| | | |
| | OMB APPROVAL | |
| | OMB Number: 3235-0570 | |
| | Expires: January 31, 2014 | |
| | Estimated average burden
hours per response: 20.6 | |
| |
UNITED STATES
SECURITIES AND EXCHANGE COMMISSION
Washington, D.C. 20549
FORM N-CSR
CERTIFIED SHAREHOLDER REPORT OF REGISTERED MANAGEMENT INVESTMENT COMPANIES
Investment Company Act file number 811-1879
Janus Investment Fund
(Exact name of registrant as specified in charter)
151 Detroit Street, Denver, Colorado 80206
(Address of principal executive offices) (Zip code)
Stephanie Grauerholz-Lofton, 151 Detroit Street, Denver, Colorado 80206
(Name and address of agent for service)
Registrant’s telephone number, including area code: 303-333-3863
Date of fiscal year end: 6/30
Date of reporting period: 6/30/13
Item 1 - Reports to Shareholders
ANNUAL REPORT
June 30, 2013
Janus Alternative Fund
Janus Diversified Alternatives Fund
HIGHLIGHTS
• Portfolio management perspective
• Investment strategy behind your fund
• Fund performance, characteristics and holdings
Table of Contents
Janus Alternative Fund
| | | |
| | 1 |
| | |
| | 3 |
| | 13 |
| | 15 |
| | 17 |
| | 18 |
| | 19 |
| | 23 |
| | 37 |
| | 38 |
| | 42 |
| | 45 |
| | 46 |
Please consider the charges, risks, expenses and investment objectives carefully before investing. For a prospectus or, if available, a summary prospectus containing this and other information, please call Janus at 877.33JANUS (52687) (or 800.525.3713 if you hold Shares directly with Janus); or download the file from janus.com/info (or janus.com/reports if you hold Shares directly with Janus). Read it carefully before you invest or send money.
Co-Chief Investment Officers’ Market Perspective (unaudited)
Jonathan Coleman, CFA
Chief Investment Officer, Equities
Gibson Smith
Chief Investment Officer, Fixed Income
Economy: Substantive improvement
The U.S. economy is showing signs of real, if uneven, improvement. The market seems obsessed with whether the Federal Reserve (Fed) will taper its bond-buying program by the end of the year, but is not focused on the continued improvement of the overall economy. We would not be surprised to see the Fed begin to taper its quantitative easing (QE) program over the next 12 months, but believe that it will leave short-term interest rates near zero for the foreseeable future. We also believe that global central banks will keep a high level of liquidity in the system. We continue to monitor potential global risk, particularly in China and Japan, but believe both of these concerns will abate in the medium term and that markets will refocus on the recovery.
Equities: Beyond the “wall of worry”
Equity markets have essentially climbed a “wall of worry” over the last six months, including the threat of falling off the fiscal cliff, then the potential impact of the sequester, and finally, concerns over Cyprus. Talking heads claimed these events spelled doomsday for the economy, but the market shrugged off each one and powered on. Now more speculative areas of the market, such as the Russell 2000 Index of U.S. small-capitalization companies, have hit all-time highs. Price/earnings multiples have expanded as stock price appreciation has exceeded the underlying earnings growth of many companies.
We think this is just when investors should be a little more cautious. The recent rally has been driven in part by a belief that the Fed and other central banks will backstop equity markets by pumping liquidity into the system forever. In late June, we got a glimpse of what happens to stock markets when the Fed even hints at taking its foot off the gas: there can be a sell-off.
Our view on the economy and equity markets has not turned negative, just more balanced. Many positives for the economy still exist. For instance, cheaper oil and natural gas in the U.S., along with more competitive labor costs, are creating a manufacturing renaissance. That’s a long-term benefit that could last a decade or longer. The U.S. housing market continues to be strong. In Europe, industrial companies are finally going through a painful restructuring that should right-size their businesses and make them more competitive on a global basis. European banks have also made significant strides in cutting costs and fortifying their balance sheets. But many of these longer-term dynamics already have been priced into stocks, or in other cases, they will take a long time to play out. The challenge as equity investors is to find those companies that can decouple from the economy, control their own destinies, and demonstrate strong growth even in the face of a slow-growth economy.
Fixed Income: Rate risk increases
As the economy gains stronger footing, the Fed will be given the opportunity to slowly remove its overly accommodative policy. While some investors may believe that we’ve seen the end of the bull market in fixed income, we are reminded that since 1980 we have seen 16 periods during which the 10-year Treasury yield rose by more than 100 basis points (1 percentage point). The 30-year bull market has hardly been a straight line up, with nothing but positive returns for fixed income investors – there have been periods of both angst and celebration, with the long-term trend being lower rates.
Making bold calls that the bull market in bonds is over can grab media attention and create fear for fixed-income investors, but the reality is that markets are always in motion and creating opportunities. This environment reminds us of the importance of active versus passive management in fixed income and the importance of capital preservation in uncertain times. While we may be entering a period where interest rates trend higher over the longer term, in the short and medium term there will be new opportunities created by change.
Because we tend to generate the majority of our excess return through security selection, we see this as a time of opportunity. Credit risk (i.e., the risk that borrowers will default) has been relatively low for years due to the excess levels of cash held on corporate balance sheets, and we believe that will continue. A back-up in rates may have the positive effect of lowering fixed income
Janus Alternative Fund | 1
(unaudited) (continued)
valuations and opening up fresh opportunities for investing at more attractive levels in credits that we believe offer good risk-adjusted return potential.
Sincerely,
Jonathan Coleman, CFA
Chief Investment Officer, Equities
Gibson Smith
Chief Investment Officer, Fixed Income
2 | JUNE 30, 2013
Janus Diversified Alternatives Fund (unaudited)
| | | | | | | |
Fund Snapshot
We invest in a portfolio of traditional and nontraditional investable risk factors distilled from traditional asset classes, each a type of risk premium. We combine these independent risk premia into a liquid portfolio that seeks to deliver consistent, absolute returns with low correlation to stocks and bonds.
| | | | 
John Fujiwara
co-portfolio manager | | 
Andrew Weisman
co-portfolio manager |
Performance Overview
Since its inception on December 28, 2012, through June 30, 2013, the Janus Diversified Alternatives Fund’s Class I Shares returned -1.60%, compared with a return of -2.54% for its primary benchmark, the Barclays U.S. Aggregate Bond Index, and 2.01% (since December 31, 2012) for its secondary benchmark, LIBOR + 3%.
Market Environment
The period opened with investors trying to assess the impact of the Federal Reserve’s (Fed) monetary easing policy of purchasing $85 billion a month in fixed income securities. At the outset, the action was stimulative, but the Fed’s focus on the longer end of the Treasury curve raised questions of its sustainability and what the inflationary impacts would be longer term. We saw evidence of investor uncertainty on whether to be long or short in the two-way movement of interest rates, which were volatile but ultimately unchanged by the end of the first quarter.
Renewed concerns over the viability of the euro also emerged as a result of the bailout for Cyprus. Like the euro, the Japanese yen also weakened relative to the dollar as Japan began efforts to introduce highly stimulative monetary policies. The moves were intended to spark economic growth, as reflected in significant gains in Japanese equities during the period, but they also ratcheted up tensions with China and other countries. A weaker yen due to monetary actions and a weaker euro based on fundamentals resulted in a stronger dollar internationally.
During the second quarter, it became apparent the U.S. economy was beginning to gain some strength, as evidenced by improvement in employment and housing prices. As a result, the Fed indicated it may begin tapering its extraordinary monetary stimulus program later this year. The announcement had a profound effect on interest rates, with a significant back-up (rise) in Treasury rates, negatively impacting bonds, stocks (particularly emerging markets) and commodities. Every asset class declined in response to the comments, which created a difficult environment for investing.
Investment Approach
We invest in a portfolio of 11 traditional and nontraditional investable risk-premium strategies derived from equity, fixed income, currency and commodity investments. By targeting a broad collection of statistically independent sources of return, we believe we are in a position to create a more robust portfolio that provides, over time, a generally more stable source of return with significantly less volatility than stocks and bonds. Since we don’t believe anyone is good at forecasting future returns, we are indifferent to asset class performances; however, we do make estimates on volatility and correlations (similarity of asset class movements) and build that into our portfolio construction process. These estimates are not forecasts per se, but rather what we think will be the contributions to portfolio risk that each of these relatively independent sources of return are going to provide. Our goal is to estimate from a forward-looking standpoint what volatility and correlations are going to look like over the next quarter and to weight the portfolio so no one risk factor is allowed to dominate. Our strategies in aggregate are designed to create positive absolute return over time, but in shorter time periods we could suffer modest pullbacks, as we did this period.
Performance Review
Our equity emerging strategy, in which we are long emerging markets and short developed markets, was the most significant detractor during the period. For the first time in 15 years, emerging markets lagged developed markets in a global equity rally. The correlation between the two markets, which had been relatively high for the last nine years, suddenly broke down.
China was among the focal points for emerging markets. Slowing growth concerns in the world’s second-largest
Janus Alternative Fund | 3
Janus Diversified Alternatives Fund (unaudited)
economy and a liquidity crisis late in the period in China were among factors impacting the equity subset. Higher rates in the U.S. also had a ripple effect on developing markets as did inflation concerns, political unrest in Brazil and threats of military aggression from North Korea.
Another key detractor, our global credit strategy, which seeks to capture the returns of global bond markets, suffered as the asset class came under extreme pressure during May and June as the Fed signaled it was considering starting to taper its quantitative easing program later this year. Conversely, our global equity strategy, which seeks to capture the returns of global equity markets, benefited from strong returns for that asset class despite a sell-off late in the period following the Fed comments.
Two of our momentum strategies were also key contributors. Our commodity momentum strategy, which aims to identify the market trends in commodities, gained on the broad declines in the asset class. The strategy has maintained a short bias since the Fund’s inception. Shorts in copper, coffee and sugar were among the main contributors. The rates momentum strategy, which seeks to capture the persistence in the movement of interest rates, also generated a gain for the Fund. Our short positions in U.S. 10-year Treasury bond futures benefited from speculation that the Fed would soon begin to taper.
Our third momentum strategy, currency momentum, however, did not fare as well. We seek to capture long-term movements in the U.S. dollar versus a basket of foreign currencies, but during this period the sideways movement of the dollar since the end of February contributed to a small loss during the period. Momentum strategies tend to underperform during periods of trendless price movements caused by general market uncertainty. As of period end, it was unclear what the next trend in interest rates, a major influence on currency movements, will be.
Among other contributors, our commodity value strategy, which seeks to benefit from identifying relative inventory conditions between commodities and investing in those that are signaling low inventories and selling those that are signaling high inventories, benefited from measures that successfully identified the relative performance of oil, soybeans and corn over coffee, wheat and sugar in a falling commodity market environment.
Our currency carry, which attempts to capture returns by being long higher-yielding currencies and being short or borrowing in lower-yield currencies, was also a modest contributor as well. Our short position in the Japanese yen more than offset our long position in the Australian dollar, which suffered a sharp fall.
Modest detractors included equity size, in which we are long small-capitalization stocks and short large caps, and commodity curve, which favors longer-term commodity deliveries rather than near-term delivery. In equity size, the strategy suffered declines through mid-April when investors rotated out of small caps into large caps in anticipation of a May-June sell-off similar to last year. The commodity curve strategy declined as global growth concerns weighed on estimates for forward demand in commodities. Additionally, unstable spring weather patterns created some near-term supply questions in grains, while the military coup in Egypt raised similar concerns for oil. Overall, spot prices outperformed longer dated commodity futures.
Finally, our equity value strategy, which is long value-style stocks and short growth stocks, ended the period as a modest contributor.
Derivatives
The Fund makes extensive use of derivatives because they are generally the most efficient and liquid way to gain our desired exposures. Swaps are used to take exposures in equity, fixed income and commodity indices. Futures are used to take exposures in commodities, currencies and long-end fixed income markets. Forwards are employed to take exposures in foreign currencies, generally one week in length. In aggregate, these positions weighed on performance. Please see “Notes to Financial Statements” for a discussion of derivatives used by the Fund.
Positioning
Among our strategies, higher volatility in the currency momentum and global credit strategies will lead to lower allocations to both for the third quarter. Meanwhile, we plan to increase some of our equity relative value strategies such as equity size and equity emerging. The latter is based on its lower correlation to the other strategies.
Thank you for investing in Janus Diversified Alternatives Fund.
4 | JUNE 30, 2013
(unaudited)
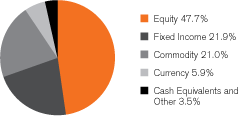
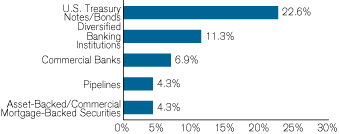
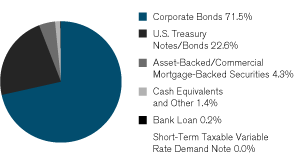
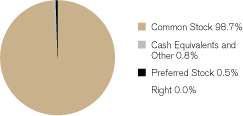
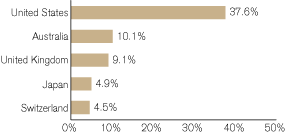
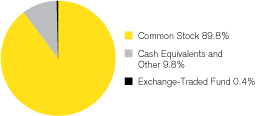
Janus Diversified Alternatives Fund At A Glance
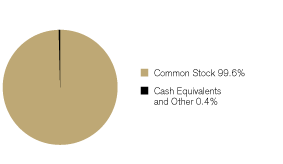
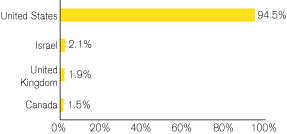
5 Largest Equity Holdings – (% of Net Assets)
As of June 30, 2013
| | | | | |
Colgate-Palmolive Co.
Cosmetics and Toiletries | | | 0.3% | |
Imperial Tobacco Group PLC
Tobacco | | | 0.3% | |
Amdocs, Ltd. (U.S. Shares)
Telecommunication Services | | | 0.3% | |
Canadian Pacific Railway, Ltd.
Transportation – Railroad | | | 0.3% | |
News Corp. – Class A
Multimedia | | | 0.3% | |
| | | | | |
| | | | 1.5% | |
As of June 30, 2013
The allocations shown reflect absolute notional exposures to various asset classes. The allocations are calculated net of cash segregated for future obligations.
Janus Alternative Fund | 5
Janus Diversified Alternatives Fund (unaudited)

| | | | | | | | |
| Cumulative Total Return – for the period ended June 30, 2013 | | | Expense Ratios – per the December 28, 2012 prospectuses (estimated for the fiscal year) |
| | | Since
| | | Total Annual Fund
| | Net Annual Fund
|
| | | Inception* | | | Operating Expenses | | Operating Expenses |
| | | | | | | | |
| Janus Diversified Alternatives Fund – Class A Shares | | | | | | | |
| | | | | | | | |
| NAV | | –1.80% | | | 1.69% | | 1.60% |
| | | | | | | | |
| MOP | | –7.45% | | | | | |
| | | | | | | | |
| Janus Diversified Alternatives Fund – Class C Shares | | | | | | | |
| | | | | | | | |
| NAV | | –2.10% | | | 2.56% | | 2.42% |
| | | | | | | | |
| CDSC | | –3.08% | | | | | |
| | | | | | | | |
| Janus Diversified Alternatives Fund – Class D Shares(1) | | –1.70% | | | 1.57% | | 1.38% |
| | | | | | | | |
| Janus Diversified Alternatives Fund – Class I Shares | | –1.60% | | | 1.37% | | 1.30% |
| | | | | | | | |
| Janus Diversified Alternatives Fund – Class N Shares | | –1.60% | | | 1.30% | | 1.25% |
| | | | | | | | |
| Janus Diversified Alternatives Fund – Class S Shares | | –1.90% | | | 1.80% | | 1.75% |
| | | | | | | | |
| Janus Diversified Alternatives Fund – Class T Shares | | –1.80% | | | 1.55% | | 1.50% |
| | | | | | | | |
| Barclays U.S. Aggregate Bond Index | | –2.54% | | | | | |
| | | | | | | | |
| London Interbank Offered Rate (LIBOR) + 3% | | 2.01%** | | | | | |
| | | | | | | | |
| Visit janus.com/advisor/mutual-funds (or janus.com/allfunds if you hold Shares directly with Janus Capital) to view current performance and characteristic information | | | | | |
| | | | | | | | |
Returns quoted are past performance and do not guarantee future results; current performance may be lower or higher. Investment returns and principal value will vary; there may be a gain or loss when shares are sold. For the most recent month-end performance call 877.33JANUS(52687) (or 800.525.3713 if you hold shares directly with Janus Capital) or visit janus.com/advisor/mutual-funds (or janus.com/allfunds if you hold shares directly with Janus Capital).
Performance shown for Class A Shares at Maximum Offering Price (MOP) includes the Fund’s maximum sales charge of 5.75%. Performance shown at Net Asset Value (NAV) does not include this charge and would have been lower had this charge been taken into account.
Performance shown for Class C Shares includes a 1% contingent deferred sales charge (CDSC) on periods of less than 12 months. Performance shown at Net Asset Value (NAV) does not include this sales charge and would have been lower had this sales charge been taken into account.
See important disclosures on the next page.
6 | JUNE 30, 2013
(unaudited)
Net expense ratios reflect the expense waiver, if any, Janus Capital has contractually agreed to through November 1, 2014.
The Fund’s performance may be affected by risks that include those associated with nondiversification, non-investment grade debt securities, investments in specific industries or countries and potential conflicts of interest with the Janus “funds of funds.” Additional risks to the Fund may also include, but are not limited to, those associated with investing in foreign securities, emerging markets, initial public offerings (“IPOs”), and derivatives. Please see the Fund’s prospectuses or janus.com/info (or janus.com/reports if you hold shares directly with Janus Capital) for more information about risks, portfolio holdings and other details.
Foreign securities have additional risks including exchange rate changes, political and economic upheaval, the relative lack of information, relatively low market liquidity and the potential lack of strict financial and accounting controls and standards. These risks are magnified in emerging markets. The prices of foreign securities held by the Fund, and therefore the Fund’s performance, may decline in response to such risks.
The Fund invests in derivatives which can be highly volatile and involve additional risks than if the underlying securities were held directly by the Fund. Such risks include gains or losses which, as a result of leverage, can be substantially greater than the derivatives’ original cost. There is also a possibility that derivatives may not perform as intended which can reduce opportunity for gains or result in losses by offsetting positive returns in other securities the Fund owns.
Investments in commodities, commodity-linked notes, securities derivatives, futures, foreign securities, short sales and investments through a nonregistered subsidiary provide exposure to certain special risks, including greater volatility and loss of interest and principal, and may not be appropriate for all investors. Commodities are speculative and may fluctuate widely based on a variety of factors, including market movements, economic events and supply and demand disruptions. Derivatives involve risks in addition to the risks of the underlying securities, including gains or losses which, as a result of leverage, can be substantially greater than the derivatives’ original cost. Short sales are speculative transactions with potentially unlimited losses, and the use of leverage can magnify the effect of losses.
Janus Capital does not have prior experience managing a risk premia investment strategy. There is a risk that the Fund’s investments will correlate with stocks and bonds to a greater degree than anticipated, and the investment process may not achieve the desired results. The Fund may underperform during up markets and be negatively affected in down markets. Risk diversification does not assure a profit or eliminate the risk of loss.
Holding a meaningful portion of assets in cash or cash equivalents may negatively affect performance.
The Fund’s performance for very short time periods may not be indicative of future performance.
For a period of three years subsequent to the Fund’s commencement of operations or until the Fund’s assets exceed the first breakpoint in the investment advisory fee schedule, whichever occurs first, Janus Capital may recover from the Fund fees and expenses previously waived or reimbursed, which could then be considered a deferral, if the Fund’s expense ratio, including recovered expenses, falls below the expense limit.
Returns include reinvestment of all dividends and distributions. The returns do not include adjustments in accordance with generally accepted accounting principles required at the period end for financial reporting purposes.
Rankings are not provided for Funds that are less than 1 year old.
There is no assurance that the investment process will consistently lead to successful investing.
See Consolidated Notes to Schedule of Investments and Other Information for index definitions.
The Fund’s portfolio may differ significantly from the securities held in the indices. The indices are unmanaged and are not available for direct investment; therefore, their performance does not reflect the expenses associated with the active management of an actual portfolio.
See “Useful Information About Your Fund Report.”
| | | |
| * | | The Fund’s inception date – December 28, 2012. |
| ** | | The London Interbank Offered Rate (LIBOR) +3% since inception returns are calculated from December 31, 2012. |
| (1) | | Closed to new investors. |
Janus Alternative Fund | 7
Janus Diversified Alternatives Fund (unaudited)
As a shareholder of the Fund, you incur two types of costs: (1) transaction costs, such as sales charges (loads) on purchase payments (applicable to Class A Shares only); and (2) ongoing costs, including management fees; distribution and shareholder servicing (12b-1) fees; administrative services fees payable pursuant to the Transfer Agency Agreement; and other Fund expenses. This example is intended to help you understand your ongoing costs (in dollars) of investing in the Fund and to compare these costs with the ongoing costs of investing in other mutual funds. To do so, compare this 5% hypothetical example with the 5% hypothetical examples that appear in the shareholder reports of the other funds. The example is based upon an investment of $1,000 invested at the beginning of the period and held for the six-months indicated, unless noted otherwise in the table and footnotes below.
Actual Expenses
The information in the table under the heading “Actual” provides information about actual account values and actual expenses. You may use the information in these columns, together with the amount you invested, to estimate the expenses that you paid over the period. Simply divide your account value by $1,000 (for example, an $8,600 account value divided by $1,000 = 8.6), then multiply the result by the number in the appropriate column for your share class under the heading entitled “Expenses Paid During Period” to estimate the expenses you paid on your account during the period.
Hypothetical Example for Comparison Purposes
The information in the table under the heading “Hypothetical (5% return before expenses)” provides information about hypothetical account values and hypothetical expenses based upon the Fund’s actual expense ratio and an assumed rate of return of 5% per year before expenses, which is not the Fund’s actual return. The hypothetical account values and expenses may not be used to estimate the actual ending account balance or expenses you paid for the period. You may use this information to compare the ongoing costs of investing in the Fund and other funds. To do so, compare this 5% hypothetical example with the 5% hypothetical examples that appear in the shareholder reports of the other funds. Additionally, for an analysis of the fees associated with an investment in any share class or other similar funds, please visit www.finra.org/fundanalyzer.
Please note that the expenses shown in the table are meant to highlight your ongoing costs only and do not reflect any transaction costs. These fees are fully described in the Fund’s prospectuses. Therefore, the hypothetical examples are useful in comparing ongoing costs only, and will not help you determine the relative total costs of owning different funds. In addition, if these transaction costs were included, your costs would have been higher.
| | | | | | | | | | | | | | | | | | | | | | | | | | | | | | | |
| | | | | Hypothetical
| | | | |
| | | Actual | | (5% return before expenses) | | | | |
| | | Beginning
| | Ending
| | Expenses
| | Beginning
| | Ending
| | Expenses
| | | | |
| | | Account
| | Account
| | Paid During
| | Account
| | Account
| | Paid During
| | Net Annualized
| | |
| | | Value
| | Value
| | Period
| | Value
| | Value
| | Period
| | Expense Ratio
| | |
| | | (1/1/13) | | (6/30/13) | | (1/1/13 - 6/30/13)† | | (1/1/13) | | (6/30/13) | | (1/1/13 - 6/30/13)† | | (1/1/13 - 6/30/13) | | |
| |
| |
| Class A Shares | | $ | 1,000.00 | | | $ | 981.00 | | | $ | 7.42 | | | $ | 1,000.00 | | | $ | 1,017.31 | | | $ | 7.55 | | | | 1.51% | | | |
| |
| |
| Class C Shares | | $ | 1,000.00 | | | $ | 977.00 | | | $ | 11.08 | | | $ | 1,000.00 | | | $ | 1,013.59 | | | $ | 11.28 | | | | 2.26% | | | |
| |
| |
| Class D Shares | | $ | 1,000.00 | | | $ | 981.00 | | | $ | 6.83 | | | $ | 1,000.00 | | | $ | 1,017.90 | | | $ | 6.95 | | | | 1.39% | | | |
| |
| |
| Class I Shares | | $ | 1,000.00 | | | $ | 982.00 | | | $ | 6.24 | | | $ | 1,000.00 | | | $ | 1,018.50 | | | $ | 6.36 | | | | 1.27% | | | |
| |
| |
| Class N Shares | | $ | 1,000.00 | | | $ | 982.00 | | | $ | 6.14 | | | $ | 1,000.00 | | | $ | 1,018.60 | | | $ | 6.26 | | | | 1.25% | | | |
| |
| |
| Class S Shares | | $ | 1,000.00 | | | $ | 980.00 | | | $ | 8.64 | | | $ | 1,000.00 | | | $ | 1,016.07 | | | $ | 8.80 | | | | 1.76% | | | |
| |
| |
| Class T Shares | | $ | 1,000.00 | | | $ | 981.00 | | | $ | 7.42 | | | $ | 1,000.00 | | | $ | 1,017.31 | | | $ | 7.55 | | | | 1.51% | | | |
| |
| |
| | | |
| † | | Expenses Paid During Period are equal to the Net Annualized Expense Ratio multiplied by the average account value over the period, multiplied by the number of days in the most recent six-month period, divided by the number of days in the fiscal year. Expenses in the examples include the effect of applicable fee waivers and/or expense reimbursements, if any. Had such waivers and/or reimbursements not been in effect, your expenses would have been higher. Please refer to the Notes to Financial Statements or the Fund’s prospectuses for more information regarding waivers and/or reimbursements. |
8 | JUNE 30, 2013
Janus Diversified Alternatives Fund
Consolidated Schedule of Investments
As of June 30, 2013
| | | | | | | | | | | |
| Shares | | Value | | | |
| |
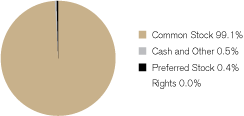
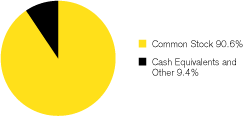
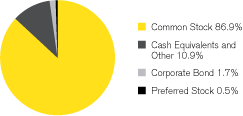
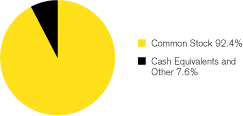
| Common Stock – 7.7% | | | | | | |
| Airlines – 0.1% | | | | | | |
| | 3,000 | | | United Continental Holdings, Inc.* | | $ | 93,870 | | | |
| Beverages – Wine and Spirits – 0.2% | | | | | | |
| | 1,850 | | | Pernod-Ricard S.A.** | | | 205,120 | | | |
| Cable/Satellite Television – 0.2% | | | | | | |
| | 5,100 | | | Comcast Corp. – Class A | | | 213,588 | | | |
| Chemicals – Diversified – 0.1% | | | | | | |
| | 1,900 | | | LyondellBasell Industries N.V. – Class A | | | 125,894 | | | |
| Commercial Banks – 0.3% | | | | | | |
| | 13,400 | | | Banco Bilbao Vizcaya Argentaria S.A.** | | | 112,402 | | | |
| | 10,400 | | | Sberbank of Russia (ADR) | | | 118,456 | | | |
| | | | | | | | 230,858 | | | |
| Commercial Services – Finance – 0.2% | | | | | | |
| | 280 | | | MasterCard, Inc. – Class A | | | 160,860 | | | |
| Computers – 0.2% | | | | | | |
| | 340 | | | Apple, Inc. | | | 134,667 | | | |
| Cosmetics and Toiletries – 0.3% | | | | | | |
| | 4,700 | | | Colgate-Palmolive Co. | | | 269,263 | | | |
| Diversified Banking Institutions – 0.3% | | | | | | |
| | 2,700 | | | Citigroup, Inc. | | | 129,519 | | | |
| | 2,800 | | | JPMorgan Chase & Co. | | | 147,812 | | | |
| | | | | | | | 277,331 | | | |
| E-Commerce/Products – 0.2% | | | | | | |
| | 2,600 | | | eBay, Inc.* | | | 134,472 | | | |
| Electric – Transmission – 0.2% | | | | | | |
| | 4,900 | | | Brookfield Infrastructure Partners L.P. | | | 178,948 | | | |
| Industrial Automation and Robotics – 0.2% | | | | | | |
| | 1,100 | | | FANUC Corp.** | | | 159,520 | | | |
| Instruments – Controls – 0.2% | | | | | | |
| | 3,800 | | | Sensata Technologies Holding N.V.* | | | 132,620 | | | |
| Investment Management and Advisory Services – 0.2% | | | | | | |
| | 2,600 | | | T. Rowe Price Group, Inc. | | | 190,190 | | | |
| Life and Health Insurance – 0.4% | | | | | | |
| | 47,600 | | | AIA Group, Ltd. | | | 201,611 | | | |
| | 10,000 | | | Prudential PLC | | | 163,476 | | | |
| | | | | | | | 365,087 | | | |
| Machinery – Pumps – 0.1% | | | | | | |
| | 3,600 | | | Weir Group PLC | | | 117,757 | | | |
| Medical – Biomedical and Genetic – 0.3% | | | | | | |
| | 1,300 | | | Celgene Corp.* | | | 151,983 | | | |
| | 2,700 | | | Gilead Sciences, Inc.* | | | 138,267 | | | |
| | | | | | | | 290,250 | | | |
| Multimedia – 0.3% | | | | | | |
| | 6,600 | | | News Corp. – Class A | | | 215,160 | | | |
| Networking Products – 0.2% | | | | | | |
| | 6,200 | | | Cisco Systems, Inc. | | | 150,722 | | | |
| Oil Companies – Exploration and Production – 0.4% | | | | | | |
| | 1,350 | | | EOG Resources, Inc. | | | 177,768 | | | |
| | 3,400 | | | Noble Energy, Inc. | | | 204,136 | | | |
| | | | | | | | 381,904 | | | |
| Oil Field Machinery and Equipment – 0.2% | | | | | | |
| | 2,800 | | | National Oilwell Varco, Inc. | | | 192,920 | | | |
| Oil Refining and Marketing – 0.1% | | | | | | |
| | 3,200 | | | Valero Energy Corp. | | | 111,264 | | | |
| Pharmacy Services – 0.4% | | | | | | |
| | 2,700 | | | Express Scripts Holding Co.* | | | 166,563 | | | |
| | 3,900 | | | Omnicare, Inc. | | | 186,069 | | | |
| | | | | | | | 352,632 | | | |
| Real Estate Management/Services – 0.2% | | | | | | |
| | 1,600 | | | Jones Lang LaSalle, Inc. | | | 145,824 | | | |
| Real Estate Operating/Development – 0.2% | | | | | | |
| | 38,000 | | | Hang Lung Properties, Ltd. | | | 132,533 | | | |
| Semiconductor Components/Integrated Circuits – 0.2% | | | | | | |
| | 45,000 | | | Taiwan Semiconductor Manufacturing Co., Ltd. | | | 166,689 | | | |
| Steel – Producers – 0.1% | | | | | | |
| | 5,500 | | | ThyssenKrupp A.G.** | | | 108,054 | | | |
| Telecommunication Services – 0.3% | | | | | | |
| | 6,200 | | | Amdocs, Ltd. (U.S. Shares) | | | 229,958 | | | |
| Tobacco – 0.5% | | | | | | |
| | 6,700 | | | Imperial Tobacco Group PLC | | | 232,303 | | | |
| | 4,400 | | | Japan Tobacco, Inc.** | | | 155,526 | | | |
| | | | | | | | 387,829 | | | |
| Transportation – Marine – 0.2% | | | | | | |
| | 21 | | | A.P. Moeller – Maersk A/S – Class B | | | 150,427 | | | |
| Transportation – Railroad – 0.3% | | | | | | |
| | 1,850 | | | Canadian Pacific Railway, Ltd.** | | | 224,397 | | | |
| Transportation – Services – 0.4% | | | | | | |
| | 2,400 | | | Koninklijke Vopak N.V.** | | | 141,578 | | | |
| | 1,900 | | | Kuehne + Nagel International A.G.** | | | 208,652 | | | |
| | | | | | | | 350,230 | | | |
| |
| |
| Total Common Stock (cost $6,515,669) | | | 6,580,838 | | | |
| |
| |
| Money Market – 8.5% | | | | | | |
| | 7,182,961 | | | Janus Cash Liquidity Fund LLC, 0%£
(cost $7,182,961) | | | 7,182,961 | | | |
| |
| |
| Total Investments (total cost $13,698,630) – 16.2% | | | 13,763,799 | | | |
| |
| |
| Cash, Receivables and Other Assets, net of Liabilities**– 83.8% | | | 71,006,033 | | | |
| |
| |
| Net Assets – 100% | | $ | 84,769,832 | | | |
| |
| |
See Notes to Consolidated Schedule of Investments and Other Information and Notes to Financial Statements.
Janus Alternative Fund | 9
Janus Diversified Alternatives Fund
Consolidated Schedule of Investments
As of June 30, 2013
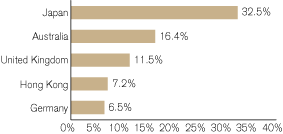
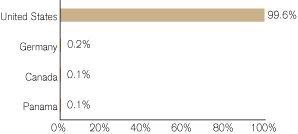
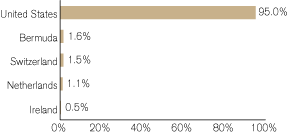
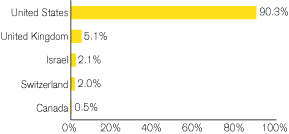
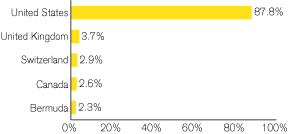
Summary of Investments by Country – (Long Positions) (unaudited)
| | | | | | | | | |
| | | | | | % of Investment
| |
| Country | | Value | | | Securities | |
| |
| |
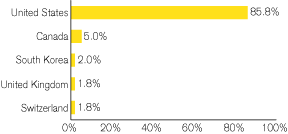
| Canada | | $ | 224,397 | | | | 1.6% | |
| Denmark | | | 150,427 | | | | 1.1% | |
| France | | | 205,120 | | | | 1.5% | |
| Germany | | | 108,054 | | | | 0.8% | |
| Hong Kong | | | 334,144 | | | | 2.4% | |
| Japan | | | 315,046 | | | | 2.3% | |
| Netherlands | | | 141,578 | | | | 1.0% | |
| Russia | | | 118,456 | | | | 0.9% | |
| Spain | | | 112,402 | | | | 0.8% | |
| Switzerland | | | 208,652 | | | | 1.5% | |
| Taiwan | | | 166,689 | | | | 1.2% | |
| United Kingdom | | | 513,536 | | | | 3.8% | |
United States†† | | | 11,165,298 | | | | 81.1% | |
| |
| |
| Total | | $ | 13,763,799 | | | | 100.0% | |
| | | |
| †† | | Includes Cash Equivalents of 52.2%. |
Forward Currency Contracts, Open
| | | | | | | | | | | | | |
| | | Currency Units
| | | | | | Unrealized
| |
| | | Sold/
| | | Currency
| | | Appreciation/
| |
| Counterparty/Currency and Settlement Date | | (Purchased) | | | Value U.S. $ | | | (Depreciation) | |
| |
| |
| HSBC Securities (USA), Inc.: | | | | | | | | | | | | |
| Australian Dollar 7/5/13 | | | (1,080,000) | | | $ | (987,194) | | | $ | (5,701) | |
| Canadian Dollar 7/5/13 | | | (750,000) | | | | (713,296) | | | | (736) | |
| Euro 7/5/13 | | | 1,540,000 | | | | 2,004,344 | | | | 5,061 | |
| Japanese Yen 7/5/13 | | | 75,200,000 | | | | 758,380 | | | | 4,167 | |
| New Zealand Dollar 7/5/13 | | | (379,000) | | | | (293,538) | | | | 115 | |
| Swedish Krona 7/5/13 | | | (3,540,000) | | | | (528,198) | | | | 844 | |
| Swiss Franc 7/5/13 | | | (282,000) | | | | (298,644) | | | | (889) | |
| |
| |
| Total | | | | | | $ | (58,146) | | | $ | 2,861 | |
| |
| |
| | | | | | | |
| |
| |
| Financial Futures – Long |
| 3 Contracts | | Brent Crude Future
expires October 2013, principal amount
$302,798, Value $303,780, cumulative
appreciation | | $ | 982 | |
| 6 Contracts | | Brent Crude Future
expires October 2013, principal amount
$607,560, Value $607,560 | | | 0 | |
| 9 Contracts | | Corn Future
expires December 2013, principal amount
$249,854, Value $229,950, cumulative
depreciation | | | (19,904) | |
| 1 Contract | | Corn Future
expires December 2013, principal amount
$26,904, Value $25,550, cumulative
depreciation | | | (1,354) | |
| 24 Contracts | | Corn Future
expires December 2013, principal amount
$613,285, Value $613,200, cumulative
depreciation | | | (85) | |
| 13 Contracts | | Cotton Future
expires March 2014, principal amount
$536,238, Value $536,120, cumulative
depreciation | | | (118) | |
| 2 Contracts | | Gold Future
expires October 2013, principal amount
$295,320, Value $244,960, cumulative
depreciation | | | (50,360) | |
| 5 Contracts | | Gold Future
expires October 2013, principal amount
$612,909, Value $612,400, cumulative
depreciation | | | (509) | |
| 4 Contracts | | Soybean Future
expires May 2014, principal amount
$254,452, Value $250,900, cumulative
depreciation | | | (3,552) | |
| 10 Contracts | | Soybean Future
expires May 2014, principal amount
$627,759, Value $627,250, cumulative
depreciation | | | (509) | |
| 76 Contracts | | U.S. Dollar Index Future
expires September 2013, principal amount
$6,202,124, Value $6,336,576, cumulative
appreciation | | | 134,452 | |
| 3 Contracts | | WTI Crude Future
expires November 2013, principal amount
$280,532, Value $285,300, cumulative
appreciation | | | 4,768 | |
| 7 Contracts | | WTI Crude Future
expires November 2013, principal amount
$665,443, Value $665,700, cumulative
appreciation | | | 257 | |
| |
| |
| Total | | | | $ | 64,068 | |
| |
| |
| Financial Futures – Short |
| 35 Contracts | | 10-Year U.S. Treasury Note Future
expires September 2013, principal amount
$4,528,870, Value $4,429,688, cumulative
appreciation | | $ | 99,182 | |
| 56 Contracts | | 10-Year U.S. Treasury Note Future
expires September 2013, principal amount
$7,228,255, Value $7,087,500, cumulative
appreciation | | | 140,755 | |
| 1 Contract | | Coffee ’C’ Future
expires December 2013, principal amount
$45,484, Value $46,256, cumulative
depreciation | | | (772) | |
| 1 Contract | | Coffee ’C’ Future
expires December 2013, principal amount
$47,884, Value $46,256,
cumulative appreciation | | | 1,628 | |
| 13 Contracts | | Coffee ’C’ Future
expires December 2013, principal amount
$601,136, Value $601,331, cumulative
depreciation | | | (195) | |
| 13 Contracts | | Coffee ’C’ Future
expires December 2013, principal amount
$647,808, Value $601,331, cumulative
appreciation | | | 46,477 | |
See Notes to Consolidated Schedule of Investments and Other Information and Notes to Financial Statements.
10 | JUNE 30, 2013
Consolidated Schedule of Investments
As of June 30, 2013
| | | | | | | |
| |
| |
| Financial Futures – Short – (continued) |
| 1 Contract | | Copper Future
expires December 2013, principal amount
$76,372, Value $76,775, cumulative
depreciation | | $ | (403) | |
| 8 Contracts | | Copper Future
expires December 2013, principal amount
$613,516, Value $614,200, cumulative
depreciation | | | (684) | |
| 8 Contracts | | Copper Future
expires December 2013, principal amount
$680,714, Value $614,200, cumulative
appreciation | | | 66,514 | |
| 1 Contract | | Corn Future
expires March 2014, principal amount
$27,734, Value $26,087, cumulative
appreciation | | | 1,647 | |
| 13 Contracts | | Corn Future
expires March 2014, principal amount
$358,993, Value $339,138, cumulative
appreciation | | | 19,855 | |
| 91 Contracts | | Euro-Bund Future
expires September 2013, principal amount
$16,962,330, Value $16,757,817, cumulative
appreciation | | | 204,513 | |
| 1 Contract | | Live Cattle Future
expires October 2013, principal amount
$49,246, Value $50,270, cumulative
depreciation | | | (1,024) | |
| 1 Contract | | Live Cattle Future
expires October 2013, principal amount
$50,146, Value $50,270, cumulative
depreciation | | | (124) | |
| 1 Contract | | Live Cattle Future
expires October 2013, principal amount
$50,516, Value $50,270, cumulative
appreciation | | | 246 | |
| 11 Contracts | | Live Cattle Future
expires October 2013, principal amount
$542,091, Value $552,970, cumulative
depreciation | | | (10,879) | |
| 12 Contracts | | Live Cattle Future
expires October 2013, principal amount
$603,620, Value $603,240, cumulative
appreciation | | | 380 | |
| 1 Contract | | Silver Future
expires December 2013, principal amount
$112,897, Value $97,595, cumulative
appreciation | | | 15,302 | |
| 6 Contracts | | Silver Future
expires December 2013, principal amount
$559,631, Value $585,570, cumulative
depreciation | | | (25,939) | |
| 6 Contracts | | Silver Future
expires December 2013, principal amount
$584,531, Value $585,570, cumulative
depreciation | | | (1,039) | |
| 2 Contracts | | Soybean Future
expires January 2014, principal amount
$130,447, Value $125,675, cumulative
appreciation | | | 4,772 | |
| 4 Contracts | | Soybean Future
expires January 2014, principal amount
$264,023, Value $251,350, cumulative
appreciation | | | 12,673 | |
| 1 Contract | | Sugar #11 (World) Future
expires March 2014, principal amount
$19,630, Value $19,869, cumulative
depreciation | | | (239) | |
| 1 Contract | | Sugar #11 (World) Future
expires March 2014, principal amount
$19,753, Value $19,869, cumulative
depreciation | | | (116) | |
| 1 Contract | | Sugar #11 (World) Future
expires March 2014, principal amount
$20,235, Value $19,869, cumulative
appreciation | | | 366 | |
| 1 Contract | | Sugar #11 (World) Future
expires March 2014, principal amount
$20,459, Value $19,869, cumulative
appreciation | | | 590 | |
| 1 Contract | | Sugar #11 (World) Future
expires March 2014, principal amount
$20,817, Value $19,869, cumulative
appreciation | | | 948 | |
| 1 Contract | | Sugar #11 (World) Future
expires March 2014, principal amount
$20,884, Value $19,868, cumulative
appreciation | | | 1,016 | |
| 6 Contracts | | Sugar #11 (World) Future
expires March 2014, principal amount
$125,751, Value $119,213, cumulative
appreciation | | | 6,538 | |
| 22 Contracts | | Sugar #11 (World) Future
expires March 2014, principal amount
$465,121, Value $437,114, cumulative
appreciation | | | 28,007 | |
| 31 Contracts | | Sugar #11 (World) Future
expires March 2014, principal amount
$615,041, Value $615,933, cumulative
depreciation | | | (892) | |
| 8 Contracts | | Wheat Future
expires December 2013, principal amount
$276,384, Value $268,600, cumulative
appreciation | | | 7,784 | |
| 18 Contracts | | Wheat Future
expires December 2013, principal amount
$602,936, Value $604,350, cumulative
depreciation | | | (1,414) | |
| |
| |
| Total | | | | $ | 615,473 | |
| |
| |
See Notes to Consolidated Schedule of Investments and Other Information and Notes to Financial Statements.
Janus Alternative Fund | 11
Janus Diversified Alternatives Fund
Consolidated Schedule of Investments
As of June 30, 2013
Total Return Swaps outstanding at June 30, 2013
| | | | | | | | | | | | | | | | |
| | | | | | | | | | | | Unrealized
|
| | | Notional
| | | Return Paid
| | Return Received
| | | | Appreciation/
|
| Counterparty | | Amount | | | by the Fund | | by the Fund | | Termination Date | | (Depreciation) |
| |
| Barclays Capital, Inc. | | $ | 16,000,000 | | | | 3 month USD LIBOR
plus 20 basis points | | | Barclays U.S. Credit RBI
Series-1 Index | | 10/1/13 | | $ | (1,557) |
| Goldman Sachs International | | | 19,201,685 | | | | 3 month USD LIBOR
minus 30 basis points | | | Russell 2000® Total
Return Index | | 10/3/13 | | | (18) |
| Goldman Sachs International | | | 12,031,002 | | | | 3 month USD LIBOR
plus 10 basis points | | | MSCI Daily Total Return
Net Emerging Markets | | 10/3/13 | | | (9,024) |
| Goldman Sachs International | | | 13,803,077 | | | | 3 month USD LIBOR
plus 35 basis points | | | S&P 500® Citigroup
Pure Value | | 10/3/13 | | | (16) |
| Goldman Sachs International | | | (11,984,834) | | | | MSCI Daily Total Return
Gross World | | | 3 month USD LIBOR
plus 30 basis points | | 10/3/13 | | | (9,206) |
| Goldman Sachs International | | | (19,199,760) | | | | Russell 1000® Total
Return Index | | | 3 month USD LIBOR
plus 15 basis points | | 10/3/13 | | | (104) |
| Goldman Sachs International | | | (13,799,906) | | | | S&P 500® Citigroup
Pure Growth | | | 3 month USD LIBOR
plus 10 basis points | | 10/3/13 | | | 636 |
| UBS A.G. | | | 29,300,000 | | | | If negative, a long/short
basket of commodity
indexes minus 22 basis
points | | | If positive, a long/short
basket of commodity
indexes minus 22 basis
points | | 9/30/13 | | | 0 |
| |
| |
| Total | | | | | | | | | | | | | | $ | (19,289) |
| |
| |
See Notes to Consolidated Schedule of Investments and Other Information and Notes to Financial Statements.
12 | JUNE 30, 2013
Notes to Consolidated Schedule of Investments and Other Information
| | |
| Barclays U.S. Aggregate Bond Index | | Made up of the Barclays U.S. Government/Corporate Bond Index, Mortgage-Backed Securities Index, and Asset-Backed Securities Index, including securities that are of investment grade quality or better, have at least one year to maturity, and have an outstanding par value of at least $100 million. |
| |
| London Interbank Offered Rate (LIBOR) | | A daily reference rate based on the interest rates at which banks offer to lend unsecured funds to other banks in the London wholesale money market (or interbank market). |
| |
| A/S | | Aktieselskab: Danish term for a stock-based corporation. |
| |
| A.G. | | Aktiengesellschaft: German term for Public Limited Company. |
| |
| ADR | | American Depositary Receipt |
| |
| L.P. | | Limited Partnership |
| |
| LLC | | Limited Liability Company |
| |
| N.V. | | Naamloze Vennootschap: Dutch term for Public Limited Liability Company. |
| |
| PLC | | Public Limited Company |
| |
| S.A. | | Sociedad Anonima: Spanish term for publicly-traded company. |
| |
| U.S. Shares | | Securities of foreign companies trading on an American Stock Exchange. |
| | | |
| * | | Non-income producing security. |
| | | |
| ** | | A portion of this security or cash has been segregated to cover margin or segregation requirements on open futures contracts, forward currency contracts, options contracts, short sales, swap agreements, and/or securities with extended settlement dates, the value of which, as of June 30, 2013, is noted below. |
| | | | | | |
| Fund | | Aggregate Value | | |
| |
| |
| Janus Diversified Alternatives Fund | | $ | 73,645,249 | | |
| |
| |
| |
| £ | The Fund may invest in certain securities that are considered affiliated companies. As defined by the Investment Company Act of 1940, as amended, an affiliated company is one in which the fund owns 5% or more of the outstanding voting securities, or a company which is under common ownership or control. Based on the Fund’s relative ownership, the following securities were considered affiliated companies for all or some portion of the period ended June 30, 2013. Except for the value at period end, all other information in the table is for the period ended June 30, 2013. |
| | | | | | | | | | | | | | | | | | | | | | |
| | | Purchases | | Sales | | Realized
| | Dividend
| | Value
| | |
| | | Shares | | Cost | | Shares | | Cost | | Gain/(Loss) | | Income | | at 6/30/13 | | |
| |
Janus Diversified Alternatives Fund | | | | | | | | | | | | | | | | | | | | | |
| Janus Cash Liquidity Fund LLC | | 115,281,036 | | $ | 115,281,036 | | (108,098,075) | | $ | (108,098,075) | | $ | – | | $ | 8,766 | | $ | 7,182,961 | | |
| |
| |
Janus Alternative Fund | 13
Notes to Consolidated Schedule of Investments and Other Information(continued)
The following is a summary of the inputs that were used to value the Fund’s investments in securities and other financial instruments as of June 30, 2013. See Notes to Financial Statements for more information.
Valuation Inputs Summary (as of June 30, 2013)
| | | | | | | | | | | | |
| | | | | Level 2 – Other Significant
| | Level 3 – Significant
| | |
| | | Level 1 – Quoted Prices | | Observable Inputs | | Unobservable Inputs | | |
| |
Investments in Securities: | | | | | | | | | | | |
| Janus Diversified Alternatives Fund | | | | | | | | | | | |
Common Stock | | | | | | | | | | | |
| Commercial Banks | | $ | 112,402 | | $ | 118,456 | | $ | – | | |
| All Other | | | 6,349,980 | | | – | | | – | | |
| | | | | | | | | | | | |
Money Market | | | – | | | 7,182,961 | | | – | | |
| | | | | | | | | | | | |
| Total Investments in Securities | | $ | 6,462,382 | | $ | 7,301,417 | | $ | – | | |
| | | | | | | | | | | | |
Other Financial Instruments(a) – Assets: | | | | | | | | | | | |
Forward currency contracts | | $ | – | | $ | 10,187 | | $ | – | | |
Outstanding swap contracts at value | | | – | | | 636 | | | – | | |
Variation margin | | | 16,437 | | | – | | | – | | |
| | | | | | | | | | | | |
Other Financial Instruments(a) – Liabilities: | | | | | | | | | | | |
Forward currency contracts | | $ | – | | $ | 7,326 | | $ | – | | |
Outstanding swap contracts at value | | | – | | | 19,925 | | | – | | |
| |
| |
| | | |
| (a) | | Other financial instruments include futures, forward currency, written option, and swap contracts. Forward currency contracts and swap contracts are reported at their unrealized appreciation/(depreciation) at measurement date, which represents the change in the contract’s value from trade date. Futures are reported at their variation margin at measurement date, which represents the amount due to/from the Fund at that date. Options are reported at their market value at measurement date. |
14 | JUNE 30, 2013
Consolidated Statement of Assets and Liabilities
| | | | | |
As of June 30, 2013
| | Janus Diversified
|
| (all numbers in thousands except net asset value per share) | | Alternatives Fund |
|
| |
| Assets: | | | | |
| Investments at cost | | $ | 13,699 | |
| Unaffiliated investments at value | | $ | 6,581 | |
| Affiliated investments at value | | | 7,183 | |
Cash denominated in foreign currency(1) | | | 1 | |
| Restricted cash (Note 1) | | | 72,330 | |
| Receivables: | | | | |
| Investments sold | | | 662 | |
| Fund shares sold | | | 32 | |
| Dividends | | | 8 | |
| Foreign dividend tax reclaim | | | 3 | |
| Outstanding swap contracts at value | | | 1 | |
| Dividends and interest on swap contracts | | | 20 | |
| Non-interested Trustees’ deferred compensation | | | 1 | |
| Variation margin | | | 16 | |
| Other assets | | | 6 | |
| Forward currency contracts | | | 10 | |
| Total Assets | | | 86,854 | |
| Liabilities: | | | | |
| Payables: | | | | |
| Due to custodian | | | 49 | |
| Investments purchased | | | 1,715 | |
| Fund shares repurchased | | | 63 | |
| Outstanding swap contracts at value | | | 20 | |
| Dividends and interest on swap contracts | | | 47 | |
| Advisory fees | | | 57 | |
| Fund administration fees | | | 1 | |
| Internal servicing cost | | | 1 | |
| Administrative services fees | | | 2 | |
| Distribution fees and shareholder servicing fees | | | 4 | |
| Administrative, networking and omnibus fees | | | 1 | |
| Non-interested Trustees’ fees and expenses | | | – | |
| Non-interested Trustees’ deferred compensation fees | | | 1 | |
| Accrued expenses and other payables | | | 116 | |
| Forward currency contracts | | | 7 | |
| Total Liabilities | | | 2,084 | |
| Net Assets | | $ | 84,770 | |
See footnotes at the end of the Statement.
See Notes to Financial Statements.
Janus Alternative Fund | 15
Consolidated Statement of Assets and Liabilities (continued)
| | | | | |
As of June 30, 2013
| | Janus Diversified
|
| (all numbers in thousands except net asset value per share) | | Alternatives Fund |
|
| |
| Net Assets Consist of: | | | | |
| Capital (par value and paid-in surplus)* | | $ | 86,269 | |
| Undistributed net investment loss* | | | (541) | |
| Undistributed net realized loss from investment and foreign currency transactions* | | | (1,686) | |
| Unrealized net appreciation of investments, foreign currency translations and non-interested Trustees’ deferred compensation | | | 728 | |
| Total Net Assets | | $ | 84,770 | |
| Net Assets - Class A Shares | | $ | 3,523 | |
| Shares Outstanding, $0.01 Par Value (unlimited shares authorized) | | | 359 | |
Net Asset Value Per Share(2) | | $ | 9.82 | |
Maximum Offering Price Per Share(3) | | $ | 10.42 | |
| Net Assets - Class C Shares | | $ | 3,566 | |
| Shares Outstanding, $0.01 Par Value (unlimited shares authorized) | | | 365 | |
Net Asset Value Per Share(2) | | $ | 9.78 | |
| Net Assets - Class D Shares | | $ | 6,008 | |
| Shares Outstanding, $0.01 Par Value (unlimited shares authorized) | | | 612 | |
| Net Asset Value Per Share | | $ | 9.82 | |
| Net Assets - Class I Shares | | $ | 6,464 | |
| Shares Outstanding, $0.01 Par Value (unlimited shares authorized) | | | 658 | |
| Net Asset Value Per Share | | $ | 9.83 | |
| Net Assets - Class N Shares | | $ | 57,935 | |
| Shares Outstanding, $0.01 Par Value (unlimited shares authorized) | | | 5,892 | |
| Net Asset Value Per Share | | $ | 9.83 | |
| Net Assets - Class S Shares | | $ | 3,502 | |
| Shares Outstanding, $0.01 Par Value (unlimited shares authorized) | | | 357 | |
| Net Asset Value Per Share | | $ | 9.81 | |
| Net Assets - Class T Shares | | $ | 3,772 | |
| Shares Outstanding, $0.01 Par Value (unlimited shares authorized) | | | 384 | |
| Net Asset Value Per Share | | $ | 9.82 | |
| | | |
| * | | See Note 6 in Notes to Financial Statements. |
| (1) | | Includes cost of $698. |
| (2) | | Redemption price per share may be reduced for any applicable contingent deferred sales charge. |
| (3) | | Maximum offering price is computed at 100/94.25 of net asset value. |
See Notes to Financial Statements.
16 | JUNE 30, 2013
Consolidated Statement of Operations
| | | | | |
For the period ended June 30, 2013
| | Janus Diversified
|
| (all numbers in thousands) | | Alternatives Fund(1) |
|
| |
| Investment Income: | | | | |
| Dividends | | $ | 47 | |
| Dividends from affiliates | | | 9 | |
| Foreign tax withheld | | | (4) | |
| Total Investment Income | | | 52 | |
| Expenses: | | | | |
| Advisory fees | | | 335 | |
| Internal servicing expense - Class A Shares | | | 2 | |
| Internal servicing expense - Class C Shares | | | 4 | |
| Internal servicing expense - Class I Shares | | | 1 | |
| Shareholder reports expense | | | 60 | |
| Transfer agent fees and expenses | | | 5 | |
| Registration fees | | | 141 | |
| Custodian fees | | | 13 | |
| Professional fees | | | 57 | |
| Non-interested Trustees’ fees and expenses | | | 1 | |
| Fund administration fees | | | 3 | |
| Administrative services fees - Class D Shares | | | 3 | |
| Administrative services fees - Class S Shares | | | 5 | |
| Administrative services fees - Class T Shares | | | 5 | |
| Distribution fees and shareholder servicing fees - Class A Shares | | | 4 | |
| Distribution fees and shareholder servicing fees - Class C Shares | | | 18 | |
| Distribution fees and shareholder servicing fees - Class S Shares | | | 4 | |
| Administrative, networking and omnibus fees - Class A Shares | | | – | |
| Administrative, networking and omnibus fees - Class C Shares | | | – | |
| Administrative, networking and omnibus fees - Class I Shares | | | – | |
| Other expenses | | | 26 | |
| Total Expenses | | | 687 | |
| Less: Excess Expense Reimbursement | | | (288) | |
| Net Expenses after Waivers and Expense Offsets | | | 399 | |
| Net Investment Loss | | | (347) | |
| Net Realized and Unrealized Gain/(Loss) on Investments: | | | | |
| Net realized loss from investment and foreign currency transactions | | | (181) | |
| Net realized loss from futures contracts | | | (83) | |
| Net realized loss from swap contracts | | | (1,622) | |
| Change in unrealized net appreciation/(depreciation) of investments, foreign currency translations and non-interested Trustees’ deferred compensation | | | 67 | |
| Change in unrealized net appreciation/(depreciation) of futures contracts | | | 680 | |
| Change in unrealized net appreciation/(depreciation) of swap contracts | | | (19) | |
| Net Loss on Investments | | | (1,158) | |
| Net Decrease in Net Assets Resulting from Operations | | $ | (1,505) | |
| | | |
| (1) | | Period from December 28, 2012 (inception date) through June 30, 2013. |
See Notes to Financial Statements.
Janus Alternative Fund | 17
Consolidated Statement of Changes in Net Assets
| | | | | |
| | | Janus Diversified
|
| | | Alternatives Fund |
| For the period ended June 30 | | 2013(1) |
|
| |
| Operations: | | | | |
| Net investment income/(loss) | | $ | (347) | |
| Net realized gain/(loss) from investment and foreign currency transactions | | | (1,886) | |
| Change in unrealized net appreciation/(depreciation) of investments, foreign currency translations and non-interested Trustees’ deferred compensation | | | 728 | |
| Net Increase/(Decrease) in Net Assets Resulting from Operations | | | (1,505) | |
| Dividends and Distributions to Shareholders: | | | | |
| Net Investment Income* | | | | |
| Class A Shares | | | – | |
| Class C Shares | | | – | |
| Class D Shares | | | – | |
| Class I Shares | | | – | |
| Class N Shares | | | – | |
| Class S Shares | | | – | |
| Class T Shares | | | – | |
| Net Realized Gain/(Loss) from Investment Transactions* | | | | |
| Class A Shares | | | – | |
| Class C Shares | | | – | |
| Class D Shares | | | – | |
| Class I Shares | | | – | |
| Class N Shares | | | – | |
| Class S Shares | | | – | |
| Class T Shares | | | – | |
| Net Decrease from Dividends and Distributions | | | – | |
| Capital Share Transactions: | | | | |
| Shares Sold | | | | |
| Class A Shares | | | 3,595 | |
| Class C Shares | | | 3,652 | |
| Class D Shares | | | 6,360 | |
| Class I Shares | | | 6,578 | |
| Class N Shares | | | 60,947 | |
| Class S Shares | | | 3,578 | |
| Class T Shares | | | 4,771 | |
| Shares Repurchased | | | | |
| Class A Shares | | | – | |
| Class C Shares | | | – | |
| Class D Shares | | | (247) | |
| Class I Shares | | | – | |
| Class N Shares | | | (2,043) | |
| Class S Shares | | | – | |
| Class T Shares | | | (916) | |
| Net Increase from Capital Share Transactions | | | 86,275 | |
| Net Increase in Net Assets | | | 84,770 | |
| Net Assets: | | | | |
| Beginning of period | | | – | |
| End of period | | $ | 84,770 | |
| | | | | |
| Undistributed Net Investment Loss* | | $ | (541) | |
| | | |
| * | | See Note 6 in Notes to Financial Statements. |
| (1) | | Period from December 28, 2012 (inception date) through June 30, 2013. |
See Notes to Financial Statements.
18 | JUNE 30, 2013
Consolidated Financial Highlights
Class A Shares
| | | | | | | |
| | | Janus Diversified
| | |
| | | Alternatives Fund | | |
| For a share outstanding during the period ended June 30 | | 2013(1) | | |
| |
| Net Asset Value, Beginning of Period | | | $10.00 | | | |
| Income from Investment Operations: | | | | | | |
| Net investment loss | | | (0.10) | | | |
| Net loss on investments (both realized and unrealized) | | | (0.08) | | | |
| Total from Investment Operations | | | (0.18) | | | |
| Less Distributions: | | | | | | |
| Dividends (from net investment income)* | | | – | | | |
| Distributions (from capital gains)* | | | – | | | |
| Total Distributions | | | – | | | |
| Net Asset Value, End of Period | | | $9.82 | | | |
| Total Return** | | | (1.80)% | | | |
| Net Assets, End of Period (in thousands) | | | $3,523 | | | |
| Average Net Assets for the Period (in thousands) | | | $3,557 | | | |
| Ratio of Gross Expenses (Absent the Waiver of Certain Fees and Expense Offsets) to Average Net Assets*** | | | 3.05% | | | |
| Ratio of Net Expenses (After Waivers and Expense Offsets) to Average Net Assets*** | | | 1.52% | | | |
| Ratio of Net Investment Loss to Average Net Assets*** | | | (1.36)% | | | |
| Portfolio Turnover Rate | | | 38% | | | |
Class C Shares
| | | | | | | |
| | | Janus Diversified
| | |
| | | Alternatives Fund | | |
| For a share outstanding during the period ended June 30 | | 2013(1) | | |
| |
| Net Asset Value, Beginning of Period | | | $10.00 | | | |
| Income from Investment Operations: | | | | | | |
| Net investment loss | | | (0.14) | | | |
| Net loss on investments (both realized and unrealized) | | | (0.08) | | | |
| Total from Investment Operations | | | (0.22) | | | |
| Less Distributions: | | | | | | |
| Dividends (from net investment income)* | | | – | | | |
| Distributions (from capital gains)* | | | – | | | |
| Total Distributions | | | – | | | |
| Net Asset Value, End of Period | | | $9.78 | | | |
| Total Return** | | | (2.20)% | | | |
| Net Assets, End of Period (in thousands) | | | $3,566 | | | |
| Average Net Assets for the Period (in thousands) | | | $3,578 | | | |
| Ratio of Gross Expenses (Absent the Waiver of Certain Fees and Expense Offsets) to Average Net Assets*** | | | 3.92% | | | |
| Ratio of Net Expenses (After Waivers and Expense Offsets) to Average Net Assets*** | | | 2.27% | | | |
| Ratio of Net Investment Loss to Average Net Assets*** | | | (2.11)% | | | |
| Portfolio Turnover Rate | | | 38% | | | |
| | | |
| * | | See Note 6 in Notes to Financial Statements. |
| ** | | Total return not annualized for periods of less than one full year. |
| *** | | Annualized for periods of less than one full year. |
| (1) | | Period from December 28, 2012 (inception date) through June 30, 2013. |
See Notes to Financial Statements.
Janus Alternative Fund | 19
Consolidated Financial Highlights (continued)
Class D Shares
| | | | | | | |
| | | Janus Diversified
| | |
| | | Alternatives Fund | | |
| For a share outstanding during the period ended June 30 | | 2013(1) | | |
| |
| Net Asset Value, Beginning of Period | | | $10.00 | | | |
| Income from Investment Operations: | | | | | | |
| Net investment loss | | | (0.08) | | | |
| Net loss on investments (both realized and unrealized) | | | (0.10) | | | |
| Total from Investment Operations | | | (0.18) | | | |
| Less Distributions: | | | | | | |
| Dividends (from net investment income)* | | | – | | | |
| Distributions (from capital gains)* | | | – | | | |
| Total Distributions | | | – | | | |
| Net Asset Value, End of Period | | | $9.82 | | | |
| Total Return** | | | (1.80)% | | | |
| Net Assets, End of Period (in thousands) | | | $6,008 | | | |
| Average Net Assets for the Period (in thousands) | | | $4,995 | | | |
| Ratio of Gross Expenses (Absent the Waiver of Certain Fees and Expense Offsets) to Average Net Assets*** | | | 3.20% | | | |
| Ratio of Net Expenses (After Waivers and Expense Offsets) to Average Net Assets*** | | | 1.39% | | | |
| Ratio of Net Investment Loss to Average Net Assets*** | | | (1.23)% | | | |
| Portfolio Turnover Rate | | | 38% | | | |
Class I Shares
| | | | | | | |
| | | Janus Diversified
| | |
| | | Alternatives Fund | | |
| For a share outstanding during the period ended June 30 | | 2013(1) | | |
| |
| Net Asset Value, Beginning of Period | | | $10.00 | | | |
| Income from Investment Operations: | | | | | | |
| Net investment loss | | | (0.08) | | | |
| Net loss on investments (both realized and unrealized) | | | (0.09) | | | |
| Total from Investment Operations | | | (0.17) | | | |
| Less Distributions: | | | | | | |
| Dividends (from net investment income)* | | | – | | | |
| Distributions (from capital gains)* | | | – | | | |
| Total Distributions | | | – | | | |
| Net Asset Value, End of Period | | | $9.83 | | | |
| Total Return** | | | (1.70)% | | | |
| Net Assets, End of Period (in thousands) | | | $6,464 | | | |
| Average Net Assets for the Period (in thousands) | | | $5,751 | | | |
| Ratio of Gross Expenses (Absent the Waiver of Certain Fees and Expense Offsets) to Average Net Assets*** | | | 2.58% | | | |
| Ratio of Net Expenses (After Waivers and Expense Offsets) to Average Net Assets*** | | | 1.27% | | | |
| Ratio of Net Investment Loss to Average Net Assets*** | | | (1.10)% | | | |
| Portfolio Turnover Rate | | | 38% | | | |
| | | |
| * | | See Note 6 in Notes to Financial Statements. |
| ** | | Total return not annualized for periods of less than one full year. |
| *** | | Annualized for periods of less than one full year. |
| (1) | | Period from December 28, 2012 (inception date) through June 30, 2013. |
See Notes to Financial Statements.
20 | JUNE 30, 2013
Class N Shares
| | | | | | | |
| | | Janus Diversified
| | |
| | | Alternatives Fund | | |
| For a share outstanding during the period ended June 30 | | 2013(1) | | |
| |
| Net Asset Value, Beginning of Period | | | $10.00 | | | |
| Income from Investment Operations: | | | | | | |
| Net investment loss | | | (0.05) | | | |
| Net loss on investments (both realized and unrealized) | | | (0.12) | | | |
| Total from Investment Operations | | | (0.17) | | | |
| Less Distributions: | | | | | | |
| Dividends (from net investment income)* | | | – | | | |
| Distributions (from capital gains)* | | | – | | | |
| Total Distributions | | | – | | | |
| Net Asset Value, End of Period | | | $9.83 | | | |
| Total Return** | | | (1.70)% | | | |
| Net Assets, End of Period (in thousands) | | | $57,935 | | | |
| Average Net Assets for the Period (in thousands) | | | $30,839 | | | |
| Ratio of Gross Expenses (Absent the Waiver of Certain Fees and Expense Offsets) to Average Net Assets*** | | | 1.84% | | | |
| Ratio of Net Expenses (After Waivers and Expense Offsets) to Average Net Assets*** | | | 1.25% | | | |
| Ratio of Net Investment Loss to Average Net Assets*** | | | (1.06)% | | | |
| Portfolio Turnover Rate | | | 38% | | | |
Class S Shares
| | | | | | | |
| | | Janus Diversified
| | |
| | | Alternatives Fund | | |
| For a share outstanding during the period ended June 30 | | 2013(1) | | |
| |
| Net Asset Value, Beginning of Period | | | $10.00 | | | |
| Income from Investment Operations: | | | | | | |
| Net investment loss | | | (0.11) | | | |
| Net loss on investments (both realized and unrealized) | | | (0.08) | | | |
| Total from Investment Operations | | | (0.19) | | | |
| Less Distributions: | | | | | | |
| Dividends (from net investment income)* | | | – | | | |
| Distributions (from capital gains)* | | | – | | | |
| Total Distributions | | | – | | | |
| Net Asset Value, End of Period | | | $9.81 | | | |
| Total Return** | | | (1.90)% | | | |
| Net Assets, End of Period (in thousands) | | | $3,502 | | | |
| Average Net Assets for the Period (in thousands) | | | $3,548 | | | |
| Ratio of Gross Expenses (Absent the Waiver of Certain Fees and Expense Offsets) to Average Net Assets*** | | | 3.19% | | | |
| Ratio of Net Expenses (After Waivers and Expense Offsets) to Average Net Assets*** | | | 1.76% | | | |
| Ratio of Net Investment Loss to Average Net Assets*** | | | (1.60)% | | | |
| Portfolio Turnover Rate | | | 38% | | | |
| | | |
| * | | See Note 6 in Notes to Financial Statements. |
| ** | | Total return not annualized for periods of less than one full year. |
| *** | | Annualized for periods of less than one full year. |
| (1) | | Period from December 28, 2012 (inception date) through June 30, 2013. |
See Notes to Financial Statements.
Janus Alternative Fund | 21
Consolidated Financial Highlights (continued)
Class T Shares
| | | | | | | |
| | | Janus Diversified
| | |
| | | Alternatives Fund | | |
| For a share outstanding during the period ended June 30 | | 2013(1) | | |
| |
| Net Asset Value, Beginning of Period | | | $10.00 | | | |
| Income from Investment Operations: | | | | | | |
| Net investment loss | | | (0.11) | | | |
| Net loss on investments (both realized and unrealized) | | | (0.07) | | | |
| Total from Investment Operations | | | (0.18) | | | |
| Less Distributions: | | | | | | |
| Dividends (from net investment income)* | | | – | | | |
| Distributions (from capital gains)* | | | – | | | |
| Total Distributions | | | – | | | |
| Net Asset Value, End of Period | | | $9.82 | | | |
| Total Return** | | | (1.80)% | | | |
| Net Assets, End of Period (in thousands) | | | $3,772 | | | |
| Average Net Assets for the Period (in thousands) | | | $4,004 | | | |
| Ratio of Gross Expenses (Absent the Waiver of Certain Fees and Expense Offsets) to Average Net Assets*** | | | 2.94% | | | |
| Ratio of Net Expenses (After Waivers and Expense Offsets) to Average Net Assets*** | | | 1.51% | | | |
| Ratio of Net Investment Loss to Average Net Assets*** | | | (1.36)% | | | |
| Portfolio Turnover Rate | | | 38% | | | |
| | | |
| * | | See Note 6 in Notes to Financial Statements. |
| ** | | Total return not annualized for periods of less than one full year. |
| *** | | Annualized for periods of less than one full year. |
| (1) | | Period from December 28, 2012 (inception date) through June 30, 2013. |
See Notes to Financial Statements.
22 | JUNE 30, 2013
Notes to Financial Statements
The following section describes the organization and significant accounting policies and provides more detailed information about the schedules and tables that appear throughout this report. In addition, the Notes to Financial Statements explain the methods used in preparing and presenting this report.
| |
| 1. | ORGANIZATION AND SIGNIFICANT ACCOUNTING POLICIES |
Janus Diversified Alternatives Fund (the “Fund”) is a series fund. The Fund is part of Janus Investment Fund (the “Trust”), which is organized as a Massachusetts business trust and is registered under the Investment Company Act of 1940, as amended (the “1940 Act”), as an open-end management investment company. The Trust offers forty-four funds which include multiple series of shares, with differing investment objectives and policies. The Fund employs various strategies within the equity, fixed income, commodity, and currency asset classes. The Fund is classified as nondiversified, as defined in the 1940 Act.
The Fund offers multiple classes of shares in order to meet the needs of various types of investors. Each class represents an interest in the same portfolio of investments. Certain financial intermediaries may not offer all classes of shares.
Class A Shares and Class C Shares are generally offered through financial intermediary platforms including, but not limited to, traditional brokerage platforms, mutual fund wrap fee programs, bank trust platforms, and retirement platforms. The maximum purchase in Class C Shares is $500,000 for any single purchase.
Class D Shares are generally no longer being made available to new investors. The Shares are available only to investors who hold accounts directly with the Janus funds and to immediate family members or members of the same household of an eligible individual investor. The Shares are not offered through financial intermediaries.
Class I Shares are available through certain financial intermediary platforms including, but not limited to, mutual fund wrap fee programs, managed account programs, asset allocation programs, and bank trust platforms, as well as certain retirement platforms. Class I Shares are also available to certain institutional investors including, but not limited to, corporations, certain retirement plans, public plans, and foundations/endowments.
Class N Shares are generally available only to financial intermediaries purchasing on behalf of 401(k) plans, 457 plans, 403(b) plans, Taft-Hartley multi-employer plans, profit-sharing and money purchase pension plans, defined benefit plans and nonqualified deferred compensation plans.
Class S Shares are offered through financial intermediary platforms including, but not limited to, retirement platforms and asset allocation, mutual fund wrap, or other discretionary or nondiscretionary fee-based investment advisory programs. In addition, Class S Shares may be available through certain financial intermediaries who have an agreement with Janus Capital Management LLC (“Janus Capital”) or its affiliates to offer Class S Shares on their supermarket platforms.
Class T Shares are available through certain financial intermediary platforms including, but not limited to, mutual fund wrap fee programs, managed account programs, asset allocation programs, bank trust platforms, as well as certain retirement platforms. In addition, Class T Shares may be available through certain financial intermediaries who have an agreement with Janus Capital or its affiliates to offer Class T Shares on their supermarket platforms.
The following accounting policies have been followed by the Fund and are in conformity with accounting principles generally accepted in the United States of America.
Investment Valuation
Securities are valued at the last sales price or the official closing price for securities traded on a principal securities exchange (U.S. or foreign) and on the NASDAQ National Market. Securities traded on over-the-counter (“OTC”) markets and listed securities for which no sales are reported are valued at the latest bid price (or yield equivalent thereof) obtained from one or more dealers transacting in a market for such securities or by a pricing service approved by the Fund’s Trustees. Short-term securities with maturities of 60 days or less may be valued at amortized cost, which approximates market value. Debt securities with a remaining maturity of greater than 60 days are valued in accordance with the evaluated bid price supplied by the pricing service. The evaluated bid price supplied by the pricing service is an evaluation that reflects such factors as security prices, yields, maturities and ratings. Short positions shall be valued in accordance with the same methodologies, except that in the event that a last sale price is not available, the latest ask price shall be used instead of a bid price. Foreign securities and currencies are converted to U.S. dollars using the applicable exchange rate in effect as of the daily close of the New York Stock Exchange (“NYSE”). When market quotations are not readily available or deemed unreliable, or events or circumstances that may affect the value of portfolio securities held by the Fund are identified between the closing of their principal markets and the time the net asset value (“NAV”) is determined, securities may be valued at fair value as determined in good faith under procedures established by and under the supervision of the Fund’s Trustees. Circumstances in
Janus Alternative Fund | 23
Notes to Financial Statements (continued)
which fair value pricing may be utilized include, but are not limited to: (i) a significant event that may affect the securities of a single issuer, such as a merger, bankruptcy, or significant issuer specific development; (ii) an event that may affect an entire market, such as a natural disaster or significant governmental action; (iii) a nonsignificant event such as a market closing early or not opening, or a security trading halt; and (iv) pricing of a non-valued security and a restricted or non-public security. The Fund uses systematic fair valuation models provided by independent third parties to value international equity securities in order to adjust for stale pricing, which may occur between the close of certain foreign exchanges and the close of the NYSE. Restricted and illiquid securities are valued in accordance with procedures established by the Fund’s Trustees.
Investment Transactions and Investment Income
Investment transactions are accounted for as of the date purchased or sold (trade date). Dividend income is recorded on the ex-dividend date. Certain dividends from foreign securities will be recorded as soon as the Trust is informed of the dividend, if such information is obtained subsequent to the ex-dividend date. Dividends from foreign securities may be subject to withholding taxes in foreign jurisdictions. Interest income is recorded on the accrual basis and includes amortization of premiums and accretion of discounts. Gains and losses are determined on the identified cost basis, which is the same basis used for federal income tax purposes. Income, as well as gains and losses, both realized and unrealized, are allocated daily to each class of shares based upon the ratio of net assets represented by each class as a percentage of total net assets.
Expenses
The Fund bears expenses incurred specifically on its behalf, as well as a portion of general expenses, which may be allocated pro rata to the Fund. Each class of shares bears expenses incurred specifically on its behalf and, in addition, each class bears a portion of general expenses, which are allocated daily to each class of shares based upon the ratio of net assets represented by each class as a percentage of total net assets. Expenses directly attributable to a specific class of shares are charged against the operations of such class. Additionally, the Fund, as a shareholder in Janus Diversified Alternatives Subsidiary, Ltd., a wholly-owned subsidiary of the Fund organized under the laws of the Cayman Islands as an exempted company (the “Subsidiary”), will also indirectly bear its pro rata share of the expenses incurred by the Subsidiary.
Estimates
The preparation of financial statements in conformity with accounting principles generally accepted in the United States of America requires management to make estimates and assumptions that affect the reported amount of assets and liabilities and disclosure of contingent assets and liabilities at the date of the consolidated financial statements, and the reported amounts of income and expenses during the reporting period. Actual results could differ from those estimates.
Foreign Currency Translations
The Fund does not isolate that portion of the results of operations resulting from the effect of changes in foreign exchange rates on investments from the fluctuations arising from changes in market prices of securities held at the date of the financial statements. Net unrealized appreciation or depreciation of investments and foreign currency translations arise from changes in the value of assets and liabilities, including investments in securities held at the date of the financial statements, resulting from changes in the exchange rates and changes in market prices of securities held.
Currency gains and losses are also calculated on payables and receivables that are denominated in foreign currencies. The payables and receivables are generally related to foreign security transactions and income translations.
Foreign currency-denominated assets and forward currency contracts may involve more risks than domestic transactions, including currency risk, political and economic risk, regulatory risk and equity risk. Risks may arise from the potential inability of a counterparty to meet the terms of a contract and from unanticipated movements in the value of foreign currencies relative to the U.S. dollar.
Dividend Distributions
The Fund generally declares and distributes dividends of net investment income and realized capital gains (if any) annually.
Federal Income Taxes
The Fund intends to continue to qualify as a regulated investment company and distribute all of its taxable income. Management has analyzed the Fund’s tax positions taken for all open federal income tax years, generally a three-year period, and has concluded that no provision for federal income tax is required in the Fund’s financial statements.
24 | JUNE 30, 2013
Restricted Cash
As of June 30, 2013, Janus Diversified Alternatives Fund had restricted cash in the amount of $72,330,000. The restricted cash represents collateral received in relation to futures and swap contracts invested in by the Fund at June 30, 2013. The restricted cash is held at the Fund’s custodian, State Street Bank and Trust Company. The carrying value of the restricted cash approximates fair value.
Valuation Inputs Summary
In accordance with FASB guidance, the Fund utilizes the “Fair Value Measurements” to define fair value, establish a framework for measuring fair value, and expand disclosure requirements regarding fair value measurements. The Fair Value Measurement Standard does not require new fair value measurements, but is applied to the extent that other accounting pronouncements require or permit fair value measurements. This standard emphasizes that fair value is a market-based measurement that should be determined based on the assumptions that market participants would use in pricing an asset or liability. Various inputs are used in determining the value of the Fund’s investments defined pursuant to this standard. These inputs are summarized into three broad levels:
Level 1 – Quoted prices in active markets for identical securities.
Level 2 – Prices determined using other significant observable inputs. Observable inputs are inputs that reflect the assumptions market participants would use in pricing a security and are developed based on market data obtained from sources independent of the reporting entity. These may include quoted prices for similar securities, interest rates, prepayment speeds, credit risk, and others.
Debt securities are valued in accordance with the evaluated bid price supplied by the pricing service and generally categorized as Level 2 in the hierarchy. Securities traded on OTC markets and listed securities for which no sales are reported are valued at the latest bid price (or yield equivalent thereof) obtained from one or more dealers transacting in a market for such securities or by a pricing service approved by the Fund’s Trustees and are categorized as Level 2 in the hierarchy. Short-term securities with maturities of 60 days or less are valued at amortized cost, which approximates market value and are categorized as Level 2 in the hierarchy. Periodic review and monitoring of the valuation of short-term securities is performed in an effort to ensure that amortized cost approximates market value. Other securities that may be categorized as Level 2 in the hierarchy include, but are not limited to, preferred stocks, bank loans, American Depositary Receipts (“ADRs”), Global Depositary Receipts (“GDRs”), warrants, swaps, investments in mutual funds, OTC options, and forward contracts. The Fund uses systematic fair valuation models provided by independent third parties to value international equity securities in order to adjust for stale pricing, which may occur between the close of certain foreign exchanges and the close of the NYSE. These are generally categorized as Level 2 in the hierarchy.
Level 3 – Prices determined using significant unobservable inputs. In situations where quoted prices or observable inputs are unavailable or deemed less relevant (for example, when there is little or no market activity for an investment at the end of the period), unobservable inputs may be used. Unobservable inputs are inputs that reflect the reporting entity’s own assumptions about the factors market participants would use in pricing the security and would be based on the best information available under the circumstances.
For restricted equity securities and private placements where observable inputs are limited, assumptions about market activity and risk are used in employing valuation techniques such as the market approach, the income approach, or the cost approach, as defined under the FASB Guidance. These are categorized as Level 3 in the hierarchy.
There have been no significant changes in valuation techniques used in valuing any such positions held by the Fund since the beginning of the period.
The inputs or methodology used for valuing securities are not necessarily an indication of the risk associated with investing in those securities. The summary of inputs used as of June 30, 2013 to value the Fund’s investments in securities and other financial instruments is included in the “Valuation Inputs Summary” in the Notes to Consolidated Schedule of Investments and Other Information.
FASB Accounting Standards Update, “Amendments to Achieve Common Fair Value Measurement and Disclosure Requirements” requires disclosures about amounts and reasons for all transfers in and out of Level 1 and Level 2 fair value measurements. For fair value measurements categorized within Level 3 of the fair value hierarchy, the Fund shall provide quantitative information about the significant unobservable inputs used in the fair value measurement. To meet the objective of the quantitative disclosure, the Fund may need to further disaggregate to provide more meaningful information about the significant unobservable inputs used and how these inputs vary over time.
Janus Alternative Fund | 25
Notes to Financial Statements (continued)
The Fund is not required to create quantitative information to comply with this disclosure requirement if quantitative unobservable inputs are not developed by the Fund when measuring fair value (for example, when a Fund uses prices from prior transactions or third-party pricing information without adjustment). However, when providing this disclosure, the Fund cannot ignore quantitative unobservable inputs that are significant to the fair value measurement and are reasonably available to the Fund.
In addition, the Accounting Standards Update requires the Fund to provide a narrative sensitivity disclosure of the fair value measurement changes in unobservable inputs and the interrelationships between those unobservable inputs for fair value measurements categorized within Level 3 of the fair value hierarchy.
There were no transfers in or out of Level 1, Level 2 and Level 3 during the period.
The Fund recognizes transfers between the levels as of the beginning of the fiscal year.
| |
| 2. | DERIVATIVE INSTRUMENTS |
The Fund may invest in various types of derivatives, which may at times result in significant derivative exposure. A derivative is a financial instrument whose performance is derived from the performance of another asset. The Fund may invest in derivative instruments including, but not limited to: futures contracts, put options, call options, options on future contracts, options on foreign currencies, swaps, forward contracts, structured investments, commodities-linked derivative instruments, inflation-index swaps, and other equity-linked derivatives. Each derivative instrument that was held by the Fund during the period ended June 30, 2013 is discussed in further detail below. A summary of derivative activity is reflected in the tables at the end of this section.
The Fund may use derivative instruments for hedging (to offset risks associated with an investment, currency exposure, or market conditions) or for speculative (to seek to enhance returns) purposes. When the Fund invests in a derivative for speculative purposes, the Fund will be fully exposed to the risks of loss of that derivative, which may sometimes be greater than the derivative’s cost. The Fund may not use any derivative to gain exposure to an asset or class of assets in which it would be prohibited by its investment restrictions from purchasing directly. The Fund’s ability to use derivative instruments may also be limited by tax considerations.
Investments in derivatives in general are subject to market risks that may cause their prices to fluctuate over time. Investments in derivatives may not directly correlate with the price movements of the underlying instrument. As a result, the use of derivatives may expose the Fund to additional risks that it would not be subject to if it invested directly in the securities underlying those derivatives. The use of derivatives may result in larger losses or smaller gains than otherwise would be the case. Derivatives can be volatile and may involve significant risks, including, but not limited to, counterparty risk, credit risk, currency risk, equity risk, index risk, interest rate risk, leverage risk, and liquidity risk, as described below.
Derivatives may generally be traded OTC or on an exchange. Derivatives traded OTC, such as options and structured notes, are agreements that are individually negotiated between parties and can be tailored to meet a purchaser’s needs.
OTC derivatives are not guaranteed by a clearing agency and may be subject to increased credit risk. In an effort to mitigate credit risk associated with derivatives traded OTC, the Fund may enter into collateral agreements with certain counterparties whereby, subject to certain minimum exposure requirements, the Fund may require the counterparty to post collateral if the Fund has a net aggregate unrealized gain on all OTC derivative contracts with a particular counterparty. There is no guarantee that counterparty exposure is reduced and these arrangements are dependent on Janus Capital’s ability to establish and maintain appropriate systems and trading.
In pursuit of its investment objective, the Fund may seek to use derivatives to increase or decrease exposure to the following market risk factors:
| | |
| | • | Counterparty Risk – Counterparty risk is the risk that the counterparty (the party on the other side of the transaction) on a derivative transaction will be unable to honor its financial obligation to the Fund. |
| |
| | • | Credit Risk – Credit risk is the risk an issuer will be unable to make principal and interest payments when due, or will default on its obligations. |
| |
| | • | Currency Risk – Currency risk is the risk that changes in the exchange rate between currencies will adversely affect the value (in U.S. dollar terms) of an investment. |
| |
| | • | Equity Risk – Equity risk relates to the change in value of equity securities as they relate to increases or decreases in the general market. |
| |
| | • | Index Risk – If the derivative is linked to the performance of an index, it will be subject to the risks associated with changes in that index. If the index changes, the Fund could receive lower interest payments or experience a reduction in the value of the derivative to below what the Fund paid. |
26 | JUNE 30, 2013
| | |
| | | Certain indexed securities, including inverse securities (which move in an opposite direction to the index), may create leverage, to the extent that they increase or decrease in value at a rate that is a multiple of the changes in the applicable index. |
| | |
| | • | Interest Rate Risk – Interest rate risk is the risk that the value of fixed-income securities will generally decline as prevailing interest rates rise, which may cause the Fund’s NAV to likewise decrease, and vice versa. |
| |
| | • | Leverage Risk – Leverage risk is the risk associated with certain types of leveraged investments or trading strategies pursuant to which relatively small market movements may result in large changes in the value of an investment. The Fund creates leverage by using borrowed capital to increase the amount invested, or investing in instruments, including derivatives, where the investment loss can exceed the original amount invested. Certain investments or trading strategies that involve leverage can result in losses that greatly exceed the amount originally invested. |
| |
| | • | Liquidity Risk – Liquidity risk is the risk that certain securities may be difficult or impossible to sell at the time that the seller would like or at the price that the seller believes the security is currently worth. |
Commodity-Linked Investments
The Fund may invest in commodity index-linked swap agreements, commodity options and futures, and options on futures that provide exposure to the investment returns of the commodities markets. The Fund may also invest in other commodity-linked derivative instruments, such as commodity-linked notes (“structured notes”). The Fund will seek to gain exposure to the commodity markets, in whole or in part, through investments in the Subsidiary which is generally subject to the same investment policies and restrictions as the Fund. The Subsidiary invests in commodity-linked investments and other investments which may serve as margin or collateral for the Subsidiary’s derivative positions. Such exposure may subject the Fund to greater volatility than investments in traditional securities. The value of a given commodity-linked derivative investment typically is based upon the price movements of a physical commodity (such as heating oil, livestock, or agricultural products), a commodity futures contract or commodity index, or some other readily measurable economic variable. The value of commodity-linked derivative instruments may therefore be affected by changes in overall market movements, volatility of the underlying benchmark, changes in interest rates, or other factors affecting a particular industry or commodity such as drought, floods, weather, livestock disease, embargoes, tariffs, and international economic, political, and regulatory developments.
Forward Foreign Currency Exchange Contracts
A forward foreign currency exchange contract (“forward currency contract”) is an obligation to buy or sell a specified currency at a future date at a negotiated rate (which may be U.S. dollars or a foreign currency). The Fund may enter into forward currency contracts for hedging purposes, including, but not limited to, reducing exposure to changes in foreign currency exchange rates on foreign portfolio holdings and locking in the U.S. dollar cost of firm purchase and sale commitments for securities denominated in or exposed to foreign currencies. The Fund may also invest in forward currency contracts for nonhedging purposes such as seeking to enhance returns. The Fund is subject to currency risk in the normal course of pursuing its investment objective through its investments in forward currency contracts.
The gain or loss arising from the difference between the U.S. dollar cost of the original contract and the value of the foreign currency in U.S. dollars upon closing a contract is included in “Net realized gain/(loss) from investment and foreign currency transactions” on the Consolidated Statement of Operations.
The Fund does not require the counterparty to post collateral for forward currency contracts; however, the Fund will segregate cash or high-grade securities with its custodian in an amount at all times equal to or greater than the Fund’s commitment with respect to these contracts. Such segregated assets are denoted on the accompanying Consolidated Schedule of Investments and are evaluated daily to ensure their market value equals or exceeds the current market value of the Fund’s corresponding forward currency contracts.
Futures Contracts
A futures contract is an exchange-traded agreement to take or make delivery of an underlying asset at a specific time in the future for a specific predetermined negotiated price. The Fund may enter into futures contracts to gain exposure to the stock market pending investment of cash balances or to meet liquidity needs. The Fund is subject to interest rate risk, equity risk, and currency risk in the normal course of pursuing its investment objective through its investments in futures contracts. The Fund may also use such derivative instruments to hedge or protect from adverse movements in securities prices, currency rates or interest rates. The use of futures contracts may involve risks such as the possibility of illiquid markets or imperfect correlation between the values of the contracts and the
Janus Alternative Fund | 27
Notes to Financial Statements (continued)
underlying securities, or that the counterparty will fail to perform its obligations.
Futures contracts are marked-to-market daily, and the daily variation margin is recorded as a receivable or payable on the Consolidated Statement of Assets and Liabilities (if applicable). When a contract is closed, a realized gain or loss is recorded as “Net realized gain/(loss) from futures contracts” on the Consolidated Statement of Operations (if applicable), equal to the difference between the opening and closing value of the contract. Generally, futures contracts are marked-to-market (i.e., treated as realized and subject to distribution) for federal income tax purposes at fiscal year-end. Securities held by the Fund that are designated as collateral for market value on futures contracts are noted on the Consolidated Schedule of Investments (if applicable). Such collateral is in the possession of the Fund’s custodian or with the counterparty broker.
With futures, there is minimal counterparty credit risk to the Fund since futures are exchange-traded and the exchange’s clearinghouse, as counterparty to all exchange-traded futures, guarantees the futures against default.
Swaps
A swap is an agreement that obligates two parties to exchange a series of cash flows at specified intervals based upon or calculated by reference to changes in specified prices or rates for a specified amount of an underlying asset. The Fund may utilize swap agreements as a means to gain exposure to a commodity index, commodity markets, or certain common or preferred stocks and/or to “hedge” or protect its portfolio from adverse movements in securities prices, the rate of inflation, or interest rates. The Fund is subject to equity risk and interest rate risk in the normal course of pursuing its investment objective through investments in swap contracts. Swap agreements entail the risk that a party will default on its payment obligation to the Fund. If the other party to a swap defaults, the Fund would risk the loss of the net amount of the payments that it contractually is entitled to receive. If the Fund utilizes a swap at the wrong time or judges market conditions incorrectly, the swap may result in a loss to the Fund and reduce the Fund’s total return. Swap agreements traditionally were privately negotiated and entered into in the OTC market. However, the Dodd-Frank Wall Street Reform and Consumer Protection Act (the “Dodd-Frank Act”) of 2010 now requires certain swap agreements to be cleared through a clearinghouse and traded on an exchange or swap execution facility. New regulations under the Dodd-Frank Act could, among other things, increase the cost of such transactions. Swap contracts of the Fund are reported as an asset or liability on the Consolidated Statement of Assets and Liabilities (if applicable). Realized gains and losses of the Fund are reported in “Net realized gain/(loss) from swap contracts” on the Consolidated Statement of Operations (if applicable).
Total return swaps involve an exchange by two parties in which one party makes payments based on a set rate, either fixed or variable, while the other party makes payments based on the return of an underlying asset, which includes both the income it generates and any capital gains over the payment period.
The Fund’s maximum risk of loss for total return swaps from counterparty risk or credit risk is the discounted value of the payments to be received from/paid to the counterparty over the contract’s remaining life, to the extent that the amount is positive. The risk is mitigated by having a netting arrangement between the Fund and the counterparty and by the posting of collateral to the Fund to cover the Fund’s exposure to the counterparty.
The following table, grouped by derivative type, provides information about the fair value and location of derivatives within the Consolidated Statement of Assets and Liabilities as of June 30, 2013.
Fair Value of Derivative Instruments as of June 30, 2013
| | | | | | | | | | | | | |
| | | Asset Derivatives | | | Liability Derivatives | |
| | | Consolidated Statements of
| | | | | Consolidated Statements of
| | | |
| Derivatives not accounted for as hedging instruments | | Assets and Liabilities Location | | Fair Value | | | Assets and Liabilities Location | | Fair Value | |
| |
| |
Janus Diversified Alternatives Fund | | | | | | | | | | | | |
| Commodity Contracts | | Outstanding swap contracts at value | | $ | 0 | | | | | $ | – | |
| Equity Contracts | | Outstanding swap contracts at value | | | 636 | | | Outstanding swap contracts at value | | | 19,925 | |
| Equity Contracts | | Variation margin | | | 16,437 | | | | | | – | |
| Foreign Exchange Contracts | | Forward currency contracts | | | 10,187 | | | Forward currency contracts | | | 7,326 | |
| |
| |
| Total | | | | $ | 27,260 | | | | | $ | 27,251 | |
| |
| |
28 | JUNE 30, 2013
The following tables provide information about the effect of derivatives and hedging activities on the Fund��s Consolidated Statement of Operations for the period ended June 30, 2013.
The effect of Derivative Instruments on the Consolidated Statement of Operations for the period ended June 30, 2013
| | | | | | | | | | | | | | | | | | | | | |
| Amount of Realized Gain/(Loss) on Derivatives Recognized in Income | |
| Derivatives not accounted for as hedging instruments | | Futures | | | Swaps | | | Options | | | Forward Currency Contracts | | | Total | |
| |
| |
Janus Diversified Alternatives Fund | | | | | | | | | | | | | | | | | | | | |
| |
| |
| Commodity Contracts | | $ | – | | | $ | 3,527 | | | $ | – | | | $ | – | | | $ | 3,527 | |
| |
| |
| Equity Contracts | | | (82,811 | ) | | | (1,625,460 | ) | | | – | | | | – | | | | (1,708,271 | ) |
| |
| |
| Foreign Exchange Contracts | | | – | | | | – | | | | – | | | | (11,570 | ) | | | (11,570 | ) |
| |
| |
| Total | | $ | (82,811 | ) | | $ | (1,621,933 | ) | | $ | – | | | $ | (11,570 | ) | | $ | (1,716,314 | ) |
| |
| |
| | | | | | | | | | | | | | | | | | | | | |
| Change in Unrealized Appreciation/(Depreciation) on Derivatives Recognized in Income | |
| Derivatives not accounted for as hedging instruments | | Futures | | | Swaps | | | Options | | | Forward Currency Contracts | | | Total | |
| |
| |
Janus Diversified Alternatives Fund | | | | | | | | | | | | | | | | | | | | |
| |
| |
| Commodity Contracts | | $ | – | | | $ | 0 | | | $ | – | | | $ | – | | | $ | – | |
| |
| |
| Equity Contracts | | | 679,541 | | | | (19,289 | ) | | | – | | | | – | | | | 660,252 | |
| |
| |
| Foreign Exchange Contracts | | | – | | | | – | | | | – | | | | 2,861 | | | | 2,861 | |
| |
| |
| Total | | $ | 679,541 | | | $ | (19,289 | ) | | $ | – | | | $ | 2,861 | | | $ | 663,113 | |
| |
| |
Please see the Fund’s Consolidated Statement of Operations for the Fund’s “Net Realized and Unrealized Gain/(Loss) on Investments.”
The value of derivative instruments at period end and the effect of derivatives on the Consolidated Statement of Assets and Liabilities, Consolidated Statement of Operations, and the Consolidated Statement of Investments are indicative of the Fund’s volume throughout the period.
| |
| 3. | OTHER INVESTMENTS AND STRATEGIES |
Additional Investment Risk
The Fund may be invested in lower-rated debt securities that have a higher risk of default or loss of value since these securities may be sensitive to economic changes, political changes or adverse developments specific to the issuer.
The financial crisis that began in 2008 has caused a significant decline in the value and liquidity of many securities of issuers worldwide in the equity and fixed-income/credit markets. In response to the crisis, the United States and certain foreign governments, along with the U.S. Federal Reserve and certain foreign central banks have taken steps to support the financial markets. The withdrawal of this support, failure of efforts to respond to the crisis, or investor perception that such efforts are not succeeding each could also negatively affect financial markets generally, and the value and liquidity of specific securities. In addition, policy and legislative changes in the United States and in other countries are impacting many aspects of financial regulation. The effect of these changes on the markets, and the practical implications for market participants, including the Fund, may not be fully known for some time. Because the situation is unprecedented and widespread, it may also be unusually difficult to identify both investment risks and opportunities, which could limit or preclude a Fund’s ability to achieve its investment objective. Therefore, it is important to understand that the value of your investment may fall, sometimes sharply, and you could lose money.
The enactment of the Dodd-Frank Act is dramatically changing the way in which the U.S. financial system is supervised and regulated. The Dodd-Frank Act provides for widespread regulation of financial institutions, consumer financial products and services, broker-dealers, OTC derivatives, investment advisers, credit rating agencies, and mortgage lending, which expands federal oversight in the financial sector, including the investment management industry. Many provisions of the Dodd-Frank Act will be implemented through future rulemaking. Therefore, the ultimate impact of the Dodd-Frank Act and the regulations under the Dodd-Frank Act, on the Fund and the investment management industry as a whole, is not yet certain.
A number of countries in the European Union (“EU”) have experienced severe economic and financial difficulties. As
Janus Alternative Fund | 29
Notes to Financial Statements (continued)
a result, financial markets in the EU have been subject to extreme volatility and declines in asset values and liquidity. Responses to these financial problems by European governments, central banks, and others, including austerity measures and reforms, may not work, may result in social unrest, and may limit future growth and economic recovery or have other unintended consequences. Further defaults or restructuring by governments and others of their debt could have additional adverse effects on economies, financial markets, and asset valuations around the world.
Certain areas of the world have historically been prone to and economically sensitive to environmental events such as, but not limited to, hurricanes, earthquakes, typhoons, flooding, tidal waves, tsunamis, erupting volcanoes, wildfires or droughts, tornadoes, mudslides, or other weather-related phenomena. Such disasters, and the resulting physical or economic damage, could have a severe and negative impact on the Fund’s investment portfolio and, in the longer term, could impair the ability of issuers in which the Fund invests to conduct their businesses as they would under normal conditions. Adverse weather conditions may also have a particularly significant negative effect on issuers in the agricultural sector and on insurance companies that insure against the impact of natural disasters.
Counterparties
Fund transactions involving a counterparty are subject to the risk that the counterparty or a third party will not fulfill its obligation to the Fund (“counterparty risk”). Counterparty risk may arise because of the counterparty’s financial condition (i.e., financial difficulties, bankruptcy, or insolvency), market activities and developments, or other reasons, whether foreseen or not. A counterparty’s inability to fulfill its obligation may result in significant financial loss to the Fund. The Fund may be unable to recover its investment from the counterparty or may obtain a limited recovery, and/or recovery may be delayed. The extent of the Fund’s exposure to counterparty risk in respect to financial assets approximates its carrying value as recorded on the Fund’s Consolidated Statement of Assets and Liabilities.
The Fund may be exposed to counterparty risk through participation in various programs including, but not limited to, lending its securities to third parties, cash sweep arrangements whereby the Fund’s cash balance is invested in one or more types of cash management vehicles, as well as investments in, but not limited to, repurchase agreements, debt securities, and derivatives, including various types of swaps, futures and options. The Fund intends to enter into financial transactions with counterparties that Janus Capital believes to be creditworthy at the time of the transaction. There is always the risk that Janus Capital’s analysis of a counterparty’s creditworthiness is incorrect or may change due to market conditions. To the extent that the Fund focuses its transactions with a limited number of counterparties, it will have greater exposure to the risks associated with one or more counterparties.
Investment in Subsidiary
To qualify as a regulated investment company under the Internal Revenue Code of 1986, as amended (the “Code”), 90% of the Fund’s income must be from certain qualified sources. Direct investment in many commodities-related investments generates income that is not from a qualifying source for purposes of meeting this 90% test. The Fund will seek to gain exposure to the commodity markets, in whole or in part, through investments in the Subsidiary, which is generally subject to the same investment policies and restrictions as the Fund. The Subsidiary may invest without limitation in commodity index-linked swaps, commodity futures, commodity swaps, commodity-linked notes, and other commodity-linked derivative instruments. The Subsidiary may also invest in fixed-income securities and other investments which may serve as margin or collateral for the Subsidiary’s derivatives positions. The Fund may invest 25% or less of its total assets in the Subsidiary. Income or net capital gains from the Fund’s investment in the Subsidiary would be treated as ordinary income to the Fund. Janus Capital is the adviser to the Subsidiary. The Subsidiary will not be subject to U.S. laws (including securities laws) and their protections. The Subsidiary is subject to the laws of a foreign jurisdiction, which can be affected by developments in that jurisdiction.
The IRS has previously issued a number of private letter rulings to mutual funds which indicate that income from a fund’s investment in a wholly-owned foreign subsidiary that invests in commodity-linked derivatives, such as the Subsidiary, constitutes qualifying income. The IRS has suspended issuance of any further private letter rulings pending a review of its position. Changes in the laws of the United States and/or the Cayman Islands could result in the inability of the Fund and/or the Subsidiary to operate as described in the Prospectuses and the SAI and could adversely affect the Fund. In particular, unfavorable treatment of the income derived from the Fund’s investment in the Subsidiary could jeopardize the Fund’s status as a regulated investment company under the Code, which in turn may subject the Fund to higher tax rates and/or penalties. Additionally, the Commodity Futures Trading Commission (“CFTC”) recently adopted changes to Rule 4.5 under the Commodity Exchange Act which required Janus Capital to register with the CFTC as a Commodity Pool Operator, and operation of the Fund and Subsidiary are subject to certain CFTC rules and regulations. Such regulatory changes, several of which
30 | JUNE 30, 2013
remain uncertain or incomplete, could potentially limit or restrict the ability of the Fund to pursue its investment strategies and/or increase the costs of implementing its strategies.
By investing in the Subsidiary, the Fund will be indirectly exposed to the risks associated with the Subsidiary’s investments, which are generally similar to those that are permitted to be held by the Fund. The Subsidiary is not registered under the 1940 Act, and is not subject to all of the provisions of the 1940 Act.
| |
| 4. | BASIS FOR CONSOLIDATION FOR JANUS DIVERSIFIED ALTERNATIVES FUND |
The Subsidiary was incorporated on December 28, 2012 as a wholly-owned subsidiary of Janus Diversified Alternatives Fund. As of June 30, 2013, net assets of the Fund were $84,769,832, of which $13,863,177, or approximately 16%, represented the Fund’s ownership of the shares of the Subsidiary. The Fund’s Consolidated Schedule of Investments, Consolidated Statement of Assets and Liabilities, Consolidated Statement of Operations, Consolidated Statement of Changes in Net Assets, and Consolidated Financial Highlights include the accounts of both the Fund and the Subsidiary for the period from December 28, 2012 (inception date) through June 30, 2013. All inter-company transactions and balances have been eliminated in consolidation.
| |
| 5. | INVESTMENT ADVISORY AGREEMENTS AND OTHER TRANSACTIONS WITH AFFILIATES |
The Fund and the Subsidiary each pay Janus Capital an investment advisory fee which is calculated daily and paid monthly. The following table reflects the Fund’s contractual investment advisory fee rate (expressed as an annual rate). The rate shown is a fixed rate based on the Fund’s average daily net assets.
| | | | | | | | | |
| | | Average Daily
| | Contractual Investment
| | |
| | | Net Assets
| | Advisory Fee (%)
| | |
| Fund | | of the Fund | | (annual rate) | | |
| |
| |
| Janus Diversified Alternatives Fund | | First $ | 1 Billion | | | 1.00 | | |
| | | Over $ | 1 Billion | | | 0.95 | | |
| |
| |
Janus Capital has contractually agreed to waive a portion of the Fund’s management fee in an amount equal to the management fee paid to Janus Capital by the Subsidiary. The management fee waiver arrangement related to the Subsidiary may not be discontinued by Janus Capital as long as its contract with the Subsidiary is in place.
Janus Capital has contractually agreed to waive the Fund’s total annual fund operating expenses, which include the other expenses of the Subsidiary (excluding the distribution and shareholder servicing fees applicable to Class A Shares, Class C Shares, and Class S Shares, administrative services fees payable pursuant to the Transfer Agency Agreement, brokerage commissions, interest, dividends, taxes, acquired fund fees and expenses, and extraordinary expenses) to 1.25% until at least November 1, 2014. The contractual waiver may be terminated or modified prior to this date only at the discretion of the Board of Trustees. If applicable, amounts reimbursed to the Fund by Janus Capital are disclosed as “Excess Expense Reimbursement” on the Statement of Operations.
For a period of three years subsequent to the Fund’s commencement of operations or until the Fund’s assets exceed the first breakpoint in the investment advisory fee schedule, whichever occurs first, Janus Capital may recover from the Fund fees and expenses previously waived or reimbursed, which could then be considered a deferral, if the Fund’s expense ratio, including recovered expenses, falls below the expense limit. The recoupment of such reimbursements expires December 28, 2015. For the period ended June 30, 2013, total reimbursement by Janus Capital was $285,095 for the Fund. As of June 30, 2013, the aggregate amount of recoupment that may potentially be made to Janus Capital is $285,095.
Janus Services LLC (“Janus Services”), a wholly-owned subsidiary of Janus Capital, is the Fund’s and the Subsidiary’s transfer agent. In addition, Janus Services provides or arranges for the provision of certain other administrative services including, but not limited to, recordkeeping, accounting, order processing, and other shareholder services for the Fund.
Certain, but not all, intermediaries charge administrative fees to investors in Class A Shares, Class C Shares, and Class I Shares for administrative services provided on behalf of such investors. These administrative fees are paid by the Class A Shares, Class C Shares, and Class I Shares of the Fund to Janus Services, which uses such fees to reimburse intermediaries. Consistent with the Transfer Agency Agreement between Janus Services and the Fund, Janus Services may negotiate the level, structure, and/or terms of the administrative fees with intermediaries requiring such fees on behalf of the Fund. Janus Capital and its affiliates benefit from an increase in assets that may result from such relationships.
Class D Shares of the Fund pay an annual administrative services fee of 0.12% of net assets. These administrative services fees are paid by Class D Shares of the Fund for shareholder services provided by Janus Services.
Janus Services receives an administrative services fee at an annual rate of up to 0.25% of the average daily net assets of Class S Shares and Class T Shares of the Fund
Janus Alternative Fund | 31
Notes to Financial Statements (continued)
for providing or procuring administrative services to investors in Class S Shares and Class T Shares of the Fund. Janus Services expects to use all or a significant portion of this fee to compensate retirement plan service providers, broker-dealers, bank trust departments, financial advisors, and other financial intermediaries for providing these services. Janus Services or its affiliates may also pay fees for services provided by intermediaries to the extent the fees charged by intermediaries exceed the 0.25% of net assets charged to Class S Shares and Class T Shares of the Fund. Janus Services may keep certain amounts retained for reimbursement of out-of-pocket costs incurred for servicing clients of Class S Shares and Class T Shares.
Services provided by these financial intermediaries may include, but are not limited to, recordkeeping, subaccounting, order processing, providing order confirmations, periodic statements, forwarding prospectuses, shareholder reports, and other materials to existing customers, answering inquiries regarding accounts, and other administrative services. Order processing includes the submission of transactions through the National Securities Clearing Corporation (“NSCC”) or similar systems, or those processed on a manual basis with Janus Capital.
Janus Services is compensated for its services related to Class D Shares, and receives reimbursement for its out-of-pocket costs on all other share classes. Included in out-of-pocket expenses are the expenses Janus Services incurs for serving as transfer agent and providing servicing to shareholders.
Janus Distributors LLC (“Janus Distributors”), a wholly-owned subsidiary of Janus Capital, is the distributor of the Fund. The Fund has adopted a Distribution and Shareholder Servicing Plan (the “Plan”) pursuant to Rule 12b-1 under the 1940 Act. The Plan authorizes payments by the Fund to intermediaries at an annual rate, as determined from time to time by the Board of Trustees, of up to 0.25% of the Class A Shares average daily net assets, of up to 1.00% of the Class C Shares average daily net assets, and of up to 0.25% of the Class S Shares average daily net assets. Payments under the Plan are not tied exclusively to actual distribution and shareholder service expenses, and the payments may exceed distribution and shareholder service expenses actually incurred by the Fund. If any of the Fund’s actual distribution and shareholder service expenses incurred during a calendar year are less than the payments made during a calendar year, the Fund will be refunded the difference. Refunds, if any, are included in “Distribution fees and shareholder servicing fees” in the Consolidated Statement of Operations.
The Board of Trustees has adopted a deferred compensation plan (the “Deferred Plan”) for independent Trustees to elect to defer receipt of all or a portion of the annual compensation they are entitled to receive from the Fund. All deferred fees are credited to an account established in the name of the Trustees. The amounts credited to the account then increase or decrease, as the case may be, in accordance with the performance of one or more of the Janus funds that are selected by the Trustees. The account balance continues to fluctuate in accordance with the performance of the selected fund or funds until final payment of all amounts are credited to the account. The fluctuation of the account balance is recorded by the Fund as unrealized appreciation/ (depreciation) and is shown as of June 30, 2013 on the Consolidated Statement of Assets and Liabilities as an asset, “Non-interested Trustees’ deferred compensation,” and a liability, “Non-interested Trustees’ deferred compensation fees.” Additionally, the recorded unrealized appreciation/(depreciation) is included in “Unrealized net appreciation/(depreciation) of investments, foreign currency translations and non-interested Trustees’ deferred compensation” on the Consolidated Statement of Assets and Liabilities. Deferred compensation expenses for the period ended June 30, 2013 are included in “Non-interested Trustees’ fees and expenses” on the Consolidated Statement of Operations. Trustees are allowed to change their designation of mutual funds from time to time. Amounts will be deferred until distributed in accordance with the Deferred Plan. Deferred fees of $243,941 were paid by the Trust to a Trustee under the Deferred Plan during the fiscal year ended June 30, 2013.
Certain officers of the Fund may also be officers and/or directors of Janus Capital. The Fund pays for the salaries, fees, and expenses of certain Janus Capital employees and Fund officers, with respect to certain specified administration functions they perform on behalf of the Fund. Administration costs are separate and apart from advisory fees and other expenses paid in connection with the investment advisory services Janus Capital provides to the Fund. Some expenses related to compensation payable to the Fund’s Chief Compliance Officer and compliance staff are shared with the Fund. Total compensation of $487,826 was paid to the Chief Compliance Officer and certain compliance staff by the Trust during the fiscal period ended June 30, 2013. The Fund’s portion is reported as part of “Other Expenses” on the Consolidated Statement of Operations.
Class A Shares include a 5.75% upfront sales charge of the offering price of the Fund. The sales charge is allocated between Janus Distributors and financial intermediaries. During the period ended June 30, 2013,
32 | JUNE 30, 2013
Janus Distributors retained the following upfront sales charges:
| | | | | | |
| | | Upfront
| | |
| Fund (Class A Shares) | | Sales Charge | | |
| |
| |
| Janus Diversified Alternatives Fund | | $ | 138 | | |
| |
| |
A contingent deferred sales charge (“CDSC”) of 1.00% will be deducted with respect to Class A Shares purchased without a sales load and redeemed within 12 months of purchase, unless waived, as discussed in the Prospectus. Any applicable CDSC will be 1.00% of the lesser of the original purchase price or the value of the redemption of the Class A Shares redeemed. There were no CDSCs paid by redeeming shareholders of Class A Shares to Janus Distributors during the period ended June 30, 2013.
Class C Shares include a 1.00% CDSC paid by redeeming shareholders to Janus Distributors. The CDSC applies to shares redeemed within 12 months of purchase. The redemption price may differ from the NAV per share. There were no CDSCs paid by redeeming shareholders of Class C Shares to Janus Distributors during the period ended June 30, 2013.
The Fund’s expenses may be reduced by expense offsets from an unaffiliated custodian and/or transfer agent. Such credits or offsets are included in “Expense and Fee Offset” on the Consolidated Statement of Operations (if applicable). The Fund could have employed the assets used by the custodian and/or transfer agent to produce income if it had not entered into an expense offset arrangement.
Pursuant to the provisions of the 1940 Act and rules promulgated thereunder, the Fund may participate in an affiliated or nonaffiliated cash sweep program. In the cash sweep program, uninvested cash balances of the Fund may be used to purchase shares of affiliated or nonaffiliated money market funds or cash management pooled investment vehicles. The Fund is eligible to participate in the cash sweep program (the “Investing Fund”). Janus Cash Liquidity Fund LLC is an affiliated unregistered cash management pooled investment vehicle that invests primarily in highly-rated short-term fixed-income securities. Janus Cash Liquidity Fund LLC currently maintains a NAV of $1.00 per share and distributes income daily in a manner consistent with a registered 2a-7 product. There are no restrictions on the Fund’s ability to withdraw investments from Janus Cash Liquidity Fund LLC at will, and there are no unfunded capital commitments due from the Fund to Janus Cash Liquidity Fund LLC. As adviser, Janus Capital has an inherent conflict of interest because of its fiduciary duties to the affiliated cash management pooled investment vehicles and the Investing Fund.
During the year ended June 30, 2013, any recorded distributions from affiliated investments as affiliated dividend income, and affiliated purchases and sales can be found in the Notes to Consolidated Schedule of Investments and Other Information.
Janus Capital or an affiliate invested and/or redeemed initial seed capital during the period ended June 30, 2013, as indicated in the following table.
| | | | | | | | | | | | | | | | | | | | | |
| | | Seed Capital
| | | | | | | | | | | | |
| | | at
| | | | Date of
| | | | Date of
| | Seed Capital
| | |
| Fund | | 12/28/12 | | Purchases | | Purchases | | Redemptions | | Redemptions | | at 6/30/13 | | |
| |
| |
Janus Diversified Alternatives Fund(1) - Class A Shares | | $ | 3,571,428 | | $ | – | | | – | | $ | – | | | – | | $ | 3,571,428 | | |
Janus Diversified Alternatives Fund(1) - Class C Shares | | | 3,571,428 | | | – | | | – | | | – | | | – | | | 3,571,428 | | |
Janus Diversified Alternatives Fund(1) - Class D Shares | | | 3,571,429 | | | – | | | – | | | – | | | – | | | 3,571,429 | | |
Janus Diversified Alternatives Fund(1) - Class I Shares | | | 3,571,428 | | | – | | | – | | | – | | | – | | | 3,571,428 | | |
Janus Diversified Alternatives Fund(1) - Class N Shares | | | 3,571,429 | | | – | | | – | | | – | | | – | | | 3,571,429 | | |
Janus Diversified Alternatives Fund(1) - Class S Shares | | | 3,571,429 | | | – | | | – | | | – | | | – | | | 3,571,429 | | |
Janus Diversified Alternatives Fund(1) - Class T Shares | | | 3,571,429 | | | – | | | – | | | – | | | – | | | 3,571,429 | | |
| |
| |
| | | |
(1) | | Period from December 28, 2012 (inception date) through June 30, 2013. |
The tax components of capital shown in the table below represent: (1) distribution requirements the Fund must satisfy under the income tax regulations; (2) losses or deductions the Fund may be able to offset against income and gains realized in future years; and (3) unrealized appreciation or depreciation of investments for federal income tax purposes.
Janus Alternative Fund | 33
Notes to Financial Statements (continued)
Other book to tax differences may consist of deferred compensation, derivatives and foreign currency contract adjustments. The Fund has elected to treat gains and losses on forward foreign currency contracts as capital gains and losses, if applicable. Other foreign currency gains and losses on debt instruments are treated as ordinary income for federal income tax purposes pursuant to Section 988 of the Internal Revenue Code.
The Funds have elected to defer post-October losses and qualified late-year losses as noted in the table below. These losses will be deferred for tax purposes and recognized the next fiscal year.
| | | | | | | | | | | | | | | | | | | | | | | | |
| | | Undistributed
| | Undistributed
| | | | Loss Deferrals | | Other Book
| | | | |
| | | Ordinary
| | Long-Term
| | Accumulated
| | Late-Year
| | Post-October
| | to Tax
| | Net Tax
| | |
| Fund | | Income | | Gains | | Capital Losses | | Ordinary Loss | | Capital Loss | | Differences | | Appreciation | | |
| |
| |
Janus Diversified Alternatives Fund(1) | | $ | – | | $ | – | | $ | (1,259,203) | | $ | (263,309) | | $ | – | | $ | (128,576) | | $ | 151,733 | | |
| |
| |
| | | |
| (1) | | Period from December 28, 2012 (inception date) through June 30, 2013. |
Accumulated capital losses noted below represented net capital loss carryovers, as of June 30, 2013, that may be available to offset future realized capital gains and thereby reduce future taxable gains distributions. The following table shows these capital loss carryovers.
Capital Loss Carryover Expiration Schedule
For the period ended June 30, 2013
| | | | | | | | | | | | |
| | | | | | | Accumulated
| | |
| | | No Expiration | | Capital
| | |
| Fund | | Short-Term | | Long-Term | | Losses | | |
| |
| |
Janus Diversified Alternatives Fund(1) | | $ | (1,259,203) | | $ | – | | $ | (1,259,203) | | |
| |
| |
| | | |
| (1) | | Period from December 28, 2012 (inception date) through June 30, 2013. |
The aggregate cost of investments and the composition of unrealized appreciation and depreciation of investment securities for federal income tax purposes as of June 30, 2013 are noted below.
Unrealized appreciation and unrealized depreciation in the table below exclude appreciation/(depreciation) on foreign currency translations. The primary differences between book and tax appreciation or depreciation of investments are wash sale loss deferrals, partnerships and futures contracts.
| | | | | | | | | | | | |
| | | Federal Tax
| | Unrealized
| | Unrealized
| | |
| Fund | | Cost | | Appreciation | | (Depreciation) | | |
| |
| |
Janus Diversified Alternatives Fund(1) | | $ | 13,612,066 | | $ | 213,463 | | $ | (61,730) | | |
| |
| |
| | | |
| (1) | | Period from December 28, 2012 (inception date) through June 30, 2013. |
Income and capital gains distributions are determined in accordance with income tax regulations that may differ from accounting principles generally accepted in the United States of America. These differences are due to differing treatments for items such as net short-term gains, deferral of wash sale losses, foreign currency transactions, net investment losses and capital loss carryovers. Certain permanent differences such as tax returns of capital and net investment losses noted below have been reclassified to paid-in capital.
For the period ended June 30, 2013
| | | | | | | | | | | | | | | | | | |
| | | Distributions | | | | | | |
| | | From Ordinary
| | From Long-Term
| | Tax Return of
| | Net Investment
| | | | |
| Fund | | Income | | Capital Gains | | Capital | | Loss | | | | |
| |
| |
Janus Diversified Alternatives Fund(1) | | $ | – | | $ | – | | $ | – | | $ | (5,953) | | | | | |
| |
| |
| | | |
| (1) | | Period from December 28, 2012 (inception date) through June 30, 2013. |
34 | JUNE 30, 2013
| |
| 7. | Capital Share Transactions |
| | | | | | | |
| | | Janus Diversified
| | |
For the period ended June 30
| | Alternatives Fund | | |
| (all numbers in thousands) | | 2013(1) | | |
| |
| Transactions in Fund Shares – Class A Shares: | | | | | | |
| Shares sold | | | 359 | | | |
| Reinvested dividends and distributions | | | – | | | |
| Shares repurchased | | | – | | | |
| Net Increase/(Decrease) in Fund Shares | | | 359 | | | |
| Shares Outstanding, Beginning of Period | | | – | | | |
| Shares Outstanding, End of Period | | | 359 | | | |
| Transactions in Fund Shares – Class C Shares: | | | | | | |
| Shares sold | | | 365 | | | |
| Reinvested dividends and distributions | | | – | | | |
| Shares repurchased | | | – | | | |
| Net Increase/(Decrease) in Fund Shares | | | 365 | | | |
| Shares Outstanding, Beginning of Period | | | – | | | |
| Shares Outstanding, End of Period | | | 365 | | | |
| Transactions in Fund Shares – Class D Shares: | | | | | | |
| Shares sold | | | 637 | | | |
| Reinvested dividends and distributions | | | – | | | |
| Shares repurchased | | | (25) | | | |
| Net Increase/(Decrease) in Fund Shares | | | 612 | | | |
| Shares Outstanding, Beginning of Period | | | – | | | |
| Shares Outstanding, End of Period | | | 612 | | | |
| Transactions in Fund Shares – Class I Shares: | | | | | | |
| Shares sold | | | 658 | | | |
| Reinvested dividends and distributions | | | – | | | |
| Shares repurchased | | | – | | | |
| Net Increase/(Decrease) in Fund Shares | | | 658 | | | |
| Shares Outstanding, Beginning of Period | | | – | | | |
| Shares Outstanding, End of Period | | | 658 | | | |
| Transactions in Fund Shares – Class N Shares: | | | | | | |
| Shares sold | | | 6,099 | | | |
| Reinvested dividends and distributions | | | – | | | |
| Shares repurchased | | | (207) | | | |
| Net Increase/(Decrease) in Fund Shares | | | 5,892 | | | |
| Shares Outstanding, Beginning of Period | | | – | | | |
| Shares Outstanding, End of Period | | | 5,892 | | | |
| Transactions in Fund Shares – Class S Shares: | | | | | | |
| Shares sold | | | 357 | | | |
| Reinvested dividends and distributions | | | – | | | |
| Shares repurchased | | | – | | | |
| Net Increase/(Decrease) in Fund Shares | | | 357 | | | |
| Shares Outstanding, Beginning of Period | | | – | | | |
| Shares Outstanding, End of Period | | | 357 | | | |
| Transactions in Fund Shares – Class T Shares: | | | | | | |
| Shares sold | | | 477 | | | |
| Reinvested dividends and distributions | | | – | | | |
| Shares repurchased | | | (93) | | | |
| Net Increase/(Decrease) in Fund Shares | | | 384 | | | |
| Shares Outstanding, Beginning of Period | | | – | | | |
| Shares Outstanding, End of Period | | | 384 | | | |
| | | |
| (1) | | Period from December 28, 2012 (inception date) through June 30, 2013. |
Janus Alternative Fund | 35
Notes to Financial Statements (continued)
| |
| 8. | PURCHASES AND SALES OF INVESTMENT SECURITIES |
For the period ended June 30, 2013, the aggregate cost of purchases and proceeds from sales of investment securities (excluding any short-term securities, short-term options contracts and in-kind transactions) was as follows:
| | | | | | | | | | | | | | | |
| | | | | | | Purchases of Long-
| | Proceeds from Sales
| | |
| | | Purchases of
| | Proceeds from Sales
| | Term U.S. Government
| | of Long-Term U.S.
| | |
| Fund | | Securities | | of Securities | | Obligations | | Government Obligations | | |
| |
Janus Diversified Alternatives Fund(1) | | $ | 26,405,243 | | $ | 6,275,391 | | $ | – | | $ | – | | |
| |
| |
| | | |
| (1) | | Period from December 28, 2012 (inception date) through June 30, 2013. |
| |
| 9. | NEW ACCOUNTING PRONOUNCEMENTS |
In December 2011, the FASB issued Accounting Standards Update No. 2011-11, “Disclosures about Offsetting Assets and Liabilities.” This update creates disclosure requirements requiring entities to disclose both gross and net information for derivatives and other financial instruments that are either offset in the Consolidated Statement of Assets and Liabilities or subject to an enforceable master netting arrangement or similar agreement. In January 2013, the FASB issued Accounting Standards Update No. 2013-01, “Clarifying the Scope of Disclosures about Offsetting Assets and Liabilities.” This update limits the scope of the new Consolidated Statement of Assets and Liabilities offsetting disclosures to derivatives, repurchase agreements, reverse repurchase agreements, securities borrowing and securities lending transactions that are either offset in the Consolidated Statement of Assets and Liabilities or subject to an enforceable master netting arrangement or similar agreement. These disclosure requirements are effective for annual reporting periods beginning on or after January 1, 2013, and interim periods within those annual periods. Management is currently evaluating the impact these updates may have on the Fund’s financial statements.
Management has evaluated whether any other events or transactions occurred subsequent to June 30, 2013 and through the date of issuance of the Fund’s financial statements and determined that there were no material events or transactions that would require recognition or disclosure in the Fund’s financial statements.
36 | JUNE 30, 2013
Report of Independent Registered Public Accounting Firm
To the Board of Trustees and Shareholders
of Janus Investment Fund:
In our opinion, the accompanying consolidated statement of assets and liabilities, including the consolidated schedule of investments, and the related consolidated statements of operations and of changes in net assets and the financial highlights present fairly, in all material respects, the financial position of Janus Diversified Alternatives Fund (one of the funds constituting Janus Investment Fund, hereafter referred to as the “Fund”) at June 30, 2013 and the result of its operations, the changes in its net assets, and the financial highlights for the period December 28, 2012 (commencement of operations) through June 30, 2013, in conformity with accounting principles generally accepted in the United States of America. These financial statements and financial highlights (hereafter referred to as “financial statements”) are the responsibility of the Fund’s management; our responsibility is to express an opinion on these financial statements based on our audit. We conducted our audit of these financial statements in accordance with the standards of the Public Company Accounting Oversight Board (United States). Those standards require that we plan and perform the audit to obtain reasonable assurance about whether the financial statements are free of material misstatement. An audit includes examining, on a test basis, evidence supporting the amounts and disclosures in the financial statements, assessing the accounting principles used and significant estimates made by management, and evaluating the overall financial statement presentation. We believe that our audit, which included confirmation of securities at June 30, 2013 by correspondence with the custodian, transfer agent and brokers, provides a reasonable basis for our opinion.

Denver, Colorado
August 19, 2013
Janus Alternative Fund | 37
Additional Information (unaudited)
Proxy Voting Policies and Voting Record
A description of the policies and procedures that the Fund uses to determine how to vote proxies relating to its portfolio securities is available without charge: (i) upon request, by calling 1-800-525-0020 (toll free); (ii) on the Fund’s website at janus.com/proxyvoting; and (iii) on the SEC’s website at http://www.sec.gov. Additionally, information regarding the Fund’s proxy voting record for the most recent twelve-month period ended June 30 is also available, free of charge, through janus.com/proxyvoting and from the SEC’s website at http://www.sec.gov.
Quarterly Portfolio Holdings
The Fund files its complete portfolio holdings (schedule of investments) with the SEC for the first and third quarters of each fiscal year on Form N-Q within 60 days of the end of such fiscal quarter. The Fund’s Form N-Q: (i) is available on the SEC’s website at http://www.sec.gov; (ii) may be reviewed and copied at the SEC’s Public Reference Room in Washington, D.C. (information on the Public Reference Room may be obtained by calling 1-800-SEC-0330); and (iii) is available without charge, upon request, by calling Janus at 1-800-525-0020 (toll free).
Approval of Advisory Agreements During the Period
The Trustees of Janus Investment Fund, none of whom has ever been affiliated with Janus Capital and each of whom serves as an “independent” Trustee (the “Trustees”), oversee the management of each Fund and, as required by law, determine annually whether to continue the investment advisory agreement for each Fund and the subadvisory agreements for the nine Funds that utilize subadvisers.
In connection with their most recent consideration of those agreements for each Fund, the Trustees received and reviewed a substantial amount of information provided by Janus Capital and the respective subadvisers in response to requests of the Trustees and their independent legal counsel. They also received and reviewed a considerable amount of information and analysis provided by, and in response to requests of, their independent fee consultant. Throughout their consideration of the agreements, the Trustees were advised by their independent legal counsel. The Trustees met with management to consider the agreements, and also met separately in executive session with their independent legal counsel and their independent fee consultant.
At a meeting held on December 7, 2012, based on the Trustees’ evaluation of the information provided by Janus Capital, the subadvisers and the independent fee consultant, as well as other information, the Trustees determined that the overall arrangements between each Fund and Janus Capital and each subadviser, as applicable, were fair and reasonable in light of the nature, extent and quality of the services provided by Janus Capital, its affiliates and the subadvisers, the fees charged for those services, and other matters that the Trustees considered relevant in the exercise of their business judgment. At that meeting, the Trustees unanimously approved the continuation of the investment advisory agreement for each Fund, and the subadvisory agreement for each subadvised Fund, for the period from February 1, 2013 through February 1, 2014, subject to earlier termination as provided for in each agreement.
In considering the continuation of those agreements, the Trustees reviewed and analyzed various factors that they determined were relevant, including the factors described below, none of which by itself was considered dispositive. However, the material factors and conclusions that formed the basis for the Trustees’ determination to approve the continuation of the agreements are discussed separately below. Also included is a summary of the independent fee consultant’s conclusions and opinions that arose during, and were included as part of, the Trustees’ consideration of the agreements.
Nature, Extent and Quality of Services
The Trustees reviewed the nature, extent and quality of the services provided by Janus Capital and the subadvisers to the Funds, taking into account the investment objective and strategy of each Fund and the knowledge the Trustees gained from their regular meetings with management on at least a quarterly basis and their ongoing review of information related to the Funds. In addition, the Trustees reviewed the resources and key personnel of Janus Capital and each subadviser, particularly noting those employees who provide investment and risk management services to the Funds. The Trustees also considered other services provided to the Funds by Janus Capital or the subadvisers, such as managing the execution of portfolio transactions and the selection of broker-dealers for those transactions. The Trustees considered Janus Capital’s role as administrator to the Funds, noting that Janus Capital does not receive a fee for its services but is reimbursed for its out-of-pocket costs. The Trustees considered the role of Janus Capital in monitoring adherence to the Funds’ investment restrictions, providing support services for the Trustees and Trustee committees, communicating with shareholders and overseeing the activities of other service providers, including monitoring compliance with various policies and
38 | JUNE 30, 2013
procedures of the Funds and with applicable securities laws and regulations.
In this regard, the independent fee consultant noted that Janus Capital provides a number of different services for the Funds of Janus Investment Fund and the Portfolios of Janus Aspen Series (such Funds and Portfolios, together the “Janus Funds”) and Janus Fund shareholders, ranging from investment management services to various other servicing functions, and that, in its opinion, Janus Capital is a capable provider of those services. The independent fee consultant also provided its belief that Janus Capital has developed institutional competitive advantages that should be able to provide superior investment management returns over the long term.
The Trustees concluded that the nature, extent and quality of the services provided by Janus Capital or the subadviser to each Fund were appropriate and consistent with the terms of the respective advisory and subadvisory agreements, and that, taking into account steps taken to address those Funds whose performance lagged that of their peers for certain periods, the quality of those services had been consistent with or superior to quality norms in the industry and the Funds were likely to benefit from the continued provision of those services. They also concluded that Janus Capital and each subadviser had sufficient personnel, with the appropriate education and experience, to serve the Funds effectively and had demonstrated its continuing ability to attract well-qualified personnel.
Performance of the Funds
The Trustees considered the performance results of each Fund over various time periods. They reviewed information comparing each Fund’s performance with the performance of comparable funds and peer groups identified by independent data providers, and with the Fund’s benchmark index. In this regard, the independent fee consultant found that the Janus Funds have had some recent performance challenges, but performance has improved recently, and for the 36 months ended September 30, 2012, approximately 47% of the Janus Funds were in the top two quartiles of performance and for the 12 months ended September 30, 2012, approximately 54% of the Janus Funds were in the top two quartiles of performance. The Trustees concluded that the performance of certain Funds was good under current market conditions. Although the performance of other Funds lagged that of their peers for certain periods, the Trustees also concluded that Janus Capital had taken or was taking appropriate steps to address those instances of under-performance.
Costs of Services Provided
The Trustees examined information regarding the fees and expenses of each Fund in comparison to similar information for other comparable funds as provided by independent data providers. They also reviewed an analysis of that information provided by their independent fee consultant and noted that the rate of management (investment advisory and any administration) fees for most of the Funds, after applicable contractual expense limitations, was below the mean management fee rate of the respective peer group of funds selected by the independent data providers.
In this regard, the independent fee consultant provided its belief that the management fees charged by Janus Capital to each of the Janus Funds under the current investment advisory and administration agreements are reasonable in relation to the services provided by Janus Capital. The independent fee consultant found (1) the total expenses and management fees of the Janus Funds to be reasonable relative to other mutual funds; (2) total expenses, on average, were 16% below the mean total expenses of their respective Lipper Expense Group peers and 23% below the mean total expenses for their Lipper Expense Universes; (3) management fees for the Janus Funds, on average, were 9% below the mean management fees for their Expense Groups and 12% below the mean for their Expense Universes; and (4) Janus Funds expenses at the functional level for each asset and share class category were reasonable. The independent fee consultant concluded that based on its strategic review of expenses at the complex, category and individual fund level, Janus Funds expenses were found to be reasonable relative to both Expense Group and Expense Universe benchmarks. Further, for certain Funds the independent fee consultant also performed a systematic “focus list” analysis of expenses in the context of the performance or service delivered to each set of investors in each share class in each selected Fund. Based on this analysis, the independent fee consultant found that the combination of service quality/ performance and expenses on these individual Funds and share classes were reasonable in light of performance trends, performance histories and existence of performance fees on such Funds.
The Trustees considered the methodology used by Janus Capital and each subadviser in determining compensation payable to portfolio managers, the competitive environment for investment management talent and the competitive market for mutual funds in different distribution channels. They concluded that the compensation methodology provided a good alignment of the interests of the portfolio managers with the interests of Fund shareholders.
Janus Alternative Fund | 39
Additional Information (unaudited) (continued)
The Trustees also reviewed management fees charged by Janus Capital and each subadviser to their separate account clients and to non-affiliated funds subadvised by Janus Capital or by a subadviser (for which Janus Capital or the subadviser provides only portfolio management services). Although in most instances subadvisory and separate account fee rates for various investment strategies were lower than management fee rates for Funds having a similar strategy, the Trustees noted that, under the terms of the management agreements with the Funds, Janus Capital performs significant additional services for the Funds that it does not provide to those other clients, including administration services, oversight of the Funds’ other service providers, trustee support, regulatory compliance and numerous other services, and that, in serving the Funds, Janus Capital assumes many legal risks that it does not assume in servicing its other clients. Moreover, they noted the research conducted and conclusions reached by their independent fee consultant.
In this regard, the independent fee consultant found that (1) the management fees Janus Capital charges to the Janus Funds are reasonable in relation to the management fees Janus Capital charges to its institutional and subadvised accounts; (2) these institutional and subadvised accounts have different service and infrastructure needs; and (3) the average spread between management fees charged to the Janus Funds and those charged to Janus Capital’s institutional and subadvised accounts is reasonable relative to the average spreads seen in the industry.
The Trustees reviewed information on the profitability to Janus Capital and its affiliates of their relationships with each Fund, as well as an explanation of the methodology utilized in allocating various expenses of Janus Capital and its affiliates among the Funds and other clients. The Trustees also reviewed the financial statements and corporate structure of Janus Capital’s parent company. In their review, the Trustees considered whether Janus Capital and each subadviser receive adequate incentives to manage the Funds effectively. The Trustees recognized that profitability comparisons among fund managers are difficult because very little comparative information is publicly available and the profitability of any fund manager is affected by numerous factors, including the organizational structure of the particular fund manager, the types of funds and other accounts it manages, possible other lines of business, the methodology for allocating expenses and the fund manager’s capital structure and cost of capital. However, taking into account those factors and the analysis provided by the Trustees’ independent fee consultant, and based on the information available, the Trustees concluded that Janus Capital’s profitability with respect to each Fund in relation to the services rendered was not unreasonable.
In this regard, the independent fee consultant found that, while assessing the reasonability of expenses in light of Janus Capital’s profits is dependent on comparisons with other publicly-traded mutual fund advisers, and that these comparisons are limited in accuracy by differences in complex size, business mix, institutional account orientation, and other factors, after accepting these limitations, the level of profit earned by Janus Capital from managing the Janus Funds is reasonable.
The Trustees concluded that the management fees and other compensation payable by each Fund to Janus Capital and its affiliates, as well as the fees paid by Janus Capital to the subadvisers of the subadvised Funds, were reasonable in relation to the nature, extent and quality of the services provided, taking into account the fees charged by other advisers for managing comparable mutual funds with similar strategies, the fees Janus Capital and the subadvisers charge to other clients, and, as applicable, the impact of fund performance on fees payable by the Funds. The Trustees also concluded that the overall expense ratio of each Fund was reasonable, taking into account the size of the Fund, the quality of services provided by Janus Capital and any subadviser, the investment performance of the Fund and any expense limitations agreed to by Janus Capital.
Economies of Scale
The Trustees considered information about the potential for Janus Capital to realize economies of scale as the assets of the Funds increase. They noted that, although many Funds pay advisory fees at a base fixed rate as a percentage of net assets, without any breakpoints, the actual management fee rate paid by most of the Funds, after any contractual expense limitations, was below the mean management fee rate of the Fund’s peer group identified by independent data providers; and, for those Funds whose expenses are being reduced by the contractual expense limitations of Janus Capital, Janus Capital is subsidizing the Funds because they have not reached adequate scale. Moreover, as the assets of many of the Funds have declined in the past few years, certain Funds have benefited from having advisory fee rates that have remained constant rather than increasing as assets declined. In addition, performance fee structures have been implemented for various Funds that have caused or will cause the effective rate of advisory fees payable by such a Fund to vary depending on the investment performance of the Fund relative to its benchmark index over the measurement period; and the five Funds that have fee schedules with breakpoints and reduced fee rates above certain asset levels. The Trustees also noted
40 | JUNE 30, 2013
that the Funds share directly in economies of scale through the lower charges of third-party service providers that are based in part on the combined scale of all of the Funds. Based on all of the information they reviewed, including research and analysis conducted by the Trustees’ independent fee consultant, the Trustees concluded that the current fee structure of each Fund was reasonable and that the current rates of fees do reflect a sharing between Janus Capital and the Fund of economies of scale at the current asset level of the Fund.
In this regard, the independent fee consultant concluded that, based on analysis it completed, and given the limitations in these analytical approaches and their conflicting results, it could not confirm or deny the existence of economies of scale in the Janus complex. Further, the independent fee consultant provided its belief that Janus Fund investors are well-served by the fee levels and performance fee structures in place on the Janus Funds in light of any economies of scale that may be present at Janus Capital.
Other Benefits to Janus Capital
The Trustees also considered benefits that accrue to Janus Capital and its affiliates from their relationships with the Funds. They recognized that two affiliates of Janus Capital separately serve the Funds as transfer agent and distributor, respectively, and the transfer agent receives compensation directly from the non-money market funds for services provided. The Trustees also considered Janus Capital’s past and proposed use of commissions paid by the Funds on their portfolio brokerage transactions to obtain proprietary and third-party research products and services benefiting the Fund and/or other clients of Janus Capital. The Trustees concluded that Janus Capital’s use of these types of client commission arrangements to obtain proprietary and third-party research products and services was consistent with regulatory requirements and guidelines and was likely to benefit each Fund. The Trustees also concluded that, other than the services provided by Janus Capital and its affiliates pursuant to the agreements and the fees to be paid by each Fund therefor, the Funds and Janus Capital may potentially benefit from their relationship with each other in other ways. They concluded that Janus Capital benefits from the receipt of research products and services acquired through commissions paid on portfolio transactions of the Funds and that the Funds benefit from Janus Capital’s receipt of those products and services as well as research products and services acquired through commissions paid by other clients of Janus Capital. They further concluded that success of any Fund could attract other business to Janus Capital or other Janus Funds, and that the success of Janus Capital could enhance Janus Capital’s ability to serve the Funds.
After full consideration of the above factors, as well as other factors, the Trustees, each of whom is an independent Trustee, concluded at their December 7, 2012 meeting that the proposed continuation of the investment advisory agreement and, if applicable, the subadvisory agreement for each Fund for another year was in the best interest of the respective Funds and their shareholders.
Janus Alternative Fund | 41
Useful Information About Your Fund Report (unaudited)
The Management Commentary in this report includes valuable insight from each of the Fund’s managers as well as statistical information to help you understand how your Fund’s performance and characteristics stack up against those of comparable indices.
If the Fund invests in foreign securities, this report may include information about country exposure. Country exposure is based primarily on the country of risk. The Fund’s managers may allocate a company to a country based on other factors such as location of the company’s principal office, the location of the principal trading market for the company’s securities, or the country where a majority of the company’s revenues are derived.
Please keep in mind that the opinions expressed by the Chief Investment Officer(s) in the Market Perspective and by the Fund’s managers in the Management Commentary are just that: opinions. They are a reflection of the Chief Investment Officer(s) and managers’ best judgment at the time this report was compiled, which was June 30, 2013. As the investing environment changes, so could their opinions. These views are unique to them and aren’t necessarily shared by fellow employees or by Janus in general.
Performance overview graphs compare the performance of a hypothetical $10,000 investment in the Fund with one or more widely used market indices. The hypothetical example does not represent the returns of any particular investment.
When comparing the performance of the Fund with an index, keep in mind that market indices do not include brokerage commissions that would be incurred if you purchased the individual securities in the index. They also do not include taxes payable on dividends and interest or operating expenses incurred if you maintained the Fund invested in the index.
Average annual total returns are quoted for a Fund with more than one year of performance history. Average annual total return is calculated by taking the growth or decline in value of an investment over a period of time, including reinvestment of dividends and distributions, then calculating the annual compounded percentage rate that would have produced the same result had the rate of growth been constant throughout the period. Average annual total return does not reflect the deduction of taxes that a shareholder would pay on Fund distributions or redemptions of Fund shares.
Cumulative total returns are quoted for a Fund with less than one year of performance history. Cumulative total return is the growth or decline in value of an investment over time, independent of the period of time involved. Cumulative total return does not reflect the deduction of taxes that a shareholder would pay on Fund distributions or redemptions of Fund shares.
Pursuant to federal securities rules, expense ratios shown in the performance chart reflect subsidized (if applicable) and unsubsidized ratios. The total annual fund operating expenses ratio is gross of any fee waivers, reflecting the Fund’s unsubsidized expense ratio. The net annual fund operating expenses ratio (if applicable) includes contractual waivers of Janus Capital and reflects the Fund’s subsidized expense ratio. Ratios may be higher or lower than those shown in the “Financial Highlights” in this report.
| |
| 3. | Consolidated Schedule of Investments |
Following the performance overview section is the Fund’s Schedule of Investments. This schedule reports the types of securities held in the Fund on the last day of the reporting period. Securities are usually listed by type (common stock, corporate bonds, U.S. Government obligations, etc.) and by industry classification (banking, communications, insurance, etc.). Holdings are subject to change without notice.
The value of each security is quoted as of the last day of the reporting period. The value of securities denominated in foreign currencies is converted into U.S. dollars.
If the Fund invests in foreign securities, it will also provide a summary of investments by country. This summary reports the Fund’s exposure to different countries by providing the percentage of securities invested in each country. The country of each security represents the country of risk. The Fund’s Schedule of Investments relies upon the industry group and country classifications published by Bloomberg L.P. and/or MSCI Inc.
Tables listing details of individual forward currency contracts, futures, written options and swaps follow the Fund’s Schedule of Investments (if applicable).
| |
| 4. | Consolidated Statement of Assets and Liabilities |
This statement is often referred to as the “balance sheet.” It lists the assets and liabilities of the Fund on the last day of the reporting period.
The Fund’s assets are calculated by adding the value of the securities owned, the receivable for securities sold but not yet settled, the receivable for dividends declared but not yet received on securities owned and the receivable for Fund shares sold to investors but not yet settled. The Fund’s liabilities include payables for securities purchased
42 | JUNE 30, 2013
but not yet settled, Fund shares redeemed but not yet paid and expenses owed but not yet paid. Additionally, there may be other assets and liabilities such as unrealized gain or loss on forward currency contracts.
The section entitled “Net Assets Consist of” breaks down the components of the Fund’s net assets. Because the Fund must distribute substantially all earnings, you will notice that a significant portion of net assets is shareholder capital.
The last section of this statement reports the net asset value (“NAV”) per share on the last day of the reporting period. The NAV is calculated by dividing the Fund’s net assets for each share class (assets minus liabilities) by the number of shares outstanding.
| |
| 5. | Consolidated Statement of Operations |
This statement details the Fund’s income, expenses, realized gains and losses on securities and currency transactions, and changes in unrealized appreciation or depreciation of Fund holdings.
The first section in this statement, entitled “Investment Income,” reports the dividends earned from securities and interest earned from interest-bearing securities in the Fund.
The next section reports the expenses incurred by the Fund, including the advisory fee paid to the investment adviser, transfer agent fees and expenses, and printing and postage for mailing statements, financial reports and prospectuses. Expense offsets and expense reimbursements, if any, are also shown.
The last section lists the amounts of realized gains or losses from investment and foreign currency transactions, and changes in unrealized appreciation or depreciation of investments and foreign currency-denominated assets and liabilities. The Fund will realize a gain (or loss) when it sells its position in a particular security. A change in unrealized gain (or loss) refers to the change in net appreciation or depreciation of the Fund during the reporting period. “Net Realized and Unrealized Gain/(Loss) on Investments” is affected both by changes in the market value of Fund holdings and by gains (or losses) realized during the reporting period.
| |
| 6. | Consolidated Statements of Changes in Net Assets |
These statements report the increase or decrease in the Fund’s net assets during the reporting period. Changes in the Fund’s net assets are attributable to investment operations, dividends and distributions to investors and capital share transactions. This is important to investors because it shows exactly what caused the Fund’s net asset size to change during the period.
The first section summarizes the information from the Statement of Operations regarding changes in net assets due to the Fund’s investment operations. The Fund’s net assets may also change as a result of dividend and capital gains distributions to investors. If investors receive their dividends and/or distributions in cash, money is taken out of the Fund to pay the dividend and/or distribution. If investors reinvest their dividends and/or distributions, the Fund’s net assets will not be affected. If you compare the Fund’s “Net Decrease from Dividends and Distributions” to “Reinvested Dividends and Distributions,” you will notice that dividends and distributions have little effect on the Fund’s net assets. This is because the majority of the Fund’s investors reinvest their dividends and/or distributions.
The reinvestment of dividends and distributions is included under “Capital Share Transactions.” “Capital Shares” refers to the money investors contribute to the Fund through purchases or withdrawals via redemptions. The Fund’s net assets will increase and decrease in value as investors purchase and redeem shares from the Fund.
| |
| 7. | Consolidated Financial Highlights |
This schedule provides a per-share breakdown of the components that affect the Fund’s NAV for current and past reporting periods as well as total return, asset size, ratios and portfolio turnover rate.
The first line in the table reflects the NAV per share at the beginning of the reporting period. The next line reports the net investment income/(loss) per share. Following is the per share total of net gains/(losses), realized and unrealized. Per share dividends and distributions to investors are then subtracted to arrive at the NAV per share at the end of the period. The next line reflects the total return for the period. The total return may include adjustments in accordance with generally accepted accounting principles required at the period end for financial reporting purposes. As a result, the total return may differ from the total return reflected for individual shareholder transactions. Also included are ratios of expenses and net investment income to average net assets.
The Fund’s expenses may be reduced through expense offsets and expense reimbursements. The ratios shown reflect expenses before and after any such offsets and reimbursements.
The ratio of net investment income/(loss) summarizes the income earned less expenses, divided by the average net assets of the Fund during the reporting period. Don’t
Janus Alternative Fund | 43
Useful Information About Your Fund Report (unaudited) (continued)
confuse this ratio with the Fund’s yield. The net investment income ratio is not a true measure of the Fund’s yield because it doesn’t take into account the dividends distributed to the Fund’s investors.
The next figure is the portfolio turnover rate, which measures the buying and selling activity in the Fund. Portfolio turnover is affected by market conditions, changes in the asset size of the Fund, fluctuating volume of shareholder purchase and redemption orders, the nature of the Fund’s investments, and the investment style and/or outlook of the portfolio managers. A 100% rate implies that an amount equal to the value of the entire portfolio was replaced once during the fiscal year; a 50% rate means that an amount equal to the value of half the portfolio is traded in a year; and a 200% rate means that an amount equal to the value of the entire portfolio is traded every six months.
44 | JUNE 30, 2013
Designation Requirements (unaudited)
For federal income tax purposes, the Fund designated the following for the period ended June 30, 2013:
Dividends Received Deduction Percentage
| | | | | | | | | | | |
| Fund | | | | | | |
| |
| |
Janus Diversified Alternatives Fund(1) | | | 100% | | | | | | | |
| |
| |
Qualified Dividend Income
| | | | | | | | | | | |
| Fund | | | | | | |
| |
| |
Janus Diversified Alternatives Fund(1) | | | 100% | | | | | | | |
| |
| |
| | | |
| (1) | | Period from December 28, 2012 (inception date) through June 30, 2013. |
Janus Alternative Fund | 45
Trustees and Officers (unaudited)
The Fund’s Statement of Additional Information includes additional information about the Trustees and officers and is available, without charge, by calling 1-877-335-2687.
The following are the Trustees and officers of the Trust, together with a brief description of their principal occupations during the last five years (principal occupations for certain Trustees may include periods over five years).
Each Trustee has served in that capacity since he or she was originally elected or appointed. The Trustees do not serve a specified term of office. Each Trustee will hold office until the termination of the Trust or his or her earlier death, resignation, retirement, incapacity, or removal. Pursuant to the Fund’s Governance Procedures and Guidelines, Trustees are required to retire no later than the end of the calendar year in which the Trustee turns 72. The Trustees review the Fund’s Governance Procedures and Guidelines from time to time and may make changes they deem appropriate. The Trust’s Nominating and Governance Committee will consider nominees for the position of Trustee recommended by shareholders. Shareholders may submit the name of a candidate for consideration by the Committee by submitting their recommendations to the Trust’s Secretary. Each Trustee is currently a Trustee of one other registered investment company advised by Janus Capital: Janus Aspen Series. Collectively, these two registered investment companies consist of 56 series or funds.
The Trust’s officers are elected annually by the Trustees for a one-year term. Certain officers also serve as officers of Janus Aspen Series. Certain officers of the Fund may also be officers and/or directors of Janus Capital. Fund officers receive no compensation from the Fund, except for the Fund’s Chief Compliance Officer, as authorized by the Trustees.
TRUSTEES
| | | | | | | | | | | |
| | | | | | | | | Number of Portfolios/Funds
| | Other Directorships
|
| | | Positions Held
| | Length of
| | Principal Occupations
| | in Fund Complex
| | Held by Trustee
|
| Name, Address, and Age | | with the Trust | | Time Served | | During the Past Five Years | | Overseen by Trustee | | During the Past Five Years |
| |
| |
Independent Trustees | | | | | | | | | | |
| | | | | | | | | | | |
William F. McCalpin
151 Detroit Street
Denver, CO 80206
DOB: 1957 | | Chairman
Trustee | | 1/08-Present
6/02-Present | | Managing Director, Holos Consulting LLC (provides consulting services to foundations and other nonprofit organizations). Formerly, Executive Vice President and Chief Operating Officer of The Rockefeller Brothers Fund (a private family foundation) (1998-2006). | | 56 | | Chairman of the Board and Director of The Investment Fund for Foundations Investment Program (TIP) (consisting of 2 funds); and Director of the F.B. Heron Foundation (a private grantmaking foundation). |
| | | | | | | | | | | |
Alan A. Brown
151 Detroit Street
Denver, CO 80206
DOB: 1962 | | Trustee | | 1/13-Present | | Managing Director, Institutional Markets, of Dividend Capital Group (private equity real estate investment management firm) (since 2012). Formerly, Executive Vice President and Co-Head, Global Private Client Group (2007-2010), Executive Vice President, Mutual Funds (2005-2007), and Chief Marketing Officer (2001-2005) of Nuveen Investments, Inc. (asset management). | | 56 | | Director of MotiveQuest LLC (strategic social market research company) (since 2003); and Director of WTTW (PBS affiliate) (since 2003). Formerly, Director of Nuveen Global Investors LLC (2007-2011); Director of Communities in Schools (2004-2010); and Director of Mutual Fund Education Alliance (until 2010). |
46 | JUNE 30, 2013
TRUSTEES (continued)
| | | | | | | | | | | |
| | | | | | | | | Number of Portfolios/Funds
| | Other Directorships
|
| | | Positions Held
| | Length of
| | Principal Occupations
| | in Fund Complex
| | Held by Trustee
|
| Name, Address, and Age | | with the Trust | | Time Served | | During the Past Five Years | | Overseen by Trustee | | During the Past Five Years |
| |
| |
| | | | | | | | | | | |
William D. Cvengros
151 Detroit Street
Denver, CO 80206
DOB: 1948 | | Trustee | | 1/11-Present | | Managing Member and Chief Executive Officer of SJC Capital, LLC (a personal investment company and consulting firm) (since 2002). Formerly, Venture Partner for The Edgewater Funds (a middle market private equity firm) (2002-2004); Chief Executive Officer and President of PIMCO Advisors Holdings L.P. (a publicly traded investment management firm) (1994-2000); and Chief Investment Officer of Pacific Life Insurance Company (a mutual life insurance and annuity company (1987-1994). | | 56 | | Chairman, National Retirement Partners, Inc. (formerly a network of advisors to 401(k) plans) (since 2005). Formerly, Director of Prospect Acquisition Corp. (a special purpose acquisition corporation) (2007-2009); Director of RemedyTemp, Inc. (temporary help services company) (1996-2006); and Trustee of PIMCO Funds Multi-Manager Series (1990-2000) and Pacific Life Variable Life & Annuity Trusts (1987-1994). |
| | | | | | | | | | | |
James T. Rothe
151 Detroit Street
Denver, CO 80206
DOB: 1943 | | Trustee | | 1/97-Present | | Co-founder and Managing Director of Roaring Fork Capital SBIC, L.P. (SBA SBIC fund focusing on private investment in public equity firms), and Professor Emeritus of Business of the University of Colorado, Colorado Springs, CO (since 2004). Formerly, Professor of Business of the University of Colorado (2002-2004), and Distinguished Visiting Professor of Business (2001-2002) of Thunderbird (American Graduate School of International Management), Glendale, AZ. | | 56 | | Director of Red Robin Gourmet Burgers, Inc. (RRGB) (since 2004). |
| | | | | | | | | | | |
William D. Stewart
151 Detroit Street
Denver, CO 80206
DOB: 1944 | | Trustee | | 6/84-Present | | Retired. Formerly, Corporate Vice President and General Manager of MKS Instruments - HPS Products, Boulder, CO (a manufacturer of vacuum fittings and valves) and PMFC Division, Andover, MA (manufacturing pressure measurement and flow products) (1976-2012). | | 56 | | None |
Janus Alternative Fund | 47
Trustees and Officers (unaudited) (continued)
TRUSTEES (continued)
| | | | | | | | | | | |
| | | | | | | | | Number of Portfolios/Funds
| | Other Directorships
|
| | | Positions Held
| | Length of
| | Principal Occupations
| | in Fund Complex
| | Held by Trustee
|
| Name, Address, and Age | | with the Trust | | Time Served | | During the Past Five Years | | Overseen by Trustee | | During the Past Five Years |
| |
| |
| | | | | | | | | | | |
Linda S. Wolf
151 Detroit Street
Denver, CO 80206
DOB: 1947 | | Trustee | | 11/05-Present | | Retired. Formerly, Chairman and Chief Executive Officer of Leo Burnett (Worldwide) (advertising agency) (2001-2005). | | 56 | | Director of Chicago Convention & Tourism Bureau, Chicago Council on Global Affairs, The Field Museum of Natural History (Chicago, IL), InnerWorkings (U.S. provider of print procurement solutions to corporate clients), Lurie Children’s Hospital
(Chicago, IL), Rehabilitation Institute of Chicago, Wal-Mart, and Wrapports, LLC (digital communications company). |
| |
| |
48 | JUNE 30, 2013
OFFICERS
| | | | | | | |
| | | Positions Held
| | Term of Office* and
| | Principal Occupations
|
| Name, Address, and Age | | with the Trust | | Length of Time Served | | During the Past Five Years |
| |
| |
| | | | | | | |
John Fujiwara
151 Detroit Street
Denver, CO 80206
DOB: 1960 | | Executive Vice President and
Co-Portfolio Manager
Janus Diversified Alternatives Fund | | 12/12-Present
| | Formerly, Senior Principal at Absolute Plus Management, LLC (2006-2012). |
| | | | | | | |
Andrew Weisman
151 Detroit Street
Denver, CO 80206
DOB: 1959 | | Executive Vice President and
Co-Portfolio Manager
Janus Diversified Alternatives Fund | | 12/12-Present
| | Chief Investment Officer, Liquid Alternatives Group, and Senior Vice President of Janus Capital; and Director of the Janus Global Diversified Risk Premia Master Fund Ltd. Formerly, Chief Executive Officer of WR Managed Accounts LLC (2008-2012); and Managing Director and Chief Portfolio Manager at Merrill Lynch Hedge Fund Development and Management Group (2005-2008). |
| | | | | | | |
Robin C. Beery
151 Detroit Street
Denver, CO 80206
DOB: 1967 | | President and Chief Executive Officer | | 4/08-Present | | Executive Vice President and Head of U.S. Distribution of Janus Capital Group Inc., Janus Capital, Janus Distributors LLC, and Janus Services LLC; Director of The Janus Foundation; Director of Perkins Investment Management LLC; and Working Director of INTECH Investment Management LLC. Formerly, Head of Intermediary Distribution, Global Marketing and Product of Janus Capital Group Inc., Janus Capital, Janus Distributors LLC, and Janus Services LLC (2009-2010); and Chief Marketing Officer of Janus Capital Group Inc. and Janus Capital (2002-2009). |
| | | | | | | |
Stephanie Grauerholz-Lofton
151 Detroit Street
Denver, CO 80206
DOB: 1970 | | Chief Legal Counsel and Secretary
Vice President | | 1/06-Present
3/06-Present | | Vice President and Assistant General Counsel of Janus Capital, and Vice President and Assistant Secretary of Janus Distributors LLC. |
| | | | | | | |
David R. Kowalski
151 Detroit Street
Denver, CO 80206
DOB: 1957 | | Vice President, Chief Compliance Officer, and Anti-Money Laundering Officer | | 6/02-Present | | Senior Vice President and Chief Compliance Officer of Janus Capital, Janus Distributors LLC, and Janus Services LLC; and Vice President of INTECH Investment Management LLC and Perkins Investment Management LLC. Formerly, Chief Compliance Officer of Bay Isle Financial LLC (2003-2008). |
| | | | | | | |
Jesper Nergaard
151 Detroit Street
Denver, CO 80206
DOB: 1962 | | Chief Financial Officer
Vice President, Treasurer, and Principal Accounting Officer | | 3/05-Present
2/05-Present | | Vice President of Janus Capital and Janus Services LLC. |
* Officers are elected at least annually by the Trustees for a one-year term and may also be elected from time to time by the Trustees for an interim period.
Janus Alternative Fund | 49
Janus provides access to a wide range of investment disciplines.
Alternative
Janus alternative funds seek to deliver strong risk-adjusted returns over a full market cycle with lower correlation to equity markets than traditional investments.
Asset Allocation
Janus’ asset allocation funds utilize our fundamental, bottom-up research to balance risk over the long term. From fund options that meet investors’ risk tolerance and objectives to a method that incorporates non-traditional investment choices to seek non-correlated sources of risk and return, Janus’ asset allocation funds aim to allocate risk more effectively.
Fixed Income
Janus fixed income funds attempt to provide less risk relative to equities while seeking to deliver a competitive total return through high current income and appreciation. Janus money market funds seek capital preservation and liquidity with current income as a secondary objective.
Global & International
Janus global and international funds seek to leverage Janus’ research capabilities by taking advantage of inefficiencies in foreign markets, where accurate information and analytical insight are often at a premium.
Growth & Core
Janus growth funds focus on companies believed to be the leaders in their respective industries, with solid management teams, expanding market share, margins and efficiencies. Janus core funds seek investments in more stable and predictable companies. Our core funds look for a strategic combination of steady growth and, for certain funds, some degree of income.
Mathematical
Our mathematical funds seek to outperform their respective indices while maintaining a risk profile equal to or lower than the index itself. Managed by INTECH (a Janus subsidiary), these funds use a mathematical process in an attempt to build a more “efficient” portfolio than the index.
Value
Our value funds, managed by Perkins (a Janus subsidiary), seek to identify companies with favorable reward to risk characteristics by conducting rigorous downside analysis before determining upside potential.
For more information about our funds, contact your investment professional or go to janus.com/advisor/mutual-funds (or janus.com/allfunds if you hold Shares directly with Janus).
Please consider the charges, risks, expenses and investment objectives carefully before investing. For a prospectus or, if available, a summary prospectus containing this and other information, please call Janus at 877.33JANUS (52687) (or 800.525.3713 if you hold Shares directly with Janus); or download the file from janus.com/info (or janus.com/reports if you hold Shares directly with Janus). Read it carefully before you invest or send money.
Funds distributed by Janus Distributors LLC (08/13)
| | | | | | | | �� | | |
| Investment products offered are: | | | NOT FDIC-INSURED | | | MAY LOSE VALUE | | | NO BANK GUARANTEE |
| | | | | | | | | | |
| |
| C-0813-42789 | 125-02-93011 08-13 |
ANNUAL REPORT
June 30, 2013
Janus Asset Allocation Funds
Janus Global Allocation Fund – Conservative (formerly named Janus Conservative Allocation Fund)Janus Global Allocation Fund – Growth (formerly named Janus Growth Allocation Fund)
Janus Global Allocation Fund – Moderate (formerly named Janus Moderate Allocation Fund)
HIGHLIGHTS
| |
| • | Portfolio management perspective |
| • | Investment strategy behind your fund |
| • | Fund performance, characteristics and holdings |
Table of Contents
Janus Asset Allocation Funds
| | | |
| | 1 |
| | |
| | 3 |
| | 10 |
| | 17 |
| | 24 |
| | 29 |
| | 31 |
| | 32 |
| | 36 |
| | 48 |
| | 58 |
| | 59 |
| | 63 |
| | 66 |
| | 67 |
Please consider the charges, risks, expenses and investment objectives carefully before investing. For a prospectus or, if available, a summary prospectus containing this and other information, please call Janus at 877.33JANUS (52687) (or 800.525.3713 if you hold Shares directly with Janus); or download the file from janus.com/info (or janus.com/reports if you hold Shares directly with Janus). Read it carefully before you invest or send money.
Co-Chief Investment Officers’ Market Perspective (unaudited)
Jonathan Coleman, CFA
Chief Investment Officer, Equities
Gibson Smith
Chief Investment Officer, Fixed Income
Economy: Substantive improvement
The U.S. economy is showing signs of real, if uneven, improvement. The market seems obsessed with whether the Federal Reserve (Fed) will taper its bond-buying program by the end of the year, but is not focused on the continued improvement of the overall economy. We would not be surprised to see the Fed begin to taper its quantitative easing (QE) program over the next 12 months, but believe that it will leave short-term interest rates near zero for the foreseeable future. We also believe that global central banks will keep a high level of liquidity in the system. We continue to monitor potential global risk, particularly in China and Japan, but believe both of these concerns will abate in the medium term and that markets will refocus on the recovery.
Equities: Beyond the “wall of worry”
Equity markets have essentially climbed a “wall of worry” over the last six months, including the threat of falling off the fiscal cliff, then the potential impact of the sequester, and finally, concerns over Cyprus. Talking heads claimed these events spelled doomsday for the economy, but the market shrugged off each one and powered on. Now more speculative areas of the market, such as the Russell 2000 Index of U.S. small-capitalization companies, have hit all-time highs. Price/earnings multiples have expanded as stock price appreciation has exceeded the underlying earnings growth of many companies.
We think this is just when investors should be a little more cautious. The recent rally has been driven in part by a belief that the Fed and other central banks will backstop equity markets by pumping liquidity into the system forever. In late June, we got a glimpse of what happens to stock markets when the Fed even hints at taking its foot off the gas: there can be a sell-off.
Our view on the economy and equity markets has not turned negative, just more balanced. Many positives for the economy still exist. For instance, cheaper oil and natural gas in the U.S., along with more competitive labor costs, are creating a manufacturing renaissance. That’s a long-term benefit that could last a decade or longer. The U.S. housing market continues to be strong. In Europe, industrial companies are finally going through a painful restructuring that should right-size their businesses and make them more competitive on a global basis. European banks have also made significant strides in cutting costs and fortifying their balance sheets. But many of these longer-term dynamics already have been priced into stocks, or in other cases, they will take a long time to play out. The challenge as equity investors is to find those companies that can decouple from the economy, control their own destinies, and demonstrate strong growth even in the face of a slow-growth economy.
Fixed Income: Rate risk increases
As the economy gains stronger footing, the Fed will be given the opportunity to slowly remove its overly accommodative policy. While some investors may believe that we’ve seen the end of the bull market in fixed income, we are reminded that since 1980 we have seen 16 periods during which the 10-year Treasury yield rose by more than 100 basis points (1 percentage point). The 30-year bull market has hardly been a straight line up, with nothing but positive returns for fixed income investors – there have been periods of both angst and celebration, with the long-term trend being lower rates.
Making bold calls that the bull market in bonds is over can grab media attention and create fear for fixed-income investors, but the reality is that markets are always in motion and creating opportunities. This environment reminds us of the importance of active versus passive management in fixed income and the importance of capital preservation in uncertain times. While we may be entering a period where interest rates trend higher over the longer term, in the short and medium term there will be new opportunities created by change.
Because we tend to generate the majority of our excess return through security selection, we see this as a time of opportunity. Credit risk (i.e., the risk that borrowers will default) has been relatively low for years due to the excess levels of cash held on corporate balance sheets, and we believe that will continue. A back-up in rates may have the positive effect of lowering fixed income
Janus Asset Allocation Funds | 1
(unaudited) (continued)
valuations and opening up fresh opportunities for investing at more attractive levels in credits that we believe offer good risk-adjusted return potential.
Sincerely,
Jonathan Coleman, CFA
Chief Investment Officer, Equities
Gibson Smith
Chief Investment Officer, Fixed Income
2 | JUNE 30, 2013
Janus Global Allocation Fund - Conservative (unaudited)
| | | | | | | |
Fund Snapshot
Our conservative global allocation fund seeks to provide strong risk-adjusted returns over the long term by leveraging the investment expertise of Janus Capital Group while also having broad exposure to global asset classes and alternative investments that seek a low correlation with broad markets.
| | | | | | 
Dan Scherman
portfolio manager |
Performance Overview
Janus Global Allocation Fund – Conservative’s Class T Shares returned 7.60% for the 12-month period ended June 30, 2013. This compares with a return of -2.18% for the Barclays Global Aggregate Bond Index, the Fund’s primary benchmark, and a return of 5.00% for its secondary benchmark, the Global Conservative Allocation Index, an internally calculated, hypothetical combination of total returns from the Barclays Global Aggregate Bond Index (60%) and the MSCI All Country World Index (40%).
Strategy and Name Change
To increase its ability to invest globally and add exposure to alternatives that seek a low correlation with broad markets, the Fund’s strategy was modified during the period to increase its non-U.S. weighting to approximately 40% and to add alternative investments through Janus Diversified Alternatives Fund. We believe higher international exposure will give the Fund greater flexibility to potentially capture the best-performing investments across asset classes regardless of geographies. The exposure to alternatives that seek a low correlation with broad markets, including Janus Global Real Estate Fund, should help dampen the Fund’s volatility and provide more consistent risk-adjusted returns. As a result of these changes, Janus Conservative Allocation Fund was renamed Janus Global Allocation Fund – Conservative and its primary benchmark changed from the S&P 500 Index to the Barclays Global Aggregate Bond Index.
Economic Overview
Early in the period, investors began to realize the euro zone’s sovereign debt crisis had eased. Housing joined a resurgent manufacturing sector as the latest evidence that the U.S. economy was growing, albeit slowly. Central banks globally also remained focused on providing liquidity to the markets through accommodative monetary policies.
During the second half of the period, the global economy, particularly the U.S., showed clear signs of recovery. Other equity markets followed, but gains were generally more muted in Europe and elsewhere. An exception was Japan, where investor enthusiasm over the country’s new growth-focused government fueled strong gains. Uncharacteristically, emerging markets failed to participate in an otherwise upbeat market.
U.S. stocks performed well in April and May, but gave back some of their gains in June, when the Federal Reserve (Fed) suggested a timetable to begin reducing its bond buying by year end as a result of economic improvement. Emerging markets significantly underperformed developed markets, reflecting worries over slowing growth in China, uncertainty over central bank actions in developed markets and political unrest in Brazil and Egypt.
In fixed income, U.S. Treasury yields spiked following the Fed’s comments on tapering its monetary easing efforts. Non-U.S. bond yields followed suit, and U.S. corporate spreads relative to Treasuries widened as well, providing little shelter from the price declines. Real estate investment trusts also gave back some of their gains for the period, reflecting their sensitivity to rising interest rates.
For the full period, equity returns were generally strong, with the notable exception of emerging markets. Value-style indices significantly outperformed growth. In fixed income, interest rates were generally range-bound until Fed fears emerged in May.
Investment Process
Janus Global Allocation Fund – Conservative invests across a broad set of Janus, INTECH and Perkins funds that span a wide range of global asset categories with a base allocation of 30% to 45% equities, 50% to 65% fixed income and 5% to 20% alternative investments that are rebalanced quarterly. Janus Global Allocation Fund – Conservative is structured as a “fund of funds” portfolio that provides investors with broad, diversified exposure to various types of investments with an emphasis on
Janus Asset Allocation Funds | 3
Janus Global Allocation Fund - Conservative (unaudited)
managing investment risk. The Fund is also designed to blend the three core competencies that Janus practices as an organization: mathematically driven, risk-managed strategies and fundamentally driven growth and value-oriented investments. We believe that combining these very different approaches in a single investment can potentially produce a portfolio with a unique and powerful performance profile.
The investment process involves setting return expectations for a broad range of Janus mutual funds that we believe best represent the full opportunity set available to today’s investor. Then, acting in conjunction with an outside consultant, we establish an ideal “model” portfolio based upon the specific risk/return objective of Janus Global Allocation Fund – Conservative. The Janus Asset Allocation Committee also provides input on the overall allocation. Finally, we select the appropriate Janus, Perkins and INTECH funds that replicate our desired exposure. The allocations assigned to each selected underlying fund are consistent with our view of current market conditions and the long-term trade-off between risk and reward potential that each of these investment types represent. However, as a result of changing market conditions, both the mix of underlying funds and the allocations to these funds will change from time to time. Any portfolio risk management process we’ve discussed includes an effort to monitor and manage risk and should not be confused with nor does it imply low risk or the ability to control risk.
Performance Review
Given its exposure to equities, the Fund significantly outperformed its primary benchmark, the Barclay’s Global Aggregate Bond Index. The Fund also easily beat its secondary benchmark, the Global Conservative Allocation Index. Among top individual contributors were INTECH U.S. Value Fund and Perkins Large Cap Value Fund, reflecting the strong performance of value-style equities during the period. INTECH U.S. Growth Fund and Janus International Equity Fund were also key contributors. Detractors were dominated by fixed income investments, led lower by Janus Global Bond Fund, which suffered from interest rate increases late in the period. Janus Diversified Alternatives Fund and Janus Global Research Fund also weighed on performance.
Outlook
At period end, investors were left pondering if the post-quantitative easing period may have finally arrived. We think it’s important to remember that the Fed would only withdraw stimulus if it feels economic growth is self-sustaining, a positive for the equity markets.
We have been anticipating rising interest rates, which is why we positioned the Fund to reflect a partial de-emphasis of fixed income in favor of alternatives, as a means of providing some measure of insulation. We are also emphasizing credit exposure among the fixed income positions that remain.
Thank you for investing in Janus Global Allocation Fund – Conservative.
4 | JUNE 30, 2013
(unaudited)
Janus Global Allocation Fund – Conservative (% of Net Assets)
| | | | | |
| Janus Global Bond Fund – Class I Shares | | | 39.0% | |
| Janus Flexible Bond Fund – Class N Shares | | | 10.0% | |
| Janus International Equity Fund – Class N Shares | | | 8.6% | |
| Janus Short-Term Bond Fund – Class N Shares | | | 5.5% | |
| INTECH U.S. Value Fund – Class I Shares | | | 5.2% | |
| Janus Diversified Alternatives Fund – Class N Shares | | | 5.0% | |
| Perkins Large Cap Value Fund – Class N Shares | | | 4.2% | |
| INTECH U.S. Growth Fund – Class I Shares | | | 4.2% | |
| INTECH International Fund – Class I Shares | | | 4.1% | |
Janus Global Research Fund(1) – Class I Shares | | | 4.1% | |
| Janus Triton Fund – Class N Shares | | | 2.1% | |
| Janus Global Select Fund – Class I Shares | | | 2.0% | |
| Janus Fund – Class N Shares | | | 2.0% | |
| Janus Overseas Fund – Class N Shares | | | 2.0% | |
| Perkins Small Cap Value Fund – Class N Shares | | | 1.0% | |
| Janus Global Real Estate Fund – Class I Shares | | | 1.0% | |
| |
| |
| | | |
| (1) | | Effective March 15, 2013, Janus Global Research Fund merged with and into Janus Worldwide Fund. Following the merger, Janus Worldwide Fund was renamed Janus Global Research Fund. |
Janus Global Allocation Fund - Conservative At A Glance
Asset Allocation – (% of Net Assets)
As of June 30, 2013
Janus Asset Allocation Funds | 5
Janus Global Allocation Fund - Conservative (unaudited)
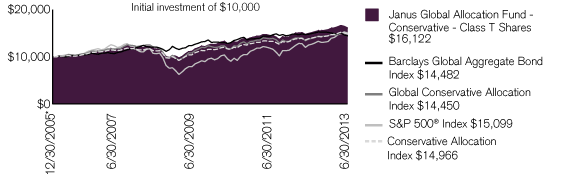
| | | | | | | | | | |
| | | | | | Expense Ratios – per the October 26, 2012 prospectuses, as
|
| Average Annual Total Return – for the periods ended June 30, 2013 | | | | | supplemented |
| | | One
| | Five
| | Since
| | | Total Annual Fund
|
| | | Year | | Year | | Inception* | | | Operating Expenses |
| | | | | | | | | | |
| Janus Global Allocation Fund – Conservative – Class A Shares | | | | | | | | | |
| | | | | | | | | | |
| NAV | | 7.36% | | 6.38% | | 6.38% | | | 1.25% |
| | | | | | | | | | |
| MOP | | 1.23% | | 5.13% | | 5.55% | | | |
| | | | | | | | | | |
| Janus Global Allocation Fund – Conservative – Class C Shares | | | | | | | | | |
| | | | | | | | | | |
| NAV | | 6.57% | | 5.62% | | 5.61% | | | 2.03% |
| | | | | | | | | | |
| CDSC | | 5.57% | | 5.62% | | 5.61% | | | |
| | | | | | | | | | |
| Janus Global Allocation Fund – Conservative – Class D Shares(1) | | 7.50% | | 6.56% | | 6.60% | | | 1.05% |
| | | | | | | | | | |
| Janus Global Allocation Fund – Conservative – Class I Shares | | 7.61% | | 6.52% | | 6.58% | | | 1.01% |
| | | | | | | | | | |
| Janus Global Allocation Fund – Conservative – Class S Shares | | 7.21% | | 6.15% | | 6.14% | | | 1.41% |
| | | | | | | | | | |
| Janus Global Allocation Fund – Conservative – Class T Shares | | 7.60% | | 6.52% | | 6.58% | | | 1.16% |
| | | | | | | | | | |
| Barclays Global Aggregate Bond Index | | –2.18% | | 3.68% | | 5.06% | | | |
| | | | | | | | | | |
| Global Conservative Allocation Index | | 5.00% | | 3.54% | | 5.03% | | | |
| | | | | | | | | | |
| S&P 500® Index | | 20.60% | | 7.01% | | 5.65% | | | |
| | | | | | | | | | |
| Conservative Allocation Index | | 7.53% | | 5.65% | | 5.52% | | | |
| | | | | | | | | | |
| Morningstar Quartile – Class T Shares | | 3rd | | 1st | | 1st | | | |
| | | | | | | | | | |
| Morningstar Ranking – based on total returns for World Allocation Funds | | 314/588 | | 22/300 | | 47/240 | | | |
| | | | | | | | | | |
| Visit janus.com/advisor/mutual-funds (or janus.com/allfunds if you hold Shares directly with Janus Capital) to view current performance and characteristic information | | | |
| | | | | | | | | | |
Returns quoted are past performance and do not guarantee future results; current performance may be lower or higher. Investment returns and principal value will vary; there may be a gain or loss when shares are sold. For the most recent month-end performance call 877.33JANUS(52687) (or 800.525.3713 if you hold shares directly with Janus Capital) or visit janus.com/advisor/mutual-funds (or janus.com/allfunds if you hold shares directly with Janus Capital).
Performance shown for Class A Shares at Maximum Offering Price (MOP) includes the Fund’s maximum sales charge of 5.75%. Performance shown at Net Asset Value (NAV) does not include this charge and would have been lower had this charge been taken into account.
Performance shown for Class C Shares includes a 1% contingent deferred sales charge (CDSC) on periods of less than 12 months. Performance shown at Net Asset Value (NAV) does not include this sales charge and would have been lower had this sales charge been taken into account.
See important disclosures on the next page.
6 | JUNE 30, 2013
(unaudited)
The expense ratios shown are estimated.
An underlying fund’s performance may be affected by risks that include those associated with nondiversification, non-investment grade debt securities, undervalued or overlooked companies, investments in specific industries or countries and potential conflicts of interest with the Janus “funds of funds.” Additional risks to a Fund may also include, but are not limited to, those associated with investing in foreign securities, emerging markets, initial public offerings (“IPOs”), real estate investment trusts (“REITs”), derivatives and companies with relatively small market capitalizations. Each underlying fund has different risks. Please see the Fund’s prospectuses or janus.com/info (or janus.com/reports if you hold shares directly with Janus Capital) for more information about risks, portfolio holdings and other details.
Because Janus Capital is the adviser to the Fund and to the underlying funds held within the Fund, it is subject to certain potential conflicts of interest when allocating the assets of the Fund among underlying Janus funds. Performance of the Fund depends on that of the underlying funds, which are subject to the volatility of the financial markets.
Returns include reinvestment of all dividends and distributions. The returns do not include adjustments in accordance with generally accepted accounting principles required at the period end for financial reporting purposes.
Class A Shares, Class C Shares, Class I Shares, and Class S Shares of the Fund commenced operations on July 6, 2009. The performance shown for periods prior to July 6, 2009 reflects the historical performance of a similar share class of the Fund, calculated using the fees and expenses of each respective share class without the effect of any fee and expense limitations or waivers.
Class D Shares of the Fund commenced operations on February 16, 2010, as a result of the restructuring of Class J Shares, the predecessor share class. The performance shown for periods prior to February 16, 2010 reflects the historical performance of the Fund’s predecessor share class.
If each share class of the Fund had been available during periods prior to its commencement, the performance shown may have been different. The performance shown for periods following the Fund’s commencement of each share class reflects the fees and expenses of each respective share class, net of any applicable fee and expense limitations or waivers. Please refer to the Fund’s prospectuses for further details concerning historical performance.
Ranking is for the share class shown only; other classes may have different performance characteristics. When an expense waiver is in effect, it may have a material effect on the total return, and therefore the ranking for the period.
© 2013 Morningstar, Inc. All Rights Reserved.
There is no assurance that the investment process will consistently lead to successful investing.
See Notes to Schedules of Investments and Other Information for index definitions.
The Fund’s portfolio may differ significantly from the securities held in the indices. The indices are unmanaged and are not available for direct investment; therefore, their performance does not reflect the expenses associated with the active management of an actual portfolio.
See “Useful Information About Your Fund Report.”
Effective February 15, 2013, Janus Conservative Allocation Fund changed its name to Janus Global Allocation Fund – Conservative and its primary benchmark from the S&P 500® Index to the Barclays Global Aggregate Bond Index. In addition, the Fund changed its secondary benchmark from the Conservative Allocation Index to the Global Conservative Allocation Index. Janus Capital believes that these changes provide a more appropriate representation of the Fund’s investment strategy that includes an increased focus on global investments, including emerging markets.
| | | |
| * | | The Fund’s inception date – December 30, 2005 |
| (1) | | Closed to new investors. |
Janus Asset Allocation Funds | 7
Janus Global Allocation Fund - Conservative (unaudited)
As a shareholder of the Fund, you incur two types of costs: (1) transaction costs, such as sales charges (loads) on purchase payments (applicable to Class A Shares only); and (2) ongoing costs, including management fees; distribution and shareholder servicing (12b-1) fees; administrative services fees payable pursuant to the Transfer Agency Agreement; and other Fund expenses. This example is intended to help you understand your ongoing costs (in dollars) of investing in the Fund and to compare these costs with the ongoing costs of investing in other mutual funds. To do so, compare this 5% hypothetical example with the 5% hypothetical examples that appear in the shareholder reports of the other funds. The example is based upon an investment of $1,000 invested at the beginning of the period and held for the six-months indicated, unless noted otherwise in the table and footnotes below.
Actual Expenses
The information in the table under the heading “Actual” provides information about actual account values and actual expenses. You may use the information in these columns, together with the amount you invested, to estimate the expenses that you paid over the period. Simply divide your account value by $1,000 (for example, an $8,600 account value divided by $1,000 = 8.6), then multiply the result by the number in the appropriate column for your share class under the heading entitled “Expenses Paid During Period” to estimate the expenses you paid on your account during the period.
Hypothetical Example for Comparison Purposes
The information in the table under the heading “Hypothetical (5% return before expenses)” provides information about hypothetical account values and hypothetical expenses based upon the Fund’s actual expense ratio and an assumed rate of return of 5% per year before expenses, which is not the Fund’s actual return. The hypothetical account values and expenses may not be used to estimate the actual ending account balance or expenses you paid for the period. You may use this information to compare the ongoing costs of investing in the Fund and other funds. To do so, compare this 5% hypothetical example with the 5% hypothetical examples that appear in the shareholder reports of the other funds. Additionally, for an analysis of the fees associated with an investment in any share class or other similar funds, please visit www.finra.org/fundanalyzer.
Please note that the expenses shown in the table are meant to highlight your ongoing costs only and do not reflect any transaction costs. These fees are fully described in the Fund’s prospectuses. Therefore, the hypothetical examples are useful in comparing ongoing costs only, and will not help you determine the relative total costs of owning different funds. In addition, if these transaction costs were included, your costs would have been higher.
| | | | | | | | | | | | | | | | | | | | | | | | | | | | | | | |
| | | | | Hypothetical
| | | | |
| | | Actual | | (5% return before expenses) | | | | |
| | | Beginning
| | Ending
| | Expenses
| | Beginning
| | Ending
| | Expenses
| | | | |
| | | Account
| | Account
| | Paid During
| | Account
| | Account
| | Paid During
| | Net Annualized
| | |
| | | Value
| | Value
| | Period
| | Value
| | Value
| | Period
| | Expense Ratio
| | |
| | | (1/1/2013) | | (6/30/2013) | | (1/1/13 - 6/30/13)† | | (1/1/2013) | | (6/30/2013) | | (1/1/13 - 6/30/13)† | | (1/1/13 - 6/30/13) | | |
| |
| |
| Class A Shares | | $ | 1,000.00 | | | $ | 1,021.30 | | | $ | 2.21 | | | $ | 1,000.00 | | | $ | 1,022.61 | | | $ | 2.21 | | | | 0.44% | | | |
| |
| |
| Class C Shares | | $ | 1,000.00 | | | $ | 1,017.60 | | | $ | 6.00 | | | $ | 1,000.00 | | | $ | 1,018.84 | | | $ | 6.01 | | | | 1.20% | | | |
| |
| |
| Class D Shares | | $ | 1,000.00 | | | $ | 1,022.00 | | | $ | 1.30 | | | $ | 1,000.00 | | | $ | 1,023.50 | | | $ | 1.30 | | | | 0.26% | | | |
| |
| |
| Class I Shares | | $ | 1,000.00 | | | $ | 1,022.80 | | | $ | 1.10 | | | $ | 1,000.00 | | | $ | 1,023.70 | | | $ | 1.10 | | | | 0.22% | | | |
| |
| |
| Class S Shares | | $ | 1,000.00 | | | $ | 1,020.60 | | | $ | 2.96 | | | $ | 1,000.00 | | | $ | 1,021.87 | | | $ | 2.96 | | | | 0.59% | | | |
| |
| |
| Class T Shares | | $ | 1,000.00 | | | $ | 1,022.80 | | | $ | 0.75 | | | $ | 1,000.00 | | | $ | 1,024.05 | | | $ | 0.75 | | | | 0.15% | | | |
| |
| |
| | | |
| † | | Expenses Paid During Period are equal to the Net Annualized Expense Ratio multiplied by the average account value over the period, multiplied by the number of days in the most recent six-month period, divided by the number of days in the fiscal year. Expenses in the examples include the effect of applicable fee waivers and/or expense reimbursements, if any. Had such waivers and/or reimbursements not been in effect, your expenses would have been higher. Please refer to the Notes to Financial Statements or the Fund’s prospectuses for more information regarding waivers and/or reimbursements. |
8 | JUNE 30, 2013
Janus Global Allocation Fund - Conservative(1)
Schedule of Investments
As of June 30, 2013
| | | | | | | | | | | |
| Shares | | Value | | | |
| |
Mutual Funds(2),£ – 100.0% | | | | | | |
| Alternative Funds – 6.0% | | | | | | |
| | 1,401,950 | | | Janus Diversified Alternatives Fund* – Class N Shares | | $ | 13,795,190 | | | |
| | 260,515 | | | Janus Global Real Estate Fund – Class I Shares | | | 2,706,748 | | | |
| | | | | | | | 16,501,938 | | | |
| Equity Funds – 39.4% | | | | | | |
| | 1,412,859 | | | INTECH International Fund – Class I Shares | | | 11,345,257 | | | |
| | 689,205 | | | INTECH U.S. Growth Fund – Class I Shares | | | 11,495,936 | | | |
| | 1,151,475 | | | INTECH U.S. Value Fund – Class I Shares | | | 14,404,951 | | | |
| | 159,562 | | | Janus Fund – Class N Shares | | | 5,544,774 | | | |
| | 216,272 | | | Janus Global Research Fund(3) – Class I Shares | | | 11,220,180 | | | |
| | 521,290 | | | Janus Global Select Fund* – Class I Shares | | | 5,577,807 | | | |
| | 2,027,122 | | | Janus International Equity Fund – Class N Shares | | | 23,879,504 | | | |
| | 165,860 | | | Janus Overseas Fund – Class N Shares | | | 5,483,334 | | | |
| | 283,800 | | | Janus Triton Fund – Class N Shares | | | 5,772,496 | | | |
| | 740,640 | | | Perkins Large Cap Value Fund – Class N Shares | | | 11,553,979 | | | |
| | 119,971 | | | Perkins Small Cap Value Fund – Class N Shares | | | 2,844,527 | | | |
| | | | | | | | 109,122,745 | | | |
| Fixed Income Funds – 54.6% | | | | | | |
| | 2,647,761 | | | Janus Flexible Bond Fund – Class N Shares | | | 27,801,488 | | | |
| | 10,977,478 | | | Janus Global Bond Fund – Class I Shares | | | 108,018,379 | | | |
| | 5,036,291 | | | Janus Short-Term Bond Fund – Class N Shares | | | 15,360,689 | | | |
| | | | | | | | 151,180,556 | | | |
| |
| |
| Total Investments (total cost $261,793,911) – 100.0% | | | 276,805,239 | | | |
| |
| |
| Liabilities, net of Cash, Receivables and Other Assets– (0.0)% | | | (23,535) | | | |
| |
| |
| Net Assets – 100% | | $ | 276,781,704 | | | |
| |
| |
| | | |
| (1) | | Formerly named Janus Conservative Allocation Fund. |
| (2) | | The Fund invests in mutual funds within the Janus family of funds and they may be deemed to be under common control because they share the same Board of Trustees. |
| (3) | | Effective March 15, 2013, Janus Global Research Fund merged with and into Janus Worldwide Fund. Following the merger, Janus Worldwide Fund was renamed Janus Global Research Fund. |
See Notes to Schedules of Investments and Other Information and Notes to Financial Statements.
Janus Asset Allocation Funds | 9
Janus Global Allocation Fund - Growth (unaudited)
| | | | | | | |
Fund Snapshot
Our global growth allocation fund aims to provide strong risk-adjusted returns over the long term by leveraging the investment expertise of Janus Capital Group while also having broad exposure to global asset classes and alternative investments that seek a low correlation with broad markets.
| | | | | |
Dan Scherman
portfolio manager |
Performance Overview
Janus Global Allocation Fund – Growth’s Class T Shares returned 14.18% for the 12-month period ended June 30, 2013. This compares with a return of 16.57% for the MSCI All Country World Index, the Fund’s primary benchmark, and a return of 12.60% for its secondary benchmark, the Global Growth Allocation Index, an internally calculated, hypothetical combination of total returns from the MSCI All Country World Index (80%) and the Barclays Global Aggregate Bond Index (20%).
Strategy and Name Change
To increase its ability to invest globally and add exposure to alternatives that seek a low correlation with broad markets, the Fund’s strategy was modified during the period to increase its non-U.S. weighting to approximately 40% and to add alternative investments through Janus Diversified Alternatives Fund. We believe higher international exposure will give the Fund greater flexibility to potentially capture the best-performing investments across asset classes regardless of geographies. The exposure to alternatives that seek a low correlation with broad markets, including Janus Global Real Estate Fund, should help dampen the Fund’s volatility and provide more consistent risk-adjusted returns. As a result of these changes, Janus Growth Allocation Fund was renamed Janus Global Allocation Fund – Growth and its primary benchmark changed from the S&P 500 Index to the MSCI All Country World Index.
Economic Overview
Early in the period, investors began to realize the euro zone’s sovereign debt crisis had eased. Housing joined a resurgent manufacturing sector as the latest evidence that the U.S. economy was growing, albeit slowly. Central banks globally also remained focused on providing liquidity to the markets through accommodative monetary policies.
During the second half of the period, the global economy, particularly the U.S., showed clear signs of recovery. Other equity markets followed, but gains were generally more muted in Europe and elsewhere. An exception was Japan, where investor enthusiasm over the country’s new growth-focused government fueled strong gains. Uncharacteristically, emerging markets failed to participate in an otherwise upbeat market.
U.S. stocks performed well in April and May, but gave back some of their gains in June, when the Federal Reserve (Fed) suggested a timetable to begin reducing its bond buying by year end as a result of economic improvement. Emerging markets significantly underperformed developed markets, reflecting worries over slowing growth in China, uncertainty over central bank actions in developed markets and political unrest in Brazil and Egypt.
In fixed income, U.S. Treasury yields spiked following the Fed’s comments on tapering its monetary easing efforts. Non-U.S. bond yields followed suit, and U.S. corporate spreads relative to Treasuries widened as well, providing little shelter from the price declines. Real estate investment trusts also gave back some of their gains for the period, reflecting their sensitivity to rising interest rates.
For the full period, equity returns were generally strong, with the notable exception of emerging markets. Value-style indices significantly outperformed growth. In fixed income, interest rates were generally range-bound until Fed fears emerged in May.
Investment Process
Janus Global Allocation Fund – Growth invests across a broad set of Janus, INTECH and Perkins funds that span a wide range of global asset categories with a base allocation of 70% to 85% equity investments, 10% to 25% fixed income investments and 5% to 20% alternative investments that are rebalanced quarterly. The Fund is structured as a “fund of funds” portfolio that provides investors with broad, diversified exposure to various types of investments with an emphasis on managing investment risk. The Fund is also designed to blend the three core competencies that Janus practices
10 | JUNE 30, 2013
(unaudited)
as an organization: mathematically driven, risk-managed strategies and fundamentally driven growth and value-oriented investments. We believe that combining these very different approaches in a single investment can potentially produce a portfolio with a unique and powerful performance profile.
The investment process involves setting return expectations for a broad range of Janus mutual funds that we believe best represent the full opportunity set available to today’s investor. Then, acting in conjunction with an outside consultant, we establish an ideal “model” portfolio based upon the specific risk/return objective of Janus Global Allocation Fund – Growth. The Janus Asset Allocation Committee also provides input on the overall allocation. Finally, we select the appropriate Janus, Perkins and INTECH funds that replicate our desired exposure. The allocations assigned to each selected underlying fund are consistent with our view of current market conditions and the long-term trade-off between risk and reward potential that each of these investment types represent. However, as a result of changing market conditions, both the mix of underlying funds and the allocations to these funds will change from time to time. Any portfolio risk management process we’ve discussed includes an effort to monitor and manage risk and should not be confused with nor does it imply low risk or the ability to control risk.
Performance Review
Given its exposure to fixed income and alternatives, the Fund underperformed its primary benchmark, the MSCI All Country World Index. The Fund outperformed its secondary benchmark, Global Growth Allocation Index. Detractors were led by Janus Global Bond Fund, Janus Emerging Markets Fund and Janus Diversified Alternatives Fund, indicating the weaknesses in their respective market segments. Janus Global Select Fund also weighed on performance due to its relative small weight. Among top individual contributors were INTECH U.S. Value Fund and Perkins Large Cap Value Fund, reflecting the strong performance of value-style equities during the period. Janus International Equity Fund and INTECH International Fund were also key contributors.
Outlook
At period end, investors were left pondering if the post-quantitative easing period may have finally arrived. We think it’s important to remember that the Fed would only withdraw stimulus if it feels economic growth is self-sustaining, a positive for the equity markets.
We have been anticipating rising interest rates, which is why we positioned the Fund to reflect a partial de-emphasis of fixed income in favor of alternatives, as a means of providing some measure of insulation. We are also emphasizing credit exposure among the fixed income positions that remain.
Thank you for investing in Janus Global Allocation Fund – Growth.
Janus Asset Allocation Funds | 11
Janus Global Allocation Fund - Growth (unaudited)
Janus Global Allocation Fund – Growth (% of Net Assets)
| | | | | |
| Janus International Equity Fund – Class N Shares | | | 16.1% | |
| Janus Global Bond Fund – Class I Shares | | | 15.3% | |
| INTECH International Fund – Class I Shares | | | 10.6% | |
| INTECH U.S. Value Fund – Class I Shares | | | 8.8% | |
| Janus Diversified Alternatives Fund – Class N Shares | | | 5.9% | |
| Janus Overseas Fund – Class N Shares | | | 5.9% | |
| Perkins Large Cap Value Fund – Class N Shares | | | 5.2% | |
| INTECH U.S. Growth Fund – Class I Shares | | | 5.1% | |
Janus Global Research Fund(1) – Class I Shares | | | 4.0% | |
| Janus Global Select Fund – Class I Shares | | | 3.0% | |
| Janus Global Real Estate Fund – Class I Shares | | | 2.9% | |
| Janus Emerging Markets Fund – Class I Shares | | | 2.7% | |
| Janus Enterprise Fund – Class N Shares | | | 2.1% | |
| Janus Twenty Fund – Class D Shares | | | 2.1% | |
| Janus Triton Fund – Class N Shares | | | 2.1% | |
| Janus Contrarian Fund – Class I Shares | | | 2.1% | |
| Janus Fund – Class N Shares | | | 2.1% | |
| Perkins Small Cap Value Fund – Class N Shares | | | 2.0% | |
| Perkins Mid Cap Value Fund – Class N Shares | | | 2.0% | |
| |
| |
| | | |
| (1) | | Effective March 15, 2013, Janus Global Research Fund merged with and into Janus Worldwide Fund. Following the merger, Janus Worldwide Fund was renamed Janus Global Research Fund. |
Janus Global Allocation Fund - Growth At A Glance
Asset Allocation – (% of Net Assets)
As of June 30, 2013
12 | JUNE 30, 2013
(unaudited)
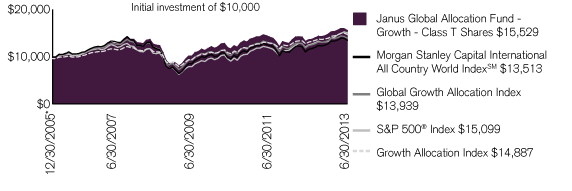
| | | | | | | | | | |
| | | | | | Expense Ratios – per the October 26, 2012 prospectuses, as
|
| Average Annual Total Return – for the periods ended June 30, 2013 | | | | | supplemented |
| | | One
| | Five
| | Since
| | | Total Annual Fund
|
| | | Year | | Year | | Inception* | | | Operating Expenses |
| | | | | | | | | | |
| Janus Global Allocation Fund – Growth – Class A Shares | | | | | | | | | |
| | | | | | | | | | |
| NAV | | 14.08% | | 4.02% | | 5.90% | | | 1.35% |
| | | | | | | | | | |
| MOP | | 7.51% | | 2.80% | | 5.07% | | | |
| | | | | | | | | | |
| Janus Global Allocation Fund – Growth – Class C Shares | | | | | | | | | |
| | | | | | | | | | |
| NAV | | 13.30% | | 3.26% | | 5.10% | | | 2.21% |
| | | | | | | | | | |
| CDSC | | 12.30% | | 3.26% | | 5.10% | | | |
| | | | | | | | | | |
| Janus Global Allocation Fund – Growth – Class D Shares(1) | | 14.21% | | 4.19% | | 6.08% | | | 1.14% |
| | | | | | | | | | |
| Janus Global Allocation Fund – Growth – Class I Shares | | 14.42% | | 4.13% | | 6.04% | | | 1.08% |
| | | | | | | | | | |
| Janus Global Allocation Fund – Growth – Class S Shares | | 13.94% | | 3.84% | | 5.68% | | | 1.49% |
| | | | | | | | | | |
| Janus Global Allocation Fund – Growth – Class T Shares | | 14.18% | | 4.13% | | 6.04% | | | 1.25% |
| | | | | | | | | | |
| Morgan Stanley Capital International All Country World IndexSM | | 16.57% | | 2.30% | | 4.10% | | | |
| | | | | | | | | | |
| Global Growth Allocation Index | | 12.60% | | 2.85% | | 4.53% | | | |
| | | | | | | | | | |
| S&P 500® Index | | 20.60% | | 7.01% | | 5.65% | | | |
| | | | | | | | | | |
| Growth Allocation Index | | 15.30% | | 5.02% | | 5.45% | | | |
| | | | | | | | | | |
| Morningstar Quartile – Class T Shares | | 1st | | 2nd | | 2nd | | | |
| | | | | | | | | | |
| Morningstar Ranking – based on total returns for World Allocation Funds | | 53/588 | | 108/300 | | 70/240 | | | |
| | | | | | | | | | |
| Visit janus.com/advisor/mutual-funds (or janus.com/allfunds if you hold Shares directly with Janus Capital) to view current performance and characteristic information | | | |
| | | | | | | | | | |
Returns quoted are past performance and do not guarantee future results; current performance may be lower or higher. Investment returns and principal value will vary; there may be a gain or loss when shares are sold. For the most recent month-end performance call 877.33JANUS(52687) (or 800.525.3713 if you hold shares directly with Janus Capital) or visit janus.com/advisor/mutual-funds (or janus.com/allfunds if you hold shares directly with Janus Capital).
Performance shown for Class A Shares at Maximum Offering Price (MOP) includes the Fund’s maximum sales charge of 5.75%. Performance shown at Net Asset Value (NAV) does not include this charge and would have been lower had this charge been taken into account.
Performance shown for Class C Shares includes a 1% contingent deferred sales charge (CDSC) on periods of less than 12 months. Performance shown at Net Asset Value (NAV) does not include this sales charge and would have been lower had this sales charge been taken into account.
See important disclosures on the next page.
Janus Asset Allocation Funds | 13
Janus Global Allocation Fund - Growth (unaudited)
The expense ratios shown are estimated.
An underlying fund’s performance may be affected by risks that include those associated with nondiversification, non-investment grade debt securities, undervalued or overlooked companies, investments in specific industries or countries and potential conflicts of interest with the Janus “funds of funds.” Additional risks to a Fund may also include, but are not limited to, those associated with investing in foreign securities, emerging markets, initial public offerings (“IPOs”), real estate investment trusts (“REITs”), derivatives and companies with relatively small market capitalizations. Each underlying fund has different risks. Please see the Fund’s prospectuses or janus.com/info (or janus.com/reports if you hold shares directly with Janus Capital) for more information about risks, portfolio holdings and other details.
Because Janus Capital is the adviser to the Fund and to the underlying funds held within the Fund, it is subject to certain potential conflicts of interest when allocating the assets of the Fund among underlying Janus funds. Performance of the Fund depends on that of the underlying funds, which are subject to the volatility of the financial markets.
Returns include reinvestment of all dividends and distributions. The returns do not include adjustments in accordance with generally accepted accounting principles required at the period end for financial reporting purposes.
Class A Shares, Class C Shares, and Class S Shares of the Fund commenced operations on July 6, 2009. The performance shown for periods prior to July 6, 2009 reflects the historical performance of a similar share class of the Fund, calculated using the fees and expenses of each respective share class without the effect of any fee and expense limitations or waivers.
Class D Shares of the Fund commenced operations on February 16, 2010, as a result of the restructuring of Class J Shares, the predecessor share class. The performance shown for periods prior to February 16, 2010 reflects the historical performance of the Fund’s predecessor share class.
Class I Shares of the Fund commenced operations on July 6, 2009. The performance shown for periods prior to July 6, 2009 reflects the historical performance of a similar share class of the Fund.
If each share class of the Fund had been available during periods prior to its commencement, the performance shown may have been different. The performance shown for periods following the Fund’s commencement of each share class reflects the fees and expenses of each respective share class, net of any applicable fee and expense limitations or waivers. Please refer to the Fund’s prospectuses for further details concerning historical performance.
Ranking is for the share class shown only; other classes may have different performance characteristics. When an expense waiver is in effect, it may have a material effect on the total return, and therefore the ranking for the period.
© 2013 Morningstar, Inc. All Rights Reserved.
There is no assurance that the investment process will consistently lead to successful investing.
See Notes to Schedules of Investments and Other Information for index definitions.
The Fund’s portfolio may differ significantly from the securities held in the indices. The indices are unmanaged and are not available for direct investment; therefore, their performance does not reflect the expenses associated with the active management of an actual portfolio.
See “Useful Information About Your Fund Report.”
Effective February 15, 2013, Janus Growth Allocation Fund changed its name to Janus Global Allocation Fund – Growth and its primary benchmark from the S&P 500® Index to the Morgan Stanley Capital International (“MSCI”) All Country World IndexSM. In addition, the Fund changed its secondary benchmark from the Growth Allocation Index to the Global Growth Allocation Index. Janus Capital believes that these changes provide a more appropriate representation of the Fund’s investment strategy that includes an increased focus on global investments, including emerging markets.
| | | |
| * | | The Fund’s inception date – December 30, 2005 |
| (1) | | Closed to new investors. |
14 | JUNE 30, 2013
(unaudited)
As a shareholder of the Fund, you incur two types of costs: (1) transaction costs, such as sales charges (loads) on purchase payments (applicable to Class A Shares only); and (2) ongoing costs, including management fees; distribution and shareholder servicing (12b-1) fees; administrative services fees payable pursuant to the Transfer Agency Agreement; and other Fund expenses. This example is intended to help you understand your ongoing costs (in dollars) of investing in the Fund and to compare these costs with the ongoing costs of investing in other mutual funds. To do so, compare this 5% hypothetical example with the 5% hypothetical examples that appear in the shareholder reports of the other funds. The example is based upon an investment of $1,000 invested at the beginning of the period and held for the six-months indicated, unless noted otherwise in the table and footnotes below.
Actual Expenses
The information in the table under the heading “Actual” provides information about actual account values and actual expenses. You may use the information in these columns, together with the amount you invested, to estimate the expenses that you paid over the period. Simply divide your account value by $1,000 (for example, an $8,600 account value divided by $1,000 = 8.6), then multiply the result by the number in the appropriate column for your share class under the heading entitled “Expenses Paid During Period” to estimate the expenses you paid on your account during the period.
Hypothetical Example for Comparison Purposes
The information in the table under the heading “Hypothetical (5% return before expenses)” provides information about hypothetical account values and hypothetical expenses based upon the Fund’s actual expense ratio and an assumed rate of return of 5% per year before expenses, which is not the Fund’s actual return. The hypothetical account values and expenses may not be used to estimate the actual ending account balance or expenses you paid for the period. You may use this information to compare the ongoing costs of investing in the Fund and other funds. To do so, compare this 5% hypothetical example with the 5% hypothetical examples that appear in the shareholder reports of the other funds. Additionally, for an analysis of the fees associated with an investment in any share class or other similar funds, please visit www.finra.org/fundanalyzer.
Please note that the expenses shown in the table are meant to highlight your ongoing costs only and do not reflect any transaction costs. These fees are fully described in the Fund’s prospectuses. Therefore, the hypothetical examples are useful in comparing ongoing costs only, and will not help you determine the relative total costs of owning different funds. In addition, if these transaction costs were included, your costs would have been higher.
| | | | | | | | | | | | | | | | | | | | | | | | | | | | | | | |
| | | | | Hypothetical
| | | | |
| | | Actual | | (5% return before expenses) | | | | |
| | | Beginning
| | Ending
| | Expenses
| | Beginning
| | Ending
| | Expenses
| | | | |
| | | Account
| | Account
| | Paid During
| | Account
| | Account
| | Paid During
| | Net Annualized
| | |
| | | Value
| | Value
| | Period
| | Value
| | Value
| | Period
| | Expense Ratio
| | |
| | | (1/1/13) | | (6/30/13) | | (1/1/13 - 6/30/13)† | | (1/1/13) | | (6/30/13) | | (1/1/13 - 6/30/13)† | | (1/1/13 - 6/30/13) | | |
| |
| |
| Class A Shares | | $ | 1,000.00 | | | $ | 1,051.80 | | | $ | 2.09 | | | $ | 1,000.00 | | | $ | 1,022.76 | | | $ | 2.06 | | | | 0.41% | | | |
| |
| |
| Class C Shares | | $ | 1,000.00 | | | $ | 1,048.40 | | | $ | 6.09 | | | $ | 1,000.00 | | | $ | 1,018.84 | | | $ | 6.01 | | | | 1.20% | | | |
| |
| |
| Class D Shares | | $ | 1,000.00 | | | $ | 1,052.40 | | | $ | 1.42 | | | $ | 1,000.00 | | | $ | 1,023.41 | | | $ | 1.40 | | | | 0.28% | | | |
| |
| |
| Class I Shares | | $ | 1,000.00 | | | $ | 1,053.20 | | | $ | 0.97 | | | $ | 1,000.00 | | | $ | 1,023.85 | | | $ | 0.95 | | | | 0.19% | | | |
| |
| |
| Class S Shares | | $ | 1,000.00 | | | $ | 1,050.40 | | | $ | 2.85 | | | $ | 1,000.00 | | | $ | 1,022.02 | | | $ | 2.81 | | | | 0.56% | | | |
| |
| |
| Class T Shares | | $ | 1,000.00 | | | $ | 1,052.40 | | | $ | 1.32 | | | $ | 1,000.00 | | | $ | 1,023.50 | | | $ | 1.30 | | | | 0.26% | | | |
| |
| |
| | | |
| † | | Expenses Paid During Period are equal to the Net Annualized Expense Ratio multiplied by the average account value over the period, multiplied by the number of days in the most recent six-month period, divided by the number of days in the fiscal year. Expenses in the examples include the effect of applicable fee waivers and/or expense reimbursements, if any. Had such waivers and/or reimbursements not been in effect, your expenses would have been higher. Please refer to the Notes to Financial Statements or the Fund’s prospectuses for more information regarding waivers and/or reimbursements. |
Janus Asset Allocation Funds | 15
Janus Global Allocation Fund - Growth(1)
Schedule of Investments
As of June 30, 2013
| | | | | | | | | | | |
| Shares | | Value | | | |
| |
Mutual Funds(2),£ – 100.0% | | | | | | |
| Alternative Funds – 8.8% | | | | | | |
| | 1,451,536 | | | Janus Diversified Alternatives Fund* – Class N Shares | | $ | 14,283,115 | | | |
| | 670,914 | | | Janus Global Real Estate Fund – Class I Shares | | | 6,970,795 | | | |
| | | | | | | | 21,253,910 | | | |
| Equity Funds – 75.8% | | | | | | |
| | 3,208,076 | | | INTECH International Fund – Class I Shares | | | 25,760,854 | | | |
| | 743,910 | | | INTECH U.S. Growth Fund – Class I Shares | | | 12,408,415 | | | |
| | 1,690,343 | | | INTECH U.S. Value Fund – Class I Shares | | | 21,146,195 | | | |
| | 287,149 | | | Janus Contrarian Fund – Class I Shares | | | 4,982,033 | | | |
| | 854,381 | | | Janus Emerging Markets Fund – Class I Shares | | | 6,536,013 | | | |
| | 67,020 | | | Janus Enterprise Fund* – Class N Shares | | | 5,001,033 | | | |
| | 142,765 | | | Janus Fund – Class N Shares | | | 4,961,069 | | | |
| | 186,722 | | | Janus Global Research Fund(3) – Class I Shares | | | 9,687,119 | | | |
| | 675,203 | | | Janus Global Select Fund – Class I Shares | | | 7,224,672 | | | |
| | 3,295,546 | | | Janus International Equity Fund – Class N Shares | | | 38,821,534 | | | |
| | 429,709 | | | Janus Overseas Fund – Class N Shares | | | 14,206,183 | | | |
| | 245,020 | | | Janus Triton Fund – Class N Shares | | | 4,983,706 | | | |
| | 74,629 | | | Janus Twenty Fund – Class D Shares | | | 4,992,714 | | | |
| | 799,434 | | | Perkins Large Cap Value Fund – Class N Shares | | | 12,471,163 | | | |
| | 205,204 | | | Perkins Mid Cap Value Fund – Class N Shares | | | 4,931,054 | | | |
| | 208,161 | | | Perkins Small Cap Value Fund – Class N Shares | | | 4,935,506 | | | |
| | | | | | | | 183,049,263 | | | |
| Fixed Income Fund – 15.4% | | | | | | |
| | 3,791,953 | | | Janus Global Bond Fund – Class I Shares | | | 37,312,813 | | | |
| |
| |
| Total Investments (total cost $208,258,097) – 100.0% | | | 241,615,986 | | | |
| |
| |
| Liabilities, net of Cash, Receivables and Other Assets– (0.0)% | | | (69,632) | | | |
| |
| |
| Net Assets – 100% | | $ | 241,546,354 | | | |
| |
| |
| | | |
| (1) | | Formerly named Janus Growth Allocation Fund. |
| (2) | | The Fund invests in mutual funds within the Janus family of funds and they may be deemed to be under common control because they share the same Board of Trustees. |
| (3) | | Effective March 15, 2013, Janus Global Research Fund merged with and into Janus Worldwide Fund. Following the merger, Janus Worldwide Fund was renamed Janus Global Research Fund. |
See Notes to Schedules of Investments and Other Information and Notes to Financial Statements.
16 | JUNE 30, 2013
Janus Global Allocation Fund - Moderate (unaudited)
| | | | | | | |
Fund Snapshot
Our moderate global allocation fund seeks to provide strong risk-adjusted returns over the long term by leveraging the investment expertise of Janus Capital Group while also having broad exposure to global asset classes and alternative investments that seek a low correlation with broad markets.
| | | | | |
Dan Scherman
portfolio manager |
Performance Overview
Janus Global Allocation Fund – Moderate’s Class T Shares returned 10.67% for the 12-month period ended June 30, 2013. This compares with a return of 16.57% for its primary benchmark, the MSCI All Country World Index, and a 8.75% return for its secondary benchmark, the Global Moderate Allocation Index, an internally calculated, hypothetical combination of total returns from the MSCI All Country World Index (60%) and the Barclays Global Aggregate Bond Index (40%).
Strategy and Name Change
To increase its ability to invest globally and add exposure to alternatives that seek a low correlation with broad markets, the Fund’s strategy was modified during the period to increase its non-U.S. weighting to approximately 40% and to add alternative investments through Janus Diversified Alternatives Fund. We believe higher international exposure will give the Fund greater flexibility to potentially capture the best-performing investments across asset classes regardless of geographies. The exposure to alternatives that seek a low-correlation with broad markets, including Janus Global Real Estate Fund, should help dampen the Fund’s volatility and provide more consistent risk-adjusted returns. As a result of these changes, Janus Moderate Allocation Fund was renamed Janus Global Allocation Fund – Moderate and its primary benchmark changed from the S&P 500 Index to the MSCI All Country World Index.
Market Review
Early in the period, investors began to realize the euro zone’s sovereign debt crisis had eased. Housing joined a resurgent manufacturing sector as the latest evidence that the U.S. economy was growing, albeit slowly. Central banks globally also remained focused on providing liquidity to the markets through accommodative monetary policies.
During the second half of the period, the global economy, particularly the U.S., showed clear signs of recovery. Other equity markets followed, but gains were generally more muted in Europe and elsewhere. An exception was Japan, where investor enthusiasm over the country’s new growth-focused government fueled strong gains. Uncharacteristically, emerging markets failed to participate in an otherwise upbeat market.
U.S. stocks performed well in April and May, but gave back some of their gains in June, when the Federal Reserve (Fed) suggested a timetable to begin reducing its bond buying by year end as a result of economic improvement. Emerging markets significantly underperformed developed markets, reflecting worries over slowing growth in China, uncertainty over central bank actions in developed markets and political unrest in Brazil and Egypt.
In fixed income, U.S. Treasury yields spiked following the Fed’s comments on tapering its monetary easing efforts. Non-U.S. bond yields followed suit, and U.S. corporate spreads relative to Treasuries widened as well, providing little shelter from the price declines. Real estate investment trusts also gave back some of their gains for the period, reflecting their sensitivity to rising interest rates.
For the full period, equity returns were generally strong, with the notable exception of emerging markets. Value-style indices significantly outperformed growth. In fixed income, interest rates were generally range-bound until Fed fears emerged in May.
Investment Process
Janus Global Allocation Fund – Moderate invests across a broad set of Janus, INTECH and Perkins funds that span a wide range of global asset categories with a base allocation of 45% to 60% equity investments, 30% to 45% fixed income investments and 5% to 20% alternative investments that are rebalanced quarterly. The Fund is structured as a “fund of funds” portfolio that provides investors with broad, diversified exposure to various types of investments with an emphasis on managing investment risk. The Fund is also designed to blend the three core competencies that Janus practices
Janus Asset Allocation Funds | 17
Janus Global Allocation Fund - Moderate (unaudited)
as an organization: mathematically driven, risk-managed strategies and fundamentally driven growth and value-oriented investments. We believe that combining these very different approaches in a single investment can potentially produce a portfolio with a unique and powerful performance profile.
The investment process involves setting return expectations for a broad range of Janus mutual funds that we believe best represent the full opportunity set available to today’s investor. Then, acting in conjunction with an outside consultant, we establish an ideal “model” portfolio based upon the specific risk/return objective of Janus Global Allocation Fund – Moderate. The Janus Asset Allocation Committee also provides input on the overall allocation. Finally, we select the appropriate Janus, Perkins and INTECH funds that replicate our desired exposure. The allocations assigned to each selected underlying fund are consistent with our view of current market conditions and the long-term trade-off between risk and reward potential that each of these investment types represent. However, as a result of changing market conditions, both the mix of underlying funds and the allocations to these funds will change from time to time. Any portfolio risk management process we’ve discussed includes an effort to monitor and manage risk and should not be confused with nor does it imply low risk or the ability to control risk.
Performance Review
Given its exposure to fixed income and alternatives, the Fund underperformed its primary benchmark, the MSCI All Country World Index. The Fund outperformed its secondary benchmark, Global Moderate Allocation Index. Detractors were led by Janus Global Bond Fund, Janus Emerging Markets Fund and Janus Diversified Alternatives Fund, indicating the weaknesses in their respective market segments. Janus Global Select Fund also weighed on performance due to its relative small weight. Among top individual contributors were INTECH U.S. Value Fund and Perkins Large Cap Value Fund, reflecting the strong performance of value-style equities during the period. Janus International Equity Fund and INTECH U.S. Growth Fund were also key contributors.
Outlook
At period end, investors were left pondering if the post-quantitative easing period may have finally arrived. We think it’s important to remember that the Fed would only withdraw stimulus if it feels economic growth is self-sustaining, a positive for the equity markets.
We have been anticipating rising interest rates, which is why we positioned the Fund to reflect a partial de-emphasis of fixed income in favor of alternatives, as a means of providing some measure of insulation. We are also emphasizing credit exposure among the fixed income positions that remain.
Thank you for investing in Janus Global Allocation Fund – Moderate.
18 | JUNE 30, 2013
(unaudited)
Janus Global Allocation Fund – Moderate (% of Net Assets)
| | | | | |
| Janus Global Bond Fund – Class I Shares | | | 29.1% | |
| Janus International Equity Fund – Class N Shares | | | 12.1% | |
| Janus Diversified Alternatives Fund – Class N Shares | | | 8.8% | |
| INTECH U.S. Value Fund – Class I Shares | | | 7.7% | |
| INTECH International Fund – Class I Shares | | | 7.6% | |
| Perkins Large Cap Value Fund – Class N Shares | | | 5.2% | |
| INTECH U.S. Growth Fund – Class I Shares | | | 4.1% | |
| Janus Overseas Fund – Class N Shares | | | 4.1% | |
Janus Global Research Fund(1) – Class I Shares | | | 3.0% | |
| Janus Short-Term Bond Fund – Class N Shares | | | 3.0% | |
| Janus Global Select Fund – Class I Shares | | | 2.2% | |
| Janus Triton Fund – Class N Shares | | | 2.1% | |
| Janus Twenty Fund – Class D Shares | | | 2.1% | |
| Janus Fund – Class N Shares | | | 2.0% | |
| Perkins Small Cap Value Fund – Class N Shares | | | 2.0% | |
| Janus Global Real Estate Fund – Class I Shares | | | 1.9% | |
| Janus Emerging Markets Fund – Class I Shares | | | 1.8% | |
| Janus Contrarian Fund – Class I Shares | | | 1.0% | |
| Perkins Global Value Fund – Class N Shares | | | 0.2% | |
| Janus Forty Fund – Class N Shares | | | 0.0% | |
| Janus High-Yield Fund – Class N Shares | | | 0.0% | |
| Janus Research Fund – Class N Shares | | | 0.0% | |
| Perkins Mid Cap Value Fund – Class N Shares | | | 0.0% | |
| |
| |
| | | |
| (1) | | Effective March 15, 2013, Janus Global Research Fund merged with and into Janus Worldwide Fund. Following the merger, Janus Worldwide Fund was renamed Janus Global Research Fund. |
Janus Global Allocation Fund - Moderate At A Glance
Asset Allocation – (% of Net Assets)
As of June 30, 2013
Janus Asset Allocation Funds | 19
Janus Global Allocation Fund - Moderate (unaudited)
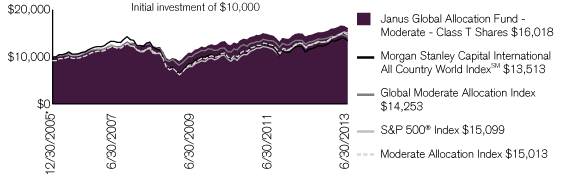
| | | | | | | | | | |
| | | | | | Expense Ratios – per the October 26, 2012 prospectuses, as
|
| Average Annual Total Return – for the periods ended June 30, 2013 | | | | | supplemented |
| | | One
| | Five
| | Since
| | | Total Annual Fund
|
| | | Year | | Year | | Inception* | | | Operating Expenses |
| | | | | | | | | | |
| Janus Global Allocation Fund – Moderate – Class A Shares | | | | | | | | | |
| | | | | | | | | | |
| NAV | | 10.67% | | 5.58% | | 6.34% | | | 1.29% |
| | | | | | | | | | |
| MOP | | 4.35% | | 4.34% | | 5.50% | | | |
| | | | | | | | | | |
| Janus Global Allocation Fund – Moderate – Class C Shares | | | | | | | | | |
| | | | | | | | | | |
| NAV | | 9.78% | | 4.81% | | 5.54% | | | 2.13% |
| | | | | | | | | | |
| CDSC | | 8.78% | | 4.81% | | 5.54% | | | |
| | | | | | | | | | |
| Janus Global Allocation Fund – Moderate – Class D Shares(1) | | 10.71% | | 5.73% | | 6.52% | | | 1.13% |
| | | | | | | | | | |
| Janus Global Allocation Fund – Moderate – Class I Shares | | 10.80% | | 5.67% | | 6.48% | | | 1.05% |
| | | | | | | | | | |
| Janus Global Allocation Fund – Moderate – Class S Shares | | 10.44% | | 5.35% | | 6.09% | | | 1.47% |
| | | | | | | | | | |
| Janus Global Allocation Fund – Moderate – Class T Shares | | 10.67% | | 5.67% | | 6.48% | | | 1.23% |
| | | | | | | | | | |
| Morgan Stanley Capital International All Country World IndexSM | | 16.57% | | 2.30% | | 4.10% | | | |
| | | | | | | | | | |
| Global Moderate Allocation Index | | 8.75% | | 3.26% | | 4.84% | | | |
| | | | | | | | | | |
| S&P 500® Index | | 20.60% | | 7.01% | | 5.65% | | | |
| | | | | | | | | | |
| Moderate Allocation Index | | 11.47% | | 5.49% | | 5.57% | | | |
| | | | | | | | | | |
| Morningstar Quartile – Class T Shares | | 2nd | | 1st | | 1st | | | |
| | | | | | | | | | |
| Morningstar Ranking – based on total returns for World Allocation Funds | | 185/588 | | 50/300 | | 49/240 | | | |
| | | | | | | | | | |
| Visit janus.com/advisor/mutual-funds (or janus.com/allfunds if you hold Shares directly with Janus Capital) to view current performance and characteristic information | | | |
| | | | | | | | | | |
Returns quoted are past performance and do not guarantee future results; current performance may be lower or higher. Investment returns and principal value will vary; there may be a gain or loss when shares are sold. For the most recent month-end performance call 877.33JANUS(52687) (or 800.525.3713 if you hold shares directly with Janus Capital) or visit janus.com/advisor/mutual-funds (or janus.com/allfunds if you hold shares directly with Janus Capital).
Performance shown for Class A Shares at Maximum Offering Price (MOP) includes the Fund’s maximum sales charge of 5.75%. Performance shown at Net Asset Value (NAV) does not include this charge and would have been lower had this charge been taken into account.
See important disclosures on the next page.
20 | JUNE 30, 2013
(unaudited)
Performance shown for Class C Shares includes a 1% contingent deferred sales charge (CDSC) on periods of less than 12 months. Performance shown at Net Asset Value (NAV) does not include this sales charge and would have been lower had this sales charge been taken into account.
The expense ratios shown are estimated.
An underlying fund’s performance may be affected by risks that include those associated with nondiversification, non-investment grade debt securities, undervalued or overlooked companies, investments in specific industries or countries and potential conflicts of interest with the Janus “funds of funds.” Additional risks to a Fund may also include, but are not limited to, those associated with investing in foreign securities, emerging markets, initial public offerings (“IPOs”), real estate investment trusts (“REITs”), derivatives and companies with relatively small market capitalizations. Each underlying fund has different risks. Please see the Fund’s prospectuses or janus.com/info (or janus.com/reports if you hold shares directly with Janus Capital) for more information about risks, portfolio holdings and other details.
Because Janus Capital is the adviser to the Fund and to the underlying funds held within the Fund, it is subject to certain potential conflicts of interest when allocating the assets of the Fund among underlying Janus funds. Performance of the Fund depends on that of the underlying funds, which are subject to the volatility of the financial markets.
Returns include reinvestment of all dividends and distributions. The returns do not include adjustments in accordance with generally accepted accounting principles required at the period end for financial reporting purposes.
Class A Shares, Class C Shares, and Class S Shares of the Fund commenced operations on July 6, 2009. The performance shown for periods prior to July 6, 2009 reflects the historical performance of a similar share class of the Fund, calculated using the fees and expenses of each respective share class without the effect of any fee and expense limitations or waivers.
Class D Shares of the Fund commenced operations on February 16, 2010, as a result of the restructuring of Class J Shares, the predecessor share class. The performance shown for periods prior to February 16, 2010 reflects the historical performance of the Fund’s predecessor share class.
Class I Shares of the Fund commenced operations on July 6, 2009. The performance shown for periods prior to July 6, 2009 reflects the historical performance of a similar share class of the Fund.
If each share class of the Fund had been available during periods prior to its commencement, the performance shown may have been different. The performance shown for periods following the Fund’s commencement of each share class reflects the fees and expenses of each respective share class, net of any applicable fee and expense limitations or waivers. Please refer to the Fund’s prospectuses for further details concerning historical performance.
Ranking is for the share class shown only; other classes may have different performance characteristics. When an expense waiver is in effect, it may have a material effect on the total return, and therefore the ranking for the period.
© 2013 Morningstar, Inc. All Rights Reserved.
There is no assurance that the investment process will consistently lead to successful investing.
See Notes to Schedules of Investments and Other Information for index definitions.
The Fund’s portfolio may differ significantly from the securities held in the indices. The indices are unmanaged and are not available for direct investment; therefore, their performance does not reflect the expenses associated with the active management of an actual portfolio.
See “Useful Information About Your Fund Report.”
Effective February 15, 2013, Janus Moderate Allocation Fund changed its name to Janus Global Allocation Fund – Moderate and its primary benchmark from the S&P 500® Index to the Morgan Stanley Capital International (“MSCI”) All Country World IndexSM. In addition, the Fund changed its secondary benchmark from the Moderate Allocation Index to the Global Moderate Allocation Index. Janus Capital believes that these changes provide a more appropriate representation of the Fund’s investment strategy that includes an increased focus on global investments, including emerging markets.
| | | |
| * | | The Fund’s inception date – December 30, 2005 |
| (1) | | Closed to new investors. |
Janus Asset Allocation Funds | 21
Janus Global Allocation Fund - Moderate (unaudited)
As a shareholder of the Fund, you incur two types of costs: (1) transaction costs, such as sales charges (loads) on purchase payments (applicable to Class A Shares only); and (2) ongoing costs, including management fees; distribution and shareholder servicing (12b-1) fees; administrative services fees payable pursuant to the Transfer Agency Agreement; and other Fund expenses. This example is intended to help you understand your ongoing costs (in dollars) of investing in the Fund and to compare these costs with the ongoing costs of investing in other mutual funds. To do so, compare this 5% hypothetical example with the 5% hypothetical examples that appear in the shareholder reports of the other funds. The example is based upon an investment of $1,000 invested at the beginning of the period and held for the six-months indicated, unless noted otherwise in the table and footnotes below.
Actual Expenses
The information in the table under the heading “Actual” provides information about actual account values and actual expenses. You may use the information in these columns, together with the amount you invested, to estimate the expenses that you paid over the period. Simply divide your account value by $1,000 (for example, an $8,600 account value divided by $1,000 = 8.6), then multiply the result by the number in the appropriate column for your share class under the heading entitled “Expenses Paid During Period” to estimate the expenses you paid on your account during the period.
Hypothetical Example for Comparison Purposes
The information in the table under the heading “Hypothetical (5% return before expenses)” provides information about hypothetical account values and hypothetical expenses based upon the Fund’s actual expense ratio and an assumed rate of return of 5% per year before expenses, which is not the Fund’s actual return. The hypothetical account values and expenses may not be used to estimate the actual ending account balance or expenses you paid for the period. You may use this information to compare the ongoing costs of investing in the Fund and other funds. To do so, compare this 5% hypothetical example with the 5% hypothetical examples that appear in the shareholder reports of the other funds. Additionally, for an analysis of the fees associated with an investment in any share class or other similar funds, please visit www.finra.org/fundanalyzer.
Please note that the expenses shown in the table are meant to highlight your ongoing costs only and do not reflect any transaction costs. These fees are fully described in the Fund’s prospectuses. Therefore, the hypothetical examples are useful in comparing ongoing costs only, and will not help you determine the relative total costs of owning different funds. In addition, if these transaction costs were included, your costs would have been higher.
| | | | | | | | | | | | | | | | | | | | | | | | | | | | | | | |
| | | | | Hypothetical
| | | | |
| | | Actual | | (5% return before expenses) | | | | |
| | | Beginning
| | Ending
| | Expenses
| | Beginning
| | Ending
| | Expenses
| | | | |
| | | Account
| | Account
| | Paid During
| | Account
| | Account
| | Paid During
| | Net Annualized
| | |
| | | Value
| | Value
| | Period
| | Value
| | Value
| | Period
| | Expense Ratio
| | |
| | | (1/1/13) | | (6/30/13) | | (1/1/13 - 6/30/13)† | | (1/1/13) | | (6/30/13) | | (1/1/13 - 6/30/13)† | | (1/1/13 - 6/30/13) | | |
| |
| |
| Class A Shares | | $ | 1,000.00 | | | $ | 1,037.50 | | | $ | 2.12 | | | $ | 1,000.00 | | | $ | 1,022.71 | | | $ | 2.11 | | | | 0.42% | | | |
| |
| |
| Class C Shares | | $ | 1,000.00 | | | $ | 1,033.90 | | | $ | 5.85 | | | $ | 1,000.00 | | | $ | 1,019.04 | | | $ | 5.81 | | | | 1.16% | | | |
| |
| |
| Class D Shares | | $ | 1,000.00 | | | $ | 1,037.80 | | | $ | 1.26 | | | $ | 1,000.00 | | | $ | 1,023.55 | | | $ | 1.25 | | | | 0.25% | | | |
| |
| |
| Class I Shares | | $ | 1,000.00 | | | $ | 1,038.60 | | | $ | 0.91 | | | $ | 1,000.00 | | | $ | 1,023.90 | | | $ | 0.90 | | | | 0.18% | | | |
| |
| |
| Class S Shares | | $ | 1,000.00 | | | $ | 1,036.50 | | | $ | 3.03 | | | $ | 1,000.00 | | | $ | 1,021.82 | | | $ | 3.01 | | | | 0.60% | | | |
| |
| |
| Class T Shares | | $ | 1,000.00 | | | $ | 1,038.00 | | | $ | 1.26 | | | $ | 1,000.00 | | | $ | 1,023.55 | | | $ | 1.25 | | | | 0.25% | | | |
| |
| |
| | | |
| † | | Expenses Paid During Period are equal to the Net Annualized Expense Ratio multiplied by the average account value over the period, multiplied by the number of days in the most recent six-month period, divided by the number of days in the fiscal year. Expenses in the examples include the effect of applicable fee waivers and/or expense reimbursements, if any. Had such waivers and/or reimbursements not been in effect, your expenses would have been higher. Please refer to the Notes to Financial Statements or the Fund’s prospectuses for more information regarding waivers and/or reimbursements. |
22 | JUNE 30, 2013
Janus Global Allocation Fund - Moderate(1)
Schedule of Investments
As of June 30, 2013
| | | | | | | | | | | |
| Shares | | Value | | | |
| |
Mutual Funds(2),£ – 100.0% | | | | | | |
| Alternative Funds – 10.7% | | | | | | |
| | 2,610,723 | | | Janus Diversified Alternatives Fund* – Class N Shares | | $ | 25,689,514 | | | |
| | 537,689 | | | Janus Global Real Estate Fund – Class I Shares | | | 5,586,593 | | | |
| | | | | | | | 31,276,107 | | | |
| Equity Funds – 57.2% | | | | | | |
| | 2,753,960 | | | INTECH International Fund – Class I Shares | | | 22,114,302 | | | |
| | 719,484 | | | INTECH U.S. Growth Fund – Class I Shares | | | 12,000,991 | | | |
| | 1,801,208 | | | INTECH U.S. Value Fund – Class I Shares | | | 22,533,114 | | | |
| | 173,834 | | | Janus Contrarian Fund* – Class I Shares | | | 3,016,016 | | | |
| | 683,318 | | | Janus Emerging Markets Fund – Class I Shares | | | 5,227,379 | | | |
| | 1,083 | | | Janus Forty Fund* – Class N Shares | | | 45,135 | | | |
| | 171,014 | | | Janus Fund – Class N Shares | | | 5,942,738 | | | |
| | 167,791 | | | Janus Global Research Fund(3) – Class I Shares | | | 8,705,012 | | | |
| | 582,667 | | | Janus Global Select Fund – Class I Shares | | | 6,234,535 | | | |
| | 2,992,150 | | | Janus International Equity Fund – Class N Shares | | | 35,247,530 | | | |
| | 359,131 | | | Janus Overseas Fund – Class N Shares | | | 11,872,864 | | | |
| | 1,162 | | | Janus Research Fund – Class N Shares | | | 42,450 | | | |
| | 302,610 | | | Janus Triton Fund – Class N Shares | | | 6,155,078 | | | |
| | 89,382 | | | Janus Twenty Fund – Class D Shares | | | 5,979,642 | | | |
| | 39,572 | | | Perkins Global Value Fund* – Class N Shares | | | 530,270 | | | |
| | 960,548 | | | Perkins Large Cap Value Fund – Class N Shares | | | 14,984,545 | | | |
| | 2,638 | | | Perkins Mid Cap Value Fund* – Class N Shares | | | 63,395 | | | |
| | 250,571 | | | Perkins Small Cap Value Fund – Class N Shares | | | 5,941,028 | | | |
| | | | | | | | 166,636,024 | | | |
| Fixed Income Funds – 32.1% | | | | | | |
| | 8,611,851 | | | Janus Global Bond Fund – Class I Shares | | | 84,740,612 | | | |
| | 9,013 | | | Janus High-Yield Fund – Class N Shares | | | 82,377 | | | |
| | 2,892,821 | | | Janus Short-Term Bond Fund – Class N Shares | | | 8,823,104 | | | |
| | | | | | | | 93,646,093 | | | |
| |
| |
| Total Investments (total cost $263,108,568) – 100.0% | | | 291,558,224 | | | |
| |
| |
| Liabilities, net of Cash, Receivables and Other Assets– (0.0)% | | | (117,863) | | | |
| |
| |
| Net Assets – 100% | | $ | 291,440,361 | | | |
| |
| |
| | | |
| (1) | | Formerly named Janus Moderate Allocation Fund. |
| (2) | | The Fund invests in mutual funds within the Janus family of funds and they may be deemed to be under common control because they share the same Board of Trustees. |
| (3) | | Effective March 15, 2013, Janus Global Research Fund merged with and into Janus Worldwide Fund. Following the merger, Janus Worldwide Fund was renamed Janus Global Research Fund. |
See Notes to Schedules of Investments and Other Information and Notes to Financial Statements.
Janus Asset Allocation Funds | 23
Notes to Schedules of Investments and Other Information
| | |
| Barclays Global Aggregate Bond Index | | Provides a broad-based measure of the global investment grade fixed-rate debt markets. It is comprised of the U.S. Aggregate, Pan-European Aggregate, and the Asian-Pacific Aggregate Indexes. It also includes a wide range of standard and customized subindices by liquidity constraint, sector, quality and maturity. |
| |
| Barclays U.S. Aggregate Bond Index | | Made up of the Barclays U.S. Government/Corporate Bond Index, Mortgage-Backed Securities Index, and Asset-Backed Securities Index, including securities that are of investment grade quality or better, have at least one year to maturity, and have an outstanding par value of at least $100 million. |
| |
| Conservative Allocation Index | | An internally calculated, hypothetical combination of unmanaged indices that combines the total returns from the Barclays U.S. Aggregate Bond Index (60%), the Dow Jones Wilshire 5000 Index (28%) and the MSCI EAFE® Index (12%). |
| |
| Dow Jones Wilshire 5000 Index | | Measures the performance of all U.S. headquartered equity securities with readily available price data. Over 5,000 capitalization-weighted security returns are used and the Dow Jones Wilshire 5000 Index is considered one of the premier measures of the entire U.S. stock market. |
| |
| Global Conservative Allocation Index | | An internally-calculated, hypothetical combination of total returns from the Barclays Global Aggregate Bond Index (60%) and the MSCI All Country World IndexSM (40%). |
| |
| Global Growth Allocation Index | | An internally-calculated, hypothetical combination of total returns from the MSCI All Country World IndexSM (80%) and the Barclays Global Aggregate Bond Index (20%). |
| |
| Global Moderate Allocation Index | | An internally calculated, hypothetical combination of total returns from the MSCI All Country World IndexSM (60%) and Barclays Global Aggregate Bond Index (40%). |
| |
| Growth Allocation Index | | An internally calculated, hypothetical combination of total returns from the Dow Jones Wilshire 5000 Index (50%), the MSCI EAFE® Index (25%), the Barclays U.S. Aggregate Bond Index (20%) and the MSCI Emerging Markets IndexSM (5%). |
| |
| Moderate Allocation Index | | An internally calculated, hypothetical combination of total returns from the Dow Jones Wilshire 5000 Index (40%), the Barclays U.S. Aggregate Bond Index (40%), the MSCI EAFE® Index (18%) and the MSCI Emerging Markets IndexSM (2%). |
| |
| Morgan Stanley Capital International All Country World IndexSM | | An unmanaged, free float-adjusted market capitalization weighted index composed of stocks of companies located in countries throughout the world. It is designed to measure equity market performance in global developed and emerging markets. The index includes reinvestment of dividends, net of foreign withholding taxes. |
| |
| Morgan Stanley Capital International EAFE® Index | | A free float-adjusted market capitalization weighted index designed to measure developed market equity performance. The MSCI EAFE® Index is composed of companies representative of the market structure of developed market countries. The index includes reinvestment of dividends, net of foreign withholding taxes. |
| |
| Morgan Stanley Capital International Emerging Markets IndexSM | | A free float-adjusted market capitalization index that is designed to measure equity market performance of emerging markets. |
| |
| S&P 500® Index | | A commonly recognized, market-capitalization weighted index of 500 widely held equity securities, designed to measure broad U.S. equity performance. |
| | | |
| * | | Non-income producing security. |
24 | JUNE 30, 2013
| |
| £ | The Funds may invest in certain securities that are considered affiliated companies. As defined by the Investment Company Act of 1940, as amended, an affiliated company is one in which the fund owns 5% or more of the outstanding voting securities, or a company which is under common ownership or control. Based on the Fund’s relative ownership, the following securities were considered affiliated companies for all or some portion of the year ended June 30, 2013. Except for the value at year end, all other information in the table is for the year ended June 30, 2013. |
| | | | | | | | | | | | | | | | | | | | | | | | |
| | | Purchases | | | Sales | | | Realized
| | Dividend
| | Value
| | |
| | | Shares | | Cost | | | Shares | | Cost | | | Gain/(Loss) | | Income | | at 6/30/13 | | |
| |
Janus Global Allocation Fund – Conservative | | | | | | | | | | | | | | | | | | | | | | | |
| INTECH International Fund – Class I Shares | | 790,197 | | $ | 6,241,216 | | | (83,792) | | $ | (670,764) | | | $ | (7,121) | | $ | 148,890 | | $ | 11,345,257 | | |
| INTECH U.S. Growth Fund – Class I Shares | | 133,271 | | | 2,032,522 | | | (509,006) | | | (6,938,380) | | | | 1,291,532 | | | 237,270 | | | 11,495,936 | | |
| INTECH U.S. Value Fund – Class I Shares | | 255,889 | | | 2,833,890 | | | (1,139,151) | | | (11,220,568) | | | | 2,524,090 | | | 464,090 | | | 14,404,951 | | |
| Janus Diversified Alternatives Fund – Class N Shares | | 1,438,564 | | | 14,383,946 | | | (36,614) | | | (366,161) | | | | (4,078) | | | – | | | 13,795,190 | | |
| Janus Flexible Bond Fund – Class N Shares | | 1,887,921 | | | 20,585,496 | | | (11,589,435) | | | (119,179,006) | | | | 5,914,134 | | | 4,955,552 | | | 27,801,488 | | |
| Janus Fund – Class N Shares | | 23,786 | | | 773,892 | | | (15,586) | | | (493,001) | | | | 24,327 | | | 53,989 | | | 5,544,774 | | |
| Janus Global Bond Fund – Class I Shares | | 11,263,147 | | | 115,885,241 | | | (285,670) | | | (2,951,173) | | | | (54,509) | | | 813,673 | | | 108,018,379 | | |
| Janus Global Real Estate Fund – Class I Shares | | 38,256 | | | 392,978 | | | (24,625) | | | (244,655) | | | | 13,564 | | | 80,423 | | | 2,706,748 | | |
Janus Global Research Fund(1) – Class I Shares | | 228,053 | | | 11,588,637 | | | (11,781) | | | (606,091) | | | | 2,351 | | | 19,807 | | | 11,220,180 | | |
| Janus Global Select Fund – Class I Shares | | 534,513 | | | 5,753,578 | | | (13,223) | | | (144,836) | | | | (3) | | | – | | | 5,577,807 | | |
| Janus High-Yield Fund – Class N Shares | | 8,836 | | | 81,194 | | | (129,525) | | | (1,034,835) | | | | 184,536 | | | 52,262 | | | – | | |
| Janus International Equity Fund – Class N Shares | | 1,118,428 | | | 13,069,432 | | | (326,651) | | | (3,756,124) | | | | (58,794) | | | 176,099 | | | 23,879,504 | | |
| Janus Overseas Fund – Class N Shares | | 34,367 | | | 1,151,195 | | | (15,238) | | | (583,671) | | | | (65,750) | | | 189,055 | | | 5,483,334 | | |
| Janus Research Fund – Class N Shares | | 28,645 | | | 924,869 | | | (355,840) | | | (9,009,199) | | | | 3,358,769 | | | 98,256 | | | – | | |
| Janus Short-Term Bond Fund – Class N Shares | | 1,092,846 | | | 3,374,033 | | | (1,433,335) | | | (4,428,532) | | | | (12,515) | | | 342,210 | | | 15,360,689 | | |
| Janus Triton Fund – Class N Shares | | 48,840 | | | 901,688 | | | (39,680) | | | (721,168) | | | | 46,722 | | | 80,656 | | | 5,772,496 | | |
| Perkins Large Cap Value Fund – Class N Shares | | 193,552 | | | 2,756,293 | | | (793,157) | | | (10,457,503) | | | | 1,484,322 | | | 333,184 | | | 11,553,979 | | |
| Perkins Small Cap Value Fund – Class N Shares | | 26,614 | | | 588,991 | | | (11,462) | | | (272,203) | | | | (14,578) | | | 38,603 | | | 2,844,527 | | |
| |
| |
| | | | | $ | 203,319,091 | | | | | $ | (173,077,870) | | | $ | 14,626,999 | | $ | 8,084,019 | | $ | 276,805,239 | | |
| |
| |
Janus Asset Allocation Funds | 25
Notes to Schedules of Investments and Other Information (continued)
| | | | | | | | | | | | | | | | | | | | | | | | |
| | | Purchases | | | Sales | | | Realized
| | Dividend
| | Value
| | |
| | | Shares | | Cost | | | Shares | | Cost | | | Gain/(Loss) | | Income | | at 6/30/13 | | |
| |
Janus Global Allocation Fund – Growth | | | | | | | | | | | | | | | | | | | | | | | |
| INTECH International Fund – Class I Shares | | 1,100,983 | | $ | 8,706,996 | | | (502,538) | | $ | (3,982,831) | | | $ | (179,372) | | $ | 470,477 | | $ | 25,760,854 | | |
| INTECH U.S. Growth Fund – Class I Shares | | 43,341 | | | 661,502 | | | (796,921) | | | (10,705,113) | | | | 2,024,333 | | | 285,528 | | | 12,408,415 | | |
| INTECH U.S. Value Fund – Class I Shares | | 87,887 | | | 981,794 | | | (803,663) | | | (8,652,806) | | | | 764,234 | | | 473,786 | | | 21,146,195 | | |
| Janus Contrarian Fund – Class I Shares | | 257,809 | | | 4,346,593 | | | (65,221) | | | (652,143) | | | | 384,366 | | | 14,585 | | | 4,982,033 | | |
| Janus Diversified Alternatives Fund – Class N Shares | | 1,496,946 | | | 14,968,631 | | | (45,410) | | | (454,117) | | | | (5,546) | | | – | | | 14,283,115 | | |
| Janus Emerging Markets Fund – Class I Shares | | 606,367 | | | 5,115,045 | | | (64,201) | | | (570,566) | | | | (46,074) | | | 16,829 | | | 6,536,013 | | |
| Janus Enterprise Fund – Class N Shares | | 72,502 | | | 4,959,678 | | | (5,482) | | | (379,098) | | | | 2,606 | | | – | | | 5,001,033 | | |
| Janus Flexible Bond Fund – Class N Shares | | 139,274 | | | 1,515,910 | | | (2,790,585) | | | (26,857,060) | | | | 3,287,478 | | | 950,758 | | | – | | |
| Janus Fund – Class N Shares | | 6,718 | | | 217,771 | | | (102,586) | | | (2,574,688) | | | | 871,694 | | | 77,496 | | | 4,961,069 | | |
| Janus Global Bond Fund – Class I Shares | | 2,922,138 | | | 30,098,386 | | | (202,795) | | | (2,129,359) | | | | (27,777) | | | 737,795 | | | 37,312,813 | | |
| Janus Global Real Estate Fund – Class I Shares | | 44,876 | | | 460,864 | | | (289,737) | | | (2,432,995) | | | | 645,652 | | | 271,370 | | | 6,970,795 | | |
Janus Global Research Fund(1) – Class I Shares | | 201,871 | | | 10,075,490 | | | (15,149) | | | (759,976) | | | | 3,431 | | | 32,423 | | | 9,687,119 | | |
| Janus Global Select Fund – Class I Shares | | 669,519 | | | 7,203,965 | | | (48,319) | | | (353,917) | | | | 159,899 | | | 2,325 | | | 7,224,672 | | |
| Janus High-Yield Fund – Class N Shares | | 7,734 | | | 71,348 | | | (164,539) | | | (1,213,108) | | | | 335,517 | | | 61,316 | | | – | | |
| Janus International Equity Fund – Class N Shares | | 1,051,607 | | | 12,328,912 | | | (541,035) | | | (6,375,183) | | | | (306,816) | | | 382,712 | | | 38,821,534 | | |
| Janus Overseas Fund – Class N Shares | | 56,644 | | | 1,883,587 | | | (160,420) | | | (6,558,100) | | | | (1,180,614) | | | 654,251 | | | 14,206,183 | | |
| Janus Research Fund – Class N Shares | | 7,781 | | | 253,356 | | | (436,340) | | | (9,756,672) | | | | 5,331,038 | | | 111,063 | | | – | | |
| Janus Short-Term Bond Fund – Class N Shares | | 30,449 | | | 94,035 | | | (1,067,867) | | | (3,283,331) | | | | 6,654 | | | 48,954 | | | – | | |
| Janus Triton Fund – Class N Shares | | 40,222 | | | 770,626 | | | (26,413) | | | (449,235) | | | | 48,709 | | | 61,596 | | | 4,983,706 | | |
| Janus Twenty Fund – Class D Shares | | 3,276 | | | 206,534 | | | (71,472) | | | (3,654,356) | | | | 952,359 | | | 61,544 | | | 4,992,714 | | |
| Perkins Large Cap Value Fund – Class N Shares | | 88,158 | | | 1,244,768 | | | (984,828) | | | (12,743,935) | | | | 2,056,492 | | | 384,641 | | | 12,471,163 | | |
| Perkins Mid Cap Value Fund – Class N Shares | | 14,455 | | | 316,591 | | | (34,758) | | | (699,216) | | | | 94,824 | | | 40,843 | | | 4,931,054 | | |
| Perkins Small Cap Value Fund – Class N Shares | | 16,792 | | | 361,552 | | | (23,095) | | | (507,414) | | | | 3,078 | | | 71,549 | | | 4,935,506 | | |
| |
| |
| | | | | $ | 106,843,934 | | | | | $ | (105,745,219) | | | $ | 15,226,165 | | $ | 5,211,841 | | $ | 241,615,986 | | |
| |
| |
26 | JUNE 30, 2013
| | | | | | | | | | | | | | | | | | | | | | | | |
| | | Purchases | | | Sales | | | Realized
| | Dividend
| | Value
| | |
| | | Shares | | Cost | | | Shares | | Cost | | | Gain/(Loss) | | Income | | at 6/30/13 | | |
| |
Janus Global Allocation Fund – Moderate(2) | | | | | | | | | | | | | | | | | | | | | | | |
| INTECH International Fund – Class I Shares | | 1,343,165 | | $ | 10,655,856 | | | (379,211) | | $ | (3,025,479) | | | $ | (169,689) | | $ | 310,288 | | $ | 22,114,302 | | |
| INTECH U.S. Growth Fund – Class I Shares | | 80,249 | | | 1,249,079 | | | (684,597) | | | (9,114,416) | | | | 1,941,306 | | | 272,772 | | | 12,000,991 | | |
| INTECH U.S. Value Fund – Class I Shares | | 184,189 | | | 2,107,758 | | | (1,083,502) | | | (11,144,282) | | | | 1,819,321 | | | 570,529 | | | 22,533,114 | | |
| Janus Contrarian Fund – Class I Shares | | 176,139 | | | 2,972,748 | | | (4,147) | | | (61,711) | | | | 10,177 | | | – | | | 3,016,016 | | |
| Janus Diversified Alternatives Fund – Class N Shares | | 2,676,063 | | | 26,754,734 | | | (65,341) | | | (653,474) | | | | (6,480) | | | – | | | 25,689,514 | | |
| Janus Emerging Markets Fund – Class I Shares | | 540,483 | | | 4,585,965 | | | (34,238) | | | (299,958) | | | | (17,819) | | | 7,391 | | | 5,227,379 | | |
| Janus Flexible Bond Fund – Class N Shares | | 722,098 | | | 7,845,302 | | | (9,079,781) | | | (91,165,594) | | | | 6,886,126 | | | 3,028,562 | | | – | | |
| Janus Forty Fund – Class N Shares | | – | | | – | | | – | | | – | | | | – | | | – | | | 45,135 | | |
| Janus Fund – Class N Shares | | 12,535 | | | 415,497 | | | (40,257) | | | (1,055,835) | | | | 289,548 | | | 65,807 | | | 5,942,738 | | |
| Janus Global Bond Fund – Class I Shares | | 8,727,810 | | | 89,789,237 | | | (212,303) | | | (2,198,476) | | | | (41,830) | | | 633,702 | | | 84,740,612 | | |
| Janus Global Life Sciences Fund – Class I Shares | | – | | | – | | | (10,329) | | | (221,127) | | | | 148,740 | | | – | | | – | | |
| Janus Global Real Estate Fund – Class I Shares | | 48,299 | | | 505,636 | | | (44,574) | | | (412,983) | | | | 45,555 | | | 160,197 | | | 5,586,593 | | |
Janus Global Research Fund(1) – Class I Shares | | 178,945 | | | 8,932,859 | | | (11,153) | | | (564,232) | | | | (3,054) | | | 29,276 | | | 8,705,012 | | |
| Janus Global Select Fund – Class I Shares | | 522,633 | | | 5,625,835 | | | (38,025) | | | (295,277) | | | | 107,312 | | | 2,380 | | | 6,234,535 | | |
| Janus Global Technology Fund – Class I Shares | | – | | | – | | | (16,600) | | | (296,189) | | | | 52,253 | | | – | | | – | | |
| Janus High-Yield Fund – Class N Shares | | 9,455 | | | 87,274 | | | (197,396) | | | (1,489,309) | | | | 369,135 | | | 87,906 | | | 82,377 | | |
| Janus International Equity Fund – Class N Shares | | 1,059,114 | | | 12,435,654 | | | (352,436) | | | (4,148,301) | | | | (223,722) | | | 312,076 | | | 35,247,530 | | |
| Janus Overseas Fund – Class N Shares | | 59,342 | | | 1,991,101 | | | (79,169) | | | (3,089,990) | | | | (429,875) | | | 459,942 | | | 11,872,864 | | |
| Janus Research Fund – Class N Shares | | 12,225 | | | 403,379 | | | (415,080) | | | (9,512,698) | | | | 4,829,962 | | | 107,325 | | | 42,450 | | |
| Janus Short-Term Bond Fund – Class N Shares | | 335,134 | | | 1,034,040 | | | (2,139,752) | | | (6,587,839) | | | | 5,827 | | | 261,032 | | | 8,823,104 | | |
| Janus Triton Fund – Class N Shares | | 37,766 | | | 712,990 | | | (24,374) | | | (426,231) | | | | 33,234 | | | 76,194 | | | 6,155,078 | | |
| Janus Twenty Fund – Class D Shares | | 6,159 | | | 396,384 | | | (12,066) | | | (764,094) | | | | 6,420 | | | 48,144 | | | 5,979,642 | | |
| Perkins Global Value Fund – Class N Shares | | – | | | – | | | – | | | – | | | | – | | | – | | | 530,270 | | |
| Perkins Large Cap Value Fund – Class N Shares | | 158,683 | | | 2,280,642 | | | (1,128,314) | | | (14,711,969) | | | | 2,277,692 | | | 445,624 | | | 14,984,545 | | |
| Perkins Mid Cap Value Fund – Class N Shares | | – | | | – | | | – | | | – | | | | – | | | – | | | 63,395 | | |
| Perkins Small Cap Value Fund – Class N Shares | | 30,043 | | | 658,386 | | | (38,200) | | | (809,886) | | | | 57,134 | | | 87,328 | | | 5,941,028 | | |
| |
| |
| | | | | $ | 181,440,356 | | | | | $ | (162,049,350) | | | $ | 17,987,273 | | $ | 6,966,475 | | $ | 291,558,224 | | |
| |
| |
| | |
| (1) | | Effective March 15, 2013, Janus Global Research Fund merged with and into Janus Worldwide Fund. Following the merger, Janus Worldwide Fund was renamed Janus Global Research Fund. |
| (2) | | Effective April 5, 2013, Janus World Allocation Fund merged with and into Janus Global Allocation Fund – Moderate. |
Janus Asset Allocation Funds | 27
Notes to Schedules of Investments and Other Information (continued)
The following is a summary of the inputs that were used to value the Funds’ investments in securities and other financial instruments as of June 30, 2013. See Notes to Financial Statements for more information.
Valuation Inputs Summary (as of June 30, 2013)
| | | | | | | | | | | | |
| | | | | Level 2 – Other Significant
| | Level 3 – Significant
| | |
| | | Level 1 – Quoted Prices | | Observable Inputs | | Unobservable Inputs | | |
| |
Investments in Securities: | | | | | | | | | | | |
| Janus Global Allocation Fund – Conservative | | | | | | | | | | | |
| Mutual Funds | | | | | | | | | | | |
Alternative Funds | | $ | – | | $ | 16,501,938 | | $ | – | | |
Equity Funds | | | – | | | 109,122,745 | | | – | | |
Fixed Income Funds | | | – | | | 151,180,556 | | | – | | |
| | | | | | | | | | | | |
| Total Investments in Securities | | $ | – | | $ | 276,805,239 | | $ | – | | |
| |
| |
Investments in Securities: | | | | | | | | | | | |
| Janus Global Allocation Fund – Growth | | | | | | | | | | | |
| Mutual Funds | | | | | | | | | | | |
Alternative Funds | | $ | – | | $ | 21,253,910 | | $ | – | | |
Equity Funds | | | – | | | 183,049,263 | | | – | | |
Fixed Income Fund | | | – | | | 37,312,813 | | | – | | |
| | | | | | | | | | | | |
| Total Investments in Securities | | $ | – | | $ | 241,615,986 | | $ | – | | |
| |
| |
Investments in Securities: | | | | | | | | | | | |
| Janus Global Allocation Fund – Moderate | | | | | | | | | | | |
| Mutual Funds | | | | | | | | | | | |
Alternative Funds | | $ | – | | $ | 31,276,107 | | $ | – | | |
Equity Funds | | | – | | | 166,636,024 | | | – | | |
Fixed Income Funds | | | – | | | 93,646,093 | | | – | | |
| | | | | | | | | | | | |
| Total Investments in Securities | | $ | – | | $ | 291,558,224 | | $ | – | | |
| |
| |
28 | JUNE 30, 2013
Statements of Assets and Liabilities
| | | | | | | | | | | | | |
As of June 30, 2013
| | Janus Global
| | Janus Global
| | Janus Global
|
| (all numbers in thousands except net asset value per share) | | Allocation Fund - Conservative | | Allocation Fund - Growth | | Allocation Fund - Moderate |
|
| |
| Assets: | | | | | | | | | | | | |
| Investments at cost | | $ | 261,794 | | | $ | 208,258 | | | $ | 263,109 | |
| Affiliated investments at value | | | 276,805 | | | | 241,616 | | | | 291,558 | |
| Cash | | | – | | | | – | | | | – | |
| Receivables: | | | | | | | | | | | | |
| Investments sold | | | 62 | | | | – | | | | 420 | |
| Fund shares sold | | | 220 | | | | 441 | | | | 63 | |
| Dividends | | | 311 | | | | 80 | | | | 192 | |
| Non-interested Trustees’ deferred compensation | | | 5 | | | | 4 | | | | 5 | |
| Other assets | | | 2 | | | | 1 | | | | 1 | |
| Total Assets | | | 277,405 | | | | 242,142 | | | | 292,239 | |
| Liabilities: | | | | | | | | | | | | |
| Payables: | | | | | | | | | | | | |
| Due to custodian | | | – | | | | – | | | | – | |
| Investments purchased | | | 311 | | | | 355 | | | | 192 | |
| Fund shares repurchased | | | 208 | | | | 126 | | | | 444 | |
| Advisory fees | | | 12 | | | | 10 | | | | 10 | |
| Fund administration fees | | | – | | | | – | | | | – | |
| Internal servicing cost | | | 1 | | | | – | | | | – | |
| Administrative services fees | | | 27 | | | | 25 | | | | 29 | |
| Distribution fees and shareholder servicing fees | | | 18 | | | | 5 | | | | 10 | |
| Administrative, networking and omnibus fees | | | 2 | | | | 1 | | | | 2 | |
| Non-interested Trustees’ fees and expenses | | | 2 | | | | 2 | | | | 2 | |
| Non-interested Trustees’ deferred compensation fees | | | 5 | | | | 4 | | | | 5 | |
| Accrued expenses and other payables | | | 37 | | | | 68 | | | | 105 | |
| Total Liabilities | | | 623 | | | | 596 | | | | 799 | |
| Net Assets | | $ | 276,782 | | | $ | 241,546 | | | $ | 291,440 | |
See footnotes at the end of the Statements.
See Notes to Financial Statements.
Janus Asset Allocation Funds | 29
Statements of Assets and Liabilities (continued)
| | | | | | | | | | | | | |
As of June 30, 2013
| | Janus Global
| | Janus Global
| | Janus Global
|
| (all numbers in thousands except net asset value per share) | | Allocation Fund - Conservative | | Allocation Fund - Growth | | Allocation Fund - Moderate |
|
| |
| Net Assets Consist of: | | | | | | | | | | | | |
| Capital (par value and paid-in surplus)* | | $ | 246,229 | | | $ | 210,634 | | | $ | 264,839 | |
| Undistributed net investment income* | | | 1,851 | | | | 244 | | | | 725 | |
| Undistributed net realized gain/(loss) from investment* | | | 13,690 | | | | (2,690) | | | | (1,832) | |
| Unrealized net appreciation of investments and non-interested Trustees’ deferred compensation | | | 15,012 | | | | 33,358 | | | | 27,708 | |
| Total Net Assets | | $ | 276,782 | | | $ | 241,546 | | | $ | 291,440 | |
| Net Assets - Class A Shares | | $ | 11,399 | | | $ | 3,182 | | | $ | 8,913 | |
| Shares Outstanding, $0.01 Par Value (unlimited shares authorized) | | | 881 | | | | 241 | | | | 709 | |
Net Asset Value Per Share(1) | | $ | 12.93 | | | $ | 13.19 | | | $ | 12.58 | |
Maximum Offering Price Per Share(2) | | $ | 13.72 | | | $ | 13.99 | | | $ | 13.35 | |
| Net Assets - Class C Shares | | $ | 18,294 | | | $ | 4,325 | | | $ | 9,480 | |
| Shares Outstanding, $0.01 Par Value (unlimited shares authorized) | | | 1,437 | | | | 333 | | | | 765 | |
Net Asset Value Per Share(1) | | $ | 12.73 | | | $ | 13.00 | | | $ | 12.40 | |
| Net Assets - Class D Shares | | $ | 218,190 | | | $ | 215,671 | | | $ | 247,153 | |
| Shares Outstanding, $0.01 Par Value (unlimited shares authorized) | | | 16,777 | | | | 16,265 | | | | 19,564 | |
| Net Asset Value Per Share | | $ | 13.00 | | | $ | 13.26 | | | $ | 12.63 | |
| Net Assets - Class I Shares | | $ | 3,319 | | | $ | 4,648 | | | $ | 5,441 | |
| Shares Outstanding, $0.01 Par Value (unlimited shares authorized) | | | 255 | | | | 350 | | | | 431 | |
| Net Asset Value Per Share | | $ | 13.01 | | | $ | 13.27 | | | $ | 12.63 | |
| Net Assets - Class S Shares | | $ | 1,357 | | | $ | 1,785 | | | $ | 3,139 | |
| Shares Outstanding, $0.01 Par Value (unlimited shares authorized) | | | 105 | | | | 136 | | | | 251 | |
| Net Asset Value Per Share | | $ | 12.91 | | | $ | 13.13 | | | $ | 12.49 | |
| Net Assets - Class T Shares | | $ | 24,223 | | | $ | 11,935 | | | $ | 17,314 | |
| Shares Outstanding, $0.01 Par Value (unlimited shares authorized) | | | 1,864 | | | | 901 | | | | 1,373 | |
| Net Asset Value Per Share | | $ | 13.00 | | | $ | 13.25 | | | $ | 12.61 | |
| | | |
| * | | See Note 3 in Notes to Financial Statements. |
| (1) | | Redemption price per share may be reduced for any applicable contingent deferred sales charge. |
| (2) | | Maximum offering price is computed at 100/94.25 of net asset value. |
See Notes to Financial Statements.
30 | JUNE 30, 2013
Statements of Operations
| | | | | | | | | | | | | |
For the year ended June 30, 2013
| | Janus Global
| | Janus Global
| | Janus Global
|
| (all numbers in thousands) | | Allocation Fund - Conservative | | Allocation Fund - Growth | | Allocation Fund - Moderate |
|
| |
| Investment Income: | | | | | | | | | | | | |
| Dividends from affiliates | | $ | 8,084 | | | $ | 5,212 | | | $ | 6,966 | |
| Total Investment Income | | | 8,084 | | | | 5,212 | | | | 6,966 | |
| Expenses: | | | | | | | | | | | | |
| Advisory fees | | | 137 | | | | 120 | | | | 140 | |
| Internal servicing expense - Class A Shares | | | 1 | | | | 1 | | | | 1 | |
| Internal servicing expense - Class C Shares | | | 5 | | | | 2 | | | | 3 | |
| Internal servicing expense - Class I Shares | | | – | | | | – | | | | – | |
| Shareholder reports expense | | | 53 | | | | 77 | | | | 64 | |
| Transfer agent fees and expenses | | | 35 | | | | 58 | | | | 46 | |
| Registration fees | | | 62 | | | | 61 | | | | 53 | |
| Professional fees | | | 42 | | | | 40 | | | | 34 | |
| Non-interested Trustees’ fees and expenses | | | 8 | | | | 5 | | | | 8 | |
| Administrative services fees - Class D Shares | | | 258 | | | | 256 | | | | 290 | |
| Administrative services fees - Class S Shares | | | 3 | | | | 5 | | | | 6 | |
| Administrative services fees - Class T Shares | | | 69 | | | | 34 | | | | 40 | |
| Distribution fees and shareholder servicing fees - Class A Shares | | | 26 | | | | 7 | | | | 17 | |
| Distribution fees and shareholder servicing fees - Class C Shares | | | 166 | | | | 41 | | | | 84 | |
| Distribution fees and shareholder servicing fees - Class S Shares | | | 3 | | | | 4 | | | | 6 | |
| Administrative, networking and omnibus fees - Class A Shares | | | 6 | | | | 1 | | | | 4 | |
| Administrative, networking and omnibus fees - Class C Shares | | | 10 | | | | 3 | | | | 4 | |
| Administrative, networking and omnibus fees - Class I Shares | | | 3 | | | | 4 | | | | 4 | |
| Other expenses | | | 7 | | | | 5 | | | | 6 | |
| Total Expenses | | | 894 | | | | 724 | | | | 810 | |
| Expense and Fee Offset | | | – | | | | – | | | | – | |
| Less: Excess Expense Reimbursement | | | (28) | | | | (8) | | | | (8) | |
| Net Expenses after Waivers and Expense Offsets | | | 866 | | | | 716 | | | | 802 | |
| Net Investment Income | | | 7,218 | | | | 4,496 | | | | 6,164 | |
| Net Realized and Unrealized Gain/(Loss) on Investments: | | | | | | | | | | | | |
| Net realized gain from investment(1) | | | 14,627 | | | | 15,226 | | | | 17,987 | |
| Capital gain distributions from Underlying Funds | | | 2,008 | | | | 1,342 | | | | 1,763 | |
| Change in unrealized net appreciation/(depreciation) of investments and non-interested Trustees’ deferred compensation | | | (4,544) | | | | 10,600 | | | | 2,010 | |
| Net Gain on Investments | | | 12,091 | | | | 27,168 | | | | 21,760 | |
| Net Increase in Net Assets Resulting from Operations | | $ | 19,309 | | | $ | 31,664 | | | $ | 27,924 | |
| | | |
| (1) | | Includes realized gain/(loss) from affiliates. See affiliates table in Notes to Schedules of Investments and Other Information. |
See Notes to Financial Statements.
Janus Asset Allocation Funds | 31
Statements of Changes in Net Assets
| | | | | | | | | | | | | | | | | | | | | | | | | |
| | | Janus Global
| | Janus Global
| | Janus Global
|
For the years ended June 30
| | Allocation Fund - Conservative | | Allocation Fund - Growth | | Allocation Fund - Moderate |
| (all numbers in thousands) | | 2013 | | 2012 | | 2013 | | 2012 | | 2013 | | 2012 |
|
| |
| Operations: | | | | | | | | | | | | | | | | | | | | | | | | |
| Net investment income | | $ | 7,218 | | | $ | 5,714 | | | $ | 4,496 | | | $ | 3,444 | | | $ | 6,164 | | | $ | 5,451 | |
Net realized gain/(loss) from investment(1) | | | 14,627 | | | | (534) | | | | 15,226 | | | | (2,155) | | | | 17,987 | | | | (1,410) | |
| Capital gain distributions from Underlying Funds | | | 2,008 | | | | 2,458 | | | | 1,342 | | | | 4,609 | | | | 1,763 | | | | 4,150 | |
| Change in unrealized net appreciation/(depreciation) of investments and non-interested Trustees’ deferred compensation | | | (4,544) | | | | (140) | | | | 10,600 | | | | (15,875) | | | | 2,010 | | | | (9,409) | |
| Net Increase/(Decrease) in Net Assets Resulting from Operations | | | 19,309 | | | | 7,498 | | | | 31,664 | | | | (9,977) | | | | 27,924 | | | | (1,218) | |
| Dividends and Distributions to Shareholders: | | | | | | | | | | | | | | | | | | | | | | | | |
| Net Investment Income* | | | | | | | | | | | | | | | | | | | | | | | | |
| Class A Shares | | | (270) | | | | (183) | | | | (51) | | | | (43) | | | | (150) | | | | (133) | |
| Class C Shares | | | (318) | | | | (298) | | | | (43) | | | | (46) | | | | (112) | | | | (174) | |
| Class D Shares | | | (5,926) | | | | (5,317) | | | | (4,203) | | | | (3,561) | | | | (6,026) | | | | (5,406) | |
| Class I Shares | | | (81) | | | | (66) | | | | (91) | | | | (35) | | | | (152) | | | | (118) | |
| Class S Shares | | | (33) | | | | (28) | | | | (31) | | | | (18) | | | | (55) | | | | (27) | |
| Class T Shares | | | (868) | | | | (524) | | | | (262) | | | | (212) | | | | (383) | | | | (477) | |
| Net Realized Gain/(Loss) from Investment Transactions* | | | | | | | | | | | | | | | | | | | | | | | | |
| Class A Shares | | | – | | | | – | | | | – | | | | – | | | | (317) | | | | – | |
| Class C Shares | | | – | | | | – | | | | – | | | | – | | | | (376) | | | | – | |
| Class D Shares | | | – | | | | – | | | | – | | | | – | | | | (11,417) | | | | – | |
| Class I Shares | | | – | | | | – | | | | – | | | | – | | | | (220) | | | | – | |
| Class S Shares | | | – | | | | – | | | | – | | | | – | | | | (123) | | | | – | |
| Class T Shares | | | – | | | | – | | | | – | | | | – | | | | (732) | | | | – | |
| Net Decrease from Dividends and Distributions | | | (7,496) | | | | (6,416) | | | | (4,681) | | | | (3,915) | | | | (20,063) | | | | (6,335) | |
| Capital Share Transactions: | | | | | | | | | | | | | | | | | | | | | | | | |
| Shares Sold | | | | | | | | | | | | | | | | | | | | | | | | |
| Class A Shares | | | 5,272 | | | | 6,406 | | | | 920 | | | | 1,167 | | | | 2,550 | | | | 2,109 | |
| Class C Shares | | | 6,403 | | | | 7,981 | | | | 1,004 | | | | 1,687 | | | | 1,246 | | | | 2,894 | |
| Class D Shares | | | 53,264 | | | | 61,300 | | | | 21,406 | | | | 27,648 | | | | 37,208 | | | | 39,525 | |
| Class I Shares | | | 3,107 | | | | 1,312 | | | | 1,798 | | | | 2,180 | | | | 2,511 | | | | 3,738 | |
| Class S Shares | | | 506 | | | | 815 | | | | 956 | | | | 1,088 | | | | 1,380 | | | | 1,490 | |
| Class T Shares | | | 14,117 | | | | 24,827 | | | | 6,336 | | | | 5,523 | | | | 8,571 | | | | 7,634 | |
| Shares Issued in Connection with Acquisition (Note 6) | | | | | | | | | | | | | | | | | | | | | | | | |
| Class A Shares | | | N/A | | | | N/A | | | | N/A | | | | N/A | | | | 1,817 | | | | N/A | |
| Class C Shares | | | N/A | | | | N/A | | | | N/A | | | | N/A | | | | 1,837 | | | | N/A | |
| Class I Shares | | | N/A | | | | N/A | | | | N/A | | | | N/A | | | | 673 | | | | N/A | |
| Class S Shares | | | N/A | | | | N/A | | | | N/A | | | | N/A | | | | 137 | | | | N/A | |
| Class T Shares | | | N/A | | | | N/A | | | | N/A | | | | N/A | | | | 530 | | | | N/A | |
See footnotes at the end of the Statements.
See Notes to Financial Statements.
32 | JUNE 30, 2013
This page intentionally left blank. The content of this page is part of a ‘Double Page Spread’ table and appears on the previous page.
33
Statements of Changes in Net Assets (continued)
| | | | | | | | | | | | | | | | | | | | | | | | | |
| | | Janus Global
| | Janus Global
| | Janus Global
|
For the years ended June 30
| | Allocation Fund - Conservative | | Allocation Fund - Growth | | Allocation Fund - Moderate |
| (all numbers in thousands) | | 2013 | | 2012 | | 2013 | | 2012 | | 2013 | | 2012 |
|
| |
| Reinvested Dividends and Distributions | | | | | | | | | | | | | | | | | | | | | | | | |
| Class A Shares | | | 248 | | | | 166 | | | | 50 | | | | 43 | | | | 454 | | | | 124 | |
| Class C Shares | | | 263 | | | | 252 | | | | 41 | | | | 44 | | | | 458 | | | | 158 | |
| Class D Shares | | | 5,879 | | | | 5,284 | | | | 4,165 | | | | 3,532 | | | | 17,310 | | | | 5,361 | |
| Class I Shares | | | 70 | | | | 61 | | | | 85 | | | | 33 | | | | 366 | | | | 116 | |
| Class S Shares | | | 33 | | | | 27 | | | | 31 | | | | 18 | | | | 178 | | | | 27 | |
| Class T Shares | | | 634 | | | | 480 | | | | 253 | | | | 207 | | | | 1,097 | | | | 468 | |
| Shares Repurchased | | | | | | | | | | | | | | | | | | | | | | | | |
| Class A Shares | | | (2,575) | | | | (3,419) | | | | (788) | | | | (1,138) | | | | (1,760) | | | | (1,880) | |
| Class C Shares | | | (2,981) | | | | (2,155) | | | | (960) | | | | (504) | | | | (2,703) | | | | (1,980) | |
| Class D Shares | | | (47,465) | | | | (47,129) | | | | (38,953) | | | | (40,574) | | | | (42,540) | | | | (47,737) | |
| Class I Shares | | | (2,334) | | | | (1,523) | | | | (1,356) | | | | (777) | | | | (3,988) | | | | (2,633) | |
| Class S Shares | | | (403) | | | | (221) | | | | (1,024) | | | | (198) | | | | (187) | | | | (357) | |
| Class T Shares | | | (20,137) | | | | (13,795) | | | | (9,234) | | | | (4,457) | | | | (8,984) | | | | (12,366) | |
| Net Increase/(Decrease) from Capital Share Transactions | | | 13,901 | | | | 40,669 | | | | (15,270) | | | | (4,478) | | | | 18,161 | | | | (3,309) | |
| Net Increase/(Decrease) in Net Assets | | | 25,714 | | | | 41,751 | | | | 11,713 | | | | (18,370) | | | | 26,022 | | | | (10,862) | |
| Net Assets: | | | | | | | | | | | | | | | | | | | | | | | | |
| Beginning of period | | | 251,068 | | | | 209,317 | | | | 229,833 | | | | 248,203 | | | | 265,418 | | | | 276,280 | |
| End of period | | $ | 276,782 | | | $ | 251,068 | | | $ | 241,546 | | | $ | 229,833 | | | $ | 291,440 | | | $ | 265,418 | |
| | | | | | | | | | | | | | | | | | | | | | | | | |
| Undistributed Net Investment Income* | | $ | 1,851 | | | $ | 2,129 | | | $ | 244 | | | $ | 428 | | | $ | 725 | | | $ | 1,440 | |
| | | |
| * | | See Note 3 in Notes to Financial Statements. |
| (1) | | Includes realized gain/(loss) from affiliates. See affiliates table in Notes to Schedules of Investments and Other Information. |
| | | |
| | | |
See Notes to Financial Statements.
34 | JUNE 30, 2013
This page intentionally left blank. The content of this page is part of a ‘Double Page Spread’ table and appears on the previous page.
35
Financial Highlights
Class A Shares
| | | | | | | | | | | | | | | | | | | | | | | |
For a share outstanding during each year or period ended June 30 and the
| | Janus Global Allocation Fund - Conservative |
| period ended October 31, 2009 | | 2013 | | 2012 | | 2011 | | 2010(1) | | 2009(2) | | |
| |
| Net Asset Value, Beginning of Period | | | $12.37 | | | | $12.38 | | | | $11.24 | | | | $11.08 | | | | $10.13 | | | |
| Income from Investment Operations: | | | | | | | | | | | | | | | | | | | | | | |
| Net investment income | | | 0.33 | | | | 0.29 | | | | 0.47 | | | | 0.33 | | | | 0.02 | | | |
| Net gain/(loss) on investments (both realized and unrealized) | | | 0.57 | | | | 0.05 | | | | 1.10 | | | | 0.20 | | | | 0.93 | | | |
| Total from Investment Operations | | | 0.90 | | | | 0.34 | | | | 1.57 | | | | 0.53 | | | | 0.95 | | | |
| Less Distributions: | | | | | | | | | | | | | | | | | | | | | | |
| Dividends (from net investment income)* | | | (0.34) | | | | (0.35) | | | | (0.43) | | | | (0.37) | | | | – | | | |
| Distributions (from capital gains)* | | | – | | | | – | | | | – | | | | – | | | | – | | | |
| Total Distributions | | | (0.34) | | | | (0.35) | | | | (0.43) | | | | (0.37) | | | | – | | | |
| Net Asset Value, End of Period | | | $12.93 | | | | $12.37 | | | | $12.38 | | | | $11.24 | | | | $11.08 | | | |
| Total Return** | | | 7.36% | | | | 2.91% | | | | 14.08% | | | | 4.75% | | | | 9.38% | | | |
| Net Assets, End of Period (in thousands) | | | $11,399 | | | | $8,064 | | | | $4,804 | | | | $1,173 | | | | $235 | | | |
| Average Net Assets for the Period (in thousands) | | | $10,187 | | | | $6,495 | | | | $2,950 | | | | $710 | | | | $41 | | | |
Ratio of Gross Expenses (Absent the Waiver of Certain Fees and Expense Offsets) to Average Net Assets***(3) | | | 0.43% | | | | 0.44% | | | | 0.38% | | | | 0.39% | | | | 0.45% | | | |
Ratio of Net Expenses (After Waivers and Expense Offsets) to Average Net Assets***(3) | | | 0.43% | | | | 0.44% | | | | 0.38% | | | | 0.39% | | | | 0.37% | | | |
Ratio of Net Investment Income to Average Net Assets***(3) | | | 2.51% | | | | 2.36% | | | | 3.79% | | | | 2.67% | | | | 2.70% | | | |
| Portfolio Turnover Rate | | | 69% | | | | 10% | | | | 12% | | | | 12%^ | | | | 21% | | | |
Class A Shares
| | | | | | | | | | | | | | | | | | | | | | | |
For a share outstanding during each year or period ended June 30 and the
| | Janus Global Allocation Fund - Growth |
| period ended October 31, 2009 | | 2013 | | 2012 | | 2011 | | 2010(1) | | 2009(2) | | |
| |
| Net Asset Value, Beginning of Period | | | $11.78 | | | | $12.49 | | | | $10.47 | | | | $10.35 | | | | $9.16 | | | |
| Income from Investment Operations: | | | | | | | | | | | | | | | | | | | | | | |
| Net investment income | | | 0.23 | | | | 0.16 | | | | 0.19 | | | | 0.17 | | | | 0.01 | | | |
| Net gain/(loss) on investments (both realized and unrealized) | | | 1.41 | | | | (0.68) | | | | 2.04 | | | | 0.14 | | | | 1.18 | | | |
| Total from Investment Operations | | | 1.64 | | | | (0.52) | | | | 2.23 | | | | 0.31 | | | | 1.19 | | | |
| Less Distributions: | | | | | | | | | | | | | | | | | | | | | | |
| Dividends (from net investment income)* | | | (0.23) | | | | (0.19) | | | | (0.21) | | | | (0.19) | | | | – | | | |
| Distributions (from capital gains)* | | | – | | | | – | | | | – | | | | – | | | | – | | | |
| Total Distributions | | | (0.23) | | | | (0.19) | | | | (0.21) | | | | (0.19) | | | | – | | | |
| Net Asset Value, End of Period | | | $13.19 | | | | $11.78 | | | | $12.49 | | | | $10.47 | | | | $10.35 | | | |
| Total Return** | | | 14.08% | | | | (4.04)% | | | | 21.38% | | | | 2.96% | | | | 12.99% | | | |
| Net Assets, End of Period (in thousands) | | | $3,182 | | | | $2,683 | | | | $2,768 | | | | $628 | | | | $149 | | | |
| Average Net Assets for the Period (in thousands) | | | $2,912 | | | | $2,684 | | | | $1,640 | | | | $343 | | | | $99 | | | |
Ratio of Gross Expenses (Absent the Waiver of Certain Fees and Expense Offsets) to Average Net Assets***(3) | | | 0.41% | | | | 0.48% | | | | 0.44% | | | | 0.39% | | | | 0.50% | | | |
Ratio of Net Expenses (After Waivers and Expense Offsets) to Average Net Assets***(3) | | | 0.41% | | | | 0.48% | | | | 0.44% | | | | 0.37% | | | | 0.47% | | | |
Ratio of Net Investment Income to Average Net Assets***(3) | | | 1.72% | | | | 1.34% | | | | 1.61% | | | | 0.92% | | | | 0.56% | | | |
| Portfolio Turnover Rate | | | 45% | | | | 18% | | | | 26% | | | | 13%^ | | | | 23% | | | |
| | | |
| * | | See Note 3 in Notes to Financial Statements. |
| ** | | Total return not annualized for periods of less than one full year. |
| *** | | Annualized for periods of less than one full year. |
| ^ | | Rate has been adjusted to conform with current year presentation. |
| (1) | | Period from November 1, 2009 through June 30, 2010. The Fund changed its fiscal year end from October 31 to June 30. |
| (2) | | Period from July 6, 2009 (inception date) through October 31, 2009. |
| (3) | | Ratios do not include expenses of the underlying funds and/or investment companies in which the Fund invests. |
See Notes to Financial Statements.
36 | JUNE 30, 2013
Class A Shares
| | | | | | | | | | | | | | | | | | | | | | | |
For a share outstanding during each year or period ended June 30 and the
| | Janus Global Allocation Fund - Moderate(1) |
| period ended October 31, 2009 | | 2013 | | 2012 | | 2011 | | 2010(2) | | 2009(3) | | |
| |
| Net Asset Value, Beginning of Period | | | $12.21 | | | | $12.57 | | | | $10.95 | | | | $10.80 | | | | $9.68 | | | |
| Income from Investment Operations: | | | | | | | | | | | | | | | | | | | | | | |
| Net investment income | | | 0.32 | | | | 0.24 | | | | 0.34 | | | | 0.18 | | | | 0.02 | | | |
| Net gain/(loss) on investments (both realized and unrealized) | | | 0.97 | | | | (0.31) | | | | 1.58 | | | | 0.24 | | | | 1.10 | | | |
| Total from Investment Operations | | | 1.29 | | | | (0.07) | | | | 1.92 | | | | 0.42 | | | | 1.12 | | | |
| Less Distributions: | | | | | | | | | | | | | | | | | | | | | | |
| Dividends (from net investment income)* | | | (0.31) | | | | (0.29) | | | | (0.30) | | | | (0.27) | | | | – | | | |
| Distributions (from capital gains)* | | | (0.61) | | | | – | | | | – | | | | – | | | | – | | | |
| Total Distributions | | | (0.92) | | | | (0.29) | | | | (0.30) | | | | (0.27) | | | | – | | | |
| Net Asset Value, End of Period | | | $12.58 | | | | $12.21 | | | | $12.57 | | | | $10.95 | | | | $10.80 | | | |
| Total Return** | | | 10.67% | | | | (0.41)% | | | | 17.59% | | | | 3.81% | | | | 11.57% | | | |
| Net Assets, End of Period (in thousands) | | | $8,913 | | | | $5,720 | | | | $5,498 | | | | $1,844 | | | | $1,145 | | | |
| Average Net Assets for the Period (in thousands) | | | $6,850 | | | | $5,484 | | | | $3,818 | | | | $1,676 | | | | $424 | | | |
Ratio of Gross Expenses (Absent the Waiver of Certain Fees and Expense Offsets) to Average Net Assets***(4) | | | 0.41% | | | | 0.42% | | | | 0.50% | | | | 0.40% | | | | 0.48% | | | |
Ratio of Net Expenses (After Waivers and Expense Offsets) to Average Net Assets***(4) | | | 0.41% | | | | 0.42% | | | | 0.50% | | | | 0.40% | | | | 0.44% | | | |
Ratio of Net Investment Income to Average Net Assets***(4) | | | 1.97% | | | | 1.98% | | | | 2.88% | | | | 1.82% | | | | 1.43% | | | |
| Portfolio Turnover Rate | | | 64% | | | | 18% | | | | 15% | | | | 11%^ | | | | 19% | | | |
| | | |
| * | | See Note 3 in Notes to Financial Statements. |
| ** | | Total return not annualized for periods of less than one full year. |
| *** | | Annualized for periods of less than one full year. |
| ^ | | Rate has been adjusted to conform with current year presentation. |
| (1) | | Effective April 5, 2013, Janus World Allocation Fund merged with and into Janus Global Allocation Fund -Moderate. See Note 6 in Notes to Financial Statements. |
| (2) | | Period from November 1, 2009 through June 30, 2010. The Fund changed its fiscal year end from October 31 to June 30. |
| (3) | | Period from July 6, 2009 (inception date) through October 31, 2009. |
| (4) | | Ratios do not include expenses of the underlying funds and/or investment companies in which the Fund invests. |
See Notes to Financial Statements.
Janus Asset Allocation Funds | 37
Financial Highlights (continued)
Class C Shares
| | | | | | | | | | | | | | | | | | | | | | | |
For a share outstanding during each year or period ended June 30 and the
| | Janus Global Allocation Fund - Conservative |
| period ended October 31, 2009 | | 2013 | | 2012 | | 2011 | | 2010(1) | | 2009(2) | | |
| |
| Net Asset Value, Beginning of Period | | | $12.19 | | | | $12.26 | | | | $11.17 | | | | $11.06 | | | | $10.13 | | | |
| Income from Investment Operations: | | | | | | | | | | | | | | | | | | | | | | |
| Net investment income | | | 0.25 | | | | 0.22 | | | | 0.40 | | | | 0.32 | | | | 0.01 | | | |
| Net gain/(loss) on investments (both realized and unrealized) | | | 0.55 | | | | 0.03 | | | | 1.07 | | | | 0.14 | | | | 0.92 | | | |
| Total from Investment Operations | | | 0.80 | | | | 0.25 | | | | 1.47 | | | | 0.46 | | | | 0.93 | | | |
| Less Distributions: | | | | | | | | | | | | | | | | | | | | | | |
| Dividends (from net investment income)* | | | (0.26) | | | | (0.32) | | | | (0.38) | | | | (0.35) | | | | – | | | |
| Distributions (from capital gains)* | | | – | | | | – | | | | – | | | | – | | | | – | | | |
| Total Distributions | | | (0.26) | | | | (0.32) | | | | (0.38) | | | | (0.35) | | | | – | | | |
| Net Asset Value, End of Period | | | $12.73 | | | | $12.19 | | | | $12.26 | | | | $11.17 | | | | $11.06 | | | |
| Total Return** | | | 6.57% | | | | 2.19% | | | | 13.25% | | | | 4.17% | | | | 9.18% | | | |
| Net Assets, End of Period (in thousands) | | | $18,294 | | | | $13,969 | | | | $7,808 | | | | $1,648 | | | | $253 | | | |
| Average Net Assets for the Period (in thousands) | | | $16,584 | | | | $11,010 | | | | $4,096 | | | | $953 | | | | $54 | | | |
Ratio of Gross Expenses (Absent the Waiver of Certain Fees and Expense Offsets) to Average Net Assets***(3) | | | 1.19% | | | | 1.19% | | | | 1.14% | | | | 1.14% | | | | 1.20% | | | |
Ratio of Net Expenses (After Waivers and Expense Offsets) to Average Net Assets***(3) | | | 1.19% | | | | 1.19% | | | | 1.14% | | | | 1.14% | | | | 1.13% | | | |
Ratio of Net Investment Income/(Loss) to Average Net Assets***(3) | | | 1.70% | | | | 1.65% | | | | 2.98% | | | | 1.81% | | | | 1.87% | | | |
| Portfolio Turnover Rate | | | 69% | | | | 10% | | | | 12% | | | | 12%^ | | | | 21% | | | |
Class C Shares
| | | | | | | | | | | | | | | | | | | | | | | |
For a share outstanding during each year or period ended June 30 and the
| | Janus Global Allocation Fund - Growth |
| period ended October 31, 2009 | | 2013 | | 2012 | | 2011 | | 2010(1) | | 2009(2) | | |
| |
| Net Asset Value, Beginning of Period | | | $11.60 | | | | $12.37 | | | | $10.40 | | | | $10.33 | | | | $9.16 | | | |
| Income from Investment Operations: | | | | | | | | | | | | | | | | | | | | | | |
| Net investment income | | | 0.12 | | | | 0.08 | | | | 0.16 | | | | 0.13 | | | | – | | | |
| Net gain/(loss) on investments (both realized and unrealized) | | | 1.41 | | | | (0.69) | | | | 1.96 | | | | 0.13 | | | | 1.17 | | | |
| Total from Investment Operations | | | 1.53 | | | | (0.61) | | | | 2.12 | | | | 0.26 | | | | 1.17 | | | |
| Less Distributions: | | | | | | | | | | | | | | | | | | | | | | |
| Dividends (from net investment income)* | | | (0.13) | | | | (0.16) | | | | (0.15) | | | | (0.19) | | | | – | | | |
| Distributions (from capital gains)* | | | – | | | | – | | | | – | | | | – | | | | – | | | |
| Total Distributions | | | (0.13) | | | | (0.16) | | | | (0.15) | | | | (0.19) | | | | – | | | |
| Net Asset Value, End of Period | | | $13.00 | | | | $11.60 | | | | $12.37 | | | | $10.40 | | | | $10.33 | | | |
| Total Return** | | | 13.30% | | | | (4.82)% | | | | 20.39% | | | | 2.41% | | | | 12.77% | | | |
| Net Assets, End of Period (in thousands) | | | $4,325 | | | | $3,791 | | | | $2,736 | | | | $706 | | | | $110 | | | |
| Average Net Assets for the Period (in thousands) | | | $4,126 | | | | $3,325 | | | | $1,446 | | | | $398 | | | | $20 | | | |
Ratio of Gross Expenses (Absent the Waiver of Certain Fees and Expense Offsets) to Average Net Assets***(3) | | | 1.21% | | | | 1.34% | | | | 1.21% | | | | 1.14% | | | | 1.37% | | | |
Ratio of Net Expenses (After Waivers and Expense Offsets) to Average Net Assets***(3) | | | 1.21% | | | | 1.34% | | | | 1.21% | | | | 1.13% | | | | 1.26% | | | |
Ratio of Net Investment Income/(Loss) to Average Net Assets***(3) | | | 0.93% | | | | 0.46% | | | | 0.51% | | | | 0.27% | | | | (0.18)% | | | |
| Portfolio Turnover Rate | | | 45% | | | | 18% | | | | 26% | | | | 13%^ | | | | 23% | | | |
| | | |
| * | | See Note 3 in Notes to Financial Statements. |
| ** | | Total return not annualized for periods of less than one full year. |
| *** | | Annualized for periods of less than one full year. |
| ^ | | Rate has been adjusted to conform with current year presentation. |
| (1) | | Period from November 1, 2009 through June 30, 2010. The Fund changed its fiscal year end from October 31 to June 30. |
| (2) | | Period from July 6, 2009 (inception date) through October 31, 2009. |
| (3) | | Ratios do not include expenses of the underlying funds and/or investment companies in which the Fund invests. |
See Notes to Financial Statements.
38 | JUNE 30, 2013
Class C Shares
| | | | | | | | | | | | | | | | | | | | | | | |
For a share outstanding during each year or period ended June 30 and the
| | Janus Global Allocation Fund - Moderate(1) |
| period ended October 31, 2009 | | 2013 | | 2012 | | 2011 | | 2010(2) | | 2009(3) | | |
| |
| Net Asset Value, Beginning of Period | | | $12.02 | | | | $12.46 | | | | $10.88 | | | | $10.77 | | | | $9.68 | | | |
| Income from Investment Operations: | | | | | | | | | | | | | | | | | | | | | | |
| Net investment income | | | 0.18 | | | | 0.15 | | | | 0.26 | | | | 0.21 | | | | 0.01 | | | |
| Net gain/(loss) on investments (both realized and unrealized) | | | 0.99 | | | | (0.32) | | | | 1.57 | | | | 0.15 | | | | 1.08 | | | |
| Total from Investment Operations | | | 1.17 | | | | (0.17) | | | | 1.83 | | | | 0.36 | | | | 1.09 | | | |
| Less Distributions: | | | | | | | | | | | | | | | | | | | | | | |
| Dividends (from net investment income)* | | | (0.18) | | | | (0.27) | | | | (0.25) | | | | (0.25) | | | | – | | | |
| Distributions (from capital gains)* | | | (0.61) | | | | – | | | | – | | | | – | | | | – | | | |
| Total Distributions | | | (0.79) | | | | (0.27) | | | | (0.25) | | | | (0.25) | | | | – | | | |
| Net Asset Value, End of Period | | | $12.40 | | | | $12.02 | | | | $12.46 | | | | $10.88 | | | | $10.77 | | | |
| Total Return** | | | 9.78% | | | | (1.27)% | | | | 16.86% | | | | 3.33% | | | | 11.26% | | | |
| Net Assets, End of Period (in thousands) | | | $9,480 | | | | $8,397 | | | | $7,572 | | | | $2,509 | | | | $406 | | | |
| Average Net Assets for the Period (in thousands) | | | $8,442 | | | | $7,945 | | | | $5,021 | | | | $1,469 | | | | $113 | | | |
Ratio of Gross Expenses (Absent the Waiver of Certain Fees and Expense Offsets) to Average Net Assets***(4) | | | 1.18% | | | | 1.26% | | | | 1.16% | | | | 1.16% | | | | 1.26% | | | |
Ratio of Net Expenses (After Waivers and Expense Offsets) to Average Net Assets***(4) | | | 1.18% | | | | 1.26% | | | | 1.16% | | | | 1.16% | | | | 1.20% | | | |
Ratio of Net Investment Income to Average Net Assets***(4) | | | 1.23% | | | | 1.10% | | | | 1.85% | | | | 0.87% | | | | 0.71% | | | |
| Portfolio Turnover Rate | | | 64% | | | | 18% | | | | 15% | | | | 11%^ | | | | 19% | | | |
| | | |
| * | | See Note 3 in Notes to Financial Statements. |
| ** | | Total return not annualized for periods of less than one full year. |
| *** | | Annualized for periods of less than one full year. |
| ^ | | Rate has been adjusted to conform with current year presentation. |
| (1) | | Effective April 5, 2013, Janus World Allocation Fund merged with and into Janus Global Allocation Fund -Moderate. See Note 6 in Notes to Financial Statements. |
| (2) | | Period from November 1, 2009 through June 30, 2010. The Fund changed its fiscal year end from October 31 to June 30. |
| (3) | | Period from July 6, 2009 (inception date) through October 31, 2009. |
| (4) | | Ratios do not include expenses of the underlying funds and/or investment companies in which the Fund invests. |
See Notes to Financial Statements.
Janus Asset Allocation Funds | 39
Financial Highlights (continued)
Class D Shares
| | | | | | | | | | | | | | | | | | | |
| | | Janus Global Allocation Fund - Conservative | | |
| For a share outstanding during each year or period ended June 30 | | 2013 | | 2012 | | 2011 | | 2010(1) | | |
| |
| Net Asset Value, Beginning of Period | | | $12.44 | | | | $12.43 | | | | $11.26 | | | | $11.13 | | | |
| Income from Investment Operations: | | | | | | | | | | | | | | | | | | |
| Net investment income | | | 0.35 | | | | 0.31 | | | | 0.48 | | | | 0.10 | | | |
| Net gain/(loss) on investments (both realized and unrealized) | | | 0.57 | | | | 0.06 | | | | 1.12 | | | | 0.03 | | | |
| Total from Investment Operations | | | 0.92 | | | | 0.37 | | | | 1.60 | | | | 0.13 | | | |
| Less Distributions: | | | | | | | | | | | | | | | | | | |
| Dividends (from net investment income)* | | | (0.36) | | | | (0.36) | | | | (0.43) | | | | – | | | |
| Distributions (from capital gains)* | | | – | | | | – | | | | – | | | | – | | | |
| Total Distributions | | | (0.36) | | | | (0.36) | | | | (0.43) | | | | – | | | |
| Net Asset Value, End of Period | | | $13.00 | | | | $12.44 | | | | $12.43 | | | | $11.26 | | | |
| Total Return** | | | 7.50% | | | | 3.14% | | | | 14.34% | | | | 1.17% | | | |
| Net Assets, End of Period (in thousands) | | | $218,190 | | | | $197,198 | | | | $177,032 | | | | $133,056 | | | |
| Average Net Assets for the Period (in thousands) | | | $215,079 | | | | $184,437 | | | | $158,291 | | | | $130,396 | | | |
Ratio of Gross Expenses (Absent the Waiver of Certain Fees and Expense Offsets) to Average Net Assets***(2) | | | 0.25% | | | | 0.24% | | | | 0.25% | | | | 0.24% | | | |
Ratio of Net Expenses (After Waivers and Expense Offsets) to Average Net Assets***(2) | | | 0.25% | | | | 0.24% | | | | 0.25% | | | | 0.24% | | | |
Ratio of Net Investment Income to Average Net Assets***(2) | | | 2.69% | | | | 2.59% | | | | 4.07% | | | | 2.40% | | | |
| Portfolio Turnover Rate | | | 69% | | | | 10% | | | | 12% | | | | 12%^ | | | |
Class D Shares
| | | | | | | | | | | | | | | | | | | |
| | | Janus Global Allocation Fund - Growth | | |
| For a share outstanding during each year or period ended June 30 | | 2013 | | 2012 | | 2011 | | 2010(1) | | |
| |
| Net Asset Value, Beginning of Period | | | $11.85 | | | | $12.54 | | | | $10.49 | | | | $10.66 | | | |
| Income from Investment Operations: | | | | | | | | | | | | | | | | | | |
| Net investment income | | | 0.25 | | | | 0.18 | | | | 0.21 | | | | 0.03 | | | |
| Net gain/(loss) on investments (both realized and unrealized) | | | 1.42 | | | | (0.67) | | | | 2.05 | | | | (0.20) | | | |
| Total from Investment Operations | | | 1.67 | | | | (0.49) | | | | 2.26 | | | | (0.17) | | | |
| Less Distributions: | | | | | | | | | | | | | | | | | | |
| Dividends (from net investment income)* | | | (0.26) | | | | (0.20) | | | | (0.21) | | | | – | | | |
| Distributions (from capital gains)* | | | – | | | | – | | | | – | | | | – | | | |
| Total Distributions | | | (0.26) | | | | (0.20) | | | | (0.21) | | | | – | | | |
| Net Asset Value, End of Period | | | $13.26 | | | | $11.85 | | | | $12.54 | | | | $10.49 | | | |
| Total Return** | | | 14.21% | | | | (3.77)% | | | | 21.56% | | | | (1.59)% | | | |
| Net Assets, End of Period (in thousands) | | | $215,671 | | | | $205,107 | | | | $227,179 | | | | $187,128 | | | |
| Average Net Assets for the Period (in thousands) | | | $213,579 | | | | $207,366 | | | | $214,398 | | | | $199,596 | | | |
Ratio of Gross Expenses (Absent the Waiver of Certain Fees and Expense Offsets) to Average Net Assets***(2) | | | 0.28% | | | | 0.28% | | | | 0.28% | | | | 0.27% | | | |
Ratio of Net Expenses (After Waivers and Expense Offsets) to Average Net Assets***(2) | | | 0.28% | | | | 0.28% | | | | 0.28% | | | | 0.27% | | | |
Ratio of Net Investment Income to Average Net Assets***(2) | | | 1.89% | | | | 1.52% | | | | 1.74% | | | | 0.71% | | | |
| Portfolio Turnover Rate | | | 45% | | | | 18% | | | | 26% | | | | 13%^ | | | |
| | | |
| * | | See Note 3 in Notes to Financial Statements. |
| ** | | Total return not annualized for periods of less than one full year. |
| *** | | Annualized for periods of less than one full year. |
| ^ | | Rate has been adjusted to conform with current year presentation. |
| (1) | | Period from February 16, 2010 (inception date) through June 30, 2010. |
| (2) | | Ratios do not include expenses of the underlying funds and/or investment companies in which the Fund invests. |
See Notes to Financial Statements.
40 | JUNE 30, 2013
Class D Shares
| | | | | | | | | | | | | | | | | | | |
| | | Janus Global Allocation Fund - Moderate(1) | | |
| For a share outstanding during each year or period ended June 30 | | 2013 | | 2012 | | 2011 | | 2010(2) | | |
| |
| Net Asset Value, Beginning of Period | | | $12.27 | | | | $12.62 | | | | $10.96 | | | | $10.98 | | | |
| Income from Investment Operations: | | | | | | | | | | | | | | | | | | |
| Net investment income | | | 0.30 | | | | 0.26 | | | | 0.34 | | | | 0.06 | | | |
| Net gain/(loss) on investments (both realized and unrealized) | | | 1.00 | | | | (0.31) | | | | 1.62 | | | | (0.08) | | | |
| Total from Investment Operations | | | 1.30 | | | | (0.05) | | | | 1.96 | | | | (0.02) | | | |
| Less Distributions: | | | | | | | | | | | | | | | | | | |
| Dividends (from net investment income)* | | | (0.33) | | | | (0.30) | | | | (0.30) | | | | – | | | |
| Distributions (from capital gains)* | | | (0.61) | | | | – | | | | – | | | | – | | | |
| Total Distributions | | | (0.94) | | | | (0.30) | | | | (0.30) | | | | – | | | |
| Net Asset Value, End of Period | | | $12.63 | | | | $12.27 | | | | $12.62 | | | | $10.96 | | | |
| Total Return** | | | 10.71% | | | | (0.27)% | | | | 18.00% | | | | (0.18)% | | | |
| Net Assets, End of Period (in thousands) | | | $247,153 | | | | $228,415 | | | | $238,030 | | | | $180,261 | | | |
| Average Net Assets for the Period (in thousands) | | | $241,398 | | | | $224,382 | | | | $216,280 | | | | $184,405 | | | |
Ratio of Gross Expenses (Absent the Waiver of Certain Fees and Expense Offsets) to Average Net Assets***(3) | | | 0.25% | | | | 0.26% | | | | 0.25% | | | | 0.27% | | | |
Ratio of Net Expenses (After Waivers and Expense Offsets) to Average Net Assets***(3) | | | 0.25% | | | | 0.26% | | | | 0.25% | | | | 0.27% | | | |
Ratio of Net Investment Income to Average Net Assets***(3) | | | 2.24% | | | | 2.10% | | | | 2.83% | | | | 1.43% | | | |
| Portfolio Turnover Rate | | | 64% | | | | 18% | | | | 15% | | | | 11%^ | | | |
| | | |
| * | | See Note 3 in Notes to Financial Statements. |
| ** | | Total return not annualized for periods of less than one full year. |
| *** | | Annualized for periods of less than one full year. |
| ^ | | Rate has been adjusted to conform with current year presentation. |
| (1) | | Effective April 5, 2013, Janus World Allocation Fund merged with and into Janus Global Allocation Fund -Moderate. See Note 6 in Notes to Financial Statements. |
| (2) | | Period from February 16, 2010 (inception date) through June 30, 2010. |
| (3) | | Ratios do not include expenses of the underlying funds and/or investment companies in which the Fund invests. |
See Notes to Financial Statements.
Janus Asset Allocation Funds | 41
Financial Highlights (continued)
Class I Shares
| | | | | | | | | | | | | | | | | | | | | | | |
For a share outstanding during each year or period ended June 30 and the
| | Janus Global Allocation Fund - Conservative |
| period ended October 31, 2009 | | 2013 | | 2012 | | 2011 | | 2010(1) | | 2009(2) | | |
| |
| Net Asset Value, Beginning of Period | | | $12.44 | | | | $12.42 | | | | $11.26 | | | | $11.10 | | | | $10.13 | | | |
| Income from Investment Operations: | | | | | | | | | | | | | | | | | | | | | | |
| Net investment income | | | 0.35 | | | | 0.33 | | | | 0.43 | | | | 0.43 | | | | 0.02 | | | |
| Net gain/(loss) on investments (both realized and unrealized) | | | 0.59 | | | | 0.05 | | | | 1.17 | | | | 0.10 | | | | 0.95 | | | |
| Total from Investment Operations | | | 0.94 | | | | 0.38 | | | | 1.60 | | | | 0.53 | | | | 0.97 | | | |
| Less Distributions: | | | | | | | | | | | | | | | | | | | | | | |
| Dividends (from net investment income)* | | | (0.37) | | | | (0.36) | | | | (0.44) | | | | (0.37) | | | | – | | | |
| Distributions (from capital gains)* | | | – | | | | – | | | | – | | | | – | | | | – | | | |
| Total Distributions | | | (0.37) | | | | (0.36) | | | | (0.44) | | | | (0.37) | | | | – | | | |
| Net Asset Value, End of Period | | | $13.01 | | | | $12.44 | | | | $12.42 | | | | $11.26 | | | | $11.10 | | | |
| Total Return** | | | 7.61% | | | | 3.22% | | | | 14.34% | | | | 4.78% | | | | 9.58% | | | |
| Net Assets, End of Period (in thousands) | | | $3,319 | | | | $2,354 | | | | $2,505 | | | | $545 | | | | $11 | | | |
| Average Net Assets for the Period (in thousands) | | | $2,902 | | | | $2,250 | | | | $1,411 | | | | $265 | | | | $2 | | | |
Ratio of Gross Expenses (Absent the Waiver of Certain Fees and Expense Offsets) to Average Net Assets***(3) | | | 0.20% | | | | 0.20% | | | | 0.18% | | | | 0.15% | | | | 0.20% | | | |
Ratio of Net Expenses (After Waivers and Expense Offsets) to Average Net Assets***(3) | | | 0.20% | | | | 0.20% | | | | 0.18% | | | | 0.14% | | | | 0.13% | | | |
Ratio of Net Investment Income to Average Net Assets***(3) | | | 2.72% | | | | 2.65% | | | | 3.84% | | | | 2.53% | | | | 2.98% | | | |
| Portfolio Turnover Rate | | | 69% | | | | 10% | | | | 12% | | | | 12%^ | | | | 21% | | | |
Class I Shares
| | | | | | | | | | | | | | | | | | | | | | | |
For a share outstanding during each year or period ended June 30 and the
| | Janus Global Allocation Fund - Growth |
| period ended October 31, 2009 | | 2013 | | 2012 | | 2011 | | 2010(1) | | 2009(2) | | |
| |
| Net Asset Value, Beginning of Period | | | $11.86 | | | | $12.53 | | | | $10.49 | | | | $10.37 | | | | $9.16 | | | |
| Income from Investment Operations: | | | | | | | | | | | | | | | | | | | | | | |
| Net investment income | | | 0.25 | | | | 0.20 | | | | 0.22 | | | | 0.23 | | | | – | | | |
| Net gain/(loss) on investments (both realized and unrealized) | | | 1.43 | | | | (0.67) | | | | 2.04 | | | | 0.09 | | | | 1.21 | | | |
| Total from Investment Operations | | | 1.68 | | | | (0.47) | | | | 2.26 | | | | 0.32 | | | | 1.21 | | | |
| Less Distributions: | | | | | | | | | | | | | | | | | | | | | | |
| Dividends (from net investment income)* | | | (0.27) | | | | (0.20) | | | | (0.22) | | | | (0.20) | | | | – | | | |
| Distributions (from capital gains)* | | | – | | | | – | | | | – | | | | – | | | | – | | | |
| Total Distributions | | | (0.27) | | | | (0.20) | | | | (0.22) | | | | (0.20) | | | | – | | | |
| Net Asset Value, End of Period | | | $13.27 | | | | $11.86 | | | | $12.53 | | | | $10.49 | | | | $10.37 | | | |
| Total Return** | | | 14.32% | | | | (3.62)% | | | | 21.58% | | | | 3.03% | | | | 13.21% | | | |
| Net Assets, End of Period (in thousands) | | | $4,648 | | | | $3,647 | | | | $2,316 | | | | $1,938 | | | | $11 | | | |
| Average Net Assets for the Period (in thousands) | | | $4,349 | | | | $2,587 | | | | $2,178 | | | | $1,065 | | | | $1 | | | |
Ratio of Gross Expenses (Absent the Waiver of Certain Fees and Expense Offsets) to Average Net Assets***(3) | | | 0.20% | | | | 0.21% | | | | 0.25% | | | | 0.14% | | | | 0.49% | | | |
Ratio of Net Expenses (After Waivers and Expense Offsets) to Average Net Assets***(3) | | | 0.20% | | | | 0.21% | | | | 0.25% | | | | 0.13% | | | | 0.29% | | | |
Ratio of Net Investment Income to Average Net Assets***(3) | | | 1.97% | | | | 1.44% | | | | 1.72% | | | | 0.86% | | | | 1.04% | | | |
| Portfolio Turnover Rate | | | 45% | | | | 18% | | | | 26% | | | | 13%^ | | | | 23% | | | |
| | | |
| * | | See Note 3 in Notes to Financial Statements. |
| ** | | Total return not annualized for periods of less than one full year. |
| *** | | Annualized for periods of less than one full year. |
| ^ | | Rate has been adjusted to conform with current year presentation. |
| (1) | | Period from November 1, 2009 through June 30, 2010. The Fund changed its fiscal year end from October 31 to June 30. |
| (2) | | Period from July 6, 2009 (inception date) through October 31, 2009. |
| (3) | | Ratios do not include expenses of the underlying funds and/or investment companies in which the Fund invests. |
See Notes to Financial Statements.
42 | JUNE 30, 2013
Class I Shares
| | | | | | | | | | | | | | | | | | | | | | | |
For a share outstanding during each year or period ended June 30 and the
| | Janus Global Allocation Fund - Moderate(1) |
| period ended October 31, 2009 | | 2013 | | 2012 | | 2011 | | 2010(2) | | 2009(3) | | |
| |
| Net Asset Value, Beginning of Period | | | $12.27 | | | | $12.60 | | | | $10.96 | | | | $10.80 | | | | $9.68 | | | |
| Income from Investment Operations: | | | | | | | | | | | | | | | | | | | | | | |
| Net investment income | | | 0.31 | | | | 0.26 | | | | 0.34 | | | | 0.26 | | | | 0.05 | | | |
| Net gain/(loss) on investments (both realized and unrealized) | | | 1.00 | | | | (0.29) | | | | 1.61 | | | | 0.17 | | | | 1.07 | | | |
| Total from Investment Operations | | | 1.31 | | | | (0.03) | | | | 1.95 | | | | 0.43 | | | | 1.12 | | | |
| Less Distributions: | | | | | | | | | | | | | | | | | | | | | | |
| Dividends (from net investment income)* | | | (0.34) | | | | (0.30) | | | | (0.31) | | | | (0.27) | | | | – | | | |
| Distributions (from capital gains)* | | | (0.61) | | | | – | | | | – | | | | – | | | | – | | | |
| Total Distributions | | | (0.95) | | | | (0.30) | | | | (0.31) | | | | (0.27) | | | | – | | | |
| Net Asset Value, End of Period | | | $12.63 | | | | $12.27 | | | | $12.60 | | | | $10.96 | | | | $10.80 | | | |
| Total Return** | | | 10.80% | | | | (0.12)% | | | | 17.91% | | | | 3.96% | | | | 11.57% | | | |
| Net Assets, End of Period (in thousands) | | | $5,441 | | | | $5,640 | | | | $4,510 | | | | $1,625 | | | | $36 | | | |
| Average Net Assets for the Period (in thousands) | | | $5,730 | | | | $5,003 | | | | $3,130 | | | | $757 | | | | $29 | | | |
Ratio of Gross Expenses (Absent the Waiver of Certain Fees and Expense Offsets) to Average Net Assets***(4) | | | 0.18% | | | | 0.17% | | | | 0.17% | | | | 0.16% | | | | 0.19% | | | |
Ratio of Net Expenses (After Waivers and Expense Offsets) to Average Net Assets***(4) | | | 0.18% | | | | 0.17% | | | | 0.17% | | | | 0.16% | | | | 0.18% | | | |
Ratio of Net Investment Income to Average Net Assets***(4) | | | 2.38% | | | | 2.18% | | | | 2.56% | | | | 1.70% | | | | 1.72% | | | |
| Portfolio Turnover Rate | | | 64% | | | | 18% | | | | 15% | | | | 11%^ | | | | 19% | | | |
| | | |
| * | | See Note 3 in Notes to Financial Statements. |
| ** | | Total return not annualized for periods of less than one full year. |
| *** | | Annualized for periods of less than one full year. |
| ^ | | Rate has been adjusted to conform with current year presentation. |
| (1) | | Effective April 5, 2013, Janus World Allocation Fund merged with and into Janus Global Allocation Fund -Moderate. See Note 6 in Notes to Financial Statements. |
| (2) | | Period from November 1, 2009 through June 30, 2010. The Fund changed its fiscal year end from October 31 to June 30. |
| (3) | | Period from July 6, 2009 (inception date) through October 31, 2009. |
| (4) | | Ratios do not include expenses of the underlying funds and/or investment companies in which the Fund invests. |
See Notes to Financial Statements.
Janus Asset Allocation Funds | 43
Financial Highlights (continued)
Class S Shares
| | | | | | | | | | | | | | | | | | | | | | | |
For a share outstanding during each year or period ended June 30 and the
| | Janus Global Allocation Fund - Conservative |
| period ended October 31, 2009 | | 2013 | | 2012 | | 2011 | | 2010(1) | | 2009(2) | | |
| |
| Net Asset Value, Beginning of Period | | | $12.35 | | | | $12.37 | | | | $11.24 | | | | $11.07 | | | | $10.13 | | | |
| Income from Investment Operations: | | | | | | | | | | | | | | | | | | | | | | |
| Net investment income | | | 0.31 | | | | 0.26 | | | | 0.41 | | | | 0.30 | | | | 0.06 | | | |
| Net gain/(loss) on investments (both realized and unrealized) | | | 0.57 | | | | 0.06 | | | | 1.13 | | | | 0.20 | | | | 0.88 | | | |
| Total from Investment Operations | | | 0.88 | | | | 0.32 | | | | 1.54 | | | | 0.50 | | | | 0.94 | | | |
| Less Distributions: | | | | | | | | | | | | | | | | | | | | | | |
| Dividends (from net investment income)* | | | (0.32) | | | | (0.34) | | | | (0.41) | | | | (0.33) | | | | – | | | |
| Distributions (from capital gains)* | | | – | | | | – | | | | – | | | | – | | | | – | | | |
| Total Distributions | | | (0.32) | | | | (0.34) | | | | (0.41) | | | | (0.33) | | | | – | | | |
| Net Asset Value, End of Period | | | $12.91 | | | | $12.35 | | | | $12.37 | | | | $11.24 | | | | $11.07 | | | |
| Total Return** | | | 7.21% | | | | 2.77% | | | | 13.82% | | | | 4.48% | | | | 9.28% | | | |
| Net Assets, End of Period (in thousands) | | | $1,357 | | | | $1,160 | | | | $520 | | | | $125 | | | | $164 | | | |
| Average Net Assets for the Period (in thousands) | | | $1,335 | | | | $967 | | | | $336 | | | | $126 | | | | $127 | | | |
Ratio of Gross Expenses (Absent the Waiver of Certain Fees and Expense Offsets) to Average Net Assets***(3) | | | 0.61% | | | | 0.59% | | | | 0.62% | | | | 0.64% | | | | 0.67% | | | |
Ratio of Net Expenses (After Waivers and Expense Offsets) to Average Net Assets***(3) | | | 0.59% | | | | 0.59% | | | | 0.62% | | | | 0.64% | | | | 0.65% | | | |
Ratio of Net Investment Income to Average Net Assets***(3) | | | 2.36% | | | | 2.28% | | | | 3.84% | | | | 2.47% | | | | 2.22% | | | |
| Portfolio Turnover Rate | | | 69% | | | | 10% | | | | 12% | | | | 12%^ | | | | 21% | | | |
Class S Shares
| | | | | | | | | | | | | | | | | | | | | | | |
For a share outstanding during each year or period ended June 30 and the
| | Janus Global Allocation Fund - Growth |
| period ended October 31, 2009 | | 2013 | | 2012 | | 2011 | | 2010(1) | | 2009(2) | | |
| |
| Net Asset Value, Beginning of Period | | | $11.74 | | | | $12.45 | | | | $10.45 | | | | $10.35 | | | | $9.16 | | | |
| Income from Investment Operations: | | | | | | | | | | | | | | | | | | | | | | |
| Net investment income | | | 0.20 | | | | 0.18 | | | | 0.21 | | | | 0.15 | | | | – | | | |
| Net gain/(loss) on investments (both realized and unrealized) | | | 1.41 | | | | (0.70) | | | | 2.00 | | | | 0.14 | | | | 1.19 | | | |
| Total from Investment Operations | | | 1.61 | | | | (0.52) | | | | 2.21 | | | | 0.29 | | | | 1.19 | | | |
| Less Distributions: | | | | | | | | | | | | | | | | | | | | | | |
| Dividends (from net investment income)* | | | (0.22) | | | | (0.19) | | | | (0.21) | | | | (0.19) | | | | – | | | |
| Distributions (from capital gains)* | | | – | | | | – | | | | – | | | | – | | | | – | | | |
| Total Distributions | | | (0.22) | | | | (0.19) | | | | (0.21) | | | | (0.19) | | | | – | | | |
| Net Asset Value, End of Period | | | $13.13 | | | | $11.74 | | | | $12.45 | | | | $10.45 | | | | $10.35 | | | |
| Total Return** | | | 13.84% | | | | (4.10)% | | | | 21.15% | | | | 2.73% | | | | 12.99% | | | |
| Net Assets, End of Period (in thousands) | | | $1,785 | | | | $1,613 | | | | $753 | | | | $30 | | | | $11 | | | |
| Average Net Assets for the Period (in thousands) | | | $1,902 | | | | $1,268 | | | | $558 | | | | $19 | | | | $1 | | | |
Ratio of Gross Expenses (Absent the Waiver of Certain Fees and Expense Offsets) to Average Net Assets***(3) | | | 0.58% | | | | 0.60% | | | | 0.67% | | | | 0.65% | | | | 0.91% | | | |
Ratio of Net Expenses (After Waivers and Expense Offsets) to Average Net Assets***(3) | | | 0.58% | | | | 0.60% | | | | 0.67% | | | | 0.65% | | | | 0.67% | | | |
Ratio of Net Investment Income to Average Net Assets***(3) | | | 1.51% | | | | 1.11% | | | | 1.61% | | | | 0.68% | | | | 0.66% | | | |
| Portfolio Turnover Rate | | | 45% | | | | 18% | | | | 26% | | | | 13%^ | | | | 23% | | | |
| | | |
| * | | See Note 3 in Notes to Financial Statements. |
| ** | | Total return not annualized for periods of less than one full year. |
| *** | | Annualized for periods of less than one full year. |
| ^ | | Rate has been adjusted to conform with current year presentation. |
| (1) | | Period from November 1, 2009 through June 30, 2010. The Fund changed its fiscal year end from October 31 to June 30. |
| (2) | | Period from July 6, 2009 (inception date) through October 31, 2009. |
| (3) | | Ratios do not include expenses of the underlying funds and/or investment companies in which the Fund invests. |
See Notes to Financial Statements.
44 | JUNE 30, 2013
Class S Shares
| | | | | | | | | | | | | | | | | | | | | | | |
For a share outstanding during each year or period ended June 30 and the
| | Janus Global Allocation Fund - Moderate(1) |
| period ended October 31, 2009 | | 2013 | | 2012 | | 2011 | | 2010(2) | | 2009(3) | | |
| |
| Net Asset Value, Beginning of Period | | | $12.14 | | | | $12.52 | | | | $10.91 | | | | $10.78 | | | | $9.68 | | | |
| Income from Investment Operations: | | | | | | | | | | | | | | | | | | | | | | |
| Net investment income | | | 0.29 | | | | 0.24 | | | | 0.29 | | | | 0.25 | | | | 0.01 | | | |
| Net gain/(loss) on investments (both realized and unrealized) | | | 0.97 | | | | (0.34) | | | | 1.62 | | | | 0.14 | | | | 1.09 | | | |
| Total from Investment Operations | | | 1.26 | | | | (0.10) | | | | 1.91 | | | | 0.39 | | | | 1.10 | | | |
| Less Distributions: | | | | | | | | | | | | | | | | | | | | | | |
| Dividends (from net investment income)* | | | (0.30) | | | | (0.28) | | | | (0.30) | | | | (0.26) | | | | – | | | |
| Distributions (from capital gains)* | | | (0.61) | | | | – | | | | – | | | | – | | | | – | | | |
| Total Distributions | | | (0.91) | | | | (0.28) | | | | (0.30) | | | | (0.26) | | | | – | | | |
| Net Asset Value, End of Period | | | $12.49 | | | | $12.14 | | | | $12.52 | | | | $10.91 | | | | $10.78 | | | |
| Total Return** | | | 10.44% | | | | (0.64)% | | | | 17.56% | | | | 3.57% | | | | 11.36% | | | |
| Net Assets, End of Period (in thousands) | | | $3,139 | | | | $1,595 | | | | $416 | | | | $58 | | | | $11 | | | |
| Average Net Assets for the Period (in thousands) | | | $2,429 | | | | $1,042 | | | | $374 | | | | $26 | | | | $1 | | | |
Ratio of Gross Expenses (Absent the Waiver of Certain Fees and Expense Offsets) to Average Net Assets***(4) | | | 0.60% | | | | 0.60% | | | | 0.64% | | | | 0.66% | | | | 0.92% | | | |
Ratio of Net Expenses (After Waivers and Expense Offsets) to Average Net Assets***(4) | | | 0.60% | | | | 0.60% | | | | 0.64% | | | | 0.66% | | | | 0.77% | | | |
Ratio of Net Investment Income to Average Net Assets***(4) | | | 1.88% | | | | 1.88% | | | | 2.92% | | | | 1.35% | | | | 1.59% | | | |
| Portfolio Turnover Rate | | | 64% | | | | 18% | | | | 15% | | | | 11%^ | | | | 19% | | | |
| | | |
| * | | See Note 3 in Notes to Financial Statements. |
| ** | | Total return not annualized for periods of less than one full year. |
| *** | | Annualized for periods of less than one full year. |
| ^ | | Rate has been adjusted to conform with current year presentation. |
| (1) | | Effective April 5, 2013, Janus World Allocation Fund merged with and into Janus Global Allocation Fund -Moderate. See Note 6 in Notes to Financial Statements. |
| (2) | | Period from November 1, 2009 through June 30, 2010. The Fund changed its fiscal year end from October 31 to June 30. |
| (3) | | Period from July 6, 2009 (inception date) through October 31, 2009. |
| (4) | | Ratios do not include expenses of the underlying funds and/or investment companies in which the Fund invests. |
See Notes to Financial Statements.
Janus Asset Allocation Funds | 45
Financial Highlights (continued)
Class T Shares
| | | | | | | | | | | | | | | | | | | | | | | | | | | |
For a share outstanding during each year or period ended
| | Janus Global Allocation Fund - Conservative | | |
| June 30 and each year ended October 31 | | 2013 | | 2012 | | 2011 | | 2010(1) | | 2009 | | 2008 | | |
| |
| Net Asset Value, Beginning of Period | | | $12.42 | | | | $12.42 | | | | $11.26 | | | | $11.09 | | | | $9.52 | | | | $12.09 | | | |
| Income from Investment Operations: | | | | | | | | | | | | | | | | | | | | | | | | | | |
| Net investment income | | | 0.38 | | | | 0.15 | | | | 0.26 | | | | 0.72 | | | | 0.38 | | | | 0.33 | | | |
| Net gain/(loss) on investments (both realized and unrealized) | | | 0.55 | | | | 0.21 | | | | 1.32 | | | | (0.20) | | | | 1.52 | | | | (2.46) | | | |
| Total from Investment Operations | | | 0.93 | | | | 0.36 | | | | 1.58 | | | | 0.52 | | | | 1.90 | | | | (2.13) | | | |
| Less Distributions: | | | | | | | | | | | | | | | | | | | | | | | | | | |
| Dividends (from net investment income)* | | | (0.35) | | | | (0.36) | | | | (0.42) | | | | (0.35) | | | | (0.33) | | | | (0.29) | | | |
| Distributions (from capital gains)* | | | – | | | | – | | | | – | | | | – | | | | – | | | | (0.15) | | | |
| Total Distributions | | | (0.35) | | | | (0.36) | | | | (0.42) | | | | (0.35) | | | | (0.33) | | | | (0.44) | | | |
| Net Asset Value, End of Period | | | $13.00 | | | | $12.42 | | | | $12.42 | | | | $11.26 | | | | $11.09 | | | | $9.52 | | | |
| Total Return** | | | 7.60% | | | | 3.03% | | | | 14.15% | | | | 4.70% | | | | 20.71% | | | | (18.26)% | | | |
| Net Assets, End of Period (in thousands) | | | $24,223 | | | | $28,323 | | | | $16,648 | | | | $9,999 | | | | $114,544 | | | | $83,219 | | | |
| Average Net Assets for the Period (in thousands) | | | $27,679 | | | | $22,198 | | | | $12,762 | | | | $60,927 | | | | $90,262 | | | | $88,345 | | | |
Ratio of Gross Expenses (Absent the Waiver of Certain Fees and Expense Offsets) to Average Net Assets***(2) | | | 0.36% | | | | 0.34% | | | | 0.36% | | | | 0.31% | | | | 0.33% | | | | 0.25% | | | |
Ratio of Net Expenses (After Waivers and Expense Offsets) to Average Net Assets***(2) | | | 0.26% | | | | 0.31% | | | | 0.36% | | | | 0.31% | | | | 0.30% | | | | 0.17% | | | |
Ratio of Net Investment Income to Average Net Assets***(2) | | | 2.87% | | | | 2.37% | | | | 3.77% | | | | 3.62% | | | | 4.14% | | | | 3.16% | | | |
| Portfolio Turnover Rate | | | 69% | | | | 10% | | | | 12% | | | | 12%^ | | | | 21% | | | | 90% | | | |
Class T Shares
| | | | | | | | | | | | | | | | | | | | | | | | | | | |
For a share outstanding during each year or period ended
| | Janus Global Allocation Fund - Growth | | |
| June 30 and each year ended October 31 | | 2013 | | 2012 | | 2011 | | 2010(1) | | 2009 | | 2008 | | |
| |
| Net Asset Value, Beginning of Period | | | $11.84 | | | | $12.54 | | | | $10.48 | | | | $10.36 | | | | $8.62 | | | | $13.95 | | | |
| Income from Investment Operations: | | | | | | | | | | | | | | | | | | | | | | | | | | |
| Net investment income | | | 0.29 | | | | 0.15 | | | | 0.21 | | | | 0.29 | | | | 0.26 | | | | 0.24 | | | |
| Net gain/(loss) on investments (both realized and unrealized) | | | 1.37 | | | | (0.65) | | | | 2.04 | | | | 0.01 | | | | 1.69 | | | | (4.93) | | | |
| Total from Investment Operations | | | 1.66 | | | | (0.50) | | | | 2.25 | | | | 0.30 | | | | 1.95 | | | | (4.69) | | | |
| Less Distributions: | | | | | | | | | | | | | | | | | | | | | | | | | | |
| Dividends (from net investment income)* | | | (0.25) | | | | (0.20) | | | | (0.19) | | | | (0.18) | | | | (0.21) | | | | (0.24) | | | |
| Distributions (from capital gains)* | | | – | | | | – | | | | – | | | | – | | | | – | | | | (0.40) | | | |
| Total Distributions | | | (0.25) | | | | (0.20) | | | | (0.19) | | | | (0.18) | | | | (0.21) | | | | (0.64) | | | |
| Net Asset Value, End of Period | | | $13.25 | | | | $11.84 | | | | $12.54 | | | | $10.48 | | | | $10.36 | | | | $8.62 | | | |
| Total Return** | | | 14.18% | | | | (3.90)% | | | | 21.55% | | | | 2.86% | | | | 23.32% | | | | (35.15)% | | | |
| Net Assets, End of Period (in thousands) | | | $11,935 | | | | $12,992 | | | | $12,451 | | | | $10,459 | | | | $190,737 | | | | $143,425 | | | |
| Average Net Assets for the Period (in thousands) | | | $13,567 | | | | $12,693 | | | | $11,585 | | | | $96,998 | | | | $154,899 | | | | $183,091 | | | |
Ratio of Gross Expenses (Absent the Waiver of Certain Fees and Expense Offsets) to Average Net Assets***(2) | | | 0.36% | | | | 0.38% | | | | 0.35% | | | | 0.33% | | | | 0.37% | | | | 0.26% | | | |
Ratio of Net Expenses (After Waivers and Expense Offsets) to Average Net Assets***(2) | | | 0.30% | | | | 0.34% | | | | 0.35% | | | | 0.33% | | | | 0.36% | | | | 0.24% | | | |
Ratio of Net Investment Income to Average Net Assets***(2) | | | 1.88% | | | | 1.46% | | | | 1.62% | | | | 1.84% | | | | 2.90% | | | | 1.95% | | | |
| Portfolio Turnover Rate | | | 45% | | | | 18% | | | | 26% | | | | 13%^ | | | | 23% | | | | 55% | | | |
| | | |
| * | | See Note 3 in Notes to Financial Statements. |
| ** | | Total return not annualized for periods of less than one full year. |
| *** | | Annualized for periods of less than one full year. |
| ^ | | Rate has been adjusted to conform with current year presentation. |
| (1) | | Period from November 1, 2009 through June 30, 2010. The Fund changed its fiscal year end from October 31 to June 30. |
| (2) | | Ratios do not include expenses of the underlying funds and/or investment companies in which the Fund invests. |
See Notes to Financial Statements.
46 | JUNE 30, 2013
Class T Shares
| | | | | | | | | | | | | | | | | | | | | | | | | | | |
For a share outstanding during each year or period ended
| | Janus Global Allocation Fund - Moderate(1) | | |
| June 30 and each year ended October 31 | | 2013 | | 2012 | | 2011 | | 2010(2) | | 2009 | | 2008 | | |
| |
| Net Asset Value, Beginning of Period | | | $12.25 | | | | $12.60 | | | | $10.95 | | | | $10.79 | | | | $9.05 | | | | $12.95 | | | |
| Income from Investment Operations: | | | | | | | | | | | | | | | | | | | | | | | | | | |
| Net investment income | | | 0.27 | | | | 0.32 | | | | 0.11 | | | | 0.56 | | | | 0.32 | | | | 0.31 | | | |
| Net gain/(loss) on investments (both realized and unrealized) | | | 1.03 | | | | (0.38) | | | | 1.84 | | | | (0.14) | | | | 1.71 | | | | (3.64) | | | |
| Total from Investment Operations | | | 1.30 | | | | (0.06) | | | | 1.95 | | | | 0.42 | | | | 2.03 | | | | (3.33) | | | |
| Less Distributions: | | | | | | | | | | | | | | | | | | | | | | | | | | |
| Dividends (from net investment income)* | | | (0.33) | | | | (0.29) | | | | (0.30) | | | | (0.26) | | | | (0.29) | | | | (0.29) | | | |
| Distributions (from capital gains)* | | | (0.61) | | | | – | | | | – | | | | – | | | | – | | | | (0.28) | | | |
| Total Distributions | | | (0.94) | | | | (0.29) | | | | (0.30) | | | | (0.26) | | | | (0.29) | | | | (0.57) | | | |
| Net Asset Value, End of Period | | | $12.61 | | | | $12.25 | | | | $12.60 | | | | $10.95 | | | | $10.79 | | | | $9.05 | | | |
| Total Return** | | | 10.67% | | | | (0.33)% | | | | 17.89% | | | | 3.80% | | | | 23.19% | | | | (26.77)% | | | |
| Net Assets, End of Period (in thousands) | | | $17,314 | | | | $15,651 | | | | $20,254 | | | | $10,268 | | | | $160,742 | | | | $110,756 | | | |
| Average Net Assets for the Period (in thousands) | | | $15,843 | | | | $19,099 | | | | $16,051 | | | | $83,813 | | | | $124,910 | | | | $132,650 | | | |
Ratio of Gross Expenses (Absent the Waiver of Certain Fees and Expense Offsets) to Average Net Assets***(3) | | | 0.35% | | | | 0.36% | | | | 0.35% | | | | 0.30% | | | | 0.33% | | | | 0.24% | | | |
Ratio of Net Expenses (After Waivers and Expense Offsets) to Average Net Assets***(3) | | | 0.30% | | | | 0.31% | | | | 0.35% | | | | 0.30% | | | | 0.32% | | | | 0.20% | | | |
Ratio of Net Investment Income to Average Net Assets***(3) | | | 2.15% | | | | 2.12% | | | | 2.88% | | | | 2.63% | | | | 3.48% | | | | 2.63% | | | |
| Portfolio Turnover Rate | | | 64% | | | | 18% | | | | 15% | | | | 11%^ | | | | 19% | | | | 71% | | | |
| | | |
| * | | See Note 3 in Notes to Financial Statements. |
| ** | | Total return not annualized for periods of less than one full year. |
| *** | | Annualized for periods of less than one full year. |
| ^ | | Rate has been adjusted to conform with current year presentation. |
| (1) | | Effective April 5, 2013, Janus World Allocation Fund merged with and into Janus Global Allocation Fund -Moderate. See Note 6 in Notes to Financial Statements. |
| (2) | | Period from November 1, 2009 through June 30, 2010. The Fund changed its fiscal year end from October 31 to June 30. |
| (3) | | Ratios do not include expenses of the underlying funds and/or investment companies in which the Fund invests. |
See Notes to Financial Statements.
Janus Asset Allocation Funds | 47
Notes to Financial Statements (unaudited)
The following section describes the organization and significant accounting policies and provides more detailed information about the schedules and tables that appear throughout this report. In addition, the Notes to Financial Statements explain the methods used in preparing and presenting this report.
| |
| 1. | Organization and Significant Accounting Policies |
Janus Global Allocation Fund – Conservative (formerly named Janus Conservative Allocation Fund), Janus Global Allocation Fund – Growth (formerly named Janus Growth Allocation Fund), and Janus Global Allocation Fund – Moderate (formerly named Janus Moderate Allocation Fund) (individually, a “Fund” and collectively, the “Funds”) are series funds. The Funds each operate as a “fund of funds,” meaning substantially all of the Funds’ assets will be invested in other Janus funds (the “underlying funds”). The Funds are part of Janus Investment Fund (the “Trust”), which is organized as a Massachusetts business trust and is registered under the Investment Company Act of 1940, as amended (the “1940 Act”), as an open-end management investment company. The financial statements include information for the year ended June 30, 2013. The Trust offers forty-four funds which include multiple series of shares, with differing investment objectives and policies. Each Fund in this report is classified as diversified, as defined in the 1940 Act.
Effective April 5, 2013, Janus World Allocation Fund merged with and into Janus Global Allocation Fund – Moderate. See Note 6 in these Notes to Financial Statements for more details about this merger.
Each Fund in this report offers multiple classes of shares in order to meet the needs of various types of investors. Each class represents an interest in the same portfolio of investments. Certain financial intermediaries may not offer all classes of shares.
Class A Shares and Class C Shares are generally offered through financial intermediary platforms including, but not limited to, traditional brokerage platforms, mutual fund wrap fee programs, bank trust platforms, and retirement platforms. The maximum purchase in Class C Shares is $500,000 for any single purchase.
Class D Shares are generally no longer being made available to new investors. The Shares are available only to investors who hold accounts directly with the Janus funds and to immediate family members or members of the same household of an eligible individual investor. The Shares are not offered through financial intermediaries.
Class I Shares are available through certain financial intermediary platforms including, but not limited to, mutual fund wrap fee programs, managed account programs, asset allocation programs, and bank trust platforms, as well as certain retirement platforms. Class I Shares are also available to certain institutional investors including, but not limited to, corporations, certain retirement plans, public plans, and foundations/endowments.
Class S Shares are offered through financial intermediary platforms including, but not limited to, retirement platforms and asset allocation, mutual fund wrap, or other discretionary or nondiscretionary fee-based investment advisory programs. In addition, Class S Shares may be available through certain financial intermediaries who have an agreement with Janus Capital Management LLC (“Janus Capital”) or its affiliates to offer Class S Shares on their supermarket platforms.
Class T Shares are available through certain financial intermediary platforms including, but not limited to, mutual fund wrap fee programs, managed account programs, asset allocation programs, bank trust platforms, as well as certain retirement platforms. In addition, Class T Shares may be available through certain financial intermediaries who have an agreement with Janus Capital or its affiliates to offer Class T Shares on their supermarket platforms.
Underlying Funds
Each Fund invests in a variety of underlying funds to pursue a target allocation of equity investments, fixed-income securities, and alternative investments and may also invest in money market instruments or cash/cash equivalents. Each Fund has a target allocation, which is how each Fund’s investments generally will be allocated among the major asset classes over the long term, as well as normal ranges, under normal market conditions, within which each Fund’s asset class allocations generally will vary over short-term periods. The normal asset allocation ranges are as follows: (1) 30%-50% equity investments, 50%-65% fixed-income securities and money market instruments, and 0%-20% alternative investments for Janus Global Allocation Fund – Conservative; (2) 70%-85% equity investments, 10%-25% fixed-income securities and money market instruments, and 5%-20% alternative investments, for Janus Global Allocation Fund – Growth; and (3) 45%-65% equity investments, 30%-45% fixed-income securities and money market instruments, and 5%-20% alternative investments for Janus Global Allocation Fund – Moderate. Additional details and descriptions of the investment objectives and strategies of each of the underlying funds are available in the Funds’ and underlying funds’ prospectuses. The Trustees of the underlying funds may change the investment objectives or strategies of the underlying funds at any time without prior notice to Fund shareholders.
48 | JUNE 30, 2013
The following accounting policies have been followed by the Funds and are in conformity with accounting principles generally accepted in the United States of America.
Investment Valuation
A Fund’s net asset value (“NAV”) is calculated based upon the NAV of each of the underlying funds in which the Fund invests on the day of valuation. The NAV for each class of the underlying funds is computed by dividing the total value of securities and other assets allocated to the class, less liabilities allocated to that class, by the total number of shares outstanding for the class.
Securities held by the underlying funds are valued at the last sales price or the official closing price for securities traded on a principal securities exchange (U.S. or foreign) and on the NASDAQ National Market. Securities held by the underlying funds traded on over-the-counter (“OTC”) markets and listed securities for which no sales are reported are valued at the latest bid price (or yield equivalent thereof) obtained from one or more dealers transacting in a market for such securities or by a pricing service approved by the underlying funds’ Trustees. Short-term securities held by the underlying funds with maturities of 60 days or less may be valued at amortized cost, which approximates market value. Debt securities held by the underlying funds with a remaining maturity of greater than 60 days are valued in accordance with the evaluated bid price supplied by the pricing service. The evaluated bid price supplied by the pricing service is an evaluation that reflects such factors as security prices, yields, maturities and ratings. Short positions shall be valued in accordance with the same methodologies, except that in the event that a last sale price is not available, the latest ask price shall be used instead of a bid price. Foreign securities and currencies held by the underlying funds are converted to U.S. dollars using the applicable exchange rate in effect as of the daily close of the New York Stock Exchange (“NYSE”). When market quotations are not readily available or deemed unreliable, or events or circumstances that may affect the value of portfolio securities held by the underlying funds are identified between the closing of their principal markets and the time the NAV is determined, securities may be valued at fair value as determined in good faith under procedures established by and under the supervision of the underlying funds’ Trustees. Circumstances in which fair value pricing may be utilized include, but are not limited to: (i) a significant event that may affect the securities of a single issuer, such as a merger, bankruptcy, or significant issuer specific development; (ii) an event that may affect an entire market, such as a natural disaster or significant governmental action; (iii) a nonsignificant event such as a market closing early or not opening, or a security trading halt; and (iv) pricing of a non-valued security and a restricted or non-public security. The underlying funds use systematic fair valuation models provided by independent third parties to value international equity securities in order to adjust for stale pricing, which may occur between the close of certain foreign exchanges and the close of the NYSE. Restricted and illiquid securities are valued in accordance with procedures established by the underlying funds’ Trustees.
Investment Transactions and Investment Income
Investment transactions are accounted for as of the date purchased or sold (trade date). Dividend income is recorded on the ex-dividend date. Gains and losses are determined on the identified cost basis, which is the same basis used for federal income tax purposes. Income, as well as gains and losses, both realized and unrealized, are allocated daily to each class of shares based upon the ratio of net assets represented by each class as a percentage of total net assets.
Expenses
Each Fund bears expenses incurred specifically on its behalf, as well as a portion of general expenses, which may be allocated pro rata to each of the Funds in the Trust. Additionally, each Fund, as a shareholder in the underlying funds, will also indirectly bear its pro rata share of the expenses incurred by the underlying funds. Each class of shares bears expenses incurred specifically on its behalf and, in addition, each class bears a portion of general expenses, which are allocated daily to each class of shares based upon the ratio of net assets represented by each class as a percentage of total net assets. Expenses directly attributable to a specific class of shares are charged against the operations of such class.
Estimates
The preparation of financial statements in conformity with accounting principles generally accepted in the United States of America requires management to make estimates and assumptions that affect the reported amount of assets and liabilities and disclosure of contingent assets and liabilities at the date of the financial statements, and the reported amounts of income and expenses during the reporting period. Actual results could differ from those estimates.
Dividend Distributions
The Funds generally declare and distribute dividends of net investment income and realized capital gains (if any) annually.
The underlying funds may make certain investments in real estate investment trusts (“REITs”) which pay dividends to their shareholders based upon funds available from operations. It is quite common for these dividends to
Janus Asset Allocation Funds | 49
Notes to Financial Statements (unaudited) (continued)
exceed the REITs’ taxable earnings and profits, resulting in the excess portion of such dividends being designated as a return of capital. If the underlying funds distribute such amounts, such distributions could constitute a return of capital to shareholders for federal income tax purposes.
Federal Income Taxes
Each Fund intends to continue to qualify as a regulated investment company and distribute all of its taxable income. Management has analyzed each Fund’s tax positions taken for all open federal income tax years, generally a three-year period, and has concluded that no provision for federal income tax is required in the Funds’ financial statements.
Valuation Inputs Summary
In accordance with FASB guidance, the Funds utilize “Fair Value Measurements” to define fair value, establish a framework for measuring fair value, and expand disclosure requirements regarding fair value measurements. The Fair Value Measurement Standard does not require new fair value measurements, but is applied to the extent that other accounting pronouncements require or permit fair value measurements. This standard emphasizes that fair value is a market-based measurement that should be determined based on the assumptions that market participants would use in pricing an asset or liability. Various inputs are used in determining the value of the Funds’ investments defined pursuant to this standard. These inputs are summarized into three broad levels:
Level 1 – Quoted prices in active markets for identical securities.
Level 2 – Prices determined using other significant observable inputs. Observable inputs are inputs that reflect the assumptions market participants would use in pricing a security and are developed based on market data obtained from sources independent of the reporting entity. These may include quoted prices for similar securities, interest rates, prepayment speeds, credit risk, and others.
The Funds classify each of their investments in underlying funds as Level 2, without consideration as to the classification level of the specific investments held by the underlying funds.
Level 3 – Prices determined using significant unobservable inputs. In situations where quoted prices or observable inputs are unavailable or deemed less relevant (for example, when there is little or no market activity for an investment at the end of the period), unobservable inputs may be used. Unobservable inputs are inputs that reflect the reporting entity’s own assumptions about the factors market participants would use in pricing the security and would be based on the best information available under the circumstances.
There have been no significant changes in valuation techniques used in valuing any such positions held by the Funds since the beginning of the fiscal year.
The inputs or methodology used for valuing securities are not necessarily an indication of the risk associated with investing in those securities. The summary of inputs used as of June 30, 2013 to value the Funds’ investments in securities and other financial instruments is included in the “Valuation Inputs Summary” in the Notes to Schedules of Investments and Other Information.
FASB Accounting Standards Update, “Amendments to Achieve Common Fair Value Measurement and Disclosure Requirements” requires disclosures about amounts and reasons for all transfers in and out of Level 1 and Level 2 fair value measurements. For fair value measurements categorized within Level 3 of the fair value hierarchy, the Funds shall provide quantitative information about the significant unobservable inputs used in the fair value measurement. To meet the objective of the quantitative disclosure, the Funds may need to further disaggregate to provide more meaningful information about the significant unobservable inputs used and how these inputs vary over time.
The Funds are not required to create quantitative information to comply with this disclosure requirement if quantitative unobservable inputs are not developed by the Funds when measuring fair value (for example, when a Fund uses prices from prior transactions or third-party pricing information without adjustment). However, when providing this disclosure, the Funds cannot ignore quantitative unobservable inputs that are significant to the fair value measurement and are reasonably available to the Funds.
In addition, the Accounting Standards Update requires the Funds to provide a narrative sensitivity disclosure of the fair value measurement changes in unobservable inputs and the interrelationships between those unobservable inputs for fair value measurements categorized within Level 3 of the fair value hierarchy.
There were no transfers in or out of Level 1, Level 2 and Level 3 for the Funds during the year.
The Funds recognize transfers between the levels as of the beginning of the fiscal year.
50 | JUNE 30, 2013
| |
| 2. | Investment Advisory Agreements and Other Transactions with Affiliates |
Each Fund pays Janus Capital an investment advisory fee which is calculated daily and paid monthly. The following table reflects each Fund’s contractual investment advisory fee rate (expressed as an annual rate).
| | | | | | | | | |
| | | | | Contractual
| | |
| | | Average
| | Investment
| | |
| | | Daily Net
| | Advisory
| | |
| | | Assets
| | Fee (%)
| | |
| Fund | | of the Fund | | (annual rate) | | |
| |
| |
| Janus Global Allocation Fund - Conservative | | | All Asset Levels | | | 0.05 | | |
| Janus Global Allocation Fund - Growth | | | All Asset Levels | | | 0.05 | | |
| Janus Global Allocation Fund - Moderate | | | All Asset Levels | | | 0.05 | | |
| |
| |
Janus Services LLC (“Janus Services”), a wholly-owned subsidiary of Janus Capital, is the Funds’ transfer agent. In addition, Janus Services provides or arranges for the provision of certain other administrative services including, but not limited to, recordkeeping, accounting, order processing, and other shareholder services for the Funds.
Certain, but not all, intermediaries charge administrative fees to investors in Class A Shares, Class C Shares, and Class I Shares for administrative services provided on behalf of such investors. These administrative fees are paid by the Class A Shares, Class C Shares, and Class I Shares of the Funds to Janus Services, which uses such fees to reimburse intermediaries. Consistent with the Transfer Agency Agreement between Janus Services and the Funds, Janus Services may negotiate the level, structure, and/or terms of the administrative fees with intermediaries requiring such fees on behalf of the Funds. Janus Capital and its affiliates benefit from an increase in assets that may result from such relationships.
Class D Shares pay an annual administrative services fee of 0.12% of net assets. These administrative services fees are paid by Class D Shares for shareholder services provided by Janus Services.
Janus Services receives an administrative services fee at an annual rate of up to 0.25% of the average daily net assets of Class S Shares and Class T Shares of each Fund for providing or procuring administrative services to investors in Class S Shares and Class T Shares of the Funds. Janus Services expects to use all or a significant portion of this fee to compensate retirement plan service providers, broker-dealers, bank trust departments, financial advisors, and other financial intermediaries for providing these services. Janus Services or its affiliates may also pay fees for services provided by intermediaries to the extent the fees charged by intermediaries exceed the 0.25% of net assets charged to Class S Shares and Class T Shares of each Fund. Janus Services may keep certain amounts retained for reimbursement of out-of-pocket costs incurred for servicing clients of Class S Shares and Class T Shares.
Services provided by these financial intermediaries may include, but are not limited to, recordkeeping, subaccounting, order processing, providing order confirmations, periodic statements, forwarding prospectuses, shareholder reports, and other materials to existing customers, answering inquiries regarding accounts, and other administrative services. Order processing includes the submission of transactions through the National Securities Clearing Corporation (“NSCC”) or similar systems, or those processed on a manual basis with Janus Capital.
Janus Services is compensated for its services related to Class D Shares, and receives reimbursement for its out-of-pocket costs on all other share classes. Included in out-of-pocket expenses are the expenses Janus Services incurs for serving as transfer agent and providing servicing to shareholders.
Janus Distributors LLC (“Janus Distributors”), a wholly-owned subsidiary of Janus Capital, is the distributor of the Funds. The Funds have adopted a Distribution and Shareholder Servicing Plan (the “Plan”) pursuant to Rule 12b-1 under the 1940 Act. The Plan authorizes payments by the Funds to intermediaries at an annual rate, as determined from time to time by the Board of Trustees, of up to 0.25% of the Class A Shares average daily net assets, of up to 1.00% of the Class C Shares average daily net assets, and of up to 0.25% of the Class S Shares average daily net assets. Payments under the Plan are not tied exclusively to actual distribution and shareholder service expenses, and the payments may exceed distribution and shareholder service expenses actually incurred by the Funds. If any of a Fund’s actual distribution and shareholder service expenses incurred during a calendar year are less than the payments made during a calendar year, the Fund will be refunded the difference. Refunds, if any, are included in “Distribution fees and shareholder servicing fees” in the Statements of Operations.
Janus Capital has contractually agreed to waive the advisory fee payable by each Fund listed below in an amount equal to the amount, if any, that the Fund’s normal operating expenses in any fiscal year, including the investment advisory fee, but excluding any expenses of an underlying fund (acquired fund fees and expenses), class-specific distribution and shareholder servicing fees applicable to Class A Shares, Class C Shares, and Class S Shares, the administrative services fees payable pursuant to the Transfer Agency Agreement, brokerage
Janus Asset Allocation Funds | 51
Notes to Financial Statements (unaudited) (continued)
commissions, interest, dividends, taxes, and extraordinary expenses, exceed the annual rates shown below. Janus Capital has agreed to continue each waiver until at least November 1, 2013. If applicable, amounts reimbursed to the Funds by Janus Capital are disclosed as “Excess Expense Reimbursement” on the Statements of Operations.
| | | | | | |
| | | Expense
| | |
| Fund | | Limit (%) | | |
| |
| |
| Janus Global Allocation Fund - Conservative | | | 0.40 | | |
| Janus Global Allocation Fund - Growth | | | 0.45 | | |
| Janus Global Allocation Fund - Moderate | | | 0.39 | | |
| |
| |
Janus Capital has entered into an agreement with Wilshire Associates Inc. (“Wilshire”), a global investment technology, investment consulting, and investment management firm, to act as a consultant to Janus Capital. Wilshire provides research and advice regarding asset allocation methodologies, which Janus Capital may use when determining asset class allocations for the Funds. For its consulting services, Janus Capital pays Wilshire an annual fee, payable monthly, that is comprised of a combination of an initial program establishment fee, fixed fee, and an asset-based fee.
The Board of Trustees has adopted a deferred compensation plan (the “Deferred Plan”) for independent Trustees to elect to defer receipt of all or a portion of the annual compensation they are entitled to receive from the Funds. All deferred fees are credited to an account established in the name of the Trustees. The amounts credited to the account then increase or decrease, as the case may be, in accordance with the performance of one or more of the Janus funds that are selected by the Trustees. The account balance continues to fluctuate in accordance with the performance of the selected fund or funds until final payment of all amounts are credited to the account. The fluctuation of the account balance is recorded by the Funds as unrealized appreciation/(depreciation) and is shown as of June 30, 2013 on the Statements of Assets and Liabilities as an asset, “Non-interested Trustees’ deferred compensation,” and a liability, “Non-interested Trustees’ deferred compensation fees.” Additionally, the recorded unrealized appreciation/(depreciation) is included in “Unrealized net appreciation/(depreciation) of investments and non-interested Trustees’ deferred compensation” on the Statements of Assets and Liabilities. Deferred compensation expenses for the year ended June 30, 2013 are included in “Non-interested Trustees’ fees and expenses” on the Statements of Operations. Trustees are allowed to change their designation of mutual funds from time to time. Amounts will be deferred until distributed in accordance with the Deferred Plan. Deferred fees of $243,941 were paid by the Trust to a Trustee under the Deferred Plan during the year ended June 30, 2013.
Certain officers of the Funds may also be officers and/or directors of Janus Capital. The Funds’ Chief Compliance Officer and certain other Fund officers may be compensated by the Funds. The Funds reimburse Janus Capital for a portion of the compensation paid to the Chief Compliance Officer and certain compliance staff as well as Janus Capital personnel providing administration services to the Funds. Total compensation of $487,826 was paid to the Chief Compliance Officer and certain compliance staff by the Trust during the year June 30, 2013. Each Fund’s portion is reported as part of “Other Expenses” on the Statements of Operations.
Class A Shares include a 5.75% upfront sales charge of the offering price of the Funds. The sales charge is allocated between Janus Distributors and financial intermediaries. During the year ended June 30, 2013, Janus Distributors retained the following upfront sales charges:
| | | | | | |
| | | Upfront
| | |
| Fund (Class A Shares) | | Sales Charge | | |
| |
| |
| Janus Global Allocation Fund - Conservative | | $ | 10,041 | | |
| Janus Global Allocation Fund - Growth | | | 2,267 | | |
| Janus Global Allocation Fund - Moderate | | | 9,830 | | |
| |
| |
A contingent deferred sales charge (“CDSC”) of 1.00% will be deducted with respect to Class A Shares purchased without a sales load and redeemed within 12 months of purchase, unless waived, as discussed in the Prospectus. Any applicable CDSC will be 1.00% of the lesser of the original purchase price or the value of the redemption of the Class A Shares redeemed. There were no CDSCs paid by redeeming shareholders of Class A Shares to Janus Distributors during the year ended June 30, 2013.
Class C Shares include a 1.00% CDSC paid by redeeming shareholders to Janus Distributors. The CDSC applies to shares redeemed within 12 months of purchase. The redemption price may differ from the NAV per share. During the year ended June 30, 2013, redeeming shareholders of Class C Shares paid the following CDSCs:
| | | | | | |
| Fund (Class C Shares) | | CDSC | | |
| |
| |
| Janus Global Allocation Fund - Conservative | | $ | 2,250 | | |
| Janus Global Allocation Fund - Growth | | | 780 | | |
| Janus Global Allocation Fund - Moderate | | | 1,417 | | |
| |
| |
The Funds’ expenses may be reduced by expense offsets from an unaffiliated custodian and/or transfer agent. Such credits or offsets are included in “Expense and Fee Offset” on the Statements of Operations (if applicable). The Funds could have employed the assets used by the
52 | JUNE 30, 2013
custodian and/or transfer agent to produce income if they had not entered into an expense offset arrangement.
Pursuant to the provisions of the 1940 Act and rules promulgated thereunder, the Funds may participate in an affiliated or nonaffiliated cash sweep program. In the cash sweep program, uninvested cash balances of the Funds may be used to purchase shares of affiliated or nonaffiliated money market funds or cash management pooled investment vehicles. The Funds are eligible to participate in the cash sweep program (the “Investing Funds”). Janus Cash Liquidity Fund LLC is an affiliated unregistered cash management pooled investment vehicle that invests primarily in highly-rated short-term fixed-income securities. Janus Cash Liquidity Fund LLC currently maintains a NAV of $1.00 per share and distributes income daily in a manner consistent with a registered 2a-7 product. There are no restrictions on the Funds’ ability to withdraw investments from Janus Cash Liquidity Fund LLC at will, and there are no unfunded capital commitments due from the Funds to Janus Cash Liquidity Fund LLC. As adviser, Janus Capital has an inherent conflict of interest because of its fiduciary duties to the affiliated cash management pooled investment vehicles and the Investing Funds.
During the year ended June 30, 2013, any recorded distributions from affiliated investments as affiliated dividend income, and affiliated purchases and sales can be found in the Notes to Schedules of Investments and Other Information.
Janus Capital or an affiliate invested and/or redeemed initial seed capital during the year ended June 30, 2013, as indicated in the following table:
| | | | | | | | | | | | | | | | | | | | | |
| | | Seed Capital
| | | | Date of
| | | | Date of
| | Seed Capital
| | |
| Fund | | at 6/30/12 | | Purchases | | Purchases | | Redemptions | | Redemptions | | at 6/30/13 | | |
| |
| |
Janus Global Allocation Fund - Moderate -
Class S Shares(1) | | $ | – | | $ | 136,757 | | | 4/5/13 | | $ | – | | | – | | $ | 136,757 | | |
| |
| |
| | | |
| (1) | | On April 5, 2013, Janus World Allocation Fund merged with and into Janus Global Allocation Fund -Moderate. The seed capital balance held in Janus World Allocation Fund - Class S Shares was transferred to Janus Global Allocation Fund - Moderate - Class S shares at the time of the merger. |
The tax components of capital shown in the tables below represent: (1) distribution requirements the Funds must satisfy under the income tax regulations; (2) losses or deductions the Funds may be able to offset against income and gains realized in future years; and (3) unrealized appreciation or depreciation of investments for federal income tax purposes.
Other book to tax differences may consist of deferred compensation.
| | | | | | | | | | | | | | | | | | | | | | | | |
| | | Undistributed
| | Undistributed
| | | | Loss Deferrals | | Other Book
| | Net Tax
| | |
| | | Ordinary
| | Long-Term
| | Accumulated
| | Late-Year
| | Post-October
| | to Tax
| | Appreciation/
| | |
| Fund | | Income | | Gains | | Capital Losses | | Ordinary Loss | | Capital Loss | | Differences | | (Depreciation) | | |
| |
| |
| Janus Global Allocation Fund - Conservative | | $ | 1,856,167 | | $ | 16,240,535 | | $ | – | | $ | – | | $ | – | | $ | (4,475) | | $ | 12,460,555 | | |
| Janus Global Allocation Fund - Growth | | | 247,972 | | | 1,047,599 | | | – | | | – | | | – | | | (3,901) | | | 29,620,961 | | |
| Janus Global Allocation Fund - Moderate | | | 730,323 | | | 1,822,446 | | | – | | | – | | | – | | | (4,718) | | | 24,795,333 | | |
| |
| |
During the year ended June 30, 2013, the following capital loss carryovers were utilized by the Funds as indicated in the table:
| | | | | | | | | |
| | | | | Capital Loss
| | |
| Fund | | | | Carryover Utilized | | |
| |
| |
| Janus Global Allocation Fund - Conservative | | | | | $ | 316,475 | | |
| Janus Global Allocation Fund - Growth | | | | | | 15,324,623 | | |
| Janus Global Allocation Fund - Moderate | | | | | | 4,700,282 | | |
| |
| |
The aggregate cost of investments and the composition of unrealized appreciation and depreciation of investment securities for federal income tax purposes as of June 30, 2013 are noted below.
Janus Asset Allocation Funds | 53
Notes to Financial Statements (unaudited) (continued)
Unrealized appreciation and unrealized depreciation in the table below exclude appreciation/(depreciation) on foreign currency translations. The primary difference between book and tax appreciation or depreciation of investments is wash sale loss deferrals.
| | | | | | | | | | | | |
| | | Federal Tax
| | Unrealized
| | Unrealized
| | |
| Fund | | Cost | | Appreciation | | (Depreciation) | | |
| |
| |
| Janus Global Allocation Fund - Conservative | | $ | 264,344,684 | | $ | 18,182,183 | | $ | (5,721,628) | | |
| Janus Global Allocation Fund - Growth | | | 211,995,025 | | | 32,358,773 | | | (2,737,812) | | |
| Janus Global Allocation Fund - Moderate | | | 266,762,891 | | | 29,710,972 | | | (4,915,639) | | |
| |
| |
Income and capital gains distributions are determined in accordance with income tax regulations that may differ from accounting principles generally accepted in the United States of America. These differences are due to differing treatments for items such as net short-term gains, deferral of wash sale losses, foreign currency transactions, net investment losses and capital loss carryovers. Certain permanent differences such as tax returns of capital and net investment losses noted below have been reclassified to paid-in capital.
For the year ended June 30, 2013
| | | | | | | | | | | | | | | | | | |
| | | Distributions | | | | | | |
| | | From Ordinary
| | From Long-Term
| | Tax Return of
| | Net Investment
| | | | |
| Fund | | Income | | Capital Gains | | Capital | | Loss | | | | |
| |
| |
| Janus Global Allocation Fund - Conservative | | $ | 7,496,101 | | $ | – | | $ | – | | $ | – | | | | | |
| Janus Global Allocation Fund - Growth | | | 4,679,949 | | | – | | | – | | | – | | | | | |
| Janus Global Allocation Fund - Moderate | | | 6,878,790 | | | 13,183,743 | | | – | | | – | | | | | |
| |
| |
For the year ended June 30, 2012
| | | | | | | | | | | | | | | | | | |
| | | Distributions | | | | | | |
| | | From Ordinary
| | From Long-Term
| | Tax Return of
| | Net Investment
| | | | |
| Fund | | Income | | Capital Gains | | Capital | | Loss | | | | |
| |
| |
| Janus Global Allocation Fund - Conservative | | $ | 6,416,521 | | $ | – | | $ | – | | $ | – | | | | | |
| Janus Global Allocation Fund - Growth | | | 3,916,126 | | | – | | | – | | | – | | | | | |
| Janus Global Allocation Fund - Moderate | | | 6,335,083 | | | – | | | – | | | – | | | | | |
| |
| |
| |
| 4. | Capital Share Transactions |
| | | | | | | | | | | | | | | | | | | | | | | | | | | |
| | | Janus Global
| | Janus Global
| | Janus Global
| | |
| | | Allocation Fund -
| | Allocation Fund -
| | Allocation Fund -
| | |
For the years ended June 30
| | Conservative | | Growth | | Moderate(1) | | |
| (all numbers are in thousands) | | 2013 | | 2012 | | 2013 | | 2012 | | 2013 | | 2012 | | |
| |
| Transactions in Fund Shares – Class A Shares: | | | | | | | | | | | | | | | | | | | | | | | | | | |
| Shares issued in connection with acquisition (Note 6) | | | N/A | | | | N/A | | | | N/A | | | | N/A | | | | 144 | | | | N/A | | | |
| Shares sold | | | 409 | | | | 530 | | | | 71 | | | | 99 | | | | 197 | | | | 175 | | | |
| Reinvested dividends and distributions | | | 20 | | | | 14 | | | | 4 | | | | 4 | | | | 36 | | | | 11 | | | |
| Shares repurchased | | | (200) | | | | (280) | | | | (62) | | | | (97) | | | | (136) | | | | (155) | | | |
| Net Increase/(Decrease) in Fund Shares | | | 229 | | | | 264 | | | | 13 | | | | 6 | | | | 241 | | | | 31 | | | |
| Shares Outstanding, Beginning of Period | | | 652 | | | | 388 | | | | 228 | | | | 222 | | | | 468 | | | | 437 | | | |
| Shares Outstanding, End of Period | | | 881 | | | | 652 | | | | 241 | | | | 228 | | | | 709 | | | | 468 | | | |
54 | JUNE 30, 2013
| | | | | | | | | | | | | | | | | | | | | | | | | | | |
| | | Janus Global
| | Janus Global
| | Janus Global
| | |
| | | Allocation Fund -
| | Allocation Fund -
| | Allocation Fund -
| | |
For the years ended June 30
| | Conservative | | Growth | | Moderate(1) | | |
| (all numbers are in thousands) | | 2013 | | 2012 | | 2013 | | 2012 | | 2013 | | 2012 | | |
| |
| Transactions in Fund Shares – Class C Shares: | | | | | | | | | | | | | | | | | | | | | | | | | | |
| Shares issued in connection with acquisition (Note 6) | | | N/A | | | | N/A | | | | N/A | | | | N/A | | | | 147 | | | | N/A | | | |
| Shares sold | | | 505 | | | | 667 | | | | 79 | | | | 145 | | | | 97 | | | | 243 | | | |
| Reinvested dividends and distributions | | | 21 | | | | 22 | | | | 3 | | | | 4 | | | | 37 | | | | 14 | | | |
| Shares repurchased | | | (235) | | | | (180) | | | | (76) | | | | (43) | | | | (215) | | | | (166) | | | |
| Net Increase/(Decrease) in Fund Shares | | | 291 | | | | 509 | | | | 6 | | | | 106 | | | | 66 | | | | 91 | | | |
| Shares Outstanding, Beginning of Period | | | 1,146 | | | | 637 | | | | 327 | | | | 221 | | | | 699 | | | | 608 | | | |
| Shares Outstanding, End of Period | | | 1,437 | | | | 1,146 | | | | 333 | | | | 327 | | | | 765 | | | | 699 | | | |
| Transactions in Fund Shares – Class D Shares: | | | | | | | | | | | | | | | | | | | | | | | | | | |
| Shares sold | | | 4,109 | | | | 5,031 | | | | 1,656 | | | | 2,346 | | | | 2,877 | | | | 3,252 | | | |
| Reinvested dividends and distributions | | | 465 | | | | 450 | | | | 335 | | | | 318 | | | | 1,367 | | | | 464 | | | |
| Shares repurchased | | | (3,651) | | | | (3,873) | | | | (3,042) | | | | (3,459) | | | | (3,303) | | | | (3,960) | | | |
| Net Increase/(Decrease) in Fund Shares | | | 923 | | | | 1,608 | | | | (1,051) | | | | (795) | | | | 941 | | | | (244) | | | |
| Shares Outstanding, Beginning of Period | | | 15,854 | | | | 14,246 | | | | 17,316 | | | | 18,111 | | | | 18,623 | | | | 18,867 | | | |
| Shares Outstanding, End of Period | | | 16,777 | | | | 15,854 | | | | 16,265 | | | | 17,316 | | | | 19,564 | | | | 18,623 | | | |
| Transactions in Fund Shares – Class I Shares: | | | | | | | | | | | | | | | | | | | | | | | | | | |
| Shares issued in connection with acquisition (Note 6) | | | N/A | | | | N/A | | | | N/A | | | | N/A | | | | 53 | | | | N/A | | | |
| Shares sold | | | 237 | | | | 107 | | | | 140 | | | | 185 | | | | 196 | | | | 309 | | | |
| Reinvested dividends and distributions | | | 6 | | | | 5 | | | | 7 | | | | 3 | | | | 29 | | | | 10 | | | |
| Shares repurchased | | | (177) | | | | (125) | | | | (105) | | | | (65) | | | | (307) | | | | (217) | | | |
| Net Increase/(Decrease) in Fund Shares | | | 66 | | | | (13) | | | | 42 | | | | 123 | | | | (29) | | | | 102 | | | |
| Shares Outstanding, Beginning of Period | | | 189 | | | | 202 | | | | 308 | | | | 185 | | | | 460 | | | | 358 | | | |
| Shares Outstanding, End of Period | | | 255 | | | | 189 | | | | 350 | | | | 308 | | | | 431 | | | | 460 | | | |
| Transactions in Fund Shares – Class S Shares: | | | | | | | | | | | | | | | | | | | | | | | | | | |
| Shares issued in connection with acquisition (Note 6) | | | N/A | | | | N/A | | | | N/A | | | | N/A | | | | 11 | | | | N/A | | | |
| Shares sold | | | 39 | | | | 68 | | | | 76 | | | | 92 | | | | 110 | | | | 125 | | | |
| Reinvested dividends and distributions | | | 3 | | | | 2 | | | | 3 | | | | 2 | | | | 14 | | | | 2 | | | |
| Shares repurchased | | | (31) | | | | (18) | | | | (80) | | | | (17) | | | | (15) | | | | (29) | | | |
| Net Increase/(Decrease) in Fund Shares | | | 11 | | | | 52 | | | | (1) | | | | 77 | | | | 120 | | | | 98 | | | |
| Shares Outstanding, Beginning of Period | | | 94 | | | | 42 | | | | 137 | | | | 60 | | | | 131 | | | | 33 | | | |
| Shares Outstanding, End of Period | | | 105 | | | | 94 | | | | 136 | | | | 137 | | | | 251 | | | | 131 | | | |
| Transactions in Fund Shares – Class T Shares: | | | | | | | | | | | | | | | | | | | | | | | | | | |
| Shares issued in connection with acquisition (Note 6) | | | N/A | | | | N/A | | | | N/A | | | | N/A | | | | 42 | | | | N/A | | | |
| Shares sold | | | 1,088 | | | | 2,034 | | | | 494 | | | | 462 | | | | 665 | | | | 633 | | | |
| Reinvested dividends and distributions | | | 50 | | | | 40 | | | | 20 | | | | 18 | | | | 87 | | | | 41 | | | |
| Shares repurchased | | | (1,554) | | | | (1,135) | | | | (710) | | | | (376) | | | | (699) | | | | (1,003) | | | |
| Net Increase/(Decrease) in Fund Shares | | | (416) | | | | 939 | | | | (196) | | | | 104 | | | | 95 | | | | (329) | | | |
| Shares Outstanding, Beginning of Period | | | 2,280 | | | | 1,341 | | | | 1,097 | | | | 993 | | | | 1,278 | | | | 1,607 | | | |
| Shares Outstanding, End of Period | | | 1,864 | | | | 2,280 | | | | 901 | | | | 1,097 | | | | 1,373 | | | | 1,278 | | | |
| | | |
| (1) | | Effective April 5, 2013, Janus World Allocation Fund merged with and into Janus Global Allocation Fund - Moderate. See Note 6 in Notes to Financial Statements. |
Janus Asset Allocation Funds | 55
Notes to Financial Statements (unaudited) (continued)
| |
| 5. | Purchases and Sales of Investment Securities |
For the year ended June 30, 2013, the aggregate cost of purchases and proceeds from sales of investment securities (excluding any short-term securities, short-term options contracts, and in-kind transactions) was as follows:
| | | | | | | | | | | | | | | |
| | | | | | | | | Proceeds from
| | |
| | | | | | | Purchases of
| | Sales of
| | |
| | | | | | | Long-Term
| | Long-Term
| | |
| | | Purchases of
| | Proceeds from Sales
| | U.S. Government
| | U.S. Government
| | |
| Fund | | Securities | | of Securities | | Obligations | | Obligations | | |
| |
| Janus Global Allocation Fund - Conservative | | $ | 203,319,091 | | $ | 187,704,869 | | $ | – | | $ | – | | |
| Janus Global Allocation Fund - Growth | | | 106,843,934 | | | 120,971,384 | | | – | | | – | | |
| Janus Global Allocation Fund - Moderate | | | 181,440,356 | | | 180,036,623 | | | – | | | – | | |
| |
| |
On April 5, 2013, Janus Global Allocation Fund – Moderate acquired all of the net assets of Janus World Allocation Fund, an open-end investment company, pursuant to a plan of reorganization approved by the Board of Trustees of Janus World Allocation Fund on November 8, 2012. The purpose of the transaction was to combine two funds managed by Janus Capital with comparable investment objectives, strategies and policies, as well as the potential for expense efficiencies due to the larger combined asset base of the merged funds.
The acquisition was accomplished by a tax-free exchange of shares of Janus Global Allocation Fund – Moderate for shares of Janus World Allocation Fund outstanding on April 5, 2013, valued at $4,994,548.
| | | | | | | | | |
| | | Number of shares
| | Number of Janus
| | |
| | | outstanding of Janus World
| | Global Allocation Fund - Moderate
| | |
| | | Allocation Fund
| | shares issued for shares of Janus
| | |
| | | prior to merger | | World Allocation Fund | | |
| |
| |
| Class A | | | 189,989 | | | 143,800 | | |
| Class C | | | 195,120 | | | 147,171 | | |
| Class I | | | 69,957 | | | 52,996 | | |
| Class S | | | 14,345 | | | 10,892 | | |
| Class T | | | 55,442 | | | 41,847 | | |
| |
| |
The investment portfolio of Janus World Allocation Fund, with a fair value of $4,675,058 and identified cost of $3,934,380 at April 5, 2013, was the principal asset acquired by Janus Global Allocation Fund – Moderate. For financial reporting purposes, assets received and shares issued by Janus Global Allocation Fund – Moderate were recorded at fair value; however, the cost basis of the investments received from Janus World Allocation Fund was carried forward to align ongoing reporting of Janus Global Allocation Fund – Moderate’s realized and unrealized gains and losses with amounts distributable to shareholders for tax purposes. Immediately prior to the merger, the net assets of Janus Global Allocation Fund – Moderate were $288,067,303.
Assuming the acquisition had been completed on July 1, 2012, the beginning of the annual reporting period of Janus Global Allocation Fund – Moderate, Janus Global Allocation Fund – Moderate’s pro forma results of operations for the year ended June 30, 2013, are as follows:
Net investment income $6,237,910
Net gain/(loss) on investments $22,603,739
Net increase/(decrease) in net assets resulting from operations $28,841,649
Because the combined investment portfolios have been managed as a single integrated portfolio since the acquisition was completed, it is not practical to separate the amounts of revenue and earnings of Janus World Allocation Fund that have been included in Janus Global Allocation Fund – Moderate’s Statement of Operations since April 5, 2013.
56 | JUNE 30, 2013
| |
| 7. | New Accounting Pronouncements |
In December 2011, the FASB issued Accounting Standards Update No. 2011-11, “Disclosures about Offsetting Assets and Liabilities.” This update creates disclosure requirements requiring entities to disclose both gross and net information for derivatives and other financial instruments that are either offset in the Statements of Assets and Liabilities or subject to an enforceable master netting arrangement or similar agreement. In January 2013, the FASB issued Accounting Standards Update No. 2013-01, “Clarifying the Scope of Disclosures about Offsetting Assets and Liabilities.” This update limits the scope of the new Statements of Assets and Liabilities offsetting disclosures to derivatives, repurchase agreements, reverse repurchase agreements, securities borrowing and securities lending transactions that are either offset in the Statements of Assets and Liabilities or subject to an enforceable master netting arrangement or similar agreement. These disclosure requirements are effective for annual reporting periods beginning on or after January 1, 2013, and interim periods within those annual periods. Management is currently evaluating the impact these updates may have on the Funds’ financial statements
Management has evaluated whether any other events or transactions occurred subsequent to June 30, 2013 and through the date of issuance of the Funds’ financial statements and determined that there were no material events or transactions that would require recognition or disclosure in the Funds’ financial statements.
Janus Asset Allocation Funds | 57
Report of Independent Registered Public Accounting Firm
To the Board of Trustees and Shareholders
of Janus Investment Fund:
In our opinion, the accompanying statements of assets and liabilities, including the schedules of investments, and the related statements of operations and of changes in net assets and the financial highlights present fairly, in all material respects, the financial position of Janus Global Allocation Fund – Conservative (formerly known as Janus Conservative Allocation Fund), Janus Global Allocation Fund – Growth (formerly known as Janus Growth Allocation Fund), and Janus Global Allocation Fund – Moderate (formerly known as Janus Moderate Allocation Fund) (three of the funds constituting Janus Investment Fund, hereafter referred to as the “Funds”) at June 30, 2013 and the results of each of their operations for the year then ended, the changes in each of their net assets for each of the two years in the period then ended and the financial highlights for each of the periods presented, in conformity with accounting principles generally accepted in the United States of America. These financial statements and financial highlights (hereafter referred to as “financial statements”) are the responsibility of the Funds’ management; our responsibility is to express an opinion on these financial statements based on our audits. We conducted our audits of these financial statements in accordance with the standards of the Public Company Accounting Oversight Board (United States). Those standards require that we plan and perform the audit to obtain reasonable assurance about whether the financial statements are free of material misstatement. An audit includes examining, on a test basis, evidence supporting the amounts and disclosures in the financial statements, assessing the accounting principles used and significant estimates made by management, and evaluating the overall financial statement presentation. We believe that our audits, which included confirmation of securities at June 30, 2013 by correspondence with the transfer agent, provide a reasonable basis for our opinion.
Denver, Colorado
August 19, 2013
58 | JUNE 30, 2013
Additional Information (unaudited)
Proxy Voting Policies and Voting Record
A description of the policies and procedures that the Funds use to determine how to vote proxies relating to their portfolio securities is available without charge: (i) upon request, by calling 1-800-525-0020 (toll free); (ii) on the Funds’ website at janus.com/proxyvoting; and (iii) on the SEC’s website at http://www.sec.gov. Additionally, information regarding each Fund’s proxy voting record for the most recent twelve-month period ended June 30 is also available, free of charge, through janus.com/proxyvoting and from the SEC’s website at http://www.sec.gov.
Quarterly Portfolio Holdings
The Funds file their complete portfolio holdings (schedule of investments) with the SEC for the first and third quarters of each fiscal year on Form N-Q within 60 days of the end of such fiscal quarter. The Funds’ Form N-Q: (i) is available on the SEC’s website at http://www.sec.gov; (ii) may be reviewed and copied at the SEC’s Public Reference Room in Washington, D.C. (information on the Public Reference Room may be obtained by calling 1-800-SEC-0330); and (iii) is available without charge, upon request, by calling Janus at 1-800-525-0020 (toll free).
Approval of Advisory Agreements During the Period
The Trustees of Janus Investment Fund, none of whom has ever been affiliated with Janus Capital and each of whom serves as an “independent” Trustee (the “Trustees”), oversee the management of each Fund and, as required by law, determine annually whether to continue the investment advisory agreement for each Fund and the subadvisory agreements for the nine Funds that utilize subadvisers.
In connection with their most recent consideration of those agreements for each Fund, the Trustees received and reviewed a substantial amount of information provided by Janus Capital and the respective subadvisers in response to requests of the Trustees and their independent legal counsel. They also received and reviewed a considerable amount of information and analysis provided by, and in response to requests of, their independent fee consultant. Throughout their consideration of the agreements, the Trustees were advised by their independent legal counsel. The Trustees met with management to consider the agreements, and also met separately in executive session with their independent legal counsel and their independent fee consultant.
At a meeting held on December 7, 2012, based on the Trustees’ evaluation of the information provided by Janus Capital, the subadvisers and the independent fee consultant, as well as other information, the Trustees determined that the overall arrangements between each Fund and Janus Capital and each subadviser, as applicable, were fair and reasonable in light of the nature, extent and quality of the services provided by Janus Capital, its affiliates and the subadvisers, the fees charged for those services, and other matters that the Trustees considered relevant in the exercise of their business judgment. At that meeting, the Trustees unanimously approved the continuation of the investment advisory agreement for each Fund, and the subadvisory agreement for each subadvised Fund, for the period from February 1, 2013 through February 1, 2014, subject to earlier termination as provided for in each agreement.
In considering the continuation of those agreements, the Trustees reviewed and analyzed various factors that they determined were relevant, including the factors described below, none of which by itself was considered dispositive. However, the material factors and conclusions that formed the basis for the Trustees’ determination to approve the continuation of the agreements are discussed separately below. Also included is a summary of the independent fee consultant’s conclusions and opinions that arose during, and were included as part of, the Trustees’ consideration of the agreements.
Nature, Extent and Quality of Services
The Trustees reviewed the nature, extent and quality of the services provided by Janus Capital and the subadvisers to the Funds, taking into account the investment objective and strategy of each Fund and the knowledge the Trustees gained from their regular meetings with management on at least a quarterly basis and their ongoing review of information related to the Funds. In addition, the Trustees reviewed the resources and key personnel of Janus Capital and each subadviser, particularly noting those employees who provide investment and risk management services to the Funds. The Trustees also considered other services provided to the Funds by Janus Capital or the subadvisers, such as managing the execution of portfolio transactions and the selection of broker-dealers for those transactions. The Trustees considered Janus Capital’s role as administrator to the Funds, noting that Janus Capital does not receive a fee for its services but is reimbursed for its out-of-pocket costs. The Trustees considered the role of Janus Capital in monitoring adherence to the Funds’ investment restrictions, providing support services for the Trustees and Trustee committees, communicating with shareholders and overseeing the activities of other service providers, including monitoring compliance with various policies and
Janus Asset Allocation Funds | 59
Additional Information (unaudited) (continued)
procedures of the Funds and with applicable securities laws and regulations.
In this regard, the independent fee consultant noted that Janus Capital provides a number of different services for the Funds of Janus Investment Fund and the Portfolios of Janus Aspen Series (such Funds and Portfolios, together the “Janus Funds”) and Janus Fund shareholders, ranging from investment management services to various other servicing functions, and that, in its opinion, Janus Capital is a capable provider of those services. The independent fee consultant also provided its belief that Janus Capital has developed institutional competitive advantages that should be able to provide superior investment management returns over the long term.
The Trustees concluded that the nature, extent and quality of the services provided by Janus Capital or the subadviser to each Fund were appropriate and consistent with the terms of the respective advisory and subadvisory agreements, and that, taking into account steps taken to address those Funds whose performance lagged that of their peers for certain periods, the quality of those services had been consistent with or superior to quality norms in the industry and the Funds were likely to benefit from the continued provision of those services. They also concluded that Janus Capital and each subadviser had sufficient personnel, with the appropriate education and experience, to serve the Funds effectively and had demonstrated its continuing ability to attract well-qualified personnel.
Performance of the Funds
The Trustees considered the performance results of each Fund over various time periods. They reviewed information comparing each Fund’s performance with the performance of comparable funds and peer groups identified by independent data providers, and with the Fund’s benchmark index. In this regard, the independent fee consultant found that the Janus Funds have had some recent performance challenges, but performance has improved recently, and for the 36 months ended September 30, 2012, approximately 47% of the Janus Funds were in the top two quartiles of performance and for the 12 months ended September 30, 2012, approximately 54% of the Janus Funds were in the top two quartiles of performance. The Trustees concluded that the performance of certain Funds was good under current market conditions. Although the performance of other Funds lagged that of their peers for certain periods, the Trustees also concluded that Janus Capital had taken or was taking appropriate steps to address those instances of under-performance.
Costs of Services Provided
The Trustees examined information regarding the fees and expenses of each Fund in comparison to similar information for other comparable funds as provided by independent data providers. They also reviewed an analysis of that information provided by their independent fee consultant and noted that the rate of management (investment advisory and any administration) fees for most of the Funds, after applicable contractual expense limitations, was below the mean management fee rate of the respective peer group of funds selected by the independent data providers.
In this regard, the independent fee consultant provided its belief that the management fees charged by Janus Capital to each of the Janus Funds under the current investment advisory and administration agreements are reasonable in relation to the services provided by Janus Capital. The independent fee consultant found (1) the total expenses and management fees of the Janus Funds to be reasonable relative to other mutual funds; (2) total expenses, on average, were 16% below the mean total expenses of their respective Lipper Expense Group peers and 23% below the mean total expenses for their Lipper Expense Universes; (3) management fees for the Janus Funds, on average, were 9% below the mean management fees for their Expense Groups and 12% below the mean for their Expense Universes; and (4) Janus Funds expenses at the functional level for each asset and share class category were reasonable. The independent fee consultant concluded that based on its strategic review of expenses at the complex, category and individual fund level, Janus Funds expenses were found to be reasonable relative to both Expense Group and Expense Universe benchmarks. Further, for certain Funds the independent fee consultant also performed a systematic “focus list” analysis of expenses in the context of the performance or service delivered to each set of investors in each share class in each selected Fund. Based on this analysis, the independent fee consultant found that the combination of service quality/ performance and expenses on these individual Funds and share classes were reasonable in light of performance trends, performance histories and existence of performance fees on such Funds.
The Trustees considered the methodology used by Janus Capital and each subadviser in determining compensation payable to portfolio managers, the competitive environment for investment management talent and the competitive market for mutual funds in different distribution channels. They concluded that the compensation methodology provided a good alignment of the interests of the portfolio managers with the interests of Fund shareholders.
60 | JUNE 30, 2013
The Trustees also reviewed management fees charged by Janus Capital and each subadviser to their separate account clients and to non-affiliated funds subadvised by Janus Capital or by a subadviser (for which Janus Capital or the subadviser provides only portfolio management services). Although in most instances subadvisory and separate account fee rates for various investment strategies were lower than management fee rates for Funds having a similar strategy, the Trustees noted that, under the terms of the management agreements with the Funds, Janus Capital performs significant additional services for the Funds that it does not provide to those other clients, including administration services, oversight of the Funds’ other service providers, trustee support, regulatory compliance and numerous other services, and that, in serving the Funds, Janus Capital assumes many legal risks that it does not assume in servicing its other clients. Moreover, they noted the research conducted and conclusions reached by their independent fee consultant.
In this regard, the independent fee consultant found that (1) the management fees Janus Capital charges to the Janus Funds are reasonable in relation to the management fees Janus Capital charges to its institutional and subadvised accounts; (2) these institutional and subadvised accounts have different service and infrastructure needs; and (3) the average spread between management fees charged to the Janus Funds and those charged to Janus Capital’s institutional and subadvised accounts is reasonable relative to the average spreads seen in the industry.
The Trustees reviewed information on the profitability to Janus Capital and its affiliates of their relationships with each Fund, as well as an explanation of the methodology utilized in allocating various expenses of Janus Capital and its affiliates among the Funds and other clients. The Trustees also reviewed the financial statements and corporate structure of Janus Capital’s parent company. In their review, the Trustees considered whether Janus Capital and each subadviser receive adequate incentives to manage the Funds effectively. The Trustees recognized that profitability comparisons among fund managers are difficult because very little comparative information is publicly available and the profitability of any fund manager is affected by numerous factors, including the organizational structure of the particular fund manager, the types of funds and other accounts it manages, possible other lines of business, the methodology for allocating expenses and the fund manager’s capital structure and cost of capital. However, taking into account those factors and the analysis provided by the Trustees’ independent fee consultant, and based on the information available, the Trustees concluded that Janus Capital’s profitability with respect to each Fund in relation to the services rendered was not unreasonable.
In this regard, the independent fee consultant found that, while assessing the reasonability of expenses in light of Janus Capital’s profits is dependent on comparisons with other publicly-traded mutual fund advisers, and that these comparisons are limited in accuracy by differences in complex size, business mix, institutional account orientation, and other factors, after accepting these limitations, the level of profit earned by Janus Capital from managing the Janus Funds is reasonable.
The Trustees concluded that the management fees and other compensation payable by each Fund to Janus Capital and its affiliates, as well as the fees paid by Janus Capital to the subadvisers of the subadvised Funds, were reasonable in relation to the nature, extent and quality of the services provided, taking into account the fees charged by other advisers for managing comparable mutual funds with similar strategies, the fees Janus Capital and the subadvisers charge to other clients, and, as applicable, the impact of fund performance on fees payable by the Funds. The Trustees also concluded that the overall expense ratio of each Fund was reasonable, taking into account the size of the Fund, the quality of services provided by Janus Capital and any subadviser, the investment performance of the Fund and any expense limitations agreed to by Janus Capital.
Economies of Scale
The Trustees considered information about the potential for Janus Capital to realize economies of scale as the assets of the Funds increase. They noted that, although many Funds pay advisory fees at a base fixed rate as a percentage of net assets, without any breakpoints, the actual management fee rate paid by most of the Funds, after any contractual expense limitations, was below the mean management fee rate of the Fund’s peer group identified by independent data providers; and, for those Funds whose expenses are being reduced by the contractual expense limitations of Janus Capital, Janus Capital is subsidizing the Funds because they have not reached adequate scale. Moreover, as the assets of many of the Funds have declined in the past few years, certain Funds have benefited from having advisory fee rates that have remained constant rather than increasing as assets declined. In addition, performance fee structures have been implemented for various Funds that have caused or will cause the effective rate of advisory fees payable by such a Fund to vary depending on the investment performance of the Fund relative to its benchmark index over the measurement period; and the five Funds that have fee schedules with breakpoints and reduced fee rates above certain asset levels. The Trustees also noted
Janus Asset Allocation Funds | 61
Additional Information (unaudited) (continued)
that the Funds share directly in economies of scale through the lower charges of third-party service providers that are based in part on the combined scale of all of the Funds. Based on all of the information they reviewed, including research and analysis conducted by the Trustees’ independent fee consultant, the Trustees concluded that the current fee structure of each Fund was reasonable and that the current rates of fees do reflect a sharing between Janus Capital and the Fund of economies of scale at the current asset level of the Fund.
In this regard, the independent fee consultant concluded that, based on analysis it completed, and given the limitations in these analytical approaches and their conflicting results, it could not confirm or deny the existence of economies of scale in the Janus complex. Further, the independent fee consultant provided its belief that Janus Fund investors are well-served by the fee levels and performance fee structures in place on the Janus Funds in light of any economies of scale that may be present at Janus Capital.
Other Benefits to Janus Capital
The Trustees also considered benefits that accrue to Janus Capital and its affiliates from their relationships with the Funds. They recognized that two affiliates of Janus Capital separately serve the Funds as transfer agent and distributor, respectively, and the transfer agent receives compensation directly from the non-money market funds for services provided. The Trustees also considered Janus Capital’s past and proposed use of commissions paid by the Funds on their portfolio brokerage transactions to obtain proprietary and third-party research products and services benefiting the Fund and/or other clients of Janus Capital. The Trustees concluded that Janus Capital’s use of these types of client commission arrangements to obtain proprietary and third-party research products and services was consistent with regulatory requirements and guidelines and was likely to benefit each Fund. The Trustees also concluded that, other than the services provided by Janus Capital and its affiliates pursuant to the agreements and the fees to be paid by each Fund therefor, the Funds and Janus Capital may potentially benefit from their relationship with each other in other ways. They concluded that Janus Capital benefits from the receipt of research products and services acquired through commissions paid on portfolio transactions of the Funds and that the Funds benefit from Janus Capital’s receipt of those products and services as well as research products and services acquired through commissions paid by other clients of Janus Capital. They further concluded that success of any Fund could attract other business to Janus Capital or other Janus Funds, and that the success of Janus Capital could enhance Janus Capital’s ability to serve the Funds.
After full consideration of the above factors, as well as other factors, the Trustees, each of whom is an independent Trustee, concluded at their December 7, 2012 meeting that the proposed continuation of the investment advisory agreement and, if applicable, the subadvisory agreement for each Fund for another year was in the best interest of the respective Funds and their shareholders.
62 | JUNE 30, 2013
Useful Information About Your Fund Report (unaudited)
The Management Commentary in this report includes valuable insight from each of the Fund’s managers as well as statistical information to help you understand how your Fund’s performance and characteristics stack up against those of comparable indices.
If the Fund invests in foreign securities, this report may include information about country exposure. Country exposure is based primarily on the country of risk. The Fund’s managers may allocate a company to a country based on other factors such as location of the company’s principal office, the location of the principal trading market for the company’s securities, or the country where a majority of the company’s revenues are derived.
Please keep in mind that the opinions expressed by the Chief Investment Officer(s) in the Market Perspective and by the Fund’s managers in the Management Commentary are just that: opinions. They are a reflection of the Chief Investment Officer(s) and managers’ best judgment at the time this report was compiled, which was June 30, 2013. As the investing environment changes, so could their opinions. These views are unique to them and aren’t necessarily shared by fellow employees or by Janus in general.
Performance overview graphs compare the performance of a hypothetical $10,000 investment in the Fund with one or more widely used market indices. The hypothetical example does not represent the returns of any particular investment.
When comparing the performance of the Fund with an index, keep in mind that market indices do not include brokerage commissions that would be incurred if you purchased the individual securities in the index. They also do not include taxes payable on dividends and interest or operating expenses incurred if you maintained the Fund invested in the index.
Average annual total returns are quoted for a Fund with more than one year of performance history. Average annual total return is calculated by taking the growth or decline in value of an investment over a period of time, including reinvestment of dividends and distributions, then calculating the annual compounded percentage rate that would have produced the same result had the rate of growth been constant throughout the period. Average annual total return does not reflect the deduction of taxes that a shareholder would pay on Fund distributions or redemptions of Fund shares.
Cumulative total returns are quoted for a Fund with less than one year of performance history. Cumulative total return is the growth or decline in value of an investment over time, independent of the period of time involved. Cumulative total return does not reflect the deduction of taxes that a shareholder would pay on Fund distributions or redemptions of Fund shares.
Pursuant to federal securities rules, expense ratios shown in the performance chart reflect subsidized (if applicable) and unsubsidized ratios. The total annual fund operating expenses ratio is gross of any fee waivers, reflecting the Fund’s unsubsidized expense ratio. The net annual fund operating expenses ratio (if applicable) includes contractual waivers of Janus Capital and reflects the Fund’s subsidized expense ratio. Ratios may be higher or lower than those shown in the “Financial Highlights” in this report.
| |
| 3. | Schedule of Investments |
Following the performance overview section is the Fund’s Schedule of Investments. This schedule reports the types of securities held in the Fund on the last day of the reporting period. Securities are usually listed by type (common stock, corporate bonds, U.S. Government obligations, etc.) and by industry classification (banking, communications, insurance, etc.). Holdings are subject to change without notice.
The value of each security is quoted as of the last day of the reporting period. The value of securities denominated in foreign currencies is converted into U.S. dollars.
If the Fund invests in foreign securities, it will also provide a summary of investments by country. This summary reports the Fund’s exposure to different countries by providing the percentage of securities invested in each country. The country of each security represents the country of risk. The Fund’s Schedule of Investments relies upon the industry group and country classifications published by Bloomberg L.P. and/or MSCI Inc.
Tables listing details of individual forward currency contracts, futures, written options and swaps follow the Fund’s Schedule of Investments (if applicable).
| |
| 4. | Statement of Assets and Liabilities |
This statement is often referred to as the “balance sheet.” It lists the assets and liabilities of the Fund on the last day of the reporting period.
The Fund’s assets are calculated by adding the value of the securities owned, the receivable for securities sold but not yet settled, the receivable for dividends declared but not yet received on securities owned and the receivable for Fund shares sold to investors but not yet settled. The Fund’s liabilities include payables for securities purchased
Janus Asset Allocation Funds | 63
Useful Information About Your Fund Report (unaudited) (continued)
but not yet settled, Fund shares redeemed but not yet paid and expenses owed but not yet paid. Additionally, there may be other assets and liabilities such as unrealized gain or loss on forward currency contracts.
The section entitled “Net Assets Consist of” breaks down the components of the Fund’s net assets. Because the Fund must distribute substantially all earnings, you will notice that a significant portion of net assets is shareholder capital.
The last section of this statement reports the net asset value (“NAV”) per share on the last day of the reporting period. The NAV is calculated by dividing the Fund’s net assets for each share class (assets minus liabilities) by the number of shares outstanding.
| |
| 5. | Statement of Operations |
This statement details the Fund’s income, expenses, realized gains and losses on securities and currency transactions, and changes in unrealized appreciation or depreciation of Fund holdings.
The first section in this statement, entitled “Investment Income,” reports the dividends earned from securities and interest earned from interest-bearing securities in the Fund.
The next section reports the expenses incurred by the Fund, including the advisory fee paid to the investment adviser, transfer agent fees and expenses, and printing and postage for mailing statements, financial reports and prospectuses. Expense offsets and expense reimbursements, if any, are also shown.
The last section lists the amounts of realized gains or losses from investment and foreign currency transactions, and changes in unrealized appreciation or depreciation of investments and foreign currency-denominated assets and liabilities. The Fund will realize a gain (or loss) when it sells its position in a particular security. A change in unrealized gain (or loss) refers to the change in net appreciation or depreciation of the Fund during the reporting period. “Net Realized and Unrealized Gain/(Loss) on Investments” is affected both by changes in the market value of Fund holdings and by gains (or losses) realized during the reporting period.
| |
| 6. | Statements of Changes in Net Assets |
These statements report the increase or decrease in the Fund’s net assets during the reporting period. Changes in the Fund’s net assets are attributable to investment operations, dividends and distributions to investors and capital share transactions. This is important to investors because it shows exactly what caused the Fund’s net asset size to change during the period.
The first section summarizes the information from the Statement of Operations regarding changes in net assets due to the Fund’s investment operations. The Fund’s net assets may also change as a result of dividend and capital gains distributions to investors. If investors receive their dividends and/or distributions in cash, money is taken out of the Fund to pay the dividend and/or distribution. If investors reinvest their dividends and/or distributions, the Fund’s net assets will not be affected. If you compare the Fund’s “Net Decrease from Dividends and Distributions” to “Reinvested Dividends and Distributions,” you will notice that dividends and distributions have little effect on the Fund’s net assets. This is because the majority of the Fund’s investors reinvest their dividends and/or distributions.
The reinvestment of dividends and distributions is included under “Capital Share Transactions.” “Capital Shares” refers to the money investors contribute to the Fund through purchases or withdrawals via redemptions. The Fund’s net assets will increase and decrease in value as investors purchase and redeem shares from the Fund.
This schedule provides a per-share breakdown of the components that affect the Fund’s NAV for current and past reporting periods as well as total return, asset size, ratios and portfolio turnover rate.
The first line in the table reflects the NAV per share at the beginning of the reporting period. The next line reports the net investment income/(loss) per share. Following is the per share total of net gains/(losses), realized and unrealized. Per share dividends and distributions to investors are then subtracted to arrive at the NAV per share at the end of the period. The next line reflects the total return for the period. The total return may include adjustments in accordance with generally accepted accounting principles required at the period end for financial reporting purposes. As a result, the total return may differ from the total return reflected for individual shareholder transactions. Also included are ratios of expenses and net investment income to average net assets.
The Fund’s expenses may be reduced through expense offsets and expense reimbursements. The ratios shown reflect expenses before and after any such offsets and reimbursements.
The ratio of net investment income/(loss) summarizes the income earned less expenses, divided by the average net assets of the Fund during the reporting period. Don’t
64 | JUNE 30, 2013
confuse this ratio with the Fund’s yield. The net investment income ratio is not a true measure of the Fund’s yield because it doesn’t take into account the dividends distributed to the Fund’s investors.
The next figure is the portfolio turnover rate, which measures the buying and selling activity in the Fund. Portfolio turnover is affected by market conditions, changes in the asset size of the Fund, fluctuating volume of shareholder purchase and redemption orders, the nature of the Fund’s investments, and the investment style and/or outlook of the portfolio managers. A 100% rate implies that an amount equal to the value of the entire portfolio was replaced once during the fiscal year; a 50% rate means that an amount equal to the value of half the portfolio is traded in a year; and a 200% rate means that an amount equal to the value of the entire portfolio is traded every six months.
Janus Asset Allocation Funds | 65
Designation Requirements (unaudited)
For federal income tax purposes, the Funds designated the following for the year ended June 30, 2013:
Capital Gain Distributions
| | | | | | | | | | | |
| Fund | | | | | | |
| |
| |
| Janus Global Allocation Fund - Moderate | | $ | 13,183,743 | | | | | | | |
| |
| |
Foreign Taxes Paid and Foreign Source Income
| | | | | | | | | | | |
| Fund | | Foreign Taxes Paid | | Foreign Source Income | | |
| |
| |
| Janus Global Allocation Fund - Conservative | | $ | 40,190 | | | $ | 344,565 | | | |
| Janus Global Allocation Fund - Growth | | | 110,424 | | | | 953,988 | | | |
| Janus Global Allocation Fund - Moderate | | | 81,172 | | | | 695,949 | | | |
| |
| |
Dividends Received Deduction Percentage
| | | | | | | | | | | |
| Fund | | | | | | |
| |
| |
| Janus Global Allocation Fund - Conservative | | | 68% | | | | | | | |
| Janus Global Allocation Fund - Growth | | | 100% | | | | | | | |
| Janus Global Allocation Fund - Moderate | | | 100% | | | | | | | |
| |
| |
Qualified Dividend Income
| | | | | | | | | | | |
| Fund | | | | | | |
| |
| |
| Janus Global Allocation Fund - Conservative | | | 89% | | | | | | | |
| Janus Global Allocation Fund - Growth | | | 100% | | | | | | | |
| Janus Global Allocation Fund - Moderate | | | 100% | | | | | | | |
| |
| |
66 | JUNE 30, 2013
Trustees and Officers (unaudited)
The Funds’ Statement of Additional Information includes additional information about the Trustees and officers and is available, without charge, by calling 1-877-335-2687.
The following are the Trustees and officers of the Trust, together with a brief description of their principal occupations during the last five years (principal occupations for certain Trustees may include periods over five years).
Each Trustee has served in that capacity since he or she was originally elected or appointed. The Trustees do not serve a specified term of office. Each Trustee will hold office until the termination of the Trust or his or her earlier death, resignation, retirement, incapacity, or removal. Pursuant to the Funds’ Governance Procedures and Guidelines, Trustees are required to retire no later than the end of the calendar year in which the Trustee turns 72. The Trustees review the Funds’ Governance Procedures and Guidelines from time to time and may make changes they deem appropriate. The Trust’s Nominating and Governance Committee will consider nominees for the position of Trustee recommended by shareholders. Shareholders may submit the name of a candidate for consideration by the Committee by submitting their recommendations to the Trust’s Secretary. Each Trustee is currently a Trustee of one other registered investment company advised by Janus Capital: Janus Aspen Series. Collectively, these two registered investment companies consist of 56 series or funds.
The Trust’s officers are elected annually by the Trustees for a one-year term. Certain officers also serve as officers of Janus Aspen Series. Certain officers of the Funds may also be officers and/or directors of Janus Capital. officers receive no compensation from the Funds, except for the Funds’ Chief Compliance Officer, as authorized by the Trustees.
TRUSTEES
| | | | | | | | | | | |
| |
| | | | | | | | | | | Other Directorships
|
| | | | | | | Principal Occupations
| | Number of Portfolios/Funds
| | Held by Trustee
|
| | | Positions Held
| | Length of
| | During the Past Five
| | in Fund Complex
| | During the Past Five
|
| Name, Address, and Age | | with the Trust | | Time Served | | Years | | Overseen by Trustee | | Years |
| |
| |
Independent Trustees | | | | | | | | | | |
| | | | | | | | | | | |
William F. McCalpin
151 Detroit Street
Denver, CO 80206
DOB: 1957 | | Chairman
Trustee | | 1/08-Present
6/02-Present | | Managing Director, Holos Consulting LLC (provides consulting services to foundations and other nonprofit organizations). Formerly, Executive Vice President and Chief Operating Officer of The Rockefeller Brothers Fund (a private family foundation) (1998-2006). | | 56 | | Chairman of the Board and Director of The Investment Fund for Foundations Investment Program (TIP) (consisting of 2 funds); and Director of the F.B. Heron Foundation (a private grantmaking foundation). |
| | | | | | | | | | | |
Alan A. Brown
151 Detroit Street
Denver, CO 80206
DOB: 1962 | | Trustee | | 1/13-Present | | Managing Director, Institutional Markets, of Dividend Capital Group (private equity real estate investment management firm) (since 2012). Formerly, Executive Vice President and Co-Head, Global Private Client Group (2007-2010), Executive Vice President, Mutual Funds (2005-2007), and Chief Marketing Officer (2001-2005) of Nuveen Investments, Inc. (asset management). | | 56 | | Director of MotiveQuest LLC (strategic social market research company) (since 2003); and Director of WTTW (PBS affiliate) (since 2003). Formerly, Director of Nuveen Global Investors LLC (2007-2011); Director of Communities in Schools (2004-2010); and Director of Mutual Fund Education Alliance (until 2010). |
| |
| |
Janus Asset Allocation Funds | 67
Trustees and Officers (unaudited) (continued)
TRUSTEES (continued)
| | | | | | | | | | | |
| | | | | | | | | | | Other Directorships
|
| | | | | | | Principal Occupations
| | Number of Portfolios/Funds
| | Held by Trustee
|
| | | Positions Held
| | Length of
| | During the Past Five
| | in Fund Complex
| | During the Past Five
|
| Name, Address, and Age | | with the Trust | | Time Served | | Years | | Overseen by Trustee | | Years |
| |
| |
| | | | | | | | | | | |
William D. Cvengros
151 Detroit Street
Denver, CO 80206
DOB: 1948 | | Trustee | | 1/11-Present | | Managing Member and Chief Executive Officer of SJC Capital, LLC (a personal investment company and consulting firm) (since 2002). Formerly, Venture Partner for The Edgewater Funds (a middle market private equity firm) (2002-2004); Chief Executive Officer and President of PIMCO Advisors Holdings L.P. (a publicly traded investment management firm) (1994-2000); and Chief Investment Officer of Pacific Life Insurance Company (a mutual life insurance and annuity company (1987-1994). | | 56 | | Chairman, National Retirement Partners, Inc. (formerly a network of advisors to 401(k) plans) (since 2005). Formerly, Director of Prospect Acquisition Corp. (a special purpose acquisition corporation) (2007-2009); Director of RemedyTemp, Inc. (temporary help services company) (1996-2006); and Trustee of PIMCO Funds Multi-Manager Series (1990-2000) and Pacific Life Variable Life & Annuity Trusts (1987-1994). |
| | | | | | | | | | | |
James T. Rothe
151 Detroit Street
Denver, CO 80206
DOB: 1943 | | Trustee | | 1/97-Present | | Co-founder and Managing Director of Roaring Fork Capital SBIC, L.P. (SBA SBIC fund focusing on private investment in public equity firms), and Professor Emeritus of Business of the University of Colorado, Colorado Springs, CO (since 2004). Formerly, Professor of Business of the University of Colorado (2002-2004), and Distinguished Visiting Professor of Business (2001-2002) of Thunderbird (American Graduate School of International Management), Glendale, AZ. | | 56 | | Director of Red Robin Gourmet Burgers, Inc. (RRGB) (since 2004). |
| | | | | | | | | | | |
William D. Stewart
151 Detroit Street
Denver, CO 80206
DOB: 1944 | | Trustee | | 6/84-Present | | Retired. Formerly, Corporate Vice President and General Manager of MKS Instruments - HPS Products, Boulder, CO (a manufacturer of vacuum fittings and valves) and PMFC Division, Andover, MA (manufacturing pressure measurement and flow products) (1976-2012). | | 56 | | None |
| |
| |
68 | JUNE 30, 2013
TRUSTEES (continued)
| | | | | | | | | | | |
| | | | | | | | | | | Other Directorships
|
| | | | | | | Principal Occupations
| | Number of Portfolios/Funds
| | Held by Trustee
|
| | | Positions Held
| | Length of
| | During the Past Five
| | in Fund Complex
| | During the Past Five
|
| Name, Address, and Age | | with the Trust | | Time Served | | Years | | Overseen by Trustee | | Years |
| |
| |
| | | | | | | | | | | |
Linda S. Wolf
151 Detroit Street
Denver, CO 80206
DOB: 1947 | | Trustee | | 11/05-Present | | Retired. Formerly, Chairman and Chief Executive Officer of Leo Burnett (Worldwide) (advertising agency) (2001-2005). | | 56 | | Director of Chicago Convention & Tourism Bureau, Chicago Council on Global Affairs, The Field Museum of Natural History (Chicago, IL), InnerWorkings (U.S. provider of print procurement solutions to corporate clients), Lurie Children’s Hospital
(Chicago, IL), Rehabilitation Institute of Chicago, Wal-Mart, and Wrapports, LLC (digital communications company). |
| |
| |
Janus Asset Allocation Funds | 69
Trustees and Officers (unaudited) (continued)
OFFICERS
| | | | | | | |
| |
| | | Positions Held
| | Term of Office* and
| | Principal Occupations
|
| Name, Address, and Age | | with the Trust | | Length of Time Served | | During the Past Five Years |
| |
| |
| | | | | | | |
Daniel G. Scherman
151 Detroit Street
Denver, CO 80206
DOB: 1961 | | Executive Vice President and
Portfolio Manager
Janus Global Allocation Fund - Growth, Janus Global Allocation Fund - Moderate, Janus Global Allocation Fund - Conservative | | 12/05-Present
| | Senior Vice President and Chief Risk Officer of Janus Capital and Portfolio Manager for other Janus accounts. |
| | | | | | | |
Robin C. Beery
151 Detroit Street
Denver, CO 80206
DOB: 1967 | | President and Chief Executive Officer | | 4/08-Present | | Executive Vice President and Head of U.S. Distribution of Janus Capital Group Inc., Janus Capital, Janus Distributors LLC, and Janus Services LLC; Director of The Janus Foundation; Director of Perkins Investment Management LLC; and Working Director of INTECH Investment Management LLC. Formerly, Head of Intermediary Distribution, Global Marketing and Product of Janus Capital Group Inc., Janus Capital, Janus Distributors LLC, and Janus Services LLC (2009-2010); and Chief Marketing Officer of Janus Capital Group Inc. and Janus Capital (2002-2009). |
| | | | | | | |
Stephanie Grauerholz-Lofton
151 Detroit Street
Denver, CO 80206
DOB: 1970 | | Chief Legal Counsel and Secretary
Vice President | | 1/06-Present
3/06-Present | | Vice President and Assistant General Counsel of Janus Capital, and Vice President and Assistant Secretary of Janus Distributors LLC. |
| | | | | | | |
David R. Kowalski
151 Detroit Street
Denver, CO 80206
DOB: 1957 | | Vice President, Chief Compliance Officer, and Anti-Money Laundering Officer | | 6/02-Present | | Senior Vice President and Chief Compliance Officer of Janus Capital, Janus Distributors LLC, and Janus Services LLC; and Vice President of INTECH Investment Management LLC and Perkins Investment Management LLC. Formerly, Chief Compliance Officer of Bay Isle Financial LLC (2003-2008). |
| | | | | | | |
Jesper Nergaard
151 Detroit Street
Denver, CO 80206
DOB: 1962 | | Chief Financial Officer
Vice President, Treasurer, and Principal Accounting Officer | | 3/05-Present
2/05-Present | | Vice President of Janus Capital and Janus Services LLC. |
| |
| |
* Officers are elected at least annually by the Trustees for a one-year term and may also be elected from time to time by the Trustees for an interim period.
70 | JUNE 30, 2013
Notes
Janus Asset Allocation Funds | 71
Notes
Janus Asset Allocation Funds | 73
Janus provides access to a wide range of investment disciplines.
Alternative
Janus alternative funds seek to deliver strong risk-adjusted returns over a full market cycle with lower correlation to equity markets than traditional investments.
Asset Allocation
Janus’ asset allocation funds utilize our fundamental, bottom-up research to balance risk over the long term. From fund options that meet investors’ risk tolerance and objectives to a method that incorporates non-traditional investment choices to seek non-correlated sources of risk and return, Janus’ asset allocation funds aim to allocate risk more effectively.
Fixed Income
Janus fixed income funds attempt to provide less risk relative to equities while seeking to deliver a competitive total return through high current income and appreciation. Janus money market funds seek capital preservation and liquidity with current income as a secondary objective.
Global & International
Janus global and international funds seek to leverage Janus’ research capabilities by taking advantage of inefficiencies in foreign markets, where accurate information and analytical insight are often at a premium.
Growth & Core
Janus growth funds focus on companies believed to be the leaders in their respective industries, with solid management teams, expanding market share, margins and efficiencies. Janus core funds seek investments in more stable and predictable companies. Our core funds look for a strategic combination of steady growth and, for certain funds, some degree of income.
Mathematical
Our mathematical funds seek to outperform their respective indices while maintaining a risk profile equal to or lower than the index itself. Managed by INTECH (a Janus subsidiary), these funds use a mathematical process in an attempt to build a more “efficient” portfolio than the index.
Value
Our value funds, managed by Perkins (a Janus subsidiary), seek to identify companies with favorable reward to risk characteristics by conducting rigorous downside analysis before determining upside potential.
For more information about our funds, contact your investment professional or go to janus.com/advisor/mutual-funds (or janus.com/allfunds if you hold Shares directly with Janus).
Please consider the charges, risks, expenses and investment objectives carefully before investing. For a prospectus containing this and other information, please call Janus at 877.33JANUS (52687) (or 800.525.3713 if you hold Shares directly with Janus); or download the file from janus.com/info (or janus.com/reports if you hold Shares directly with Janus). Read it carefully before you invest or send money.
Funds distributed by Janus Distributors LLC (08/13)
| | | | | | | | | | |
| Investment products offered are: | | | NOT FDIC-INSURED | | | MAY LOSE VALUE | | | NO BANK GUARANTEE |
| | | | | | | | | | |
| |
| C-0813-42687 | 125-02-93005 08-13 |
ANNUAL REPORT
June 30, 2013
Janus Fixed Income Fund
(formerly named Janus Real Return Allocation Fund)
HIGHLIGHTS
| |
| • | Portfolio management perspective |
| • | Investment strategy behind your fund |
| • | Fund performance, characteristics and holdings |
Table of Contents
Janus Fixed Income Fund
| | | |
| | 1 |
| | |
| | 3 |
| | 12 |
| | 13 |
| | 14 |
| | 15 |
| | 16 |
| | 19 |
| | 35 |
| | 36 |
| | 40 |
| | 43 |
| | 44 |
Please consider the charges, risks, expenses and investment objectives carefully before investing. For a prospectus or, if available, a summary prospectus containing this and other information, please call Janus at 877.33JANUS(52687) (or 800.525.3713 if you hold Shares directly with Janus). You can also visit janus.com/info (or janus.com/reports if you hold Shares directly with Janus). Read it carefully before you invest or send money.
Co-Chief Investment Officers’ Market Perspective (unaudited)
Jonathan Coleman, CFA
Chief Investment
Officer, Equities
Gibson Smith
Chief Investment
Officer, Fixed Income
Economy: Substantive improvement
The U.S. economy is showing signs of real, if uneven, improvement. The market seems obsessed with whether the Federal Reserve (Fed) will taper its bond-buying program by the end of the year, but is not focused on the continued improvement of the overall economy. We would not be surprised to see the Fed begin to taper its quantitative easing (QE) program over the next 12 months, but believe that it will leave short-term interest rates near zero for the foreseeable future. We also believe that global central banks will keep a high level of liquidity in the system. We continue to monitor potential global risk, particularly in China and Japan, but believe both of these concerns will abate in the medium term and that markets will refocus on the recovery.
Equities: Beyond the “wall of worry”
Equity markets have essentially climbed a “wall of worry” over the last six months, including the threat of falling off the fiscal cliff, then the potential impact of the sequester, and finally, concerns over Cyprus. Talking heads claimed these events spelled doomsday for the economy, but the market shrugged off each one and powered on. Now more speculative areas of the market, such as the Russell 2000 Index of U.S. small-capitalization companies, have hit all-time highs. Price/earnings multiples have expanded as stock price appreciation has exceeded the underlying earnings growth of many companies.
We think this is just when investors should be a little more cautious. The recent rally has been driven in part by a belief that the Fed and other central banks will backstop equity markets by pumping liquidity into the system forever. In late June, we got a glimpse of what happens to stock markets when the Fed even hints at taking its foot off the gas: there can be a sell-off.
Our view on the economy and equity markets has not turned negative, just more balanced. Many positives for the economy still exist. For instance, cheaper oil and natural gas in the U.S., along with more competitive labor costs, are creating a manufacturing renaissance. That’s a long-term benefit that could last a decade or longer. The U.S. housing market continues to be strong. In Europe, industrial companies are finally going through a painful restructuring that should right-size their businesses and make them more competitive on a global basis. European banks have also made significant strides in cutting costs and fortifying their balance sheets. But many of these longer-term dynamics already have been priced into stocks, or in other cases, they will take a long time to play out. The challenge as equity investors is to find those companies that can decouple from the economy, control their own destinies, and demonstrate strong growth even in the face of a slow-growth economy.
Fixed Income: Rate risk increases
As the economy gains stronger footing, the Fed will be given the opportunity to slowly remove its overly accommodative policy. While some investors may believe that we’ve seen the end of the bull market in fixed income, we are reminded that since 1980 we have seen 16 periods during which the 10-year Treasury yield rose by more than 100 basis points (1 percentage point). The 30-year bull market has hardly been a straight line up, with nothing but positive returns for fixed income investors — there have been periods of both angst and celebration, with the long-term trend being lower rates.
Making bold calls that the bull market in bonds is over can grab media attention and create fear for fixed-income investors, but the reality is that markets are always in motion and creating opportunities. This environment reminds us of the importance of active versus passive management in fixed income and the importance of capital preservation in uncertain times. While we may be entering a period where interest rates trend higher over the longer term, in the short and medium term there will be new opportunities created by change.
Because we tend to generate the majority of our excess return through security selection, we see this as a time of opportunity. Credit risk (i.e., the risk that borrowers will default) has been relatively low for years due to the excess levels of cash held on corporate balance sheets, and we believe that will continue. A back-up in rates may have the positive effect of lowering fixed income valuations and opening up fresh opportunities for investing
Janus Fixed Income Fund | 1
(Continued) (unaudited)
at more attractive levels in credits that we believe offer good risk-adjusted return potential.
Sincerely,
Jonathan Coleman
Co-Chief Investment Officer
Gibson Smith
Co-Chief Investment Officer
2 | JUNE 30, 2013
Janus Real Return Fund (unaudited)
| | | | | | | |
Fund Snapshot
The fund employs a bottom-up fundamentally driven investment process designed to protect against the potential for inflationary or deflationary environments. The nontraditional portfolio invests across a broad range of fixed income, including short-duration high yield.
| | | | 
Darrell Watters
co-portfolio manager | | 
Gibson Smith
co-portfolio manager |
PERFORMANCE OVERVIEW
For the 12-month period ended June 30, 2013, Janus Real Return Fund’s Class I Shares returned 2.66%. This compares with -0.92% for its primary benchmark, the Barclays U.S. 1-5 Year TIPS Index.
MARKET ENVIRONMENT
The period began with concern about slow global economic growth, prompting additional stimulus from major central banks including the U.S. Federal Reserve (Fed), the European Central Bank and the Bank of Japan. Toward the end of calendar year 2012, worries grew about the “fiscal cliff,” a potentially recessionary mix of U.S. spending cuts and tax increases scheduled to take effect in January 2013. However, lawmakers delayed some elements of the fiscal cliff until March 2013, softening the impact, and the Fed continued to reiterate support for the markets via quantitative easing (QE) and near-zero interest rates.
By spring, there were signs that economic growth was improving. The U.S. economy seemed to weather the impact of government spending cuts that took effect in March, and employment data showed strengthening hiring patterns beginning in April. By May, markets were beginning to speculate about the eventual end of the Fed’s QE program, and longer-term Treasury yields rose. U.S. inflation remained subdued, however, with the core Consumer Price Index (CPI) easing to a 1.7% year-over-year growth rate and the core personal consumption expenditures (PCE) price index falling to 1.1%.
FUND REPOSITIONING
On October 15, 2012, the Fund became known as the Janus Real Return Fund. The Fund’s primary benchmark changed to the Barclays U.S. 1-5 Year TIPS Index. Darrell Watters was added as Co-Portfolio Manager along with existing Portfolio Manager Gibson Smith. John Brynjolfsson is no longer a portfolio manager for the Fund, as Armored Wolf is no longer a subadviser to the Fund.
During the period, we repositioned the Fund to leverage our fixed income capabilities in an effort to improve fund performance and to deliver a product designed to help investors shield the impact of inflation and rising interest rates. At period end the Janus Real Return Fund was composed primarily of fixed income securities, instead of allocating among six asset classes. We anticipate that the Fund will have the majority of its portfolio allocated between and among short-duration high-yield and Treasury securities. In addition, we anticipate making select investments in other inflation-oriented securities that may include equities, real estate, convertibles, preferreds, commodities and inflation-linked bonds. The allocations will be adjusted depending on the inflationary or deflationary environment as viewed by the portfolio management team.
PERFORMANCE DISCUSSION
Prior to the Fund’s repositioning, for the period of July 1 through October 14, 2012, the Janus Real Return Allocation Fund produced positive total return. The Fund’s global real estate holdings were the greatest contributors to total return, followed by emerging market equity. The Fund’s Treasury Inflation-Protected Securities (TIPS) sleeve detracted from total return.
For the period October 15, 2012, through June 30, 2013, the Janus Real Return Fund outperformed its benchmark, the Barclays U.S. 1-5 Year TIPS Index. Our allocation to corporate credit was the top contributor to outperformance during the period, followed by our Treasury holdings. Our holdings in convertibles and exchange-traded funds (ETFs) detracted from relative performance.
In terms of corporate credit sectors, the top contributors were banking, noncaptive diversified financial companies and gaming. Detractors were led by metals; other sectors including natural gas pipelines and diversified manufacturing companies were neutral for relative performance.
Janus Fixed Income Fund | 3
Janus Real Return Fund (unaudited)
Individual corporate credit contributors were led by financial services company Wells Fargo, which reported record earnings during the period amid reduced expenses, strong asset quality, and better than expected gain-on-sale in mortgage banking.
Individual credit detractors were led by steelmaker ArcelorMittal, which was pressured by concerns about slowing global growth, particularly in China. ArcelorMittal also issued shares and convertible notes early in the period, intending to use the proceeds to reduce debt. While this should be positive for the company’s bondholders over the longer term, the additional supply pressured its existing bonds. Over time, we believe that ArcelorMittal’s efforts to improve its balance sheet will provide benefits to its investors.
Prior to the repositioning, the Fund held futures, swaps, options and forward currency contracts, which in aggregate detracted from performance. We used currency derivatives to hedge existing currency exposures and swaps to access markets in which we were not trading locally either due to our risk policies or an inability to trade locally. We executed sales and purchases of puts and calls to hedge existing equity exposures and sold puts on non-existing positions to hedge other similar securities. In an effort to capitalize on the volatility in certain sectors, we periodically sold short-duration, out-of-the-money put and call options in liquid, well-understood names. The rationale behind this strategy was to generate additional income for shareholders while limiting risks to potentially having to buy or sell shares at what we viewed as attractive entry/exit prices. Please see the Derivative Instruments section in the “Notes to Financial Statements” for a discussion of derivatives used by the Fund.
OUTLOOK
Over the past few years, the Fed’s unconventional monetary policies have suppressed U.S. Treasury rates to unprecedented lows in an effort to stimulate economic growth. Recent U.S. economic data reflects modest acceleration that may give the Fed the support it needs to begin tapering quantitative easing. However, we still believe the Fed will leave short-term interest rates unchanged for an extended period. We currently expect core U.S. Consumer Price Inflation (CPI) to remain subdued at around 1.7% in 2013, below the Fed’s 2% inflation target, which should give policymakers room to continue accommodation.
Security selection in fixed income has become extremely important, in our view, as valuations have become stretched due to investors’ search for yield and the growing risk of higher interest rates. In this environment, we believe that preservation of capital must take priority over aggressive return seeking. This is not to say that great opportunities have disappeared from the fixed income market — they have not, and we are still finding some — but the universe of securities to select from today is much narrower than it has been over the last four years. Fortunately, a back-up in rates may have the positive effect of lowering fixed income valuations and opening up fresh opportunities for investing at more attractive levels in credits that we believe offer the potential for good risk-adjusted returns.
Because we focus on generating excess return through security selection, we see this as a time of great opportunity. Credit risk (i.e., the risk that borrowers will default) has been relatively low for years due to the excess levels of cash held on corporate balance sheets, and we believe that will continue. We believe returns this year will be significantly influenced not just by what we own, but by what we have chosen not to own: There are many securities that offer what we view as asymmetric risk profiles, with greater downside risk exposure, and we intend to steer around them. In our view, the key to success for the remainder of the year will be driving performance through security selection while navigating interest-rate volatility.
On behalf of each member of our investment team, thank you for your investment in Janus Real Return Fund. We appreciate your entrusting us with your assets and look forward to continuing to serve your investment needs.
4 | JUNE 30, 2013
(unaudited)
Janus Real Return Fund At A Glance
June 30, 2013
| | | |
Weighted Average Maturity | | 4.3 Years |
Average Effective Duration* | | 2.1 Years |
30-day Current Yield** | | |
| Class A Shares at NAV | | |
| Without Reimbursement | | –0.96% |
| With Reimbursement | | 1.64% |
| Class A Shares at MOP | | |
| Without Reimbursement | | –0.92% |
| With Reimbursement | | 1.57% |
| Class C Shares*** | | |
| Without Reimbursement | | –1.77% |
| With Reimbursement | | 0.90% |
| Class D Shares | | |
| Without Reimbursement | | –1.93% |
| With Reimbursement | | 1.73% |
| Class I Shares | | |
| Without Reimbursement | | –0.69% |
| With Reimbursement | | 1.89% |
| Class S Shares | | |
| Without Reimbursement | | –1.16% |
| With Reimbursement | | 1.40% |
| Class T Shares | | |
| Without Reimbursement | | –0.93% |
| With Reimbursement | | 1.63% |
Number of Bonds/Notes | | 73 |
| | | |
| * | | A theoretical measure of price volatility |
| ** | | Yield will fluctuate |
| *** | | Does not include the 1.00% contingent deferred sales charge. |
Ratings† Summary – (% of Fixed Income Securities)
June 30, 2013
| | | |
AA | | 18.4% |
A | | 1.2% |
BBB | | 18.1% |
BB | | 34.7% |
B | | 24.7% |
CCC | | 2.9% |
| | | |
| † | | Bond ratings provided by Standard & Poor’s. Not rated securities are not rated by S&P but may be rated by other rating agencies. Bond ratings are measured on a scale that generally ranges from AAA (highest) to D (lowest). |
Significant Areas of Investment – (% of Net Assets)
As of June 30, 2013
Asset Allocation – (% of Net Assets)
As of June 30, 2013
Janus Fixed Income Fund | 5
Janus Real Return Fund (unaudited)
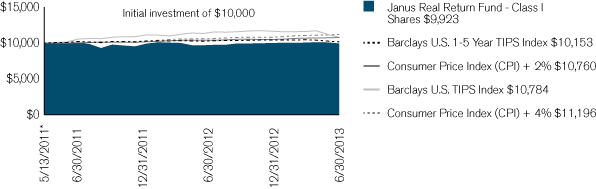
| | | | | | | | | | |
| Average Annual Total Return – for the periods ended June 30, 2013 | | | Expense Ratios – per the October 26, 2012 prospectuses |
| | | One
| | Since
| | | Total Annual Fund
| | Net Annual Fund
|
| | | Year | | Inception* | | | Operating Expenses | | Operating Expenses |
| | | | | | | | | | |
| Janus Real Return Fund – Class A Shares | | | | | | | 1.50% | | 1.01% |
| | | | | | | | | | |
| NAV | | 2.37% | | –0.61% | | | | | |
| | | | | | | | | | |
| MOP | | –3.49% | | –3.33% | | | | | |
| | | | | | | | | | |
| Janus Real Return Fund – Class C Shares | | | | | | | 2.24% | | 1.76% |
| | | | | | | | | | |
| NAV | | 1.64% | | –1.33% | | | | | |
| | | | | | | | | | |
| CDSC | | 0.64% | | –1.33% | | | | | |
| | | | | | | | | | |
| Janus Real Return Fund – Class D Shares(1) | | 2.59% | | –0.47% | | | 1.52% | | 0.88% |
| | | | | | | | | | |
| Janus Real Return Fund – Class I Shares | | 2.66% | | –0.36% | | | 1.24% | | 0.76% |
| | | | | | | | | | |
| Janus Real Return Fund – Class S Shares | | 2.51% | | –0.66% | | | 1.74% | | 1.26% |
| | | | | | | | | | |
| Janus Real Return Fund – Class T Shares | | 2.76% | | –0.43% | | | 1.49% | | 1.01% |
| | | | | | | | | | |
| Barclays U.S. 1-5 Year TIPS Index | | –0.92% | | 0.72% | | | | | |
| | | | | | | | | | |
| Consumer Price Index (CPI) + 2% | | 3.75% | | 3.58%(2) | | | | | |
| | | | | | | | | | |
| Barclays U.S. TIPS Index | | –4.78% | | 3.61% | | | | | |
| | | | | | | | | | |
| Consumer Price Index (CPI) + 4% | | 5.75% | | 5.57%(2) | | | | | |
| | | | | | | | | | |
| Morningstar Quartile – Class I Shares | | 4th | | 4th | | | | | |
| | �� | | | | | | | | |
| Morningstar Ranking – based on total return for Multisector Bond Funds | | 239/308 | | 270/276 | | | | | |
| | | | | | | | | | |
| Visit janus.com/advisor/mutual-funds (or janus.com/allfunds if you hold Shares directly with Janus Capital) to view current performance and characteristic information | | | | | |
| | | | | | | | | | |
Returns quoted are past performance and do not guarantee future results; current performance may be lower or higher. Investment returns and principal value will vary; there may be a gain or loss when shares are sold. For the most recent month-end performance call 877.33JANUS(52687) (or 800.525.3713 if you hold shares directly with Janus Capital) or visit janus.com/advisor/mutual-funds (or janus.com/allfunds if you hold shares directly with Janus Capital).
Performance shown for Class A Shares at Maximum Offering Price (MOP) includes the Fund’s maximum sales charge of 4.75%. Performance shown at Net Asset Value (NAV) does not include this charge and would have been lower had this charge been taken into account.
Performance shown for Class C Shares includes a 1% contingent deferred sales charge (CDSC) on periods of less than 12 months. Performance shown at Net Asset Value (NAV) does not include this sales charge and would have been lower had this sales charge been taken into account.
See important disclosures on the next page.
6 | JUNE 30, 2013
(unaudited)
Net expense ratios reflect the expense waiver, if any, Janus Capital has contractually agreed to through November 1, 2013.
The expense ratios shown are estimated.
The Fund’s performance may be affected by risks that include those associated with nondiversification, non-investment grade debt securities, high-yield/high-risk securities, investments in specific industries or countries and potential conflicts of interest with the Janus “funds of funds.” Additional risks to the Fund may also include, but are not limited to, those associated with investing in foreign securities, emerging markets, initial public offerings (“IPOs”), real estate investment trusts (“REITs”), and derivatives. Please see the Fund’s prospectuses or janus.com/info (or janus.com/reports if you hold shares directly with Janus Capital) for more information about risks, portfolio holdings and other details.
Inflation-linked bonds typically have lower yields than conventional fixed-rate bonds due to their inflation adjustment feature and normally decline in price when interest rates rise.
The Fund invests in REITs which may be subject to a higher degree of market risk because of concentration in a specific industry, sector or geographic region. REITs may be subject to risks including, but not limited to: legal, political, liquidity, interest rate risks, a decline in the value of real estate, risks related to general and economic conditions, changes in the value of the underlying property owned by the trust and defaults by borrowers. To the extent the Fund invests in foreign REITs, the Fund may be subject to fluctuations in currency rates or political or economic conditions in a particular country.
The Fund invests in derivatives which can be highly volatile and involve additional risks than if the underlying securities were held directly by the Fund. Such risks include gains or losses which, as a result of leverage, can be substantially greater than the derivatives’ original cost. There is also a possibility that derivatives may not perform as intended which can reduce opportunity for gains or result in losses by offsetting positive returns in other securities the Fund owns.
Funds that invest in bonds have the same interest rate, inflation, and credit risks that are associated with the underlying bonds owned by the Fund. Unlike owning individual bonds, there are ongoing fees and expenses associated with owning shares of bonds funds. The return of principal is not guaranteed due to net asset value fluctuation that is caused by changes in the price of specific bonds held in the fund and selling of bonds within the fund by the portfolio managers.
High-yield/high-risk bonds, also known as “junk” bonds, involve a greater risk of default and price volatility than investment grade bonds. High-yield/high-risk bonds can experience sudden and sharp price swings which will affect net asset value.
For a period of three years subsequent to the Fund’s commencement of operations or until the Fund’s assets exceed the first breakpoint in the investment advisory fee schedule that was effective at commencement of operations, whichever occurs first, Janus Capital may recover from the Fund fees and expenses previously waived or reimbursed, which could then be considered a deferral, if the Fund’s expense ratio, including recovered expenses, falls below the expense limit.
Holding a meaningful portion of assets in cash or cash equivalents may negatively affect performance.
Returns include reinvestment of all dividends and distributions. The returns do not include adjustments in accordance with generally accepted accounting principles required at the period end for financial reporting purposes.
Ranking is for the share class shown only; other classes may have different performance characteristics. When an expense waiver is in effect, it may have a material effect on the total return or yield, and therefore the ranking for the period.
® 2013 Morningstar, Inc. All Rights Reserved.
There is no assurance that the investment process will consistently lead to successful investing.
See Notes to Schedule of Investments and Other Information for index definitions.
The Fund’s portfolio may differ significantly from the securities held in the indices. The indices are unmanaged and are not available for direct investment; therefore, their performance does not reflect the expenses associated with the active management of an actual portfolio.
See “Useful Information About Your Fund Report.”
Effective October 15, 2012, Janus Real Return Allocation Fund changed its name to Janus Real Return Fund and its primary benchmark from the Barclays U.S. TIPS Index to the Barclays U.S. 1-5 Year TIPS Index. In addition, the Fund changed its secondary benchmark from the Consumer Price Index + 4% to the Consumer Price Index + 2%.
| | | |
| * | | The Fund’s inception date — May 13, 2011 |
| (1) | | Closed to new investors. |
| (2) | | The Consumer Price Index + 2% and the Consumer Price Index + 4% since inception returns are calculated from May 31, 2011. |
Janus Fixed Income Fund | 7
Janus Real Return Fund (unaudited)
As a shareholder of the Fund, you incur two types of costs: (1) transaction costs, such as sales charges (loads) on purchase payments (applicable to Class A Shares only); and (2) ongoing costs, including management fees; distribution and shareholder servicing (12b-1) fees; administrative services fees payable pursuant to the Transfer Agency Agreement; and other Fund expenses. This example is intended to help you understand your ongoing costs (in dollars) of investing in the Fund and to compare these costs with the ongoing costs of investing in other mutual funds. To do so, compare this 5% hypothetical example with the 5% hypothetical examples that appear in the shareholder reports of the other funds. The example is based upon an investment of $1,000 invested at the beginning of the period and held for the six-months indicated, unless noted otherwise in the table and footnotes below.
Actual Expenses
The information in the table under the heading “Actual” provides information about actual account values and actual expenses. You may use the information in these columns, together with the amount you invested, to estimate the expenses that you paid over the period. Simply divide your account value by $1,000 (for example, an $8,600 account value divided by $1,000 = 8.6), then multiply the result by the number in the appropriate column for your share class under the heading entitled “Expenses Paid During Period” to estimate the expenses you paid on your account during the period.
Hypothetical Example for Comparison Purposes
The information in the table under the heading “Hypothetical (5% return before expenses)” provides information about hypothetical account values and hypothetical expenses based upon the Fund’s actual expense ratio and an assumed rate of return of 5% per year before expenses, which is not the Fund’s actual return. The hypothetical account values and expenses may not be used to estimate the actual ending account balance or expenses you paid for the period. You may use this information to compare the ongoing costs of investing in the Fund and other funds. To do so, compare this 5% hypothetical example with the 5% hypothetical examples that appear in the shareholder reports of the other funds. Additionally, for an analysis of the fees associated with an investment in any share class or other similar funds, please visit www.finra.org/fundanalyzer.
Please note that the expenses shown in the table are meant to highlight your ongoing costs only and do not reflect any transaction costs. These fees are fully described in the Fund’s prospectuses. Therefore, the hypothetical examples are useful in comparing ongoing costs only, and will not help you determine the relative total costs of owning different funds. In addition, if these transaction costs were included, your costs would have been higher.
| | | | | | | | | | | | | | | | | | | | | | | | | | | | | | | |
| | | | | Hypothetical
| | | | |
| | | Actual | | (5% return before expenses) | | | | |
| | | Beginning
| | Ending
| | Expenses
| | Beginning
| | Ending
| | Expenses
| | | | |
| | | Account
| | Account
| | Paid During
| | Account
| | Account
| | Paid During
| | Net Annualized
| | |
| | | Value
| | Value
| | Period
| | Value
| | Value
| | Period
| | Expense Ratio
| | |
| | | (1/1/13) | | (6/30/13) | | (1/1/13-6/30/13)† | | (1/1/13) | | (6/30/13) | | (1/1/13-6/30/13)† | | (1/1/13-6/30/13) | | |
| |
| |
| Class A Shares | | $ | 1,000.00 | | | $ | 993.40 | | | $ | 4.99 | | | $ | 1,000.00 | | | $ | 1,019.79 | | | $ | 5.06 | | | | 1.01% | | | |
| |
| |
| Class C Shares | | $ | 1,000.00 | | | $ | 990.30 | | | $ | 8.69 | | | $ | 1,000.00 | | | $ | 1,016.07 | | | $ | 8.80 | | | | 1.76% | | | |
| |
| |
| Class D Shares | | $ | 1,000.00 | | | $ | 995.80 | | | $ | 4.50 | | | $ | 1,000.00 | | | $ | 1,020.28 | | | $ | 4.56 | | | | 0.91% | | | |
| |
| |
| Class I Shares | | $ | 1,000.00 | | | $ | 994.30 | | | $ | 3.76 | | | $ | 1,000.00 | | | $ | 1,021.03 | | | $ | 3.81 | | | | 0.76% | | | |
| |
| |
| Class S Shares | | $ | 1,000.00 | | | $ | 993.90 | | | $ | 2.82 | | | $ | 1,000.00 | | | $ | 1,021.97 | | | $ | 2.86 | | | | 0.57% | | | |
| |
| |
| Class T Shares | | $ | 1,000.00 | | | $ | 996.30 | | | $ | 1.88 | | | $ | 1,000.00 | | | $ | 1,022.91 | | | $ | 1.91 | | | | 0.38% | | | |
| |
| |
| | | |
| † | | Expenses Paid During Period are equal to the Net Annualized Expense Ratio multiplied by the average account value over the period, multiplied by the number of days in the most recent six-month period, divided by the number of days in the fiscal year. Expenses in the examples include the effect of applicable fee waivers and/or expense reimbursements, if any. Had such waivers and/or reimbursements not been in effect, your expenses would have been higher. Please refer to the Notes to Financial Statements or the Fund’s prospectuses for more information regarding waivers and/or reimbursements. |
8 | JUNE 30, 2013
Janus Real Return Fund(1)
Schedule of Investments
As of June 30, 2013
| | | | | | | | | | | |
| Shares or Principal Amount | | Value | | | |
| |
| Common Stock – 0.5% | | | | | | |
| Oil Companies – Exploration and Production – 0.5% | | | | | | |
| | 3,745 | | | Chesapeake Energy Corp. (cost $73,777) | | $ | 76,323 | | | |
| |
| |
| Corporate Bonds – 68.0% | | | | | | |
| Aerospace and Defense – Equipment – 2.5% | | | | | | |
| | $13,000 | | | Exelis, Inc.
4.2500%, 10/1/16 | | | 13,707 | | | |
| | 332,000 | | | TransDigm, Inc.
7.7500%, 12/15/18 | | | 349,430 | | | |
| | | | | | | | 363,137 | | | |
| Beverages – Wine and Spirits – 1.5% | | | | | | |
| | 190,000 | | | Constellation Brands, Inc.
7.2500%, 9/1/16 | | | 215,887 | | | |
| Building Products – Cement and Aggregate – 0.1% | | | | | | |
| | 8,000 | | | Vulcan Materials Co.
7.0000%, 6/15/18 | | | 8,680 | | | |
| Building – Residential and Commercial – 3.6% | | | | | | |
| | 250,000 | | | Lennar Corp.
4.7500%, 12/15/17 | | | 250,000 | | | |
| | 289,000 | | | Meritage Homes Corp.
4.5000%, 3/1/18 | | | 286,110 | | | |
| | | | | | | | 536,110 | | | |
| Casino Hotels – 3.1% | | | | | | |
| | 136,000 | | | CityCenter Holdings LLC / CityCenter Finance Corp.
7.6250%, 1/15/16 | | | 143,480 | | | |
| | 290,000 | | | MGM Resorts International
7.5000%, 6/1/16 | | | 316,100 | | | |
| | | | | | | | 459,580 | | | |
| Chemicals – Specialty – 0.8% | | | | | | |
| | 72,000 | | | Ashland, Inc.
3.0000%, 3/15/16 (144A) | | | 72,360 | | | |
| | 50,000 | | | Ashland, Inc.
3.8750%, 4/15/18 (144A) | | | 49,500 | | | |
| | | | | | | | 121,860 | | | |
| Coal – 0.5% | | | | | | |
| | 69,000 | | | CONSOL Energy, Inc.
8.0000%, 4/1/17 | | | 72,623 | | | |
| Commercial Banks – 2.6% | | | | | | |
| | 290,000 | | | CIT Group, Inc.
4.7500%, 2/15/15 (144A) | | | 294,713 | | | |
| | 73,000 | | | Regions Financial Corp.
7.7500%, 11/10/14 | | | 78,882 | | | |
| | 2,000 | | | Zions BanCorp.
4.0000%, 6/20/16 | | | 2,093 | | | |
| | | | | | | | 375,688 | | | |
| Consumer Products – Miscellaneous – 1.4% | | | | | | |
| | 190,000 | | | Jarden Corp.
7.5000%, 5/1/17 | | | 208,288 | | | |
| Containers – Metal and Glass – 2.1% | | | | | | |
| | 290,000 | | | Ardagh Packaging Finance PLC / Ardagh MP Holdings U.S.A., Inc.
7.3750%, 10/15/17 (144A) | | | 309,212 | | | |
| Diversified Banking Institutions – 4.8% | | | | | | |
| | 305,000 | | | Ally Financial, Inc. – Series 8
6.7500%, 12/1/14 | | | 320,631 | | | |
| | 56,000 | | | Bank of America Corp. – Series K
8.0000%, 1/30/18‡,# | | | 62,370 | | | |
| | 10,000 | | | Bank of America Corp. – Series M
8.1250%, 5/15/18‡,# | | | 11,250 | | | |
| | 260,000 | | | Citigroup, Inc.
5.0000%, 9/15/14 | | | 270,199 | | | |
| | 40,000 | | | Royal Bank of Scotland Group PLC
2.5500%, 9/18/15 | | | 40,671 | | | |
| | | | | | | | 705,121 | | | |
| Diversified Manufacturing Operations – 1.3% | | | | | | |
| | 110,000 | | | Bombardier, Inc.
4.2500%, 1/15/16 (144A) | | | 112,475 | | | |
| | 70,000 | | | GE Capital Trust I
6.3750%, 11/15/67‡ | | | 72,538 | | | |
| | | | | | | | 185,013 | | | |
| Diversified Minerals – 0.5% | | | | | | |
| | 70,000 | | | FMG Resources (August 2006) Pty, Ltd.
6.8750%, 2/1/18 (144A) | | | 69,125 | | | |
| Electric – Generation – 1.7% | | | | | | |
| | 220,000 | | | AES Corp.
9.7500%, 4/15/16 | | | 253,550 | | | |
| Electronic Measuring Instruments – 0.8% | | | | | | |
| | 120,000 | | | FLIR Systems, Inc.
3.7500%, 9/1/16 | | | 124,032 | | | |
| Finance – Leasing Company – 1.5% | | | | | | |
| | 220,000 | | | International Lease Finance Corp. (MTN)
6.6250%, 11/15/13 | | | 223,025 | | | |
| Finance – Auto Loans – 2.3% | | | | | | |
| | 325,000 | | | Ford Motor Credit Co. LLC
4.2500%, 2/3/17 | | | 339,568 | | | |
| Finance – Consumer Loans – 1.3% | | | | | | |
| | 190,000 | | | SLM Corp. – Series A (MTN)
5.0000%, 4/15/15 | | | 196,175 | | | |
| Finance – Credit Card – 0.7% | | | | | | |
| | 100,000 | | | American Express Co.
6.8000%, 9/1/66‡ | | | 106,750 | | | |
| Finance – Investment Bankers/Brokers – 1.3% | | | | | | |
| | 150,000 | | | Lazard Group LLC
7.1250%, 5/15/15 | | | 162,879 | | | |
| | 34,000 | | | Raymond James Financial, Inc.
4.2500%, 4/15/16 | | | 35,932 | | | |
| | | | | | | | 198,811 | | | |
| Finance – Other Services – 2.1% | | | | | | |
| | 274,000 | | | CNH Capital LLC
3.8750%, 11/1/15 | | | 275,370 | | | |
| | 28,000 | | | CNH Capital LLC
3.6250%, 4/15/18 (144A) | | | 26,670 | | | |
| | | | | | | | 302,040 | | | |
| Food – Meat Products – 2.1% | | | | | | |
| | 290,000 | | | JBS U.S.A. LLC / JBS U.S.A. Finance, Inc.
11.6250%, 5/1/14 | | | 305,950 | | | |
| Food – Retail – 1.6% | | | | | | |
| | 227,000 | | | Stater Bros Holdings, Inc.
7.3750%, 11/15/18 | | | 240,052 | | | |
See Notes to Schedule of Investments and Other Information and Notes to Financial Statements.
Janus Fixed Income Fund | 9
Janus Real Return Fund(1)
Schedule of Investments
As of June 30, 2013
| | | | | | | | | | | |
| Shares or Principal Amount | | Value | | | |
| |
| Independent Power Producer – 2.1% | | | | | | |
| | $290,000 | | | Calpine Corp.
7.2500%, 10/15/17 (144A) | | $ | 302,325 | | | |
| Investment Management and Advisory Services – 0.5% | | | | | | |
| | 65,000 | | | Ameriprise Financial, Inc.
7.5180%, 6/1/66‡ | | | 71,013 | | | |
| Medical – HMO – 1.4% | | | | | | |
| | 200,000 | | | Centene Corp.
5.7500%, 6/1/17 | | | 209,500 | | | |
| Medical – Hospitals – 1.8% | | | | | | |
| | 250,000 | | | HCA, Inc.
6.5000%, 2/15/16 | | | 269,375 | | | |
| Office Furnishings – Original – 1.2% | | | | | | |
| | 160,000 | | | Interface, Inc.
7.6250%, 12/1/18 | | | 169,600 | | | |
| Oil Companies – Exploration and Production – 4.8% | | | | | | |
| | 220,000 | | | Berry Petroleum Co.
10.2500%, 6/1/14 | | | 232,100 | | | |
| | 220,000 | | | Chesapeake Energy Corp.
9.5000%, 2/15/15 | | | 243,100 | | | |
| | 122,000 | | | Chesapeake Energy Corp.
3.2500%, 3/15/16 | | | 121,390 | | | |
| | 30,000 | | | Chesapeake Energy Corp.
7.2500%, 12/15/18 | | | 33,450 | | | |
| | 65,000 | | | Plains Exploration & Production Co.
6.5000%, 11/15/20 | | | 68,913 | | | |
| | | | | | | | 698,953 | | | |
| Oil Refining and Marketing – 1.4% | | | | | | |
| | 190,000 | | | Frontier Oil Corp.
6.8750%, 11/15/18 | | | 203,775 | | | |
| Paper and Related Products – 0.8% | | | | | | |
| | 100,000 | | | Georgia-Pacific LLC
7.7000%, 6/15/15 | | | 112,258 | | | |
| Pharmacy Services – 1.0% | | | | | | |
| | 134,000 | | | Omnicare, Inc.
7.7500%, 6/1/20 | | | 146,730 | | | |
| Pipelines – 3.1% | | | | | | |
| | 127,000 | | | Crosstex Energy L.P. / Crosstex Energy Finance Corp.
8.8750%, 2/15/18 | | | 134,620 | | | |
| | 309,000 | | | Kinder Morgan Finance Co. LLC
6.0000%, 1/15/18 (144A) | | | 324,419 | | | |
| | 2,000 | | | Kinder Morgan Finance Co. ULC
5.7000%, 1/5/16 | | | 2,142 | | | |
| | | | | | | | 461,181 | | | |
| Poultry – 0.8% | | | | | | |
| | 108,000 | | | Pilgrim’s Pride Corp.
7.8750%, 12/15/18 | | | 115,020 | | | |
| REIT – Office Property – 2.1% | | | | | | |
| | 288,000 | | | Reckson Operating Partnership L.P.
6.0000%, 3/31/16 | | | 313,820 | | | |
| Retail – Toy Store – 1.6% | | | | | | |
| | 220,000 | | | Toys R Us Property Co. II LLC
8.5000%, 12/1/17 | | | 228,525 | | | |
| Steel – Producers – 0.5% | | | | | | |
| | 70,000 | | | ArcelorMittal
4.2500%, 3/1/16 | | | 70,350 | | | |
| Super – Regional Banks – US – 1.0% | | | | | | |
| | 125,000 | | | Wells Fargo & Co. – Series K
7.9800%, 3/15/18‡,# | | | 141,250 | | | |
| Telecommunication Services – 0.3% | | | | | | |
| | 40,000 | | | Qwest Corp.
7.5000%, 10/1/14 | | | 43,054 | | | |
| Telephone – Integrated – 1.9% | | | | | | |
| | 250,000 | | | Windstream Corp.
7.8750%, 11/1/17 | | | 274,375 | | | |
| Transportation – Truck – 0.6% | | | | | | |
| | 76,000 | | | Swift Services Holdings, Inc.
10.0000%, 11/15/18 | | | 83,980 | | | |
| Trucking & Leasing – 0.9% | | | | | | |
| | 14,000 | | | Penske Truck Leasing Co. L.P. / PTL Finance Corp.
2.5000%, 7/11/14 (144A) | | | 14,200 | | | |
| | 123,000 | | | Penske Truck Leasing Co. L.P. / PTL Finance Corp.
2.5000%, 3/15/16 (144A) | | | 125,113 | | | |
| | | | | | | | 139,313 | | | |
| |
| |
| Total Corporate Bonds (cost $10,092,211) | | | 9,974,674 | | | |
| |
| |
| Preferred Stock – 1.1% | | | | | | |
| Diversified Banking Institutions – 0.4% | | | | | | |
| | 3,175 | | | Royal Bank of Scotland Group PLC – Series N,
6.3500% | | | 66,802 | | | |
| Diversified Financial Services – 0.3% | | | | | | |
| | 1,350 | | | Citigroup Capital XIII, 7.8750% | | | 37,598 | | | |
| Steel – Producers – 0.4% | | | | | | |
| | 2,950 | | | ArcelorMittal – Series MTUS, 6.0000% | | | 55,371 | | | |
| |
| |
| Total Preferred Stock (cost $184,830) | | | 159,771 | | | |
| |
| |
| U.S. Treasury Notes/Bonds – 14.9% | | | | | | |
| | | | | U.S. Treasury Notes/Bonds: | | | | | | |
| | $815,000 | | | 0.2500%, 2/28/14 | | | 815,605 | | | |
| | 145,000 | | | 0.2500%, 4/30/14 | | | 145,096 | | | |
| | 269,000 | | | 0.2500%, 8/31/14 | | | 269,116 | | | |
| | 200,000 | | | 0.2500%, 11/30/14 | | | 200,047 | | | |
| | 140,000 | | | 0.3750%, 3/15/15 | | | 140,164 | | | |
| | 220,000 | | | 0.2500%, 5/31/15 | | | 219,613 | | | |
| | 47,000 | | | 1.0000%, 10/31/16 | | | 47,279 | | | |
| | 20,000 | | | 0.8750%, 1/31/18 | | | 19,644 | | | |
| | 185,000 | | | 0.7500%, 3/31/18 | | | 180,071 | | | |
| | 39,000 | | | 1.7500%, 5/15/23 | | | 36,526 | | | |
| | 126,000 | | | 2.8750%, 5/15/43 | | | 111,510 | | | |
| |
| |
| Total U.S. Treasury Notes/Bonds (cost $2,189,398) | | | 2,184,671 | | | |
| |
| |
| Money Market – 15.5% | | | | | | |
| | 2,277,891 | | | Janus Cash Liquidity Fund LLC, 0%£ (cost $2,277,891) | | | 2,277,891 | | | |
| |
| |
| Total Investments (cost $14,818,107) – 100% | | $ | 14,673,330 | | | |
| |
| |
| Liabilities, net of Cash, Receivables and Other Assets – (0.0)% | | | (3,774) | | | |
| |
| |
| Net Assets – 100.0% | | $ | 14,669,556 | | | |
| |
| |
| | | |
| (1) | | Formerly named Janus Real Return Allocation Fund. |
See Notes to Schedule of Investments and Other Information and Notes to Financial Statements.
10 | JUNE 30, 2013
Schedule of Investments
As of June 30, 2013
Summary of Investments by Country – (Long Positions) (unaudited)
| | | | | | | | | |
| | | | | | % of Investment
| |
| Country | | Value | | | Securities | |
| |
| |
| Australia | | $ | 69,125 | | | | 0.5% | |
| Canada | | | 112,475 | | | | 0.8% | |
| Ireland | | | 309,212 | | | | 2.1% | |
| Luxembourg | | | 125,721 | | | | 0.8% | |
| United Kingdom | | | 107,473 | | | | 0.7% | |
United States†† | | | 13,949,324 | | | | 95.1% | |
| |
| |
| Total | | $ | 14,673,330 | | | | 100.0% | |
| | | |
| †† | | Includes Cash Equivalents of 15.5%. |
See Notes to Schedule of Investments and Other Information and Notes to Financial Statements.
Janus Fixed Income Fund | 11
Notes to Schedule of Investments and Other Information
| | |
| Barclays U.S. TIPS Index | | The Barclays U.S. Government Inflation-Linked Bond Index also known as the Barclays U.S. TIPS Index measures the performance of the U.S. Treasury Inflation-Protected Securities (“TIPS”) market. The index includes TIPS with one or more years remaining maturity with total outstanding issue size of $500M or more. |
| |
Barclays U.S. 1-5 Year
TIPS Index | | The Barclays U.S. Government Inflation-Linked Bond Index also known as the Barclays U.S. TIPS Index measures the performance of the U.S. Treasury Inflation-Protected Securities (“TIPS”) market. The index includes TIPS with one to 5 years remaining maturity with total outstanding issue size of $500M or more. |
| |
Consumer Price
Index (CPI) + 2% | | The Consumer Price Index (CPI) is a measure of the average change over time in the prices paid by urban consumers for a market basket of consumer goods and services plus 200 basis points. |
| |
Consumer Price
Index (CPI) + 4% | | The Consumer Price Index (CPI) is a measure of the average change over time in the prices paid by urban consumers for a market basket of consumer goods and services plus 400 basis points. |
| |
| L.P. | | Limited Partnership |
| |
| LLC | | Limited Liability Company |
| |
| MTN | | Medium Term Note |
| |
| PLC | | Public Limited Company |
| |
| REIT | | Real Estate Investment Trust |
| |
| ULC | | Unlimited Liability Company |
| |
| 144A | Securities sold under Rule 144A of the Securities Act of 1933, as amended, are subject to legal and/or contractual restrictions on resale and may not be publicly sold without registration under the 1933 Act. These securities have been determined to be liquid under guidelines established by the Board of Trustees. The total value of 144A securities as of the year ended June 30, 2013 is indicated in the table below: |
| | | | | | | | | |
| | | | | Value as a % of
| | |
| Fund | | Value | | Net Assets | | |
| |
| Janus Real Return Fund | | $ | 1,700,112 | | | 11.6% | | |
| |
| |
| | | |
| ‡ | | The interest rate on floating rate notes is based on an index or market interest rates and is subject to change. Rate in the security description is as of year end. |
| | | |
| # | | Security is perpetual and thus does not have a predetermined maturity date. The coupon rate for this security is fixed for a period of time and may be structured to adjust thereafter. The date shown reflects the next call date. The coupon rate shown is the rate in effect as of June 30, 2013. |
| | | |
| £ | | The Fund may invest in certain securities that are considered affiliated companies. As defined by the Investment Company Act of 1940, as amended, an affiliated company is one in which the fund owns 5% or more of the outstanding voting securities, or a company which is under common ownership or control. Based on the Fund’s relative ownership, the following securities were considered affiliated companies for all or some portion of the year ended June 30, 2013. Except for the value at year end, all other information in the table is for the year ended June 30, 2013. |
| | | | | | | | | | | | | | | | | | | | | | | | |
| | | Purchases | | Sales | | Realized
| | Dividend
| | Value
| | |
| | | Shares | | Cost | | Shares | | Cost | | Gain/(Loss) | | Income | | at 6/30/13 | | |
| |
Janus Real Return Fund | | | | | | | | | | | | | | | | | | | | | | | |
| Janus Cash Liquidity Fund LLC | | | 48,859,729 | | $ | 48,859,729 | | | (54,018,227) | | $ | (54,018,227) | | $ | – | | $ | 4,723 | | $ | 2,277,891 | | |
| |
| |
The following is a summary of the inputs that were used to value the Fund’s investments in securities and other financial instruments as of June 30, 2013. See Notes to Financial Statements for more information.
Valuation Inputs Summary (as of June 30, 2013)
| | | | | | | | | | | | |
| | | | | Level 2 – Other Significant
| | Level 3 – Significant
| | |
| | | Level 1 – Quoted Prices | | Observable Inputs | | Unobservable Inputs | | |
| |
Investments in Securities: | | | | | | | | | | | |
| Janus Real Return Fund | | | | | | | | | | | |
Common Stock | | $ | 76,323 | | $ | – | | $ | – | | |
Corporate Bonds | | | – | | | 9,974,674 | | | – | | |
Preferred Stock | | | – | | | 159,771 | | | – | | |
U.S. Treasury Notes/Bonds | | | – | | | 2,184,671 | | | – | | |
Money Market | | | – | | | 2,277,891 | | | – | | |
| Total Investments in Securities | | $ | 76,323 | | $ | 14,597,007 | | $ | – | | |
| |
| |
12 | JUNE 30, 2013
Statement of Assets and Liabilities
| | | | | |
As of June 30, 2013
| | Janus Real
|
| (all numbers in thousands except net asset value per share) | | Return Fund(1) |
|
| |
| Assets: | | | | |
| Investments at cost | | $ | 14,818 | |
| Unaffiliated investments at value | | $ | 12,395 | |
| Affiliated investments at value | | | 2,278 | |
| Receivables: | | | | |
| Investments sold | | | 36 | |
| Dividends | | | 1 | |
| Due from adviser | | | 28 | |
| Foreign dividend tax reclaim | | | – | |
| Interest | | | 133 | |
| Non-interested Trustees’ deferred compensation | | | – | |
| Total Assets | | | 14,871 | |
| Liabilities: | | | | |
| Payables: | | | | |
| Investments purchased | | | 110 | |
| Fund shares repurchased | | | 5 | |
| Administrative services fees | | | 1 | |
| Distribution fees and shareholder servicing fees | | | 3 | |
| Administrative, networking and omnibus fees | | | 1 | |
| Non-interested Trustees’ fees and expenses | | | 1 | |
| Non-interested Trustees’ deferred compensation fees | | | – | |
| Accrued expenses and other payables | | | 80 | |
| Total Liabilities | | | 201 | |
| Net Assets | | $ | 14,670 | |
| Net Assets Consist of: | | | | |
| Capital (par value and paid-in surplus)* | | $ | 15,288 | |
| Undistributed net investment gain* | | | – | |
| Undistributed net realized loss from investments and foreign currency transactions* | | | (473) | |
| Unrealized depreciation of investments, foreign currency translations and non-interested Trustees’ deferred compensation | | | (145) | |
| Total Net Assets | | $ | 14,670 | |
| Net Assets - Class A Shares | | $ | 2,054 | |
| Shares Outstanding, $0.01 Par Value (unlimited shares authorized) | | | 213 | |
Net Asset Value Per Share(2) | | $ | 9.64 | |
Maximum Offering Price Per Share(3) | | $ | 10.12 | |
| Net Assets - Class C Shares | | $ | 1,978 | |
| Shares Outstanding, $0.01 Par Value (unlimited shares authorized) | | | 206 | |
Net Asset Value Per Share(2) | | $ | 9.59 | |
| Net Assets - Class D Shares | | $ | 4,431 | |
| Shares Outstanding, $0.01 Par Value (unlimited shares authorized) | | | 459 | |
| Net Asset Value Per Share | | $ | 9.65 | |
| Net Assets - Class I Shares | | $ | 2,195 | |
| Shares Outstanding, $0.01 Par Value (unlimited shares authorized) | | | 229 | |
| Net Asset Value Per Share | | $ | 9.59 | |
| Net Assets - Class S Shares | | $ | 1,984 | |
| Shares Outstanding, $0.01 Par Value (unlimited shares authorized) | | | 206 | |
| Net Asset Value Per Share | | $ | 9.65 | |
| Net Assets - Class T Shares | | $ | 2,028 | |
| Shares Outstanding, $0.01 Par Value (unlimited shares authorized) | | | 211 | |
| Net Asset Value Per Share | | $ | 9.61 | |
| | | |
| * | | See Note 5 in Notes to Financial Statements. |
| (1) | | Formerly named Janus Real Return Allocation Fund. |
| (2) | | Redemption price per share may be reduced for any applicable contingent deferred sales charge. |
| (3) | | Maximum offering price is computed at 100/95.25 of net asset value. |
See Notes to Financial Statements.
Janus Fixed Income Fund | 13
Statement of Operations
| | | | | |
For the year ended June 30, 2013
| | Janus Real
|
| (all numbers in thousands) | | Return Fund(1)(2) |
|
| |
| Investment Income: | | | | |
| Interest | | $ | 297 | |
| Dividends | | | 93 | |
| Dividends from affiliate | | | 5 | |
| Foreign tax withheld | | | (8) | |
| Total Investment Income | | | 387 | |
| Expenses: | | | | |
| Advisory fees | | | 140 | |
| Shareholder reports expenses | | | 24 | |
| Transfer agent fees and expenses | | | 4 | |
| Registration fees | | | 69 | |
| Custodian fees | | | 71 | |
| Professional fees | | | 92 | |
| Non-interested Trustees’ fees and expenses | | | 2 | |
| Accounting Agent fees | | | 65 | |
| Fund administration fees | | | 71 | |
| Administrative services fees - Class D Shares | | | 6 | |
| Administrative services fees - Class S Shares | | | 1 | |
| Administrative services fees - Class T Shares | | | 1 | |
| Distribution fees and shareholder servicing fees - Class A Shares | | | 8 | |
| Distribution fees and shareholder servicing fees - Class C Shares | | | 32 | |
| Distribution fees and shareholder servicing fees - Class S Shares | | | 8 | |
| Administrative, networking and omnibus fees - Class A Shares | | | – | |
| Administrative, networking and omnibus fees - Class C Shares | | | – | |
| Administrative, networking and omnibus fees - Class I Shares | | | – | |
| Other expenses | | | 8 | |
| Total Expenses | | | 602 | |
| Expense and Fee Offset | | | – | |
| Less: Excess Expense Reimbursement | | | (354) | |
| Net Expenses after Waivers and Expense Offsets | | | 248 | |
| Net Investment Income | | | 139 | |
| Net Realized and Unrealized Gain/(Loss) on Investments: | | | | |
| Net realized gain from investment and foreign currency transactions | | | 2,633 | |
| Net realized loss from futures contracts | | | (741) | |
| Net realized loss from swap contracts | | | (1,746) | |
| Net realized gain from options contracts | | | 8 | |
| Change in unrealized net appreciation/(depreciation) of investments, foreign currency translations and non-interested Trustees’ deferred compensation | | | (1,520) | |
| Change in unrealized net appreciation/(depreciation) of futures contracts | | | 247 | |
| Change in unrealized net appreciation/(depreciation) of swap contracts | | | 1,938 | |
| Change in unrealized net appreciation/(depreciation) of written option contracts | | | (3) | |
| Net Gain on Investments | | | 816 | |
| Net Increase in Net Assets Resulting from Operations | | $ | 955 | |
| | | |
| (1) | | Formerly named Janus Real Return Allocation Fund. |
| (2) | | Includes the accounts of Janus Real Return Fund and the Subsidiary. See Note 1 in Notes to Financial Statements. |
See Notes to Financial Statements.
14 | JUNE 30, 2013
Statements of Changes in Net Assets
| | | | | | | | | |
| | | Janus Real
|
For each year ended June 30
| | Return Fund(1)(2) |
| (all numbers in thousands) | | 2013 | | 2012 |
|
| |
| Operations: | | | | | | | | |
| Net investment income | | $ | 139 | | | $ | 482 | |
| Net realized gain from investment and foreign currency transactions | | | 154 | | | | (1,015) | |
| Change in unrealized net appreciation/(depreciation) of investments, foreign currency translations and non-interested Trustees’ deferred compensation | | | 662 | | | | (838) | |
| Net Increase in Net Assets Resulting from Operations | | | 955 | | | | (1,371) | |
| Dividends and Distributions to Shareholders: | | | | | | | | |
| Net investment income* | | | | | | | | |
| Class A Shares | | | (20) | | | | (29) | |
| Class C Shares | | | (6) | | | | (20) | |
| Class D Shares | | | (39) | | | | (30) | |
| Class I Shares | | | (36) | | | | (31) | |
| Class S Shares | | | (16) | | | | (25) | |
| Class T Shares | | | (28) | | | | (28) | |
| Net realized gain/(loss) from investment transactions* | | | | | | | | |
| Class A Shares | | | – | | | | (35) | |
| Class C Shares | | | – | | | | (33) | |
| Class D Shares | | | – | | | | (39) | |
| Class I Shares | | | – | | | | (35) | |
| Class S Shares | | | – | | | | (33) | |
| Class T Shares | | | – | | | | (34) | |
| Return of Capital | | | | | | | | |
| Class A Shares | | | (12) | | | | N/A | |
| Class C Shares | | | (3) | | | | N/A | |
| Class D Shares | | | (22) | | | | N/A | |
| Class I Shares | | | (20) | | | | N/A | |
| Class S Shares | | | (9) | | | | N/A | |
| Class T Shares | | | (16) | | | | N/A | |
| Net Decrease from Dividends and Distributions | | | (227) | | | | (372) | |
| Capital Share Transactions: | | | | | | | | |
| Shares Sold | | | | | | | | |
| Class A Shares | | | 59 | | | | 1,243 | |
| Class C Shares | | | 37 | | | | 42 | |
| Class D Shares | | | 2,001 | | | | 1,624 | |
| Class I Shares | | | 137 | | | | 174 | |
| Class S Shares | | | 5 | | | | 1 | |
| Class T Shares | | | 296 | | | | 158 | |
| Reinvested Dividends and Distributions | | | | | | | | |
| Class A Shares | | | 32 | | | | 64 | |
| Class C Shares | | | 9 | | | | 54 | |
| Class D Shares | | | 60 | | | | 69 | |
| Class I Shares | | | 56 | | | | 65 | |
| Class S Shares | | | 25 | | | | 59 | |
| Class T Shares | | | 44 | | | | 62 | |
| Shares Repurchased | | | | | | | | |
| Class A Shares | | | (4,927) | | | | (901) | |
| Class C Shares | | | (4,588) | | | | (11) | |
| Class D Shares | | | (5,383) | | | | (709) | |
| Class I Shares | | | (4,762) | | | | (120) | |
| Class S Shares | | | (4,583) | | | | – | |
| Class T Shares | | | (4,974) | | | | (44) | |
| Net Increase/(Decrease) from Capital Share Transactions | | | (26,456) | | | | 1,830 | |
| Net Increase/(Decrease) in Net Assets | | | (25,728) | | | | 87 | |
| Net Assets: | | | | | | | | |
| Beginning of period | | | 40,398 | | | | 40,311 | |
| End of period | | $ | 14,670 | | | $ | 40,398 | |
| Undistributed Net Investment Income* | | $ | – | | | $ | 16 | |
| | | |
| * | | See Note 5 in Notes to Financial Statements. |
| (1) | | Formerly named Janus Real Return Allocation Fund. |
| (2) | | Includes the accounts of Janus Real Return Fund and the Subsidiary. See Note 1 in Notes to Financial Statements. |
See Notes to Financial Statements.
Janus Fixed Income Fund | 15
Financial Highlights
Class A Shares
| | | | | | | | | | | | | | | |
For a share outstanding during each year ended June 30 and the
| | Janus Real Return Fund(1) | | |
| period ended June 30, 2011 | | 2013 | | 2012 | | 2011(2) | | |
| |
| Net Asset Value, Beginning of Period | | | $9.55 | | | | $9.95 | | | | $10.00 | | | |
| Income from Investment Operations: | | | | | | | | | | | | | | |
| Net investment income | | | 0.17 | | | | 0.01 | | | | 0.04 | | | |
| Net gain/(loss) on investments (both realized and unrealized) | | | 0.07 | | | | (0.32) | | | | (0.09) | | | |
| Total from Investment Operations | | | 0.24 | | | | (0.31) | | | | (0.05) | | | |
| Less Distributions and Other: | | | | | | | | | | | | | | |
| Dividends (from net investment income)* | | | (0.09) | | | | (0.04) | | | | – | | | |
| Distributions (from capital gains)* | | | – | | | | (0.05) | | | | – | | | |
| Return of capital | | | (0.06) | | | | N/A | | | | N/A | | | |
| Total Distributions and Other | | | (0.15) | | | | (0.09) | | | | – | | | |
| Net Asset Value, End of Period | | | $9.64 | | | | $9.55 | | | | $9.95 | | | |
| Total Return** | | | 2.48% | | | | (3.09)% | | | | (.50)% | | | |
| Net Assets, End of Period (in thousands) | | | $2,054 | | | | $6,759 | | | | $6,660 | | | |
| Average Net Assets for the Period (in thousands) | | | $3,351 | | | | $6,973 | | | | $6,635 | | | |
| Ratio of Gross Expenses (Absent the Waiver of Certain Fees and Expense Offsets) to Average Net Assets*** | | | 2.71% | | | | 2.25% | | | | 5.68% | | | |
| Ratio of Net Expenses (After Waivers and Expense Offsets) to Average Net Assets*** | | | 1.15% | | | | 1.26%(3) | | | | 1.27% | | | |
| Ratio of Net Investment Income to Average Net Assets*** | | | 0.60% | | | | 1.24% | | | | 3.21% | | | |
| Portfolio Turnover Rate | | | 112%(4) | | | | 45% | | | | 6%^ | | | |
Class C Shares
| | | | | | | | | | | | | | | |
For a share outstanding during each year ended June 30 and the
| | Janus Real Return Fund(1) | | |
| period ended June 30, 2011 | | 2013 | | 2012 | | 2011(2) | | |
| |
| Net Asset Value, Beginning of Period | | | $9.48 | | | | $9.94 | | | | $10.00 | | | |
| Income from Investment Operations: | | | | | | | | | | | | | | |
| Net investment income/(loss) | | | (0.10) | | | | (0.05) | | | | 0.03 | | | |
| Net gain/(loss) on investments (both realized and unrealized) | | | 0.26 | | | | (0.33) | | | | (0.09) | | | |
| Total from Investment Operations | | | 0.16 | | | | (0.38) | | | | (0.06) | | | |
| Less Distributions and Other: | | | | | | | | | | | | | | |
| Dividends (from net investment income)* | | | (0.03) | | | | (0.03) | | | | – | | | |
| Distributions (from capital gains)* | | | – | | | | (0.05) | | | | – | | | |
| Return of capital | | | (0.02) | | | | N/A | | | | N/A | | | |
| Total Distributions and Other | | | (0.05) | | | | (0.08) | | | | – | | | |
| Net Asset Value, End of Period | | | $9.59 | | | | $9.48 | | | | $9.94 | | | |
| Total Return** | | | 1.64% | | | | (3.80)% | | | | (.60)% | | | |
| Net Assets, End of Period (in thousands) | | | $1,978 | | | | $6,400 | | | | $6,627 | | | |
| Average Net Assets for the Period (in thousands) | | | $3,182 | | | | $6,492 | | | | $6,616 | | | |
| Ratio of Gross Expenses (Absent the Waiver of Certain Fees and Expense Offsets) to Average Net Assets*** | | | 3.52% | | | | 2.95% | | | | 6.43% | | | |
| Ratio of Net Expenses (After Waivers and Expense Offsets) to Average Net Assets*** | | | 1.90% | | | | 2.01%(5) | | | | 2.02% | | | |
| Ratio of Net Investment Income/(Loss) to Average Net Assets*** | | | (0.16)% | | | | 0.51% | | | | 2.46% | | | |
| Portfolio Turnover Rate | | | 112%(4) | | | | 45% | | | | 6%^ | | | |
| | | |
| * | | See Note 5 in Notes to Financial Statements. |
| ** | | Total Return not annualized for periods of less than one full year. |
| *** | | Annualized for periods of less than one full year. |
| ^ | | Rate has been adjusted to conform with current year presentation. |
| (1) | | Formerly named Janus Real Return Allocation Fund. The Fund included the accounts of both Janus Real Return Allocation Fund and Janus Real Return Subsidiary, Ltd. from May 13, 2011 (inception date) through October 15, 2012. See Note 1 in Notes to Financial Statements. |
| (2) | | Period from May 13, 2011 (inception date) through June 30, 2011. |
| (3) | | Ratio of Net Expenses (After Waivers and Expense Offsets) to Average Net Assets includes any applicable dividends and interest on short positions and may include stock loan fees. The ratio would have been 1.26% in 2012 without the inclusion of any applicable dividends and interest on short positions and any stock loan fees. |
| (4) | | The increase in the portfolio turnover rate was due to a restructuring of the Fund’s portfolio as a result of a change in its principal investment strategies. |
| (5) | | Ratio of Net Expenses (After Waivers and Expense Offsets) to Average Net Assets includes any applicable dividends and interest on short positions and may include stock loan fees. The ratio would have been 2.01% in 2012 without the inclusion of any applicable dividends and interest on short positions and any stock loan fees. |
See Notes to Financial Statements.
16 | JUNE 30, 2013
Class D Shares
| | | | | | | | | | | | | | | |
For a share outstanding during each year ended June 30 and the
| | Janus Real Return Fund(1) | | |
| period ended June 30, 2011 | | 2013 | | 2012 | | 2011(2) | | |
| |
| Net Asset Value, Beginning of Period | | | $9.56 | | | | $9.95 | | | | $10.00 | | | |
| Income from Investment Operations: | | | | | | | | | | | | | | |
| Net investment income | | | 0.18 | | | | 0.03 | | | | 0.04 | | | |
| Net gain/(loss) on investments (both realized and unrealized) | | | 0.07 | | | | (0.33) | | | | (0.09) | | | |
| Total from Investment Operations | | | 0.25 | | | | (0.30) | | | | (0.05) | | | |
| Less Distributions and Other: | | | | | | | | | | | | | | |
| Dividends (from net investment income)* | | | (0.10) | | | | (0.04) | | | | – | | | |
| Distributions (from capital gains)* | | | – | | | | (0.05) | | | | – | | | |
| Return of capital | | | (0.06) | | | | N/A | | | | N/A | | | |
| Total Distributions and Other | | | (0.16) | | | | (0.09) | | | | – | | | |
| Net Asset Value, End of Period | | | $9.65 | | | | $9.56 | | | | $9.95 | | | |
| Total Return** | | | 2.59% | | | | (3.02)% | | | | (.50)% | | | |
| Net Assets, End of Period (in thousands) | | | $4,431 | | | | $7,632 | | | | $6,954 | | | |
| Average Net Assets for the Period (in thousands) | | | $4,876 | | | | $7,558 | | | | $6,832 | | | |
| Ratio of Gross Expenses (Absent the Waiver of Certain Fees and Expense Offsets) to Average Net Assets*** | | | 2.98% | | | | 2.25% | | | | 5.96% | | | |
| Ratio of Net Expenses (After Waivers and Expense Offsets) to Average Net Assets*** | | | 1.00% | | | | 1.14%(3) | | | | 1.25% | | | |
| Ratio of Net Investment Income to Average Net Assets*** | | | 0.97% | | | | 1.40% | | | | 3.24% | | | |
| Portfolio Turnover Rate | | | 112%(4) | | | | 45% | | | | 6%^ | | | |
Class I Shares
| | | | | | | | | | | | | | | |
For a share outstanding during each year ended June 30 and the
| | Janus Real Return Fund(1) | | |
| period ended June 30, 2011 | | 2013 | | 2012 | | 2011(2) | | |
| |
| Net Asset Value, Beginning of Period | | | $9.57 | | | | $9.95 | | | | $10.00 | | | |
| Income from Investment Operations: | | | | | | | | | | | | | | |
| Net investment income | | | 0.27 | | | | 0.04 | | | | 0.05 | | | |
| Net gain/(loss) on investments (both realized and unrealized) | | | 0.00 | | | | (0.33) | | | | (0.10) | | | |
| Total from Investment Operations | | | 0.27 | | | | (0.29) | | | | (0.05) | | | |
| Less Distributions and Other: | | | | | | | | | | | | | | |
| Dividends (from net investment income)* | | | (0.16) | | | | (0.04) | | | | – | | | |
| Distributions (from capital gains)* | | | – | | | | (0.05) | | | | – | | | |
| Return of capital | | | (0.09) | | | | N/A | | | | N/A | | | |
| Total Distributions and Other | | | (0.25) | | | | (0.09) | | | | – | | | |
| Net Asset Value, End of Period | | | $9.59 | | | | $9.57 | | | | $9.95 | | | |
| Total Return** | | | 2.77% | | | | (2.86)% | | | | (.50)% | | | |
| Net Assets, End of Period (in thousands) | | | $2,195 | | | | $6,650 | | | | $6,797 | | | |
| Average Net Assets for the Period (in thousands) | | | $3,457 | | | | $6,738 | | | | $6,658 | | | |
| Ratio of Gross Expenses (Absent the Waiver of Certain Fees and Expense Offsets) to Average Net Assets*** | | | 2.47% | | | | 1.93% | | | | 5.43% | | | |
| Ratio of Net Expenses (After Waivers and Expense Offsets) to Average Net Assets*** | | | 0.90% | | | | 1.01%(5) | | | | 1.02% | | | |
| Ratio of Net Investment Income to Average Net Assets*** | | | 0.89% | | | | 1.50% | | | | 3.47% | | | |
| Portfolio Turnover Rate | | | 112%(4) | | | | 45% | | | | 6%^ | | | |
| | | |
| * | | See Note 5 in Notes to Financial Statements. |
| ** | | Total Return not annualized for periods of less than one full year. |
| *** | | Annualized for periods of less than one full year. |
| ^ | | Rate has been adjusted to conform with current year presentation. |
| (1) | | Formerly named Janus Real Return Allocation Fund. The Fund included the accounts of both Janus Real Return Allocation Fund and Janus Real Return Subsidiary, Ltd. from May 13, 2011 (inception date) through October 15, 2012. See Note 1 in Notes to Financial Statements. |
| (2) | | Period from May 13, 2011 (inception date) through June 30, 2011. |
| (3) | | Ratio of Net Expenses (After Waivers and Expense Offsets) to Average Net Assets includes any applicable dividends and interest on short positions and may include stock loan fees. The ratio would have been 1.14% in 2012 without the inclusion of any applicable dividends and interest on short positions and any stock loan fees. |
| (4) | | The increase in the portfolio turnover rate was due to a restructuring of the Fund’s portfolio as a result of a change in its principal investment strategies. |
| (5) | | Ratio of Net Expenses (After Waivers and Expense Offsets) to Average Net Assets includes any applicable dividends and interest on short positions and may include stock loan fees. The ratio would have been 1.01% in 2012 without the inclusion of any applicable dividends and interest on short positions and any stock loan fees. |
See Notes to Financial Statements.
Janus Fixed Income Fund | 17
Financial Highlights (continued)
Class S Shares
| | | | | | | | | | | | | | | |
For a share outstanding during each year ended June 30 and the
| | Janus Real Return Fund(1) | | |
| period ended June 30, 2011 | | 2013 | | 2012 | | 2011(2) | | |
| |
| Net Asset Value, Beginning of Period | | | $9.53 | | | | $9.95 | | | | $10.00 | | | |
| Income from Investment Operations: | | | | | | | | | | | | | | |
| Net investment income | | | 0.13 | | | | – | | | | 0.04 | | | |
| Net gain/(loss) on investments (both realized and unrealized) | | | 0.11 | | | | (0.33) | | | | (0.09) | | | |
| Total from Investment Operations | | | 0.24 | | | | (0.33) | | | | (0.05) | | | |
| Less Distributions and Other: | | | | | | | | | | | | | | |
| Dividends (from net investment income)* | | | (0.08) | | | | (0.04) | | | | – | | | |
| Distributions (from capital gains)* | | | – | | | | (0.05) | | | | – | | | |
| Return of capital | | | (0.04) | | | | N/A | | | | N/A | | | |
| Total Distributions and Other | | | (0.12) | | | | (0.09) | | | | – | | | |
| Net Asset Value, End of Period | | | $9.65 | | | | $9.53 | | | | $9.95 | | | |
| Total Return** | | | 2.51% | | | | (3.33)% | | | | (.50)% | | | |
| Net Assets, End of Period (in thousands) | | | $1,984 | | | | $6,412 | | | | $6,632 | | | |
| Average Net Assets for the Period (in thousands) | | | $3,207 | | | | $6,502 | | | | $6,618 | | | |
| Ratio of Gross Expenses (Absent the Waiver of Certain Fees and Expense Offsets) to Average Net Assets*** | | | 2.70% | | | | 2.43% | | | | 5.93% | | | |
| Ratio of Net Expenses (After Waivers and Expense Offsets) to Average Net Assets*** | | | 1.19% | | | | 1.45%(3) | | | | 1.52% | | | |
| Ratio of Net Investment Income to Average Net Assets*** | | | 0.56% | | | | 1.07% | | | | 2.96% | | | |
| Portfolio Turnover Rate | | | 112%(4) | | | | 45% | | | | 6%^ | | | |
Class T Shares
| | | | | | | | | | | | | | | |
For a share outstanding during each year ended June 30 and the
| | Janus Real Return Fund(1) | | |
| period ended June 30, 2011 | | 2013 | | 2012 | | 2011(2) | | |
| |
| Net Asset Value, Beginning of Period | | | $9.55 | | | | $9.95 | | | | $10.00 | | | |
| Income from Investment Operations: | | | | | | | | | | | | | | |
| Net investment income | | | 0.22 | | | | 0.02 | | | | 0.04 | | | |
| Net gain/(loss) on investments (both realized and unrealized) | | | 0.04 | | | | (0.33) | | | | (0.09) | | | |
| Total from Investment Operations | | | 0.26 | | | | (0.31) | | | | (0.05) | | | |
| Less Distributions and Other: | | | | | | | | | | | | | | |
| Dividends (from net investment income)* | | | (0.13) | | | | (0.04) | | | | – | | | |
| Distributions (from capital gains)* | | | – | | | | (0.05) | | | | – | | | |
| Return of capital | | | (0.07) | | | | N/A | | | | N/A | | | |
| Total Distributions and Other | | | (0.20) | | | | (0.09) | | | | – | | | |
| Net Asset Value, End of Period | | | $9.61 | | | | $9.55 | | | | $9.95 | | | |
| Total Return** | | | 2.76% | | | | (3.09)% | | | | (.50)% | | | |
| Net Assets, End of Period (in thousands) | | | $2,028 | | | | $6,545 | | | | $6,641 | | | |
| Average Net Assets for the Period (in thousands) | | | $3,323 | | | | $6,633 | | | | $6,623 | | | |
| Ratio of Gross Expenses (Absent the Waiver of Certain Fees and Expense Offsets) to Average Net Assets*** | | | 2.48% | | | | 2.17% | | | | 5.68% | | | |
| Ratio of Net Expenses (After Waivers and Expense Offsets) to Average Net Assets*** | | | 0.94% | | | | 1.20%(5) | | | | 1.27% | | | |
| Ratio of Net Investment Income to Average Net Assets*** | | | 0.83% | | | | 1.31% | | | | 3.21% | | | |
| Portfolio Turnover Rate | | | 112%(4) | | | | 45% | | | | 6%^ | | | |
| | | |
| * | | See Note 5 in Notes to Financial Statements. |
| ** | | Total Return not annualized for periods of less than one full year. |
| *** | | Annualized for periods of less than one full year. |
| ^ | | Rate has been adjusted to conform with current year presentation. |
| (1) | | Formerly named Janus Real Return Allocation Fund. The Fund included the accounts of both Janus Real Return Allocation Fund and Janus Real Return Subsidiary, Ltd. from May 13, 2011 (inception date) through October 15, 2012. See Note 1 in Notes to Financial Statements. |
| (2) | | Period from May 13, 2011 (inception date) through June 30, 2011. |
| (3) | | Ratio of Net Expenses (After Waivers and Expense Offsets) to Average Net Assets includes any applicable dividends and interest on short positions and may include stock loan fees. The ratio would have been 1.45% in 2012 without the inclusion of any applicable dividends and interest on short positions and any stock loan fees. |
| (4) | | The increase in the portfolio turnover rate was due to a restructuring of the Fund’s portfolio as a result of a change in its principal investment strategies. |
| (5) | | Ratio of Net Expenses (After Waivers and Expense Offsets) to Average Net Assets includes any applicable dividends and interest on short positions and may include stock loan fees. The ratio would have been 1.20% in 2012 without the inclusion of any applicable dividends and interest on short positions and any stock loan fees. |
See Notes to Financial Statements.
18 | JUNE 30, 2013
Notes to Financial Statements
The following section describes the organization and significant accounting policies and provides more detailed information about the schedules and tables that appear throughout this report. In addition, the Notes to Financial Statements explain the methods used in preparing and presenting this report.
| |
| 1. | Organization And Significant Accounting Policies |
Janus Real Return Fund (formerly named Janus Real Return Allocation Fund) (the “Fund”) is a series fund. The Fund is part of Janus Investment Fund (the “Trust”), which is organized as a Massachusetts business trust and is registered under the Investment Company Act of 1940, as amended (the “1940 Act”), as an open-end management investment company. Janus Real Return Subsidiary, Ltd. was a wholly-owned subsidiary of the Fund organized under the laws of the Cayman Islands as an exempted company (the “Subsidiary”) until its liquidation and conclusion of operations effective October 15, 2012. The Fund’s Statement of Operations, Statement of Changes in Net Assets, and Financial Highlights include the accounts of both Janus Real Return Fund and the Subsidiary. The financial statements include information for the year ended June 30, 2013. The Trust offers forty-four funds which include multiple series of shares, with differing investment objectives and policies. The Fund invests primarily in income-producing securities. The Fund is classified as nondiversified, as defined in the 1940 Act.
The Fund offers multiple classes of shares in order to meet the needs of various types of investors. Each class represents an interest in the same portfolio of investments. Certain financial intermediaries may not offer all classes of shares.
Class A Shares and Class C Shares are generally offered through financial intermediary platforms including, but not limited to, traditional brokerage platforms, mutual fund wrap fee programs, bank trust platforms, and retirement platforms. The maximum purchase in Class C Shares is $500,000 for any single purchase.
Class D Shares are generally no longer being made available to new investors. The Shares are available only to investors who hold accounts directly with the Janus funds and to immediate family members or members of the same household of an eligible individual investor. The Shares are not offered through financial intermediaries.
Class I Shares are available through certain financial intermediary platforms including, but not limited to, mutual fund wrap fee programs, managed account programs, asset allocation programs, and bank trust platforms, as well as certain retirement platforms. Class I Shares are also available to certain institutional investors including, but not limited to, corporations, certain retirement plans, public plans, and foundations/endowments.
Class S Shares are offered through financial intermediary platforms including, but not limited to, retirement platforms and asset allocation, mutual fund wrap, or other discretionary or nondiscretionary fee-based investment advisory programs. In addition, Class S Shares may be available through certain financial intermediaries who have an agreement with Janus Capital Management LLC (“Janus Capital”) or its affiliates to offer Class S Shares on their supermarket platforms.
Class T Shares are available through certain financial intermediary platforms including, but not limited to, mutual fund wrap fee programs, managed account programs, asset allocation programs, bank trust platforms, as well as certain retirement platforms. In addition, Class T Shares may be available through certain financial intermediaries who have an agreement with Janus Capital or its affiliates to offer Class T Shares on their supermarket platforms.
The following accounting policies have been followed by the Fund and are in conformity with accounting principles generally accepted in the United States of America.
Investment Valuation
Securities are valued at the last sales price or the official closing price for securities traded on a principal securities exchange (U.S. or foreign) and on the NASDAQ National Market. Securities traded on over-the-counter (“OTC”) markets and listed securities for which no sales are reported are valued at the latest bid price (or yield equivalent thereof) obtained from one or more dealers transacting in a market for such securities or by a pricing service approved by the Fund’s Trustees. Short-term securities with maturities of 60 days or less may be valued at amortized cost, which approximates market value. Debt securities with a remaining maturity of greater than 60 days are valued in accordance with the evaluated bid price supplied by the pricing service. The evaluated bid price supplied by the pricing service is an evaluation that reflects such factors as security prices, yields, maturities and ratings. Short positions shall be valued in accordance with the same methodologies, except that in the event that a last sale price is not available, the latest ask price shall be used instead of a bid price. Foreign securities and currencies are converted to U.S. dollars using the applicable exchange rate in effect as of the daily close of the New York Stock Exchange (“NYSE”). When market quotations are not readily available or deemed unreliable, or events or circumstances that may affect the value of portfolio securities held by the Fund are identified between the closing of their principal markets and the time the net asset value (“NAV”) is determined, securities may be valued at fair value as determined in good faith
Janus Fixed Income Fund | 19
Notes to Financial Statements (continued)
under procedures established by and under the supervision of the Fund’s Trustees. Circumstances in which fair value pricing may be utilized include, but are not limited to: (i) a significant event that may affect the securities of a single issuer, such as a merger, bankruptcy, or significant issuer specific development; (ii) an event that may affect an entire market, such as a natural disaster or significant governmental action; (iii) a nonsignificant event such as a market closing early or not opening, or a security trading halt; and (iv) pricing of a non-valued security and a restricted or non-public security. The Fund uses systematic fair valuation models provided by independent third parties to value international equity securities in order to adjust for stale pricing, which may occur between the close of certain foreign exchanges and the close of the NYSE. Restricted and illiquid securities are valued in accordance with procedures established by the Fund’s Trustees.
Investment Transactions and Investment Income
Investment transactions are accounted for as of the date purchased or sold (trade date). Dividend income is recorded on the ex-dividend date. Certain dividends from foreign securities will be recorded as soon as the Trust is informed of the dividend, if such information is obtained subsequent to the ex-dividend date. Dividends from foreign securities may be subject to withholding taxes in foreign jurisdictions. Interest income is recorded on the accrual basis and includes amortization of premiums and accretion of discounts. Gains and losses are determined on the identified cost basis, which is the same basis used for federal income tax purposes. Income, as well as gains and losses, both realized and unrealized, are allocated daily to each class of shares based upon the ratio of net assets represented by each class as a percentage of total net assets.
Expenses
The Fund bears expenses incurred specifically on its behalf, as well as a portion of general expenses, which may be allocated pro rata to the Fund. Each class of shares bears expenses incurred specifically on its behalf and, in addition, each class bears a portion of general expenses, which are allocated daily to each class of shares based upon the ratio of net assets represented by each class as a percentage of total net assets. Expenses directly attributable to a specific class of shares are charged against the operations of such class.
Estimates
The preparation of financial statements in conformity with accounting principles generally accepted in the United States of America requires management to make estimates and assumptions that affect the reported amount of assets and liabilities and disclosure of contingent assets and liabilities at the date of the financial statements, and the reported amounts of income and expenses during the reporting period. Actual results could differ from those estimates.
Foreign Currency Translations
The Fund does not isolate that portion of the results of operations resulting from the effect of changes in foreign exchange rates on investments from the fluctuations arising from changes in market prices of securities held at the date of the financial statements. Net unrealized appreciation or depreciation of investments and foreign currency translations arise from changes in the value of assets and liabilities, including investments in securities held at the date of the financial statements, resulting from changes in the exchange rates and changes in market prices of securities held.
Currency gains and losses are also calculated on payables and receivables that are denominated in foreign currencies. The payables and receivables are generally related to foreign security transactions and income translations.
Foreign currency-denominated assets and forward currency contracts may involve more risks than domestic transactions, including currency risk, political and economic risk, regulatory risk and equity risk. Risks may arise from the potential inability of a counterparty to meet the terms of a contract and from unanticipated movements in the value of foreign currencies relative to the U.S. dollar.
Dividend Distributions
Effective November 1, 2012, dividends of net investment income are declared daily and distributed monthly for the Fund. Realized capital gains, if any, are declared and distributed annually. Prior to November 1, 2012, the Fund declared and distributed dividends of net investment income and realized capital gains (if any) annually.
The Fund may make certain investments in real estate investment trusts (“REITs”) which pay dividends to their shareholders based upon funds available from operations. It is quite common for these dividends to exceed the REITs’ taxable earnings and profits, resulting in the excess portion of such dividends being designated as a return of capital. If the Fund distributes such amounts, such distributions could constitute a return of capital to shareholders for federal income tax purposes.
Federal Income Taxes
The Fund intends to continue to qualify as a regulated investment company and distribute all of its taxable income. Management has analyzed the Fund’s tax
20 | JUNE 30, 2013
positions taken for all open federal income tax years, generally a three-year period, and has concluded that no provision for federal income tax is required in the Fund’s financial statements.
Valuation Inputs Summary
In accordance with FASB guidance, the Fund utilizes the “Fair Value Measurements” to define fair value, establish a framework for measuring fair value, and expand disclosure requirements regarding fair value measurements. The Fair Value Measurement Standard does not require new fair value measurements, but is applied to the extent that other accounting pronouncements require or permit fair value measurements. This standard emphasizes that fair value is a market-based measurement that should be determined based on the assumptions that market participants would use in pricing an asset or liability. Various inputs are used in determining the value of the Fund’s investments defined pursuant to this standard. These inputs are summarized into three broad levels:
Level 1 – Quoted prices in active markets for identical securities.
Level 2 – Prices determined using other significant observable inputs. Observable inputs are inputs that reflect the assumptions market participants would use in pricing a security and are developed based on market data obtained from sources independent of the reporting entity. These may include quoted prices for similar securities, interest rates, prepayment speeds, credit risk, and others.
Debt securities are valued in accordance with the evaluated bid price supplied by the pricing service and generally categorized as Level 2 in the hierarchy. Securities traded on OTC markets and listed securities for which no sales are reported are valued at the latest bid price (or yield equivalent thereof) obtained from one or more dealers transacting in a market for such securities or by a pricing service approved by the Fund’s Trustees and are categorized as Level 2 in the hierarchy. Short-term securities with maturities of 60 days or less are valued at amortized cost, which approximates market value and are categorized as Level 2 in the hierarchy. Periodic review and monitoring of the valuation of short-term securities is performed in an effort to ensure that amortized cost approximates market value. Other securities that may be categorized as Level 2 in the hierarchy include, but are not limited to, preferred stocks, bank loans, American Depositary Receipts (“ADRs”), Global Depositary Receipts (“GDRs”), warrants, swaps, investments in mutual funds, OTC options, and forward contracts. The Fund uses systematic fair valuation models provided by independent third parties to value international equity securities in order to adjust for stale pricing, which may occur between the close of certain foreign exchanges and the close of the NYSE. These are generally categorized as Level 2 in the hierarchy.
Level 3 – Prices determined using significant unobservable inputs. In situations where quoted prices or observable inputs are unavailable or deemed less relevant (for example, when there is little or no market activity for an investment at the end of the period), unobservable inputs may be used. Unobservable inputs are inputs that reflect the reporting entity’s own assumptions about the factors market participants would use in pricing the security and would be based on the best information available under the circumstances.
For restricted equity securities and private placements where observable inputs are limited, assumptions about market activity and risk are used in employing valuation techniques such as the market approach, the income approach, or the cost approach, as defined under the FASB Guidance. These are categorized as Level 3 in the hierarchy.
There have been no significant changes in valuation techniques used in valuing any such positions held by the Fund since the beginning of the fiscal year.
The inputs or methodology used for valuing securities are not necessarily an indication of the risk associated with investing in those securities. The summary of inputs used as of June 30, 2013 to value the Fund’s investments in securities and other financial instruments is included in the “Valuation Inputs Summary” in the Notes to Schedule of Investments and Other Information.
FASB Accounting Standards Update, “Amendments to Achieve Common Fair Value Measurement and Disclosure Requirements” requires disclosures about amounts and reasons for all transfers in and out of Level 1 and Level 2 fair value measurements. For fair value measurements categorized within Level 3 of the fair value hierarchy, the Fund shall provide quantitative information about the significant unobservable inputs used in the fair value measurement. To meet the objective of the quantitative disclosure, the Fund may need to further disaggregate to provide more meaningful information about the significant unobservable inputs used and how these inputs vary over time.
The Fund is not required to create quantitative information to comply with this disclosure requirement if quantitative unobservable inputs are not developed by the Fund when measuring fair value (for example, when a Fund uses prices from prior transactions or third-party pricing
Janus Fixed Income Fund | 21
Notes to Financial Statements (continued)
information without adjustment). However, when providing this disclosure, the Fund cannot ignore quantitative unobservable inputs that are significant to the fair value measurement and are reasonably available to the Fund.
In addition, the Accounting Standards Update requires the Fund to provide a narrative sensitivity disclosure of the fair value measurement changes in unobservable inputs and the interrelationships between those unobservable inputs for fair value measurements categorized within Level 3 of the fair value hierarchy.
There were no transfers in or out of Level 1, Level 2 and Level 3 during the year.
The Fund recognizes transfers between the levels as of the beginning of the fiscal year.
| |
| 2. | Derivative Instruments |
The Fund may invest in various types of derivatives, which may at times result in significant derivative exposure. A derivative is a financial instrument whose performance is derived from the performance of another asset. The Fund may invest in derivative instruments including, but not limited to: futures contracts, put options, call options, options on swap contracts, options on future contracts, options on foreign currencies, swaps, forward contracts, structured investments, and other equity-linked derivatives. Each derivative instrument that was held by the Fund during the year ended June 30, 2013 is discussed in further detail below. A summary of derivative activity is reflected in the tables at the end of this section.
The Fund may use derivative instruments for hedging (to offset risks associated with an investment, currency exposure, or market conditions) or for speculative (to seek to enhance returns) purposes. When the Fund invests in a derivative for speculative purposes, the Fund will be fully exposed to the risks of loss of that derivative, which may sometimes be greater than the derivative’s cost. The Fund may not use any derivative to gain exposure to an asset or class of assets in which it would be prohibited by its investment restrictions from purchasing directly. The Fund’s ability to use derivative instruments may also be limited by tax considerations.
Investments in derivatives in general are subject to market risks that may cause their prices to fluctuate over time. Investments in derivatives may not directly correlate with the price movements of the underlying instrument. As a result, the use of derivatives may expose the Fund to additional risks that it would not be subject to if it invested directly in the securities underlying those derivatives. The use of derivatives may result in larger losses or smaller gains than otherwise would be the case. Derivatives can be volatile and may involve significant risks, including, but not limited to, counterparty risk, credit risk, currency risk, equity risk, index risk, interest rate risk, leverage risk, and liquidity risk, as described below.
Derivatives may generally be traded OTC or on an exchange. Derivatives traded OTC, such as options and structured notes, are agreements that are individually negotiated between parties and can be tailored to meet a purchaser’s needs.
OTC derivatives are not guaranteed by a clearing agency and may be subject to increased credit risk. In an effort to mitigate credit risk associated with derivatives traded OTC, the Fund may enter into collateral agreements with certain counterparties whereby, subject to certain minimum exposure requirements, the Fund may require the counterparty to post collateral if the Fund has a net aggregate unrealized gain on all OTC derivative contracts with a particular counterparty. There is no guarantee that counterparty exposure is reduced and these arrangements are dependent on Janus Capital’s ability to establish and maintain appropriate systems and trading.
In pursuit of its investment objective, the Fund may seek to use derivatives to increase or decrease exposure to the following market risk factors:
| |
| • | Counterparty Risk – Counterparty risk is the risk that the counterparty (the party on the other side of the transaction) on a derivative transaction will be unable to honor its financial obligation to the Fund. |
| |
| • | Credit Risk – Credit risk is the risk an issuer will be unable to make principal and interest payments when due, or will default on its obligations. |
| |
| • | Currency Risk – Currency risk is the risk that changes in the exchange rate between currencies will adversely affect the value (in U.S. dollar terms) of an investment. |
| |
| • | Equity Risk – Equity risk relates to the change in value of equity securities as they relate to increases or decreases in the general market. |
| |
| • | Index Risk – If the derivative is linked to the performance of an index, it will be subject to the risks associated with changes in that index. If the index changes, the Fund could receive lower interest payments or experience a reduction in the value of the derivative to below what the Fund paid. Certain indexed securities, including inverse securities (which move in an opposite direction to the index), may create leverage, to the extent that they increase or decrease in value at a rate that is a multiple of the changes in the applicable index. |
| |
| • | Interest Rate Risk – Interest rate risk is the risk that the value of fixed-income securities will generally |
22 | JUNE 30, 2013
| |
| decline as prevailing interest rates rise, which may cause the Fund’s NAV to likewise decrease, and vice versa. |
| |
| • | Leverage Risk – Leverage risk is the risk associated with certain types of leveraged investments or trading strategies pursuant to which relatively small market movements may result in large changes in the value of an investment. The Fund creates leverage by using borrowed capital to increase the amount invested, or investing in instruments, including derivatives, where the investment loss can exceed the original amount invested. Certain investments or trading strategies that involve leverage can result in losses that greatly exceed the amount originally invested. |
| |
| • | Liquidity Risk – Liquidity risk is the risk that certain securities may be difficult or impossible to sell at the time that the seller would like or at the price that the seller believes the security is currently worth. |
Commodity-Linked Investments
The Fund may invest in commodity index-linked swap agreements, commodity options and futures, and options on futures that provide exposure to the investment returns of the commodities markets. The Fund may also invest in other commodity-linked derivative instruments, such as commodity-linked notes (“structured notes”). Prior to October 15, 2012, the Fund sought to gain exposure to the commodity markets, in whole or in part, through investments in the Subsidiary which was generally subject to the same investment policies and restrictions of the Fund. The Subsidiary invested in commodity-linked investments and other investments which served as margin or collateral for the Subsidiary’s derivative positions. Such exposure subjected the Fund to greater volatility than investments in traditional securities. The value of a given commodity-linked derivative investment typically is based upon the price movements of a physical commodity (such as heating oil, livestock, or agricultural products), a commodity futures contract or commodity index, or some other readily measurable economic variable. The value of commodity-linked derivative instruments may therefore be affected by changes in overall market movements, volatility of the underlying benchmark, changes in interest rates, or other factors affecting a particular industry or commodity such as drought, floods, weather, livestock disease, embargoes, tariffs, and international economic, political, and regulatory developments.
Forward Foreign Currency Exchange Contracts
A forward foreign currency exchange contract (“forward currency contract”) is an obligation to buy or sell a specified currency at a future date at a negotiated rate (which may be U.S. dollars or a foreign currency). The Fund may enter into forward currency contracts for hedging purposes, including, but not limited to, reducing exposure to changes in foreign currency exchange rates on foreign portfolio holdings and locking in the U.S. dollar cost of firm purchase and sale commitments for securities denominated in or exposed to foreign currencies. The Fund may also invest in forward currency contracts for nonhedging purposes such as seeking to enhance returns. The Fund is subject to currency risk in the normal course of pursuing its investment objective through its investments in forward currency contracts.
The gain or loss arising from the difference between the U.S. dollar cost of the original contract and the value of the foreign currency in U.S. dollars upon closing a contract is included in “Net realized gain/(loss) from investment and foreign currency transactions” on the Statement of Operations.
The Fund does not require the counterparty to post collateral for forward currency contracts; however, the Fund will segregate cash or high-grade securities with its custodian in an amount at all times equal to or greater than the Fund’s commitment with respect to these contracts. Such segregated assets are denoted on the accompanying Schedule of Investments and are evaluated daily to ensure their market value equals or exceeds the current market value of the Fund’s corresponding forward currency contracts.
Futures Contracts
A futures contract is an exchange-traded agreement to take or make delivery of an underlying asset at a specific time in the future for a specific predetermined negotiated price. The Fund may enter into futures contracts to gain exposure to the stock market pending investment of cash balances or to meet liquidity needs. The Fund is subject to interest rate risk, equity risk, and currency risk in the normal course of pursuing its investment objective through its investments in futures contracts. The Fund may also use such derivative instruments to hedge or protect from adverse movements in securities prices, currency rates or interest rates. The use of futures contracts may involve risks such as the possibility of illiquid markets or imperfect correlation between the values of the contracts and the underlying securities, or that the counterparty will fail to perform its obligations.
Futures contracts are marked-to-market daily, and the daily variation margin is recorded as a receivable or payable on the Statement of Assets and Liabilities. When a contract is closed, a realized gain or loss is recorded as “Net realized gain/(loss) from futures contracts” on the Statement of Operations, equal to the difference between the opening and closing value of the contract. Generally, futures contracts are marked-to-market (i.e., treated as
Janus Fixed Income Fund | 23
Notes to Financial Statements (continued)
realized and subject to distribution) for federal income tax purposes at fiscal year-end. Securities held by the Fund that are designated as collateral for market value on futures contracts are noted on the Schedule of Investments. Such collateral is in the possession of the Fund’s custodian or with the counterparty broker.
With futures, there is minimal counterparty credit risk to the Fund since futures are exchange-traded and the exchange’s clearinghouse, as counterparty to all exchange-traded futures, guarantees the futures against default.
Options Contracts
An options contract provides the purchaser with the right, but not the obligation, to buy (call option) or sell (put option) a financial instrument at an agreed upon price. The Fund is subject to interest rate risk, liquidity risk, equity risk, and currency risk in the normal course of pursuing its investment objective through its investments in options contracts. The Fund may use options contracts to hedge against changes in interest rates, the values of equities, or foreign currencies. The Fund may utilize American-style and European-style options. An American-style option is an option contract that can be exercised at any time between the time of purchase and the option’s expiration date. A European-style option is an option contract that can only be exercised on the option’s expiration date. The Fund may also purchase or write put and call options on foreign currencies in a manner similar to that in which futures or forward contracts on foreign currencies will be utilized. The Fund generally invests in options to hedge against adverse movements in the value of portfolio holdings.
When an option is written, the Fund receives a premium and becomes obligated to sell or purchase the underlying security at a fixed price, upon exercise of the option. In writing an option, the Fund bears the risk of an unfavorable change in the price of the security underlying the written option. Exercise of an option written by the Fund could result in the Fund buying or selling a security at a price different from the current market value.
When an option is exercised, the proceeds on sales for a written call option, the purchase cost for a written put option, or the cost of the security for a purchased put or call option are adjusted by the amount of premium received or paid.
The Fund may also purchase and write exchange-listed and OTC put and call options on domestic securities indices, and on foreign securities indices listed on domestic and foreign securities exchanges. Options on securities indices are similar to options on securities except that (1) the expiration cycles of securities index options are monthly, while those of securities options are currently quarterly, and (2) the delivery requirements are different. Instead of giving the right to take or make delivery of securities at a specified price, an option on a securities index gives the holder the right to receive a cash “exercise settlement amount” equal to (a) the amount, if any, by which the fixed exercise price of the option exceeds (in the case of a put) or is less than (in the case of a call) the closing value of the underlying index on the date of exercise, multiplied by (b) a fixed “index multiplier.” Receipt of this cash amount will depend upon the closing level of the securities index upon which the option is based being greater than, in the case of a call, or less than, in the case of a put, the exercise price of the index and the exercise price of the option times a specified multiple. The writer of the option is obligated, in return for the premium received, to make delivery of this amount.
Options traded on an exchange are regulated and the terms of the options are standardized. Options traded OTC expose the Fund to counterparty risk in the event that the counterparty does not perform. This risk is mitigated by having a netting arrangement between the Fund and the counterparty and by having the counterparty post collateral to cover the Fund’s exposure to the counterparty.
Holdings of the Fund designated to cover outstanding written options are noted on the Schedule of Investments. Options written are reported as a liability on the Statement of Assets and Liabilities as “Options written at value.” Realized gains and losses are reported as “Net realized gain/(loss) from written options contracts” on the Statement of Operations.
The risk in writing call options is that the Fund gives up the opportunity for profit if the market price of the security increases and the options are exercised. The risk in writing put options is that the Fund may incur a loss if the market price of the security decreases and the options are exercised. The risk in buying options is that the Fund pays a premium whether or not the options are exercised. The use of such instruments may involve certain additional risks as a result of unanticipated movements in the market. A lack of correlation between the value of an instrument underlying an option and the asset being hedged, or unexpected adverse price movements, could render the Fund’s hedging strategy unsuccessful. In addition, there can be no assurance that a liquid secondary market will exist for any option purchased or sold. There is no limit to the loss the Fund may recognize due to written call options.
24 | JUNE 30, 2013
Written option activity for the year ended June 30, 2013 is indicated in the tables below:
| | | | | | | | | |
| | | Number of
| | Premiums
| | |
| Call Options | | Contracts | | Received | | |
| |
| |
| Options outstanding at June 30, 2012 | | | – | | $ | – | | |
| Options written | | | 7,300 | | | 2,359 | | |
| Options closed | | | (7,300) | | | (2,359) | | |
| Options expired | | | – | | | – | | |
| Options exercised | | | – | | | – | | |
| |
| |
| Options outstanding at June 30, 2013 | | | – | | $ | – | | |
| |
| |
| | | | | | | | | |
| | | Number of
| | Premiums
| | |
| Put Options | | Contracts | | Received | | |
| |
| |
| Options outstanding at June 30, 2012 | | | 137 | | $ | 6,486 | | |
| Options written | | | – | | | – | | |
| Options closed | | | – | | | – | | |
| Options expired | | | (137) | | | (6,486) | | |
| Options exercised | | | – | | | – | | |
| |
| |
| Options outstanding at June 30, 2013 | | | – | | $ | – | | |
| |
| |
Swaps
A swap is an agreement that obligates two parties to exchange a series of cash flows at specified intervals based upon or calculated by reference to changes in specified prices or rates for a specified amount of an underlying asset. The Fund may utilize swap agreements as a means to gain exposure to certain common stocks and/or to “hedge” or protect its portfolio from adverse movements in securities prices, the rate of inflation, or interest rates. The Fund is subject to equity risk and interest rate risk in the normal course of pursuing its investment objective through investments in swap contracts. Swap agreements entail the risk that a party will default on its payment obligation to the Fund. If the other party to a swap defaults, the Fund would risk the loss of the net amount of the payments that it contractually is entitled to receive. If the Fund utilizes a swap at the wrong time or judges market conditions incorrectly, the swap may result in a loss to the Fund and reduce the Fund’s total return. Swap agreements traditionally were privately negotiated and entered into in the OTC market. However, the Dodd-Frank Wall Street Reform and Consumer Protection Act (the “Dodd-Frank Act”) of 2010 now requires certain swap agreements to be cleared through a clearinghouse and traded on an exchange or swap execution facility. New regulations under the Dodd-Frank Act could, among other things, increase the cost of such transactions. Swap contracts of the Fund are reported as an asset or liability on the Statement of Assets and Liabilities. Realized gains and losses of the Fund are reported in “Net realized gain/(loss) from swap contracts” on the Statement of Operations.
Various types of swaps such as credit default (funded and unfunded), interest rate and total return swaps are described below.
Credit default swaps are a specific kind of counterparty agreement that allows the transfer of third-party credit risk from one party to the other. The Fund is subject to credit risk in the normal course of pursuing its investment objective through its investments in credit default swap contracts. The Fund may enter into credit default swaps to manage its exposure to the market or certain sectors of the market, to reduce its risk exposure to defaults of corporate and sovereign issuers, or to create exposure to corporate or sovereign issuers to which it is not otherwise exposed. With a credit default swap, one party in the swap is a lender and faces credit risk from a third party, and the counterparty in the credit default swap agrees to insure this risk in exchange for regular periodic payments. The Fund’s maximum risk of loss from counterparty risk, either as a protection seller or as a protection buyer (undiscounted), is the notional value of the agreement. The risk is mitigated by having a netting arrangement between the Fund and the counterparty and by posting of collateral by the counterparty to the Fund to cover the Fund’s exposure to the counterparty.
Funded (notional value of contract paid up front) or unfunded (notional value only paid in case of default) credit default swaps are based on an index of credit default swaps (“CDXs”) or other similarly structured products. CDXs are designed to track segments of the credit default swap market and provide investors with exposure to specific reference baskets of issuers of bonds or loans. These instruments have the potential to allow an investor to obtain the same investment exposure as an investor who invests in an individual credit default swap, but with the potential added benefit of diversification. The CDX reference baskets are normally priced daily and rebalanced every six months in conjunction with leading market makers in the credit industry. The liquidity of the market for CDXs is normally subject to liquidity in the secured loan and credit derivatives markets. A fund investing in CDXs is normally only permitted to take long positions in these instruments.
Interest rate swaps involve the exchange by two parties of their respective commitments to pay or receive interest (e.g., an exchange of floating rate payments for fixed rate payments).
Total return swaps involve an exchange by two parties in which one party makes payments based on a set rate, either fixed or variable, while the other party makes payments based on the return of an underlying asset, which includes both the income it generates and any capital gains over the payment period.
The Fund’s maximum risk of loss for credit default swaps, interest rate swaps and total return swaps from counterparty risk or credit risk is the discounted value of
Janus Fixed Income Fund | 25
Notes to Financial Statements (continued)
the payments to be received from/paid to the counterparty over the contract’s remaining life, to the extent that the amount is positive. The risk is mitigated by having a netting arrangement between the Fund and the counterparty and by the posting of collateral to the Fund to cover the Fund’s exposure to the counterparty.
The following tables provide information about the effect of derivatives and hedging activities on the Fund’s Statement of Operations for the year ended June 30, 2013. There were no derivatives held by the Fund at June 30, 2013.
The effect of Derivative Instruments on the Statement of Operations for the year ended June 30, 2013
| | | | | | | | | | | | | | | | | | | | | |
| Amount of Realized Gain/(Loss) on Derivatives Recognized in Income | |
| | | | | | | | | | | | Forward Currency
| | | | |
| Derivatives Not Accounted for as Hedging Instruments | | Futures | | | Swaps | | | Options | | | Contracts | | | Total | |
| |
| |
| Commodity-Linked Contracts | | $ | (224,130 | ) | | $ | – | | | $ | – | | | $ | – | | | $ | (224,130 | ) |
| |
| |
| Credit Contracts | | | – | | | | 34,358 | | | | – | | | | – | | | | 34,358 | |
| |
| |
| Currency Contracts | | | (128,174 | ) | | | – | | | | – | | | | – | | | | (128,174 | ) |
| |
| |
| Equity Contracts | | | (484,927 | ) | | | 241,373 | | | | 8,232 | | | | – | | | | (235,322 | ) |
| |
| |
| Foreign Exchange Contracts | | | – | | | | – | | | | – | | | | 471 | | | | 471 | |
| |
| |
| Interest Rate Contracts | | | 96,613 | | | | (2,021,389 | ) | | | – | | | | – | | | | (1,924,776 | ) |
| |
| |
| Total | | $ | (740,618 | ) | | $ | (1,745,658 | ) | | $ | 8,232 | | | $ | 471 | | | $ | (2,477,573 | ) |
| |
| |
| | | | | | | | | | | | | | | | | | | | | |
| Change in Unrealized Appreciation/(Depreciation) on Derivatives Recognized in Income | |
| | | | | | | | | | | | Forward Currency
| | | | |
| Derivatives Not Accounted for as Hedging Instruments | | Futures | | | Swaps | | | Options | | | Contracts | | | Total | |
| |
| |
| Commodity-Linked Contracts | | $ | 35,365 | | | $ | – | | | $ | – | | | $ | – | | | $ | 35,365 | |
| |
| |
| Credit Contracts | | | – | | | | (27,001 | ) | | | – | | | | – | | | | (27,001 | ) |
| |
| |
| Currency Contracts | | | 31,709 | | | | – | | | | – | | | | – | | | | 31,709 | |
| |
| |
| Equity Contracts | | | 171,724 | | | | (41,347 | ) | | | (3,363 | ) | | | – | | | | 127,014 | |
| |
| |
| Foreign Exchange Contracts | | | – | | | | – | | | | – | | | | (813 | ) | | | (813 | ) |
| |
| |
| Interest Rate Contracts | | | 7,944 | | | | 2,006,020 | | | | – | | | | – | | | | 2,013,964 | |
| |
| |
| Total | | $ | 246,742 | | | $ | 1,937,672 | | | $ | (3,363 | ) | | $ | (813 | ) | | $ | 2,180,238 | |
| |
| |
Please see the Fund’s Statement of Operations for the Fund’s “Net Realized and Unrealized Gain/(Loss) on Investments.”
The effect of derivatives on the Statement of Operations is indicative of the Fund’s volume through October 15, 2012. Subsequent to October 15, 2012, the Fund has not held derivatives.
| |
| 3. | Other Investments and Strategies |
Additional Investment Risk
The Fund may be invested in lower-rated debt securities that have a higher risk of default or loss of value since these securities may be sensitive to economic changes, political changes or adverse developments specific to the issuer.
The financial crisis that began in 2008 has caused a significant decline in the value and liquidity of many securities of issuers worldwide in the equity and fixed-income/credit markets. In response to the crisis, the United States and certain foreign governments, along with the U.S. Federal Reserve and certain foreign central banks have taken steps to support the financial markets. The withdrawal of this support, failure of efforts to respond to the crisis, or investor perception that such efforts are not succeeding each could also negatively affect financial markets generally, and the value and liquidity of specific securities. In addition, policy and legislative changes in the United States and in other countries are impacting many aspects of financial regulation. The effect of these changes on the markets, and the practical implications for market participants, including a Fund, may not be fully known for some time. Because the situation is unprecedented and widespread, it may also be unusually difficult to identify both investment risks and opportunities, which could limit or preclude a Fund’s ability to achieve its investment objective. Therefore, it is important to understand that the value of your investment may fall, sometimes sharply, and you could lose money.
The enactment of the Dodd-Frank Act is dramatically changing the way in which the U.S. financial system is supervised and regulated. The Dodd-Frank Act provides for widespread regulation of financial institutions, consumer financial products and services, broker-dealers, OTC derivatives, investment advisers, credit rating agencies, and mortgage lending, which expands federal oversight in the financial sector, including the investment
26 | JUNE 30, 2013
management industry. Many provisions of the Dodd-Frank Act will be implemented through future rulemaking. Therefore, the ultimate impact of the Dodd-Frank Act and the regulations under the Dodd-Frank Act, on the Fund and the investment management industry as a whole, is not yet certain.
A number of countries in the European Union (“EU”) have experienced severe economic and financial difficulties. As a result, financial markets in the EU have been subject to extreme volatility and declines in asset values and liquidity. Responses to these financial problems by European governments, central banks, and others, including austerity measures and reforms, may not work, may result in social unrest, and may limit future growth and economic recovery or have other unintended consequences. Further defaults or restructuring by governments and others of their debt could have additional adverse effects on economies, financial markets, and asset valuations around the world.
Certain areas of the world have historically been prone to and economically sensitive to environmental events such as, but not limited to, hurricanes, earthquakes, typhoons, flooding, tidal waves, tsunamis, erupting volcanoes, wildfires or droughts, tornadoes, mudslides, or other weather-related phenomena. Such disasters, and the resulting physical or economic damage, could have a severe and negative impact on the Fund’s investment portfolio and, in the longer term, could impair the ability of issuers in which the Fund invests to conduct their businesses as they would under normal conditions. Adverse weather conditions may also have a particularly significant negative effect on issuers in the agricultural sector and on insurance companies that insure against the impact of natural disasters.
Counterparties
Fund transactions involving a counterparty are subject to the risk that the counterparty or a third party will not fulfill its obligation to the Fund (“counterparty risk”). Counterparty risk may arise because of the counterparty’s financial condition (i.e., financial difficulties, bankruptcy, or insolvency), market activities and developments, or other reasons, whether foreseen or not. A counterparty’s inability to fulfill its obligation may result in significant financial loss to the Fund. The Fund may be unable to recover its investment from the counterparty or may obtain a limited recovery, and/or recovery may be delayed. The extent of the Fund’s exposure to counterparty risk in respect to financial assets approximates its carrying value as recorded on the Fund’s Statement of Assets and Liabilities.
The Fund may be exposed to counterparty risk through participation in various programs including, but not limited to, lending its securities to third parties, cash sweep arrangements whereby the Fund’s cash balance is invested in one or more types of cash management vehicles, as well as investments in, but not limited to, repurchase agreements, debt securities, and derivatives, including various types of swaps, futures and options. The Fund intends to enter into financial transactions with counterparties that Janus Capital believes to be creditworthy at the time of the transaction. There is always the risk that Janus Capital’s analysis of a counterparty’s creditworthiness is incorrect or may change due to market conditions. To the extent that the Fund focuses its transactions with a limited number of counterparties, it will have greater exposure to the risks associated with one or more counterparties.
Investment in Subsidiary
To qualify as a regulated investment company under the Internal Revenue Code of 1986, as amended (the “Code”), 90% of the Fund’s income must be from certain qualified sources. Direct investment in many commodities-related investments generates income that is not from a qualifying source for purposes of meeting this 90% test. Until October 15, 2012, the Fund sought to gain exposure to the commodity markets, in whole or in part, through investments in the Subsidiary, which was generally subject to the same investment policies and restrictions of the Fund. The Subsidiary invested in commodity index-linked swaps, commodity futures, commodity-linked notes, and other commodity-linked derivative instruments. The Subsidiary also invested in fixed-income securities and other investments which served as margin or collateral for the Subsidiary’s derivatives positions. The Fund could invest up to 25% of its total assets in the Subsidiary. Income or net capital gains from the Fund’s investment in the Subsidiary was treated as ordinary income to the Fund. Janus Capital was the adviser to the Subsidiary and Armored Wolf, LLC (“Armored Wolf”) was the Subsidiary’s subadviser. The Subsidiary was not subject to U.S. laws (including securities laws) and their protections. The Subsidiary was subject to the laws of a foreign jurisdiction. The Fund applied for a private letter ruling confirming, among other things, that income produced by the Fund’s investment in the Subsidiary and that income from certain commodity-related investments constitutes qualifying income to the Fund.
Real Estate Investing
The Fund may invest in equity and debt securities of real estate-related companies. Such companies may include those in the real estate industry or real estate-related industries. These securities may include common stocks, preferred stocks, and other equity securities, including, but not limited to, mortgage-backed securities, real estate-backed securities, securities of REITs and similar REIT-like
Janus Fixed Income Fund | 27
Notes to Financial Statements (continued)
entities. A REIT is a trust that invests in real estate-related projects, such as properties, mortgage loans, and construction loans. REITs are generally categorized as equity, mortgage, or hybrid REITs. A REIT may be listed on an exchange or traded OTC.
Restricted Security Transactions
Restricted securities held by the Fund may not be sold except in exempt transactions or in a public offering registered under the Securities Act of 1933, as amended. The risk of investing in such securities is generally greater than the risk of investing in the securities of widely held, publicly traded companies. Lack of a secondary market and resale restrictions may result in the inability of the Fund to sell a security at a fair price and may substantially delay the sale of the security. In addition, these securities may exhibit greater price volatility than securities for which secondary markets exist. There were no restricted securities held by the Fund at June 30, 2013.
Sovereign Debt
The Fund may invest in U.S. and foreign government debt securities (“sovereign debt”). Investments in U.S. sovereign debt are considered low risk. However, investments in non-U.S. sovereign debt can involve a high degree of risk, including the risk that the governmental entity that controls the repayment of sovereign debt may not be willing or able to repay the principal and/or to pay the interest on its sovereign debt in a timely manner. A sovereign debtor’s willingness or ability to satisfy its debt obligation may be affected by various factors, including its cash flow situation, the extent of its foreign currency reserves, the availability of foreign exchange when a payment is due, the relative size of its debt position in relation to its economy as a whole, the sovereign debtor’s policy toward international lenders, and local political constraints to which the governmental entity may be subject. Sovereign debtors may also be dependent on expected disbursements from foreign governments, multilateral agencies, and other entities. The failure of a sovereign debtor to implement economic reforms, achieve specified levels of economic performance, or repay principal or interest when due may result in the cancellation of third party commitments to lend funds to the sovereign debtor, which may further impair such debtor’s ability or willingness to timely service its debts. The Fund may be requested to participate in the rescheduling of such sovereign debt and to extend further loans to governmental entities, which may adversely affect the Fund’s holdings. In the event of default, there may be limited or no legal remedies for collecting sovereign debt and there may be no bankruptcy proceedings through which the Fund may collect all or part of the sovereign debt that a governmental entity has not repaid.
| |
| 4. | Investment Advisory Agreements and Other Transactions With Affiliates |
Effective October 15, 2012, the Fund pays Janus Capital an investment advisory fee which is calculated daily and paid monthly. The following table reflects the Fund’s contractual investment advisory fee rate (expressed as an annual rate). The rate shown is a fixed rate based on the Fund’s average daily net assets.
| | | | | | | | | |
| | | | | Contractual
| | |
| | | | | Investment
| | |
| | | Average Daily Net
| | Advisory Fee
| | |
| Fund | | Assets of the Fund | | % (annual rate) | | |
| |
| |
| Janus Real Return Fund | | | First $1 Billion | | | 0.55 | | |
| | | | Next $4 Billion | | | 0.53 | | |
| | | | Over $5 Billion | | | 0.50 | | |
| |
| |
Prior to October 15, 2012, the Fund and the Subsidiary each paid Janus Capital an investment advisory fee which was calculated daily and paid monthly. The following table reflected the Fund’s contractual investment advisory fee rate (expressed as an annual rate). The rate shown was a fixed rate based on the Fund’s average daily net assets.
| | | | | | | | | |
| | | | | Contractual
| | |
| | | | | Investment
| | |
| | | Average Daily Net
| | Advisory Fee
| | |
| Fund | | Assets of the Fund | | % (annual rate) | | |
| |
| |
| Janus Real Return Fund | | | First $3 Billion | | | 0.75 | | |
| | | | Over $3 Billion | | | 0.72 | | |
| |
| |
Until October 15, 2012, Janus Capital contractually agreed to waive a portion of the Fund’s management fee in an amount equal to the management fee paid to Janus Capital by the Subsidiary.
Until October 15, 2012, Armored Wolf served as a subadviser to the Fund and to the Subsidiary, and provided advisory services to the Fund related to inflation-linked securities, emerging market debt, commodity-linked investments and participated in overall investment category allocation determinations. Armored Wolf no longer serves as subadviser to the Fund.
Janus Capital has agreed to reimburse the Fund until at least November 1, 2013 by the amount, if any, that the Fund’s normal operating expenses in any fiscal year, including the investment advisory fee, but excluding any class-specific distribution and shareholder servicing fees applicable to Class A Shares, Class C Shares, and Class S Shares, the administrative services fees payable pursuant to the Transfer Agency Agreement (except for networking and omnibus fees for Class A Shares, Class C Shares, and Class I Shares), brokerage commissions, interest, dividends, taxes, acquired fund fees and expenses, and extraordinary expenses, exceed the annual rates noted below. Amounts reimbursed to the Fund by Janus Capital
28 | JUNE 30, 2013
are disclosed as “Excess Expense Reimbursement” on the Statement of Operations.
| | | | | | | | | |
| | | New
| | | | |
| | | Expense Limit (%)
| | Previous
| | |
| | | (October 15, 2012
| | Expense Limit (%)
| | |
| Fund | | to Present) | | (until October 15, 2012) | | |
| |
| |
| Janus Real Return Fund | | | 0.76 | | | 1.00 | | |
| |
| |
For a period of three years subsequent to the Fund’s commencement of operations or until the Fund’s assets exceed the first breakpoint in the investment advisory fee schedule, that was effective at commencement of operations, whichever occurs first, Janus Capital may recover from the Fund fees and expenses previously waived or reimbursed, which could then be considered a deferral, if the Fund’s expense ratio, including recovered expenses, falls below the expense limit. The recoupment of such reimbursements expires May 13, 2014. For the year ended June 30, 2013, total reimbursement by Janus Capital was $354,134 for the Fund. As of June 30, 2013, the aggregate amount of recoupment that may potentially be made to Janus Capital is $989,048.
State Street Bank and Trust Company (“State Street”) provides certain accounting services to the Fund and the Subsidiary as part of the custodial and fund accounting arrangement, including calculating the daily NAV of each share class and certain compliance-related functions. State Street also provides certain administration services to the Fund, including services related to the Fund’s audit, tax, and reporting obligations, pursuant to an Agreement with the Trust, on behalf of the Fund. As compensation for such services, the Fund pays State Street a flat fee. Janus Capital serves as administrator to the Fund. With respect to other administration services, such as recordkeeping, and state monitoring and registration functions, Janus Capital does not receive any compensation for these services but may be reimbursed for out-of-pocket expenses by the Fund. Additionally, the Subsidiary had entered into separate agreements with State Street related to custodian, accounting, and transfer agency services related to the Subsidiary. Compensation to State Street for such services was indirectly borne by the Fund.
Effective July 1, 2013, Janus Capital replaced State Street Bank and Trust Company to perform for the Fund certain administration functions previously performed by State Street Bank and Trust Company, such as calculating the NAV of each share class and performing certain other audit-related functions, maintaining certain books and records, and performing tax services.
Janus Services LLC (“Janus Services”), a wholly-owned subsidiary of Janus Capital, is the Fund’s transfer agent. In addition, Janus Services provides or arranges for the provision of certain other administrative services including, but not limited to, recordkeeping, accounting, order processing, and other shareholder services for the Fund.
Certain, but not all, intermediaries charge administrative fees to investors in Class A Shares, Class C Shares, and Class I Shares for administrative services provided on behalf of such investors. These administrative fees are paid by the Class A Shares, Class C Shares, and Class I Shares of the Fund to Janus Services, which uses such fees to reimburse intermediaries. Consistent with the Transfer Agency Agreement between Janus Services and the Fund, Janus Services may negotiate the level, structure, and/or terms of the administrative fees with intermediaries requiring such fees on behalf of the Fund. Janus Capital and its affiliates benefit from an increase in assets that may result from such relationships.
Class D Shares of the Fund pay an annual administrative services fee of 0.12% of net assets. These administrative services fees are paid by Class D Shares of the Fund for shareholder services provided by Janus Services.
Janus Services receives an administrative services fee at an annual rate of up to 0.25% of the average daily net assets of Class S Shares and Class T Shares of the Fund for providing or procuring administrative services to investors in Class S Shares and Class T Shares of the Fund. Janus Services expects to use all or a significant portion of this fee to compensate retirement plan service providers, broker-dealers, bank trust departments, financial advisors, and other financial intermediaries for providing these services. Janus Services or its affiliates may also pay fees for services provided by intermediaries to the extent the fees charged by intermediaries exceed the 0.25% of net assets charged to Class S Shares and Class T Shares of the Fund. Janus Services may keep certain amounts retained for reimbursement of out-of-pocket costs incurred for servicing clients of Class S Shares and Class T Shares.
Services provided by these financial intermediaries may include, but are not limited to, recordkeeping, subaccounting, order processing, providing order confirmations, periodic statements, forwarding prospectuses, shareholder reports, and other materials to existing customers, answering inquiries regarding accounts, and other administrative services. Order processing includes the submission of transactions through the National Securities Clearing Corporation (“NSCC”) or similar systems, or those processed on a manual basis with Janus Capital.
Janus Services is compensated for its services related to Class D Shares, and receives reimbursement for its out-of-pocket costs on all other share classes. Included in out-of-pocket expenses are the expenses Janus Services
Janus Fixed Income Fund | 29
Notes to Financial Statements (continued)
incurs for serving as transfer agent and providing servicing to shareholders.
Janus Distributors LLC (“Janus Distributors”), a wholly-owned subsidiary of Janus Capital, is the distributor of the Fund. The Fund has adopted a Distribution and Shareholder Servicing Plan (the “Plan”) pursuant to Rule 12b-1 under the 1940 Act. The Plan authorizes payments by the Fund to intermediaries at an annual rate, as determined from time to time by the Board of Trustees, of up to 0.25% of the Class A Shares average daily net assets, of up to 1.00% of the Class C Shares average daily net assets, and of up to 0.25% of the Class S Shares average daily net assets. Payments under the Plan are not tied exclusively to actual distribution and shareholder service expenses, and the payments may exceed distribution and shareholder service expenses actually incurred by the Fund. If any of the Fund’s actual distribution and shareholder service expenses incurred during a calendar year are less than the payments made during a calendar year, the Fund will be refunded the difference. Refunds, if any, are included in “Distribution fees and shareholder servicing fees” in the Statement of Operations.
The Board of Trustees has adopted a deferred compensation plan (the “Deferred Plan”) for independent Trustees to elect to defer receipt of all or a portion of the annual compensation they are entitled to receive from the Fund. All deferred fees are credited to an account established in the name of the Trustees. The amounts credited to the account then increase or decrease, as the case may be, in accordance with the performance of one or more of the Janus funds that are selected by the Trustees. The account balance continues to fluctuate in accordance with the performance of the selected fund or funds until final payment of all amounts are credited to the account. The fluctuation of the account balance is recorded by the Fund as unrealized appreciation/(depreciation) and is shown as of June 30, 2013 on the Statement of Assets and Liabilities as an asset, “Non-interested Trustees’ deferred compensation,” and a liability, “Non-interested Trustees’ deferred compensation fees.” Additionally, the recorded unrealized appreciation/(depreciation) is included in “Unrealized net appreciation/(depreciation) of investments, foreign currency translations and non-interested Trustees’ deferred compensation” on the Statement of Assets and Liabilities. Deferred compensation expenses for the year ended June 30, 2013 are included in “Non-interested Trustees’ fees and expenses” on the Statement of Operations. Trustees are allowed to change their designation of mutual funds from time to time. Amounts will be deferred until distributed in accordance with the Deferred Plan. Deferred fees of $243,941 were paid to a Trustee under the Deferred Plan during the year ended June 30, 2013.
Certain officers of the Fund may also be officers and/or directors of Janus Capital. The Fund pays for the salaries, fees, and expenses of certain Janus Capital employees and Fund officers, with respect to certain specified administration functions they perform on behalf of the Fund. Administration costs are separate and apart from advisory fees and other expenses paid in connection with the investment advisory services Janus Capital provides to the Fund. Some expenses related to compensation payable to the Fund’s Chief Compliance Officer and compliance staff are shared with the Fund. Total compensation of $487,826 was paid by the Trust to the Chief Compliance Officer and certain compliance staff by the Trust during the year ended June 30, 2013. The Fund’s portion is reported as part of “Other Expenses” on the Statement of Operations.
Class A Shares include a 4.75% upfront sales charge of the offering price of the Fund. The sales charge is allocated between Janus Distributors and financial intermediaries. The sales charge was reduced effective October 15, 2012 from 5.75% to 4.75%. During the year ended June 30, 2013, Janus Distributors retained the following upfront sales charges:
| | | | | | |
| | | Upfront
| | |
| Fund (Class A Shares) | | Sales Charge | | |
| |
| |
| Janus Real Return Fund | | | $363 | | |
| |
| |
A contingent deferred sales charge (“CDSC”) of 1.00% will be deducted with respect to Class A Shares purchased without a sales load and redeemed within 12 months of purchase, unless waived, as discussed in the Prospectus. Any applicable CDSC will be 1.00% of the lesser of the original purchase price or the value of the redemption of the Class A Shares redeemed. There were no CDSCs paid by redeeming shareholders of Class A Shares to Janus Distributors during the year ended June 30, 2013.
Class C Shares include a 1.00% CDSC paid by redeeming shareholders to Janus Distributors. The CDSC applies to shares redeemed within 12 months of purchase. The redemption price may differ from the NAV per share. There were no CDSCs paid by redeeming shareholders of Class C Shares to Janus Distributors during the year ended June 30, 2013.
The Fund’s expenses may be reduced by expense offsets from an unaffiliated custodian and/or transfer agent. Such credits or offsets are included in “Expense and Fee Offset” on the Statement of Operations. The Fund could
30 | JUNE 30, 2013
have employed the assets used by the custodian and/or transfer agent to produce income if it had not entered into an expense offset arrangement.
Pursuant to the provisions of the 1940 Act and rules promulgated thereunder, the Fund may participate in an affiliated or nonaffiliated cash sweep program. In the cash sweep program, uninvested cash balances of the Fund may be used to purchase shares of affiliated or nonaffiliated money market funds or cash management pooled investment vehicles. The Fund is eligible to participate in the cash sweep program (the “Investing Fund”). Janus Cash Liquidity Fund LLC currently is an affiliated unregistered cash management pooled investment vehicle that invests primarily in highly-rated short-term fixed-income securities. Janus Cash Liquidity Fund LLC maintains a NAV of $1.00 per share and distributes income daily in a manner consistent with a registered 2a-7 product. There are no restrictions on the Fund’s ability to withdraw investments from Janus Cash Liquidity Fund LLC at will, and there are no unfunded capital commitments due from the Fund to Janus Cash Liquidity Fund LLC. As adviser, Janus Capital has an inherent conflict of interest because of its fiduciary duties to the affiliated cash management pooled investment vehicles and the Investing Fund.
During the year ended June 30, 2013, any recorded distributions from affiliated investments as affiliated dividend income, and affiliated purchases and sales can be found in the Notes to Schedule of Investments and Other Information.
Janus Capital or an affiliate invested and/or redeemed seed capital during the year ended June 30, 2013, as indicated in the following table.
| | | | | | | | | | | | | | | |
| | | Seed Capital
| | | | Date of
| | Seed Capital
| | |
| | | at 6/30/12 | | Redemptions | | Redemptions | | at 6/30/13 | | |
| |
| Janus Real Return Fund – Class A Shares | | $ | 6,666,666 | | $ | (4,688,830) | | | 8/30/12 – 10/15/12 | | $ | 1,977,836 | | |
| Janus Real Return Fund – Class C Shares | | | 6,666,666 | | | (4,736,022) | | | 8/30/12 – 10/15/12 | | $ | 1,930,644 | | |
| Janus Real Return Fund – Class D Shares | | | 6,666,667 | | | (4,680,191) | | | 8/30/12 – 10/15/12 | | $ | 1,986,476 | | |
| Janus Real Return Fund – Class I Shares | | | 6,666,667 | | | (4,675,109) | | | 8/30/12 – 10/15/12 | | $ | 1,991,558 | | |
| Janus Real Return Fund – Class S Shares | | | 6,666,667 | | | (4,702,954) | | | 8/30/12 – 10/15/12 | | $ | 1,963,713 | | |
| Janus Real Return Fund – Class T Shares | | | 6,666,667 | | | (4,688,520) | | | 8/30/12 – 10/15/12 | | $ | 1,978,147 | | |
| |
| |
The tax components of capital shown in the table below represent: (1) distribution requirements the Fund must satisfy under the income tax regulations; (2) losses or deductions the Fund may be able to offset against income and gains realized in future years; and (3) unrealized appreciation or depreciation of investments for federal income tax purposes.
Other book to tax differences may consist of deferred compensation, derivatives, foreign currency contract adjustments, and foreign subsidiary income. The Fund has elected to treat gains and losses on forward foreign currency contracts as capital gains and losses. Other foreign currency gains and losses on debt instruments are treated as ordinary income for federal income tax purposes pursuant to Section 988 of the Internal Revenue Code.
| | | | | | | | | | | | | | | | | | | | | | | | |
| | | Undistributed
| | Undistributed
| | | | Loss Deferrals | | Other Book
| | Net Tax
| | |
| | | Ordinary
| | Long-Term
| | Accumulated
| | Late-Year
| | Post-October
| | to Tax
| | Appreciation/
| | |
| Fund | | Income | | Gains | | Capital Losses | | Ordinary Loss | | Capital Loss | | Differences | | (Depreciation) | | |
| |
| Janus Real Return Fund | | $ | – | | $ | – | | $ | (458,182) | | $ | – | | $ | – | | $ | 33 | | $ | (160,066) | | |
| |
| |
Accumulated capital losses noted below represented net capital loss carryovers, as of June 30, 2013, that may be available to offset future realized capital gains and thereby reduce future taxable gains distributions. The following table shows these capital loss carryovers.
| | | | | | | | | | | | |
Capital Loss Carryover Expiration Schedule
| | | | | | Accumulated
| | |
For the year ended June 30, 2013
| | No Expiration | | Capital
| | |
| Fund | | Short-Term | | Long-Term | | Losses | | |
| |
| Janus Real Return Fund | | $ | 458,182 | | $ | – | | $ | 458,182 | | |
| |
| |
During the year ended June 30, 2013, the following capital loss carryover was utilized by the Fund:
| | | | | | |
| | | Capital Loss
| | |
| Fund | | Carryover Utilized | | |
| |
| Janus Real Return Fund | | $ | – | | |
| |
| |
Janus Fixed Income Fund | 31
Notes to Financial Statements (continued)
The aggregate cost of investments and the composition of unrealized appreciation and depreciation of investment securities for federal income tax purposes as of June 30, 2013 are noted below.
Unrealized appreciation and unrealized depreciation in the table below exclude appreciation/(depreciation) on foreign currency translations. The primary differences between book and tax appreciation or depreciation of investments are wash sale loss deferrals, and investments in options, forward foreign currency and futures contracts, and passive foreign investment companies.
| | | | | | | | | | | | |
| | | Federal Tax
| | Unrealized
| | Unrealized
| | |
| Fund | | Cost | | Appreciation | | (Depreciation) | | |
| |
| Janus Real Return Fund | | $ | 14,833,396 | | $ | 30,943 | | $ | (191,009) | | |
| |
| |
Income and capital gains distributions are determined in accordance with income tax regulations that may differ from accounting principles generally accepted in the United States of America. These differences are due to differing treatments for items such as net short-term gains, deferral of wash sale losses, foreign currency transactions, passive foreign investment companies, income reversals of the Subsidiary, net investment losses and capital loss carryovers. Certain permanent differences such as tax returns of capital and net investment losses noted below have been reclassified to paid-in capital.
For the year ended June 30, 2013
| | | | | | | | | | | | | | | |
| | | Distributions | | | | |
| | | From Ordinary
| | From Long-Term
| | Tax Return of
| | Net Investment
| | |
| Fund | | Income | | Capital Gains | | Capital | | Loss | | |
| |
| |
| Janus Real Return Fund | | $ | 143,901 | | $ | – | | $ | 82,764 | | $ | – | | |
| |
| |
For the year ended June 30, 2012
| | | | | | | | | | | | | | | |
| | | Distributions | | | | |
| | | From Ordinary
| | From Long-Term
| | Tax Return of
| | Net Investment
| | |
| Fund | | Income | | Capital Gains | | Capital | | Loss | | |
| |
| |
| Janus Real Return Fund | | $ | 163,689 | | $ | 209,626 | | $ | – | | $ | – | | |
| |
| |
32 | JUNE 30, 2013
| |
| 6. | Capital Share Transactions |
| | | | | | | | | |
| | | Janus
| | |
| | | Real Return
| | |
For each year ended June 30
| | Fund | | |
| (all numbers in thousands) | | 2013 | | 2012 | | |
| |
| Transactions in Fund Shares – Class A Shares: | | | | | | | | |
| Shares Sold | | | 6 | | | 125 | | |
| Reinvested dividends and distributions | | | 3 | | | 7 | | |
| Shares repurchased | | | (504) | | | (93) | | |
| Net Increase/(Decrease) in Fund Shares | | | (495) | | | 39 | | |
| Shares Outstanding, Beginning of Period | | | 708 | | | 669 | | |
| Shares Outstanding, End of Period | | | 213 | | | 708 | | |
| Transactions in Fund Shares – Class C Shares: | | | | | | | | |
| Shares Sold | | | 4 | | | 4 | | |
| Reinvested dividends and distributions | | | 1 | | | 5 | | |
| Shares repurchased | | | (474) | | | (1) | | |
| Net Increase/(Decrease) in Fund Shares | | | (469) | | | 8 | | |
| Shares Outstanding, Beginning of Period | | | 675 | | | 667 | | |
| Shares Outstanding, End of Period | | | 206 | | | 675 | | |
| Transactions in Fund Shares – Class D Shares: | | | | | | | | |
| Shares Sold | | | 204 | | | 165 | | |
| Reinvested dividends and distributions | | | 6 | | | 7 | | |
| Shares repurchased | | | (549) | | | (73) | | |
| Net Increase/(Decrease) in Fund Shares | | | (339) | | | 99 | | |
| Shares Outstanding, Beginning of Period | | | 798 | | | 699 | | |
| Shares Outstanding, End of Period | | | 459 | | | 798 | | |
| Transactions in Fund Shares – Class I Shares: | | | | | | | | |
| Shares Sold | | | 14 | | | 17 | | |
| Reinvested dividends and distributions | | | 6 | | | 7 | | |
| Shares repurchased | | | (486) | | | (12) | | |
| Net Increase/(Decrease) in Fund Shares | | | (466) | | | 12 | | |
| Shares Outstanding, Beginning of Period | | | 695 | | | 683 | | |
| Shares Outstanding, End of Period | | | 229 | | | 695 | | |
| Transactions in Fund Shares – Class S Shares: | | | | | | | | |
| Shares Sold | | | – | | | – | | |
| Reinvested dividends and distributions | | | 3 | | | 6 | | |
| Shares repurchased | | | (470) | | | – | | |
| Net Increase/(Decrease) in Fund Shares | | | (467) | | | 6 | | |
| Shares Outstanding, Beginning of Period | | | 673 | | | 667 | | |
| Shares Outstanding, End of Period | | | 206 | | | 673 | | |
| Transactions in Fund Shares – Class T Shares: | | | | | | | | |
| Shares Sold | | | 30 | | | 16 | | |
| Reinvested dividends and distributions | | | 5 | | | 7 | | |
| Shares repurchased | | | (509) | | | (5) | | |
| Net Increase/(Decrease) in Fund Shares | | | (474) | | | 18 | | |
| Shares Outstanding, Beginning of Period | | | 685 | | | 667 | | |
| Shares Outstanding, End of Period | | | 211 | | | 685 | | |
Janus Fixed Income Fund | 33
Notes to Financial Statements (continued)
| |
| 7. | Purchases and Sales of Investment Securities |
For the year ended June 30, 2013, the aggregate cost of purchases and proceeds from sales of investment securities (excluding any short-term securities, short-term options contracts, and in-kind transactions) was as follows:
| | | | | | | | | | | | | | | |
| | | | | | | | | Proceeds from
| | |
| | | | | | | Purchases of
| | Sales of
| | |
| | | | | | | Long-Term
| | Long-Term
| | |
| | | Purchases of
| | Proceeds from Sales
| | U.S. Government
| | U.S. Government
| | |
| Fund | | Securities | | of Securities | | Obligations | | Obligations | | |
| |
| Janus Real Return Fund | | $ | 20,367,521 | | $ | 38,535,523 | | $ | 4,139,551 | | $ | 21,185,810 | | |
| |
| |
| |
| 8. | New Accounting Pronouncements |
In December 2011, the FASB issued Accounting Standards Update No. 2011-11, “Disclosures about Offsetting Assets and Liabilities.” The update creates new disclosure requirements requiring entities to disclose both gross and net information for derivatives and other financial instruments that are either offset in the Statement of Assets and Liabilities or subject to an enforceable master netting arrangement or similar agreement. In January 2013, the FASB issued Accounting Standards Update No. 2013-01, “Clarifying the Scope of Disclosures about Offsetting Assets and Liabilities.” This update limits the scope of the new Statement of Assets and Liabilities offsetting disclosures to derivatives, repurchase agreements, reverse repurchase agreements, securities borrowing and securities lending transactions that are either offset in the Statement of Assets and Liabilities or subject to an enforceable master netting arrangement or similar agreement. The disclosure requirements are effective for annual reporting periods beginning on or after January 1, 2013, and interim periods within those annual periods. Management is currently evaluating the impact this update may have on the Fund’s financial statements.
Management has evaluated whether any other events or transactions occurred subsequent to June 30, 2013 and through the date of issuance of the Fund’s financial statements and determined that there were no material events or transactions that would require recognition or disclosure in the Fund’s financial statements.
34 | JUNE 30, 2013
Report of Independent Registered Public Accounting Firm
To the Trustees and Shareholders
of Janus Investment Fund:
In our opinion, the accompanying statement of assets and liabilities, including the schedule of investments, and the related statement of operations and of changes in net assets and the financial highlights present fairly, in all material respects, the financial position of Janus Real Return Fund (formerly known as Janus Real Return Allocation Fund) (one of the funds constituting Janus Investment Fund, hereafter referred to as the “Fund”) at June 30, 2013 and the result of its operations for the year then ended, the changes in its net assets for each of the two years in the period then ended and the financial highlights for each of the periods presented, in conformity with accounting principles generally accepted in the United States of America. These financial statements and financial highlights (hereafter referred to as “financial statements”) are the responsibility of the Fund’s management; our responsibility is to express an opinion on these financial statements based on our audits. We conducted our audits of these financial statements in accordance with the standards of the Public Company Accounting Oversight Board (United States). Those standards require that we plan and perform the audit to obtain reasonable assurance about whether the financial statements are free of material misstatement. An audit includes examining, on a test basis, evidence supporting the amounts and disclosures in the financial statements, assessing the accounting principles used and significant estimates made by management, and evaluating the overall financial statement presentation. We believe that our audits, which included confirmation of securities at June 30, 2013 by correspondence with the custodian, transfer agent and brokers, provide a reasonable basis for our opinion.

Denver, Colorado
August 19, 2013
Janus Fixed Income Fund | 35
Additional Information (unaudited)
Proxy Voting Policies and Voting Record
A description of the policies and procedures that the Fund uses to determine how to vote proxies relating to its portfolio securities is available without charge: (i) upon request, by calling 1-800-525-0020 (toll free); (ii) on the Fund’s website at janus.com/proxyvoting; and (iii) on the SEC’s website at http://www.sec.gov. Additionally, information regarding the Fund’s proxy voting record for the most recent twelve-month period ended June 30 is also available, free of charge, through janus.com/proxyvoting and from the SEC’s website at http://www.sec.gov.
Quarterly Portfolio Holdings
The Fund files its complete portfolio holdings (schedule of investments) with the SEC for the first and third quarters of each fiscal year on Form N-Q within 60 days of the end of such fiscal quarter. The Fund’s Form N-Q: (i) is available on the SEC’s website at http://www.sec.gov; (ii) may be reviewed and copied at the SEC’s Public Reference Room in Washington, D.C. (information on the Public Reference Room may be obtained by calling 1-800-SEC-0330); and (iii) is available without charge, upon request, by calling Janus at 1-800-525-0020 (toll free).
Approval of Advisory Agreements During the Period
The Trustees of Janus Investment Fund, none of whom has ever been affiliated with Janus Capital and each of whom serves as an “independent” Trustee (the “Trustees”), oversee the management of each Fund and, as required by law, determine annually whether to continue the investment advisory agreement for each Fund and the subadvisory agreements for the nine Funds that utilize subadvisers.
In connection with their most recent consideration of those agreements for each Fund, the Trustees received and reviewed a substantial amount of information provided by Janus Capital and the respective subadvisers in response to requests of the Trustees and their independent legal counsel. They also received and reviewed a considerable amount of information and analysis provided by, and in response to requests of, their independent fee consultant. Throughout their consideration of the agreements, the Trustees were advised by their independent legal counsel. The Trustees met with management to consider the agreements, and also met separately in executive session with their independent legal counsel and their independent fee consultant.
At a meeting held on December 7, 2012, based on the Trustees’ evaluation of the information provided by Janus Capital, the subadvisers and the independent fee consultant, as well as other information, the Trustees determined that the overall arrangements between each Fund and Janus Capital and each subadviser, as applicable, were fair and reasonable in light of the nature, extent and quality of the services provided by Janus Capital, its affiliates and the subadvisers, the fees charged for those services, and other matters that the Trustees considered relevant in the exercise of their business judgment. At that meeting, the Trustees unanimously approved the continuation of the investment advisory agreement for each Fund, and the subadvisory agreement for each subadvised Fund, for the period from February 1, 2013 through February 1, 2014, subject to earlier termination as provided for in each agreement.
In considering the continuation of those agreements, the Trustees reviewed and analyzed various factors that they determined were relevant, including the factors described below, none of which by itself was considered dispositive. However, the material factors and conclusions that formed the basis for the Trustees’ determination to approve the continuation of the agreements are discussed separately below. Also included is a summary of the independent fee consultant’s conclusions and opinions that arose during, and were included as part of, the Trustees’ consideration of the agreements.
Nature, Extent and Quality of Services
The Trustees reviewed the nature, extent and quality of the services provided by Janus Capital and the subadvisers to the Funds, taking into account the investment objective and strategy of each Fund and the knowledge the Trustees gained from their regular meetings with management on at least a quarterly basis and their ongoing review of information related to the Funds. In addition, the Trustees reviewed the resources and key personnel of Janus Capital and each subadviser, particularly noting those employees who provide investment and risk management services to the Funds. The Trustees also considered other services provided to the Funds by Janus Capital or the subadvisers, such as managing the execution of portfolio transactions and the selection of broker-dealers for those transactions. The Trustees considered Janus Capital’s role as administrator to the Funds, noting that Janus Capital does not receive a fee for its services but is reimbursed for its out-of-pocket costs. The Trustees considered the role of Janus Capital in monitoring adherence to the Funds’ investment restrictions, providing support services for the Trustees and Trustee committees, communicating with shareholders and overseeing the activities of other service providers, including monitoring compliance with various policies and procedures of the Funds and with applicable securities laws and regulations.
36 | JUNE 30, 2013
In this regard, the independent fee consultant noted that Janus Capital provides a number of different services for the Funds of Janus Investment Fund and the Portfolios of Janus Aspen Series (such Funds and Portfolios, together the “Janus Funds”) and Janus Fund shareholders, ranging from investment management services to various other servicing functions, and that, in its opinion, Janus Capital is a capable provider of those services. The independent fee consultant also provided its belief that Janus Capital has developed institutional competitive advantages that should be able to provide superior investment management returns over the long term.
The Trustees concluded that the nature, extent and quality of the services provided by Janus Capital or the subadviser to each Fund were appropriate and consistent with the terms of the respective advisory and subadvisory agreements, and that, taking into account steps taken to address those Funds whose performance lagged that of their peers for certain periods, the quality of those services had been consistent with or superior to quality norms in the industry and the Funds were likely to benefit from the continued provision of those services. They also concluded that Janus Capital and each subadviser had sufficient personnel, with the appropriate education and experience, to serve the Funds effectively and had demonstrated its continuing ability to attract well-qualified personnel.
Performance of the Funds
The Trustees considered the performance results of each Fund over various time periods. They reviewed information comparing each Fund’s performance with the performance of comparable funds and peer groups identified by independent data providers, and with the Fund’s benchmark index. In this regard, the independent fee consultant found that the Janus Funds have had some recent performance challenges, but performance has improved recently, and for the 36 months ended September 30, 2012, approximately 47% of the Janus Funds were in the top two quartiles of performance and for the 12 months ended September 30, 2012, approximately 54% of the Janus Funds were in the top two quartiles of performance. The Trustees concluded that the performance of certain Funds was good under current market conditions. Although the performance of other Funds lagged that of their peers for certain periods, the Trustees also concluded that Janus Capital had taken or was taking appropriate steps to address those instances of under-performance.
Costs of Services Provided
The Trustees examined information regarding the fees and expenses of each Fund in comparison to similar information for other comparable funds as provided by independent data providers. They also reviewed an analysis of that information provided by their independent fee consultant and noted that the rate of management (investment advisory and any administration) fees for most of the Funds, after applicable contractual expense limitations, was below the mean management fee rate of the respective peer group of funds selected by the independent data providers.
In this regard, the independent fee consultant provided its belief that the management fees charged by Janus Capital to each of the Janus Funds under the current investment advisory and administration agreements are reasonable in relation to the services provided by Janus Capital. The independent fee consultant found (1) the total expenses and management fees of the Janus Funds to be reasonable relative to other mutual funds; (2) total expenses, on average, were 16% below the mean total expenses of their respective Lipper Expense Group peers and 23% below the mean total expenses for their Lipper Expense Universes; (3) management fees for the Janus Funds, on average, were 9% below the mean management fees for their Expense Groups and 12% below the mean for their Expense Universes; and (4) Janus Funds expenses at the functional level for each asset and share class category were reasonable. The independent fee consultant concluded that based on its strategic review of expenses at the complex, category and individual fund level, Janus Funds expenses were found to be reasonable relative to both Expense Group and Expense Universe benchmarks. Further, for certain Funds the independent fee consultant also performed a systematic “focus list” analysis of expenses in the context of the performance or service delivered to each set of investors in each share class in each selected Fund. Based on this analysis, the independent fee consultant found that the combination of service quality/ performance and expenses on these individual Funds and share classes were reasonable in light of performance trends, performance histories and existence of performance fees on such Funds.
The Trustees considered the methodology used by Janus Capital and each subadviser in determining compensation payable to portfolio managers, the competitive environment for investment management talent and the competitive market for mutual funds in different distribution channels. They concluded that the compensation methodology provided a good alignment of the interests of the portfolio managers with the interests of Fund shareholders.
The Trustees also reviewed management fees charged by Janus Capital and each subadviser to their separate account clients and to non-affiliated funds subadvised by Janus Capital or by a subadviser (for which Janus Capital
Janus Fixed Income Fund | 37
Additional Information (unaudited) (continued)
or the subadviser provides only portfolio management services). Although in most instances subadvisory and separate account fee rates for various investment strategies were lower than management fee rates for Funds having a similar strategy, the Trustees noted that, under the terms of the management agreements with the Funds, Janus Capital performs significant additional services for the Funds that it does not provide to those other clients, including administration services, oversight of the Funds’ other service providers, trustee support, regulatory compliance and numerous other services, and that, in serving the Funds, Janus Capital assumes many legal risks that it does not assume in servicing its other clients. Moreover, they noted the research conducted and conclusions reached by their independent fee consultant.
In this regard, the independent fee consultant found that (1) the management fees Janus Capital charges to the Janus Funds are reasonable in relation to the management fees Janus Capital charges to its institutional and subadvised accounts; (2) these institutional and subadvised accounts have different service and infrastructure needs; and (3) the average spread between management fees charged to the Janus Funds and those charged to Janus Capital’s institutional and subadvised accounts is reasonable relative to the average spreads seen in the industry.
The Trustees reviewed information on the profitability to Janus Capital and its affiliates of their relationships with each Fund, as well as an explanation of the methodology utilized in allocating various expenses of Janus Capital and its affiliates among the Funds and other clients. The Trustees also reviewed the financial statements and corporate structure of Janus Capital’s parent company. In their review, the Trustees considered whether Janus Capital and each subadviser receive adequate incentives to manage the Funds effectively. The Trustees recognized that profitability comparisons among fund managers are difficult because very little comparative information is publicly available and the profitability of any fund manager is affected by numerous factors, including the organizational structure of the particular fund manager, the types of funds and other accounts it manages, possible other lines of business, the methodology for allocating expenses and the fund manager’s capital structure and cost of capital. However, taking into account those factors and the analysis provided by the Trustees’ independent fee consultant, and based on the information available, the Trustees concluded that Janus Capital’s profitability with respect to each Fund in relation to the services rendered was not unreasonable.
In this regard, the independent fee consultant found that, while assessing the reasonability of expenses in light of Janus Capital’s profits is dependent on comparisons with other publicly-traded mutual fund advisers, and that these comparisons are limited in accuracy by differences in complex size, business mix, institutional account orientation, and other factors, after accepting these limitations, the level of profit earned by Janus Capital from managing the Janus Funds is reasonable.
The Trustees concluded that the management fees and other compensation payable by each Fund to Janus Capital and its affiliates, as well as the fees paid by Janus Capital to the subadvisers of the subadvised Funds, were reasonable in relation to the nature, extent and quality of the services provided, taking into account the fees charged by other advisers for managing comparable mutual funds with similar strategies, the fees Janus Capital and the subadvisers charge to other clients, and, as applicable, the impact of fund performance on fees payable by the Funds. The Trustees also concluded that the overall expense ratio of each Fund was reasonable, taking into account the size of the Fund, the quality of services provided by Janus Capital and any subadviser, the investment performance of the Fund and any expense limitations agreed to by Janus Capital.
Economies of Scale
The Trustees considered information about the potential for Janus Capital to realize economies of scale as the assets of the Funds increase. They noted that, although many Funds pay advisory fees at a base fixed rate as a percentage of net assets, without any breakpoints, the actual management fee rate paid by most of the Funds, after any contractual expense limitations, was below the mean management fee rate of the Fund’s peer group identified by independent data providers; and, for those Funds whose expenses are being reduced by the contractual expense limitations of Janus Capital, Janus Capital is subsidizing the Funds because they have not reached adequate scale. Moreover, as the assets of many of the Funds have declined in the past few years, certain Funds have benefited from having advisory fee rates that have remained constant rather than increasing as assets declined. In addition, performance fee structures have been implemented for various Funds that have caused or will cause the effective rate of advisory fees payable by such a Fund to vary depending on the investment performance of the Fund relative to its benchmark index over the measurement period; and the five Funds that have fee schedules with breakpoints and reduced fee rates above certain asset levels. The Trustees also noted that the Funds share directly in economies of scale through the lower charges of third-party service providers that are based in part on the combined scale of all of the Funds. Based on all of the information they reviewed, including research and analysis conducted by the Trustees’ independent fee consultant, the Trustees
38 | JUNE 30, 2013
concluded that the current fee structure of each Fund was reasonable and that the current rates of fees do reflect a sharing between Janus Capital and the Fund of economies of scale at the current asset level of the Fund.
In this regard, the independent fee consultant concluded that, based on analysis it completed, and given the limitations in these analytical approaches and their conflicting results, it could not confirm or deny the existence of economies of scale in the Janus complex. Further, the independent fee consultant provided its belief that Janus Fund investors are well-served by the fee levels and performance fee structures in place on the Janus Funds in light of any economies of scale that may be present at Janus Capital.
Other Benefits to Janus Capital
The Trustees also considered benefits that accrue to Janus Capital and its affiliates from their relationships with the Funds. They recognized that two affiliates of Janus Capital separately serve the Funds as transfer agent and distributor, respectively, and the transfer agent receives compensation directly from the non-money market funds for services provided. The Trustees also considered Janus Capital’s past and proposed use of commissions paid by the Funds on their portfolio brokerage transactions to obtain proprietary and third-party research products and services benefiting the Fund and/or other clients of Janus Capital. The Trustees concluded that Janus Capital’s use of these types of client commission arrangements to obtain proprietary and third-party research products and services was consistent with regulatory requirements and guidelines and was likely to benefit each Fund. The Trustees also concluded that, other than the services provided by Janus Capital and its affiliates pursuant to the agreements and the fees to be paid by each Fund therefor, the Funds and Janus Capital may potentially benefit from their relationship with each other in other ways. They concluded that Janus Capital benefits from the receipt of research products and services acquired through commissions paid on portfolio transactions of the Funds and that the Funds benefit from Janus Capital’s receipt of those products and services as well as research products and services acquired through commissions paid by other clients of Janus Capital. They further concluded that success of any Fund could attract other business to Janus Capital or other Janus Funds, and that the success of Janus Capital could enhance Janus Capital’s ability to serve the Funds.
After full consideration of the above factors, as well as other factors, the Trustees, each of whom is an independent Trustee, concluded at their December 7, 2012 meeting that the proposed continuation of the investment advisory agreement and, if applicable, the subadvisory agreement for each Fund for another year was in the best interest of the respective Funds and their shareholders.
Janus Fixed Income Fund | 39
Useful Information About Your Fund Report (unaudited)
The Management Commentary in this report includes valuable insight from the Fund’s managers as well as statistical information to help you understand how your Fund’s performance and characteristics stack up against those of comparable indices.
If the Fund invests in foreign securities, this report may include information about country exposure. Country exposure is based primarily on the country of risk. The Fund’s managers may allocate a company to a country based on other factors such as location of the company’s principal office, the location of the principal trading market for the company’s securities, or the country where a majority of the company’s revenues are derived.
Please keep in mind that the opinions expressed by the Chief Investment Officer(s) in the Market Perspective and by the Fund’s managers in the Management Commentary are just that: opinions. They are a reflection of the Chief Investment Officer(s) and each manager’s best judgment at the time this report was compiled, which was June 30, 2013. As the investing environment changes, so could their opinions. These views are unique to them and aren’t necessarily shared by fellow employees or by Janus in general.
Performance overview graphs compare the performance of a hypothetical $10,000 investment in the Fund with one or more widely used market indices. The hypothetical example does not represent the returns of any particular investment.
When comparing the performance of the Fund with an index, keep in mind that market indices do not include brokerage commissions that would be incurred if you purchased the individual securities in the index. They also do not include taxes payable on dividends and interest or operating expenses incurred if you maintained the Fund invested in the index.
Average annual total returns are quoted for a Fund with more than one year of performance history. Average annual total return is calculated by taking the growth or decline in value of an investment over a period of time, including reinvestment of dividends and distributions, then calculating the annual compounded percentage rate that would have produced the same result had the rate of growth been constant throughout the period. Average annual total return does not reflect the deduction of taxes that a shareholder would pay on Fund distributions or redemptions of Fund shares.
Cumulative total returns are quoted for a Fund with less than one year of performance history. Cumulative total return is the growth or decline in value of an investment over time, independent of the period of time involved. Cumulative total return does not reflect the deduction of taxes that a shareholder would pay on Fund distributions or redemptions of Fund shares.
Pursuant to federal securities rules, expense ratios shown in the performance chart reflect subsidized (if applicable) and unsubsidized ratios. The total annual fund operating expenses ratio is gross of any fee waivers, reflecting the Fund’s unsubsidized expense ratio. The net annual fund operating expenses ratio (if applicable) includes contractual waivers of Janus Capital and reflects the Fund’s subsidized expense ratio. Ratios may be higher or lower than those shown in the “Financial Highlights” in this report.
| |
| 3. | Schedule of Investments |
Following the performance overview section is the Fund’s Schedule of Investments. This schedule reports the types of securities held in the Fund on the last day of the reporting period. Securities are usually listed by type (common stock, corporate bonds, U.S. Government obligations, etc.) and by industry classification (banking, communications, insurance, etc.). Holdings are subject to change without notice.
The value of each security is quoted as of the last day of the reporting period. The value of securities denominated in foreign currencies is converted into U.S. dollars.
If the Fund invests in foreign securities, it will also provide a summary of investments by country. This summary reports the Fund’s exposure to different countries by providing the percentage of securities invested in each country. The country of each security represents the country of risk. The Fund’s Schedule of Investments relies upon the industry group and country classifications published by Bloomberg L.P. and/or MSCI Inc.
Tables listing details of individual forward currency contracts, futures, written options and swaps follow the Fund’s Schedule of Investments (if applicable).
| |
| 4. | Statement of Assets and Liabilities |
This statement is often referred to as the “balance sheet.” It lists the assets and liabilities of the Fund on the last day of the reporting period.
The Fund’s assets are calculated by adding the value of the securities owned, the receivable for securities sold but not yet settled, the receivable for dividends declared but not yet received on securities owned and the receivable for Fund shares sold to investors but not yet settled. The Fund’s liabilities include payables for securities purchased
40 | JUNE 30, 2013
but not yet settled, Fund shares redeemed but not yet paid and expenses owed but not yet paid. Additionally, there may be other assets and liabilities such as unrealized gain or loss on forward currency contracts.
The section entitled “Net Assets Consist of” breaks down the components of the Fund’s net assets. Because the Fund must distribute substantially all earnings, you will notice that a significant portion of net assets is shareholder capital.
The last section of this statement reports the net asset value (“NAV”) per share on the last day of the reporting period. The NAV is calculated by dividing the Fund’s net assets for each share class (assets minus liabilities) by the number of shares outstanding.
| |
| 5. | Statement of Operations |
This statement details the Fund’s income, expenses, realized gains and losses on securities and currency transactions, and changes in unrealized appreciation or depreciation of Fund holdings.
The first section in this statement, entitled “Investment Income,” reports the dividends earned from securities and interest earned from interest-bearing securities in the Fund.
The next section reports the expenses incurred by the Fund, including the advisory fee paid to the investment adviser, transfer agent fees and expenses, and printing and postage for mailing statements, financial reports and prospectuses. Expense offsets and expense reimbursements, if any, are also shown.
The last section lists the amounts of realized gains or losses from investment and foreign currency transactions, and changes in unrealized appreciation or depreciation of investments and foreign currency-denominated assets and liabilities. The Fund will realize a gain (or loss) when it sells its position in a particular security. A change in unrealized gain (or loss) refers to the change in net appreciation or depreciation of the Fund during the reporting period. “Net Realized and Unrealized Gain/(Loss) on Investments” is affected both by changes in the market value of Fund holdings and by gains (or losses) realized during the reporting period.
| |
| 6. | Statements of Changes in Net Assets |
These statements report the increase or decrease in the Fund’s net assets during the reporting period. Changes in the Fund’s net assets are attributable to investment operations, dividends and distributions to investors and capital share transactions. This is important to investors because it shows exactly what caused the Fund’s net asset size to change during the period.
The first section summarizes the information from the Statement of Operations regarding changes in net assets due to the Fund’s investment operations. The Fund’s net assets may also change as a result of dividend and capital gains distributions to investors. If investors receive their dividends and/or distributions in cash, money is taken out of the Fund to pay the dividend and/or distribution. If investors reinvest their dividends and/or distributions, the Fund’s net assets will not be affected. If you compare the Fund’s “Net Decrease from Dividends and Distributions” to “Reinvested Dividends and Distributions,” you will notice that dividends and distributions have little effect on the Fund’s net assets. This is because the majority of the Fund’s investors reinvest their dividends and/or distributions.
The reinvestment of dividends and distributions is included under “Capital Share Transactions.” “Capital Shares” refers to the money investors contribute to the Fund through purchases or withdrawals via redemptions. The Fund’s net assets will increase and decrease in value as investors purchase and redeem shares from the Fund.
This schedule provides a per-share breakdown of the components that affect the Fund’s NAV for current and past reporting periods as well as total return, asset size, ratios and portfolio turnover rate.
The first line in the table reflects the NAV per share at the beginning of the reporting period. The next line reports the net investment income/(loss) per share. Following is the per share total of net gains/(losses), realized and unrealized. Per share dividends and distributions to investors are then subtracted to arrive at the NAV per share at the end of the period. The next line reflects the total return for the period. The total return may include adjustments in accordance with generally accepted accounting principles required at the period end for financial reporting purposes. As a result, the total return may differ from the total return reflected for individual shareholder transactions. Also included are ratios of expenses and net investment income to average net assets.
The Fund’s expenses may be reduced through expense offsets and expense reimbursements. The ratios shown reflect expenses before and after any such offsets and reimbursements.
The ratio of net investment income/(loss) summarizes the income earned less expenses, divided by the average net assets of the Fund during the reporting period. Don’t
Janus Fixed Income Fund | 41
Useful Information About Your Fund Report (unaudited) (continued)
confuse this ratio with the Fund’s yield. The net investment income ratio is not a true measure of the Fund’s yield because it doesn’t take into account the dividends distributed to the Fund’s investors.
The next figure is the portfolio turnover rate, which measures the buying and selling activity in the Fund. Portfolio turnover is affected by market conditions, changes in the asset size of the Fund, fluctuating volume of shareholder purchase and redemption orders, the nature of the Fund’s investments, and the investment style and/or outlook of the portfolio manager. A 100% rate implies that an amount equal to the value of the entire portfolio was replaced once during the fiscal year; a 50% rate means that an amount equal to the value of half the portfolio is traded in a year; and a 200% rate means that an amount equal to the value of the entire portfolio is traded every six months.
42 | JUNE 30, 2013
Designation Requirements (unaudited)
For federal income tax purposes, the Fund designated the following for the year ended June 30, 2013:
Return of Capital Distributions
| | | | | | | |
| Fund | | | | |
| |
| |
| Janus Real Return Fund | | $ | 82,764 | | | |
| |
| |
Dividends Received Deduction Percentage
| | | | | | | |
| Fund | | | | |
| |
| |
| Janus Real Return Fund | | | 2% | | | |
| |
| |
Qualified Dividend Income
| | | | | | | |
| Fund | | | | |
| |
| |
| Janus Real Return Fund | | | 67% | | | |
| |
| |
Janus Fixed Income Fund | 43
Trustees and Officers (unaudited)
The Fund’s Statement of Additional Information includes additional information about the Trustees and officers and is available, without charge, by calling 1-877-335-2687.
The following are the Trustees and officers of the Trust, together with a brief description of their principal occupations during the last five years (principal occupations for certain Trustees may include periods over five years).
Each Trustee has served in that capacity since he or she was originally elected or appointed. The Trustees do not serve a specified term of office. Each Trustee will hold office until the termination of the Trust or his or her earlier death, resignation, retirement, incapacity, or removal. Pursuant to the Fund’s Governance Procedures and Guidelines, Trustees are required to retire no later than the end of the calendar year in which the Trustee turns 72. The Trustees review the Fund’s Governance Procedures and Guidelines from time to time and may make changes they deem appropriate. The Trust’s Nominating and Governance Committee will consider nominees for the position of Trustee recommended by shareholders. Shareholders may submit the name of a candidate for consideration by the Committee by submitting their recommendations to the Trust’s Secretary. Each Trustee is currently a Trustee of one other registered investment company advised by Janus Capital: Janus Aspen Series. Collectively, these two registered investment companies consist of 56 series or funds.
The Trust’s officers are elected annually by the Trustees for a one-year term. Certain officers also serve as officers of Janus Aspen Series. Certain officers of the Fund may also be officers and/or directors of Janus Capital. Fund officers receive no compensation from the Fund, except for the Fund’s Chief Compliance Officer, as authorized by the Trustees.
TRUSTEES
| | | | | | | | | | | |
| |
| | | | | | | | | Number of
| | |
| | | | | | | | | Portfolios/Funds
| | Other Directorships
|
| | | | | | | | | in Fund Complex
| | Held by Trustee
|
| | | Positions Held
| | Length of
| | Principal Occupations
| | Overseen
| | During the Past Five
|
| Name, Address, and Age | | with the Trust | | Time Served | | During the Past Five Years | | by Trustee | | Years |
| |
| |
Independent Trustees | | | | | | | | | | |
| | | | | | | | | | | |
William F. McCalpin
151 Detroit Street
Denver, CO 80206
DOB: 1957 | | Chairman
Trustee | | 1/08-Present
6/02-Present | | Managing Director, Holos Consulting LLC (provides consulting services to foundations and other nonprofit organizations). Formerly, Executive Vice President and Chief Operating Officer of The Rockefeller Brothers Fund (a private family foundation) (1998-2006). | | 56 | | Chairman of the Board and Director of The Investment Fund for Foundations Investment Program (TIP) (consisting of 2 funds); and Director of the F.B. Heron Foundation (a private grantmaking foundation). |
| | | | | | | | | | | |
Alan A. Brown
151 Detroit Street
Denver, CO 80206
DOB: 1962 | | Trustee | | 1/13-Present | | Managing Director, Institutional Markets, of Dividend Capital Group (private equity real estate investment management firm) (since 2012). Formerly, Executive Vice President and Co-Head, Global Private Client Group (2007-2010), Executive Vice President, Mutual Funds (2005-2007), and Chief Marketing Officer (2001-2005) of Nuveen Investments, Inc. (asset management). | | 56 | | Director of MotiveQuest LLC (strategic social market research company) (since 2003); and Director of WTTW (PBS affiliate) (since 2003). Formerly, Director of Nuveen Global Investors LLC (2007-2011); Director of Communities in Schools (2004-2010); and Director of Mutual Fund Education Alliance (until 2010). |
| |
| |
44 | JUNE 30, 2013
TRUSTEES (continued)
| | | | | | | | | | | |
| | | | | | | | | Number of
| | |
| | | | | | | | | Portfolios/Funds
| | Other Directorships
|
| | | | | | | | | in Fund Complex
| | Held by Trustee
|
| | | Positions Held
| | Length of
| | Principal Occupations
| | Overseen
| | During the Past Five
|
| Name, Address, and Age | | with the Trust | | Time Served | | During the Past Five Years | | by Trustee | �� | Years |
| |
| |
| | | | | | | | | | | |
William D. Cvengros
151 Detroit Street
Denver, CO 80206
DOB: 1948 | | Trustee | | 1/11-Present | | Managing Member and Chief Executive Officer of SJC Capital, LLC (a personal investment company and consulting firm) (since 2002). Formerly, Venture Partner for The Edgewater Funds (a middle market private equity firm) (2002-2004); Chief Executive Officer and President of PIMCO Advisors Holdings L.P. (a publicly traded investment management firm) (1994-2000); and Chief Investment Officer of Pacific Life Insurance Company (a mutual life insurance and annuity company (1987-1994). | | 56 | | Chairman, National Retirement Partners, Inc. (formerly a network of advisors to 401(k) plans) (since 2005). Formerly, Director of Prospect Acquisition Corp. (a special purpose acquisition corporation) (2007-2009); Director of RemedyTemp, Inc. (temporary help services company) (1996-2006); and Trustee of PIMCO Funds Multi-Manager Series (1990-2000) and Pacific Life Variable Life & Annuity Trusts (1987-1994). |
| | | | | | | | | | | |
James T. Rothe
151 Detroit Street
Denver, CO 80206
DOB: 1943 | | Trustee | | 1/97-Present | | Co-founder and Managing Director of Roaring Fork Capital SBIC, L.P. (SBA SBIC fund focusing on private investment in public equity firms), and Professor Emeritus of Business of the University of Colorado, Colorado Springs, CO (since 2004). Formerly, Professor of Business of the University of Colorado (2002-2004), and Distinguished Visiting Professor of Business (2001-2002) of Thunderbird (American Graduate School of International Management), Glendale, AZ. | | 56 | | Director of Red Robin Gourmet Burgers, Inc. (RRGB) (since 2004). |
| | | | | | | | | | | |
William D. Stewart
151 Detroit Street
Denver, CO 80206
DOB: 1944 | | Trustee | | 6/84-Present | | Retired. Formerly, Corporate Vice President and General Manager of MKS Instruments - HPS Products, Boulder, CO (a manufacturer of vacuum fittings and valves) and PMFC Division, Andover, MA (manufacturing pressure measurement and flow products) (1976-2012). | | 56 | | None |
| | | | | | | | | | | |
Linda S. Wolf
151 Detroit Street
Denver, CO 80206
DOB: 1947 | | Trustee | | 11/05-Present | | Retired. Formerly, Chairman and Chief Executive Officer of Leo Burnett (Worldwide) (advertising agency) (2001-2005). | | 56 | | Director of Chicago Convention & Tourism Bureau, Chicago Council on Global Affairs, The Field Museum of Natural History (Chicago, IL), InnerWorkings (U.S. provider of print procurement solutions to corporate clients), Lurie Children’s Hospital (Chicago, IL), Rehabilitation Institute of Chicago, Wal-Mart, and Wrapports, LLC (digital communications company). |
| |
| |
Janus Fixed Income Fund | 45
Trustees and Officers (unaudited) (continued)
OFFICERS
| | | | | | | |
| |
| | | | | Term of Office* and
| | Principal Occupations
|
| Name, Address, and Age | | Positions Held with the Trust | | Length of Time Served | | During the Past Five Years |
| |
| |
| | | | | | | |
Gibson Smith
151 Detroit Street
Denver, CO 80206
DOB: 1968 | | Executive Vice President and Co-Portfolio Manager
Janus Real Return Fund | | 5/11-Present | | Co-Chief Investment Officer and Executive Vice President of Janus Capital; Executive Vice President of Janus Distributors LLC and Janus Services LLC; Director of Perkins Investment Management LLC; and Portfolio Manager for other Janus accounts. |
| | | | | | | |
Darrell Watters
151 Detroit Street
Denver, CO 80206
DOB: 1963 | | Executive Vice President and Co-Portfolio Manager
Janus Real Return Fund | | 10/12-Present | | Vice President of Janus Capital and Portfolio Manager for other Janus accounts. |
| | | | | | | |
Robin C. Beery
151 Detroit Street
Denver, CO 80206
DOB: 1967 | | President and Chief Executive Officer | | 4/08-Present | | Executive Vice President and Head of U.S. Distribution of Janus Capital Group Inc., Janus Capital, Janus Distributors LLC, and Janus Services LLC; Director of The Janus Foundation; Director of Perkins Investment Management LLC; and Working Director of INTECH Investment Management LLC. Formerly, Head of Intermediary Distribution, Global Marketing and Product of Janus Capital Group Inc., Janus Capital, Janus Distributors LLC, and Janus Services LLC (2009-2010); and Chief Marketing Officer of Janus Capital Group Inc. and Janus Capital (2002-2009). |
| | | | | | | |
Stephanie Grauerholz-Lofton
151 Detroit Street
Denver, CO 80206
DOB: 1970 | | Chief Legal Counsel and Secretary
Vice President | | 1/06-Present
3/06-Present | | Vice President and Assistant General Counsel of Janus Capital, and Vice President and Assistant Secretary of Janus Distributors LLC. |
| | | | | | | |
David R. Kowalski
151 Detroit Street
Denver, CO 80206
DOB: 1957 | | Vice President, Chief Compliance Officer, and Anti-Money Laundering Officer | | 6/02-Present | | Senior Vice President and Chief Compliance Officer of Janus Capital, Janus Distributors LLC, and Janus Services LLC; and Vice President of INTECH Investment Management LLC and Perkins Investment Management LLC. Formerly, Chief Compliance Officer of Bay Isle Financial LLC (2003-2008). |
| | | | | | | |
Jesper Nergaard
151 Detroit Street
Denver, CO 80206
DOB: 1962 | | Chief Financial Officer
Vice President, Treasurer, and Principal Accounting Officer | | 3/05-Present
2/05-Present | | Vice President of Janus Capital and Janus Services LLC. |
| |
| |
* Officers are elected at least annually by the Trustees for a one-year term and may also be elected from time to time by the Trustees for an interim period.
46 | JUNE 30, 2013
Notes
Janus Fixed Income Fund | 47
Notes
Janus Fixed Income Fund | 49
Janus provides access to a wide range of investment disciplines.
Alternative
Janus alternative funds seek to deliver strong risk-adjusted returns over a full market cycle with lower correlation to equity markets than traditional investments.
Asset Allocation
Janus’ asset allocation funds utilize our fundamental, bottom-up research to balance risk over the long term. From fund options that meet investors’ risk tolerance and objectives to a method that incorporates non-traditional investment choices to seek non-correlated sources of risk and return, Janus’ asset allocation funds aim to allocate risk more effectively.
Fixed Income
Janus fixed income funds attempt to provide less risk relative to equities while seeking to deliver a competitive total return through high current income and appreciation. Janus money market funds seek capital preservation and liquidity with current income as a secondary objective.
Global & International
Janus global and international funds seek to leverage Janus’ research capabilities by taking advantage of inefficiencies in foreign markets, where accurate information and analytical insight are often at a premium.
Growth & Core
Janus growth funds focus on companies believed to be the leaders in their respective industries, with solid management teams, expanding market share, margins and efficiencies. Janus core funds seek investments in more stable and predictable companies. Our core funds look for a strategic combination of steady growth and, for certain funds, some degree of income.
Mathematical
Our mathematical funds seek to outperform their respective indices while maintaining a risk profile equal to or lower than the index itself. Managed by INTECH (a Janus subsidiary), these funds use a mathematical process in an attempt to build a more “efficient” portfolio than the index.
Value
Our value funds, managed by Perkins (a Janus subsidiary), seek to identify companies with favorable reward to risk characteristics by conducting rigorous downside analysis before determining upside potential.
For more information about our funds, contact your investment professional or go to janus.com/advisor/mutual-funds (or janus.com/allfunds if you hold Shares directly with Janus).
Please consider the charges, risks, expenses and investment objectives carefully before investing. For a prospectus or, if available, a summary prospectus containing this and other information, please call Janus at 877.33JANUS (52687) (or 800.525.3713 if you hold Shares directly with Janus); or download the file from janus.com/info (or janus.com/reports if you hold Shares directly with Janus). Read it carefully before you invest or send money.
Funds distributed by Janus Distributors LLC (07/13)
| | | | | | | | | | |
| Investment products offered are: | | | NOT FDIC-INSURED | | | MAY LOSE VALUE | | | NO BANK GUARANTEE |
| | | | | | | | | | |
| |
| C-0813-42790 | 125-02-93009 08-13 |
ANNUAL REPORT
June 30, 2013
Janus Fixed Income & Money Market Funds
Fixed Income
Janus Flexible Bond Fund
Janus Global Bond Fund
Janus High-Yield Fund
Janus Short-Term Bond Fund
Money Market
Janus Government Money Market Fund
Janus Money Market Fund
HIGHLIGHTS
| |
| • | Portfolio management perspective |
| • | Investment strategy behind your fund |
| • | Fund performance, characteristics and holdings |
Table of Contents
Janus Fixed Income & Money Market Funds
| | | |
| | 1 |
| | |
| | 3 |
| | 17 |
| | 30 |
| | 43 |
| | 54 |
| | 54 |
| | 60 |
| | 64 |
| | 68 |
| | 70 |
| | 74 |
| | 88 |
| | 89 |
| | 90 |
| | 91 |
| | 93 |
| | 111 |
| | 112 |
| | 116 |
| | 119 |
| | 120 |
Please consider the charges, risks, expenses and investment objectives carefully before investing. For a prospectus or, if available, a summary prospectus containing this and other information, please call Janus at 877.33JANUS (52687) (or 800.525.3713 if you hold Shares directly with Janus); or download the file from janus.com/info (or janus.com/reports if you hold Shares directly with Janus). Read it carefully before you invest or send money.
Investments in money market funds are not insured or guaranteed by the Federal Deposit Insurance Corporation or any other government agency. Although money market funds seek to preserve the value of your investment at $1.00 per share, it is possible to lose money by investing in money market funds.
Co-Chief Investment Officers’ Market Perspective (unaudited)
Jonathan Coleman, CFA
Chief Investment Officer, Equities
Gibson Smith
Chief Investment Officer, Fixed Income
Economy: Substantive improvement
The U.S. economy is showing signs of real, if uneven, improvement. The market seems obsessed with whether the Federal Reserve (Fed) will taper its bond-buying program by the end of the year, but is not focused on the continued improvement of the overall economy. We would not be surprised to see the Fed begin to taper its quantitative easing (QE) program over the next 12 months, but believe that it will leave short-term interest rates near zero for the foreseeable future. We also believe that global central banks will keep a high level of liquidity in the system. We continue to monitor potential global risk, particularly in China and Japan, but believe both of these concerns will abate in the medium term and that markets will refocus on the recovery.
Equities: Beyond the “wall of worry”
Equity markets have essentially climbed a “wall of worry” over the last six months, including the threat of falling off the fiscal cliff, then the potential impact of the sequester, and finally, concerns over Cyprus. Talking heads claimed these events spelled doomsday for the economy, but the market shrugged off each one and powered on. Now more speculative areas of the market, such as the Russell 2000 Index of U.S. small-capitalization companies, have hit all-time highs. Price/earnings multiples have expanded as stock price appreciation has exceeded the underlying earnings growth of many companies.
We think this is just when investors should be a little more cautious. The recent rally has been driven in part by a belief that the Fed and other central banks will backstop equity markets by pumping liquidity into the system forever. In late June, we got a glimpse of what happens to stock markets when the Fed even hints at taking its foot off the gas: there can be a sell-off.
Our view on the economy and equity markets has not turned negative, just more balanced. Many positives for the economy still exist. For instance, cheaper oil and natural gas in the U.S., along with more competitive labor costs, are creating a manufacturing renaissance. That’s a long-term benefit that could last a decade or longer. The U.S. housing market continues to be strong. In Europe, industrial companies are finally going through a painful restructuring that should right-size their businesses and make them more competitive on a global basis. European banks have also made significant strides in cutting costs and fortifying their balance sheets. But many of these longer-term dynamics already have been priced into stocks, or in other cases, they will take a long time to play out. The challenge as equity investors is to find those companies that can decouple from the economy, control their own destinies, and demonstrate strong growth even in the face of a slow-growth economy.
Fixed Income: Rate risk increases
As the economy gains stronger footing, the Fed will be given the opportunity to slowly remove its overly accommodative policy. While some investors may believe that we’ve seen the end of the bull market in fixed income, we are reminded that since 1980 we have seen 16 periods during which the 10-year Treasury yield rose by more than 100 basis points (1 percentage point). The 30-year bull market has hardly been a straight line up, with nothing but positive returns for fixed income investors – there have been periods of both angst and celebration, with the long-term trend being lower rates.
Making bold calls that the bull market in bonds is over can grab media attention and create fear for fixed-income investors, but the reality is that markets are always in motion and creating opportunities. This environment reminds us of the importance of active versus passive management in fixed income and the importance of capital preservation in uncertain times. While we may be entering a period where interest rates trend higher over the longer term, in the short and medium term there will be new opportunities created by change.
Because we tend to generate the majority of our excess return through security selection, we see this as a time of opportunity. Credit risk (i.e., the risk that borrowers will default) has been relatively low for years due to the excess levels of cash held on corporate balance sheets, and we believe that will continue. A back-up in rates may have the positive effect of lowering fixed income
Janus Fixed Income & Money Market Funds | 1
(unaudited) (continued)
valuations and opening up fresh opportunities for investing at more attractive levels in credits that we believe offer good risk-adjusted return potential.
Sincerely,
Jonathan Coleman, CFA
Chief Investment Officer, Equities
Gibson Smith
Chief Investment Officer, Fixed Income
2 | JUNE 30, 2013
Janus Flexible Bond Fund (unaudited)
| | | | | | | |
Fund Snapshot
We believe a bottom-up, fundamentally driven investment process that focuses on credit-oriented investments can generate risk-adjusted outperformance relative to our peers over time. Our comprehensive bottom-up view drives decision-making at a macro level, enabling us to make informed decisions about allocations to all sectors of the fixed income universe.
| | | | 
Gibson Smith
co-portfolio manager | | 
Darrell Watters
co-portfolio manager |
Performance Summary
During the one-year period ended June 30, 2013, Janus Flexible Bond Fund’s Class T Shares returned 1.42% compared with -0.69% for the Fund’s benchmark, the Barclays U.S. Aggregate Bond Index.
Market Environment
The 12 months ended June 30, 2013 were largely characterized by concern about global fiscal policies and their impact on economic growth. Overall, both investment-grade and high-yield corporate credit spreads and mortgage-backed securities (MBS) spreads narrowed during the period. Meanwhile, U.S. Treasury bond yields rose, particularly in the final months of the period as U.S. economic data began to improve.
The period began with concern about slow global economic growth, prompting additional stimulus from major central banks including the U.S. Federal Reserve (Fed), the European Central Bank and the Bank of Japan. Toward the end of calendar year 2012, worries grew about the “fiscal cliff,” a potentially recessionary mix of U.S. spending cuts and tax increases scheduled to take effect in January 2013. However, lawmakers delayed some elements of the fiscal cliff until March 2013, softening the impact, and the Fed continued to reiterate support for the markets via quantitative easing (QE) and near-zero interest rates.
By spring, there were signs that economic growth was improving. The U.S. economy seemed to weather the impact of government spending cuts that took effect in March, and employment data showed strengthening hiring patterns beginning in April. By May, markets were beginning to speculate about the eventual end of the Fed’s QE program, driving up longer-term Treasury yields. Meanwhile, Japan’s attempts to reflate its economy appeared to be having an effect, with signs of improving exports, rising manufacturing activity and increasing capital spending. Europe’s economy showed signs of stabilization, although growth expectations declined for China.
Performance Discussion
Our overweight allocation and security selection within corporate credit, as well as our security selection within MBS, were the top contributors to outperformance during the period. Our yield curve positioning in Treasury securities detracted. Sector contributors were led by noncaptive diversified financial companies, real estate investment trusts (REITs) and banking; top sector detractors included property and casualty insurers, cyclical consumer services and supermarkets.
Overall, we reduced the Fund’s weighting to corporate credit during the period, as we reacted to changing economic and market factors. Corporate credit represented 47.4% of holdings as of June 30, 2013, down from 56.5% a year earlier, as we opportunistically realized gains and lowered the Fund’s risk profile at various points during the 12 months, including reducing duration and increasing our Treasury weighting. However, we remain bullish on corporate credit in general, and are still significantly overweight to credit compared with the benchmark. We increased exposure to high-yield credit.
Consistent with our process of closely monitoring company fundamentals to drive our allocation decisions, we periodically seek to reduce the Fund’s risk profile. With that goal, we increased U.S. Treasury exposure at various points during the period. At the end of June 2013, our allocation to U.S. Treasury securities was 22.5%, compared with 19.3% a year earlier. We also shifted investment toward the shorter end of the yield curve with the goal to help preserve capital in the face of a potential rise in interest rates. However, our yield curve positioning in Treasurys detracted from relative performance during the period. While we held an underweight allocation to Treasury securities compared with the benchmark, our Treasury duration (i.e., our sensitivity to rising interest rates) was modestly longer until roughly mid-May.
Janus Fixed Income & Money Market Funds | 3
Janus Flexible Bond Fund (unaudited)
Our MBS selection also was beneficial to performance, in particular our preference for prepayment-protected, higher-coupon MBS. We have sought to avoid the type of MBS that the Fed has been buying through its $40-billion-per-month MBS purchase program, part of its current QE program. This helped the Fund avoid much of the market volatility sparked by the question of when the Fed might taper QE. During the period we added to our position in higher-coupon MBS, which we view as an attractive risk-adjusted spread alternative to corporate credit. At the end of June 2013, our allocation to MBS was 23.7%, up from 17.1% a year earlier. However, we remain underweight to MBS versus the benchmark.
Given that interest rates rose, our small allocation to bank loans, which are designed to reset based on short-term interest rates, contributed to performance. Our security selection within commercial mortgage-backed securities (CMBS) also was a positive contributor, along with our preferred stock holdings.
Credit Contributors to Performance
Contributors were led by American International Group (AIG), an international insurer that offers property and casualty insurance, life insurance and retirement services. Over the past few years, AIG has simplified itself and transformed its balance sheet by selling noncore assets and deleveraging its capital structure. During the period AIG finished repaying all of the $182 billion owed to the U.S. government from the company’s bailout during the 2007-2008 financial crisis. We believe its core business units are on strong footing, and that AIG remains focused on reducing high-cost debt and improving its ratings.
General Electric Capital Corp., which provides financing, mortgage and insurance services, also contributed. GE Capital has undergone a significant balance sheet transformation since the 2007-2008 financial crisis, making significant strides in reducing leverage, increasing reserves, cutting reliance on short-term funding and improving capital. Its management team has been committed to reducing the size of the company, which should reduce debt outstanding and improve the quality of its balance sheet.
Another top contributor was Goodman Funding, a REIT with industrial properties in Australia, New Zealand, the UK, Asia and Europe. Goodman’s operating performance was stronger than expected during the 12-month period; its European portfolio, in particular, outperformed expectations. Goodman also raised equity during the period for growth, which was viewed as positive for its corporate credit. We have favored Goodman for its high-quality asset base and focus on keeping leverage low.
Credit Detractors from Performance
Diversified holding company Loews Corp. detracted, partly because we held longer-duration securities, which tend to perform relatively worse when interest rates rise, as they did during the year. Loews’ subsidiaries are involved in businesses including commercial property and casualty insurance, offshore drilling, and hotels and resorts.
ADT Corp. also detracted, again largely because we held longer-duration securities that were affected by rising rates in the latter part of the period. ADT, which provides home security monitoring services, spun off from Tyco International in 2012. We find the business model attractive, as the company has long-term contracts that provide stability of earnings and free cash flow. Consumers have been adopting its new home automation package, ADT Pulse, which we believe should help boost earnings and lead to gradual deleveraging of the company’s capital structure over time.
Citigroup also detracted, largely because we were underweight to the credit compared with the benchmark. Citigroup is a diversified financial services holding company. It has been proactive in selling non-core businesses, focusing on long-term debt reduction and growing its loan book in international markets, all of which are supportive of potentially higher levels of profitability and liquidity.
Outlook
Over the past few years, the Fed’s unconventional monetary policies have suppressed U.S. Treasury rates to unprecedented lows in an effort to stimulate economic growth. Recent U.S. economic data reflects modest acceleration that may give the Fed the support it needs to begin tapering quantitative easing. However, we still believe the Fed will leave short-term interest rates unchanged for an extended period.
While some investors may believe that rates will continue to move higher from here and that we’ve seen the end of the bull market in fixed income, it’s important to recognize that the impact of rising rates will not be uniform across all fixed income securities. In our view, the biggest effect is likely to be on securities with 10 or more years to maturity. We view that segment of the yield curve as containing the greatest potential for capital loss and the greatest volatility. We have reduced exposure to longer-duration securities in an effort to buffer the effect of rising rates. Some corporate credit names tend to be more
4 | JUNE 30, 2013
(unaudited)
sensitive to interest rate changes than others, and we have reduced our exposure to those, as well. We also continue to look for opportunities in products that have served in the past as alternatives to government bonds and corporate credit, including bank loans and agency MBS.
Security selection in fixed income has become extremely important, in our view, as valuations have become stretched due to investors’ search for yield and the growing risk of higher interest rates. In this environment, we believe that preservation of capital must take priority over aggressive return seeking. This is not to say that great opportunities have disappeared from the fixed income market – they have not, and we are still finding some – but the universe of securities to select from today is much narrower than it has been over the last four years. Fortunately, a back-up in rates may have the positive effect of lowering fixed income valuations and opening up fresh opportunities for investing at more attractive levels in credits that we believe offer the potential for good risk-adjusted returns.
Because we have tended to generate the majority of our excess return through security selection, we see this as a time of great opportunity. Credit risk (i.e., the risk that borrowers will default) has been relatively low for years due to the excess levels of cash held on corporate balance sheets, and we believe that will continue. We believe returns this year will be significantly influenced not just by what we own, but by what we have chosen not to own: There are many securities that offer what we view as asymmetric risk profiles, with greater downside risk exposure, and we intend to steer around them. In our view, the key to success for the remainder of the year will be driving performance through security selection while navigating interest-rate volatility.
On behalf of each member of our investment team, thank you for your investment in the Janus Flexible Bond Fund. We appreciate your entrusting us with your assets and look forward to continuing to serve your investment needs.
Janus Fixed Income & Money Market Funds | 5
Janus Flexible Bond Fund (unaudited)
Janus Flexible Bond Fund At A Glance
June 30, 2013
| | | |
Weighted Average Maturity | | 6.9 Years |
Average Effective Duration* | | 4.6 Years |
30-day Current Yield** | | |
| Class A Shares at NAV | | |
| Without Reimbursement | | 2.12% |
| With Reimbursement | | 2.12% |
| Class A Shares at MOP | | |
| Without Reimbursement | | 2.02% |
| With Reimbursement | | 2.02% |
| Class C Shares*** | | |
| Without Reimbursement | | 1.32% |
| With Reimbursement | | 1.32% |
| Class D Shares | | |
| Without Reimbursement | | 2.30% |
| With Reimbursement | | 2.30% |
| Class I Shares | | |
| Without Reimbursement | | 2.42% |
| With Reimbursement | | 2.39% |
| Class N Shares | | |
| Without Reimbursement | | 2.45% |
| With Reimbursement | | 2.45% |
| Class R Shares | | |
| Without Reimbursement | | 1.70% |
| With Reimbursement | | 1.70% |
| Class S Shares | | |
| Without Reimbursement | | 1.94% |
| With Reimbursement | | 1.94% |
| Class T Shares | | |
| Without Reimbursement | | 2.21% |
| With Reimbursement | | 2.21% |
Number of Bonds/Notes | | 375 |
| | | |
| * | | A theoretical measure of price volatility |
| ** | | Yield will fluctuate |
| *** | | Does not include the 1.00% contingent deferred sales charge. |
Ratings† Summary – (% of Fixed Income Securities)
June 30, 2013
| | | |
AAA | | 0.5% |
AA | | 47.6% |
A | | 8.2% |
BBB | | 25.8% |
BB | | 12.2% |
B | | 1.6% |
CCC | | 0.2% |
Other | | 3.9% |
| | | |
| † | | Bond ratings provided by Standard & Poor’s. Not rated securities are not rated by S&P but may be rated by other rating agencies. Bond ratings are measured on a scale that generally ranges from AAA (highest) to D (lowest). |
Significant Areas of Investment – (% of Net Assets)
As of June 30, 2013
Asset Allocation – (% of Net Assets)
As of June 30, 2013
6 | JUNE 30, 2013
(unaudited)
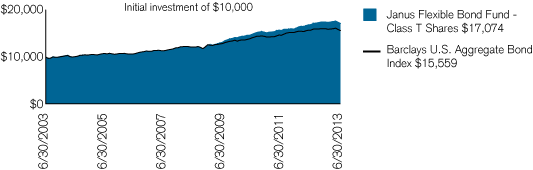
| | | | | | | | | | | | |
| Average Annual Total Return – for the periods ended June 30, 2013 | | | | | Expense Ratios – per the October 26, 2012 prospectuses |
| | | One
| | Five
| | Ten
| | Since
| | | Total Annual Fund
|
| | | Year | | Year | | Year | | Inception* | | | Operating Expenses |
| | | | | | | | | | | | |
| Janus Flexible Bond Fund – Class A Shares | | | | | | | | | | | |
| | | | | | | | | | | | |
| NAV | | 1.45% | | 7.26% | | 5.46% | | 7.32% | | | 0.77% |
| | | | | | | | | | | | |
| MOP | | –3.36% | | 6.23% | | 4.95% | | 7.12% | | | |
| | | | | | | | | | | | |
| Janus Flexible Bond Fund – Class C Shares | | | | | | | | | | | |
| | | | | | | | | | | | |
| NAV | | 0.65% | | 6.48% | | 4.74% | | 6.63% | | | 1.55% |
| | | | | | | | | | | | |
| CDSC | | –0.32% | | 6.48% | | 4.74% | | 6.63% | | | |
| | | | | | | | | | | | |
Janus Flexible Bond Fund –
Class D Shares(1) | | 1.61% | | 7.41% | | 5.54% | | 7.35% | | | 0.59% |
| | | | | | | | | | | | |
| Janus Flexible Bond Fund – Class I Shares | | 1.66% | | 7.32% | | 5.50% | | 7.33% | | | 0.55% |
| | | | | | | | | | | | |
| Janus Flexible Bond Fund – Class N Shares | | 1.77% | | 7.32% | | 5.50% | | 7.33% | | | 0.46% |
| | | | | | | | | | | | |
| Janus Flexible Bond Fund – Class R Shares | | 1.02% | | 6.82% | | 5.03% | | 6.92% | | | 1.20% |
| | | | | | | | | | | | |
| Janus Flexible Bond Fund – Class S Shares | | 1.26% | | 7.07% | | 5.27% | | 7.17% | | | 0.95% |
| | | | | | | | | | | | |
| Janus Flexible Bond Fund – Class T Shares | | 1.42% | | 7.32% | | 5.50% | | 7.33% | | | 0.70% |
| | | | | | | | | | | | |
| Barclays U.S. Aggregate Bond Index | | –0.69% | | 5.19% | | 4.52% | | 6.97%** | | | |
| | | | | | | | | | | | |
| Morningstar Quartile – Class T Shares | | 2nd | | 1st | | 1st | | 1st | | | |
| | | | | | | | | | | | |
| Morningstar Ranking – based on total returns for Intermediate-Term Bond Funds | | 407/1,236 | | 141/1,065 | | 125/952 | | 31/263 | | | |
| | | | | | | | | | | | |
| Visit janus.com/advisor/mutual-funds (or janus.com/allfunds if you hold Shares directly with Janus Capital) to view current performance and characteristic information | | | |
| | | | | | | | | | | | |
Returns quoted are past performance and do not guarantee future results; current performance may be lower or higher. Investment returns and principal value will vary; there may be a gain or loss when shares are sold. For the most recent month–end performance call 877.33JANUS(52687) (or 800.525.3713 if you hold shares directly with Janus Capital) or visit janus.com/advisor/mutual-funds (or janus.com/allfunds if you hold shares directly with Janus Capital).
Performance shown for Class A Shares at Maximum Offering Price (MOP) includes the Fund’s maximum sales charge of 4.75%. Performance shown at Net Asset Value (NAV) does not include this charge and would have been lower had this charge been taken into account.
See important disclosures on the next page.
Janus Fixed Income & Money Market Funds | 7
Janus Flexible Bond Fund (unaudited)
Performance shown for Class C Shares includes a 1% contingent deferred sales charge (CDSC) on periods of less than 12 months. Performance shown at Net Asset Value (NAV) does not include this sales charge and would have been lower had this sales charge been taken into account.
The expense ratios for Class N Shares are estimated.
The Fund’s performance may be affected by risks that include those associated with non-investment grade debt securities, investments in specific industries or countries and potential conflicts of interest with the Janus “funds of funds.” Additional risks to the Fund may include those associated with investing in foreign securities, emerging markets, initial public offerings (“IPOs”), real estate investment trusts (“REITs”), and derivatives. Please see the Fund’s prospectuses or janus.com/info (or janus.com/reports if you hold shares directly with Janus Capital) for more information about risks, portfolio holdings and other details.
Funds that invest in bonds have the same interest rate, inflation, and credit risks that are associated with the underlying bonds owned by the Fund. Unlike owning individual bonds, there are ongoing fees and expenses associated with owning shares of Fixed Income Funds. The return of principal is not guaranteed due to net asset value fluctuation that is caused by changes in the price of specific bonds held in the Fund and selling of bonds within the Fund by the portfolio managers.
The Fund invests in mortgage-backed securities. Mortgage-backed securities are subject to prepayment risk (early payoff of mortgages during periods of declining interest rates) and extension risk (extending the duration of mortgage-backed securities during periods of rising interest rates). These risks may increase the volatility of these securities and affect total returns.
High-yield/high-risk bonds, also known as “junk” bonds, involve a greater risk of default and price volatility than investment grade bonds. High-yield/high-risk bonds can experience sudden and sharp price swings which will affect net asset value.
The Fund invests in REITs, which may be subject to a higher degree of market risk because of concentration in a specific industry, sector or geographic region. REITs may be subject to risks including, but not limited to: legal, political, liquidity, interest rate risks, a decline in the value of real estate, risks related to general and economic conditions, changes in the value of the underlying property owned by the trust and defaults by borrowers. To the extent the Fund invests in foreign REITs, the Fund may be subject to fluctuations in currency rates or political or economic conditions in a particular country.
The Fund may invest in derivatives which can be highly volatile and involve additional risks than if the underlying securities were held directly by the Fund. Such risks include gains or losses which, as a result of leverage, can be substantially greater than the derivatives’ original cost. There is also a possibility that derivatives may not perform as intended which can reduce opportunity for gains or result in losses by offsetting positive returns in other securities the Fund owns.
The Fund will normally invest at least 80% of its net assets, measured at the time of purchase, in the type of securities described by its name.
Returns include reinvestment of all dividends and distributions. The returns do not include adjustments in accordance with generally accepted accounting principles required at the period end for financial reporting purposes.
Class A Shares, Class C Shares, Class R Shares, and Class S Shares of the Fund commenced operations on July 6, 2009. The performance shown for periods prior to July 6, 2009 reflects the historical performance of a similar share class of the Fund, calculated using the fees and expenses of each respective share class without the effect of any fee and expense limitations or waivers.
Class D Shares of the Fund commenced operations on February 16, 2010, as a result of the restructuring of Class J Shares, the predecessor share class. The performance shown for periods prior to February 16, 2010 reflects the historical performance of the Fund’s predecessor share class.
Class I Shares of the Fund commenced operations on July 6, 2009. The performance shown for periods prior to July 6, 2009 reflects the historical performance of a similar share class of the Fund.
Class N Shares of the Fund commenced operations on May 31, 2012. The performance shown for periods prior to May 31, 2012 reflects the historical performance of a similar share class of the Fund.
If each share class of the Fund had been available during periods prior to its commencement, the performance shown may have been different. The performance shown for periods following the Fund’s commencement of each share class reflects the fees and expenses of each respective share class, net of any applicable fee and expense limitations or waivers. Please refer to the Fund’s prospectuses for further details concerning historical performance.
Ranking is for the share class shown only; other classes may have different performance characteristics. When an expense waiver is in effect, it may have a material effect on the total return or yield, and therefore the ranking for the period.
© 2013 Morningstar, Inc. All Rights Reserved.
There is no assurance that the investment process will consistently lead to successful investing.
See Notes to Schedules of Investments and Other Information for index definitions.
The Fund’s portfolio may differ significantly from the securities held in the index. The index is unmanaged and is not available for direct investment; therefore, its performance does not reflect the expenses associated with the active management of an actual portfolio.
See “Useful Information About Your Fund Report.”
| | | |
| * | | The Fund’s inception date – July 7, 1987. |
| ** | | The Barclays U.S. Aggregate Bond Index’s since inception returns are calculated from June 30, 1987. |
| (1) | | Closed to new investors. |
8 | JUNE 30, 2013
(unaudited)
As a shareholder of the Fund, you incur two types of costs: (1) transaction costs, such as sales charges (loads) on purchase payments (applicable to Class A Shares only); and (2) ongoing costs, including management fees; distribution and shareholder servicing (12b-1) fees; administrative services fees payable pursuant to the Transfer Agency Agreement; and other Fund expenses. This example is intended to help you understand your ongoing costs (in dollars) of investing in the Fund and to compare these costs with the ongoing costs of investing in other mutual funds. To do so, compare this 5% hypothetical example with the 5% hypothetical examples that appear in the shareholder reports of the other funds. The example is based upon an investment of $1,000 invested at the beginning of the period and held for the six-months indicated, unless noted otherwise in the table and footnotes below.
Actual Expenses
The information in the table under the heading “Actual” provides information about actual account values and actual expenses. You may use the information in these columns, together with the amount you invested, to estimate the expenses that you paid over the period. Simply divide your account value by $1,000 (for example, an $8,600 account value divided by $1,000 = 8.6), then multiply the result by the number in the appropriate column for your share class under the heading entitled “Expenses Paid During Period” to estimate the expenses you paid on your account during the period.
Hypothetical Example for Comparison Purposes
The information in the table under the heading “Hypothetical (5% return before expenses)” provides information about hypothetical account values and hypothetical expenses based upon the Fund’s actual expense ratio and an assumed rate of return of 5% per year before expenses, which is not the Fund’s actual return. The hypothetical account values and expenses may not be used to estimate the actual ending account balance or expenses you paid for the period. You may use this information to compare the ongoing costs of investing in the Fund and other funds. To do so, compare this 5% hypothetical example with the 5% hypothetical examples that appear in the shareholder reports of the other funds. Additionally, for an analysis of the fees associated with an investment in any share class or other similar funds, please visit www.finra.org/fundanalyzer.
Please note that the expenses shown in the table are meant to highlight your ongoing costs only and do not reflect any transaction costs. These fees are fully described in the Fund’s prospectuses. Therefore, the hypothetical examples are useful in comparing ongoing costs only, and will not help you determine the relative total costs of owning different funds. In addition, if these transaction costs were included, your costs would have been higher.
| | | | | | | | | | | | | | | | | | | | | | | | | | | | | | | |
| | | | | Hypothetical
| | | | |
| | | Actual | | (5% return before expenses) | | | | |
| | | Beginning
| | Ending
| | Expenses
| | Beginning
| | Ending
| | Expenses
| | | | |
| | | Account
| | Account
| | Paid During
| | Account
| | Account
| | Paid During
| | Net Annualized
| | |
| | | Value
| | Value
| | Period
| | Value
| | Value
| | Period
| | Expense Ratio
| | |
| | | (1/1/13) | | (6/30/13) | | (1/1/13 - 6/30/13)† | | (1/1/13) | | (6/30/13) | | (1/1/13 - 6/30/13)† | | (1/1/13 - 6/30/13) | | |
| |
| |
| Class A Shares | | $ | 1,000.00 | | | $ | 983.70 | | | $ | 3.74 | | | $ | 1,000.00 | | | $ | 1,021.03 | | | $ | 3.81 | | | | 0.76% | | | |
| |
| |
| Class C Shares | | $ | 1,000.00 | | | $ | 979.80 | | | $ | 7.66 | | | $ | 1,000.00 | | | $ | 1,017.06 | | | $ | 7.80 | | | | 1.56% | | | |
| |
| |
| Class D Shares | | $ | 1,000.00 | | | $ | 984.50 | | | $ | 2.95 | | | $ | 1,000.00 | | | $ | 1,021.82 | | | $ | 3.01 | | | | 0.60% | | | |
| |
| |
| Class I Shares | | $ | 1,000.00 | | | $ | 984.70 | | | $ | 2.71 | | | $ | 1,000.00 | | | $ | 1,022.07 | | | $ | 2.76 | | | | 0.55% | | | |
| |
| |
| Class N Shares | | $ | 1,000.00 | | | $ | 985.20 | | | $ | 2.17 | | | $ | 1,000.00 | | | $ | 1,022.61 | | | $ | 2.21 | | | | 0.44% | | | |
| |
| |
| Class R Shares | | $ | 1,000.00 | | | $ | 981.80 | | | $ | 5.65 | | | $ | 1,000.00 | | | $ | 1,019.09 | | | $ | 5.76 | | | | 1.15% | | | |
| |
| |
| Class S Shares | | $ | 1,000.00 | | | $ | 982.80 | | | $ | 4.62 | | | $ | 1,000.00 | | | $ | 1,020.13 | | | $ | 4.71 | | | | 0.94% | | | |
| |
| |
| Class T Shares | | $ | 1,000.00 | | | $ | 983.10 | | | $ | 3.34 | | | $ | 1,000.00 | | | $ | 1,021.42 | | | $ | 3.41 | | | | 0.68% | | | |
| |
| |
| | | |
| † | | Expenses Paid During Period are equal to the Net Annualized Expense Ratio multiplied by the average account value over the period, multiplied by the number of days in the most recent six-month period, divided by the number of days in the fiscal year. Expenses in the examples include the effect of applicable fee waivers and/or expense reimbursements, if any. Had such waivers and/or reimbursements not been in effect, your expenses would have been higher. Please refer to the Notes to Financial Statements or the Fund’s prospectuses for more information regarding waivers and/or reimbursements. |
Janus Fixed Income & Money Market Funds | 9
Janus Flexible Bond Fund
Schedule of Investments
As of June 30, 2013
| | | | | | | | | | | |
| Shares or Principal Amount | | Value | | | |
| |
| Asset-Backed/Commercial Mortgage-Backed Securities – 3.2% | | | | | | |
| | $10,215,000 | | | AmeriCredit Automobile Receivables Trust
3.3800%, 4/9/18 | | $ | 10,428,912 | | | |
| | 15,244,000 | | | AmeriCredit Automobile Receivables Trust
2.6800%, 10/9/18 | | | 15,134,228 | | | |
| | 11,404,625 | | | Beacon Container Finance LLC
3.7200%, 9/20/27 (144A) | | | 11,371,461 | | | |
| | 10,552,000 | | | Commercial Mortgage Pass Through Certificates
3.4244%, 3/10/31 (144A) | | | 10,128,833 | | | |
| | 3,530,000 | | | Commercial Mortgage Trust
5.6500%, 12/10/49 | | | 3,608,896 | | | |
| | 22,129,000 | | | Commercial Mortgage Trust
5.8670%, 12/10/49‡ | | | 23,705,957 | | | |
| | 20,149,076 | | | FREMF 2010 K-SCT Mortgage Trust
2.0000%, 1/25/20§ | | | 16,629,234 | | | |
| | 7,446,000 | | | FREMF Mortgage Trust
2.8037%, 5/25/19 (144A),‡ | | | 7,485,397 | | | |
| | 4,679,000 | | | GS Mortgage Securities Corp. II
2.9540%, 11/5/22 (144A) | | | 4,352,733 | | | |
| | 14,049,000 | | | GS Mortgage Securities Corp. II
3.5495%, 12/10/27 (144A),‡ | | | 12,012,499 | | | |
| | 12,256,000 | | | GS Mortgage Securities Corp. II
2.7982%, 11/8/29 (144A),‡ | | | 12,231,218 | | | |
| | 5,829,000 | | | GS Mortgage Securities Corp. II
3.7982%, 11/8/29 (144A),‡ | | | 5,678,303 | | | |
| | 6,423,000 | | | GS Mortgage Securities Corp. Trust
3.7706%, 1/10/18 (144A),‡ | | | 6,312,948 | | | |
| | 8,023,000 | | | GS Mortgage Securities Corp. Trust
3.5510%, 4/10/34 (144A),‡ | | | 7,899,470 | | | |
| | 4,700,000 | | | JPMorgan Chase Commercial Mortgage Securities Trust
3.9340%, 4/15/30 (144A),‡ | | | 4,637,730 | | | |
| | 6,243,000 | | | Santander Drive Auto Receivables Trust
2.5200%, 9/15/16 | | | 6,164,357 | | | |
| | 2,129,000 | | | Santander Drive Auto Receivables Trust
3.6400%, 5/15/18 | | | 2,174,925 | | | |
| | 6,185,000 | | | Santander Drive Auto Receivables Trust
3.3000%, 9/17/18 | | | 6,238,036 | | | |
| | 16,984,000 | | | Wachovia Bank Commercial Mortgage Trust
5.3830%, 12/15/43 | | | 17,904,261 | | | |
| | 11,367,000 | | | Wachovia Bank Commercial Mortgage Trust
5.5910%, 4/15/47‡ | | | 12,047,042 | | | |
| |
| |
| Total Asset-Backed/Commercial Mortgage-Backed Securities (cost $201,115,614) | | | 196,146,440 | | | |
| |
| |
| Bank Loans – 1.9% | | | | | | |
| Casino Hotels – 0.4% | | | | | | |
| | 23,047,185 | | | MGM Resorts International
3.5000%, 12/20/19‡ | | | 22,874,331 | | | |
| Hotels and Motels – 1.2% | | | | | | |
| | 10,000,000 | | | Hilton Hotels Corp.
0%, 11/12/15(a),‡ | | | 9,800,000 | | | |
| | 62,677,233 | | | Hilton Hotels Corp.
4.1930%, 11/12/15‡ | | | 61,658,728 | | | |
| | | | | | | | 71,458,728 | | | |
| Metal – Iron – 0.1% | | | | | | |
| | 9,826,743 | | | FMG Resources (August 2006) Pty, Ltd.
5.2500%, 10/18/17‡ | | | 9,760,707 | | | |
| Pharmaceuticals – 0.2% | | | | | | |
| | 11,386,269 | | | Quintiles Transnational Corp.
4.5000%, 6/8/18‡ | | | 11,372,036 | | | |
| |
| |
| Total Bank Loans (cost $116,454,051) | | | 115,465,802 | | | |
| |
| |
| Corporate Bonds – 47.4% | | | | | | |
| Aerospace and Defense – Equipment – 0.5% | | | | | | |
| | 12,259,000 | | | Exelis, Inc.
4.2500%, 10/1/16 | | | 12,925,412 | | | |
| | 5,299,000 | | | Exelis, Inc.
5.5500%, 10/1/21 | | | 5,383,169 | | | |
| | 10,514,000 | | | TransDigm, Inc.
7.7500%, 12/15/18 | | | 11,065,985 | | | |
| | | | | | | | 29,374,566 | | | |
| Airlines – 0.2% | | | | | | |
| | 3,827,000 | | | Southwest Airlines Co.
5.2500%, 10/1/14 | | | 4,006,000 | | | |
| | 10,517,000 | | | Southwest Airlines Co.
5.1250%, 3/1/17 | | | 11,338,020 | | | |
| | | | | | | | 15,344,020 | | | |
| Automotive – Cars and Light Trucks – 0.1% | | | | | | |
| | 5,932,000 | | | Jaguar Land Rover Automotive PLC
5.6250%, 2/1/23 (144A) | | | 5,754,040 | | | |
| Beverages – Wine and Spirits – 0% | | | | | | |
| | 2,844,000 | | | Constellation Brands, Inc.
3.7500%, 5/1/21 | | | 2,662,695 | | | |
| Broadcast Services and Programming – 0.3% | | | | | | |
| | 16,000,000 | | | A&E Communications – Private Placement
3.6300%, 8/22/22§ | | | 16,108,640 | | | |
| Building – Residential and Commercial – 0.4% | | | | | | |
| | 6,755,000 | | | D.R. Horton, Inc.
4.7500%, 5/15/17 | | | 6,974,537 | | | |
| | 2,188,000 | | | D.R. Horton, Inc.
4.3750%, 9/15/22 | | | 2,078,600 | | | |
| | 4,969,000 | | | M.D.C. Holdings, Inc.
5.3750%, 12/15/14 | | | 5,201,157 | | | |
| | 4,730,000 | | | Toll Brothers Finance Corp.
5.8750%, 2/15/22 | | | 4,942,850 | | | |
| | 3,236,000 | | | Toll Brothers Finance Corp.
4.3750%, 4/15/23 | | | 3,009,480 | | | |
| | | | | | | | 22,206,624 | | | |
| Building Products – Cement and Aggregate – 0.3% | | | | | | |
| | 11,956,000 | | | Hanson, Ltd.
6.1250%, 8/15/16 | | | 12,942,370 | | | |
| | 3,342,000 | | | Vulcan Materials Co.
7.0000%, 6/15/18 | | | 3,626,070 | | | |
| | | | | | | | 16,568,440 | | | |
| Casino Hotels – 0.4% | | | | | | |
| | 6,573,000 | | | MGM Resorts International
6.6250%, 7/15/15 | | | 7,008,461 | | | |
See Notes to Schedules of Investments and Other Information and Notes to Financial Statements.
10 | JUNE 30, 2013
Schedule of Investments
As of June 30, 2013
| | | | | | | | | | | |
| Shares or Principal Amount | | Value | | | |
| |
| Casino Hotels – (continued) | | | | | | |
| | $8,437,000 | | | MGM Resorts International
7.5000%, 6/1/16 | | $ | 9,196,330 | | | |
| | 9,791,000 | | | Wynn Las Vegas LLC / Wynn Las Vegas Capital Corp.
4.2500%, 5/30/23 (144A) | | | 9,056,675 | | | |
| | | | | | | | 25,261,466 | | | |
| Cellular Telecommunications – 0.3% | | | | | | |
| | 16,947,000 | | | Sprint Nextel Corp.
7.0000%, 8/15/20 | | | 17,794,350 | | | |
| Chemicals – Diversified – 0.5% | | | | | | |
| | 29,474,000 | | | LyondellBasell Industries N.V.
5.0000%, 4/15/19 | | | 32,070,542 | | | |
| Chemicals – Specialty – 0.8% | | | | | | |
| | 10,956,000 | | | Ashland, Inc.
3.8750%, 4/15/18 (144A) | | | 10,846,440 | | | |
| | 11,218,000 | | | Ashland, Inc.
4.7500%, 8/15/22 (144A) | | | 11,105,820 | | | |
| | 15,923,000 | | | Ashland, Inc.
6.8750%, 5/15/43 (144A) | | | 16,241,460 | | | |
| | 12,960,000 | | | Ecolab, Inc.
3.0000%, 12/8/16 | | | 13,521,570 | | | |
| | | | | | | | 51,715,290 | | | |
| Coatings and Paint Products – 0% | | | | | | |
| | 18,000 | | | RPM International, Inc.
6.2500%, 12/15/13 | | | 18,383 | | | |
| Commercial Banks – 2.7% | | | | | | |
| | 3,860,000 | | | CIT Group, Inc.
4.7500%, 2/15/15 (144A) | | | 3,922,725 | | | |
| | 35,303,000 | | | CIT Group, Inc.
4.2500%, 8/15/17 | | | 35,479,515 | | | |
| | 6,328,000 | | | CIT Group, Inc.
6.6250%, 4/1/18 (144A) | | | 6,834,240 | | | |
| | 25,843,000 | | | CIT Group, Inc.
5.5000%, 2/15/19 (144A) | | | 26,682,897 | | | |
| | 12,326,000 | | | HSBC Bank USA N.A.
4.8750%, 8/24/20 | | | 13,204,573 | | | |
| | 30,975,000 | | | Intesa Sanpaolo SpA
3.8750%, 1/16/18 | | | 29,742,536 | | | |
| | 15,442,000 | | | SVB Financial Group
5.3750%, 9/15/20 | | | 16,901,284 | | | |
| | 10,396,000 | | | Zions Bancorp
4.5000%, 3/27/17 | | | 10,994,238 | | | |
| | 26,957,000 | | | Zions Bancorp
5.8000%, 12/15/99‡ | | | 25,339,580 | | | |
| | | | | | | | 169,101,588 | | | |
| Computer Aided Design – 0.4% | | | | | | |
| | 8,901,000 | | | Autodesk, Inc.
1.9500%, 12/15/17 | | | 8,683,994 | | | |
| | 13,699,000 | | | Autodesk, Inc.
3.6000%, 12/15/22 | | | 13,075,216 | | | |
| | | | | | | | 21,759,210 | | | |
| Consulting Services – 1.2% | | | | | | |
| | 10,181,000 | | | Verisk Analytics, Inc.
4.8750%, 1/15/19 | | | 10,909,898 | | | |
| | 41,009,000 | | | Verisk Analytics, Inc.
5.8000%, 5/1/21 | | | 45,263,889 | | | |
| | 19,370,000 | | | Verisk Analytics, Inc.
4.1250%, 9/12/22 | | | 19,247,175 | | | |
| | | | | | | | 75,420,962 | | | |
| Data Processing and Management – 0.3% | | | | | | |
| | 11,200,000 | | | Fiserv, Inc.
3.1250%, 10/1/15 | | | 11,682,978 | | | |
| | 5,683,000 | | | Fiserv, Inc.
3.1250%, 6/15/16 | | | 5,925,988 | | | |
| | | | | | | | 17,608,966 | | | |
| Dialysis Centers – 0.2% | | | | | | |
| | 9,183,000 | | | Fresenius Medical Care U.S. Finance II, Inc.
5.8750%, 1/31/22 (144A) | | | 9,665,108 | | | |
| Diversified Banking Institutions – 4.4% | | | | | | |
| | 2,936,000 | | | Bank of America Corp.
4.5000%, 4/1/15 | | | 3,079,647 | | | |
| | 16,554,000 | | | Bank of America Corp.
1.5000%, 10/9/15 | | | 16,516,389 | | | |
| | 12,642,000 | | | Bank of America Corp.
3.6250%, 3/17/16 | | | 13,205,922 | | | |
| | 19,999,000 | | | Bank of America Corp.
3.7500%, 7/12/16 | | | 20,964,612 | | | |
| | 8,507,000 | | | Bank of America Corp.
2.0000%, 1/11/18 | | | 8,239,999 | | | |
| | 24,958,000 | | | Bank of America Corp.
8.0000%, 7/30/99‡ | | | 27,796,973 | | | |
| | 4,351,000 | | | Bank of America Corp.
8.1250%, 11/15/99‡ | | | 4,894,875 | | | |
| | 8,305,000 | | | Citigroup, Inc.
5.0000%, 9/15/14 | | | 8,630,780 | | | |
| | 13,282,000 | | | Citigroup, Inc.
5.3500%, 11/15/99‡ | | | 12,451,875 | | | |
| | 8,346,000 | | | Goldman Sachs Group, Inc.
5.6250%, 1/15/17 | | | 9,045,270 | | | |
| | 48,863,000 | | | Goldman Sachs Group, Inc.
2.3750%, 1/22/18 | | | 47,975,257 | | | |
| | 11,747,000 | | | Morgan Stanley
4.0000%, 7/24/15 | | | 12,244,450 | | | |
| | 38,050,000 | | | Morgan Stanley
3.4500%, 11/2/15 | | | 39,262,425 | | | |
| | 6,476,000 | | | Morgan Stanley
4.7500%, 3/22/17 | | | 6,868,808 | | | |
| | 22,487,000 | | | Morgan Stanley
2.1250%, 4/25/18 | | | 21,520,756 | | | |
| | 3,999,000 | | | Royal Bank of Scotland Group PLC
2.5500%, 9/18/15 | | | 4,066,019 | | | |
| | 12,319,000 | | | Royal Bank of Scotland Group PLC
6.1000%, 6/10/23 | | | 11,687,196 | | | |
| | | | | | | | 268,451,253 | | | |
| Diversified Financial Services – 1.0% | | | | | | |
| | 13,088,000 | | | Carlyle Holdings Finance LLC
3.8750%, 2/1/23 (144A) | | | 12,666,422 | | | |
| | 1,475,000 | | | General Electric Capital Corp.
6.3750%, 11/15/67‡ | | | 1,534,000 | | | |
See Notes to Schedules of Investments and Other Information and Notes to Financial Statements.
Janus Fixed Income & Money Market Funds | 11
Janus Flexible Bond Fund
Schedule of Investments
As of June 30, 2013
| | | | | | | | | | | |
| Shares or Principal Amount | | Value | | | |
| |
| Diversified Financial Services – (continued) | | | | | | |
| | $15,000,000 | | | General Electric Capital Corp.
6.2500%, 12/15/99‡ | | $ | 15,937,500 | | | |
| | 30,500,000 | | | General Electric Capital Corp.
7.1250%, 12/15/99‡ | | | 34,465,000 | | | |
| | | | | | | | 64,602,922 | | | |
| Diversified Minerals – 0.2% | | | | | | |
| | 14,608,000 | | | FMG Resources (August 2006) Pty, Ltd.
7.0000%, 11/1/15 (144A) | | | 14,754,080 | | | |
| Diversified Operations – 0.6% | | | | | | |
| | 7,819,000 | | | GE Capital Trust I
6.3750%, 11/15/67‡ | | | 8,102,439 | | | |
| | 27,210,000 | | | Ingersoll-Rand Global Holding Co., Ltd.
4.2500%, 6/15/23 (144A) | | | 27,039,121 | | | |
| | | | | | | | 35,141,560 | | | |
| Electric – Generation – 0% | | | | | | |
| | 1,502,000 | | | AES Corp.
7.7500%, 10/15/15 | | | 1,655,955 | | | |
| Electric – Integrated – 1.2% | | | | | | |
| | 13,772,000 | | | CMS Energy Corp.
4.2500%, 9/30/15 | | | 14,606,005 | | | |
| | 10,252,000 | | | CMS Energy Corp.
5.0500%, 2/15/18 | | | 11,388,393 | | | |
| | 7,407,000 | | | Great Plains Energy, Inc.
4.8500%, 6/1/21 | | | 7,867,167 | | | |
| | 6,680,000 | | | Monongahela Power Co., Inc.
6.7000%, 6/15/14 | | | 7,028,836 | | | |
| | 16,692,000 | | | PPL Energy Supply LLC
4.6000%, 12/15/21 | | | 16,986,180 | | | |
| | 10,321,000 | | | PPL WEM Holdings PLC
3.9000%, 5/1/16 (144A) | | | 10,786,436 | | | |
| | 6,925,000 | | | PPL WEM Holdings PLC
5.3750%, 5/1/21 (144A) | | | 7,594,135 | | | |
| | | | | | | | 76,257,152 | | | |
| Electronic Components – Semiconductors – 0.7% | | | | | | |
| | 44,522,000 | | | Samsung Electronics America, Inc.
1.7500%, 4/10/17 (144A) | | | 44,099,086 | | | |
| Electronic Connectors – 0.6% | | | | | | |
| | 16,091,000 | | | Amphenol Corp.
4.7500%, 11/15/14 | | | 16,862,306 | | | |
| | 17,131,000 | | | Amphenol Corp.
4.0000%, 2/1/22 | | | 17,095,762 | | | |
| | | | | | | | 33,958,068 | | | |
| Electronic Measuring Instruments – 0.4% | | | | | | |
| | 4,736,000 | | | Agilent Technologies, Inc.
2.5000%, 7/15/13 | | | 4,738,936 | | | |
| | 17,284,000 | | | FLIR Systems, Inc.
3.7500%, 9/1/16 | | | 17,864,777 | | | |
| | | | | | | | 22,603,713 | | | |
| Engineering – Research and Development Services – 0.4% | | | | | | |
| | 12,306,000 | | | URS Corp.
4.3500%, 4/1/17 (144A) | | | 12,536,590 | | | |
| | 11,296,000 | | | URS Corp.
5.5000%, 4/1/22 (144A) | | | 11,656,274 | | | |
| | | | | | | | 24,192,864 | | | |
| Finance – Auto Loans – 1.9% | | | | | | |
| | 35,910,000 | | | Ford Motor Credit Co. LLC
3.8750%, 1/15/15 | | | 37,014,017 | | | |
| | 9,462,000 | | | Ford Motor Credit Co. LLC
3.0000%, 6/12/17 | | | 9,481,946 | | | |
| | 10,647,000 | | | Ford Motor Credit Co. LLC
6.6250%, 8/15/17 | | | 12,050,200 | | | |
| | 11,576,000 | | | Ford Motor Credit Co. LLC
5.0000%, 5/15/18 | | | 12,344,924 | | | |
| | 27,461,000 | | | Ford Motor Credit Co. LLC
5.8750%, 8/2/21 | | | 29,939,355 | | | |
| | 8,155,000 | | | General Motors Financial Co., Inc.
3.2500%, 5/15/18 (144A) | | | 7,930,738 | | | |
| | 11,713,000 | | | General Motors Financial Co., Inc.
4.2500%, 5/15/23 (144A) | | | 10,907,731 | | | |
| | | | | | | | 119,668,911 | | | |
| Finance – Credit Card – 0.2% | | | | | | |
| | 14,100,000 | | | American Express Co.
6.8000%, 9/1/66‡ | | | 15,051,750 | | | |
| Finance – Investment Bankers/Brokers – 1.7% | | | | | | |
| | 14,983,000 | | | Charles Schwab Corp.
7.0000%, 8/1/99‡ | | | 16,706,045 | | | |
| | 15,208,000 | | | Lazard Group LLC
7.1250%, 5/15/15 | | | 16,513,759 | | | |
| | 2,413,000 | | | Lazard Group LLC
6.8500%, 6/15/17 | | | 2,699,044 | | | |
| | 42,481,000 | | | Raymond James Financial, Inc.
5.6250%, 4/1/24 | | | 44,742,433 | | | |
| | 16,230,000 | | | TD Ameritrade Holding Corp.
4.1500%, 12/1/14 | | | 16,993,151 | | | |
| | 5,901,000 | | | TD Ameritrade Holding Corp.
5.6000%, 12/1/19 | | | 6,859,594 | | | |
| | | | | | | | 104,514,026 | | | |
| Finance – Leasing Companies – 0.6% | | | | | | |
| | 40,739,000 | | | LeasePlan Corp. N.V.
2.5000%, 5/16/18 (144A) | | | 39,260,622 | | | |
| Finance – Mortgage Loan Banker – 0.3% | | | | | | |
| | 19,032,000 | | | Northern Rock Asset Management PLC
5.6250%, 6/22/17 (144A) | | | 21,550,314 | | | |
| Finance – Other Services – 0.2% | | | | | | |
| | 11,768,000 | | | CNH Capital LLC
3.6250%, 4/15/18 (144A) | | | 11,209,020 | | | |
| Food – Meat Products – 1.0% | | | | | | |
| | 36,834,000 | | | Tyson Foods, Inc.
6.6000%, 4/1/16 | | | 41,605,329 | | | |
| | 17,223,000 | | | Tyson Foods, Inc.
4.5000%, 6/15/22 | | | 17,598,875 | | | |
| | | | | | | | 59,204,204 | | | |
| Food – Miscellaneous/Diversified – 0.9% | | | | | | |
| | 5,667,000 | | | Hawk Acquisition Sub, Inc.
4.2500%, 10/15/20 (144A) | | | 5,419,069 | | | |
| | 49,956,000 | | | Kraft Foods Group, Inc.
2.2500%, 6/5/17 | | | 50,306,541 | | | |
| | | | | | | | 55,725,610 | | | |
| | | | | | | | | | | |
See Notes to Schedules of Investments and Other Information and Notes to Financial Statements.
12 | JUNE 30, 2013
Schedule of Investments
As of June 30, 2013
| | | | | | | | | | | |
| Shares or Principal Amount | | Value | | | |
| |
| Food – Retail – 0.5% | | | | | | |
| | $4,747,000 | | | Safeway, Inc.
3.9500%, 8/15/20 | | $ | 4,654,946 | | | |
| | 22,707,000 | | | Safeway, Inc.
4.7500%, 12/1/21 | | | 23,134,687 | | | |
| | | | | | | | 27,789,633 | | | |
| Gas – Transportation – 0% | | | | | | |
| | 1,927,000 | | | Southern Star Central Gas Pipeline, Inc.
6.0000%, 6/1/16 (144A) | | | 2,101,326 | | | |
| Hotels and Motels – 0.3% | | | | | | |
| | 2,629,000 | | | Starwood Hotels & Resorts Worldwide, Inc.
6.7500%, 5/15/18 | | | 3,108,437 | | | |
| | 10,786,000 | | | Starwood Hotels & Resorts Worldwide, Inc.
7.1500%, 12/1/19 | | | 13,027,083 | | | |
| | | | | | | | 16,135,520 | | | |
| Investment Management and Advisory Services – 0.9% | | | | | | |
| | 14,298,000 | | | Ameriprise Financial, Inc.
7.5180%, 6/1/66‡ | | | 15,620,565 | | | |
| | 22,405,000 | | | Neuberger Berman Group LLC / Neuberger Berman Finance Corp.
5.6250%, 3/15/20 (144A) | | | 23,189,175 | | | |
| | 13,442,000 | | | Neuberger Berman Group LLC / Neuberger Berman Finance Corp.
5.8750%, 3/15/22 (144A) | | | 13,710,840 | | | |
| | | | | | | | 52,520,580 | | | |
| Life and Health Insurance – 0.6% | | | | | | |
| | 33,486,000 | | | Primerica, Inc.
4.7500%, 7/15/22 | | | 35,430,566 | | | |
| Linen Supply & Related Items – 0.2% | | | | | | |
| | 5,983,000 | | | Cintas Corp. No. 2
2.8500%, 6/1/16 | | | 6,246,288 | | | |
| | 6,383,000 | | | Cintas Corp. No. 2
4.3000%, 6/1/21 | | | 6,684,367 | | | |
| | | | | | | | 12,930,655 | | | |
| Medical – Biomedical and Genetic – 0.7% | | | | | | |
| | 6,695,000 | | | Bio-Rad Laboratories, Inc.
8.0000%, 9/15/16 | | | 7,006,077 | | | |
| | 30,378,000 | | | Life Technologies Corp.
6.0000%, 3/1/20 | | | 34,222,913 | | | |
| | | | | | | | 41,228,990 | | | |
| Medical – Drugs – 0.8% | | | | | | |
| | 27,564,000 | | | AbbVie, Inc.
1.7500%, 11/6/17 (144A) | | | 27,004,919 | | | |
| | 4,506,000 | | | AbbVie, Inc.
2.0000%, 11/6/18 (144A) | | | 4,369,135 | | | |
| | 19,847,000 | | | VPII Escrow Corp.
6.7500%, 8/15/18 (144A) | | | 20,343,175 | | | |
| | | | | | | | 51,717,229 | | | |
| Medical – Generic Drugs – 0.4% | | | | | | |
| | 27,063,000 | | | Actavis, Inc.
1.8750%, 10/1/17 | | | 26,382,636 | | | |
| Metal Processors and Fabricators – 0% | | | | | | |
| | 2,311,000 | | | Timken Co.
6.0000%, 9/15/14 | | | 2,443,228 | | | |
| Multi-Line Insurance – 1.8% | | | | | | |
| | 17,906,000 | | | American International Group, Inc.
4.2500%, 9/15/14 | | | 18,569,292 | | | |
| | 5,816,000 | | | American International Group, Inc.
5.6000%, 10/18/16 | | | 6,480,722 | | | |
| | 10,417,000 | | | American International Group, Inc.
5.4500%, 5/18/17 | | | 11,483,034 | | | |
| | 9,655,000 | | | American International Group, Inc.
6.2500%, 3/15/37 | | | 9,860,169 | | | |
| | 31,306,000 | | | American International Group, Inc.
8.1750%, 5/15/58‡ | | | 38,193,320 | | | |
| | 10,640,000 | | | ING U.S., Inc.
2.9000%, 2/15/18 (144A) | | | 10,693,541 | | | |
| | 12,102,000 | | | ING U.S., Inc.
5.6500%, 5/15/53 (144A),‡ | | | 11,375,880 | | | |
| | 2,241,000 | | | Loews Corp.
2.6250%, 5/15/23 | | | 2,038,384 | | | |
| | | | | | | | 108,694,342 | | | |
| Office Furnishings – Original – 0.1% | | | | | | |
| | 4,558,000 | | | Interface, Inc.
7.6250%, 12/1/18 | | | 4,831,480 | | | |
| Oil – Field Services – 0.5% | | | | | | |
| | 10,474,000 | | | Korea National Oil Corp.
4.0000%, 10/27/16 (144A) | | | 11,076,297 | | | |
| | 18,225,000 | | | Schlumberger Investment S.A.
1.9500%, 9/14/16 (144A) | | | 18,569,197 | | | |
| | | | | | | | 29,645,494 | | | |
| Oil and Gas Drilling – 0.7% | | | | | | |
| | 6,920,000 | | | Nabors Industries, Inc.
6.1500%, 2/15/18 | | | 7,719,343 | | | |
| | 24,873,000 | | | Nabors Industries, Inc.
5.0000%, 9/15/20 | | | 25,355,760 | | | |
| | 8,544,000 | | | Rowan Cos., Inc.
5.0000%, 9/1/17 | | | 9,234,338 | | | |
| | | | | | | | 42,309,441 | | | |
| Oil Companies – Exploration and Production – 3.0% | | | | | | |
| | 54,869,000 | | | Chesapeake Energy Corp.
5.3750%, 6/15/21 | | | 54,594,655 | | | |
| | 17,570,000 | | | Cimarex Energy Co.
5.8750%, 5/1/22 | | | 18,184,950 | | | |
| | 2,588,000 | | | Continental Resources, Inc.
7.1250%, 4/1/21 | | | 2,846,800 | | | |
| | 36,401,000 | | | Continental Resources, Inc.
5.0000%, 9/15/22 | | | 37,038,017 | | | |
| | 10,463,000 | | | Petrohawk Energy Corp.
10.5000%, 8/1/14 | | | 10,996,613 | | | |
| | 2,196,000 | | | Petrohawk Energy Corp.
7.2500%, 8/15/18 | | | 2,395,836 | | | |
| | 12,076,000 | | | Petrohawk Energy Corp.
6.2500%, 6/1/19 | | | 13,253,410 | | | |
| | 7,871,000 | | | Plains Exploration & Production Co.
6.5000%, 11/15/20 | | | 8,344,874 | | | |
| | 25,925,000 | | | Plains Exploration & Production Co.
6.8750%, 2/15/23 | | | 27,737,209 | | | |
| | 6,113,000 | | | Whiting Petroleum Corp.
6.5000%, 10/1/18 | | | 6,464,498 | | | |
| | | | | | | | 181,856,862 | | | |
See Notes to Schedules of Investments and Other Information and Notes to Financial Statements.
Janus Fixed Income & Money Market Funds | 13
Janus Flexible Bond Fund
Schedule of Investments
As of June 30, 2013
| | | | | | | | | | | |
| Shares or Principal Amount | | Value | | | |
| |
| Oil Companies – Integrated – 0.1% | | | | | | |
| | $8,629,000 | | | Phillips 66
2.9500%, 5/1/17 | | $ | 8,893,203 | | | |
| Oil Refining and Marketing – 0.1% | | | | | | |
| | 7,796,000 | | | Motiva Enterprises LLC
5.7500%, 1/15/20 (144A) | | | 8,896,320 | | | |
| Pharmacy Services – 1.3% | | | | | | |
| | 14,412,000 | | | Express Scripts Holding Co.
2.1000%, 2/12/15 | | | 14,656,788 | | | |
| | 11,034,000 | | | Express Scripts Holding Co.
3.1250%, 5/15/16 | | | 11,473,771 | | | |
| | 52,360,000 | | | Express Scripts Holding Co.
2.6500%, 2/15/17 | | | 53,315,727 | | | |
| | | | | | | | 79,446,286 | | | |
| Pipelines – 2.0% | | | | | | |
| | 11,116,000 | | | DCP Midstream Operating L.P.
3.2500%, 10/1/15 | | | 11,520,556 | | | |
| | 24,987,000 | | | DCP Midstream Operating L.P.
4.9500%, 4/1/22 | | | 25,612,275 | | | |
| | 1,976,000 | | | El Paso Pipeline Partners Operating Co. LLC
6.5000%, 4/1/20 | | | 2,287,060 | | | |
| | 8,478,000 | | | El Paso Pipeline Partners Operating Co. LLC
5.0000%, 10/1/21 | | | 9,096,122 | | | |
| | 18,193,000 | | | Kinder Morgan Finance Co. LLC
5.7000%, 1/5/16 | | | 19,486,450 | | | |
| | 37,923,000 | | | Western Gas Partners L.P.
5.3750%, 6/1/21 | | | 40,693,692 | | | |
| | 14,519,000 | | | Williams Cos., Inc.
3.7000%, 1/15/23 | | | 13,489,356 | | | |
| | | | | | | | 122,185,511 | | | |
| Publishing – Newspapers – 0% | | | | | | |
| | 1,758,000 | | | Gannett Co., Inc.
6.3750%, 9/1/15 | | | 1,898,640 | | | |
| Publishing – Periodicals – 0.3% | | | | | | |
| | 16,772,000 | | | UBM PLC
5.7500%, 11/3/20 (144A) | | | 17,002,397 | | | |
| Real Estate Management/Services – 0.5% | | | | | | |
| | 6,034,000 | | | CBRE Services, Inc.
6.6250%, 10/15/20 | | | 6,365,870 | | | |
| | 23,685,000 | | | Jones Lang LaSalle, Inc.
4.4000%, 11/15/22 | | | 23,241,451 | | | |
| | | | | | | | 29,607,321 | | | |
| Real Estate Operating/Development – 0.2% | | | | | | |
| | 11,136,000 | | | Post Apartment Homes L.P.
4.7500%, 10/15/17 | | | 12,000,443 | | | |
| REIT – Diversified – 1.5% | | | | | | |
| | 19,961,000 | | | American Tower Trust I
1.5510%, 3/15/18 (144A) | | | 19,615,215 | | | |
| | 36,035,000 | | | American Tower Trust I
3.0700%, 3/15/23 (144A) | | | 34,418,290 | | | |
| | 9,613,000 | | | Goodman Funding Pty, Ltd.
6.3750%, 11/12/20 (144A) | | | 10,712,823 | | | |
| | 25,399,000 | | | Goodman Funding Pty, Ltd.
6.3750%, 4/15/21 (144A) | | | 28,444,950 | | | |
| | | | | | | | 93,191,278 | | | |
| REIT – Health Care – 0.2% | | | | | | |
| | 4,936,000 | | | Senior Housing Properties Trust
6.7500%, 4/15/20 | | | 5,430,355 | | | |
| | 5,770,000 | | | Senior Housing Properties Trust
6.7500%, 12/15/21 | | | 6,374,477 | | | |
| | | | | | | | 11,804,832 | | | |
| REIT – Hotels – 0.2% | | | | | | |
| | 7,075,000 | | | Host Hotels & Resorts L.P.
6.7500%, 6/1/16 | | | 7,179,710 | | | |
| | 3,721,000 | | | Host Hotels & Resorts L.P.
3.7500%, 10/15/23 | | | 3,412,704 | | | |
| | | | | | | | 10,592,414 | | | |
| REIT – Office Property – 1.0% | | | | | | |
| | 24,695,000 | | | Alexandria Real Estate Equities, Inc.
4.6000%, 4/1/22 | | | 25,167,366 | | | |
| | 3,955,000 | | | Reckson Operating Partnership L.P.
6.0000%, 3/31/16 | | | 4,309,582 | | | |
| | 10,637,000 | | | SL Green Realty Corp. / SL Green Operating Partnership / Reckson Operating Partnership
5.0000%, 8/15/18 | | | 11,325,267 | | | |
| | 18,952,000 | | | SL Green Realty Corp. / SL Green Operating Partnership / Reckson Operating Partnership
7.7500%, 3/15/20 | | | 22,325,058 | | | |
| | | | | | | | 63,127,273 | | | |
| Retail – Regional Department Stores – 0.2% | | | | | | |
| | 4,977,000 | | | Macy’s Retail Holdings, Inc.
5.7500%, 7/15/14 | | | 5,216,444 | | | |
| | 4,777,000 | | | Macy’s Retail Holdings, Inc.
5.9000%, 12/1/16 | | | 5,426,457 | | | |
| | | | | | | | 10,642,901 | | | |
| Retail – Restaurants – 0.5% | | | | | | |
| | 31,312,000 | | | Brinker International, Inc.
3.8750%, 5/15/23 | | | 29,364,675 | | | |
| Rubber – Tires – 0.1% | | | | | | |
| | 4,419,000 | | | Continental Rubber of America Corp.
4.5000%, 9/15/19 (144A) | | | 4,550,134 | | | |
| Security Services – 0.6% | | | | | | |
| | 41,564,000 | | | ADT Corp.
4.1250%, 6/15/23 | | | 39,149,589 | | | |
| Semiconductor Components/Integrated Circuits – 0.8% | | | | | | |
| | 54,242,000 | | | TSMC Global, Ltd.
1.6250%, 4/3/18 (144A) | | | 52,145,384 | | | |
| Steel – Producers – 0.4% | | | | | | |
| | 10,509,000 | | | ArcelorMittal
5.0000%, 2/25/17 | | | 10,640,362 | | | |
| | 7,784,000 | | | Reliance Steel & Aluminum Co.
4.5000%, 4/15/23 | | | 7,382,159 | | | |
| | 7,470,000 | | | Steel Dynamics, Inc.
5.2500%, 4/15/23 (144A) | | | 7,320,600 | | | |
| | | | | | | | 25,343,121 | | | |
| Super-Regional Banks – 0.2% | | | | | | |
| | 8,178,000 | | | Wells Fargo & Co.
7.9800%, 9/15/99‡ | | | 9,241,140 | | | |
See Notes to Schedules of Investments and Other Information and Notes to Financial Statements.
14 | JUNE 30, 2013
Schedule of Investments
As of June 30, 2013
| | | | | | | | | | | |
| Shares or Principal Amount | | Value | | | |
| |
| Telecommunication Services – 0.2% | | | | | | |
| | $11,044,000 | | | SBA Tower Trust
2.9330%, 12/15/17 (144A) | | $ | 11,145,229 | | | |
| Telephone – Integrated – 0.8% | | | | | | |
| | 36,080,000 | | | Qwest Communications International, Inc.
7.1250%, 4/1/18 | | | 37,433,000 | | | |
| | 4,278,000 | | | Softbank Corp.
4.5000%, 4/15/20 (144A) | | | 4,122,922 | | | |
| | 7,592,000 | | | Sprint Capital Corp.
6.9000%, 5/1/19 | | | 7,895,680 | | | |
| | | | | | | | 49,451,602 | | | |
| Transportation – Railroad – 0% | | | | | | |
| | 2,381,067 | | | CSX Transportation, Inc.
8.3750%, 10/15/14 | | | 2,594,746 | | | |
| Transportation – Services – 0% | | | | | | |
| | 2,325,000 | | | Asciano Finance, Ltd.
3.1250%, 9/23/15 (144A) | | | 2,375,813 | | | |
| Transportation – Truck – 0.3% | | | | | | |
| | 16,761,000 | | | JB Hunt Transport Services, Inc.
3.3750%, 9/15/15 | | | 17,474,667 | | | |
| Trucking and Leasing – 0.5% | | | | | | |
| | 2,997,000 | | | Penske Truck Leasing Co. L.P. / PTL Finance Corp.
2.5000%, 3/15/16 (144A) | | | 3,048,488 | | | |
| | 21,368,000 | | | Penske Truck Leasing Co. L.P. / PTL Finance Corp.
3.3750%, 3/15/18 (144A) | | | 21,968,975 | | | |
| | 8,177,000 | | | Penske Truck Leasing Co. L.P. / PTL Finance Corp.
4.2500%, 1/17/23 (144A) | | | 8,083,259 | | | |
| | | | | | | | 33,100,722 | | | |
| |
| |
| Total Corporate Bonds (cost $2,886,086,692) | | | 2,921,579,623 | | | |
| |
| |
| Mortgage-Backed Securities – 23.7% | | | | | | |
| | | | | Fannie Mae: | | | | | | |
| | 4,172,306 | | | 5.5000%, 1/1/25 | | | 4,503,626 | | | |
| | 10,281,836 | | | 5.5000%, 7/1/25 | | | 11,083,750 | | | |
| | 17,704,052 | | | 5.5000%, 8/1/25 | | | 19,086,406 | | | |
| | 13,413,997 | | | 5.0000%, 9/1/29 | | | 14,525,174 | | | |
| | 5,448,252 | | | 5.0000%, 1/1/30 | | | 5,905,574 | | | |
| | 2,554,925 | | | 5.5000%, 1/1/33 | | | 2,817,677 | | | |
| | 7,467,814 | | | 5.0000%, 9/1/33 | | | 8,338,580 | | | |
| | 1,683,911 | | | 5.0000%, 11/1/33 | | | 1,821,811 | | | |
| | 3,225,743 | | | 5.0000%, 12/1/33 | | | 3,489,663 | | | |
| | 1,687,677 | | | 5.0000%, 2/1/34 | | | 1,825,757 | | | |
| | 28,059,398 | | | 5.5000%, 7/1/35 | | | 30,764,497 | | | |
| | 5,704,818 | | | 5.0000%, 10/1/35 | | | 6,148,418 | | | |
| | 15,188,002 | | | 6.0000%, 10/1/35 | | | 16,631,566 | | | |
| | 13,717,006 | | | 6.0000%, 12/1/35 | | | 15,316,370 | | | |
| | 5,976,915 | | | 5.5000%, 1/1/36 | | | 6,518,580 | | | |
| | 4,474,324 | | | 6.0000%, 2/1/37 | | | 5,024,927 | | | |
| | 4,099,111 | | | 6.0000%, 3/1/37 | | | 4,449,920 | | | |
| | 16,817,484 | | | 5.5000%, 5/1/37 | | | 18,518,138 | | | |
| | 3,201,833 | | | 6.0000%, 5/1/37 | | | 3,484,209 | | | |
| | 2,897,214 | | | 5.5000%, 7/1/37 | | | 3,142,201 | | | |
| | 18,801,181 | | | 6.0000%, 9/1/37 | | | 20,566,108 | | | |
| | 3,076,770 | | | 5.5000%, 3/1/38 | | | 3,392,105 | | | |
| | 14,413,272 | | | 6.0000%, 10/1/38 | | | 16,200,066 | | | |
| | 3,303,552 | | | 6.0000%, 11/1/38 | | | 3,594,899 | | | |
| | 8,080,458 | | | 6.0000%, 11/1/38 | | | 8,811,877 | | | |
| | 6,752,272 | | | 7.0000%, 2/1/39 | | | 7,579,425 | | | |
| | 7,415,800 | | | 5.0000%, 5/1/39 | | | 8,185,333 | | | |
| | 17,855,544 | | | 6.0000%, 10/1/39 | | | 19,771,605 | | | |
| | 12,844,260 | | | 5.0000%, 2/1/40 | | | 14,065,230 | | | |
| | 7,481,642 | | | 6.0000%, 4/1/40 | | | 8,141,463 | | | |
| | 6,025,890 | | | 5.0000%, 6/1/40 | | | 6,646,415 | | | |
| | 12,470,173 | | | 5.0000%, 6/1/40 | | | 13,643,970 | | | |
| | 14,916,456 | | | 5.0000%, 6/1/40 | | | 16,396,891 | | | |
| | 26,570,217 | | | 6.0000%, 7/1/40 | | | 29,636,094 | | | |
| | 3,296,784 | | | 4.5000%, 10/1/40 | | | 3,552,172 | | | |
| | 3,288,797 | | | 4.0000%, 12/1/40 | | | 3,446,802 | | | |
| | 35,420,999 | | | 5.0000%, 2/1/41 | | | 38,769,309 | | | |
| | 3,203,659 | | | 5.0000%, 3/1/41 | | | 3,535,610 | | | |
| | 5,832,303 | | | 4.5000%, 4/1/41 | | | 6,296,764 | | | |
| | 9,633,680 | | | 4.5000%, 4/1/41 | | | 10,320,833 | | | |
| | 5,828,065 | | | 5.0000%, 4/1/41 | | | 6,379,319 | | | |
| | 8,338,147 | | | 5.0000%, 4/1/41 | | | 9,204,773 | | | |
| | 9,875,359 | | | 4.5000%, 5/1/41 | | | 10,700,273 | | | |
| | 5,538,847 | | | 5.0000%, 5/1/41 | | | 6,115,348 | | | |
| | 7,262,988 | | | 5.0000%, 5/1/41 | | | 8,096,068 | | | |
| | 20,100,206 | | | 4.5000%, 6/1/41 | | | 21,765,731 | | | |
| | 12,450,618 | | | 5.0000%, 6/1/41 | | | 13,614,010 | | | |
| | 27,023,488 | | | 5.0000%, 6/1/41 | | | 30,104,218 | | | |
| | 5,051,858 | | | 5.0000%, 7/1/41 | | | 5,536,757 | | | |
| | 14,554,923 | | | 5.0000%, 7/1/41 | | | 15,938,659 | | | |
| | 13,094,608 | | | 4.5000%, 8/1/41 | | | 14,046,756 | | | |
| | 66,136,274 | | | 4.5000%, 8/1/41 | | | 72,093,714 | | | |
| | 239,191 | | | 5.0000%, 9/1/41 | | | 261,322 | | | |
| | 10,103,161 | | | 4.5000%, 10/1/41 | | | 10,800,698 | | | |
| | 6,628,565 | | | 5.0000%, 10/1/41 | | | 7,221,823 | | | |
| | | | | Freddie Mac: | | | | | | |
| | 3,491,333 | | | 5.0000%, 1/1/19 | | | 3,690,173 | | | |
| | 2,701,972 | | | 5.0000%, 2/1/19 | | | 2,855,856 | | | |
| | 3,686,783 | | | 5.5000%, 8/1/19 | | | 3,938,388 | | | |
| | 5,994,182 | | | 5.0000%, 6/1/20 | | | 6,421,402 | | | |
| | 13,091,751 | | | 5.5000%, 12/1/28 | | | 14,320,996 | | | |
| | 18,091,574 | | | 5.0000%, 1/1/36 | | | 20,018,819 | | | |
| | 9,582,699 | | | 5.5000%, 10/1/36 | | | 10,591,467 | | | |
| | 5,113,417 | | | 5.0000%, 11/1/36 | | | 5,468,163 | | | |
| | 5,985,520 | | | 6.0000%, 1/1/38 | | | 6,500,686 | | | |
| | 2,161,461 | | | 5.5000%, 5/1/38 | | | 2,356,109 | | | |
| | 45,401,386 | | | 6.0000%, 11/1/38 | | | 50,839,587 | | | |
| | 15,988,832 | | | 5.0000%, 5/1/39 | | | 17,448,443 | | | |
| | 6,843,234 | | | 5.5000%, 10/1/39 | | | 7,484,159 | | | |
| | 7,432,522 | | | 4.5000%, 1/1/41 | | | 7,972,732 | | | |
| | 15,982,241 | | | 5.0000%, 5/1/41 | | | 17,549,425 | | | |
| | 2,592,458 | | | 4.5000%, 9/1/41 | | | 2,789,211 | | | |
| | 6,806,948 | | | 5.0000%, 9/1/41 | | | 7,360,262 | | | |
| | | | | Ginnie Mae: | | | | | | |
| | 7,039,555 | | | 4.0000%, 8/15/24 | | | 7,499,456 | | | |
| | 11,571,525 | | | 5.1000%, 12/15/29 | | | 13,046,894 | | | |
| | 6,198,663 | | | 6.0000%, 11/20/34 | | | 6,910,942 | | | |
| | 27,672,455 | | | 5.5000%, 3/20/35 | | | 30,490,678 | | | |
| | 4,114,647 | | | 5.5000%, 9/15/35 | | | 4,616,078 | | | |
| | 7,017,445 | | | 5.5000%, 3/15/36 | | | 7,721,138 | | | |
| | 8,486,702 | | | 5.5000%, 3/20/36 | | | 9,322,170 | | | |
| | 10,553,807 | | | 5.5000%, 5/20/36 | | | 11,620,694 | | | |
| | 4,940,580 | | | 6.0000%, 1/20/39 | | | 5,554,011 | | | |
| | 4,464,050 | | | 5.0000%, 4/15/39 | | | 4,838,267 | | | |
See Notes to Schedules of Investments and Other Information and Notes to Financial Statements.
Janus Fixed Income & Money Market Funds | 15
Janus Flexible Bond Fund
Schedule of Investments
As of June 30, 2013
| | | | | | | | | | | |
| Shares or Principal Amount | | Value | | | |
| |
| Mortgage-Backed Securities – (continued) | | | | | | |
| | | | | Ginnie Mae: (continued) | | | | | | |
| | $46,973,801 | | | 5.5000%, 6/15/39 | | $ | 52,708,258 | | | |
| | 11,383,285 | | | 5.5000%, 8/15/39 | | | 13,213,523 | | | |
| | 16,881,504 | | | 5.5000%, 8/15/39 | | | 19,039,082 | | | |
| | 11,348,357 | | | 5.0000%, 9/15/39 | | | 12,522,009 | | | |
| | 23,215,540 | | | 5.0000%, 9/15/39 | | | 25,616,125 | | | |
| | 6,258,458 | | | 5.0000%, 10/15/39 | | | 6,855,657 | | | |
| | 9,443,149 | | | 5.0000%, 10/15/39 | | | 10,226,632 | | | |
| | 11,411,899 | | | 5.0000%, 11/15/39 | | | 12,630,989 | | | |
| | 3,279,103 | | | 5.0000%, 1/15/40 | | | 3,629,442 | | | |
| | 2,392,106 | | | 5.0000%, 4/15/40 | | | 2,647,653 | | | |
| | 3,829,159 | | | 5.0000%, 4/15/40 | | | 4,297,169 | | | |
| | 4,227,990 | | | 5.0000%, 5/15/40 | | | 4,649,227 | | | |
| | 9,008,252 | | | 5.0000%, 5/20/40 | | | 9,924,030 | | | |
| | 3,863,116 | | | 5.0000%, 7/15/40 | | | 4,275,816 | | | |
| | 10,910,121 | | | 5.0000%, 7/15/40 | | | 12,075,689 | | | |
| | 13,829,431 | | | 4.5000%, 9/15/40 | | | 15,372,690 | | | |
| | 10,865,534 | | | 5.0000%, 2/15/41 | | | 11,926,147 | | | |
| | 5,046,783 | | | 5.0000%, 4/15/41 | | | 5,753,186 | | | |
| | 10,236,307 | | | 5.5000%, 4/20/41 | | | 11,243,541 | | | |
| | 13,225,979 | | | 4.5000%, 5/15/41 | | | 14,697,020 | | | |
| | 4,482,519 | | | 5.0000%, 5/15/41 | | | 4,948,061 | | | |
| | 2,809,968 | | | 5.0000%, 6/20/41 | | | 3,072,647 | | | |
| | 11,930,421 | | | 5.0000%, 6/20/41 | | | 13,197,995 | | | |
| | 2,755,206 | | | 4.5000%, 7/15/41 | | | 2,955,691 | | | |
| | 10,929,507 | | | 4.5000%, 7/15/41 | | | 11,711,084 | | | |
| | 26,411,847 | | | 4.5000%, 8/15/41 | | | 28,815,582 | | | |
| | 4,008,593 | | | 5.0000%, 9/15/41 | | | 4,373,291 | | | |
| | 3,995,761 | | | 5.5000%, 9/20/41 | | | 4,376,549 | | | |
| | 22,948,736 | | | 5.0000%, 10/15/41 | | | 24,892,239 | | | |
| | 18,144,988 | | | 5.0000%, 10/20/41 | | | 19,748,984 | | | |
| | 1,860,645 | | | 6.0000%, 10/20/41 | | | 2,087,573 | | | |
| | 6,971,843 | | | 6.0000%, 12/20/41 | | | 7,824,830 | | | |
| | 11,666,352 | | | 5.5000%, 1/20/42 | | | 12,767,298 | | | |
| | 5,926,462 | | | 6.0000%, 1/20/42 | | | 6,649,125 | | | |
| | 6,219,673 | | | 6.0000%, 2/20/42 | | | 6,977,957 | | | |
| | 5,022,031 | | | 6.0000%, 3/20/42 | | | 5,631,929 | | | |
| | 20,117,019 | | | 6.0000%, 4/20/42 | | | 22,560,323 | | | |
| | 5,342,496 | | | 3.5000%, 5/20/42 | | | 5,519,326 | | | |
| | 14,392,671 | | | 6.0000%, 5/20/42 | | | 16,151,089 | | | |
| | 23,346,049 | | | 5.5000%, 7/20/42 | | | 25,602,285 | | | |
| | 5,689,783 | | | 6.0000%, 7/20/42 | | | 6,385,264 | | | |
| | 5,651,208 | | | 6.0000%, 8/20/42 | | | 6,341,564 | | | |
| | 6,664,369 | | | 6.0000%, 9/20/42 | | | 7,473,721 | | | |
| | 5,607,372 | | | 6.0000%, 11/20/42 | | | 6,293,365 | | | |
| | 6,041,659 | | | 6.0000%, 2/20/43 | | | 6,775,386 | | | |
| |
| |
| Total Mortgage-Backed Securities (cost $1,476,810,234) | | | 1,463,492,533 | | | |
| |
| |
| Preferred Stock – 0.5% | | | | | | |
| Diversified Financial Services – 0.1% | | | | | | |
| | 236,750 | | | Citigroup Capital XIII
7.8750% | | | 6,593,488 | | | |
| Finance – Credit Card – 0.4% | | | | | | |
| | 955,570 | | | Discover Financial Services
6.5000% | | | 23,984,807 | | | |
| |
| |
| Total Preferred Stock (cost $30,551,400) | | | 30,578,295 | | | |
| |
| |
| U.S. Treasury Notes/Bonds – 22.5% | | | | | | |
| | | | | U.S. Treasury Notes/Bonds: | | | | | | |
| | $11,147,000 | | | 0.2500%, 3/31/14 | | | 11,154,402 | | | |
| | 9,190,000 | | | 0.2500%, 4/30/14 | | | 9,196,102 | | | |
| | 49,092,000 | | | 0.2500%, 5/31/14 | | | 49,120,768 | | | |
| | 119,017,000 | | | 0.2500%, 8/31/14 | | | 119,068,177 | | | |
| | 27,482,000 | | | 0.2500%, 9/15/14 | | | 27,491,674 | | | |
| | 68,999,000 | | | 0.2500%, 9/30/14 | | | 69,023,288 | | | |
| | 9,595,000 | | | 0.2500%, 10/31/14 | | | 9,598,752 | | | |
| | 6,610,000 | | | 0.1250%, 12/31/14 | | | 6,598,122 | | | |
| | 194,592,000 | | | 0.2500%, 1/15/15 | | | 194,554,054 | | | |
| | 128,757,000 | | | 0.1250%, 4/30/15 | | | 128,269,140 | | | |
| | 189,586,000 | | | 0.2500%, 5/31/15 | | | 189,252,708 | | | |
| | 36,441,300 | | | 2.1250%, 5/31/15 | | | 37,676,879 | | | |
| | 5,855,000 | | | 0.3750%, 6/15/15 | | | 5,856,827 | | | |
| | 12,945,000 | | | 0.3750%, 2/15/16 | | | 12,887,356 | | | |
| | 7,657,000 | | | 1.0000%, 8/31/16 | | | 7,716,219 | | | |
| | 11,524,900 | | | 1.0000%, 9/30/16 | | | 11,603,235 | | | |
| | 8,648,500 | | | 1.0000%, 10/31/16 | | | 8,699,855 | | | |
| | 1,188,000 | | | 0.8750%, 11/30/16 | | | 1,188,742 | | | |
| | 115,815,500 | | | 0.8750%, 1/31/17** | | | 115,634,596 | | | |
| | 17,908,000 | | | 0.8750%, 2/28/17 | | | 17,863,230 | | | |
| | 28,415,000 | | | 0.7500%, 6/30/17 | | | 28,059,812 | | | |
| | 9,545,000 | | | 0.7500%, 10/31/17 | | | 9,365,287 | | | |
| | 11,750,000 | | | 0.7500%, 12/31/17 | | | 11,495,718 | | | |
| | 19,120,000 | | | 0.8750%, 1/31/18 | | | 18,779,434 | | | |
| | 14,010,000 | | | 0.7500%, 3/31/18 | | | 13,636,760 | | | |
| | 17,343,100 | | | 2.3750%, 5/31/18 | | | 18,183,165 | | | |
| | 3,846,700 | | | 1.7500%, 10/31/18 | | | 3,900,792 | | | |
| | 10,800,000 | | | 1.0000%, 9/30/19 | | | 10,327,500 | | | |
| | 206,196,000 | | | 1.7500%, 5/15/23 | | | 193,115,338 | | | |
| | 52,460,000 | | | 2.8750%, 5/15/43 | | | 46,427,100 | | | |
| |
| |
| Total U.S. Treasury Notes/Bonds (cost $1,395,301,809) | | | 1,385,745,032 | | | |
| |
| |
| Money Market – 0.7% | | | | | | |
| | 40,073,406 | | | Janus Cash Liquidity Fund LLC, 0%£
(cost $40,073,406) | | | 40,073,406 | | | |
| |
| |
| Total Investments (total cost $6,146,393,206) – 99.9% | | | 6,153,081,131 | | | |
| |
| |
| Cash, Receivables and Other Assets, net of Liabilities – 0.1% | | | 4,347,567 | | | |
| |
| |
| Net Assets – 100% | | $ | 6,157,428,698 | | | |
| |
| |
Summary of Investments by Country – (Long Positions) (unaudited)
| | | | | | | | | |
| | | | | | % of Investment
| |
| Country | | Value | | | Securities | |
| |
| |
| Australia | | $ | 66,048,373 | | | | 1.1% | |
| Canada | | | 20,343,175 | | | | 0.3% | |
| Germany | | | 14,215,242 | | | | 0.2% | |
| Italy | | | 29,742,536 | | | | 0.5% | |
| Japan | | | 4,122,922 | | | | 0.1% | |
| Luxembourg | | | 10,640,362 | | | | 0.2% | |
| Netherlands | | | 39,260,622 | | | | 0.6% | |
| South Korea | | | 55,175,383 | | | | 0.9% | |
| Taiwan | | | 52,145,384 | | | | 0.8% | |
| United Kingdom | | | 73,002,336 | | | | 1.2% | |
United States†† | | | 5,788,384,796 | | | | 94.1% | |
| |
| |
| Total | | $ | 6,153,081,131 | | | | 100.0% | |
| | | |
| †† | | Includes Cash Equivalents of 0.7%. |
See Notes to Schedules of Investments and Other Information and Notes to Financial Statements.
16 | JUNE 30, 2013
Janus Global Bond Fund (unaudited)
| | | | | | | |
Fund Snapshot
We believe a bottom-up, fundamentally-driven investment process that is focused on credit-oriented investments anywhere in the world can generate risk-adjusted outperformance over time.
| |
Gibson Smith
co-portfolio manager | |
Darrell Watters
co-portfolio manager | | 
Chris Diaz
co-portfolio manager |
Performance Summary
During the one-year period ended June 30, 2013, Janus Global Bond Fund’s Class I Shares returned -0.79% compared with -2.18% for the Fund’s primary benchmark, the Barclays Global Aggregate Bond Index, and 2.90% for the Fund’s secondary benchmark, the Barclays Global Aggregate Corporate Bond Index.
Market Environment
The 12 months ended June 30, 2013 were largely characterized by concern about global fiscal policies and their impact on economic growth. Overall, both investment-grade and high-yield corporate credit spreads and mortgage-backed securities (MBS) spreads narrowed during the period. U.S. Treasury bond yields rose, particularly in the final months as U.S. economic data began to improve. The U.S. dollar was mixed over the period, while the euro appreciated modestly and the yen experienced a significant devaluation.
The period began with concern about slow global economic growth, prompting additional stimulus from major central banks including the U.S. Federal Reserve (Fed), the European Central Bank and the Bank of Japan. Toward the end of calendar year 2012, worries grew about the “fiscal cliff,” a potentially recessionary mix of U.S. spending cuts and tax increases scheduled to take effect in January 2013. However, lawmakers delayed some elements of the fiscal cliff until March 2013, softening the impact, and the Fed continued to reiterate support for the markets via quantitative easing (QE) and near-zero interest rates.
By spring, there were signs that economic growth was improving. The U.S. economy seemed to weather the impact of government spending cuts that took effect in March, and U.S. employment data showed strengthening hiring patterns beginning in April. By May, markets were beginning to speculate about the eventual end of the Fed’s QE program, driving up longer-term Treasury yields.
Meanwhile, Japan’s attempts to reflate its economy appeared to be having an effect, with signs of improving exports, rising manufacturing activity and increasing capital spending. Europe’s economy showed signs of stabilization, although growth expectations declined for China. Emerging markets sold off sharply toward the end of the period on signs of slowing Chinese growth and worries that the Fed’s shifting policy stance could shut down the flow of global liquidity that has fueled investment in emerging markets in recent years.
Fund Comments
Our overweight allocation and security selection within corporate credit, as well as our security selection within MBS, were the top contributors to outperformance during the period. Sector contributors were led by banking, noncaptive diversified financial companies and real estate investment trusts (REITs); top sector detractors included property and casualty insurers, supermarkets and transportation services.
Overall, we reduced the Fund’s weighting to corporate credit during the period, as we reacted to changing economic and market factors. Corporate credit represented 43.9% of holdings as of June 30, 2013, down from 53.04% a year earlier, as we opportunistically realized gains and lowered the Fund’s risk profile at various points during the 12 months, including reducing duration and increasing our Treasury weighting. However, we remain bullish on corporate credit in general, and are still significantly overweight to credit compared with the benchmark. We increased exposure to high-yield credit.
Consistent with our process of closely monitoring company fundamentals to drive our allocation decisions, we periodically seek to reduce the Fund’s risk profile. With that goal, we increased U.S. Treasury exposure at various points during the period. We also shifted investment toward the shorter end of the yield curve with the goal to help preserve capital in the face of a potential rise in interest rates. However, our yield curve positioning in Treasurys detracted from relative performance during the
Janus Fixed Income & Money Market Funds | 17
Janus Global Bond Fund (unaudited)
period. While we held an underweight allocation to Treasury securities compared with the benchmark, our Treasury duration (i.e., our sensitivity to rising interest rates) was modestly longer until roughly mid-May.
Our MBS selection also was beneficial to performance, in particular our preference for prepayment-protected, higher-coupon MBS. We have sought to avoid the type of MBS that the Fed has been buying through its $40-billion-per-month MBS purchase program, part of its current QE program. This helped the Fund avoid much of the market volatility sparked by the question of when the Fed might taper QE.
Given that interest rates rose, our small allocation to bank loans, which are designed to reset based on short-term interest rates, contributed to performance. Our security selection within commercial mortgage-backed securities (CMBS) also was a positive contributor, as was our allocation to preferred stock.
We have sharply reduced exposure to the Japanese yen this year, seeking to mitigate portfolio risk in the face of fiscal and monetary policy aimed at stimulating the economy but also driving volatility in Japanese bond and currency markets. Our yen underweight was a strong contributor during the period. On the other hand, our underweight to the euro detracted from relative performance, as Europe’s economy began to show signs of stabilization, if not improvement.
Please see the Derivative Instruments section in the “Notes to Financial Statements” for a discussion of derivatives used by the Fund.
Credit Contributors to Performance
Individual credit contributors were led by General Electric Capital Corp., which provides financing, mortgage and insurance services. GE Capital has undergone a significant balance sheet transformation since the 2007-2008 financial crisis, making significant strides in reducing leverage, increasing reserves, cutting reliance on short-term funding and improving capital. Its management team has been committed to reducing the size of the company, which should reduce debt outstanding and improve the quality of its balance sheet.
UK-based Lloyds Bank was the second-largest contributor during the period, as it began to appear more likely that the UK government may sell off its investment in Lloyds this year. Lloyds has reported positive earnings, and in general there has been macroeconomic improvement in the UK. It also has continued to make progress in improving its balance sheet and reducing noncore assets.
Financial services company Morgan Stanley also contributed. Morgan Stanley has made great strides in improving its balance sheet with capital and liquidity levels at record highs. We view positively the transition toward management’s growth of its wealth management businesses, which should be less capital- and liquidity-intensive and produce lower earnings volatility.
Credit Detractors from Performance
Detractors were led by Red de Carreteras de Occidente, which builds, operates and maintains concessioned highways in Mexico. The company’s bonds were pressured by the sell-off in emerging market debt during the period.
Detractors also included China National Offshore Oil Corp. (CNOOC) Ltd., which through subsidiaries explores, develops, produces and sells crude oil and natural gas. CNOOC declined amid lower growth expectations for China.
ADT Corp. also detracted, partly because we held longer-duration securities that were affected by rising rates in the later part of the period. ADT, which provides home security monitoring services, spun off from Tyco International in 2012. We have continued to find the business model attractive, as the company has long-term contracts that provide stability of earnings and free cash flow.
Outlook
We are keeping a close eye on events in China, which has demonstrated obvious liquidity issues and the potential for slower growth going forward. The economic evolution from an export-driven economy to one of internal production and consumption will undoubtedly continue to produce growing pains. Ultimately we believe that China will settle in at a lower rate of growth than the world would like to see, which at least would calm some of the recent volatility in fixed income markets.
We believe that Japanese Prime Minister Shinzo Abe is on the right track and eventually will succeed in ending Japan’s long-running series of deflationary cycles, leading to a lower yen, but the process will not be smooth. The upper house elections in July will be telling as to the path the Japanese economy will follow. The yen volatility we’ve seen recently is likely to continue in coming months, although we believe the long-term direction will be weaker over time.
Our company discussions and economic data indicate the European economy probably has reached bottom and will begin to improve from here. However, it may be a rocky road over the next few months, with Italian and German
18 | JUNE 30, 2013
(unaudited)
elections in the fall and a Spanish economy that just cannot seem to get traction. Brazil and emerging markets will continue to struggle until they get recent civil unrest under control and stabilize their currencies.
We continue to favor the U.S. dollar over the euro, British pound and yen. Better relative fiscal and economic fundamentals should be supportive for the U.S. dollar, combined with the eventual implementation of QE tapering, providing higher interest rate parity. Countries with lower debt loads and higher growth prospects should have better-performing currencies. We are likely to maintain exposure to smaller G-10 currencies as well as some emerging markets.
The Fed may taper its bond-buying program at some point in the next 12 months, but we believe it will leave short-term interest rates near zero until the U.S. unemployment rate falls to 6.5%; many Fed policymakers do not expect this to happen before 2015, and we take them at their word. Interest rates are likely to remain very low around the globe as central banks continue to distort markets via unconventional policy. Credit, both investment-grade and high-yield, and securitized products should remain well supported as investors continue to reach for yield in a low-yield world. As always, security selection will be critical, perhaps even more so in the next 12 months with yields and spreads at historically low levels.
On behalf of each member of our investment team, thank you for your investment in Janus Global Bond Fund. We appreciate you entrusting us with your assets and look forward to continuing to serve your investment needs.
Janus Fixed Income & Money Market Funds | 19
Janus Global Bond Fund (unaudited)
Janus Global Bond Fund At A Glance
June 30, 2013
| | | |
Weighted Average Maturity | | 6.0 Years |
Average Effective Duration* | | 4.0 Years |
30-day Current Yield** | | |
| Class A Shares at NAV | | |
| Without Reimbursement | | 1.62% |
| With Reimbursement | | 1.61% |
| Class A Shares at MOP | | |
| Without Reimbursement | | 1.54% |
| With Reimbursement | | 1.53% |
| Class C Shares*** | | |
| Without Reimbursement | | 0.81% |
| With Reimbursement | | 0.85% |
| Class D Shares | | |
| Without Reimbursement | | 1.77% |
| With Reimbursement | | 1.72% |
| Class I Shares | | |
| Without Reimbursement | | 1.92% |
| With Reimbursement | | 1.92% |
| Class S Shares | | |
| Without Reimbursement | | 1.42% |
| With Reimbursement | | 1.37% |
| Class T Shares | | |
| Without Reimbursement | | 1.66% |
| With Reimbursement | | 1.61% |
Number of Bonds/Notes | | 242 |
| | | |
| * | | A theoretical measure of price volatility |
| ** | | Yield will fluctuate |
| *** | | Does not include the 1.00% contingent deferred sales charge. |
Ratings†Summary – (% of Fixed Income Securities)
June 30, 2013
| | | |
AAA | | 0.1% |
AA | | 31.0% |
A | | 5.0% |
BBB | | 26.7% |
BB | | 24.7% |
B | | 3.8% |
Other | | 8.7% |
| | | |
| † | | Bond ratings provided by Standard & Poor’s. Not rated securities are not rated by S&P but may be rated by other rating agencies. Bond ratings are measured on a scale that generally ranges from AAA (highest) to D (lowest). |
Significant Areas of Investment – (% of Net Assets)
As of June 30, 2013
Asset Allocation – (% of Net Assets)
As of June 30, 2013
20 | JUNE 30, 2013
(unaudited)
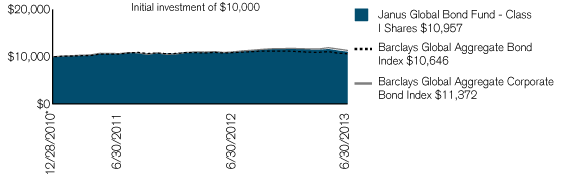
| | | | | | | | | | |
| Average Annual Total Return – for the periods ended June 30, 2013 | | | Expense Ratios – per the October 26, 2012 prospectuses |
| | | One
| | Since
| | | Total Annual Fund
| | Net Annual Fund
|
| | | Year | | Inception* | | | Operating Expenses | | Operating Expenses |
| | | | | | | | | | |
| Janus Global Bond Fund – Class A Shares | | | | | | | | | |
| | | | | | | | | | |
| NAV | | –1.04% | | 3.49% | | | 1.45% | | 1.01% |
| | | | | | | | | | |
| MOP | | –5.72% | | 1.50% | | | | | |
| | | | | | | | | | |
| Janus Global Bond Fund – Class C Shares | | | | | | | | | |
| | | | | | | | | | |
| NAV | | –1.78% | | 2.76% | | | 2.21% | | 1.76% |
| | | | | | | | | | |
| CDSC | | –2.72% | | 2.76% | | | | | |
| | | | | | | | | | |
| Janus Global Bond Fund – Class D Shares(1) | | –0.83% | | 3.61% | | | 1.31% | | 0.91% |
| | | | | | | | | | |
| Janus Global Bond Fund – Class I Shares | | –0.79% | | 3.72% | | | 1.13% | | 0.76% |
| | | | | | | | | | |
| Janus Global Bond Fund – Class S Shares | | –1.17% | | 3.35% | | | 1.62% | | 1.26% |
| | | | | | | | | | |
| Janus Global Bond Fund – Class T Shares | | –1.01% | | 3.51% | | | 1.38% | | 1.01% |
| | | | | | | | | | |
| Barclays Global Aggregate Bond Index | | –2.18% | | 2.53% | | | | | |
| | | | | | | | | | |
| Barclays Global Aggregate Corporate Bond Index | | 2.90% | | 5.27% | | | | | |
| | | | | | | | | | |
| Morningstar Quartile – Class I Shares | | 3rd | | 2nd | | | | | |
| | | | | | | | | | |
| Morningstar Ranking – based on total returns for World Bond Funds | | 191/360 | | 95/311 | | | | | |
| | | | | | | | | | |
| Visit janus.com/advisor/mutual-funds (or janus.com/allfunds if you hold Shares directly with Janus Capital) to view current performance and characteristic information | | | | | |
| | | | | | | | | | |
Returns quoted are past performance and do not guarantee future results; current performance may be lower or higher. Investment returns and principal value will vary; there may be a gain or loss when shares are sold. For the most recent month-end performance call 877.33JANUS(52687) (or 800.525.3713 if you hold shares directly with Janus Capital) or visit janus.com/advisor/mutual-funds (or janus.com/allfunds if you hold shares directly with Janus Capital).
Performance shown for Class A Shares at Maximum Offering Price (MOP) includes the Fund’s maximum sales charge of 4.75%. Performance shown at Net Asset Value (NAV) does not include this charge and would have been lower had this charge been taken into account.
Performance shown for Class C Shares includes a 1% contingent deferred sales charge (CDSC) on periods of less than 12 months. Performance shown at Net Asset Value (NAV) does not include this sales charge and would have been lower had this sales charge been taken into account.
See important disclosures on the next page.
Janus Fixed Income & Money Market Funds | 21
Janus Global Bond Fund (unaudited)
Net expense ratios reflect the expense waiver, if any, Janus Capital has contractually agreed to through November 1, 2013.
The Fund’s performance may be affected by risks that include those associated with non-investment grade debt securities, investments in specific industries or countries and potential conflicts of interest with the Janus “funds of funds.” Additional risks to the Fund may include those associated with investing in foreign securities, emerging markets, initial public offerings (“IPOs”), real estate investment trusts (“REITs”), and derivatives. Please see the Fund’s prospectuses or janus.com/info (or janus.com/reports if you hold shares directly with Janus Capital) for more information about risks, portfolio holdings and other details.
Foreign securities have additional risks including exchange rate changes, political and economic upheaval, the relative lack of information, relatively low market liquidity and the potential lack of strict financial and accounting controls and standards. These risks are magnified in emerging markets. The prices of foreign securities held by the Fund, and therefore the Fund’s performance, may decline in response to such risks.
Funds that invest in bonds have the same interest rate, inflation, and credit risks that are associated with the underlying bonds owned by the Fund. Unlike owning individual bonds, there are ongoing fees and expenses associated with owning shares of Fixed Income Funds. The return of principal is not guaranteed due to net asset value fluctuation that is caused by changes in the price of specific bonds held in the Fund and selling of bonds within the Fund by the portfolio managers.
The Fund invests in mortgage-backed securities. Mortgage-backed securities are subject to prepayment risk (early payoff of mortgages during periods of declining interest rates) and extension risk (extending the duration of mortgage-backed securities during periods of rising interest rates). These risks may increase the volatility of these securities and affect total returns.
The Fund invests in REITs, which may be subject to a higher degree of market risk because of concentration in a specific industry, sector or geographic region. REITs may be subject to risks including, but not limited to: legal, political, liquidity, interest rate risks, a decline in the value of real estate, risks related to general and economic conditions, changes in the value of the underlying property owned by the trust and defaults by borrowers. To the extent the Fund invests in foreign REITs, the Fund may be subject to fluctuations in currency rates or political or economic conditions in a particular country.
High-yield/high-risk bonds, also known as “junk” bonds, involve a greater risk of default and price volatility than investment grade bonds. High-yield/high-risk bonds can experience sudden and sharp price swings which will affect net asset value.
This Fund may have significant exposure to emerging markets. In general, emerging market investments have historically been subject to significant gains and/or losses. As such, the Fund’s returns and NAV may be subject to volatility.
Sovereign debt securities are subject to the additional risk that, under some political, diplomatic, social or economic circumstances, some developing countries that issue lower quality debt securities may be unable or unwilling to make principal or interest payments as they come due.
The Fund may invest in derivatives which can be highly volatile and involve additional risks than if the underlying securities were held directly by the Fund. Such risks include gains or losses which, as a result of leverage, can be substantially greater than the derivatives’ original cost. There is also a possibility that derivatives may not perform as intended which can reduce opportunity for gains or result in losses by offsetting positive returns in other securities the Fund owns.
For a period of three years subsequent to the Fund’s commencement of operations or until the Fund’s assets exceed the first breakpoint in the investment advisory fee schedule, whichever occurs first, Janus Capital may recover from the Fund fees and expenses previously waived or reimbursed, which could then be considered a deferral, if the Fund’s expense ratio, including recovered expenses, falls below the expense limit.
The Fund will normally invest at least 80% of its net assets, measured at the time of purchase, in the type of securities described by its name.
Returns include reinvestment of all dividends and distributions. The returns do not include adjustments in accordance with generally accepted accounting principles required at the period end for financial reporting purposes.
Ranking is for the share class shown only; other classes may have different performance characteristics. When an expense waiver is in effect, it may have a material effect on the total return and yield, and therefore the ranking for the period.
© 2013 Morningstar, Inc. All Rights Reserved.
There is no assurance that the investment process will consistently lead to successful investing.
See Notes to Schedules of Investments and Other Information for index definitions.
The Fund’s portfolio may differ significantly from the securities held in the indices. The indices are unmanaged and are not available for direct investment; therefore, their performance does not reflect the expenses associated with the active management of an actual portfolio.
See “Useful Information About Your Fund Report.”
| | | |
| * | | The Fund’s inception date – December 28, 2010 |
| (1) | | Closed to new investors. |
22 | JUNE 30, 2013
(unaudited)
As a shareholder of the Fund, you incur two types of costs: (1) transaction costs, such as sales charges (loads) on purchase payments (applicable to Class A Shares only); and (2) ongoing costs, including management fees; distribution and shareholder servicing (12b-1) fees; administrative services fees payable pursuant to the Transfer Agency Agreement; and other Fund expenses. This example is intended to help you understand your ongoing costs (in dollars) of investing in the Fund and to compare these costs with the ongoing costs of investing in other mutual funds. To do so, compare this 5% hypothetical example with the 5% hypothetical examples that appear in the shareholder reports of the other funds. The example is based upon an investment of $1,000 invested at the beginning of the period and held for the six-months indicated, unless noted otherwise in the table and footnotes below.
Actual Expenses
The information in the table under the heading “Actual” provides information about actual account values and actual expenses. You may use the information in these columns, together with the amount you invested, to estimate the expenses that you paid over the period. Simply divide your account value by $1,000 (for example, an $8,600 account value divided by $1,000 = 8.6), then multiply the result by the number in the appropriate column for your share class under the heading entitled “Expenses Paid During Period” to estimate the expenses you paid on your account during the period.
Hypothetical Example for Comparison Purposes
The information in the table under the heading “Hypothetical (5% return before expenses)” provides information about hypothetical account values and hypothetical expenses based upon the Fund’s actual expense ratio and an assumed rate of return of 5% per year before expenses, which is not the Fund’s actual return. The hypothetical account values and expenses may not be used to estimate the actual ending account balance or expenses you paid for the period. You may use this information to compare the ongoing costs of investing in the Fund and other funds. To do so, compare this 5% hypothetical example with the 5% hypothetical examples that appear in the shareholder reports of the other funds. Additionally, for an analysis of the fees associated with an investment in any share class or other similar funds, please visit www.finra.org/fundanalyzer.
Please note that the expenses shown in the table are meant to highlight your ongoing costs only and do not reflect any transaction costs. These fees are fully described in the Fund’s prospectuses. Therefore, the hypothetical examples are useful in comparing ongoing costs only, and will not help you determine the relative total costs of owning different funds. In addition, if these transaction costs were included, your costs would have been higher.
| | | | | | | | | | | | | | | | | | | | | | | | | | | | | | | |
| | | | | Hypothetical
| | | | |
| | | Actual | | (5% return before expenses) | | | | |
| | | Beginning
| | Ending
| | Expenses
| | Beginning
| | Ending
| | Expenses
| | | | |
| | | Account
| | Account
| | Paid During
| | Account
| | Account
| | Paid During
| | Net Annualized
| | |
| | | Value
| | Value
| | Period
| | Value
| | Value
| | Period
| | Expense Ratio
| | |
| | | (1/1/13) | | (6/30/13) | | (1/1/13 - 6/30/13)† | | (1/1/13) | | (6/30/13) | | (1/1/13 - 6/30/13)† | | (1/1/13 - 6/30/13) | | |
| |
| |
| Class A Shares | | $ | 1,000.00 | | | $ | 948.10 | | | $ | 4.88 | | | $ | 1,000.00 | | | $ | 1,019.79 | | | $ | 5.06 | | | | 1.01% | | | |
| |
| |
| Class C Shares | | $ | 1,000.00 | | | $ | 943.80 | | | $ | 8.48 | | | $ | 1,000.00 | | | $ | 1,016.07 | | | $ | 8.80 | | | | 1.76% | | | |
| |
| |
| Class D Shares | | $ | 1,000.00 | | | $ | 948.70 | | | $ | 4.30 | | | $ | 1,000.00 | | | $ | 1,020.38 | | | $ | 4.46 | | | | 0.89% | | | |
| |
| |
| Class I Shares | | $ | 1,000.00 | | | $ | 948.50 | | | $ | 3.62 | | | $ | 1,000.00 | | | $ | 1,021.08 | | | $ | 3.76 | | | | 0.75% | | | |
| |
| |
| Class S Shares | | $ | 1,000.00 | | | $ | 948.30 | | | $ | 4.88 | | | $ | 1,000.00 | | | $ | 1,019.79 | | | $ | 5.06 | | | | 1.01% | | | |
| |
| |
| Class T Shares | | $ | 1,000.00 | | | $ | 948.50 | | | $ | 4.59 | | | $ | 1,000.00 | | | $ | 1,020.08 | | | $ | 4.76 | | | | 0.95% | | | |
| |
| |
| | | |
| † | | Expenses Paid During Period are equal to the Net Annualized Expense Ratio multiplied by the average account value over the period, multiplied by the number of days in the most recent six-month period, divided by the number of days in the fiscal year. Expenses in the examples include the effect of applicable fee waivers and/or expense reimbursements, if any. Had such waivers and/or reimbursements not been in effect, your expenses would have been higher. Please refer to the Notes to Financial Statements or the Fund’s prospectuses for more information regarding waivers and/or reimbursements. |
Janus Fixed Income & Money Market Funds | 23
Janus Global Bond Fund
Schedule of Investments
As of June 30, 2013
| | | | | | | | | | | |
| Shares or Principal Amount | | Value | | | |
| |
| Asset-Backed/Commercial Mortgage-Backed Securities – 6.9% | | | | | | |
| $ | 428,000 | | | AmeriCredit Automobile Receivables Trust
3.3800%, 4/9/18 | | $ | 436,963 | | | |
| | 665,000 | | | AmeriCredit Automobile Receivables Trust
2.6800%, 10/9/18 | | | 660,211 | | | |
| | 158,000 | | | Commercial Mortgage Trust
5.6500%, 12/10/49 | | | 161,531 | | | |
| | 877,000 | | | Commercial Mortgage Trust
5.8670%, 12/10/49‡ | | | 939,497 | | | |
| | 860,535 | | | FREMF 2010 K-SCT Mortgage Trust
2.0000%, 1/25/20 § | | | 710,208 | | | |
| | 340,000 | | | FREMF Mortgage Trust
2.8037%, 5/25/19 (144A),‡ | | | 341,799 | | | |
| EUR | 2,086,344 | | | German Residential Asset Note Distributor PLC
2.6500%, 1/20/21 **,‡ | | | 2,693,669 | | | |
| | 205,000 | | | Gracechurch Card Funding PLC
0.8992%, 6/15/17 (144A),**‡ | | | 206,472 | | | |
| | 680,000 | | | GS Mortgage Securities Corp. II
3.5495%, 12/10/27 (144A),‡ | | | 581,429 | | | |
| | 680,000 | | | GS Mortgage Securities Corp. II
2.7982%, 11/8/29 (144A),‡ | | | 678,625 | | | |
| | 1,213,000 | | | GS Mortgage Securities Corp. Trust
3.5510%, 4/10/34 (144A),‡ | | | 1,194,323 | | | |
| | 205,000 | | | JPMorgan Chase Commercial Mortgage Securities Trust
3.9340%, 4/15/30 (144A),‡ | | | 202,284 | | | |
| | 276,000 | | | Santander Drive Auto Receivables Trust
2.5200%, 9/15/16 | | | 272,523 | | | |
| | 89,000 | | | Santander Drive Auto Receivables Trust
3.6400%, 5/15/18 | | | 90,920 | | | |
| | 293,000 | | | Santander Drive Auto Receivables Trust
3.3000%, 9/17/18 | | | 295,513 | | | |
| EUR | 2,330,000 | | | Taurus 2013 GMF1 PLC
2.9609%, 5/21/24 ** | | | 3,009,768 | | | |
| | 737,000 | | | Wachovia Bank Commercial Mortgage Trust
5.3830%, 12/15/43 | | | 776,934 | | | |
| | 530,000 | | | Wachovia Bank Commercial Mortgage Trust
5.5910%, 4/15/47‡ | | | 561,708 | | | |
| GBP | 2,785,668 | | | Windermere XI CMBS PLC
0.7544%, 4/24/17 **,‡ | | | 4,013,778 | | | |
| |
| |
| Total Asset-Backed/Commercial Mortgage-Backed Securities (cost $18,205,048) | | | 17,828,155 | | | |
| |
| |
| Bank Loans – 1.0% | | | | | | |
| Building and Construction Products – Miscellaneous – 0.9% | | | | | | |
| | 2,499,000 | | | American Builders & Contractors Supply Co., Inc.
3.5000%, 4/16/20‡ | | | 2,478,383 | | | |
| Casino Hotels – 0.1% | | | | | | |
| | 149,250 | | | MGM Resorts International
3.5000%, 12/20/19‡ | | | 148,131 | | | |
| Pharmaceuticals – 0% | | | | | | |
| | 72,649 | | | Quintiles Transnational Corp.
4.5000%, 6/8/18‡ | | | 72,558 | | | |
| |
| |
| Total Bank Loans (cost $2,720,204) | | | 2,699,072 | | | |
| |
| |
| Corporate Bonds – 43.9% | | | | | | |
| Advertising Agencies – 0.2% | | | | | | |
| GBP | 350,000 | | | WPP 2012, Ltd.
6.0000%, 4/4/17 ** | | | 601,364 | | | |
| Aerospace and Defense – Equipment – 0.4% | | | | | | |
| | 440,000 | | | Exelis, Inc.
4.2500%, 10/1/16 | | | 463,919 | | | |
| | 457,000 | | | TransDigm, Inc.
7.7500%, 12/15/18 | | | 480,992 | | | |
| | | | | | | | 944,911 | | | |
| Airport Development – Maintenance – 1.1% | | | | | | |
| EUR | 1,876,000 | | | DAA Finance PLC
6.5872%, 7/9/18 ** | | | 2,795,663 | | | |
| Automotive – Cars and Light Trucks – 3.0% | | | | | | |
| GBP | 2,261,000 | | | Jaguar Land Rover Automotive PLC
8.1250%, 5/15/18 ** | | | 3,743,463 | | | |
| EUR | 2,999,000 | | | Renault S.A.
4.6250%, 9/18/17 ** | | | 4,033,494 | | | |
| | | | | | | | 7,776,957 | | | |
| Banking – 0.2% | | | | | | |
| EUR | 500,000 | | | Banco BPI S.A.
3.2500%, 1/15/15 ** | | | 657,158 | | | |
| Building – Heavy Construction – 0.7% | | | | | | |
| MXN | 24,500,000 | | | Red de Carreteras de Occidente S.A.P.I.B. de C.V.
9.0000%, 6/10/28 (144A),** | | | 1,779,070 | | | |
| Casino Hotels – 0.7% | | | | | | |
| | 305,000 | | | MGM Resorts International
6.6250%, 7/15/15 | | | 325,206 | | | |
| | 364,000 | | | MGM Resorts International
7.5000%, 6/1/16 | | | 396,760 | | | |
| | 622,000 | | | MGM Resorts International
7.6250%, 1/15/17 | | | 679,535 | | | |
| | 432,000 | | | Wynn Las Vegas LLC / Wynn Las Vegas Capital Corp.
4.2500%, 5/30/23 (144A) | | | 399,600 | | | |
| | | | | | | | 1,801,101 | | | |
| Cellular Telecommunications – 0.3% | | | | | | |
| | 743,000 | | | Sprint Nextel Corp.
7.0000%, 8/15/20 | | | 780,150 | | | |
| Chemicals – Diversified – 0.6% | | | | | | |
| | 1,365,000 | | | LyondellBasell Industries N.V.
5.0000%, 4/15/19 | | | 1,485,251 | | | |
| Chemicals – Specialty – 0.7% | | | | | | |
| | 498,000 | | | Ashland, Inc.
3.8750%, 4/15/18 (144A) | | | 493,020 | | | |
| | 516,000 | | | Ashland, Inc.
4.7500%, 8/15/22 (144A) | | | 510,840 | | | |
| | 727,000 | | | Ashland, Inc.
6.8750%, 5/15/43 (144A) | | | 741,540 | | | |
| | | | | | | | 1,745,400 | | | |
See Notes to Schedules of Investments and Other Information and Notes to Financial Statements.
24 | JUNE 30, 2013
Schedule of Investments
As of June 30, 2013
| | | | | | | | | | | |
| Shares or Principal Amount | | Value | | | |
| |
| Commercial Banks – 5.8% | | | | | | |
| EUR | 1,404,000 | | | Bank of Ireland
10.0000%, 2/12/20 ** | | $ | 1,955,320 | | | |
| EUR | 1,400,000 | | | Bank of Ireland Mortgage Bank
2.7500%, 3/22/18 ** | | | 1,800,609 | | | |
| EUR | 1,400,000 | | | BBVA Senior Finance SAU
4.3750%, 9/21/15 ** | | | 1,886,966 | | | |
| $ | 1,641,000 | | | BBVA U.S. Senior SAU
4.6640%, 10/9/15 ** | | | 1,690,432 | | | |
| | 112,000 | | | CIT Group, Inc.
4.7500%, 2/15/15 (144A) | | | 113,820 | | | |
| | 1,560,000 | | | CIT Group, Inc.
4.2500%, 8/15/17 | | | 1,567,800 | | | |
| | 276,000 | | | CIT Group, Inc.
6.6250%, 4/1/18 (144A) | | | 298,080 | | | |
| | 1,359,000 | | | CIT Group, Inc.
5.5000%, 2/15/19 (144A) | | | 1,403,167 | | | |
| | 1,365,000 | | | Intesa Sanpaolo SpA
3.8750%, 1/16/18 ** | | | 1,310,688 | | | |
| | 1,071,000 | | | SVB Financial Group
5.3750%, 9/15/20 | | | 1,172,211 | | | |
| | 516,000 | | | Zions Bancorp
4.5000%, 3/27/17 | | | 545,693 | | | |
| | 1,225,000 | | | Zions Bancorp
5.8000%, 12/15/99‡ | | | 1,151,500 | | | |
| | | | | | | | 14,896,286 | | | |
| Computer Aided Design – 0.1% | | | | | | |
| | 393,000 | | | Autodesk, Inc.
1.9500%, 12/15/17 | | | 383,419 | | | |
| Consulting Services – 0.5% | | | | | | |
| | 522,000 | | | Verisk Analytics, Inc.
4.8750%, 1/15/19 | | | 559,372 | | | |
| | 746,000 | | | Verisk Analytics, Inc.
5.8000%, 5/1/21 ** | | | 823,401 | | | |
| | | | | | | | 1,382,773 | | | |
| Dialysis Centers – 0.2% | | | | | | |
| | 416,000 | | | Fresenius Medical Care U.S. Finance II, Inc.
5.8750%, 1/31/22 (144A),** | | | 437,840 | | | |
| Diversified Banking Institutions – 3.1% | | | | | | |
| | 30,000 | | | Bank of America Corp.
4.5000%, 4/1/15 | | | 31,468 | | | |
| | 30,000 | | | Bank of America Corp.
3.6250%, 3/17/16 | | | 31,338 | | | |
| | 785,000 | | | Bank of America Corp.
3.7500%, 7/12/16 | | | 822,902 | | | |
| | 375,000 | | | Bank of America Corp.
2.0000%, 1/11/18 | | | 363,230 | | | |
| | 667,000 | | | Bank of America Corp.
8.0000%, 7/30/99‡ | | | 742,871 | | | |
| | 113,000 | | | Bank of America Corp.
8.1250%, 11/15/99‡ | | | 127,125 | | | |
| | 364,000 | | | Goldman Sachs Group, Inc.
5.6250%, 1/15/17 | | | 394,498 | | | |
| | 1,554,000 | | | Goldman Sachs Group, Inc.
2.3750%, 1/22/18 | | | 1,525,767 | | | |
| EUR | 350,000 | | | Morgan Stanley
4.0000%, 11/17/15 | | | 480,266 | | | |
| EUR | 702,000 | | | Morgan Stanley
3.7500%, 9/21/17 | | | 962,365 | | | |
| EUR | 703,000 | | | Morgan Stanley
2.2500%, 3/12/18 | | | 900,617 | | | |
| | 977,000 | | | Morgan Stanley
2.1250%, 4/25/18 | | | 935,019 | | | |
| EUR | 350,000 | | | Morgan Stanley
5.3750%, 8/10/20 | | | 513,156 | | | |
| | 176,000 | | | Royal Bank of Scotland Group PLC
2.5500%, 9/18/15 ** | | | 178,950 | | | |
| | | | | | | | 8,009,572 | | | |
| Diversified Financial Services – 1.2% | | | | | | |
| | 65,000 | | | General Electric Capital Corp.
6.3750%, 11/15/67‡ | | | 67,600 | | | |
| | 700,000 | | | General Electric Capital Corp.
6.2500%, 12/15/99‡ | | | 743,750 | | | |
| | 2,100,000 | | | General Electric Capital Corp.
7.1250%, 12/15/99‡ | | | 2,373,000 | | | |
| | | | | | | | 3,184,350 | | | |
| Diversified Minerals – 0.2% | | | | | | |
| | 645,000 | | | FMG Resources (August 2006) Pty, Ltd.
7.0000%, 11/1/15 (144A) | | | 651,450 | | | |
| Diversified Operations – 0.6% | | | | | | |
| | 364,000 | | | GE Capital Trust I
6.3750%, 11/15/67‡ | | | 377,195 | | | |
| | 1,140,000 | | | Ingersoll-Rand Global Holding Co., Ltd.
4.2500%, 6/15/23 (144A) | | | 1,132,841 | | | |
| | | | | | | | 1,510,036 | | | |
| Electric – Integrated – 0.2% | | | | | | |
| | 605,000 | | | PPL WEM Holdings PLC
3.9000%, 5/1/16 (144A) | | | 632,283 | | | |
| Electric – Transmission – 0.1% | | | | | | |
| GBP | 210,000 | | | SPI Australia Assets Pty, Ltd.
5.1250%, 2/11/21 ** | | | 351,787 | | | |
| Electronic Connectors – 0.2% | | | | | | |
| | 433,000 | | | Amphenol Corp.
4.0000%, 2/1/22 | | | 432,109 | | | |
| Electronic Measuring Instruments – 0.4% | | | | | | |
| | 1,008,000 | | | FLIR Systems, Inc.
3.7500%, 9/1/16 | | | 1,041,871 | | | |
| Engineering – Research and Development Services – 0.5% | | | | | | |
| | 633,000 | | | URS Corp.
4.3500%, 4/1/17 (144A) | | | 644,861 | | | |
| | 610,000 | | | URS Corp.
5.5000%, 4/1/22 (144A) | | | 629,455 | | | |
| | | | | | | | 1,274,316 | | | |
| Finance – Auto Loans – 0.8% | | | | | | |
| | 1,365,000 | | | Ford Motor Credit Co. LLC
3.0000%, 6/12/17 | | | 1,367,877 | | | |
| | 368,000 | | | General Motors Financial Co., Inc.
3.2500%, 5/15/18 (144A) | | | 357,880 | | | |
| | 512,000 | | | General Motors Financial Co., Inc.
4.2500%, 5/15/23 (144A) | | | 476,800 | | | |
| | | | | | | | 2,202,557 | | | |
See Notes to Schedules of Investments and Other Information and Notes to Financial Statements.
Janus Fixed Income & Money Market Funds | 25
Janus Global Bond Fund
Schedule of Investments
As of June 30, 2013
| | | | | | | | | | | |
| Shares or Principal Amount | | Value | | | |
| |
| Finance – Credit Card – 0% | | | | | | |
| $ | 18,000 | | | American Express Co.
6.8000%, 9/1/66‡ | | $ | 19,215 | | | |
| Finance – Investment Bankers/Brokers – 1.0% | | | | | | |
| | 434,000 | | | Lazard Group LLC
7.1250%, 5/15/15 | | | 471,263 | | | |
| | 2,092,000 | | | Raymond James Financial, Inc.
5.6250%, 4/1/24 | | | 2,203,366 | | | |
| | | | | | | | 2,674,629 | | | |
| Finance – Leasing Companies – 0.7% | | | | | | |
| | 1,772,000 | | | LeasePlan Corp. N.V.
2.5000%, 5/16/18 (144A),** | | | 1,707,696 | | | |
| Finance – Other Services – 0.4% | | | | | | |
| | 1,016,000 | | | CNH Capital LLC
3.6250%, 4/15/18 (144A) | | | 967,740 | | | |
| Food – Miscellaneous/Diversified – 0.1% | | | | | | |
| | 251,000 | | | Hawk Acquisition Sub, Inc.
4.2500%, 10/15/20 (144A) | | | 240,019 | | | |
| Food – Retail – 0.5% | | | | | | |
| | 212,000 | | | Safeway, Inc.
3.9500%, 8/15/20 | | | 207,889 | | | |
| | 997,000 | | | Safeway, Inc.
4.7500%, 12/1/21 | | | 1,015,778 | | | |
| | | | | | | | 1,223,667 | | | |
| Investment Management and Advisory Services – 0.9% | | | | | | |
| | 47,000 | | | Ameriprise Financial, Inc.
7.5180%, 6/1/66‡ | | | 51,348 | | | |
| | 1,576,000 | | | Neuberger Berman Group LLC / Neuberger Berman Finance Corp.
5.6250%, 3/15/20 (144A) | | | 1,631,160 | | | |
| | 598,000 | | | Neuberger Berman Group LLC / Neuberger Berman Finance Corp.
5.8750%, 3/15/22 (144A) | | | 609,960 | | | |
| | | | | | | | 2,292,468 | | | |
| Life and Health Insurance – 0.4% | | | | | | |
| | 919,000 | | | Primerica, Inc.
4.7500%, 7/15/22 | | | 972,367 | | | |
| Medical – Biomedical and Genetic – 0.6% | | | | | | |
| | 1,318,000 | | | Life Technologies Corp.
6.0000%, 3/1/20 | | | 1,484,818 | | | |
| Medical – Drugs – 0.7% | | | | | | |
| | 869,000 | | | CFR International SpA
5.1250%, 12/6/22 (144A) | | | 851,602 | | | |
| | 836,000 | | | VPII Escrow Corp.
6.7500%, 8/15/18 (144A) | | | 856,900 | | | |
| | | | | | | | 1,708,502 | | | |
| Medical Equipment – 0.3% | | | | | | |
| EUR | 592,000 | | | FMC Finance VIII S.A.
5.2500%, 7/31/19 ** | | | 848,851 | | | |
| Money Center Banks – 1.6% | | | | | | |
| EUR | 2,818,000 | | | Lloyds TSB Bank PLC
6.5000%, 3/24/20 ** | | | 4,018,450 | | | |
| Multi-Line Insurance – 1.1% | | | | | | |
| EUR | 300,000 | | | American International Group Inc.
8.0000%, 5/22/38‡ | | | 452,049 | | | |
| EUR | 50,000 | | | American International Group, Inc.
8.0000%, 5/22/38 (144A),‡ | | | 75,341 | | | |
| | 1,024,000 | | | American International Group, Inc.
8.1750%, 5/15/58‡ | | | 1,249,280 | | | |
| | 482,000 | | | ING U.S., Inc.
2.9000%, 2/15/18 (144A) | | | 484,425 | | | |
| | 530,000 | | | ING U.S., Inc.
5.6500%, 5/15/53 (144A),‡ | | | 498,200 | | | |
| | 102,000 | | | Loews Corp.
2.6250%, 5/15/23 | | | 92,778 | | | |
| | | | | | | | 2,852,073 | | | |
| Oil – Field Services – 0.6% | | | | | | |
| | 1,365,000 | | | Korea National Oil Corp.
4.0000%, 10/27/16 (144A),** | | | 1,443,493 | | | |
| Oil and Gas Drilling – 0.4% | | | | | | |
| | 674,000 | | | Nabors Industries, Inc.
5.0000%, 9/15/20 | | | 687,082 | | | |
| | 311,000 | | | Rowan Cos., Inc.
5.0000%, 9/1/17 | | | 336,128 | | | |
| | | | | | | | 1,023,210 | | | |
| Oil Companies – Exploration and Production – 3.4% | | | | | | |
| | 2,431,000 | | | Chesapeake Energy Corp.
5.3750%, 6/15/21 | | | 2,418,845 | | | |
| | 765,000 | | | Cimarex Energy Co.
5.8750%, 5/1/22 | | | 791,775 | | | |
| | 1,400,000 | | | CNOOC Finance 2012, Ltd.
3.8750%, 5/2/22 (144A) | | | 1,351,781 | | | |
| | 113,000 | | | Continental Resources, Inc.
7.1250%, 4/1/21 | | | 124,300 | | | |
| | 850,000 | | | Continental Resources, Inc.
5.0000%, 9/15/22 | | | 864,875 | | | |
| | 705,000 | | | Harvest Operations Corp.
6.8750%, 10/1/17 | | | 786,075 | | | |
| | 545,000 | | | Petrohawk Energy Corp.
10.5000%, 8/1/14 | | | 572,795 | | | |
| | 331,000 | | | Plains Exploration & Production Co.
6.5000%, 11/15/20 | | | 350,928 | | | |
| | 1,146,000 | | | Plains Exploration & Production Co.
6.8750%, 2/15/23 | | | 1,226,108 | | | |
| | 270,000 | | | Whiting Petroleum Corp.
6.5000%, 10/1/18 | | | 285,525 | | | |
| | | | | | | | 8,773,007 | | | |
| Oil Companies – Integrated – 0% | | | | | | |
| EUR | 50,000 | | | BP Capital Markets PLC
3.8300%, 10/6/17 ** | | | 71,525 | | | |
| Paper and Related Products – 1.1% | | | | | | |
| EUR | 2,060,000 | | | WEPA Hygieneprodukte GmbH
6.5000%, 5/15/20 ** | | | 2,749,473 | | | |
| Pipelines – 2.6% | | | | | | |
| | 1,213,000 | | | DCP Midstream Operating L.P.
4.9500%, 4/1/22 | | | 1,243,354 | | | |
| | 862,000 | | | El Paso LLC
7.0000%, 6/15/17 | | | 937,131 | | | |
| | 3,269,000 | | | Kinder Morgan Finance Co. LLC
5.7000%, 1/5/16 ** | | | 3,501,413 | | | |
| | 899,000 | | | Western Gas Partners L.P.
5.3750%, 6/1/21 | | | 964,682 | | | |
| | | | | | | | 6,646,580 | | | |
See Notes to Schedules of Investments and Other Information and Notes to Financial Statements.
26 | JUNE 30, 2013
Schedule of Investments
As of June 30, 2013
| | | | | | | | | | | |
| Shares or Principal Amount | | Value | | | |
| |
| Property Trust – 0.2% | | | | | | |
| EUR | 338,000 | | | Prologis International Funding S.A.
5.8750%, 10/23/14 ** | | $ | 456,406 | | | |
| Real Estate Management/Services – 0.4% | | | | | | |
| $ | 1,038,000 | | | Jones Lang LaSalle, Inc.
4.4000%, 11/15/22 | | | 1,018,561 | | | |
| REIT – Diversified – 1.9% | | | | | | |
| | 897,000 | | | American Tower Trust I
1.5510%, 3/15/18 (144A) | | | 881,461 | | | |
| EUR | 2,100,000 | | | GELF Bond Issuer I S.A.
3.1250%, 4/3/18 ** | | | 2,707,375 | | | |
| | 1,120,000 | | | Goodman Funding Pty, Ltd.
6.3750%, 11/12/20 (144A) | | | 1,248,139 | | | |
| | | | | | | | 4,836,975 | | | |
| REIT – Office Property – 0.4% | | | | | | |
| | 623,000 | | | Alexandria Real Estate Equities, Inc.
4.6000%, 4/1/22 | | | 634,917 | | | |
| | 352,000 | | | SL Green Realty Corp. / SL Green Operating Partnership / Reckson Operating Partnership
5.0000%, 8/15/18 | | | 374,776 | | | |
| | | | | | | | 1,009,693 | | | |
| Retail – Restaurants – 0.2% | | | | | | |
| | 685,000 | | | Brinker International, Inc.
3.8750%, 5/15/23 | | | 642,399 | | | |
| Security Services – 0.3% | | | | | | |
| | 971,000 | | | ADT Corp.
4.1250%, 6/15/23 | | | 914,596 | | | |
| Semiconductor Components/Integrated Circuits – 0.9% | | | | | | |
| | 2,355,000 | | | TSMC Global, Ltd.
1.6250%, 4/3/18 (144A) | | | 2,263,972 | | | |
| Steel – Producers – 0.3% | | | | | | |
| | 487,000 | | | ArcelorMittal
5.0000%, 2/25/17 ** | | | 493,088 | | | |
| | 323,000 | | | Steel Dynamics, Inc.
5.2500%, 4/15/23 (144A) | | | 316,540 | | | |
| | | | | | | | 809,628 | | | |
| Super-Regional Banks – 0.2% | | | | | | |
| | 375,000 | | | Wells Fargo & Co.
7.9800%, 9/15/99‡ | | | 423,750 | | | |
| Telecommunication Services – 0.2% | | | | | | |
| | 487,000 | | | SBA Tower Trust
2.9330%, 12/15/17 (144A) | | | 491,464 | | | |
| Telephone – Integrated – 0.7% | | | | | | |
| | 1,137,000 | | | Qwest Communications International, Inc.
7.1250%, 4/1/18 | | | 1,179,638 | | | |
| | 400,000 | | | Softbank Corp.
4.5000%, 4/15/20 (144A),** | | | 385,500 | | | |
| | 323,000 | | | Sprint Capital Corp.
6.9000%, 5/1/19 | | | 335,920 | | | |
| | | | | | | | 1,901,058 | | | |
| |
| |
| Total Corporate Bonds (cost $115,627,303) | | | 113,243,959 | | | |
| |
| |
| Foreign Government Bonds – 16.0% | | | | | | |
| EUR | 1,055,000 | | | Bank of Ireland
4.0000%, 1/28/15 ** | | | 1,408,589 | | | |
| EUR | 2,042,000 | | | Bank of Ireland
2.7500%, 6/5/16 ** | | | 2,571,649 | | | |
| | 1,400,000 | | | Bermuda Government International Bond
4.1380%, 1/3/23 (144A) | | | 1,379,000 | | | |
| EUR | 2,220,000 | | | Ireland Government Bond
3.9000%, 3/20/23 ** | | | 2,842,076 | | | |
| EUR | 4,171,000 | | | Italy Buoni Poliennali Del Tesoro
2.7500%, 12/1/15 ** | | | 5,479,072 | | | |
| EUR | 957,000 | | | Italy Buoni Poliennali Del Tesoro
4.7500%, 6/1/17 ** | | | 1,314,732 | | | |
| EUR | 2,018,000 | | | Italy Buoni Poliennali Del Tesoro
4.5000%, 5/1/23 ** | | | 2,626,441 | | | |
| PHP | 109,000,000 | | | Philippine Government International Bond
3.9000%, 11/26/22 | | | 2,347,343 | | | |
| EUR | 7,134,000 | | | Portugal Obrigacoes do Tesouro OT
3.6000%, 10/15/14 ** | | | 9,299,808 | | | |
| EUR | 1,131,000 | | | Portugal Obrigacoes do Tesouro OT
4.9500%, 10/25/23 ** | | | 1,312,881 | | | |
| EUR | 5,502,000 | | | Spain Government Bond
2.7500%, 3/31/15 ** | | | 7,216,031 | | | |
| EUR | 352,000 | | | Spain Government Bond
4.0000%, 7/30/15 ** | | | 471,370 | | | |
| EUR | 824,000 | | | Spain Government Bond
3.2500%, 4/30/16 ** | | | 1,083,101 | | | |
| EUR | 474,000 | | | Spain Government Bond
4.2500%, 10/31/16 ** | | | 638,062 | | | |
| EUR | 997,000 | | | Spain Government Bond
4.4000%, 10/31/23 (144A),** | | | 1,260,141 | | | |
| |
| |
| Total Foreign Government Bonds (cost $41,865,370) | | | 41,250,296 | | | |
| |
| |
| Mortgage-Backed Securities – 13.7% | | | | | | |
| | | | | Fannie Mae: | | | | | | |
| | 285,283 | | | 5.5000%, 1/1/25 | | | 307,937 | | | |
| | 641,479 | | | 5.0000%, 9/1/29 | | | 694,617 | | | |
| | 175,612 | | | 5.5000%, 1/1/33 | | | 193,672 | | | |
| | 94,462 | | | 5.0000%, 11/1/33 | | | 102,198 | | | |
| | 180,257 | | | 5.0000%, 12/1/33 | | | 195,005 | | | |
| | 93,084 | | | 5.0000%, 2/1/34 | | | 100,699 | | | |
| | 1,923,698 | | | 5.5000%, 7/1/35 | | | 2,109,155 | | | |
| | 281,829 | | | 5.0000%, 10/1/35 | | | 303,744 | | | |
| | 295,519 | | | 5.5000%, 1/1/36 | | | 322,301 | | | |
| | 204,838 | | | 6.0000%, 2/1/37 | | | 230,045 | | | |
| | 943,648 | | | 5.5000%, 5/1/37 | | | 1,039,074 | | | |
| | 220,788 | | | 6.0000%, 5/1/37 | | | 240,260 | | | |
| | 197,795 | | | 5.5000%, 7/1/37 | | | 214,521 | | | |
| | 848,761 | | | 6.0000%, 9/1/37 | | | 928,437 | | | |
| | 172,995 | | | 5.5000%, 3/1/38 | | | 190,725 | | | |
| | 227,380 | | | 6.0000%, 11/1/38 | | | 247,434 | | | |
| | 553,933 | | | 6.0000%, 11/1/38 | | | 604,073 | | | |
| | 873,213 | | | 6.0000%, 10/1/39 | | | 966,916 | | | |
| | 664,888 | | | 5.0000%, 6/1/40 | | | 730,877 | | | |
| | 1,472,020 | | | 5.0000%, 8/1/40 | | | 1,605,065 | | | |
| | 181,434 | | | 4.5000%, 10/1/40 | | | 195,489 | | | |
| | 238,019 | | | 4.0000%, 12/1/40 | | | 249,455 | | | |
| | 1,579,173 | | | 5.0000%, 2/1/41 | | | 1,728,450 | | | |
| | 179,157 | | | 5.0000%, 3/1/41 | | | 197,721 | | | |
| | 278,501 | | | 4.5000%, 4/1/41 | | | 300,680 | | | |
| | 434,391 | | | 4.5000%, 4/1/41 | | | 465,375 | | | |
| | 327,610 | | | 5.0000%, 4/1/41 | | | 358,597 | | | |
See Notes to Schedules of Investments and Other Information and Notes to Financial Statements.
Janus Fixed Income & Money Market Funds | 27
Janus Global Bond Fund
Schedule of Investments
As of June 30, 2013
| | | | | | | | | | | |
| Shares or Principal Amount | | Value | | | |
| |
| Mortgage-Backed Securities – (continued) | | | | | | |
| | | | | Fannie Mae: (continued) | | | | | | |
| $ | 466,639 | | | 5.0000%, 4/1/41 | | $ | 515,140 | | | |
| | 250,333 | | | 5.0000%, 5/1/41 | | | 276,389 | | | |
| | 922,512 | | | 4.5000%, 6/1/41 | | | 998,952 | | | |
| | 590,448 | | | 4.5000%, 8/1/41 | | | 633,381 | | | |
| | 728,848 | | | 4.5000%, 10/1/41 | | | 779,169 | | | |
| | 458,089 | | | 5.0000%, 10/1/41 | | | 499,088 | | | |
| | | | | Freddie Mac: | | | | | | |
| | 196,015 | | | 5.0000%, 1/1/19 | | | 207,178 | | | |
| | 184,872 | | | 5.0000%, 2/1/19 | | | 195,401 | | | |
| | 251,782 | | | 5.5000%, 8/1/19 | | | 268,965 | | | |
| | 287,411 | | | 5.0000%, 6/1/20 | | | 307,895 | | | |
| | 614,250 | | | 5.5000%, 12/1/28 | | | 671,925 | | | |
| | 252,747 | | | 5.0000%, 11/1/36 | | | 270,281 | | | |
| | 335,853 | | | 6.0000%, 1/1/38 | | | 364,759 | | | |
| | 120,170 | | | 5.5000%, 5/1/38 | | | 130,992 | | | |
| | 383,963 | | | 5.5000%, 10/1/39 | | | 419,925 | | | |
| | 414,713 | | | 4.5000%, 1/1/41 | | | 444,855 | | | |
| | 892,702 | | | 5.0000%, 5/1/41 | | | 980,238 | | | |
| | 139,109 | | | 4.5000%, 9/1/41 | | | 149,667 | | | |
| | | | | Ginnie Mae: | | | | | | |
| | 359,153 | | | 6.0000%, 11/20/34 | | | 400,423 | | | |
| | 187,984 | | | 5.5000%, 9/15/35 | | | 210,893 | | | |
| | 506,063 | | | 5.5000%, 3/15/36 | | | 556,810 | | | |
| | 260,905 | | | 5.5000%, 5/20/36 | | | 287,280 | | | |
| | 225,145 | | | 6.0000%, 1/20/39 | | | 253,100 | | | |
| | 257,614 | | | 5.0000%, 4/15/39 | | | 279,210 | | | |
| | 359,901 | | | 5.0000%, 10/15/39 | | | 394,244 | | | |
| | 592,551 | | | 5.0000%, 11/15/39 | | | 655,851 | | | |
| | 166,650 | | | 5.0000%, 1/15/40 | | | 184,455 | | | |
| | 120,932 | | | 5.0000%, 4/15/40 | | | 133,851 | | | |
| | 193,553 | | | 5.0000%, 4/15/40 | | | 217,210 | | | |
| | 214,294 | | | 5.0000%, 5/15/40 | | | 235,644 | | | |
| | 260,517 | | | 5.0000%, 5/20/40 | | | 287,002 | | | |
| | 195,548 | | | 5.0000%, 7/15/40 | | | 216,438 | | | |
| | 566,694 | | | 5.0000%, 7/15/40 | | | 627,236 | | | |
| | 626,904 | | | 5.0000%, 2/15/41 | | | 688,097 | | | |
| | 259,522 | | | 5.0000%, 5/15/41 | | | 286,475 | | | |
| | 156,300 | | | 4.5000%, 7/15/41 | | | 167,673 | | | |
| | 186,848 | | | 5.0000%, 9/15/41 | | | 203,847 | | | |
| | 182,769 | | | 5.5000%, 9/20/41 | | | 200,186 | | | |
| | 832,446 | | | 5.0000%, 10/20/41 | | | 906,034 | | | |
| | 82,313 | | | 6.0000%, 10/20/41 | | | 92,351 | | | |
| | 317,479 | | | 6.0000%, 12/20/41 | | | 356,322 | | | |
| | 271,401 | | | 6.0000%, 1/20/42 | | | 304,495 | | | |
| | 273,931 | | | 6.0000%, 2/20/42 | | | 307,328 | | | |
| | 204,242 | | | 6.0000%, 3/20/42 | | | 229,046 | | | |
| | 481,184 | | | 6.0000%, 4/20/42 | | | 539,626 | | | |
| | 658,254 | | | 6.0000%, 5/20/42 | | | 738,675 | | | |
| | 1,067,985 | | | 5.5000%, 7/20/42 | | | 1,171,199 | | | |
| | 261,971 | | | 6.0000%, 7/20/42 | | | 293,992 | | | |
| | 268,333 | | | 6.0000%, 8/20/42 | | | 301,113 | | | |
| | 309,191 | | | 6.0000%, 9/20/42 | | | 346,740 | | | |
| | 259,698 | | | 6.0000%, 2/20/43 | | | 291,237 | | | |
| |
| |
| Total Mortgage-Backed Securities (cost $35,648,730) | | | 35,300,805 | | | |
| |
| |
| Preferred Stock – 0.4% | | | | | | |
| Finance – Credit Card – 0.4% | | | | | | |
| | 41,400 | | | Discover Financial Services, 6.5000% (cost $1,065,738) | | | 1,039,140 | | | |
| |
| |
| U.S. Treasury Notes/Bonds – 13.5% | | | | | | |
| | | | | U.S. Treasury Notes/Bonds: | | | | | | |
| $ | 22,931,000 | | | 0.2500%, 1/15/15 | | | 22,926,529 | | | |
| | 8,049,000 | | | 0.2500%, 5/31/15 | | | 8,034,850 | | | |
| | 199,000 | | | 0.8750%, 1/31/18 | | | 195,455 | | | |
| | 1,225,000 | | | 0.7500%, 3/31/18 | | | 1,192,365 | | | |
| | 691,000 | | | 1.7500%, 5/15/23 | | | 647,164 | | | |
| | 2,211,000 | | | 2.8750%, 5/15/43 | | | 1,956,735 | | | |
| |
| |
| Total U.S. Treasury Notes/Bonds (cost $34,983,734) | | | 34,953,098 | | | |
| |
| |
| Money Market – 5.3% | | | | | | |
| | 13,731,000 | | | Janus Cash Liquidity Fund LLC, 0%£
(cost $13,731,000) | | | 13,731,000 | | | |
| |
| |
| Total Investments (total cost $263,847,127) – 100.7% | | | 260,045,525 | | | |
| |
| |
| Liabilities, net of Cash, Receivables and Other Assets– (0.7)% | | | (1,861,855) | | | |
| |
| |
| Net Assets – 100% | | $ | 258,183,670 | | | |
| |
| |
Forward Currency Contracts, Open
| | | | | | | | | | | | | |
| | | Currency Units
| | | | | | Unrealized
| |
| | | Sold/
| | | Currency
| | | Appreciation/
| |
| Counterparty/Currency and Settlement Date | | (Purchased) | | | Value U.S. $ | | | (Depreciation) | |
| | |
| JPMorgan Chase & Co.: | | | | | | | | | | | | |
| British Pound 8/2/13 | | | 711,000 | | | $ | 1,080,960 | | | $ | 15,350 | |
| Canadian Dollar 8/2/13 | | | (10,895,000) | | | | (10,353,926) | | | | 20,152 | |
| Euro 8/2/13 | | | 31,244,000 | | | | 40,669,371 | | | | 189,682 | |
| Japanese Yen 8/2/13 | | | (1,518,318,000) | | | | (15,313,972) | | | | (229,108) | |
| Mexican Nuevo Peso 8/2/13 | | | 23,120,000 | | | | 1,779,207 | | | | (58,380) | |
| Norwegian Krone 8/2/13 | | | (30,856,000) | | | | (5,075,517) | | | | 68,377 | |
| Singapore Dollar 8/2/13 | | | (6,626,000) | | | | (5,229,668) | | | | 44,842 | |
| Swedish Krona 8/2/13 | | | (69,646,000) | | | | (10,384,242) | | | | 115,755 | |
| |
| |
| Total | | | | | | $ | (2,827,787) | | | $ | 166,670 | |
| |
| |
See Notes to Schedules of Investments and Other Information and Notes to Financial Statements.
28 | JUNE 30, 2013
Schedule of Investments
As of June 30, 2013
Summary of Investments by Country – (Long Positions) (unaudited)
| | | | | | | | | |
| | | | | | % of Investment
| |
| Country | | Value | | | Securities | |
| |
| |
| Australia | | $ | 1,899,589 | | | | 0.7% | |
| Bermuda | | | 1,379,000 | | | | 0.5% | |
| Canada | | | 856,900 | | | | 0.3% | |
| Chile | | | 851,602 | | | | 0.3% | |
| China | | | 1,351,781 | | | | 0.5% | |
| France | | | 6,740,869 | | | | 2.6% | |
| Germany | | | 4,036,164 | | | | 1.6% | |
| Ireland | | | 16,067,575 | | | | 6.2% | |
| Italy | | | 10,730,933 | | | | 4.1% | |
| Japan | | | 385,500 | | | | 0.1% | |
| Luxembourg | | | 493,088 | | | | 0.2% | |
| Mexico | | | 1,779,070 | | | | 0.7% | |
| Netherlands | | | 1,707,696 | | | | 0.7% | |
| Philippines | | | 2,347,343 | | | | 0.9% | |
| Portugal | | | 11,269,847 | | | | 4.3% | |
| Singapore | | | 351,787 | | | | 0.1% | |
| South Korea | | | 2,229,568 | | | | 0.9% | |
| Spain | | | 14,246,103 | | | | 5.5% | |
| Taiwan | | | 2,263,972 | | | | 0.9% | |
| United Kingdom | | | 15,843,770 | | | | 6.1% | |
United States†† | | | 163,213,368 | | | | 62.8% | |
| |
| |
| Total | | $ | 260,045,525 | | | | 100.0% | |
| | | |
| †† | | Includes Cash Equivalents of 5.3%. |
See Notes to Schedules of Investments and Other Information and Notes to Financial Statements.
Janus Fixed Income & Money Market Funds | 29
Janus High-Yield Fund (unaudited)
| | | | | | | |
Fund Snapshot
We believe a bottom-up, fundamentally driven investment process focused on free-cash-flow and confirming management intentions to transform and improve balance sheets can generate risk-adjusted outperformance over time. Through our comprehensive research process and moderate beta approach, we seek to preserve capital and deliver a less volatile client experience over full market cycles.
| | | |
Gibson Smith
co-portfolio manager | |
Darrell Watters
co-portfolio manager |
Performance Overview
During the one-year period ended June 30, 2013, Janus High-Yield Fund’s Class T Shares returned 8.23% compared with a 9.49% return for the Fund’s benchmark, the Barclays U.S. Corporate High-Yield Bond Index.
Market Environment
The 12 months ended June 30, 2013 were largely characterized by concern about global fiscal policies and their impact on economic growth. Overall, high-yield corporate credit spreads narrowed during the period. U.S. Treasury bond yields rose, particularly in the final months as U.S. economic data began to improve.
The period began with concern about slow global economic growth, prompting additional stimulus from major central banks including the U.S. Federal Reserve (Fed), the European Central Bank and the Bank of Japan. Toward the end of calendar year 2012, worries grew about the “fiscal cliff,” a potentially recessionary mix of U.S. spending cuts and tax increases scheduled to take effect in January 2013. However, lawmakers delayed some elements of the fiscal cliff until March 2013, softening the impact, and the Fed continued to reiterate support for the markets via quantitative easing (QE) and near-zero interest rates.
By spring, there were signs that economic growth was improving. The U.S. economy seemed to weather the impact of government spending cuts that took effect in March, and employment data showed strengthening hiring patterns beginning in April. By May, markets were beginning to speculate about the eventual end of the Fed’s QE program, driving up longer-term Treasury yields. Meanwhile, Japan’s attempts to reflate its economy appeared to be having an effect, with signs of improving exports, rising manufacturing activity and increasing capital spending. Europe’s economy showed signs of stabilization, although growth expectations declined for China.
Fund Comments
Our corporate credit security selection detracted from relative performance. It is worth noting the Fund’s focus on companies undergoing balance sheet repair can result in some underperformance during periods in which high-yield debt markets perform particularly well, as they did over the past year. However, we maintain our commitment to delivering solid risk-adjusted returns with moderate volatility in any market cycle. At period end we held relatively longer-duration (a measurement of a bond’s price volatility) exposure to higher-quality credit compared with the benchmark, again reflecting our bias toward minimizing volatility for our clients.
Bank loans contributed to performance. Because bank loans are designed to reset based on changing interest rates, they typically do well during periods when interest rates are rising, as they did during the period. Our allocation to commercial mortgage-backed securities (CMBS) also contributed.
From a credit industry sector standpoint, detractors were led by wireless communications, metals and mining and noncyclical consumer products. Sector contributors included both cable and noncable media communications, and food and beverage companies.
Detractors from performance
Our underweight allocation to wireless and wireline communications provider Sprint Nextel led detractors. Sprint agreed to merge with Softbank Corp. during the period, with Softbank investing roughly $21.6 billion partly to strengthen Sprint’s balance sheet.
Credit detractors included steelmaker ArcelorMittal, which was pressured by concerns about slowing global growth, particularly in China. ArcelorMittal also issued shares and convertible notes early in the period, intending to use the proceeds to reduce debt. While this should be positive for the company’s bondholders over the longer term, the additional supply pressured its existing bonds. Over time,
30 | JUNE 30, 2013
(unaudited)
we believe that ArcelorMittal’s efforts to improve its balance sheet will provide benefits to its investors.
Affinion struggled during 2012 after announcing that many of its large bank customers were delaying marketing campaigns until they received more clarity on new federal consumer protection regulations. At period end, the Fund no longer held this credit.
Contributors to performance
Contributors were led by American International Group (AIG), an international insurer that offers property and casualty insurance, life insurance and retirement services. Over the past few years, AIG has simplified itself and transformed its balance sheet by selling noncore assets and deleveraging its capital structure. During the period AIG finished repaying all of the $182 billion owed to the U.S. government from the company’s bailout during the 2007-2008 financial crisis. We believe its core business units are on strong footing, and that AIG remains focused on reducing high-cost debt and improving its ratings.
Our underweight allocation to Cengage Learning, an educational content and software company, was beneficial as the credit struggled during the period. We sold our holdings during the period as the company’s fundamentals deteriorated and we lost confidence in the management team.
Contributors also included education software company Blackboard, which has benefited from an increase in higher education enrollment. Recent revenue and earnings growth have surpassed expectations.
Outlook
Over the past few years, the Fed’s unconventional monetary policies have suppressed U.S. Treasury rates to unprecedented lows in an effort to stimulate economic growth. Recent U.S. economic data reflects modest acceleration that may give the Fed the support it needs to begin tapering quantitative easing. However, we still believe the Fed will leave short-term interest rates unchanged for an extended period.
We have reduced exposure to longer-duration securities in an effort to buffer the effect of rising rates on the Fund; particularly in high-yield, many newly issued bonds would push Fund duration higher than our comfort zone, so we have avoided them. Some corporate credit names tend to be more sensitive to interest rate changes than others, and we have reduced our exposure to those as well. We are taking a closer look at lower-rated, higher-yielding credit, partly because we expect credit risk (i.e., the risk that borrowers will default) to remain low due to the excess levels of cash held on corporate balance sheets.
However, security selection has become extremely important, in our view, as high-yield valuations have become stretched due to investors’ search for yield, as well as the growing risk of higher interest rates. Commensurate with our ongoing commitment to delivering solid risk-adjusted returns with moderate volatility in any market cycle, we believe even more strongly in this environment that preservation of capital must take priority over aggressive return seeking. This is not to say that great opportunities have disappeared from the fixed income market – they have not, and we are still finding some, particularly in short-duration high-yield markets – but the universe of securities to select from today is much narrower than it has been over the last four years. Fortunately, a back-up in rates may have the positive effect of lowering fixed income valuations and opening up fresh opportunities for investing at more attractive levels in credits that we believe offer the potential for good risk-adjusted returns.
On behalf of each member of our investment team, thank you for your investment in Janus High-Yield Fund. We appreciate your entrusting us with your assets and look forward to continuing to play a role in your overall portfolio.
Janus Fixed Income & Money Market Funds | 31
Janus High-Yield Fund (unaudited)
Janus High-Yield Fund At A Glance
June 30, 2013
| | | |
Weighted Average Maturity | | 7.0 Years |
Average Effective Duration* | | 4.3 Years |
30-day Current Yield** | | |
| Class A Shares at NAV | | |
| Without Reimbursement | | 5.43% |
| With Reimbursement | | 5.43% |
| Class A Shares at MOP | | |
| Without Reimbursement | | 5.17% |
| With Reimbursement | | 5.17% |
| Class C Shares*** | | |
| Without Reimbursement | | 4.69% |
| With Reimbursement | | 4.69% |
| Class D Shares | | |
| Without Reimbursement | | 5.66% |
| With Reimbursement | | 5.66% |
| Class I Shares | | |
| Without Reimbursement | | 5.73% |
| With Reimbursement | | 5.73% |
| Class N Shares | | |
| Without Reimbursement | | 5.83% |
| With Reimbursement | | 5.83% |
| Class R Shares | | |
| Without Reimbursement | | 5.05% |
| With Reimbursement | | 5.05% |
| Class S Shares | | |
| Without Reimbursement | | 5.22% |
| With Reimbursement | | 5.22% |
| Class T Shares | | |
| Without Reimbursement | | 5.57% |
| With Reimbursement | | 5.57% |
Number of Bonds/Notes | | 211 |
| | | |
| * | | A theoretical measure of price volatility |
| ** | | Yield will fluctuate |
| *** | | Does not include the 1.00% contingent deferred sales charge. |
Ratings† Summary – (% of Fixed Income Securities )
June 30, 2013
| | | |
BBB | | 3.0% |
BB | | 26.9% |
B | | 45.7% |
CCC | | 18.1% |
Other | | 6.3% |
| | | |
| † | | Bond ratings provided by Standard & Poor’s. Not rated securities are not rated by S&P but may be rated by other rating agencies. Bond ratings are measured on a scale that generally ranges from AAA (highest) to D (lowest). |
32 | JUNE 30, 2013
(unaudited)
Significant Areas of Investment – (% of Net Assets)
As of June 30, 2013
Asset Allocation – (% of Net Assets)
As of June 30, 2013
Janus Fixed Income & Money Market Funds | 33
Janus High-Yield Fund (unaudited)
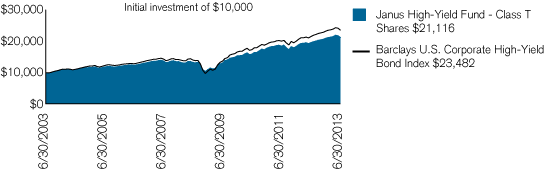
| | | | | | | | | | | | |
| Average Annual Total Return – for the periods ended June 30, 2013 | | | | | Expense Ratios – per the October 26, 2012 prospectuses |
| | | One
| | Five
| | Ten
| | Since
| | | Total Annual Fund
|
| | | Year | | Year | | Year | | Inception* | | | Operating Expenses |
| | | | | | | | | | | | |
| Janus High-Yield Fund – Class A Shares | | | | | | | | | | | |
| | | | | | | | | | | | |
| NAV | | 8.12% | | 9.76% | | 7.66% | | 7.96% | | | 0.99% |
| | | | | | | | | | | | |
| MOP | | 2.97% | | 8.69% | | 7.14% | | 7.66% | | | |
| | | | | | | | | | | | |
| Janus High-Yield Fund – Class C Shares | | | | | | | | | | | |
| | | | | | | | | | | | |
| NAV | | 7.19% | | 9.02% | | 6.90% | | 7.20% | | | 1.72% |
| | | | | | | | | | | | |
| CDSC | | 6.19% | | 9.02% | | 6.90% | | 7.20% | | | |
| | | | | | | | | | | | |
| Janus High-Yield Fund – Class D Shares(1) | | 8.33% | | 9.96% | | 7.80% | | 8.04% | | | 0.76% |
| | | | | | | | | | | | |
| Janus High-Yield Fund – Class I Shares | | 8.43% | | 9.89% | | 7.76% | | 8.02% | | | 0.68% |
| | | | | | | | | | | | |
| Janus High-Yield Fund – Class N Shares | | 8.38% | | 9.89% | | 7.76% | | 8.02% | | | 0.61% |
| | | | | | | | | | | | |
| Janus High-Yield Fund – Class R Shares | | 7.68% | | 9.35% | | 7.19% | | 7.48% | | | 1.36% |
| | | | | | | | | | | | |
| Janus High-Yield Fund – Class S Shares | | 7.95% | | 9.62% | | 7.46% | | 7.74% | | | 1.11% |
| | | | | | | | | | | | |
| Janus High-Yield Fund – Class T Shares | | 8.23% | | 9.89% | | 7.76% | | 8.02% | | | 0.86% |
| | | | | | | | | | | | |
| Barclays U.S. Corporate High-Yield Bond Index | | 9.49% | | 10.94% | | 8.91% | | 7.52% | | | |
| | | | | | | | | | | | |
| Morningstar Quartile – Class T Shares | | 3rd | | 1st | | 2nd | | 1st | | | |
| | | | | | | | | | | | |
| Morningstar Ranking – based on total returns for High Yield Bond Funds | | 404/652 | | 102/559 | | 203/492 | | 6/229 | | | |
| | | | | | | | | | | | |
| Visit janus.com/advisor/mutual-funds (or janus.com/allfunds if you hold Shares directly with Janus Capital) to view current performance and characteristic information | | | |
| | | | | | | | | | | | |
Returns quoted are past performance and do not guarantee future results; current performance may be lower or higher. Investment returns and principal value will vary; there may be a gain or loss when shares are sold. For the most recent month–end performance call 877.33JANUS(52687) (or 800.525.3713 if you hold shares directly with Janus Capital) or visit janus.com/advisor/mutual-funds (or janus.com/allfunds if you hold shares directly with Janus Capital).
Performance shown for Class A Shares at Maximum Offering Price (MOP) includes the Fund’s maximum sales charge of 4.75%. Performance shown at Net Asset Value (NAV) does not include this charge and would have been lower had this charge been taken into account.
See important disclosures on the next page.
34 | JUNE 30, 2013
(unaudited)
Performance shown for Class C Shares includes a 1% contingent deferred sales charge (CDSC) on periods of less than 12 months. Performance shown at Net Asset Value (NAV) does not include this sales charge and would have been lower had this sales charge been taken into account.
The expense ratios for Class N Shares are estimated.
The Fund’s performance may be affected by risks that include those associated with non-investment grade debt securities, investments in specific industries or countries and potential conflicts of interest with the Janus “funds of funds.” Additional risks to the Fund may include those associated with investing in foreign securities, emerging markets, initial public offerings (“IPOs”), real estate investment trusts (“REITs”), and derivatives. Please see the Fund’s prospectuses or janus.com/info (or janus.com/reports if you hold shares directly with Janus Capital) for more information about risks, portfolio holdings and other details.
Funds that invest in bonds have the same interest rate, inflation, and credit risks that are associated with the underlying bonds owned by the Fund. Unlike owning individual bonds, there are ongoing fees and expenses associated with owning shares of Fixed Income Funds. The return of principal is not guaranteed due to net asset value fluctuation that is caused by changes in the price of specific bonds held in the Fund and selling of bonds within the Fund by the portfolio managers.
High-yield/high-risk bonds, also known as “junk” bonds, involve a greater risk of default and price volatility than investment grade bonds. High-yield/high-risk bonds can experience sudden and sharp price swings which will affect net asset value.
The Fund invests in REITs, which may be subject to a higher degree of market risk because of concentration in a specific industry, sector or geographic region. REITs may be subject to risks including, but not limited to: legal, political, liquidity, interest rate risks, a decline in the value of real estate, risks related to general and economic conditions, changes in the value of the underlying property owned by the trust and defaults by borrowers. To the extent the Fund invests in foreign REITs, the Fund may be subject to fluctuations in currency rates or political or economic conditions in a particular country.
The Fund will normally invest at least 80% of its net assets, measured at the time of purchase, in the type of securities described by its name.
Returns include reinvestment of all dividends and distributions. The returns do not include adjustments in accordance with generally accepted accounting principles required at the period end for financial reporting purposes.
Class A Shares, Class C Shares, Class R Shares, and Class S Shares of the Fund commenced operations on July 6, 2009. The performance shown for periods prior to July 6, 2009 reflects the historical performance of a similar share class of the Fund, calculated using the fees and expenses of each respective share class without the effect of any fee and expense limitations or waivers.
Class D Shares of the Fund commenced operations on February 16, 2010, as a result of the restructuring of Class J Shares, the predecessor share class. The performance shown for periods prior to February 16, 2010 reflects the historical performance of the Fund’s predecessor share class.
Class I Shares of the Fund commenced operations on July 6, 2009. The performance shown for periods prior to July 6, 2009 reflects the historical performance of a similar share class of the Fund.
Class N Shares of the Fund commenced operations on May 31, 2012. The performance shown for periods prior to May 31, 2012 reflects the historical performance of a similar share class of the Fund.
If each share class of the Fund had been available during periods prior to its commencement, the performance shown may have been different. The performance shown for periods following the Fund’s commencement of each share class reflects the fees and expenses of each respective share class, net of any applicable fee and expense limitations or waivers. Please refer to the Fund’s prospectuses for further details concerning historical performance.
Ranking is for the share class shown only; other classes may have different performance characteristics. When an expense waiver is in effect, it may have a material effect on the total return or yield, and therefore the ranking for the period.
© 2013 Morningstar, Inc. All Rights Reserved.
There is no assurance that the investment process will consistently lead to successful investing.
See Notes to Schedules of Investments and Other Information for index definitions.
The Fund’s portfolio may differ significantly from the securities held in the index. The index is unmanaged and is not available for direct investment; therefore, its performance does not reflect the expenses associated with the active management of an actual portfolio.
See “Useful Information About Your Fund Report.”
| | | |
| * | | The Fund’s inception date – December 29, 1995 |
| (1) | | Closed to new investors. |
Janus Fixed Income & Money Market Funds | 35
Janus High-Yield Fund (unaudited)
As a shareholder of the Fund, you incur two types of costs: (1) transaction costs, such as sales charges (loads) on purchase payments (applicable to Class A Shares only); and (2) ongoing costs, including management fees; distribution and shareholder servicing (12b-1) fees; administrative services fees payable pursuant to the Transfer Agency Agreement; and other Fund expenses. This example is intended to help you understand your ongoing costs (in dollars) of investing in the Fund and to compare these costs with the ongoing costs of investing in other mutual funds. To do so, compare this 5% hypothetical example with the 5% hypothetical examples that appear in the shareholder reports of the other funds. The example is based upon an investment of $1,000 invested at the beginning of the period and held for the six-months indicated, unless noted otherwise in the table and footnotes below.
Actual Expenses
The information in the table under the heading “Actual” provides information about actual account values and actual expenses. You may use the information in these columns, together with the amount you invested, to estimate the expenses that you paid over the period. Simply divide your account value by $1,000 (for example, an $8,600 account value divided by $1,000 = 8.6), then multiply the result by the number in the appropriate column for your share class under the heading entitled “Expenses Paid During Period” to estimate the expenses you paid on your account during the period.
Hypothetical Example for Comparison Purposes
The information in the table under the heading “Hypothetical (5% return before expenses)” provides information about hypothetical account values and hypothetical expenses based upon the Fund’s actual expense ratio and an assumed rate of return of 5% per year before expenses, which is not the Fund’s actual return. The hypothetical account values and expenses may not be used to estimate the actual ending account balance or expenses you paid for the period. You may use this information to compare the ongoing costs of investing in the Fund and other funds. To do so, compare this 5% hypothetical example with the 5% hypothetical examples that appear in the shareholder reports of the other funds. Additionally, for an analysis of the fees associated with an investment in any share class or other similar funds, please visit www.finra.org/fundanalyzer.
Please note that the expenses shown in the table are meant to highlight your ongoing costs only and do not reflect any transaction costs. These fees are fully described in the Fund’s prospectuses. Therefore, the hypothetical examples are useful in comparing ongoing costs only, and will not help you determine the relative total costs of owning different funds. In addition, if these transaction costs were included, your costs would have been higher.
| | | | | | | | | | | | | | | | | | | | | | | | | | | | | | | |
| | | | | Hypothetical
| | | | |
| | | Actual | | (5% return before expenses) | | | | |
| | | Beginning
| | Ending
| | Expenses
| | Beginning
| | Ending
| | Expenses
| | | | |
| | | Account
| | Account
| | Paid During
| | Account
| | Account
| | Paid During
| | Net Annualized
| | |
| | | Value
| | Value
| | Period
| | Value
| | Value
| | Period
| | Expense Ratio
| | |
| | | (1/1/13) | | (6/30/13) | | (1/1/13 - 6/30/13)† | | (1/1/13) | | (6/30/13) | | (1/1/13 - 6/30/13)† | | (1/1/13 - 6/30/13) | | |
| |
| |
| Class A Shares | | $ | 1,000.00 | | | $ | 1,009.70 | | | $ | 4.83 | | | $ | 1,000.00 | | | $ | 1,019.98 | | | $ | 4.86 | | | | 0.97% | | | |
| |
| |
| Class C Shares | | $ | 1,000.00 | | | $ | 1,005.80 | | | $ | 8.60 | | | $ | 1,000.00 | | | $ | 1,016.22 | | | $ | 8.65 | | | | 1.73% | | | |
| |
| |
| Class D Shares | | $ | 1,000.00 | | | $ | 1,010.70 | | | $ | 3.84 | | | $ | 1,000.00 | | | $ | 1,020.98 | | | $ | 3.86 | | | | 0.77% | | | |
| |
| |
| Class I Shares | | $ | 1,000.00 | | | $ | 1,012.10 | | | $ | 3.44 | | | $ | 1,000.00 | | | $ | 1,021.37 | | | $ | 3.46 | | | | 0.69% | | | |
| |
| |
| Class N Shares | | $ | 1,000.00 | | | $ | 1,011.40 | | | $ | 3.09 | | | $ | 1,000.00 | | | $ | 1,021.72 | | | $ | 3.11 | | | | 0.62% | | | |
| |
| |
| Class R Shares | | $ | 1,000.00 | | | $ | 1,008.70 | | | $ | 6.82 | | | $ | 1,000.00 | | | $ | 1,018.00 | | | $ | 6.85 | | | | 1.37% | | | |
| |
| |
| Class S Shares | | $ | 1,000.00 | | | $ | 1,010.00 | | | $ | 5.58 | | | $ | 1,000.00 | | | $ | 1,019.24 | | | $ | 5.61 | | | | 1.12% | | | |
| |
| |
| Class T Shares | | $ | 1,000.00 | | | $ | 1,010.20 | | | $ | 4.29 | | | $ | 1,000.00 | | | $ | 1,020.53 | | | $ | 4.31 | | | | 0.86% | | | |
| |
| |
| | | |
| † | | Expenses Paid During Period are equal to the Net Annualized Expense Ratio multiplied by the average account value over the period, multiplied by the number of days in the most recent six-month period, divided by the number of days in the fiscal year. Expenses in the examples include the effect of applicable fee waivers and/or expense reimbursements, if any. Had such waivers and/or reimbursements not been in effect, your expenses would have been higher. Please refer to the Notes to Financial Statements or the Fund’s prospectuses for more information regarding waivers and/or reimbursements. |
36 | JUNE 30, 2013
Janus High-Yield Fund
Schedule of Investments
As of June 30, 2013
| | | | | | | | | | | |
| Shares or Principal Amount | | Value | | | |
| |
| Bank Loans – 7.8% | | | | | | |
| Building – Residential and Commercial – 0.1% | | | | | | |
| | $1,752,100 | | | Orleans Homebuilders, Inc.
10.5000%, 2/14/16‡ | | $ | 1,747,719 | | | |
| Casino Hotels – 0.9% | | | | | | |
| | 14,257,000 | | | Caesars Entertainment Corp.
9.2500%, 4/25/17‡ | | | 14,328,285 | | | |
| | 6,573,000 | | | Harrah’s Las Vegas Propco LLC
3.6825%, 2/13/14‡ | | | 6,066,353 | | | |
| | | | | | | | 20,394,638 | | | |
| Commercial Mortgage-Backed Security – Other – 0.9% | | | | | | |
| | 20,000,000 | | | EOP Mezz 3 LLC
1.6940%, 2/1/14 (144A),‡ | | | 20,800,000 | | | |
| Distribution/Wholesale – 0.5% | | | | | | |
| | 11,725,080 | | | WESCO Distribution, Inc.
4.5000%, 12/12/19‡ | | | 11,732,467 | | | |
| Educational Software – 1.3% | | | | | | |
| | 2,287,505 | | | Blackboard, Inc.
6.2500%, 10/4/18‡ | | | 2,306,102 | | | |
| | 27,173,000 | | | Blackboard, Inc.
11.5000%, 4/4/19‡ | | | 27,490,109 | | | |
| | | | | | | | 29,796,211 | | | |
| Hotels and Motels – 2.3% | | | | | | |
| | 22,950,656 | | | Hilton Hotels Corp.
3.9430%, 11/12/15‡ | | | 22,491,643 | | | |
| | 9,896,857 | | | J.W. Marriott
7.8200%, 4/16/18 (144A),‡ | | | 9,797,889 | | | |
| | 21,607,000 | | | Riverboat Corp. of Mississippi
10.0000%, 11/29/16‡ | | | 21,498,965 | | | |
| | | | | | | | 53,788,497 | | | |
| Metal – Iron – 0.2% | | | | | | |
| | 6,201,140 | | | FMG Resources (August 2006) Pty, Ltd.
5.2500%, 10/18/17‡ | | | 6,159,468 | | | |
| Oil Companies – Exploration and Production – 0.2% | | | | | | |
| | 4,600,470 | | | Rice Drilling B LLC
8.5000%, 10/25/18‡ | | | 4,588,969 | | | |
| Retail – Drug Store – 0.2% | | | | | | |
| | 4,605,000 | | | Rite Aid Corp.
5.7500%, 8/21/20‡ | | | 4,662,563 | | | |
| Retail – Regional Department Stores – 0.6% | | | | | | |
| | 13,179,000 | | | JC Penney Corp., Inc.
6.0000%, 5/22/18‡ | | | 13,188,357 | | | |
| Transportation & Logistics – 0.6% | | | | | | |
| | 13,690,000 | | | State Class Tankers II LLC
0%, 6/20/20(a),‡ | | | 13,587,325 | | | |
| |
| |
| Total Bank Loans (cost $176,915,580) | | | 180,446,214 | | | |
| |
| |
| Commercial Mortgage-Backed Security – 0.3% | | | | | | |
| | 7,913,642 | | | JPMorgan Chase Commercial Mortgage Securities Trust, 6.1925%, 4/15/18 (144A),‡ (cost $8,010,628) | | | 8,059,253 | | | |
| |
| |
| Corporate Bonds – 85.7% | | | | | | |
| Advertising Services – 0.5% | | | | | | |
| | 12,342,000 | | | Visant Corp.
10.0000%, 10/1/17 | | | 11,385,495 | | | |
| Aerospace and Defense – 1.8% | | | | | | |
| | 42,017,000 | | | ADS Tactical, Inc.
11.0000%, 4/1/18**,§ | | | 40,546,405 | | | |
| Aerospace and Defense – Equipment – 1.1% | | | | | | |
| | 15,112,000 | | | TransDigm, Inc.
5.5000%, 10/15/20 (144A) | | | 14,280,840 | | | |
| | 10,848,000 | | | TransDigm, Inc.
7.5000%, 7/15/21 (144A) | | | 11,092,080 | | | |
| | | | | | | | 25,372,920 | | | |
| Agricultural Chemicals – 0.2% | | | | | | |
| | 3,473,000 | | | Phibro Animal Health Corp.
9.2500%, 7/1/18 (144A) | | | 3,733,475 | | | |
| Airlines – 0.8% | | | | | | |
| | 13,741,000 | | | U.S. Airways Group, Inc.
6.1250%, 6/1/18 | | | 12,985,245 | | | |
| | 5,029,000 | | | United Continental Holdings, Inc.
6.3750%, 6/1/18 | | | 4,940,993 | | | |
| | | | | | | | 17,926,238 | | | |
| Apparel Manufacturers – 0.6% | | | | | | |
| | 14,317,000 | | | Quiksilver, Inc.
6.8750%, 4/15/15 | | | 14,030,660 | | | |
| Automotive – Medium and Heavy Duty Trucks – 0.2% | | | | | | |
| | 5,124,000 | | | Navistar International Corp.
8.2500%, 11/1/21 | | | 5,034,330 | | | |
| Broadcast Services and Programming – 1.4% | | | | | | |
| | 14,170,000 | | | Clear Channel Worldwide Holdings, Inc.
6.5000%, 11/15/22 (144A) | | | 14,595,100 | | | |
| | 16,248,000 | | | Crown Media Holdings, Inc.
10.5000%, 7/15/19 | | | 18,035,280 | | | |
| | | | | | | | 32,630,380 | | | |
| Building – Residential and Commercial – 0.5% | | | | | | |
| | 10,778,000 | | | Meritage Homes Corp.
7.0000%, 4/1/22 | | | 11,855,800 | | | |
| Building and Construction Products – Miscellaneous – 0.5% | | | | | | |
| | 3,631,000 | | | Ply Gem Industries, Inc.
9.3750%, 4/15/17 | | | 3,839,783 | | | |
| | 2,262,000 | | | USG Corp.
6.3000%, 11/15/16 | | | 2,307,240 | | | |
| | 5,378,000 | | | USG Corp.
7.8750%, 3/30/20 (144A) | | | 5,862,020 | | | |
| | | | | | | | 12,009,043 | | | |
| Cable/Satellite Television – 3.2% | | | | | | |
| | 14,008,000 | | | Block Communications, Inc.
7.2500%, 2/1/20 (144A) | | | 14,708,400 | | | |
| | 27,377,000 | | | DISH DBS Corp.
5.1250%, 5/1/20 (144A) | | | 26,829,460 | | | |
| | 6,453,000 | | | Harron Communications L.P. / Harron Finance Corp.
9.1250%, 4/1/20 (144A) | | | 6,969,240 | | | |
| | 17,140,000 | | | Mediacom Broadband LLC / Mediacom Broadband Corp.
6.3750%, 4/1/23 | | | 17,054,300 | | | |
| | 8,257,000 | | | Mediacom LLC / Mediacom Capital Corp.
7.2500%, 2/15/22 | | | 8,690,492 | | | |
| | | | | | | | 74,251,892 | | | |
See Notes to Schedules of Investments and Other Information and Notes to Financial Statements.
Janus Fixed Income & Money Market Funds | 37
Janus High-Yield Fund
Schedule of Investments
As of June 30, 2013
| | | | | | | | | | | |
| Shares or Principal Amount | | Value | | | |
| |
| Casino Hotels – 4.3% | | | | | | |
| | $11,036,000 | | | Ameristar Casinos, Inc.
7.5000%, 4/15/21 | | $ | 11,477,440 | | | |
| | 2,953,000 | | | Boyd Gaming Corp.
9.1250%, 12/1/18 | | | 3,078,502 | | | |
| | 2,776,000 | | | Caesars Entertainment Operating Co., Inc.
11.2500%, 6/1/17 | | | 2,890,510 | | | |
| | 3,453,000 | | | CityCenter Holdings LLC / CityCenter Finance Corp.
7.6250%, 1/15/16 | | | 3,642,915 | | | |
| | 6,191,000 | | | Marina District Finance Co., Inc.
9.8750%, 8/15/18 | | | 6,438,640 | | | |
| | 16,963,000 | | | MGM Resorts International
4.2500%, 4/15/15 | | | 18,987,958 | | | |
| | 3,830,000 | | | MGM Resorts International
11.3750%, 3/1/18 | | | 4,787,500 | | | |
| | 11,222,000 | | | MGM Resorts International
8.6250%, 2/1/19 | | | 12,680,860 | | | |
| | 5,429,000 | | | MGM Resorts International
6.7500%, 10/1/20 | | | 5,619,015 | | | |
| | 14,851,000 | | | MGM Resorts International
6.6250%, 12/15/21 | | | 15,315,094 | | | |
| | 6,915,000 | | | MGM Resorts International
7.7500%, 3/15/22 | | | 7,511,419 | | | |
| | 6,666,000 | | | Station Casinos LLC
7.5000%, 3/1/21 (144A) | | | 6,732,660 | | | |
| | | | | | | | 99,162,513 | | | |
| Casino Services – 1.0% | | | | | | |
| | 5,388,000 | | | CCM Merger, Inc.
9.1250%, 5/1/19 (144A) | | | 5,630,460 | | | |
| | 17,157,000 | | | Peninsula Gaming LLC / Peninsula Gaming Corp.
8.3750%, 2/15/18 (144A) | | | 17,843,280 | | | |
| | | | | | | | 23,473,740 | | | |
| Cellular Telecommunications – 1.7% | | | | | | |
| | 6,287,000 | | | Cricket Communications, Inc.
7.7500%, 10/15/20 | | | 6,035,520 | | | |
| | 24,498,000 | | | Sprint Nextel Corp.
7.0000%, 8/15/20 | | | 25,722,900 | | | |
| | 8,214,000 | | | Sprint Nextel Corp.
6.0000%, 11/15/22 | | | 8,049,720 | | | |
| | | | | | | | 39,808,140 | | | |
| Chemicals – Specialty – 1.2% | | | | | | |
| | 8,348,000 | | | Ashland, Inc.
4.7500%, 8/15/22 (144A) | | | 8,264,520 | | | |
| | 13,251,000 | | | Ashland, Inc.
4.7500%, 8/15/22 (144A) | | | 13,118,490 | | | |
| | 6,828,000 | | | Ashland, Inc.
6.8750%, 5/15/43 (144A) | | | 6,964,560 | | | |
| | | | | | | | 28,347,570 | | | |
| Coal – 1.0% | | | | | | |
| | 13,163,000 | | | Arch Coal, Inc.
8.7500%, 8/1/16 | | | 13,163,000 | | | |
| | 5,799,000 | | | Peabody Energy Corp.
6.2500%, 11/15/21 | | | 5,596,035 | | | |
| | 7,717,000 | | | Peabody Energy Corp.
4.7500%, 12/15/41 | | | 5,358,492 | | | |
| | | | | | | | 24,117,527 | | | |
| Commercial Banks – 2.3% | | | | | | |
| | 8,400,000 | | | Banco Bilbao Vizcaya Argentaria S.A.
9.0000%, 8/9/99‡ | | | 7,974,960 | | | |
| | 8,084,000 | | | CIT Group, Inc.
5.2500%, 3/15/18 | | | 8,306,310 | | | |
| | 7,270,000 | | | CIT Group, Inc.
6.6250%, 4/1/18 (144A) | | | 7,851,600 | | | |
| | 21,018,000 | | | CIT Group, Inc.
5.5000%, 2/15/19 (144A) | | | 21,701,085 | | | |
| | 7,134,000 | | | CIT Group, Inc.
5.3750%, 5/15/20 | | | 7,303,432 | | | |
| | | | | | | | 53,137,387 | | | |
| Commercial Services – 0.8% | | | | | | |
| | 2,673,000 | | | Envision Healthcare Corp.
8.1250%, 6/1/19 | | | 2,840,063 | | | |
| | 14,822,000 | | | Global A&T Electronics, Ltd.
10.0000%, 2/1/19 (144A) | | | 15,044,330 | | | |
| | | | | | | | 17,884,393 | | | |
| Commercial Services – Finance – 1.4% | | | | | | |
| | 14,039,000 | | | Cardtronics, Inc.
8.2500%, 9/1/18 | | | 14,881,340 | | | |
| | 5,597,000 | | | TransUnion Holding Co., Inc.
8.1250%, 6/15/18 (144A) | | | 5,925,824 | | | |
| | 10,797,000 | | | TransUnion Holding Co., Inc.
9.6250%, 6/15/18 | | | 11,525,797 | | | |
| | | | | | | | 32,332,961 | | | |
| Consulting Services – 0.6% | | | | | | |
| | 7,696,000 | | | Verisk Analytics, Inc.
4.8750%, 1/15/19 | | | 8,246,987 | | | |
| | 5,324,000 | | | Verisk Analytics, Inc.
4.1250%, 9/12/22 | | | 5,290,241 | | | |
| | | | | | | | 13,537,228 | | | |
| Consumer Products – Miscellaneous – 1.1% | | | | | | |
| | 13,578,000 | | | Reynolds Group Issuer, Inc. / Reynolds Group Issuer LLC
9.0000%, 4/15/19 | | | 14,019,285 | | | |
| | 2,425,000 | | | Reynolds Group Issuer, Inc. / Reynolds Group Issuer LLC
7.8750%, 8/15/19 | | | 2,643,250 | | | |
| | 7,759,000 | | | Reynolds Group Issuer, Inc. / Reynolds Group Issuer LLC
9.8750%, 8/15/19 | | | 8,302,130 | | | |
| | | | | | | | 24,964,665 | | | |
| Containers – Metal and Glass – 0.6% | | | | | | |
| | 11,116,000 | | | Greif, Inc.
7.7500%, 8/1/19 | | | 12,727,820 | | | |
| Containers – Paper and Plastic – 0.3% | | | | | | |
| | 6,541,000 | | | BOE Intermediate Holding Corp.
9.0000%, 11/1/17 (144A) | | | 6,279,360 | | | |
| Data Processing and Management – 0.6% | | | | | | |
| | 12,594,000 | | | First Data Corp.
12.6250%, 1/15/21 | | | 13,318,155 | | | |
See Notes to Schedules of Investments and Other Information and Notes to Financial Statements.
38 | JUNE 30, 2013
Schedule of Investments
As of June 30, 2013
| | | | | | | | | | | |
| Shares or Principal Amount | | Value | | | |
| |
| Distribution/Wholesale – 0.5% | | | | | | |
| | $8,337,000 | | | American Builders & Contractors Supply Co., Inc.
5.6250%, 4/15/21 (144A) | | $ | 8,191,103 | | | |
| | 2,450,000 | | | HD Supply, Inc.
11.0000%, 4/15/20 | | | 2,854,250 | | | |
| | | | | | | | 11,045,353 | | | |
| Diversified Minerals – 0.5% | | | | | | |
| | 11,933,000 | | | FMG Resources (August 2006) Pty, Ltd.
6.8750%, 4/1/22 (144A) | | | 11,575,010 | | | |
| Diversified Operations – 0.4% | | | | | | |
| | 8,300,000 | | | Park-Ohio Industries, Inc.
8.1250%, 4/1/21 | | | 9,005,500 | | | |
| E-Commerce/Products – 0.2% | | | | | | |
| | 5,606,000 | | | Mood Media Corp.
9.2500%, 10/15/20 (144A) | | | 5,129,490 | | | |
| Electric – Generation – 0.4% | | | | | | |
| | 7,892,000 | | | AES Corp.
8.0000%, 10/15/17 | | | 8,878,500 | | | |
| Electric – Integrated – 0.5% | | | | | | |
| | 12,057,000 | | | IPALCO Enterprises, Inc.
5.0000%, 5/1/18 | | | 12,418,710 | | | |
| Engines – Internal Combustion – 0.3% | | | | | | |
| | 6,288,000 | | | Briggs & Stratton Corp.
6.8750%, 12/15/20 | | | 6,916,800 | | | |
| Finance – Commercial – 0.2% | | | | | | |
| | 4,370,000 | | | Jefferies Finance LLC / JFIN Co-Issuer Corp.
7.3750%, 4/1/20 (144A) | | | 4,238,900 | | | |
| Finance – Investment Bankers/Brokers – 1.3% | | | | | | |
| | 9,378,000 | | | E*TRADE Financial Corp.
6.7500%, 6/1/16 | | | 9,635,895 | | | |
| | 11,091,000 | | | E*TRADE Financial Corp.
6.0000%, 11/15/17 | | | 11,201,910 | | | |
| | 9,982,000 | | | E*TRADE Financial Corp.
6.3750%, 11/15/19 | | | 10,131,730 | | | |
| | | | | | | | 30,969,535 | | | |
| Food – Dairy Products – 0.8% | | | | | | |
| | 17,688,000 | | | FAGE Dairy Industry S.A. / FAGE USA Dairy Industry, Inc.
9.8750%, 2/1/20 (144A) | | | 19,058,820 | | | |
| Food – Meat Products – 1.2% | | | | | | |
| | 11,039,000 | | | JBS USA LLC / JBS USA Finance, Inc.
8.2500%, 2/1/20 (144A) | | | 11,563,352 | | | |
| | 7,374,000 | | | JBS USA LLC / JBS USA Finance, Inc.
7.2500%, 6/1/21 (144A) | | | 7,374,000 | | | |
| | 7,082,000 | | | Smithfield Foods, Inc.
6.6250%, 8/15/22 | | | 7,613,150 | | | |
| | | | | | | | 26,550,502 | | | |
| Home Furnishings – 0.4% | | | | | | |
| | 9,352,000 | | | Norcraft Cos. L.P. / Norcraft Finance Corp.
10.5000%, 12/15/15 | | | 9,702,700 | | | |
| Independent Power Producer – 0.3% | | | | | | |
| | 5,674,000 | | | NRG Energy, Inc.
6.6250%, 3/15/23 (144A) | | | 5,674,000 | | | |
| Investment Management and Advisory Services – 0.5% | | | | | | |
| | 7,660,000 | | | Neuberger Berman Group LLC / Neuberger Berman Finance Corp.
5.6250%, 3/15/20 (144A) | | | 7,928,100 | | | |
| | 4,298,000 | | | Neuberger Berman Group LLC / Neuberger Berman Finance Corp.
5.8750%, 3/15/22 (144A) | | | 4,383,960 | | | |
| | | | | | | | 12,312,060 | | | |
| Machinery – Construction and Mining – 0.5% | | | | | | |
| | 6,599,000 | | | Terex Corp.
6.5000%, 4/1/20 | | | 6,730,980 | | | |
| | 4,583,000 | | | Terex Corp.
6.0000%, 5/15/21 | | | 4,571,543 | | | |
| | | | | | | | 11,302,523 | | | |
| Medical – Drugs – 1.7% | | | | | | |
| | 554,000 | | | Valeant Pharmaceuticals International
6.8750%, 12/1/18 (144A) | | | 567,850 | | | |
| | 12,420,000 | | | Valeant Pharmaceuticals International
6.3750%, 10/15/20 (144A) | | | 12,280,275 | | | |
| | 14,662,000 | | | VPII Escrow Corp.
6.7500%, 8/15/18 (144A) | | | 15,028,550 | | | |
| | 10,730,000 | | | VPII Escrow Corp.
7.5000%, 7/15/21 (144A) | | | 11,112,256 | | | |
| | | | | | | | 38,988,931 | | | |
| Medical – Hospitals – 1.1% | | | | | | |
| | 2,204,000 | | | HCA Holdings, Inc.
7.7500%, 5/15/21 | | | 2,380,320 | | | |
| | 13,715,000 | | | HCA, Inc.
6.5000%, 2/15/20 | | | 14,837,915 | | | |
| | 8,261,000 | | | Universal Health Services, Inc.
7.0000%, 10/1/18 | | | 8,705,029 | | | |
| | | | | | | | 25,923,264 | | | |
| Medical Instruments – 0.3% | | | | | | |
| | 7,141,000 | | | Physio-Control International, Inc.
9.8750%, 1/15/19 (144A) | | | 7,855,100 | | | |
| Medical Labs and Testing Services – 0.1% | | | | | | |
| | 4,832,000 | | | Aurora Diagnostics Holdings / Aurora Diagnostics Financing, Inc.
10.7500%, 1/15/18 | | | 3,140,800 | | | |
| Medical Products – 0.4% | | | | | | |
| | 9,684,000 | | | Biomet, Inc.
6.5000%, 8/1/20 | | | 9,980,573 | | | |
| Multi-Line Insurance – 1.4% | | | | | | |
| | 1,431,000 | | | American International Group, Inc.
6.2500%, 3/15/37 | | | 1,461,409 | | | |
| | 26,082,000 | | | American International Group, Inc.
8.1750%, 5/15/58‡ | | | 31,820,040 | | | |
| | | | | | | | 33,281,449 | | | |
| Oil – Field Services – 0.7% | | | | | | |
| | 7,738,000 | | | Calfrac Holdings L.P.
7.5000%, 12/1/20 (144A) | | | 7,660,620 | | | |
| | 8,764,000 | | | Hiland Partners L.P. / Hiland Partners Finance Corp.
7.2500%, 10/1/20 (144A) | | | 9,026,920 | | | |
| | | | | | | | 16,687,540 | | | |
See Notes to Schedules of Investments and Other Information and Notes to Financial Statements.
Janus Fixed Income & Money Market Funds | 39
Janus High-Yield Fund
Schedule of Investments
As of June 30, 2013
| | | | | | | | | | | |
| Shares or Principal Amount | | Value | | | |
| |
| Oil and Gas Drilling – 0.9% | | | | | | |
| | $3,857,000 | | | Atwood Oceanics, Inc.
6.5000%, 2/1/20 | | $ | 4,001,638 | | | |
| | 5,955,000 | | | Drill Rigs Holdings, Inc.
6.5000%, 10/1/17 (144A) | | | 5,940,112 | | | |
| | 11,172,000 | | | Sidewinder Drilling, Inc.
9.7500%, 11/15/19 (144A) | | | 11,311,650 | | | |
| | | | | | | | 21,253,400 | | | |
| Oil Companies – Exploration and Production – 16.0% | | | | | | |
| | 2,774,000 | | | Antero Resources Finance Corp.
6.0000%, 12/1/20 | | | 2,732,390 | | | |
| | 23,337,000 | | | Aurora USA Oil & Gas, Inc.
9.8750%, 2/15/17 (144A) | | | 24,270,480 | | | |
| | 14,490,000 | | | Aurora USA Oil & Gas, Inc.
7.5000%, 4/1/20 (144A) | | | 14,200,200 | | | |
| | 1,669,000 | | | Bonanza Creek Energy, Inc.
6.7500%, 4/15/21 (144A) | | | 1,681,518 | | | |
| | 6,223,000 | | | Chaparral Energy, Inc.
9.8750%, 10/1/20 | | | 6,907,530 | | | |
| | 8,344,000 | | | Chaparral Energy, Inc.
8.2500%, 9/1/21 | | | 8,782,060 | | | |
| | 33,880,000 | | | Chesapeake Energy Corp.
6.1250%, 2/15/21 | | | 35,574,000 | | | |
| | 19,507,000 | | | Chesapeake Energy Corp.
5.7500%, 3/15/23 | | | 19,750,837 | | | |
| | 13,418,000 | | | Chesapeake Energy Corp.
2.5000%, 5/15/37 | | | 12,638,079 | | | |
| | 5,040,000 | | | Continental Resources, Inc.
5.0000%, 9/15/22 | | | 5,128,200 | | | |
| | 11,176,000 | | | EP Energy LLC / EP Energy Finance, Inc.
9.3750%, 5/1/20 | | | 12,628,880 | | | |
| | 2,859,000 | | | EP Energy LLC / Everest Acquisition Finance, Inc.
7.7500%, 9/1/22 | | | 3,059,130 | | | |
| | 20,879,000 | | | EV Energy Partners L.P. / EV Energy Finance Corp.
8.0000%, 4/15/19 | | | 21,087,790 | | | |
| | 17,477,000 | | | Forest Oil Corp.
7.5000%, 9/15/20 (144A) | | | 16,603,150 | | | |
| | 17,507,000 | | | Halcon Resources Corp.
9.7500%, 7/15/20 | | | 17,463,232 | | | |
| | 9,981,000 | | | Halcon Resources Corp.
8.8750%, 5/15/21 | | | 9,681,570 | | | |
| | 3,464,000 | | | Hilcorp Energy I L.P. / Hilcorp Finance Co.
7.6250%, 4/15/21 (144A) | | | 3,671,840 | | | |
| | 4,651,000 | | | Kodiak Oil & Gas Corp.
8.1250%, 12/1/19 | | | 5,046,335 | | | |
| | 5,479,000 | | | Legacy Reserves L.P. / Legacy Reserves Finance Corp.
6.6250%, 12/1/21 (144A) | | | 5,273,538 | | | |
| | 4,409,000 | | | Linn Energy LLC / Linn Energy Finance Corp.
6.5000%, 5/15/19 | | | 4,309,798 | | | |
| | 15,996,000 | | | Linn Energy LLC / Linn Energy Finance Corp.
6.2500%, 11/1/19 (144A) | | | 15,236,190 | | | |
| | 6,480,000 | | | Oasis Petroleum, Inc.
6.5000%, 11/1/21 | | | 6,642,000 | | | |
| | 14,096,000 | | | Quicksilver Resources, Inc.
7.1250%, 4/1/16 | | | 12,404,480 | | | |
| | 26,694,000 | | | Samson Investment Co.
10.0000%, 2/15/20 (144A) | | | 28,128,802 | | | |
| | 8,468,000 | | | SandRidge Energy, Inc.
7.5000%, 3/15/21 | | | 8,086,940 | | | |
| | 10,777,000 | | | SandRidge Energy, Inc.
8.1250%, 10/15/22 | | | 10,669,230 | | | |
| | 5,712,000 | | | SandRidge Energy, Inc.
7.5000%, 2/15/23 | | | 5,426,400 | | | |
| | 2,762,000 | | | SM Energy Co.
6.6250%, 2/15/19 | | | 2,893,195 | | | |
| | 4,374,000 | | | SM Energy Co.
6.5000%, 11/15/21 | | | 4,592,700 | | | |
| | 2,741,000 | | | SM Energy Co.
6.5000%, 1/1/23 | | | 2,878,050 | | | |
| | 10,901,000 | | | Stone Energy Corp.
7.5000%, 11/15/22 | | | 11,282,535 | | | |
| | 12,740,000 | | | Venoco, Inc.
8.8750%, 2/15/19 | | | 12,421,500 | | | |
| | 19,676,000 | | | W&T Offshore, Inc.
8.5000%, 6/15/19 | | | 20,315,470 | | | |
| | | | | | | | 371,468,049 | | | |
| Oil Field Machinery and Equipment – 0.5% | | | | | | |
| | 10,712,000 | | | Dresser-Rand Group, Inc.
6.5000%, 5/1/21 | | | 11,354,720 | | | |
| Oil Refining and Marketing – 1.9% | | | | | | |
| | 5,096,000 | | | Frontier Oil Corp.
6.8750%, 11/15/18 | | | 5,465,460 | | | |
| | 19,770,000 | | | PBF Holding Co. LLC / PBF Finance Corp.
8.2500%, 2/15/20 | | | 20,709,075 | | | |
| | 19,339,000 | | | Western Refining, Inc.
6.2500%, 4/1/21 (144A) | | | 18,903,872 | | | |
| | | | | | | | 45,078,407 | | | |
| Paper and Related Products – 0.8% | | | | | | |
| | 13,230,000 | | | Resolute Forest Products, Inc.
5.8750%, 5/15/23 (144A) | | | 11,807,775 | | | |
| | 5,490,000 | | | Unifrax I LLC / Unifrax Holding Co.
7.5000%, 2/15/19 (144A) | | | 5,599,800 | | | |
| | | | | | | | 17,407,575 | | | |
| Pipelines – 3.6% | | | | | | |
| | 3,396,000 | | | Atlas Pipeline Partners L.P. / Atlas Pipeline Finance Corp.
6.6250%, 10/1/20 (144A) | | | 3,404,490 | | | |
| | 10,885,000 | | | Crestwood Midstream Partners L.P. / Crestwood Midstream Finance Corp.
7.7500%, 4/1/19 | | | 11,211,550 | | | |
| | 11,129,000 | | | Crestwood Midstream Partners L.P. / Crestwood Midstream Finance Corp.
7.7500%, 4/1/19 (144A) | | | 11,462,870 | | | |
| | 8,367,000 | | | Holly Energy Partners L.P. / Holly Energy Finance Corp.
6.5000%, 3/1/20 | | | 8,429,752 | | | |
| | 5,695,000 | | | MarkWest Energy Partners L.P. / MarkWest Energy Finance Corp.
6.2500%, 6/15/22 | | | 5,865,850 | | | |
See Notes to Schedules of Investments and Other Information and Notes to Financial Statements.
40 | JUNE 30, 2013
Schedule of Investments
As of June 30, 2013
| | | | | | | | | | | |
| Shares or Principal Amount | | Value | | | |
| |
| Pipelines – (continued) | | | | | | |
| | $4,194,000 | | | Regency Energy Partners L.P. / Regency Energy Finance Corp.
6.8750%, 12/1/18 | | $ | 4,414,185 | | | |
| | 14,372,000 | | | Sabine Pass Liquefaction LLC
5.6250%, 2/1/21 (144A) | | | 13,940,840 | | | |
| | 8,396,000 | | | Sabine Pass Liquefaction LLC
5.6250%, 4/15/23 (144A) | | | 7,934,220 | | | |
| | 7,929,000 | | | Targa Resources Partners L.P. / Targa Resources Partners Finance Corp.
6.3750%, 8/1/22 | | | 8,305,628 | | | |
| | 6,708,000 | | | Targa Resources Partners L.P. / Targa Resources Partners Finance Corp.
5.2500%, 5/1/23 (144A) | | | 6,422,910 | | | |
| | 2,838,000 | | | Tesoro Logistics L.P. / Tesoro Logistics Finance Corp.
5.8750%, 10/1/20 (144A) | | | 2,795,430 | | | |
| | | | | | | | 84,187,725 | | | |
| Poultry – 1.0% | | | | | | |
| | 22,496,000 | | | Pilgrim’s Pride Corp.
7.8750%, 12/15/18 | | | 23,958,240 | | | |
| Printing – Commercial – 1.1% | | | | | | |
| | 15,023,000 | | | ARC Document Solutions, Inc.
10.5000%, 12/15/16 | | | 14,985,442 | | | |
| | 11,667,000 | | | Cenveo Corp.
8.8750%, 2/1/18 | | | 11,258,655 | | | |
| | | | | | | | 26,244,097 | | | |
| Publishing – Periodicals – 0.4% | | | | | | |
| | 10,650,000 | | | Nielsen Finance LLC / Nielsen Finance Co.
4.5000%, 10/1/20 (144A) | | | 10,224,000 | | | |
| Radio – 1.3% | | | | | | |
| | 17,412,000 | | | Entercom Radio LLC
10.5000%, 12/1/19 | | | 19,544,970 | | | |
| | 9,682,000 | | | Townsquare Radio LLC / Townsquare Radio, Inc.
9.0000%, 4/1/19 (144A) | | | 10,311,330 | | | |
| | | | | | | | 29,856,300 | | | |
| Real Estate Management/Services – 1.9% | | | | | | |
| | 16,652,000 | | | Kennedy-Wilson, Inc.
8.7500%, 4/1/19 (144A) | | | 17,900,900 | | | |
| | 24,237,000 | | | Kennedy-Wilson, Inc.
8.7500%, 4/1/19 | | | 26,054,775 | | | |
| | | | | | | | 43,955,675 | | | |
| Rental Auto/Equipment – 1.0% | | | | | | |
| | 13,585,000 | | | Ahern Rentals, Inc.
9.5000%, 6/15/18 (144A) | | | 13,551,037 | | | |
| | 3,906,000 | | | NES Rentals Holdings, Inc.
7.8750%, 5/1/18 (144A) | | | 3,857,175 | | | |
| | 5,111,000 | | | United Rentals N.A., Inc.
8.3750%, 9/15/20 | | | 5,532,658 | | | |
| | | | | | | | 22,940,870 | | | |
| Research & Development – 0.2% | | | | | | |
| | 4,657,000 | | | Jaguar Holding Co. II / Jaguar Merger Sub, Inc.
9.5000%, 12/1/19 (144A) | | | 5,145,985 | | | |
| Retail – Drug Store – 0.1% | | | | | | |
| | 2,528,000 | | | Rite Aid Corp.
9.2500%, 3/15/20 | | | 2,790,280 | | | |
| Retail – Leisure Products – 0.2% | | | | | | |
| | 4,363,000 | | | Steinway Musical Instruments, Inc.
7.0000%, 3/1/14 (144A) | | | 4,368,497 | | | |
| Retail – Perfume and Cosmetics – 0.6% | | | | | | |
| | 11,724,000 | | | Sally Holdings LLC / Sally Capital, Inc.
6.8750%, 11/15/19 | | | 12,573,990 | | | |
| Retail – Propane Distribution – 0.2% | | | | | | |
| | 5,476,000 | | | Ferrellgas Partners L.P. / Ferrellgas Partners Finance Corp.
8.6250%, 6/15/20 | | | 5,571,830 | | | |
| Retail – Regional Department Stores – 0.5% | | | | | | |
| | 6,593,000 | | | Bon-Ton Department Stores, Inc.
8.0000%, 6/15/21 (144A) | | | 6,700,136 | | | |
| | 7,123,000 | | | JC Penney Corp., Inc.
6.3750%, 10/15/36 | | | 5,555,940 | | | |
| | | | | | | | 12,256,076 | | | |
| Retail – Restaurants – 1.9% | | | | | | |
| | 21,409,000 | | | Landry’s, Inc.
9.3750%, 5/1/20 (144A) | | | 22,586,495 | | | |
| | 18,967,000 | | | Wok Acquisition Corp.
10.2500%, 6/30/20 (144A) | | | 20,863,700 | | | |
| | | | | | | | 43,450,195 | | | |
| Retail – Toy Store – 0.6% | | | | | | |
| | 3,539,000 | | | Toys R Us Property Co. II LLC
8.5000%, 12/1/17 | | | 3,676,136 | | | |
| | 10,356,000 | | | Toys R Us, Inc.
10.3750%, 8/15/17 | | | 10,356,000 | | | |
| | | | | | | | 14,032,136 | | | |
| Semiconductor Equipment – 0.6% | | | | | | |
| | 13,824,000 | | | Sensata Technologies B.V.
6.5000%, 5/15/19 (144A) | | | 14,860,800 | | | |
| Steel – Producers – 2.0% | | | | | | |
| | 6,031,000 | | | ArcelorMittal
6.0000%, 3/1/21 | | | 6,000,845 | | | |
| | 11,960,000 | | | ArcelorMittal
6.7500%, 2/25/22 | | | 12,259,000 | | | |
| | 3,403,000 | | | Edgen Murray Corp.
8.7500%, 11/1/20 (144A) | | | 3,385,985 | | | |
| | 11,400,000 | | | Steel Dynamics, Inc.
6.1250%, 8/15/19 (144A) | | | 12,055,500 | | | |
| | 11,166,000 | | | Steel Dynamics, Inc.
6.3750%, 8/15/22 (144A) | | | 11,780,130 | | | |
| | | | | | | | 45,481,460 | | | |
| Steel – Specialty – 0.2% | | | | | | |
| | 4,973,000 | | | Permian Holdings, Inc.
10.5000%, 1/15/18 (144A) | | | 4,823,810 | | | |
| Telecommunication Equipment – 0.7% | | | | | | |
| | 17,469,000 | | | CommScope Holding Co., Inc.
6.6250%, 6/1/20 (144A) | | | 16,682,895 | | | |
| | | | | | | | | | | |
See Notes to Schedules of Investments and Other Information and Notes to Financial Statements.
Janus Fixed Income & Money Market Funds | 41
Janus High-Yield Fund
Schedule of Investments
As of June 30, 2013
| | | | | | | | | | | |
| Shares or Principal Amount | | Value | | | |
| |
| Telecommunication Services – 0.2% | | | | | | |
| | $3,247,000 | | | Level 3 Communications, Inc.
11.8750%, 2/1/19 | | $ | 3,677,228 | | | |
| | 1,724,000 | | | Level 3 Communications, Inc.
8.8750%, 6/1/19 | | | 1,792,960 | | | |
| | | | | | | | 5,470,188 | | | |
| Telephone – Integrated – 3.0% | | | | | | |
| | 13,840,000 | | | Level 3 Financing, Inc.
9.3750%, 4/1/19 | | | 14,947,200 | | | |
| | 4,615,000 | | | Level 3 Financing, Inc.
8.1250%, 7/1/19 | | | 4,845,750 | | | |
| | 6,434,000 | | | Level 3 Financing, Inc.
7.0000%, 6/1/20 | | | 6,417,915 | | | |
| | 14,025,000 | | | Softbank Corp.
4.5000%, 4/15/20 (144A) | | | 13,516,594 | | | |
| | 2,754,000 | | | Sprint Capital Corp.
6.9000%, 5/1/19 | | | 2,864,160 | | | |
| | 15,335,000 | | | Sprint Capital Corp.
6.8750%, 11/15/28 | | | 14,721,600 | | | |
| | 11,499,000 | | | Sprint Capital Corp.
8.7500%, 3/15/32 | | | 12,648,900 | | | |
| | | | | | | | 69,962,119 | | | |
| Theaters – 0.4% | | | | | | |
| | 8,253,000 | | | National CineMedia LLC
7.8750%, 7/15/21 | | | 8,954,505 | | | |
| Transportation – Railroad – 0.7% | | | | | | |
| | 10,635,000 | | | Florida East Coast Railway Corp.
8.1250%, 2/1/17 | | | 11,246,513 | | | |
| | 3,901,000 | | | Watco Cos. LLC / Watco Finance Corp.
6.3750%, 4/1/23 (144A) | | | 3,881,495 | | | |
| | | | | | | | 15,128,008 | | | |
| Transportation – Truck – 0.7% | | | | | | |
| | 15,254,000 | | | Swift Services Holdings, Inc.
10.0000%, 11/15/18 | | | 16,855,670 | | | |
| Water Treatment Systems – 1.1% | | | | | | |
| | 6,681,000 | | | Nuverra Environmental Solutions, Inc.
9.8750%, 4/15/18 (144A) | | | 7,020,194 | | | |
| | 18,537,000 | | | Nuverra Environmental Solutions, Inc.
9.8750%, 4/15/18 | | | 19,463,850 | | | |
| | | | | | | | 26,484,044 | | | |
| |
| |
| Total Corporate Bonds (cost $1,970,063,413) | | | 1,991,325,703 | | | |
| |
| |
| Preferred Stock – 0.4% | | | | | | |
| Steel – Producers – 0.4% | | | | | | |
| | 508,550 | | | ArcelorMittal, 6.0000% (cost $13,023,804) | | | 9,545,483 | | | |
| |
| |
| Money Market – 4.5% | | | | | | |
| | 104,382,849 | | | Janus Cash Liquidity Fund LLC, 0%£
(cost $104,382,849) | | | 104,382,849 | | | |
| |
| |
| Total Investments (total cost $2,272,396,274) – 98.7% | | | 2,293,759,502 | | | |
| |
| |
| Cash, Receivables and Other Assets, net of Liabilities**– 1.3% | | | 30,755,451 | | | |
| |
| |
| Net Assets – 100% | | $ | 2,324,514,953 | | | |
| |
| |
Summary of Investments by Country – (Long Positions) (unaudited)
| | | | | | | | | |
| | | | | | % of Investment
| |
| Country | | Value | | | Securities | |
| |
| |
| Australia | | $ | 17,734,478 | | | | 0.8% | |
| Brazil | | | 18,937,352 | | | | 0.8% | |
| Canada | | | 38,930,916 | | | | 1.7% | |
| Greece | | | 19,058,820 | | | | 0.8% | |
| Japan | | | 13,516,594 | | | | 0.6% | |
| Luxembourg | | | 27,805,328 | | | | 1.2% | |
| Netherlands | | | 10,224,000 | | | | 0.4% | |
| Singapore | | | 15,044,330 | | | | 0.7% | |
| Spain | | | 7,974,960 | | | | 0.4% | |
United States†† | | | 2,124,532,724 | | | | 92.6% | |
| |
| |
| Total | | $ | 2,293,759,502 | | | | 100.0% | |
| | | |
| †† | | Includes Cash Equivalents of 4.6%. |
See Notes to Schedules of Investments and Other Information and Notes to Financial Statements.
42 | JUNE 30, 2013
Janus Short-Term Bond Fund (unaudited)
| | | | | | | |
Fund Snapshot
We believe a bottom-up, fundamentally driven investment process that focuses on credit-oriented investments can generate risk-adjusted outperformance relative to our peers over time. Our comprehensive bottom-up view drives decision-making at a macro level, enabling us to make informed decisions about overall portfolio allocations.
| | | |
Gibson Smith
co-portfolio manager | |
Darrell Watters
co-portfolio manager |
Performance Summary
During the one-year period ended June 30, 2013, Janus Short-Term Bond Fund’s Class T Shares returned 0.90% compared with 0.74% for the Fund’s benchmark, the Barclays 1-3 Year U.S. Government/Credit Index.
Market Environment
The 12 months ended June 30, 2013 were largely characterized by concern about global fiscal policies and their impact on economic growth. Overall, corporate credit spreads narrowed during the period. Longer-term U.S. Treasury bond yields rose, particularly in the final months as U.S. economic data began to improve.
The period began with concern about slow global economic growth, prompting additional stimulus from major central banks including the U.S. Federal Reserve (Fed), the European Central Bank and the Bank of Japan. Toward the end of calendar year 2012, worries grew about the “fiscal cliff,” a potentially recessionary mix of U.S. spending cuts and tax increases scheduled to take effect in January 2013. However, lawmakers delayed some elements of the fiscal cliff until March 2013, softening the impact, and the Fed continued to reiterate support for the markets via quantitative easing (QE) and near-zero interest rates.
By spring, there were signs that economic growth was improving. The U.S. economy seemed to weather the impact of government spending cuts that took effect in March, and employment data showed strengthening hiring patterns beginning in April. By May, markets were beginning to speculate about the eventual end of the Fed’s QE program, driving up longer-term Treasury yields. Meanwhile, Japan’s attempts to reflate its economy appeared to be having an effect, with signs of improving exports, rising manufacturing activity and increasing capital spending. Europe’s economy showed signs of stabilization, although growth expectations declined for China.
Performance Discussion
Overall, we increased the Fund’s weighting to corporate credit during the period, as we reacted to changing economic and market factors. Corporate credit represented 72.03% of holdings at period end, up from 65.96% a year earlier. At period end, we were significantly overweight to credit compared with the benchmark, which was roughly 18% weighted to credit at the end of the period. This approach rewarded shareholders as the Fund outperformed during the period, primarily through our security selection and overweight to credit, along with our excess spread carry, or the additional income generated by higher-yielding credit relative to the securities in the benchmark. This was balanced to some extent by our greater allocation to longer-duration credit, which tends not to fare as well when interest rates rise, as they did during the year.
Our underweight allocation to U.S. Treasury securities contributed, as well, as short-term interest rates moved incrementally higher. We reduced our Treasury exposure during the period, reflecting our increasingly defensive stance against interest rate risk and the relatively attractive risk-adjusted returns that we were seeing in corporate credit markets. At the end of June, our allocation to U.S. Treasury securities was 22.64%, compared with 29.39% a year earlier.
Our small allocation to commercial asset-backed securities (ABS) was a contributor to relative performance; these are loans backed by hard assets, such as vehicles or capital equipment. Our holdings in commercial mortgage-backed securities (CMBS) and bank loans also contributed.
Credit Contributors to Performance
Contributors were led by American International Group (AIG), an international insurer that offers property-casualty insurance, life insurance and retirement services. Over the past few years, AIG has simplified itself and transformed its balance sheet by selling noncore assets and
Janus Fixed Income & Money Market Funds | 43
Janus Short-Term Bond Fund (unaudited)
deleveraging its capital structure. During the period AIG finished repaying all of the $182 billion owed to the U.S. government from the company’s bailout during the 2007-2008 financial crisis. We believe its core business units are on strong footing, and that AIG remains focused on reducing high-cost debt and improving its ratings.
Engineering and construction company URS Corp. also performed well. In our opinion this is a company undergoing fundamental balance sheet improvement, and is likely to benefit from an improving global economy.
JPMorgan Chase & Co. also contributed. JPMorgan continued to maintain one of the strongest balance sheets in the industry, despite the cost of correcting a large trading loss announced in 2012. It has highly diversified businesses that have helped the company manage through credit losses and increased regulation while maintaining profitability.
Credit Detractors from Performance
Chemical company LyondellBasell and automaker General Motors detracted, primarily because our holdings were in relatively long duration securities.
Online brokerage firm E*Trade also detracted. E*Trade is a liquid name that tends to be traded actively during periods of market volatility. In addition, our holdings were in longer-duration securities.
Outlook
We believe employment data will continue to drive Fed action. While the employment picture has become brighter, it remains a long way from where the Fed needs it to be in order to begin “normalizing” the federal funds rate. The Fed is targeting a 6.5% unemployment rate as a turning point for policy. Most Fed policymakers don’t see that happening before 2015, and we take them at their word. Inflation remains low and disinflationary pressures have re-emerged, which should give the Fed room to keep short-term interest rates near zero for an extended period.
Risks to a continued U.S. economic recovery abound, with slowing growth in China, perpetual unrest in the Middle East, Europe’s financial crises and a rising U.S. dollar, which threatens export volumes. Any of these risks could flare and cause a pullback in risk and flight back to the relative safety of U.S. Treasury securities, which keeps us positive on the short end of the credit and Treasury curves. Expectations for corporate earnings are generally high for the second half of 2013, but talk of higher taxes or any of the aforementioned risks could disappoint investors in risk markets as well.
We plan to maintain a defensive posture in Treasuries over the near term and will reinvest maturing issues at higher corporate rates; we believe this can be a good way to preserve capital and build wealth in short-term bond markets. Fed policy should keep the front end of the yield curve anchored and the curve relatively steep, which we believe offers good opportunity for short-term bond investors to benefit from roll-down, or the return component associated with the price of a bond over time as it moves closer to maturity and the risk of owning it diminishes.
On behalf of each member of our investment team, thank you for your investment in the Janus Short-Term Bond Fund. We appreciate you entrusting us with your assets and look forward to continuing to serve your investment needs.
44 | JUNE 30, 2013
(unaudited)
Janus Short-Term Bond Fund At A Glance
June 30, 2013
| | | |
| Weighted Average Maturity | | 2.5 Years |
| Average Effective Duration* | | 1.9 Years |
| 30-day Current Yield** | | |
| Class A Shares at NAV | | |
| Without Reimbursement | | 0.81% |
| With Reimbursement | | 0.89% |
| Class A Shares at MOP | | |
| Without Reimbursement | | 0.79% |
| With Reimbursement | | 0.86% |
| Class C Shares*** | | |
| Without Reimbursement | | 0.01% |
| With Reimbursement | | 0.14% |
| Class D Shares | | |
| Without Reimbursement | | 0.92% |
| With Reimbursement | | 1.00% |
| Class I Shares | | |
| Without Reimbursement | | 1.04% |
| With Reimbursement | | 1.13% |
| Class N Shares | | |
| Without Reimbursement | | 1.10% |
| With Reimbursement | | 1.14% |
| Class S Shares | | |
| Without Reimbursement | | 0.60% |
| With Reimbursement | | 0.64% |
| Class T Shares | | |
| Without Reimbursement | | 0.85% |
| With Reimbursement | | 0.89% |
| Number of Bonds/Notes | | 186 |
| | | |
| * | | A theoretical measure of price volatility |
| ** | | Yield will fluctuate |
| *** | | Does not include the 1.00% contingent deferred sales charge. |
Ratings† Summary – (% of Fixed Income Securities)
June 30, 2013
| | | |
AAA | | 1.3% |
AA | | 27.0% |
A | | 21.0% |
BBB | | 30.0% |
BB | | 13.1% |
B | | 4.3% |
Other | | 3.3% |
| | | |
| † | | Bond ratings provided by Standard & Poor’s. Not rated securities are not rated by S&P but may be rated by other rating agencies. Bond ratings are measured on a scale that generally ranges from AAA (highest) to D (lowest). |
Significant Areas of Investment – (% of Net Assets)
As of June 30, 2013
Asset Allocation – (% of Net Assets)
As of June 30, 2013
Janus Fixed Income & Money Market Funds | 45
Janus Short-Term Bond Fund (unaudited)
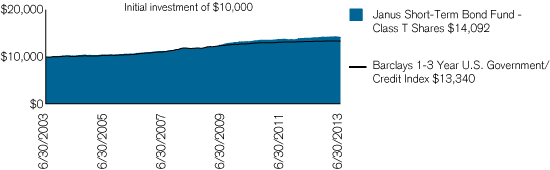
| | | | | | | | | | | | | | |
| Average Annual Total Return – for the periods ended June 30, 2013 | | | Expense Ratios – per the October 26, 2012 prospectuses |
| | | One
| | Five
| | Ten
| | Since
| | | Total Annual Fund
| | Net Annual Fund
|
| | | Year | | Year | | Year | | Inception* | | | Operating Expenses | | Operating Expenses |
| | | | | | | | | | | | | | |
Janus Short-Term Bond Fund –
Class A Shares | | | | | | | | | | | | | |
| | | | | | | | | | | | | | |
| NAV | | 1.22% | | 3.93% | | 3.23% | | 4.09% | | | 0.94% | | 0.80% |
| | | | | | | | | | | | | | |
| MOP | | –1.34% | | 2.92% | | 2.73% | | 3.85% | | | | | |
| | | | | | | | | | | | | | |
Janus Short-Term Bond Fund –
Class C Shares | | | | | | | | | | | | | |
| | | | | | | | | | | | | | |
| NAV | | 0.46% | | 3.30% | | 2.61% | | 3.42% | | | 1.68% | | 1.55% |
| | | | | | | | | | | | | | |
| CDSC | | –0.53% | | 3.30% | | 2.61% | | 3.42% | | | | | |
| | | | | | | | | | | | | | |
Janus Short-Term Bond Fund –
Class D Shares(1) | | 1.01% | | 4.05% | | 3.53% | | 4.48% | | | 0.74% | | 0.69% |
| | | | | | | | | | | | | | |
Janus Short-Term Bond Fund –
Class I Shares | | 1.48% | | 3.97% | | 3.44% | | 4.32% | | | 0.64% | | 0.55% |
| | | | | | | | | | | | | | |
Janus Short-Term Bond Fund –
Class N Shares | | 1.48% | | 3.97% | | 3.49% | | 4.46% | | | 0.60% | | 0.55% |
| | | | | | | | | | | | | | |
Janus Short-Term Bond Fund –
Class S Shares | | 1.03% | | 3.66% | | 3.03% | | 3.91% | | | 1.09% | | 1.05% |
| | | | | | | | | | | | | | |
Janus Short-Term Bond Fund –
Class T Shares | | 0.90% | | 3.97% | | 3.49% | | 4.46% | | | 0.84% | | 0.80% |
| | | | | | | | | | | | | | |
| Barclays 1-3 Year U.S. Government/Credit Index | | 0.74% | | 2.47% | | 2.92% | | 4.51%** | | | | | |
| | | | | | | | | | | | | | |
| Morningstar Quartile – Class T Shares | | 3rd | | 1st | | 1st | | 1st | | | | | |
| | | | | | | | | | | | | | |
| Morningstar Ranking – based on total returns for Short-Term Bond Funds | | 261/442 | | 97/413 | | 78/345 | | 42/169 | | | | | |
| | | | | | | | | | | | | | |
| Visit janus.com/advisor/mutual-funds (or janus.com/allfunds if you hold Shares directly with Janus Capital) to view current performance and characteristic information | | | | | |
| | | | | | | | | | | | | | |
Returns quoted are past performance and do not guarantee future results; current performance may be lower or higher. Investment returns and principal value will vary; there may be a gain or loss when shares are sold. For the most recent month–end performance call 877.33JANUS(52687) (or 800.525.3713 if you hold shares directly with Janus Capital) or visit janus.com/advisor/mutual-funds (or janus.com/allfunds if you hold shares directly with Janus Capital).
See important disclosures on the next page.
46 | JUNE 30, 2013
(unaudited)
Performance shown for Class A Shares at Maximum Offering Price (MOP) includes the Fund’s maximum sales charge of 2.50%. Performance shown at Net Asset Value (NAV) does not include this charge and would have been lower had this charge been taken into account.
Performance shown for Class C Shares includes a 1% contingent deferred sales charge (CDSC) on periods of less than 12 months. Performance shown at Net Asset Value (NAV) does not include this sales charge and would have been lower had this sales charge been taken into account.
Net expense ratios reflect the expense waiver, if any, Janus Capital has contractually agreed to through November 1, 2013.
The expense ratios for Class A Shares and Class N Shares shown are estimated.
The Fund’s performance may be affected by risks that include those associated with non-investment grade debt securities, investments in specific industries or countries and potential conflicts of interest with the Janus “funds of funds.” Additional risks to the Fund may include those associated with investing in foreign securities, emerging markets, initial public offerings (“IPOs”), real estate investment trusts (“REITs”), and derivatives. Please see the Fund’s prospectuses or janus.com/info (or janus.com/reports if you hold shares directly with Janus Capital) for more information about risks, portfolio holdings and other details.
Funds that invest in bonds have the same interest rate, inflation, and credit risks that are associated with the underlying bonds owned by the Fund. Unlike owning individual bonds, there are ongoing fees and expenses associated with owning shares of Fixed Income Funds. The return of principal is not guaranteed due to net asset value fluctuation that is caused by changes in the price of specific bonds held in the Fund and selling of bonds within the Fund by the portfolio managers.
The Fund invests in mortgage-backed securities. Mortgage-backed securities are subject to prepayment risk (early payoff of mortgages during periods of declining interest rates) and extension risk (extending the duration of mortgage-backed securities during periods of rising interest rates). These risks may increase the volatility of these securities and affect total returns.
High-yield/high-risk bonds, also known as “junk” bonds, involve a greater risk of default and price volatility than investment grade bonds. High-yield/high-risk bonds can experience sudden and sharp price swings which will affect net asset value.
The Fund invests in REITs, which may be subject to a higher degree of market risk because of concentration in a specific industry, sector or geographic region. REITs may be subject to risks including, but not limited to: legal, political, liquidity, interest rate risks, a decline in the value of real estate, risks related to general and economic conditions, changes in the value of the underlying property owned by the trust and defaults by borrowers. To the extent the Fund invests in foreign REITs, the Fund may be subject to fluctuations in currency rates or political or economic conditions in a particular country.
The Fund may invest in derivatives which can be highly volatile and involve additional risks than if the underlying securities were held directly by the Fund. Such risks include gains or losses which, as a result of leverage, can be substantially greater than the derivatives’ original cost. There is also a possibility that derivatives may not perform as intended which can reduce opportunity for gains or result in losses by offsetting positive returns in other securities the Fund owns.
The Fund will normally invest at least 80% of its net assets, measured at the time of purchase, in the type of securities described by its name.
Returns include reinvestment of all dividends and distributions. The returns do not include adjustments in accordance with generally accepted accounting principles required at the period end for financial reporting purposes.
Class A Shares, Class C Shares, Class I Shares, and Class S Shares of the Fund commenced operations on July 6, 2009. The performance shown for periods prior to July 6, 2009 reflects the historical performance of a similar share class of the Fund, calculated using the fees and expenses of each respective share class without the effect of any fee and expense limitations or waivers.
Class D Shares of the Fund commenced operations on February 16, 2010, as a result of the restructuring of Class J Shares, the predecessor share class. The performance shown for periods prior to February 16, 2010 reflects the historical performance of the Fund’s predecessor share class.
Class N Shares of the Fund commenced operations on May 31, 2012. The performance shown for periods prior to May 31, 2012 reflects the historical performance of a similar share class of the Fund.
If each share class of the Fund had been available during periods prior to its commencement, the performance shown may have been different. The performance shown for periods following the Fund’s commencement of each share class reflects the fees and expenses of each respective share class, net of any applicable fee and expense limitations or waivers. Please refer to the Fund’s prospectuses for further details concerning historical performance.
Ranking is for the share class shown only; other classes may have different performance characteristics. When an expense waiver is in effect, it may have a material effect on the total return or yield, and therefore the ranking for the period.
© 2013 Morningstar, Inc. All Rights Reserved.
There is no assurance that the investment process will consistently lead to successful investing.
See Notes to Schedules of Investments and Other Information for index definitions.
The Fund’s portfolio may differ significantly from the securities held in the index. The index is unmanaged and is not available for direct investment; therefore, its performance does not reflect the expenses associated with the active management of an actual portfolio.
See “Useful Information About Your Fund Report.”
Janus Fixed Income & Money Market Funds | 47
Janus Short-Term Bond Fund (unaudited)
| | | |
| * | | The Fund’s inception date – September 1, 1992 |
| ** | | The Barclays 1-3 Year U.S. Government/Credit Index’s since inception returns are calculated from August 31, 1992. |
| (1) | | Closed to new investors. |
As a shareholder of the Fund, you incur two types of costs: (1) transaction costs, such as sales charges (loads) on purchase payments (applicable to Class A Shares only); and (2) ongoing costs, including management fees; distribution and shareholder servicing (12b-1) fees; administrative services fees payable pursuant to the Transfer Agency Agreement; and other Fund expenses. This example is intended to help you understand your ongoing costs (in dollars) of investing in the Fund and to compare these costs with the ongoing costs of investing in other mutual funds. To do so, compare this 5% hypothetical example with the 5% hypothetical examples that appear in the shareholder reports of the other funds. The example is based upon an investment of $1,000 invested at the beginning of the period and held for the six-months indicated, unless noted otherwise in the table and footnotes below.
Actual Expenses
The information in the table under the heading “Actual” provides information about actual account values and actual expenses. You may use the information in these columns, together with the amount you invested, to estimate the expenses that you paid over the period. Simply divide your account value by $1,000 (for example, an $8,600 account value divided by $1,000 = 8.6), then multiply the result by the number in the appropriate column for your share class under the heading entitled “Expenses Paid During Period” to estimate the expenses you paid on your account during the period.
Hypothetical Example for Comparison Purposes
The information in the table under the heading “Hypothetical (5% return before expenses)” provides information about hypothetical account values and hypothetical expenses based upon the Fund’s actual expense ratio and an assumed rate of return of 5% per year before expenses, which is not the Fund’s actual return. The hypothetical account values and expenses may not be used to estimate the actual ending account balance or expenses you paid for the period. You may use this information to compare the ongoing costs of investing in the Fund and other funds. To do so, compare this 5% hypothetical example with the 5% hypothetical examples that appear in the shareholder reports of the other funds. Additionally, for an analysis of the fees associated with an investment in any share class or other similar funds, please visit www.finra.org/fundanalyzer.
Please note that the expenses shown in the table are meant to highlight your ongoing costs only and do not reflect any transaction costs. These fees are fully described in the Fund’s prospectuses. Therefore, the hypothetical examples are useful in comparing ongoing costs only, and will not help you determine the relative total costs of owning different funds. In addition, if these transaction costs were included, your costs would have been higher.
| | | | | | | | | | | | | | | | | | | | | | | | | | | | | | | |
| | | | | Hypothetical
| | | | |
| | | Actual | | (5% return before expenses) | | | | |
| | | Beginning
| | Ending
| | Expenses
| | Beginning
| | Ending
| | Expenses
| | | | |
| | | Account
| | Account
| | Paid During
| | Account
| | Account
| | Paid During
| | Net Annualized
| | |
| | | Value
| | Value
| | Period
| | Value
| | Value
| | Period
| | Expense Ratio
| | |
| | | (1/1/13) | | (6/30/13) | | (1/1/13 - 6/30/13)† | | (1/1/13) | | (6/30/13) | | (1/1/13 - 6/30/13)† | | (1/1/13 - 6/30/13) | | |
| |
| |
| Class A Shares | | $ | 1,000.00 | | | $ | 997.40 | | | $ | 4.01 | | | $ | 1,000.00 | | | $ | 1,020.78 | | | $ | 4.06 | | | | 0.81% | | | |
| |
| |
| Class C Shares | | $ | 1,000.00 | | | $ | 993.70 | | | $ | 7.66 | | | $ | 1,000.00 | | | $ | 1,017.11 | | | $ | 7.75 | | | | 1.55% | | | |
| |
| |
| Class D Shares | | $ | 1,000.00 | | | $ | 998.00 | | | $ | 3.37 | | | $ | 1,000.00 | | | $ | 1,021.42 | | | $ | 3.41 | | | | 0.68% | | | |
| |
| |
| Class I Shares | | $ | 1,000.00 | | | $ | 998.70 | | | $ | 2.73 | | | $ | 1,000.00 | | | $ | 1,022.07 | | | $ | 2.76 | | | | 0.55% | | | |
| |
| |
| Class N Shares | | $ | 1,000.00 | | | $ | 998.70 | | | $ | 2.73 | | | $ | 1,000.00 | | | $ | 1,022.07 | | | $ | 2.76 | | | | 0.55% | | | |
| |
| |
| Class S Shares | | $ | 1,000.00 | | | $ | 1,000.00 | | | $ | 4.66 | | | $ | 1,000.00 | | | $ | 1,020.13 | | | $ | 4.71 | | | | 0.94% | | | |
| |
| |
| Class T Shares | | $ | 1,000.00 | | | $ | 997.40 | | | $ | 3.91 | | | $ | 1,000.00 | | | $ | 1,020.88 | | | $ | 3.96 | | | | 0.79% | | | |
| |
| |
| | | |
| † | | Expenses Paid During Period are equal to the Net Annualized Expense Ratio multiplied by the average account value over the period, multiplied by the number of days in the most recent six-month period, divided by the number of days in the fiscal year. Expenses in the examples include the effect of applicable fee waivers and/or expense reimbursements, if any. Had such waivers and/or reimbursements not been in effect, your expenses would have been higher. Please refer to the Notes to Financial Statements or the Fund’s prospectuses for more information regarding waivers and/or reimbursements. |
48 | JUNE 30, 2013
Janus Short-Term Bond Fund
Schedule of Investments
As of June 30, 2013
| | | | | | | | | | | |
| Shares or Principal Amount | | Value | | | |
| |
| Asset-Backed/Commercial Mortgage-Backed Securities – 4.3% | | | | | | |
| | $16,507,000 | | | AmeriCredit Automobile Receivables Trust
1.9300%, 8/8/18 | | $ | 16,322,848 | | | |
| | 13,681,948 | | | Banc of America Large Loan Trust
2.4990%, 11/15/15 (144A),‡ | | | 13,692,566 | | | |
| | 8,835,000 | | | Gracechurch Card Funding PLC
0.8992%, 6/15/17 (144A),‡ | | | 8,898,435 | | | |
| | 30,586,000 | | | Permanent Master Issuer PLC
1.8271%, 7/15/42 (144A),‡ | | | 31,079,414 | | | |
| | 14,074,300 | | | Santander Consumer Acquired Receivables Trust
2.0100%, 8/15/16 (144A) | | | 14,154,931 | | | |
| | 867,480 | | | Santander Drive Auto Receivables Trust
1.8900%, 5/15/17 (144A) | | | 870,186 | | | |
| | 12,782,000 | | | Santander Drive Auto Receivables Trust
1.9400%, 4/16/18 | | | 12,688,295 | | | |
| | 8,939,715 | | | SMART Trust
1.5400%, 3/14/15 (144A) | | | 8,972,944 | | | |
| | 18,233,000 | | | SMART Trust
2.5200%, 11/14/16 (144A) | | | 18,538,512 | | | |
| | 3,797,000 | | | SMART Trust
0.9700%, 3/14/17 | | | 3,797,000 | | | |
| |
| |
| Total Asset-Backed/Commercial Mortgage-Backed Securities (cost $128,776,402) | | | 129,015,131 | | | |
| |
| |
| Bank Loan – 0.2% | | | | | | |
| Metal – Iron – 0.2% | | | | | | |
| | 4,777,895 | | | FMG Resources (August 2006) Pty, Ltd.
5.2500%, 10/18/17‡ (cost $4,736,365) | | | 4,745,787 | | | |
| |
| |
| Corporate Bonds – 71.5% | | | | | | |
| Advertising Services – 0.1% | | | | | | |
| | 1,618,000 | | | WPP Finance UK
5.8750%, 6/15/14 | | | 1,687,289 | | | |
| Aerospace and Defense – Equipment – 0.8% | | | | | | |
| | 9,974,000 | | | Exelis, Inc.
4.2500%, 10/1/16 | | | 10,516,197 | | | |
| | 13,953,000 | | | TransDigm, Inc.
7.7500%, 12/15/18 | | | 14,685,532 | | | |
| | | | | | | | 25,201,729 | | | |
| Airlines – 0.3% | | | | | | |
| | 9,271,000 | | | Southwest Airlines Co.
5.2500%, 10/1/14 | | | 9,704,632 | | | |
| Apparel Manufacturers – 0.3% | | | | | | |
| | 8,121,000 | | | Hanesbrands, Inc.
6.3750%, 12/15/20 | | | 8,659,016 | | | |
| Beverages – Non-Alcoholic – 1.0% | | | | | | |
| | 29,986,000 | | | PepsiCo, Inc.
0.7000%, 8/13/15 | | | 29,978,354 | | | |
| Building – Residential and Commercial – 0.3% | | | | | | |
| | 8,730,000 | | | Lennar Corp.
5.6000%, 5/31/15 | | | 9,166,500 | | | |
| Building Products – Cement and Aggregate – 0.2% | | | | | | |
| | 5,238,000 | | | CRH America, Inc.
5.3000%, 10/15/13 | | | 5,304,313 | | | |
| Cable/Satellite Television – 0% | | | | | | |
| | 1,048,000 | | | Time Warner Cable, Inc.
6.2000%, 7/1/13 | | | 1,048,000 | | | |
| Casino Hotels – 0.9% | | | | | | |
| | 14,840,000 | | | MGM Resorts International
6.6250%, 7/15/15 | | | 15,823,150 | | | |
| | 3,513,000 | | | MGM Resorts International
7.5000%, 6/1/16 | | | 3,829,170 | | | |
| | 6,317,000 | | | MGM Resorts International
7.6250%, 1/15/17 | | | 6,901,323 | | | |
| | | | | | | | 26,553,643 | | | |
| Cellular Telecommunications – 0.8% | | | | | | |
| | 1,615,000 | | | Cellco Partnership / Verizon Wireless Capital LLC
7.3750%, 11/15/13 | | | 1,653,487 | | | |
| | 1,659,000 | | | Cellco Partnership / Verizon Wireless Capital LLC
5.5500%, 2/1/14 | | | 1,703,176 | | | |
| | 18,339,000 | | | Sprint Nextel Corp.
6.0000%, 12/1/16 | | | 19,347,645 | | | |
| | | | | | | | 22,704,308 | | | |
| Chemicals – Diversified – 1.5% | | | | | | |
| | 40,963,000 | | | LyondellBasell Industries N.V.
5.0000%, 4/15/19 | | | 44,571,676 | | | |
| Chemicals – Specialty – 2.1% | | | | | | |
| | 15,634,000 | | | Ashland, Inc.
3.0000%, 3/15/16 (144A) | | | 15,712,170 | | | |
| | 20,346,000 | | | Ashland, Inc.
3.8750%, 4/15/18 (144A) | | | 20,142,540 | | | |
| | 14,399,000 | | | Ecolab, Inc.
2.3750%, 12/8/14 | | | 14,685,224 | | | |
| | 11,972,000 | | | Ecolab, Inc.
1.0000%, 8/9/15 | | | 11,959,046 | | | |
| | | | | | | | 62,498,980 | | | |
| Coatings and Paint Products – 0.5% | | | | | | |
| | 14,031,000 | | | RPM International, Inc.
6.2500%, 12/15/13 | | | 14,329,748 | | | |
| Commercial Banks – 6.9% | | | | | | |
| | 7,843,000 | | | Associated Banc-Corp
1.8750%, 3/12/14 | | | 7,856,804 | | | |
| | 27,155,000 | | | BBVA U.S. Senior SAU
4.6640%, 10/9/15 | | | 27,972,990 | | | |
| | 17,282,000 | | | Canadian Imperial Bank of Commerce
1.4500%, 9/13/13 | | | 17,321,783 | | | |
| | 23,605,000 | | | CIT Group, Inc.
5.2500%, 4/1/14 (144A) | | | 23,959,075 | | | |
| | 2,349,000 | | | CIT Group, Inc.
4.7500%, 2/15/15 (144A) | | | 2,387,171 | | | |
| | 40,650,000 | | | CIT Group, Inc.
5.0000%, 5/15/17 | | | 41,513,812 | | | |
| | 14,330,000 | | | HSBC Bank PLC
1.6250%, 8/12/13 (144A) | | | 14,351,051 | | | |
| | 14,057,000 | | | Intesa Sanpaolo SpA
3.1250%, 1/15/16 | | | 13,821,658 | | | |
| | 7,575,000 | | | National Bank of Canada
1.6500%, 1/30/14 (144A) | | | 7,625,753 | | | |
| | 17,547,000 | | | Nordea Bank A.B.
1.7500%, 10/4/13 (144A) | | | 17,607,186 | | | |
See Notes to Schedules of Investments and Other Information and Notes to Financial Statements.
Janus Fixed Income & Money Market Funds | 49
Janus Short-Term Bond Fund
Schedule of Investments
As of June 30, 2013
| | | | | | | | | | | |
| Shares or Principal Amount | | Value | | | |
| |
| Commercial Banks – (continued) | | | | | | |
| | $15,649,000 | | | Nordea Bank A.B.
0.8750%, 5/13/16 (144A) | | $ | 15,476,548 | | | |
| | 4,308,000 | | | Regions Financial Corp.
7.7500%, 11/10/14 | | | 4,655,139 | | | |
| | 10,548,000 | | | Regions Financial Corp.
2.0000%, 5/15/18 | | | 9,971,119 | | | |
| | 1,544,000 | | | Zions Bancorp
4.0000%, 6/20/16 | | | 1,615,598 | | | |
| | | | | | | | 206,135,687 | | | |
| Commercial Services – Finance – 0.5% | | | | | | |
| | 15,760,000 | | | Total System Services, Inc.
2.3750%, 6/1/18 | | | 15,269,013 | | | |
| Data Processing and Management – 1.2% | | | | | | |
| | 15,816,000 | | | Dun & Bradstreet Corp.
3.2500%, 12/1/17 | | | 15,930,603 | | | |
| | 18,777,000 | | | Fiserv, Inc.
3.1250%, 10/1/15 | | | 19,586,720 | | | |
| | 1,429,000 | | | Fiserv, Inc.
3.1250%, 6/15/16 | | | 1,490,100 | | | |
| | | | | | | | 37,007,423 | | | |
| Diversified Banking Institutions – 11.3% | | | | | | |
| | 4,854,000 | | | Bank of America Corp.
4.5000%, 4/1/15 | | | 5,091,487 | | | |
| | 8,567,000 | | | Bank of America Corp.
1.5000%, 10/9/15 | | | 8,547,536 | | | |
| | 31,395,000 | | | Bank of America Corp.
1.2500%, 1/11/16 | | | 30,960,116 | | | |
| | 15,930,000 | | | Bank of America Corp.
3.6250%, 3/17/16 | | | 16,640,590 | | | |
| | 6,695,000 | | | Bank of America Corp.
3.7500%, 7/12/16 | | | 7,018,255 | | | |
| | 50,961,000 | | | Citigroup, Inc.
5.0000%, 9/15/14 | | | 52,960,047 | | | |
| | 7,328,000 | | | Citigroup, Inc.
4.8750%, 5/7/15 | | | 7,730,417 | | | |
| | 39,812,000 | | | Goldman Sachs Group, Inc.
3.6250%, 2/7/16 | | | 41,558,194 | | | |
| | 4,197,000 | | | Goldman Sachs Group, Inc.
5.6250%, 1/15/17 | | | 4,548,646 | | | |
| | 18,101,000 | | | JPMorgan Chase & Co.
4.8750%, 3/15/14 | | | 18,613,059 | | | |
| | 38,434,000 | | | JPMorgan Chase & Co.
5.1500%, 10/1/15 | | | 41,524,862 | | | |
| | 13,103,000 | | | Morgan Stanley
4.2000%, 11/20/14 | | | 13,554,791 | | | |
| | 17,013,000 | | | Morgan Stanley
3.4500%, 11/2/15 | | | 17,555,102 | | | |
| | 15,735,000 | | | Morgan Stanley
1.7500%, 2/25/16 | | | 15,588,177 | | | |
| | 6,806,000 | | | Morgan Stanley
3.8000%, 4/29/16 | | | 7,078,655 | | | |
| | 31,611,000 | | | Royal Bank of Scotland Group PLC
2.5500%, 9/18/15 | | | 32,140,769 | | | |
| | 15,431,000 | | | UBS A.G.
2.2500%, 8/12/13 | | | 15,457,341 | | | |
| | 2,269,000 | | | UBS A.G.
5.8750%, 7/15/16 | | | 2,498,024 | | | |
| | | | | | | | 339,066,068 | | | |
| Diversified Financial Services – 1.9% | | | | | | |
| | 4,363,000 | | | General Electric Capital Corp.
3.5000%, 6/29/15 | | | 4,552,415 | | | |
| | 13,985,000 | | | General Electric Capital Corp.
2.3750%, 6/30/15 | | | 14,343,086 | | | |
| | 18,122,000 | | | General Electric Capital Corp.
4.3750%, 9/21/15 | | | 19,359,225 | | | |
| | 17,113,000 | | | General Electric Capital Corp.
5.0000%, 1/8/16 | | | 18,663,181 | | | |
| | | | | | | | 56,917,907 | | | |
| Diversified Minerals – 0.2% | | | | | | |
| | 7,363,000 | | | FMG Resources (August 2006) Pty, Ltd.
7.0000%, 11/1/15 (144A) | | | 7,436,630 | | | |
| Diversified Operations – 1.2% | | | | | | |
| | 17,769,000 | | | Eaton Corp.
0.9500%, 11/2/15 (144A) | | | 17,698,777 | | | |
| | 19,600,000 | | | Ingersoll-Rand Global Holding Co., Ltd.
2.8750%, 1/15/19 (144A) | | | 19,334,969 | | | |
| | | | | | | | 37,033,746 | | | |
| Electric – Distribution – 0.2% | | | | | | |
| | 5,281,000 | | | SP PowerAssets, Ltd.
5.0000%, 10/22/13 (144A) | | | 5,339,851 | | | |
| Electric – Generation – 0% | | | | | | |
| | 1,273,000 | | | AES Corp.
7.7500%, 10/15/15 | | | 1,403,483 | | | |
| Electric – Integrated – 1.1% | | | | | | |
| | 5,922,000 | | | CMS Energy Corp.
2.7500%, 5/15/14 | | | 6,005,701 | | | |
| | 1,440,000 | | | Duke Energy Corp.
6.3000%, 2/1/14 | | | 1,485,834 | | | |
| | 873,000 | | | Georgia Power Co.
6.0000%, 11/1/13 | | | 888,559 | | | |
| | 1,309,000 | | | Monongahela Power Co., Inc.
7.9500%, 12/15/13 (144A) | | | 1,349,956 | | | |
| | 4,365,000 | | | Nisource Finance Corp.
5.4000%, 7/15/14 | | | 4,561,831 | | | |
| | 15,184,000 | | | PPL WEM Holdings PLC
3.9000%, 5/1/16 (144A) | | | 15,868,738 | | | |
| | 4,365,000 | | | Union Electric Co.
4.6500%, 10/1/13 | | | 4,399,558 | | | |
| | | | | | | | 34,560,177 | | | |
| Electronic Components – Semiconductors – 1.0% | | | | | | |
| | 29,257,000 | | | Samsung Electronics America, Inc.
1.7500%, 4/10/17 (144A) | | | 28,979,088 | | | |
| Electronic Measuring Instruments – 0.5% | | | | | | |
| | 13,433,000 | | | FLIR Systems, Inc.
3.7500%, 9/1/16 | | | 13,884,376 | | | |
| Engineering – Research and Development Services – 0.3% | | | | | | |
| | 10,202,000 | | | URS Corp.
4.3500%, 4/1/17 (144A) | | | 10,393,165 | | | |
| Fiduciary Banks – 0.1% | | | | | | |
| | 1,746,000 | | | Northern Trust Corp.
5.5000%, 8/15/13 | | | 1,756,958 | | | |
| Finance – Auto Loans – 3.5% | | | | | | |
| | 19,402,000 | | | Ford Motor Credit Co. LLC
3.8750%, 1/15/15 | | | 19,998,495 | | | |
See Notes to Schedules of Investments and Other Information and Notes to Financial Statements.
50 | JUNE 30, 2013
Schedule of Investments
As of June 30, 2013
| | | | | | | | | | | |
| Shares or Principal Amount | | Value | | | |
| |
| Finance – Auto Loans – (continued) | | | | | | |
| | $28,245,000 | | | Ford Motor Credit Co. LLC
2.7500%, 5/15/15 | | $ | 28,640,148 | | | |
| | 10,200,000 | | | Ford Motor Credit Co. LLC
4.2500%, 2/3/17 | | | 10,657,225 | | | |
| | 26,097,000 | | | General Motors Financial Co., Inc.
2.7500%, 5/15/16 (144A) | | | 25,672,924 | | | |
| | 4,146,000 | | | General Motors Financial Co., Inc.
3.2500%, 5/15/18 (144A) | | | 4,031,985 | | | |
| | 15,579,000 | | | PACCAR Financial Corp.
0.7500%, 8/14/15 | | | 15,597,866 | | | |
| | | | | | | | 104,598,643 | | | |
| Finance – Credit Card – 0.2% | | | | | | |
| | 5,953,000 | | | American Express Credit Corp.
1.7500%, 6/12/15 | | | 6,033,776 | | | |
| Finance – Investment Bankers/Brokers – 1.4% | | | | | | |
| | 14,322,000 | | | E*TRADE Financial Corp.
6.0000%, 11/15/17 | | | 14,465,220 | | | |
| | 24,684,000 | | | Raymond James Financial, Inc.
4.2500%, 4/15/16 | | | 26,086,816 | | | |
| | 1,790,000 | | | TD Ameritrade Holding Corp.
4.1500%, 12/1/14 | | | 1,874,168 | | | |
| | | | | | | | 42,426,204 | | | |
| Finance – Leasing Companies – 0.2% | | | | | | |
| | 7,040,000 | | | International Lease Finance Corp.
2.2238%, 6/15/16‡ | | | 6,987,200 | | | |
| Finance – Other Services – 0.1% | | | | | | |
| | 1,674,000 | | | National Rural Utilities Cooperative Finance Corp.
5.5000%, 7/1/13 | | | 1,674,000 | | | |
| Food – Confectionary – 0.3% | | | | | | |
| | 8,765,000 | | | WM Wrigley Jr. Co.
3.7000%, 6/30/14 (144A) | | | 8,995,651 | | | |
| Food – Meat Products – 0.2% | | | | | | |
| | 5,083,000 | | | JBS USA LLC / JBS USA Finance, Inc.
11.6250%, 5/1/14 | | | 5,362,565 | | | |
| Food – Miscellaneous/Diversified – 1.2% | | | | | | |
| | 9,026,000 | | | ConAgra Foods, Inc.
1.3000%, 1/25/16 | | | 9,040,884 | | | |
| | 9,494,000 | | | Dole Food Co., Inc.
8.7500%, 7/15/13 | | | 9,508,241 | | | |
| | 8,590,000 | | | General Mills, Inc.
1.5500%, 5/16/14 | | | 8,664,973 | | | |
| | 7,356,000 | | | Kraft Foods Group, Inc.
1.6250%, 6/4/15 | | | 7,434,437 | | | |
| | | | | | | | 34,648,535 | | | |
| Food – Retail – 0.6% | | | | | | |
| | 4,646,000 | | | Stater Bros Holdings, Inc.
7.7500%, 4/15/15 | | | 4,657,661 | | | |
| | 12,512,000 | | | Stater Bros Holdings, Inc.
7.3750%, 11/15/18 | | | 13,231,440 | | | |
| | | | | | | | 17,889,101 | | | |
| Linen Supply & Related Items – 0.2% | | | | | | |
| | 5,043,000 | | | Cintas Corp. No. 2
2.8500%, 6/1/16 | | | 5,264,922 | | | |
| Machinery – Farm – 0.1% | | | | | | |
| | 2,619,000 | | | Case New Holland, Inc.
7.8750%, 12/1/17 | | | 2,966,018 | | | |
| Machinery – General Industrial – 0.2% | | | | | | |
| | 5,645,000 | | | Wabtec Corp.
6.8750%, 7/31/13 | | | 5,666,169 | | | |
| Medical – Drugs – 2.1% | | | | | | |
| | 42,042,000 | | | AbbVie, Inc.
1.2000%, 11/6/15 (144A) | | | 42,088,204 | | | |
| | 16,317,000 | | | GlaxoSmithKline Capital PLC
0.7500%, 5/8/15 | | | 16,313,345 | | | |
| | 5,893,000 | | | Zoetis, Inc.
1.1500%, 2/1/16 (144A) | | | 5,872,982 | | | |
| | | | | | | | 64,274,531 | | | |
| Metal Processors and Fabricators – 0.3% | | | | | | |
| | 8,884,000 | | | Precision Castparts Corp.
0.7000%, 12/20/15 | | | 8,831,727 | | | |
| Multi-Line Insurance – 2.1% | | | | | | |
| | 42,043,000 | | | American International Group, Inc.
4.2500%, 9/15/14 | | | 43,600,399 | | | |
| | 18,785,000 | | | American International Group, Inc.
2.3750%, 8/24/15 | | | 19,081,314 | | | |
| | | | | | | | 62,681,713 | | | |
| Multimedia – 1.5% | | | | | | |
| | 11,705,000 | | | NBCUniversal Enterprise, Inc.
0.8170%, 4/15/16 (144A),‡ | | | 11,739,729 | | | |
| | 17,312,000 | | | NBCUniversal Media LLC
2.1000%, 4/1/14 | | | 17,520,488 | | | |
| | 14,194,000 | | | Time Warner, Inc.
3.1500%, 7/15/15 | | | 14,826,584 | | | |
| | | | | | | | 44,086,801 | | | |
| Office Automation and Equipment – 0% | | | | | | |
| | 972,000 | | | Xerox Corp.
8.2500%, 5/15/14 | | | 1,032,709 | | | |
| Oil Companies – Exploration and Production – 4.0% | | | | | | |
| | 15,407,000 | | | Canadian Natural Resources, Ltd.
1.4500%, 11/14/14 | | | 15,531,596 | | | |
| | 25,835,000 | | | Chesapeake Energy Corp.
3.2500%, 3/15/16 | | | 25,705,825 | | | |
| | 7,123,000 | | | Continental Resources, Inc.
8.2500%, 10/1/19 | | | 7,799,685 | | | |
| | 8,222,000 | | | Harvest Operations Corp.
6.8750%, 10/1/17 | | | 9,167,530 | | | |
| | 12,796,000 | | | Petrohawk Energy Corp.
10.5000%, 8/1/14 | | | 13,448,596 | | | |
| | 20,010,000 | | | Petrohawk Energy Corp.
7.8750%, 6/1/15 | | | 20,440,215 | | | |
| | 14,205,000 | | | Plains Exploration & Production Co.
6.5000%, 11/15/20 | | | 15,060,212 | | | |
| | 11,895,000 | | | Whiting Petroleum Corp.
7.0000%, 2/1/14 | | | 12,162,638 | | | |
| | | | | | | | 119,316,297 | | | |
| Oil Companies – Integrated – 1.5% | | | | | | |
| | 43,108,000 | | | Phillips 66
1.9500%, 3/5/15 | | | 43,776,476 | | | |
| Oil Refining and Marketing – 0.1% | | | | | | |
| | 4,190,000 | | | Sunoco, Inc.
4.8750%, 10/15/14 | | | 4,363,948 | | | |
| | | | | | | | | | | |
See Notes to Schedules of Investments and Other Information and Notes to Financial Statements.
Janus Fixed Income & Money Market Funds | 51
Janus Short-Term Bond Fund
Schedule of Investments
As of June 30, 2013
| | | | | | | | | | | |
| Shares or Principal Amount | | Value | | | |
| |
| Paper and Related Products – 0.1% | | | | | | |
| | $1,929,000 | | | Cascades, Inc.
7.8750%, 1/15/20 | | $ | 2,015,805 | | | |
| Pharmacy Services – 3.4% | | | | | | |
| | 59,942,000 | | | Express Scripts Holding Co.
2.7500%, 11/21/14 | | | 61,260,604 | | | |
| | 31,195,000 | | | Express Scripts Holding Co.
2.1000%, 2/12/15 | | | 31,724,847 | | | |
| | 8,408,000 | | | Express Scripts Holding Co.
3.1250%, 5/15/16 | | | 8,743,109 | | | |
| | | | | | | | 101,728,560 | | | |
| Pipelines – 4.3% | | | | | | |
| | 27,234,000 | | | Crosstex Energy L.P. / Crosstex Energy Finance Corp.
8.8750%, 2/15/18 | | | 28,868,040 | | | |
| | 26,187,000 | | | DCP Midstream Operating L.P.
2.5000%, 12/1/17 | | | 25,849,240 | | | |
| | 8,778,000 | | | Enterprise Products Operating LLC
1.2500%, 8/13/15 | | | 8,806,809 | | | |
| | 2,820,000 | | | Kinder Morgan Energy Partners L.P.
5.0000%, 12/15/13 | | | 2,873,312 | | | |
| | 23,277,000 | | | Kinder Morgan Finance Co. LLC
5.7000%, 1/5/16 | | | 24,931,902 | | | |
| | 10,683,000 | | | Kinder Morgan Finance Co. LLC
6.0000%, 1/15/18 (144A) | | | 11,216,071 | | | |
| | 1,718,000 | | | Kinder Morgan, Inc.
5.1500%, 3/1/15 | | | 1,774,742 | | | |
| | 18,310,000 | | | Plains All American Pipeline L.P. / PAA Finance Corp.
3.9500%, 9/15/15 | | | 19,419,458 | | | |
| | 6,145,000 | | | TransCanada PipeLines, Ltd.
0.8750%, 3/2/15 | | | 6,150,346 | | | |
| | | | | | | | 129,889,920 | | | |
| Property and Casualty Insurance – 0.4% | | | | | | |
| | 13,095,000 | | | ACE INA Holdings, Inc.
2.6000%, 11/23/15 | | | 13,590,777 | | | |
| Property Trust – 0.3% | | | | | | |
| | 8,585,000 | | | WT Finance Aust Pty, Ltd. / Westfield Capital / WEA Finance LLC
5.1250%, 11/15/14 (144A) | | | 9,131,023 | | | |
| Publishing – Newspapers – 0.6% | | | | | | |
| | 17,603,000 | | | Gannett Co., Inc.
6.3750%, 9/1/15 | | | 19,011,240 | | | |
| Publishing – Periodicals – 0.4% | | | | | | |
| | 10,490,000 | | | Nielsen Finance LLC / Nielsen Finance Co.
7.7500%, 10/15/18 | | | 11,276,750 | | | |
| Reinsurance – 0% | | | | | | |
| | 1,015,000 | | | Berkshire Hathaway Finance Corp.
5.0000%, 8/15/13 | | | 1,020,695 | | | |
| REIT – Office Property – 0.5% | | | | | | |
| | 14,151,000 | | | Reckson Operating Partnership L.P.
6.0000%, 3/31/16 | | | 15,419,694 | | | |
| REIT – Regional Malls – 0.1% | | | | | | |
| | 3,470,000 | | | Simon Property Group L.P.
4.9000%, 1/30/14 | | | 3,552,510 | | | |
| REIT – Warehouse and Industrial – 0.4% | | | | | | |
| | 5,257,000 | | | ProLogis L.P.
5.6250%, 11/15/15 | | | 5,693,673 | | | |
| | 5,565,000 | | | ProLogis L.P.
5.7500%, 4/1/16 | | | 6,109,329 | | | |
| | | | | | | | 11,803,002 | | | |
| Retail – Drug Store – 0% | | | | | | |
| | 1,486,000 | | | Walgreen Co.
4.8750%, 8/1/13 | | | 1,490,827 | | | |
| Retail – Propane Distribution – 0.3% | | | | | | |
| | 8,651,000 | | | Ferrellgas L.P. / Ferrellgas Finance Corp.
9.1250%, 10/1/17 | | | 9,040,295 | | | |
| Retail – Restaurants – 0.5% | | | | | | |
| | 15,471,000 | | | Brinker International, Inc.
2.6000%, 5/15/18 | | | 15,142,489 | | | |
| Savings/Loan/Thrifts – 0.3% | | | | | | |
| | 10,016,000 | | | Amsouth Bank
5.2000%, 4/1/15 | | | 10,391,600 | | | |
| Semiconductor Components/Integrated Circuits – 0.8% | | | | | | |
| | 11,835,000 | | | TSMC Global, Ltd.
0.9500%, 4/3/16 (144A) | | | 11,655,723 | | | |
| | 13,847,000 | | | TSMC Global, Ltd.
1.6250%, 4/3/18 (144A) | | | 13,311,772 | | | |
| | | | | | | | 24,967,495 | | | |
| Steel – Producers – 1.1% | | | | | | |
| | 10,865,000 | | | ArcelorMittal
4.2500%, 2/25/15 | | | 10,946,487 | | | |
| | 7,017,000 | | | ArcelorMittal
4.2500%, 8/5/15 | | | 7,087,170 | | | |
| | 15,412,000 | | | ArcelorMittal
4.2500%, 3/1/16 | | | 15,489,060 | | | |
| | | | | | | | 33,522,717 | | | |
| Super-Regional Banks – 0.1% | | | | | | |
| | 3,230,000 | | | PNC Funding Corp.
5.2500%, 11/15/15 | | | 3,515,106 | | | |
| Telephone – Integrated – 0.8% | | | | | | |
| | 22,395,000 | | | British Telecommunications PLC
2.0000%, 6/22/15 | | | 22,831,389 | | | |
| Transportation – Services – 0.8% | | | | | | |
| | 20,364,000 | | | Asciano Finance, Ltd.
3.1250%, 9/23/15 (144A) | | | 20,809,055 | | | |
| | 873,000 | | | FedEx Corp.
7.3750%, 1/15/14 | | | 903,425 | | | |
| | 2,171,000 | | | United Parcel Service, Inc.
3.8750%, 4/1/14 | | | 2,225,822 | | | |
| | | | | | | | 23,938,302 | | | |
| Transportation – Truck – 0.1% | | | | | | |
| | 2,948,000 | | | JB Hunt Transport Services, Inc.
3.3750%, 9/15/15 | | | 3,073,523 | | | |
| Trucking and Leasing – 1.2% | | | | | | |
| | 11,091,000 | | | Penske Truck Leasing Co. L.P. / PTL Finance Corp.
2.5000%, 7/11/14 (144A) | | | 11,249,058 | | | |
See Notes to Schedules of Investments and Other Information and Notes to Financial Statements.
52 | JUNE 30, 2013
Schedule of Investments
As of June 30, 2013
| | | | | | | | | | | |
| Shares or Principal Amount | | Value | | | |
| |
| Trucking and Leasing – (continued) | | | | | | |
| | $15,768,000 | | | Penske Truck Leasing Co. L.P. / PTL Finance Corp.
2.5000%, 3/15/16 (144A) | | $ | 16,038,894 | | | |
| | 8,730,000 | | | Penske Truck Leasing Co. L.P. / PTL Finance Corp.
2.8750%, 7/17/18 (144A) | | | 8,816,820 | | | |
| | | | | | | | 36,104,772 | | | |
| |
| |
| Total Corporate Bonds (cost $2,149,685,364) | | | 2,149,927,237 | | | |
| |
| |
| U.S. Treasury Notes/Bonds – 22.6% | | | | | | |
| | | | | U.S. Treasury Notes/Bonds: | | | | | | |
| | 199,140,000 | | | 0.2500%, 2/28/14** | | | 199,287,762 | | | |
| | 14,845,000 | | | 1.2500%, 3/15/14 | | | 14,959,811 | | | |
| | 11,768,000 | | | 0.2500%, 3/31/14 | | | 11,775,814 | | | |
| | 33,115,000 | | | 0.2500%, 4/30/14 | | | 33,136,988 | | | |
| | 9,483,000 | | | 0.2500%, 6/30/14 | | | 9,488,557 | | | |
| | 77,903,000 | | | 0.6250%, 7/15/14 | | | 78,243,826 | | | |
| | 1,749,000 | | | 0.5000%, 8/15/14 | | | 1,754,738 | | | |
| | 58,375,000 | | | 0.2500%, 8/31/14 | | | 58,400,101 | | | |
| | 8,786,000 | | | 0.2500%, 9/15/14 | | | 8,789,093 | | | |
| | 75,547,000 | | | 0.2500%, 10/31/14 | | | 75,576,539 | | | |
| | 155,069,000 | | | 0.2500%, 1/15/15 | | | 155,038,761 | | | |
| | 18,606,000 | | | 0.2500%, 2/15/15 | | | 18,595,097 | | | |
| | 423,000 | | | 0.3750%, 3/15/15 | | | 423,496 | | | |
| | 15,246,000 | | | 1.0000%, 5/31/18 | | | 14,983,952 | | | |
| |
| |
| Total U.S. Treasury Notes/Bonds (cost $679,969,339) | | | 680,454,535 | | | |
| |
| |
| Short-Term Taxable Variable Rate Demand Note – 0% | | | | | | |
| | 940,000 | | | California Infrastructure & Economic Development Bank
0.3400%, 4/1/24‡ (cost $940,000) | | | 940,000 | | | |
| |
| |
| Money Market – 1.3% | | | | | | |
| | 39,010,000 | | | Janus Cash Liquidity Fund LLC, 0%£
(cost $39,010,000) | | | 39,010,000 | | | |
| |
| |
| Total Investments (total cost $3,003,117,470) – 99.9% | | | 3,004,092,690 | | | |
| |
| |
| Cash, Receivables and Other Assets, net of Liabilities – 0.1% | | | 3,584,624 | | | |
| |
| |
| Net Assets – 100% | | $ | 3,007,677,314 | | | |
| |
| |
Summary of Investments by Country – (Long Positions) (unaudited)
| | | | | | | | | |
| | | | | | % of Investment
| |
| Country | | Value | | | Securities | |
| |
| |
| Australia | | $ | 73,430,951 | | | | 2.4% | |
| Brazil | | | 5,362,565 | | | | 0.2% | |
| Canada | | | 48,645,283 | | | | 1.6% | |
| Ireland | | | 5,304,313 | | | | 0.2% | |
| Italy | | | 13,821,658 | | | | 0.5% | |
| Luxembourg | | | 33,522,717 | | | | 1.1% | |
| Netherlands | | | 11,276,750 | | | | 0.4% | |
| Singapore | | | 5,339,851 | | | | 0.2% | |
| South Korea | | | 38,146,618 | | | | 1.3% | |
| Spain | | | 27,972,990 | | | | 0.9% | |
| Sweden | | | 33,083,734 | | | | 1.1% | |
| Switzerland | | | 17,955,365 | | | | 0.6% | |
| Taiwan | | | 24,967,495 | | | | 0.8% | |
| United Kingdom | | | 127,301,692 | | | | 4.2% | |
United States†† | | | 2,537,960,708 | | | | 84.5% | |
| |
| |
| Total | | $ | 3,004,092,690 | | | | 100.0% | |
| | | |
| †† | | Includes Cash Equivalents of 1.3%. |
See Notes to Schedules of Investments and Other Information and Notes to Financial Statements.
Janus Fixed Income & Money Market Funds | 53
Janus Money Market Funds (unaudited)
| | | |
Janus Government Money Market Fund
| | |
Average Annual Total Return
| | Portfolio Manager
|
| For the Periods Ended June 30, 2013 | | Eric Thorderson |
| |
| |
Class D Shares(1) | | |
| 1 Year | | 0.01% |
| 5 Year | | 0.13% |
| 10 Year | | 1.47% |
| Since Inception (February 14, 1995) | | 2.74% |
| Class T Shares | | |
| 1 Year | | 0.01% |
| 5 Year | | 0.13% |
| 10 Year | | 1.47% |
| Since Inception (February 14, 1995) | | 2.74% |
| |
| |
| Seven-Day Current Yield | | |
Class D Shares(1) | | |
| With Reimbursement | | 0.0100% |
| Without Reimbursement | | -0.4600% |
| Class T Shares | | |
| With Reimbursement | | 0.0100% |
| Without Reimbursement | | -0.4800% |
| |
| |
| Expense Ratio | | |
Per the October 26, 2012 prospectuses | | |
| |
| |
Class D Shares(1) | | |
| Total Annual Fund Operating Expenses | | 0.69% |
| Class T Shares | | |
| Total Annual Fund Operating Expenses | | 0.71% |
| |
| |
| | | |
Janus Money Market
| | |
Fund
| | |
Average Annual Total Return
| | Portfolio Manager
|
| For the Periods Ended June 30, 2013 | | Eric Thorderson |
| |
| |
Class D Shares(1) | | |
| 1 Year | | 0.00% |
| 5 Year | | 0.16% |
| 10 Year | | 1.55% |
| Since Inception (February 14, 1995) | | 2.83% |
| Class T Shares | | |
| 1 Year | | 0.00% |
| 5 Year | | 0.16% |
| 10 Year | | 1.55% |
| Since Inception (February 14, 1995) | | 2.83% |
| |
| |
| Seven-Day Current Yield | | |
Class D Shares(1) | | |
| With Reimbursement | | 0.0000% |
| Without Reimbursement | | -0.4500% |
| Class T Shares | | |
| With Reimbursement | | 0.0000% |
| Without Reimbursement | | -0.4700% |
| |
| |
| Expense Ratio | | |
Per the October 26, 2012 prospectuses | | |
| |
| |
Class D Shares(1) | | |
| Total Annual Fund Operating Expenses | | 0.67% |
| Class T Shares | | |
| Total Annual Fund Operating Expenses | | 0.69% |
| |
| |
Returns quoted are past performance and do not guarantee future results; current performance may be lower or higher. For the most recent month-end performance call 877.33JANUS(52687) (or 800.525.3713 if you hold shares directly with Janus Capital) or visit janus.com/advisor/mutual-funds (or janus.com/allfunds if you hold shares directly with Janus Capital).
An investment in a money market fund is not insured or guaranteed by the Federal Deposit Insurance Corporation or any other government agency. Although the money market fund seeks to preserve the value of your investment at $1.00 per share, it is possible to lose money by investing in the Fund.
Janus Capital has voluntarily agreed to waive one-half of its investment advisory fee and such additional fees to the extent necessary to assist each Fund in attempting to maintain a yield of at least 0.00%. Such reimbursements could be changed or terminated at any time.
Class D Shares of each Fund commenced operations on February 16, 2010, as a result of the restructuring of Class J Shares, the predecessor share class. The performance shown for Class D Shares for periods prior to February 16, 2010, reflects the performance of each Fund’s former Class J Shares. If Class D Shares of each Fund had been available during periods prior to February 16, 2010, the performance shown may have been different. The performance shown for periods following each Fund’s commencement of Class D Shares reflects the fees and expenses of Class D Shares, net of any fee and expense limitations or waivers.
Returns include reinvestment of all dividends and distributions.
The yield more closely reflects the current earnings of each Fund than the total return.
See Notes to Schedules of Investments and Other Information and Notes to Financial Statements.
See “Useful Information About Your Fund Report.”
| | | |
| (1) | | Closed to new investors. |
54 | JUNE 30, 2013
Janus Government Money Market Fund (unaudited)
As a shareholder of the Fund, you incur two types of costs: (1) transaction costs, such as sales charges (loads) on purchase payments (applicable to Class A Shares only); and (2) ongoing costs, including management fees; distribution and shareholder servicing (12b-1) fees; administrative services fees payable pursuant to the Transfer Agency Agreement; and other Fund expenses. This example is intended to help you understand your ongoing costs (in dollars) of investing in the Fund and to compare these costs with the ongoing costs of investing in other mutual funds. To do so, compare this 5% hypothetical example with the 5% hypothetical examples that appear in the shareholder reports of the other funds. The example is based upon an investment of $1,000 invested at the beginning of the period and held for the six-months indicated, unless noted otherwise in the table and footnotes below.
Actual Expenses
The information in the table under the heading “Actual” provides information about actual account values and actual expenses. You may use the information in these columns, together with the amount you invested, to estimate the expenses that you paid over the period. Simply divide your account value by $1,000 (for example, an $8,600 account value divided by $1,000 = 8.6), then multiply the result by the number in the appropriate column for your share class under the heading entitled “Expenses Paid During Period” to estimate the expenses you paid on your account during the period.
Hypothetical Example for Comparison Purposes
The information in the table under the heading “Hypothetical (5% return before expenses)” provides information about hypothetical account values and hypothetical expenses based upon the Fund’s actual expense ratio and an assumed rate of return of 5% per year before expenses, which is not the Fund’s actual return. The hypothetical account values and expenses may not be used to estimate the actual ending account balance or expenses you paid for the period. You may use this information to compare the ongoing costs of investing in the Fund and other funds. To do so, compare this 5% hypothetical example with the 5% hypothetical examples that appear in the shareholder reports of the other funds. Additionally, for an analysis of the fees associated with an investment in any share class or other similar funds, please visit www.finra.org/fundanalyzer.
Please note that the expenses shown in the table are meant to highlight your ongoing costs only and do not reflect any transaction costs. These fees are fully described in the Fund’s prospectuses. Therefore, the hypothetical examples are useful in comparing ongoing costs only, and will not help you determine the relative total costs of owning different funds. In addition, if these transaction costs were included, your costs would have been higher.
| | | | | | | | | | | | | | | | | | | | | | | | | | | | | | | |
| | | | | Hypothetical
| | | | |
| | | Actual | | (5% return before expenses) | | | | |
| | | Beginning
| | Ending
| | Expenses
| | Beginning
| | Ending
| | Expenses
| | | | |
| | | Account
| | Account
| | Paid During
| | Account
| | Account
| | Paid During
| | Net Annualized
| | |
| | | Value
| | Value
| | Period
| | Value
| | Value
| | Period
| | Expense Ratio
| | |
| | | (1/1/13) | | (6/30/13) | | (1/1/13 - 6/30/13)† | | (1/1/13) | | (6/30/13) | | (1/1/13 - 6/30/13)† | | (1/1/13 - 6/30/13) | | |
| |
| |
| Class D Shares | | $ | 1,000.00 | | | $ | 1,000.00 | | | $ | 0.84 | | | $ | 1,000.00 | | | $ | 1,023.95 | | | $ | 0.85 | | | | 0.17% | | | |
| |
| |
| Class T Shares | | $ | 1,000.00 | | | $ | 1,000.00 | | | $ | 0.84 | | | $ | 1,000.00 | | | $ | 1,023.95 | | | $ | 0.85 | | | | 0.17% | | | |
| |
| |
| | | |
| † | | Expenses Paid During Period are equal to the Net Annualized Expense Ratio multiplied by the average account value over the period, multiplied by the number of days in the most recent six-month period, divided by the number of days in the fiscal year. Expenses in the examples include the effect of applicable fee waivers and/or expense reimbursements, if any. Had such waivers and/or reimbursements not been in effect, your expenses would have been higher. Please refer to the Notes to Financial Statements or the Fund’s prospectuses for more information regarding waivers and/or reimbursements. |
Janus Fixed Income & Money Market Funds | 55
Janus Money Market Fund (unaudited)
As a shareholder of the Fund, you incur two types of costs: (1) transaction costs, such as sales charges (loads) on purchase payments (applicable to Class A Shares only); and (2) ongoing costs, including management fees; distribution and shareholder servicing (12b-1) fees; administrative services fees payable pursuant to the Transfer Agency Agreement; and other Fund expenses. This example is intended to help you understand your ongoing costs (in dollars) of investing in the Fund and to compare these costs with the ongoing costs of investing in other mutual funds. To do so, compare this 5% hypothetical example with the 5% hypothetical examples that appear in the shareholder reports of the other funds. The example is based upon an investment of $1,000 invested at the beginning of the period and held for the six-months indicated, unless noted otherwise in the table and footnotes below.
Actual Expenses
The information in the table under the heading “Actual” provides information about actual account values and actual expenses. You may use the information in these columns, together with the amount you invested, to estimate the expenses that you paid over the period. Simply divide your account value by $1,000 (for example, an $8,600 account value divided by $1,000 = 8.6), then multiply the result by the number in the appropriate column for your share class under the heading entitled “Expenses Paid During Period” to estimate the expenses you paid on your account during the period.
Hypothetical Example for Comparison Purposes
The information in the table under the heading “Hypothetical (5% return before expenses)” provides information about hypothetical account values and hypothetical expenses based upon the Fund’s actual expense ratio and an assumed rate of return of 5% per year before expenses, which is not the Fund’s actual return. The hypothetical account values and expenses may not be used to estimate the actual ending account balance or expenses you paid for the period. You may use this information to compare the ongoing costs of investing in the Fund and other funds. To do so, compare this 5% hypothetical example with the 5% hypothetical examples that appear in the shareholder reports of the other funds. Additionally, for an analysis of the fees associated with an investment in any share class or other similar funds, please visit www.finra.org/fundanalyzer.
Please note that the expenses shown in the table are meant to highlight your ongoing costs only and do not reflect any transaction costs. These fees are fully described in the Fund’s prospectuses. Therefore, the hypothetical examples are useful in comparing ongoing costs only, and will not help you determine the relative total costs of owning different funds. In addition, if these transaction costs were included, your costs would have been higher.
| | | | | | | | | | | | | | | | | | | | | | | | | | | | | | | |
| | | | | Hypothetical
| | | | |
| | | Actual | | (5% return before expenses) | | | | |
| | | Beginning
| | Ending
| | Expenses
| | Beginning
| | Ending
| | Expenses
| | | | |
| | | Account
| | Account
| | Paid During
| | Account
| | Account
| | Paid During
| | Net Annualized
| | |
| | | Value
| | Value
| | Period
| | Value
| | Value
| | Period
| | Expense Ratio
| | |
| | | (1/1/13) | | (6/30/13) | | (1/1/13 - 6/30/13)† | | (1/1/13) | | (6/30/13) | | (1/1/13 - 6/30/13)† | | (1/1/13 - 6/30/13) | | |
| |
| |
| Class D Shares | | $ | 1,000.00 | | | $ | 1,000.00 | | | $ | 0.74 | | | $ | 1,000.00 | | | $ | 1,024.05 | | | $ | 0.75 | | | | 0.15% | | | |
| |
| |
| Class T Shares | | $ | 1,000.00 | | | $ | 1,000.00 | | | $ | 0.74 | | | $ | 1,000.00 | | | $ | 1,024.05 | | | $ | 0.75 | | | | 0.15% | | | |
| |
| |
| | | |
| † | | Expenses Paid During Period are equal to the Net Annualized Expense Ratio multiplied by the average account value over the period, multiplied by the number of days in the most recent six-month period, divided by the number of days in the fiscal year. Expenses in the examples include the effect of applicable fee waivers and/or expense reimbursements, if any. Had such waivers and/or reimbursements not been in effect, your expenses would have been higher. Please refer to the Notes to Financial Statements or the Fund’s prospectuses for more information regarding waivers and/or reimbursements. |
56 | JUNE 30, 2013
Janus Government Money Market Fund
Schedule of Investments
As of June 30, 2013
| | | | | | | | | | | |
| Principal Amount | | Value | | | |
| |
| Repurchase Agreements – 19.4% | | | | | | |
| | $30,700,000 | | | Credit Suisse Securities (USA) LLC, 0.1200%, dated 6/28/13, maturing 7/1/13 to be repurchased at $30,700,307 collateralized by $1,028,647,656 in U.S. Government Agencies 0.2631%-5.7510%, 2/25/19-6/15/42 with a value of $31,314,114 | | $ | 30,700,000 | | | |
| | 4,600,000 | | | RBC Capital Markets Corp., 0.1300%, dated 6/28/13, maturing 7/1/13 to be repurchased at $4,600,050 collateralized by $4,509,591 in U.S. Government Agencies 3.0000%-10.0000%, 3/1/19-5/15/55 with a value of $4,692,000 | | | 4,600,000 | | | |
| |
| |
| Total Repurchase Agreements (amortized cost $35,300,000) | | | 35,300,000 | | | |
| |
| |
| U.S. Government Agency Notes – 34.2% | | | | | | |
| | | | | Fannie Mae: | | | | | | |
| | 2,000,000 | | | 0.1101%, 7/31/13 | | | 1,999,817 | | | |
| | 3,000,000 | | | 0.1652%, 8/1/13 | | | 2,999,574 | | | |
| | 4,300,000 | | | 0.1122%, 10/1/13 | | | 4,298,768 | | | |
| | 5,000,000 | | | 0.1201%, 11/6/13 | | | 4,997,867 | | | |
| | 4,000,000 | | | 0.1301%, 11/20/13 | | | 3,997,949 | | | |
| | 4,000,000 | | | 0.1401%, 12/26/13 | | | 3,997,231 | | | |
| | | | | Federal Home Loan Bank System: | | | | | | |
| | 3,000,000 | | | 0.1351%, 7/3/13 | | | 2,999,977 | | | |
| | 4,000,000 | | | 0.1065%, 7/24/13 | | | 3,999,728 | | | |
| | 2,000,000 | | | 0.0600%, 8/9/13 | | | 1,999,870 | | | |
| | 4,500,000 | | | 0.0900%, 9/6/13 | | | 4,499,246 | | | |
| | | | | Freddie Mac: | | | | | | |
| | 3,000,000 | | | 0.1151%, 7/8/13 | | | 2,999,933 | | | |
| | 3,000,000 | | | 0.1351%, 8/13/13 | | | 2,999,516 | | | |
| | 2,000,000 | | | 0.0700%, 9/10/13 | | | 1,999,724 | | | |
| | 2,000,000 | | | 0.0901%, 11/5/13 | | | 1,999,365 | | | |
| | 3,000,000 | | | 0.1001%, 12/9/13 | | | 2,998,658 | | | |
| | 2,000,000 | | | 0.1015%, 1/14/14 | | | 1,998,905 | | | |
| | 3,000,000 | | | 0.1251%, 1/15/14 | | | 2,997,937 | | | |
| | 2,000,000 | | | 0.1352%, 4/21/14 | | | 1,997,795 | | | |
| | 6,337,188 | | | 0.2400%, 1/15/42‡ | | | 6,337,188 | | | |
| |
| |
| Total U.S. Government Agency Notes (amortized cost $62,119,048) | | | 62,119,048 | | | |
| |
| |
| Variable Rate Demand Agency Notes – 46.5% | | | | | | |
| | 1,080,000 | | | A.E. Realty LLC
0.1900%, 10/1/23 | | | 1,080,000 | | | |
| | 600,000 | | | City of Plymouth WI
0.2000%, 12/1/14 | | | 600,000 | | | |
| | 1,350,000 | | | Clearwater Solutions LLC
0.2500%, 9/1/21 | | | 1,350,000 | | | |
| | 9,000,000 | | | Cypress Bend Real Estate Development Co. LLC
0.1900%, 4/1/33 | | | 9,000,000 | | | |
| | 3,000,000 | | | Florida Food Products, Inc.
0.1900%, 12/1/22 | | | 3,000,000 | | | |
| | 5,960,000 | | | Florida Housing Finance Corp.
0.0700%, 7/15/36 | | | 5,960,000 | | | |
| | 3,000,000 | | | Greer Family LLC
0.1900%, 8/1/31 | | | 3,000,000 | | | |
| | 2,065,000 | | | Housing Development Corp., New York
0.0600%, 6/15/37 | | | 2,065,000 | | | |
| | 410,000 | | | Illinois Housing Development Authority
0.2100%, 5/1/37 | | | 410,000 | | | |
| | 2,805,000 | | | Indian Hills Country Club
0.1900%, 3/1/30 | | | 2,805,000 | | | |
| | 2,500,000 | | | Irrevocable Trust Agreement John A. Thomas & Elizabeth F. Thomas
0.1900%, 12/1/20 | | | 2,500,000 | | | |
| | 3,745,000 | | | Johnson Capital Management LLC
0.2500%, 6/1/47 | | | 3,745,000 | | | |
| | 155,000 | | | Lakeshore Professional Properties LLC
0.3000%, 7/1/45 | | | 155,000 | | | |
| | 700,000 | | | Maryland Community Development Administration
0.0600%, 2/1/41 | | | 700,000 | | | |
| | 22,605,000 | | | Mesivta Yeshiva Rabbi Chaim Berlin
0.1953%, 11/1/35 | | | 22,605,000 | | | |
| | 3,835,000 | | | Mississippi Business Finance Corp.
0.2300%, 1/1/34 | | | 3,835,000 | | | |
| | 4,010,000 | | | Mississippi Business Finance Corp. – Series A
0.2300%, 3/1/29 | | | 4,010,000 | | | |
| | 3,730,000 | | | Mississippi Business Finance Corp. – Series B
0.2300%, 3/1/29 | | | 3,730,000 | | | |
| | 4,310,000 | | | Phenix City Downtown Redevelopment Authority
0.1900%, 2/1/33 | | | 4,310,000 | | | |
| | 500,000 | | | Sacramento Housing & Redevelopment Agency
0.2000%, 1/15/36 | | | 500,000 | | | |
| | 1,685,000 | | | Shepherd Capital LLC
0.3000%, 10/1/53 | | | 1,685,000 | | | |
| | 4,500,000 | | | Thomas H. Turner Family Irrevocable Trust
0.1900%, 6/1/20 | | | 4,500,000 | | | |
| | 2,210,000 | | | Tyler Enterprises LLC
0.1900%, 10/1/22 | | | 2,210,000 | | | |
| | 760,000 | | | VOC-RE I LLC
0.1900%, 2/1/43 | | | 760,000 | | | |
| |
| |
| Total Variable Rate Demand Agency Notes (amortized cost $84,515,000) | | | 84,515,000 | | | |
| |
| |
Total Investments
(total amortized cost $181,934,048) – 100.1% | | | 181,934,048 | | | |
| |
| |
| Liabilities, net of Cash, Receivables and Other Assets– (0.1)% | | | (185,973) | | | |
| |
| |
| Net Assets – 100% | | $ | 181,748,075 | | | |
| |
| |
See Notes to Schedules of Investments and Other Information and Notes to Financial Statements.
Janus Fixed Income & Money Market Funds | 57
Janus Money Market Fund
Schedule of Investments
As of June 30, 2013
| | | | | | | | | | | |
| Principal Amount | | Value | | | |
| |
| Certificates Of Deposit – 17.3% | | | | | | |
| | $30,000,000 | | | Bank of Montreal, Chicago
0.1500%, 8/27/13 | | $ | 30,000,000 | | | |
| | 22,300,000 | | | Mizuho Corporate Bank, Ltd.
0.1100%, 7/3/13 | | | 22,300,000 | | | |
| | 25,000,000 | | | Mizuho Corporate Bank, Ltd.
0.1200%, 7/5/13 | | | 25,000,000 | | | |
| | 25,000,000 | | | Sumitomo Mitsui Banking Corp.
0.0700%, 7/5/13 | | | 25,000,000 | | | |
| | 30,000,000 | | | Sumitomo Mitsui Banking Corp.
0.1000%, 7/10/13 | | | 30,000,000 | | | |
| | 25,000,000 | | | Svenska Handelsbanken A.B.
0.1950%, 7/23/13 | | | 25,000,076 | | | |
| | 19,300,000 | | | Toronto Dominion Bank, New York
0.1400%, 7/10/13 | | | 19,300,000 | | | |
| | 25,000,000 | | | Toronto Dominion Bank, New York
0.1600%, 7/18/13 | | | 25,000,000 | | | |
| | 17,700,000 | | | Toronto Dominion Bank, New York
0.1500%, 8/19/13 | | | 17,700,000 | | | |
| |
| |
| Total Certificates Of Deposit (amortized cost $219,300,076) | | | 219,300,076 | | | |
| |
| |
| Commercial Paper – 13.2% | | | | | | |
| | 25,000,000 | | | BNP Paribas Finance, Inc.
0.0913%, 7/2/13 | | | 24,999,938 | | | |
| | 35,000,000 | | | BNP Paribas Finance, Inc.
0.0913%, 7/5/13 | | | 34,999,650 | | | |
| | 10,000,000 | | | JPMorgan Chase & Co.
0.2030%, 7/29/13 | | | 9,998,444 | | | |
| | 20,000,000 | | | JPMorgan Chase & Co.
0.1624%, 7/31/13 | | | 19,997,333 | | | |
| | 15,000,000 | | | JPMorgan Chase & Co.
0.1624%, 8/2/13 | | | 14,997,866 | | | |
| | 20,000,000 | | | Nieuw Amsterdam Receivables Corp.
0.1725%, 7/11/13 (Section 4(2)) | | | 19,999,056 | | | |
| | 10,000,000 | | | Nieuw Amsterdam Receivables Corp.
0.1725%, 7/15/13 (Section 4(2)) | | | 9,999,339 | | | |
| | 12,000,000 | | | Nieuw Amsterdam Receivables Corp.
0.1624%, 7/18/13 (Section 4(2)) | | | 11,999,093 | | | |
| | 20,000,000 | | | Nieuw Amsterdam Receivables Corp.
0.1522%, 7/25/13 (Section 4(2)) | | | 19,998,000 | | | |
| |
| |
| Total Commercial Paper (amortized cost $166,988,719) | | | 166,988,719 | | | |
| |
| |
| Repurchase Agreements – 43.6% | | | | | | |
| | 100,000,000 | | | Goldman Sachs & Co., 0.1400%, dated 6/28/13, maturing 7/1/13 to be repurchased at $100,001,167 collateralized by $99,187,602 in U.S. Government Agencies 2.5370%-4.0000%, 6/1/42-6/1/43 with a value of $102,000,001 | | | 100,000,000 | | | |
| | 100,000,000 | | | HSBC Securities (USA), Inc., 0.1500%, dated 6/28/13, maturing 7/1/13 to be repurchased at $100,001,250 collateralized by $102,731,473 in U.S. Government Agencies 0.4416%-2.0000%, 2/20/38-1/20/43 with a value of $102,003,982 | | | 100,000,000 | | | |
| | 100,000,000 | | | JPMorgan Chase & Co., 0.1000%, dated 6/28/13, maturing 7/1/13 to be repurchased at $100,000,833 collateralized by $608,801,194 in U.S. Government Agencies 0.0500%-6.5570%, 11/25/26-12/25/42 with a value of $102,000,135 | | | 100,000,000 | | | |
| | 253,000,000 | | | RBC Capital Markets Corp., 0.1300%, dated 6/28/13, maturing 7/1/13 to be repurchased at $253,002,741 collateralized by $248,027,514 in U.S. Government Agencies 3.0000%-10.0000%, 3/1/19-5/15/55 with a value of $258,060,000 | | | 253,000,000 | | | |
| |
| |
| Total Repurchase Agreements (amortized cost $553,000,000) | | | 553,000,000 | | | |
| |
| |
| U.S. Government Agency Notes – 11.5% | | | | | | |
| | | | | Fannie Mae: | | | | | | |
| | 10,000,000 | | | 0.1101%, 7/31/13 | | | 9,999,083 | | | |
| | 20,000,000 | | | 0.1502%, 8/1/13 | | | 19,997,415 | | | |
| | 10,000,000 | | | 0.1401%, 12/26/13 | | | 9,993,078 | | | |
| | | | | Federal Home Loan Bank System: | | | | | | |
| | 10,000,000 | | | 0.1351%, 7/3/13 | | | 9,999,925 | | | |
| | 10,000,000 | | | 0.1065%, 7/24/13 | | | 9,999,320 | | | |
| | 10,000,000 | | | 0.1151%, 7/26/13 | | | 9,999,201 | | | |
| | | | | Freddie Mac: | | | | | | |
| | 10,000,000 | | | 0.1301%, 7/1/13 | | | 10,000,000 | | | |
| | 10,000,000 | | | 0.1151%, 7/8/13 | | | 9,999,776 | | | |
| | 10,000,000 | | | 0.1382%, 8/13/13 | | | 9,998,351 | | | |
| | 13,000,000 | | | 0.1251%, 11/25/13 | | | 12,993,364 | | | |
| | 10,000,000 | | | 0.1402%, 2/3/14 | | | 9,991,560 | | | |
| | 5,900,000 | | | 0.1201%, 2/11/14 | | | 5,895,575 | | | |
| | 6,100,000 | | | 0.1101%, 2/24/14 | | | 6,095,564 | | | |
| | 10,000,000 | | | 0.1352%, 4/21/14 | | | 9,988,974 | | | |
| |
| |
| Total U.S. Government Agency Notes (amortized cost $144,951,186) | | | 144,951,186 | | | |
| |
| |
| Variable Rate Demand Agency Notes – 14.5% | | | | | | |
| | 5,060,000 | | | Auburn Industrial Development Board
0.1900%, 7/1/26 | | | 5,060,000 | | | |
| | 4,000,000 | | | Breckenridge Terrace LLC
0.2100%, 5/1/39 | | | 4,000,000 | | | |
| | 14,980,000 | | | Breckenridge Terrace LLC
0.2100%, 5/1/39 | | | 14,980,000 | | | |
| | 7,985,000 | | | Brevard County Health Facilities Authority
0.0500%, 9/1/25 | | | 7,985,000 | | | |
| | 800,000 | | | California Infrastructure & Economic Development Bank
0.1400%, 7/1/33 | | | 800,000 | | | |
| | 1,020,000 | | | Capital Markets Access Co. LC
0.1900%, 7/1/25 | | | 1,020,000 | | | |
| | 9,100,000 | | | County of Eagle CO
0.2600%, 6/1/27 | | | 9,100,000 | | | |
| | 8,000,000 | | | County of Eagle CO
0.2600%, 5/1/39 | | | 8,000,000 | | | |
| | 8,965,000 | | | County of Franklin OH – Series A
0.0600%, 11/1/22 | | | 8,965,000 | | | |
| | 6,850,000 | | | County of Franklin OH – Series B
0.0600%, 11/1/34 | | | 6,850,000 | | | |
See Notes to Schedules of Investments and Other Information and Notes to Financial Statements.
58 | JUNE 30, 2013
Schedule of Investments
As of June 30, 2013
| | | | | | | | | | | |
| Principal Amount | | Value | | | |
| |
| | $5,595,000 | | | Danville-Pittsylvania Regional Facility Authority
0.2000%, 1/1/26 | | $ | 5,595,000 | | | |
| | 11,470,000 | | | Eskaton Properties, Inc.
0.4000%, 12/1/37 | | | 11,470,000 | | | |
| | 3,795,000 | | | FJM Properties of Willmar LLC
0.2300%, 10/1/24 | | | 3,795,000 | | | |
| | 7,000,000 | | | Florissant Industrial Development Authority
0.0500%, 9/1/28 | | | 7,000,000 | | | |
| | 5,620,000 | | | Hunter’s Ridge, Southpointe
0.2300%, 6/1/25 | | | 5,620,000 | | | |
| | 3,760,000 | | | J-Jay Properties LLC
0.1800%, 7/1/35 | | | 3,760,000 | | | |
| | 530,000 | | | Kentucky Economic Development Finance Authority
1.0000%, 11/1/15 | | | 530,000 | | | |
| | 1,080,000 | | | Lone Tree Building Authority
0.4000%, 12/1/17 | | | 1,080,000 | | | |
| | 9,000,000 | | | Louisiana Public Facilities Authority
0.0500%, 7/1/47 | | | 9,000,000 | | | |
| | 10,000,000 | | | Massachusetts Health & Educational Facilities Authority – Series N2
0.0600%, 10/1/42 | | | 10,000,000 | | | |
| | 4,415,000 | | | Mesivta Yeshiva Rabbi Chaim Berlin
0.1953%, 11/1/35 | | | 4,415,000 | | | |
| | 5,000,000 | | | Phenix City Downtown Redevelopment Authority
0.1900%, 2/1/33 | | | 5,000,000 | | | |
| | 160,000 | | | Phoenix Realty Special Account
0.2700%, 4/1/20 | | | 160,000 | | | |
| | 10,865,000 | | | RBS Insurance Trust
0.1900%, 11/1/31 | | | 10,865,000 | | | |
| | 3,650,000 | | | Riley Family Eagle Lake L.P. & Riley Family Lexington Heights L.P.
0.2000%, 9/1/33 | | | 3,650,000 | | | |
| | 5,700,000 | | | Tenderfoot Seasonal Housing LLC
0.2600%, 7/1/35 | | | 5,700,000 | | | |
| | 2,600,000 | | | Tift County Development Authority
0.2500%, 2/1/18 | | | 2,600,000 | | | |
| | 4,350,000 | | | Triple Crown Investments LLC
0.1900%, 8/1/25 | | | 4,350,000 | | | |
| | 1,620,000 | | | Volunteers of America of Alabama, Inc.
0.2500%, 9/1/23 | | | 1,620,000 | | | |
| | 21,080,000 | | | Washington Higher Education Facilities Authority
0.0600%, 10/1/30 | | | 21,080,000 | | | |
| |
| |
| Total Variable Rate Demand Agency Notes (amortized cost $184,050,000) | | | 184,050,000 | | | |
| |
| |
Total Investments
(total amortized cost $1,268,289,981) – 100.1% | | | 1,268,289,981 | | | |
| |
| |
| Liabilities, net of Cash, Receivables and Other Assets– (0.1)% | | | (671,773) | | | |
| |
| |
| Net Assets – 100% | | $ | 1,267,618,208 | | | |
| |
| |
See Notes to Schedules of Investments and Other Information and Notes to Financial Statements.
Janus Fixed Income & Money Market Funds | 59
Notes to Schedules of Investments and Other Information
| | |
| Barclays 1-3 Year U.S. Government/Credit Index | | Composed of all bonds of investment grade with a maturity between one and three years. |
| |
| Barclays Global Aggregate Bond Index | | Provides a broad-based measure of the global investment grade fixed-rate debt markets. It is comprised of the U.S. Aggregate, Pan-European Aggregate, and the Asian-Pacific Aggregate Indexes. It also includes a wide range of standard and customized subindices by liquidity constraint, sector, quality and maturity. |
| |
| Barclays Global Aggregate Corporate Bond Index | | The corporate component of the Barclays Global Aggregate Bond Index. |
| |
| Barclays U.S. Aggregate Bond Index | | Made up of the Barclays U.S. Government/Corporate Bond Index, Mortgage-Backed Securities Index, and Asset-Backed Securities Index, including securities that are of investment grade quality or better, have at least one year to maturity, and have an outstanding par value of at least $100 million. |
| |
| Barclays U.S. Corporate High-Yield Bond Index | | Composed of fixed-rate, publicly issued, non-investment grade debt. |
| |
| A.B. | | Aktiebolag: Swedish stock company. |
| |
| A.G. | | Aktiengesellschaft: German term for Public Limited Company. |
| |
| B.V. | | Besloten Vennootschap: Dutch term for private Limited Liability Company. |
| |
| L.P. | | Limited Partnership |
| |
| LLC | | Limited Liability Company |
| |
| N.A. | | National Association |
| |
| N.V. | | Naamloze Vennootschap: Dutch term for Public Limited Liability Company. |
| |
| PLC | | Public Limited Company |
| |
| REIT | | Real Estate Investment Trust |
| |
| S.A. | | Sociedad Anonima: Spanish term for publicly-traded company. |
| |
| S.A.P.I.B. de C.V. | | Sociedad Anonima Promotora de Inversion Bursatil de Capital Variable: Spanish term for Variable Capital Company. |
| |
| SAU | | Sociedad Anonima Unipersonal: Spanish term for Single Shareholder Corporation. |
| |
| Section 4(2) | | Securities subject to legal and/or contractual restrictions on resale and may not be publicly sold without registration under the Securities Act of 1933, as amended. |
| |
| SpA | | Societa per Azioni: Italian term for Public Limited Company. |
Money market funds may hold securities with stated maturities of greater than 397 days when those securities have features that allow a fund to “put” back the security to the issuer or to a third party within 397 days of acquisition. The maturity dates shown in the security descriptions are the stated maturity dates.
Repurchase agreements held by a Fund are fully collateralized, and such collateral is in the possession of the Fund’s custodian or, for tri-party agreements, the custodian designated by the agreement. The collateral is evaluated daily to ensure its market value exceeds the current market value of the repurchase agreements, including accrued interest. In the event of default on the obligation to repurchase, the Fund has the right to liquidate the collateral and apply the proceeds in satisfaction of the obligation. In the event of default or bankruptcy by the other party to the agreement, realization and/or retention of the collateral or proceeds may be subject to legal proceedings.
| | | |
| 144A | | Securities sold under Rule 144A of the Securities Act of 1933, as amended, are subject to legal and/or contractual restrictions on resale and may not be publicly sold without registration under the 1933 Act. These securities have been determined to be liquid under guidelines established by the Board of Trustees. The total value of 144A securities as of the year ended June 30, 2013 is indicated in the table below: |
| | | | | | | | | | | |
| | | | | | Value as a %
| | | |
| Fund | | Value | | | of Net Assets | | | |
| |
Fixed Income | | | | | | | | | | |
| Janus Flexible Bond Fund | | $ | 795,913,919 | | | | 12.9 | % | | |
| Janus Global Bond Fund | | | 32,852,013 | | | | 12.7 | % | | |
| Janus High-Yield Fund | | | 812,838,577 | | | | 35.0 | % | | |
| Janus Short-Term Bond Fund | | | 520,499,547 | | | | 17.3 | % | | |
| |
| |
60 | JUNE 30, 2013
| | | |
| (a) | | All or a portion of this position has not settled, or is not funded. Upon settlement or funding date, interest rates for unsettled or unfunded amounts will be determined. Interest and dividends will not be accrued until time of settlement or funding. |
| | | |
| ** | | A portion of this security has been segregated to cover margin or segregation requirements on open futures contracts, forward currency contracts, options contracts, short sales, swap agreements, and/or securities with extended settlement dates, the value of which, as of June 30, 2013, is noted below. |
| | | | | | |
| Fund | | Aggregate Value | | |
| |
| |
Fixed Income | | | | | |
| Janus Flexible Bond Fund | | $ | 49,921,900 | | |
| Janus Global Bond Fund | | | 85,519,126 | | |
| Janus High-Yield Fund | | | 48,775,000 | | |
| Janus Short-Term Bond Fund | | | 40,029,680 | | |
| |
| |
| | | |
| ‡ | | The interest rate on floating rate notes is based on an index or market interest rates and is subject to change. Rate in the security description is as of year end. |
| | | |
| ß | | Security is illiquid. |
| |
| § | Schedule of Restricted and Illiquid Securities (as of June 30, 2013) |
| | | | | | | | | | | | | |
| | | Acquisition
| | Acquisition
| | | | Value as a
| | |
| | | Date | | Cost | | Value | | % of Net Assets | | |
| |
| |
Janus Flexible Bond Fund | | | | | | | | | | | | |
| A&E Communications – Private Placement, 3.6300%, 8/22/22 | | 8/7/12 | | $ | 16,000,000 | | $ | 16,108,640 | | 0.3% | | |
| FREMF 2010 K-SCT Mortgage Trust, 2.0000%, 1/25/20 | | 4/29/13 | | | 17,103,103 | | | 16,629,234 | | 0.3% | | |
| |
| |
| | | | | $ | 33,103,103 | | $ | 32,737,874 | | 0.6% | | |
| |
| |
Janus Global Bond Fund | | | | | | | | | | | | |
| FREMF 2010 K-SCT Mortgage Trust, 2.0000%, 1/25/20 | | 4/29/13 | | $ | 730,446 | | $ | 710,208 | | 0.3% | | |
| |
| |
Janus High-Yield Fund | | | | | | | | | | | | |
| ADS Tactical, Inc., 11.0000%, 4/1/18 | | 3/22/11 – 11/5/12 | | $ | 42,657,288 | | $ | 40,546,405 | | 1.8% | | |
| |
| |
The Funds have registration rights for certain restricted securities held as of June 30, 2013. The issuer incurs all registration costs.
| |
| £ | The Funds may invest in certain securities that are considered affiliated companies. As defined by the Investment Company Act of 1940, as amended, an affiliated company is one in which the fund owns 5% or more of the outstanding voting securities, or a company which is under common ownership or control. Based on the Fund’s relative ownership, the following securities were considered affiliated companies for all or some portion of the year ended June 30, 2013. Except for the value at year end, all other information in the table is for the year ended June 30, 2013. |
| | | | | | | | | | | | | | | | | | | | | | |
| | | Purchases | | Sales | | Realized
| | Dividend
| | Value
| | |
| | | Shares | | Cost | | Shares | | Cost | | Gain/(Loss) | | Income | | at 6/30/13 | | |
| |
Janus Flexible Bond Fund | | | | | | | | | | | | | | | | | | | | | |
| Janus Cash Liquidity Fund LLC | | 3,883,958,105 | | $ | 3,883,958,105 | | (3,960,874,000) | | $ | (3,960,874,000) | | $ | – | | $ | 273,458 | | $ | 40,073,406 | | |
| |
| |
Janus Global Bond Fund | | | | | | | | | | | | | | | | | | | | | |
| Janus Cash Liquidity Fund LLC | | 205,724,404 | | | 205,724,404 | | (192,290,404) | | | (192,290,404) | | | – | | | 6,381 | | | 13,731,000 | | |
| |
| |
Janus High-Yield Fund | | | | | | | | | | | | | | | | | | | | | |
| Janus Cash Liquidity Fund LLC | | 1,366,377,273 | | | 1,366,377,273 | | (1,428,526,000) | | | (1,428,526,000) | | | – | | | 196,292 | | | 104,382,849 | | |
| |
| |
Janus Short-Term Bond Fund | | | | | | | | | | | | | | | | | | | | | |
| Janus Cash Liquidity Fund LLC | | 2,111,219,872 | | | 2,111,219,872 | | (2,153,951,080) | | | (2,153,951,080) | | | – | | | 134,514 | | | 39,010,000 | | |
| |
| |
Janus Fixed Income & Money Market Funds | 61
Notes to Schedules of Investments and Other Information (continued)
The following is a summary of the inputs that were used to value the Funds’ investments in securities and other financial instruments as of June 30, 2013. See Notes to Financial Statements for more information.
Valuation Inputs Summary (as of June 30, 2013)
| | | | | | | | | | | | |
| | | | | Level 2 – Other Significant
| | Level 3 – Significant
| | |
| | | Level 1 – Quoted Prices | | Observable Inputs | | Unobservable Inputs | | |
| |
Investments in Securities: | | | | | | | | | | | |
| Janus Flexible Bond Fund | | | | | | | | | | | |
Asset-Backed/Commercial Mortgage-Backed Securities | | $ | – | | $ | 196,146,440 | | $ | – | | |
| | | | | | | | | | | | |
Bank Loans | | | – | | | 115,465,802 | | | – | | |
| | | | | | | | | | | | |
Corporate Bonds | | | – | | | 2,921,579,623 | | | – | | |
| | | | | | | | | | | | |
Mortgage-Backed Securities | | | – | | | 1,463,492,533 | | | – | | |
| | | | | | | | | | | | |
Preferred Stock | | | – | | | 30,578,295 | | | – | | |
| | | | | | | | | | | | |
U.S. Treasury Notes/Bonds | | | – | | | 1,385,745,032 | | | – | | |
| | | | | | | | | | | | |
Money Market | | | – | | | 40,073,406 | | | – | | |
| | | | | | | | | | | | |
| Total Investments in Securities | | $ | – | | $ | 6,153,081,131 | | $ | – | | |
| |
| |
Investments in Securities: | | | | | | | | | | | |
| Janus Global Bond Fund | | | | | | | | | | | |
Asset-Backed/Commercial Mortgage-Backed Securities | | $ | – | | $ | 17,828,155 | | $ | – | | |
| | | | | | | | | | | | |
Bank Loans | | | – | | | 2,699,072 | | | – | | |
| | | | | | | | | | | | |
Corporate Bonds | | | – | | | 113,243,959 | | | – | | |
| | | | | | | | | | | | |
Foreign Government Bonds | | | – | | | 41,250,296 | | | – | | |
| | | | | | | | | | | | |
Mortgage-Backed Securities | | | – | | | 35,300,805 | | | – | | |
| | | | | | | | | | | | |
Preferred Stock | | | – | | | 1,039,140 | | | – | | |
| | | | | | | | | | | | |
U.S. Treasury Notes/Bonds | | | – | | | 34,953,098 | | | – | | |
| | | | | | | | | | | | |
Money Market | | | – | | | 13,731,000 | | | – | | |
| | | | | | | | | | | | |
| Total Investments in Securities | | $ | – | | $ | 260,045,525 | | $ | – | | |
| | | | | | | | | | | | |
Other Financial Instruments(a) – Assets: | | | | | | | | | | | |
Forward currency contracts | | $ | – | | $ | 454,158 | | $ | – | | |
| | | | | | | | | | | | |
Other Financial Instruments(a) – Liabilities: | | | | | | | | | | | |
Forward currency contracts | | $ | – | | $ | 287,488 | | $ | – | | |
| |
| |
Investments in Securities: | | | | | | | | | | | |
| Janus High-Yield Fund | | | | | | | | | | | |
Bank Loans | | $ | – | | $ | 180,446,214 | | $ | – | | |
| | | | | | | | | | | | |
Commercial Mortgage-Backed Security | | | – | | | 8,059,253 | | | – | | |
| | | | | | | | | | | | |
Corporate Bonds | | | – | | | 1,991,325,703 | | | – | | |
| | | | | | | | | | | | |
Preferred Stock | | | – | | | 9,545,483 | | | – | | |
| | | | | | | | | | | | |
Money Market | | | – | | | 104,382,849 | | | – | | |
| | | | | | | | | | | | |
| Total Investments in Securities | | $ | – | | $ | 2,293,759,502 | | $ | – | | |
| |
| |
62 | JUNE 30, 2013
| | | | | | | | | | | | |
| | | | | Level 2 – Other Significant
| | Level 3 – Significant
| | |
| | | Level 1 – Quoted Prices | | Observable Inputs | | Unobservable Inputs | | |
| |
Investments in Securities: | | | | | | | | | | | |
| Janus Short-Term Bond Fund | | | | | | | | | | | |
Asset-Backed/Commercial Mortgage-Backed Securities | | $ | – | | $ | 129,015,131 | | $ | – | | |
| | | | | | | | | | | | |
Bank Loan | | | – | | | 4,745,787 | | | – | | |
| | | | | | | | | | | | |
Corporate Bonds | | | – | | | 2,149,927,237 | | | – | | |
| | | | | | | | | | | | |
Short-Term Taxable Variable Rate Demand Note | | | – | | | 940,000 | | | – | | |
| | | | | | | | | | | | |
U.S. Treasury Notes/Bonds | | | – | | | 680,454,535 | | | – | | |
| | | | | | | | | | | | |
Money Market | | | – | | | 39,010,000 | | | – | | |
| | | | | | | | | | | | |
| Total Investments in Securities | | $ | – | | $ | 3,004,092,690 | | $ | – | | |
| |
| |
Investments in Securities: | | | | | | | | | | | |
| Janus Government Money Market Fund | | | | | | | | | | | |
Repurchase Agreements | | $ | – | | $ | 35,300,000 | | $ | – | | |
| | | | | | | | | | | | |
U.S. Government Agency Notes | | | – | | | 62,119,048 | | | – | | |
| | | | | | | | | | | | |
Variable Rate Demand Agency Notes | | | – | | | 84,515,000 | | | – | | |
| | | | | | | | | | | | |
| Total Investments in Securities | | $ | – | | $ | 181,934,048 | | $ | – | | |
| |
| |
Investments in Securities: | | | | | | | | | | | |
| Janus Money Market Fund | | | | | | | | | | | |
Certificates of Deposit | | $ | – | | $ | 219,300,076 | | $ | – | | |
| | | | | | | | | | | | |
Commercial Paper | | | – | | | 166,988,719 | | | – | | |
| | | | | | | | | | | | |
Repurchase Agreements | | | – | | | 553,000,000 | | | – | | |
| | | | | | | | | | | | |
U.S. Government Agency Notes | | | – | | | 144,951,186 | | | – | | |
| | | | | | | | | | | | |
Variable Rate Demand Agency Notes | | | – | | | 184,050,000 | | | – | | |
| | | | | | | | | | | | |
| Total Investments in Securities | | $ | – | | $ | 1,268,289,981 | | $ | – | | |
| |
| |
| | | |
| (a) | | Other financial instruments include futures, forward currency, written option, and swap contracts. Forward currency contracts and swap contracts are reported at their unrealized appreciation/(depreciation) at measurement date, which represents the change in the contract’s value from trade date. Futures are reported at their variation margin at measurement date, which represents the amount due to/from the Fund at that date. Options are reported at their market value at measurement date. |
Janus Fixed Income & Money Market Funds | 63
Statements of Assets and Liabilities - Fixed Income Funds
| | | | | | | | | | | | | | | | | |
As of June 30, 2013
| | | | | | | | |
| (all numbers in thousands except net asset value per share) | | Janus Flexible Bond Fund | | Janus Global Bond Fund | | Janus High-Yield Fund | | Janus Short-Term Bond Fund |
|
| |
| Assets: | | | | | | | | | | | | | | | | |
| Investments at cost | | $ | 6,146,393 | | | $ | 263,847 | | | $ | 2,272,396 | | | $ | 3,003,117 | |
| Unaffiliated investments at value | | $ | 6,113,008 | | | $ | 246,315 | | | $ | 2,189,377 | | | $ | 2,965,083 | |
| Affiliated investments at value | | | 40,073 | | | | 13,731 | | | | 104,383 | | | | 39,010 | |
| Cash | | | 28,912 | | | | – | | | | 2,701 | | | | 18,847 | |
| Restricted cash (Note 1) | | | – | | | | – | | | | 15,000 | | | | – | |
| Receivables: | | | | | | | | | | | | | | | | |
| Investments sold | | | 59,953 | | | | 853 | | | | 36,711 | | | | – | |
| Closed foreign currency contracts | | | – | | | | 1 | | | | – | | | | – | |
| Fund shares sold | | | 23,658 | | | | 100 | | | | 1,690 | | | | 5,175 | |
| Dividends | | | 10 | | | | 1 | | | | 199 | | | | – | |
| Interest | | | 40,193 | | | | 2,319 | | | | 39,130 | | | | 21,163 | |
| Non-interested Trustees’ deferred compensation | | | 107 | | | | 4 | | | | 40 | | | | 52 | |
| Other assets | | | 14 | | | | 19 | | | | 7 | | | | 20 | |
| Forward currency contracts | | | – | | | | 454 | | | | – | | | | – | |
| Total Assets | | | 6,305,928 | | | | 263,797 | | | | 2,389,238 | | | | 3,049,350 | |
| Liabilities: | | | | | | | | | | | | | | | | |
| Payables: | | | | | | | | | | | | | | | | |
| Due to custodian | | | – | | | | 283 | | | | – | | | | – | |
| Investments purchased | | | 129,024 | | | | 4,542 | | | | 57,030 | | | | 31,994 | |
| Fund shares repurchased | | | 14,629 | | | | 274 | | | | 5,163 | | | | 7,130 | |
| Dividends | | | 1,134 | | | | 1 | | | | 613 | | | | 184 | |
| Advisory fees | | | 2,116 | | | | 148 | | | | 1,133 | | | | 1,250 | |
| Fund administration fees | | | 50 | | | | 2 | | | | 20 | | | | 26 | |
| Internal servicing cost | | | 31 | | | | – | | | | 7 | | | | 9 | |
| Administrative services fees | | | 350 | | | | 3 | | | | 316 | | | | 488 | |
| Distribution fees and shareholder servicing fees | | | 554 | | | | 3 | | | | 138 | | | | 97 | |
| Administrative, networking and omnibus fees | | | 128 | | | | – | | | | 15 | | | | 112 | |
| Non-interested Trustees’ fees and expenses | | | 51 | | | | – | | | | 21 | | | | 26 | |
| Non-interested Trustees’ deferred compensation fees | | | 107 | | | | 4 | | | | 40 | | | | 52 | |
| Accrued expenses and other payables | | | 325 | | | | 66 | | | | 227 | | | | 305 | |
| Forward currency contracts | | | – | | | | 287 | | | | – | | | | – | |
| Total Liabilities | | | 148,499 | | | | 5,613 | | | | 64,723 | | | | 41,673 | |
| Net Assets | | $ | 6,157,429 | | | $ | 258,184 | | | $ | 2,324,515 | | | $ | 3,007,677 | |
See footnotes at the end of the Statements.
See Notes to Financial Statements.
64 | JUNE 30, 2013
This page intentionally left blank. The content of this page is part of a ‘Double Page Spread’ table and appears on the previous page.
65
Statements of Assets and Liabilities - Fixed Income Funds (continued)
| | | | | | | | | | | | | | | | | |
As of June 30, 2013
| | | | | | | | |
| (all numbers in thousands except net asset value per share) | | Janus Flexible Bond Fund | | Janus Global Bond Fund | | Janus High-Yield Fund | | Janus Short-Term Bond Fund |
|
| |
| Net Assets Consist of: | | | | | | | | | | | | | | | | |
| Capital (par value and paid-in surplus)* | | $ | 6,128,569 | | | $ | 268,461 | | | $ | 2,248,227 | | | $ | 2,998,926 | |
| Undistributed net investment income/(loss)* | | | 96 | | | | (288) | | | | 320 | | | | (9) | |
| Undistributed net realized gain/(loss) from investment and foreign currency transactions* | | | 22,068 | | | | (6,374) | | | | 54,602 | | | | 7,781 | |
| Unrealized net appreciation/(depreciation) of investments, foreign currency translations and non-interested Trustees’ deferred compensation | | | 6,696 | | | | (3,615) | | | | 21,366 | | | | 979 | |
| Total Net Assets | | $ | 6,157,429 | | | $ | 258,184 | | | $ | 2,324,515 | | | $ | 3,007,677 | |
| Net Assets - Class A Shares | | $ | 719,932 | | | $ | 4,649 | | | $ | 321,554 | | | $ | 153,132 | |
| Shares Outstanding, $0.01 Par Value (unlimited shares authorized) | | | 68,584 | | | | 472 | | | | 35,176 | | | | 50,224 | |
Net Asset Value Per Share(1) | | $ | 10.50 | | | $ | 9.85 | | | $ | 9.14 | | | $ | 3.05 | |
Maximum Offering Price Per Share(2) | | $ | 11.02 | | | $ | 10.34 | | | $ | 9.60 | | | $ | 3.13 | |
| Net Assets - Class C Shares | | $ | 432,713 | | | $ | 1,654 | | | $ | 79,726 | | | $ | 78,276 | |
| Shares Outstanding, $0.01 Par Value (unlimited shares authorized) | | | 41,220 | | | | 168 | | | | 8,718 | | | | 25,694 | |
Net Asset Value Per Share(1) | | $ | 10.50 | | | $ | 9.86 | | | $ | 9.14 | | | $ | 3.05 | |
| Net Assets - Class D Shares | | $ | 750,690 | | | $ | 9,875 | | | $ | 360,924 | | | $ | 208,522 | |
| Shares Outstanding, $0.01 Par Value (unlimited shares authorized) | | | 71,515 | | | | 1,003 | | | | 39,479 | | | | 68,291 | |
| Net Asset Value Per Share | | $ | 10.50 | | | $ | 9.85 | | | $ | 9.14 | | | $ | 3.05 | |
| Net Assets - Class I Shares | | $ | 2,918,160 | | | $ | 234,166 | | | $ | 236,426 | | | $ | 315,482 | |
| Shares Outstanding, $0.01 Par Value (unlimited shares authorized) | | | 278,012 | | | | 23,799 | | | | 25,852 | | | | 103,470 | |
| Net Asset Value Per Share | | $ | 10.50 | | | $ | 9.84 | | | $ | 9.15 | | | $ | 3.05 | |
| Net Assets - Class N Shares | | $ | 64,760 | | | | N/A | | | $ | 6,738 | | | $ | 37,619 | |
| Shares Outstanding, $0.01 Par Value (unlimited shares authorized) | | | 6,170 | | | | N/A | | | | 737 | | | | 12,324 | |
| Net Asset Value Per Share | | $ | 10.50 | | | | N/A | | | $ | 9.14 | | | $ | 3.05 | |
| Net Assets - Class R Shares | | $ | 30,080 | | | | N/A | | | $ | 1,666 | | | | N/A | |
| Shares Outstanding, $0.01 Par Value (unlimited shares authorized) | | | 2,866 | | | | N/A | | | | 182 | | | | N/A | |
| Net Asset Value Per Share | | $ | 10.50 | | | | N/A | | | $ | 9.14 | | | | N/A | |
| Net Assets - Class S Shares | | $ | 75,202 | | | $ | 905 | | | $ | 6,901 | | | $ | 5,149 | |
| Shares Outstanding, $0.01 Par Value (unlimited shares authorized) | | | 7,163 | | | | 92 | | | | 753 | | | | 1,690 | |
| Net Asset Value Per Share | | $ | 10.50 | | | $ | 9.87 | | | $ | 9.16 | | | $ | 3.05 | |
| Net Assets - Class T Shares | | $ | 1,165,892 | | | $ | 6,935 | | | $ | 1,310,580 | | | $ | 2,209,497 | |
| Shares Outstanding, $0.01 Par Value (unlimited shares authorized) | | | 111,093 | | | | 704 | | | | 143,332 | | | | 723,339 | |
| Net Asset Value Per Share | | $ | 10.49 | | | $ | 9.86 | | | $ | 9.14 | | | $ | 3.05 | |
| | | |
| * | | See Note 5 in Notes to Financial Statements. |
| (1) | | Redemption price per share may be reduced for any applicable contingent deferred sales charge. |
| (2) | | Maximum offering price is computed at 100/95.25 of net asset value for Janus Flexible Bond Fund, Janus Global Bond Fund, and Janus High-Yield Fund and 100/97.50 of net asset value for Janus Short-Term Bond Fund. |
| | | |
| | | |
See Notes to Financial Statements.
66 | JUNE 30, 2013
This page intentionally left blank. The content of this page is part of a ‘Double Page Spread’ table and appears on the previous page.
67
Statements of Operations - Fixed Income Funds
| | | | | | | | | | | | | | | | | | | | | |
For the year ended June 30, 2013
| | | | | | | | | | |
| (all numbers in thousands) | | Janus Flexible Bond Fund | | Janus Global Bond Fund | | Janus High-Yield Fund | | Janus Short-Term Bond Fund | | |
|
| |
| Investment Income: | | | | | | | | | | | | | | | | | | | | |
| Interest | | $ | 164,892 | | | $ | 2,969 | | | $ | 169,258 | | | $ | 66,599 | | | | | |
| Dividends | | | 1,542 | | | | 23 | | | | 570 | | | | – | | | | | |
| Dividends from affiliates | | | 273 | | | | 6 | | | | 196 | | | | 135 | | | | | |
| Fee income | | | 13 | | | | – | | | | 638 | | | | 23 | | | | | |
| Other Income | | | 1,671 | | | | 38 | | | | 2,457 | | | | 2,605 | | | | | |
| Foreign tax withheld | | | – | | | | (1) | | | | – | | | | – | | | | | |
| Total Investment Income | | | 168,391 | | | | 3,035 | | | | 173,119 | | | | 69,362 | | | | | |
| Expenses: | | | | | | | | | | | | | | | | | | | | |
| Advisory fees | | | 23,979 | | | | 574 | | | | 13,767 | | | | 16,670 | | | | | |
| Internal servicing expense - Class A Shares | | | 89 | | | | 1 | | | | 34 | | | | 55 | | | | | |
| Internal servicing expense - Class C Shares | | | 157 | | | | 1 | | | | 30 | | | | 29 | | | | | |
| Internal servicing expense - Class I Shares | | | 111 | | | | 1 | | | | 16 | | | | 20 | | | | | |
| Shareholder reports expense | | | 874 | | | | 7 | | | | 406 | | | | 561 | | | | | |
| Transfer agent fees and expenses | | | 252 | | | | 5 | | | | 96 | | | | 103 | | | | | |
| Registration fees | | | 314 | | | | 67 | | | | 255 | | | | 282 | | | | | |
| Custodian fees | | | 39 | | | | 9 | | | | 14 | | | | 17 | | | | | |
| Professional fees | | | 121 | | | | 81 | | | | 101 | | | | 99 | | | | | |
| Non-interested Trustees’ fees and expenses | | | 216 | | | | 3 | | | | 80 | | | | 92 | | | | | |
| Fund administration fees | | | 592 | | | | 10 | | | | 245 | | | | 303 | | | | | |
| Administrative services fees - Class D Shares | | | 990 | | | | 14 | | | | 434 | | | | 252 | | | | | |
| Administrative services fees - Class R Shares | | | 74 | | | | N/A | | | | 4 | | | | N/A | | | | | |
| Administrative services fees - Class S Shares | | | 196 | | | | 2 | | | | 17 | | | | 13 | | | | | |
| Administrative services fees - Class T Shares | | | 3,335 | | | | 10 | | | | 3,505 | | | | 5,500 | | | | | |
| Distribution fees and shareholder servicing fees - Class A Shares | | | 1,966 | | | | 12 | | | | 747 | | | | 482 | | | | | |
| Distribution fees and shareholder servicing fees - Class C Shares | | | 4,703 | | | | 20 | | | | 842 | | | | 784 | | | | | |
| Distribution fees and shareholder servicing fees - Class R Shares | | | 140 | | | | N/A | | | | 7 | | | | N/A | | | | | |
| Distribution fees and shareholder servicing fees - Class S Shares | | | 196 | | | | 2 | | | | 17 | | | | 12 | | | | | |
| Administrative, networking and omnibus fees - Class A Shares | | | 378 | | | | 1 | | | | 264 | | | | 355 | | | | | |
| Administrative, networking and omnibus fees - Class C Shares | | | 339 | | | | – | | | | 56 | | | | 45 | | | | | |
| Administrative, networking and omnibus fees - Class I Shares | | | 2,352 | | | | – | | | | 172 | | | | 149 | | | | | |
| Other expenses | | | 241 | | | | 26 | | | | 228 | | | | 164 | | | | | |
| Total Expenses | | | 41,654 | | | | 846 | | | | 21,337 | | | | 25,987 | | | | | |
| Expense and Fee Offset | | | (3) | | | | – | | | | (3) | | | | (2) | | | | | |
| Less: Excess Expense Reimbursement | | | (239) | | | | (43) | | | | (65) | | | | (2,249) | | | | | |
| Net Expenses after Waivers and Expense Offsets | | | 41,412 | | | | 803 | | | | 21,269 | | | | 23,736 | | | | | |
| Net Investment Income | | | 126,979 | | | | 2,232 | | | | 151,850 | | | | 45,626 | | | | | |
| Net Realized and Unrealized Gain/(Loss) on Investments: | | | | | | | | | | | | | | | | | | | | |
| Net realized gain/(loss) from investment and foreign currency transactions | | | 114,855 | | | | (7,271) | | | | 87,166 | | | | 19,320 | | | | | |
| Change in unrealized net appreciation/(depreciation) of investments, foreign currency translations and non-interested Trustees’ deferred compensation | | | (170,235) | | | | (4,006) | | | | (50,488) | | | | (30,660) | | | | | |
| Net Gain/(Loss) on Investments | | | (55,380) | | | | (11,277) | | | | 36,678 | | | | (11,340) | | | | | |
| Net Increase/(Decrease) in Net Assets Resulting from Operations | | $ | 71,599 | | | $ | (9,045) | | | $ | 188,528 | | | $ | 34,286 | | | | | |
See Notes to Financial Statements.
68 | JUNE 30, 2013
This page intentionally left blank. The content of this page is part of a ‘Double Page Spread’ table and appears on the previous page.
69
Statements of Changes in Net Assets - Fixed Income Funds
| | | | | | | | | | | | | | | | | | | | | | | | | | | | | | | | | |
| | | Janus Flexible
| | Janus Global
| | Janus
| | Janus Short-Term
|
For each year ended June 30
| | Bond Fund | | Bond Fund | | High-Yield Fund | | Bond Fund |
| (all numbers in thousands) | | 2013 | | 2012(1) | | 2013 | | 2012 | | 2013 | | 2012(1) | | 2013 | | 2012(1) |
|
| |
| Operations: | | | | | | | | | | | | | | | | | | | | | | | | | | | | | | | | |
| Net investment income | | $ | 126,979 | | | $ | 135,612 | | | $ | 2,232 | | | $ | 877 | | | $ | 151,850 | | | $ | 136,441 | | | $ | 45,626 | | | $ | 58,928 | |
| Net realized gain/(loss) from investment and foreign currency transactions | | | 114,855 | | | | 99,550 | | | | (7,271) | | | | 529 | | | | 87,166 | | | | (16,082) | | | | 19,320 | | | | 10,662 | |
| Change in unrealized net appreciation/(depreciation) of investments, foreign currency translations and non-interested Trustees’ deferred compensation | | | (170,235) | | | | 99,405 | | | | (4,006) | | | | 122 | | | | (50,488) | | | | (2,788) | | | | (30,660) | | | | (9,628) | |
| Net Increase/(Decrease) in Net Assets Resulting from Operations | | | 71,599 | | | | 334,567 | | | | (9,045) | | | | 1,528 | | | | 188,528 | | | | 117,571 | | | | 34,286 | | | | 59,962 | |
| Dividends and Distributions to Shareholders: | | | | | | | | | | | | | | | | | | | | | | | | | | | | | | | | |
| Net Investment Income* | | | | | | | | | | | | | | | | | | | | | | | | | | | | | | | | |
| Class A Shares | | | (21,719) | | | | (17,781) | | | | (54) | | | | (96) | | | | (18,233) | | | | (14,849) | | | | (2,876) | | | | (7,560) | |
| Class C Shares | | | (9,246) | | | | (8,471) | | | | (16) | | | | (34) | | | | (4,511) | | | | (4,617) | | | | (576) | | | | (923) | |
| Class D Shares | | | (24,080) | | | | (26,145) | | | | (131) | | | | (311) | | | | (22,771) | | | | (22,442) | | | | (3,355) | | | | (4,308) | |
| Class I Shares | | | (64,518) | | | | (55,239) | | | | (814) | | | | (383) | | | | (18,236) | | | | (16,574) | | | | (5,331) | | | | (8,595) | |
| Class N Shares | | | (6,493) | | | | (542) | | | | N/A | | | | N/A | | | | (568) | | | | (20) | | | | (655) | | | | (41) | |
| Class R Shares | | | (690) | | | | (391) | | | | N/A | | | | N/A | | | | (83) | | | | (72) | | | | N/A | | | | N/A | |
| Class S Shares | | | (2,018) | | | | (2,094) | | | | (10) | | | | (23) | | | | (411) | | | | (409) | | | | (66) | | | | (98) | |
| Class T Shares | | | (37,752) | | | | (34,910) | | | | (44) | | | | (127) | | | | (87,051) | | | | (78,752) | | | | (32,748) | | | | (37,408) | |
| Net Realized Gain/(Loss) from Investment Transactions* | | | | | | | | | | | | | | | | | | | | | | | | | | | | | | | | |
| Class A Shares | | | (16,132) | | | | (7,683) | | | | (108) | | | | (29) | | | | (426) | | | | – | | | | (1,192) | | | | (729) | |
| Class C Shares | | | (9,469) | | | | (4,783) | | | | (49) | | | | (11) | | | | (126) | | | | – | | | | (558) | | | | (150) | |
| Class D Shares | | | (16,438) | | | | (10,736) | | | | (293) | | | | (84) | | | | (534) | | | | – | | | | (1,498) | | | | (403) | |
| Class I Shares | | | (41,813) | | | | (22,886) | | | | (346) | | | | (85) | | | | (410) | | | | – | | | | (2,276) | | | | (724) | |
| Class N Shares | | | (5,266) | | | | – | | | | N/A | | | | N/A | | | | (17) | | | | – | | | | (290) | | | | – | |
| Class R Shares | | | (612) | | | | (173) | | | | N/A | | | | N/A | | | | (2) | | | | – | | | | N/A | | | | N/A | |
| Class S Shares | | | (1,538) | | | | (946) | | | | (22) | | | | (6) | | | | (10) | | | | – | | | | (36) | | | | (11) | |
| Class T Shares | | | (26,922) | | | | (14,600) | | | | (78) | | | | (21) | | | | (2,091) | | | | – | | | | (15,842) | | | | (3,655) | |
| Return of Capital | | | | | | | | | | | | | | | | | | | | | | | | | | | | | | | | |
| Class A Shares | | | N/A | | | | N/A | | | | (87) | | | | N/A | | | | N/A | | | | N/A | | | | N/A | | | | N/A | |
| Class C Shares | | | N/A | | | | N/A | | | | (26) | | | | N/A | | | | N/A | | | | N/A | | | | N/A | | | | N/A | |
| Class D Shares | | | N/A | | | | N/A | | | | (209) | | | | N/A | | | | N/A | | | | N/A | | | | N/A | | | | N/A | |
| Class I Shares | | | N/A | | | | N/A | | | | (1,299) | | | | N/A | | | | N/A | | | | N/A | | | | N/A | | | | N/A | |
| Class S Shares | | | N/A | | | | N/A | | | | (15) | | | | N/A | | | | N/A | | | | N/A | | | | N/A | | | | N/A | |
| Class T Shares | | | N/A | | | | N/A | | | | (70) | | | | N/A | | | | N/A | | | | N/A | | | | N/A | | | | N/A | |
| Net Decrease from Dividends and Distributions | | | (284,706) | | | | (207,380) | | | | (3,671) | | | | (1,210) | | | | (155,480) | | | | (137,735) | | | | (67,299) | | | | (64,605) | |
See footnotes at the end of the Statements.
See Notes to Financial Statements.
70 | JUNE 30, 2013
This page intentionally left blank. The content of this page is part of a ‘Double Page Spread’ table and appears on the previous page.
71
Statements of Changes in Net Assets - Fixed Income Funds (continued)
| | | | | | | | | | | | | | | | | | | | | | | | | | | | | | | | | |
| | | Janus Flexible
| | Janus Global
| | Janus
| | Janus Short-Term
|
For each year ended June 30
| | Bond Fund | | Bond Fund | | High-Yield Fund | | Bond Fund |
| (all numbers in thousands) | | 2013 | | 2012(1) | | 2013 | | 2012 | | 2013 | | 2012(1) | | 2013 | | 2012(1) |
|
| |
| Capital Share Transactions: | | | | | | | | | | | | | | | | | | | | | | | | | | | | | | | | |
| Shares Sold | | | | | | | | | | | | | | | | | | | | | | | | | | | | | | | | |
| Class A Shares | | | 325,805 | | | | 402,803 | | | | 1,880 | | | | 4,436 | | | | 147,203 | | | | 173,224 | | | | 89,588 | | | | 204,991 | |
| Class C Shares | | | 154,241 | | | | 202,079 | | | | 324 | | | | 968 | | | | 18,370 | | | | 19,046 | | | | 28,566 | | | | 32,420 | |
| Class D Shares | | | 125,852 | | | | 188,338 | | | | 5,809 | | | | 13,949 | | | | 87,790 | | | | 58,469 | | | | 53,023 | | | | 44,440 | |
| Class I Shares | | | 2,020,700 | | | | 1,044,312 | | | | 236,075 | | | | 5,457 | | | | 215,586 | | | | 262,973 | | | | 244,920 | | | | 217,482 | |
| Class N Shares | | | 63,380 | | | | 255,838 | | | | N/A | | | | N/A | | | | 8,989 | | | | 4,347 | | | | 18,989 | | | | 35,186 | |
| Class R Shares | | | 17,378 | | | | 22,585 | | | | N/A | | | | N/A | | | | 1,008 | | | | 676 | | | | N/A | | | | N/A | |
| Class S Shares | | | 32,577 | | | | 39,308 | | | | – | | | | – | | | | 1,733 | | | | 1,751 | | | | 3,957 | | | | 1,135 | |
| Class T Shares | | | 444,129 | | | | 699,607 | | | | 7,780 | | | | 1,936 | | | | 430,791 | | | | 509,052 | | | | 1,124,277 | | | | 781,742 | |
| Redemption Fees | | | | | | | | | | | | | | | | | | | | | | | | | | | | | | | | |
| Class D Shares | | | N/A | | | | N/A | | | | N/A | | | | N/A | | | | N/A | | | | 26 | | | | N/A | | | | N/A | |
| Class I Shares | | | N/A | | | | N/A | | | | N/A | | | | N/A | | | | N/A | | | | 7 | | | | N/A | | | | N/A | |
| Class T Shares | | | N/A | | | | N/A | | | | N/A | | | | N/A | | | | N/A | | | | 184 | | | | N/A | | | | N/A | |
| Reinvested Dividends and Distributions | | | | | | | | | | | | | | | | | | | | | | | | | | | | | | | | |
| Class A Shares | | | 35,258 | | | | 23,185 | | | | 246 | | | | 124 | | | | 17,962 | | | | 14,093 | | | | 3,667 | | | | 7,919 | |
| Class C Shares | | | 13,850 | | | | 9,078 | | | | 90 | | | | 45 | | | | 3,905 | | | | 3,784 | | | | 865 | | | | 789 | |
| Class D Shares | | | 38,141 | | | | 34,443 | | | | 614 | | | | 385 | | | | 19,895 | | | | 19,038 | | | | 4,740 | | | | 4,595 | |
| Class I Shares | | | 87,663 | | | | 65,998 | | | | 2,459 | | | | 467 | | | | 16,133 | | | | 14,190 | | | | 4,722 | | | | 6,606 | |
| Class N Shares | | | 11,484 | | | | 542 | | | | N/A | | | | N/A | | | | 566 | | | | 20 | | | | 941 | | | | 41 | |
| Class R Shares | | | 1,128 | | | | 482 | | | | N/A | | | | N/A | | | | 58 | | | | 56 | | | | N/A | | | | N/A | |
| Class S Shares | | | 3,542 | | | | 3,027 | | | | 47 | | | | 29 | | | | 420 | | | | 404 | | | | 101 | | | | 109 | |
| Class T Shares | | | 64,071 | | | | 48,984 | | | | 191 | | | | 148 | | | | 87,855 | | | | 77,538 | | | | 47,910 | | | | 40,603 | |
Shares Repurchased(2) | | | | | | | | | | | | | | | | | | | | | | | | | | | | | | | | |
| Class A Shares | | | (311,972) | | | | (145,182) | | | | (2,287) | | | | (699) | | | | (112,424) | | | | (92,406) | | | | (362,528) | | | | (164,394) | |
| Class C Shares | | | (145,032) | | | | (63,898) | | | | (528) | | | | (435) | | | | (22,244) | | | | (21,627) | | | | (26,128) | | | | (27,869) | |
| Class D Shares | | | (189,101) | | | | (128,131) | | | | (6,039) | | | | (8,959) | | | | (80,110) | | | | (61,284) | | | | (54,413) | | | | (51,923) | |
| Class I Shares | | | (789,285) | | | | (693,944) | | | | (8,137) | | | | (1,748) | | | | (239,341) | | | | (210,920) | | | | (205,881) | | | | (491,109) | |
| Class N Shares | | | (260,681) | | | | (3,931) | | | | N/A | | | | N/A | | | | (7,314) | | | | (48) | | | | (16,271) | | | | (924) | |
| Class R Shares | | | (13,544) | | | | (6,907) | | | | N/A | | | | N/A | | | | (490) | | | | (721) | | | | N/A | | | | N/A | |
| Class S Shares | | | (32,442) | | | | (27,933) | | | | – | | | | – | | | | (1,560) | | | | (2,794) | | | | (3,981) | | | | (1,800) | |
| Class T Shares | | | (585,650) | | | | (286,735) | | | | (2,903) | | | | (8,648) | | | | (498,467) | | | | (364,985) | | | | (959,865) | | | | (750,571) | |
| Net Increase/(Decrease) from Capital Share Transactions | | | 1,111,492 | | | | 1,683,948 | | | | 235,621 | | | | 7,455 | | | | 96,314 | | | | 404,093 | | | | (2,801) | | | | (110,532) | |
| Net Increase/(Decrease) in Net Assets | | | 898,385 | | | | 1,811,135 | | | | 222,905 | | | | 7,773 | | | | 129,362 | | | | 383,929 | | | | (35,814) | | | | (115,175) | |
| Net Assets: | | | | | | | | | | | | | | | | | | | | | | | | | | | | | | | | |
| Beginning of period | | | 5,259,044 | | | | 3,447,909 | | | | 35,279 | | | | 27,506 | | | | 2,195,153 | | | | 1,811,224 | | | | 3,043,491 | | | | 3,158,666 | |
| End of period | | $ | 6,157,429 | | | $ | 5,259,044 | | | $ | 258,184 | | | $ | 35,279 | | | $ | 2,324,515 | | | $ | 2,195,153 | | | $ | 3,007,677 | | | $ | 3,043,491 | |
| | | | | | | | | | | | | | | | | | | | | | | | | | | | | | | | | |
| Undistributed Net Investment Income/(Loss)* | | $ | 96 | | | $ | 32 | | | $ | (288) | | | $ | (1) | | | $ | 320 | | | $ | 42 | | | $ | (9) | | | $ | (89) | |
| | | |
| * | | See Note 5 in Notes to Financial Statements. |
| (1) | | Period from May 31, 2012 (inception date) through June 30, 2012 for Class N Shares. |
| (2) | | During the fiscal year ended June 30, 2012, Janus Flexible Bond Fund disbursed to a redeeming shareholder portfolio securities and cash valued at $13,879,817 and $2,616,353, respectively, at the date of redemption. |
| | | |
| | | |
See Notes to Financial Statements.
72 | JUNE 30, 2013
This page intentionally left blank. The content of this page is part of a ‘Double Page Spread’ table and appears on the previous page.
73
Financial Highlights - Fixed Income Funds
Class A Shares
| | | | | | | | | | | | | | | | | | | | | | | |
For a share outstanding during each year or period ended June 30 and
| | Janus Flexible Bond Fund |
| the period ended October 31, 2009 | | 2013 | | 2012 | | 2011 | | 2010(1) | | 2009(2) | | |
| |
| Net Asset Value, Beginning of Period | | | $10.85 | | | | $10.54 | | | | $10.70 | | | | $10.41 | | | | $9.97 | | | |
| Income from Investment Operations: | | | | | | | | | | | | | | | | | | | | | | |
| Net investment income | | | 0.30 | | | | 0.35 | | | | 0.37 | | | | 0.28 | | | | 0.14 | | | |
| Net gain/(loss) on investments (both realized and unrealized) | | | (0.14) | | | | 0.46 | | | | 0.19 | | | | 0.35 | | | | 0.44 | | | |
| Total from Investment Operations | | | 0.16 | | | | 0.81 | | | | 0.56 | | | | 0.63 | | | | 0.58 | | | |
| Less Distributions: | | | | | | | | | | | | | | | | | | | | | | |
| Dividends (from net investment income)* | | | (0.30) | | | | (0.35) | | | | (0.38) | | | | (0.28) | | | | (0.14) | | | |
| Distributions (from capital gains)* | | | (0.21) | | | | (0.15) | | | | (0.34) | | | | (0.06) | | | | – | | | |
| Total Distributions | | | (0.51) | | | | (0.50) | | | | (0.72) | | | | (0.34) | | | | (0.14) | | | |
| Net Asset Value, End of Period | | | $10.50 | | | | $10.85 | | | | $10.54 | | | | $10.70 | | | | $10.41 | | | |
| Total Return** | | | 1.45% | | | | 7.97% | | | | 5.41% | | | | 6.16% | | | | 5.87% | | | |
| Net Assets, End of Period (in thousands) | | | $719,932 | | | | $697,880 | | | | $400,706 | | | | $324,085 | | | | $231,112 | | | |
| Average Net Assets for the Period (in thousands) | | | $786,291 | | | | $539,788 | | | | $371,462 | | | | $265,798 | | | | $218,408 | | | |
| Ratio of Gross Expenses (Absent the Waiver of Certain Fees and Expense Offsets) to Average Net Assets*** | | | 0.75% | | | | 0.77% | | | | 0.76% | | | | 0.76% | | | | 0.80% | | | |
| Ratio of Net Expenses (After Waivers and Expense Offsets) to Average Net Assets*** | | | 0.75% | | | | 0.77% | | | | 0.76% | | | | 0.76% | | | | 0.80% | | | |
| Ratio of Net Investment Income to Average Net Assets*** | | | 2.09% | | | | 3.06% | | | | 3.51% | | | | 4.04% | | | | 4.28% | | | |
| Portfolio Turnover Rate | | | 118% | | | | 126% | | | | 147% | | | | 86%^ | | | | 215% | | | |
Class A Shares
| | | | | | | | | | | | | | | |
| | | Janus Global Bond Fund | | |
| For a share outstanding during each year or period ended June 30 | | 2013 | | 2012 | | 2011(3) | | |
| |
| Net Asset Value, Beginning of Period | | | $10.48 | | | | $10.35 | | | | $10.00 | | | |
| Income from Investment Operations: | | | | | | | | | | | | | | |
| Net investment income | | | 0.27 | | | | 0.23 | | | | 0.19 | | | |
| Net gain/(loss) on investments (both realized and unrealized) | | | (0.35) | | | | 0.27 | | | | 0.31 | | | |
| Total from Investment Operations | | | (0.08) | | | | 0.50 | | | | 0.50 | | | |
| Less Distributions and Other: | | | | | | | | | | | | | | |
| Dividends (from net investment income)* | | | (0.12) | | | | (0.29) | | | | (0.15) | | | |
| Distributions (from capital gains)* | | | (0.25) | | | | (0.08) | | | | – | | | |
| Return of capital | | | (0.18) | | | | N/A | | | | N/A | | | |
| Total Distributions and Other | | | (0.55) | | | | (0.37) | | | | (0.15) | | | |
| Net Asset Value, End of Period | | | $9.85 | | | | $10.48 | | | | $10.35 | | | |
| Total Return** | | | (1.04)% | | | | 4.89% | | | | 4.99% | | | |
| Net Assets, End of Period (in thousands) | | | $4,649 | | | | $5,113 | | | | $1,190 | | | |
| Average Net Assets for the Period (in thousands) | | | $5,017 | | | | $3,309 | | | | $958 | | | |
| Ratio of Gross Expenses (Absent the Waiver of Certain Fees and Expense Offsets) to Average Net Assets*** | | | 1.28% | | | | 1.46% | | | | 3.50% | | | |
| Ratio of Net Expenses (After Waivers and Expense Offsets) to Average Net Assets*** | | | 1.01% | | | | 1.02% | | | | 0.79% | | | |
| Ratio of Net Investment Income to Average Net Assets*** | | | 2.32% | | | | 2.48% | | | | 3.03% | | | |
| Portfolio Turnover Rate | | | 182% | | | | 222% | | | | 173% | | | |
| | | |
| * | | See Note 5 in Notes to Financial Statements. |
| ** | | Total return not annualized for periods of less than one full year. |
| *** | | Annualized for periods of less than one full year. |
| ^ | | Rate has been adjusted to conform with current year presentation. |
| (1) | | Period from November 1, 2009 through June 30, 2010. The Fund changed its fiscal year end from October 31 to June 30. |
| (2) | | Period from July 6, 2009 (inception date) through October 31, 2009. |
| (3) | | Period from December 28, 2010 (inception date) through June 30, 2011. |
See Notes to Financial Statements.
74 | JUNE 30, 2013
Class A Shares
| | | | | | | | | | | | | | | | | | | | | | | |
For a share outstanding during each year or period ended June 30 and
| | Janus High-Yield Fund |
| the period ended October 31, 2009 | | 2013 | | 2012 | | 2011 | | 2010(1) | | 2009(2) | | |
| |
| Net Asset Value, Beginning of Period | | | $9.00 | | | | $9.13 | | | | $8.45 | | | | $8.29 | | | | $7.61 | | | |
| Income from Investment Operations: | | | | | | | | | | | | | | | | | | | | | | |
| Net investment income | | | 0.57 | | | | 0.62 | | | | 0.65 | | | | 0.47 | | | | 0.27 | | | |
| Net gain/(loss) on investments (both realized and unrealized) | | | 0.15 | | | | (0.13) | | | | 0.68 | | | | 0.16 | | | | 0.68 | | | |
| Total from Investment Operations | | | 0.72 | | | | 0.49 | | | | 1.33 | | | | 0.63 | | | | 0.95 | | | |
| Less Distributions: | | | | | | | | | | | | | | | | | | | | | | |
| Dividends (from net investment income)* | | | (0.57) | | | | (0.62) | | | | (0.65) | | | | (0.47) | | | | (0.27) | | | |
| Distributions (from capital gains)* | | | (0.01) | | | | – | | | | – | | | | – | | | | – | | | |
| Total Distributions | | | (0.58) | | | | (0.62) | | | | (0.65) | | | | (0.47) | | | | (0.27) | | | |
| Net Asset Value, End of Period | | | $9.14 | | | | $9.00 | | | | $9.13 | | | | $8.45 | | | | $8.29 | | | |
| Total Return** | | | 8.12% | | | | 5.71% | | | | 16.09%(3) | | | | 7.66% | | | | 12.63% | | | |
| Net Assets, End of Period (in thousands) | | | $321,554 | | | | $265,944 | | | | $171,976 | | | | $109,096 | | | | $84,972 | | | |
| Average Net Assets for the Period (in thousands) | | | $298,736 | | | | $212,564 | | | | $143,277 | | | | $98,784 | | | | $75,369 | | | |
| Ratio of Gross Expenses (Absent the Waiver of Certain Fees and Expense Offsets) to Average Net Assets*** | | | 0.97% | | | | 0.99% | | | | 0.92% | | | | 0.92% | | | | 0.96% | | | |
| Ratio of Net Expenses (After Waivers and Expense Offsets) to Average Net Assets*** | | | 0.97% | | | | 0.99% | | | | 0.92% | | | | 0.92% | | | | 0.96% | | | |
| Ratio of Net Investment Income to Average Net Assets*** | | | 6.10% | | | | 6.91% | | | | 7.23% | | | | 8.30% | | | | 10.07% | | | |
| Portfolio Turnover Rate | | | 93% | | | | 61% | | | | 92% | | | | 61%^ | | | | 97% | | | |
Class A Shares
| | | | | | | | | | | | | | | | | | | | | | | |
For a share outstanding during each year or period ended June 30 and
| | Janus Short-Term Bond Fund |
| the period ended October 31, 2009 | | 2013 | | 2012 | | 2011 | | 2010(1) | | 2009(2) | | |
| |
| Net Asset Value, Beginning of Period | | | $3.08 | | | | $3.08 | | | | $3.09 | | | | $3.06 | | | | $3.01 | | | |
| Income from Investment Operations: | | | | | | | | | | | | | | | | | | | | | | |
| Net investment income | | | 0.05 | | | | 0.06 | | | | 0.07 | | | | 0.05 | | | | 0.04 | | | |
| Net gain/(loss) on investments (both realized and unrealized) | | | (0.01) | | | | 0.01 | | | | 0.01 | | | | 0.03 | | | | 0.05 | | | |
| Total from Investment Operations | | | 0.04 | | | | 0.07 | | | | 0.08 | | | | 0.08 | | | | 0.09 | | | |
| Less Distributions: | | | | | | | | | | | | | | | | | | | | | | |
| Dividends (from net investment income)* | | | (0.05) | | | | (0.06) | | | | (0.07) | | | | (0.05) | | | | (0.04) | | | |
| Distributions (from capital gains)* | | | (0.02) | | | | (0.01) | | | | (0.02) | | | | – | | | | – | | | |
| Total Distributions | | | (0.07) | | | | (0.07) | | | | (0.09) | | | | (0.05) | | | | (0.04) | | | |
| Net Asset Value, End of Period | | | $3.05 | | | | $3.08 | | | | $3.08 | | | | $3.09 | | | | $3.06 | | | |
| Total Return** | | | 1.24% | | | | 2.18% | | | | 2.65% | | | | 2.65% | | | | 3.05% | | | |
| Net Assets, End of Period (in thousands) | | | $153,132 | | | | $423,210 | | | | $374,981 | | | | $121,254 | | | | $43,636 | | | |
| Average Net Assets for the Period (in thousands) | | | $192,733 | | | | $387,633 | | | | $164,464 | | | | $82,728 | | | | $18,271 | | | |
| Ratio of Gross Expenses (Absent the Waiver of Certain Fees and Expense Offsets) to Average Net Assets*** | | | 1.07% | | | | 1.40% | | | | 0.88% | | | | 0.84% | | | | 0.88% | | | |
| Ratio of Net Expenses (After Waivers and Expense Offsets) to Average Net Assets*** | | | 0.81% | | | | 0.80% | | | | 0.80% | | | | 0.80% | | | | 0.81% | | | |
| Ratio of Net Investment Income to Average Net Assets*** | | | 1.49% | | | | 1.95% | | | | 2.12% | | | | 2.39% | | | | 2.78% | | | |
| Portfolio Turnover Rate | | | 100% | | | | 93% | | | | 100% | | | | 33%^ | | | | 57% | | | |
| | | |
| * | | See Note 5 in Notes to Financial Statements. |
| ** | | Total return not annualized for periods of less than one full year. |
| *** | | Annualized for periods of less than one full year. |
| ^ | | Rate has been adjusted to conform with current year presentation. |
| (1) | | Period from November 1, 2009 through June 30, 2010. The Fund changed its fiscal year end from October 31 to June 30. |
| (2) | | Period from July 6, 2009 (inception date) through October 31, 2009. |
| (3) | | Impact on performance due to reimbursement from advisor was 0.51%. |
See Notes to Financial Statements.
Janus Fixed Income & Money Market Funds | 75
Financial Highlights - Fixed Income Funds (continued)
Class C Shares
| | | | | | | | | | | | | | | | | | | | | | | |
For a share outstanding during each year or period ended June 30 and
| | Janus Flexible Bond Fund |
| the period ended October 31, 2009 | | 2013 | | 2012 | | 2011 | | 2010(1) | | 2009(2) | | |
| |
| Net Asset Value, Beginning of Period | | | $10.85 | | | | $10.54 | | | | $10.70 | | | | $10.41 | | | | $9.97 | | | |
| Income from Investment Operations: | | | | | | | | | | | | | | | | | | | | | | |
| Net investment income | | | 0.21 | | | | 0.27 | | | | 0.29 | | | | 0.23 | | | | 0.12 | | | |
| Net gain/(loss) on investments (both realized and unrealized) | | | (0.14) | | | | 0.46 | | | | 0.19 | | | | 0.35 | | | | 0.44 | | | |
| Total from Investment Operations | | | 0.07 | | | | 0.73 | | | | 0.48 | | | | 0.58 | | | | 0.56 | | | |
| Less Distributions: | | | | | | | | | | | | | | | | | | | | | | |
| Dividends (from net investment income)* | | | (0.21) | | | | (0.27) | | | | (0.30) | | | | (0.23) | | | | (0.12) | | | |
| Distributions (from capital gains)* | | | (0.21) | | | | (0.15) | | | | (0.34) | | | | (0.06) | | | | – | | | |
| Total Distributions | | | (0.42) | | | | (0.42) | | | | (0.64) | | | | (0.29) | | | | (0.12) | | | |
| Net Asset Value, End of Period | | | $10.50 | | | | $10.85 | | | | $10.54 | | | | $10.70 | | | | $10.41 | | | |
| Total Return** | | | 0.65% | | | | 7.14% | | | | 4.62% | | | | 5.63% | | | | 5.61% | | | |
| Net Assets, End of Period (in thousands) | | | $432,713 | | | | $425,830 | | | | $268,575 | | | | $236,850 | | | | $161,218 | | | |
| Average Net Assets for the Period (in thousands) | | | $470,325 | | | | $336,150 | | | | $264,522 | | | | $195,825 | | | | $137,244 | | | |
| Ratio of Gross Expenses (Absent the Waiver of Certain Fees and Expense Offsets) to Average Net Assets*** | | | 1.55% | | | | 1.55% | | | | 1.51% | | | | 1.51% | | | | 1.58% | | | |
| Ratio of Net Expenses (After Waivers and Expense Offsets) to Average Net Assets*** | | | 1.55% | | | | 1.55% | | | | 1.51% | | | | 1.51% | | | | 1.57% | | | |
| Ratio of Net Investment Income to Average Net Assets*** | | | 1.30% | | | | 2.29% | | | | 2.75% | | | | 3.29% | | | | 3.51% | | | |
| Portfolio Turnover Rate | | | 118% | | | | 126% | | | | 147% | | | | 86%^ | | | | 215% | | | |
Class C Shares
| | | | | | | | | | | | | | | |
| | | Janus Global Bond Fund | | |
| For a share outstanding during each year or period ended June 30 | | 2013 | | 2012 | | 2011(3) | | |
| |
| Net Asset Value, Beginning of Period | | | $10.49 | | | | $10.36 | | | | $10.00 | | | |
| Income from Investment Operations: | | | | | | | | | | | | | | |
| Net investment income | | | 0.19 | | | | 0.18 | | | | 0.16 | | | |
| Net gain/(loss) on investments (both realized and unrealized) | | | (0.35) | | | | 0.24 | | | | 0.31 | | | |
| Total from Investment Operations | | | (0.16) | | | | 0.42 | | | | 0.47 | | | |
| Less Distributions and Other: | | | | | | | | | | | | | | |
| Dividends (from net investment income)* | | | (0.08) | | | | (0.21) | | | | (0.11) | | | |
| Distributions (from capital gains)* | | | (0.25) | | | | (0.08) | | | | – | | | |
| Return of capital | | | (0.14) | | | | N/A | | | | N/A | | | |
| Total Distributions and Other | | | (0.47) | | | | (0.29) | | | | (0.11) | | | |
| Net Asset Value, End of Period | | | $9.86 | | | | $10.49 | | | | $10.36 | | | |
| Total Return** | | | (1.78)% | | | | 4.10% | | | | 4.70% | | | |
| Net Assets, End of Period (in thousands) | | | $1,654 | | | | $1,884 | | | | $1,293 | | | |
| Average Net Assets for the Period (in thousands) | | | $2,016 | | | | $1,634 | | | | $908 | | | |
| Ratio of Gross Expenses (Absent the Waiver of Certain Fees and Expense Offsets) to Average Net Assets*** | | | 2.05% | | | | 2.21% | | | | 4.22% | | | |
| Ratio of Net Expenses (After Waivers and Expense Offsets) to Average Net Assets*** | | | 1.76% | | | | 1.76% | | | | 1.36%(4) | | | |
| Ratio of Net Investment Income to Average Net Assets*** | | | 1.58% | | | | 1.77% | | | | 2.45% | | | |
| Portfolio Turnover Rate | | | 182% | | | | 222% | | | | 173% | | | |
| | | |
| * | | See Note 5 in Notes to Financial Statements. |
| ** | | Total return not annualized for periods of less than one full year. |
| *** | | Annualized for periods of less than one full year. |
| ^ | | Rate has been adjusted to conform with current year presentation. |
| (1) | | Period from November 1, 2009 through June 30, 2010. The Fund changed its fiscal year end from October 31 to June 30. |
| (2) | | Period from July 6, 2009 (inception date) through October 31, 2009. |
| (3) | | Period from December 28, 2010 (inception date) through June 30, 2011. |
| (4) | | Pursuant to a contractual agreement, Janus waived certain fees and expenses during the period. The Ratio of Net Expenses (After Waivers and Expense Offsets) to Average Net Assets would be 1.77% without the waiver of these fees and expenses. |
See Notes to Financial Statements.
76 | JUNE 30, 2013
Class C Shares
| | | | | | | | | | | | | | | | | | | | | | | |
For a share outstanding during each year or period ended June 30 and the
| | Janus High-Yield Fund |
| period ended October 31, 2009 | | 2013 | | 2012 | | 2011 | | 2010(1) | | 2009(2) | | |
| |
| Net Asset Value, Beginning of Period | | | $9.00 | | | | $9.13 | | | | $8.45 | | | | $8.29 | | | | $7.61 | | | |
| Income from Investment Operations: | | | | | | | | | | | | | | | | | | | | | | |
| Net investment income | | | 0.50 | | | | 0.55 | | | | 0.59 | | | | 0.43 | | | | 0.27 | | | |
| Net gain/(loss) on investments (both realized and unrealized) | | | 0.15 | | | | (0.12) | | | | 0.68 | | | | 0.16 | | | | 0.68 | | | |
| Total from Investment Operations | | | 0.65 | | | | 0.43 | | | | 1.27 | | | | 0.59 | | | | 0.95 | | | |
| Less Distributions: | | | | | | | | | | | | | | | | | | | | | | |
| Dividends (from net investment income)* | | | (0.50) | | | | (0.56) | | | | (0.59) | | | | (0.43) | | | | (0.27) | | | |
| Distributions (from capital gains)* | | | (0.01) | | | | – | | | | – | | | | – | | | | – | | | |
| Total Distributions | | | (0.51) | | | | (0.56) | | | | (0.59) | | | | (0.43) | | | | (0.27) | | | |
| Net Asset Value, End of Period | | | $9.14 | | | | $9.00 | | | | $9.13 | | | | $8.45 | | | | $8.29 | | | |
| Total Return** | | | 7.31% | | | | 4.93% | | | | 15.30%(3) | | | | 7.14% | | | | 12.36% | | | |
| Net Assets, End of Period (in thousands) | | | $79,726 | | | | $78,392 | | | | $78,456 | | | | $68,485 | | | | $61,744 | | | |
| Average Net Assets for the Period (in thousands) | | | $84,174 | | | | $73,801 | | | | $76,507 | | | | $67,693 | | | | $51,080 | | | |
| Ratio of Gross Expenses (Absent the Waiver of Certain Fees and Expense Offsets) to Average Net Assets*** | | | 1.72% | | | | 1.72% | | | | 1.61% | | | | 1.65% | | | | 1.71% | | | |
| Ratio of Net Expenses (After Waivers and Expense Offsets) to Average Net Assets*** | | | 1.72% | | | | 1.72% | | | | 1.61% | | | | 1.65% | | | | 1.71% | | | |
| Ratio of Net Investment Income to Average Net Assets*** | | | 5.36% | | | | 6.19% | | | | 6.57% | | | | 7.59% | | | | 9.27% | | | |
| Portfolio Turnover Rate | | | 93% | | | | 61% | | | | 92% | | | | 61%^ | | | | 97% | | | |
Class C Shares
| | | | | | | | | | | | | | | | | | | | | | | |
For a share outstanding during each year or period ended June 30 and the
| | Janus Short-Term Bond Fund |
| period ended October 31, 2009 | | 2013 | | 2012 | | 2011 | | 2010(1) | | 2009(2) | | |
| |
| Net Asset Value, Beginning of Period | | | $3.08 | | | | $3.08 | | | | $3.08 | | | | $3.06 | | | | $3.01 | | | |
| Income from Investment Operations: | | | | | | | | | | | | | | | | | | | | | | |
| Net investment income | | | 0.02 | | | | 0.04 | | | | 0.04 | | | | 0.03 | | | | 0.05 | | | |
| Net gain/(loss) on investments (both realized and unrealized) | | | (0.01) | | | | 0.01 | | | | 0.02 | | | | 0.02 | | | | 0.05 | | | |
| Total from Investment Operations | | | 0.01 | | | | 0.05 | | | | 0.06 | | | | 0.05 | | | | 0.10 | | | |
| Less Distributions: | | | | | | | | | | | | | | | | | | | | | | |
| Dividends (from net investment income)* | | | (0.02) | | | | (0.04) | | | | (0.04) | | | | (0.03) | | | | (0.05) | | | |
| Distributions (from capital gains)* | | | (0.02) | | | | (0.01) | | | | (0.02) | | | | – | | | | – | | | |
| Total Distributions | | | (0.04) | | | | (0.05) | | | | (0.06) | | | | (0.03) | | | | (0.05) | | | |
| Net Asset Value, End of Period | | | $3.05 | | | | $3.08 | | | | $3.08 | | | | $3.08 | | | | $3.06 | | | |
| Total Return** | | | 0.46% | | | | 1.44% | | | | 2.24% | | | | 1.82% | | | | 3.31% | | | |
| Net Assets, End of Period (in thousands) | | | $78,276 | | | | $75,789 | | | | $70,507 | | | | $63,030 | | | | $23,567 | | | |
| Average Net Assets for the Period (in thousands) | | | $78,430 | | | | $74,993 | | | | $69,983 | | | | $42,824 | | | | $8,848 | | | |
| Ratio of Gross Expenses (Absent the Waiver of Certain Fees and Expense Offsets) to Average Net Assets*** | | | 1.69% | | | | 1.66% | | | | 1.64% | | | | 1.59% | | | | 1.63% | | | |
| Ratio of Net Expenses (After Waivers and Expense Offsets) to Average Net Assets*** | | | 1.55% | | | | 1.53% | | | | 1.53% | | | | 1.55% | | | | 1.56% | | | |
| Ratio of Net Investment Income to Average Net Assets*** | | | 0.74% | | | | 1.23% | | | | 1.40% | | | | 1.64% | | | | 2.01% | | | |
| Portfolio Turnover Rate | | | 100% | | | | 93% | | | | 100% | | | | 33%^ | | | | 57% | | | |
| | | |
| * | | See Note 5 in Notes to Financial Statements. |
| ** | | Total return not annualized for periods of less than one full year. |
| *** | | Annualized for periods of less than one full year. |
| ^ | | Rate has been adjusted to conform with current year presentation. |
| (1) | | Period from November 1, 2009 through June 30, 2010. The Fund changed its fiscal year end from October 31 to June 30. |
| (2) | | Period from July 6, 2009 (inception date) through October 31, 2009. |
| (3) | | Impact on performance due to reimbursement from advisor was 0.51%. |
See Notes to Financial Statements.
Janus Fixed Income & Money Market Funds | 77
Financial Highlights - Fixed Income Funds (continued)
Class D Shares
| | | | | | | | | | | | | | | | | | | |
| | | Janus Flexible Bond Fund | | |
| For a share outstanding during each year or period ended June 30 | | 2013 | | 2012 | | 2011 | | 2010(1) | | |
| |
| Net Asset Value, Beginning of Period | | | $10.85 | | | | $10.54 | | | | $10.70 | | | | $10.43 | | | |
| Income from Investment Operations: | | | | | | | | | | | | | | | | | | |
| Net investment income | | | 0.32 | | | | 0.37 | | | | 0.39 | | | | 0.16 | | | |
| Net gain/(loss) on investments (both realized and unrealized) | | | (0.14) | | | | 0.46 | | | | 0.18 | | | | 0.27 | | | |
| Total from Investment Operations | | | 0.18 | | | | 0.83 | | | | 0.57 | | | | 0.43 | | | |
| Less Distributions: | | | | | | | | | | | | | | | | | | |
| Dividends (from net investment income)* | | | (0.32) | | | | (0.37) | | | | (0.39) | | | | (0.16) | | | |
| Distributions (from capital gains)* | | | (0.21) | | | | (0.15) | | | | (0.34) | | | | – | | | |
| Total Distributions | | | (0.53) | | | | (0.52) | | | | (0.73) | | | | (0.16) | | | |
| Net Asset Value, End of Period | | | $10.50 | | | | $10.85 | | | | $10.54 | | | | $10.70 | | | |
| Total Return** | | | 1.61% | | | | 8.17% | | | | 5.59% | | | | 4.13% | | | |
| Net Assets, End of Period (in thousands) | | | $750,690 | | | | $802,674 | | | | $686,500 | | | | $665,736 | | | |
| Average Net Assets for the Period (in thousands) | | | $825,062 | | | | $747,701 | | | | $691,039 | | | | $632,441 | | | |
| Ratio of Gross Expenses (Absent the Waiver of Certain Fees and Expense Offsets) to Average Net Assets*** | | | 0.60% | | | | 0.59% | | | | 0.59% | | | | 0.60% | | | |
| Ratio of Net Expenses (After Waivers and Expense Offsets) to Average Net Assets*** | | | 0.60% | | | | 0.59% | | | | 0.59% | | | | 0.60% | | | |
| Ratio of Net Investment Income to Average Net Assets*** | | | 2.25% | | | | 3.28% | | | | 3.68% | | | | 4.09% | | | |
| Portfolio Turnover Rate | | | 118% | | | | 126% | | | | 147% | | | | 86%^ | | | |
Class D Shares
| | | | | | | | | | | | | | | |
| | | Janus Global Bond Fund | | |
| For a share outstanding during each year or period ended June 30 | | 2013 | | 2012 | | 2011(2) | | |
| |
| Net Asset Value, Beginning of Period | | | $10.47 | | | | $10.35 | | | | $10.00 | | | |
| Income from Investment Operations: | | | | | | | | | | | | | | |
| Net investment income | | | 0.28 | | | | 0.26 | | | | 0.18 | | | |
| Net gain/(loss) on investments (both realized and unrealized) | | | (0.34) | | | | 0.24 | | | | 0.32 | | | |
| Total from Investment Operations | | | (0.06) | | | | 0.50 | | | | 0.50 | | | |
| Less Distributions and Other: | | | | | | | | | | | | | | |
| Dividends (from net investment income)* | | | (0.12) | | | | (0.30) | | | | (0.15) | | | |
| Distributions (from capital gains)* | | | (0.25) | | | | (0.08) | | | | – | | | |
| Return of capital | | | (0.19) | | | | N/A | | | | N/A | | | |
| Total Distributions and Other | | | (0.56) | | | | (0.38) | | | | (0.15) | | | |
| Net Asset Value, End of Period | | | $9.85 | | | | $10.47 | | | | $10.35 | | | |
| Total Return** | | | (0.84)% | | | | 4.90% | | | | 5.06% | | | |
| Net Assets, End of Period (in thousands) | | | $9,875 | | | | $10,240 | | | | $4,876 | | | |
| Average Net Assets for the Period (in thousands) | | | $11,610 | | | | $10,566 | | | | $2,296 | | | |
| Ratio of Gross Expenses (Absent the Waiver of Certain Fees and Expense Offsets) to Average Net Assets*** | | | 1.16% | | | | 1.31% | | | | 2.92% | | | |
| Ratio of Net Expenses (After Waivers and Expense Offsets) to Average Net Assets*** | | | 0.90% | | | | 0.91% | | | | 0.72% | | | |
| Ratio of Net Investment Income to Average Net Assets*** | | | 2.43% | | | | 2.64% | | | | 3.08% | | | |
| Portfolio Turnover Rate | | | 182% | | | | 222% | | | | 173% | | | |
| | | |
| * | | See Note 5 in Notes to Financial Statements. |
| ** | | Total return not annualized for periods of less than one full year. |
| *** | | Annualized for periods of less than one full year. |
| ^ | | Rate has been adjusted to conform with current year presentation. |
| (1) | | Period from February 16, 2010 (inception date) through June 30, 2010. |
| (2) | | Period from December 28, 2010 (inception date) through June 30, 2011. |
See Notes to Financial Statements.
78 | JUNE 30, 2013
Class D Shares
| | | | | | | | | | | | | | | | | | | |
| | | Janus High-Yield Fund | | |
| For a share outstanding during each year or period ended June 30 | | 2013 | | 2012 | | 2011 | | 2010(1) | | |
| |
| Net Asset Value, Beginning of Period | | | $9.00 | | | | $9.13 | | | | $8.45 | | | | $8.27 | | | |
| Income from Investment Operations: | | | | | | | | | | | | | | | | | | |
| Net investment income | | | 0.59 | | | | 0.64 | | | | 0.67 | | | | 0.26 | | | |
| Net gain/(loss) on investments (both realized and unrealized) | | | 0.15 | | | | (0.13) | | | | 0.68 | | | | 0.18 | | | |
| Total from Investment Operations | | | 0.74 | | | | 0.51 | | | | 1.35 | | | | 0.44 | | | |
| Less Distributions and Other: | | | | | | | | | | | | | | | | | | |
| Dividends (from net investment income)* | | | (0.59) | | | | (0.64) | | | | (0.67) | | | | (0.26) | | | |
| Distributions (from capital gains)* | | | (0.01) | | | | – | | | | – | | | | – | | | |
| Redemption fees | | | N/A | | | | –(2) | | | | –(2) | | | | –(2) | | | |
| Total Distributions and Other | | | (0.60) | | | | (0.64) | | | | (0.67) | | | | (0.26) | | | |
| Net Asset Value, End of Period | | | $9.14 | | | | $9.00 | | | | $9.13 | | | | $8.45 | | | |
| Total Return** | | | 8.33% | | | | 5.94% | | | | 16.28%(3) | | | | 5.31% | | | |
| Net Assets, End of Period (in thousands) | | | $360,924 | | | | $328,700 | | | | $317,038 | | | | $247,945 | | | |
| Average Net Assets for the Period (in thousands) | | | $361,587 | | | | $310,872 | | | | $292,765 | | | | $245,710 | | | |
| Ratio of Gross Expenses (Absent the Waiver of Certain Fees and Expense Offsets) to Average Net Assets*** | | | 0.77% | | | | 0.76% | | | | 0.76% | | | | 0.77% | | | |
| Ratio of Net Expenses (After Waivers and Expense Offsets) to Average Net Assets*** | | | 0.77% | | | | 0.76% | | | | 0.76% | | | | 0.77% | | | |
| Ratio of Net Investment Income to Average Net Assets*** | | | 6.30% | | | | 7.15% | | | | 7.41% | | | | 8.27% | | | |
| Portfolio Turnover Rate | | | 93% | | | | 61% | | | | 92% | | | | 61%^ | | | |
Class D Shares
| | | | | | | | | | | | | | | | | | | |
| | | Janus Short-Term Bond Fund | | |
| For a share outstanding during each year or period ended June 30 | | 2013 | | 2012 | | 2011 | | 2010(1) | | |
| |
| Net Asset Value, Beginning of Period | | | $3.09 | | | | $3.09 | | | | $3.09 | | | | $3.08 | | | |
| Income from Investment Operations: | | | | | | | | | | | | | | | | | | |
| Net investment income | | | 0.05 | | | | 0.06 | | | | 0.07 | | | | 0.03 | | | |
| Net gain/(loss) on investments (both realized and unrealized) | | | (0.02) | | | | 0.01 | | | | 0.02 | | | | 0.01 | | | |
| Total from Investment Operations | | | 0.03 | | | | 0.07 | | | | 0.09 | | | | 0.04 | | | |
| Less Distributions: | | | | | | | | | | | | | | | | | | |
| Dividends (from net investment income)* | | | (0.05) | | | | (0.06) | | | | (0.07) | | | | (0.03) | | | |
| Distributions (from capital gains)* | | | (0.02) | | | | (0.01) | | | | (0.02) | | | | – | | | |
| Total Distributions | | | (0.07) | | | | (0.07) | | | | (0.09) | | | | (0.03) | | | |
| Net Asset Value, End of Period | | | $3.05 | | | | $3.09 | | | | $3.09 | | | | $3.09 | | | |
| Total Return** | | | 1.01% | | | | 2.30% | | | | 3.12% | | | | 1.21% | | | |
| Net Assets, End of Period (in thousands) | | | $208,522 | | | | $207,395 | | | | $210,532 | | | | $227,147 | | | |
| Average Net Assets for the Period (in thousands) | | | $210,423 | | | | $207,647 | | | | $221,970 | | | | $221,604 | | | |
| Ratio of Gross Expenses (Absent the Waiver of Certain Fees and Expense Offsets) to Average Net Assets*** | | | 0.77% | | | | 0.74% | | | | 0.72% | | | | 0.74% | | | |
| Ratio of Net Expenses (After Waivers and Expense Offsets) to Average Net Assets*** | | | 0.69% | | | | 0.69% | | | | 0.67% | | | | 0.67% | | | |
| Ratio of Net Investment Income to Average Net Assets*** | | | 1.60% | | | | 2.07% | | | | 2.25% | | | | 2.42% | | | |
| Portfolio Turnover Rate | | | 100% | | | | 93% | | | | 100% | | | | 33%^ | | | |
| | | |
| * | | See Note 5 in Notes to Financial Statements. |
| ** | | Total return not annualized for periods of less than one full year. |
| *** | | Annualized for periods of less than one full year. |
| ^ | | Rate has been adjusted to conform with current year presentation. |
| (1) | | Period from February 16, 2010 (inception date) through June 30, 2010. |
| (2) | | Redemption fees aggregated less than $0.01 on a per share basis. Redemption fees were eliminated effective April 2, 2012. |
| (3) | | Impact on performance due to reimbursement from advisor was 0.51%. |
See Notes to Financial Statements.
Janus Fixed Income & Money Market Funds | 79
Financial Highlights - Fixed Income Funds (continued)
Class I Shares
| | | | | | | | | | | | | | | | | | | | | | | |
For a share outstanding during each year or period ended June 30
| | Janus Flexible Bond Fund |
| and the period ended October 31, 2009 | | 2013 | | 2012 | | 2011 | | 2010(1) | | 2009(2) | | |
| |
| Net Asset Value, Beginning of Period | | | $10.85 | | | | $10.54 | | | | $10.70 | | | | $10.41 | | | | $9.97 | | | |
| Income from Investment Operations: | | | | | | | | | | | | | | | | | | | | | | |
| Net investment income | | | 0.32 | | | | 0.38 | | | | 0.40 | | | | 0.30 | | | | 0.15 | | | |
| Net gain/(loss) on investments (both realized and unrealized) | | | (0.14) | | | | 0.46 | | | | 0.18 | | | | 0.35 | | | | 0.44 | | | |
| Total from Investment Operations | | | 0.18 | | | | 0.84 | | | | 0.58 | | | | 0.65 | | | | 0.59 | | | |
| Less Distributions: | | | | | | | | | | | | | | | | | | | | | | |
| Dividends (from net investment income)* | | | (0.32) | | | | (0.38) | | | | (0.40) | | | | (0.30) | | | | (0.15) | | | |
| Distributions (from capital gains)* | | | (0.21) | | | | (0.15) | | | | (0.34) | | | | (0.06) | | | | – | | | |
| Total Distributions | | | (0.53) | | | | (0.53) | | | | (0.74) | | | | (0.36) | | | | (0.15) | | | |
| Net Asset Value, End of Period | | | $10.50 | | | | $10.85 | | | | $10.54 | | | | $10.70 | | | | $10.41 | | | |
| Total Return** | | | 1.66% | | | | 8.21% | | | | 5.62% | | | | 6.32% | | | | 5.96% | | | |
| Net Assets, End of Period (in thousands) | | | $2,918,160 | | | | $1,691,809 | | | | $1,230,115 | | | | $767,784 | | | | $453,037 | | | |
| Average Net Assets for the Period (in thousands) | | | $2,181,783 | | | | $1,567,379 | | | | $1,067,665 | | | | $609,814 | | | | $202,602 | | | |
| Ratio of Gross Expenses (Absent the Waiver of Certain Fees and Expense Offsets) to Average Net Assets*** | | | 0.56% | | | | 0.55% | | | | 0.58% | | | | 0.59% | | | | 0.48% | | | |
| Ratio of Net Expenses (After Waivers and Expense Offsets) to Average Net Assets*** | | | 0.55% | | | | 0.55% | | | | 0.56% | | | | 0.55% | | | | 0.48% | | | |
| Ratio of Net Investment Income to Average Net Assets*** | | | 2.28% | | | | 3.29% | | | | 3.72% | | | | 4.24% | | | | 4.55% | | | |
| Portfolio Turnover Rate | | | 118% | | | | 126% | | | | 147% | | | | 86%^ | | | | 215% | | | |
Class I Shares
| | | | | | | | | | | | | | | |
| | | Janus Global Bond Fund | | |
For a share outstanding during each year or period ended June 30
| | 2013 | | 2012 | | 2011(3) | | |
| |
| Net Asset Value, Beginning of Period | | | $10.47 | | | | $10.34 | | | | $10.00 | | | |
| Income from Investment Operations: | | | | | | | | | | | | | | |
| Net investment income | | | 0.31 | | | | 0.29 | | | | 0.19 | | | |
| Net gain/(loss) on investments (both realized and unrealized) | | | (0.37) | | | | 0.24 | | | | 0.31 | | | |
| Total from Investment Operations | | | (0.06) | | | | 0.53 | | | | 0.50 | | | |
| Less Distributions and Other: | | | | | | | | | | | | | | |
| Dividends (from net investment income)* | | | (0.12) | | | | (0.32) | | | | (0.16) | | | |
| Distributions (from capital gains)* | | | (0.25) | | | | (0.08) | | | | – | | | |
| Return of capital | | | (0.20) | | | | N/A | | | | N/A | | | |
| Total Distributions and Other | | | (0.57) | | | | (0.40) | | | | (0.16) | | | |
| Net Asset Value, End of Period | | | $9.84 | | | | $10.47 | | | | $10.34 | | | |
| Total Return** | | | (0.79)% | | | | 5.15% | | | | 5.02% | | | |
| Net Assets, End of Period (in thousands) | | | $234,166 | | | | $14,810 | | | | $10,464 | | | |
| Average Net Assets for the Period (in thousands) | | | $74,492 | | | | $12,500 | | | | $7,863 | | | |
| Ratio of Gross Expenses (Absent the Waiver of Certain Fees and Expense Offsets) to Average Net Assets*** | | | 0.75% | | | | 1.13% | | | | 3.13% | | | |
| Ratio of Net Expenses (After Waivers and Expense Offsets) to Average Net Assets*** | | | 0.75% | | | | 0.76% | | | | 0.77% | | | |
| Ratio of Net Investment Income to Average Net Assets*** | | | 2.27% | | | | 2.77% | | | | 3.06% | | | |
| Portfolio Turnover Rate | | | 182% | | | | 222% | | | | 173% | | | |
| | | |
| * | | See Note 5 in Notes to Financial Statements. |
| ** | | Total return not annualized for periods of less than one full year. |
| *** | | Annualized for periods of less than one full year. |
| ^ | | Rate has been adjusted to conform with current year presentation. |
| (1) | | Period from November 1, 2009 through June 30, 2010. The Fund changed its fiscal year end from October 31 to June 30. |
| (2) | | Period from July 6, 2009 (inception date) through October 31, 2009. |
| (3) | | Period from December 28, 2010 (inception date) through June 30, 2011. |
See Notes to Financial Statements.
80 | JUNE 30, 2013
Class I Shares
| | | | | | | | | | | | | | | | | | | | | | | |
For a share outstanding during each year or period ended June 30 and
| | Janus High-Yield Fund |
| the period ended October 31, 2009 | | 2013 | | 2012 | | 2011 | | 2010(1) | | 2009(2) | | |
| |
| Net Asset Value, Beginning of Period | | | $9.01 | | | | $9.13 | | | | $8.45 | | | | $8.28 | | | | $7.61 | | | |
| Income from Investment Operations: | | | | | | | | | | | | | | | | | | | | | | |
| Net investment income | | | 0.60 | | | | 0.64 | | | | 0.67 | | | | 0.48 | | | | 0.28 | | | |
| Net gain/(loss) on investments (both realized and unrealized) | | | 0.15 | | | | (0.11) | | | | 0.68 | | | | 0.17 | | | | 0.67 | | | |
| Total from Investment Operations | | | 0.75 | | | | 0.53 | | | | 1.35 | | | | 0.65 | | | | 0.95 | | | |
| Less Distributions and Other: | | | | | | | | | | | | | | | | | | | | | | |
| Dividends (from net investment income)* | | | (0.60) | | | | (0.65) | | | | (0.67) | | | | (0.48) | | | | (0.28) | | | |
| Distributions (from capital gains)* | | | (0.01) | | | | – | | | | – | | | | – | | | | – | | | |
| Redemption fees | | | N/A | | | | –(3) | | | | –(3) | | | | –(3) | | | | – | | | |
| Total Distributions and Other | | | (0.61) | | | | (0.65) | | | | (0.67) | | | | (0.48) | | | | (0.28) | | | |
| Net Asset Value, End of Period | | | $9.15 | | | | $9.01 | | | | $9.13 | | | | $8.45 | | | | $8.28 | | | |
| Total Return** | | | 8.43% | | | | 6.13% | | | | 16.35%(4) | | | | 7.98% | | | | 12.60% | | | |
| Net Assets, End of Period (in thousands) | | | $236,426 | | | | $241,339 | | | | $174,961 | | | | $73,042 | | | | $22,052 | | | |
| Average Net Assets for the Period (in thousands) | | | $285,515 | | | | $226,809 | | | | $178,564 | | | | $43,060 | | | | $14,845 | | | |
| Ratio of Gross Expenses (Absent the Waiver of Certain Fees and Expense Offsets) to Average Net Assets*** | | | 0.68% | | | | 0.68% | | | | 0.70% | | | | 0.64% | | | | 0.66% | | | |
| Ratio of Net Expenses (After Waivers and Expense Offsets) to Average Net Assets*** | | | 0.68% | | | | 0.68% | | | | 0.70% | | | | 0.64% | | | | 0.66% | | | |
| Ratio of Net Investment Income to Average Net Assets*** | | | 6.38% | | | | 7.23% | | | | 7.43% | | | | 8.50% | | | | 10.33% | | | |
| Portfolio Turnover Rate | | | 93% | | | | 61% | | | | 92% | | | | 61%^ | | | | 97% | | | |
Class I Shares
| | | | | | | | | | | | | | | | | | | | | | | |
For a share outstanding during each year or period ended June 30 and
| | Janus Short-Term Bond Fund |
| the period ended October 31, 2009 | | 2013 | | 2012 | | 2011 | | 2010(1) | | 2009(2) | | |
| |
| Net Asset Value, Beginning of Period | | | $3.08 | | | | $3.08 | | | | $3.09 | | | | $3.06 | | | | $3.01 | | | |
| Income from Investment Operations: | | | | | | | | | | | | | | | | | | | | | | |
| Net investment income | | | 0.05 | | | | 0.07 | | | | 0.07 | | | | 0.06 | | | | 0.03 | | | |
| Net gain/(loss) on investments (both realized and unrealized) | | | (0.01) | | | | 0.01 | | | | 0.01 | | | | 0.02 | | | | 0.05 | | | |
| Total from Investment Operations | | | 0.04 | | | | 0.08 | | | | 0.08 | | | | 0.08 | | | | 0.08 | | | |
| Less Distributions: | | | | | | | | | | | | | | | | | | | | | | |
| Dividends (from net investment income)* | | | (0.05) | | | | (0.07) | | | | (0.07) | | | | (0.05) | | | | (0.03) | | | |
| Distributions (from capital gains)* | | | (0.02) | | | | (0.01) | | | | (0.02) | | | | – | | | | – | | | |
| Total Distributions | | | (0.07) | | | | (0.08) | | | | (0.09) | | | | (0.05) | | | | (0.03) | | | |
| Net Asset Value, End of Period | | | $3.05 | | | | $3.08 | | | | $3.08 | | | | $3.09 | | | | $3.06 | | | |
| Total Return** | | | 1.48% | | | | 2.43% | | | | 2.91% | | | | 2.82% | | | | 2.75% | | | |
| Net Assets, End of Period (in thousands) | | | $315,482 | | | | $275,345 | | | | $543,799 | | | | $171,201 | | | | $69,785 | | | |
| Average Net Assets for the Period (in thousands) | | | $307,611 | | | | $387,327 | | | | $350,062 | | | | $115,010 | | | | $8,399 | | | |
| Ratio of Gross Expenses (Absent the Waiver of Certain Fees and Expense Offsets) to Average Net Assets*** | | | 0.66% | | | | 0.64% | | | | 0.63% | | | | 0.59% | | | | 0.79% | | | |
| Ratio of Net Expenses (After Waivers and Expense Offsets) to Average Net Assets*** | | | 0.55% | | | | 0.55% | | | | 0.56% | | | | 0.55% | | | | 0.57% | | | |
| Ratio of Net Investment Income to Average Net Assets*** | | | 1.73% | | | | 2.22% | | | | 2.39% | | | | 2.64% | | | | 2.85% | | | |
| Portfolio Turnover Rate | | | 100% | | | | 93% | | | | 100% | | | | 33%^ | | | | 57% | | | |
| | | |
| * | | See Note 5 in Notes to Financial Statements. |
| ** | | Total return not annualized for periods of less than one full year. |
| *** | | Annualized for periods of less than one full year. |
| ^ | | Rate has been adjusted to conform with current year presentation. |
| (1) | | Period from November 1, 2009 through June 30, 2010. The Fund changed its fiscal year end from October 31 to June 30. |
| (2) | | Period from July 6, 2009 (inception date) through October 31, 2009. |
| (3) | | Redemption fees aggregated less than $0.01 on a per share basis. Redemption fees were eliminated effective April 2, 2012. |
| (4) | | Impact on performance due to reimbursement from advisor was 0.51%. |
See Notes to Financial Statements.
Janus Fixed Income & Money Market Funds | 81
Financial Highlights - Fixed Income Funds (continued)
Class N Shares
| | | | | | | | | | | | | | | | | | | |
| | | Janus Flexible Bond Fund | | Janus High-Yield Fund | | |
| For a share outstanding during each year or period ended June 30 | | 2013 | | 2012(1) | | 2013 | | 2012(1) | | |
| |
| Net Asset Value, Beginning of Period | | | $10.85 | | | | $10.82 | | | | $9.01 | | | | $8.92 | | | |
| Income from Investment Operations: | | | | | | | | | | | | | | | | | | |
| Net investment income | | | 0.39 | | | | 0.05 | | | | 0.60 | | | | 0.06 | | | |
| Net gain/(loss) on investments (both realized and unrealized) | | | (0.19) | | | | 0.01 | | | | 0.14 | | | | 0.08 | | | |
| Total from Investment Operations | | | 0.20 | | | | 0.06 | | | | 0.74 | | | | 0.14 | | | |
| Less Distributions: | | | | | | | | | | | | | | | | | | |
| Dividends (from net investment income)* | | | (0.34) | | | | (0.03) | | | | (0.60) | | | | (0.05) | | | |
| Distributions (from capital gains)* | | | (0.21) | | | | – | | | | (0.01) | | | | – | | | |
| Total Distributions | | | (0.55) | | | | (0.03) | | | | (0.61) | | | | (0.05) | | | |
| Net Asset Value, End of Period | | | $10.50 | | | | $10.85 | | | | $9.14 | | | | $9.01 | | | |
| Total Return** | | | 1.77% | | | | 0.57% | | | | 8.38% | | | | 1.63% | | | |
| Net Assets, End of Period (in thousands) | | | $64,760 | | | | $253,638 | | | | $6,738 | | | | $4,392 | | | |
| Average Net Assets for the Period (in thousands) | | | $210,599 | | | | $196,727 | | | | $8,788 | | | | $3,390 | | | |
| Ratio of Gross Expenses (Absent the Waiver of Certain Fees and Expense Offsets) to Average Net Assets*** | | | 0.44% | | | | 0.46% | | | | 0.61% | | | | 0.61% | | | |
| Ratio of Net Expenses (After Waivers and Expense Offsets) to Average Net Assets*** | | | 0.44% | | | | 0.46% | | | | 0.61% | | | | 0.61% | | | |
| Ratio of Net Investment Income to Average Net Assets*** | | | 2.45% | | | | 2.78% | | | | 6.47% | | | | 6.86% | | | |
| Portfolio Turnover Rate | | | 118% | | | | 126% | | | | 93% | | | | 61% | | | |
Class N Shares
| | | | | | | | | | | |
| | | Janus Short-Term Bond Fund | | |
| For a share outstanding during each year or period ended June 30 | | 2013 | | 2012(1) | | |
| |
| Net Asset Value, Beginning of Period | | | $3.08 | | | | $3.08 | | | |
| Income from Investment Operations: | | | | | | | | | | |
| Net investment income | | | 0.05 | | | | – | | | |
| Net gain/(loss) on investments (both realized and unrealized) | | | (0.01) | | | | – | | | |
| Total from Investment Operations | | | 0.04 | | | | – | | | |
| Less Distributions: | | | | | | | | | | |
| Dividends (from net investment income)* | | | (0.05) | | | | – | | | |
| Distributions (from capital gains)* | | | (0.02) | | | | – | | | |
| Total Distributions | | | (0.07) | | | | – | | | |
| Net Asset Value, End of Period | | | $3.05 | | | | $3.08 | | | |
| Total Return** | | | 1.48% | | | | 0.17% | | | |
| Net Assets, End of Period (in thousands) | | | $37,619 | | | | $34,342 | | | |
| Average Net Assets for the Period (in thousands) | | | $37,659 | | | | $26,909 | | | |
| Ratio of Gross Expenses (Absent the Waiver of Certain Fees and Expense Offsets) to Average Net Assets*** | | | 0.60% | | | | 0.61% | | | |
| Ratio of Net Expenses (After Waivers and Expense Offsets) to Average Net Assets*** | | | 0.55% | | | | 0.56% | | | |
| Ratio of Net Investment Income to Average Net Assets*** | | | 1.74% | | | | 1.80% | | | |
| Portfolio Turnover Rate | | | 100% | | | | 93% | | | |
| | | |
| * | | See Note 5 in Notes to Financial Statements. |
| ** | | Total return not annualized for periods of less than one full year. |
| *** | | Annualized for periods of less than one full year. |
| (1) | | Period from May 31, 2012 (inception date) through June 30, 2012. |
See Notes to Financial Statements.
82 | JUNE 30, 2013
Class R Shares
| | | | | | | | | | | | | | | | | | | | | | | |
For a share outstanding during each year or period ended June 30 and the
| | Janus Flexible Bond Fund |
| period ended October 31, 2009 | | 2013 | | 2012 | | 2011 | | 2010(1) | | 2009(2) | | |
| |
| Net Asset Value, Beginning of Period | | | $10.85 | | | | $10.54 | | | | $10.70 | | | | $10.42 | | | | $9.97 | | | |
| Income from Investment Operations: | | | | | | | | | | | | | | | | | | | | | | |
| Net investment income | | | 0.26 | | | | 0.31 | | | | 0.33 | | | | 0.25 | | | | 0.13 | | | |
| Net gain/(loss) on investments (both realized and unrealized) | | | (0.14) | | | | 0.46 | | | | 0.18 | | | | 0.34 | | | | 0.45 | | | |
| Total from Investment Operations | | | 0.12 | | | | 0.77 | | | | 0.51 | | | | 0.59 | | | | 0.58 | | | |
| Less Distributions: | | | | | | | | | | | | | | | | | | | | | | |
| Dividends (from net investment income)* | | | (0.26) | | | | (0.31) | | | | (0.33) | | | | (0.25) | | | | (0.13) | | | |
| Distributions (from capital gains)* | | | (0.21) | | | | (0.15) | | | | (0.34) | | | | (0.06) | | | | – | | | |
| Total Distributions | | | (0.47) | | | | (0.46) | | | | (0.67) | | | | (0.31) | | | | (0.13) | | | |
| Net Asset Value, End of Period | | | $10.50 | | | | $10.85 | | | | $10.54 | | | | $10.70 | | | | $10.42 | | | |
| Total Return** | | | 1.02% | | | | 7.54% | | | | 4.94% | | | | 5.76% | | | | 5.81% | | | |
| Net Assets, End of Period (in thousands) | | | $30,080 | | | | $26,212 | | | | $9,585 | | | | $5,582 | | | | $3,120 | | | |
| Average Net Assets for the Period (in thousands) | | | $29,460 | | | | $13,660 | | | | $7,906 | | | | $4,675 | | | | $2,700 | | | |
| Ratio of Gross Expenses (Absent the Waiver of Certain Fees and Expense Offsets) to Average Net Assets*** | | | 1.17% | | | | 1.18% | | | | 1.20% | | | | 1.20% | | | | 1.25% | | | |
| Ratio of Net Expenses (After Waivers and Expense Offsets) to Average Net Assets*** | | | 1.17% | | | | 1.18% | | | | 1.20% | | | | 1.20% | | | | 1.24% | | | |
| Ratio of Net Investment Income to Average Net Assets*** | | | 1.67% | | | | 2.63% | | | | 3.06% | | | | 3.59% | | | | 3.83% | | | |
| Portfolio Turnover Rate | | | 118% | | | | 126% | | | | 147% | | | | 86%^ | | | | 215% | | | |
Class R Shares
| | | | | | | | | | | | | | | | | | | | | | | |
For a share outstanding during each year or period ended June 30 and the
| | Janus High-Yield Fund |
| period ended October 31, 2009 | | 2013 | | 2012 | | 2011 | | 2010(1) | | 2009(2) | | |
| |
| Net Asset Value, Beginning of Period | | | $9.00 | | | | $9.13 | | | | $8.45 | | | | $8.28 | | | | $7.61 | | | |
| Income from Investment Operations: | | | | | | | | | | | | | | | | | | | | | | |
| Net investment income | | | 0.53 | | | | 0.59 | | | | 0.61 | | | | 0.45 | | | | 0.26 | | | |
| Net gain/(loss) on investments (both realized and unrealized) | | | 0.15 | | | | (0.13) | | | | 0.68 | | | | 0.17 | | | | 0.67 | | | |
| Total from Investment Operations | | | 0.68 | | | | 0.46 | | | | 1.29 | | | | 0.62 | | | | 0.93 | | | |
| Less Distributions and Other: | | | | | | | | | | | | | | | | | | | | | | |
| Dividends (from net investment income)* | | | (0.53) | | | | (0.59) | | | | (0.61) | | | | (0.45) | | | | (0.26) | | | |
| Distributions (from capital gains)* | | | (0.01) | | | | – | | | | – | | | | – | | | | – | | | |
| Redemption fees | | | N/A | | | | –(3) | | | | –(3) | | | | – | | | | – | | | |
| Total Distributions and Other | | | (0.54) | | | | (0.59) | | | | (0.61) | | | | (0.45) | | | | (0.26) | | | |
| Net Asset Value, End of Period | | | $9.14 | | | | $9.00 | | | | $9.13 | | | | $8.45 | | | | $8.28 | | | |
| Total Return** | | | 7.68% | | | | 5.38% | | | | 15.62%(4) | | | | 7.46% | | | | 12.33% | | | |
| Net Assets, End of Period (in thousands) | | | $1,666 | | | | $1,082 | | | | $1,100 | | | | $876 | | | | $959 | | | |
| Average Net Assets for the Period (in thousands) | | | $1,459 | | | | $1,081 | | | | $997 | | | | $1,095 | | | | $885 | | | |
| Ratio of Gross Expenses (Absent the Waiver of Certain Fees and Expense Offsets) to Average Net Assets*** | | | 1.37% | | | | 1.29% | | | | 1.33% | | | | 1.37% | | | | 1.41% | | | |
| Ratio of Net Expenses (After Waivers and Expense Offsets) to Average Net Assets*** | | | 1.37% | | | | 1.29% | | | | 1.33% | | | | 1.37% | | | | 1.41% | | | |
| Ratio of Net Investment Income to Average Net Assets*** | | | 5.67% | | | | 6.64% | | | | 6.85% | | | | 7.88% | | | | 9.83% | | | |
| Portfolio Turnover Rate | | | 93% | | | | 61% | | | | 92% | | | | 61%^ | | | | 97% | | | |
| | | |
| * | | See Note 5 in Notes to Financial Statements. |
| ** | | Total return not annualized for periods of less than one full year. |
| *** | | Annualized for periods of less than one full year. |
| ^ | | Rate has been adjusted to conform with current year presentation. |
| (1) | | Period from November 1, 2009 through June 30, 2010. The Fund changed its fiscal year end from October 31 to June 30. |
| (2) | | Period from July 6, 2009 (inception date) through October 31, 2009. |
| (3) | | Redemption fees aggregated less than $0.01 on a per share basis. Redemption fees were eliminated effective April 2, 2012. |
| (4) | | Impact on performance due to reimbursement from advisor was 0.50%. |
See Notes to Financial Statements.
Janus Fixed Income & Money Market Funds | 83
Financial Highlights - Fixed Income Funds (continued)
Class S Shares
| | | | | | | | | | | | | | | | | | | | | | | |
For a share outstanding during each year or period ended June 30 and the
| | Janus Flexible Bond Fund |
| period ended October 31, 2009 | | 2013 | | 2012 | | 2011 | | 2010(1) | | 2009(2) | | |
| |
| Net Asset Value, Beginning of Period | | | $10.85 | | | | $10.55 | | | | $10.71 | | | | $10.42 | | | | $9.97 | | | |
| Income from Investment Operations: | | | | | | | | | | | | | | | | | | | | | | |
| Net investment income | | | 0.28 | | | | 0.34 | | | | 0.35 | | | | 0.27 | | | | 0.14 | | | |
| Net gain/(loss) on investments (both realized and unrealized) | | | (0.14) | | | | 0.45 | | | | 0.19 | | | | 0.35 | | | | 0.45 | | | |
| Total from Investment Operations | | | 0.14 | | | | 0.79 | | | | 0.54 | | | | 0.62 | | | | 0.59 | | | |
| Less Distributions: | | | | | | | | | | | | | | | | | | | | | | |
| Dividends (from net investment income)* | | | (0.28) | | | | (0.34) | | | | (0.36) | | | | (0.27) | | | | (0.14) | | | |
| Distributions (from capital gains)* | | | (0.21) | | | | (0.15) | | | | (0.34) | | | | (0.06) | | | | – | | | |
| Total Distributions | | | (0.49) | | | | (0.49) | | | | (0.70) | | | | (0.33) | | | | (0.14) | | | |
| Net Asset Value, End of Period | | | $10.50 | | | | $10.85 | | | | $10.55 | | | | $10.71 | | | | $10.42 | | | |
| Total Return** | | | 1.26% | | | | 7.69% | | | | 5.21% | | | | 6.04% | | | | 5.89% | | | |
| Net Assets, End of Period (in thousands) | | | $75,202 | | | | $74,154 | | | | $57,799 | | | | $61,541 | | | | $70,553 | | | |
| Average Net Assets for the Period (in thousands) | | | $78,304 | | | | $66,641 | | | | $60,614 | | | | $66,480 | | | | $67,591 | | | |
| Ratio of Gross Expenses (Absent the Waiver of Certain Fees and Expense Offsets) to Average Net Assets*** | | | 0.95% | | | | 0.95% | | | | 0.95% | | | | 0.95% | | | | 0.99% | | | |
| Ratio of Net Expenses (After Waivers and Expense Offsets) to Average Net Assets*** | | | 0.94% | | | | 0.94% | | | | 0.95% | | | | 0.95% | | | | 0.99% | | | |
| Ratio of Net Investment Income to Average Net Assets*** | | | 1.91% | | | | 2.92% | | | | 3.31% | | | | 3.87% | | | | 4.10% | | | |
| Portfolio Turnover Rate | | | 118% | | | | 126% | | | | 147% | | | | 86%^ | | | | 215% | | | |
Class S Shares
| | | | | | | | | | | | | | | |
| | | Janus Global Bond Fund | | |
| For a share outstanding during each year or period ended June 30 | | 2013 | | 2012 | | 2011(3) | | |
| |
| Net Asset Value, Beginning of Period | | | $10.49 | | | | $10.36 | | | | $10.00 | | | |
| Income from Investment Operations: | | | | | | | | | | | | | | |
| Net investment income | | | 0.26 | | | | 0.25 | | | | 0.20 | | | |
| Net gain/(loss) on investments (both realized and unrealized) | | | (0.35) | | | | 0.23 | | | | 0.29 | | | |
| Total from Investment Operations | | | (0.09) | | | | 0.48 | | | | 0.49 | | | |
| Less Distributions and Other: | | | | | | | | | | | | | | |
| Dividends (from net investment income)* | | | (0.11) | | | | (0.27) | | | | (0.13) | | | |
| Distributions (from capital gains)* | | | (0.25) | | | | (0.08) | | | | – | | | |
| Return of capital | | | (0.17) | | | | N/A | | | | N/A | | | |
| Total Distributions and Other | | | (0.53) | | | | (0.35) | | | | (0.13) | | | |
| Net Asset Value, End of Period | | | $9.87 | | | | $10.49 | | | | $10.36 | | | |
| Total Return** | | | (1.06)% | | | | 4.69% | | | | 4.96% | | | |
| Net Assets, End of Period (in thousands) | | | $905 | | | | $915 | | | | $875 | | | |
| Average Net Assets for the Period (in thousands) | | | $943 | | | | $895 | | | | $851 | | | |
| Ratio of Gross Expenses (Absent the Waiver of Certain Fees and Expense Offsets) to Average Net Assets*** | | | 1.49% | | | | 1.62% | | | | 3.84% | | | |
| Ratio of Net Expenses (After Waivers and Expense Offsets) to Average Net Assets*** | | | 1.13% | | | | 1.20% | | | | 0.86%(4) | | | |
| Ratio of Net Investment Income to Average Net Assets*** | | | 2.20% | | | | 2.33% | | | | 2.97% | | | |
| Portfolio Turnover Rate | | | 182% | | | | 222% | | | | 173% | | | |
| | | |
| * | | See Note 5 in Notes to Financial Statements. |
| ** | | Total return not annualized for periods of less than one full year. |
| *** | | Annualized for periods of less than one full year. |
| ^ | | Rate has been adjusted to conform with current year presentation. |
| (1) | | Period from November 1, 2009 through June 30, 2010. The Fund changed its fiscal year end from October 31 to June 30. |
| (2) | | Period from July 6, 2009 (inception date) through October 31, 2009. |
| (3) | | Period from December 28, 2010 (inception date) through June 30, 2011. |
| (4) | | Pursuant to a contractual agreement, Janus waived certain fees and expenses during the period. The Ratio of Net Expenses (After Waivers and Expense Offsets) to Average Net Assets would be 1.27% without the waiver of these fees and expenses. |
See Notes to Financial Statements.
84 | JUNE 30, 2013
Class S Shares
| | | | | | | | | | | | | | | | | | | | | | | |
For a share outstanding during each year or period ended June 30 and the
| | Janus High-Yield Fund |
| period ended October 31, 2009 | | 2013 | | 2012 | | 2011 | | 2010(1) | | 2009(2) | | |
| |
| Net Asset Value, Beginning of Period | | | $9.02 | | | | $9.15 | | | | $8.47 | | | | $8.29 | | | | $7.61 | | | |
| Income from Investment Operations: | | | | | | | | | | | | | | | | | | | | | | |
| Net investment income | | | 0.56 | | | | 0.61 | | | | 0.63 | | | | 0.46 | | | | 0.27 | | | |
| Net gain/(loss) on investments (both realized and unrealized) | | | 0.15 | | | | (0.13) | | | | 0.68 | | | | 0.17 | | | | 0.67 | | | |
| Total from Investment Operations | | | 0.71 | | | | 0.48 | | | | 1.31 | | | | 0.63 | | | | 0.94 | | | |
| Less Distributions and Other: | | | | | | | | | | | | | | | | | | | | | | |
| Dividends (from net investment income)* | | | (0.56) | | | | (0.61) | | | | (0.63) | | | | (0.45) | | | | (0.27) | | | |
| Distributions (from capital gains)* | | | (0.01) | | | | – | | | | – | | | | – | | | | – | | | |
| Redemption fees | | | N/A | | | | –(3) | | | | –(3) | | | | –(3) | | | | 0.01 | | | |
| Total Distributions and Other | | | (0.57) | | | | (0.61) | | | | (0.63) | | | | (0.45) | | | | (0.26) | | | |
| Net Asset Value, End of Period | | | $9.16 | | | | $9.02 | | | | $9.15 | | | | $8.47 | | | | $8.29 | | | |
| Total Return** | | | 7.95% | | | | 5.57% | | | | 15.83%(4) | | | | 7.77% | | | | 12.55% | | | |
| Net Assets, End of Period (in thousands) | | | $6,901 | | | | $6,213 | | | | $7,015 | | | | $6,354 | | | | $5,841 | | | |
| Average Net Assets for the Period (in thousands) | | | $6,893 | | | | $5,959 | | | | $7,079 | | | | $6,774 | | | | $5,037 | | | |
| Ratio of Gross Expenses (Absent the Waiver of Certain Fees and Expense Offsets) to Average Net Assets*** | | | 1.12% | | | | 1.11% | | | | 1.13% | | | | 1.12% | | | | 1.18% | | | |
| Ratio of Net Expenses (After Waivers and Expense Offsets) to Average Net Assets*** | | | 1.12% | | | | 1.11% | | | | 1.13% | | | | 1.12% | | | | 1.18% | | | |
| Ratio of Net Investment Income to Average Net Assets*** | | | 5.96% | | | | 6.80% | | | | 7.05% | | | | 8.12% | | | | 9.82% | | | |
| Portfolio Turnover Rate | | | 93% | | | | 61% | | | | 92% | | | | 61%^ | | | | 97% | | | |
Class S Shares
| | | | | | | | | | | | | | | | | | | | | | | |
For a share outstanding during each year or period ended June 30 and the period
| | Janus Short-Term Bond Fund |
| ended October 31, 2009 | | 2013 | | 2012 | | 2011 | | 2010(1) | | 2009(2) | | |
| |
| Net Asset Value, Beginning of Period | | | $3.08 | | | | $3.08 | | | | $3.08 | | | | $3.06 | | | | $3.01 | | | |
| Income from Investment Operations: | | | | | | | | | | | | | | | | | | | | | | |
| Net investment income | | | 0.04 | | | | 0.05 | | | | 0.06 | | | | 0.04 | | | | 0.03 | | | |
| Net gain/(loss) on investments (both realized and unrealized) | | | (0.01) | | | | 0.01 | | | | 0.02 | | | | 0.03 | | | | 0.05 | | | |
| Total from Investment Operations | | | 0.03 | | | | 0.06 | | | | 0.08 | | | | 0.07 | | | | 0.08 | | | |
| Less Distributions: | | | | | | | | | | | | | | | | | | | | | | |
| Dividends (from net investment income)* | | | (0.04) | | | | (0.05) | | | | (0.06) | | | | (0.05) | | | | (0.03) | | | |
| Distributions (from capital gains)* | | | (0.02) | | | | (0.01) | | | | (0.02) | | | | – | | | | – | | | |
| Total Distributions | | | (0.06) | | | | (0.06) | | | | (0.08) | | | | (0.05) | | | | (0.03) | | | |
| Net Asset Value, End of Period | | | $3.05 | | | | $3.08 | | | | $3.08 | | | | $3.08 | | | | $3.06 | | | |
| Total Return** | | | 1.03% | | | | 1.98% | | | | 2.74% | | | | 2.16% | | | | 2.62% | | | |
| Net Assets, End of Period (in thousands) | | | $5,149 | | | | $5,127 | | | | $5,692 | | | | $5,145 | | | | $4,549 | | | |
| Average Net Assets for the Period (in thousands) | | | $5,117 | | | | $5,547 | | | | $5,172 | | | | $4,928 | | | | $2,543 | | | |
| Ratio of Gross Expenses (Absent the Waiver of Certain Fees and Expense Offsets) to Average Net Assets*** | | | 1.09% | | | | 1.06% | | | | 1.08% | | | | 1.09% | | | | 1.13% | | | |
| Ratio of Net Expenses (After Waivers and Expense Offsets) to Average Net Assets*** | | | 0.99% | | | | 1.00% | | | | 1.03% | | | | 1.05% | | | | 1.06% | | | |
| Ratio of Net Investment Income to Average Net Assets*** | | | 1.29% | | | | 1.77% | | | | 1.90% | | | | 2.20% | | | | 2.59% | | | |
| Portfolio Turnover Rate | | | 100% | | | | 93% | | | | 100% | | | | 33%^ | | | | 57% | | | |
| | | |
| * | | See Note 5 in Notes to Financial Statements. |
| ** | | Total return not annualized for periods of less than one full year. |
| *** | | Annualized for periods of less than one full year. |
| ^ | | Rate has been adjusted to conform with current year presentation. |
| (1) | | Period from November 1, 2009 through June 30, 2010. The Fund changed its fiscal year end from October 31 to June 30. |
| (2) | | Period from July 6, 2009 (inception date) through October 31, 2009. |
| (3) | | Redemption fees aggregated less than $0.01 on a per share basis. Redemption fees were eliminated effective April 2, 2012. |
| (4) | | Impact on performance due to reimbursement from advisor was 0.50%. |
See Notes to Financial Statements.
Janus Fixed Income & Money Market Funds | 85
Financial Highlights - Fixed Income Funds (continued)
Class T Shares
| | | | | | | | | | | | | | | | | | | | | | | | | | | |
For a share outstanding during each year or period
| | Janus Flexible Bond Fund | | |
| ended June 30 and each year ended October 31 | | 2013 | | 2012 | | 2011 | | 2010(1) | | 2009 | | 2008 | | |
| |
| Net Asset Value, Beginning of Period | | | $10.85 | | | | $10.54 | | | | $10.70 | | | | $10.42 | | | | $9.09 | | | | $9.45 | | | |
| Income from Investment Operations: | | | | | | | | | | | | | | | | | | | | | | | | | | |
| Net investment income | | | 0.31 | | | | 0.36 | | | | 0.38 | | | | 0.29 | | | | 0.43 | | | | 0.42 | | | |
| Net gain/(loss) on investments (both realized and unrealized) | | | (0.15) | | | | 0.46 | | | | 0.18 | | | | 0.34 | | | | 1.33 | | | | (0.36) | | | |
| Total from Investment Operations | | | 0.16 | | | | 0.82 | | | | 0.56 | | | | 0.63 | | | | 1.76 | | | | 0.06 | | | |
| Less Distributions: | | | | | | | | | | | | | | | | | | | | | | | | | | |
| Dividends (from net investment income)* | | | (0.31) | | | | (0.36) | | | | (0.38) | | | | (0.29) | | | | (0.43) | | | | (0.42) | | | |
| Distributions (from capital gains)* | | | (0.21) | | | | (0.15) | | | | (0.34) | | | | (0.06) | | | | – | | | | – | | | |
| Total Distributions | | | (0.52) | | | | (0.51) | | | | (0.72) | | | | (0.35) | | | | (0.43) | | | | (0.42) | | | |
| Net Asset Value, End of Period | | | $10.49 | | | | $10.85 | | | | $10.54 | | | | $10.70 | | | | $10.42 | | | | $9.09 | | | |
| Total Return** | | | 1.42% | | | | 8.06% | | | | 5.47% | | | | 6.13% | | | | 19.74% | | | | 0.50% | | | |
| Net Assets, End of Period (in thousands) | | | $1,165,892 | | | | $1,286,847 | | | | $794,629 | | | | $641,811 | | | | $1,086,604 | | | | $740,543 | | | |
| Average Net Assets for the Period (in thousands) | | | $1,333,891 | | | | $1,033,338 | | | | $727,010 | | | | $831,851 | | | | $915,900 | | | | $855,399 | | | |
| Ratio of Gross Expenses (Absent the Waiver of Certain Fees and Expense Offsets) to Average Net Assets*** | | | 0.70% | | | | 0.70% | | | | 0.70% | | | | 0.66% | | | | 0.73% | | | | 0.78% | | | |
| Ratio of Net Expenses (After Waivers and Expense Offsets) to Average Net Assets*** | | | 0.69% | | | | 0.69% | | | | 0.70% | | | | 0.66% | | | | 0.73% | | | | 0.77% | | | |
| Ratio of Net Investment Income to Average Net Assets*** | | | 2.16% | | | | 3.14% | | | | 3.56% | | | | 4.19% | | | | 4.34% | | | | 4.32% | | | |
| Portfolio Turnover Rate | | | 118% | | | | 126% | | | | 147% | | | | 86%^ | | | | 215% | | | | 185% | | | |
Class T Shares
| | | | | | | | | | | | | | | |
| | | Janus Global Bond Fund | | |
| For a share outstanding during each year or period ended June 30 | | 2013 | | 2012 | | 2011(2) | | |
| |
| Net Asset Value, Beginning of Period | | | $10.48 | | | | $10.35 | | | | $10.00 | | | |
| Income from Investment Operations: | | | | | | | | | | | | | | |
| Net investment income | | | 0.27 | | | | 0.31 | | | | 0.16 | | | |
| Net gain/(loss) on investments (both realized and unrealized) | | | (0.34) | | | | 0.19 | | | | 0.34 | | | |
| Total from Investment Operations | | | (0.07) | | | | 0.50 | | | | 0.50 | | | |
| Less Distributions and Other: | | | | | | | | | | | | | | |
| Dividends (from net investment income)* | | | (0.12) | | | | (0.29) | | | | (0.15) | | | |
| Distributions (from capital gains)* | | | (0.25) | | | | (0.08) | | | | – | | | |
| Return of capital | | | (0.18) | | | | N/A | | | | N/A | | | |
| Total Distributions and Other | | | (0.55) | | | | (0.37) | | | | (0.15) | | | |
| Net Asset Value, End of Period | | | $9.86 | | | | $10.48 | | | | $10.35 | | | |
| Total Return** | | | (0.91)% | | | | 4.90% | | | | 4.99% | | | |
| Net Assets, End of Period (in thousands) | | | $6,935 | | | | $2,317 | | | | $8,808 | | | |
| Average Net Assets for the Period (in thousands) | | | $4,055 | | | | $4,904 | | | | $1,739 | | | |
| Ratio of Gross Expenses (Absent the Waiver of Certain Fees and Expense Offsets) to Average Net Assets*** | | | 1.19% | | | | 1.38% | | | | 2.33% | | | |
| Ratio of Net Expenses (After Waivers and Expense Offsets) to Average Net Assets*** | | | 0.98% | | | | 1.00% | | | | 0.68%(3) | | | |
| Ratio of Net Investment Income to Average Net Assets*** | | | 2.29% | | | | 2.44% | | | | 2.92% | | | |
| Portfolio Turnover Rate | | | 182% | | | | 222% | | | | 173% | | | |
| | | |
| * | | See Note 5 in Notes to Financial Statements. |
| ** | | Total return not annualized for periods of less than one full year. |
| *** | | Annualized for periods of less than one full year. |
| ^ | | Rate has been adjusted to conform with current year presentation. |
| (1) | | Period from November 1, 2009 through June 30, 2010. The Fund changed its fiscal year end from October 31 to June 30. |
| (2) | | Period from December 28, 2010 (inception date) through June 30, 2011. |
| (3) | | Pursuant to a contractual agreement, Janus waived certain fees and expenses during the period. The Ratio of Net Expenses (After Waivers and Expense Offsets) to Average Net Assets would be 1.01% without the waiver of these fees and expenses. |
See Notes to Financial Statements.
86 | JUNE 30, 2013
Class T Shares
| | | | | | | | | | | | | | | | | | | | | | | | | | | |
For a share outstanding during each year or period
| | Janus High-Yield Fund | | |
| ended June 30 and each year ended October 31 | | 2013 | | 2012 | | 2011 | | 2010(1) | | 2009 | | 2008 | | |
| |
| Net Asset Value, Beginning of Period | | | $9.00 | | | | $9.13 | | | | $8.45 | | | | $8.28 | | | | $6.94 | | | | $9.53 | | | |
| Income from Investment Operations: | | | | | | | | | | | | | | | | | | | | | | | | | | |
| Net investment income | | | 0.58 | | | | 0.63 | | | | 0.65 | | | | 0.47 | | | | 0.93 | | | | 0.73 | | | |
| Net gain/(loss) on investments (both realized and unrealized) | | | 0.15 | | | | (0.13) | | | | 0.69 | | | | 0.17 | | | | 1.34 | | | | (2.59) | | | |
| Total from Investment Operations | | | 0.73 | | | | 0.50 | | | | 1.34 | | | | 0.64 | | | | 2.27 | | | | (1.86) | | | |
| Less Distributions and Other: | | | | | | | | | | | | | | | | | | | | | | | | | | |
| Dividends (from net investment income)* | | | (0.58) | | | | (0.63) | | | | (0.66) | | | | (0.47) | | | | (0.93) | | | | (0.73) | | | |
| Distributions (from capital gains)* | | | (0.01) | | | | – | | | | – | | | | – | | | | – | | | | – | | | |
| Redemption fees | | | N/A | | | | –(2) | | | | –(2) | | | | –(2) | | | | –(2) | | | | –(2) | | | |
| Total Distributions and Other | | | (0.59) | | | | (0.63) | | | | (0.66) | | | | (0.47) | | | | (0.93) | | | | (0.73) | | | |
| Net Asset Value, End of Period | | | $9.14 | | | | $9.00 | | | | $9.13 | | | | $8.45 | | | | $8.28 | | | | $6.94 | | | |
| Total Return** | | | 8.23% | | | | 5.83% | | | | 16.14%(3) | | | | 7.83% | | | | 35.34% | | | | (20.74)% | | | |
| Net Assets, End of Period (in thousands) | | | $1,310,580 | | | | $1,269,091 | | | | $1,060,678 | | | | $707,010 | | | | $881,347 | | | | $381,290 | | | |
| Average Net Assets for the Period (in thousands) | | | $1,401,785 | | | | $1,107,108 | | | | $875,192 | | | | $819,927 | | | | $574,291 | | | | $510,868 | | | |
| Ratio of Gross Expenses (Absent the Waiver of Certain Fees and Expense Offsets) to Average Net Assets*** | | | 0.87% | | | | 0.86% | | | | 0.88% | | | | 0.86% | | | | 0.89% | | | | 0.90% | | | |
| Ratio of Net Expenses (After Waivers and Expense Offsets) to Average Net Assets*** | | | 0.86% | | | | 0.86% | | | | 0.88% | | | | 0.86% | | | | 0.89% | | | | 0.89% | | | |
| Ratio of Net Investment Income to Average Net Assets*** | | | 6.21% | | | | 7.05% | | | | 7.28% | | | | 8.42% | | | | 12.44% | | | | 8.26% | | | |
| Portfolio Turnover Rate | | | 93% | | | | 61% | | | | 92% | | | | 61%^ | | | | 97% | | | | 109% | | | |
Class T Shares
| | | | | | | | | | | | | | | | | | | | | | | | | | | |
For a share outstanding during each year or period
| | Janus Short-Term Bond Fund | | |
| ended June 30 and each year ended October 31 | | 2013 | | 2012 | | 2011 | | 2010(1) | | 2009 | | 2008 | | |
| |
| Net Asset Value, Beginning of Period | | | $3.09 | | | | $3.09 | | | | $3.09 | | | | $3.06 | | | | $2.87 | | | | $2.88 | | | |
| Income from Investment Operations: | | | | | | | | | | | | | | | | | | | | | | | | | | |
| Net investment income | | | 0.05 | | | | 0.06 | | | | 0.07 | | | | 0.05 | | | | 0.10 | | | | 0.10 | | | |
| Net gain/(loss) on investments (both realized and unrealized) | | | (0.02) | | | | 0.01 | | | | 0.02 | | | | 0.03 | | | | 0.19 | | | | (0.01) | | | |
| Total from Investment Operations | | | 0.03 | | | | 0.07 | | | | 0.09 | | | | 0.08 | | | | 0.29 | | | | 0.09 | | | |
| Less Distributions: | | | | | | | | | | | | | | | | | | | | | | | | | | |
| Dividends (from net investment income)* | | | (0.05) | | | | (0.06) | | | | (0.07) | | | | (0.05) | | | | (0.10) | | | | (0.10) | | | |
| Distributions (from capital gains)* | | | (0.02) | | | | (0.01) | | | | (0.02) | | | | – | | | | – | | | | – | | | |
| Total Distributions | | | (0.07) | | | | (0.07) | | | | (0.09) | | | | (0.05) | | | | (0.10) | | | | (0.10) | | | |
| Net Asset Value, End of Period | | | $3.05 | | | | $3.09 | | | | $3.09 | | | | $3.09 | | | | $3.06 | | | | $2.87 | | | |
| Total Return** | | | 0.90% | | | | 2.18% | | | | 2.99% | | | | 2.68% | | | | 10.35% | | | | 3.24% | | | |
| Net Assets, End of Period (in thousands) | | | $2,209,497 | | | | $2,022,283 | | | | $1,953,155 | | | | $1,956,871 | | | | $1,212,465 | | | | $231,823 | | | |
| Average Net Assets for the Period (in thousands) | | | $2,200,413 | | | | $1,915,783 | | | | $1,950,013 | | | | $1,637,559 | | | | $588,441 | | | | $193,360 | | | |
| Ratio of Gross Expenses (Absent the Waiver of Certain Fees and Expense Offsets) to Average Net Assets*** | | | 0.85% | | | | 0.84% | | | | 0.84% | | | | 0.83% | | | | 0.87% | | | | 0.98% | | | |
| Ratio of Net Expenses (After Waivers and Expense Offsets) to Average Net Assets*** | | | 0.80% | | | | 0.80% | | | | 0.80% | | | | 0.79% | | | | 0.72% | | | | 0.64% | | | |
| Ratio of Net Investment Income to Average Net Assets*** | | | 1.49% | | | | 1.95% | | | | 2.16% | | | | 2.44% | | | | 3.46% | | | | 3.51% | | | |
| Portfolio Turnover Rate | | | 100% | | | | 93% | | | | 100% | | | | 33%^ | | | | 57% | | | | 127% | | | |
| | | |
| * | | See Note 5 in Notes to Financial Statements. |
| ** | | Total return not annualized for periods of less than one full year. |
| *** | | Annualized for periods of less than one full year. |
| ^ | | Rate has been adjusted to conform with current year presentation. |
| (1) | | Period from November 1, 2009 through June 30, 2010. The Fund changed its fiscal year end from October 31 to June 30. |
| (2) | | Redemption fees aggregated less than $0.01 on a per share basis. Redemption fees were eliminated effective April 2, 2012. |
| (3) | | Impact on performance due to reimbursement from advisor was 0.51%. |
See Notes to Financial Statements.
Janus Fixed Income & Money Market Funds | 87
Statements of Assets and Liabilities - Money Market Funds
| | | | | | | | | |
As of June 30, 2013
| | Janus Government
| | Janus Money
|
| (all numbers in thousands except net asset value per share) | | Money Market Fund | | Market Fund |
|
| |
| Assets: | | | | | | | | |
| Investments at cost(1) | | $ | 181,934 | | | $ | 1,268,290 | |
| Investments at value | | $ | 146,634 | | | $ | 715,290 | |
| Repurchase agreements | | | 35,300 | | | | 553,000 | |
| Cash | | | 97 | | | | – | |
| Receivables: | | | | | | | | |
| Fund shares sold | | | 27 | | | | 1,396 | |
| Interest | | | 15 | | | | 89 | |
| Non-interested Trustees’ deferred compensation | | | 3 | | | | 22 | |
| Other assets | | | – | | | | – | |
| Total Assets | | | 182,076 | | | | 1,269,797 | |
| Liabilities: | | | | | | | | |
| Payables: | | | | | | | | |
| Due to custodian | | | – | | | | 50 | |
| Fund shares repurchased | | | 270 | | | | 1,945 | |
| Dividends | | | – | | | | 1 | |
| Advisory fees | | | 14 | | | | 96 | |
| Administrative services fees | | | 2 | | | | 10 | |
| Non-interested Trustees’ fees and expenses | | | 3 | | | | 17 | |
| Non-interested Trustees’ deferred compensation fees | | | 3 | | | | 22 | |
| Accrued expenses and other payables | | | 36 | | | | 38 | |
| Total Liabilities | | | 328 | | | | 2,179 | |
| Net Assets | | $ | 181,748 | | | $ | 1,267,618 | |
| Net Assets Consist of: | | | | | | | | |
| Capital (par value and paid-in surplus)* | | $ | 181,763 | | | $ | 1,267,649 | |
| Undistributed net investment loss* | | | (15) | | | | (33) | |
| Undistributed net realized gain from investment and foreign currency transactions* | | | – | | | | – | |
| Unrealized net appreciation of investments, foreign currency translations and non-interested Trustees’ deferred compensation | | | – | | | | 2 | |
| Total Net Assets | | $ | 181,748 | | | $ | 1,267,618 | |
| Net Assets - Class D Shares | | $ | 175,179 | | | $ | 1,077,369 | |
| Shares Outstanding, $0.01 Par Value (unlimited shares authorized) | | | 175,194 | | | | 1,077,392 | |
| Net Asset Value Per Share | | $ | 1.00 | | | $ | 1.00 | |
| Net Assets - Class T Shares | | $ | 6,569 | | | $ | 190,249 | |
| Shares Outstanding, $0.01 Par Value (unlimited shares authorized) | | | 6,569 | | | | 190,258 | |
| Net Asset Value Per Share | | $ | 1.00 | | | $ | 1.00 | |
| | | |
| * | | See Note 5 in Notes to Financial Statements. |
| (1) | | Includes cost of repurchase agreements of $35,300,000 and $553,000,000 for Janus Government Money Market Fund and Janus Money Market Fund, respectively. |
See Notes to Financial Statements.
88 | JUNE 30, 2013
Statements of Operations - Money Market Funds
| | | | | | | | | |
For the year ended June 30, 2013
| | Janus Government
| | Janus
|
| (all numbers in thousands) | | Money Market Fund | | Money Market Fund |
|
| |
| Investment Income: | | | | | | | | |
| Interest | | $ | 349 | | | $ | 2,175 | |
| Total Investment Income | | | 349 | | | | 2,175 | |
| Expenses: | | | | | | | | |
| Advisory fees | | | 365 | | | | 2,488 | |
| Professional fees | | | 56 | | | | 67 | |
| Non-interested Trustees’ fees and expenses | | | 3 | | | | 69 | |
| Administrative services fees - Class D Shares | | | 820 | | | | 4,918 | |
| Administrative services fees - Class T Shares | | | 27 | | | | 855 | |
| Other expenses | | | 1 | | | | – | |
| Total Expenses | | | 1,272 | | | | 8,397 | |
| Less: Excess Expense Reimbursement | | | (932) | | | | (6,279) | |
| Net Expenses after Waivers and Expense Offsets | | | 340 | | | | 2,118 | |
| Net Investment Income | | | 9 | | | | 57 | |
| Net Realized and Unrealized Gain/(Loss) on Investments: | | | | | | | | |
| Change in unrealized net appreciation/(depreciation) of non-interested Trustees’ deferred compensation | | | – | | | | 2 | |
| Net Gain on Investments | | | – | | | | 2 | |
| Net Increase in Net Assets Resulting from Operations | | $ | 9 | | | $ | 59 | |
See Notes to Financial Statements.
Janus Fixed Income & Money Market Funds | 89
Statements of Changes in Net Assets - Money Market Funds
| | | | | | | | | | | | | | | | | |
| | | Janus Government
| | Janus Money
|
For each year ended June 30
| | Money Market Fund | | Market Fund |
| (all numbers in thousands) | | 2013 | | 2012 | | 2013 | | 2012 |
|
| |
| Operations: | | | | | | | | | | | | | | | | |
| Net investment income | | $ | 9 | | | $ | 6 | | | $ | 57 | | | $ | 59 | |
| Net realized gain from investment and foreign currency transactions | | | – | | | | – | | | | – | | | | – | |
| Change in unrealized net appreciation/(depreciation) of non-interested Trustees’ deferred compensation | | | – | | | | – | | | | 2 | | | | (2) | |
| Net Increase in Net Assets Resulting from Operations | | | 9 | | | | 6 | | | | 59 | | | | 57 | |
| Dividends and Distributions to Shareholders: | | | | | | | | | | | | | | | | |
| Net Investment Income* | | | | | | | | | | | | | | | | |
| Class D Shares | | | (9) | | | | (6) | | | | (51) | | | | (50) | |
| Class T Shares | | | – | | | | – | | | | (9) | | | | (7) | |
| Net Realized Gain/(Loss) from Investment Transactions* | | | | | | | | | | | | | | | | |
| Class D Shares | | | – | | | | (2) | | | | – | | | | (6) | |
| Class T Shares | | | – | | | | – | | | | – | | | | (1) | |
| Net Decrease from Dividends and Distributions | | | (9) | | | | (8) | | | | (60) | | | | (64) | |
| Capital Share Transactions: | | | | | | | | | | | | | | | | |
| Shares Sold | | | | | | | | | | | | | | | | |
| Class D Shares | | | 74,214 | | | | 79,886 | | | | 574,480 | | | | 623,381 | |
| Class T Shares | | | 4,552 | | | | 5,053 | | | | 109,753 | | | | 103,157 | |
| Reinvested Dividends and Distributions | | | | | | | | | | | | | | | | |
| Class D Shares | | | 8 | | | | 7 | | | | 40 | | | | 52 | |
| Class T Shares | | | – | | | | – | | | | 4 | | | | 4 | |
| Shares Repurchased | | | | | | | | | | | | | | | | |
| Class D Shares | | | (81,354) | | | | (86,828) | | | | (586,410) | | | | (639,464) | |
| Class T Shares | | | (3,302) | | | | (5,466) | | | | (87,185) | | | | (100,027) | |
| Net Increase/(Decrease) from Capital Share Transactions | | | (5,882) | | | | (7,348) | | | | 10,682 | | | | (12,897) | |
| Net Increase/(Decrease) in Net Assets | | | (5,882) | | | | (7,350) | | | | 10,681 | | | | (12,904) | |
| Net Assets: | | | | | | | | | | | | | | | | |
| Beginning of period | | | 187,630 | | | | 194,980 | | | | 1,256,937 | | | | 1,269,841 | |
| End of period | | $ | 181,748 | | | $ | 187,630 | | | $ | 1,267,618 | | | $ | 1,256,937 | |
| | | | | | | | | | | | | | | | | |
| Undistributed Net Investment Loss* | | $ | (15) | | | $ | (15) | | | $ | (33) | | | $ | (36) | |
| | | |
| * | | See Note 5 in Notes to Financial Statements. |
See Notes to Financial Statements.
90 | JUNE 30, 2013
Financial Highlights - Money Market Funds
Class D Shares
| | | | | | | | | | | | | | | | | | | |
| | | Janus Government Money Market Fund | | |
| For a share outstanding during each year or period ended June 30 | | 2013 | | 2012 | | 2011 | | 2010(1) | | |
| |
| Net Asset Value, Beginning of Period | | | $1.00 | | | | $1.00 | | | | $1.00 | | | | $1.00 | | | |
| Income from Investment Operations: | | | | | | | | | | | | | | | | | | |
| Net investment income | | | – | | | | – | | | | – | | | | – | | | |
| Net gain on investments (both realized and unrealized) | | | – | | | | – | | | | – | | | | – | | | |
| Total from Investment Operations | | | – | | | | – | | | | – | | | | – | | | |
| Less Distributions: | | | | | | | | | | | | | | | | | | |
| Dividends (from net investment income)* | | | – | | | | – | | | | – | | | | – | | | |
| Distributions (from capital gains)* | | | – | | | | – | | | | – | | | | – | | | |
| Total Distributions | | | – | | | | – | | | | – | | | | – | | | |
| Net Asset Value, End of Period | | | $1.00 | | | | $1.00 | | | | $1.00 | | | | $1.00 | | | |
| Total Return** | | | 0.01% | | | | 0.00% | | | | 0.00% | | | | 0.01% | | | |
| Net Assets, End of Period (in thousands) | | | $175,179 | | | | $182,311 | | | | $189,249 | | | | $211,746 | | | |
| Average Net Assets for the Period (in thousands) | | | $178,560 | | | | $190,180 | | | | $199,694 | | | | $209,798 | | | |
| Ratio of Gross Expenses (Absent the Waiver of Certain Fees and Expense Offsets) to Average Net Assets*** | | | 0.69% | | | | 0.69% | | | | 0.71% | | | | 0.68% | | | |
| Ratio of Net Expenses (After Waivers and Expense Offsets) to Average Net Assets*** | | | 0.18% | | | | 0.18% | | | | 0.23% | | | | 0.26% | | | |
| Ratio of Net Investment Income/(Loss) to Average Net Assets*** | | | 0.00% | | | | 0.00% | | | | 0.00% | | | | (0.03)% | | | |
Class D Shares
| | | | | | | | | | | | | | | | | | | |
| | | Janus Money Market Fund | | |
| For a share outstanding during each year or period ended June 30 | | 2013 | | 2012 | | 2011 | | 2010(1) | | |
| |
| Net Asset Value, Beginning of Period | | | $1.00 | | | | $1.00 | | | | $1.00 | | | | $1.00 | | | |
| Income from Investment Operations: | | | | | | | | | | | | | | | | | | |
| Net investment income | | | – | | | | – | | | | – | | | | – | | | |
| Net gain on investments (both realized and unrealized) | | | – | | | | – | | | | – | | | | – | | | |
| Total from Investment Operations | | | – | | | | – | | | | – | | | | – | | | |
| Less Distributions: | | | | | | | | | | | | | | | | | | |
| Dividends (from net investment income)* | | | – | | | | – | | | | – | | | | – | | | |
| Distributions (from capital gains)* | | | – | | | | – | | | | – | | | | – | | | |
| Total Distributions | | | – | | | | – | | | | – | | | | – | | | |
| Net Asset Value, End of Period | | | $1.00 | | | | $1.00 | | | | $1.00 | | | | $1.00 | | | |
| Total Return** | | | 0.00% | | | | 0.00% | | | | 0.01% | | | | 0.00% | | | |
| Net Assets, End of Period (in thousands) | | | $1,077,369 | | | | $1,089,252 | | | | $1,105,288 | | | | $1,236,987 | | | |
| Average Net Assets for the Period (in thousands) | | | $1,070,220 | | | | $1,131,399 | | | | $1,148,654 | | | | $1,244,263 | | | |
| Ratio of Gross Expenses (Absent the Waiver of Certain Fees and Expense Offsets) to Average Net Assets*** | | | 0.67% | | | | 0.67% | | | | 0.67% | | | | 0.67% | | | |
| Ratio of Net Expenses (After Waivers and Expense Offsets) to Average Net Assets*** | | | 0.17% | | | | 0.14% | | | | 0.22% | | | | 0.24% | | | |
| Ratio of Net Investment Income/(Loss) to Average Net Assets*** | | | 0.00% | | | | 0.00% | | | | 0.00% | | | | 0.01% | | | |
| | | |
| * | | See Note 5 in Notes to Financial Statements. |
| ** | | Total return not annualized for periods of less than one full year. |
| *** | | Annualized for periods of less than one full year. |
| (1) | | Period from February 16, 2010 (inception date) through June 30, 2010. |
See Notes to Financial Statements.
Janus Fixed Income & Money Market Funds | 91
Financial Highlights - Money Market Funds (continued)
Class T Shares
| | | | | | | | | | | | | | | | | | | | | | | | | | | |
For a share outstanding during each year or period ended June 30
| | Janus Government Money Market Fund | | |
| and each year ended October 31 | | 2013 | | 2012 | | 2011 | | 2010(1) | | 2009 | | 2008 | | |
| |
| Net Asset Value, Beginning of Period | | | $1.00 | | | | $1.00 | | | | $1.00 | | | | $1.00 | | | | $1.00 | | | | $1.00 | | | |
| Income from Investment Operations: | | | | | | | | | | | | | | | | | | | | | | | | | | |
| Net investment income | | | – | | | | – | | | | – | | | | 0.01(2) | | | | – | | | | 0.02 | | | |
| Net gain/(loss) on investments (both realized and unrealized) | | | – | | | | – | | | | – | | | | (0.01)(2) | | | | – | | | | – | | | |
| Total from Investment Operations | | | – | | | | – | | | | – | | | | – | | | | – | | | | 0.02 | | | |
| Less Distributions: | | | | | | | | | | | | | | | | | | | | | | | | | | |
| Dividends (from net investment income)* | | | – | | | | – | | | | – | | | | – | | | | – | | | | (0.02) | | | |
| Distributions (from capital gains)* | | | – | | | | – | | | | – | | | | – | | | | – | | | | – | | | |
| Total Distributions | | | – | | | | – | | | | – | | | | – | | | | – | | | | (0.02) | | | |
| Net Asset Value, End of Period | | | $1.00 | | | | $1.00 | | | | $1.00 | | | | $1.00 | | | | $1.00 | | | | $1.00 | | | |
| Total Return** | | | 0.01% | | | | 0.00% | | | | 0.00% | | | | 0.02% | | | | 0.08% | | | | 2.46% | | | |
| Net Assets, End of Period (in thousands) | | | $6,569 | | | | $5,319 | | | | $5,731 | | | | $4,446 | | | | $228,531 | | | | $312,248 | | | |
| Average Net Assets for the Period (in thousands) | | | $5,526 | | | | $5,267 | | | | $4,596 | | | | $100,419 | | | | $273,901 | | | | $225,293 | | | |
| Ratio of Gross Expenses (Absent the Waiver of Certain Fees and Expense Offsets) to Average Net Assets*** | | | 0.73% | | | | 0.71% | | | | 0.74% | | | | 0.72% | | | | 0.73% | | | | 0.72% | | | |
| Ratio of Net Expenses (After Waivers and Expense Offsets) to Average Net Assets*** | | | 0.18% | | | | 0.18% | | | | 0.22% | | | | 0.24% | | | | 0.55% | | | | 0.62% | | | |
| Ratio of Net Investment Income to Average Net Assets*** | | | 0.00% | | | | 0.00% | | | | 0.00% | | | | 0.05% | | | | 0.10% | | | | 2.33% | | | |
Class T Shares
| | | | | | | | | | | | | | | | | | | | | | | | | | | |
For a share outstanding during each year or period
| | Janus Money Market Fund | | |
| ended June 30 and each year ended October 31 | | 2013 | | 2012 | | 2011 | | 2010(1) | | 2009 | | 2008 | | |
| |
| Net Asset Value, Beginning of Period | | | $1.00 | | | | $1.00 | | | | $1.00 | | | | $1.00 | | | | $1.00 | | | | $1.00 | | | |
| Income from Investment Operations: | | | | | | | | | | | | | | | | | | | | | | | | | | |
| Net investment income | | | – | | | | – | | | | – | | | | – | | | | – | | | | 0.03 | | | |
| Net gain/(loss) on investments (both realized and unrealized) | | | – | | | | – | | | | – | | | | – | | | | – | | | | – | | | |
| Total from Investment Operations | | | – | | | | – | | | | – | | | | – | | | | – | | | | 0.03 | | | |
| Less Distributions: | | | | | | | | | | | | | | | | | | | | | | | | | | |
| Dividends (from net investment income)* | | | – | | | | – | | | | – | | | | – | | | | – | | | | (0.03) | | | |
| Distributions (from capital gains)* | | | – | | | | – | | | | – | | | | – | | | | – | | | | – | | | |
| Total Distributions | | | – | | | | – | | | | – | | | | – | | | | – | | | | (0.03) | | | |
| Net Asset Value, End of Period | | | $1.00 | | | | $1.00 | | | | $1.00 | | | | $1.00 | | | | $1.00 | | | | $1.00 | | | |
| Total Return** | | | 0.00% | | | | 0.00% | | | | 0.01% | | | | 0.00% | | | | 0.18% | | | | 2.76% | | | |
| Net Assets, End of Period (in thousands) | | | $190,249 | | | | $167,685 | | | | $164,553 | | | | $166,308 | | | | $1,517,715 | | | | $1,983,438 | | | |
| Average Net Assets for the Period (in thousands) | | | $178,310 | | | | $162,966 | | | | $163,660 | | | | $741,343 | | | | $1,785,483 | | | | $1,931,685 | | | |
| Ratio of Gross Expenses (Absent the Waiver of Certain Fees and Expense Offsets) to Average Net Assets*** | | | 0.69% | | | | 0.69% | | | | 0.69% | | | | 0.71% | | | | 0.73% | | | | 0.71% | | | |
| Ratio of Net Expenses (After Waivers and Expense Offsets) to Average Net Assets*** | | | 0.17% | | | | 0.14% | | | | 0.22% | | | | 0.25% | | | | 0.54% | | | | 0.61% | | | |
| Ratio of Net Investment Income to Average Net Assets*** | | | 0.00% | | | | 0.00% | | | | 0.00% | | | | 0.00% | | | | 0.20% | | | | 2.68% | | | |
| | | |
| * | | See Note 5 in Notes to Financial Statements. |
| ** | | Total return not annualized for periods of less than one full year. |
| *** | | Annualized for periods of less than one full year. |
| (1) | | Period from November 1, 2009 through June 30, 2010. The Fund changed its fiscal year end from October 31 to June 30. |
| (2) | | Due to decreased shares outstanding during the period, amounts shown for a share outstanding do not correspond with the aggregate net investment income and net gain/(loss) on investments. |
See Notes to Financial Statements.
92 | JUNE 30, 2013
Notes to Financial Statements
The following section describes the organization and significant accounting policies and provides more detailed information about the schedules and tables that appear throughout this report. In addition, the Notes to Financial Statements explain the methods used in preparing and presenting this report.
| |
| 1. | Organization and Significant Accounting Policies |
Janus Flexible Bond Fund, Janus Global Bond Fund, Janus High-Yield Fund and Janus Short-Term Bond Fund (collectively, the “Fixed Income Funds”) and Janus Government Money Market Fund and Janus Money Market Fund (collectively, the “Money Market Funds”) are series funds. The Fixed Income Funds and the Money Market Funds (individually, a “Fund” and collectively, the “Funds”) are part of Janus Investment Fund (the “Trust”), which is organized as a Massachusetts business trust and is registered under the Investment Company Act of 1940, as amended (the “1940 Act”), as an open-end management investment company. The financial statements include information for the fiscal year ended June 30, 2013. The Trust offers forty-four funds which include multiple series of shares, with differing investment objectives and policies. The Fixed Income Funds invest primarily in income-producing securities. The Money Market Funds invest primarily in short-term money market securities. Each Fixed Income Fund in this report is classified as diversified, as defined in the 1940 Act.
Each Fixed Income Fund in this report offers multiple classes of shares in order to meet the needs of various types of investors. Each Money Market Fund offers Class D Shares and Class T Shares. Each class represents an interest in the same portfolio of investments. Certain financial intermediaries may not offer all classes of shares.
Class A Shares and Class C Shares are generally offered through financial intermediary platforms including, but not limited to, traditional brokerage platforms, mutual fund wrap fee programs, bank trust platforms, and retirement platforms. The maximum purchase in Class C Shares is $500,000 for any single purchase.
Class D Shares are generally no longer being made available to new investors. The Shares are available only to investors who hold accounts directly with the Janus funds and to immediate family members or members of the same household of an eligible individual investor. The Shares are not offered through financial intermediaries.
Class I Shares are available through certain financial intermediary platforms including, but not limited to, mutual fund wrap fee programs, managed account programs, asset allocation programs, and bank trust platforms, as well as certain retirement platforms. Class I Shares are also available to certain institutional investors including, but not limited to, corporations, certain retirement plans, public plans, and foundations/endowments.
Class N Shares are generally available only to financial intermediaries purchasing on behalf of 401(k) plans, 457 plans, 403(b) plans, Taft-Hartley multi-employer plans, profit-sharing and money purchase pension plans, defined benefit plans and nonqualified deferred compensation plans.
Class R Shares are offered through financial intermediary platforms including, but not limited to, retirement platforms.
Class S Shares are offered through financial intermediary platforms including, but not limited to, retirement platforms and asset allocation, mutual fund wrap, or other discretionary or nondiscretionary fee-based investment advisory programs. In addition, Class S Shares may be available through certain financial intermediaries who have an agreement with Janus Capital Management LLC (“Janus Capital”) or its affiliates to offer Class S Shares on their supermarket platforms.
Class T Shares are available through certain financial intermediary platforms including, but not limited to, mutual fund wrap fee programs, managed account programs, asset allocation programs, bank trust platforms, as well as certain retirement platforms. In addition, Class T Shares may be available through certain financial intermediaries who have an agreement with Janus Capital or its affiliates to offer Class T Shares on their supermarket platforms.
The following accounting policies have been followed by the Funds and are in conformity with accounting principles generally accepted in the United States of America.
Investment Valuation
Securities are valued at the last sales price or the official closing price for securities traded on a principal securities exchange (U.S. or foreign) and on the NASDAQ National Market. Securities traded on over-the-counter (“OTC”) markets and listed securities for which no sales are reported are valued at the latest bid price (or yield equivalent thereof) obtained from one or more dealers transacting in a market for such securities or by a pricing service approved by the Funds’ Trustees. Short-term securities with maturities of 60 days or less may be valued at amortized cost, which approximates market value. Investments held by the Money Market Funds are valued utilizing the amortized cost method of valuation permitted in accordance with Rule 2a-7 under the 1940 Act and certain conditions therein. Under the amortized cost method, which does not take into account unrealized capital gains or losses, an instrument is initially valued at its cost and thereafter assumes a constant accretion/amortization to maturity of any discount or premium. Debt
Janus Fixed Income & Money Market Funds | 93
Notes to Financial Statements (continued)
securities with a remaining maturity of greater than 60 days are valued in accordance with the evaluated bid price supplied by the pricing service. The evaluated bid price supplied by the pricing service is an evaluation that reflects such factors as security prices, yields, maturities and ratings. Short positions shall be valued in accordance with the same methodologies, except that in the event that a last sale price is not available, the latest ask price shall be used instead of a bid price. Foreign securities and currencies are converted to U.S. dollars using the applicable exchange rate in effect as of the daily close of the New York Stock Exchange (“NYSE”). When market quotations are not readily available or deemed unreliable, or events or circumstances that may affect the value of portfolio securities held by the Funds are identified between the closing of their principal markets and the time the net asset value (“NAV”) is determined, securities may be valued at fair value as determined in good faith under procedures established by and under the supervision of the Funds’ Trustees. Circumstances in which fair value pricing may be utilized include, but are not limited to: (i) a significant event that may affect the securities of a single issuer, such as a merger, bankruptcy, or significant issuer specific development; (ii) an event that may affect an entire market, such as a natural disaster or significant governmental action; (iii) a nonsignificant event such as a market closing early or not opening, or a security trading halt; and (iv) pricing of a non-valued security and a restricted or non-public security. The Funds use systematic fair valuation models provided by independent third parties to value international equity securities in order to adjust for stale pricing, which may occur between the close of certain foreign exchanges and the close of the NYSE. Restricted and illiquid securities are valued in accordance with procedures established by the Funds’ Trustees.
Investment Transactions and Investment Income
Investment transactions are accounted for as of the date purchased or sold (trade date). Dividend income is recorded on the ex-dividend date. Certain dividends from foreign securities will be recorded as soon as the Trust is informed of the dividend, if such information is obtained subsequent to the ex-dividend date. Dividends from foreign securities may be subject to withholding taxes in foreign jurisdictions. Interest income is recorded on the accrual basis and includes amortization of premiums and accretion of discounts. Gains and losses are determined on the identified cost basis, which is the same basis used for federal income tax purposes. Income, as well as gains and losses, both realized and unrealized, are allocated daily to each class of shares based upon the ratio of net assets represented by each class as a percentage of total net assets.
Expenses
Each Fund bears expenses incurred specifically on its behalf, as well as a portion of general expenses, which may be allocated pro rata to each Fund. Each class of shares bears expenses incurred specifically on its behalf and, in addition, each class bears a portion of general expenses, which are allocated daily to each class of shares based upon the ratio of net assets represented by each class as a percentage of total net assets. Expenses directly attributable to a specific class of shares are charged against the operations of such class.
Estimates
The preparation of financial statements in conformity with accounting principles generally accepted in the United States of America requires management to make estimates and assumptions that affect the reported amount of assets and liabilities and disclosure of contingent assets and liabilities at the date of the financial statements, and the reported amounts of income and expenses during the reporting period. Actual results could differ from those estimates.
Foreign Currency Translations
The Fixed Income Funds do not isolate that portion of the results of operations resulting from the effect of changes in foreign exchange rates on investments from the fluctuations arising from changes in market prices of securities held at the date of the financial statements. Net unrealized appreciation or depreciation of investments and foreign currency translations arise from changes in the value of assets and liabilities, including investments in securities held at the date of the financial statements, resulting from changes in the exchange rates and changes in market prices of securities held.
Currency gains and losses are also calculated on payables and receivables that are denominated in foreign currencies. The payables and receivables are generally related to foreign security transactions and income translations.
Foreign currency-denominated assets and forward currency contracts may involve more risks than domestic transactions, including currency risk, political and economic risk, regulatory risk and equity risk. Risks may arise from the potential inability of a counterparty to meet the terms of a contract and from unanticipated movements in the value of foreign currencies relative to the U.S. dollar.
Dividend Distributions
Dividends are declared daily and distributed monthly for the Funds. Realized capital gains, if any, are declared and distributed in December.
94 | JUNE 30, 2013
The Fixed Income Funds may make certain investments in real estate investment trusts (“REITs”) which pay dividends to their shareholders based upon funds available from operations. It is quite common for these dividends to exceed the REITs’ taxable earnings and profits, resulting in the excess portion of such dividends being designated as a return of capital. If the Funds distribute such amounts, such distributions could constitute a return of capital to shareholders for federal income tax purposes.
Federal Income Taxes
Each Fund intends to continue to qualify as a regulated investment company and distribute all of its taxable income. Management has analyzed each Fund’s tax positions taken for all open federal income tax years, generally a three-year period, and has concluded that no provision for federal income tax is required in the Funds’ financial statements.
Restricted Cash
As of June 30, 2013, Janus High-Yield Fund had restricted cash in the amount of $15,000,000. The restricted cash is held at the Fund’s custodian, State Street Bank and Trust Company. The carrying value of the restricted cash approximates fair value.
Valuation Inputs Summary
In accordance with FASB guidance, the Funds utilize the “Fair Value Measurements” to define fair value, establish a framework for measuring fair value, and expand disclosure requirements regarding fair value measurements. The Fair Value Measurement Standard does not require new fair value measurements, but is applied to the extent that other accounting pronouncements require or permit fair value measurements. This standard emphasizes that fair value is a market-based measurement that should be determined based on the assumptions that market participants would use in pricing an asset or liability. Various inputs are used in determining the value of the Funds’ investments defined pursuant to this standard. These inputs are summarized into three broad levels:
Level 1 – Quoted prices in active markets for identical securities.
Level 2 – Prices determined using other significant observable inputs. Observable inputs are inputs that reflect the assumptions market participants would use in pricing a security and are developed based on market data obtained from sources independent of the reporting entity. These may include quoted prices for similar securities, interest rates, prepayment speeds, credit risk, and others.
Debt securities are valued in accordance with the evaluated bid price supplied by the pricing service and generally categorized as Level 2 in the hierarchy. Securities traded on OTC markets and listed securities for which no sales are reported are valued at the latest bid price (or yield equivalent thereof) obtained from one or more dealers transacting in a market for such securities or by a pricing service approved by the Funds’ Trustees and are categorized as Level 2 in the hierarchy. Short-term securities with maturities of 60 days or less are valued at amortized cost, which approximates market value and are categorized as Level 2 in the hierarchy. Periodic review and monitoring of the valuation of short-term securities is performed in an effort to ensure that amortized cost approximates market value. Other securities that may be categorized as Level 2 in the hierarchy include, but are not limited to, preferred stocks, bank loans, American Depositary Receipts (“ADRs”), Global Depositary Receipts (“GDRs”), warrants, swaps, investments in mutual funds, OTC options, and forward contracts. The Funds use systematic fair valuation models provided by independent third parties to value international equity securities in order to adjust for stale pricing, which may occur between the close of certain foreign exchanges and the close of the NYSE. These are generally categorized as Level 2 in the hierarchy.
Level 3 – Prices determined using significant unobservable inputs. In situations where quoted prices or observable inputs are unavailable or deemed less relevant (for example, when there is little or no market activity for an investment at the end of the period), unobservable inputs may be used. Unobservable inputs are inputs that reflect the reporting entity’s own assumptions about the factors market participants would use in pricing the security and would be based on the best information available under the circumstances.
For restricted equity securities and private placements where observable inputs are limited, assumptions about market activity and risk are used in employing valuation techniques such as the market approach, the income approach, or the cost approach, as defined under the FASB Guidance. These are categorized as Level 3 in the hierarchy.
There have been no significant changes in valuation techniques used in valuing any such positions held by the Funds since the beginning of the fiscal year.
The inputs or methodology used for valuing securities are not necessarily an indication of the risk associated with investing in those securities. The summary of inputs used as of June 30, 2013 to value the Funds’ investments in securities and other financial instruments is included in
Janus Fixed Income & Money Market Funds | 95
Notes to Financial Statements (continued)
the “Valuation Inputs Summary” in the Notes to Schedules of Investments and Other Information.
FASB Accounting Standards Update, “Amendments to Achieve Common Fair Value Measurement and Disclosure Requirements” requires disclosures about amounts and reasons for all transfers in and out of Level 1 and Level 2 fair value measurements. For fair value measurements categorized within Level 3 of the fair value hierarchy, the Funds shall provide quantitative information about the significant unobservable inputs used in the fair value measurement. To meet the objective of the quantitative disclosure, the Funds may need to further disaggregate to provide more meaningful information about the significant unobservable inputs used and how these inputs vary over time.
The Funds are not required to create quantitative information to comply with this disclosure requirement if quantitative unobservable inputs are not developed by the Funds when measuring fair value (for example, when a Fund uses prices from prior transactions or third-party pricing information without adjustment). However, when providing this disclosure, the Funds cannot ignore quantitative unobservable inputs that are significant to the fair value measurement and are reasonably available to the Funds.
In addition, the Accounting Standards Update requires the Funds to provide a narrative sensitivity disclosure of the fair value measurement changes in unobservable inputs and the interrelationships between those unobservable inputs for fair value measurements categorized within Level 3 of the fair value hierarchy.
There were no transfers in or out of Level 1, Level 2 and Level 3 during the year.
The Funds recognize transfers between the levels as of the beginning of the fiscal year.
| |
| 2. | Derivative Instruments |
The Fixed Income Funds may invest in various types of derivatives, which may at times result in significant derivative exposure. A derivative is a financial instrument whose performance is derived from the performance of another asset. The Fixed Income Funds may invest in derivative instruments including, but not limited to: futures contracts, put options, call options, options on future contracts, options on foreign currencies, swaps, forward contracts, structured investments, and other equity-linked derivatives. Each derivative instrument that was held by one or more of the Fixed Income Funds during the year ended June 30, 2013 is discussed in further detail below. A summary of derivative activity by Fund is reflected in the tables at the end of this section.
The Fixed Income Funds may use derivative instruments for hedging (to offset risks associated with an investment, currency exposure, or market conditions) or for speculative (to seek to enhance returns) purposes. When the Fixed Income Funds invest in a derivative for speculative purposes, the Fixed Income Funds will be fully exposed to the risks of loss of that derivative, which may sometimes be greater than the derivative’s cost. The Fixed Income Funds may not use any derivative to gain exposure to an asset or class of assets in which they would be prohibited by their respective investment restrictions from purchasing directly. The Fixed Income Funds’ ability to use derivative instruments may also be limited by tax considerations.
Investments in derivatives in general are subject to market risks that may cause their prices to fluctuate over time. Investments in derivatives may not directly correlate with the price movements of the underlying instrument. As a result, the use of derivatives may expose the Fixed Income Funds to additional risks that they would not be subject to if they invested directly in the securities underlying those derivatives. The use of derivatives may result in larger losses or smaller gains than otherwise would be the case. Derivatives can be volatile and may involve significant risks, including, but not limited to, counterparty risk, credit risk, currency risk, equity risk, index risk, interest rate risk, leverage risk, and liquidity risk, as described below.
Derivatives may generally be traded OTC or on an exchange. Derivatives traded OTC, such as options and structured notes, are agreements that are individually negotiated between parties and can be tailored to meet a purchaser’s needs.
OTC derivatives are not guaranteed by a clearing agency and may be subject to increased credit risk. In an effort to mitigate credit risk associated with derivatives traded OTC, the Fixed Income Funds may enter into collateral agreements with certain counterparties whereby, subject to certain minimum exposure requirements, a Fixed Income Fund may require the counterparty to post collateral if the Fixed Income Fund has a net aggregate unrealized gain on all OTC derivative contracts with a particular counterparty. There is no guarantee that counterparty exposure is reduced and these arrangements are dependent on Janus Capital’s ability to establish and maintain appropriate systems and trading.
In pursuit of their investment objectives, each Fund may seek to use derivatives to increase or decrease exposure to the following market risk factors:
| | |
| | • | Counterparty Risk – Counterparty risk is the risk that the counterparty (the party on the other side of the transaction) on a derivative transaction will be unable to honor its financial obligation to a Fixed Income Fund. |
96 | JUNE 30, 2013
| | |
| | • | Credit Risk – Credit risk is the risk an issuer will be unable to make principal and interest payments when due, or will default on its obligations. |
| |
| | • | Currency Risk – Currency risk is the risk that changes in the exchange rate between currencies will adversely affect the value (in U.S. dollar terms) of an investment. |
| |
| | • | Equity Risk – Equity risk relates to the change in value of equity securities as they relate to increases or decreases in the general market. |
| |
| | • | Index Risk – If the derivative is linked to the performance of an index, it will be subject to the risks associated with changes in that index. If the index changes, a Fixed Income Fund could receive lower interest payments or experience a reduction in the value of the derivative to below what the Fixed Income Fund paid. Certain indexed securities, including inverse securities (which move in an opposite direction to the index), may create leverage, to the extent that they increase or decrease in value at a rate that is a multiple of the changes in the applicable index. |
| |
| | • | Interest Rate Risk – Interest rate risk is the risk that the value of fixed-income securities will generally decline as prevailing interest rates rise, which may cause a Fixed Income Fund’s NAV to likewise decrease, and vice versa. |
| |
| | • | Leverage Risk – Leverage risk is the risk associated with certain types of leveraged investments or trading strategies pursuant to which relatively small market movements may result in large changes in the value of an investment. A Fixed Income Fund creates leverage by using borrowed capital to increase the amount invested, or investing in instruments, including derivatives, where the investment loss can exceed the original amount invested. Certain investments or trading strategies that involve leverage can result in losses that greatly exceed the amount originally invested. |
| |
| | • | Liquidity Risk – Liquidity risk is the risk that certain securities may be difficult or impossible to sell at the time that the seller would like or at the price that the seller believes the security is currently worth. |
Forward Foreign Currency Exchange Contracts
A forward foreign currency exchange contract (“forward currency contract”) is an obligation to buy or sell a specified currency at a future date at a negotiated rate (which may be U.S. dollars or a foreign currency). The Fixed Income Funds may enter into forward currency contracts for hedging purposes, including, but not limited to, reducing exposure to changes in foreign currency exchange rates on foreign portfolio holdings and locking in the U.S. dollar cost of firm purchase and sale commitments for securities denominated in or exposed to foreign currencies. The Fixed Income Funds may also invest in forward currency contracts for nonhedging purposes such as seeking to enhance returns. The Fixed Income Funds are subject to currency risk in the normal course of pursuing their investment objectives through their investments in forward currency contracts.
The gain or loss arising from the difference between the U.S. dollar cost of the original contract and the value of the foreign currency in U.S. dollars upon closing a contract is included in “Net realized gain/(loss) from investment and foreign currency transactions” on the Statements of Operations (if applicable).
The Fixed Income Funds do not require the counterparty to post collateral for forward currency contracts; however, the Fixed Income Funds will segregate cash or high-grade securities with their custodian in an amount at all times equal to or greater than the Fixed Income Funds’ commitment with respect to these contracts. Such segregated assets are denoted on the accompanying Schedules of Investments and are evaluated daily to ensure their market value equals or exceeds the current market value of the Fixed Income Funds’ corresponding forward currency contracts.
The following tables, grouped by derivative type, provide information about the fair value and location of derivatives within the Statements of Assets and Liabilities as of June 30, 2013.
Fair Value of Derivative Instruments as of June 30, 2013
| | | | | | | | | | | | | |
Derivatives not accounted for as
| | Asset Derivatives | | | Liability Derivatives | |
| hedging instruments | | Statements of Assets and Liabilities Location | | Fair Value | | | Statements of Assets and Liabilities Location | | Fair Value | |
| |
| |
Janus Global Bond Fund | | | | | | | | | | | | |
| |
| |
| Foreign Exchange Contracts | | Forward currency contracts | | $ | 454,158 | | | Forward currency contracts | | $ | 287,488 | |
| |
| |
| Total | | | | $ | 454,158 | | | | | $ | 287,488 | |
| |
| |
Janus Fixed Income & Money Market Funds | 97
Notes to Financial Statements (continued)
The following tables provide information about the effect of derivatives and hedging activities on the Funds’ Statements of Operations for the year ended June 30, 2013.
The effect of Derivative Instruments on the Statement of Operations for the year ended June 30, 2013
| | | | | | | | | | | | | | | | | | | | | |
| Amount of Realized Gain/(Loss) on Derivatives Recognized in Income | |
| | | | | | | | | | | | Forward Currency
| | | | |
| Derivatives not accounted for as hedging instruments | | Futures | | | Swaps | | | Options | | | Contracts | | | Total | |
| |
| |
Janus Global Bond Fund | | | | | | | | | | | | | | | | | | | | |
| |
| |
| Foreign Exchange Contracts | | $ | – | | | $ | – | | | $ | – | | | $ | (5,452,959 | ) | | $ | (5,452,959 | ) |
| |
| |
| Total | | $ | – | | | $ | – | | | $ | – | | | $ | (5,452,959 | ) | | $ | (5,452,959 | ) |
| |
| |
| | | | | | | | | | | | | | | | | | | | | |
| Change in Unrealized Appreciation/(Depreciation) on Derivatives Recognized in Income | |
| | | | | | | | | | | | Forward Currency
| | | | |
| Derivatives not accounted for as hedging instruments | | Futures | | | Swaps | | | Options | | | Contracts | | | Total | |
| |
| |
Janus Global Bond Fund | | | | | | | | | | | | | | | | | | | | |
| |
| |
| Foreign Exchange Contracts | | $ | – | | | $ | – | | | $ | – | | | $ | 148,352 | | | $ | 148,352 | |
| |
| |
| Total | | $ | – | | | $ | – | | | $ | – | | | $ | 148,352 | | | $ | 148,352 | |
| |
| |
Please see the Fund’s Statements of Operations for the Fund’s “Net Realized and Unrealized Gain/(Loss) on Investments.”
The value of derivative instruments at period end and the effect of derivatives on the Statements of Operations are indicative of the Fund’s volumes throughout the period.
| |
| 3. | Other investments and strategies |
Additional Investment Risk
The Fixed Income Funds may be invested in lower-rated debt securities that have a higher risk of default or loss of value since these securities may be sensitive to economic changes, political changes or adverse developments specific to the issuer.
The financial crisis that began in 2008 has caused a significant decline in the value and liquidity of many securities of issuers worldwide in the equity and fixed-income/credit markets. In response to the crisis, the United States and certain foreign governments, along with the U.S. Federal Reserve and certain foreign central banks have taken steps to support the financial markets. The withdrawal of this support, failure of efforts to respond to the crisis, or investor perception that such efforts are not succeeding each could also negatively affect financial markets generally, and the value and liquidity of specific securities. In addition, policy and legislative changes in the United States and in other countries are impacting many aspects of financial regulation. The effect of these changes on the markets, and the practical implications for market participants, including a Fund, may not be fully known for some time. Because the situation is unprecedented and widespread, it may also be unusually difficult to identify both investment risks and opportunities, which could limit or preclude a Fund’s ability to achieve its investment objective. Therefore, it is important to understand that the value of your investment may fall, sometimes sharply, and you could lose money.
The Dodd-Frank Wall Street Reform and Consumer Protection Act (the “Dodd-Frank Act”) in July 2010 is dramatically changing the way in which the U.S. financial system is supervised and regulated. The Dodd-Frank Act provides for widespread regulation of financial institutions, consumer financial products and services, broker-dealers, OTC derivatives, investment advisers, credit rating agencies, and mortgage lending, which expands federal oversight in the financial sector, including the investment management industry. Many provisions of the Dodd-Frank Act will be implemented through future rulemaking. Therefore, the ultimate impact of the Dodd-Frank Act and the regulations under the Dodd-Frank Act, on the Funds and the investment management industry as a whole, is not yet certain.
A number of countries in the European Union (“EU”) have experienced severe economic and financial difficulties. As a result, financial markets in the EU have been subject to extreme volatility and declines in asset values and liquidity. Responses to these financial problems by European governments, central banks, and others, including austerity measures and reforms, may not work, may result in social unrest, and may limit future growth and economic recovery or have other unintended consequences. Further defaults or restructuring by governments and others of their debt could have additional adverse effects on economies, financial markets, and asset valuations around the world.
Certain areas of the world have historically been prone to and economically sensitive to environmental events such as, but not limited to, hurricanes, earthquakes, typhoons, flooding, tidal waves, tsunamis, erupting volcanoes,
98 | JUNE 30, 2013
wildfires or droughts, tornadoes, mudslides, or other weather-related phenomena. Such disasters, and the resulting physical or economic damage, could have a severe and negative impact on a Fund’s investment portfolio and, in the longer term, could impair the ability of issuers in which the Fund invests to conduct their businesses as they would under normal conditions. Adverse weather conditions may also have a particularly significant negative effect on issuers in the agricultural sector and on insurance companies that insure against the impact of natural disasters.
Bank Loans
The Fixed Income Funds may invest in bank loans, which include institutionally traded floating and fixed-rate debt securities generally acquired as an assignment from another holder of, or participation interest in, loans originated by a bank or financial institution (the “Lender”) that acts as agent for all holders. Some bank loans may be purchased on a “when-issued” basis. The agent administers the terms of the loan, as specified in the loan agreement. When investing in a loan participation, a Fixed Income Fund has the right to receive payments of principal, interest and any fees to which it is entitled only from the Lender selling the loan agreement and only upon receipt by the Lender of payments from the borrower. The Fixed Income Funds generally have no right to enforce compliance with the terms of the loan agreement with the borrower. Assignments and participations involve credit, interest rate, and liquidity risk. Janus Global Bond Fund’s non-U.S. bank loan investments are subject to the risks of foreign investment, including Eurozone risk. Interest rates on floating rate securities adjust with interest rate changes and/or issuer credit quality, and unexpected changes in such rates could result in losses to a Fixed Income Fund. The interest rates paid on a floating rate security in which the Fixed Income Funds invest generally are readjusted periodically to an increment over a designated benchmark rate, such as the one-month, three-month, six-month, or one-year London Interbank Offered Rate (“LIBOR”). LIBOR is a short-term interest rate that banks charge one another and is generally representative of the most competitive and current cash rates.
The Fixed Income Funds may have difficulty trading assignments and participations to third parties. There may be restrictions on transfer and only limited opportunities may exist to sell such securities in secondary markets. As a result, the Fixed Income Funds may be unable to sell assignments or participations at the desired time or may be able to sell only at a price less than fair market value. The Fixed Income Funds utilize an independent third party to value individual bank loans on a daily basis.
The average monthly value of borrowings outstanding under bank loan arrangements and the related rate range during the year ended June 30, 2013 is indicated in the table below:
| | | | | | | | | |
| | | Average Monthly
| | | | |
| Fund | | Value | | Rates | | |
| |
| |
Fixed Income | | | | | | | | |
| Janus Flexible Bond Fund | | $ | 43,150,194 | | | 0.0000% - 5.2500% | | |
| Janus Global Bond Fund | | | 756,239 | | | 3.5000% - 4.5000% | | |
| Janus High-Yield Fund | | | 141,604,236 | | | 0.0000% - 12.5000% | | |
| Janus Short-Term Bond Fund | | | 16,868,228 | | | 1.4620% - 5.2500% | | |
| |
| |
Counterparties
Fund transactions involving a counterparty are subject to the risk that the counterparty or a third party will not fulfill its obligation to a Fund (“counterparty risk”). Counterparty risk may arise because of the counterparty’s financial condition (i.e., financial difficulties, bankruptcy, or insolvency), market activities and developments, or other reasons, whether foreseen or not. A counterparty’s inability to fulfill its obligation may result in significant financial loss to a Fund. A Fund may be unable to recover its investment from the counterparty or may obtain a limited recovery, and/or recovery may be delayed. The extent of a Fund’s exposure to counterparty risk in respect to financial assets approximates its carrying value as recorded on the Fund’s Statement of Assets and Liabilities.
A Fund may be exposed to counterparty risk through participation in various programs including, but not limited to, lending its securities to third parties, cash sweep arrangements whereby a Fund’s cash balance is invested in one or more types of cash management vehicles, as well as investments in, but not limited to, repurchase agreements, debt securities, and derivatives, including various types of swaps, futures and options. A Fund intends to enter into financial transactions with counterparties that Janus Capital believes to be creditworthy at the time of the transaction. There is always the risk that Janus Capital’s analysis of a counterparty’s creditworthiness is incorrect or may change due to market conditions. To the extent that a Fund focuses its transactions with a limited number of counterparties, it will have greater exposure to the risks associated with one or more counterparties.
Floating Rate Loans
The Fixed Income Funds may invest in secured and unsecured floating rate loans. Floating rate loans are debt securities that have floating interest rates, that adjust periodically, and are tied to a benchmark lending rate, such as LIBOR. In other cases, the lending rate could be tied to the prime rate offered by one or more major U.S. banks or the rate paid on large certificates of deposit
Janus Fixed Income & Money Market Funds | 99
Notes to Financial Statements (continued)
traded in the secondary markets. If the benchmark lending rate changes, the rate payable to lenders under the loan will change at the next scheduled adjustment date specified in the loan agreement. Floating rate loans are typically issued to companies (“borrowers”) in connection with recapitalizations, acquisitions, and refinancings. Floating rate loan investments are generally below investment grade. Senior floating rate loans are secured by specific collateral of a borrower and are senior in the borrower’s capital structure. The senior position in the borrower’s capital structure generally gives holders of senior loans a claim on certain of the borrower’s assets that is senior to subordinated debt and preferred and common stock in the case of a borrower’s default. Floating rate loan investments may involve foreign borrowers, and investments may be denominated in foreign currencies. Floating rate loans often involve borrowers whose financial condition is troubled or uncertain and companies that are highly leveraged. The Fixed Income Funds may invest in obligations of borrowers who are in bankruptcy proceedings. While the Fixed Income Funds generally expect to invest in fully funded term loans, certain of the loans in which the Fixed Income Funds may invest include revolving loans, bridge loans, and delayed draw term loans.
Purchasers of floating rate loans may pay and/or receive certain fees. The Fixed Income Funds may receive fees such as covenant waiver fees or prepayment penalty fees. A Fixed Income Fund may pay fees such as facility fees. Such fees may affect the Fixed Income Fund’s return.
Mortgage- and Asset-Backed Securities
The Funds may purchase fixed or variable rate mortgage-backed securities issued by the Government National Mortgage Association (“Ginnie Mae”), the Federal National Mortgage Association (“Fannie Mae”), the Federal Home Loan Mortgage Corporation (“Freddie Mac”), or other governmental or government-related entities. Ginnie Mae’s guarantees are backed by the full faith and credit of the U.S. Government. Historically, Fannie Maes and Freddie Macs were not backed by the full faith and credit of the U.S. Government, and may not be in the future. In September 2008, the Federal Housing Finance Agency (“FHFA”), an agency of the U.S. Government, placed Fannie Mae and Freddie Mac under conservatorship. Under the conservatorship, the management of Fannie Mae and Freddie Mac was replaced. Since 2008, Fannie Mae and Freddie Mac have received capital support through U.S. Treasury preferred stock purchases, and Treasury and Federal Reserve purchases of their mortgage-backed securities. The FHFA and the U.S. Treasury have imposed strict limits on the size of these entities’ mortgage portfolios. The FHFA has the power to cancel any contract entered into by Fannie Mae and Freddie Mac prior to FHFA’s appointment as conservator or receiver, including the guarantee obligations of Fannie Mae and Freddie Mac.
The Funds may purchase other mortgage- and asset-backed securities through single- and multi-seller conduits, collateralized debt obligations, structured investment vehicles, and other similar securities. Asset-backed securities may be backed by automobile loans, equipment leases, credit card receivables, or other collateral. In the event the underlying assets fail to perform, these investment vehicles could be forced to sell the assets and recognize losses on such assets, which could impact the Funds’ yield and your return.
Unlike traditional debt instruments, payments on these securities include both interest and a partial payment of principal. Prepayment risk, which results from prepayments of the principal of underlying loans at a faster pace than expected, may shorten the effective maturities of these securities and may result in a Fund having to reinvest proceeds at a lower interest rate.
In addition to prepayment risk, investments in mortgage-backed securities, including those comprised of subprime mortgages, and investments in other asset-backed securities comprised of under-performing assets may be subject to a higher degree of credit risk, valuation risk, and liquidity risk. Additionally, although mortgages and mortgage-related securities are generally supported by some form of government or private guarantee and/or insurance, there is no assurance that private guarantors or insurers will meet their obligations.
Mortgage- and asset-backed securities are also subject to extension risk, which is the risk that rising interest rates could cause mortgages or other obligations underlying these securities to be paid more slowly than expected, increasing the Funds’ sensitivity to interest rate changes and causing its price to decline.
Real Estate Investing
The Fixed Income Funds may invest in equity and debt securities of real estate-related companies. Such companies may include those in the real estate industry or real estate-related industries. These securities may include corporate bonds, preferred stocks, and other securities, including, but not limited to, mortgage-backed securities, real estate-backed securities, securities of REITs and similar REIT-like entities. A REIT is a trust that invests in real estate-related projects, such as properties, mortgage loans, and construction loans. REITs are generally categorized as equity, mortgage, or hybrid REITs. A REIT may be listed on an exchange or traded OTC.
100 | JUNE 30, 2013
Restricted Security Transactions
Restricted securities held by the Funds may not be sold except in exempt transactions or in a public offering registered under the Securities Act of 1933, as amended. The risk of investing in such securities is generally greater than the risk of investing in the securities of widely held, publicly traded companies. Lack of a secondary market and resale restrictions may result in the inability of the Funds to sell a security at a fair price and may substantially delay the sale of the security. In addition, these securities may exhibit greater price volatility than securities for which secondary markets exist.
Sovereign Debt
A Fund may invest in U.S. and foreign government debt securities (“sovereign debt”). Investments in U.S. sovereign debt are considered low risk. However, investments in non-U.S. sovereign debt can involve a high degree of risk, including the risk that the governmental entity that controls the repayment of sovereign debt may not be willing or able to repay the principal and/or to pay the interest on its sovereign debt in a timely manner. A sovereign debtor’s willingness or ability to satisfy its debt obligation may be affected by various factors, including its cash flow situation, the extent of its foreign currency reserves, the availability of foreign exchange when a payment is due, the relative size of its debt position in relation to its economy as a whole, the sovereign debtor’s policy toward international lenders, and local political constraints to which the governmental entity may be subject. Sovereign debtors may also be dependent on expected disbursements from foreign governments, multilateral agencies, and other entities. The failure of a sovereign debtor to implement economic reforms, achieve specified levels of economic performance, or repay principal or interest when due may result in the cancellation of third party commitments to lend funds to the sovereign debtor, which may further impair such debtor’s ability or willingness to timely service its debts. A Fund may be requested to participate in the rescheduling of such sovereign debt and to extend further loans to governmental entities, which may adversely affect the Fund’s holdings. In the event of default, there may be limited or no legal remedies for collecting sovereign debt and there may be no bankruptcy proceedings through which the Fund may collect all or part of the sovereign debt that a governmental entity has not repaid.
When-Issued Securities
The Funds may purchase or sell securities on a when-issued or delayed delivery basis. When-issued and delayed delivery securities in which the Funds may invest include U.S. Treasury Securities, municipal bonds, bank loans, and other similar instruments. The price of the underlying securities and date when the securities will be delivered and paid for are fixed at the time the transaction is negotiated. Losses may arise due to changes in the market value of the securities or from the inability of counterparties to meet the terms of the contract. In connection with such purchases, the Funds may hold liquid assets as collateral with the Funds’ custodian sufficient to cover the purchase price.
| |
| 4. | Investment Advisory Agreements and Other Transactions with Affiliates |
Each Fund pays Janus Capital an investment advisory fee which is calculated daily and paid monthly. The following table reflects each Fund’s contractual investment advisory fee rate (expressed as an annual rate).
| | | | | | | | | |
| | | | | Contractual
| | |
| | | | | Investment
| | |
| | | Average
| | Advisory
| | |
| | | Daily Net Assets
| | Fee (%)
| | |
| Fund | | of the Fund | | (annual rate) | | |
| |
| |
Fixed Income | | | | | | | | |
| Janus Flexible Bond Fund | | First $ | 300 Million | | | 0.50 | | |
| | | Over $ | 300 Million | | | 0.40 | | |
| Janus Global Bond Fund | | First $ | 1 Billion | | | 0.60 | | |
| | | Next $ | 1 Billion | | | 0.55 | | |
| | | Over $ | 2 Billion | | | 0.50 | | |
| Janus High-Yield Fund | | First $ | 300 Million | | | 0.65 | | |
| | | Over $ | 300 Million | | | 0.55 | | |
| Janus Short-Term Bond Fund | | First $ | 300 Million | | | 0.64 | | |
| | | Over $ | 300 Million | | | 0.54 | | |
Money Market | | | | | | | | |
Janus Government Money
Market Fund | | | All Asset Levels | | | 0.20 | | |
| Janus Money Market Fund | | | All Asset Levels | | | 0.20 | | |
| |
| |
Class D Shares and Class T Shares of each Money Market Fund compensate Janus Capital an administration fee at an annual rate of 0.46% and 0.48%, respectively, of average daily net assets. Janus Capital may voluntarily waive and/or reimburse administration fees to the extent necessary to assist the Money Market Funds in attempting to maintain a yield of at least 0.00%. These waivers and reimbursements are voluntary and could change or be terminated at any time at the discretion of Janus Capital. There is no guarantee that the Money Market Funds will maintain a positive yield.
Janus Services LLC (“Janus Services”), a wholly-owned subsidiary of Janus Capital, is the Funds’ transfer agent. In addition, Janus Services provides or arranges for the provision of certain other administrative services including, but not limited to, recordkeeping, accounting, order processing, and other shareholder services for the Funds.
Certain, but not all, intermediaries charge administrative fees to investors in Class A Shares, Class C Shares, and Class I Shares of the Fixed Income Funds for administrative services provided on behalf of such
Janus Fixed Income & Money Market Funds | 101
Notes to Financial Statements (continued)
investors. These administrative fees are paid by the Class A Shares, Class C Shares, and Class I Shares of the Funds to Janus Services, which uses such fees to reimburse intermediaries. Consistent with the Transfer Agency Agreement between Janus Services and the Funds, Janus Services may negotiate the level, structure, and/or terms of the administrative fees with intermediaries requiring such fees on behalf of the Funds. Janus Capital and its affiliates benefit from an increase in assets that may result from such relationships.
Class D Shares pay an annual administrative services fee of 0.12% of net assets. These administrative services fees are paid by Class D Shares for shareholder services provided by Janus Services.
Janus Services receives an administrative services fee at an annual rate of up to 0.25% of the average daily net assets of Class R Shares, Class S Shares and Class T Shares of the Fixed Income Funds for providing or procuring administrative services to investors in Class R Shares, Class S Shares and Class T Shares of the Funds. Janus Services expects to use all or a significant portion of this fee to compensate retirement plan service providers, broker-dealers, bank trust departments, financial advisors, and other financial intermediaries for providing these services. Janus Services or its affiliates may also pay fees for services provided by intermediaries to the extent the fees charged by intermediaries exceed the 0.25% of net assets charged to Class R Shares, Class S Shares, and Class T Shares of each Fund. Janus Services may keep certain amounts retained for reimbursement of out-of-pocket costs incurred for servicing clients of Class R Shares, Class S Shares, and Class T Shares.
Services provided by these financial intermediaries may include, but are not limited to, recordkeeping, subaccounting, order processing, providing order confirmations, periodic statements, forwarding prospectuses, shareholder reports, and other materials to existing customers, answering inquiries regarding accounts, and other administrative services. Order processing includes the submission of transactions through the National Securities Clearing Corporation (“NSCC”) or similar systems, or those processed on a manual basis with Janus Capital.
Janus Services is compensated for its services related to Class D Shares, and receives reimbursement for its out-of-pocket costs on all other share classes. Included in out-of-pocket expenses are the expenses Janus Services incurs for serving as transfer agent and providing servicing to shareholders.
Janus Distributors LLC (“Janus Distributors”), a wholly-owned subsidiary of Janus Capital, is the distributor of the Funds. The Funds have adopted a Distribution and Shareholder Servicing Plan (the “Plan”) pursuant to Rule 12b-1 under the 1940 Act. The Plan authorizes payments by the Fixed Income Funds to intermediaries at an annual rate, as determined from time to time by the Board of Trustees, of up to 0.25% of the Class A Shares average daily net assets, of up to 1.00% of the Class C Shares average daily net assets, of up to 0.50% of the Class R Shares average daily net assets, and of up to 0.25% of the Class S Shares average daily net assets. Payments under the Plan are not tied exclusively to actual distribution and shareholder service expenses, and the payments may exceed distribution and shareholder service expenses actually incurred by the Funds. If any of a Fund’s actual distribution and shareholder service expenses incurred during a calendar year are less than the payments made during a calendar year, the Fund will be refunded the difference. Refunds, if any, are included in “Distribution fees and shareholder servicing fees” in the Statements of Operations.
Janus Capital has contractually agreed to waive the advisory fee payable by each Fixed Income Fund listed below in an amount equal to the amount, if any, that the Fund’s normal operating expenses in any fiscal year, including the investment advisory fee, but excluding the distribution and shareholder servicing fees (applicable to Class A Shares, Class C Shares, Class R Shares, and Class S Shares), administrative services fees payable pursuant to the Transfer Agency Agreement, brokerage commissions, interest, dividends, taxes, acquired fund fees and expenses, and extraordinary expenses, exceed the annual rates shown below. Janus Capital has agreed to continue each waiver until at least November 1, 2013. If applicable, amounts reimbursed to the Funds by Janus Capital are disclosed as “Excess Expense Reimbursement” on the Statements of Operations.
| | | | | | |
| | | Expense
| | |
| Fund | | Limit (%) | | |
| |
| |
Fixed Income | | | | | |
| Janus Flexible Bond Fund | | | 0.55 | | |
| Janus Global Bond Fund | | | 0.75 | | |
| Janus High-Yield Fund | | | 0.78 | | |
| Janus Short-Term Bond Fund | | | 0.55 | | |
| |
| |
For a period of three years subsequent to Janus Global Bond Fund’s commencement of operations or until the Fund’s assets exceed the first breakpoint in the investment advisory fee schedule, whichever occurs first, Janus Capital may recover from the Fund fees and expenses previously waived or reimbursed, which could then be considered a deferral, if the Fund’s expense ratio, including recovered expenses, falls below the expense limit. The recoupment of such reimbursements expires December 28, 2013. For the year ended June 30, 2013, total reimbursement by Janus Capital was $40,750, which includes a $17,351 recoupment for Class I Shares of the
102 | JUNE 30, 2013
Fund. As of June 30, 2013, the aggregate amount of recoupment that may potentially be made to Janus Capital is $345,576.
The Board of Trustees has adopted a deferred compensation plan (the “Deferred Plan”) for independent Trustees to elect to defer receipt of all or a portion of the annual compensation they are entitled to receive from the Funds. All deferred fees are credited to an account established in the name of the Trustees. The amounts credited to the account then increase or decrease, as the case may be, in accordance with the performance of one or more of the Janus funds that are selected by the Trustees. The account balance continues to fluctuate in accordance with the performance of the selected fund or funds until final payment of all amounts are credited to the account. The fluctuation of the account balance is recorded by the Funds as unrealized appreciation/(depreciation) and is shown as of June 30, 2013 on the Statements of Assets and Liabilities as an asset, “Non-interested Trustees’ deferred compensation,” and a liability, “Non-interested Trustees’ deferred compensation fees.” Additionally, the recorded unrealized appreciation/(depreciation) is included in “Unrealized net appreciation/(depreciation) of investments, foreign currency translations and non-interested Trustees’ deferred compensation” for the Fixed Income Funds, and “Unrealized net appreciation/(depreciation) of investments for non-interested Trustees’ deferred compensation” for the Money Market Funds on the Statements of Assets and Liabilities. Deferred compensation expenses for the year ended June 30, 2013 are included in “Non-interested Trustees’ fees and expenses” on the Statements of Operations. Trustees are allowed to change their designation of mutual funds from time to time. Amounts will be deferred until distributed in accordance with the Deferred Plan. Deferred fees of $243,941 were paid by the Trust to a Trustee under the Deferred Plan during the year ended June 30, 2013.
Certain officers of the Funds may also be officers and/or directors of Janus Capital. Each Fund pays for the salaries, fees, and expenses of certain Janus Capital employees and Fund officers, with respect to certain specified administration functions they perform on behalf of the Funds. Administration costs are separate and apart from advisory fees and other expenses paid in connection with the investment advisory services Janus Capital provides to each Fund. Some expenses related to compensation payable to the Funds’ Chief Compliance Officer and compliance staff are shared with the Funds. Total compensation of $487,826 was paid to the Chief Compliance Officer and certain compliance staff by the Trust during the year ended June 30, 2013. Each Fund’s portion is reported as part of “Other Expenses” on the Statements of Operations.
Class A Shares of Janus Flexible Bond Fund, Janus Global Bond Fund and Janus High-Yield Fund include a 4.75% upfront sales charge of the offering price. Class A Shares of Janus Short-Term Bond Fund include a 2.50% upfront sales charge of the offering price. The sales charge is allocated between Janus Distributors and financial intermediaries. During the year ended June 30, 2013, Janus Distributors retained the following upfront sales charges:
| | | | | | |
| | | Upfront
| | |
| Fund (Class A Shares) | | Sales Charge | | |
| |
| |
Fixed Income | | | | | |
| Janus Flexible Bond Fund | | $ | 75,594 | | |
| Janus Global Bond Fund | | | 321 | | |
| Janus High-Yield Fund | | | 22,942 | | |
| Janus Short-Term Bond Fund | | | 16,895 | | |
| |
| |
A contingent deferred sales charge (“CDSC”) of 1.00% will be deducted with respect to Class A Shares purchased without a sales load and redeemed within 12 months of purchase, unless waived, as discussed in the Prospectus. Any applicable CDSC will be 1.00% of the lesser of the original purchase price or the value of the redemption of the Class A Shares redeemed. During the year ended June 30, 2013, redeeming shareholders of Class A Shares paid the following CDSCs to Janus Distributors:
| | | | | | |
| Fund (Class A Shares) | | CDSC | | |
| |
| |
Fixed Income | | | | | |
| Janus Flexible Bond Fund | | $ | 10,745 | | |
| Janus High-Yield Fund | | | 1,700 | | |
| Janus Short-Term Bond Fund | | | 9,000 | | |
| |
| |
Class C Shares include a 1.00% CDSC paid by redeeming shareholders to Janus Distributors. The CDSC applies to shares redeemed within 12 months of purchase. The redemption price may differ from the NAV per share. During the year ended June 30, 2013, redeeming shareholders of Class C Shares paid the following CDSCs:
| | | | | | |
| Fund (Class C Shares) | | CDSC | | |
| |
| |
Fixed Income | | | | | |
| Janus Flexible Bond Fund | | $ | 96,964 | | |
| Janus Global Bond Fund | | | 107 | | |
| Janus High-Yield Fund | | | 10,991 | | |
| Janus Short-Term Bond Fund | | | 15,362 | | |
| |
| |
The Fixed Income Funds’ expenses may be reduced by expense offsets from an unaffiliated custodian and/or transfer agent. Such credits or offsets are included in “Expense and Fee Offset” on the Statements of Operations (if applicable). The Funds could have employed the assets used by the custodian and/or transfer agent to
Janus Fixed Income & Money Market Funds | 103
Notes to Financial Statements (continued)
produce income if they had not entered into an expense offset arrangement.
Pursuant to the provisions of the 1940 Act and rules promulgated thereunder, the Fixed Income Funds may participate in an affiliated or nonaffiliated cash sweep program. In the cash sweep program, uninvested cash balances of the Funds may be used to purchase shares of affiliated or nonaffiliated money market funds or cash management pooled investment vehicles. The Funds are eligible to participate in the cash sweep program (the “Investing Funds”). Janus Cash Liquidity Fund LLC is an affiliated unregistered cash management pooled investment vehicle that invests primarily in highly-rated short-term fixed-income securities. Janus Cash Liquidity Fund LLC currently maintains a NAV of $1.00 per share and distributes income daily in a manner consistent with a registered 2a-7 product. There are no restrictions on the Funds’ ability to withdraw investments from Janus Cash Liquidity Fund LLC at will, and there are no unfunded capital commitments due from the Funds to Janus Cash Liquidity Fund LLC. As adviser, Janus Capital has an inherent conflict of interest because of its fiduciary duties to the affiliated cash management pooled investment vehicles and the Investing Funds.
During the year ended June 30, 2013, any recorded distributions from affiliated investments as affiliated dividend income, and affiliated purchases and sales can be found in the Notes to Schedules of Investments and Other Information.
Janus Capital or an affiliate invested and/or redeemed initial seed capital during the year ended June 30, 2013, as indicated in the following table.
| | | | | | | | | | | | | | | | | | | | | |
| | | Seed
| | | | | | | | | | Seed
| | |
| | | Capital at
| | | | Date of
| | | | Date of
| | Capital at
| | |
| Fund | | 6/30/12 | | Purchases | | Purchases | | Redemptions | | Redemptions | | 6/30/13 | | |
| |
| |
Fixed Income | | | | | | | | | | | | | | | | | | | | |
| Janus Flexible Bond Fund - Class N Shares | | $ | 10,000 | | $ | – | | | – | | $ | (10,000) | | | 9/20/12 | | $ | – | | |
| Janus Global Bond Fund - Class A Shares | | | 833,333 | | | – | | | – | | | – | | | – | | | 833,333 | | |
| Janus Global Bond Fund - Class C Shares | | | 833,334 | | | – | | | – | | | – | | | – | | | 833,334 | | |
| Janus Global Bond Fund - Class D Shares | | | 833,333 | | | – | | | – | | | – | | | – | | | 833,333 | | |
| Janus Global Bond Fund - Class I Shares | | | 833,333 | | | – | | | – | | | – | | | – | | | 833,333 | | |
| Janus Global Bond Fund - Class S Shares | | | 833,334 | | | – | | | – | | | – | | | – | | | 833,334 | | |
| Janus Global Bond Fund - Class T Shares | | | 833,333 | | | – | | | – | | | – | | | – | | | 833,333 | | |
| Janus High-Yield Fund - Class N Shares | | | 50,000 | | | – | | | – | | | (50,000) | | | 9/20/12 | | | – | | |
| Janus Short-Term Bond Fund - Class N Shares | | | 10,000 | | | – | | | – | | | (10,000) | | | 9/20/12 | | | – | | |
| |
| |
The tax components of capital shown in the table below represent: (1) distribution requirements the Funds must satisfy under the income tax regulations; (2) losses or deductions the Funds may be able to offset against income and gains realized in future years; and (3) unrealized appreciation or depreciation of investments for federal income tax purposes.
Other book to tax differences may consist of deferred compensation, derivatives and foreign currency contract adjustments. The Funds have elected to treat gains and losses on forward foreign currency contracts as capital gains and losses, if applicable. Other foreign currency gains and losses on debt instruments are treated as ordinary income for federal income tax purposes pursuant to Section 988 of the Internal Revenue Code.
104 | JUNE 30, 2013
The Funds have elected to defer post-October losses and qualified late-year losses as noted in the table below. These losses will be deferred for tax purposes and recognized during the next fiscal year.
| | | | | | | | | | | | | | | | | | | | | | | | |
| | | Undistributed
| | Undistributed
| | | | Loss Deferrals | | Other Book
| | Net Tax
| | |
| | | Ordinary
| | Long-Term
| | Accumulated
| | Late-Year
| | Post-October
| | to Tax
| | Appreciation/
| | |
| Fund | | Income | | Gains | | Capital Losses | | Ordinary Loss | | Capital Loss | | Differences | | (Depreciation) | | |
| |
| |
Fixed Income | | | | | | | | | | | | | | | | | | | | | | | |
| Janus Flexible Bond Fund | | $ | 202,985 | | $ | 65,122,462 | | $ | – | | $ | – | | $ | (37,348,756) | | $ | (99,330) | | $ | 982,175 | | |
| Janus Global Bond Fund | | | – | | | – | | | – | | | – | | | (5,907,478) | | | 58,951 | | | (4,428,337) | | |
| Janus High-Yield Fund | | | 1,952,217 | | | 53,915,439 | | | – | | | – | | | – | | | (37,470) | | | 20,457,834 | | |
| Janus Short-Term Bond Fund | | | 760,011 | | | 6,978,385 | | | – | | | – | | | – | | | (48,614) | | | 1,061,701 | | |
Money Market | | | | | | | | | | | | | | | – | | | | | | | | |
| Janus Government Money Market Fund | | | – | | | – | | | – | | | – | | | – | | | – | | | – | | |
| Janus Money Market Fund | | | – | | | – | | | – | | | – | | | – | | | – | | | – | | |
| |
| |
During the year ended June 30, 2013, the following capital loss carryovers were utilized by the Funds as indicated in the table:
| | | | | | | | | |
| | | | | Capital Loss
| | |
| Fund | | | | Carryover Utilized | | |
| |
| |
Fixed Income | | | | | | | | |
| Janus High-Yield Fund | | | | | $ | 21,279,803 | | |
| |
| |
The aggregate cost of investments and the composition of unrealized appreciation and depreciation of investment securities for federal income tax purposes as of June 30, 2013 are noted below.
Unrealized appreciation and unrealized depreciation in the table below exclude appreciation/(depreciation) on foreign currency translations. The primary difference between book and tax appreciation or depreciation of investments is wash sale loss deferrals.
| | | | | | | | | | | | |
| | | Federal Tax
| | Unrealized
| | Unrealized
| | |
| Fund | | Cost | | Appreciation | | (Depreciation) | | |
| |
| |
Fixed Income | | | | | | | | | | | |
| Janus Flexible Bond Fund | | $ | 6,152,098,956 | | $ | 79,865,429 | | $ | (78,883,254) | | |
| Janus Global Bond Fund | | | 264,473,862 | | | 510,281 | | | (4,938,618) | | |
| Janus High-Yield Fund | | | 2,273,301,668 | | | 56,652,817 | | | (36,194,983) | | |
| Janus Short-Term Bond Fund | | | 3,003,030,989 | | | 18,125,740 | | | (17,064,039) | | |
Money Market | | | | | | | | | | | |
| Janus Government Money Market Fund | | | 181,934,048 | | | – | | | – | | |
| Janus Money Market Fund | | | 1,268,289,981 | | | – | | | – | | |
| |
| |
Income and capital gains distributions are determined in accordance with income tax regulations that may differ from accounting principles generally accepted in the United States of America. These differences are due to differing treatments for items such as net short-term gains, deferral of wash sale losses, foreign currency transactions, net investment losses and capital loss carryovers. Certain permanent differences such as tax returns of capital and net investment losses noted below have been reclassified to paid-in capital.
For the year ended June 30, 2013
| | | | | | | | | | | | | | | | | | |
| | | Distributions | | | | | | |
| | | From Ordinary
| | From Long-Term
| | Tax Return of
| | Net Investment
| | | | |
| Fund | | Income | | Capital Gains | | Capital | | Loss | | | | |
| |
| |
Fixed Income | | | | | | | | | | | | | | | | | |
| Janus Flexible Bond Fund | | $ | 230,953,981 | | $ | 53,752,539 | | $ | – | | $ | – | | | | | |
| Janus Global Bond Fund | | | 1,704,541 | | | 259,818 | | | 1,705,596 | | | – | | | | | |
| Janus High-Yield Fund | | | 151,863,944 | | | 3,616,537 | | | – | | | – | | | | | |
| Janus Short-Term Bond Fund | | | 53,934,259 | | | 13,365,749 | | | – | | | – | | | | | |
Money Market | | | | | | | | | | | | | | | | | |
| Janus Government Money Market Fund | | | 9,603 | | | – | | | – | | | – | | | | | |
| Janus Money Market Fund | | | 59,731 | | | – | | | – | | | – | | | | | |
| |
| |
Janus Fixed Income & Money Market Funds | 105
Notes to Financial Statements (continued)
For the year ended June 30, 2012
| | | | | | | | | | | | | | | | | | |
| | | Distributions | | | | | | |
| | | From Ordinary
| | From Long-Term
| | Tax Return of
| | Net Investment
| | | | |
| Fund | | Income | | Capital Gains | | Capital | | Loss | | | | |
| |
| |
Fixed Income | | | | | | | | | | | | | | | | | |
| Janus Flexible Bond Fund | | $ | 158,841,026 | | $ | 48,540,213 | | $ | – | | $ | – | | | | | |
| Janus Global Bond Fund | | | 1,179,595 | | | 29,065 | | | – | | | – | | | | | |
| Janus High-Yield Fund | | | 137,735,074 | | | – | | | – | | | – | | | | | |
| Janus Short-Term Bond Fund | | | 59,025,940 | | | 5,577,239 | | | – | | | – | | | | | |
Money Market | | | | | | | | | | | | | | | | | |
| Janus Government Money Market Fund | | | 7,991 | | | – | | | – | | | – | | | | | |
| Janus Money Market Fund | | | 63,586 | | | – | | | – | | | – | | | | | |
| |
| |
| |
| 6. | Capital Share Transactions |
| | | | | | | | | | | | | | | | | | | |
| | | Janus Flexible
| | Janus Global
| | |
For each year ended June 30 (all numbers in thousands)
| | Bond Fund | | Bond Fund | | |
| Fixed Income | | 2013 | | 2012(1) | | 2013 | | 2012 | | |
| |
| Transactions in Fund Shares – Class A Shares: | | | | | | | | | | | | | | | | | | |
| Shares sold | | | 29,877 | | | | 37,728 | | | | 179 | | | | 428 | | | |
| Reinvested dividends and distributions | | | 3,251 | | | | 2,180 | | | | 23 | | | | 12 | | | |
| Shares repurchased | | | (28,864) | | | | (13,593) | | | | (218) | | | | (67) | | | |
| Net Increase/(Decrease) in Fund Shares | | | 4,264 | | | | 26,315 | | | | (16) | | | | 373 | | | |
| Shares Outstanding, Beginning of Period | | | 64,320 | | | | 38,005 | | | | 488 | | | | 115 | | | |
| Shares Outstanding, End of Period | | | 68,584 | | | | 64,320 | | | | 472 | | | | 488 | | | |
| Transactions in Fund Shares – Class C Shares: | | | | | | | | | | | | | | | | | | |
| Shares sold | | | 14,138 | | | | 18,903 | | | | 30 | | | | 93 | | | |
| Reinvested dividends and distributions | | | 1,277 | | | | 855 | | | | 9 | | | | 4 | | | |
| Shares repurchased | | | (13,440) | | | | (5,984) | | | | (51) | | | | (42) | | | |
| Net Increase/(Decrease) in Fund Shares | | | 1,975 | | | | 13,774 | | | | (12) | | | | 55 | | | |
| Shares Outstanding, Beginning of Period | | | 39,245 | | | | 25,471 | | | | 180 | | | | 125 | | | |
| Shares Outstanding, End of Period | | | 41,220 | | | | 39,245 | | | | 168 | | | | 180 | | | |
| Transactions in Fund Shares – Class D Shares: | | | | | | | | | | | | | | | | | | |
| Shares sold | | | 11,530 | | | | 17,640 | | | | 547 | | | | 1,331 | | | |
| Reinvested dividends and distributions | | | 3,516 | | | | 3,239 | | | | 58 | | | | 37 | | | |
| Shares repurchased | | | (17,510) | | | | (12,010) | | | | (580) | | | | (861) | | | |
| Net Increase/(Decrease) in Fund Shares | | | (2,464) | | | | 8,869 | | | | 25 | | | | 507 | | | |
| Shares Outstanding, Beginning of Period | | | 73,979 | | | | 65,110 | | | | 978 | | | | 471 | | | |
| Shares Outstanding, End of Period | | | 71,515 | | | | 73,979 | | | | 1,003 | | | | 978 | | | |
| Transactions in Fund Shares – Class I Shares: | | | | | | | | | | | | | | | | | | |
| Shares sold | | | 187,123 | | | | 97,752 | | | | 22,938 | | | | 526 | | | |
| Reinvested dividends and distributions | | | 8,092 | | | | 6,208 | | | | 240 | | | | 45 | | | |
| Shares repurchased | | | (73,140) | | | | (64,699) | | | | (794) | | | | (168) | | | |
| Net Increase/(Decrease) in Fund Shares | | | 122,075 | | | | 39,261 | | | | 22,384 | | | | 403 | | | |
| Shares Outstanding, Beginning of Period | | | 155,937 | | | | 116,676 | | | | 1,415 | | | | 1,012 | | | |
| Shares Outstanding, End of Period | | | 278,012 | | | | 155,937 | | | | 23,799 | | | | 1,415 | | | |
| Transactions in Fund Shares – Class N Shares: | | | | | | | | | | | | | | | | | | |
| Shares sold | | | 5,881 | | | | 23,688 | | | | N/A | | | | N/A | | | |
| Reinvested dividends and distributions | | | 1,056 | | | | 50 | | | | N/A | | | | N/A | | | |
| Shares repurchased | | | (24,143) | | | | (362) | | | | N/A | | | | N/A | | | |
| Net Increase/(Decrease) in Fund Shares | | | (17,206) | | | | 23,376 | | | | N/A | | | | N/A | | | |
| Shares Outstanding, Beginning of Period | | | 23,376 | | | | N/A | | | | N/A | | | | N/A | | | |
| Shares Outstanding, End of Period | | | 6,170 | | | | 23,376 | | | | N/A | | | | N/A | | | |
106 | JUNE 30, 2013
| | | | | | | | | | | | | | | | | | | |
| | | Janus Flexible
| | Janus Global
| | |
For each year ended June 30 (all numbers in thousands)
| | Bond Fund | | Bond Fund | | |
| Fixed Income | | 2013 | | 2012(1) | | 2013 | | 2012 | | |
| |
| Transactions in Fund Shares – Class R Shares: | | | | | | | | | | | | | | | | | | |
| Shares sold | | | 1,595 | | | | 2,108 | | | | N/A | | | | N/A | | | |
| Reinvested dividends and distributions | | | 104 | | | | 45 | | | | N/A | | | | N/A | | | |
| Shares repurchased | | | (1,249) | | | | (646) | | | | N/A | | | | N/A | | | |
| Net Increase/(Decrease) in Fund Shares | | | 450 | | | | 1,507 | | | | N/A | | | | N/A | | | |
| Shares Outstanding, Beginning of Period | | | 2,416 | | | | 909 | | | | N/A | | | | N/A | | | |
| Shares Outstanding, End of Period | | | 2,866 | | | | 2,416 | | | | N/A | | | | N/A | | | |
| Transactions in Fund Shares – Class S Shares: | | | | | | | | | | | | | | | | | | |
| Shares sold | | | 2,988 | | | | 3,686 | | | | – | | | | – | | | |
| Reinvested dividends and distributions | | | 327 | | | | 285 | | | | 5 | | | | 3 | | | |
| Shares repurchased | | | (2,985) | | | | (2,619) | | | | – | | | | – | | | |
| Net Increase/(Decrease) in Fund Shares | | | 330 | | | | 1,352 | | | | 5 | | | | 3 | | | |
| Shares Outstanding, Beginning of Period | | | 6,833 | | | | 5,481 | | | | 87 | | | | 84 | | | |
| Shares Outstanding, End of Period | | | 7,163 | | | | 6,833 | | | | 92 | | | | 87 | | | |
| Transactions in Fund Shares – Class T Shares: | | | | | | | | | | | | | | | | | | |
| Shares sold | | | 40,745 | | | | 65,547 | | | | 743 | | | | 185 | | | |
| Reinvested dividends and distributions | | | 5,907 | | | | 4,605 | | | | 18 | | | | 14 | | | |
| Shares repurchased | | | (54,187) | | | | (26,888) | | | | (278) | | | | (829) | | | |
| Net Increase/(Decrease) in Fund Shares | | | (7,535) | | | | 43,264 | | | | 483 | | | | (630) | | | |
| Shares Outstanding, Beginning of Period | | | 118,628 | | | | 75,364 | | | | 221 | | | | 851 | | | |
| Shares Outstanding, End of Period | | | 111,093 | | | | 118,628 | | | | 704 | | | | 221 | | | |
| | | |
| (1) | | Period from May 31, 2012 (inception date) through June 30, 2012 for Class N Shares. |
Janus Fixed Income & Money Market Funds | 107
Notes to Financial Statements (continued)
| | | | | | | | | | | | | | | | | | | |
| | | Janus
| | Janus
| | |
| | | High-Yield
| | Short-Term
| | |
For each year ended June 30 (all numbers in thousands)
| | Fund | | Bond Fund | | |
| Fixed Income | | 2013 | | 2012(1) | | 2012 | | 2012(1) | | |
| |
| Transactions in Fund Shares – Class A Shares: | | | | | | | | | | | | | | | | | | |
| Shares sold | | | 15,841 | | | | 19,541 | | | | 29,022 | | | | 66,759 | | | |
| Reinvested dividends and distributions | | | 1,935 | | | | 1,588 | | | | 1,189 | | | | 2,582 | | | |
| Shares repurchased | | | (12,143) | | | | (10,422) | | | | (117,361) | | | | (53,557) | | | |
| Net Increase/(Decrease) in Fund Shares | | | 5,633 | | | | 10,707 | | | | (87,150) | | | | 15,784 | | | |
| Shares Outstanding, Beginning of Period | | | 29,543 | | | | 18,836 | | | | 137,374 | | | | 121,590 | | | |
| Shares Outstanding, End of Period | | | 35,176 | | | | 29,543 | | | | 50,224 | | | | 137,374 | | | |
| Transactions in Fund Shares – Class C Shares: | | | | | | | | | | | | | | | | | | |
| Shares sold | | | 1,981 | | | | 2,141 | | | | 9,264 | | | | 10,564 | | | |
| Reinvested dividends and distributions | | | 421 | | | | 426 | | | | 281 | | | | 258 | | | |
| Shares repurchased | | | (2,389) | | | | (2,452) | | | | (8,471) | | | | (9,082) | | | |
| Net Increase/(Decrease) in Fund Shares | | | 13 | | | | 115 | | | | 1,074 | | | | 1,740 | | | |
| Shares Outstanding, Beginning of Period | | | 8,705 | | | | 8,590 | | | | 24,620 | | | | 22,880 | | | |
| Shares Outstanding, End of Period | | | 8,718 | | | | 8,705 | | | | 25,694 | | | | 24,620 | | | |
| Transactions in Fund Shares – Class D Shares: | | | | | | | | | | | | | | | | | | |
| Shares sold | | | 9,428 | | | | 6,578 | | | | 17,147 | | | | 14,440 | | | |
| Reinvested dividends and distributions | | | 2,143 | | | | 2,147 | | | | 1,535 | | | | 1,495 | | | |
| Shares repurchased | | | (8,603) | | | | (6,940) | | | | (17,608) | | | | (16,877) | | | |
| Net Increase/(Decrease) in Fund Shares | | | 2,968 | | | | 1,785 | | | | 1,074 | | | | (942) | | | |
| Shares Outstanding, Beginning of Period | | | 36,511 | | | | 34,726 | | | | 67,217 | | | | 68,159 | | | |
| Shares Outstanding, End of Period | | | 39,479 | | | | 36,511 | | | | 68,291 | | | | 67,217 | | | |
| Transactions in Fund Shares – Class I Shares: | | | | | | | | | | | | | | | | | | |
| Shares sold | | | 23,178 | | | | 29,871 | | | | 79,357 | | | | 70,814 | | | |
| Reinvested dividends and distributions | | | 1,738 | | | | 1,594 | | | | 1,531 | | | | 2,153 | | | |
| Shares repurchased | | | (25,863) | | | | (23,821) | | | | (66,792) | | | | (159,874) | | | |
| Net Increase/(Decrease) in Fund Shares | | | (947) | | | | 7,644 | | | | 14,096 | | | | (86,907) | | | |
| Shares Outstanding, Beginning of Period | | | 26,799 | | | | 19,155 | | | | 89,374 | | | | 176,281 | | | |
| Shares Outstanding, End of Period | | | 25,852 | | | | 26,799 | | | | 103,470 | | | | 89,374 | | | |
| Transactions in Fund Shares – Class N Shares: | | | | | | | | | | | | | | | | | | |
| Shares sold | | | 970 | | | | 490 | | | | 6,161 | | | | 11,424 | | | |
| Reinvested dividends and distributions | | | 61 | | | | 2 | | | | 305 | | | | 13 | | | |
| Shares repurchased | | | (781) | | | | (5) | | | | (5,279) | | | | (300) | | | |
| Net Increase/(Decrease) in Fund Shares | | | 250 | | | | 487 | | | | 1,187 | | | | 11,137 | | | |
| Shares Outstanding, Beginning of Period | | | 487 | | | | – | | | | 11,137 | | | | – | | | |
| Shares Outstanding, End of Period | | | 737 | | | | 487 | | | | 12,324 | | | | 11,137 | | | |
| Transactions in Fund Shares – Class R Shares: | | | | | | | | | | | | | | | | | | |
| Shares sold | | | 108 | | | | 76 | | | | N/A | | | | N/A | | | |
| Reinvested dividends and distributions | | | 6 | | | | 6 | | | | N/A | | | | N/A | | | |
| Shares repurchased | | | (52) | | | | (83) | | | | N/A | | | | N/A | | | |
| Net Increase/(Decrease) in Fund Shares | | | 62 | | | | (1) | | | | N/A | | | | N/A | | | |
| Shares Outstanding, Beginning of Period | | | 120 | | | | 121 | | | | N/A | | | | N/A | | | |
| Shares Outstanding, End of Period | | | 182 | | | | 120 | | | | N/A | | | | N/A | | | |
| Transactions in Fund Shares – Class S Shares: | | | | | | | | | | | | | | | | | | |
| Shares sold | | | 187 | | | | 197 | | | | 1,282 | | | | 369 | | | |
| Reinvested dividends and distributions | | | 45 | | | | 45 | | | | 33 | | | | 36 | | | |
| Shares repurchased | | | (168) | | | | (320) | | | | (1,291) | | | | (586) | | | |
| Net Increase/(Decrease) in Fund Shares | | | 64 | | | | (78) | | | | 24 | | | | (181) | | | |
| Shares Outstanding, Beginning of Period | | | 689 | | | | 767 | | | | 1,666 | | | | 1,847 | | | |
| Shares Outstanding, End of Period | | | 753 | | | | 689 | | | | 1,690 | | | | 1,666 | | | |
108 | JUNE 30, 2013
| | | | | | | | | | | | | | | | | | | |
| | | Janus
| | Janus
| | |
| | | High-Yield
| | Short-Term
| | |
For each year ended June 30 (all numbers in thousands)
| | Fund | | Bond Fund | | |
| Fixed Income | | 2013 | | 2012(1) | | 2012 | | 2012(1) | | |
| |
| Transactions in Fund Shares – Class T Shares: | | | | | | | | | | | | | | | | | | |
| Shares sold | | | 46,510 | | | | 57,266 | | | | 363,510 | | | | 254,050 | | | |
| Reinvested dividends and distributions | | | 9,463 | | | | 8,737 | | | | 15,520 | | | | 13,207 | | | |
| Shares repurchased | | | (53,586) | | | | (41,223) | | | | (310,882) | | | | (244,131) | | | |
| Net Increase/(Decrease) in Fund Shares | | | 2,387 | | | | 24,780 | | | | 68,148 | | | | 23,126 | | | |
| Shares Outstanding, Beginning of Period | | | 140,945 | | | | 116,165 | | | | 655,191 | | | | 632,065 | | | |
| Shares Outstanding, End of Period | | | 143,332 | | | | 140,945 | | | | 723,339 | | | | 655,191 | | | |
| | | |
| (1) | | Period from May 31, 2012 (inception date) through June 30, 2012 for Class N Shares. |
Janus Fixed Income & Money Market Funds | 109
Notes to Financial Statements (continued)
| | | | | | | | | | | | | | | | | | | |
| | | Janus Government
| | | | | | |
For each year ended June 30 (all numbers in thousands)
| | Money Market Fund | | Janus Money Market Fund | | |
| Money Market | | 2013 | | 2012 | | 2013 | | 2012 | | |
| |
| Transactions in Fund Shares – Class D Shares: | | | | | | | | | | | | | | | | | | |
| Shares sold | | | 74,214 | | | | 79,885 | | | | 574,480 | | | | 623,381 | | | |
| Reinvested dividends and distributions | | | 8 | | | | 7 | | | | 40 | | | | 53 | | | |
| Shares repurchased | | | (81,354) | | | | (86,828) | | | | (586,411) | | | | (639,464) | | | |
| Net Increase/(Decrease) in Fund Shares | | | (7,132) | | | | (6,936) | | | | (11,891) | | | | (16,030) | | | |
| Shares Outstanding, Beginning of Period | | | 182,326 | | | | 189,262 | | | | 1,089,283 | | | | 1,105,313 | | | |
| Shares Outstanding, End of Period | | | 175,194 | | | | 182,326 | | | | 1,077,392 | | | | 1,089,283 | | | |
| Transactions in Fund Shares – Class T Shares: | | | | | | | | | | | | | | | | | | |
| Shares sold | | | 4,552 | | | | 5,053 | | | | 109,753 | | | | 103,157 | | | |
| Reinvested dividends and distributions | | | – | | | | – | | | | 4 | | | | 4 | | | |
| Shares repurchased | | | (3,302) | | | | (5,466) | | | | (87,186) | | | | (100,027) | | | |
| Net Increase/(Decrease) in Fund Shares | | | 1,250 | | | | (413) | | | | 22,571 | | | | 3,134 | | | |
| Shares Outstanding, Beginning of Period | | | 5,319 | | | | 5,732 | | | | 167,687 | | | | 164,553 | | | |
| Shares Outstanding, End of Period | | | 6,569 | | | | 5,319 | | | | 190,258 | | | | 167,687 | | | |
| |
| 7. | Purchases and Sales of Investment Securities |
For the year ended June 30, 2013, the aggregate cost of purchases and proceeds from sales of investment securities (excluding any short-term securities, short-term options contracts, and in-kind transactions) was as follows:
| | | | | | | | | | | | | | | |
| | | | | | | Purchases of Long-
| | Proceeds from Sales
| | |
| | | Purchases of
| | Proceeds from Sales
| | Term U.S. Government
| | of Long-Term U.S.
| | |
| Fund | | Securities | | of Securities | | Obligations | | Government Obligations | | |
| |
Fixed Income | | | | | | | | | | | | | | |
| Janus Flexible Bond Fund | | $ | 4,713,826,891 | | $ | 3,990,775,556 | | $ | 3,232,948,714 | | $ | 2,805,969,287 | | |
| Janus Global Bond Fund | | | 340,146,228 | | | 156,214,547 | | | 68,677,552 | | | 33,570,733 | | |
| Janus High-Yield Fund | | | 2,270,895,172 | | | 2,133,600,476 | | | – | | | – | | |
| Janus Short-Term Bond Fund | | | 2,390,464,780 | | | 2,224,388,615 | | | 614,156,128 | | | 717,146,853 | | |
| |
| |
| |
| 8. | New Accounting Pronouncements |
In December 2011, the FASB issued Accounting Standards Update No. 2011-11, “Disclosures about Offsetting Assets and Liabilities.” This update creates disclosure requirements requiring entities to disclose both gross and net information for derivatives and other financial instruments that are either offset in the Statements of Assets and Liabilities or subject to an enforceable master netting arrangement or similar agreement. In January 2013, the FASB issued Accounting Standards Update No. 2013-01, “Clarifying the Scope of Disclosures about Offsetting Assets and Liabilities.” This update limits the scope of the new Statements of Assets and Liabilities offsetting disclosures to derivatives, repurchase agreements, reverse repurchase agreements, securities borrowing and securities lending transactions that are either offset in the Statements of Assets and Liabilities or subject to an enforceable master netting arrangement or similar agreement. These disclosure requirements are effective for annual reporting periods beginning on or after January 1, 2013, and interim periods within those annual periods. Management is currently evaluating the impact these updates may have on the Funds’ financial statements.
Management has evaluated whether any other events or transactions occurred subsequent to June 30, 2013 and through the date of issuance of the Funds’ financial statements and determined that there were no material events or transactions that would require recognition or disclosure in the Funds’ financial statements.
110 | JUNE 30, 2013
Report of Independent Registered Public Accounting Firm
To the Board of Trustees and Shareholders
of Janus Investment Fund:
In our opinion, the accompanying statements of assets and liabilities, including the schedules of investments, and the related statements of operations and of changes in net assets and the financial highlights present fairly, in all material respects, the financial position of Janus Flexible Bond Fund, Janus Global Bond Fund, Janus High-Yield Fund, Janus Short-Term Bond Fund, Janus Government Money Market Fund, and Janus Money Market Fund (six of the funds constituting Janus Investment Fund, hereafter referred to as the “Funds”) at June 30, 2013 and the results of each of their operations for the year then ended, the changes in each of their net assets for each of the two years in the period then ended and the financial highlights for each of the periods presented, in conformity with accounting principles generally accepted in the United States of America. These financial statements and financial highlights (hereafter referred to as “financial statements”) are the responsibility of the Funds’ management; our responsibility is to express an opinion on these financial statements based on our audits. We conducted our audits of these financial statements in accordance with the standards of the Public Company Accounting Oversight Board (United States). Those standards require that we plan and perform the audit to obtain reasonable assurance about whether the financial statements are free of material misstatement. An audit includes examining, on a test basis, evidence supporting the amounts and disclosures in the financial statements, assessing the accounting principles used and significant estimates made by management, and evaluating the overall financial statement presentation. We believe that our audits, which included confirmation of securities at June 30, 2013 by correspondence with the custodian, transfer agent and brokers, provide a reasonable basis for our opinion.
Denver, Colorado
August 19, 2013
Janus Fixed Income & Money Market Funds | 111
Additional Information (unaudited)
Proxy Voting Policies and Voting Record
A description of the policies and procedures that the Funds use to determine how to vote proxies relating to their portfolio securities is available without charge: (i) upon request, by calling 1-800-525-0020 (toll free); (ii) on the Funds’ website at janus.com/proxyvoting; and (iii) on the SEC’s website at http://www.sec.gov. Additionally, information regarding each Fund’s proxy voting record for the most recent twelve-month period ended June 30 is also available, free of charge, through janus.com/proxyvoting and from the SEC’s website at http://www.sec.gov.
Quarterly Portfolio Holdings
The Funds file their complete portfolio holdings (schedule of investments) with the SEC for the first and third quarters of each fiscal year on Form N-Q within 60 days of the end of such fiscal quarter. The Funds’ Form N-Q: (i) is available on the SEC’s website at http://www.sec.gov; (ii) may be reviewed and copied at the SEC’s Public Reference Room in Washington, D.C. (information on the Public Reference Room may be obtained by calling 1-800-SEC-0330); and (iii) is available without charge, upon request, by calling Janus at 1-800-525-0020 (toll free).
Approval of Advisory Agreements During the Period
The Trustees of Janus Investment Fund, none of whom has ever been affiliated with Janus Capital and each of whom serves as an “independent” Trustee (the “Trustees”), oversee the management of each Fund and, as required by law, determine annually whether to continue the investment advisory agreement for each Fund and the subadvisory agreements for the nine Funds that utilize subadvisers.
In connection with their most recent consideration of those agreements for each Fund, the Trustees received and reviewed a substantial amount of information provided by Janus Capital and the respective subadvisers in response to requests of the Trustees and their independent legal counsel. They also received and reviewed a considerable amount of information and analysis provided by, and in response to requests of, their independent fee consultant. Throughout their consideration of the agreements, the Trustees were advised by their independent legal counsel. The Trustees met with management to consider the agreements, and also met separately in executive session with their independent legal counsel and their independent fee consultant.
At a meeting held on December 7, 2012, based on the Trustees’ evaluation of the information provided by Janus Capital, the subadvisers and the independent fee consultant, as well as other information, the Trustees determined that the overall arrangements between each Fund and Janus Capital and each subadviser, as applicable, were fair and reasonable in light of the nature, extent and quality of the services provided by Janus Capital, its affiliates and the subadvisers, the fees charged for those services, and other matters that the Trustees considered relevant in the exercise of their business judgment. At that meeting, the Trustees unanimously approved the continuation of the investment advisory agreement for each Fund, and the subadvisory agreement for each subadvised Fund, for the period from February 1, 2013 through February 1, 2014, subject to earlier termination as provided for in each agreement.
In considering the continuation of those agreements, the Trustees reviewed and analyzed various factors that they determined were relevant, including the factors described below, none of which by itself was considered dispositive. However, the material factors and conclusions that formed the basis for the Trustees’ determination to approve the continuation of the agreements are discussed separately below. Also included is a summary of the independent fee consultant’s conclusions and opinions that arose during, and were included as part of, the Trustees’ consideration of the agreements.
Nature, Extent and Quality of Services
The Trustees reviewed the nature, extent and quality of the services provided by Janus Capital and the subadvisers to the Funds, taking into account the investment objective and strategy of each Fund and the knowledge the Trustees gained from their regular meetings with management on at least a quarterly basis and their ongoing review of information related to the Funds. In addition, the Trustees reviewed the resources and key personnel of Janus Capital and each subadviser, particularly noting those employees who provide investment and risk management services to the Funds. The Trustees also considered other services provided to the Funds by Janus Capital or the subadvisers, such as managing the execution of portfolio transactions and the selection of broker-dealers for those transactions. The Trustees considered Janus Capital’s role as administrator to the Funds, noting that Janus Capital does not receive a fee for its services but is reimbursed for its out-of-pocket costs. The Trustees considered the role of Janus Capital in monitoring adherence to the Funds’ investment restrictions, providing support services for the Trustees and Trustee committees, communicating with shareholders and overseeing the activities of other service providers, including monitoring compliance with various policies and
112 | JUNE 30, 2013
procedures of the Funds and with applicable securities laws and regulations.
In this regard, the independent fee consultant noted that Janus Capital provides a number of different services for the Funds of Janus Investment Fund and the Portfolios of Janus Aspen Series (such Funds and Portfolios, together the “Janus Funds”) and Janus Fund shareholders, ranging from investment management services to various other servicing functions, and that, in its opinion, Janus Capital is a capable provider of those services. The independent fee consultant also provided its belief that Janus Capital has developed institutional competitive advantages that should be able to provide superior investment management returns over the long term.
The Trustees concluded that the nature, extent and quality of the services provided by Janus Capital or the subadviser to each Fund were appropriate and consistent with the terms of the respective advisory and subadvisory agreements, and that, taking into account steps taken to address those Funds whose performance lagged that of their peers for certain periods, the quality of those services had been consistent with or superior to quality norms in the industry and the Funds were likely to benefit from the continued provision of those services. They also concluded that Janus Capital and each subadviser had sufficient personnel, with the appropriate education and experience, to serve the Funds effectively and had demonstrated its continuing ability to attract well-qualified personnel.
Performance of the Funds
The Trustees considered the performance results of each Fund over various time periods. They reviewed information comparing each Fund’s performance with the performance of comparable funds and peer groups identified by independent data providers, and with the Fund’s benchmark index. In this regard, the independent fee consultant found that the Janus Funds have had some recent performance challenges, but performance has improved recently, and for the 36 months ended September 30, 2012, approximately 47% of the Janus Funds were in the top two quartiles of performance and for the 12 months ended September 30, 2012, approximately 54% of the Janus Funds were in the top two quartiles of performance. The Trustees concluded that the performance of certain Funds was good under current market conditions. Although the performance of other Funds lagged that of their peers for certain periods, the Trustees also concluded that Janus Capital had taken or was taking appropriate steps to address those instances of under-performance.
Costs of Services Provided
The Trustees examined information regarding the fees and expenses of each Fund in comparison to similar information for other comparable funds as provided by independent data providers. They also reviewed an analysis of that information provided by their independent fee consultant and noted that the rate of management (investment advisory and any administration) fees for most of the Funds, after applicable contractual expense limitations, was below the mean management fee rate of the respective peer group of funds selected by the independent data providers.
In this regard, the independent fee consultant provided its belief that the management fees charged by Janus Capital to each of the Janus Funds under the current investment advisory and administration agreements are reasonable in relation to the services provided by Janus Capital. The independent fee consultant found (1) the total expenses and management fees of the Janus Funds to be reasonable relative to other mutual funds; (2) total expenses, on average, were 16% below the mean total expenses of their respective Lipper Expense Group peers and 23% below the mean total expenses for their Lipper Expense Universes; (3) management fees for the Janus Funds, on average, were 9% below the mean management fees for their Expense Groups and 12% below the mean for their Expense Universes; and (4) Janus Funds expenses at the functional level for each asset and share class category were reasonable. The independent fee consultant concluded that based on its strategic review of expenses at the complex, category and individual fund level, Janus Funds expenses were found to be reasonable relative to both Expense Group and Expense Universe benchmarks. Further, for certain Funds the independent fee consultant also performed a systematic “focus list” analysis of expenses in the context of the performance or service delivered to each set of investors in each share class in each selected Fund. Based on this analysis, the independent fee consultant found that the combination of service quality/ performance and expenses on these individual Funds and share classes were reasonable in light of performance trends, performance histories and existence of performance fees on such Funds.
The Trustees considered the methodology used by Janus Capital and each subadviser in determining compensation payable to portfolio managers, the competitive environment for investment management talent and the competitive market for mutual funds in different distribution channels. They concluded that the compensation methodology provided a good alignment of the interests of the portfolio managers with the interests of Fund shareholders.
Janus Fixed Income & Money Market Funds | 113
Additional Information (unaudited) (continued)
The Trustees also reviewed management fees charged by Janus Capital and each subadviser to their separate account clients and to non-affiliated funds subadvised by Janus Capital or by a subadviser (for which Janus Capital or the subadviser provides only portfolio management services). Although in most instances subadvisory and separate account fee rates for various investment strategies were lower than management fee rates for Funds having a similar strategy, the Trustees noted that, under the terms of the management agreements with the Funds, Janus Capital performs significant additional services for the Funds that it does not provide to those other clients, including administration services, oversight of the Funds’ other service providers, trustee support, regulatory compliance and numerous other services, and that, in serving the Funds, Janus Capital assumes many legal risks that it does not assume in servicing its other clients. Moreover, they noted the research conducted and conclusions reached by their independent fee consultant.
In this regard, the independent fee consultant found that (1) the management fees Janus Capital charges to the Janus Funds are reasonable in relation to the management fees Janus Capital charges to its institutional and subadvised accounts; (2) these institutional and subadvised accounts have different service and infrastructure needs; and (3) the average spread between management fees charged to the Janus Funds and those charged to Janus Capital’s institutional and subadvised accounts is reasonable relative to the average spreads seen in the industry.
The Trustees reviewed information on the profitability to Janus Capital and its affiliates of their relationships with each Fund, as well as an explanation of the methodology utilized in allocating various expenses of Janus Capital and its affiliates among the Funds and other clients. The Trustees also reviewed the financial statements and corporate structure of Janus Capital’s parent company. In their review, the Trustees considered whether Janus Capital and each subadviser receive adequate incentives to manage the Funds effectively. The Trustees recognized that profitability comparisons among fund managers are difficult because very little comparative information is publicly available and the profitability of any fund manager is affected by numerous factors, including the organizational structure of the particular fund manager, the types of funds and other accounts it manages, possible other lines of business, the methodology for allocating expenses and the fund manager’s capital structure and cost of capital. However, taking into account those factors and the analysis provided by the Trustees’ independent fee consultant, and based on the information available, the Trustees concluded that Janus Capital’s profitability with respect to each Fund in relation to the services rendered was not unreasonable.
In this regard, the independent fee consultant found that, while assessing the reasonability of expenses in light of Janus Capital’s profits is dependent on comparisons with other publicly-traded mutual fund advisers, and that these comparisons are limited in accuracy by differences in complex size, business mix, institutional account orientation, and other factors, after accepting these limitations, the level of profit earned by Janus Capital from managing the Janus Funds is reasonable.
The Trustees concluded that the management fees and other compensation payable by each Fund to Janus Capital and its affiliates, as well as the fees paid by Janus Capital to the subadvisers of the subadvised Funds, were reasonable in relation to the nature, extent and quality of the services provided, taking into account the fees charged by other advisers for managing comparable mutual funds with similar strategies, the fees Janus Capital and the subadvisers charge to other clients, and, as applicable, the impact of fund performance on fees payable by the Funds. The Trustees also concluded that the overall expense ratio of each Fund was reasonable, taking into account the size of the Fund, the quality of services provided by Janus Capital and any subadviser, the investment performance of the Fund and any expense limitations agreed to by Janus Capital.
Economies of Scale
The Trustees considered information about the potential for Janus Capital to realize economies of scale as the assets of the Funds increase. They noted that, although many Funds pay advisory fees at a base fixed rate as a percentage of net assets, without any breakpoints, the actual management fee rate paid by most of the Funds, after any contractual expense limitations, was below the mean management fee rate of the Fund’s peer group identified by independent data providers; and, for those Funds whose expenses are being reduced by the contractual expense limitations of Janus Capital, Janus Capital is subsidizing the Funds because they have not reached adequate scale. Moreover, as the assets of many of the Funds have declined in the past few years, certain Funds have benefited from having advisory fee rates that have remained constant rather than increasing as assets declined. In addition, performance fee structures have been implemented for various Funds that have caused or will cause the effective rate of advisory fees payable by such a Fund to vary depending on the investment performance of the Fund relative to its benchmark index over the measurement period; and the five Funds that have fee schedules with breakpoints and reduced fee rates above certain asset levels. The Trustees also noted
114 | JUNE 30, 2013
that the Funds share directly in economies of scale through the lower charges of third-party service providers that are based in part on the combined scale of all of the Funds. Based on all of the information they reviewed, including research and analysis conducted by the Trustees’ independent fee consultant, the Trustees concluded that the current fee structure of each Fund was reasonable and that the current rates of fees do reflect a sharing between Janus Capital and the Fund of economies of scale at the current asset level of the Fund.
In this regard, the independent fee consultant concluded that, based on analysis it completed, and given the limitations in these analytical approaches and their conflicting results, it could not confirm or deny the existence of economies of scale in the Janus complex. Further, the independent fee consultant provided its belief that Janus Fund investors are well-served by the fee levels and performance fee structures in place on the Janus Funds in light of any economies of scale that may be present at Janus Capital.
Other Benefits to Janus Capital
The Trustees also considered benefits that accrue to Janus Capital and its affiliates from their relationships with the Funds. They recognized that two affiliates of Janus Capital separately serve the Funds as transfer agent and distributor, respectively, and the transfer agent receives compensation directly from the non-money market funds for services provided. The Trustees also considered Janus Capital’s past and proposed use of commissions paid by the Funds on their portfolio brokerage transactions to obtain proprietary and third-party research products and services benefiting the Fund and/or other clients of Janus Capital. The Trustees concluded that Janus Capital’s use of these types of client commission arrangements to obtain proprietary and third-party research products and services was consistent with regulatory requirements and guidelines and was likely to benefit each Fund. The Trustees also concluded that, other than the services provided by Janus Capital and its affiliates pursuant to the agreements and the fees to be paid by each Fund therefor, the Funds and Janus Capital may potentially benefit from their relationship with each other in other ways. They concluded that Janus Capital benefits from the receipt of research products and services acquired through commissions paid on portfolio transactions of the Funds and that the Funds benefit from Janus Capital’s receipt of those products and services as well as research products and services acquired through commissions paid by other clients of Janus Capital. They further concluded that success of any Fund could attract other business to Janus Capital or other Janus Funds, and that the success of Janus Capital could enhance Janus Capital’s ability to serve the Funds.
After full consideration of the above factors, as well as other factors, the Trustees, each of whom is an independent Trustee, concluded at their December 7, 2012 meeting that the proposed continuation of the investment advisory agreement and, if applicable, the subadvisory agreement for each Fund for another year was in the best interest of the respective Funds and their shareholders.
Janus Fixed Income & Money Market Funds | 115
Useful Information About Your Fund Report (unaudited)
The Management Commentary in this report includes valuable insight from each of the Fund’s managers as well as statistical information to help you understand how your Fund’s performance and characteristics stack up against those of comparable indices.
If the Fund invests in foreign securities, this report may include information about country exposure. Country exposure is based primarily on the country of risk. The Fund’s managers may allocate a company to a country based on other factors such as location of the company’s principal office, the location of the principal trading market for the company’s securities, or the country where a majority of the company’s revenues are derived.
Please keep in mind that the opinions expressed by the Chief Investment Officer(s) in the Market Perspective and by the Fund’s managers in the Management Commentary are just that: opinions. They are a reflection of the Chief Investment Officer(s) and managers’ best judgment at the time this report was compiled, which was June 30, 2013. As the investing environment changes, so could their opinions. These views are unique to them and aren’t necessarily shared by fellow employees or by Janus in general.
Performance overview graphs compare the performance of a hypothetical $10,000 investment in the Fund with one or more widely used market indices. The hypothetical example does not represent the returns of any particular investment.
When comparing the performance of the Fund with an index, keep in mind that market indices do not include brokerage commissions that would be incurred if you purchased the individual securities in the index. They also do not include taxes payable on dividends and interest or operating expenses incurred if you maintained the Fund invested in the index.
Average annual total returns are quoted for a Fund with more than one year of performance history. Average annual total return is calculated by taking the growth or decline in value of an investment over a period of time, including reinvestment of dividends and distributions, then calculating the annual compounded percentage rate that would have produced the same result had the rate of growth been constant throughout the period. Average annual total return does not reflect the deduction of taxes that a shareholder would pay on Fund distributions or redemptions of Fund shares.
Cumulative total returns are quoted for a Fund with less than one year of performance history. Cumulative total return is the growth or decline in value of an investment over time, independent of the period of time involved. Cumulative total return does not reflect the deduction of taxes that a shareholder would pay on Fund distributions or redemptions of Fund shares.
Pursuant to federal securities rules, expense ratios shown in the performance chart reflect subsidized (if applicable) and unsubsidized ratios. The total annual fund operating expenses ratio is gross of any fee waivers, reflecting the Fund’s unsubsidized expense ratio. The net annual fund operating expenses ratio (if applicable) includes contractual waivers of Janus Capital and reflects the Fund’s subsidized expense ratio. Ratios may be higher or lower than those shown in the “Financial Highlights” in this report.
| |
| 3. | Schedule of Investments |
Following the performance overview section is the Fund’s Schedule of Investments. This schedule reports the types of securities held in the Fund on the last day of the reporting period. Securities are usually listed by type (common stock, corporate bonds, U.S. Government obligations, etc.) and by industry classification (banking, communications, insurance, etc.). Holdings are subject to change without notice.
The value of each security is quoted as of the last day of the reporting period. The value of securities denominated in foreign currencies is converted into U.S. dollars.
If the Fund invests in foreign securities, it will also provide a summary of investments by country. This summary reports the Fund’s exposure to different countries by providing the percentage of securities invested in each country. The country of each security represents the country of risk. The Fund’s Schedule of Investments relies upon the industry group and country classifications published by Bloomberg L.P. and/or MSCI Inc.
Tables listing details of individual forward currency contracts, futures, written options and swaps follow the Fund’s Schedule of Investments (if applicable).
| |
| 4. | Statement of Assets and Liabilities |
This statement is often referred to as the “balance sheet.” It lists the assets and liabilities of the Fund on the last day of the reporting period.
The Fund’s assets are calculated by adding the value of the securities owned, the receivable for securities sold but not yet settled, the receivable for dividends declared but not yet received on securities owned and the receivable for Fund shares sold to investors but not yet settled. The Fund’s liabilities include payables for securities purchased
116 | JUNE 30, 2013
but not yet settled, Fund shares redeemed but not yet paid and expenses owed but not yet paid. Additionally, there may be other assets and liabilities such as unrealized gain or loss on forward currency contracts.
The section entitled “Net Assets Consist of” breaks down the components of the Fund’s net assets. Because the Fund must distribute substantially all earnings, you will notice that a significant portion of net assets is shareholder capital.
The last section of this statement reports the net asset value (“NAV”) per share on the last day of the reporting period. The NAV is calculated by dividing the Fund’s net assets for each share class (assets minus liabilities) by the number of shares outstanding.
| |
| 5. | Statement of Operations |
This statement details the Fund’s income, expenses, realized gains and losses on securities and currency transactions, and changes in unrealized appreciation or depreciation of Fund holdings.
The first section in this statement, entitled “Investment Income,” reports the dividends earned from securities and interest earned from interest-bearing securities in the Fund.
The next section reports the expenses incurred by the Fund, including the advisory fee paid to the investment adviser, transfer agent fees and expenses, and printing and postage for mailing statements, financial reports and prospectuses. Expense offsets and expense reimbursements, if any, are also shown.
The last section lists the amounts of realized gains or losses from investment and foreign currency transactions, and changes in unrealized appreciation or depreciation of investments and foreign currency-denominated assets and liabilities. The Fund will realize a gain (or loss) when it sells its position in a particular security. A change in unrealized gain (or loss) refers to the change in net appreciation or depreciation of the Fund during the reporting period. “Net Realized and Unrealized Gain/(Loss) on Investments” is affected both by changes in the market value of Fund holdings and by gains (or losses) realized during the reporting period.
| |
| 6. | Statements of Changes in Net Assets |
These statements report the increase or decrease in the Fund’s net assets during the reporting period. Changes in the Fund’s net assets are attributable to investment operations, dividends and distributions to investors and capital share transactions. This is important to investors because it shows exactly what caused the Fund’s net asset size to change during the period.
The first section summarizes the information from the Statement of Operations regarding changes in net assets due to the Fund’s investment operations. The Fund’s net assets may also change as a result of dividend and capital gains distributions to investors. If investors receive their dividends and/or distributions in cash, money is taken out of the Fund to pay the dividend and/or distribution. If investors reinvest their dividends and/or distributions, the Fund’s net assets will not be affected. If you compare the Fund’s “Net Decrease from Dividends and Distributions” to “Reinvested Dividends and Distributions,” you will notice that dividends and distributions have little effect on the Fund’s net assets. This is because the majority of the Fund’s investors reinvest their dividends and/or distributions.
The reinvestment of dividends and distributions is included under “Capital Share Transactions.” “Capital Shares” refers to the money investors contribute to the Fund through purchases or withdrawals via redemptions. The Fund’s net assets will increase and decrease in value as investors purchase and redeem shares from the Fund.
This schedule provides a per-share breakdown of the components that affect the Fund’s NAV for current and past reporting periods as well as total return, asset size, ratios and portfolio turnover rate.
The first line in the table reflects the NAV per share at the beginning of the reporting period. The next line reports the net investment income/(loss) per share. Following is the per share total of net gains/(losses), realized and unrealized. Per share dividends and distributions to investors are then subtracted to arrive at the NAV per share at the end of the period. The next line reflects the total return for the period. The total return may include adjustments in accordance with generally accepted accounting principles required at the period end for financial reporting purposes. As a result, the total return may differ from the total return reflected for individual shareholder transactions. Also included are ratios of expenses and net investment income to average net assets.
The Fund’s expenses may be reduced through expense offsets and expense reimbursements. The ratios shown reflect expenses before and after any such offsets and reimbursements.
The ratio of net investment income/(loss) summarizes the income earned less expenses, divided by the average net assets of the Fund during the reporting period. Don’t
Janus Fixed Income & Money Market Funds | 117
Useful Information About Your Fund Report (unaudited) (continued)
confuse this ratio with the Fund’s yield. The net investment income ratio is not a true measure of the Fund’s yield because it doesn’t take into account the dividends distributed to the Fund’s investors.
The next figure is the portfolio turnover rate, which measures the buying and selling activity in the Fund. Portfolio turnover is affected by market conditions, changes in the asset size of the Fund, fluctuating volume of shareholder purchase and redemption orders, the nature of the Fund’s investments, and the investment style and/or outlook of the portfolio managers. A 100% rate implies that an amount equal to the value of the entire portfolio was replaced once during the fiscal year; a 50% rate means that an amount equal to the value of half the portfolio is traded in a year; and a 200% rate means that an amount equal to the value of the entire portfolio is traded every six months.
118 | JUNE 30, 2013
Designation Requirements (unaudited)
For federal income tax purposes, the Funds designated the following for the year ended June 30, 2013:
Capital Gain Distributions
| | | | | | | | | | | |
| Fund | | | | | | |
| |
| |
Fixed Income | | | | | | | | | | |
| Janus Flexible Bond Fund | | $ | 53,752,539 | | | | | | | |
| Janus Global Bond Fund | | | 259,818 | | | | | | | |
| Janus High-Yield Fund | | | 3,616,537 | | | | | | | |
| Janus Short-Term Bond Fund | | | 13,365,749 | | | | | | | |
| |
| |
Return of Capital Distributions
| | | | | | | | | | | |
| Fund | | | | | | |
| |
| |
Fixed Income | | | | | | | | | | |
| Janus Global Bond Fund | | $ | 1,705,596 | | | | | | | |
| |
| |
Janus Fixed Income & Money Market Funds | 119
Trustees and Officers (unaudited)
The Funds’ Statement of Additional Information includes additional information about the Trustees and officers and is available, without charge, by calling 1-877-335-2687.
The following are the Trustees and officers of the Trust, together with a brief description of their principal occupations during the last five years (principal occupations for certain Trustees may include periods over five years).
Each Trustee has served in that capacity since he or she was originally elected or appointed. The Trustees do not serve a specified term of office. Each Trustee will hold office until the termination of the Trust or his or her earlier death, resignation, retirement, incapacity, or removal. Pursuant to the Funds’ Governance Procedures and Guidelines, Trustees are required to retire no later than the end of the calendar year in which the Trustee turns 72. The Trustees review the Funds’ Governance Procedures and Guidelines from time to time and may make changes they deem appropriate. The Trust’s Nominating and Governance Committee will consider nominees for the position of Trustee recommended by shareholders. Shareholders may submit the name of a candidate for consideration by the Committee by submitting their recommendations to the Trust’s Secretary. Each Trustee is currently a Trustee of one other registered investment company advised by Janus Capital: Janus Aspen Series. Collectively, these two registered investment companies consist of 56 series or funds.
The Trust’s officers are elected annually by the Trustees for a one-year term. Certain officers also serve as officers of Janus Aspen Series. Certain officers of the Funds may also be officers and/or directors of Janus Capital. Fund officers receive no compensation from the Funds, except for the Funds’ Chief Compliance Officer, as authorized by the Trustees.
TRUSTEES
| | | | | | | | | | | |
| |
| | | | | | | | | Number of Portfolios/Funds
| | Other Directorships
|
| | | Positions Held
| | Length of
| | Principal Occupations
| | in Fund Complex
| | Held by Trustee
|
| Name, Address, and Age | | with the Trust | | Time Served | | During the Past Five Years | | Overseen by Trustee | | During the Past Five Years |
| |
| |
Independent Trustees | | | | | | | | | | |
| | | | | | | | | | | |
William F. McCalpin
151 Detroit Street
Denver, CO 80206
DOB: 1957 | | Chairman
Trustee | | 1/08-Present
6/02-Present | | Managing Director, Holos Consulting LLC (provides consulting services to foundations and other nonprofit organizations). Formerly, Executive Vice President and Chief Operating Officer of The Rockefeller Brothers Fund (a private family foundation) (1998-2006). | | 56 | | Chairman of the Board and Director of The Investment Fund for Foundations Investment Program (TIP) (consisting of 2 funds); and Director of the F.B. Heron Foundation (a private grantmaking foundation). |
| | | | | | | | | | | |
Alan A. Brown
151 Detroit Street
Denver, CO 80206
DOB: 1962 | | Trustee | | 1/13-Present | | Managing Director, Institutional Markets, of Dividend Capital Group (private equity real estate investment management firm) (since 2012). Formerly, Executive Vice President and Co-Head, Global Private Client Group (2007-2010), Executive Vice President, Mutual Funds (2005-2007), and Chief Marketing Officer (2001-2005) of Nuveen Investments, Inc. (asset management). | | 56 | | Director of MotiveQuest LLC (strategic social market research company) (since 2003); and Director of WTTW (PBS affiliate) (since 2003). Formerly, Director of Nuveen Global Investors LLC (2007-2011); Director of Communities in Schools (2004-2010); and Director of Mutual Fund Education Alliance (until 2010). |
| |
| |
120 | JUNE 30, 2013
TRUSTEES (continued)
| | | | | | | | | | | |
| | | | | | | | | Number of Portfolios/Funds
| | Other Directorships
|
| | | Positions Held
| | Length of
| | Principal Occupations
| | in Fund Complex
| | Held by Trustee
|
| Name, Address, and Age | | with the Trust | | Time Served | | During the Past Five Years | | Overseen by Trustee | | During the Past Five Years |
| |
| |
| | | | | | | | | | | |
William D. Cvengros
151 Detroit Street
Denver, CO 80206
DOB: 1948 | | Trustee | | 1/11-Present | | Managing Member and Chief Executive Officer of SJC Capital, LLC (a personal investment company and consulting firm) (since 2002). Formerly, Venture Partner for The Edgewater Funds (a middle market private equity firm) (2002-2004); Chief Executive Officer and President of PIMCO Advisors Holdings L.P. (a publicly traded investment management firm) (1994-2000); and Chief Investment Officer of Pacific Life Insurance Company (a mutual life insurance and annuity company (1987-1994). | | 56 | | Chairman, National Retirement Partners, Inc. (formerly a network of advisors to 401(k) plans) (since 2005). Formerly, Director of Prospect Acquisition Corp. (a special purpose acquisition corporation) (2007-2009); Director of RemedyTemp, Inc. (temporary help services company) (1996-2006); and Trustee of PIMCO Funds Multi-Manager Series (1990-2000) and Pacific Life Variable Life & Annuity Trusts (1987-1994). |
| | | | | | | | | | | |
James T. Rothe
151 Detroit Street
Denver, CO 80206
DOB: 1943 | | Trustee | | 1/97-Present | | Co-founder and Managing Director of Roaring Fork Capital SBIC, L.P. (SBA SBIC fund focusing on private investment in public equity firms), and Professor Emeritus of Business of the University of Colorado, Colorado Springs, CO (since 2004). Formerly, Professor of Business of the University of Colorado (2002-2004), and Distinguished Visiting Professor of Business (2001-2002) of Thunderbird (American Graduate School of International Management), Glendale, AZ. | | 56 | | Director of Red Robin Gourmet Burgers, Inc. (RRGB) (since 2004). |
| | | | | | | | | | | |
William D. Stewart
151 Detroit Street
Denver, CO 80206
DOB: 1944 | | Trustee | | 6/84-Present | | Retired. Formerly, Corporate Vice President and General Manager of MKS Instruments - HPS Products, Boulder, CO (a manufacturer of vacuum fittings and valves) and PMFC Division, Andover, MA (manufacturing pressure measurement and flow products) (1976-2012). | | 56 | | None |
| |
| |
Janus Fixed Income & Money Market Funds | 121
Trustees and Officers (unaudited) (continued)
TRUSTEES (continued)
| | | | | | | | | | | |
| | | | | | | | | Number of Portfolios/Funds
| | Other Directorships
|
| | | Positions Held
| | Length of
| | Principal Occupations
| | in Fund Complex
| | Held by Trustee
|
| Name, Address, and Age | | with the Trust | | Time Served | | During the Past Five Years | | Overseen by Trustee | | During the Past Five Years |
| |
| |
| | | | | | | | | | | |
Linda S. Wolf
151 Detroit Street
Denver, CO 80206
DOB: 1947 | | Trustee | | 11/05-Present | | Retired. Formerly, Chairman and Chief Executive Officer of Leo Burnett (Worldwide) (advertising agency) (2001-2005). | | 56 | | Director of Chicago Convention & Tourism Bureau, Chicago Council on Global Affairs, The Field Museum of Natural History (Chicago, IL), InnerWorkings (U.S. provider of print procurement solutions to corporate clients), Lurie Children’s Hospital
(Chicago, IL), Rehabilitation Institute of Chicago, Wal-Mart, and Wrapports, LLC (digital communications company). |
| |
| |
122 | JUNE 30, 2013
OFFICERS
| | | | | | | |
| |
| | | Positions Held
| | Term of Office* and
| | Principal Occupations
|
| Name, Address, and Age | | with the Trust | | Length of Time Served | | During the Past Five Years |
| |
| |
| | | | | | | |
Christopher H. Diaz
151 Detroit Street
Denver, CO 80206
DOB: 1974 | | Executive Vice President and
Co-Portfolio Manager
Janus Global Bond Fund | | 5/11-Present | | Formerly, Portfolio Manager for ING (2000-2011). |
| | | | | | | |
Gibson Smith
151 Detroit Street
Denver, CO 80206
DOB: 1968 | | Executive Vice President and
Co-Portfolio Manager
Janus High-Yield Fund
Executive Vice President and
Co-Portfolio Manager
Janus Flexible Bond Fund
Executive Vice President and
Co-Portfolio Manager
Janus Short-Term Bond Fund
Executive Vice President and
Co-Portfolio Manager
Janus Global Bond Fund | | 12/03-Present
5/07-Present
7/10-Present
12/10-Present | | Co-Chief Investment Officer and Executive Vice President of Janus Capital; Executive Vice President of Janus Distributors LLC and Janus Services LLC; Director of Perkins Investment Management LLC; and Portfolio Manager for other Janus accounts. |
| | | | | | | |
J. Eric Thorderson
151 Detroit Street
Denver, CO 80206
DOB: 1961 | | Executive Vice President and
Portfolio Manager
Janus Government Money Market Fund
Executive Vice President and
Portfolio Manager
Janus Money Market Fund | | 2/99-Present
2/04-Present | | Vice President of Janus Capital and Portfolio Manager for other Janus accounts. |
| | | | | | | |
Darrell Watters
151 Detroit Street
Denver, CO 80206
DOB: 1963 | | Executive Vice President and
Co-Portfolio Manager
Janus Flexible Bond Fund
Executive Vice President and
Co-Portfolio Manager
Janus Short-Term Bond Fund
Executive Vice President and
Co-Portfolio Manager
Janus High-Yield Fund
Executive Vice President and
Co-Portfolio Manager
Janus Global Bond Fund | | 5/07-Present
5/07-Present
7/08-Present
12/10-Present | | Vice President of Janus Capital and Portfolio Manager for other Janus accounts. |
| | | | | | | |
Robin C. Beery
151 Detroit Street
Denver, CO 80206
DOB: 1967 | | President and Chief Executive Officer | | 4/08-Present | | Executive Vice President and Head of U.S. Distribution of Janus Capital Group Inc., Janus Capital, Janus Distributors LLC, and Janus Services LLC; Director of The Janus Foundation; Director of Perkins Investment Management LLC; and Working Director of INTECH Investment Management LLC. Formerly, Head of Intermediary Distribution, Global Marketing and Product of Janus Capital Group Inc., Janus Capital, Janus Distributors LLC, and Janus Services LLC (2009-2010); and Chief Marketing Officer of Janus Capital Group Inc. and Janus Capital (2002-2009). |
| |
| |
* Officers are elected at least annually by the Trustees for a one-year term and may also be elected from time to time by the Trustees for an interim period.
Janus Fixed Income & Money Market Funds | 123
Trustees and Officers (unaudited) (continued)
OFFICERS (continued)
| | | | | | | |
| |
| | | Positions Held
| | Term of Office* and
| | Principal Occupations
|
| Name, Address, and Age | | with the Trust | | Length of Time Served | | During the Past Five Years |
| |
| |
| | | | | | | |
Stephanie Grauerholz-Lofton
151 Detroit Street
Denver, CO 80206
DOB: 1970 | | Chief Legal Counsel and Secretary
Vice President | | 1/06-Present
3/06-Present | | Vice President and Assistant General Counsel of Janus Capital, and Vice President and Assistant Secretary of Janus Distributors LLC. |
| | | | | | | |
David R. Kowalski
151 Detroit Street
Denver, CO 80206
DOB: 1957 | | Vice President, Chief Compliance Officer, and Anti-Money Laundering Officer | | 6/02-Present | | Senior Vice President and Chief Compliance Officer of Janus Capital, Janus Distributors LLC, and Janus Services LLC; and Vice President of INTECH Investment Management LLC and Perkins Investment Management LLC. Formerly, Chief Compliance Officer of Bay Isle Financial LLC (2003-2008). |
| | | | | | | |
Jesper Nergaard
151 Detroit Street
Denver, CO 80206
DOB: 1962 | | Chief Financial Officer
Vice President, Treasurer, and Principal Accounting Officer | | 3/05-Present
2/05-Present | | Vice President of Janus Capital and Janus Services LLC. |
| |
| |
* Officers are elected at least annually by the Trustees for a one-year term and may also be elected from time to time by the Trustees for an interim period.
124 | JUNE 30, 2013
Notes
Janus Fixed Income & Money Market Funds | 125
Janus provides access to a wide range of investment disciplines.
Alternative
Janus alternative funds seek to deliver strong risk-adjusted returns over a full market cycle with lower correlation to equity markets than traditional investments.
Asset Allocation
Janus’ asset allocation funds utilize our fundamental, bottom-up research to balance risk over the long term. From fund options that meet investors’ risk tolerance and objectives to a method that incorporates non-traditional investment choices to seek non-correlated sources of risk and return, Janus’ asset allocation funds aim to allocate risk more effectively.
Fixed Income
Janus fixed income funds attempt to provide less risk relative to equities while seeking to deliver a competitive total return through high current income and appreciation. Janus money market funds seek capital preservation and liquidity with current income as a secondary objective.
Global & International
Janus global and international funds seek to leverage Janus’ research capabilities by taking advantage of inefficiencies in foreign markets, where accurate information and analytical insight are often at a premium.
Growth & Core
Janus growth funds focus on companies believed to be the leaders in their respective industries, with solid management teams, expanding market share, margins and efficiencies. Janus core funds seek investments in more stable and predictable companies. Our core funds look for a strategic combination of steady growth and, for certain funds, some degree of income.
Mathematical
Our mathematical funds seek to outperform their respective indices while maintaining a risk profile equal to or lower than the index itself. Managed by INTECH (a Janus subsidiary), these funds use a mathematical process in an attempt to build a more “efficient” portfolio than the index.
Value
Our value funds, managed by Perkins (a Janus subsidiary), seek to identify companies with favorable reward to risk characteristics by conducting rigorous downside analysis before determining upside potential.
For more information about our funds, contact your investment professional or go to janus.com/advisor/mutual-funds (or janus.com/allfunds if you hold Shares directly with Janus).
Please consider the charges, risks, expenses and investment objectives carefully before investing. For a prospectus or, if available, a summary prospectus containing this and other information, please call Janus at 877.33JANUS (52687) (or 800.525.3713 if you hold Shares directly with Janus); or download the file from janus.com/info (or janus.com/reports if you hold Shares directly with Janus). Read it carefully before you invest or send money.
Funds distributed by Janus Distributors LLC (08/13)
| | | | | | | | | | |
| Investment products offered are: | | | NOT FDIC-INSURED | | | MAY LOSE VALUE | | | NO BANK GUARANTEE |
| | | | | | | | | | |
| |
| C-0813-42879 | 125-02-93004 08-13 |
ANNUAL REPORT
June 30, 2013
Janus Mathematical Funds
INTECH Global Dividend FundINTECH International Fund
INTECH U.S. Core Fund
INTECH U.S. Growth Fund
INTECH U.S. Value Fund
HIGHLIGHTS
| |
| • | Portfolio management perspective |
| • | Investment strategy behind your fund |
| • | Fund performance, characteristics and holdings |
Table of Contents
Janus Mathematical Funds
| | | |
| | |
| | 1 |
| | 11 |
| | 22 |
| | 33 |
| | 45 |
| | 58 |
| | 62 |
| | 66 |
| | 68 |
| | 72 |
| | 88 |
| | 100 |
| | 101 |
| | 105 |
| | 108 |
| | 109 |
Please consider the charges, risks, expenses and investment objectives carefully before investing. For a prospectus or, if available, a summary prospectus containing this and other information, please call Janus at 877.33JANUS (52687) (or 800.525.3713 if you hold Shares directly with Janus); or download the file from janus.com/info (or janus.com/reports if you hold Shares directly with Janus). Read it carefully before you invest or send money.
INTECH Global Dividend Fund (unaudited)
| | | | | | | |
Fund Snapshot
INTECH’s active approach focuses on adding value by selecting stocks with unique volatility characteristics and low correlations to one another.
| | | | | | Managed by
INTECH Investment Management LLC |
Performance Overview
For the 12-month period ended June 30, 2013, INTECH Global Dividend Fund’s Class I Shares returned 15.77%. This compares to the 18.58% return posted by the MSCI World Index, the Fund’s primary benchmark, for the same time period. The Fund’s secondary benchmark, the MSCI World High Dividend Yield Index, returned 16.26%.
Investment Strategy
INTECH’s mathematical investing process seeks to build a more efficient portfolio than its benchmark, with returns in excess of the index while maintaining benchmark-like risk. The process does not attempt to predict the direction of the market, nor does it have a view of any particular company in the portfolio. Instead, it employs a proprietary optimization process to build portfolios with the potential to outperform the index by capturing stocks’ natural volatility.
Within specific risk controls, INTECH’s disciplined mathematical process establishes target proportional weightings for stocks in the portfolio as a result of an optimization routine. Once the weights are determined and the portfolio is constructed, it is rebalanced and re-optimized on a periodic basis. By limiting the distance any one stock position can deviate from its benchmark weight, INTECH’s process attempts to control the relative risk of the portfolio. We believe that instituting an investment process aimed at providing consistent, positive excess returns at benchmark-like risk, will allow us to meet our investors’ objectives while minimizing the risk of significant underperformance relative to the benchmark.
Performance Review
As stock prices moved naturally throughout the period, we continued to implement our mathematical process in a disciplined manner in an effort to maintain a more efficient portfolio than the benchmark, without increasing relative risk. While other factors may influence performance over the short term, we believe that the consistent application of our process will help the Fund perform well over the long term.
In INTECH’s history, which spans more than 26 years, we have experienced periods of both underperformance and outperformance relative to the benchmark. From our perspective, the key is to keep periods of underperformance both short in duration and mild in scope. INTECH aims to achieve excess returns over the long term and we believe the Fund remains well positioned for long-term growth of capital and income.
Investment Strategy and Outlook
Going forward, we will continue building portfolios in a disciplined and deliberate manner, with risk management remaining the hallmark of our investment process. While we may experience short periods of underperformance, we aim to exceed the benchmark over a three- to five-year time horizon. As INTECH’s ongoing research efforts yield modest improvements, we will continue implementing changes that we believe are likely to improve the long-term results for our clients.
Thank you for your investment in INTECH Global Dividend Fund.
Janus Mathematical Funds | 1
INTECH Global Dividend Fund (unaudited)
INTECH Global Dividend Fund At A Glance
5 Largest Equity Holdings – (% of Net Assets)
As of June 30, 2013
| | | | | |
Roche Holding A.G.
Medical – Drugs | | | 2.1% | |
Bristol-Myers Squibb Co.
Medical – Drugs | | | 2.0% | |
Hewlett-Packard Co.
Computers | | | 2.0% | |
Telstra Corp., Ltd.
Telephone – Integrated | | | 1.9% | |
Kellogg Co.
Food – Miscellaneous/Diversified | | | 1.8% | |
| | | | | |
| | | | 9.8% | |
Asset Allocation – (% of Net Assets)
As of June 30, 2013
Top Country Allocations – Long Positions (% of Investment Securities)
As of June 30, 2013
2 | JUNE 30, 2013
(unaudited)
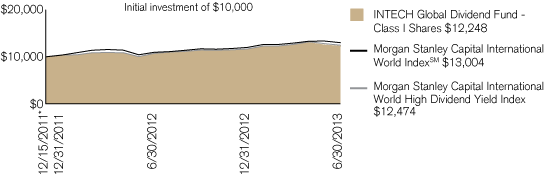
| | | | | | | | | | |
| Average Annual Total Return – for the periods ended June 30, 2013 | | | Expense Ratios – per the October 26, 2012 prospectuses |
| | | One
| | Since
| | | Total Annual Fund
| | Net Annual Fund
|
| | | Year | | Inception* | | | Operating Expenses | | Operating Expenses |
| | | | | | | | | | |
| INTECH Global Dividend Fund – Class A Shares | | | | | | | | | |
| | | | | | | | | | |
| NAV | | 15.41% | | 13.75% | | | 5.58% | | 0.77% |
| | | | | | | | | | |
| MOP | | 8.82% | | 9.47% | | | | | |
| | | | | | | | | | |
| INTECH Global Dividend Fund- Class C Shares | | | | | | | | | |
| | | | | | | | | | |
| NAV | | 14.50% | | 12.93% | | | 6.33% | | 1.52% |
| | | | | | | | | | |
| CDSC | | 13.50% | | 12.93% | | | | | |
| | | | | | | | | | |
| INTECH Global Dividend Fund – Class D Shares(1) | | 15.49% | | 13.74% | | | 6.15% | | 0.81% |
| | | | | | | | | | |
| INTECH Global Dividend Fund – Class I Shares | | 15.77% | | 14.05% | | | 5.07% | | 0.52% |
| | | | | | | | | | |
| INTECH Global Dividend Fund – Class S Shares | | 15.40% | | 13.68% | | | 5.84% | | 1.02% |
| | | | | | | | | | |
| INTECH Global Dividend Fund – Class T Shares | | 15.55% | | 13.84% | | | 5.53% | | 0.77% |
| | | | | | | | | | |
| Morgan Stanley Capital International World IndexSM | | 18.58% | | 18.56% | | | | | |
| | | | | | | | | | |
| Morgan Stanley Capital International World High Dividend Yield Index | | 16.26% | | 15.41% | | | | | |
| | | | | | | | | | |
| Morningstar Quartile – Class I Shares | | 3rd | | 4th | | | | | |
| | | | | | | | | | |
| Morningstar Ranking – based on total returns for World Stock Funds | | 697/1,034 | | 766/934 | | | | | |
| | | | | | | | | | |
| Visit janus.com/advisor/mutual-funds (or janus.com/allfunds if you hold Shares directly with Janus Capital) to view current performance and characteristic information | | | | | |
| | | | | | | | | | |
Returns quoted are past performance and do not guarantee future results; current performance may be lower or higher. Investment returns and principal value will vary; there may be a gain or loss when shares are sold. For the most recent month-end performance call 877.33JANUS(52687) (or 800.525.3713 if you hold shares directly with Janus Capital) or visit janus.com/advisor/mutual-funds (or janus.com/allfunds if you hold shares directly with Janus Capital).
Performance shown for Class A Shares at Maximum Offering Price (MOP) includes the Fund’s maximum sales charge of 5.75%. Performance shown at Net Asset Value (NAV) does not include this charge and would have been lower had this charge been taken into account.
Performance shown for Class C Shares includes a 1% contingent deferred sales charge (CDSC) on periods of less than 12 months. Performance shown at Net Asset Value (NAV) does not include this sales charge and would have been lower had this sales charge been taken into account.
See important disclosures on the next page.
Janus Mathematical Funds | 3
INTECH Global Dividend Fund (unaudited)
Net expense ratios reflect the expense waiver, if any, Janus Capital has contractually agreed to through November 1, 2013.
The proprietary mathematical process used by INTECH Investment Management LLC (“INTECH”) may not achieve the desired results. The rebalancing techniques used by the Fund may result in a higher portfolio turnover rate, higher expenses and potentially higher net taxable gains or losses compared to a “buy and hold” or index fund strategy.
The Fund’s performance may be affected by risks that include those associated with investments in specific industries or countries and potential conflicts of interest with the Janus “funds of funds.” Additional risks to the Fund may include those associated with investing in foreign securities, initial public offerings (“IPOs”), real estate investment trusts (“REITs”), and derivatives. Please see the Fund’s prospectuses or janus.com/info (or janus.com/reports if you hold shares directly with Janus Capital) for more information about risks, portfolio holdings and other details.
Foreign securities have additional risks including exchange rate changes, political and economic upheaval, the relative lack of information, relatively low market liquidity and the potential lack of strict financial and accounting controls and standards. These risks are magnified in emerging markets. The prices of foreign securities held by the Fund, and therefore the Fund’s performance, may decline in response to such risks.
For a period of three years subsequent to the effective date, Janus Capital may recover from the Fund fees and expenses previously waived or reimbursed, which could then be considered a deferral, if the Fund’s expense ratio, including recovered expenses, falls below the expense limit.
The Fund will normally invest at least 80% of its net assets, measured at the time of purchase, in the type of securities described by its name.
Returns include reinvestment of all dividends and distributions. The returns do not include adjustments in accordance with generally accepted accounting principles required at the period end for financial reporting purposes.
Ranking is for the share class shown only; other classes may have different performance characteristics. When an expense waiver is in effect, it may have a material effect on the total return, and therefore the ranking for the period.
© 2013 Morningstar, Inc. All Rights Reserved.
There is no assurance that the investment process will consistently lead to successful investing.
See Notes to Schedules of Investments and Other Information for index definitions.
The weighting of securities within the portfolio may differ significantly from the weightings within the indices. The indices are unmanaged and are not available for direct investment; therefore, their performance does not reflect the expenses associated with the active management of an actual portfolio.
See “Useful Information About Your Fund Report.”
| | | |
| * | | The Fund’s inception date – December 15, 2011 |
| (1) | | Closed to new investors. |
4 | JUNE 30, 2013
(unaudited)
As a shareholder of the Fund, you incur two types of costs: (1) transaction costs, such as sales charges (loads) on purchase payments (applicable to Class A Shares only); and (2) ongoing costs, including management fees; distribution and shareholder servicing (12b-1) fees; administrative services fees payable pursuant to the Transfer Agency Agreement; and other Fund expenses. This example is intended to help you understand your ongoing costs (in dollars) of investing in the Fund and to compare these costs with the ongoing costs of investing in other mutual funds. To do so, compare this 5% hypothetical example with the 5% hypothetical examples that appear in the shareholder reports of the other funds. The example is based upon an investment of $1,000 invested at the beginning of the period and held for the six-months indicated, unless noted otherwise in the table and footnotes below.
Actual Expenses
The information in the table under the heading “Actual” provides information about actual account values and actual expenses. You may use the information in these columns, together with the amount you invested, to estimate the expenses that you paid over the period. Simply divide your account value by $1,000 (for example, an $8,600 account value divided by $1,000 = 8.6), then multiply the result by the number in the appropriate column for your share class under the heading entitled “Expenses Paid During Period” to estimate the expenses you paid on your account during the period.
Hypothetical Example for Comparison Purposes
The information in the table under the heading “Hypothetical (5% return before expenses)” provides information about hypothetical account values and hypothetical expenses based upon the Fund’s actual expense ratio and an assumed rate of return of 5% per year before expenses, which is not the Fund’s actual return. The hypothetical account values and expenses may not be used to estimate the actual ending account balance or expenses you paid for the period. You may use this information to compare the ongoing costs of investing in the Fund and other funds. To do so, compare this 5% hypothetical example with the 5% hypothetical examples that appear in the shareholder reports of the other funds. Additionally, for an analysis of the fees associated with an investment in any share class or other similar funds, please visit www.finra.org/fundanalyzer.
Please note that the expenses shown in the table are meant to highlight your ongoing costs only and do not reflect any transaction costs. These fees are fully described in the Fund’s prospectuses. Therefore, the hypothetical examples are useful in comparing ongoing costs only, and will not help you determine the relative total costs of owning different funds. In addition, if these transaction costs were included, your costs would have been higher.
| | | | | | | | | | | | | | | | | | | | | | | | | | | | | | | |
| | | | | Hypothetical
| | | | |
| | | Actual | | (5% return before expenses) | | | | |
| | | Beginning
| | Ending
| | Expenses
| | Beginning
| | Ending
| | Expenses
| | | | |
| | | Account
| | Account
| | Paid During
| | Account
| | Account
| | Paid During
| | Net Annualized
| | |
| | | Value
| | Value
| | Period
| | Value
| | Value
| | Period
| | Expense Ratio
| | |
| | | (1/1/13) | | (6/30/13) | | (1/1/13 - 6/30/13)† | | (1/1/13) | | (6/30/13) | | (1/1/13 - 6/30/13)† | | (1/1/13 - 6/30/13) | | |
| |
| |
| Class A Shares | | $ | 1,000.00 | | | $ | 1,055.90 | | | $ | 3.87 | | | $ | 1,000.00 | | | $ | 1,021.03 | | | $ | 3.81 | | | | 0.76% | | | |
| |
| |
| Class C Shares | | $ | 1,000.00 | | | $ | 1,052.40 | | | $ | 7.68 | | | $ | 1,000.00 | | | $ | 1,017.31 | | | $ | 7.55 | | | | 1.51% | | | |
| |
| |
| Class D Shares | | $ | 1,000.00 | | | $ | 1,057.00 | | | $ | 3.37 | | | $ | 1,000.00 | | | $ | 1,021.52 | | | $ | 3.31 | | | | 0.66% | | | |
| |
| |
| Class I Shares | | $ | 1,000.00 | | | $ | 1,057.20 | | | $ | 2.60 | | | $ | 1,000.00 | | | $ | 1,022.27 | | | $ | 2.56 | | | | 0.51% | | | |
| |
| |
| Class S Shares | | $ | 1,000.00 | | | $ | 1,057.70 | | | $ | 2.96 | | | $ | 1,000.00 | | | $ | 1,021.92 | | | $ | 2.91 | | | | 0.58% | | | |
| |
| |
| Class T Shares | | $ | 1,000.00 | | | $ | 1,057.20 | | | $ | 3.06 | | | $ | 1,000.00 | | | $ | 1,021.82 | | | $ | 3.01 | | | | 0.60% | | | |
| |
| |
| | | |
| † | | Expenses Paid During Period are equal to the Net Annualized Expense Ratio multiplied by the average account value over the period, multiplied by the number of days in the most recent six-month period, divided by the number of days in the fiscal year. Expenses in the examples include the effect of applicable fee waivers and/or expense reimbursements, if any. Had such waivers and/or reimbursements not been in effect, your expenses would have been higher. Please refer to the Notes to Financial Statements or the Fund’s prospectuses for more information regarding waivers and/or reimbursements. |
Janus Mathematical Funds | 5
INTECH Global Dividend Fund
Schedule of Investments
As of June 30, 2013
| | | | | | | | | | | |
| Shares | | Value | | | |
| |
| Common Stock – 98.7% | | | | | | |
| Aerospace and Defense – 1.0% | | | | | | |
| | 4,355 | | | BAE Systems PLC | | $ | 25,365 | | | |
| | 200 | | | Lockheed Martin Corp. | | | 21,692 | | | |
| | 200 | | | Northrop Grumman Corp. | | | 16,560 | | | |
| | 400 | | | Raytheon Co. | | | 26,448 | | | |
| | | | | | | | 90,065 | | | |
| Aerospace and Defense – Equipment – 0.3% | | | | | | |
| | 6,956 | | | Cobham PLC | | | 27,725 | | | |
| Airport Development – Maintenance – 0.2% | | | | | | |
| | 9,555 | | | Auckland International Airport, Ltd. | | | 21,985 | | | |
| Apparel Manufacturers – 0.1% | | | | | | |
| | 117 | | | Hugo Boss A.G. | | | 12,883 | | | |
| Appliances – 0.2% | | | | | | |
| | 551 | | | Electrolux A.B. | | | 13,928 | | | |
| Athletic Footwear – 0.2% | | | | | | |
| | 8,000 | | | Yue Yuen Industrial Holdings, Ltd. | | | 20,733 | | | |
| Automotive – Cars and Light Trucks – 0.4% | | | | | | |
| | 1,000 | | | Daihatsu Motor Co., Ltd. | | | 18,959 | | | |
| | 273 | | | Daimler A.G. | | | 16,517 | | | |
| | | | | | | | 35,476 | | | |
| Automotive – Medium and Heavy Duty Trucks – 0.1% | | | | | | |
| | 663 | | | Scania A.B. – Class B | | | 13,287 | | | |
| Beverages – Non-Alcoholic – 0.1% | | | | | | |
| | 1,094 | | | Coca-Cola Amatil, Ltd. | | | 12,713 | | | |
| Building – Heavy Construction – 1.0% | | | | | | |
| | 677 | | | ACS Actividades de Construccion y Servicios S.A. | | | 17,931 | | | |
| | 836 | | | Aker Solutions A.S.A. | | | 11,379 | | | |
| | 3,000 | | | Cheung Kong Infrastructure Holdings, Ltd. | | | 19,998 | | | |
| | 954 | | | Skanska A.B. – Class B | | | 15,844 | | | |
| | 534 | | | Vinci S.A. | | | 26,796 | | | |
| | | | | | | | 91,948 | | | |
| Building and Construction – Miscellaneous – 1.4% | | | | | | |
| | 910 | | | Bouygues S.A. | | | 23,226 | | | |
| | 5,777 | | | Ferrovial S.A. | | | 92,331 | | | |
| | 291 | | | Koninklijke Boskalis Westminster N.V. | | | 10,610 | | | |
| | | | | | | | 126,167 | | | |
| Building and Construction Products – Miscellaneous – 0.3% | | | | | | |
| | 347 | | | Cie de Saint-Gobain | | | 14,045 | | | |
| | 39 | | | Geberit A.G. | | | 9,677 | | | |
| | | | | | | | 23,722 | | | |
| Building Products – Cement and Aggregate – 0.3% | | | | | | |
| | 720 | | | CRH PLC | | | 14,572 | | | |
| | 1,743 | | | James Hardie Industries PLC (CDI) | | | 14,964 | | | |
| | | | | | | | 29,536 | | | |
| Cable/Satellite Television – 0.6% | | | | | | |
| | 1,309 | | | British Sky Broadcasting Group PLC | | | 15,765 | | | |
| | 1,000 | | | Cablevision Systems Corp. – Class A | | | 16,820 | | | |
| | 1,100 | | | Shaw Communications, Inc. – Class B | | | 26,407 | | | |
| | | | | | | | 58,992 | | | |
| Casino Hotels – 0.4% | | | | | | |
| | 3,600 | | | Sands China, Ltd. | | | 16,965 | | | |
| | 6,582 | | | SKYCITY Entertainment Group, Ltd. | | | 22,232 | | | |
| | | | | | | | 39,197 | | | |
| Casino Services – 0.2% | | | | | | |
| | 300 | | | Sankyo Co., Ltd. | | | 14,174 | | | |
| Cellular Telecommunications – 0.6% | | | | | | |
| | 365 | | | Millicom International Cellular S.A. (SDR) | | | 26,312 | | | |
| | 300 | | | Rogers Communications, Inc. – Class B | | | 11,756 | | | |
| | 7,731 | | | Vodafone Group PLC | | | 22,085 | | | |
| | | | | | | | 60,153 | | | |
| Chemicals – Diversified – 0.8% | | | | | | |
| | 133 | | | BASF S.E. | | | 11,880 | | | |
| | 300 | | | E.I. du Pont de Nemours & Co. | | | 15,750 | | | |
| | 276 | | | K+S A.G. | | | 10,204 | | | |
| | 544 | | | Koninklijke DSM N.V. | | | 35,443 | | | |
| | | | | | | | 73,277 | | | |
| Chemicals – Specialty – 0.6% | | | | | | |
| | 734 | | | Lonza Group A.G. | | | 55,305 | | | |
| Commercial Banks – 2.7% | | | | | | |
| | 679 | | | Australia & New Zealand Banking Group, Ltd. | | | 17,743 | | | |
| | 200 | | | Bank of Montreal | | | 11,604 | | | |
| | 300 | | | Bank of Nova Scotia | | | 16,041 | | | |
| | 6,089 | | | Bendigo and Adelaide Bank, Ltd. | | | 56,061 | | | |
| | 6,000 | | | BOC Hong Kong Holdings, Ltd. | | | 18,451 | | | |
| | 200 | | | Canadian Imperial Bank of Commerce | | | 14,198 | | | |
| | 1,000 | | | DBS Group Holdings, Ltd. | | | 12,233 | | | |
| | 2,900 | | | Hang Seng Bank, Ltd. | | | 42,888 | | | |
| | 2,000 | | | Oversea-Chinese Banking Corp., Ltd. | | | 15,784 | | | |
| | 200 | | | Royal Bank of Canada | | | 11,657 | | | |
| | 200 | | | Toronto-Dominion Bank | | | 16,068 | | | |
| | 1,000 | | | United Overseas Bank, Ltd. | | | 15,674 | | | |
| | | | | | | | 248,402 | | | |
| Commercial Services – Finance – 1.5% | | | | | | |
| | 3,800 | | | H&R Block, Inc. | | | 105,450 | | | |
| | 700 | | | Paychex, Inc. | | | 25,564 | | | |
| | 600 | | | Western Union Co. | | | 10,266 | | | |
| | | | | | | | 141,280 | | | |
| Computers – 2.0% | | | | | | |
| | 7,300 | | | Hewlett-Packard Co. | | | 181,040 | | | |
| Computers – Memory Devices – 0.5% | | | | | | |
| | 1,000 | | | Seagate Technology PLC | | | 44,830 | | | |
| Consumer Products – Miscellaneous – 1.8% | | | | | | |
| | 800 | | | Clorox Co. | | | 66,512 | | | |
| | 2,600 | | | Husqvarna A.B. – Class B | | | 13,730 | | | |
| | 900 | | | Kimberly-Clark Corp. | | | 87,426 | | | |
| | | | | | | | 167,668 | | | |
| Containers – Paper and Plastic – 0.8% | | | | | | |
| | 8,325 | | | Amcor, Ltd. | | | 77,181 | | | |
| Distribution/Wholesale – 1.2% | | | | | | |
| | 1,400 | | | Genuine Parts Co. | | | 109,298 | | | |
| Diversified Financial Services – 0.2% | | | | | | |
| | 2,326 | | | Investec PLC | | | 14,633 | | | |
| Diversified Minerals – 0.3% | | | | | | |
| | 556 | | | Anglo American PLC | | | 10,704 | | | |
| | 511 | | | BHP Billiton PLC | | | 13,071 | | | |
| | | | | | | | 23,775 | | | |
| Diversified Operations – 2.4% | | | | | | |
| | 1,866 | | | ALS, Ltd. | | | 16,344 | | | |
| | 1,017 | | | Industrivarden A.B. – Class C | | | 16,997 | | | |
See Notes to Schedules of Investments and Other Information and Notes to Financial Statements.
6 | JUNE 30, 2013
Schedule of Investments
As of June 30, 2013
| | | | | | | | | | | |
| Shares | | Value | | | |
| |
| Diversified Operations – (continued) | | | | | | |
| | 2,000 | | | Keppel Corp., Ltd. | | $ | 16,415 | | | |
| | 2,300 | | | Leggett & Platt, Inc. | | | 71,507 | | | |
| | 18,000 | | | NWS Holdings, Ltd. | | | 27,711 | | | |
| | 1,913 | | | Orkla A.S.A. | | | 15,677 | | | |
| | 118 | | | Siemens A.G. | | | 11,925 | | | |
| | 1,000 | | | Swire Pacific, Ltd. – Class A | | | 12,107 | | | |
| | 755 | | | Wartsila Oyj Abp | | | 32,850 | | | |
| | | | | | | | 221,533 | | | |
| Diversified Operations – Commercial Services – 1.0% | | | | | | |
| | 11,123 | | | Brambles, Ltd. | | | 94,986 | | | |
| Electric – Integrated – 7.2% | | | | | | |
| | 300 | | | Alliant Energy Corp. | | | 15,126 | | | |
| | 1,200 | | | American Electric Power Co., Inc. | | | 53,736 | | | |
| | 2,000 | | | CLP Holdings, Ltd. | | | 16,181 | | | |
| | 1,000 | | | CMS Energy Corp. | | | 27,170 | | | |
| | 300 | | | Consolidated Edison, Inc. | | | 17,493 | | | |
| | 300 | | | DTE Energy Co. | | | 20,103 | | | |
| | 266 | | | Duke Energy Corp. | | | 17,955 | | | |
| | 8,452 | | | Energias de Portugal S.A. | | | 27,226 | | | |
| | 300 | | | Entergy Corp. | | | 20,904 | | | |
| | 500 | | | FirstEnergy Corp. | | | 18,670 | | | |
| | 400 | | | Fortis, Inc. | | | 12,247 | | | |
| | 894 | | | Fortum Oyj | | | 16,755 | | | |
| | 300 | | | Integrys Energy Group, Inc. | | | 17,559 | | | |
| | 400 | | | NextEra Energy, Inc. | | | 32,592 | | | |
| | 362 | | | Northeast Utilities | | | 15,211 | | | |
| | 6,905 | | | Origin Energy, Ltd. | | | 79,358 | | | |
| | 1,100 | | | Pepco Holdings, Inc. | | | 22,176 | | | |
| | 500 | | | PG&E Corp. | | | 22,865 | | | |
| | 300 | | | Pinnacle West Capital Corp. | | | 16,641 | | | |
| | 9,000 | | | Power Assets Holdings, Ltd. | | | 77,632 | | | |
| | 700 | | | PPL Corp. | | | 21,182 | | | |
| | 700 | | | Public Service Enterprise Group, Inc. | | | 22,862 | | | |
| | 300 | | | SCANA Corp. | | | 14,730 | | | |
| | 300 | | | Southern Co. | | | 13,239 | | | |
| | 791 | | | SSE PLC | | | 18,320 | | | |
| | 300 | | | Wisconsin Energy Corp. | | | 12,297 | | | |
| | 600 | | | Xcel Energy, Inc. | | | 17,004 | | | |
| | | | | | | | 667,234 | | | |
| Electric – Transmission – 0.5% | | | | | | |
| | 357 | | | Red Electrica Corp. S.A. | | | 19,631 | | | |
| | 7,137 | | | Terna Rete Elettrica Nazionale SpA | | | 29,650 | | | |
| | | | | | | | 49,281 | | | |
| Electronic Components – Miscellaneous – 0.5% | | | | | | |
| | 600 | | | Garmin, Ltd. | | | 21,696 | | | |
| | 600 | | | Hoya Corp. | | | 12,398 | | | |
| | 497 | | | Koninklijke Philips N.V. | | | 13,548 | | | |
| | | | | | | | 47,642 | | | |
| Electronic Components – Semiconductors – 1.1% | | | | | | |
| | 600 | | | Intel Corp. | | | 14,532 | | | |
| | 400 | | | Microchip Technology, Inc. | | | 14,900 | | | |
| | 8,454 | | | STMicroelectronics N.V. | | | 76,151 | | | |
| | | | | | | | 105,583 | | | |
| Electronic Parts Distributors – 0.2% | | | | | | |
| | 756 | | | Rexel S.A. | | | 17,002 | | | |
| Engineering – Research and Development Services – 0.3% | | | | | | |
| | 343 | | | ABB, Ltd. | | | 7,450 | | | |
| | 3,000 | | | SembCorp Industries, Ltd. | | | 11,719 | | | |
| | 612 | | | WorleyParsons, Ltd. | | | 10,906 | | | |
| | | | | | | | 30,075 | | | |
| Enterprise Software/Services – 0.2% | | | | | | |
| | 800 | | | CA, Inc. | | | 22,904 | | | |
| Finance – Investment Bankers/Brokers – 0.3% | | | | | | |
| | 4,291 | | | ICAP PLC | | | 23,720 | | | |
| Finance – Other Services – 1.2% | | | | | | |
| | 2,400 | | | NYSE Euronext | | | 99,360 | | | |
| | 2,000 | | | Singapore Exchange, Ltd. | | | 11,096 | | | |
| | | | | | | | 110,456 | | | |
| Food – Miscellaneous/Diversified – 6.8% | | | | | | |
| | 2,600 | | | Campbell Soup Co. | | | 116,454 | | | |
| | 4,600 | | | ConAgra Foods, Inc. | | | 160,678 | | | |
| | 2,800 | | | General Mills, Inc. | | | 135,884 | | | |
| | 2,600 | | | Kellogg Co. | | | 166,998 | | | |
| | 500 | | | Kraft Foods Group, Inc. | | | 27,935 | | | |
| | 103 | | | Nestle S.A. | | | 6,757 | | | |
| | 217 | | | Unilever N.V. | | | 8,545 | | | |
| | 301 | | | Unilever PLC | | | 12,185 | | | |
| | | | | | | | 635,436 | | | |
| Food – Retail – 4.6% | | | | | | |
| | 192 | | | Casino Guichard Perrachon S.A. | | | 17,985 | | | |
| | 1,492 | | | Delhaize Group S.A. | | | 92,218 | | | |
| | 2,910 | | | J. Sainsbury PLC | | | 15,723 | | | |
| | 605 | | | Kesko Oyj – Class B | | | 16,819 | | | |
| | 3,231 | | | Koninklijke Ahold N.V. | | | 48,086 | | | |
| | 3,500 | | | Safeway, Inc. | | | 82,810 | | | |
| | 2,445 | | | Tesco PLC | | | 12,322 | | | |
| | 2,921 | | | WM Morrison Supermarkets PLC | | | 11,629 | | | |
| | 4,417 | | | Woolworths, Ltd. | | | 132,502 | | | |
| | | | | | | | 430,094 | | | |
| Food – Wholesale/Distribution – 0.7% | | | | | | |
| | 15,710 | | | Metcash, Ltd. | | | 50,560 | | | |
| | 400 | | | Sysco Corp. | | | 13,664 | | | |
| | | | | | | | 64,224 | | | |
| Gas – Distribution – 3.3% | | | | | | |
| | 900 | | | CenterPoint Energy, Inc. | | | 21,141 | | | |
| | 2,950 | | | Centrica PLC | | | 16,159 | | | |
| | 1,740 | | | Enagas S.A. | | | 42,994 | | | |
| | 4,268 | | | Gas Natural SDG S.A. | | | 86,044 | | | |
| | 2,276 | | | National Grid PLC | | | 25,820 | | | |
| | 900 | | | NiSource, Inc. | | | 25,776 | | | |
| | 1,100 | | | Sempra Energy | | | 89,936 | | | |
| | | | | | | | 307,870 | | | |
| Gas – Transportation – 0.3% | | | | | | |
| | 6,024 | | | Snam SpA | | | 27,441 | | | |
| Gold Mining – 0.1% | | | | | | |
| | 400 | | | Newmont Mining Corp. | | | 11,980 | | | |
| Human Resources – 0.5% | | | | | | |
| | 296 | | | Adecco S.A. | | | 16,880 | | | |
| | 828 | | | Randstad Holding N.V. | | | 33,946 | | | |
| | | | | | | | 50,826 | | | |
| | | | | | | | | | | |
See Notes to Schedules of Investments and Other Information and Notes to Financial Statements.
Janus Mathematical Funds | 7
INTECH Global Dividend Fund
Schedule of Investments
As of June 30, 2013
| | | | | | | | | | | |
| Shares | | Value | | | |
| |
| Import/Export – 2.0% | | | | | | |
| | 9,700 | | | ITOCHU Corp. | | $ | 112,006 | | | |
| | 6,000 | | | Marubeni Corp. | | | 40,117 | | | |
| | 500 | | | Mitsubishi Corp. | | | 8,567 | | | |
| | 1,000 | | | Mitsui & Co., Ltd. | | | 12,566 | | | |
| | 1,100 | | | Sumitomo Corp. | | | 13,722 | | | |
| | | | | | | | 186,978 | | | |
| Investment Management and Advisory Services – 0.5% | | | | | | |
| | 700 | | | CI Financial Corp. | | | 20,153 | | | |
| | 300 | | | IGM Financial, Inc. | | | 12,866 | | | |
| | 5,137 | | | Old Mutual PLC | | | 14,116 | | | |
| | | | | | | | 47,135 | | | |
| Life and Health Insurance – 1.7% | | | | | | |
| | 8,471 | | | Legal & General Group PLC | | | 22,080 | | | |
| | 400 | | | Power Corp. of Canada | | | 10,736 | | | |
| | 500 | | | Power Financial Corp. | | | 14,543 | | | |
| | 18,127 | | | Standard Life PLC | | | 95,295 | | | |
| | 78 | | | Swiss Life Holding A.G. | | | 12,687 | | | |
| | | | | | | | 155,341 | | | |
| Lottery Services – 0.3% | | | | | | |
| | 9,573 | | | Tatts Group, Ltd. | | | 27,746 | | | |
| Machinery – Construction and Mining – 0.1% | | | | | | |
| | 618 | | | Atlas Copco A.B. – Class B | | | 13,261 | | | |
| Machinery – General Industrial – 0.3% | | | | | | |
| | 410 | | | Metso Oyj | | | 13,938 | | | |
| | 997 | | | Zardoya Otis S.A. | | | 14,131 | | | |
| | | | | | | | 28,069 | | | |
| Medical – Drugs – 10.8% | | | | | | |
| | 1,800 | | | AbbVie, Inc. | | | 74,412 | | | |
| | 422 | | | AstraZeneca PLC | | | 19,990 | | | |
| | 4,200 | | | Bristol-Myers Squibb Co. | | | 187,698 | | | |
| | 500 | | | Eisai Co., Ltd. | | | 20,396 | | | |
| | 2,600 | | | Eli Lilly & Co. | | | 127,712 | | | |
| | 765 | | | GlaxoSmithKline PLC | | | 19,172 | | | |
| | 200 | | | Johnson & Johnson | | | 17,172 | | | |
| | 300 | | | Merck & Co., Inc. | | | 13,935 | | | |
| | 278 | | | Novartis A.G. | | | 19,754 | | | |
| | 500 | | | Ono Pharmaceutical Co., Ltd. | | | 33,935 | | | |
| | 736 | | | Orion Oyj – Class B | | | 17,261 | | | |
| | 3,000 | | | Pfizer, Inc. | | | 84,030 | | | |
| | 797 | | | Roche Holding A.G. | | | 198,343 | | | |
| | 425 | | | Sanofi | | | 44,041 | | | |
| | 2,800 | | | Takeda Pharmaceutical Co., Ltd. | | | 126,503 | | | |
| | | | | | | | 1,004,354 | | | |
| Medical Products – 0.2% | | | | | | |
| | 263 | | | Cochlear, Ltd. | | | 14,839 | | | |
| Metal – Copper – 0.3% | | | | | | |
| | 377 | | | Antofagasta PLC | | | 4,558 | | | |
| | 900 | | | Freeport-McMoRan Copper & Gold, Inc. | | | 24,849 | | | |
| | | | | | | | 29,407 | | | |
| Metal – Diversified – 0.3% | | | | | | |
| | 873 | | | Boliden A.B. | | | 10,832 | | | |
| | 324 | | | Rio Tinto PLC | | | 13,219 | | | |
| | | | | | | | 24,051 | | | |
| Metal Processors and Fabricators – 0.2% | | | | | | |
| | 633 | | | SKF A.B. – Class B | | | 14,839 | | | |
| Mining Services – 0.1% | | | | | | |
| | 613 | | | Orica, Ltd. | | | 11,574 | | | |
| MRI and Medical Diagnostic Imaging Center – 0.1% | | | | | | |
| | 764 | | | Sonic Healthcare, Ltd. | | | 10,345 | | | |
| Multi-Line Insurance – 3.2% | | | | | | |
| | 76 | | | Allianz S.E. | | | 11,103 | | | |
| | 1,300 | | | Cincinnati Financial Corp. | | | 59,670 | | | |
| | 3,239 | | | CNP Assurances | | | 46,477 | | | |
| | 9,009 | | | Mapfre S.A. | | | 29,337 | | | |
| | 3,308 | | | Sampo Oyj – Class A | | | 128,903 | | | |
| | 80 | | | Zurich Insurance Group A.G. | | | 20,756 | | | |
| | | | | | | | 296,246 | | | |
| Multimedia – 0.9% | | | | | | |
| | 1,429 | | | Lagardere S.C.A. | | | 39,801 | | | |
| | 751 | | | Pearson PLC | | | 13,373 | | | |
| | 1,000 | | | Thomson Reuters Corp. | | | 32,642 | | | |
| | | | | | | | 85,816 | | | |
| Non-Hazardous Waste Disposal – 0.4% | | | | | | |
| | 1,000 | | | Waste Management, Inc. | | | 40,330 | | | |
| Oil – Field Services – 0.3% | | | | | | |
| | 990 | | | AMEC PLC | | | 15,130 | | | |
| | 254 | | | Fugro N.V. | | | 13,769 | | | |
| | | | | | | | 28,899 | | | |
| Oil and Gas Drilling – 0.3% | | | | | | |
| | 624 | | | Seadrill, Ltd. | | | 25,198 | | | |
| Oil Companies – Exploration and Production – 0.6% | | | | | | |
| | 600 | | | Baytex Energy Trust | | | 21,628 | | | |
| | 300 | | | ConocoPhillips | | | 18,150 | | | |
| | 300 | | | Vermilion Energy, Inc. | | | 14,669 | | | |
| | | | | | | | 54,447 | | | |
| Oil Companies – Integrated – 1.8% | | | | | | |
| | 100 | | | Chevron Corp. | | | 11,834 | | | |
| | 600 | | | Husky Energy, Inc. | | | 15,990 | | | |
| | 1,166 | | | OMV A.G. | | | 52,659 | | | |
| | 777 | | | Repsol S.A. | | | 16,393 | | | |
| | 484 | | | Royal Dutch Shell PLC – Class A | | | 15,456 | | | |
| | 570 | | | Royal Dutch Shell PLC – Class B | | | 18,862 | | | |
| | 639 | | | Statoil A.S.A. | | | 13,186 | | | |
| | 486 | | | Total S.A. | | | 23,723 | | | |
| | | | | | | | 168,103 | | | |
| Paper and Related Products – 0.1% | | | | | | |
| | 400 | | | MeadWestvaco Corp. | | | 13,644 | | | |
| Pipelines – 0.5% | | | | | | |
| | 500 | | | Spectra Energy Corp. | | | 17,230 | | | |
| | 300 | | | TransCanada Corp. | | | 12,920 | | | |
| | 500 | | | Williams Cos., Inc. | | | 16,235 | | | |
| | | | | | | | 46,385 | | | |
| Property and Casualty Insurance – 0.7% | | | | | | |
| | 1,278 | | | Admiral Group PLC | | | 25,790 | | | |
| | 1,666 | | | Gjensidige Forsikring A.S.A. | | | 24,515 | | | |
| | 208 | | | Tryg A/S | | | 17,146 | | | |
| | | | | | | | 67,451 | | | |
See Notes to Schedules of Investments and Other Information and Notes to Financial Statements.
8 | JUNE 30, 2013
Schedule of Investments
As of June 30, 2013
| | | | | | | | | | | |
| Shares | | Value | | | |
| |
| Public Thoroughfares – 0.5% | | | | | | |
| | 1,427 | | | Abertis Infraestucturas S.A. | | $ | 24,887 | | | |
| | 1,157 | | | Atlantia SpA | | | 18,868 | | | |
| | | | | | | | 43,755 | | | |
| Publishing – Books – 0.2% | | | | | | |
| | 1,051 | | | Reed Elsevier N.V. | | | 17,509 | | | |
| Publishing – Newspapers – 0.3% | | | | | | |
| | 8,000 | | | Singapore Press Holdings, Ltd. | | | 26,328 | | | |
| Publishing – Periodicals – 0.6% | | | | | | |
| | 365 | | | Axel Springer A.G. | | | 15,570 | | | |
| | 2,562 | | | Reed Elsevier PLC | | | 29,103 | | | |
| | 616 | | | Wolters Kluwer N.V. | | | 13,032 | | | |
| | | | | | | | 57,705 | | | |
| Real Estate Management/Services – 0.1% | | | | | | |
| | 176 | | | Swiss Prime Site A.G. | | | 12,944 | | | |
| Real Estate Operating/Development – 0.8% | | | | | | |
| | 400 | | | Brookfield Office Properties, Inc. | | | 6,654 | | | |
| | 200 | | | Daito Trust Construction Co., Ltd. | | | 18,858 | | | |
| | 4,500 | | | Hopewell Holdings, Ltd. | | | 14,999 | | | |
| | 6,000 | | | Keppel Land, Ltd. | | | 15,863 | | | |
| | 10,000 | | | Sino Land Co., Ltd. | | | 14,080 | | | |
| | | | | | | | 70,454 | | | |
| Regional Banks – 0.2% | | | | | | |
| | 37 | | | Banque Cantonale Vaudoise | | | 18,377 | | | |
| Reinsurance – 0.9% | | | | | | |
| | 409 | | | Hannover Rueckversicherung S.E. | | | 29,448 | | | |
| | 101 | | | Muenchener Rueckversicherungs A.G. | | | 18,587 | | | |
| | 617 | | | SCOR S.E. | | | 18,931 | | | |
| | 226 | | | Swiss Re A.G. | | | 16,825 | | | |
| | | | | | | | 83,791 | | | |
| Retail – Apparel and Shoe – 0.2% | | | | | | |
| | 463 | | | Hennes & Mauritz A.B. – Class B | | | 15,227 | | | |
| Retail – Convenience Stores – 0.1% | | | | | | |
| | 100 | | | Lawson, Inc. | | | 7,634 | | | |
| Retail – Major Department Stores – 0.1% | | | | | | |
| | 2,013 | | | Marks & Spencer Group PLC | | | 13,185 | | | |
| Retail – Miscellaneous/Diversified – 0.8% | | | | | | |
| | 2,080 | | | Wesfarmers, Ltd. | | | 75,309 | | | |
| Retail – Office Supplies – 0.3% | | | | | | |
| | 2,000 | | | Staples, Inc. | | | 31,720 | | | |
| Retail – Restaurants – 0.3% | | | | | | |
| | 400 | | | Darden Restaurants, Inc. | | | 20,192 | | | |
| | 100 | | | McDonald’s Corp. | | | 9,900 | | | |
| | | | | �� | | | 30,092 | | | |
| Rubber – Tires – 0.3% | | | | | | |
| | 145 | | | Cie Generale des Etablissements Michelin | | | 12,965 | | | |
| | 290 | | | Nokian Renkaat Oyj | | | 11,818 | | | |
| | | | | | | | 24,783 | | | |
| Satellite Telecommunications – 0.7% | | | | | | |
| | 390 | | | Eutelsat Communications S.A. | | | 11,070 | | | |
| | 2,143 | | | Inmarsat PLC | | | 21,948 | | | |
| | 980 | | | SES S.A. (FDR) | | | 28,061 | | | |
| | | | | | | | 61,079 | | | |
| Savings/Loan/Thrifts – 0.2% | | | | | | |
| | 1,300 | | | People’s United Financial, Inc. | | | 19,370 | | | |
| Security Services – 0.4% | | | | | | |
| | 4,023 | | | G4S PLC | | | 14,095 | | | |
| | 2,282 | | | Securitas A.B. – Class B | | | 19,972 | | | |
| | | | | | | | 34,067 | | | |
| Semiconductor Components/Integrated Circuits – 0.2% | | | | | | |
| | 400 | | | Linear Technology Corp. | | | 14,736 | | | |
| Shipbuilding – 0.2% | | | | | | |
| | 25,000 | | | Yangzijiang Shipbuilding Holdings, Ltd. | | | 16,376 | | | |
| Silver Mining – 0.1% | | | | | | |
| | 719 | | | Fresnillo PLC | | | 9,644 | | | |
| Soap and Cleaning Preparations – 1.5% | | | | | | |
| | 1,974 | | | Reckitt Benckiser Group PLC | | | 139,527 | | | |
| Steel – Producers – 0.2% | | | | | | |
| | 500 | | | Nucor Corp. | | | 21,660 | | | |
| Telecommunication Services – 1.6% | | | | | | |
| | 500 | | | BCE, Inc. | | | 20,506 | | | |
| | 1,000 | | | Bell Aliant, Inc. | | | 26,879 | | | |
| | 37,000 | | | PCCW, Ltd. | | | 17,317 | | | |
| | 6,000 | | | Singapore Telecommunications, Ltd. | | | 17,852 | | | |
| | 9,000 | | | StarHub, Ltd. | | | 29,690 | | | |
| | 1,848 | | | Tele2 A.B. – Class B | | | 21,716 | | | |
| | 792 | | | Telenor A.S.A. | | | 15,704 | | | |
| | | | | | | | 149,664 | | | |
| Telephone – Integrated – 4.9% | | | | | | |
| | 900 | | | AT&T, Inc. | | | 31,860 | | | |
| | 1,585 | | | Belgacom S.A. | | | 35,554 | | | |
| | 38,409 | | | Bezeq Israeli Telecommunication Corp., Ltd. | | | 51,351 | | | |
| | 1,303 | | | Elisa Oyj | | | 25,455 | | | |
| | 400 | | | Nippon Telegraph & Telephone Corp. | | | 20,734 | | | |
| | 45 | | | Swisscom A.G. | | | 19,710 | | | |
| | 8,611 | | | TDC A/S | | | 69,798 | | | |
| | 3,578 | | | TeliaSonera A.B. | | | 23,348 | | | |
| | 40,357 | | | Telstra Corp., Ltd. | | | 176,006 | | | |
| | | | | | | | 453,816 | | | |
| Tobacco – 1.5% | | | | | | |
| | 600 | | | Altria Group, Inc. | | | 20,994 | | | |
| | 293 | | | British American Tobacco PLC | | | 15,004 | | | |
| | 452 | | | Imperial Tobacco Group PLC | | | 15,672 | | | |
| | 400 | | | Lorillard, Inc. | | | 17,472 | | | |
| | 200 | | | Philip Morris International, Inc. | | | 17,324 | | | |
| | 1,000 | | | Reynolds American, Inc. | | | 48,370 | | | |
| | | | | | | | 134,836 | | | |
| Toys – 1.4% | | | | | | |
| | 1,300 | | | Hasbro, Inc. | | | 58,279 | | | |
| | 1,600 | | | Mattel, Inc. | | | 72,496 | | | |
| | | | | | | | 130,775 | | | |
| Transportation – Services – 1.0% | | | | | | |
| | 24,000 | | | ComfortDelGro Corp., Ltd. | | | 34,757 | | | |
| | 110 | | | Kuehne + Nagel International A.G. | | | 12,080 | | | |
| | 9,805 | | | Toll Holdings, Ltd. | | | 47,692 | | | |
| | | | | | | | 94,529 | | | |
See Notes to Schedules of Investments and Other Information and Notes to Financial Statements.
Janus Mathematical Funds | 9
INTECH Global Dividend Fund
Schedule of Investments
As of June 30, 2013
| | | | | | | | | | | |
| Shares | | Value | | | |
| |
| Travel Services – 0.6% | | | | | | |
| | 767 | | | Flight Centre, Ltd. | | $ | 27,581 | | | |
| | 5,852 | | | TUI Travel PLC | | | 31,761 | | | |
| | | | | | | | 59,342 | | | |
| Water – 0.5% | | | | | | |
| | 954 | | | Severn Trent PLC | | | 24,141 | | | |
| | 1,487 | | | Suez Environment Co. | | | 19,206 | | | |
| | | | | | | | 43,347 | | | |
| Wireless Equipment – 1.3% | | | | | | |
| | 10,736 | | | Telefonaktiebolaget L.M. Ericsson – Class B | | | 121,674 | | | |
| |
| |
| Total Common Stock (cost $8,828,749) | | | 9,175,373 | | | |
| |
| |
| Preferred Stock – 0.5% | | | | | | |
| Television – 0.5% | | | | | | |
| | 1,053 | | | ProSiebenSat.1 Media A.G. (cost $35,690) | | | 45,253 | | | |
| |
| |
| Right – 0% | | | | | | |
| Oil Companies – Integrated – 0% | | | | | | |
| | 777 | | | Repsol S.A. (cost $459) | | | 433 | | | |
| |
| |
| Money Market – 2.2% | | | | | | |
| | 205,000 | | | Janus Cash Liquidity Fund LLC, 0%£
(cost $205,000) | | | 205,000 | | | |
| |
| |
| Total Investments (total cost $9,069,898) – 101.4% | | | 9,426,059 | | | |
| |
| |
| Liabilities, net of Cash, Receivables and Other Assets– (1.4)% | | | (133,576) | | | |
| |
| |
| Net Assets – 100% | | $ | 9,292,483 | | | |
| |
| |
Summary of Investments by Country – (Long Positions) (unaudited)
| | | | | | | | | |
| | | | | | % of Investment
| |
| Country | | Value | | | Securities | |
| |
| |
| Australia | | $ | 954,410 | | | | 10.1% | |
| Austria | | | 52,659 | | | | 0.6% | |
| Belgium | | | 127,772 | | | | 1.4% | |
| Canada | | | 330,164 | | | | 3.5% | |
| Denmark | | | 86,944 | | | | 0.9% | |
| Finland | | | 263,799 | | | | 2.8% | |
| France | | | 419,480 | | | | 4.4% | |
| Germany | | | 183,370 | | | | 1.9% | |
| Hong Kong | | | 299,062 | | | | 3.2% | |
| Ireland | | | 14,572 | | | | 0.2% | |
| Israel | | | 51,351 | | | | 0.5% | |
| Italy | | | 75,959 | | | | 0.8% | |
| Japan | | | 460,569 | | | | 4.9% | |
| Netherlands | | | 194,488 | | | | 2.1% | |
| New Zealand | | | 44,217 | | | | 0.5% | |
| Norway | | | 105,659 | | | | 1.1% | |
| Portugal | | | 27,226 | | | | 0.3% | |
| Singapore | | | 223,787 | | | | 2.4% | |
| Spain | | | 344,112 | | | | 3.6% | |
| Sweden | | | 340,967 | | | | 3.6% | |
| Switzerland | | | 427,545 | | | | 4.5% | |
| United Kingdom | | | 856,347 | | | | 9.1% | |
United States†† | | | 3,541,600 | | | | 37.6% | |
| |
| |
| Total | | $ | 9,426,059 | | | | 100.0% | |
| | | |
| †† | | Includes Cash Equivalents of 2.2%. |
See Notes to Schedules of Investments and Other Information and Notes to Financial Statements.
10 | JUNE 30, 2013
INTECH International Fund (unaudited)
| | | | | | | |
Fund Snapshot
INTECH’s active approach focuses on adding value by selecting stocks with unique volatility characteristics and low correlations to one another.
| | | | | | Managed by
INTECH Investment Management LLC |
Performance Overview
For the 12-month period ended June 30, 2013, INTECH International Fund’s Class I Shares returned 21.78%. This compares to the 18.62% return posted by the MSCI EAFE Index, the Fund’s benchmark.
Investment Strategy
INTECH’s mathematical investing process seeks to build a more efficient portfolio than its benchmark, with returns in excess of the index while maintaining benchmark-like risk. The process does not attempt to predict the direction of the market, nor does it have a view of any particular company in the portfolio. Instead, it employs a proprietary optimization process to build portfolios with the potential to outperform the index by capturing stocks’ natural volatility.
Within specific risk controls, INTECH’s disciplined mathematical process establishes target proportional weightings for stocks in the portfolio as a result of an optimization routine. Once the weights are determined and the portfolio is constructed, it is rebalanced and re-optimized on a periodic basis. By limiting the distance any one stock position can deviate from its benchmark weight, INTECH’s process attempts to control the relative risk of the portfolio. We believe that instituting an investment process aimed at providing consistent, positive excess returns at benchmark-like risk, will allow us to meet our investors’ objectives while minimizing the risk of significant underperformance relative to the benchmark.
Performance Review
As stock prices moved naturally throughout the period, we continued to implement our mathematical process in a disciplined manner in an effort to maintain a more efficient portfolio than the benchmark, without increasing relative risk. While other factors may influence performance over the short term, we believe that the consistent application of our process will help the Fund perform well over the long term.
In INTECH’s history, which spans more than 26 years, we have experienced periods of both underperformance and outperformance relative to the benchmark. From our perspective, the key is to keep periods of underperformance both short in duration and mild in scope. INTECH aims to achieve excess returns over the long term and we believe the Fund remains well positioned for long-term capital growth.
Investment Strategy and Outlook
Going forward, we will continue building portfolios in a disciplined and deliberate manner, with risk management remaining the hallmark of our investment process. While we may experience short periods of underperformance, we aim to exceed the benchmark over a three- to five-year time horizon. As INTECH’s ongoing research efforts yield modest improvements, we will continue implementing changes that we believe are likely to improve the long-term results for our clients.
Thank you for your investment in INTECH International Fund.
Janus Mathematical Funds | 11
INTECH International Fund (unaudited)
INTECH International Fund At A Glance
5 Largest Equity Holdings – (% of Net Assets)
As of June 30, 2013
| | | | | |
Fuji Heavy Industries, Ltd.
Automotive – Cars and Light Trucks | | | 2.2% | |
CSL, Ltd.
Medical – Biomedical and Genetic | | | 2.2% | |
Nomura Holdings, Inc.
Finance – Investment Bankers/Brokers | | | 1.9% | |
Galaxy Entertainment Group, Ltd.
Casino Hotels | | | 1.5% | |
Insurance Australia Group, Ltd.
Property and Casualty Insurance | | | 1.4% | |
| | | | | |
| | | | 9.2% | |
Asset Allocation – (% of Net Assets)
As of June 30, 2013
Top Country Allocations – Long Positions (% of Investment Securities)
As of June 30, 2013
12 | JUNE 30, 2013
(unaudited)
| | | | | | | | | | | | |
| Average Annual Total Return – for the periods ended June 30, 2013 | | | Expense Ratios – per the October 26, 2012 prospectus |
| | | One
| | Five
| | Since
| | | Total Annual Fund
| | Net Annual Fund
|
| | | Year | | Year | | Inception* | | | Operating Expenses | | Operating Expenses |
| | | | | | | | | | | | |
| INTECH International Fund – Class A Shares | | | | | | | | | | | |
| | | | | | | | | | | | |
| NAV | | 21.27% | | –1.01% | | –1.65% | | | 1.42% | | 1.26% |
| | | | | | | | | | | | |
| MOP | | 14.37% | | –2.17% | | –2.59% | | | | | |
| | | | | | | | | | | | |
| INTECH International Fund – Class C Shares | | | | | | | | | | | |
| | | | | | | | | | | | |
| NAV | | 22.79% | | –0.85% | | –1.66% | | | 2.25% | | 2.01% |
| | | | | | | | | | | | |
| CDSC | | 21.79% | | –0.85% | | –1.66% | | | | | |
| | | | | | | | | | | | |
| INTECH International Fund – Class I Shares | | 21.78% | | –0.96% | | –1.57% | | | 1.13% | | 1.01% |
| | | | | | | | | | | | |
| INTECH International Fund – Class S Shares | | 21.48% | | –1.00% | | –1.68% | | | 1.66% | | 1.51% |
| | | | | | | | | | | | |
| INTECH International Fund – Class T Shares | | 21.30% | | –1.66% | | –2.81% | | | 1.41% | | 1.26% |
| | | | | | | | | | | | |
| Morgan Stanley Capital International EAFE® Index | | 18.62% | | –0.63% | | –2.02% | | | | | |
| | | | | | | | | | | | |
| Morningstar Quartile – Class I Shares | | 1st | | 3rd | | 2nd | | | | | |
| | | | | | | | | | | | |
| Morningstar Ranking – based on total returns for Foreign Large Blend Funds | | 59/816 | | 385/716 | | 271/654 | | | | | |
| | | | | | | | | | | | |
| Visit janus.com/advisor/mutual-funds to view current performance and characteristic information | | | | | |
| | | | | | | | | | | | |
Returns quoted are past performance and do not guarantee future results; current performance may be lower or higher. Investment returns and principal value will vary; there may be a gain or loss when shares are sold. For the most recent month-end performance call 877.33JANUS(52687) or visit janus.com/advisor/mutual-funds.
Performance shown for Class A Shares at Maximum Offering Price (MOP) includes the Fund’s maximum sales charge of 5.75%. Performance shown at Net Asset Value (NAV) does not include this charge and would have been lower had this charge been taken into account.
Performance shown for Class C Shares includes a 1% contingent deferred sales charge (CDSC) on periods of less than 12 months. Performance shown at Net Asset Value (NAV) does not include this sales charge and would have been lower had this sales charge been taken into account.
See important disclosures on the next page.
Janus Mathematical Funds | 13
INTECH International Fund (unaudited)
Net expense ratios reflect the expense waiver, if any, Janus Capital has contractually agreed to through November 1, 2013.
The proprietary mathematical process used by INTECH Investment Management LLC (“INTECH”) may not achieve the desired results. The rebalancing techniques used by the Fund may result in a higher portfolio turnover rate, higher expenses and potentially higher net taxable gains or losses compared to a “buy and hold” or index fund strategy.
The Fund’s performance may be affected by risks that include those associated with investments in specific industries or countries and potential conflicts of interest with the Janus “funds of funds.” Additional risks to the Fund may include those associated with investing in foreign securities, initial public offerings (“IPOs”), real estate investment trusts (“REITs”), and derivatives. Please see the Fund’s prospectus or janus.com/info for more information about risks, portfolio holdings and other details.
The Fund invests in REITs, which may be subject to a higher degree of market risk because of concentration in a specific industry, sector or geographic region. REITs may be subject to risks including, but not limited to: legal, political, liquidity, interest rate risks, a decline in the value of real estate, risks related to general and economic conditions, changes in the value of the underlying property owned by the trust and defaults by borrowers. To the extent the Fund invests in foreign REITs, the Fund may be subject to fluctuations in currency rates or political or economic conditions in a particular country.
Foreign securities have additional risks including exchange rate changes, political and economic upheaval, the relative lack of information, relatively low market liquidity and the potential lack of strict financial and accounting controls and standards. These risks are magnified in emerging markets. The prices of foreign securities held by the Fund, and therefore the Fund’s performance, may decline in response to such risks.
Returns include reinvestment of all dividends and distributions. The returns do not include adjustments in accordance with generally accepted accounting principles required at the period end for financial reporting purposes.
Class A Shares, Class C Shares, Class I Shares, and Class S Shares of the Fund commenced operations on July 6, 2009. The performance shown for periods prior to July 6, 2009 reflects the historical performance of each respective share class of the predecessor fund, calculated using the fees and expenses of each respective share class accounting for, when applicable and permitted, any fee and expense limitations or waivers.
Class T Shares of the Fund commenced operations on July 6, 2009. The performance shown for periods prior to July 6, 2009 reflects the historical performance of the predecessor fund’s Class I Shares, calculated using the fees and expenses of Class T Shares without the effect of any fee and expense limitations or waivers.
If each share class of the Fund had been available during periods prior to its commencement, the performance shown may have been different. The performance shown for periods following the Fund’s commencement of each share class reflects the fees and expenses of each respective share class, net of any applicable fee and expense limitations or waivers. Please refer to the Fund’s prospectus for further details concerning historical performance.
Ranking is for the share class shown only; other classes may have different performance characteristics. When an expense waiver is in effect, it may have a material effect on the total return, and therefore the ranking for the period.
© 2013 Morningstar, Inc. All Rights Reserved.
There is no assurance that the investment process will consistently lead to successful investing.
See Notes to Schedules of Investments and Other Information for index definitions.
The weighting of securities within the portfolio may differ significantly from the weightings within the index. The index is unmanaged and is not available for direct investment; therefore, its performance does not reflect the expenses associated with the active management of an actual portfolio.
See “Useful Information About Your Fund Report.”
| | | |
| * | | The predecessor Fund’s inception date – May 2, 2007 |
14 | JUNE 30, 2013
(unaudited)
As a shareholder of the Fund, you incur two types of costs: (1) transaction costs, such as sales charges (loads) on purchase payments (applicable to Class A Shares only); and (2) ongoing costs, including management fees; distribution and shareholder servicing (12b-1) fees; administrative services fees payable pursuant to the Transfer Agency Agreement; and other Fund expenses. This example is intended to help you understand your ongoing costs (in dollars) of investing in the Fund and to compare these costs with the ongoing costs of investing in other mutual funds. To do so, compare this 5% hypothetical example with the 5% hypothetical examples that appear in the shareholder reports of the other funds. The example is based upon an investment of $1,000 invested at the beginning of the period and held for the six-months indicated, unless noted otherwise in the table and footnotes below.
Actual Expenses
The information in the table under the heading “Actual” provides information about actual account values and actual expenses. You may use the information in these columns, together with the amount you invested, to estimate the expenses that you paid over the period. Simply divide your account value by $1,000 (for example, an $8,600 account value divided by $1,000 = 8.6), then multiply the result by the number in the appropriate column for your share class under the heading entitled “Expenses Paid During Period” to estimate the expenses you paid on your account during the period.
Hypothetical Example for Comparison Purposes
The information in the table under the heading “Hypothetical (5% return before expenses)” provides information about hypothetical account values and hypothetical expenses based upon the Fund’s actual expense ratio and an assumed rate of return of 5% per year before expenses, which is not the Fund’s actual return. The hypothetical account values and expenses may not be used to estimate the actual ending account balance or expenses you paid for the period. You may use this information to compare the ongoing costs of investing in the Fund and other funds. To do so, compare this 5% hypothetical example with the 5% hypothetical examples that appear in the shareholder reports of the other funds. Additionally, for an analysis of the fees associated with an investment in any share class or other similar funds, please visit www.finra.org/fundanalyzer.
Please note that the expenses shown in the table are meant to highlight your ongoing costs only and do not reflect any transaction costs. These fees are fully described in the Fund’s prospectus. Therefore, the hypothetical examples are useful in comparing ongoing costs only, and will not help you determine the relative total costs of owning different funds. In addition, if these transaction costs were included, your costs would have been higher.
| | | | | | | | | | | | | | | | | | | | | | | | | | | | | | | |
| | | | | Hypothetical
| | | | |
| | | Actual | | (5% return before expenses) | | | | |
| | | Beginning
| | Ending
| | Expenses
| | Beginning
| | Ending
| | Expenses
| | | | |
| | | Account
| | Account
| | Paid During
| | Account
| | Account
| | Paid During
| | Net Annualized
| | |
| | | Value
| | Value
| | Period
| | Value
| | Value
| | Period
| | Expense Ratio
| | |
| | | (1/1/13) | | (6/30/13) | | (1/1/13 - 6/30/13)† | | (1/1/13) | | (6/30/13) | | (1/1/13 - 6/30/13)† | | (1/1/13 - 6/30/13) | | |
| |
| |
| Class A Shares | | $ | 1,000.00 | | | $ | 1,068.90 | | | $ | 5.90 | | | $ | 1,000.00 | | | $ | 1,019.09 | | | $ | 5.76 | | | | 1.15% | | | |
| |
| |
| Class C Shares | | $ | 1,000.00 | | | $ | 1,085.30 | | | $ | 10.65 | | | $ | 1,000.00 | | | $ | 1,014.58 | | | $ | 10.29 | | | | 2.06% | | | |
| |
| |
| Class I Shares | | $ | 1,000.00 | | | $ | 1,070.70 | | | $ | 4.36 | | | $ | 1,000.00 | | | $ | 1,020.58 | | | $ | 4.26 | | | | 0.85% | | | |
| |
| |
| Class S Shares | | $ | 1,000.00 | | | $ | 1,072.90 | | | $ | 4.21 | | | $ | 1,000.00 | | | $ | 1,020.73 | | | $ | 4.11 | | | | 0.82% | | | |
| |
| |
| Class T Shares | | $ | 1,000.00 | | | $ | 1,068.00 | | | $ | 6.10 | | | $ | 1,000.00 | | | $ | 1,018.89 | | | $ | 5.96 | | | | 1.19% | | | |
| |
| |
| | | |
| † | | Expenses Paid During Period are equal to the Net Annualized Expense Ratio multiplied by the average account value over the period, multiplied by the number of days in the most recent six-month period, divided by the number of days in the fiscal year. Expenses in the examples include the effect of applicable fee waivers and/or expense reimbursements, if any. Had such waivers and/or reimbursements not been in effect, your expenses would have been higher. Please refer to the Notes to Financial Statements or the Fund’s prospectus for more information regarding waivers and/or reimbursements. |
Janus Mathematical Funds | 15
INTECH International Fund
Schedule of Investments
As of June 30, 2013
| | | | | | | | | | | |
| Shares | | Value | | | |
| |
| Common Stock – 99.1% | | | | | | |
| Advertising Agencies – 0.3% | | | | | | |
| | 9,697 | | | WPP PLC | | $ | 165,453 | | | |
| Advertising Services – 0.1% | | | | | | |
| | 590 | | | Hakuhodo DY Holdings, Inc. | | | 41,352 | | | |
| | 636 | | | Publicis Groupe S.A. | | | 45,279 | | | |
| | | | | | | | 86,631 | | | |
| Aerospace and Defense – 0.2% | | | | | | |
| | 8,185 | | | Meggitt PLC | | | 64,413 | | | |
| | 3,633 | | | Rolls-Royce Holdings PLC | | | 62,650 | | | |
| | | | | | | | 127,063 | | | |
| Aerospace and Defense – Equipment – 1.3% | | | | | | |
| | 8,998 | | | Cobham PLC | | | 35,864 | | | |
| | 13,961 | | | European Aeronautic Defence and Space Co. N.V. | | | 746,165 | | | |
| | 228 | | | Zodiac Aerospace | | | 30,179 | | | |
| | | | | | | | 812,208 | | | |
| Airlines – 1.2% | | | | | | |
| | 24,325 | | | Deutsche Lufthansa A.G. | | | 493,725 | | | |
| | 6,569 | | | easyJet PLC | | | 129,464 | | | |
| | 23,070 | | | International Consolidated Airlines Group S.A.* | | | 92,659 | | | |
| | 100 | | | Japan Airlines Co., Ltd. | | | 5,143 | | | |
| | | | | | | | 720,991 | | | |
| Apparel Manufacturers – 0.4% | | | | | | |
| | 339 | | | Christian Dior S.A. | | | 54,710 | | | |
| | 1,601 | | | Hugo Boss A.G. | | | 176,282 | | | |
| | | | | | | | 230,992 | | | |
| Audio and Video Products – 0.7% | | | | | | |
| | 75,000 | | | Sharp Corp. | | | 302,541 | | | |
| | 7,200 | | | Sony Corp. | | | 150,884 | | | |
| | | | | | | | 453,425 | | | |
| Automotive – Cars and Light Trucks – 4.2% | | | | | | |
| | 3,000 | | | Daihatsu Motor Co., Ltd. | | | 56,878 | | | |
| | 3,295 | | | Fiat SpA | | | 23,029 | | | |
| | 55,000 | | | Fuji Heavy Industries, Ltd. | | | 1,356,142 | | | |
| | 184,000 | | | Mazda Motor Corp.* | | | 725,535 | | | |
| | 3,046 | | | Renault S.A. | | | 204,959 | | | |
| | 2,800 | | | Suzuki Motor Corp. | | | 64,578 | | | |
| | 2,200 | | | Toyota Motor Corp. | | | 132,896 | | | |
| | | | | | | | 2,564,017 | | | |
| Automotive – Medium and Heavy Duty Trucks – 0.9% | | | | | | |
| | 36,000 | | | Hino Motors, Ltd. | | | 528,600 | | | |
| Automotive – Truck Parts and Equipment – Original – 1.0% | | | | | | |
| | 1,800 | | | Aisin Seiki Co., Ltd. | | | 68,889 | | | |
| | 3,100 | | | Denso Corp. | | | 145,840 | | | |
| | 7,000 | | | Koito Manufacturing Co., Ltd. | | | 133,774 | | | |
| | 4,000 | | | NGK Spark Plug Co., Ltd. | | | 80,113 | | | |
| | 6,200 | | | NHK Spring Co., Ltd. | | | 71,904 | | | |
| | 1,900 | | | Stanley Electric Co., Ltd. | | | 37,019 | | | |
| | 1,800 | | | Sumitomo Electric Industries, Ltd. | | | 21,529 | | | |
| | 900 | | | Toyoda Gosei Co., Ltd. | | | 22,064 | | | |
| | 600 | | | Toyota Industries Corp. | | | 24,566 | | | |
| | | | | | | | 605,698 | | | |
| Beverages – Non-Alcoholic – 0.2% | | | | | | |
| | 4,044 | | | Coca-Cola HBC A.G. | | | 94,644 | | | |
| Beverages – Wine and Spirits – 0.7% | | | | | | |
| | 14,988 | | | Diageo PLC | | | 428,496 | | | |
| | 238 | | | Pernod-Ricard S.A. | | | 26,388 | | | |
| | | | | | | | 454,884 | | | |
| Bicycle Manufacturing – 0.1% | | | | | | |
| | 600 | | | Shimano, Inc. | | | 50,948 | | | |
| Brewery – 0.9% | | | | | | |
| | 4,081 | | | Anheuser-Busch InBev N.V. | | | 363,250 | | | |
| | 931 | | | Heineken Holding N.V. | | | 52,231 | | | |
| | 934 | | | Heineken N.V. | | | 59,504 | | | |
| | 3,000 | | | Kirin Holdings Co., Ltd. | | | 47,015 | | | |
| | 902 | | | SABMiller PLC | | | 43,242 | | | |
| | | | | | | | 565,242 | | | |
| Building – Heavy Construction – 0.1% | | | | | | |
| | 6,000 | | | Cheung Kong Infrastructure Holdings, Ltd. | | | 39,996 | | | |
| Building – Residential and Commercial – 2.0% | | | | | | |
| | 24,000 | | | Daiwa House Industry Co., Ltd. | | | 448,003 | | | |
| | 8,903 | | | Persimmon PLC | | | 159,894 | | | |
| | 23,000 | | | Sekisui Chemical Co., Ltd. | | | 244,242 | | | |
| | 24,000 | | | Sekisui House, Ltd. | | | 347,075 | | | |
| | | | | | | | 1,199,214 | | | |
| Building and Construction – Miscellaneous – 1.0% | | | | | | |
| | 29,497 | | | Ferrovial S.A. | | | 471,436 | | | |
| | 940 | | | Hochtief A.G. | | | 61,452 | | | |
| | 20,000 | | | Obayashi Corp. | | | 103,873 | | | |
| | | | | | | | 636,761 | | | |
| Building and Construction Products – Miscellaneous – 1.3% | | | | | | |
| | 78,542 | | | Fletcher Building, Ltd. | | | 512,937 | | | |
| | 69 | | | Sika A.G. | | | 178,729 | | | |
| | 9,000 | | | TOTO, Ltd. | | | 91,579 | | | |
| | | | | | | | 783,245 | | | |
| Building Products – Air and Heating – 0.6% | | | | | | |
| | 9,200 | | | Daikin Industries, Ltd. | | | 372,045 | | | |
| Building Products – Cement and Aggregate – 1.5% | | | | | | |
| | 48,696 | | | Boral, Ltd. | | | 187,441 | | | |
| | 855 | | | HeidelbergCement A.G. | | | 57,498 | | | |
| | 4,593 | | | James Hardie Industries PLC (CDI) | | | 39,432 | | | |
| | 10,140 | | | Lafarge S.A. | | | 623,440 | | | |
| | | | | | | | 907,811 | | | |
| Cable/Satellite Television – 0.8% | | | | | | |
| | 4,453 | | | Kabel Deutschland Holding A.G. | | | 489,034 | | | |
| Casino Hotels – 2.2% | | | | | | |
| | 29,418 | | | Crown, Ltd. | | | 325,722 | | | |
| | 183,000 | | | Galaxy Entertainment Group, Ltd.* | | | 896,619 | | | |
| | 32,800 | | | MGM China Holdings, Ltd. | | | 87,542 | | | |
| | 23,000 | | | SJM Holdings, Ltd. | | | 55,930 | | | |
| | | | | | | | 1,365,813 | | | |
| Chemicals – Diversified – 0.6% | | | | | | |
| | 2,000 | | | Asahi Kasei Corp. | | | 13,231 | | | |
| | 588 | | | Croda International PLC | | | 22,149 | | | |
| | 473 | | | Koninklijke DSM N.V. | | | 30,818 | | | |
| | 15,000 | | | Mitsubishi Gas Chemical Co., Inc. | | | 110,276 | | | |
| | 1,000 | | | Nitto Denko Corp. | | | 64,340 | | | |
| | 727 | | | Solvay S.A. | | | 95,282 | | | |
| | | | | | | | 336,096 | | | |
See Notes to Schedules of Investments and Other Information and Notes to Financial Statements.
16 | JUNE 30, 2013
Schedule of Investments
As of June 30, 2013
| | | | | | | | | | | |
| Shares | | Value | | | |
| |
| Chemicals – Plastics – 0.1% | | | | | | |
| | 302 | | | EMS-Chemie Holding A.G. | | $ | 89,388 | | | |
| Chemicals – Specialty – 0.7% | | | | | | |
| | 379 | | | Brenntag A.G. | | | 57,565 | | | |
| | 9,000 | | | Daicel Corp. | | | 78,872 | | | |
| | 42 | | | Givaudan S.A. | | | 54,218 | | | |
| | 1,617 | | | Lonza Group A.G. | | | 121,836 | | | |
| | 3,172 | | | Novozymes A/S – Class B | | | 101,539 | | | |
| | | | | | | | 414,030 | | | |
| Collectibles – 0.1% | | | | | | |
| | 1,900 | | | Sanrio Co., Ltd. | | | 88,428 | | | |
| Commercial Banks – 7.0% | | | | | | |
| | 100,117 | | | Bank Hapoalim BM | | | 453,613 | | | |
| | 34,395 | | | Bank Leumi Le-Israel BM | | | 114,489 | | | |
| | 661,941 | | | Bank of Ireland* | | | 135,259 | | | |
| | 30,421 | | | Bendigo and Adelaide Bank, Ltd. | | | 280,087 | | | |
| | 5,000 | | | Chiba Bank, Ltd. | | | 34,086 | | | |
| | 683 | | | Commonwealth Bank of Australia | | | 43,201 | | | |
| | 15,264 | | | Erste Group Bank A.G. | | | 407,357 | | | |
| | 16,000 | | | Fukuoka Financial Group, Inc. | | | 68,092 | | | |
| | 6,000 | | | Gunma Bank, Ltd. | | | 33,159 | | | |
| | 13,000 | | | Hachijuni Bank, Ltd. | | | 76,039 | | | |
| | 9,000 | | | Hiroshima Bank, Ltd. | | | 38,392 | | | |
| | 73,000 | | | Hokuhoku Financial Group, Inc. | | | 149,445 | | | |
| | 11,000 | | | Iyo Bank, Ltd. | | | 105,163 | | | |
| | 4,780 | | | KBC Groep N.V. | | | 177,958 | | | |
| | 8,961 | | | Mediobanca SpA | | | 46,651 | | | |
| | 117,900 | | | Mizuho Financial Group, Inc. | | | 244,931 | | | |
| | 4,015 | | | National Australia Bank, Ltd. | | | 108,953 | | | |
| | 9,000 | | | Nishi-Nippon City Bank, Ltd. | | | 23,507 | | | |
| | 12,041 | | | Nordea Bank A.B. | | | 134,757 | | | |
| | 16,124 | | | Pohjola Bank PLC – Class A | | | 236,926 | | | |
| | 2,000 | | | Shizuoka Bank, Ltd. | | | 21,561 | | | |
| | 10,815 | | | Skandinaviska Enskilda Banken A.B. – Class A | | | 103,446 | | | |
| | 1,600 | | | Sumitomo Mitsui Financial Group, Inc. | | | 73,417 | | | |
| | 63,000 | | | Sumitomo Mitsui Trust Holdings, Inc. | | | 294,161 | | | |
| | 5,000 | | | Suruga Bank, Ltd. | | | 90,863 | | | |
| | 1,581 | | | Svenska Handelsbanken A.B. – Class A | | | 63,509 | | | |
| | 6,844 | | | Swedbank A.B. – Class A | | | 157,070 | | | |
| | 20,900 | | | Westpac Banking Corp. | | | 551,866 | | | |
| | | | | | | | 4,267,958 | | | |
| Commercial Services – 0.1% | | | | | | |
| | 830 | | | Intertek Group PLC | | | 36,893 | | | |
| | 23 | | | SGS S.A. | | | 49,420 | | | |
| | | | | | | | 86,313 | | | |
| Computer Services – 0% | | | | | | |
| | 2,913 | | | Computershare, Ltd. | | | 27,353 | | | |
| Computers – Integrated Systems – 0.1% | | | | | | |
| | 500 | | | Otsuka Corp. | | | 55,567 | | | |
| Consulting Services – 0.6% | | | | | | |
| | 14,636 | | | Bereau Veritas S.A. | | | 378,977 | | | |
| Containers – Paper and Plastic – 0.3% | | | | | | |
| | 20,529 | | | Amcor, Ltd. | | | 190,325 | | | |
| Cosmetics and Toiletries – 0.3% | | | | | | |
| | 525 | | | Beiersdorf A.G. | | | 45,780 | | | |
| | 800 | | | Kao Corp. | | | 27,229 | | | |
| | 710 | | | L’Oreal S.A. | | | 116,664 | | | |
| | | | | | | | 189,673 | | | |
| Distribution/Wholesale – 0.1% | | | | | | |
| | 1,281 | | | Wolseley PLC | | | 59,084 | | | |
| Diversified Banking Institutions – 3.6% | | | | | | |
| | 121,271 | | | Barclays PLC | | | 513,510 | | | |
| | 451 | | | BNP Paribas S.A. | | | 24,639 | | | |
| | 66,081 | | | Credit Agricole S.A. | | | 567,890 | | | |
| | 18,212 | | | Credit Suisse Group A.G. | | | 483,121 | | | |
| | 225,890 | | | Lloyds Banking Group PLC* | | | 216,962 | | | |
| | 12,000 | | | Mitsubishi UFJ Financial Group, Inc. | | | 74,062 | | | |
| | 4,642 | | | Societe Generale S.A. | | | 159,498 | | | |
| | 7,232 | | | UBS A.G. | | | 123,150 | | | |
| | | | | | | | 2,162,832 | | | |
| Diversified Financial Services – 0.1% | | | | | | |
| | 10,363 | | | Investec PLC | | | 65,195 | | | |
| Diversified Operations – 1.7% | | | | | | |
| | 1,531 | | | Exor SpA | | | 45,272 | | | |
| | 2,633 | | | IMI PLC | | | 49,650 | | | |
| | 2,099 | | | Industrivarden A.B. – Class C | | | 35,080 | | | |
| | 1,500 | | | Keppel Corp., Ltd. | | | 12,311 | | | |
| | 3,785 | | | Smiths Group PLC | | | 75,287 | | | |
| | 516 | | | Wartsila Oyj Abp | | | 22,451 | | | |
| | 366 | | | Wendel S.A. | | | 37,703 | | | |
| | 91,000 | | | Wharf Holdings, Ltd. | | | 765,002 | | | |
| | | | | | | | 1,042,756 | | | |
| Diversified Operations – Commercial Services – 0.5% | | | | | | |
| | 20,598 | | | Brambles, Ltd. | | | 175,898 | | | |
| | 2,622 | | | Bunzl PLC | | | 51,037 | | | |
| | 1,119 | | | Sodexo | | | 93,209 | | | |
| | | | | | | | 320,144 | | | |
| E-Commerce/Products – 0.1% | | | | | | |
| | 4,000 | | | Rakuten, Inc. | | | 47,318 | | | |
| Electric – Generation – 0.1% | | | | | | |
| | 1,700 | | | Electric Power Development Co., Ltd. | | | 53,146 | | | |
| Electric – Integrated – 0.5% | | | | | | |
| | 2,745 | | | Electricite de France S.A. | | | 63,718 | | | |
| | 3,600 | | | Hokuriku Electric Power Co. | | | 56,563 | | | |
| | 4,100 | | | Kansai Electric Power Co., Inc. | | | 56,191 | | | |
| | 1,400 | | | Kyushu Electric Power Co., Inc. | | | 21,121 | | | |
| | 5,434 | | | Origin Energy, Ltd. | | | 62,452 | | | |
| | 5,500 | | | Power Assets Holdings, Ltd. | | | 47,442 | | | |
| | | | | | | | 307,487 | | | |
| Electric Products – Miscellaneous – 0.2% | | | | | | |
| | 1,361 | | | Legrand S.A. | | | 63,131 | | | |
| | 3,000 | | | Mitsubishi Electric Corp. | | | 28,106 | | | |
| | | | | | | | 91,237 | | | |
| Electronic Components – Miscellaneous – 1.0% | | | | | | |
| | 21,500 | | | AAC Technologies Holdings, Inc. | | | 121,419 | | | |
| | 2,249 | | | Koninklijke Philips N.V. | | | 61,308 | | | |
| | 1,100 | | | Murata Manufacturing Co., Ltd. | | | 83,754 | | | |
| | 300 | | | Omron Corp. | | | 8,931 | | | |
| | 57,000 | | | Toshiba Corp. | | | 274,193 | | | |
| | 5,000 | | | Yaskawa Electric Corp. | | | 60,861 | | | |
| | | | | | | | 610,466 | | | |
See Notes to Schedules of Investments and Other Information and Notes to Financial Statements.
Janus Mathematical Funds | 17
INTECH International Fund
Schedule of Investments
As of June 30, 2013
| | | | | | | | | | | |
| Shares | | Value | | | |
| |
| Electronic Components – Semiconductors – 1.4% | | | | | | |
| | 54,370 | | | ARM Holdings PLC | | $ | 657,311 | | | |
| | 19,516 | | | STMicroelectronics N.V. | | | 175,795 | | | |
| | | | | | | | 833,106 | | | |
| Engineering – Research and Development Services – 0.6% | | | | | | |
| | 102,000 | | | Singapore Technologies Engineering, Ltd. | | | 337,290 | | | |
| Enterprise Software/Services – 0.1% | | | | | | |
| | 1,400 | | | Nomura Research Institute, Ltd. | | | 45,603 | | | |
| Entertainment Software – 0.4% | | | | | | |
| | 210 | | | GungHo Online Entertainment, Inc.* | | | 228,721 | | | |
| Filtration and Separations Products – 0% | | | | | | |
| | 1,228 | | | Alfa Laval A.B. | | | 25,104 | | | |
| Finance – Consumer Loans – 0% | | | | | | |
| | 680 | | | Acom Co., Ltd.* | | | 21,636 | | | |
| Finance – Credit Card – 0.2% | | | | | | |
| | 3,800 | | | AEON Financial Service Co., Ltd. | | | 107,646 | | | |
| Finance – Investment Bankers/Brokers – 3.9% | | | | | | |
| | 82,000 | | | Daiwa Securities Group, Inc. | | | 688,846 | | | |
| | 13,492 | | | Macquarie Group, Ltd. | | | 516,499 | | | |
| | 155,100 | | | Nomura Holdings, Inc. | | | 1,143,385 | | | |
| | | | | | | | 2,348,730 | | | |
| Finance – Leasing Companies – 0.1% | | | | | | |
| | 6,500 | | | Mitsubishi UFJ Lease & Finance Co., Ltd. | | | 30,809 | | | |
| Finance – Other Services – 0.5% | | | | | | |
| | 552 | | | ASX, Ltd. | | | 16,690 | | | |
| | 1,800 | | | Japan Exchange Group, Inc. | | | 181,888 | | | |
| | 4,283 | | | London Stock Exchange Group PLC | | | 87,081 | | | |
| | | | | | | | 285,659 | | | |
| Fisheries – 0.4% | | | | | | |
| | 8,000 | | | Toyo Suisan Kaisha, Ltd. | | | 266,236 | | | |
| Food – Baking – 0.1% | | | | | | |
| | 639 | | | Aryzta A.G. | | | 35,932 | | | |
| Food – Confectionary – 0.2% | | | | | | |
| | 1 | | | Lindt & Spruengli A.G. | | | 43,588 | | | |
| | 14 | | | Lindt & Spruengli A.G. | | | 52,602 | | | |
| | | | | | | | 96,190 | | | |
| Food – Miscellaneous/Diversified – 2.1% | | | | | | |
| | 26,735 | | | Associated British Foods PLC | | | 705,382 | | | |
| | 46,000 | | | First Pacific Co., Ltd. | | | 49,287 | | | |
| | 316 | | | Kerry Group PLC – Class A | | | 17,438 | | | |
| | 2,000 | | | Kikkoman Corp. | | | 33,280 | | | |
| | 277 | | | Nestle S.A. | | | 18,172 | | | |
| | 36,164 | | | Tate & Lyle PLC | | | 453,432 | | | |
| | | | | | | | 1,276,991 | | | |
| Food – Retail – 1.7% | | | | | | |
| | 598 | | | Carrefour S.A. | | | 16,446 | | | |
| | 198 | | | Casino Guichard Perrachon S.A. | | | 18,547 | | | |
| | 2,409 | | | Delhaize Group S.A. | | | 148,897 | | | |
| | 65,064 | | | Distribuidora Internacional de Alimentacion S.A. | | | 491,998 | | | |
| | 10,508 | | | Jeronimo Martins SGPS S.A. | | | 221,418 | | | |
| | 1,258 | | | Koninklijke Ahold N.V. | | | 18,722 | | | |
| | 3,229 | | | Woolworths, Ltd. | | | 96,864 | | | |
| | | | | | | | 1,012,892 | | | |
| Food – Wholesale/Distribution – 0.1% | | | | | | |
| | 21,470 | | | Metcash, Ltd. | | | 69,098 | | | |
| Gambling – Non-Hotel – 0.4% | | | | | | |
| | 18,069 | | | OPAP S.A. | | | 151,214 | | | |
| | 7,468 | | | Tabcorp Holdings, Ltd. | | | 20,825 | | | |
| | 9,469 | | | William Hill PLC | | | 63,488 | | | |
| | | | | | | | 235,527 | | | |
| Gas – Distribution – 1.0% | | | | | | |
| | 9,181 | | | Enagas S.A. | | | 226,854 | | | |
| | 17,745 | | | Gas Natural SDG S.A. | | | 357,745 | | | |
| | 2,048 | | | National Grid PLC | | | 23,234 | | | |
| | 5,000 | | | Osaka Gas Co., Ltd. | | | 21,128 | | | |
| | | | | | | | 628,961 | | | |
| Gas – Transportation – 1.2% | | | | | | |
| | 279,950 | | | Hong Kong & China Gas Co., Ltd. | | | 684,372 | | | |
| | 5,000 | | | Tokyo Gas Co., Ltd. | | | 27,632 | | | |
| | | | | | | | 712,004 | | | |
| Hotels and Motels – 0.1% | | | | | | |
| | 2,234 | | | InterContinental Hotels Group PLC | | | 61,422 | | | |
| Human Resources – 0.1% | | | | | | |
| | 2,117 | | | Randstad Holding N.V. | | | 86,792 | | | |
| Import/Export – 0.8% | | | | | | |
| | 5,300 | | | ITOCHU Corp. | | | 61,199 | | | |
| | 16,400 | | | Toyota Tsusho Corp. | | | 422,900 | | | |
| | | | | | | | 484,099 | | | |
| Industrial Gases – 0.1% | | | | | | |
| | 11,000 | | | Taiyo Nippon Sanso Corp. | | | 75,988 | | | |
| Internet Content – Information/News – 0.1% | | | | | | |
| | 9,135 | | | Seek, Ltd. | | | 75,754 | | | |
| Internet Financial Services – 0.1% | | | | | | |
| | 7,600 | | | SBI Holdings, Inc. | | | 83,925 | | | |
| Investment Companies – 0.6% | | | | | | |
| | 12,750 | | | Investor A.B. – Class B | | | 343,031 | | | |
| Investment Management and Advisory Services – 1.7% | | | | | | |
| | 90,655 | | | Aberdeen Asset Management PLC | | | 527,726 | | | |
| | 1,585 | | | Hargreaves Lansdown PLC | | | 21,404 | | | |
| | 91,048 | | | Old Mutual PLC | | | 250,192 | | | |
| | 329 | | | Partners Group Holdings A.G. | | | 89,105 | | | |
| | 3,759 | | | Schroders PLC | | | 124,787 | | | |
| | | | | | | | 1,013,214 | | | |
| Leisure & Recreation Products – 0.1% | | | | | | |
| | 2,900 | | | Sega Sammy Holdings, Inc. | | | 72,617 | | | |
| Life and Health Insurance – 3.0% | | | | | | |
| | 41,418 | | | AMP, Ltd. | | | 160,941 | | | |
| | 17,349 | | | Legal & General Group PLC | | | 45,220 | | | |
| | 142,212 | | | Standard Life PLC | | | 747,619 | | | |
| | 70,650 | | | Suncorp Group, Ltd. | | | 769,978 | | | |
| | 528 | | | Swiss Life Holding A.G. | | | 85,885 | | | |
| | | | | | | | 1,809,643 | | | |
| Lottery Services – 0.3% | | | | | | |
| | 66,653 | | | Tatts Group, Ltd. | | | 193,183 | | | |
| Machinery – Construction and Mining – 0.4% | | | | | | |
| | 3,600 | | | Hitachi Construction Machinery Co., Ltd. | | | 72,791 | | | |
| | 7,700 | | | Komatsu, Ltd. | | | 178,057 | | | |
| | | | | | | | 250,848 | | | |
| Machinery – Electrical – 0.1% | | | | | | |
| | 200 | | | SMC Corp. | | | 40,178 | | | |
See Notes to Schedules of Investments and Other Information and Notes to Financial Statements.
18 | JUNE 30, 2013
Schedule of Investments
As of June 30, 2013
| | | | | | | | | | | |
| Shares | | Value | | | |
| |
| Machinery – Farm – 0.2% | | | | | | |
| | 9,000 | | | Kubota Corp. | | $ | 131,424 | | | |
| Machinery – General Industrial – 1.5% | | | | | | |
| | 20,000 | | | Amada Co., Ltd. | | | 132,110 | | | |
| | 2,942 | | | Hexagon A.B. – Class B | | | 78,714 | | | |
| | 90,000 | | | IHI Corp. | | | 341,267 | | | |
| | 88,000 | | | Kawasaki Heavy Industries, Ltd. | | | 270,674 | | | |
| | 567 | | | Kone Oyj – Class B | | | 45,052 | | | |
| | 6,000 | | | Mitsubishi Heavy Industries, Ltd. | | | 33,340 | | | |
| | 487 | | | Zardoya Otis S.A. | | | 6,902 | | | |
| | | | | | | | 908,059 | | | |
| Machinery – Pumps – 0% | | | | | | |
| | 587 | | | Weir Group PLC | | | 19,201 | | | |
| Medical – Biomedical and Genetic – 2.2% | | | | | | |
| | 23,328 | | | CSL, Ltd. | | | 1,313,430 | | | |
| Medical – Drugs – 4.9% | | | �� | | | |
| | 977 | | | Actelion, Ltd. | | | 58,870 | | | |
| | 6,805 | | | Bayer A.G. | | | 725,634 | | | |
| | 900 | | | Chugai Pharmaceutical Co., Ltd. | | | 18,661 | | | |
| | 5,200 | | | Daiichi Sankyo Co., Ltd. | | | 86,841 | | | |
| | 4,200 | | | Dainippon Sumitomo Pharma Co., Ltd. | | | 55,528 | | | |
| | 1,349 | | | GlaxoSmithKline PLC | | | 33,808 | | | |
| | 1,734 | | | Grifols S.A. | | | 63,642 | | | |
| | 3,000 | | | Kyowa Hakko Kirin Co., Ltd. | | | 33,945 | | | |
| | 3,593 | | | Merck KGaA | | | 547,363 | | | |
| | 422 | | | Novartis A.G. | | | 29,986 | | | |
| | 3,207 | | | Novo Nordisk A/S – Class B | | | 499,861 | | | |
| | 1,100 | | | Ono Pharmaceutical Co., Ltd. | | | 74,657 | | | |
| | 1,003 | | | Orion Oyj – Class B | | | 23,524 | | | |
| | 577 | | | Roche Holding A.G. | | | 143,593 | | | |
| | 792 | | | Sanofi | | | 82,072 | | | |
| | 23,600 | | | Shionogi & Co., Ltd. | | | 492,658 | | | |
| | 600 | | | Takeda Pharmaceutical Co., Ltd. | | | 27,108 | | | |
| | | | | | | | 2,997,751 | | | |
| Medical – Hospitals – 0.6% | | | | | | |
| | 11,601 | | | Ramsay Health Care, Ltd. | | | 379,830 | | | |
| Medical – Wholesale Drug Distributors – 0.2% | | | | | | |
| | 600 | | | Alfresa Holdings Corp. | | | 32,130 | | | |
| | 2,900 | | | Medipal Holdings Corp. | | | 39,306 | | | |
| | 1,200 | | | Suzuken Co., Ltd. | | | 40,420 | | | |
| | | | | | | | 111,856 | | | |
| Medical Instruments – 0.3% | | | | | | |
| | 2,500 | | | Sysmex Corp. | | | 163,624 | | | |
| Medical Products – 1.2% | | | | | | |
| | 480 | | | Cochlear, Ltd. | | | 27,082 | | | |
| | 11,369 | | | Coloplast A/S – Class B | | | 637,575 | | | |
| | 185 | | | Fresenius S.E. & Co. KGaA | | | 22,804 | | | |
| | 800 | | | Terumo Corp. | | | 39,815 | | | |
| | | | | | | | 727,276 | | | |
| Metal – Aluminum – 0.1% | | | | | | |
| | 65,756 | | | Alumina, Ltd. | | | 59,219 | | | |
| Metal Processors and Fabricators – 0.1% | | | | | | |
| | 8,000 | | | NSK, Ltd. | | | 76,563 | | | |
| Motion Pictures and Services – 0% | | | | | | |
| | 1,100 | | | Toho Co., Ltd. | | | 22,652 | | | |
| Multi-Line Insurance – 1.4% | | | | | | |
| | 14,865 | | | Ageas | | | 521,883 | | | |
| | 1,474 | | | Baloise Holding A.G. | | | 143,373 | | | |
| | 568 | | | CNP Assurances | | | 8,150 | | | |
| | 4,400 | | | Direct Line Insurance Group PLC | | | 15,590 | | | |
| | 15,027 | | | Mapfre S.A. | | | 48,934 | | | |
| | 3,397 | | | Sampo Oyj – Class A | | | 132,371 | | | |
| | 213 | | | Vienna Insurance Group A.G. | | | 9,893 | | | |
| | | | | | | | 880,194 | | | |
| Multimedia – 0% | | | | | | |
| | 508 | | | Lagardere S.C.A. | | | 14,149 | | | |
| Office Automation and Equipment – 0% | | | | | | |
| | 2,000 | | | Ricoh Co., Ltd. | | | 23,800 | | | |
| Oil Companies – Exploration and Production – 0% | | | | | | |
| | 1,829 | | | Santos, Ltd. | | | 20,953 | | | |
| Oil Companies – Integrated – 0.1% | | | | | | |
| | 1,306 | | | OMV A.G. | | | 58,982 | | | |
| Oil Refining and Marketing – 0.4% | | | | | | |
| | 12,540 | | | Caltex Australia, Ltd. | | | 206,950 | | | |
| | 1,800 | | | Neste Oil Oyj | | | 26,332 | | | |
| | | | | | | | 233,282 | | | |
| Optical Supplies – 0.2% | | | | | | |
| | 1,802 | | | Luxottica Group SpA | | | 91,092 | | | |
| Paper and Related Products – 0.1% | | | | | | |
| | 2,279 | | | Svenska Cellulosa A.B. – Class B | | | 57,234 | | | |
| Photo Equipment and Supplies – 0.1% | | | | | | |
| | 1,000 | | | Olympus Corp. | | | 30,405 | | | |
| Pipelines – 0.7% | | | | | | |
| | 82,108 | | | APA Group | | | 449,679 | | | |
| Printing – Commercial – 0.2% | | | | | | |
| | 14,000 | | | Dai Nippon Printing Co., Ltd. | | | 128,056 | | | |
| Property and Casualty Insurance – 1.7% | | | | | | |
| | 2,229 | | | Gjensidige Forsikring A.S.A. | | | 32,800 | | | |
| | 175,366 | | | Insurance Australia Group, Ltd. | | | 872,236 | | | |
| | 2,200 | | | MS&AD Insurance Group Holdings | | | 55,954 | | | |
| | 2,015 | | | QBE Insurance Group, Ltd. | | | 27,801 | | | |
| | 448 | | | Tryg A/S | | | 36,931 | | | |
| | | | | | | | 1,025,722 | | | |
| Public Thoroughfares – 0% | | | | | | |
| | 1,122 | | | Abertis Infraestucturas S.A. | | | 19,568 | | | |
| Publishing – Books – 0% | | | | | | |
| | 1,588 | | | Reed Elsevier N.V. | | | 26,455 | | | |
| Publishing – Periodicals – 0.1% | | | | | | |
| | 4,044 | | | Reed Elsevier PLC | | | 45,939 | | | |
| Real Estate Management/Services – 0.9% | | | | | | |
| | 7,745 | | | IMMOFINANZ A.G. | | | 28,930 | | | |
| | 41,863 | | | Lend Lease Group | | | 319,600 | | | |
| | 6,000 | | | Mitsubishi Estate Co., Ltd. | | | 159,802 | | | |
| | 2,200 | | | Nomura Real Estate Holdings, Inc. | | | 48,677 | | | |
| | | | | | | | 557,009 | | | |
| Real Estate Operating/Development – 4.7% | | | | | | |
| | 101,000 | | | CapitaLand, Ltd. | | | 245,506 | | | |
| | 18,700 | | | Henderson Land Development Co., Ltd. | | | 111,634 | | | |
| | 1,500 | | | Hopewell Holdings, Ltd. | | | 5,000 | | | |
| | 10,000 | | | Hulic Co., Ltd. | | | 107,301 | | | |
See Notes to Schedules of Investments and Other Information and Notes to Financial Statements.
Janus Mathematical Funds | 19
INTECH International Fund
Schedule of Investments
As of June 30, 2013
| | | | | | | | | | | |
| Shares | | Value | | | |
| |
| Real Estate Operating/Development – (continued) | | | | | | |
| | 57,000 | | | Keppel Land, Ltd. | | $ | 150,699 | | | |
| | 4,000 | | | Mitsui Fudosan Co., Ltd. | | | 117,668 | | | |
| | 323,000 | | | New World Development Co., Ltd. | | | 447,281 | | | |
| | 28 | | | NTT Urban Development Corp. | | | 34,393 | | | |
| | 4,000 | | | Sumitomo Realty & Development Co., Ltd. | | | 159,540 | | | |
| | 29,000 | | | Sun Hung Kai Properties, Ltd. | | | 374,288 | | | |
| | 60,200 | | | Swire Properties, Ltd. | | | 178,136 | | | |
| | 21,000 | | | Tokyo Tatemono Co., Ltd. | | | 174,929 | | | |
| | 26,000 | | | Tokyu Land Corp. | | | 238,604 | | | |
| | 3,000 | | | UOL Group, Ltd. | | | 15,910 | | | |
| | 102,000 | | | Wheelock & Co., Ltd. | | | 511,591 | | | |
| | | | | | | | 2,872,480 | | | |
| Recreational Vehicles – 0.5% | | | | | | |
| | 22,600 | | | Yamaha Motor Co., Ltd. | | | 292,870 | | | |
| Reinsurance – 0.6% | | | | | | |
| | 3,772 | | | Hannover Rueckversicherung S.E. | | | 271,582 | | | |
| | 502 | | | Muenchener Rueckversicherungs A.G. | | | 92,384 | | | |
| | | | | | | | 363,966 | | | |
| REIT – Diversified – 1.1% | | | | | | |
| | 220,000 | | | CapitaCommercial Trust | | | 254,360 | | | |
| | 51,360 | | | Dexus Property Group | | | 50,246 | | | |
| | 202 | | | Gecina S.A. | | | 22,342 | | | |
| | 57,331 | | | Goodman Group | | | 255,799 | | | |
| | 520 | | | Klepierre | | | 20,493 | | | |
| | 11,284 | | | Stockland | | | 35,903 | | | |
| | 26 | | | United Urban Investment Corp. | | | 35,161 | | | |
| | | | | | | | 674,304 | | | |
| REIT – Office Property – 0.4% | | | | | | |
| | 15 | | | Japan Real Estate Investment Corp. | | | 167,457 | | | |
| | 6 | | | Nippon Building Fund, Inc. | | | 69,463 | | | |
| | | | | | | | 236,920 | | | |
| REIT – Shopping Centers – 0.7% | | | | | | |
| | 49 | | | Japan Retail Fund Investment Corp. | | | 102,388 | | | |
| | 14,655 | | | Westfield Group | | | 153,286 | | | |
| | 61,201 | | | Westfield Retail Trust | | | 173,464 | | | |
| | | | | | | | 429,138 | | | |
| Resorts and Theme Parks – 0.1% | | | | | | |
| | 300 | | | Oriental Land Co., Ltd. | | | 46,410 | | | |
| Retail – Apparel and Shoe – 1.0% | | | | | | |
| | 800 | | | Fast Retailing Co., Ltd. | | | 269,867 | | | |
| | 4,193 | | | Next PLC | | | 290,633 | | | |
| | 400 | | | Shimamura Co., Ltd. | | | 48,608 | | | |
| | | | | | | | 609,108 | | | |
| Retail – Building Products – 0.2% | | | | | | |
| | 3,468 | | | Kingfisher PLC | | | 18,089 | | | |
| | 4,147 | | | Travis Perkins PLC | | | 91,821 | | | |
| | | | | | | | 109,910 | | | |
| Retail – Consumer Electronics – 0% | | | | | | |
| | 670 | | | Yamada Denki Co., Ltd. | | | 27,196 | | | |
| Retail – Discount – 0.1% | | | | | | |
| | 1,000 | | | Don Quijote Co., Ltd. | | | 48,659 | | | |
| Retail – Jewelry – 0.1% | | | | | | |
| | 51 | | | Swatch Group A.G. | | | 27,922 | | | |
| | 305 | | | Swatch Group A.G. | | | 28,746 | | | |
| | | | | | | | 56,668 | | | |
| Retail – Major Department Stores – 1.4% | | | | | | |
| | 199 | | | Kering | | | 40,443 | | | |
| | 30,700 | | | Marui Group Co., Ltd. | | | 306,195 | | | |
| | 47,000 | | | Takashimaya Co., Ltd. | | | 476,351 | | | |
| | | | | | | | 822,989 | | | |
| Retail – Miscellaneous/Diversified – 0.9% | | | | | | |
| | 15,570 | | | Wesfarmers, Ltd. | | | 563,733 | | | |
| Retail – Regional Department Stores – 0.8% | | | | | | |
| | 15,700 | | | Isetan Mitsukoshi Holdings, Ltd. | | | 208,521 | | | |
| | 35,000 | | | J. Front Retailing Co., Ltd. | | | 279,195 | | | |
| | | | | | | | 487,716 | | | |
| Rubber – Tires – 0.4% | | | | | | |
| | 1,800 | | | Bridgestone Corp. | | | 61,355 | | | |
| | 4,400 | | | Sumitomo Rubber Industries, Ltd. | | | 71,973 | | | |
| | 12,000 | | | Yokohama Rubber Co., Ltd. | | | 120,653 | | | |
| | | | | | | | 253,981 | | | |
| Semiconductor Equipment – 0.2% | | | | | | |
| | 1,177 | | | ASML Holding N.V. | | | 92,862 | | | |
| Soap and Cleaning Preparations – 0.1% | | | | | | |
| | 410 | | | Henkel A.G. & Co. KGaA | | | 32,150 | | | |
| | 766 | | | Reckitt Benckiser Group PLC | | | 54,143 | | | |
| | | | | | | | 86,293 | | | |
| Steel – Producers – 0.6% | | | | | | |
| | 10,900 | | | JFE Holdings, Inc. | | | 239,303 | | | |
| | 97,000 | | | Kobe Steel, Ltd. | | | 120,321 | | | |
| | | | | | | | 359,624 | | | |
| Steel – Specialty – 0.1% | | | | | | |
| | 3,000 | | | Hitachi Metals, Ltd. | | | 33,764 | | | |
| Storage and Warehousing – 0.1% | | | | | | |
| | 3,000 | | | Mitsubishi Logistics Corp. | | | 41,902 | | | |
| Sugar – 0.3% | | | | | | |
| | 5,931 | | | Suedzucker A.G. | | | 183,679 | | | |
| Telecommunication Services – 0% | | | | | | |
| | 11,338 | | | Telecom Corp. of New Zealand, Ltd. | | | 19,763 | | | |
| Telephone – Integrated – 1.9% | | | | | | |
| | 39,533 | | | Bezeq Israeli Telecommunication Corp., Ltd. | | | 52,854 | | | |
| | 2,800 | | | KDDI Corp. | | | 145,704 | | | |
| | 2,000 | | | Softbank Corp. | | | 116,781 | | | |
| | 4,012 | | | TDC A/S | | | 32,520 | | | |
| | 182,609 | | | Telstra Corp., Ltd. | | | 796,399 | | | |
| | | | | | | | 1,144,258 | | | |
| Television – 0.3% | | | | | | |
| | 80,519 | | | ITV PLC | | | 171,546 | | | |
| Tools – Hand Held – 0.1% | | | | | | |
| | 600 | | | Makita Corp. | | | 32,432 | | | |
| Toys – 0.1% | | | | | | |
| | 2,600 | | | Namco Bandai Holdings, Inc. | | | 42,215 | | | |
| Transactional Software – 0.1% | | | | | | |
| | 1,864 | | | Amadeus IT Holding S.A. – Class A | | | 59,571 | | | |
| Transportation – Marine – 0.5% | | | | | | |
| | 35,000 | | | Mitsui O.S.K. Lines, Ltd. | | | 136,598 | | | |
| | 69,000 | | | Nippon Yusen K.K. | | | 183,007 | | | |
| | | | | | | | 319,605 | | | |
| | | | | | | | | | | |
See Notes to Schedules of Investments and Other Information and Notes to Financial Statements.
20 | JUNE 30, 2013
Schedule of Investments
As of June 30, 2013
| | | | | | | | | | | |
| Shares | | Value | | | |
| |
| Transportation – Railroad – 0.7% | | | | | | |
| | 500 | | | Central Japan Railway Co. | | $ | 61,164 | | | |
| | 900 | | | East Japan Railway Co. | | | 69,978 | | | |
| | 3,000 | | | Keisei Electric Railway Co., Ltd. | | | 28,106 | | | |
| | 44,000 | | | Tokyu Corp. | | | 287,979 | | | |
| | | | | | | | 447,227 | | | |
| Transportation – Services – 1.1% | | | | | | |
| | 4,046 | | | Asciano, Ltd. | | | 18,570 | | | |
| | 80,000 | | | ComfortDelGro Corp., Ltd. | | | 115,855 | | | |
| | 18,060 | | | Deutsche Post A.G. | | | 448,832 | | | |
| | 16,625 | | | Toll Holdings, Ltd. | | | 80,866 | | | |
| | | | | | | | 664,123 | | | |
| Transportation – Truck – 0.2% | | | | | | |
| | 22,000 | | | Nippon Express Co., Ltd. | | | 104,498 | | | |
| | 2,100 | | | Yamato Holdings Co., Ltd. | | | 44,283 | | | |
| | | | | | | | 148,781 | | | |
| Travel Services – 0.3% | | | | | | |
| | 5,451 | | | Flight Centre, Ltd. | | | 196,015 | | | |
| Venture Capital – 0.3% | | | | | | |
| | 31,552 | | | 3i Group PLC | | | 161,985 | | | |
| Water – 0% | | | | | | |
| | 1,585 | | | Suez Environment Co. | | | 20,472 | | | |
| Web Portals/Internet Service Providers – 0.2% | | | | | | |
| | 385 | | | Iliad S.A. | | | 83,255 | | | |
| | 1,028 | | | United Internet A.G. | | | 29,013 | | | |
| | 49 | | | Yahoo! Japan Corp. | | | 24,164 | | | |
| | | | | | | | 136,432 | | | |
| Wireless Equipment – 0.3% | | | | | | |
| | 16,492 | | | Telefonaktiebolaget L.M. Ericsson – Class B | | | 186,909 | | | |
| |
| |
| Total Common Stock (cost $56,577,315) | | | 60,346,227 | | | |
| |
| |
| Preferred Stock – 0.4% | | | | | | |
| Automotive – Cars and Light Trucks – 0.1% | | | | | | |
| | 737 | | | Bayerische Motoren Werke A.G. | | | 50,387 | | | |
| Soap and Cleaning Preparations – 0.2% | | | | | | |
| | 927 | | | Henkel A.G. & Co. KGaA | | | 87,170 | | | |
| Television – 0.1% | | | | | | |
| | 1,895 | | | ProSiebenSat.1 Media A.G. | | | 81,439 | | | |
| |
| |
| Total Preferred Stock (cost $212,470) | | | 218,996 | | | |
| |
| |
| Rights – 0% | | | | | | |
| Finance – Other Services – 0% | | | | | | |
| | 58 | | | ASX, Ltd. | | | 165 | | | |
| Retail – Miscellaneous/Diversified – 0% | | | | | | |
| | 199 | | | Groupe Fnac | | | 519 | | | |
| |
| |
| Total Rights (cost $460) | | | 684 | | | |
| |
| |
| Total Investments (total cost $56,790,245) – 99.5% | | | 60,565,907 | | | |
| |
| |
| Cash, Receivables and Other Assets, net of Liabilities – 0.5% | | | 320,971 | | | |
| |
| |
| Net Assets – 100% | | $ | 60,886,878 | | | |
| |
| |
Summary of Investments by Country – (Long Positions) (unaudited)
| | | | | | | | | |
| | | | | | % of Investment
| |
| Country | | Value | | | Securities | |
| |
| |
| Australia | | $ | 9,913,788 | | | | 16.4% | |
| Austria | | | 505,162 | | | | 0.8% | |
| Belgium | | | 1,307,270 | | | | 2.2% | |
| Denmark | | | 1,308,426 | | | | 2.2% | |
| Finland | | | 486,656 | | | | 0.8% | |
| France | | | 3,739,232 | | | | 6.2% | |
| Germany | | | 3,953,773 | | | | 6.5% | |
| Greece | | | 151,214 | | | | 0.2% | |
| Hong Kong | | | 4,375,539 | | | | 7.2% | |
| Ireland | | | 152,697 | | | | 0.2% | |
| Israel | | | 620,956 | | | | 1.0% | |
| Italy | | | 206,044 | | | | 0.3% | |
| Japan | | | 19,670,870 | | | | 32.5% | |
| Netherlands | | | 428,692 | | | | 0.7% | |
| New Zealand | | | 532,700 | | | | 0.9% | |
| Norway | | | 32,800 | | | | 0.1% | |
| Portugal | | | 221,418 | | | | 0.4% | |
| Singapore | | | 1,131,931 | | | | 1.9% | |
| Spain | | | 1,839,309 | | | | 3.0% | |
| Sweden | | | 1,184,854 | | | | 1.9% | |
| Switzerland | | | 1,857,636 | | | | 3.1% | |
| United Kingdom | | | 6,944,940 | | | | 11.5% | |
| |
| |
| Total | | $ | 60,565,907 | | | | 100.0% | |
See Notes to Schedules of Investments and Other Information and Notes to Financial Statements.
Janus Mathematical Funds | 21
INTECH U.S. Core Fund (unaudited)
| | | | | | | |
Fund Snapshot
INTECH’s active approach focuses on adding value by selecting stocks with unique volatility characteristics and low correlations to one another.
| | | | | | Managed by
INTECH Investment Management LLC |
Performance Overview
For the 12-month period ended June 30, 2013, INTECH U.S. Core Fund’s Class T Shares returned 21.58%. This compares to the 20.60% return posted by the S&P 500 Index, the Fund’s benchmark.
Investment Strategy
INTECH’s mathematical investing process seeks to build a more efficient portfolio than its benchmark, with returns in excess of the index while maintaining benchmark-like risk. The process does not attempt to predict the direction of the market, nor does it have a view of any particular company in the portfolio. Instead, it employs a proprietary optimization process to build portfolios with the potential to outperform the index by capturing stocks’ natural volatility.
Within specific risk controls, INTECH’s disciplined mathematical process establishes target proportional weightings for stocks in the portfolio as a result of an optimization routine. Once the weights are determined and the portfolio is constructed, it is rebalanced and re-optimized on a periodic basis. By limiting the distance any one stock position can deviate from its benchmark weight, INTECH’s process attempts to control the relative risk of the portfolio. We believe that instituting an investment process aimed at providing consistent, positive excess returns at benchmark-like risk, will allow us to meet our investors’ objectives while minimizing the risk of significant underperformance relative to the benchmark.
Performance Review
As stock prices moved naturally throughout the period, we continued to implement our mathematical process in a disciplined manner in an effort to maintain a more efficient portfolio than the benchmark, without increasing relative risk. While other factors may influence performance over the short term, we believe that the consistent application of our process will help the Fund perform well over the long term.
In INTECH’s history, which spans more than 26 years, we have experienced periods of both underperformance and outperformance relative to the benchmark. From our perspective, the key is to keep periods of underperformance both short in duration and mild in scope. INTECH aims to achieve excess returns over the long term and we believe the Fund remains well positioned for long-term capital growth.
Investment Strategy and Outlook
Going forward, we will continue building portfolios in a disciplined and deliberate manner, with risk management remaining the hallmark of our investment process. While we may experience short periods of underperformance, we aim to exceed the benchmark over a three- to five-year time horizon. As INTECH’s ongoing research efforts yield modest improvements, we will continue implementing changes that we believe are likely to improve the long-term results for our clients.
Thank you for your investment in INTECH U.S. Core Fund.
22 | JUNE 30, 2013
(unaudited)
INTECH U.S. Core Fund At A Glance
5 Largest Equity Holdings – (% of Net Assets)
As of June 30, 2013
| | | | | |
Home Depot, Inc.
Retail – Building Products | | | 3.6% | |
TJX Cos., Inc.
Retail – Major Department Stores | | | 2.9% | |
Comcast Corp. – Class A
Cable/Satellite Television | | | 2.7% | |
Apple, Inc.
Computers | | | 2.2% | |
Sherwin-Williams Co.
Coatings and Paint Products | | | 1.9% | |
| | | | | |
| | | | 13.3% | |
Asset Allocation – (% of Net Assets)
As of June 30, 2013
Top Country Allocations – Long Positions (% of Investment Securities)
As of June 30, 2013
Janus Mathematical Funds | 23
INTECH U.S. Core Fund (unaudited)
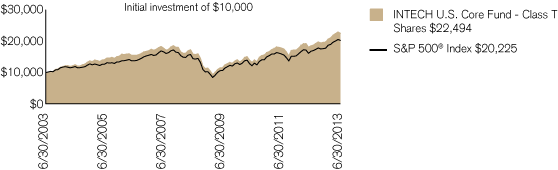
| | | | | | | | | | | | |
| Average Annual Total Return – for the periods ended June 30, 2013 | | | | | Expense Ratios – per the October 26, 2012 prospectuses |
| | | One
| | Five
| | Ten
| | Since
| | | Total Annual Fund
|
| | | Year | | Year | | Year | | Inception* | | | Operating Expenses |
| | | | | | | | | | | | |
| INTECH U.S. Core Fund – Class A Shares | | | | | | | | | | | |
| | | | | | | | | | | | |
| NAV | | 21.48% | | 7.10% | | 8.18% | | 9.19% | | | 0.99% |
| | | | | | | | | | | | |
| MOP | | 14.48% | | 5.84% | | 7.55% | | 8.57% | | | |
| | | | | | | | | | | | |
| INTECH U.S. Core Fund – Class C Shares | | | | | | | | | | | |
| | | | | | | | | | | | |
| NAV | | 20.51% | | 6.36% | | 7.37% | | 8.37% | | | 1.83% |
| | | | | | | | | | | | |
| CDSC | | 19.51% | | 6.36% | | 7.37% | | 8.37% | | | |
| | | | | | | | | | | | |
| INTECH U.S. Core Fund – Class D Shares(1) | | 21.62% | | 7.30% | | 8.47% | | 9.48% | | | 0.84% |
| | | | | | | | | | | | |
| INTECH U.S. Core Fund – Class I Shares | | 21.75% | | 7.25% | | 8.44% | | 9.46% | | | 0.72% |
| | | | | | | | | | | | |
| INTECH U.S. Core Fund – Class S Shares | | 21.20% | | 6.96% | | 8.00% | | 9.00% | | | 1.16% |
| | | | | | | | | | | | |
| INTECH U.S. Core Fund – Class T Shares | | 21.58% | | 7.25% | | 8.44% | | 9.46% | | | 0.91% |
| | | | | | | | | | | | |
| S&P 500® Index | | 20.60% | | 7.01% | | 7.30% | | 8.65% | | | |
| | | | | | | | | | | | |
| Morningstar Quartile – Class T Shares | | 1st | | 1st | | 1st | | 1st | | | |
| | | | | | | | | | | | |
| Morningstar Ranking – based on total returns for Large Growth Funds | | 269/1,764 | | 373/1,568 | | 210/1,315 | | 309/1,302 | | | |
| | | | | | | | | | | | |
| Visit janus.com/advisor/mutual-funds (or janus.com/allfunds if you hold Shares directly with Janus Capital) to view current performance and characteristic information | | | |
| | | | | | | | | | | | |
Returns quoted are past performance and do not guarantee future results; current performance may be lower or higher. Investment returns and principal value will vary; there may be a gain or loss when shares are sold. For the most recent month-end performance call 877.33JANUS(52687) (or 800.525.3713 if you hold shares directly with Janus Capital) or visit janus.com/advisor/mutual-funds (or janus.com/allfunds if you hold shares directly with Janus Capital).
Performance shown for Class A Shares at Maximum Offering Price (MOP) includes the Fund’s maximum sales charge of 5.75%. Performance shown at Net Asset Value (NAV) does not include this charge and would have been lower had this charge been taken into account.
Performance shown for Class C Shares includes a 1% contingent deferred sales charge (CDSC) on periods of less than 12 months. Performance shown at Net Asset Value (NAV) does not include this sales charge and would have been lower had this sales charge been taken into account.
See important disclosures on the next page.
24 | JUNE 30, 2013
(unaudited)
The Fund has a performance-based management fee that adjusts up or down based on the Fund’s performance relative to an approved benchmark index over a performance measurement period. See the Fund’s prospectuses or Statement of Additional Information for more details.
The proprietary mathematical process used by INTECH Investment Management LLC (“INTECH”) may not achieve the desired results. The rebalancing techniques used by the Fund may result in a higher portfolio turnover rate, higher expenses and potentially higher net taxable gains or losses compared to a “buy and hold” or index fund strategy.
The Fund’s performance may be affected by risks that include those associated with investments in specific industries or countries and potential conflicts of interest with the Janus “funds of funds.” Additional risks to the Fund may include those associated with investing in foreign securities, initial public offerings (“IPOs”), real estate investment trusts (“REITs”), and derivatives. Please see the Fund’s prospectuses or janus.com/info (or janus.com/reports if you hold shares directly with Janus Capital) for more information about risks, portfolio holdings and other details.
The Fund invests in REITs, which may be subject to a higher degree of market risk because of concentration in a specific industry, sector or geographic region. REITs may be subject to risks including, but not limited to: legal, political, liquidity, interest rate risks, a decline in the value of real estate, risks related to general and economic conditions, changes in the value of the underlying property owned by the trust and defaults by borrowers. To the extent the Fund invests in foreign REITs, the Fund may be subject to fluctuations in currency rates or political or economic conditions in a particular country.
The Fund will normally invest at least 80% of its net assets, measured at the time of purchase, in the type of securities described by its name.
Returns include reinvestment of all dividends and distributions. The returns do not include adjustments in accordance with generally accepted accounting principles required at the period end for financial reporting purposes.
Class A Shares, Class C Shares, and Class S Shares of the Fund commenced operations on July 6, 2009. The performance shown for periods prior to July 6, 2009 reflects the historical performance of a similar share class of the Fund, calculated using the fees and expenses of each respective share class without the effect of any fee and expense limitations or waivers.
Class D Shares of the Fund commenced operations on February 16, 2010, as a result of the restructuring of Class J Shares, the predecessor share class. The performance shown for periods prior to February 16, 2010 reflects the historical performance of the Fund’s predecessor share class.
Class I Shares of the Fund commenced operations on July 6, 2009. The performance shown for periods prior to July 6, 2009 reflects the historical performance of a similar share class of the Fund.
If each share class of the Fund had been available during periods prior to its commencement, the performance shown may have been different. The performance shown for periods following the Fund’s commencement of each share class reflects the fees and expenses of each respective share class, net of any applicable fee and expense limitations or waivers. Please refer to the Fund’s prospectuses for further details concerning historical performance.
Ranking is for the share class shown only; other classes may have different performance characteristics. When an expense waiver is in effect, it may have a material effect on the total return, and therefore the ranking for the period.
© 2013 Morningstar, Inc. All Rights Reserved.
There is no assurance that the investment process will consistently lead to successful investing.
See Notes to Schedules of Investments and Other Information for index definitions.
The weighting of securities within the portfolio may differ significantly from the weightings within the index. The index is unmanaged and is not available for direct investment; therefore, its performance does not reflect the expenses associated with the active management of an actual portfolio.
See “Useful Information About Your Fund Report.”
| | | |
| * | | The Fund’s inception date – February 28, 2003 |
| (1) | | Closed to new investors. |
Janus Mathematical Funds | 25
INTECH U.S. Core Fund (unaudited)
As a shareholder of the Fund, you incur two types of costs: (1) transaction costs, such as sales charges (loads) on purchase payments (applicable to Class A Shares only); and (2) ongoing costs, including management fees; distribution and shareholder servicing (12b-1) fees; administrative services fees payable pursuant to the Transfer Agency Agreement; and other Fund expenses. This example is intended to help you understand your ongoing costs (in dollars) of investing in the Fund and to compare these costs with the ongoing costs of investing in other mutual funds. To do so, compare this 5% hypothetical example with the 5% hypothetical examples that appear in the shareholder reports of the other funds. The example is based upon an investment of $1,000 invested at the beginning of the period and held for the six-months indicated, unless noted otherwise in the table and footnotes below.
Actual Expenses
The information in the table under the heading “Actual” provides information about actual account values and actual expenses. You may use the information in these columns, together with the amount you invested, to estimate the expenses that you paid over the period. Simply divide your account value by $1,000 (for example, an $8,600 account value divided by $1,000 = 8.6), then multiply the result by the number in the appropriate column for your share class under the heading entitled “Expenses Paid During Period” to estimate the expenses you paid on your account during the period.
Hypothetical Example for Comparison Purposes
The information in the table under the heading “Hypothetical (5% return before expenses)” provides information about hypothetical account values and hypothetical expenses based upon the Fund’s actual expense ratio and an assumed rate of return of 5% per year before expenses, which is not the Fund’s actual return. The hypothetical account values and expenses may not be used to estimate the actual ending account balance or expenses you paid for the period. You may use this information to compare the ongoing costs of investing in the Fund and other funds. To do so, compare this 5% hypothetical example with the 5% hypothetical examples that appear in the shareholder reports of the other funds. Additionally, for an analysis of the fees associated with an investment in any share class or other similar funds, please visit www.finra.org/fundanalyzer.
Please note that the expenses shown in the table are meant to highlight your ongoing costs only and do not reflect any transaction costs. These fees are fully described in the Fund’s prospectuses. Therefore, the hypothetical examples are useful in comparing ongoing costs only, and will not help you determine the relative total costs of owning different funds. In addition, if these transaction costs were included, your costs would have been higher.
| | | | | | | | | | | | | | | | | | | | | | | | | | | | | | | |
| | | | | Hypothetical
| | | | |
| | | Actual | | (5% return before expenses) | | | | |
| | | Beginning
| | Ending
| | Expenses
| | Beginning
| | Ending
| | Expenses
| | | | |
| | | Account
| | Account
| | Paid During
| | Account
| | Account
| | Paid During
| | Net Annualized
| | |
| | | Value
| | Value
| | Period
| | Value
| | Value
| | Period
| | Expense Ratio
| | |
| | | (1/1/13) | | (6/30/13) | | (1/1/13 - 6/30/13)† | | (1/1/13) | | (6/30/13) | | (1/1/13 - 6/30/13)† | | (1/1/13 - 6/30/13) | | |
| |
| |
| Class A Shares | | $ | 1,000.00 | | | $ | 1,143.00 | | | $ | 5.15 | | | $ | 1,000.00 | | | $ | 1,019.98 | | | $ | 4.86 | | | | 0.97% | | | |
| |
| |
| Class C Shares | | $ | 1,000.00 | | | $ | 1,138.50 | | | $ | 9.33 | | | $ | 1,000.00 | | | $ | 1,016.07 | | | $ | 8.80 | | | | 1.76% | | | |
| |
| |
| Class D Shares | | $ | 1,000.00 | | | $ | 1,143.70 | | | $ | 4.46 | | | $ | 1,000.00 | | | $ | 1,020.63 | | | $ | 4.21 | | | | 0.84% | | | |
| |
| |
| Class I Shares | | $ | 1,000.00 | | | $ | 1,144.30 | | | $ | 3.83 | | | $ | 1,000.00 | | | $ | 1,021.22 | | | $ | 3.61 | | | | 0.72% | | | |
| |
| |
| Class S Shares | | $ | 1,000.00 | | | $ | 1,142.30 | | | $ | 6.21 | | | $ | 1,000.00 | | | $ | 1,018.99 | | | $ | 5.86 | | | | 1.17% | | | |
| |
| |
| Class T Shares | | $ | 1,000.00 | | | $ | 1,143.70 | | | $ | 4.84 | | | $ | 1,000.00 | | | $ | 1,020.28 | | | $ | 4.56 | | | | 0.91% | | | |
| |
| |
| | | |
| † | | Expenses Paid During Period are equal to the Net Annualized Expense Ratio multiplied by the average account value over the period, multiplied by the number of days in the most recent six-month period, divided by the number of days in the fiscal year. Expenses in the examples include the effect of applicable fee waivers and/or expense reimbursements, if any. Had such waivers and/or reimbursements not been in effect, your expenses would have been higher. Please refer to the Notes to Financial Statements or the Fund’s prospectuses for more information regarding waivers and/or reimbursements. |
26 | JUNE 30, 2013
INTECH U.S. Core Fund
Schedule of Investments
As of June 30, 2013
| | | | | | | | | | | |
| Shares | | Value | | | |
| |
| Common Stock – 98.6% | | | | | | |
| Advertising Agencies – 0.1% | | | | | | |
| | 6,900 | | | Interpublic Group of Cos., Inc. | | $ | 100,395 | | | |
| | 3,300 | | | Omnicom Group, Inc. | | | 207,471 | | | |
| | | | | | | | 307,866 | | | |
| Aerospace and Defense – 0.2% | | | | | | |
| | 900 | | | Lockheed Martin Corp. | | | 97,614 | | | |
| | 1,000 | | | Northrop Grumman Corp. | | | 82,800 | | | |
| | 700 | | | Raytheon Co. | | | 46,284 | | | |
| | 7,000 | | | Rockwell Collins, Inc. | | | 443,870 | | | |
| | | | | | | | 670,568 | | | |
| Aerospace and Defense – Equipment – 0% | | | | | | |
| | 1,400 | | | United Technologies Corp. | | | 130,116 | | | |
| Agricultural Operations – 0% | | | | | | |
| | 5,900 | | | Archer-Daniels-Midland Co. | | | 200,069 | | | |
| Airlines – 0.1% | | | | | | |
| | 38,200 | | | Southwest Airlines Co. | | | 492,398 | | | |
| Apparel Manufacturers – 0.1% | | | | | | |
| | 3,200 | | | VF Corp. | | | 617,792 | | | |
| Appliances – 0.7% | | | | | | |
| | 26,800 | | | Whirlpool Corp. | | | 3,064,848 | | | |
| Applications Software – 0.1% | | | | | | |
| | 6,500 | | | Intuit, Inc. | | | 396,695 | | | |
| Athletic Footwear – 0.1% | | | | | | |
| | 6,700 | | | NIKE, Inc. – Class B | | | 426,656 | | | |
| Automotive – Cars and Light Trucks – 0.5% | | | | | | |
| | 90,300 | | | Ford Motor Co. | | | 1,396,941 | | | |
| | 28,000 | | | General Motors Co.* | | | 932,680 | | | |
| | | | | | | | 2,329,621 | | | |
| Automotive – Truck Parts and Equipment – Original – 0.5% | | | | | | |
| | 39,100 | | | Delphi Automotive PLC | | | 1,981,979 | | | |
| | 8,400 | | | Johnson Controls, Inc. | | | 300,636 | | | |
| | | | | | | | 2,282,615 | | | |
| Beverages – Non-Alcoholic – 0.5% | | | | | | |
| | 16,200 | | | Coca-Cola Co. | | | 649,782 | | | |
| | 4,200 | | | Coca-Cola Enterprises, Inc. | | | 147,672 | | | |
| | 10,000 | | | Dr. Pepper Snapple Group, Inc. | | | 459,300 | | | |
| | 5,800 | | | Monster Beverage Corp.* | | | 352,466 | | | |
| | 5,400 | | | PepsiCo, Inc. | | | 441,666 | | | |
| | | | | | | | 2,050,886 | | | |
| Beverages – Wine and Spirits – 1.4% | | | | | | |
| | 11,600 | | | Beam, Inc. | | | 732,076 | | | |
| | 12,900 | | | Brown-Forman Corp. – Class B | | | 871,395 | | | |
| | 82,700 | | | Constellation Brands, Inc. – Class A* | | | 4,310,324 | | | |
| | | | | | | | 5,913,795 | | | |
| Broadcast Services and Programming – 0.6% | | | | | | |
| | 16,700 | | | Discovery Communications, Inc. – Class A* | | | 1,289,407 | | | |
| | 22,300 | | | Scripps Networks Interactive, Inc. – Class A | | | 1,488,748 | | | |
| | | | | | | | 2,778,155 | | | |
| Cable/Satellite Television – 3.8% | | | | | | |
| | 62,100 | | | Cablevision Systems Corp. – Class A | | | 1,044,522 | | | |
| | 279,700 | | | Comcast Corp. – Class A | | | 11,713,836 | | | |
| | 13,800 | | | DIRECTV* | | | 850,356 | | | |
| | 26,100 | | | Time Warner Cable, Inc. | | | 2,935,728 | | | |
| | | | | | | | 16,544,442 | | | |
| Casino Services – 0% | | | | | | |
| | 8,400 | | | International Game Technology | | | 140,364 | | | |
| Cellular Telecommunications – 0.8% | | | | | | |
| | 484,300 | | | Sprint Nextel Corp.* | | | 3,399,786 | | | |
| Chemicals – Diversified – 1.5% | | | | | | |
| | 22,400 | | | FMC Corp. | | | 1,367,744 | | | |
| | 19,800 | | | LyondellBasell Industries N.V. – Class A | | | 1,311,948 | | | |
| | 26,500 | | | PPG Industries, Inc. | | | 3,879,865 | | | |
| | | | | | | | 6,559,557 | | | |
| Chemicals – Specialty – 0.7% | | | | | | |
| | 34,100 | | | Eastman Chemical Co. | | | 2,387,341 | | | |
| | 7,000 | | | International Flavors & Fragrances, Inc. | | | 526,120 | | | |
| | | | | | | | 2,913,461 | | | |
| Coal – 0.1% | | | | | | |
| | 3,900 | | | CONSOL Energy, Inc. | | | 105,690 | | | |
| | 29,600 | | | Peabody Energy Corp. | | | 433,344 | | | |
| | | | | | | | 539,034 | | | |
| Coatings and Paint Products – 1.9% | | | | | | |
| | 47,100 | | | Sherwin-Williams Co. | | | 8,317,860 | | | |
| Commercial Banks – 0.9% | | | | | | |
| | 77,100 | | | BB&T Corp. | | | 2,612,148 | | | |
| | 11,400 | | | M&T Bank Corp. | | | 1,273,950 | | | |
| | | | | | | | 3,886,098 | | | |
| Commercial Services – 0.1% | | | | | | |
| | 15,100 | | | Iron Mountain, Inc. | | | 401,811 | | | |
| | 5,000 | | | Quanta Services, Inc.* | | | 132,300 | | | |
| | | | | | | | 534,111 | | | |
| Commercial Services – Finance – 2.1% | | | | | | |
| | 40,000 | | | Equifax, Inc. | | | 2,357,200 | | | |
| | 67,300 | | | H&R Block, Inc. | | | 1,867,575 | | | |
| | 700 | | | MasterCard, Inc. – Class A | | | 402,150 | | | |
| | 42,400 | | | McGraw-Hill Cos., Inc. | | | 2,255,256 | | | |
| | 37,000 | | | Moody’s Corp. | | | 2,254,410 | | | |
| | 1,000 | | | Paychex, Inc. | | | 36,520 | | | |
| | | | | | | | 9,173,111 | | | |
| Computer Services – 2.1% | | | | | | |
| | 17,900 | | | Accenture PLC – Class A (U.S. Shares) | | | 1,288,084 | | | |
| | 14,900 | | | Cognizant Technology Solutions Corp. – Class A* | | | 932,889 | | | |
| | 76,800 | | | Computer Sciences Corp. | | | 3,361,536 | | | |
| | 17,300 | | | International Business Machines Corp. | | | 3,306,203 | | | |
| | | | | | | | 8,888,712 | | | |
| Computers – 2.5% | | | | | | |
| | 23,800 | | | Apple, Inc. | | | 9,426,704 | | | |
| | 111,900 | | | Dell, Inc. | | | 1,493,865 | | | |
| | | | | | | | 10,920,569 | | | |
| Computers – Memory Devices – 0.2% | | | | | | |
| | 10,200 | | | Western Digital Corp. | | | 633,318 | | | |
See Notes to Schedules of Investments and Other Information and Notes to Financial Statements.
Janus Mathematical Funds | 27
INTECH U.S. Core Fund
Schedule of Investments
As of June 30, 2013
| | | | | | | | | | | |
| Shares | | Value | | | |
| |
| Consumer Products – Miscellaneous – 0.2% | | | | | | |
| | 1,900 | | | Clorox Co. | | $ | 157,966 | | | |
| | 9,300 | | | Kimberly-Clark Corp. | | | 903,402 | | | |
| | | | | | | | 1,061,368 | | | |
| Containers – Metal and Glass – 0.1% | | | | | | |
| | 11,300 | | | Owens-Illinois, Inc.* | | | 314,027 | | | |
| Containers – Paper and Plastic – 0.2% | | | | | | |
| | 14,000 | | | Bemis Co., Inc. | | | 547,960 | | | |
| | 18,900 | | | Sealed Air Corp. | | | 452,655 | | | |
| | | | | | | | 1,000,615 | | | |
| Cosmetics and Toiletries – 0.4% | | | | | | |
| | 15,600 | | | Colgate-Palmolive Co. | | | 893,724 | | | |
| | 3,600 | | | Estee Lauder Cos., Inc. – Class A | | | 236,772 | | | |
| | 6,900 | | | Procter & Gamble Co. | | | 531,231 | | | |
| | | | | | | | 1,661,727 | | | |
| Cruise Lines – 0% | | | | | | |
| | 2,400 | | | Carnival Corp. (U.S. Shares) | | | 82,296 | | | |
| Data Processing and Management – 0.8% | | | | | | |
| | 18,400 | | | Dun & Bradstreet Corp. | | | 1,793,080 | | | |
| | 38,000 | | | Fidelity National Information Services, Inc. | | | 1,627,920 | | | |
| | | | | | | | 3,421,000 | | | |
| Dialysis Centers – 0.5% | | | | | | |
| | 18,000 | | | DaVita HealthCare Partners, Inc.* | | | 2,174,400 | | | |
| Distribution/Wholesale – 1.9% | | | | | | |
| | 62,000 | | | Fastenal Co. | | | 2,842,700 | | | |
| | 4,600 | | | Genuine Parts Co. | | | 359,122 | | | |
| | 20,400 | | | W.W. Grainger, Inc. | | | 5,144,472 | | | |
| | | | | | | | 8,346,294 | | | |
| Diversified Banking Institutions – 1.7% | | | | | | |
| | 73,300 | | | Bank of America Corp. | | | 942,638 | | | |
| | 22,400 | | | Citigroup, Inc. | | | 1,074,528 | | | |
| | 19,000 | | | Goldman Sachs Group, Inc. | | | 2,873,750 | | | |
| | 24,326 | | | JPMorgan Chase & Co. | | | 1,284,170 | | | |
| | 48,300 | | | Morgan Stanley | | | 1,179,969 | | | |
| | | | | | | | 7,355,055 | | | |
| Diversified Operations – 2.4% | | | | | | |
| | 1,400 | | | 3M Co. | | | 153,090 | | | |
| | 2,300 | | | Danaher Corp. | | | 145,590 | | | |
| | 31,300 | | | Dover Corp. | | | 2,430,758 | | | |
| | 51,683 | | | Eaton Corp. PLC | | | 3,401,258 | | | |
| | 19,000 | | | General Electric Co. | | | 440,610 | | | |
| | 6,300 | | | Illinois Tool Works, Inc. | | | 435,771 | | | |
| | 7,200 | | | Ingersoll-Rand PLC | | | 399,744 | | | |
| | 43,000 | | | Leggett & Platt, Inc. | | | 1,336,870 | | | |
| | 37,300 | | | Leucadia National Corp. | | | 978,006 | | | |
| | 800 | | | Parker Hannifin Corp. | | | 76,320 | | | |
| | 1,800 | | | Pentair, Ltd. | | | 103,842 | | | |
| | 12,900 | | | Textron, Inc. | | | 336,045 | | | |
| | | | | | | | 10,237,904 | | | |
| E-Commerce/Products – 0.6% | | | | | | |
| | 49,700 | | | eBay, Inc.* | | | 2,570,484 | | | |
| E-Commerce/Services – 0.6% | | | | | | |
| | 37,800 | | | Expedia, Inc. | | | 2,273,670 | | | |
| | 2,000 | | | Netflix, Inc.* | | | 422,180 | | | |
| | | | | | | | 2,695,850 | | | |
| Electric – Integrated – 2.7% | | | | | | |
| | 4,300 | | | American Electric Power Co., Inc. | | | 192,554 | | | |
| | 37,400 | | | CMS Energy Corp. | | | 1,016,158 | | | |
| | 2,100 | | | Consolidated Edison, Inc. | | | 122,451 | | | |
| | 23,500 | | | Dominion Resources, Inc. | | | 1,335,270 | | | |
| | 4,100 | | | DTE Energy Co. | | | 274,741 | | | |
| | 55,412 | | | Duke Energy Corp. | | | 3,740,310 | | | |
| | 14,200 | | | NextEra Energy, Inc. | | | 1,157,016 | | | |
| | 33,400 | | | Pinnacle West Capital Corp. | | | 1,852,698 | | | |
| | 3,400 | | | PPL Corp. | | | 102,884 | | | |
| | 3,900 | | | Public Service Enterprise Group, Inc. | | | 127,374 | | | |
| | 3,800 | | | SCANA Corp. | | | 186,580 | | | |
| | 5,000 | | | TECO Energy, Inc. | | | 85,950 | | | |
| | 33,000 | | | Wisconsin Energy Corp. | | | 1,352,670 | | | |
| | | | | | | | 11,546,656 | | | |
| Electric Products – Miscellaneous – 0.1% | | | | | | |
| | 8,100 | | | Emerson Electric Co. | | | 441,774 | | | |
| Electronic Components – Miscellaneous – 0.1% | | | | | | |
| | 13,500 | | | TE Connectivity, Ltd. (U.S. Shares) | | | 614,790 | | | |
| Electronic Components – Semiconductors – 0.3% | | | | | | |
| | 3,500 | | | Altera Corp. | | | 115,465 | | | |
| | 15,900 | | | First Solar, Inc.* | | | 711,207 | | | |
| | 5,800 | | | Microchip Technology, Inc. | | | 216,050 | | | |
| | 8,100 | | | Texas Instruments, Inc. | | | 282,447 | | | |
| | 2,600 | | | Xilinx, Inc. | | | 102,986 | | | |
| | | | | | | | 1,428,155 | | | |
| Electronic Connectors – 0.1% | | | | | | |
| | 5,600 | | | Amphenol Corp. – Class A | | | 436,464 | | | |
| Electronic Forms – 0.2% | | | | | | |
| | 20,700 | | | Adobe Systems, Inc.* | | | 943,092 | | | |
| Electronic Measuring Instruments – 0.4% | | | | | | |
| | 2,100 | | | Agilent Technologies, Inc. | | | 89,796 | | | |
| | 56,900 | | | FLIR Systems, Inc. | | | 1,534,593 | | | |
| | | | | | | | 1,624,389 | | | |
| Electronic Security Devices – 0% | | | | | | |
| | 4,800 | | | Tyco International, Ltd. (U.S. Shares) | | | 158,160 | | | |
| Engineering – Research and Development Services – 0.2% | | | | | | |
| | 1,800 | | | Fluor Corp. | | | 106,758 | | | |
| | 13,300 | | | Jacobs Engineering Group, Inc.* | | | 733,229 | | | |
| | | | | | | | 839,987 | | | |
| Engines – Internal Combustion – 0.1% | | | | | | |
| | 1,900 | | | Cummins, Inc. | | | 206,074 | | | |
| Enterprise Software/Services – 0.4% | | | | | | |
| | 46,100 | | | CA, Inc. | | | 1,319,843 | | | |
| | 15,000 | | | Oracle Corp. | | | 460,800 | | | |
| | | | | | | | 1,780,643 | | | |
| Entertainment Software – 0.2% | | | | | | |
| | 30,800 | | | Electronic Arts, Inc.* | | | 707,476 | | | |
| Fiduciary Banks – 0.8% | | | | | | |
| | 14,000 | | | Bank of New York Mellon Corp. | | | 392,700 | | | |
| | 44,600 | | | State Street Corp. | | | 2,908,366 | | | |
| | | | | | | | 3,301,066 | | | |
| Filtration and Separations Products – 0.2% | | | | | | |
| | 13,100 | | | Pall Corp. | | | 870,233 | | | |
See Notes to Schedules of Investments and Other Information and Notes to Financial Statements.
28 | JUNE 30, 2013
Schedule of Investments
As of June 30, 2013
| | | | | | | | | | | |
| Shares | | Value | | | |
| |
| Finance – Credit Card – 1.5% | | | | | | |
| | 94,500 | | | Discover Financial Services | | $ | 4,501,980 | | | |
| | 10,000 | | | Visa, Inc. – Class A | | | 1,827,500 | | | |
| | | | | | | | 6,329,480 | | | |
| Finance – Investment Bankers/Brokers – 0.4% | | | | | | |
| | 65,500 | | | Charles Schwab Corp. | | | 1,390,565 | | | |
| | 8,800 | | | E*TRADE Financial Corp.* | | | 111,408 | | | |
| | | | | | | | 1,501,973 | | | |
| Finance – Other Services – 0.6% | | | | | | |
| | 37,700 | | | NASDAQ OMX Group, Inc. | | | 1,236,183 | | | |
| | 33,900 | | | NYSE Euronext | | | 1,403,460 | | | |
| | | | | | | | 2,639,643 | | | |
| Food – Confectionary – 0.7% | | | | | | |
| | 21,200 | | | Hershey Co. | | | 1,892,736 | | | |
| | 10,300 | | | J.M. Smucker Co. | | | 1,062,445 | | | |
| | | | | | | | 2,955,181 | | | |
| Food – Meat Products – 0.8% | | | | | | |
| | 52,200 | | | Hormel Foods Corp. | | | 2,013,876 | | | |
| | 49,700 | | | Tyson Foods, Inc. – Class A | | | 1,276,296 | | | |
| | | | | | | | 3,290,172 | | | |
| Food – Miscellaneous/Diversified – 1.7% | | | | | | |
| | 13,800 | | | Campbell Soup Co. | | | 618,102 | | | |
| | 107,800 | | | ConAgra Foods, Inc. | | | 3,765,454 | | | |
| | 8,300 | | | General Mills, Inc. | | | 402,799 | | | |
| | 15,700 | | | Kellogg Co. | | | 1,008,411 | | | |
| | 21,100 | | | McCormick & Co., Inc. | | | 1,484,596 | | | |
| | | | | | | | 7,279,362 | | | |
| Food – Retail – 0.4% | | | | | | |
| | 38,800 | | | Kroger Co. | | | 1,340,152 | | | |
| | 8,300 | | | Safeway, Inc. | | | 196,378 | | | |
| | | | | | | | 1,536,530 | | | |
| Gas – Distribution – 1.1% | | | | | | |
| | 45,300 | | | NiSource, Inc. | | | 1,297,392 | | | |
| | 42,400 | | | Sempra Energy | | | 3,466,624 | | | |
| | | | | | | | 4,764,016 | | | |
| Home Decoration Products – 0.5% | | | | | | |
| | 83,500 | | | Newell Rubbermaid, Inc. | | | 2,191,875 | | | |
| Hotels and Motels – 0.5% | | | | | | |
| | 2,000 | | | Marriott International, Inc. – Class A | | | 80,740 | | | |
| | 33,800 | | | Wyndham Worldwide Corp. | | | 1,934,374 | | | |
| | | | | | | | 2,015,114 | | | |
| Human Resources – 0.4% | | | | | | |
| | 45,500 | | | Robert Half International, Inc. | | | 1,511,965 | | | |
| Independent Power Producer – 0.8% | | | | | | |
| | 129,600 | | | NRG Energy, Inc. | | | 3,460,320 | | | |
| Industrial Automation and Robotics – 0.2% | | | | | | |
| | 12,400 | | | Rockwell Automation, Inc. | | | 1,030,936 | | | |
| Industrial Gases – 0.1% | | | | | | |
| | 2,100 | | | Airgas, Inc. | | | 200,466 | | | |
| | 3,600 | | | Praxair, Inc. | | | 414,576 | | | |
| | | | | | | | 615,042 | | | |
| Instruments – Controls – 0.1% | | | | | | |
| | 2,800 | | | Honeywell International, Inc. | | | 222,152 | | | |
| Instruments – Scientific – 0.9% | | | | | | |
| | 55,500 | | | PerkinElmer, Inc. | | | 1,803,750 | | | |
| | 24,400 | | | Thermo Fisher Scientific, Inc. | | | 2,064,972 | | | |
| | 1,700 | | | Waters Corp.* | | | 170,085 | | | |
| | | | | | | | 4,038,807 | | | |
| Insurance Brokers – 0.4% | | | | | | |
| | 25,300 | | | Aon PLC | | | 1,628,055 | | | |
| | 1,500 | | | Marsh & McLennan Cos., Inc. | | | 59,880 | | | |
| | | | | | | | 1,687,935 | | | |
| Internet Infrastructure Software – 0% | | | | | | |
| | 1,600 | | | F5 Networks, Inc.* | | | 110,080 | | | |
| Internet Security – 0.3% | | | | | | |
| | 58,300 | | | Symantec Corp. | | | 1,310,001 | | | |
| | 2,800 | | | VeriSign, Inc. | | | 125,048 | | | |
| | | | | | | | 1,435,049 | | | |
| Investment Management and Advisory Services – 1.2% | | | | | | |
| | 19,400 | | | Ameriprise Financial, Inc. | | | 1,569,072 | | | |
| | 11,800 | | | BlackRock, Inc. | | | 3,030,830 | | | |
| | 3,400 | | | Franklin Resources, Inc. | | | 462,468 | | | |
| | | | | | | | 5,062,370 | | | |
| Life and Health Insurance – 0.9% | | | | | | |
| | 42,200 | | | AFLAC, Inc. | | | 2,452,664 | | | |
| | 5,900 | | | Torchmark Corp. | | | 384,326 | | | |
| | 40,000 | | | Unum Group | | | 1,174,800 | | | |
| | | | | | | | 4,011,790 | | | |
| Linen Supply & Related Items – 0.4% | | | | | | |
| | 36,300 | | | Cintas Corp. | | | 1,653,102 | | | |
| Machinery – Farm – 0.1% | | | | | | |
| | 3,600 | | | Deere & Co. | | | 292,500 | | | |
| Machinery – General Industrial – 0.2% | | | | | | |
| | 7,600 | | | Roper Industries, Inc. | | | 944,072 | | | |
| Machinery – Pumps – 0.9% | | | | | | |
| | 75,000 | | | Flowserve Corp. | | | 4,050,750 | | | |
| Medical – Biomedical and Genetic – 2.7% | | | | | | |
| | 6,100 | | | Alexion Pharmaceuticals, Inc.* | | | 562,664 | | | |
| | 38,400 | | | Amgen, Inc. | | | 3,788,544 | | | |
| | 19,100 | | | Biogen Idec, Inc.* | | | 4,110,320 | | | |
| | 9,500 | | | Celgene Corp.* | | | 1,110,645 | | | |
| | 29,400 | | | Gilead Sciences, Inc.* | | | 1,505,574 | | | |
| | 4,900 | | | Life Technologies Corp.* | | | 362,649 | | | |
| | 1,400 | | | Regeneron Pharmaceuticals, Inc.* | | | 314,832 | | | |
| | | | | | | | 11,755,228 | | | |
| Medical – Drugs – 1.7% | | | | | �� | |
| | 19,800 | | | Abbott Laboratories | | | 690,624 | | | |
| | 10,300 | | | AbbVie, Inc. | | | 425,802 | | | |
| | 3,600 | | | Allergan, Inc. | | | 303,264 | | | |
| | 39,600 | | | Bristol-Myers Squibb Co. | | | 1,769,724 | | | |
| | 32,800 | | | Eli Lilly & Co. | | | 1,611,136 | | | |
| | 1,500 | | | Johnson & Johnson | | | 128,790 | | | |
| | 50,386 | | | Merck & Co., Inc. | | | 2,340,430 | | | |
| | 2,900 | | | Pfizer, Inc. | | | 81,229 | | | |
| | | | | | | | 7,350,999 | | | |
See Notes to Schedules of Investments and Other Information and Notes to Financial Statements.
Janus Mathematical Funds | 29
INTECH U.S. Core Fund
Schedule of Investments
As of June 30, 2013
| | | | | | | | | | | |
| Shares | | Value | | | |
| |
| Medical – Generic Drugs – 1.8% | | | | | | |
| | 31,900 | | | Actavis, Inc.* | | $ | 4,026,418 | | | |
| | 115,200 | | | Mylan, Inc.* | | | 3,574,656 | | | |
| | | | | | | | 7,601,074 | | | |
| Medical – HMO – 1.0% | | | | | | |
| | 20,163 | | | Aetna, Inc. | | | 1,281,157 | | | |
| | 33,200 | | | Cigna Corp. | | | 2,406,668 | | | |
| | 4,500 | | | Humana, Inc. | | | 379,710 | | | |
| | 2,200 | | | UnitedHealth Group, Inc. | | | 144,056 | | | |
| | | | | | | | 4,211,591 | | | |
| Medical – Hospitals – 0% | | | | | | |
| | 3,100 | | | Tenet Healthcare Corp.* | | | 142,910 | | | |
| Medical – Wholesale Drug Distributors – 0.4% | | | | | | |
| | 18,200 | | | AmerisourceBergen Corp. | | | 1,016,106 | | | |
| | 7,000 | | | Cardinal Health, Inc. | | | 330,400 | | | |
| | 3,600 | | | McKesson Corp. | | | 412,200 | | | |
| | | | | | | | 1,758,706 | | | |
| Medical Instruments – 0.8% | | | | | | |
| | 113,300 | | | Boston Scientific Corp.* | | | 1,050,291 | | | |
| | 1,900 | | | Edwards Lifesciences Corp.* | | | 127,680 | | | |
| | 3,300 | | | Intuitive Surgical, Inc.* | | | 1,671,714 | | | |
| | 9,400 | | | St. Jude Medical, Inc. | | | 428,922 | | | |
| | | | | | | | 3,278,607 | | | |
| Medical Labs and Testing Services – 0% | | | | | | |
| | 1,400 | | | Laboratory Corp. of America Holdings* | | | 140,140 | | | |
| Medical Products – 0.6% | | | | | | |
| | 9,500 | | | Baxter International, Inc. | | | 658,065 | | | |
| | 7,200 | | | Becton, Dickinson and Co. | | | 711,576 | | | |
| | 11,900 | | | CareFusion Corp.* | | | 438,515 | | | |
| | 5,200 | | | Stryker Corp. | | | 336,336 | | | |
| | 5,500 | | | Varian Medical Systems, Inc.* | | | 370,975 | | | |
| | 1,300 | | | Zimmer Holdings, Inc. | | | 97,422 | | | |
| | | | | | | | 2,612,889 | | | |
| Metal – Iron – 0% | | | | | | |
| | 7,000 | | | Cliffs Natural Resources, Inc. | | | 113,750 | | | |
| Metal Processors and Fabricators – 0% | | | | | | |
| | 400 | | | Precision Castparts Corp. | | | 90,404 | | | |
| Multi-Line Insurance – 3.5% | | | | | | |
| | 134,600 | | | Allstate Corp. | | | 6,476,952 | | | |
| | 6,100 | | | Assurant, Inc. | | | 310,551 | | | |
| | 96,900 | | | Cincinnati Financial Corp. | | | 4,447,710 | | | |
| | 11,800 | | | Genworth Financial, Inc. – Class A* | | | 134,638 | | | |
| | 50,700 | | | Hartford Financial Services Group, Inc. | | | 1,567,644 | | | |
| | 73,400 | | | XL Group PLC | | | 2,225,488 | | | |
| | | | | | | | 15,162,983 | | | |
| Multimedia – 3.8% | | | | | | |
| | 124,400 | | | News Corp. – Class A | | | 4,055,440 | | | |
| | 121,000 | | | Time Warner, Inc. | | | 6,996,220 | | | |
| | 2,300 | | | Viacom, Inc. – Class B | | | 156,515 | | | |
| | 82,100 | | | Walt Disney Co. | | | 5,184,615 | | | |
| | | | | | | | 16,392,790 | | | |
| Networking Products – 0% | | | | | | |
| | 6,800 | | | Cisco Systems, Inc. | | | 165,308 | | | |
| Non-Hazardous Waste Disposal – 0.1% | | | | | | |
| | 5,500 | | | Republic Services, Inc. | | | 186,670 | | | |
| | 2,500 | | | Waste Management, Inc. | | | 100,825 | | | |
| | | | | | | | 287,495 | | | |
| Office Supplies and Forms – 0.3% | | | | | | |
| | 30,600 | | | Avery Dennison Corp. | | | 1,308,456 | | | |
| Oil – Field Services – 0.2% | | | | | | |
| | 9,600 | | | Halliburton Co. | | | 400,512 | | | |
| | 7,947 | | | Schlumberger, Ltd. (U.S. Shares) | | | 569,482 | | | |
| | | | | | | | 969,994 | | | |
| Oil and Gas Drilling – 0.3% | | | | | | |
| | 9,200 | | | Ensco PLC – Class A | | | 534,704 | | | |
| | 15,300 | | | Helmerich & Payne, Inc. | | | 955,485 | | | |
| | | | | | | | 1,490,189 | | | |
| Oil Companies – Exploration and Production – 1.0% | | | | | | |
| | 19,800 | | | Cabot Oil & Gas Corp. | | | 1,406,196 | | | |
| | 2,700 | | | ConocoPhillips | | | 163,350 | | | |
| | 4,300 | | | EOG Resources, Inc. | | | 566,224 | | | |
| | 3,100 | | | EQT Corp. | | | 246,047 | | | |
| | 14,000 | | | Noble Energy, Inc. | | | 840,560 | | | |
| | 1,200 | | | Occidental Petroleum Corp. | | | 107,076 | | | |
| | 5,900 | | | Pioneer Natural Resources Co. | | | 854,025 | | | |
| | | | | | | | 4,183,478 | | | |
| Oil Companies – Integrated – 1.1% | | | | | | |
| | 5,430 | | | Chevron Corp. | | | 642,586 | | | |
| | 21,900 | | | Exxon Mobil Corp. | | | 1,978,665 | | | |
| | 5,000 | | | Hess Corp. | | | 332,450 | | | |
| | 20,900 | | | Marathon Oil Corp. | | | 722,722 | | | |
| | 13,400 | | | Murphy Oil Corp. | | | 815,926 | | | |
| | 7,200 | | | Phillips 66 | | | 424,152 | | | |
| | | | | | | | 4,916,501 | | | |
| Oil Field Machinery and Equipment – 0% | | | | | | |
| | 500 | | | Cameron International Corp.* | | | 30,580 | | | |
| Oil Refining and Marketing – 2.5% | | | | | | |
| | 69,200 | | | Marathon Petroleum Corp. | | | 4,917,352 | | | |
| | 67,700 | | | Tesoro Corp. | | | 3,542,064 | | | |
| | 63,600 | | | Valero Energy Corp. | | | 2,211,372 | | | |
| | | | | | | | 10,670,788 | | | |
| Paper and Related Products – 0.2% | | | | | | |
| | 18,900 | | | International Paper Co. | | | 837,459 | | | |
| | 6,500 | | | MeadWestvaco Corp. | | | 221,715 | | | |
| | | | | | | | 1,059,174 | | | |
| Pipelines – 0.9% | | | | | | |
| | 31,100 | | | ONEOK, Inc. | | | 1,284,741 | | | |
| | 28,800 | | | Spectra Energy Corp. | | | 992,448 | | | |
| | 46,000 | | | Williams Cos., Inc. | | | 1,493,620 | | | |
| | | | | | | | 3,770,809 | | | |
| Property and Casualty Insurance – 0.4% | | | | | | |
| | 12,700 | | | Progressive Corp. | | | 322,834 | | | |
| | 16,600 | | | Travelers Cos., Inc. | | | 1,326,672 | | | |
| | | | | | | | 1,649,506 | | | |
| Publishing – Newspapers – 0.2% | | | | | | |
| | 39,800 | | | Gannett Co., Inc. | | | 973,508 | | | |
| Real Estate Management/Services – 0.1% | | | | | | |
| | 9,900 | | | CBRE Group, Inc. – Class A* | | | 231,264 | | | |
See Notes to Schedules of Investments and Other Information and Notes to Financial Statements.
30 | JUNE 30, 2013
Schedule of Investments
As of June 30, 2013
| | | | | | | �� | | | | |
| Shares | | Value | | | |
| |
| REIT – Apartments – 0.1% | | | | | | |
| | 9,800 | | | Apartment Investment & Management Co. – Class A | | $ | 294,392 | | | |
| REIT – Diversified – 1.5% | | | | | | |
| | 13,300 | | | American Tower Corp. | | | 973,161 | | | |
| | 1,600 | | | Vornado Realty Trust | | | 132,560 | | | |
| | 189,300 | | | Weyerhaeuser Co. | | | 5,393,157 | | | |
| | | | | | | | 6,498,878 | | | |
| REIT – Health Care – 0.4% | | | | | | |
| | 15,700 | | | HCP, Inc. | | | 713,408 | | | |
| | 2,600 | | | Heath Care REIT, Inc. | | | 174,278 | | | |
| | 12,600 | | | Ventas, Inc. | | | 875,196 | | | |
| | | | | | | | 1,762,882 | | | |
| REIT – Regional Malls – 0.4% | | | | | | |
| | 4,800 | | | Macerich Co. | | | 292,656 | | | |
| | 9,000 | | | Simon Property Group, Inc. | | | 1,421,280 | | | |
| | | | | | | | 1,713,936 | | | |
| REIT – Storage – 0.3% | | | | | | |
| | 9,100 | | | Public Storage | | | 1,395,303 | | | |
| Retail – Apparel and Shoe – 1.8% | | | | | | |
| | 105,100 | | | Gap, Inc. | | | 4,385,823 | | | |
| | 2,100 | | | PVH Corp. | | | 262,605 | | | |
| | 44,500 | | | Ross Stores, Inc. | | | 2,884,045 | | | |
| | 11,100 | | | Urban Outfitters, Inc.* | | | 446,442 | | | |
| | | | | | | | 7,978,915 | | | |
| Retail – Auto Parts – 0.1% | | | | | | |
| | 700 | | | AutoZone, Inc.* | | | 296,583 | | | |
| | 2,700 | | | O’Reilly Automotive, Inc.* | | | 304,074 | | | |
| | | | | | | | 600,657 | | | |
| Retail – Automobile – 0.2% | | | | | | |
| | 15,000 | | | CarMax, Inc.* | | | 692,400 | | | |
| Retail – Building Products – 4.4% | | | | | | |
| | 198,500 | | | Home Depot, Inc. | | | 15,377,795 | | | |
| | 89,400 | | | Lowe’s Cos., Inc. | | | 3,656,460 | | | |
| | | | | | | | 19,034,255 | | | |
| Retail – Computer Equipment – 0.1% | | | | | | |
| | 7,500 | | | GameStop Corp. – Class A | | | 315,225 | | | |
| Retail – Consumer Electronics – 0% | | | | | | |
| | 5,700 | | | Best Buy Co., Inc. | | | 155,781 | | | |
| Retail – Discount – 0.8% | | | | | | |
| | 1,200 | | | Costco Wholesale Corp. | | | 132,684 | | | |
| | 43,300 | | | Wal-Mart Stores, Inc. | | | 3,225,417 | | | |
| | | | | | | | 3,358,101 | | | |
| Retail – Drug Store – 0.1% | | | | | | |
| | 12,400 | | | Walgreen Co. | | | 548,080 | | | |
| Retail – Major Department Stores – 3.1% | | | | | | |
| | 42,900 | | | JC Penney Co., Inc.* | | | 732,732 | | | |
| | 250,700 | | | TJX Cos., Inc. | | | 12,550,042 | | | |
| | | | | | | | 13,282,774 | | | |
| Retail – Pet Food and Supplies – 0.1% | | | | | | |
| | 4,800 | | | PetSmart, Inc. | | | 321,552 | | | |
| Retail – Regional Department Stores – 0.1% | | | | | | |
| | 6,800 | | | Macy’s, Inc. | | | 326,400 | | | |
| Retail – Restaurants – 0.3% | | | | | | |
| | 200 | | | Chipotle Mexican Grill, Inc.* | | | 72,870 | | | |
| | 8,400 | | | McDonald’s Corp. | | | 831,600 | | | |
| | 7,600 | | | Yum! Brands, Inc. | | | 526,984 | | | |
| | | | | | | | 1,431,454 | | | |
| Savings/Loan/Thrifts – 0.2% | | | | | | |
| | 106,600 | | | Hudson City Bancorp, Inc. | | | 976,456 | | | |
| Security Services – 0.6% | | | | | | |
| | 63,200 | | | ADT Corp. | | | 2,518,520 | | | |
| Semiconductor Components/Integrated Circuits – 0.1% | | | | | | |
| | 2,000 | | | Analog Devices, Inc. | | | 90,120 | | | |
| | 9,000 | | | Linear Technology Corp. | | �� | 331,560 | | | |
| | | | | | | | 421,680 | | | |
| Semiconductor Equipment – 0.1% | | | | | | |
| | 25,500 | | | Applied Materials, Inc. | | | 380,205 | | | |
| | 5,000 | | | Lam Research Corp.* | | | 221,700 | | | |
| | | | | | | | 601,905 | | | |
| Steel – Producers – 0.1% | | | | | | |
| | 7,400 | | | Nucor Corp. | | | 320,568 | | | |
| Super-Regional Banks – 0.4% | | | | | | |
| | 11,300 | | | U.S. Bancorp | | | 408,495 | | | |
| | 27,980 | | | Wells Fargo & Co. | | | 1,154,735 | | | |
| | | | | | | | 1,563,230 | | | |
| Telecommunication Equipment – 0.4% | | | | | | |
| | 17,200 | | | Harris Corp. | | | 847,100 | | | |
| | 45,600 | | | Juniper Networks, Inc.* | | | 880,536 | | | |
| | | | | | | | 1,727,636 | | | |
| Telecommunication Equipment – Fiber Optics – 0% | | | | | | |
| | 10,700 | | | JDS Uniphase Corp.* | | | 153,866 | | | |
| Telephone – Integrated – 1.1% | | | | | | |
| | 81,458 | | | AT&T, Inc. | | | 2,883,613 | | | |
| | 29,985 | | | CenturyLink, Inc. | | | 1,059,970 | | | |
| | 18,100 | | | Verizon Communications, Inc. | | | 911,154 | | | |
| | | | | | | | 4,854,737 | | | |
| Television – 0.2% | | | | | | |
| | 14,000 | | | CBS Corp. – Class B | | | 684,180 | | | |
| Tobacco – 1.5% | | | | | | |
| | 58,200 | | | Altria Group, Inc. | | | 2,036,418 | | | |
| | 6,100 | | | Lorillard, Inc. | | | 266,448 | | | |
| | 31,200 | | | Philip Morris International, Inc. | | | 2,702,544 | | | |
| | 32,000 | | | Reynolds American, Inc. | | | 1,547,840 | | | |
| | | | | | | | 6,553,250 | | | |
| Tools – Hand Held – 0.6% | | | | | | |
| | 28,600 | | | Snap-on, Inc. | | | 2,556,268 | | | |
| Transportation – Railroad – 0.2% | | | | | | |
| | 4,000 | | | Kansas City Southern | | | 423,840 | | | |
| | 4,100 | | | Union Pacific Corp. | | | 632,548 | | | |
| | | | | | | | 1,056,388 | | | |
| Transportation – Services – 0.4% | | | | | | |
| | 5,900 | | | Expeditors International of Washington, Inc. | | | 224,259 | | | |
| | 4,700 | | | FedEx Corp. | | | 463,326 | | | |
| | 12,200 | | | Ryder System, Inc. | | | 741,638 | | | |
| | 1,000 | | | United Parcel Service, Inc. – Class B | | | 86,480 | | | |
| | | | | | | | 1,515,703 | | | |
See Notes to Schedules of Investments and Other Information and Notes to Financial Statements.
Janus Mathematical Funds | 31
INTECH U.S. Core Fund
Schedule of Investments
As of June 30, 2013
| | | | | | | | | | | |
| Shares | | Value | | | |
| |
| Vitamins and Nutrition Products – 0% | | | | | | |
| | 1,400 | | | Mead Johnson Nutrition Co. | | $ | 110,922 | | | |
| Web Portals/Internet Service Providers – 1.7% | | | | | | |
| | 7,000 | | | Google, Inc. – Class A* | | | 6,162,590 | | | |
| | 54,700 | | | Yahoo!, Inc.* | | | 1,373,517 | | | |
| | | | | | | | 7,536,107 | | | |
| Wireless Equipment – 1.7% | | | | | | |
| | 91,800 | | | Crown Castle International Corp.* | | | 6,645,402 | | | |
| | 8,600 | | | Motorola Solutions, Inc. | | | 496,478 | | | |
| | | | | | | | 7,141,880 | | | |
| |
| |
| Total Common Stock (cost $345,649,022) | | | 426,886,100 | | | |
| |
| |
| Money Market – 0.7% | | | | | | |
| | 3,093,665 | | | Janus Cash Liquidity Fund LLC, 0%£
(cost $3,093,665) | | | 3,093,665 | | | |
| |
| |
| Total Investments (total cost $348,742,687) – 99.3% | | | 429,979,765 | | | |
| |
| |
| Cash, Receivables and Other Assets, net of Liabilities – 0.7% | | | 2,960,376 | | | |
| |
| |
| Net Assets – 100% | | $ | 432,940,141 | | | |
| |
| |
Summary of Investments by Country – (Long Positions) (unaudited)
| | | | | | | | | |
| | | | | | % of Investment
| |
| Country | | Value | | | Securities | |
| |
| |
United States†† | | $ | 429,979,765 | | | | 100.0% | |
| |
| |
| Total | | $ | 429,979,765 | | | | 100.0% | |
| | | |
| †† | | Includes Cash Equivalents of 0.7%. |
See Notes to Schedules of Investments and Other Information and Notes to Financial Statements.
32 | JUNE 30, 2013
INTECH U.S. Growth Fund (unaudited)
| | | | | | | |
Fund Snapshot
INTECH’s active approach focuses on adding value by selecting stocks with unique volatility characteristics and low correlations to one another.
| | | | | | Managed by
INTECH Investment
Management LLC |
Performance Overview
For the 12-month period ended June 30, 2013, INTECH U.S. Growth Fund’s Class S Shares returned 17.36%. This compares to the 17.07% return posted by the Russell 1000 Growth Index, the Fund’s benchmark.
Investment Strategy
INTECH’s mathematical investing process seeks to build a more efficient portfolio than its benchmark, with returns in excess of the index while maintaining benchmark-like risk. The process does not attempt to predict the direction of the market, nor does it have a view of any particular company in the portfolio. Instead, it employs a proprietary optimization process to build portfolios with the potential to outperform the index by capturing stocks’ natural volatility.
Within specific risk controls, INTECH’s disciplined mathematical process establishes target proportional weightings for stocks in the portfolio as a result of an optimization routine. Once the weights are determined and the portfolio is constructed, it is rebalanced and re-optimized on a periodic basis. By limiting the distance any one stock position can deviate from its benchmark weight, INTECH’s process attempts to control the relative risk of the portfolio. We believe that instituting an investment process aimed at providing consistent, positive excess returns at benchmark-like risk, will allow us to meet our investors’ objectives while minimizing the risk of significant underperformance relative to the benchmark.
Performance Review
As stock prices moved naturally throughout the period, we continued to implement our mathematical process in a disciplined manner in an effort to maintain a more efficient portfolio than the benchmark, without increasing relative risk. While other factors may influence performance over the short term, we believe that the consistent application of our process will help the Fund perform well over the long term.
In INTECH’s history, which spans more than 26 years, we have experienced periods of both underperformance and outperformance relative to the benchmark. From our perspective, the key is to keep periods of underperformance both short in duration and mild in scope. INTECH aims to achieve excess returns over the long term and we believe the Fund remains well positioned for long-term capital growth.
Investment Strategy and Outlook
Going forward, we will continue building portfolios in a disciplined and deliberate manner, with risk management remaining the hallmark of our investment process. While we may experience short periods of underperformance, we aim to exceed the benchmark over a three- to five-year time horizon. As INTECH’s ongoing research efforts yield modest improvements, we will continue implementing changes that we believe are likely to improve the long-term results for our clients.
Thank you for your investment in INTECH U.S. Growth Fund.
Janus Mathematical Funds | 33
INTECH U.S. Growth Fund (unaudited)
INTECH U.S. Growth Fund At A Glance
5 Largest Equity Holdings – (% of Net Assets)
As of June 30, 2013
| | | | | |
Apple, Inc.
Computers | | | 2.2% | |
International Business Machines Corp.
Computer Services | | | 2.1% | |
Comcast Corp. – Class A
Cable/Satellite Television | | | 1.6% | |
Sherwin-Williams Co.
Coatings and Paint Products | | | 1.5% | |
Google, Inc. – Class A
Web Portals/Internet Service Providers | | | 1.4% | |
| | | | | |
| | | | 8.8% | |
Asset Allocation – (% of Net Assets)
As of June 30, 2013
Top Country Allocations – Long Positions (% of Investment Securities)
As of June 30, 2013
34 | JUNE 30, 2013
(unaudited)
| | | | | | | | | | | | |
| Average Annual Total Return – for the periods ended June 30, 2013 | | | | | Expense Ratios – per the October 26, 2012 prospectus |
| | | One
| | Five
| | Ten
| | Since
| | | Total Annual Fund
|
| | | Year | | Year | | Year | | Inception* | | | Operating Expenses |
| | | | | | | | | | | | |
| INTECH U.S. Growth Fund – Class A Shares | | | | | | | | | | | |
| | | | | | | | | | | | |
| NAV | | 17.57% | | 6.08% | | 6.69% | | 7.24% | | | 0.92% |
| | | | | | | | | | | | |
| MOP | | 10.81% | | 4.83% | | 6.28% | | 6.84% | | | |
| | | | | | | | | | | | |
| INTECH U.S. Growth Fund – Class C Shares | | | | | | | | | | | |
| | | | | | | | | | | | |
| NAV | | 16.70% | | 5.20% | | 6.07% | | 6.62% | | | 1.71% |
| | | | | | | | | | | | |
| CDSC | | 15.70% | | 5.20% | | 6.07% | | 6.62% | | | |
| | | | | | | | | | | | |
| INTECH U.S. Growth Fund – Class I Shares | | 17.89% | | 6.35% | | 6.69% | | 7.24% | | | 0.62% |
| | | | | | | | | | | | |
| INTECH U.S. Growth Fund – Class S Shares | | 17.36% | | 5.88% | | 6.69% | | 7.24% | | | 1.07% |
| | | | | | | | | | | | |
| INTECH U.S. Growth Fund – Class T Shares | | 17.61% | | 5.88% | | 6.69% | | 7.24% | | | 0.83% |
| | | | | | | | | | | | |
| Russell 1000® Growth Index | | 17.07% | | 7.47% | | 7.40% | | 7.96% | | | |
| | | | | | | | | | | | |
| Morningstar Quartile – Class S Shares | | 2nd | | 2nd | | 3rd | | 3rd | | | |
| | | | | | | | | | | | |
| Morningstar Ranking – based on total returns for Large Growth Funds | | 804/1,764 | | 720/1,568 | | 762/1,315 | | 736/1,291 | | | |
| | | | | | | | | | | | |
| Visit janus.com/advisor/mutual-funds to view current performance and characteristic information | | | |
| | | | | | | | | | | | |
Returns quoted are past performance and do not guarantee future results; current performance may be lower or higher. Investment returns and principal value will vary; there may be a gain or loss when shares are sold. For the most recent month-end performance call 877.33JANUS(52687) or visit janus.com/advisor/mutual-funds.
Performance shown for Class A Shares at Maximum Offering Price (MOP) includes the Fund’s maximum sales charge of 5.75%. Performance shown at Net Asset Value (NAV) does not include this charge and would have been lower had this charge been taken into account.
Performance shown for Class C Shares includes a 1% contingent deferred sales charge (CDSC) on periods of less than 12 months. Performance shown at Net Asset Value (NAV) does not include this sales charge and would have been lower had this sales charge been taken into account.
See important disclosures on the next page.
Janus Mathematical Funds | 35
INTECH U.S. Growth Fund (unaudited)
The proprietary mathematical process used by INTECH Investment Management LLC (“INTECH”) may not achieve the desired results. The rebalancing techniques used by the Fund may result in a higher portfolio turnover rate, higher expenses and potentially higher net taxable gains or losses compared to a “buy and hold” or index fund strategy.
The Fund’s performance may be affected by risks that include those associated with investments in specific industries or countries and potential conflicts of interest with the Janus “funds of funds.” Additional risks to the Fund may include those associated with investing in foreign securities, initial public offerings (“IPOs”), real estate investment trusts (“REITs”), and derivatives. Please see the Fund’s prospectus or janus.com/info for more information about risks, portfolio holdings and other details.
The Fund invests in REITs which may be subject to a higher degree of market risk because of concentration in a specific industry, sector or geographic region. REITs may be subject to risks including, but not limited to: legal, political, liquidity, interest rate risks, a decline in the value of real estate, risks related to general and economic conditions, changes in the value of the underlying property owned by the trust and defaults by borrowers. To the extent the Fund invests in foreign REITs, the Fund may be subject to fluctuations in currency rates or political or economic conditions in a particular country.
The Fund will normally invest at least 80% of its net assets, measured at the time of purchase, in the type of securities described by its name.
Returns include reinvestment of all dividends and distributions. The returns do not include adjustments in accordance with generally accepted accounting principles required at the period end for financial reporting purposes.
Class A Shares, Class C Shares, Class I Shares, and Class S Shares of the Fund commenced operations on July 6, 2009. The performance shown for periods prior to July 6, 2009 reflects the historical performance of one or more share classes of the predecessor fund, calculated using the fees and expenses of one or more share classes accounting for, when applicable and permitted, any fee and expense limitations or waivers.
Class T Shares of the Fund commenced operations on July 6, 2009. The performance shown for periods prior to July 6, 2009 reflects the historical performance of the predecessor fund’s Class S Shares.
If each share class of the Fund had been available during periods prior to its commencement, the performance shown may have been different. The performance shown for periods following the Fund’s commencement of each share class reflects the fees and expenses of each respective share class, net of any applicable fee and expense limitations or waivers. Please refer to the Fund’s prospectus for further details concerning historical performance.
Ranking is for the share class shown only; other classes may have different performance characteristics. When an expense waiver is in effect, it may have a material effect on the total return, and therefore the ranking for the period.
© 2013 Morningstar, Inc. All Rights Reserved.
There is no assurance that the investment process will consistently lead to successful investing.
See Notes to Schedules of Investments and Other Information for index definitions.
The weighting of securities within the portfolio may differ significantly from the weightings within the index. The index is unmanaged and is not available for direct investment; therefore, its performance does not reflect the expenses associated with the active management of an actual portfolio.
See “Useful Information About Your Fund Report.”
| | | |
| * | | The predecessor Fund’s inception date – January 2, 2003 |
36 | JUNE 30, 2013
(unaudited)
As a shareholder of the Fund, you incur two types of costs: (1) transaction costs, such as sales charges (loads) on purchase payments (applicable to Class A Shares only); and (2) ongoing costs, including management fees; distribution and shareholder servicing (12b-1) fees; administrative services fees payable pursuant to the Transfer Agency Agreement; and other Fund expenses. This example is intended to help you understand your ongoing costs (in dollars) of investing in the Fund and to compare these costs with the ongoing costs of investing in other mutual funds. To do so, compare this 5% hypothetical example with the 5% hypothetical examples that appear in the shareholder reports of the other funds. The example is based upon an investment of $1,000 invested at the beginning of the period and held for the six-months indicated, unless noted otherwise in the table and footnotes below.
Actual Expenses
The information in the table under the heading “Actual” provides information about actual account values and actual expenses. You may use the information in these columns, together with the amount you invested, to estimate the expenses that you paid over the period. Simply divide your account value by $1,000 (for example, an $8,600 account value divided by $1,000 = 8.6), then multiply the result by the number in the appropriate column for your share class under the heading entitled “Expenses Paid During Period” to estimate the expenses you paid on your account during the period.
Hypothetical Example for Comparison Purposes
The information in the table under the heading “Hypothetical (5% return before expenses)” provides information about hypothetical account values and hypothetical expenses based upon the Fund’s actual expense ratio and an assumed rate of return of 5% per year before expenses, which is not the Fund’s actual return. The hypothetical account values and expenses may not be used to estimate the actual ending account balance or expenses you paid for the period. You may use this information to compare the ongoing costs of investing in the Fund and other funds. To do so, compare this 5% hypothetical example with the 5% hypothetical examples that appear in the shareholder reports of the other funds. Additionally, for an analysis of the fees associated with an investment in any share class or other similar funds, please visit www.finra.org/fundanalyzer.
Please note that the expenses shown in the table are meant to highlight your ongoing costs only and do not reflect any transaction costs. These fees are fully described in the Fund’s prospectus. Therefore, the hypothetical examples are useful in comparing ongoing costs only, and will not help you determine the relative total costs of owning different funds. In addition, if these transaction costs were included, your costs would have been higher.
| | | | | | | | | | | | | | | | | | | | | | | | | | | | | | | |
| | | | | Hypothetical
| | | | |
| | | Actual | | (5% return before expenses) | | | | |
| | | Beginning
| | Ending
| | Expenses
| | Beginning
| | Ending
| | Expenses
| | | | |
| | | Account
| | Account
| | Paid During
| | Account
| | Account
| | Paid During
| | Net Annualized
| | |
| | | Value
| | Value
| | Period
| | Value
| | Value
| | Period
| | Expense Ratio
| | |
| | | (1/1/13) | | (6/30/13) | | (1/1/13 - 6/30/13)† | | (1/1/13) | | (6/30/13) | | (1/1/13 - 6/30/13)† | | (1/1/13 - 6/30/13) | | |
| |
| |
| Class A Shares | | $ | 1,000.00 | | | $ | 1,123.00 | | | $ | 4.74 | | | $ | 1,000.00 | | | $ | 1,020.33 | | | $ | 4.51 | | | | 0.90% | | | |
| |
| |
| Class C Shares | | $ | 1,000.00 | | | $ | 1,118.90 | | | $ | 8.30 | | | $ | 1,000.00 | | | $ | 1,016.96 | | | $ | 7.90 | | | | 1.58% | | | |
| |
| |
| Class I Shares | | $ | 1,000.00 | | | $ | 1,124.70 | | | $ | 3.00 | | | $ | 1,000.00 | | | $ | 1,021.97 | | | $ | 2.86 | | | | 0.57% | | | |
| |
| |
| Class S Shares | | $ | 1,000.00 | | | $ | 1,122.10 | | | $ | 5.47 | | | $ | 1,000.00 | | | $ | 1,019.64 | | | $ | 5.21 | | | | 1.04% | | | |
| |
| |
| Class T Shares | | $ | 1,000.00 | | | $ | 1,123.00 | | | $ | 4.21 | | | $ | 1,000.00 | | | $ | 1,020.83 | | | $ | 4.01 | | | | 0.80% | | | |
| |
| |
| | | |
| † | | Expenses Paid During Period are equal to the Net Annualized Expense Ratio multiplied by the average account value over the period, multiplied by the number of days in the most recent six-month period, divided by the number of days in the fiscal year. Expenses in the examples include the effect of applicable fee waivers and/or expense reimbursements, if any. Had such waivers and/or reimbursements not been in effect, your expenses would have been higher. Please refer to the Notes to Financial Statements or the Fund’s prospectus for more information regarding waivers and/or reimbursements. |
Janus Mathematical Funds | 37
INTECH U.S. Growth Fund
Schedule of Investments
As of June 30, 2013
| | | | | | | | | | | |
| Shares | | Value | | | |
| |
| Common Stock – 99.5% | | | | | | |
| Advertising Agencies – 0.2% | | | | | | |
| | 4,900 | | | Interpublic Group of Cos., Inc. | | $ | 71,295 | | | |
| | 6,200 | | | Omnicom Group, Inc. | | | 389,794 | | | |
| | | | | | | | 461,089 | | | |
| Advertising Sales – 0.3% | | | | | | |
| | 21,100 | | | Lamar Advertising Co. – Class A* | | | 915,740 | | | |
| Aerospace and Defense – 1.5% | | | | | | |
| | 800 | | | Boeing Co. | | | 81,952 | | | |
| | 4,300 | | | Lockheed Martin Corp. | | | 466,378 | | | |
| | 12,900 | | | Rockwell Collins, Inc. | | | 817,989 | | | |
| | 15,700 | | | TransDigm Group, Inc. | | | 2,461,289 | | | |
| | | | | | | | 3,827,608 | | | |
| Aerospace and Defense – Equipment – 0.8% | | | | | | |
| | 14,900 | | | B/E Aerospace, Inc.* | | | 939,892 | | | |
| | 2,900 | | | Triumph Group, Inc. | | | 229,535 | | | |
| | 8,600 | | | United Technologies Corp. | | | 799,284 | | | |
| | | | | | | | 1,968,711 | | | |
| Agricultural Chemicals – 0.4% | | | | | | |
| | 10,600 | | | Monsanto Co. | | | 1,047,280 | | | |
| Airlines – 1.0% | | | | | | |
| | 6,500 | | | Copa Holdings S.A. – Class A | | | 852,280 | | | |
| | 42,700 | | | Delta Air Lines, Inc. | | | 798,917 | | | |
| | 38,200 | | | Southwest Airlines Co. | | | 492,398 | | | |
| | 19,300 | | | United Continental Holdings, Inc.* | | | 603,897 | | | |
| | | | | | | | 2,747,492 | | | |
| Apparel Manufacturers – 0.2% | | | | | | |
| | 2,500 | | | Carter’s, Inc. | | | 185,175 | | | |
| | 6,200 | | | Hanesbrands, Inc. | | | 318,804 | | | |
| | 300 | | | Ralph Lauren Corp. | | | 52,122 | | | |
| | 400 | | | VF Corp. | | | 77,224 | | | |
| | | | | | | | 633,325 | | | |
| Applications Software – 0.7% | | | | | | |
| | 800 | | | Citrix Systems, Inc.* | | | 48,264 | | | |
| | 6,000 | | | Compuware Corp. | | | 62,100 | | | |
| | 27,600 | | | Microsoft Corp. | | | 953,028 | | | |
| | 5,900 | | | NetSuite, Inc.* | | | 541,266 | | | |
| | 9,900 | | | Nuance Communications, Inc.* | | | 181,962 | | | |
| | 700 | | | Salesforce.com, Inc.* | | | 26,726 | | | |
| | | | | | | | 1,813,346 | | | |
| Athletic Footwear – 0.1% | | | | | | |
| | 5,100 | | | NIKE, Inc. – Class B | | | 324,768 | | | |
| Automotive – Cars and Light Trucks – 0.1% | | | | | | |
| | 3,000 | | | Tesla Motors, Inc.* | | | 322,290 | | | |
| Automotive – Medium and Heavy Duty Trucks – 0% | | | | | | |
| | 2,400 | | | PACCAR, Inc. | | | 128,784 | | | |
| Automotive – Truck Parts and Equipment – Original – 0.6% | | | | | | |
| | 25,500 | | | Delphi Automotive PLC | | | 1,292,595 | | | |
| | 1,700 | | | Visteon Corp.* | | | 107,304 | | | |
| | 700 | | | WABCO Holdings, Inc.* | | | 52,283 | | | |
| | | | | | | | 1,452,182 | | | |
| Beverages – Non-Alcoholic – 1.5% | | | | | | |
| | 37,500 | | | Coca-Cola Co. | | | 1,504,125 | | | |
| | 18,400 | | | Coca-Cola Enterprises, Inc. | | | 646,944 | | | |
| | 20,100 | | | Dr. Pepper Snapple Group, Inc. | | | 923,193 | | | |
| | 3,400 | | | Monster Beverage Corp.* | | | 206,618 | | | |
| | 7,700 | | | PepsiCo, Inc. | | | 629,783 | | | |
| | | | | | | | 3,910,663 | | | |
| Beverages – Wine and Spirits – 0.3% | | | | | | |
| | 13,200 | | | Brown-Forman Corp. – Class B | | | 891,660 | | | |
| Broadcast Services and Programming – 0.5% | | | | | | |
| | 11,700 | | | Discovery Communications, Inc. – Class A* | | | 903,357 | | | |
| | 3,200 | | | Scripps Networks Interactive, Inc. – Class A | | | 213,632 | | | |
| | 4,200 | | | Starz – Class A* | | | 92,820 | | | |
| | | | | | | | 1,209,809 | | | |
| Building – Heavy Construction – 0.1% | | | | | | |
| | 6,400 | | | Chicago Bridge & Iron Co. N.V. | | | 381,824 | | | |
| Building – Residential and Commercial – 0.4% | | | | | | |
| | 1,000 | | | NVR, Inc.* | | | 922,000 | | | |
| Building and Construction Products – Miscellaneous – 0.1% | | | | | | |
| | 4,700 | | | Fortune Brands Home & Security, Inc. | | | 182,078 | | | |
| Building Products – Air and Heating – 0.2% | | | | | | |
| | 8,200 | | | Lennox International, Inc. | | | 529,228 | | | |
| Building Products – Cement and Aggregate – 0.1% | | | | | | |
| | 3,800 | | | Martin Marietta Materials, Inc. | | | 373,996 | | | |
| Building Products – Wood – 0.1% | | | | | | |
| | 8,800 | | | Masco Corp. | | | 171,512 | | | |
| Cable/Satellite Television – 4.2% | | | | | | |
| | 7,100 | | | Charter Communications, Inc. – Class A* | | | 879,335 | | | |
| | 98,300 | | | Comcast Corp. – Class A | | | 4,116,804 | | | |
| | 11,000 | | | DIRECTV* | | | 677,820 | | | |
| | 14,500 | | | DISH Network Corp. – Class A | | | 616,540 | | | |
| | 2 | | | Liberty Global PLC* | | | 136 | | | |
| | 30,335 | | | Liberty Global PLC – Class A* | | | 2,247,217 | | | |
| | 22,200 | | | Time Warner Cable, Inc. | | | 2,497,056 | | | |
| | | | | | | | 11,034,908 | | | |
| Casino Hotels – 0.4% | | | | | | |
| | 9,800 | | | Las Vegas Sands Corp. | | | 518,714 | | | |
| | 5,100 | | | Wynn Resorts, Ltd. | | | 652,800 | | | |
| | | | | | | | 1,171,514 | | | |
| Casino Services – 0.2% | | | | | | |
| | 29,400 | | | International Game Technology | | | 491,274 | | | |
| Chemicals – Diversified – 0.3% | | | | | | |
| | 6,000 | | | Celanese Corp. | | | 268,800 | | | |
| | 2,100 | | | E.I. du Pont de Nemours & Co. | | | 110,250 | | | |
| | 3,000 | | | FMC Corp. | | | 183,180 | | | |
| | 2,900 | | | LyondellBasell Industries N.V. – Class A | | | 192,154 | | | |
| | 400 | | | PPG Industries, Inc. | | | 58,564 | | | |
| | 1,400 | | | Rockwood Holdings, Inc. | | | 89,642 | | | |
| | | | | | | | 902,590 | | | |
| Chemicals – Specialty – 0.9% | | | | | | |
| | 5,300 | | | Albemarle Corp. | | | 330,137 | | | |
| | 3,652 | | | Eastman Chemical Co. | | | 255,676 | | | |
| | 11,014 | | | Ecolab, Inc. | | | 938,283 | | | |
| | 3,700 | | | International Flavors & Fragrances, Inc. | | | 278,092 | | | |
| | 800 | | | NewMarket Corp. | | | 210,048 | | | |
| | 2,800 | | | WR Grace & Co.* | | | 235,312 | | | |
| | | | | | | | 2,247,548 | | | |
See Notes to Schedules of Investments and Other Information and Notes to Financial Statements.
38 | JUNE 30, 2013
Schedule of Investments
As of June 30, 2013
| | | | | | | | | | | |
| Shares | | Value | | | |
| |
| Coatings and Paint Products – 1.8% | | | | | | |
| | 700 | | | RPM International, Inc. | | $ | 22,358 | | | |
| | 21,800 | | | Sherwin-Williams Co. | | | 3,849,880 | | | |
| | 12,600 | | | Valspar Corp. | | | 814,842 | | | |
| | | | | | | | 4,687,080 | | | |
| Coffee – 0.3% | | | | | | |
| | 10,600 | | | Green Mountain Coffee Roasters, Inc.* | | | 795,636 | | | |
| Commercial Banks – 0% | | | | | | |
| | 600 | | | Signature Bank* | | | 49,812 | | | |
| Commercial Services – 0.1% | | | | | | |
| | 6,457 | | | Iron Mountain, Inc. | | | 171,821 | | | |
| Commercial Services – Finance – 4.9% | | | | | | |
| | 11,700 | | | Alliance Data Systems Corp.* | | | 2,118,051 | | | |
| | 27,900 | | | Automatic Data Processing, Inc. | | | 1,921,194 | | | |
| | 7,500 | | | Equifax, Inc. | | | 441,975 | | | |
| | 14,600 | | | FleetCor Technologies, Inc.* | | | 1,186,980 | | | |
| | 6,700 | | | Global Payments, Inc. | | | 310,344 | | | |
| | 61,100 | | | H&R Block, Inc. | | | 1,695,525 | | | |
| | 1,300 | | | MasterCard, Inc. – Class A | | | 746,850 | | | |
| | 27,900 | | | McGraw-Hill Cos., Inc. | | | 1,484,001 | | | |
| | 14,900 | | | Moody’s Corp. | | | 907,857 | | | |
| | 3,200 | | | Morningstar, Inc. | | | 248,256 | | | |
| | 25,900 | | | Paychex, Inc. | | | 945,868 | | | |
| | 26,300 | | | SEI Investments Co. | | | 747,709 | | | |
| | 6,600 | | | Western Union Co. | | | 112,926 | | | |
| | | | | | | | 12,867,536 | | | |
| Computer Aided Design – 0.2% | | | | | | |
| | 3,700 | | | ANSYS, Inc.* | | | 270,470 | | | |
| | 10,500 | | | Autodesk, Inc.* | | | 356,370 | | | |
| | | | | | | | 626,840 | | | |
| Computer Data Security – 0.1% | | | | | | |
| | 8,600 | | | Fortinet, Inc.* | | | 150,500 | | | |
| Computer Services – 3.2% | | | | | | |
| | 29,100 | | | Accenture PLC – Class A (U.S. Shares) | | | 2,094,036 | | | |
| | 5,600 | | | Cognizant Technology Solutions Corp. – Class A* | | | 350,616 | | | |
| | 3,200 | | | DST Systems, Inc. | | | 209,056 | | | |
| | 2,100 | | | IHS, Inc. – Class A* | | | 219,198 | | | |
| | 28,800 | | | International Business Machines Corp. | | | 5,503,968 | | | |
| | | | | | | | 8,376,874 | | | |
| Computers – 2.2% | | | | | | |
| | 14,500 | | | Apple, Inc. | | | 5,743,160 | | | |
| Computers – Integrated Systems – 0.3% | | | | | | |
| | 13,600 | | | Jack Henry & Associates, Inc. | | | 640,968 | | | |
| | 7,100 | | | NCR Corp.* | | | 234,229 | | | |
| | | | | | | | 875,197 | | | |
| Consulting Services – 0.3% | | | | | | |
| | 3,600 | | | Gartner, Inc.* | | | 205,164 | | | |
| | 6,100 | | | Genpact, Ltd. | | | 117,364 | | | |
| | 11,700 | | | SAIC, Inc. | | | 162,981 | | | |
| | 5,200 | | | Verisk Analytics, Inc. – Class A* | | | 310,440 | | | |
| | | | | | | | 795,949 | | | |
| Consumer Products – Miscellaneous – 1.6% | | | | | | |
| | 4,900 | | | Clorox Co. | | | 407,386 | | | |
| | 9,200 | | | Jarden Corp.* | | | 402,500 | | | |
| | 21,500 | | | Kimberly-Clark Corp. | | | 2,088,510 | | | |
| | 15,500 | | | Tupperware Brands Corp. | | | 1,204,195 | | | |
| | | | | | | | 4,102,591 | | | |
| Containers – Metal and Glass – 0.4% | | | | | | |
| | 9,900 | | | Ball Corp. | | | 411,246 | | | |
| | 3,700 | | | Crown Holdings, Inc.* | | | 152,181 | | | |
| | 14,700 | | | Owens-Illinois, Inc.* | | | 408,513 | | | |
| | 2,600 | | | Silgan Holdings, Inc. | | | 122,096 | | | |
| | | | | | | | 1,094,036 | | | |
| Containers – Paper and Plastic – 0.7% | | | | | | |
| | 34,200 | | | Packaging Corp. of America | | | 1,674,432 | | | |
| | 2,900 | | | Rock-Tenn Co. – Class A | | | 289,652 | | | |
| | | | | | | | 1,964,084 | | | |
| Cosmetics and Toiletries – 0.9% | | | | | | |
| | 30,400 | | | Colgate-Palmolive Co. | | | 1,741,616 | | | |
| | 9,034 | | | Procter & Gamble Co. | | | 695,528 | | | |
| | | | | | | | 2,437,144 | | | |
| Data Processing and Management – 0.4% | | | | | | |
| | 4,800 | | | Dun & Bradstreet Corp. | | | 467,760 | | | |
| | 5,900 | | | Fiserv, Inc.* | | | 515,719 | | | |
| | | | | | | | 983,479 | | | |
| Decision Support Software – 0.2% | | | | | | |
| | 14,100 | | | MSCI, Inc.* | | | 469,107 | | | |
| Dental Supplies and Equipment – 0.1% | | | | | | |
| | 2,300 | | | DENTSPLY International, Inc. | | | 94,208 | | | |
| | 5,500 | | | Patterson Cos., Inc. | | | 206,800 | | | |
| | | | | | | | 301,008 | | | |
| Diagnostic Kits – 0.1% | | | | | | |
| | 1,800 | | | IDEXX Laboratories, Inc.* | | | 161,604 | | | |
| Dialysis Centers – 0.4% | | | | | | |
| | 8,800 | | | DaVita HealthCare Partners, Inc.* | | | 1,063,040 | | | |
| Distribution/Wholesale – 0.8% | | | | | | |
| | 8,900 | | | Fastenal Co. | | | 408,065 | | | |
| | 900 | | | Fossil Group, Inc.* | | | 92,979 | | | |
| | 2,600 | | | Genuine Parts Co. | | | 202,982 | | | |
| | 53,700 | | | LKQ Corp.* | | | 1,382,775 | | | |
| | 400 | | | W.W. Grainger, Inc. | | | 100,872 | | | |
| | | | | | | | 2,187,673 | | | |
| Diversified Operations – 2.4% | | | | | | |
| | 14,700 | | | 3M Co. | | | 1,607,445 | | | |
| | 4,400 | | | Carlisle Cos., Inc. | | | 274,164 | | | |
| | 5,400 | | | Colfax Corp.* | | | 281,394 | | | |
| | 3,800 | | | Danaher Corp. | | | 240,540 | | | |
| | 10,300 | | | Eaton Corp. PLC | | | 677,843 | | | |
| | 5,400 | | | Illinois Tool Works, Inc. | | | 373,518 | | | |
| | 22,300 | | | Ingersoll-Rand PLC | | | 1,238,096 | | | |
| | 6,800 | | | ITT Corp. | | | 199,988 | | | |
| | 22,800 | | | Leucadia National Corp. | | | 597,816 | | | |
| | 2,300 | | | Parker Hannifin Corp. | | | 219,420 | | | |
| | 6,100 | | | SPX Corp. | | | 439,078 | | | |
| | 7,900 | | | Textron, Inc. | | | 205,795 | | | |
| | | | | | | | 6,355,097 | | | |
See Notes to Schedules of Investments and Other Information and Notes to Financial Statements.
Janus Mathematical Funds | 39
INTECH U.S. Growth Fund
Schedule of Investments
As of June 30, 2013
| | | | | | | | | | | |
| Shares | | Value | | | |
| |
| E-Commerce/Products – 1.0% | | | | | | |
| | 2,500 | | | Amazon.com, Inc.* | | $ | 694,225 | | | |
| | 35,100 | | | eBay, Inc.* | | | 1,815,372 | | | |
| | | | | | | | 2,509,597 | | | |
| E-Commerce/Services – 1.0% | | | | | | |
| | 6,950 | | | Expedia, Inc. | | | 418,042 | | | |
| | 37,500 | | | Liberty Interactive Corp. – Class A* | | | 862,875 | | | |
| | 3,200 | | | Liberty Ventures | | | 272,032 | | | |
| | 3,400 | | | Netflix, Inc.* | | | 717,706 | | | |
| | 200 | | | priceline.com, Inc.* | | | 165,426 | | | |
| | 3,300 | | | TripAdvisor, Inc. | | | 200,871 | | | |
| | | | | | | | 2,636,952 | | | |
| Electric Products – Miscellaneous – 0.6% | | | | | | |
| | 17,650 | | | AMETEK, Inc. | | | 746,595 | | | |
| | 15,400 | | | Emerson Electric Co. | | | 839,916 | | | |
| | | | | | | | 1,586,511 | | | |
| Electric – Transmission – 0.2% | | | | | | |
| | 5,100 | | | ITC Holdings Corp. | | | 465,630 | | | |
| Electronic Components – Miscellaneous – 0.1% | | | | | | |
| | 11,900 | | | Gentex Corp. | | | 274,295 | | | |
| Electronic Components – Semiconductors – 0.6% | | | | | | |
| | 5,700 | | | Altera Corp. | | | 188,043 | | | |
| | 1,600 | | | Broadcom Corp. – Class A | | | 54,016 | | | |
| | 10,700 | | | Intel Corp. | | | 259,154 | | | |
| | 6,300 | | | Microchip Technology, Inc. | | | 234,675 | | | |
| | 3,300 | | | Rovi Corp.* | | | 75,372 | | | |
| | 7,200 | | | Texas Instruments, Inc. | | | 251,064 | | | |
| | 12,800 | | | Xilinx, Inc. | | | 507,008 | | | |
| | | | | | | | 1,569,332 | | | |
| Electronic Connectors – 0.1% | | | | | | |
| | 2,900 | | | Amphenol Corp. – Class A | | | 226,026 | | | |
| Electronic Design Automation – 0.7% | | | | | | |
| | 107,100 | | | Cadence Design Systems, Inc.* | | | 1,550,808 | | | |
| | 6,000 | | | Synopsys, Inc.* | | | 214,500 | | | |
| | | | | | | | 1,765,308 | | | |
| Electronic Forms – 0.2% | | | | | | |
| | 11,900 | | | Adobe Systems, Inc.* | | | 542,164 | | | |
| Electronic Measuring Instruments – 0.6% | | | | | | |
| | 8,100 | | | Agilent Technologies, Inc. | | | 346,356 | | | |
| | 18,600 | | | FLIR Systems, Inc. | | | 501,642 | | | |
| | 9,800 | | | National Instruments Corp. | | | 273,812 | | | |
| | 17,600 | | | Trimble Navigation, Ltd.* | | | 457,776 | | | |
| | | | | | | | 1,579,586 | | | |
| Engineering – Research and Development Services – 0.1% | | | | | | |
| | 3,700 | | | Fluor Corp. | | | 219,447 | | | |
| Engines – Internal Combustion – 0.1% | | | | | | |
| | 1,900 | | | Cummins, Inc. | | | 206,074 | | | |
| Enterprise Software/Services – 0.9% | | | | | | |
| | 3,900 | | | CA, Inc. | | | 111,657 | | | |
| | 5,200 | | | Concur Technologies, Inc.* | | | 423,176 | | | |
| | 13,100 | | | Informatica Corp.* | | | 458,238 | | | |
| | 43,000 | | | Oracle Corp. | | | 1,320,960 | | | |
| | | | | | | | 2,314,031 | | | |
| Filtration and Separations Products – 0.2% | | | | | | |
| | 6,500 | | | Pall Corp. | | | 431,795 | | | |
| Finance – Credit Card – 1.4% | | | | | | |
| | 2,600 | | | American Express Co. | | | 194,376 | | | |
| | 19,600 | | | Visa, Inc. – Class A | | | 3,581,900 | | | |
| | | | | | | | 3,776,276 | | | |
| Finance – Investment Bankers/Brokers – 0.2% | | | | | | |
| | 14,900 | | | Lazard, Ltd. – Class A | | | 479,035 | | | |
| Finance – Other Services – 0.8% | | | | | | |
| | 37,700 | | | CBOE Holdings, Inc. | | | 1,758,328 | | | |
| | 1,900 | | | IntercontinentalExchange, Inc.* | | | 337,744 | | | |
| | | | | | | | 2,096,072 | | | |
| Food – Baking – 0.2% | | | | | | |
| | 25,350 | | | Flowers Foods, Inc. | | | 558,968 | | | |
| Food – Confectionary – 0.4% | | | | | | |
| | 13,200 | | | Hershey Co. | | | 1,178,496 | | | |
| Food – Meat Products – 0.5% | | | | | | |
| | 21,700 | | | Hillshire Brands Co. | | | 717,836 | | | |
| | 16,800 | | | Hormel Foods Corp. | | | 648,144 | | | |
| | | | | | | | 1,365,980 | | | |
| Food – Miscellaneous/Diversified – 2.1% | | | | | | |
| | 19,800 | | | Campbell Soup Co. | | | 886,842 | | | |
| | 9,100 | | | General Mills, Inc. | | | 441,623 | | | |
| | 7,100 | | | Ingredion, Inc. | | | 465,902 | | | |
| | 17,200 | | | Kellogg Co. | | | 1,104,756 | | | |
| | 5,300 | | | Kraft Foods Group, Inc. | | | 296,111 | | | |
| | 31,000 | | | McCormick & Co., Inc. | | | 2,181,160 | | | |
| | 6,300 | | | Mondelez International, Inc. – Class A | | | 179,739 | | | |
| | | | | | | | 5,556,133 | | | |
| Food – Retail – 0.3% | | | | | | |
| | 13,400 | | | Kroger Co. | | | 462,836 | | | |
| | 9,200 | | | Safeway, Inc. | | | 217,672 | | | |
| | | | | | | | 680,508 | | | |
| Food – Wholesale/Distribution – 0.3% | | | | | | |
| | 19,600 | | | Sysco Corp. | | | 669,536 | | | |
| Footwear and Related Apparel – 0.1% | | | | | | |
| | 6,100 | | | Deckers Outdoor Corp.* | | | 308,111 | | | |
| Garden Products – 0% | | | | | | |
| | 1,400 | | | Toro Co. | | | 63,574 | | | |
| Gas – Transportation – 0.2% | | | | | | |
| | 19,500 | | | Questar Corp. | | | 465,075 | | | |
| Gold Mining – 0% | | | | | | |
| | 1,100 | | | Royal Gold, Inc. | | | 46,288 | | | |
| Hazardous Waste Disposal – 0.1% | | | | | | |
| | 1,200 | | | Stericycle, Inc.* | | | 132,516 | | | |
| Home Furnishings – 0.1% | | | | | | |
| | 6,400 | | | Tempur Sealy International, Inc.* | | | 280,960 | | | |
| Hotels and Motels – 0.1% | | | | | | |
| | 5,600 | | | Marriott International, Inc. – Class A | | | 226,072 | | | |
| | 2,100 | | | Wyndham Worldwide Corp. | | | 120,183 | | | |
| | | | | | | | 346,255 | | | |
| Human Resources – 0.2% | | | | | | |
| | 12,400 | | | Robert Half International, Inc. | | | 412,052 | | | |
| Industrial Automation and Robotics – 0.3% | | | | | | |
| | 10,600 | | | Rockwell Automation, Inc. | | | 881,284 | | | |
See Notes to Schedules of Investments and Other Information and Notes to Financial Statements.
40 | JUNE 30, 2013
Schedule of Investments
As of June 30, 2013
| | | | | | | | | | | |
| Shares | | Value | | | |
| |
| Industrial Gases – 0.2% | | | | | | |
| | 2,000 | | | Airgas, Inc. | | $ | 190,920 | | | |
| | 2,000 | | | Praxair, Inc. | | | 230,320 | | | |
| | | | | | | | 421,240 | | | |
| Instruments – Controls – 0.5% | | | | | | |
| | 3,800 | | | Honeywell International, Inc. | | | 301,492 | | | |
| | 4,500 | | | Mettler-Toledo International, Inc.* | | | 905,400 | | | |
| | | | | | | | 1,206,892 | | | |
| Instruments – Scientific – 0.1% | | | | | | |
| | 3,200 | | | Waters Corp.* | | | 320,160 | | | |
| Insurance Brokers – 0.6% | | | | | | |
| | 7,600 | | | Aon PLC | | | 489,060 | | | |
| | 3,200 | | | Arthur J. Gallagher & Co. | | | 139,808 | | | |
| | 2,600 | | | Brown & Brown, Inc. | | | 83,824 | | | |
| | 3,200 | | | Erie Indemnity Co. – Class A | | | 255,008 | | | |
| | 18,200 | | | Marsh & McLennan Cos., Inc. | | | 726,544 | | | |
| | | | | | | | 1,694,244 | | | |
| Internet Content – Entertainment – 0.2% | | | | | | |
| | 18,100 | | | Facebook, Inc. – Class A* | | | 449,966 | | | |
| Internet Content – Information/News – 0.3% | | | | | | |
| | 4,200 | | | LinkedIn Corp. – Class A* | | | 748,860 | | | |
| Internet Security – 0.3% | | | | | | |
| | 19,500 | | | Symantec Corp. | | | 438,165 | | | |
| | 6,600 | | | VeriSign, Inc. | | | 294,756 | | | |
| | | | | | | | 732,921 | | | |
| Investment Management and Advisory Services – 1.4% | | | | | | |
| | 6,700 | | | Affiliated Managers Group, Inc.* | | | 1,098,398 | | | |
| | 2,700 | | | BlackRock, Inc. | | | 693,495 | | | |
| | 15,800 | | | Eaton Vance Corp. | | | 593,922 | | | |
| | 2,100 | | | Federated Investors, Inc. – Class B | | | 57,561 | | | |
| | 3,900 | | | Franklin Resources, Inc. | | | 530,478 | | | |
| | 16,300 | | | Waddell & Reed Financial, Inc. – Class A | | | 709,050 | | | |
| | | | | | | | 3,682,904 | | | |
| Linen Supply & Related Items – 0.1% | | | | | | |
| | 7,600 | | | Cintas Corp. | | | 346,104 | | | |
| Machine Tools and Related Products – 0.2% | | | | | | |
| | 11,100 | | | Lincoln Electric Holdings, Inc. | | | 635,697 | | | |
| Machinery – Construction and Mining – 0% | | | | | | |
| | 1,900 | | | Joy Global, Inc. | | | 92,207 | | | |
| Machinery – Farm – 0.2% | | | | | | |
| | 6,400 | | | Deere & Co. | | | 520,000 | | | |
| Machinery – General Industrial – 0.9% | | | | | | |
| | 5,000 | | | Babcock & Wilcox Co. | | | 150,150 | | | |
| | 6,600 | | | IDEX Corp. | | | 355,146 | | | |
| | 18,700 | | | Manitowoc Co., Inc. | | | 334,917 | | | |
| | 8,200 | | | Roper Industries, Inc. | | | 1,018,604 | | | |
| | 4,600 | | | Wabtec Corp. | | | 245,778 | | | |
| | 5,600 | | | Zebra Technologies Corp. – Class A* | | | 243,264 | | | |
| | | | | | | | 2,347,859 | | | |
| Machinery – Pumps – 0.7% | | | | | | |
| | 30,300 | | | Flowserve Corp. | | | 1,636,503 | | | |
| | 2,800 | | | Graco, Inc. | | | 176,988 | | | |
| | 5,600 | | | Xylem, Inc. | | | 150,864 | | | |
| | | | | | | | 1,964,355 | | | |
| Medical – Biomedical and Genetic – 5.1% | | | | | | |
| | 8,500 | | | Alexion Pharmaceuticals, Inc.* | | | 784,040 | | | |
| | 34,700 | | | Amgen, Inc. | | | 3,423,502 | | | |
| | 120,300 | | | Ariad Pharmaceuticals, Inc.* | | | 2,104,047 | | | |
| | 8,400 | | | Biogen Idec, Inc.* | | | 1,807,680 | | | |
| | 7,100 | | | Celgene Corp.* | | | 830,061 | | | |
| | 4,200 | | | Charles River Laboratories International, Inc.* | | | 172,326 | | | |
| | 29,600 | | | Gilead Sciences, Inc.* | | | 1,515,816 | | | |
| | 7,500 | | | Illumina, Inc.* | | | 561,300 | | | |
| | 2,700 | | | Incyte Corp., Ltd.* | | | 59,400 | | | |
| | 3,200 | | | Life Technologies Corp.* | | | 236,832 | | | |
| | 1,400 | | | Regeneron Pharmaceuticals, Inc.* | | | 314,832 | | | |
| | 19,900 | | | United Therapeutics Corp.* | | | 1,309,818 | | | |
| | 1,500 | | | Vertex Pharmaceuticals, Inc.* | | | 119,805 | | | |
| | | | | | | | 13,239,459 | | | |
| Medical – Drugs – 2.4% | | | | | | |
| | 38,200 | | | Abbott Laboratories | | | 1,332,416 | | | |
| | 30,600 | | | AbbVie, Inc. | | | 1,265,004 | | | |
| | 4,200 | | | Allergan, Inc. | | | 353,808 | | | |
| | 24,600 | | | Bristol-Myers Squibb Co. | | | 1,099,374 | | | |
| | 22,600 | | | Eli Lilly & Co. | | | 1,110,112 | | | |
| | 7,500 | | | Endo Health Solutions, Inc.* | | | 275,925 | | | |
| | 8,700 | | | Johnson & Johnson | | | 746,982 | | | |
| | 1,700 | | | Salix Pharmaceuticals, Ltd.* | | | 112,455 | | | |
| | 2,500 | | | Zoetis, Inc. | | | 77,225 | | | |
| | | | | | | | 6,373,301 | | | |
| Medical – Generic Drugs – 1.1% | | | | | | |
| | 5,100 | | | Actavis, Inc.* | | | 643,722 | | | |
| | 55,100 | | | Mylan, Inc.* | | | 1,709,753 | | | |
| | 3,300 | | | Perrigo Co. | | | 399,300 | | | |
| | | | | | | | 2,752,775 | | | |
| Medical – HMO – 0.1% | | | | | | |
| | 1,800 | | | WellPoint, Inc. | | | 147,312 | | | |
| Medical – Hospitals – 0.4% | | | | | | |
| | 20,200 | | | HCA Holdings, Inc. | | | 728,412 | | | |
| | 3,400 | | | Tenet Healthcare Corp.* | | | 156,740 | | | |
| | 1,400 | | | Universal Health Services, Inc. – Class B | | | 93,744 | | | |
| | | | | | | | 978,896 | | | |
| Medical – Wholesale Drug Distributors – 0.4% | | | | | | |
| | 10,300 | | | AmerisourceBergen Corp. | | | 575,049 | | | |
| | 5,900 | | | Cardinal Health, Inc. | | | 278,480 | | | |
| | 2,100 | | | McKesson Corp. | | | 240,450 | | | |
| | | | | | | | 1,093,979 | | | |
| Medical Information Systems – 0% | | | | | | |
| | 800 | | | Cerner Corp.* | | | 76,872 | | | |
| Medical Instruments – 0.5% | | | | | | |
| | 1,900 | | | Edwards Lifesciences Corp.* | | | 127,680 | | | |
| | 400 | | | Intuitive Surgical, Inc.* | | | 202,632 | | | |
| | 9,200 | | | Medtronic, Inc. | | | 473,524 | | | |
| | 10,800 | | | St. Jude Medical, Inc. | | | 492,804 | | | |
| | 3,500 | | | Thoratec Corp.* | | | 109,585 | | | |
| | | | | | | | 1,406,225 | | | |
| Medical Labs and Testing Services – 0.1% | | | | | | |
| | 1,800 | | | Covance, Inc.* | | | 137,052 | | | |
| | 900 | | | Laboratory Corp. of America Holdings* | | | 90,090 | | | |
| | | | | | | | 227,142 | | | |
See Notes to Schedules of Investments and Other Information and Notes to Financial Statements.
Janus Mathematical Funds | 41
INTECH U.S. Growth Fund
Schedule of Investments
As of June 30, 2013
| | | | | | | | | | | |
| Shares | | Value | | | |
| |
| Medical Products – 1.5% | | | | | | |
| | 10,700 | | | Baxter International, Inc. | | $ | 741,189 | | | |
| | 4,400 | | | Becton, Dickinson and Co. | | | 434,852 | | | |
| | 6,100 | | | Cooper Cos., Inc. | | | 726,205 | | | |
| | 6,700 | | | Covidien PLC (U.S. Shares) | | | 421,028 | | | |
| | 2,400 | | | Henry Schein, Inc.* | | | 229,800 | | | |
| | 8,100 | | | Sirona Dental Systems, Inc.* | | | 533,628 | | | |
| | 5,100 | | | Stryker Corp. | | | 329,868 | | | |
| | 5,200 | | | Zimmer Holdings, Inc. | | | 389,688 | | | |
| | | | | | | | 3,806,258 | | | |
| Metal – Copper – 0.1% | | | | | | |
| | 11,700 | | | Southern Copper Corp. | | | 323,154 | | | |
| Metal Processors and Fabricators – 0.1% | | | | | | |
| | 800 | | | Precision Castparts Corp. | | | 180,808 | | | |
| | 2,100 | | | Timken Co. | | | 118,188 | | | |
| | | | | | | | 298,996 | | | |
| Multimedia – 1.9% | | | | | | |
| | 1,600 | | | FactSet Research Systems, Inc. | | | 163,104 | | | |
| | 30,400 | | | News Corp. – Class A | | | 991,040 | | | |
| | 19,700 | | | Viacom, Inc. – Class B | | | 1,340,585 | | | |
| | 37,500 | | | Walt Disney Co. | | | 2,368,125 | | | |
| | | | | | | | 4,862,854 | | | |
| Non-Hazardous Waste Disposal – 0% | | | | | | |
| | 4,200 | | | Covanta Holding Corp. | | | 84,084 | | | |
| Office Automation and Equipment – 0.1% | | | | | | |
| | 17,300 | | | Pitney Bowes, Inc. | | | 253,964 | | | |
| Oil – Field Services – 1.0% | | | | | | |
| | 600 | | | CARBO Ceramics, Inc. | | | 40,458 | | | |
| | 20,400 | | | Halliburton Co. | | | 851,088 | | | |
| | 9,000 | | | Oceaneering International, Inc. | | | 649,800 | | | |
| | 14,000 | | | Schlumberger, Ltd. (U.S. Shares) | | | 1,003,240 | | | |
| | | | | | | | 2,544,586 | | | |
| Oil and Gas Drilling – 0.2% | | | | | | |
| | 700 | | | Atwood Oceanics, Inc.* | | | 36,435 | | | |
| | 7,900 | | | Helmerich & Payne, Inc. | | | 493,355 | | | |
| | | | | | | | 529,790 | | | |
| Oil Companies – Exploration and Production – 1.1% | | | | | | |
| | 12,600 | | | Cabot Oil & Gas Corp. | | | 894,852 | | | |
| | 300 | | | Concho Resources, Inc.* | | | 25,116 | | | |
| | 1,100 | | | Continental Resources, Inc.* | | | 94,666 | | | |
| | 900 | | | EOG Resources, Inc. | | | 118,512 | | | |
| | 10,400 | | | Noble Energy, Inc. | | | 624,416 | | | |
| | 6,300 | | | Pioneer Natural Resources Co. | | | 911,925 | | | |
| | 1,800 | | | Range Resources Corp. | | | 139,176 | | | |
| | 1,600 | | | SM Energy Co. | | | 95,968 | | | |
| | | | | | | | 2,904,631 | | | |
| Oil Field Machinery and Equipment – 0.4% | | | | | | |
| | 3,800 | | | Cameron International Corp.* | | | 232,408 | | | |
| | 9,100 | | | Dresser-Rand Group, Inc.* | | | 545,818 | | | |
| | 3,600 | | | FMC Technologies, Inc.* | | | 200,448 | | | |
| | | | | | | | 978,674 | | | |
| Oil Refining and Marketing – 0.3% | | | | | | |
| | 25,100 | | | Cheniere Energy, Inc.* | | | 696,776 | | | |
| Other Specialty Retail – Discretionary – 0.1% | | | | | | |
| | 8,300 | | | GNC Holdings, Inc. – Class A | | | 366,943 | | | |
| Pharmacy Services – 0.1% | | | | | | |
| | 3,700 | | | Catamaran Corp. (U.S. Shares)* | | | 180,264 | | | |
| | 1,935 | | | Express Scripts Holding Co.* | | | 119,370 | | | |
| | | | | | | | 299,634 | | | |
| Pipelines – 0.8% | | | | | | |
| | 27,347 | | | Kinder Morgan, Inc. | | | 1,043,288 | | | |
| | 4,000 | | | ONEOK, Inc. | | | 165,240 | | | |
| | 24,500 | | | Williams Cos., Inc. | | | 795,515 | | | |
| | | | | | | | 2,004,043 | | | |
| Power Converters and Power Supply Equipment – 0.1% | | | | | | |
| | 2,700 | | | Hubbell, Inc. – Class B | | | 267,300 | | | |
| Professional Sports – 0.1% | | | | | | |
| | 2,600 | | | Madison Square Garden Co. – Class A* | | | 154,050 | | | |
| Property and Casualty Insurance – 0.6% | | | | | | |
| | 5,700 | | | Arch Capital Group, Ltd.* | | | 293,037 | | | |
| | 5,900 | | | Hanover Insurance Group, Inc. | | | 288,687 | | | |
| | 11,400 | | | Travelers Cos., Inc. | | | 911,088 | | | |
| | | | | | | | 1,492,812 | | | |
| Publishing – Periodicals – 0.1% | | | | | | |
| | 8,800 | | | Nielsen Holdings N.V. | | | 295,592 | | | |
| Quarrying – 0% | | | | | | |
| | 1,000 | | | Compass Minerals International, Inc. | | | 84,530 | | | |
| Racetracks – 0% | | | | | | |
| | 1,000 | | | Penn National Gaming, Inc.* | | | 52,860 | | | |
| Real Estate Management/Services – 0.2% | | | | | | |
| | 20,900 | | | CBRE Group, Inc. – Class A* | | | 488,224 | | | |
| Reinsurance – 0.4% | | | | | | |
| | 7,000 | | | Allied World Assurance Co. Holdings A.G. | | | 640,570 | | | |
| | 1,700 | | | Endurance Specialty Holdings, Ltd. | | | 87,465 | | | |
| | 11,700 | | | Validus Holdings, Ltd. | | | 422,604 | | | |
| | | | | | | | 1,150,639 | | | |
| REIT – Apartments – 0.9% | | | | | | |
| | 5,000 | | | American Campus Communities, Inc. | | | 203,300 | | | |
| | 20,500 | | | Apartment Investment & Management Co. – Class A | | | 615,820 | | | |
| | 6,400 | | | BRE Properties, Inc. | | | 320,128 | | | |
| | 2,800 | | | Camden Property Trust | | | 193,592 | | | |
| | 1,100 | | | Equity Residential | | | 63,866 | | | |
| | 1,100 | | | Essex Property Trust, Inc. | | | 174,812 | | | |
| | 4,900 | | | Home Properties, Inc. | | | 320,313 | | | |
| | 7,400 | | | Mid-America Apartment Communities, Inc. | | | 501,498 | | | |
| | | | | | | | 2,393,329 | | | |
| REIT – Diversified – 1.8% | | | | | | |
| | 1,700 | | | American Tower Corp. | | | 124,389 | | | |
| | 900 | | | Digital Realty Trust, Inc. | | | 54,900 | | | |
| | 26,000 | | | Plum Creek Timber Co., Inc. | | | 1,213,420 | | | |
| | 27,350 | | | Rayonier, Inc. | | | 1,514,916 | | | |
| | 63,300 | | | Weyerhaeuser Co. | | | 1,803,417 | | | |
| | | | | | | | 4,711,042 | | | |
| REIT – Health Care – 0.1% | | | | | | |
| | 5,700 | | | HCP, Inc. | | | 259,008 | | | |
| REIT – Multi-Housing – 0.1% | | | | | | |
| | 4,600 | | | Equity Lifestyle Properties, Inc. | | | 361,514 | | | |
See Notes to Schedules of Investments and Other Information and Notes to Financial Statements.
42 | JUNE 30, 2013
Schedule of Investments
As of June 30, 2013
| | | | | | | | | | | |
| Shares | | Value | | | |
| |
| REIT – Office Property – 0.1% | | | | | | |
| | 500 | | | Boston Properties, Inc. | | $ | 52,735 | | | |
| | 2,300 | | | Kilroy Realty Corp. | | | 121,923 | | | |
| | | | | | | | 174,658 | | | |
| REIT – Regional Malls – 0.5% | | | | | | |
| | 6,400 | | | Simon Property Group, Inc. | | | 1,010,688 | | | |
| | 9,400 | | | Tanger Factory Outlet Centers | | | 314,524 | | | |
| | | | | | | | 1,325,212 | | | |
| REIT – Shopping Centers – 0.2% | | | | | | |
| | 3,000 | | | Federal Realty Investment Trust | | | 311,040 | | | |
| | 4,000 | | | Regency Centers Corp. | | | 203,240 | | | |
| | | | | | | | 514,280 | | | |
| REIT – Storage – 0.8% | | | | | | |
| | 36,300 | | | Extra Space Storage, Inc. | | | 1,522,059 | | | |
| | 3,000 | | | Public Storage | | | 459,990 | | | |
| | | | | | | | 1,982,049 | | | |
| Rental Auto/Equipment – 0.1% | | | | | | |
| | 11,500 | | | Hertz Global Holdings, Inc.* | | | 285,200 | | | |
| | 2,000 | | | United Rentals, Inc.* | | | 99,820 | | | |
| | | | | | | | 385,020 | | | |
| Respiratory Products – 0.5% | | | | | | |
| | 30,200 | | | ResMed, Inc. | | | 1,362,926 | | | |
| Retail – Apparel and Shoe – 1.0% | | | | | | |
| | 3,000 | | | DSW, Inc. – Class A | | | 220,410 | | | |
| | 19,100 | | | Gap, Inc. | | | 797,043 | | | |
| | 1,700 | | | Limited Brands, Inc. | | | 83,725 | | | |
| | 14,200 | | | Ross Stores, Inc. | | | 920,302 | | | |
| | 15,900 | | | Urban Outfitters, Inc.* | | | 639,498 | | | |
| | | | | | | | 2,660,978 | | | |
| Retail – Auto Parts – 0.3% | | | | | | |
| | 1,500 | | | Advance Auto Parts, Inc. | | | 121,755 | | | |
| | 600 | | | AutoZone, Inc.* | | | 254,214 | | | |
| | 4,400 | | | O’Reilly Automotive, Inc.* | | | 495,528 | | | |
| | | | | | | | 871,497 | | | |
| Retail – Automobile – 0.3% | | | | | | |
| | 3,500 | | | CarMax, Inc.* | | | 161,560 | | | |
| | 16,700 | | | Copart, Inc.* | | | 514,360 | | | |
| | | | | | | | 675,920 | | | |
| Retail – Bedding – 0.1% | | | | | | |
| | 1,900 | | | Bed Bath & Beyond, Inc.* | | | 134,710 | | | |
| Retail – Building Products – 1.5% | | | | | | |
| | 36,400 | | | Home Depot, Inc. | | | 2,819,908 | | | |
| | 25,700 | | | Lowe’s Cos., Inc. | | | 1,051,130 | | | |
| | | | | | | | 3,871,038 | | | |
| Retail – Catalog Shopping – 0.1% | | | | | | |
| | 2,800 | | | MSC Industrial Direct Co., Inc. – Class A | | | 216,888 | | | |
| Retail – Discount – 1.1% | | | | | | |
| | 4,800 | | | Big Lots, Inc.* | | | 151,344 | | | |
| | 10,200 | | | Costco Wholesale Corp. | | | 1,127,814 | | | |
| | 1,700 | | | Dollar General Corp.* | | | 85,731 | | | |
| | 11,100 | | | Target Corp. | | | 764,346 | | | |
| | 10,500 | | | Wal-Mart Stores, Inc. | | | 782,145 | | | |
| | | | | | | | 2,911,380 | | | |
| Retail – Drug Store – 0.1% | | | | | | |
| | 5,100 | | | CVS Caremark Corp. | | | 291,618 | | | |
| Retail – Jewelry – 0% | | | | | | |
| | 1,500 | | | Tiffany & Co. | | | 109,260 | | | |
| Retail – Mail Order – 0.1% | | | | | | |
| | 4,700 | | | Williams-Sonoma, Inc. | | | 262,683 | | | |
| Retail – Major Department Stores – 0.7% | | | | | | |
| | 35,300 | | | TJX Cos., Inc. | | | 1,767,118 | | | |
| Retail – Miscellaneous/Diversified – 0.2% | | | | | | |
| | 12,900 | | | Sally Beauty Holdings, Inc.* | | | 401,190 | | | |
| Retail – Petroleum Products – 0% | | | | | | |
| | 1,400 | | | World Fuel Services Corp. | | | 55,972 | | | |
| Retail – Regional Department Stores – 0% | | | | | | |
| | 1,600 | | | Macy’s, Inc. | | | 76,800 | | | |
| Retail – Restaurants – 0.8% | | | | | | |
| | 3,000 | | | Brinker International, Inc. | | | 118,290 | | | |
| | 700 | | | Chipotle Mexican Grill, Inc.* | | | 255,045 | | | |
| | 2,200 | | | Darden Restaurants, Inc. | | | 111,056 | | | |
| | 14,800 | | | Dunkin’ Brands Group, Inc. | | | 633,736 | | | |
| | 7,700 | | | McDonald’s Corp. | | | 762,300 | | | |
| | 2,800 | | | Yum! Brands, Inc. | | | 194,152 | | | |
| | | | | | | | 2,074,579 | | | |
| Rubber – Tires – 0.2% | | | | | | |
| | 27,500 | | | Goodyear Tire & Rubber Co.* | | | 420,475 | | | |
| Savings/Loan/Thrifts – 0.1% | | | | | | |
| | 13,200 | | | People’s United Financial, Inc. | | | 196,680 | | | |
| Semiconductor Components/Integrated Circuits – 0.9% | | | | | | |
| | 9,100 | | | Analog Devices, Inc. | | | 410,046 | | | |
| | 22,200 | | | Atmel Corp.* | | | 163,170 | | | |
| | 9,900 | | | Linear Technology Corp. | | | 364,716 | | | |
| | 7,000 | | | Maxim Integrated Products, Inc. | | | 194,460 | | | |
| | 21,700 | | | QUALCOMM, Inc. | | | 1,325,436 | | | |
| | | | | | | | 2,457,828 | | | |
| Semiconductor Equipment – 0% | | | | | | |
| | 1,500 | | | Lam Research Corp.* | | | 66,510 | | | |
| Soap and Cleaning Preparations – 0.4% | | | | | | |
| | 15,800 | | | Church & Dwight Co., Inc. | | | 975,018 | | | |
| Steel – Producers – 0% | | | | | | |
| | 1,300 | | | Steel Dynamics, Inc. | | | 19,383 | | | |
| Steel Pipe and Tube – 0.5% | | | | | | |
| | 10,000 | | | Valmont Industries, Inc. | | | 1,430,900 | | | |
| Telecommunication Equipment – 0.3% | | | | | | |
| | 16,500 | | | Harris Corp. | | | 812,625 | | | |
| Telecommunication Equipment – Fiber Optics – 0.1% | | | | | | |
| | 5,100 | | | IPG Photonics Corp. | | | 309,723 | | | |
| Telecommunication Services – 0.7% | | | | | | |
| | 3,500 | | | Level 3 Communications, Inc.* | | | 73,780 | | | |
| | 22,300 | | | NeuStar, Inc. – Class A* | | | 1,085,564 | | | |
| | 21,800 | | | tw telecom, inc.* | | | 613,452 | | | |
| | | | | | | | 1,772,796 | | | |
| Telephone – Integrated – 0.2% | | | | | | |
| | 12,000 | | | Verizon Communications, Inc. | | | 604,080 | | | |
See Notes to Schedules of Investments and Other Information and Notes to Financial Statements.
Janus Mathematical Funds | 43
INTECH U.S. Growth Fund
Schedule of Investments
As of June 30, 2013
| | | | | | | | | | | |
| Shares | | Value | | | |
| |
| Television – 0.5% | | | | | | |
| | 9,000 | | | AMC Networks, Inc. – Class A* | | $ | 588,690 | | | |
| | 14,800 | | | CBS Corp. – Class B | | | 723,276 | | | |
| | 300 | | | Liberty Media Corp. | | | 38,028 | | | |
| | | | | | | | 1,349,994 | | | |
| Theaters – 0.1% | | | | | | |
| | 13,200 | | | Cinemark Holdings, Inc. | | | 368,544 | | | |
| Therapeutics – 0.3% | | | | | | |
| | 3,600 | | | BioMarin Pharmaceutical, Inc.* | | | 200,844 | | | |
| | 2,000 | | | Onyx Pharmaceuticals, Inc.* | | | 173,640 | | | |
| | 19,600 | | | Warner Chilcott PLC – Class A | | | 389,648 | | | |
| | | | | | | | 764,132 | | | |
| Tobacco – 2.2% | | | | | | |
| | 42,100 | | | Altria Group, Inc. | | | 1,473,079 | | | |
| | 3,400 | | | Lorillard, Inc. | | | 148,512 | | | |
| | 34,800 | | | Philip Morris International, Inc. | | | 3,014,376 | | | |
| | 24,400 | | | Reynolds American, Inc. | | | 1,180,228 | | | |
| | | | | | | | 5,816,195 | | | |
| Toys – 0.7% | | | | | | |
| | 6,600 | | | Hasbro, Inc. | | | 295,878 | | | |
| | 31,300 | | | Mattel, Inc. | | | 1,418,203 | | | |
| | | | | | | | 1,714,081 | | | |
| Transactional Software – 0.4% | | | | | | |
| | 17,000 | | | Solera Holdings, Inc. | | | 946,050 | | | |
| Transportation – Marine – 0.1% | | | | | | |
| | 3,700 | | | Kirby Corp.* | | | 294,298 | | | |
| Transportation – Railroad – 0.7% | | | | | | |
| | 4,600 | | | Kansas City Southern | | | 487,416 | | | |
| | 8,100 | | | Union Pacific Corp. | | | 1,249,668 | | | |
| | | | | | | | 1,737,084 | | | |
| Transportation – Services – 0.2% | | | | | | |
| | 400 | | | C.H. Robinson Worldwide, Inc. | | | 22,524 | | | |
| | 3,200 | | | Expeditors International of Washington, Inc. | | | 121,632 | | | |
| | 1,600 | | | FedEx Corp. | | | 157,728 | | | |
| | 2,100 | | | United Parcel Service, Inc. – Class B | | | 181,608 | | | |
| | | | | | | | 483,492 | | | |
| Transportation – Truck – 0.1% | | | | | | |
| | 5,000 | | | Con-way, Inc. | | | 194,800 | | | |
| | 2,000 | | | J.B. Hunt Transport Services, Inc. | | | 144,480 | | | |
| | 1,000 | | | Landstar System, Inc. | | | 51,500 | | | |
| | | | | | | | 390,780 | | | |
| Water – 0.1% | | | | | | |
| | 7,300 | | | Aqua America, Inc. | | | 228,417 | | | |
| Web Hosting/Design – 0.5% | | | | | | |
| | 5,000 | | | Equinix, Inc.* | | | 923,600 | | | |
| | 11,400 | | | Rackspace Hosting, Inc.* | | | 431,946 | | | |
| | | | | | | | 1,355,546 | | | |
| Web Portals/Internet Service Providers – 1.4% | | | | | | |
| | 4,100 | | | Google, Inc. – Class A* | | | 3,609,517 | | | |
| Wireless Equipment – 2.1% | | | | | | |
| | 23,800 | | | Crown Castle International Corp.* | | | 1,722,882 | | | |
| | 8,400 | | | Motorola Solutions, Inc. | | | 484,932 | | | |
| | 44,900 | | | SBA Communications Corp. – Class A* | | | 3,327,988 | | | |
| | | | | | | | 5,535,802 | | | |
| |
| |
| Total Common Stock (cost $203,569,631) | | | 260,856,737 | | | |
| |
| |
| Money Market – 0.4% | | | | | | |
| | 1,107,000 | | | Janus Cash Liquidity Fund LLC, 0%£
(cost $1,107,000) | | | 1,107,000 | | | |
| |
| |
| Total Investments (total cost $204,676,631) – 99.9% | | | 261,963,737 | | | |
| |
| |
| Cash, Receivables and Other Assets, net of Liabilities – 0.1% | | | 202,093 | | | |
| |
| |
| Net Assets – 100% | | $ | 262,165,830 | | | |
| |
| |
Summary of Investments by Country – (Long Positions) (unaudited)
| | | | | | | | | |
| | | | | | % of Investment
| |
| Country | | Value | | | Securities | |
| |
| |
| Canada | | $ | 180,264 | | | | 0.1% | |
| India | | | 117,364 | | | | 0.0% | |
| Panama | | | 852,280 | | | | 0.3% | |
| Peru | | | 323,154 | | | | 0.1% | |
| United Kingdom | | | 2,247,353 | | | | 0.9% | |
United States†† | | | 258,243,322 | | | | 98.6% | |
| |
| |
| Total | | $ | 261,963,737 | | | | 100.0% | |
| | | |
| †† | | Includes Cash Equivalents of 0.4%. |
See Notes to Schedules of Investments and Other Information and Notes to Financial Statements.
44 | JUNE 30, 2013
INTECH U.S. Value Fund (unaudited)
| | | | | | | |
Fund Snapshot
INTECH’s active approach focuses on adding value by selecting stocks with unique volatility characteristics and low correlations to one another.
| | | | | | Managed by
INTECH Investment Management LLC |
Performance Overview
For the 12-month period ended June 30, 2013, INTECH U.S. Value Fund’s Class I Shares returned 25.23%. This compares to the 25.32% return posted by the Russell 1000 Value Index, the Fund’s benchmark.
Investment Strategy
INTECH’s mathematical investing process seeks to build a more efficient portfolio than its benchmark, with returns in excess of the index while maintaining benchmark-like risk. The process does not attempt to predict the direction of the market, nor does it have a view of any particular company in the portfolio. Instead, it employs a proprietary optimization process to build portfolios with the potential to outperform the index by capturing stocks’ natural volatility.
Within specific risk controls, INTECH’s disciplined mathematical process establishes target proportional weightings for stocks in the portfolio as a result of an optimization routine. Once the weights are determined and the portfolio is constructed, it is rebalanced and re-optimized on a periodic basis. By limiting the distance any one stock position can deviate from its benchmark weight, INTECH’s process attempts to control the relative risk of the portfolio. We believe that instituting an investment process aimed at providing consistent, positive excess returns at benchmark-like risk, will allow us to meet our investors’ objectives while minimizing the risk of significant underperformance relative to the benchmark.
Performance Review
As stock prices moved naturally throughout the period, we continued to implement our mathematical process in a disciplined manner in an effort to maintain a more efficient portfolio than the benchmark, without increasing relative risk. While other factors may influence performance over the short term, we believe that the consistent application of our process will help the Fund perform well over the long term.
In INTECH’s history, which spans more than 26 years, we have experienced periods of both underperformance and outperformance relative to the benchmark. From our perspective, the key is to keep periods of underperformance both short in duration and mild in scope. INTECH aims to achieve excess returns over the long term and we believe the Fund remains well positioned for long-term capital growth.
Investment Strategy and Outlook
Going forward, we will continue building portfolios in a disciplined and deliberate manner, with risk management remaining the hallmark of our investment process. While we may experience short periods of underperformance, we aim to exceed the benchmark over a three- to five-year time horizon. As INTECH’s ongoing research efforts yield modest improvements, we will continue implementing changes that we believe are likely to improve the long-term results for our clients.
Thank you for your investment in INTECH U.S. Value Fund.
Janus Mathematical Funds | 45
INTECH U.S. Value Fund (unaudited)
INTECH U.S. Value Fund At A Glance
5 Largest Equity Holdings – (% of Net Assets)
As of June 30, 2013
| | | | | |
Exxon Mobil Corp.
Oil Companies – Integrated | | | 3.6% | |
General Electric Co.
Diversified Operations | | | 1.4% | |
Berkshire Hathaway, Inc. – Class B
Reinsurance | | | 1.4% | |
Chevron Corp.
Oil Companies – Integrated | | | 1.3% | |
Marathon Petroleum Corp.
Oil Refining and Marketing | | | 1.2% | |
| | | | | |
| | | | 8.9% | |
Asset Allocation – (% of Net Assets)
As of June 30, 2013
Top Country Allocations – Long Positions (% of Investment Securities)
As of June 30, 2013
46 | JUNE 30, 2013
(unaudited)
| | | | | | | | | | | | |
| Average Annual Total Return – for the periods ended June 30, 2013 | | | Expense Ratios – per the October 26, 2012 prospectus |
| | | One
| | Five
| | Since
| | | Total Annual Fund
| | Net Annual Fund
|
| | | Year | | Year | | Inception* | | | Operating Expenses | | Operating Expenses |
| | | | | | | | | | | | |
| INTECH U.S. Value Fund – Class A Shares | | | | | | | | | | | |
| | | | | | | | | | | | |
| NAV | | 24.86% | | 7.04% | | 4.91% | | | 0.92% | | 0.92% |
| | | | | | | | | | | | |
| MOP | | 17.67% | | 5.79% | | 4.08% | | | | | |
| | | | | | | | | | | | |
| INTECH U.S. Value Fund – Class C Shares | | | | | | | | | | | |
| | | | | | | | | | | | |
| NAV | | 23.97% | | 6.25% | | 4.13% | | | 1.86% | | 1.75% |
| | | | | | | | | | | | |
| CDSC | | 22.97% | | 6.25% | | 4.13% | | | | | |
| | | | | | | | | | | | |
| INTECH U.S. Value Fund – Class I Shares | | 25.23% | | 7.28% | | 5.15% | | | 0.67% | | 0.67% |
| | | | | | | | | | | | |
| INTECH U.S. Value Fund – Class S Shares | | 25.12% | | 6.90% | | 4.72% | | | 1.15% | | 1.15% |
| | | | | | | | | | | | |
| INTECH U.S. Value Fund – Class T Shares | | 24.84% | | 7.00% | | 4.76% | | | 0.89% | | 0.89% |
| | | | | | | | | | | | |
| Russell 1000® Value Index | | 25.32% | | 6.67% | | 5.14% | | | | | |
| | | | | | | | | | | | |
| Morningstar Quartile – Class I Shares | | 2nd | | 2nd | | 2nd | | | | | |
| | | | | | | | | | | | |
| Morningstar Ranking – based on total returns for Large Value Funds | | 371/1,237 | | 331/1,111 | | 475/1,044 | | | | | |
| | | | | | | | | | | | |
| Visit janus.com/advisor/mutual-funds to view current performance and characteristic information | | | | | |
| | | | | | | | | | | | |
Returns quoted are past performance and do not guarantee future results; current performance may be lower or higher. Investment returns and principal value will vary; there may be a gain or loss when shares are sold. For the most recent month-end performance call 877.33JANUS(52687) or visit janus.com/advisor/mutual-funds.
Performance shown for Class A Shares at Maximum Offering Price (MOP) includes the Fund’s maximum sales charge of 5.75%. Performance shown at Net Asset Value (NAV) does not include this charge and would have been lower had this charge been taken into account.
Performance shown for Class C Shares includes a 1% contingent deferred sales charge (CDSC) on periods of less than 12 months. Performance shown at Net Asset Value (NAV) does not include this sales charge and would have been lower had this sales charge been taken into account.
See important disclosures on the next page.
Janus Mathematical Funds | 47
INTECH U.S. Value Fund (unaudited)
Net expense ratios reflect the expense waiver, if any, Janus Capital has contractually agreed to through November 1, 2013.
The proprietary mathematical process used by INTECH Investment Management LLC (“INTECH”) may not achieve the desired results. The rebalancing techniques used by the Fund may result in a higher portfolio turnover rate, higher expenses and potentially higher net taxable gains or losses compared to a “buy and hold” or index fund strategy.
The Fund’s performance may be affected by risks that include those associated with investments in specific industries or countries and potential conflicts of interest with the Janus “funds of funds.” Additional risks to the Fund may include those associated with investing in foreign securities, initial public offerings (“IPOs”), real estate investment trusts (“REITs”), and derivatives. Please see the Fund’s prospectus or janus.com/info for more information about risks, portfolio holdings and other details.
The Fund invests in REITs, which may be subject to a higher degree of market risk because of concentration in a specific industry, sector or geographic region. REITs may be subject to risks including, but not limited to: legal, political, liquidity, interest rate risks, a decline in the value of real estate, risks related to general and economic conditions, changes in the value of the underlying property owned by the trust and defaults by borrowers. To the extent the Fund invests in foreign REITs, the Fund may be subject to fluctuations in currency rates or political or economic conditions in a particular country.
The Fund will normally invest at least 80% of its net assets, measured at the time of purchase, in the type of securities described by its name.
Returns include reinvestment of all dividends and distributions. The returns do not include adjustments in accordance with generally accepted accounting principles required at the period end for financial reporting purposes.
Class A Shares, Class C Shares, Class I Shares, and Class S Shares of the Fund commenced operations on July 6, 2009. The performance shown for periods prior to July 6, 2009 reflects the historical performance of each respective share class of the predecessor fund, calculated using the fees and expenses of each respective share class accounting for, when applicable and permitted, any fee and expense limitations or waivers.
Class T Shares of the Fund commenced operations on July 6, 2009. The performance shown for periods prior to July 6, 2009 reflects the historical performance of the predecessor fund’s Class I Shares, calculated using the fees and expenses of Class T Shares without the effect of any fee and expense limitations or waivers.
If each share class of the Fund had been available during periods prior to its commencement, the performance shown may have been different. The performance shown for periods following the Fund’s commencement of each share class reflects the fees and expenses of each respective share class, net of any applicable fee and expense limitations or waivers. Please refer to the Fund’s prospectus for further details concerning historical performance.
Ranking is for the share class shown only; other classes may have different performance characteristics. When an expense waiver is in effect, it may have a material effect on the total return, and therefore the ranking for the period.
© 2013 Morningstar, Inc. All Rights Reserved.
There is no assurance that the investment process will consistently lead to successful investing.
See Notes to Schedules of Investments and Other Information for index definitions.
The weighting of securities within the portfolio may differ significantly from the weightings within the index. The index is unmanaged and is not available for direct investment; therefore, its performance does not reflect the expenses associated with the active management of an actual portfolio.
See “Useful Information About Your Fund Report.”
| | | |
| * | | The predecessor Fund’s inception date – December 30, 2005 |
48 | JUNE 30, 2013
(unaudited)
As a shareholder of the Fund, you incur two types of costs: (1) transaction costs, such as sales charges (loads) on purchase payments (applicable to Class A Shares only); and (2) ongoing costs, including management fees; distribution and shareholder servicing (12b-1) fees; administrative services fees payable pursuant to the Transfer Agency Agreement; and other Fund expenses. This example is intended to help you understand your ongoing costs (in dollars) of investing in the Fund and to compare these costs with the ongoing costs of investing in other mutual funds. To do so, compare this 5% hypothetical example with the 5% hypothetical examples that appear in the shareholder reports of the other funds. The example is based upon an investment of $1,000 invested at the beginning of the period and held for the six-months indicated, unless noted otherwise in the table and footnotes below.
Actual Expenses
The information in the table under the heading “Actual” provides information about actual account values and actual expenses. You may use the information in these columns, together with the amount you invested, to estimate the expenses that you paid over the period. Simply divide your account value by $1,000 (for example, an $8,600 account value divided by $1,000 = 8.6), then multiply the result by the number in the appropriate column for your share class under the heading entitled “Expenses Paid During Period” to estimate the expenses you paid on your account during the period.
Hypothetical Example for Comparison Purposes
The information in the table under the heading “Hypothetical (5% return before expenses)” provides information about hypothetical account values and hypothetical expenses based upon the Fund’s actual expense ratio and an assumed rate of return of 5% per year before expenses, which is not the Fund’s actual return. The hypothetical account values and expenses may not be used to estimate the actual ending account balance or expenses you paid for the period. You may use this information to compare the ongoing costs of investing in the Fund and other funds. To do so, compare this 5% hypothetical example with the 5% hypothetical examples that appear in the shareholder reports of the other funds. Additionally, for an analysis of the fees associated with an investment in any share class or other similar funds, please visit www.finra.org/fundanalyzer.
Please note that the expenses shown in the table are meant to highlight your ongoing costs only and do not reflect any transaction costs. These fees are fully described in the Fund’s prospectus. Therefore, the hypothetical examples are useful in comparing ongoing costs only, and will not help you determine the relative total costs of owning different funds. In addition, if these transaction costs were included, your costs would have been higher.
| | | | | | | | | | | | | | | | | | | | | | | | | | | | | | | |
| | | | | Hypothetical
| | | | |
| | | Actual | | (5% return before expenses) | | | | |
| | | Beginning
| | Ending
| | Expenses
| | Beginning
| | Ending
| | Expenses
| | | | |
| | | Account
| | Account
| | Paid During
| | Account
| | Account
| | Paid During
| | Net Annualized
| | |
| | | Value
| | Value
| | Period
| | Value
| | Value
| | Period
| | Expense Ratio
| | |
| | | (1/1/13) | | (6/30/13) | | (1/1/13 - 6/30/13)† | | (1/1/13) | | (6/30/13) | | (1/1/13 - 6/30/13)† | | (1/1/13 - 6/30/13) | | |
| |
| |
| Class A Shares | | $ | 1,000.00 | | | $ | 1,160.30 | | | $ | 5.36 | | | $ | 1,000.00 | | | $ | 1,019.84 | | | $ | 5.01 | | | | 1.00% | | | |
| |
| |
| Class C Shares | | $ | 1,000.00 | | | $ | 1,156.30 | | | $ | 8.93 | | | $ | 1,000.00 | | | $ | 1,016.51 | | | $ | 8.35 | | | | 1.67% | | | |
| |
| |
| Class I Shares | | $ | 1,000.00 | | | $ | 1,161.60 | | | $ | 3.48 | | | $ | 1,000.00 | | | $ | 1,021.57 | | | $ | 3.26 | | | | 0.65% | | | |
| |
| |
| Class S Shares | | $ | 1,000.00 | | | $ | 1,163.40 | | | $ | 3.06 | | | $ | 1,000.00 | | | $ | 1,021.97 | | | $ | 2.86 | | | | 0.57% | | | |
| |
| |
| Class T Shares | | $ | 1,000.00 | | | $ | 1,159.90 | | | $ | 4.71 | | | $ | 1,000.00 | | | $ | 1,020.43 | | | $ | 4.41 | | | | 0.88% | | | |
| |
| |
| | | |
| † | | Expenses Paid During Period are equal to the Net Annualized Expense Ratio multiplied by the average account value over the period, multiplied by the number of days in the most recent six-month period, divided by the number of days in the fiscal year. Expenses in the examples include the effect of applicable fee waivers and/or expense reimbursements, if any. Had such waivers and/or reimbursements not been in effect, your expenses would have been higher. Please refer to the Notes to Financial Statements or the Fund’s prospectus for more information regarding waivers and/or reimbursements. |
Janus Mathematical Funds | 49
INTECH U.S. Value Fund
Schedule of Investments
As of June 30, 2013
| | | | | | | | | | | |
| Shares | | Value | | | |
| |
| Common Stock – 99.6% | | | | | | |
| Advertising Sales – 0% | | | | | | |
| | 500 | | | Lamar Advertising Co. – Class A* | | $ | 21,700 | | | |
| Aerospace and Defense – 0.5% | | | | | | |
| | 500 | | | Boeing Co. | | | 51,220 | | | |
| | 200 | | | Lockheed Martin Corp. | | | 21,692 | | | |
| | 1,300 | | | Northrop Grumman Corp. | | | 107,640 | | | |
| | 2,800 | | | Raytheon Co. | | | 185,136 | | | |
| | 1,100 | | | Spirit Aerosystems Holdings, Inc. – Class A* | | | 23,628 | | | |
| | | | | | | | 389,316 | | | |
| Aerospace and Defense – Equipment – 0.4% | | | | | | |
| | 2,800 | | | Alliant Techsystems, Inc. | | | 230,524 | | | |
| | 900 | | | Triumph Group, Inc. | | | 71,235 | | | |
| | | | | | | | 301,759 | | | |
| Agricultural Chemicals – 0% | | | | | | |
| | 200 | | | Mosaic Co. | | | 10,762 | | | |
| Agricultural Operations – 0.2% | | | | | | |
| | 3,100 | | | Archer-Daniels-Midland Co. | | | 105,121 | | | |
| | 1,300 | | | Bunge, Ltd. | | | 92,001 | | | |
| | | | | | | | 197,122 | | | |
| Airlines – 0.6% | | | | | | |
| | 700 | | | Copa Holdings S.A. – Class A | | | 91,784 | | | |
| | 13,700 | | | Delta Air Lines, Inc. | | | 256,327 | | | |
| | 10,600 | | | Southwest Airlines Co. | | | 136,634 | | | |
| | | | | | | | 484,745 | | | |
| Appliances – 0.7% | | | | | | |
| | 5,600 | | | Whirlpool Corp. | | | 640,416 | | | |
| Applications Software – 0.2% | | | | | | |
| | 19,900 | | | Compuware Corp. | | | 205,965 | | | |
| Automotive – Cars and Light Trucks – 0.9% | | | | | | |
| | 44,100 | | | Ford Motor Co. | | | 682,227 | | | |
| | 2,400 | | | General Motors Co.* | | | 79,944 | | | |
| | | | | | | | 762,171 | | | |
| Automotive – Medium and Heavy Duty Trucks – 0.4% | | | | | | |
| | 2,700 | | | Navistar International Corp.* | | | 74,952 | | | |
| | 4,400 | | | Oshkosh Corp.* | | | 167,068 | | | |
| | 1,300 | | | PACCAR, Inc. | | | 69,758 | | | |
| | | | | | | | 311,778 | | | |
| Automotive – Truck Parts and Equipment – Original – 0.7% | | | | | | |
| | 2,400 | | | Johnson Controls, Inc. | | | 85,896 | | | |
| | 3,000 | | | Lear Corp. | | | 181,380 | | | |
| | 3,200 | | | TRW Automotive Holdings Corp.* | | | 212,608 | | | |
| | 1,700 | | | Visteon Corp.* | | | 107,304 | | | |
| | | | | | | | 587,188 | | | |
| Batteries & Battery Systems – 0.2% | | | | | | |
| | 2,100 | | | Energizer Holdings, Inc. | | | 211,071 | | | |
| Beverages – Non-Alcoholic – 0.1% | | | | | | |
| | 2,800 | | | Coca-Cola Enterprises, Inc. | | | 98,448 | | | |
| Beverages – Wine and Spirits – 0.4% | | | | | | |
| | 1,400 | | | Beam, Inc. | | | 88,354 | | | |
| | 450 | | | Brown-Forman Corp. – Class B | | | 30,397 | | | |
| | 5,100 | | | Constellation Brands, Inc. – Class A* | | | 265,812 | | | |
| | | | | | | | 384,563 | | | |
| Brewery – 0.1% | | | | | | |
| | 1,100 | | | Molson Coors Brewing Co. – Class B | | | 52,646 | | | |
| Broadcast Services and Programming – 0.2% | | | | | | |
| | 6,374 | | | Starz – Class A* | | | 140,865 | | | |
| Building – Heavy Construction – 0.2% | | | | | | |
| | 2,220 | | | Chicago Bridge & Iron Co. N.V. | | | 132,445 | | | |
| Building – Residential and Commercial – 0.4% | | | | | | |
| | 1,700 | | | D.R. Horton, Inc. | | | 36,176 | | | |
| | 3,400 | | | Lennar Corp. – Class A | | | 122,536 | | | |
| | 9,200 | | | PulteGroup, Inc. | | | 174,524 | | | |
| | | | | | | | 333,236 | | | |
| Building and Construction Products – Miscellaneous – 0.1% | | | | | | |
| | 1,300 | | | Fortune Brands Home & Security, Inc. | | | 50,362 | | | |
| | 700 | | | Owens Corning* | | | 27,356 | | | |
| | | | | | | | 77,718 | | | |
| Building Products – Cement and Aggregate – 0.2% | | | | | | |
| | 700 | | | Martin Marietta Materials, Inc. | | | 68,894 | | | |
| | 2,100 | | | Vulcan Materials Co. | | | 101,661 | | | |
| | | | | | | | 170,555 | | | |
| Cable/Satellite Television – 1.0% | | | | | | |
| | 1,900 | | | Cablevision Systems Corp. – Class A | | | 31,958 | | | |
| | 18,650 | | | Comcast Corp. – Class A | | | 781,062 | | | |
| | 1,600 | | | DISH Network Corp. – Class A | | | 68,032 | | | |
| | | | | | | | 881,052 | | | |
| Casino Hotels – 0% | | | | | | |
| | 1,600 | | | MGM Resorts International* | | | 23,648 | | | |
| Casino Services – 0.1% | | | | | | |
| | 3,200 | | | International Game Technology | | | 53,472 | | | |
| Cellular Telecommunications – 0.6% | | | | | | |
| | 68,900 | | | Sprint Nextel Corp.* | | | 483,678 | | | |
| Chemicals – Diversified – 0.7% | | | | | | |
| | 7,700 | | | LyondellBasell Industries N.V. – Class A | | | 510,202 | | | |
| | 1,100 | | | Rockwood Holdings, Inc. | | | 70,433 | | | |
| | 200 | | | Westlake Chemical Corp. | | | 19,282 | | | |
| | | | | | | | 599,917 | | | |
| Chemicals – Specialty – 0.2% | | | | | | |
| | 1,400 | | | Albemarle Corp. | | | 87,206 | | | |
| | 1,000 | | | Cytec Industries, Inc. | | | 73,250 | | | |
| | 500 | | | Eastman Chemical Co. | | | 35,005 | | | |
| | 100 | | | WR Grace & Co.* | | | 8,404 | | | |
| | | | | | | | 203,865 | | | |
| Coffee – 0.1% | | | | | | |
| | 1,600 | | | Green Mountain Coffee Roasters, Inc.* | | | 120,096 | | | |
| Commercial Banks – 1.7% | | | | | | |
| | 1,000 | | | Associated Banc-Corp | | | 15,550 | | | |
| | 6,200 | | | BB&T Corp. | | | 210,056 | | | |
| | 12,400 | | | CapitalSource, Inc. | | | 116,312 | | | |
| | 500 | | | CIT Group, Inc.* | | | 23,315 | | | |
| | 400 | | | Cullen / Frost Bankers, Inc. | | | 26,708 | | | |
| | 3,100 | | | First Horizon National Corp. | | | 34,720 | | | |
| | 500 | | | First Republic Bank | | | 19,240 | | | |
| | 3,600 | | | M&T Bank Corp. | | | 402,300 | | | |
| | 4,600 | | | Popular, Inc.* | | | 139,518 | | | |
| | 23,600 | | | Regions Financial Corp. | | | 224,908 | | | |
| | 500 | | | Signature Bank* | | | 41,510 | | | |
| | 700 | | | SVB Financial Group* | | | 58,324 | | | |
See Notes to Schedules of Investments and Other Information and Notes to Financial Statements.
50 | JUNE 30, 2013
Schedule of Investments
As of June 30, 2013
| | | | | | | | | | | |
| Shares | | Value | | | |
| |
| Commercial Banks – (continued) | | | | | | |
| | 7,600 | | | TCF Financial Corp. | | $ | 107,768 | | | |
| | 1,900 | | | Zions Bancorp | | | 54,872 | | | |
| | | | | | | | 1,475,101 | | | |
| Commercial Services – 0% | | | | | | |
| | 279 | | | Iron Mountain, Inc. | | | 7,424 | | | |
| Commercial Services – Finance – 0.2% | | | | | | |
| | 200 | | | Equifax, Inc. | | | 11,786 | | | |
| | 5,400 | | | H&R Block, Inc. | | | 149,850 | | | |
| | | | | | | | 161,636 | | | |
| Computer Services – 0.4% | | | | | | |
| | 5,000 | | | Computer Sciences Corp. | | | 218,850 | | | |
| | 2,400 | | | DST Systems, Inc. | | | 156,792 | | | |
| | | | | | | | 375,642 | | | |
| Computers – 1.2% | | | | | | |
| | 59,000 | | | Dell, Inc. | | | 787,650 | | | |
| | 9,800 | | | Hewlett-Packard Co. | | | 243,040 | | | |
| | | | | | | | 1,030,690 | | | |
| Computers – Memory Devices – 0.2% | | | | | | |
| | 1,300 | | | SanDisk Corp. | | | 79,430 | | | |
| | 1,900 | | | Western Digital Corp. | | | 117,971 | | | |
| | | | | | | | 197,401 | | | |
| Consulting Services – 0.3% | | | | | | |
| | 5,100 | | | SAIC, Inc. | | | 71,043 | | | |
| | 1,400 | | | Towers Watson & Co. – Class A | | | 114,716 | | | |
| | 600 | | | Verisk Analytics, Inc. – Class A* | | | 35,820 | | | |
| | | | | | | | 221,579 | | | |
| Consumer Products – Miscellaneous – 0.9% | | | | | | |
| | 2,900 | | | Clorox Co. | | | 241,106 | | | |
| | 4,050 | | | Jarden Corp.* | | | 177,187 | | | |
| | 3,400 | | | Kimberly-Clark Corp. | | | 330,276 | | | |
| | | | | | | | 748,569 | | | |
| Containers – Metal and Glass – 0.2% | | | | | | |
| | 600 | | | Crown Holdings, Inc.* | | | 24,678 | | | |
| | 3,800 | | | Owens-Illinois, Inc.* | | | 105,602 | | | |
| | | | | | | | 130,280 | | | |
| Containers – Paper and Plastic – 0.6% | | | | | | |
| | 2,900 | | | Bemis Co., Inc. | | | 113,506 | | | |
| | 700 | | | Packaging Corp. of America | | | 34,272 | | | |
| | 1,700 | | | Rock-Tenn Co. – Class A | | | 169,796 | | | |
| | 6,400 | | | Sealed Air Corp. | | | 153,280 | | | |
| | | | | | | | 470,854 | | | |
| Cosmetics and Toiletries – 1.3% | | | | | | |
| | 3,300 | | | Avon Products, Inc. | | | 69,399 | | | |
| | 600 | | | Colgate-Palmolive Co. | | | 34,374 | | | |
| | 13,300 | | | Procter & Gamble Co. | | | 1,023,967 | | | |
| | | | | | | | 1,127,740 | | | |
| Cruise Lines – 0.2% | | | | | | |
| | 4,600 | | | Royal Caribbean Cruises, Ltd. (U.S. Shares) | | | 153,364 | | | |
| Data Processing and Management – 0.7% | | | | | | |
| | 11,100 | | | Fidelity National Information Services, Inc. | | | 475,524 | | | |
| | 1,300 | | | Fiserv, Inc.* | | | 113,633 | | | |
| | | | | | | | 589,157 | | | |
| Dental Supplies and Equipment – 0% | | | | | | |
| | 200 | | | DENTSPLY International, Inc. | | | 8,192 | | | |
| Diagnostic Kits – 0.2% | | | | | | |
| | 2,600 | | | Alere, Inc.* | | | 63,700 | | | |
| | 6,700 | | | QIAGEN N.V. (U.S. Shares)* | | | 133,397 | | | |
| | | | | | | | 197,097 | | | |
| Distribution/Wholesale – 0.1% | | | | | | |
| | 3,500 | | | Ingram Micro, Inc. – Class A* | | | 66,465 | | | |
| | 400 | | | WESCO International, Inc.* | | | 27,184 | | | |
| | | | | | | | 93,649 | | | |
| Diversified Banking Institutions – 4.0% | | | | | | |
| | 32,400 | | | Bank of America Corp. | | | 416,664 | | | |
| | 7,470 | | | Citigroup, Inc. | | | 358,336 | | | |
| | 5,800 | | | Goldman Sachs Group, Inc. | | | 877,250 | | | |
| | 19,100 | | | JPMorgan Chase & Co. | | | 1,008,289 | | | |
| | 31,400 | | | Morgan Stanley | | | 767,102 | | | |
| | | | | | | | 3,427,641 | | | |
| Diversified Operations – 4.8% | | | | | | |
| | 300 | | | 3M Co. | | | 32,805 | | | |
| | 2,100 | | | Carlisle Cos., Inc. | | | 130,851 | | | |
| | 2,900 | | | Colfax Corp.* | | | 151,119 | | | |
| | 4,800 | | | Crane Co. | | | 287,616 | | | |
| | 1,500 | | | Danaher Corp. | | | 94,950 | | | |
| | 4,800 | | | Dover Corp. | | | 372,768 | | | |
| | 9,417 | | | Eaton Corp. PLC | | | 619,733 | | | |
| | 52,700 | | | General Electric Co. | | | 1,222,113 | | | |
| | 1,000 | | | Harsco Corp. | | | 23,190 | | | |
| | 1,700 | | | ITT Corp. | | | 49,997 | | | |
| | 7,400 | | | Leggett & Platt, Inc. | | | 230,066 | | | |
| | 11,832 | | | Leucadia National Corp. | | | 310,235 | | | |
| | 4,834 | | | Pentair, Ltd. | | | 278,873 | | | |
| | 800 | | | SPX Corp. | | | 57,584 | | | |
| | 1,300 | | | Textron, Inc. | | | 33,865 | | | |
| | 6,500 | | | Trinity Industries, Inc. | | | 249,860 | | | |
| | | | | | | | 4,145,625 | | | |
| E-Commerce/Services – 0.5% | | | | | | |
| | 8,000 | | | Liberty Interactive Corp. – Class A* | | | 184,080 | | | |
| | 2,675 | | | Liberty Ventures | | | 227,402 | | | |
| | | | | | | | 411,482 | | | |
| Electric – Generation – 0% | | | | | | |
| | 3,400 | | | AES Corp. | | | 40,766 | | | |
| Electric – Integrated – 2.7% | | | | | | |
| | 600 | | | Alliant Energy Corp. | | | 30,252 | | | |
| | 1,200 | | | Ameren Corp. | | | 41,328 | | | |
| | 1,800 | | | American Electric Power Co., Inc. | | | 80,604 | | | |
| | 5,200 | | | CMS Energy Corp. | | | 141,284 | | | |
| | 1,400 | | | Dominion Resources, Inc. | | | 79,548 | | | |
| | 3,400 | | | DTE Energy Co. | | | 227,834 | | | |
| | 2,997 | | | Duke Energy Corp. | | | 202,298 | | | |
| | 2,300 | | | Edison International | | | 110,768 | | | |
| | 400 | | | Entergy Corp. | | | 27,872 | | | |
| | 1,700 | | | Exelon Corp. | | | 52,496 | | | |
| | 900 | | | Great Plains Energy, Inc. | | | 20,286 | | | |
| | 700 | | | National Fuel Gas Co. | | | 40,565 | | | |
| | 3,200 | | | NextEra Energy, Inc. | | | 260,736 | | | |
| | 6,961 | | | Northeast Utilities | | | 292,501 | | | |
| | 600 | | | NV Energy, Inc. | | | 14,076 | | | |
| | 4,000 | | | OGE Energy Corp. | | | 272,800 | | | |
See Notes to Schedules of Investments and Other Information and Notes to Financial Statements.
Janus Mathematical Funds | 51
INTECH U.S. Value Fund
Schedule of Investments
As of June 30, 2013
| | | | | | | | | | | |
| Shares | | Value | | | |
| |
| Electric – Integrated – (continued) | | | | | | |
| | 800 | | | PG&E Corp. | | $ | 36,584 | | | |
| | 1,500 | | | Pinnacle West Capital Corp. | | | 83,205 | | | |
| | 1,300 | | | PPL Corp. | | | 39,338 | | | |
| | 1,900 | | | Public Service Enterprise Group, Inc. | | | 62,054 | | | |
| | 900 | | | SCANA Corp. | | | 44,190 | | | |
| | 1,500 | | | Southern Co. | | | 66,195 | | | |
| | 900 | | | Westar Energy, Inc. | | | 28,764 | | | |
| | 800 | | | Wisconsin Energy Corp. | | | 32,792 | | | |
| | 1,400 | | | Xcel Energy, Inc. | | | 39,676 | | | |
| | | | | | | | 2,328,046 | | | |
| Electric Products – Miscellaneous – 0.2% | | | | | | |
| | 3,600 | | | Emerson Electric Co. | | | 196,344 | | | |
| Electronic Components – Miscellaneous – 0.1% | | | | | | |
| | 3,100 | | | Vishay Intertechnology, Inc.* | | | 43,059 | | | |
| Electronic Components – Semiconductors – 1.1% | | | | | | |
| | 5,200 | | | Cree, Inc.* | | | 332,072 | | | |
| | 900 | | | Intel Corp. | | | 21,798 | | | |
| | 9,400 | | | Micron Technology, Inc.* | | | 134,702 | | | |
| | 13,700 | | | ON Semiconductor Corp.* | | | 110,696 | | | |
| | 2,700 | | | Rovi Corp.* | | | 61,668 | | | |
| | 9,200 | | | Texas Instruments, Inc. | | | 320,804 | | | |
| | | | | | | | 981,740 | | | |
| Electronic Design Automation – 0.2% | | | | | | |
| | 3,700 | | | Synopsys, Inc.* | | | 132,275 | | | |
| Electronic Forms – 0.2% | | | | | | |
| | 3,700 | | | Adobe Systems, Inc.* | | | 168,572 | | | |
| Electronic Measuring Instruments – 0.1% | | | | | | |
| | 1,200 | | | FLIR Systems, Inc. | | | 32,364 | | | |
| | 600 | | | Itron, Inc.* | | | 25,458 | | | |
| | | | | | | | 57,822 | | | |
| Electronic Parts Distributors – 0.2% | | | | | | |
| | 3,800 | | | Avnet, Inc.* | | | 127,680 | | | |
| | 1,400 | | | Tech Data Corp.* | | | 65,926 | | | |
| | | | | | | | 193,606 | | | |
| Electronic Security Devices – 0.3% | | | | | | |
| | 7,200 | | | Tyco International, Ltd. (U.S. Shares) | | | 237,240 | | | |
| Electronics – Military – 0.1% | | | | | | |
| | 1,000 | | | L-3 Communications Holdings, Inc. | | | 85,740 | | | |
| Engineering – Research and Development Services – 0.4% | | | | | | |
| | 6,100 | | | AECOM Technology Corp.* | | | 193,919 | | | |
| | 500 | | | Fluor Corp. | | | 29,655 | | | |
| | 1,200 | | | Jacobs Engineering Group, Inc.* | | | 66,156 | | | |
| | 1,200 | | | URS Corp. | | | 56,664 | | | |
| | | | | | | | 346,394 | | | |
| Enterprise Software/Services – 0% | | | | | | |
| | 1,000 | | | CA, Inc. | | | 28,630 | | | |
| Entertainment Software – 0.7% | | | | | | |
| | 24,300 | | | Activision Blizzard, Inc. | | | 346,518 | | | |
| | 10,200 | | | Electronic Arts, Inc.* | | | 234,294 | | | |
| | | | | | | | 580,812 | | | |
| Fiduciary Banks – 1.5% | | | | | | |
| | 4,224 | | | Bank of New York Mellon Corp. | | | 118,483 | | | |
| | 3,300 | | | Northern Trust Corp. | | | 191,070 | | | |
| | 14,500 | | | State Street Corp. | | | 945,545 | | | |
| | | | | | | | 1,255,098 | | | |
| Finance – Consumer Loans – 0.1% | | | | | | |
| | 2,700 | | | SLM Corp. | | | 61,722 | | | |
| Finance – Credit Card – 0.6% | | | | | | |
| | 1,500 | | | American Express Co. | | | 112,140 | | | |
| | 8,000 | | | Discover Financial Services | | | 381,120 | | | |
| | | | | | | | 493,260 | | | |
| Finance – Investment Bankers/Brokers – 0.3% | | | | | | |
| | 2,500 | | | Charles Schwab Corp. | | | 53,075 | | | |
| | 3,500 | | | Raymond James Financial, Inc. | | | 150,430 | | | |
| | 1,200 | | | TD Ameritrade Holding Corp. | | | 29,148 | | | |
| | | | | | | | 232,653 | | | |
| Finance – Leasing Companies – 0.1% | | | | | | |
| | 4,600 | | | Air Lease Corp. | | | 126,914 | | | |
| Finance – Other Services – 0.8% | | | | | | |
| | 500 | | | CBOE Holdings, Inc. | | | 23,320 | | | |
| | 3,000 | | | NASDAQ OMX Group, Inc. | | | 98,370 | | | |
| | 12,600 | | | NYSE Euronext | | | 521,640 | | | |
| | | | | | | | 643,330 | | | |
| Financial Guarantee Insurance – 0% | | | | | | |
| | 1,600 | | | Assured Guaranty, Ltd. | | | 35,296 | | | |
| Food – Confectionary – 0.2% | | | | | | |
| | 1,600 | | | J.M. Smucker Co. | | | 165,040 | | | |
| Food – Dairy Products – 0% | | | | | | |
| | 306 | | | WhiteWave Foods Co. – Class A | | | 4,973 | | | |
| Food – Meat Products – 0.5% | | | | | | |
| | 800 | | | Hillshire Brands Co. | | | 26,464 | | | |
| | 4,600 | | | Hormel Foods Corp. | | | 177,468 | | | |
| | 9,100 | | | Tyson Foods, Inc. – Class A | | | 233,688 | | | |
| | | | | | | | 437,620 | | | |
| Food – Miscellaneous/Diversified – 1.6% | | | | | | |
| | 1,200 | | | Campbell Soup Co. | | | 53,748 | | | |
| | 19,400 | | | ConAgra Foods, Inc. | | | 677,642 | | | |
| | 4,000 | | | General Mills, Inc. | | | 194,120 | | | |
| | 2,500 | | | Ingredion, Inc. | | | 164,050 | | | |
| | 1,100 | | | Kellogg Co. | | | 70,653 | | | |
| | 2,250 | | | Kraft Foods Group, Inc. | | | 125,707 | | | |
| | 3,852 | | | Mondelez International, Inc. – Class A | | | 109,898 | | | |
| | | | | | | | 1,395,818 | | | |
| Food – Retail – 0.4% | | | | | | |
| | 14,500 | | | Safeway, Inc. | | | 343,070 | | | |
| Food – Wholesale/Distribution – 0.1% | | | | | | |
| | 3,200 | | | Sysco Corp. | | | 109,312 | | | |
| Footwear and Related Apparel – 0% | | | | | | |
| | 700 | | | Deckers Outdoor Corp.* | | | 35,357 | | | |
| Funeral Services and Related Items – 0.1% | | | | | | |
| | 5,800 | | | Service Corp. International | | | 104,574 | | | |
See Notes to Schedules of Investments and Other Information and Notes to Financial Statements.
52 | JUNE 30, 2013
Schedule of Investments
As of June 30, 2013
| | | | | | | | | | | |
| Shares | | Value | | | |
| |
| Gas – Distribution – 1.2% | | | | | | |
| | 2,600 | | | CenterPoint Energy, Inc. | | $ | 61,074 | | | |
| | 9,900 | | | NiSource, Inc. | | | 283,536 | | | |
| | 8,400 | | | Sempra Energy | | | 686,784 | | | |
| | | | | | | | 1,031,394 | | | |
| Gas – Transportation – 0.4% | | | | | | |
| | 1,700 | | | AGL Resources, Inc. | | | 72,862 | | | |
| | 2,000 | | | Atmos Energy Corp. | | | 82,120 | | | |
| | 2,500 | | | Questar Corp. | | | 59,625 | | | |
| | 1,500 | | | UGI Corp. | | | 58,665 | | | |
| | 2,100 | | | Vectren Corp. | | | 71,043 | | | |
| | | | | | | | 344,315 | | | |
| Home Decoration Products – 0.3% | | | | | | |
| | 11,100 | | | Newell Rubbermaid, Inc. | | | 291,375 | | | |
| Hotels and Motels – 0% | | | | | | |
| | 600 | | | Hyatt Hotels Corp. – Class A* | | | 24,216 | | | |
| Human Resources – 0.3% | | | | | | |
| | 4,600 | | | Manpowergroup, Inc. | | | 252,080 | | | |
| Independent Power Producer – 0.5% | | | | | | |
| | 7,300 | | | Calpine Corp.* | | | 154,979 | | | |
| | 10,200 | | | NRG Energy, Inc. | | | 272,340 | | | |
| | | | | | | | 427,319 | | | |
| Instruments – Scientific – 0.9% | | | | | | |
| | 2,400 | | | PerkinElmer, Inc. | | | 78,000 | | | |
| | 8,500 | | | Thermo Fisher Scientific, Inc. | | | 719,355 | | | |
| | | | | | | | 797,355 | | | |
| Insurance Brokers – 0.7% | | | | | | |
| | 9,100 | | | Aon PLC | | | 585,585 | | | |
| | 1,300 | | | Brown & Brown, Inc. | | | 41,912 | | | |
| | 200 | | | Marsh & McLennan Cos., Inc. | | | 7,984 | | | |
| | | | | | | | 635,481 | | | |
| Internet Security – 0.6% | | | | | | |
| | 20,300 | | | Symantec Corp. | | | 456,141 | | | |
| | 800 | | | VeriSign, Inc. | | | 35,728 | | | |
| | | | | | | | 491,869 | | | |
| Investment Companies – 0.4% | | | | | | |
| | 16,900 | | | American Capital, Ltd.* | | | 214,123 | | | |
| | 7,500 | | | Ares Capital Corp. | | | 129,000 | | | |
| | | | | | | | 343,123 | | | |
| Investment Management and Advisory Services – 1.2% | | | | | | |
| | 300 | | | Affiliated Managers Group, Inc.* | | | 49,182 | | | |
| | 2,900 | | | Ameriprise Financial, Inc. | | | 234,552 | | | |
| | 2,200 | | | BlackRock, Inc. | | | 565,070 | | | |
| | 400 | | | Franklin Resources, Inc. | | | 54,408 | | | |
| | 2,000 | | | Invesco, Ltd. | | | 63,600 | | | |
| | 1,000 | | | Legg Mason, Inc. | | | 31,010 | | | |
| | | | | | | | 997,822 | | | |
| Life and Health Insurance – 0.7% | | | | | | |
| | 1,400 | | | AFLAC, Inc. | | | 81,368 | | | |
| | 1,000 | | | Lincoln National Corp. | | | 36,470 | | | |
| | 1,700 | | | Principal Financial Group, Inc. | | | 63,665 | | | |
| | 2,000 | | | Protective Life Corp. | | | 76,820 | | | |
| | 1,800 | | | StanCorp Financial Group, Inc. | | | 88,938 | | | |
| | 3,700 | | | Torchmark Corp. | | | 241,018 | | | |
| | 1,700 | | | Unum Group | | | 49,929 | | | |
| | | | | | | | 638,208 | | | |
| Linen Supply & Related Items – 0.1% | | | | | | |
| | 1,200 | | | Cintas Corp. | | | 54,648 | | | |
| Machinery – Construction and Mining – 0% | | | | | | |
| | 1,500 | | | Terex Corp.* | | | 39,450 | | | |
| Machinery – Electrical – 0.1% | | | | | | |
| | 800 | | | Regal-Beloit Corp. | | | 51,872 | | | |
| Machinery – General Industrial – 0.5% | | | | | | |
| | 1,100 | | | Gardner Denver, Inc. | | | 82,698 | | | |
| | 4,800 | | | IDEX Corp. | | | 258,288 | | | |
| | 2,400 | | | Zebra Technologies Corp. – Class A* | | | 104,256 | | | |
| | | | | | | | 445,242 | | | |
| Machinery – Pumps – 0% | | | | | | |
| | 600 | | | Flowserve Corp. | | | 32,406 | | | |
| Medical – Biomedical and Genetic – 0.3% | | | | | | |
| | 700 | | | Bio-Rad Laboratories, Inc. – Class A* | | | 78,540 | | | |
| | 1,900 | | | Life Technologies Corp.* | | | 140,619 | | | |
| | | | | | | | 219,159 | | | |
| Medical – Drugs – 3.0% | | | | | | |
| | 2,200 | | | Abbott Laboratories | | | 76,736 | | | |
| | 2,000 | | | AbbVie, Inc. | | | 82,680 | | | |
| | 4,800 | | | Bristol-Myers Squibb Co. | | | 214,512 | | | |
| | 9,200 | | | Eli Lilly & Co. | | | 451,904 | | | |
| | 1,300 | | | Endo Health Solutions, Inc.* | | | 47,827 | | | |
| | 1,100 | | | Forest Laboratories, Inc.* | | | 45,100 | | | |
| | 3,700 | | | Johnson & Johnson | | | 317,682 | | | |
| | 7,675 | | | Merck & Co., Inc. | | | 356,504 | | | |
| | 35,771 | | | Pfizer, Inc. | | | 1,001,945 | | | |
| | | | | | | | 2,594,890 | | | |
| Medical – Generic Drugs – 0.1% | | | | | | |
| | 1,500 | | | Mylan, Inc.* | | | 46,545 | | | |
| Medical – HMO – 1.3% | | | | | | |
| | 6,690 | | | Aetna, Inc. | | | 425,083 | | | |
| | 3,200 | | | Cigna Corp. | | | 231,968 | | | |
| | 1,700 | | | Health Net, Inc.* | | | 54,094 | | | |
| | 5,600 | | | UnitedHealth Group, Inc. | | | 366,688 | | | |
| | 600 | | | WellPoint, Inc. | | | 49,104 | | | |
| | | | | | | | 1,126,937 | | | |
| Medical – Hospitals – 1.3% | | | | | | |
| | 5,500 | | | Community Health Systems, Inc. | | | 257,840 | | | |
| | 2,800 | | | HCA Holdings, Inc. | | | 100,968 | | | |
| | 10,800 | | | Health Management Associates, Inc. – Class A* | | | 169,776 | | | |
| | 1,500 | | | LifePoint Hospitals, Inc.* | | | 73,260 | | | |
| | 6,200 | | | Tenet Healthcare Corp.* | | | 285,820 | | | |
| | 3,500 | | | Universal Health Services, Inc. – Class B | | | 234,360 | | | |
| | | | | | | | 1,122,024 | | | |
| Medical – Wholesale Drug Distributors – 0.3% | | | | | | |
| | 4,900 | | | Cardinal Health, Inc. | | | 231,280 | | | |
| Medical Information Systems – 0.1% | | | | | | |
| | 5,300 | | | Allscripts Healthcare Solutions, Inc.* | | | 68,582 | | | |
| | | | | | | | | | | |
See Notes to Schedules of Investments and Other Information and Notes to Financial Statements.
Janus Mathematical Funds | 53
INTECH U.S. Value Fund
Schedule of Investments
As of June 30, 2013
| | | | | | | | | | | |
| Shares | | Value | | | |
| |
| Medical Instruments – 0.8% | | | | | | |
| | 63,100 | | | Boston Scientific Corp.* | | $ | 584,937 | | | |
| | 500 | | | Medtronic, Inc. | | | 25,735 | | | |
| | 900 | | | St. Jude Medical, Inc. | | | 41,067 | | | |
| | | | | | | | 651,739 | | | |
| Medical Labs and Testing Services – 0.2% | | | | | | |
| | 2,500 | | | Covance, Inc.* | | | 190,350 | | | |
| Medical Products – 1.5% | | | | | | |
| | 2,600 | | | Baxter International, Inc. | | | 180,102 | | | |
| | 400 | | | Becton, Dickinson and Co. | | | 39,532 | | | |
| | 2,600 | | | CareFusion Corp.* | | | 95,810 | | | |
| | 1,300 | | | Cooper Cos., Inc. | | | 154,765 | | | |
| | 1,100 | | | Covidien PLC (U.S. Shares) | | | 69,124 | | | |
| | 1,200 | | | Henry Schein, Inc.* | | | 114,900 | | | |
| | 2,400 | | | Hill-Rom Holdings, Inc. | | | 80,832 | | | |
| | 3,400 | | | Sirona Dental Systems, Inc.* | | | 223,992 | | | |
| | 1,900 | | | Stryker Corp. | | | 122,892 | | | |
| | 1,300 | | | Teleflex, Inc. | | | 100,737 | | | |
| | 1,000 | | | Zimmer Holdings, Inc. | | | 74,940 | | | |
| | | | | | | | 1,257,626 | | | |
| Metal – Copper – 0.1% | | | | | | |
| | 3,830 | | | Freeport-McMoRan Copper & Gold, Inc. | | | 105,746 | | | |
| Metal Processors and Fabricators – 0.2% | | | | | | |
| | 3,400 | | | Timken Co. | | | 191,352 | | | |
| Multi-Line Insurance – 2.6% | | | | | | |
| | 3,800 | | | ACE, Ltd. (U.S. Shares) | | | 340,024 | | | |
| | 8,900 | | | Allstate Corp. | | | 428,268 | | | |
| | 2,500 | | | American Financial Group, Inc. | | | 122,275 | | | |
| | 3,100 | | | American International Group, Inc. | | | 138,570 | | | |
| | 1,900 | | | Assurant, Inc. | | | 96,729 | | | |
| | 4,900 | | | Cincinnati Financial Corp. | | | 224,910 | | | |
| | 15,300 | | | Genworth Financial, Inc. – Class A* | | | 174,573 | | | |
| | 8,500 | | | Hartford Financial Services Group, Inc. | | | 262,820 | | | |
| | 1,900 | | | Loews Corp. | | | 84,360 | | | |
| | 15,000 | | | Old Republic International Corp. | | | 193,050 | | | |
| | 5,600 | | | XL Group PLC | | | 169,792 | | | |
| | | | | | | | 2,235,371 | | | |
| Multimedia – 1.6% | | | | | | |
| | 8,400 | | | News Corp. – Class A | | | 273,840 | | | |
| | 3,000 | | | Thomson Reuters Corp. | | | 97,710 | | | |
| | 11,400 | | | Time Warner, Inc. | | | 659,148 | | | |
| | 5,900 | | | Walt Disney Co. | | | 372,585 | | | |
| | | | | | | | 1,403,283 | | | |
| Networking Products – 0.7% | | | | | | |
| | 23,100 | | | Cisco Systems, Inc. | | | 561,561 | | | |
| Non-Hazardous Waste Disposal – 0.4% | | | | | | |
| | 6,600 | | | Covanta Holding Corp. | | | 132,132 | | | |
| | 3,500 | | | Republic Services, Inc. | | | 118,790 | | | |
| | 1,700 | | | Waste Connections, Inc. | | | 69,938 | | | |
| | 1,400 | | | Waste Management, Inc. | | | 56,462 | | | |
| | | | | | | | 377,322 | | | |
| Office Automation and Equipment – 0.1% | | | | | | |
| | 2,100 | | | Pitney Bowes, Inc. | | | 30,828 | | | |
| | 7,500 | | | Xerox Corp. | | | 68,025 | | | |
| | | | | | | | 98,853 | | | |
| Office Supplies and Forms – 0.2% | | | | | | |
| | 4,100 | | | Avery Dennison Corp. | | | 175,316 | | | |
| Oil – Field Services – 0.2% | | | | | | |
| | 3,000 | | | Halliburton Co. | | | 125,160 | | | |
| | 2,100 | | | Superior Energy Services, Inc.* | | | 54,474 | | | |
| | | | | | | | 179,634 | | | |
| Oil and Gas Drilling – 0.4% | | | | | | |
| | 1,900 | | | Diamond Offshore Drilling, Inc. | | | 130,701 | | | |
| | 2,200 | | | Helmerich & Payne, Inc. | | | 137,390 | | | |
| | 4,300 | | | Patterson-UTI Energy, Inc. | | | 83,227 | | | |
| | | | | | | | 351,318 | | | |
| Oil Companies – Exploration and Production – 0.6% | | | | | | |
| | 1,200 | | | Cimarex Energy Co. | | | 77,988 | | | |
| | 3,093 | | | ConocoPhillips | | | 187,126 | | | |
| | 1,000 | | | EQT Corp. | | | 79,370 | | | |
| | 1,800 | | | Noble Energy, Inc. | | | 108,072 | | | |
| | 2,500 | | | QEP Resources, Inc. | | | 69,450 | | | |
| | 1,100 | | | Ultra Petroleum Corp. (U.S. Shares)* | | | 21,802 | | | |
| | | | | | | | 543,808 | | | |
| Oil Companies – Integrated – 6.1% | | | | | | |
| | 9,600 | | | Chevron Corp. | | | 1,136,064 | | | |
| | 34,029 | | | Exxon Mobil Corp. | | | 3,074,520 | | | |
| | 3,900 | | | Hess Corp. | | | 259,311 | | | |
| | 2,500 | | | Marathon Oil Corp. | | | 86,450 | | | |
| | 2,200 | | | Murphy Oil Corp. | | | 133,958 | | | |
| | 8,896 | | | Phillips 66 | | | 524,064 | | | |
| | | | | | | | 5,214,367 | | | |
| Oil Field Machinery and Equipment – 0% | | | | | | |
| | 400 | | | Cameron International Corp.* | | | 24,464 | | | |
| Oil Refining and Marketing – 3.1% | | | | | | |
| | 3,000 | | | Cheniere Energy, Inc.* | | | 83,280 | | | |
| | 9,800 | | | HollyFrontier Corp. | | | 419,244 | | | |
| | 14,950 | | | Marathon Petroleum Corp. | | | 1,062,347 | | | |
| | 6,200 | | | Tesoro Corp. | | | 324,384 | | | |
| | 21,400 | | | Valero Energy Corp. | | | 744,078 | | | |
| | | | | | | | 2,633,333 | | | |
| Paper and Related Products – 0.4% | | | | | | |
| | 3,000 | | | International Paper Co. | | | 132,930 | | | |
| | 5,900 | | | MeadWestvaco Corp. | | | 201,249 | | | |
| | | | | | | | 334,179 | | | |
| Pharmacy Services – 0.2% | | | | | | |
| | 2,700 | | | Omnicare, Inc. | | | 128,817 | | | |
| Physical Practice Management – 0.2% | | | | | | |
| | 2,200 | | | MEDNAX, Inc.* | | | 201,476 | | | |
| Pipelines – 0.1% | | | | | | |
| | 3,400 | | | Spectra Energy Corp. | | | 117,164 | | | |
| Power Converters and Power Supply Equipment – 0% | | | | | | |
| | 100 | | | Hubbell, Inc. – Class B | | | 9,900 | | | |
| Printing – Commercial – 0.1% | | | | | | |
| | 4,400 | | | R.R. Donnelley & Sons Co. | | | 61,644 | | | |
| Professional Sports – 0.2% | | | | | | |
| | 2,200 | | | Madison Square Garden Co. – Class A* | | | 130,350 | | | |
| Property and Casualty Insurance – 3.3% | | | | | | |
| | 100 | | | Alleghany Corp.* | | | 38,331 | | | |
| | 6,500 | | | Arch Capital Group, Ltd.* | | | 334,165 | | | |
| | 2,200 | | | Chubb Corp. | | | 186,230 | | | |
| | 18,400 | | | Fidelity National Financial, Inc. – Class A | | | 438,104 | | | |
| | 1,700 | | | Hanover Insurance Group, Inc. | | | 83,181 | | | |
See Notes to Schedules of Investments and Other Information and Notes to Financial Statements.
54 | JUNE 30, 2013
Schedule of Investments
As of June 30, 2013
| | | | | | | | | | | |
| Shares | | Value | | | |
| |
| Property and Casualty Insurance – (continued) | | | | | | |
| | 6,000 | | | HCC Insurance Holdings, Inc. | | $ | 258,660 | | | |
| | 200 | | | Markel Corp.* | | | 105,390 | | | |
| | 26,600 | | | Progressive Corp. | | | 676,172 | | | |
| | 5,800 | | | Travelers Cos., Inc. | | | 463,536 | | | |
| | 3,500 | | | W.R. Berkley Corp. | | | 143,010 | | | |
| | 200 | | | White Mountains Insurance Group, Ltd. | | | 114,988 | | | |
| | | | | | | | 2,841,767 | | | |
| Publishing – Newspapers – 0.2% | | | | | | |
| | 5,000 | | | Gannett Co., Inc. | | | 122,300 | | | |
| | 100 | | | Washington Post Co. – Class B | | | 48,377 | | | |
| | | | | | | | 170,677 | | | |
| Publishing – Periodicals – 0.1% | | | | | | |
| | 1,800 | | | Nielsen Holdings N.V. | | | 60,462 | | | |
| Racetracks – 0.1% | | | | | | |
| | 1,400 | | | Penn National Gaming, Inc.* | | | 74,004 | | | |
| Real Estate Management/Services – 0.1% | | | | | | |
| | 1,100 | | | Jones Lang LaSalle, Inc. | | | 100,254 | | | |
| | 400 | | | Realogy Holdings Corp. | | | 19,216 | | | |
| | | | | | | | 119,470 | | | |
| Real Estate Operating/Development – 0.1% | | | | | | |
| | 500 | | | Howard Hughes Corp.* | | | 56,045 | | | |
| Reinsurance – 2.4% | | | | | | |
| | 600 | | | Allied World Assurance Co. Holdings A.G. | | | 54,906 | | | |
| | 3,200 | | | Aspen Insurance Holdings, Ltd. | | | 118,688 | | | |
| | 1,100 | | | Axis Capital Holdings, Ltd. | | | 50,358 | | | |
| | 10,500 | | | Berkshire Hathaway, Inc. – Class B* | | | 1,175,160 | | | |
| | 1,100 | | | Endurance Specialty Holdings, Ltd. | | | 56,595 | | | |
| | 1,700 | | | Everest Re Group, Ltd. | | | 218,042 | | | |
| | 1,900 | | | PartnerRe, Ltd. | | | 172,064 | | | |
| | 1,500 | | | RenaissanceRe Holdings, Ltd. | | | 130,185 | | | |
| | 1,700 | | | Validus Holdings, Ltd. | | | 61,404 | | | |
| | | | | | | | 2,037,402 | | | |
| REIT – Apartments – 0.3% | | | | | | |
| | 2,600 | | | American Campus Communities, Inc. | | | 105,716 | | | |
| | 2,700 | | | Apartment Investment & Management Co. – Class A | | | 81,108 | | | |
| | 300 | | | BRE Properties, Inc. | | | 15,006 | | | |
| | 600 | | | Camden Property Trust | | | 41,484 | | | |
| | 500 | | | Home Properties, Inc. | | | 32,685 | | | |
| | | | | | | | 275,999 | | | |
| REIT – Diversified – 0.8% | | | | | | |
| | 4,133 | | | Corrections Corp. of America | | | 139,985 | | | |
| | 2,700 | | | Duke Realty Corp. | | | 42,093 | | | |
| | 1,500 | | | Liberty Property Trust | | | 55,440 | | | |
| | 1,100 | | | Rayonier, Inc. | | | 60,929 | | | |
| | 14,840 | | | Weyerhaeuser Co. | | | 422,791 | | | |
| | | | | | | | 721,238 | | | |
| REIT – Health Care – 1.3% | | | | | | |
| | 13,200 | | | HCP, Inc. | | | 599,808 | | | |
| | 1,300 | | | Heath Care REIT, Inc. | | | 87,139 | | | |
| | 6,000 | | | Senior Housing Properties Trust | | | 155,580 | | | |
| | 3,462 | | | Ventas, Inc. | | | 240,471 | | | |
| | | | | | | | 1,082,998 | | | |
| REIT – Hotels – 0.1% | | | | | | |
| | 2,600 | | | Hospitality Properties Trust | | | 68,328 | | | |
| REIT – Mortgage – 0.1% | | | | | | |
| | 300 | | | American Capital Agency Corp. | | | 6,897 | | | |
| | 13,900 | | | MFA Financial, Inc. | | | 117,455 | | | |
| | | | | | | | 124,352 | | | |
| REIT – Multi-Housing – 0% | | | | | | |
| | 500 | | | Equity Lifestyle Properties, Inc. | | | 39,295 | | | |
| REIT – Office Property – 0.7% | | | | | | |
| | 4,400 | | | BioMed Realty Trust, Inc. | | | 89,012 | | | |
| | 3,300 | | | Brandywine Realty Trust | | | 44,616 | | | |
| | 8,100 | | | CommonWealth REIT | | | 187,272 | | | |
| | 1,900 | | | Corporate Office Properties Trust | | | 48,450 | | | |
| | 1,400 | | | Douglas Emmett, Inc. | | | 34,930 | | | |
| | 1,400 | | | Kilroy Realty Corp. | | | 74,214 | | | |
| | 6,100 | | | Piedmont Office Realty Trust, Inc. – Class A | | | 109,068 | | | |
| | 300 | | | SL Green Realty Corp. | | | 26,457 | | | |
| | | | | | | | 614,019 | | | |
| REIT – Regional Malls – 0.5% | | | | | | |
| | 2,200 | | | CBL & Associates Properties, Inc. | | | 47,124 | | | |
| | 3,900 | | | General Growth Properties, Inc. | | | 77,493 | | | |
| | 500 | | | Macerich Co. | | | 30,485 | | | |
| | 1,223 | | | Simon Property Group, Inc. | | | 193,136 | | | |
| | 700 | | | Taubman Centers, Inc. | | | 52,605 | | | |
| | | | | | | | 400,843 | | | |
| REIT – Shopping Centers – 0.2% | | | | | | |
| | 7,000 | | | DDR Corp. | | | 116,550 | | | |
| | 1,100 | | | Kimco Realty Corp. | | | 23,573 | | | |
| | 1,000 | | | Weingarten Realty Investors | | | 30,770 | | | |
| | | | | | | | 170,893 | | | |
| REIT – Single Tenant – 0.4% | | | | | | |
| | 1,900 | | | National Retail Properties, Inc. | | | 65,360 | | | |
| | 5,600 | | | Realty Income Corp. | | | 234,752 | | | |
| | | | | | | | 300,112 | | | |
| REIT – Storage – 0.1% | | | | | | |
| | 1,500 | | | Extra Space Storage, Inc. | | | 62,895 | | | |
| REIT – Warehouse and Industrial – 0.2% | | | | | | |
| | 4,630 | | | Prologis, Inc. | | | 174,644 | | | |
| Rental Auto/Equipment – 0.1% | | | | | | |
| | 4,900 | | | Hertz Global Holdings, Inc.* | | | 121,520 | | | |
| Retail – Apparel and Shoe – 0.3% | | | | | | |
| | 6,000 | | | Abercrombie & Fitch Co. – Class A | | | 271,500 | | | |
| | 200 | | | PVH Corp. | | | 25,010 | | | |
| | | | | | | | 296,510 | | | |
| Retail – Automobile – 0.3% | | | | | | |
| | 6,300 | | | CarMax, Inc.* | | | 290,808 | | | |
| Retail – Building Products – 0.4% | | | | | | |
| | 7,700 | | | Lowe’s Cos., Inc. | | | 314,930 | | | |
| Retail – Computer Equipment – 0.1% | | | | | | |
| | 1,200 | | | GameStop Corp. – Class A | | | 50,436 | | | |
| Retail – Consumer Electronics – 0.3% | | | | | | |
| | 9,300 | | | Best Buy Co., Inc. | | | 254,169 | | | |
| Retail – Discount – 0.4% | | | | | | |
| | 500 | | | Target Corp. | | | 34,430 | | | |
| | 4,400 | | | Wal-Mart Stores, Inc. | | | 327,756 | | | |
| | | | | | | | 362,186 | | | |
| | | | | | | | | | | |
See Notes to Schedules of Investments and Other Information and Notes to Financial Statements.
Janus Mathematical Funds | 55
INTECH U.S. Value Fund
Schedule of Investments
As of June 30, 2013
| | | | | | | | | | | |
| Shares | | Value | | | |
| |
| Retail – Drug Store – 0.6% | | | | | | |
| | 2,800 | | | CVS Caremark Corp. | | $ | 160,104 | | | |
| | 8,200 | | | Walgreen Co. | | | 362,440 | | | |
| | | | | | | | 522,544 | | | |
| Retail – Jewelry – 0.2% | | | | | | |
| | 1,800 | | | Signet Jewelers, Ltd. | | | 121,374 | | | |
| | 400 | | | Tiffany & Co. | | | 29,136 | | | |
| | | | | | | | 150,510 | | | |
| Retail – Mail Order – 0% | | | | | | |
| | 500 | | | Williams-Sonoma, Inc. | | | 27,945 | | | |
| Retail – Miscellaneous/Diversified – 0.1% | | | | | | |
| | 1,744 | | | CST Brands, Inc. | | | 53,733 | | | |
| Retail – Office Supplies – 0.4% | | | | | | |
| | 19,900 | | | Staples, Inc. | | | 315,614 | | | |
| Retail – Regional Department Stores – 0.1% | | | | | | |
| | 1,300 | | | Macy’s, Inc. | | | 62,400 | | | |
| Savings/Loan/Thrifts – 0.6% | | | | | | |
| | 6,700 | | | Capitol Federal Financial, Inc. | | | 81,338 | | | |
| | 21,200 | | | Hudson City Bancorp, Inc. | | | 194,192 | | | |
| | 10,300 | | | New York Community Bancorp, Inc. | | | 144,200 | | | |
| | 3,300 | | | Washington Federal, Inc. | | | 62,304 | | | |
| | | | | | | | 482,034 | | | |
| Schools – 0.1% | | | | | | |
| | 2,000 | | | DeVry, Inc. | | | 62,040 | | | |
| Security Services – 0.6% | | | | | | |
| | 13,900 | | | ADT Corp. | | | 553,915 | | | |
| Semiconductor Components/Integrated Circuits – 0.2% | | | | | | |
| | 2,500 | | | Analog Devices, Inc. | | | 112,650 | | | |
| | 4,800 | | | Marvell Technology Group, Ltd. | | | 56,208 | | | |
| | | | | | | | 168,858 | | | |
| Semiconductor Equipment – 1.0% | | | | | | |
| | 27,700 | | | Applied Materials, Inc. | | | 413,007 | | | |
| | 4,300 | | | KLA-Tencor Corp. | | | 239,639 | | | |
| | 3,700 | | | Lam Research Corp.* | | | 164,058 | | | |
| | 4,200 | | | Teradyne, Inc.* | | | 73,794 | | | |
| | | | | | | | 890,498 | | | |
| Shipbuilding – 0.1% | | | | | | |
| | 2,000 | | | Huntington Ingalls Industries, Inc. | | | 112,960 | | | |
| Soap and Cleaning Preparations – 0.2% | | | | | | |
| | 2,800 | | | Church & Dwight Co., Inc. | | | 172,788 | | | |
| Steel – Producers – 0.1% | | | | | | |
| | 1,200 | | | Reliance Steel & Aluminum Co. | | | 78,672 | | | |
| | 3,000 | | | Steel Dynamics, Inc. | | | 44,730 | | | |
| | | | | | | | 123,402 | | | |
| Super-Regional Banks – 1.8% | | | | | | |
| | 900 | | | Capital One Financial Corp. | | | 56,529 | | | |
| | 8,000 | | | Fifth Third Bancorp | | | 144,400 | | | |
| | 2,900 | | | KeyCorp | | | 32,016 | | | |
| | 4,300 | | | SunTrust Banks, Inc. | | | 135,751 | | | |
| | 14,700 | | | U.S. Bancorp | | | 531,405 | | | |
| | 14,961 | | | Wells Fargo & Co. | | | 617,440 | | | |
| | | | | | | | 1,517,541 | | | |
| Telecommunication Equipment – 0.4% | | | | | | |
| | 600 | | | Harris Corp. | | | 29,550 | | | |
| | 16,200 | | | Juniper Networks, Inc.* | | | 312,822 | | | |
| | | | | | | | 342,372 | | | |
| Telecommunication Equipment – Fiber Optics – 0.1% | | | | | | |
| | 7,900 | | | JDS Uniphase Corp.* | | | 113,602 | | | |
| Telecommunication Services – 0.3% | | | | | | |
| | 7,700 | | | Amdocs, Ltd. (U.S. Shares) | | | 285,593 | | | |
| Telephone – Integrated – 1.4% | | | | | | |
| | 23,010 | | | AT&T, Inc. | | | 814,554 | | | |
| | 9,462 | | | CenturyLink, Inc. | | | 334,482 | | | |
| | 2,700 | | | Frontier Communications Corp. | | | 10,935 | | | |
| | | | | | | | 1,159,971 | | | |
| Television – 0.8% | | | | | | |
| | 6,600 | | | CBS Corp. – Class B | | | 322,542 | | | |
| | 2,774 | | | Liberty Media Corp. | | | 351,632 | | | |
| | | | | | | | 674,174 | | | |
| Textile-Home Furnishings – 0.1% | | | | | | |
| | 1,000 | | | Mohawk Industries, Inc.* | | | 112,490 | | | |
| Tobacco – 0.4% | | | | | | |
| | 4,600 | | | Altria Group, Inc. | | | 160,954 | | | |
| | 2,000 | | | Philip Morris International, Inc. | | | 173,240 | | | |
| | 600 | | | Reynolds American, Inc. | | | 29,022 | | | |
| | | | | | | | 363,216 | | | |
| Tools – Hand Held – 0.2% | | | | | | |
| | 700 | | | Snap-on, Inc. | | | 62,566 | | | |
| | 1,155 | | | Stanley Black & Decker, Inc. | | | 89,282 | | | |
| | | | | | | | 151,848 | | | |
| Toys – 0.2% | | | | | | |
| | 3,900 | | | Mattel, Inc. | | | 176,709 | | | |
| Transportation – Equipment & Leasing – 0.1% | | | | | | |
| | 1,000 | | | GATX Corp. | | | 47,430 | | | |
| Transportation – Marine – 0.1% | | | | | | |
| | 1,500 | | | Kirby Corp.* | | | 119,310 | | | |
| Transportation – Railroad – 0.2% | | | | | | |
| | 1,100 | | | CSX Corp. | | | 25,509 | | | |
| | 800 | | | Kansas City Southern | | | 84,768 | | | |
| | 500 | | | Norfolk Southern Corp. | | | 36,325 | | | |
| | | | | | | | 146,602 | | | |
| Transportation – Services – 1.0% | | | | | | |
| | 800 | | | Expeditors International of Washington, Inc. | | | 30,408 | | | |
| | 6,700 | | | FedEx Corp. | | | 660,486 | | | |
| | 2,900 | | | Ryder System, Inc. | | | 176,291 | | | |
| | | | | | | | 867,185 | | | |
| Transportation – Truck – 0% | | | | | | |
| | 600 | | | Con-way, Inc. | | | 23,376 | | | |
| Veterinary Diagnostics – 0.1% | | | | | | |
| | 3,000 | | | VCA Antech, Inc.* | | | 78,270 | | | |
| Water – 0.5% | | | | | | |
| | 7,800 | | | American Water Works Co., Inc. | | | 321,594 | | | |
| | 2,700 | | | Aqua America, Inc. | | | 84,483 | | | |
| | | | | | | | 406,077 | | | |
See Notes to Schedules of Investments and Other Information and Notes to Financial Statements.
56 | JUNE 30, 2013
Schedule of Investments
As of June 30, 2013
| | | | | | | | | | | |
| Shares | | Value | | | |
| |
| Web Portals/Internet Service Providers – 0.9% | | | | | | |
| | 2,800 | | | AOL, Inc. | | $ | 102,144 | | | |
| | 27,300 | | | Yahoo!, Inc.* | | | 685,503 | | | |
| | | | | | | | 787,647 | | | |
| X-Ray Equipment – 0.2% | | | | | | |
| | 9,200 | | | Hologic, Inc.* | | | 177,560 | | | |
| |
| |
| Total Common Stock (cost $70,269,638) | | | 85,541,184 | | | |
| |
| |
| Money Market – 0.3% | | | | | | |
| | 289,000 | | | Janus Cash Liquidity Fund LLC, 0%£
(cost $289,000) | | | 289,000 | | | |
| |
| |
| Total Investments (total cost $70,558,638) – 99.9% | | | 85,830,184 | | | |
| |
| |
| Cash, Receivables and Other Assets, net of Liabilities – 0.1% | | | 65,653 | | | |
| |
| |
| Net Assets – 100% | | $ | 85,895,837 | | | |
| |
| |
Summary of Investments by Country – (Long Positions) (unaudited)
| | | | | | | | | |
| | | | | | % of Investment
| |
| Country | | Value | | | Securities | |
| |
| |
| Canada | | $ | 97,710 | | | | 0.1% | |
| Germany | | | 133,397 | | | | 0.2% | |
| Panama | | | 91,784 | | | | 0.1% | |
United States†† | | | 85,507,293 | | | | 99.6% | |
| |
| |
| Total | | $ | 85,830,184 | | | | 100.0% | |
| | | |
| †† | | Includes Cash Equivalents of 0.3%. |
See Notes to Schedules of Investments and Other Information and Notes to Financial Statements.
Janus Mathematical Funds | 57
Notes to Schedules of Investments and Other Information
| | |
| Morgan Stanley Capital International EAFE® Index | | A free float-adjusted market capitalization weighted index designed to measure developed market equity performance. The MSCI EAFE® Index is composed of companies representative of the market structure of developed market countries. The index includes reinvestment of dividends, net of foreign withholding taxes. |
| |
| Morgan Stanley Capital International World High Dividend Yield Index | | An index designed to reflect the performance of the high dividend yield securities contained within the broader MSCI World IndexSM. The index includes large and mid cap stocks from developed markets across the Americas, Asia-Pacific and Europe. |
| |
| Morgan Stanley Capital International World IndexSM | | A market capitalization weighted index composed of companies representative of the market structure of developed market countries in North America, Europe, and the Asia/Pacific Region. The index includes reinvestment of dividends, net of foreign withholding taxes. |
| |
| Russell 1000® Growth Index | | Measures the performance of those Russell 1000® Index companies with higher price-to-book ratios and higher forecasted growth values. |
| |
| Russell 1000® Value Index | | Measures the performance of those Russell 1000® Index companies with lower price-to-book ratios and lower forecasted growth values. |
| |
| S&P 500® Index | | A commonly recognized, market-capitalization weighted index of 500 widely held equity securities, designed to measure broad U.S. equity performance. |
| |
| A/S | | Aktieselskab: Danish term for a stock-based corporation. |
| |
| A.B. | | Aktiebolag: Swedish stock company. |
| |
| A.G. | | Aktiengesellschaft: German term for Public Limited Company. |
| |
| A.S.A. | | Allmennaksjeselskap: Norwegian term for Public Limited Company. |
| |
| Abp | | Publikt Aktiebolag: Finnish term for a Public Company. |
| |
| BM | | Beeravon Mugbal: Hebrew term for Limited Liability Company. |
| |
| CDI | | Clearing House Electronic Subregister System Depositary Interest |
| |
| FDR | | Fixed Depositary Receipt |
| |
| K.K. | | Kabushiki Kaisha: Japanese term for public Limited Liability Company. |
| |
| KGaA | | Kommanditgesellschaft Auf Aktien: German term for Limited Partnership. |
| |
| LLC | | Limited Liability Company |
| |
| N.V. | | Naamloze Vennootschap: Dutch term for Public Limited Liability Company. |
| |
| Oyj | | Osakeyhtio: Finnish term for limited company. |
| |
| PLC | | Public Limited Company |
| |
| REIT | | Real Estate Investment Trust |
| |
| S.A. | | Sociedad Anonima: Spanish term for publicly-traded company. |
| |
| S.C.A. | | Societe en Commandite par Actions: French term for Limited Partnership. |
| |
| S.E. | | Societas Europoea: a public European Company. |
| |
| SDR | | Swedish Depositary Receipt |
| |
| SGPS | | Sociedad Gestora de Participacoes Sociais: Portuguese term for holding corporation. |
| |
| SpA | | Societa per Azioni: Italian term for Public Limited Company. |
| |
| U.S. Shares | | Securities of foreign companies trading on an American Stock Exchange. |
| | | |
| * | | Non-income producing security. |
£ The Funds may invest in certain securities that are considered affiliated companies. As defined by the Investment Company Act of 1940, as amended, an affiliated company is one in which the fund owns 5% or more of the outstanding voting securities, or a company which is under common ownership or control. Based on the Fund’s relative ownership, the following securities were considered affiliated companies for all or some portion of the year
58 | JUNE 30, 2013
ended June 30, 2013. Except for the value at year end, all other information in the table is for the year ended June 30, 2013.
| | | | | | | | | | | | | | | | | | | | | | |
| | | Purchases | | Sales | | Realized
| | Dividend
| | Value
| | |
| | | Shares | | Cost | | Shares | | Cost | | Gain/(Loss) | | Income | | at 6/30/13 | | |
| |
INTECH Global Dividend Fund | | | | | | | | | | | | | | | | | | | | | |
| Janus Cash Liquidity Fund LLC | | 6,163,219 | | $ | 6,163,219 | | (6,018,219) | | $ | (6,018,219) | | $ | – | | $ | 249 | | $ | 205,000 | | |
| |
| |
INTECH International Fund | | | | | | | | | | | | | | | | | | | | | |
| Janus Cash Liquidity Fund LLC | | 34,674,987 | | | 34,674,987 | | (34,909,056) | | | (34,909,056) | | | – | | | 1,034 | | | – | | |
| |
| |
INTECH U.S. Core Fund | | | | | | | | | | | | | | | | | | | | | |
| Janus Cash Liquidity Fund LLC | | 61,660,776 | | | 61,660,776 | | (60,326,111) | | | (60,326,111) | | | – | | | 3,467 | | | 3,093,665 | | |
| |
| |
INTECH U.S. Growth Fund | | | | | | | | | | | | | | | | | | | | | |
| Janus Cash Liquidity Fund LLC | | 37,996,321 | | | 37,996,321 | | (38,084,321) | | | (38,084,321) | | | – | | | 1,858 | | | 1,107,000 | | |
| |
| |
INTECH U.S. Value Fund | | | | | | | | | | | | | | | | | | | | | |
| Janus Cash Liquidity Fund LLC | | 10,732,555 | | | 10,732,555 | | (11,111,555) | | | (11,111,555) | | | – | | | 749 | | | 289,000 | | |
| |
| |
The following is a summary of the inputs that were used to value the Funds’ investments in securities and other financial instruments as of June 30, 2013. See Notes to Financial Statements for more information.
Valuation Inputs Summary (as of June 30, 2013)
| | | | | | | | | | | | |
| | | | | Level 2 – Other Significant
| | Level 3 – Significant
| | |
| | | Level 1 – Quoted Prices | | Observable Inputs | | Unobservable Inputs | | |
| |
Investments in Securities: | | | | | | | | | | | |
| INTECH Global Dividend Fund | | | | | | | | | | | |
Common Stock | | | | | | | | | | | |
| Building Products – Cement and Aggregate | | $ | 14,572 | | $ | 14,964 | | $ | – | | |
| Cellular Telecommunications | | | 33,841 | | | 26,312 | | | – | | |
| Satellite Telecommunications | | | 33,018 | | | 28,061 | | | – | | |
| All Other | | | 9,024,605 | | | – | | | – | | |
| | | | | | | | | | | | |
Preferred Stock | | | – | | | 45,253 | | | – | | |
| | | | | | | | | | | | |
Right | | | 433 | | | – | | | – | | |
| | | | | | | | | | | | |
Money Market | | | – | | | 205,000 | | | – | | |
| | | | | | | | | | | | |
| Total Investments in Securities | | $ | 9,106,469 | | $ | 319,590 | | $ | – | | |
| |
| |
Investments in Securities: | | | | | | | | | | | |
| INTECH International Fund | | | | | | | | | | | |
Common Stock | | | | | | | | | | | |
| Building Products – Cement and Aggregate | | $ | 868,379 | | $ | 39,432 | | $ | – | | |
| All Other | | | 59,438,416 | | | – | | | – | | |
| | | | | | | | | | | | |
Preferred Stock | | | – | | | 218,996 | | | – | | |
| | | | | | | | | | | | |
Rights | | | 684 | | | – | | | – | | |
| | | | | | | | | | | | |
| Total Investments in Securities | | $ | 60,307,479 | | $ | 258,428 | | $ | – | | |
| |
| |
Investments in Securities: | | | | | | | | | | | |
| INTECH U.S. Core Fund | | | | | | | | | | | |
Common Stock | | $ | 426,886,100 | | $ | – | | $ | – | | |
| | | | | | | | | | | | |
Money Market | | | – | | | 3,093,665 | | | – | | |
| | | | | | | | | | | | |
| Total Investments in Securities | | $ | 426,886,100 | | $ | 3,093,665 | | $ | – | | |
| |
| |
Investments in Securities: | | | | | | | | | | | |
| INTECH U.S. Growth Fund | | | | | | | | | | | |
Common Stock | | $ | 260,856,737 | | $ | – | | $ | – | | |
| | | | | | | | | | | | |
Money Market | | | – | | | 1,107,000 | | | – | | |
| | | | | | | | | | | | |
| Total Investments in Securities | | $ | 260,856,737 | | $ | 1,107,000 | | $ | – | | |
| |
| |
Investments in Securities: | | | | | | | | | | | |
| INTECH U.S. Value Fund | | | | | | | | | | | |
Common Stock | | $ | 85,541,184 | | $ | – | | $ | – | | |
| | | | | | | | | | | | |
Money Market | | | – | | | 289,000 | | | – | | |
Janus Mathematical Funds | 59
Notes to Schedules of Investments and Other Information (continued)
| | | | | | | | | | | | |
| | | | | Level 2 – Other Significant
| | Level 3 – Significant
| | |
| | | Level 1 – Quoted Prices | | Observable Inputs | | Unobservable Inputs | | |
| |
| Total Investments in Securities | | $ | 85,541,184 | | $ | 289,000 | | $ | – | | |
| |
| |
60 | JUNE 30, 2013
[This page intentionally left blank.]
Janus Mathematical Funds | 61
Statements of Assets and Liabilities
| | | | | | | | | | | | | | | | | | | | | |
As of June 30, 2013
| | | | | | | | | | |
| (all numbers in thousands except net asset value per share) | | INTECH Global Dividend Fund | | INTECH International Fund | | INTECH U.S. Core Fund | | INTECH U.S. Growth Fund | | INTECH U.S. Value Fund |
|
| |
| Assets: | | | | | | | | | | | | | | | | | | | | |
| Investments at cost | | $ | 9,070 | | | $ | 56,790 | | | $ | 348,743 | | | $ | 204,677 | | | $ | 70,559 | |
| Unaffiliated investments at value | | $ | 9,221 | | | $ | 60,566 | | | $ | 426,886 | | | $ | 260,857 | | | $ | 85,541 | |
| Affiliated investments at value | | | 205 | | | | – | | | | 3,094 | | | | 1,107 | | | | 289 | |
| Cash | | | 41 | | | | – | | | | 354 | | | | 63 | | | | – | |
Cash denominated in foreign currency(1) | | | 3 | | | | 9 | | | | – | | | | – | | | | – | |
| Receivables: | | | | | | | | | | | | | | | | | | | | |
| Investments sold | | | – | | | | 330 | | | | – | | | | – | | | | – | |
| Fund shares sold | | | 3 | | | | 42 | | | | 2,718 | | | | 185 | | | | 110 | |
| Dividends | | | 26 | | | | 118 | | | | 406 | | | | 242 | | | | 95 | |
| Foreign dividend tax reclaim | | | 6 | | | | 40 | | | | – | | | | – | | | | – | |
| Due from adviser | | | 11 | | | | – | | | | – | | | | – | | | | – | |
| Non-interested Trustees’ deferred compensation | | | – | | | | 1 | | | | 7 | | | | 5 | | | | 1 | |
| Other assets | | | – | | | | – | | | | – | | | | 2 | | | | – | |
| Total Assets | | | 9,516 | | | | 61,106 | | | | 433,465 | | | | 262,461 | | | | 86,036 | |
| Liabilities: | | | | | | | | | | | | | | | | | | | | |
| Payables: | | | | | | | | | | | | | | | | | | | | |
| Due to custodian | | | – | | | | 107 | | | | – | | | | – | | | | 18 | |
| Investments purchased | | | 155 | | | | – | | | | – | | | | – | | | | – | |
| Fund shares repurchased | | | 1 | | | | 34 | | | | 107 | | | | 48 | | | | 35 | |
| Dividends | | | – | | | | – | | | | – | | | | – | | | | – | |
| Advisory fees | | | 4 | | | | 28 | | | | 212 | | | | 110 | | | | 36 | |
| Fund administration fees | | | – | | | | 1 | | | | 3 | | | | 2 | | | | 1 | |
| Internal servicing cost | | | – | | | | – | | | | 1 | | | | 1 | | | | 1 | |
| Administrative services fees | | | 1 | | | | – | | | | 45 | | | | 7 | | | | – | |
| Distribution fees and shareholder servicing fees | | | 1 | | | | – | | | | 12 | | | | 8 | | | | 2 | |
| Administrative, networking and omnibus fees | | | – | | | | – | | | | 5 | | | | 19 | | | | 3 | |
| Non-interested Trustees’ fees and expenses | | | – | | | | – | | | | 3 | | | | 2 | | | | 1 | |
| Non-interested Trustees’ deferred compensation fees | | | – | | | | 1 | | | | 7 | | | | 5 | | | | 1 | |
| Accrued expenses and other payables | | | 62 | | | | 48 | | | | 130 | | | | 93 | | | | 42 | |
| Total Liabilities | | | 224 | | | | 219 | | | | 525 | | | | 295 | | | | 140 | |
| Net Assets | | $ | 9,292 | | | $ | 60,887 | | | $ | 432,940 | | | $ | 262,166 | | | $ | 85,896 | |
See footnotes at the end of the Statements.
See Notes to Financial Statements.
62 | JUNE 30, 2013
This page intentionally left blank. The content of this page is part of a ‘Double Page Spread’ table and appears on the previous page.
63
Statements of Assets and Liabilities (continued)
| | | | | | | | | | | | | | | | | | | | | |
As of June 30, 2013
| | | | | | | | | | |
| (all numbers in thousands except net asset value per share) | | INTECH Global Dividend Fund | | INTECH International Fund | | INTECH U.S. Core Fund | | INTECH U.S. Growth Fund | | INTECH U.S. Value Fund |
|
| |
| Net Assets Consist of: | | | | | | | | | | | | | | | | | | | | |
| Capital (par value and paid-in surplus)* | | $ | 8,216 | | | $ | 59,240 | | | $ | 362,633 | | | $ | 393,591 | | | $ | 61,112 | |
| Undistributed net investment income* | | | 50 | | | | 466 | | | | 1,387 | | | | 710 | | | | 777 | |
| Undistributed net realized gain/(loss) from investment and foreign currency transactions* | | | 671 | | | | (2,589) | | | | (12,318) | | | | (189,423) | | | | 8,735 | |
| Unrealized net appreciation of investments, foreign currency translations and non-interested Trustees’ deferred compensation | | | 355 | | | | 3,770 | | | | 81,238 | | | | 57,288 | | | | 15,272 | |
| Total Net Assets | | $ | 9,292 | | | $ | 60,887 | | | $ | 432,940 | | | $ | 262,166 | | | $ | 85,896 | |
| Net Assets - Class A Shares | | $ | 1,625 | | | $ | 473 | | | $ | 16,242 | | | $ | 5,445 | | | $ | 7,348 | |
| Shares Outstanding, $0.01 Par Value (unlimited shares authorized) | | | 140 | | | | 59 | | | | 920 | | | | 324 | | | | 590 | |
Net Asset Value Per Share(2) | | $ | 11.60 | | | $ | 8.07 | | | $ | 17.66 | | | $ | 16.80 | | | $ | 12.45 | |
Maximum Offering Price Per Share(3) | | $ | 12.31 | | | $ | 8.56 | | | $ | 18.74 | | | $ | 17.82 | | | $ | 13.21 | |
| Net Assets - Class C Shares | | $ | 489 | | | $ | 113 | | | $ | 9,154 | | | $ | 3,232 | | | $ | 380 | |
| Shares Outstanding, $0.01 Par Value (unlimited shares authorized) | | | 42 | | | | 14 | | | | 520 | | | | 200 | | | | 31 | |
Net Asset Value Per Share(2) | | $ | 11.56 | | | $ | 8.14 | | | $ | 17.59 | | | $ | 16.18 | | | $ | 12.43 | |
| Net Assets - Class D Shares | | $ | 4,706 | | | | N/A | | | $ | 220,548 | | | | N/A | | | | N/A | |
| Shares Outstanding, $0.01 Par Value (unlimited shares authorized) | | | 407 | | | | N/A | | | | 12,480 | | | | N/A | | | | N/A | |
| Net Asset Value Per Share | | $ | 11.58 | | | | N/A | | | $ | 17.67 | | | | N/A | | | | N/A | |
| Net Assets - Class I Shares | | $ | 1,571 | | | $ | 59,981 | | | $ | 71,592 | | | $ | 218,980 | | | $ | 77,625 | |
| Shares Outstanding, $0.01 Par Value (unlimited shares authorized) | | | 135 | | | | 7,471 | | | | 4,049 | | | | 13,129 | | | | 6,204 | |
| Net Asset Value Per Share | | $ | 11.62 | | | $ | 8.03 | | | $ | 17.68 | | | $ | 16.68 | | | $ | 12.51 | |
| Net Assets - Class S Shares | | $ | 286 | | | $ | 118 | | | $ | 5,996 | | | $ | 18,867 | | | $ | 64 | |
| Shares Outstanding, $0.01 Par Value (unlimited shares authorized) | | | 25 | | | | 15 | | | | 339 | | | | 1,128 | | | | 5 | |
| Net Asset Value Per Share | | $ | 11.58 | | | $ | 8.09 | | | $ | 17.66 | | | $ | 16.73 | | | $ | 12.53 | |
| Net Assets - Class T Shares | | $ | 615 | | | $ | 202 | | | $ | 109,408 | | | $ | 15,642 | | | $ | 479 | |
| Shares Outstanding, $0.01 Par Value (unlimited shares authorized) | | | 53 | | | | 25 | | | | 6,192 | | | | 941 | | | | 38 | |
| Net Asset Value Per Share | | $ | 11.60 | | | $ | 8.01 | | | $ | 17.67 | | | $ | 16.62 | | | $ | 12.48 | |
| | | |
| * | | See Note 4 in Notes to Financial Statements. |
| (1) | | Includes cost of $2,904 and $9,416 for INTECH Global Dividend Fund and INTECH International Fund, respectively. |
| (2) | | Redemption price per share may be reduced for any applicable contingent deferred sales charge. |
| (3) | | Maximum offering price is computed at 100/94.25 of net asset value. |
| | | |
| | | |
See Notes to Financial Statements.
64 | JUNE 30, 2013
This page intentionally left blank. The content of this page is part of a ‘Double Page Spread’ table and appears on the previous page.
65
Statements of Operations
| | | | | | | | | | | | | | | | | | | | | | | | | |
For the year ended June 30, 2013
| | | | | | | | | | | | |
| (all numbers in thousands) | | INTECH Global Dividend Fund | | INTECH International Fund | | INTECH U.S. Core Fund | | INTECH U.S. Growth Fund | | INTECH U.S. Value Fund | | |
|
| |
| Investment Income: | | | | | | | | | | | | | | | | | | | | | | | | |
| Interest | | $ | – | | | $ | – | | | $ | 1 | | | $ | – | | | $ | – | | | | | |
| Dividends | | | 392 | | | | 1,267 | | | | 7,447 | | | | 5,157 | | | | 2,388 | | | | | |
| Dividends from affiliates | | | – | | | | 1 | | | | 3 | | | | 2 | | | | 1 | | | | | |
| Other Income | | | – | | | | 2 | | | | – | | | | – | | | | – | | | | | |
| Foreign tax withheld | | | (22) | | | | (65) | | | | (6) | | | | (10) | | | | (5) | | | | | |
| Total Investment Income | | | 370 | | | | 1,205 | | | | 7,445 | | | | 5,149 | | | | 2,384 | | | | | |
| Expenses: | | | | | | | | | | | | | | | | | | | | | | | | |
| Advisory fees | | | 49 | | | | 239 | | | | 2,209 | | | | 1,450 | | | | 501 | | | | | |
| Internal servicing expense - Class A Shares | | | – | | | | – | | | | 2 | | | | 1 | | | | 1 | | | | | |
| Internal servicing expense - Class C Shares | | | – | | | | – | | | | 2 | | | | 1 | | | | – | | | | | |
| Internal servicing expense - Class I Shares | | | – | | | | 2 | | | | 3 | | | | 18 | | | | 6 | | | | | |
| Shareholder reports expense | | | 8 | | | | 1 | | | | 80 | | | | 5 | | | | 3 | | | | | |
| Transfer agent fees and expenses | | | 2 | | | | 1 | | | | 61 | | | | 1 | | | | 1 | | | | | |
| Registration fees | | | 86 | | | | 63 | | | | 118 | | | | 72 | | | | 78 | | | | | |
| Custodian fees | | | 9 | | | | 17 | | | | 2 | | | | – | | | | – | | | | | |
| Professional fees | | | 49 | | | | 62 | | | | 43 | | | | 42 | | | | 50 | | | | | |
| Non-interested Trustees’ fees and expenses | | | – | | | | 1 | | | | 9 | | | | 3 | | | | 2 | | | | | |
| Fund administration fees | | | 1 | | | | 4 | | | | 37 | | | | 29 | | | | 10 | | | | | |
| Administrative services fees - Class D Shares | | | 4 | | | | N/A | | | | 231 | | | | N/A | | | | N/A | | | | | |
| Administrative services fees - Class S Shares | | | 2 | | | | 1 | | | | 12 | | | | 44 | | | | – | | | | | |
| Administrative services fees - Class T Shares | | | 3 | | | | – | | | | 232 | | | | 11 | | | | 1 | | | | | |
| Distribution fees and shareholder servicing fees - Class A Shares | | | 2 | | | | 1 | | | | 34 | | | | 16 | | | | 16 | | | | | |
| Distribution fees and shareholder servicing fees - Class C Shares | | | 8 | | | | – | | | | 75 | | | | 30 | | | | 2 | | | | | |
| Distribution fees and shareholder servicing fees - Class S Shares | | | 2 | | | | 1 | | | | 12 | | | | 44 | | | | – | | | | | |
| Administrative, networking and omnibus fees - Class A Shares | | | – | | | | – | | | | 6 | | | | 5 | | | | 3 | | | | | |
| Administrative, networking and omnibus fees - Class C Shares | | | – | | | | – | | | | 5 | | | | – | | | | – | | | | | |
| Administrative, networking and omnibus fees - Class I Shares | | | – | | | | – | | | | 41 | | | | 45 | | | | 8 | | | | | |
| Other expenses | | | 13 | | | | 12 | | | | 28 | | | | 23 | | | | 14 | | | | | |
| Total Expenses | | | 238 | | | | 405 | | | | 3,242 | | | | 1,840 | | | | 696 | | | | | |
| Expense and Fee Offset | | | – | | | | – | | | | – | | | | – | | | | – | | | | | |
| Less: Excess Expense Reimbursement | | | (173) | | | | (1) | | | | (4) | | | | (1) | | | | – | | | | | |
| Net Expenses after Waivers and Expense Offsets | | | 65 | | | | 404 | | | | 3,238 | | | | 1,839 | | | | 696 | | | | | |
| Net Investment Income | | | 305 | | | | 801 | | | | 4,207 | | | | 3,310 | | | | 1,688 | | | | | |
| Net Realized and Unrealized Gain/(Loss) on Investments: | | | | | | | | | | | | | | | | | | | | | | | | |
| Net realized gain from investment and foreign currency transactions | | | 710 | | | | 3,288 | | | | 35,422 | | | | 41,882 | | | | 17,715 | | | | | |
| Change in unrealized net appreciation/(depreciation) of investments, foreign currency translations and non-interested Trustees’ deferred compensation | | | 188 | | | | 3,480 | | | | 30,498 | | | | 2,921 | | | | 3,856 | | | | | |
| Net Gain on Investments | | | 898 | | | | 6,768 | | | | 65,920 | | | | 44,803 | | | | 21,571 | | | | | |
| Net Increase in Net Assets Resulting from Operations | | $ | 1,203 | | | $ | 7,569 | | | $ | 70,127 | | | $ | 48,113 | | | $ | 23,259 | | | | | |
See Notes to Financial Statements.
66 | JUNE 30, 2013
This page intentionally left blank. The content of this page is part of a ‘Double Page Spread’ table and appears on the previous page.
67
Statements of Changes in Net Assets
| | | | | | | | | | | | | | | | | | | | | | | | | | | | | | | | | | | | | | | | | |
| | | INTECH Global
| | INTECH International
| | INTECH U.S.
| | | | | | | | |
For each year or period ended June 30
| | Dividend Fund | | Fund | | Core Fund | | INTECH U.S. Growth Fund | | INTECH U.S. Value Fund |
| (all numbers in thousands) | | 2013 | | 2012(1) | | 2013 | | 2012 | | 2013 | | 2012 | | 2013 | | 2012 | | 2013 | | 2012 |
|
| |
| Operations: | | | | | | | | | | | | | | | | | | | | | | | | | | | | | | | | | | | | | | | | |
| Net investment income | | $ | 305 | | | $ | 155 | | | $ | 801 | | | $ | 635 | | | $ | 4,207 | | | $ | 3,758 | | | $ | 3,310 | | | $ | 2,857 | | | $ | 1,688 | | | $ | 1,686 | |
| Net realized gain/(loss) from investment and foreign currency transactions | | | 710 | | | | (21) | | | | 3,288 | | | | (3,188) | | | | 35,422 | | | | 17,076 | | | | 41,882 | | | | 18,604 | | | | 17,715 | | | | 2,082 | |
| Change in unrealized net appreciation/(depreciation) of investments, foreign currency translations and non-interested Trustees’ deferred compensation | | | 188 | | | | 168 | | | | 3,480 | | | | (290) | | | | 30,498 | | | | (8,376) | | | | 2,921 | | | | (10,496) | | | | 3,856 | | | | (870) | |
| Net Increase/(Decrease) in Net Assets Resulting from Operations | | | 1,203 | | | | 302 | | | | 7,569 | | | | (2,843) | | | | 70,127 | | | | 12,458 | | | | 48,113 | | | | 10,965 | | | | 23,259 | | | | 2,898 | |
| Dividends and Distributions to Shareholders: | | | | | | | | | | | | | | | | | | | | | | | | | | | | | | | | | | | | | | | | |
| Net Investment Income* | | | | | | | | | | | | | | | | | | | | | | | | | | | | | | | | | | | | | | | | |
| Class A Shares | | | (36) | | | | (14) | | | | (6) | | | | (4) | | | | (154) | | | | (130) | | | | (61) | | | | (61) | | | | (109) | | | | (75) | |
| Class C Shares | | | (22) | | | | (15) | | | | (6) | | | | (5) | | | | (41) | | | | – | | | | (11) | | | | – | | | | (2) | | | | – | |
| Class D Shares | | | (114) | | | | (30) | | | | N/A | | | | N/A | | | | (2,635) | | | | (1,628) | | | | N/A | | | | N/A | | | | N/A | | | | N/A | |
| Class I Shares | | | (70) | | | | (28) | | | | (945) | | | | (300) | | | | (853) | | | | (566) | | | | (3,721) | | | | (2,545) | | | | (1,947) | | | | (1,531) | |
| Class S Shares | | | (24) | | | | (14) | | | | (5) | | | | (4) | | | | (45) | | | | (29) | | | | (156) | | | | (72) | | | | (2) | | | | (2) | |
| Class T Shares | | | (44) | | | | (18) | | | | (2) | | | | – | | | | (1,228) | | | | (646) | | | | (38) | | | | (1) | | | | (1) | | | | – | |
| Net Realized Gain/(Loss) from Investment Transactions* | | | | | | | | | | | | | | | | | | | | | | | | | | | | | | | | | | | | | | | | |
| Class A Shares | | | – | | | | – | | | | – | | | | – | | | | – | | | | – | | | | – | | | | – | | | | – | | | | – | |
| Class C Shares | | | – | | | | – | | | | – | | | | – | | | | – | | | | – | | | | – | | | | – | | | | – | | | | – | |
| Class D Shares | | | – | | | | – | | | | N/A | | | | N/A | | | | – | | | | – | | | | N/A | | | | N/A | | | | N/A | | | | N/A | |
| Class I Shares | | | – | | | | – | | | | – | | | | – | | | | – | | | | – | | | | – | | | | – | | | | – | | | | – | |
| Class S Shares | | | – | | | | – | | | | – | | | | – | | | | – | | | | – | | | | – | | | | – | | | | – | | | | – | |
| Class T Shares | | | – | | | | – | | | | – | | | | – | | | | – | | | | – | | | | – | | | | – | | | | – | | | | – | |
| Net Decrease from Dividends and Distributions | | | (310) | | | | (119) | | | | (964) | | | | (313) | | | | (4,956) | | | | (2,999) | | | | (3,987) | | | | (2,679) | | | | (2,061) | | | | (1,608) | |
See footnotes at the end of the Statements.
See Notes to Financial Statements.
68 | JUNE 30, 2013
This page intentionally left blank. The content of this page is part of a ‘Double Page Spread’ table and appears on the previous page.
69
Statements of Changes in Net Assets (continued)
| | | | | | | | | | | | | | | | | | | | | | | | | | | | | | | | | | | | | | | | | |
| | | INTECH Global
| | INTECH International
| | INTECH U.S.
| | | | | | | | |
For each year or period ended June 30
| | Dividend Fund | | Fund | | Core Fund | | INTECH U.S. Growth Fund | | INTECH U.S. Value Fund |
| (all numbers in thousands) | | 2013 | | 2012(1) | | 2013 | | 2012 | | 2013 | | 2012 | | 2013 | | 2012 | | 2013 | | 2012 |
|
| |
| Capital Share Transactions: | | | | | | | | | | | | | | | | | | | | | | | | | | | | | | | | | | | | | | | | |
| Shares Sold | | | | | | | | | | | | | | | | | | | | | | | | | | | | | | | | | | | | | | | | |
| Class A Shares | | | 1,391 | | | | 882 | | | | 368 | | | | – | | | | 6,559 | | | | 3,096 | | | | 1,430 | | | | 1,732 | | | | 1,387 | | | | 1,133 | |
| Class C Shares | | | 167 | | | | 897 | | | | – | | | | 488 | | | | 2,543 | | | | 1,060 | | | | 482 | | | | 412 | | | | 200 | | | | 67 | |
| Class D Shares | | | 4,608 | | | | 2,274 | | | | N/A | | | | N/A | | | | 35,993 | | | | 22,664 | | | | N/A | | | | N/A | | | | N/A | | | | N/A | |
| Class I Shares | | | 570 | | | | 1,914 | | | | 25,143 | | | | 21,044 | | | | 30,499 | | | | 12,645 | | | | 17,214 | | | | 20,446 | | | | 5,633 | | | | 9,047 | |
| Class S Shares | | | – | | | | 833 | | | | – | | | | 8 | | | | 2,544 | | | | 1,503 | | | | 2,921 | | | | 8,006 | | | | – | | | | – | |
| Class T Shares | | | 587 | | | | 1,188 | | | | 189 | | | | 22 | | | | 29,253 | | | | 22,524 | | | | 16,075 | | | | 81 | | | | 421 | | | | 40 | |
| Redemption Fees | | | | | | | | | | | | | | | | | | | | | | | | | | | | | | | | | | | | | | | | |
| Class D Shares | | | N/A | | | | N/A | | | | N/A | | | | N/A | | | | N/A | | | | 10 | | | | N/A | | | | N/A | | | | N/A | | | | N/A | |
| Class I Shares | | | N/A | | | | N/A | | | | N/A | | | | 24 | | | | N/A | | | | 4 | | | | N/A | | | | 10 | | | | N/A | | | | – | |
| Class S Shares | | | N/A | | | | N/A | | | | N/A | | | | – | | | | N/A | | | | 2 | | | | N/A | | | | 2 | | | | N/A | | | | – | |
| Class T Shares | | | N/A | | | | N/A | | | | N/A | | | | – | | | | N/A | | | | 8 | | | | N/A | | | | – | | | | N/A | | | | – | |
| Reinvested Dividends and Distributions | | | | | | | | | | | | | | | | | | | | | | | | | | | | | | | | | | | | | | | | |
| Class A Shares | | | 36 | | | | 14 | | | | 6 | | | | 4 | | | | 149 | | | | 116 | | | | 52 | | | | 55 | | | | 107 | | | | 74 | |
| Class C Shares | | | 22 | | | | 15 | | | | 6 | | | | 5 | | | | 18 | | | | – | | | | 6 | | | | – | | | | 1 | | | | – | |
| Class D Shares | | | 111 | | | | 30 | | | | N/A | | | | N/A | | | | 2,600 | | | | 1,610 | | | | N/A | | | | N/A | | | | N/A | | | | N/A | |
| Class I Shares | | | 70 | | | | 28 | | | | 945 | | | | 300 | | | | 563 | | | | 395 | | | | 3,137 | | | | 2,069 | | | | 1,903 | | | | 1,494 | |
| Class S Shares | | | 24 | | | | 14 | | | | 5 | | | | 4 | | | | 45 | | | | 29 | | | | 156 | | | | 72 | | | | 2 | | | | 2 | |
| Class T Shares | | | 44 | | | | 18 | | | | 2 | | | | – | | | | 1,212 | | | | 637 | | | | 38 | | | | 1 | | | | 1 | | | | – | |
| Shares Repurchased | | | | | | | | | | | | | | | | | | | | | | | | | | | | | | | | | | | | | | | | |
| Class A Shares | | | (799) | | | | – | | | | (380) | | | | – | | | | (6,263) | | | | (4,716) | | | | (4,360) | | | | (3,940) | | | | (942) | | | | (832) | |
| Class C Shares | | | (746) | | | | – | | | | (381) | | | | (451) | | | | (1,207) | | | | (1,544) | | | | (447) | | | | (1,397) | | | | (6) | | | | (133) | |
| Class D Shares | | | (2,356) | | | | (201) | | | | N/A | | | | N/A | | | | (27,474) | | | | (27,638) | | | | N/A | | | | N/A | | | | N/A | | | | N/A | |
| Class I Shares | | | (1,193) | | | | (75) | | | | (8,175) | | | | (3,664) | | | | (19,232) | | | | (19,545) | | | | (105,457) | | | | (88,878) | | | | (43,493) | | | | (11,586) | |
| Class S Shares | | | (723) | | | | – | | | | (364) | | | | (7) | | | | (2,092) | | | | (1,908) | | | | (4,136) | | | | (5,580) | | | | (189) | | | | – | |
| Class T Shares | | | (1,419) | | | | (9) | | | | (48) | | | | – | | | | (21,211) | | | | (16,423) | | | | (907) | | | | (54) | | | | (47) | | | | (1) | |
| Net Increase/(Decrease) from Capital Share Transactions | | | 394 | | | | 7,822 | | | | 17,316 | | | | 17,777 | | | | 34,499 | | | | (5,471) | | | | (73,796) | | | | (66,963) | | | | (35,022) | | | | (695) | |
| Net Increase/(Decrease) in Net Assets | | | 1,287 | | | | 8,005 | | | | 23,921 | | | | 14,621 | | | | 99,670 | | | | 3,988 | | | | (29,670) | | | | (58,677) | | | | (13,824) | | | | 595 | |
| Net Assets: | | | | | | | | | | | | | | | | | | | | | | | | | | | | | | | | | | | | | | | | |
| Beginning of period | | | 8,005 | | | | – | | | | 36,966 | | | | 22,345 | | | | 333,270 | | | | 329,282 | | | | 291,836 | | | | 350,513 | | | | 99,720 | | | | 99,125 | |
| End of period | | $ | 9,292 | | | $ | 8,005 | | | $ | 60,887 | | | $ | 36,966 | | | $ | 432,940 | | | $ | 333,270 | | | $ | 262,166 | | | $ | 291,836 | | | $ | 85,896 | | | $ | 99,720 | |
| | | | | | | | | | | | | | | | | | | | | | | | | | | | | | | | | | | | | | | | | |
| Undistributed Net Investment Income* | | $ | 50 | | | $ | 36 | | | $ | 466 | | | $ | 508 | | | $ | 1,387 | | | $ | 2,133 | | | $ | 710 | | | $ | 1,390 | | | $ | 777 | | | $ | 1,147 | |
| | | |
| * | | See Note 4 in Notes to Financial Statements. |
| (1) | | Period from December 15, 2011 (inception date) through June 30, 2012. |
| | | |
| | | |
See Notes to Financial Statements.
70 | JUNE 30, 2013
This page intentionally left blank. The content of this page is part of a ‘Double Page Spread’ table and appears on the previous page.
71
Financial Highlights
Class A Shares
| | | | | | | | | | | |
| | | INTECH Global Dividend Fund | | |
| For a share outstanding during each year or period ended June 30 | | 2013 | | 2012(1) | | |
| |
| Net Asset Value, Beginning of Period | | | $10.40 | | | | $10.00 | | | |
| Income from Investment Operations: | | | | | | | | | | |
| Net investment income | | | 0.35 | | | | 0.22 | | | |
| Net gain/(loss) on investments (both realized and unrealized) | | | 1.24 | | | | 0.35 | | | |
| Total from Investment Operations | | | 1.59 | | | | 0.57 | | | |
| Less Distributions: | | | | | | | | | | |
| Dividends (from net investment income)* | | | (0.39) | | | | (0.17) | | | |
| Distributions (from capital gains)* | | | – | | | | – | | | |
| Total Distributions | | | (0.39) | | | | (0.17) | | | |
| Net Asset Value, End of Period | | | $11.60 | | | | $10.40 | | | |
| Total Return** | | | 15.41% | | | | 5.70% | | | |
| Net Assets, End of Period (in thousands) | | | $1,625 | | | | $931 | | | |
| Average Net Assets for the Period (in thousands) | | | $996 | | | | $881 | | | |
| Ratio of Gross Expenses (Absent the Waiver of Certain Fees and Expense Offsets) to Average Net Assets*** | | | 2.69% | | | | 5.56% | | | |
| Ratio of Net Expenses (After Waivers and Expense Offsets) to Average Net Assets*** | | | 0.76% | | | | 1.02% | | | |
| Ratio of Net Investment Income to Average Net Assets*** | | | 3.18% | | | | 4.01% | | | |
| Portfolio Turnover Rate | | | 116% | | | | 24% | | | |
Class A Shares
| | | | | | | | | | | | | | | | | | | | | | | | | | | |
For a share outstanding during each year or period ended June 30
| | INTECH International Fund | | |
| and each year ended July 31 | | 2013 | | 2012 | | 2011 | | 2010(2) | | 2009 | | 2008 | | |
| |
| Net Asset Value, Beginning of Period | | | $6.79 | | | | $8.10 | | | | $6.16 | | | | $6.56 | | | | $8.97 | | | | $9.93 | | | |
| Income from Investment Operations: | | | | | | | | | | | | | | | | | | | | | | | | | | |
| Net investment income | | | 0.22 | | | | 0.12 | | | | 0.66 | | | | 0.13 | | | | 0.16 | | | | 0.20 | | | |
| Net gain/(loss) on investments (both realized and unrealized) | | | 1.21 | | | | (1.36) | | | | 1.39 | | | | (0.47) | | | | (2.31) | | | | (1.01) | | | |
| Total from Investment Operations | | | 1.43 | | | | (1.24) | | | | 2.05 | | | | (0.34) | | | | (2.15) | | | | (0.81) | | | |
| Less Distributions: | | | | | | | | | | | | | | | | | | | | | | | | | | |
| Dividends (from net investment income)* | | | (0.15) | | | | (0.07) | | | | (0.11) | | | | (0.06) | | | | (0.26) | | | | (0.15) | | | |
| Distributions (from capital gains)* | | | – | | | | – | | | | – | | | | – | | | | – | | | | – | | | |
| Total Distributions | | | (0.15) | | | | (0.07) | | | | (0.11) | | | | (0.06) | | | | (0.26) | | | | (0.15) | | | |
| Net Asset Value, End of Period | | | $8.07 | | | | $6.79 | | | | $8.10 | | | | $6.16 | | | | $6.56 | | | | $8.97 | | | |
| Total Return** | | | 21.27% | | | | (15.33)% | | | | 33.42% | | | | (5.32)% | | | | (23.53)% | | | | (8.35)% | | | |
| Net Assets, End of Period (in thousands) | | | $473 | | | | $445 | | | | $526 | | | | $1,684 | | | | $1,836 | | | | $2,326 | | | |
| Average Net Assets for the Period (in thousands) | | | $317 | | | | $452 | | | | $1,910 | | | | $1,900 | | | | $1,632 | | | | $2,507 | | | |
| Ratio of Gross Expenses (Absent the Waiver of Certain Fees and Expense Offsets) to Average Net Assets*** | | | 1.22% | | | | 1.42% | | | | 3.22% | | | | 4.61% | | | | 6.45% | | | | 4.18% | | | |
| Ratio of Net Expenses (After Waivers and Expense Offsets) to Average Net Assets*** | | | 1.22% | | | | 1.26% | | | | 1.07%(3) | | | | 0.73%(3) | | | | 0.64%(3) | | | | 0.90% | | | |
| Ratio of Net Investment Income to Average Net Assets*** | | | 1.26% | | | | 1.72% | | | | 2.05% | | | | 1.87% | | | | 2.62% | | | | 1.92% | | | |
| Portfolio Turnover Rate | | | 143% | | | | 140% | | | | 179% | | | | 119%^ | | | | 115% | | | | 105% | | | |
| | | |
| * | | See Note 4 in Notes to Financial Statements. |
| ** | | Total return not annualized for periods of less than one full year. |
| *** | | Annualized for periods of less than one full year. |
| ^ | | Rate has been adjusted to conform with current year presentation. |
| (1) | | Period from December 15, 2011 (inception date) through June 30, 2012. |
| (2) | | Period from August 1, 2009 through June 30, 2010. The Fund changed its fiscal year end from July 31 to June 30. |
| (3) | | Pursuant to a contractual agreement, Janus waived certain fees and expenses during the period. The Ratio of Net Expenses (After Waivers and Expense Offsets) to Average Net Assets would have been 1.25% in 2011, 1.25% in 2010 and 0.93% in 2009 without the waiver of these fees and expenses. |
See Notes to Financial Statements.
72 | JUNE 30, 2013
Class A Shares
| | | | | | | | | | | | | | | | | | | | | | | |
For a share outstanding during each year or period ended June 30 and the
| | INTECH U.S. Core Fund | | |
| period ended October 31, 2009 | | 2013 | | 2012 | | 2011 | | 2010(1) | | 2009(2) | | |
| |
| Net Asset Value, Beginning of Period | | | $14.72 | | | | $14.31 | | | | $10.72 | | | | $10.56 | | | | $9.26 | | | |
| Income from Investment Operations: | | | | | | | | | | | | | | | | | | | | | | |
| Net investment income | | | 0.18 | | | | 0.15 | | | | 0.10 | | | | 0.07 | | | | 0.05 | | | |
| Net gain/(loss) on investments (both realized and unrealized) | | | 2.96 | | | | 0.39 | | | | 3.58 | | | | 0.16 | | | | 1.25 | | | |
| Total from Investment Operations | | | 3.14 | | | | 0.54 | | | | 3.68 | | | | 0.23 | | | | 1.30 | | | |
| Less Distributions: | | | | | | | | | | | | | | | | | | | | | | |
| Dividends (from net investment income)* | | | (0.20) | | | | (0.13) | | | | (0.09) | | | | (0.07) | | | | – | | | |
| Distributions (from capital gains)* | | | – | | | | – | | | | – | | | | – | | | | – | | | |
| Total Distributions | | | (0.20) | | | | (0.13) | | | | (0.09) | | | | (0.07) | | | | – | | | |
| Net Asset Value, End of Period | | | $17.66 | | | | $14.72 | | | | $14.31 | | | | $10.72 | | | | $10.56 | | | |
| Total Return** | | | 21.48% | | | | 3.83% | | | | 34.44% | | | | 2.11% | | | | 14.04% | | | |
| Net Assets, End of Period (in thousands) | | | $16,242 | | | | $13,486 | | | | $14,544 | | | | $11,026 | | | | $13,008 | | | |
| Average Net Assets for the Period (in thousands) | | | $13,430 | | | | $13,834 | | | | $13,331 | | | | $12,844 | | | | $14,686 | | | |
| Ratio of Gross Expenses (Absent the Waiver of Certain Fees and Expense Offsets) to Average Net Assets*** | | | 0.98% | | | | 0.99% | | | | 0.98% | | | | 1.15% | | | | 1.25% | | | |
| Ratio of Net Expenses (After Waivers and Expense Offsets) to Average Net Assets*** | | | 0.98% | | | | 0.99% | | | | 0.98% | | | | 1.06% | | | | 1.08% | | | |
| Ratio of Net Investment Income to Average Net Assets*** | | | 1.05% | | | | 1.03% | | | | 0.82% | | | | 0.85% | | | | 1.20% | | | |
| Portfolio Turnover Rate | | | 67% | | | | 73% | | | | 93% | | | | 80%^ | | | | 111% | | | |
Class A Shares
| | | | | | | | | | | | | | | | | | | | | | | | | | | |
For a share outstanding during each year or period ended June 30
| | INTECH U.S. Growth Fund | | |
| and each year ended July 31 | | 2013 | | 2012 | | 2011 | | 2010(3) | | 2009 | | 2008 | | |
| |
| Net Asset Value, Beginning of Period | | | $14.43 | | | | $14.07 | | | | $10.52 | | | | $9.80 | | | | $12.88 | | | | $14.45 | | | |
| Income from Investment Operations: | | | | | | | | | | | | | | | | | | | | | | | | | | |
| Net investment income | | | 0.33 | | | | 0.16 | | | | 0.23 | | | | 0.14 | | | | 0.14 | | | | 0.09 | | | |
| Net gain/(loss) on investments (both realized and unrealized) | | | 2.19 | | | | 0.29 | | | | 3.44 | | | | 0.64 | | | | (3.11) | | | | (0.94) | | | |
| Total from Investment Operations | | | 2.52 | | | | 0.45 | | | | 3.67 | | | | 0.78 | | | | (2.97) | | | | (0.85) | | | |
| Less Distributions: | | | | | | | | | | | | | | | | | | | | | | | | | | |
| Dividends (from net investment income)* | | | (0.15) | | | | (0.09) | | | | (0.12) | | | | (0.06) | | | | (0.11) | | | | (0.08) | | | |
| Distributions (from capital gains)* | | | – | | | | – | | | | – | | | | – | | | | – | | | | (0.64) | | | |
| Total Distributions | | | (0.15) | | | | (0.09) | | | | (0.12) | | | | (0.06) | | | | (0.11) | | | | (0.72) | | | |
| Net Asset Value, End of Period | | | $16.80 | | | | $14.43 | | | | $14.07 | | | | $10.52 | | | | $9.80 | | | | $12.88 | | | |
| Total Return** | | | 17.57% | | | | 3.26% | | | | 35.03% | | | | 7.97% | | | | (22.92)% | | | | (6.54)% | | | |
| Net Assets, End of Period (in thousands) | | | $5,445 | | | | $7,328 | | | | $9,208 | | | | $11,914 | | | | $18,215 | | | | $34,231 | | | |
| Average Net Assets for the Period (in thousands) | | | $6,267 | | | | $8,624 | | | | $9,550 | | | | $17,116 | | | | $20,041 | | | | $47,093 | | | |
| Ratio of Gross Expenses (Absent the Waiver of Certain Fees and Expense Offsets) to Average Net Assets*** | | | 0.90% | | | | 0.92% | | | | 0.86% | | | | 0.90% | | | | 0.82% | | | | 0.78% | | | |
| Ratio of Net Expenses (After Waivers and Expense Offsets) to Average Net Assets*** | | | 0.90% | | | | 0.92% | | | | 0.86% | | | | 0.90% | | | | 0.82% | | | | 0.78% | | | |
| Ratio of Net Investment Income to Average Net Assets*** | | | 0.85% | | | | 0.65% | | | | 0.62% | | | | 0.71% | | | | 1.01% | | | | 0.57% | | | |
| Portfolio Turnover Rate | | | 81% | | | | 84% | | | | 96% | | | | 117%^ | | | | 119% | | | | 125% | | | |
| | | |
| * | | See Note 4 in Notes to Financial Statements. |
| ** | | Total return not annualized for periods of less than one full year. |
| *** | | Annualized for periods of less than one full year. |
| ^ | | Rate has been adjusted to conform with current year presentation. |
| (1) | | Period from November 1, 2009 through June 30, 2010. The Fund changed its fiscal year end from October 31 to June 30. |
| (2) | | Period from July 6, 2009 (inception date) through October 31, 2009. |
| (3) | | Period from August 1, 2009 through June 30, 2010. The Fund changed its fiscal year end from July 31 to June 30. |
See Notes to Financial Statements.
Janus Mathematical Funds | 73
Financial Highlights (continued)
Class A Shares
| | | | | | | | | | | | | | | | | | | | | | | | | | | |
For a share outstanding during each year or period ended June 30
| | INTECH U.S. Value Fund | | |
| and each year ended July 31 | | 2013 | | 2012 | | 2011 | | 2010(1) | | 2009 | | 2008 | | |
| |
| Net Asset Value, Beginning of Period | | | $10.15 | | | | $10.03 | | | | $7.85 | | | | $7.36 | | | | $9.88 | | | | $11.68 | | | |
| Income from Investment Operations: | | | | | | | | | | | | | | | | | | | | | | | | | | |
| Net investment income | | | 0.16 | | | | 0.15 | | | | 0.13 | | | | 0.10 | | | | 0.15 | | | | 0.14 | | | |
| Net gain/(loss) on investments (both realized and unrealized) | | | 2.33 | | | | 0.11 | | | | 2.16 | | | | 0.43 | | | | (2.35) | | | | (1.58) | | | |
| Total from Investment Operations | | | 2.49 | | | | 0.26 | | | | 2.29 | | | | 0.53 | | | | (2.20) | | | | (1.44) | | | |
| Less Distributions: | | | | | | | | | | | | | | | | | | | | | | | | | | |
| Dividends (from net investment income)* | | | (0.19) | | | | (0.14) | | | | (0.11) | | | | (0.04) | | | | (0.32) | | | | (0.13) | | | |
| Distributions (from capital gains)* | | | – | | | | – | | | | – | | | | – | | | | – | | | | (0.23) | | | |
| Total Distributions | | | (0.19) | | | | (0.14) | | | | (0.11) | | | | (0.04) | | | | (0.32) | | | | (0.36) | | | |
| Net Asset Value, End of Period | | | $12.45 | | | | $10.15 | | | | $10.03 | | | | $7.85 | | | | $7.36 | | | | $9.88 | | | |
| Total Return** | | | 24.86% | | | | 2.71% | | | | 29.23% | | | | 7.21% | | | | (22.01)% | | | | (12.78)% | | | |
| Net Assets, End of Period (in thousands) | | | $7,348 | | | | $5,494 | | | | $4,980 | | | | $3,694 | | | | $3,440 | | | | $1,032 | | | |
| Average Net Assets for the Period (in thousands) | | | $6,373 | | | | $5,099 | | | | $4,598 | | | | $3,815 | | | | $1,762 | | | | $680 | | | |
| Ratio of Gross Expenses (Absent the Waiver of Certain Fees and Expense Offsets) to Average Net Assets*** | | | 0.97% | | | | 0.92% | | | | 0.95% | | | | 1.05% | | | | 1.33% | | | | 1.17% | | | |
| Ratio of Net Expenses (After Waivers and Expense Offsets) to Average Net Assets*** | | | 0.97% | | | | 0.92% | | | | 0.95% | | | | 1.01% | | | | 0.74% | | | | 0.85% | | | |
| Ratio of Net Investment Income to Average Net Assets*** | | | 1.37% | | | | 1.54% | | | | 1.38% | | | | 1.26% | | | | 2.28% | | | | 2.08% | | | |
| Portfolio Turnover Rate | | | 100% | | | | 100% | | | | 108% | | | | 92%^ | | | | 100% | | | | 78% | | | |
| | | |
| * | | See Note 4 in Notes to Financial Statements. |
| ** | | Total return not annualized for periods of less than one full year. |
| *** | | Annualized for periods of less than one full year. |
| ^ | | Rate has been adjusted to conform with current year presentation. |
| (1) | | Period from August 1, 2009 through June 30, 2010. The Fund changed its fiscal year end from July 31 to June 30. |
See Notes to Financial Statements.
74 | JUNE 30, 2013
Class C Shares
| | | | | | | | | | | |
| | | INTECH Global Dividend Fund | | |
| For a share outstanding during each year or period ended June 30 | | 2013 | | 2012(1) | | |
| |
| Net Asset Value, Beginning of Period | | | $10.37 | | | | $10.00 | | | |
| Income from Investment Operations: | | | | | | | | | | |
| Net investment income | | | 0.27 | | | | 0.19 | | | |
| Net gain/(loss) on investments (both realized and unrealized) | | | 1.22 | | | | 0.35 | | | |
| Total from Investment Operations | | | 1.49 | | | | 0.54 | | | |
| Less Distributions: | | | | | | | | | | |
| Dividends (from net investment income)* | | | (0.30) | | | | (0.17) | | | |
| Distributions (from capital gains)* | | | – | | | | – | | | |
| Total Distributions | | | (0.30) | | | | (0.17) | | | |
| Net Asset Value, End of Period | | | $11.56 | | | | $10.37 | | | |
| Total Return** | | | 14.50% | | | | 5.36% | | | |
| Net Assets, End of Period (in thousands) | | | $489 | | | | $940 | | | |
| Average Net Assets for the Period (in thousands) | | | $793 | | | | $900 | | | |
| Ratio of Gross Expenses (Absent the Waiver of Certain Fees and Expense Offsets) to Average Net Assets*** | | | 3.50% | | | | 6.25% | | | |
| Ratio of Net Expenses (After Waivers and Expense Offsets) to Average Net Assets*** | | | 1.51% | | | | 1.70% | | | |
| Ratio of Net Investment Income to Average Net Assets*** | | | 2.26% | | | | 3.37% | | | |
| Portfolio Turnover Rate | | | 116% | | | | 24% | | | |
Class C Shares
| | | | | | | | | | | | | | | | | | | | | | | | | | | |
For a share outstanding during each year or period ended June 30
| | INTECH International Fund | | |
| and each year ended July 31 | | 2013 | | 2012 | | 2011 | | 2010(2) | | 2009 | | 2008 | | |
| |
| Net Asset Value, Beginning of Period | | | $6.78 | | | | $8.11 | | | | $6.17 | | | | $6.57 | | | | $8.93 | | | | $9.91 | | | |
| Income from Investment Operations: | | | | | | | | | | | | | | | | | | | | | | | | | | |
| Net investment income | | | 2.46 | | | | 0.17 | | | | 0.58 | | | | 0.13 | | | | 0.16 | | | | 0.13 | | | |
| Net gain/(loss) on investments (both realized and unrealized) | | | (0.93) | | | | (1.43) | | | | 1.47 | | | | (0.47) | | | | (2.30) | | | | (1.01) | | | |
| Total from Investment Operations | | | 1.53 | | | | (1.26) | | | | 2.05 | | | | (0.34) | | | | (2.14) | | | | (0.88) | | | |
| Less Distributions: | | | | | | | | | | | | | | | | | | | | | | | | | | |
| Dividends (from net investment income)* | | | (0.17) | | | | (0.07) | | | | (0.11) | | | | (0.06) | | | | (0.22) | | | | (0.10) | | | |
| Distributions (from capital gains)* | | | – | | | | – | | | | – | | | | – | | | | – | | | | – | | | |
| Total Distributions | | | (0.17) | | | | (0.07) | | | | (0.11) | | | | (0.06) | | | | (0.22) | | | | (0.10) | | | |
| Net Asset Value, End of Period | | | $8.14 | | | | $6.78 | | | | $8.11 | | | | $6.17 | | | | $6.57 | | | | $8.93 | | | |
| Total Return** | | | 22.79% | | | | (15.55)% | | | | 33.37% | | | | (5.31)% | | | | (23.61)% | | | | (9.03)% | | | |
| Net Assets, End of Period (in thousands) | | | $113 | | | | $433 | | | | $563 | | | | $1,642 | | | | $1,737 | | | | $2,274 | | | |
| Average Net Assets for the Period (in thousands) | | | $251 | | | | $574 | | | | $1,877 | | | | $1,827 | | | | $1,552 | | | | $2,485 | | | |
| Ratio of Gross Expenses (Absent the Waiver of Certain Fees and Expense Offsets) to Average Net Assets*** | | | 1.32% | | | | 1.71% | | | | 3.96% | | | | 5.33% | | | | 7.20% | | | | 4.93% | | | |
| Ratio of Net Expenses (After Waivers and Expense Offsets) to Average Net Assets*** | | | 1.18% | | | | 1.47% | | | | 1.21%(3) | | | | 0.73%(3) | | | | 0.69%(3) | | | | 1.65% | | | |
| Ratio of Net Investment Income to Average Net Assets*** | | | 1.20% | | | | 1.33% | | | | 1.92% | | | | 1.88% | | | | 2.56% | | | | 1.17% | | | |
| Portfolio Turnover Rate | | | 143% | | | | 140% | | | | 179% | | | | 119%^ | | | | 115% | | | | 105% | | | |
| | | |
| * | | See Note 4 in Notes to Financial Statements. |
| ** | | Total return not annualized for periods of less than one full year. |
| *** | | Annualized for periods of less than one full year. |
| ^ | | Rate has been adjusted to conform with current year presentation. |
| (1) | | Period from December 15, 2011 (inception date) through June 30, 2012. |
| (2) | | Period from August 1, 2009 through June 30, 2010. The Fund changed its fiscal year end from July 31 to June 30. |
| (3) | | Pursuant to a contractual agreement, Janus waived certain fees and expenses during the period. The Ratio of Net Expenses (After Waivers and Expense Offsets) to Average Net Assets would have been 2.00% in 2011, 2.00% in 2010 and 1.68% in 2009 without the waiver of these fees and expenses. |
See Notes to Financial Statements.
Janus Mathematical Funds | 75
Financial Highlights (continued)
Class C Shares
| | | | | | | | | | | | | | | | | | | | | | | |
For a share outstanding during each year or period ended June 30 and the
| | INTECH U.S. Core Fund | | |
| period ended October 31, 2009 | | 2013 | | 2012 | | 2011 | | 2010(1) | | 2009(2) | | |
| |
| Net Asset Value, Beginning of Period | | | $14.68 | | | | $14.26 | | | | $10.71 | | | | $10.54 | | | | $9.26 | | | |
| Income from Investment Operations: | | | | | | | | | | | | | | | | | | | | | | |
| Net investment income/(loss) | | | 0.04 | | | | 0.03 | | | | – | | | | 0.03 | | | | 0.02 | | | |
| Net gain/(loss) on investments (both realized and unrealized) | | | 2.96 | | | | 0.39 | | | | 3.56 | | | | 0.16 | | | | 1.26 | | | |
| Total from Investment Operations | | | 3.00 | | | | 0.42 | | | | 3.56 | | | | 0.19 | | | | 1.28 | | | |
| Less Distributions: | | | | | | | | | | | | | | | | | | | | | | |
| Dividends (from net investment income)* | | | (0.09) | | | | – | | | | (0.01) | | | | (0.02) | | | | – | | | |
| Distributions (from capital gains)* | | | – | | | | – | | | | – | | | | – | | | | – | | | |
| Total Distributions | | | (0.09) | | | | – | | | | (0.01) | | | | (0.02) | | | | – | | | |
| Net Asset Value, End of Period | | | $17.59 | | | | $14.68 | | | | $14.26 | | | | $10.71 | | | | $10.54 | | | |
| Total Return** | | | 20.51% | | | | 2.95% | | | | 33.26% | | | | 1.82% | | | | 13.82% | | | |
| Net Assets, End of Period (in thousands) | | | $9,154 | | | | $6,450 | | | | $6,755 | | | | $6,452 | | | | $7,938 | | | |
| Average Net Assets for the Period (in thousands) | | | $7,536 | | | | $6,402 | | | | $6,690 | | | | $7,678 | | | | $8,527 | | | |
| Ratio of Gross Expenses (Absent the Waiver of Certain Fees and Expense Offsets) to Average Net Assets*** | | | 1.77% | | | | 1.83% | | | | 1.80% | | | | 1.56% | | | | 2.17% | | | |
| Ratio of Net Expenses (After Waivers and Expense Offsets) to Average Net Assets*** | | | 1.77% | | | | 1.83% | | | | 1.80% | | | | 1.56% | | | | 1.83% | | | |
| Ratio of Net Investment Income/(Loss) to Average Net Assets*** | | | 0.25% | | | | 0.20% | | | | (0.01)% | | | | 0.35% | | | | 0.44% | | | |
| Portfolio Turnover Rate | | | 67% | | | | 73% | | | | 93% | | | | 80%^ | | | | 111% | | | |
Class C Shares
| | | | | | | | | | | | | | | | | | | | | | | | | | | |
For a share outstanding during each year or period ended June 30
| | INTECH U.S. Growth Fund | | |
| and each year ended July 31 | | 2013 | | 2012 | | 2011 | | 2010(3) | | 2009 | | 2008 | | |
| |
| Net Asset Value, Beginning of Period | | | $13.92 | | | | $13.58 | | | | $10.15 | | | | $9.50 | | | | $12.45 | | | | $14.03 | | | |
| Income from Investment Operations: | | | | | | | | | | | | | | | | | | | | | | | | | | |
| Net investment income/(loss) | | | 0.04 | | | | (0.28) | | | | (0.22) | | | | (0.14) | | | | (0.05) | | | | (0.11) | | | |
| Net gain/(loss) on investments (both realized and unrealized) | | | 2.28 | | | | 0.62 | | | | 3.65 | | | | 0.81 | | | | (2.88) | | | | (0.83) | | | |
| Total from Investment Operations | | | 2.32 | | | | 0.34 | | | | 3.43 | | | | 0.67 | | | | (2.93) | | | | (0.94) | | | |
| Less Distributions and Other: | | | | | | | | | | | | | | | | | | | | | | | | | | |
| Dividends (from net investment income)* | | | (0.06) | | | | – | | | | – | | | | (0.02) | | | | (0.02) | | | | – | | | |
| Distributions (from capital gains)* | | | – | | | | – | | | | – | | | | – | | | | – | | | | (0.64) | | | |
| Redemption fees | | | N/A | | | | – | | | | – | | | | –(4) | | | | – | | | | – | | | |
| Total Distributions and Other | | | (0.06) | | | | – | | | | – | | | | (0.02) | | | | (0.02) | | | | (0.64) | | | |
| Net Asset Value, End of Period | | | $16.18 | | | | $13.92 | | | | $13.58 | | | | $10.15 | | | | $9.50 | | | | $12.45 | | | |
| Total Return** | | | 16.70% | | | | 2.50% | | | | 33.79% | | | | 7.05% | | | | (23.53)% | | | | (7.31)% | | | |
| Net Assets, End of Period (in thousands) | | | $3,232 | | | | $2,742 | | | | $3,717 | | | | $3,928 | | | | $4,921 | | | | $8,767 | | | |
| Average Net Assets for the Period (in thousands) | | | $2,999 | | | | $3,089 | | | | $4,005 | | | | $4,571 | | | | $5,469 | | | | $12,982 | | | |
| Ratio of Gross Expenses (Absent the Waiver of Certain Fees and Expense Offsets) to Average Net Assets*** | | | 1.60% | | | | 1.71% | | | | 1.71% | | | | 2.82% | | | | 1.67% | | | | 1.60% | | | |
| Ratio of Net Expenses (After Waivers and Expense Offsets) to Average Net Assets*** | | | 1.60% | | | | 1.71% | | | | 1.70% | | | | 1.93% | | | | 1.62% | | | | 1.60% | | | |
| Ratio of Net Investment Income/(Loss) to Average Net Assets*** | | | 0.15% | | | | (0.15)% | | | | (0.25)% | | | | (0.32)% | | | | 0.21% | | | | (0.25)% | | | |
| Portfolio Turnover Rate | | | 81% | | | | 84% | | | | 96% | | | | 117%^ | | | | 119% | | | | 125% | | | |
| | | |
| * | | See Note 4 in Notes to Financial Statements. |
| ** | | Total return not annualized for periods of less than one full year. |
| *** | | Annualized for periods of less than one full year. |
| ^ | | Rate has been adjusted to conform with current year presentation. |
| (1) | | Period from November 1, 2009 through June 30, 2010. The Fund changed its fiscal year end from October 31 to June 30. |
| (2) | | Period from July 6, 2009 (inception date) through October 31, 2009. |
| (3) | | Period from August 1, 2009 through June 30, 2010. The Fund changed its fiscal year end from July 31 to June 30. |
| (4) | | Redemption fees aggregated less than $0.01 on a per share basis. Redemption fees were eliminated effective April 2, 2012. |
See Notes to Financial Statements.
76 | JUNE 30, 2013
Class C Shares
| | | | | | | | | | | | | | | | | | | | | | | | | | | |
For a share outstanding during each year or period ended June 30
| | INTECH U.S. Value Fund | | |
| and each year ended July 31 | | 2013 | | 2012 | | 2011 | | 2010(1) | | 2009 | | 2008 | | |
| |
| Net Asset Value, Beginning of Period | | | $10.14 | | | | $9.94 | | | | $7.81 | | | | $7.35 | | | | $9.78 | | | | $11.61 | | | |
| Income from Investment Operations: | | | | | | | | | | | | | | | | | | | | | | | | | | |
| Net investment income/(loss) | | | (0.08) | | | | 0.18 | | | | 0.14 | | | | 0.03 | | | | 0.12 | | | | 0.23 | | | |
| Net gain/(loss) on investments (both realized and unrealized) | | | 2.49 | | | | 0.02 | | | | 2.05 | | | | 0.45 | | | | (2.34) | | | | (1.75) | | | |
| Total from Investment Operations | | | 2.41 | | | | 0.20 | | | | 2.19 | | | | 0.48 | | | | (2.22) | | | | (1.52) | | | |
| Less Distributions: | | | | | | | | | | | | | | | | | | | | | | | | | | |
| Dividends (from net investment income)* | | | (0.12) | | | | – | | | | (0.06) | | | | (0.02) | | | | (0.21) | | | | (0.08) | | | |
| Distributions (from capital gains)* | | | – | | | | – | | | | – | | | | – | | | | – | | | | (0.23) | | | |
| Total Distributions | | | (0.12) | | | | – | | | | (0.06) | | | | (0.02) | | | | (0.21) | | | | (0.31) | | | |
| Net Asset Value, End of Period | | | $12.43 | | | | $10.14 | | | | $9.94 | | | | $7.81 | | | | $7.35 | | | | $9.78 | | | |
| Total Return** | | | 23.97% | | | | 2.01% | | | | 28.03% | | | | 6.51% | | | | (22.52)% | | | | (13.49)% | | | |
| Net Assets, End of Period (in thousands) | | | $380 | | | | $147 | | | | $217 | | | | $330 | | | | $281 | | | | $342 | | | |
| Average Net Assets for the Period (in thousands) | | | $206 | | | | $164 | | | | $432 | | | | $324 | | | | $266 | | | | $860 | | | |
| Ratio of Gross Expenses (Absent the Waiver of Certain Fees and Expense Offsets) to Average Net Assets*** | | | 1.69% | | | | 1.72% | | | | 1.74% | | | | 1.80% | | | | 1.99% | | | | 1.96% | | | |
| Ratio of Net Expenses (After Waivers and Expense Offsets) to Average Net Assets*** | | | 1.69% | | | | 1.61% | | | | 1.74% | | | | 1.76% | | | | 1.47% | | | | 1.60% | | | |
| Ratio of Net Investment Income to Average Net Assets*** | | | 0.57% | | | | 0.81% | | | | 0.58% | | | | 0.51% | | | | 1.94% | | | | 1.36% | | | |
| Portfolio Turnover Rate | | | 100% | | | | 100% | | | | 108% | | | | 92%^ | | | | 100% | | | | 78% | | | |
| | | |
| * | | See Note 4 in Notes to Financial Statements. |
| ** | | Total return not annualized for periods of less than one full year. |
| *** | | Annualized for periods of less than one full year. |
| ^ | | Rate has been adjusted to conform with current year presentation. |
| (1) | | Period from August 1, 2009 through June 30, 2010. The Fund changed its fiscal year end from July 31 to June 30. |
See Notes to Financial Statements.
Janus Mathematical Funds | 77
Financial Highlights (continued)
Class D Shares
| | | | | | | | | | | |
| | | INTECH Global Dividend Fund | | |
| For a share outstanding during each year or period ended June 30 | | 2013 | | 2012(1) | | |
| |
| Net Asset Value, Beginning of Period | | | $10.39 | | | | $10.00 | | | |
| Income from Investment Operations: | | | | | | | | | | |
| Net investment income | | | 0.42 | | | | 0.21 | | | |
| Net gain/(loss) on investments (both realized and unrealized) | | | 1.17 | | | | 0.35 | | | |
| Total from Investment Operations | | | 1.59 | | | | 0.56 | | | |
| Less Distributions: | | | | | | | | | | |
| Dividends (from net investment income)* | | | (0.40) | | | | (0.17) | | | |
| Distributions (from capital gains)* | | | – | | | | – | | | |
| Total Distributions | | | (0.40) | | | | (0.17) | | | |
| Net Asset Value, End of Period | | | $11.58 | | | | $10.39 | | | |
| Total Return** | | | 15.49% | | | | 5.60% | | | |
| Net Assets, End of Period (in thousands) | | | $4,706 | | | | $2,124 | | | |
| Average Net Assets for the Period (in thousands) | | | $3,161 | | | | $1,727 | | | |
| Ratio of Gross Expenses (Absent the Waiver of Certain Fees and Expense Offsets) to Average Net Assets*** | | | 2.57% | | | | 5.98% | | | |
| Ratio of Net Expenses (After Waivers and Expense Offsets) to Average Net Assets*** | | | 0.67% | | | | 1.32% | | | |
| Ratio of Net Investment Income to Average Net Assets*** | | | 3.91% | | | | 4.09% | | | |
| Portfolio Turnover Rate | | | 116% | | | | 24% | | | |
Class D Shares
| | | | | | | | | | | | | | | | | | | |
| | | INTECH U.S. Core Fund | | |
| For a share outstanding during each year or period ended June 30 | | 2013 | | 2012 | | 2011 | | 2010(2) | | |
| |
| Net Asset Value, Beginning of Period | | | $14.74 | | | | $14.32 | | | | $10.74 | | | | $10.95 | | | |
| Income from Investment Operations: | | | | | | | | | | | | | | | | | | |
| Net investment income | | | 0.19 | | | | 0.17 | | | | 0.13 | | | | 0.05 | | | |
| Net gain/(loss) on investments (both realized and unrealized) | | | 2.97 | | | | 0.39 | | | | 3.59 | | | | (0.26) | | | |
| Total from Investment Operations | | | 3.16 | | | | 0.56 | | | | 3.72 | | | | (0.21) | | | |
| Less Distributions and Other: | | | | | | | | | | | | | | | | | | |
| Dividends (from net investment income)* | | | (0.23) | | | | (0.14) | | | | (0.14) | | | | – | | | |
| Distributions (from capital gains)* | | | – | | | | – | | | | – | | | | – | | | |
| Redemption fees | | | N/A | | | | –(3) | | | | –(3) | | | | –(3) | | | |
| Total Distributions and Other | | | (0.23) | | | | (0.14) | | | | (0.14) | | | | – | | | |
| Net Asset Value, End of Period | | | $17.67 | | | | $14.74 | | | | $14.32 | | | | $10.74 | | | |
| Total Return** | | | 21.62% | | | | 3.96% | | | | 34.74% | | | | (1.92)% | | | |
| Net Assets, End of Period (in thousands) | | | $220,548 | | | | $174,853 | | | | $173,097 | | | | $135,712 | | | |
| Average Net Assets for the Period (in thousands) | | | $192,611 | | | | $168,338 | | | | $156,479 | | | | $150,392 | | | |
| Ratio of Gross Expenses (Absent the Waiver of Certain Fees and Expense Offsets) to Average Net Assets*** | | | 0.85% | | | | 0.84% | | | | 0.82% | | | | 0.61% | | | |
| Ratio of Net Expenses (After Waivers and Expense Offsets) to Average Net Assets*** | | | 0.85% | | | | 0.84% | | | | 0.82% | | | | 0.60% | | | |
| Ratio of Net Investment Income to Average Net Assets*** | | | 1.17% | | | | 1.20% | | | | 0.96% | | | | 1.22% | | | |
| Portfolio Turnover Rate | | | 67% | | | | 73% | | | | 93% | | | | 80%^ | | | |
| | | |
| * | | See Note 4 in Notes to Financial Statements. |
| ** | | Total return not annualized for periods of less than one full year. |
| *** | | Annualized for periods of less than one full year. |
| ^ | | Rate has been adjusted to conform with current year presentation. |
| (1) | | Period from December 15, 2011 (inception date) through June 30, 2012. |
| (2) | | Period from February 16, 2010 (inception date) through June 30, 2010. |
| (3) | | Redemption fees aggregated less than $0.01 on a per share basis. Redemption fees were eliminated effective April 2, 2012. |
See Notes to Financial Statements.
78 | JUNE 30, 2013
Class I Shares
| | | | | | | | | | | |
| | | INTECH Global Dividend Fund | | |
| For a share outstanding during each year or period ended June 30 | | 2013 | | 2012(1) | | |
| |
| Net Asset Value, Beginning of Period | | | $10.42 | | | | $10.00 | | | |
| Income from Investment Operations: | | | | | | | | | | |
| Net investment income | | | 0.46 | | | | 0.23 | | | |
| Net gain/(loss) on investments (both realized and unrealized) | | | 1.15 | | | | 0.36 | | | |
| Total from Investment Operations | | | 1.61 | | | | 0.59 | | | |
| Less Distributions: | | | | | | | | | | |
| Dividends (from net investment income)* | | | (0.41) | | | | (0.17) | | | |
| Distributions (from capital gains)* | | | – | | | | – | | | |
| Total Distributions | | | (0.41) | | | | (0.17) | | | |
| Net Asset Value, End of Period | | | $11.62 | | | | $10.42 | | | |
| Total Return** | | | 15.66% | | | | 5.90% | | | |
| Net Assets, End of Period (in thousands) | | | $1,571 | | | | $1,897 | | | |
| Average Net Assets for the Period (in thousands) | | | $1,927 | | | | $1,542 | | | |
| Ratio of Gross Expenses (Absent the Waiver of Certain Fees and Expense Offsets) to Average Net Assets*** | | | 2.45% | | | | 5.07% | | | |
| Ratio of Net Expenses (After Waivers and Expense Offsets) to Average Net Assets*** | | | 0.51% | | | | 0.75% | | | |
| Ratio of Net Investment Income to Average Net Assets*** | | | 3.63% | | | | 4.64% | | | |
| Portfolio Turnover Rate | | | 116% | | | | 24% | | | |
Class I Shares
| | | | | | | | | | | | �� | | | | | | | | | | | | | | | |
For a share outstanding during each year or period ended
| | INTECH International Fund | | |
| June 30 and each year ended July 31 | | 2013 | | 2012 | | 2011 | | 2010(2) | | 2009 | | 2008 | | |
| |
| Net Asset Value, Beginning of Period | | | $6.77 | | | | $8.06 | | | | $6.14 | | | | $6.55 | | | | $8.98 | | | | $9.93 | | | |
| Income from Investment Operations: | | | | | | | | | | | | | | | | | | | | | | | | | | |
| Net investment income | | | 0.18 | | | | 0.12 | | | | 0.03 | | | | 0.13 | | | | 0.15 | | | | 0.22 | | | |
| Net gain/(loss) on investments (both realized and unrealized) | | | 1.28 | | | | (1.35) | | | | 2.00 | | | | (0.48) | | | | (2.30) | | | | (1.01) | | | |
| Total from Investment Operations | | | 1.46 | | | | (1.23) | | | | 2.03 | | | | (0.35) | | | | (2.15) | | | | (0.79) | | | |
| Less Distributions and Other: | | | | | | | | | | | | | | | | | | | | | | | | | | |
| Dividends (from net investment income)* | | | (0.20) | | | | (0.06) | | | | (0.11) | | | | (0.06) | | | | (0.28) | | | | (0.16) | | | |
| Distributions (from capital gains)* | | | – | | | | – | | | | – | | | | – | | | | – | | | | – | | | |
| Redemption fees | | | N/A | | | | –(3) | | | | – | | | | –(3) | | | | – | | | | – | | | |
| Total Distributions and Other | | | (0.20) | | | | (0.06) | | | | (0.11) | | | | (0.06) | | | | (0.28) | | | | (0.16) | | | |
| Net Asset Value, End of Period | | | $8.03 | | | | $6.77 | | | | $8.06 | | | | $6.14 | | | | $6.55 | | | | $8.98 | | | |
| Total Return** | | | 21.78% | | | | (15.18)% | | | | 33.20% | | | | (5.48)% | | | | (23.56)% | | | | (8.09)% | | | |
| Net Assets, End of Period (in thousands) | | | $59,981 | | | | $35,608 | | | | $20,713 | | | | $1,180 | | | | $2,327 | | | | $2,571 | | | |
| Average Net Assets for the Period (in thousands) | | | $42,583 | | | | $29,910 | | | | $1,393 | | | | $2,223 | | | | $1,935 | | | | $2,694 | | | |
| Ratio of Gross Expenses (Absent the Waiver of Certain Fees and Expense Offsets) to Average Net Assets*** | | | 0.92% | | | | 1.13% | | | | 3.08% | | | | 4.68% | | | | 6.34% | | | | 3.92% | | | |
| Ratio of Net Expenses (After Waivers and Expense Offsets) to Average Net Assets*** | | | 0.92% | | | | 1.00% | | | | 0.86% | | | | 1.00% | | | | 0.68% | | | | 0.65% | | | |
| Ratio of Net Investment Income to Average Net Assets*** | | | 1.86% | | | | 2.05% | | | | 2.28% | | | | 1.38% | | | | 2.65% | | | | 2.18% | | | |
| Portfolio Turnover Rate | | | 143% | | | | 140% | | | | 179% | | | | 119%^ | | | | 115% | | | | 105% | | | |
| | | |
| * | | See Note 4 in Notes to Financial Statements. |
| ** | | Total return not annualized for periods of less than one full year. |
| *** | | Annualized for periods of less than one full year. |
| ^ | | Rate has been adjusted to conform with current year presentation. |
| (1) | | Period from December 15, 2011 (inception date) through June 30, 2012. |
| (2) | | Period from August 1, 2009 through June 30, 2010. The Fund changed its fiscal year end from July 31 to June 30. |
| (3) | | Redemption fees aggregated less than $0.01 on a per share basis. Redemption fees were eliminated effective April 2, 2012. |
See Notes to Financial Statements.
Janus Mathematical Funds | 79
Financial Highlights (continued)
Class I Shares
| | | | | | | | | | | | | | | | | | | | | | | |
For a share outstanding during each year or period ended June 30 and the
| | INTECH U.S. Core Fund | | |
| period ended October 31, 2009 | | 2013 | | 2012 | | 2011 | | 2010(1) | | 2009(2) | | |
| |
| Net Asset Value, Beginning of Period | | | $14.75 | | | | $14.33 | | | | $10.75 | | | | $10.57 | | | | $9.26 | | | |
| Income from Investment Operations: | | | | | | | | | | | | | | | | | | | | | | |
| Net investment income | | | 0.19 | | | | 0.20 | | | | 0.16 | | | | 0.11 | | | | 0.05 | | | |
| Net gain/(loss) on investments (both realized and unrealized) | | | 2.99 | | | | 0.37 | | | | 3.57 | | | | 0.16 | | | | 1.26 | | | |
| Total from Investment Operations | | | 3.18 | | | | 0.57 | | | | 3.73 | | | | 0.27 | | | | 1.31 | | | |
| Less Distributions and Other: | | | | | | | | | | | | | | | | | | | | | | |
| Dividends (from net investment income)* | | | (0.25) | | | | (0.15) | | | | (0.15) | | | | (0.09) | | | | – | | | |
| Distributions (from capital gains)* | | | – | | | | – | | | | – | | | | – | | | | – | | | |
| Redemption fees | | | N/A | | | | –(3) | | | | –(3) | | | | –(3) | | | | – | | | |
| Total Distributions and Other | | | (0.25) | | | | (0.15) | | | | (0.15) | | | | (0.09) | | | | – | | | |
| Net Asset Value, End of Period | | | $17.68 | | | | $14.75 | | | | $14.33 | | | | $10.75 | | | | $10.57 | | | |
| Total Return** | | | 21.75% | | | | 4.06% | | | | 34.84% | | | | 2.51% | | | | 14.15% | | | |
| Net Assets, End of Period (in thousands) | | | $71,592 | | | | $50,196 | | | | $55,567 | | | | $50,382 | | | | $45,795 | | | |
| Average Net Assets for the Period (in thousands) | | | $56,472 | | | | $52,297 | | | | $53,512 | | | | $51,959 | | | | $49,319 | | | |
| Ratio of Gross Expenses (Absent the Waiver of Certain Fees and Expense Offsets) to Average Net Assets*** | | | 0.75% | | | | 0.72% | | | | 0.72% | | | | 0.53% | | | | 0.80% | | | |
| Ratio of Net Expenses (After Waivers and Expense Offsets) to Average Net Assets*** | | | 0.75% | | | | 0.72% | | | | 0.72% | | | | 0.53% | | | | 0.78% | | | |
| Ratio of Net Investment Income to Average Net Assets*** | | | 1.27% | | | | 1.31% | | | | 1.07% | | | | 1.37% | | | | 1.49% | | | |
| Portfolio Turnover Rate | | | 67% | | | | 73% | | | | 93% | | | | 80%^ | | | | 111% | | | |
Class I Shares
| | | | | | | | | | | | | | | | | | | | | | | | | | | |
For a share outstanding during each year or period ended
| | INTECH U.S. Growth Fund | | |
| June 30 and each year ended July 31 | | 2013 | | 2012 | | 2011 | | 2010(4) | | 2009 | | 2008 | | |
| |
| Net Asset Value, Beginning of Period | | | $14.35 | | | | $13.97 | | | | $10.45 | | | | $9.72 | | | | $12.84 | | | | $14.40 | | | |
| Income from Investment Operations: | | | | | | | | | | | | | | | | | | | | | | | | | | |
| Net investment income | | | 0.18 | | | | 0.13 | | | | 0.13 | | | | 0.12 | | | | 0.12 | | | | 0.11 | | | |
| Net gain/(loss) on investments (both realized and unrealized) | | | 2.36 | | | | 0.37 | | | | 3.55 | | | | 0.69 | | | | (3.07) | | | | (0.93) | | | |
| Total from Investment Operations | | | 2.54 | | | | 0.50 | | | | 3.68 | | | | 0.81 | | | | (2.95) | | | | (0.82) | | | |
| Less Distributions and Other: | | | | | | | | | | | | | | | | | | | | | | | | | | |
| Dividends (from net investment income)* | | | (0.21) | | | | (0.12) | | | | (0.16) | | | | (0.08) | | | | (0.17) | | | | (0.10) | | | |
| Distributions (from capital gains)* | | | – | | | | – | | | | – | | | | – | | | | – | | | | (0.64) | | | |
| Redemption fees | | | N/A | | | | –(3) | | | | –(3) | | | | –(3) | | | | –(3) | | | | – | | | |
| Total Distributions and Other | | | (0.21) | | | | (0.12) | | | | (0.16) | | | | (0.08) | | | | (0.17) | | | | (0.74) | | | |
| Net Asset Value, End of Period | | | $16.68 | | | | $14.35 | | | | $13.97 | | | | $10.45 | | | | $9.72 | | | | $12.84 | | | |
| Total Return** | | | 17.89% | | | | 3.64% | | | | 35.31% | | | | 8.29% | | | | (22.76)% | | | | (6.33)% | | | |
| Net Assets, End of Period (in thousands) | | | $218,980 | | | | $264,411 | | | | $323,567 | | | | $379,401 | | | | $807,347 | | | | $1,224,054 | | | |
| Average Net Assets for the Period (in thousands) | | | $258,682 | | | | $287,232 | | | | $329,686 | | | | $768,204 | | | | $857,115 | | | | $1,288,020 | | | |
| Ratio of Gross Expenses (Absent the Waiver of Certain Fees and Expense Offsets) to Average Net Assets*** | | | 0.58% | | | | 0.62% | | | | 0.63% | | | | 0.62% | | | | 0.55% | | | | 0.53% | | | |
| Ratio of Net Expenses (After Waivers and Expense Offsets) to Average Net Assets*** | | | 0.58% | | | | 0.62% | | | | 0.63% | | | | 0.61% | | | | 0.55% | | | | 0.53% | | | |
| Ratio of Net Investment Income to Average Net Assets*** | | | 1.20% | | | | 0.95% | | | | 0.84% | | | | 1.00% | | | | 1.30% | | | | 0.79% | | | |
| Portfolio Turnover Rate | | | 81% | | | | 84% | | | | 96% | | | | 117%^ | | | | 119% | | | | 125% | | | |
| | | |
| * | | See Note 4 in Notes to Financial Statements. |
| ** | | Total return not annualized for periods of less than one full year. |
| *** | | Annualized for periods of less than one full year. |
| ^ | | Rate has been adjusted to conform with current year presentation. |
| (1) | | Period from November 1, 2009 through June 30, 2010. The Fund changed its fiscal year end from October 31 to June 30. |
| (2) | | Period from July 6, 2009 (inception date) through October 31, 2009. |
| (3) | | Redemption fees aggregated less than $0.01 on a per share basis. Redemption fees were eliminated effective April 2, 2012. |
| (4) | | Period from August 1, 2009 through June 30, 2010. The Fund changed its fiscal year end from July 31 to June 30. |
See Notes to Financial Statements.
80 | JUNE 30, 2013
Class I Shares
| | | | | | | | | | | | | | | | | | | | | | | | | | | |
For a share outstanding during each year or period ended
| | INTECH U.S. Value Fund | | |
| June 30 and each year ended July 31 | | 2013 | | 2012 | | 2011 | | 2010(1) | | 2009 | | 2008 | | |
| |
| Net Asset Value, Beginning of Period | | | $10.19 | | | | $10.07 | | | | $7.89 | | | | $7.37 | | | | $9.91 | | | | $11.70 | | | |
| Income from Investment Operations: | | | | | | | | | | | | | | | | | | | | | | | | | | |
| Net investment income | | | 0.22 | | | | 0.17 | | | | 0.15 | | | | 0.11 | | | | 0.18 | | | | 0.22 | | | |
| Net gain/(loss) on investments (both realized and unrealized) | | | 2.32 | | | | 0.12 | | | | 2.16 | | | | 0.45 | | | | (2.38) | | | | (1.64) | | | |
| Total from Investment Operations | | | 2.54 | | | | 0.29 | | | | 2.31 | | | | 0.56 | | | | (2.20) | | | | (1.42) | | | |
| Less Distributions and Other: | | | | | | | | | | | | | | | | | | | | | | | | | | |
| Dividends (from net investment income)* | | | (0.22) | | | | (0.17) | | | | (0.13) | | | | (0.04) | | | | (0.34) | | | | (0.14) | | | |
| Distributions (from capital gains)* | | | – | | | | – | | | | – | | | | – | | | | – | | | | (0.23) | | | |
| Redemption fees | | | N/A | | | | –(2) | | | | – | | | | –(2) | | | | –(2) | | | | –(2) | | | |
| Total Distributions and Other | | | (0.22) | | | | (0.17) | | | | (0.13) | | | | (0.04) | | | | (0.34) | | | | (0.37) | | | |
| Net Asset Value, End of Period | | | $12.51 | | | | $10.19 | | | | $10.07 | | | | $7.89 | | | | $7.37 | | | | $9.91 | | | |
| Total Return** | | | 25.23% | | | | 2.96% | | | | 29.38% | | | | 7.62% | | | | (21.96)% | | | | (12.54)% | | | |
| Net Assets, End of Period (in thousands) | | | $77,625 | | | | $93,800 | | | | $93,695 | | | | $66,137 | | | | $59,647 | | | | $63,472 | | | |
| Average Net Assets for the Period (in thousands) | | | $93,335 | | | | $89,976 | | | | $84,034 | | | | $69,502 | | | | $53,614 | | | | $57,513 | | | |
| Ratio of Gross Expenses (Absent the Waiver of Certain Fees and Expense Offsets) to Average Net Assets*** | | | 0.67% | | | | 0.67% | | | | 0.68% | | | | 0.77% | | | | 0.96% | | | | 0.90% | | | |
| Ratio of Net Expenses (After Waivers and Expense Offsets) to Average Net Assets*** | | | 0.67% | | | | 0.67% | | | | 0.68% | | | | 0.75% | | | | 0.61% | | | | 0.60% | | | |
| Ratio of Net Investment Income to Average Net Assets*** | | | 1.71% | | | | 1.78% | | | | 1.64% | | | | 1.53% | | | | 2.79% | | | | 2.34% | | | |
| Portfolio Turnover Rate | | | 100% | | | | 100% | | | | 108% | | | | 92%^ | | | | 100% | | | | 78% | | | |
| | | |
| * | | See Note 4 in Notes to Financial Statements. |
| ** | | Total return not annualized for periods of less than one full year. |
| *** | | Annualized for periods of less than one full year. |
| ^ | | Rate has been adjusted to conform with current year presentation. |
| (1) | | Period from August 1, 2009 through June 30, 2010. The Fund changed its fiscal year end from July 31 to June 30. |
| (2) | | Redemption fees aggregated less than $0.01 on a per share basis. Redemption fees were eliminated effective April 2, 2012. |
See Notes to Financial Statements.
Janus Mathematical Funds | 81
Financial Highlights (continued)
Class S Shares
| | | | | | | | | | | |
| | | INTECH Global Dividend Fund | | |
| For a share outstanding during each year or period ended June 30 | | 2013 | | 2012(1) | | |
| |
| Net Asset Value, Beginning of Period | | | $10.39 | | | | $10.00 | | | |
| Income from Investment Operations: | | | | | | | | | | |
| Net investment income | | | 0.43 | | | | 0.21 | | | |
| Net gain/(loss) on investments (both realized and unrealized) | | | 1.15 | | | | 0.35 | | | |
| Total from Investment Operations | | | 1.58 | | | | 0.56 | | | |
| Less Distributions: | | | | | | | | | | |
| Dividends (from net investment income)* | | | (0.39) | | | | (0.17) | | | |
| Distributions (from capital gains)* | | | – | | | | – | | | |
| Total Distributions | | | (0.39) | | | | (0.17) | | | |
| Net Asset Value, End of Period | | | $11.58 | | | | $10.39 | | | |
| Total Return** | | | 15.40% | | | | 5.60% | | | |
| Net Assets, End of Period (in thousands) | | | $286 | | | | $880 | | | |
| Average Net Assets for the Period (in thousands) | | | $726 | | | | $872 | | | |
| Ratio of Gross Expenses (Absent the Waiver of Certain Fees and Expense Offsets) to Average Net Assets*** | | | 2.96% | | | | 5.82% | | | |
| Ratio of Net Expenses (After Waivers and Expense Offsets) to Average Net Assets*** | | | 0.86% | | | | 1.26% | | | |
| Ratio of Net Investment Income to Average Net Assets*** | | | 2.86% | | | | 3.77% | | | |
| Portfolio Turnover Rate | | | 116% | | | | 24% | | | |
Class S Shares
| | | | | | | | | | | | | | | | | | | | | | | | | | | |
For a share outstanding during each year or period ended June 30
| | INTECH International Fund | | |
| and each year ended July 31 | | 2013 | | 2012 | | 2011 | | 2010(2) | | 2009 | | 2008 | | |
| |
| Net Asset Value, Beginning of Period | | | $6.79 | | | | $8.12 | | | | $6.16 | | | | $6.56 | | | | $8.95 | | | | $9.92 | | | |
| Income from Investment Operations: | | | | | | | | | | | | | | | | | | | | | | | | | | |
| Net investment income | | | 2.47 | | | | 0.10 | | | | 0.70 | | | | 0.13 | | | | 0.16 | | | | 0.18 | | | |
| Net gain/(loss) on investments (both realized and unrealized) | | | (1.02) | | | | (1.36) | | | | 1.37 | | | | (0.47) | | | | (2.30) | | | | (1.02) | | | |
| Total from Investment Operations | | | 1.45 | | | | (1.26) | | | | 2.07 | | | | (0.34) | | | | (2.14) | | | | (0.84) | | | |
| Less Distributions: | | | | | | | | | | | | | | | | | | | | | | | | | | |
| Dividends (from net investment income)* | | | (0.15) | | | | (0.07) | | | | (0.11) | | | | (0.06) | | | | (0.25) | | | | (0.13) | | | |
| Distributions (from capital gains)* | | | – | | | | – | | | | – | | | | – | | | | – | | | | – | | | |
| Total Distributions | | | (0.15) | | | | (0.07) | | | | (0.11) | | | | (0.06) | | | | (0.25) | | | | (0.13) | | | |
| Net Asset Value, End of Period | | | $8.09 | | | | $6.79 | | | | $8.12 | | | | $6.16 | | | | $6.56 | | | | $8.95 | | | |
| Total Return** | | | 21.48% | | | | (15.54)% | | | | 33.75% | | | | (5.32)% | | | | (23.54)% | | | | (8.61)% | | | |
| Net Assets, End of Period (in thousands) | | | $118 | | | | $421 | | | | $498 | | | | $1,642 | | | | $1,733 | | | | $2,268 | | | |
| Average Net Assets for the Period (in thousands) | | | $254 | | | | $432 | | | | $1,870 | | | | $1,831 | | | | $1,551 | | | | $2,477 | | | |
| Ratio of Gross Expenses (Absent the Waiver of Certain Fees and Expense Offsets) to Average Net Assets*** | | | 1.48% | | | | 1.66% | | | | 3.46% | | | | 4.83% | | | | 6.66% | | | | 4.43% | | | |
| Ratio of Net Expenses (After Waivers and Expense Offsets) to Average Net Assets*** | | | 1.29% | | | | 1.44% | | | | 1.07%(3) | | | | 0.72%(3) | | | | 0.65%(3) | | | | 1.15% | | | |
| Ratio of Net Investment Income to Average Net Assets*** | | | 1.09% | | | | 1.52% | | | | 2.05% | | | | 1.89% | | | | 2.60% | | | | 1.67% | | | |
| Portfolio Turnover Rate | | | 143% | | | | 140% | | | | 179% | | | | 119%^ | | | | 115% | | | | 105% | | | |
| | | |
| * | | See Note 4 in Notes to Financial Statements. |
| ** | | Total return not annualized for periods of less than one full year. |
| *** | | Annualized for periods of less than one full year. |
| ^ | | Rate has been adjusted to conform with current year presentation. |
| (1) | | Period from December 15, 2011 (inception date) through June 30, 2012. |
| (2) | | Period from August 1, 2009 through June 30, 2010. The Fund changed its fiscal year end from July 31 to June 30. |
| (3) | | Pursuant to a contractual agreement, Janus waived certain fees and expenses during the period. The Ratio of Net Expenses (After Waivers and Expense Offsets) to Average Net Assets would have been 1.50% in 2011, 1.50% in 2010 and 1.18% in 2009 without the waiver of these fees and expenses. |
See Notes to Financial Statements.
82 | JUNE 30, 2013
Class S Shares
| | | | | | | | | | | | | | | | | | | | | | | |
For a share outstanding during each year or period ended June 30 and the
| | INTECH U.S. Core Fund | | |
| period ended October 31, 2009 | | 2013 | | 2012 | | 2011 | | 2010(1) | | 2009(2) | | |
| |
| Net Asset Value, Beginning of Period | | | $14.73 | | | | $14.29 | | | | $10.73 | | | | $10.55 | | | | $9.26 | | | |
| Income from Investment Operations: | | | | | | | | | | | | | | | | | | | | | | |
| Net investment income/(loss) | | | 0.16 | | | | 0.12 | | | | 0.08 | | | | 0.07 | | | | 0.04 | | | |
| Net gain/(loss) on investments (both realized and unrealized) | | | 2.94 | | | | 0.40 | | | | 3.57 | | | | 0.17 | | | | 1.25 | | | |
| Total from Investment Operations | �� | | 3.10 | | | | 0.52 | | | | 3.65 | | | | 0.24 | | | | 1.29 | | | |
| Less Distributions and Other: | | | | | | | | | | | | | | | | | | | | | | |
| Dividends (from net investment income)* | | | (0.17) | | | | (0.09) | | | | (0.09) | | | | (0.06) | | | | – | | | |
| Distributions (from capital gains)* | | | – | | | | – | | | | – | | | | – | | | | – | | | |
| Redemption fees | | | N/A | | | | 0.01 | | | | –(3) | | | | –(3) | | | | –(3) | | | |
| Total Distributions and Other | | | (0.17) | | | | (0.08) | | | | (0.09) | | | | (0.06) | | | | – | | | |
| Net Asset Value, End of Period | | | $17.66 | | | | $14.73 | | | | $14.29 | | | | $10.73 | | | | $10.55 | | | |
| Total Return** | | | 21.20% | | | | 3.75% | | | | 34.11% | | | | 2.26% | | | | 13.93% | | | |
| Net Assets, End of Period (in thousands) | | | $5,996 | | | | $4,645 | | | | $4,836 | | | | $3,888 | | | | $4,558 | | | |
| Average Net Assets for the Period (in thousands) | | | $4,857 | | | | $4,525 | | | | $4,423 | | | | $4,677 | | | | $5,179 | | | |
| Ratio of Gross Expenses (Absent the Waiver of Certain Fees and Expense Offsets) to Average Net Assets*** | | | 1.17% | | | | 1.16% | | | | 1.18% | | | | 1.03% | | | | 1.27% | | | |
| Ratio of Net Expenses (After Waivers and Expense Offsets) to Average Net Assets*** | | | 1.17% | | | | 1.16% | | | | 1.18% | | | | 1.02% | | | | 1.25% | | | |
| Ratio of Net Investment Income to Average Net Assets*** | | | 0.86% | | | | 0.88% | | | | 0.61% | | | | 0.89% | | | | 1.02% | | | |
| Portfolio Turnover Rate | | | 67% | | | | 73% | | | | 93% | | | | 80%^ | | | | 111% | | | |
Class S Shares
| | | | | | | | | | | | | | | | | | | | | | | | | | | |
For a share outstanding during each year or period ended
| | INTECH U.S. Growth Fund | | |
| June 30 and each year ended July 31 | | 2013 | | 2012 | | 2011 | | 2010(4) | | 2009 | | 2008 | | |
| |
| Net Asset Value, Beginning of Period | | | $14.39 | | | | $14.02 | | | | $10.48 | | | | $9.77 | | | | $12.81 | | | | $14.36 | | | |
| Income from Investment Operations: | | | | | | | | | | | | | | | | | | | | | | | | | | |
| Net investment income/(loss) | | | 0.15 | | | | (0.06) | | | | 0.33 | | | | 0.20 | | | | 0.33 | | | | 0.11 | | | |
| Net gain/(loss) on investments (both realized and unrealized) | | | 2.33 | | | | 0.49 | | | | 3.31 | | | | 0.56 | | | | (3.30) | | | | (0.98) | | | |
| Total from Investment Operations | | | 2.48 | | | | 0.43 | | | | 3.64 | | | | 0.76 | | | | (2.97) | | | | (0.87) | | | |
| Less Distributions and Other: | | | | | | | | | | | | | | | | | | | | | | | | | | |
| Dividends (from net investment income)* | | | (0.14) | | | | (0.06) | | | | (0.10) | | | | (0.05) | | | | (0.07) | | | | (0.04) | | | |
| Distributions (from capital gains)* | | | – | | | | – | | | | – | | | | – | | | | – | | | | (0.64) | | | |
| Redemption fees | | | N/A | | | | –(3) | | | | –(3) | | | | –(3) | | | | –(3) | | | | –(3) | | | |
| Total Distributions and Other | | | (0.14) | | | | (0.06) | | | | (0.10) | | | | (0.05) | | | | (0.07) | | | | (0.68) | | | |
| Net Asset Value, End of Period | | | $16.73 | | | | $14.39 | | | | $14.02 | | | | $10.48 | | | | $9.77 | | | | $12.81 | | | |
| Total Return** | | | 17.36% | | | | 3.14% | | | | 34.77% | | | | 7.73% | | | | (23.09)% | | | | (6.68)% | | | |
| Net Assets, End of Period (in thousands) | | | $18,867 | | | | $17,270 | | | | $13,963 | | | | $15,629 | | | | $20,051 | | | | $70,963 | | | |
| Average Net Assets for the Period (in thousands) | | | $17,704 | | | | $15,590 | | | | $14,606 | | | | $18,507 | | | | $40,058 | | | | $117,236 | | | |
| Ratio of Gross Expenses (Absent the Waiver of Certain Fees and Expense Offsets) to Average Net Assets*** | | | 1.06% | | | | 1.07% | | | | 1.07% | | | | 1.12% | | | | 1.04% | | | | 1.02% | | | |
| Ratio of Net Expenses (After Waivers and Expense Offsets) to Average Net Assets*** | | | 1.06% | | | | 1.07% | | | | 1.07% | | | | 1.12% | | | | 1.04% | | | | 1.02% | | | |
| Ratio of Net Investment Income to Average Net Assets*** | | | 0.70% | | | | 0.52% | | | | 0.40% | | | | 0.49% | | | | 0.77% | | | | 0.36% | | | |
| Portfolio Turnover Rate | | | 81% | | | | 84% | | | | 96% | | | | 117%^ | | | | 119% | | | | 125% | | | |
| | | |
| * | | See Note 4 in Notes to Financial Statements. |
| ** | | Total return not annualized for periods of less than one full year. |
| *** | | Annualized for periods of less than one full year. |
| ^ | | Rate has been adjusted to conform with current year presentation. |
| (1) | | Period from November 1, 2009 through June 30, 2010. The Fund changed its fiscal year end from October 31 to June 30. |
| (2) | | Period from July 6, 2009 (inception date) through October 31, 2009. |
| (3) | | Redemption fees aggregated less than $0.01 on a per share basis. Redemption fees were eliminated effective April 2, 2012. |
| (4) | | Period from August 1, 2009 through June 30, 2010. The Fund changed its fiscal year end from July 31 to June 30. |
See Notes to Financial Statements.
Janus Mathematical Funds | 83
Financial Highlights (continued)
Class S Shares
| | | | | | | | | | | | | | | | | | | | | | | | | | | |
For a share outstanding during each year or period ended June 30
| | INTECH U.S. Value Fund | | |
| and each year ended July 31 | | 2013 | | 2012 | | 2011 | | 2010(1) | | 2009 | | 2008 | | |
| |
| Net Asset Value, Beginning of Period | | | $10.15 | | | | $10.02 | | | | $7.85 | | | | $7.37 | | | | $9.86 | | | | $11.66 | | | |
| Income from Investment Operations: | | | | | | | | | | | | | | | | | | | | | | | | | | |
| Net investment income | | | 0.90 | | | | 0.13 | | | | 0.15 | | | | 0.08 | | | | 0.17 | | | | 0.20 | | | |
| Net gain/(loss) on investments (both realized and unrealized) | | | 1.63 | | | | 0.11 | | | | 2.11 | | | | 0.44 | | | | (2.38) | | | | (1.67) | | | |
| Total from Investment Operations | | | 2.53 | | | | 0.24 | | | | 2.26 | | | | 0.52 | | | | (2.21) | | | | (1.47) | | | |
| Less Distributions: | | | | | | | | | | | | | | | | | | | | | | | | | | |
| Dividends (from net investment income)* | | | (0.15) | | | | (0.11) | | | | (0.09) | | | | (0.04) | | | | (0.28) | | | | (0.10) | | | |
| Distributions (from capital gains)* | | | – | | | | – | | | | – | | | | – | | | | – | | | | (0.23) | | | |
| Total Distributions | | | (0.15) | | | | (0.11) | | | | (0.09) | | | | (0.04) | | | | (0.28) | | | | (0.33) | | | |
| Net Asset Value, End of Period | | | $12.53 | | | | $10.15 | | | | $10.02 | | | | $7.85 | | | | $7.37 | | | | $9.86 | | | |
| Total Return** | | | 25.12% | | | | 2.48% | | | | 28.81% | | | | 7.00% | | | | (22.15)% | | | | (12.98)% | | | |
| Net Assets, End of Period (in thousands) | | | $64 | | | | $221 | | | | $216 | | | | $214 | | | | $200 | | | | $257 | | | |
| Average Net Assets for the Period (in thousands) | | | $132 | | | | $208 | | | | $254 | | | | $225 | | | | $192 | | | | $284 | | | |
| Ratio of Gross Expenses (Absent the Waiver of Certain Fees and Expense Offsets) to Average Net Assets*** | | | 1.16% | | | | 1.15% | | | | 1.17% | | | | 1.27% | | | | 1.44% | | | | 1.41% | | | |
| Ratio of Net Expenses (After Waivers and Expense Offsets) to Average Net Assets*** | | | 0.97% | | | | 1.09% | | | | 1.17% | | | | 1.26% | | | | 0.97% | | | | 1.10% | | | |
| Ratio of Net Investment Income to Average Net Assets*** | | | 1.41% | | | | 1.36% | | | | 1.16% | | | | 1.02% | | | | 2.43% | | | | 1.84% | | | |
| Portfolio Turnover Rate | | | 100% | | | | 100% | | | | 108% | | | | 92%^ | | | | 100% | | | | 78% | | | |
| | | |
| * | | See Note 4 in Notes to Financial Statements. |
| ** | | Total return not annualized for periods of less than one full year. |
| *** | | Annualized for periods of less than one full year. |
| ^ | | Rate has been adjusted to conform with current year presentation. |
| (1) | | Period from August 1, 2009 through June 30, 2010. The Fund changed its fiscal year end from July 31 to June 30. |
See Notes to Financial Statements.
84 | JUNE 30, 2013
Class T Shares
| | | | | | | | | | | |
| | | INTECH Global Dividend Fund | | |
| For a share outstanding during each year or period ended June 30 | | 2013 | | 2012(1) | | |
| |
| Net Asset Value, Beginning of Period | | | $10.40 | | | | $10.00 | | | |
| Income from Investment Operations: | | | | | | | | | | |
| Net investment income | | | 0.46 | | | | 0.22 | | | |
| Net gain/(loss) on investments (both realized and unrealized) | | | 1.14 | | | | 0.35 | | | |
| Total from Investment Operations | | | 1.60 | | | | 0.57 | | | |
| Less Distributions: | | | | | | | | | | |
| Dividends (from net investment income)* | | | (0.40) | | | | (0.17) | | | |
| Distributions (from capital gains)* | | | – | | | | – | | | |
| Total Distributions | | | (0.40) | | | | (0.17) | | | |
| Net Asset Value, End of Period | | | $11.60 | | | | $10.40 | | | |
| Total Return** | | | 15.55% | | | | 5.70% | | | |
| Net Assets, End of Period (in thousands) | | | $615 | | | | $1,233 | | | |
| Average Net Assets for the Period (in thousands) | | | $1,249 | | | | $1,093 | | | |
| Ratio of Gross Expenses (Absent the Waiver of Certain Fees and Expense Offsets) to Average Net Assets*** | | | 2.69% | | | | 5.53% | | | |
| Ratio of Net Expenses (After Waivers and Expense Offsets) to Average Net Assets*** | | | 0.69% | | | | 1.03% | | | |
| Ratio of Net Investment Income/(Loss) to Average Net Assets*** | | | 3.27% | | | | 4.09% | | | |
| Portfolio Turnover Rate | | | 116% | | | | 24% | | | |
Class T Shares
| | | | | | | | | | | | | | | | | | | | | | | |
For a share outstanding during each year or period ended June 30 and the
| | INTECH International Fund |
| period ended July 31, 2009 | | 2013 | | 2012 | | 2011 | | 2010(2) | | 2009(3) | | |
| |
| Net Asset Value, Beginning of Period | | | $6.77 | | | | $8.09 | | | | $6.16 | | | | $6.55 | | | | $5.93 | | | |
| Income from Investment Operations: | | | | | | | | | | | | | | | | | | | | | | |
| Net investment income | | | 0.08 | | | | 0.06 | | | | 0.17 | | | | 0.12 | | | | – | | | |
| Net gain/(loss) on investments (both realized and unrealized) | | | 1.35 | | | | (1.31) | | | | 1.87 | | | | (0.45) | | | | 0.62 | | | |
| Total from Investment Operations | | | 1.43 | | | | (1.25) | | | | 2.04 | | | | (0.33) | | | | 0.62 | | | |
| Less Distributions: | | | | | | | | | | | | | | | | | | | | | | |
| Dividends (from net investment income)* | | | (0.19) | | | | (0.07) | | | | (0.11) | | | | (0.06) | | | | – | | | |
| Distributions (from capital gains)* | | | – | | | | – | | | | – | | | | – | | | | – | | | |
| Total Distributions | | | (0.19) | | | | (0.07) | | | | (0.11) | | | | (0.06) | | | | – | | | |
| Net Asset Value, End of Period | | | $8.01 | | | | $6.77 | | | | $8.09 | | | | $6.16 | | | | $6.55 | | | |
| Total Return** | | | 21.30% | | | | (15.47)% | | | | 33.26% | | | | (5.17)% | | | | 10.46% | | | |
| Net Assets, End of Period (in thousands) | | | $202 | | | | $59 | | | | $45 | | | | $10 | | | | $1 | | | |
| Average Net Assets for the Period (in thousands) | | | $70 | | | | $40 | | | | $29 | | | | $8 | | | | $1 | | | |
| Ratio of Gross Expenses (Absent the Waiver of Certain Fees and Expense Offsets) to Average Net Assets*** | | | 1.27% | | | | 1.41% | | | | 2.41% | | | | 4.81% | | | | 13.96% | | | |
| Ratio of Net Expenses (After Waivers and Expense Offsets) to Average Net Assets*** | | | 1.26% | | | | 1.25% | | | | 0.54%(4) | | | | 0.31%(4) | | | | 1.25% | | | |
| Ratio of Net Investment Income/(Loss) to Average Net Assets*** | | | 1.24% | | | | 1.80% | | | | 3.12% | | | | 2.47% | | | | (0.35)% | | | |
| Portfolio Turnover Rate | | | 143% | | | | 140% | | | | 179% | | | | 119%^ | | | | 115% | | | |
| | | |
| * | | See Note 4 in Notes to Financial Statements. |
| ** | | Total return not annualized for periods of less than one full year. |
| *** | | Annualized for periods of less than one full year. |
| ^ | | Rate has been adjusted to conform with current year presentation. |
| (1) | | Period from December 15, 2011 (inception date) through June 30, 2012. |
| (2) | | Period from August 1, 2009 through June 30, 2010. The Fund changed its fiscal year end from July 31 to June 30. |
| (3) | | Period from July 6, 2009 (inception date) through July 31, 2009. |
| (4) | | Pursuant to a contractual agreement, Janus waived certain fees and expenses during the period. The Ratio of Net Expenses (After Waivers and Expense Offsets) to Average Net Assets would have been 1.25% in 2011 and 1.25% in 2010 without the waiver of these fees and expenses. |
See Notes to Financial Statements.
Janus Mathematical Funds | 85
Financial Highlights (continued)
Class T Shares
| | | | | | | | | | | | | | | | | | | | | | | | | | | |
For a share outstanding during each year or period ended
| | INTECH U.S. Core Fund | | |
| June 30 and each year ended October 31 | | 2013 | | 2012 | | 2011 | | 2010(1) | | 2009 | | 2008 | | |
| |
| Net Asset Value, Beginning of Period | | | $14.74 | | | | $14.31 | | | | $10.74 | | | | $10.56 | | | | $10.21 | | | | $17.38 | | | |
| Income from Investment Operations: | | | | | | | | | | | | | | | | | | | | | | | | | | |
| Net investment income | | | 0.18 | | | | 0.15 | | | | 0.12 | | | | 0.12 | | | | 0.18 | | | | 0.24 | | | |
| Net gain/(loss) on investments (both realized and unrealized) | | | 2.97 | | | | 0.40 | | | | 3.58 | | | | 0.14 | | | | 0.46 | | | | (5.75) | | | |
| Total from Investment Operations | | | 3.15 | | | | 0.55 | | | | 3.70 | | | | 0.26 | | | | 0.64 | | | | (5.51) | | | |
| Less Distributions and Other: | | | | | | | | | | | | | | | | | | | | | | | | | | |
| Dividends (from net investment income)* | | | (0.22) | | | | (0.12) | | | | (0.13) | | | | (0.08) | | | | (0.29) | | | | (0.24) | | | |
| Distributions (from capital gains)* | | | – | | | | – | | | | – | | | | – | | | | – | | | | (1.42) | | | |
| Redemption fees | | | N/A | | | | –(2) | | | | –(2) | | | | –(2) | | | | –(2) | | | | –(2) | | | |
| Total Distributions and Other | | | (0.22) | | | | (0.12) | | | | (0.13) | | | | (0.08) | | | | (0.29) | | | | (1.66) | | | |
| Net Asset Value, End of Period | | | $17.67 | | | | $14.74 | | | | $14.31 | | | | $10.74 | | | | $10.56 | | | | $10.21 | | | |
| Total Return** | | | 21.58% | | | | 3.93% | | | | 34.53% | | | | 2.39% | | | | 6.70% | | | | (34.82)% | | | |
| Net Assets, End of Period (in thousands) | | | $109,408 | | | | $83,640 | | | | $74,483 | | | | $58,922 | | | | $222,932 | | | | $246,935 | | | |
| Average Net Assets for the Period (in thousands) | | | $92,764 | | | | $75,220 | | | | $66,619 | | | | $140,726 | | | | $215,954 | | | | $386,247 | | | |
| Ratio of Gross Expenses (Absent the Waiver of Certain Fees and Expense Offsets) to Average Net Assets*** | | | 0.92% | | | | 0.91% | | | | 0.92% | | | | 0.79% | | | | 0.91% | | | | 0.75% | | | |
| Ratio of Net Expenses (After Waivers and Expense Offsets) to Average Net Assets*** | | | 0.92% | | | | 0.91% | | | | 0.92% | | | | 0.79% | | | | 0.91% | | | | 0.75% | | | |
| Ratio of Net Investment Income to Average Net Assets*** | | | 1.11% | | | | 1.14% | | | | 0.87% | | | | 1.16% | | | | 1.78% | | | | 1.55% | | | |
| Portfolio Turnover Rate | | | 67% | | | | 73% | | | | 93% | | | | 80%^ | | | | 111% | | | | 74% | | | |
Class T Shares
| | | | | | | | | | | | | | | | | | | | | | | |
For a share outstanding during each year or period ended June 30 and the
| | INTECH U.S. Growth Fund | | |
| period ended July 31, 2009 | | 2013 | | 2012 | | 2011 | | 2010(3) | | 2009(4) | | |
| |
| Net Asset Value, Beginning of Period | | | $14.33 | | | | $13.96 | | | | $10.48 | | | | $9.76 | | | | $8.98 | | | |
| Income from Investment Operations: | | | | | | | | | | | | | | | | | | | | | | |
| Net investment income | | | 0.26 | | | | 0.12 | | | | 0.11 | | | | 0.06 | | | | 0.01 | | | |
| Net gain/(loss) on investments (both realized and unrealized) | | | 2.24 | | | | 0.33 | | | | 3.54 | | | | 0.73 | | | | 0.77 | | | |
| Total from Investment Operations | | | 2.50 | | | | 0.45 | | | | 3.65 | | | | 0.79 | | | | 0.78 | | | |
| Less Distributions and Other: | | | | | | | | | | | | | | | | | | | | | | |
| Dividends (from net investment income)* | | | (0.21) | | | | (0.10) | | | | (0.17) | | | | (0.07) | | | | – | | | |
| Distributions (from capital gains)* | | | – | | | | – | | | | – | | | | – | | | | – | | | |
| Redemption fees | | | N/A | | | | 0.02 | | | | – | | | | – | | | | – | | | |
| Total Distributions and Other | | | (0.21) | | | | (0.08) | | | | (0.17) | | | | (0.07) | | | | – | | | |
| Net Asset Value, End of Period | | | $16.62 | | | | $14.33 | | | | $13.96 | | | | $10.48 | | | | $9.76 | | | |
| Total Return** | | | 17.61% | | | | 3.45% | | | | 34.99% | | | | 8.11% | | | | 8.69% | | | |
| Net Assets, End of Period (in thousands) | | | $15,642 | | | | $85 | | | | $58 | | | | $14 | | | | $1 | | | |
| Average Net Assets for the Period (in thousands) | | | $4,390 | | | | $74 | | | | $33 | | | | $10 | | | | $1 | | | |
| Ratio of Gross Expenses (Absent the Waiver of Certain Fees and Expense Offsets) to Average Net Assets*** | | | 0.81% | | | | 0.83% | | | | 0.76% | | | | 0.85% | | | | 0.86% | | | |
| Ratio of Net Expenses (After Waivers and Expense Offsets) to Average Net Assets*** | | | 0.81% | | | | 0.81% | | | | 0.76% | | | | 0.85% | | | | 0.85% | | | |
| Ratio of Net Investment Income to Average Net Assets*** | | | 0.82% | | | | 0.79% | | | | 0.63% | | | | 0.67% | | | | 0.72% | | | |
| Portfolio Turnover Rate | | | 81% | | | | 84% | | | | 96% | | | | 117%^ | | | | 119% | | | |
| | | |
| * | | See Note 4 in Notes to Financial Statements. |
| ** | | Total return not annualized for periods of less than one full year. |
| *** | | Annualized for periods of less than one full year. |
| ^ | | Rate has been adjusted to conform with current year presentation. |
| (1) | | Period from November 1, 2009 through June 30, 2010. The Fund changed its fiscal year end from October 31 to June 30. |
| (2) | | Redemption fees aggregated less than $0.01 on a per share basis. Redemption fees were eliminated effective April 2, 2012. |
| (3) | | Period from August 1, 2009 through June 30, 2010. The Fund changed its fiscal year end from July 31 to June 30. |
| (4) | | Period from July 6, 2009 (inception date) through July 31, 2009. |
See Notes to Financial Statements.
86 | JUNE 30, 2013
Class T Shares
| | | | | | | | | | | | | | | | | | | | | | | |
For a share outstanding during each year or period ended June 30 and the
| | INTECH U.S. Value Fund | | |
| period ended July 31, 2009 | | 2013 | | 2012 | | 2011 | | 2010(1) | | 2009(2) | | |
| |
| Net Asset Value, Beginning of Period | | | $10.18 | | | | $10.05 | | | | $7.87 | | | | $7.37 | | | | $6.63 | | | |
| Income from Investment Operations: | | | | | | | | | | | | | | | | | | | | | | |
| Net investment income | | | 0.19 | | | | 0.13 | | | | 0.15 | | | | 0.05 | | | | 0.01 | | | |
| Net gain on investments (both realized and unrealized) | | | 2.31 | | | | 0.13 | | | | 2.15 | | | | 0.49 | | | | 0.73 | | | |
| Total from Investment Operations | | | 2.50 | | | | 0.26 | | | | 2.30 | | | | 0.54 | | | | 0.74 | | | |
| Less Distributions: | | | | | | | | | | | | | | | | | | | | | | |
| Dividends (from net investment income)* | | | (0.20) | | | | (0.13) | | | | (0.12) | | | | (0.04) | | | | – | | | |
| Distributions (from capital gains)* | | | – | | | | – | | | | – | | | | – | | | | – | | | |
| Total Distributions | | | (0.20) | | | | (0.13) | | | | (0.12) | | | | (0.04) | | | | – | | | |
| Net Asset Value, End of Period | | | $12.48 | | | | $10.18 | | | | $10.05 | | | | $7.87 | | | | $7.37 | | | |
| Total Return** | | | 24.84% | | | | 2.73% | | | | 29.29% | | | | 7.31% | | | | 11.16% | | | |
| Net Assets, End of Period (in thousands) | | | $479 | | | | $58 | | | | $17 | | | | $33 | | | | $1 | | | |
| Average Net Assets for the Period (in thousands) | | | $205 | | | | $36 | | | | $35 | | | | $20 | | | | $1 | | | |
| Ratio of Gross Expenses (Absent the Waiver of Certain Fees and Expense Offsets) to Average Net Assets*** | | | 0.91% | | | | 0.89% | | | | 0.95% | | | | 0.99% | | | | 1.47% | | | |
| Ratio of Net Expenses (After Waivers and Expense Offsets) to Average Net Assets*** | | | 0.89% | | | | 0.89% | | | | 0.95% | | | | 1.00% | | | | 1.00% | | | |
| Ratio of Net Investment Income to Average Net Assets*** | | | 1.28% | | | | 1.54% | | | | 1.39% | | | | 1.20% | | | | 2.08% | | | |
| Portfolio Turnover Rate | | | 100% | | | | 100% | | | | 108% | | | | 92%^ | | | | 100% | | | |
| | | |
| * | | See Note 4 in Notes to Financial Statements. |
| ** | | Total return not annualized for periods of less than one full year. |
| *** | | Annualized for periods of less than one full year. |
| ^ | | Rate has been adjusted to conform with current year presentation. |
| (1) | | Period from August 1, 2009 through June 30, 2010. The Fund changed its fiscal year end from July 31 to June 30. |
| (2) | | Period from July 6, 2009 (inception date) through July 31, 2009. |
See Notes to Financial Statements.
Janus Mathematical Funds | 87
Notes to Financial Statements
The following section describes the organization and significant accounting policies and provides more detailed information about the schedules and tables that appear throughout this report. In addition, the Notes to Financial Statements explain the methods used in preparing and presenting this report.
| |
| 1. | Organization and Significant Accounting Policies |
INTECH Global Dividend Fund, INTECH International Fund, INTECH U.S. Core Fund, INTECH U.S. Growth Fund and INTECH U.S. Value Fund (individually, a “Fund” and collectively, the “Funds”) are series funds. The Funds are part of Janus Investment Fund (the “Trust”), which is organized as a Massachusetts business trust and is registered under the Investment Company Act of 1940, as amended (the “1940 Act”), as an open-end management investment company. The financial statements include information for the year ended June 30, 2013. The Trust offers forty-four funds which include multiple series of shares, with differing investment objectives and policies. Each Fund in this report is classified as diversified, as defined in the 1940 Act.
Each Fund in this report offers multiple classes of shares in order to meet the needs of various types of investors. Each class represents an interest in the same portfolio of investments. Certain financial intermediaries may not offer all classes of shares.
Class A Shares and Class C Shares are generally offered through financial intermediary platforms including, but not limited to, traditional brokerage platforms, mutual fund wrap fee programs, bank trust platforms, and retirement platforms. The maximum purchase in Class C Shares is $500,000 for any single purchase.
Class D Shares are generally no longer being made available to new investors. The Shares are available only to investors who hold accounts directly with the Janus funds and to immediate family members or members of the same household of an eligible individual investor. The Shares are not offered through financial intermediaries.
Class I Shares are available through certain financial intermediary platforms including, but not limited to, mutual fund wrap fee programs, managed account programs, asset allocation programs, and bank trust platforms, as well as certain retirement platforms. Class I Shares are also available to certain institutional investors including, but not limited to, corporations, certain retirement plans, public plans, and foundations/endowments.
Class S Shares are offered through financial intermediary platforms including, but not limited to, retirement platforms and asset allocation, mutual fund wrap, or other discretionary or nondiscretionary fee-based investment advisory programs. In addition, Class S Shares may be available through certain financial intermediaries who have an agreement with Janus Capital Management LLC (“Janus Capital”) or its affiliates to offer Class S Shares on their supermarket platforms.
Class T Shares are available through certain financial intermediary platforms including, but not limited to, mutual fund wrap fee programs, managed account programs, asset allocation programs, bank trust platforms, as well as certain retirement platforms. In addition, Class T Shares may be available through certain financial intermediaries who have an agreement with Janus Capital or its affiliates to offer Class T Shares on their supermarket platforms.
The following accounting policies have been followed by the Funds and are in conformity with accounting principles generally accepted in the United States of America.
Investment Valuation
Securities are valued at the last sales price or the official closing price for securities traded on a principal securities exchange (U.S. or foreign) and on the NASDAQ National Market. Securities traded on over-the-counter (“OTC”) markets and listed securities for which no sales are reported are valued at the latest bid price (or yield equivalent thereof) obtained from one or more dealers transacting in a market for such securities or by a pricing service approved by the Funds’ Trustees. Short-term securities with maturities of 60 days or less may be valued at amortized cost, which approximates market value. Debt securities with a remaining maturity of greater than 60 days are valued in accordance with the evaluated bid price supplied by the pricing service. The evaluated bid price supplied by the pricing service is an evaluation that reflects such factors as security prices, yields, maturities and ratings. Short positions shall be valued in accordance with the same methodologies, except that in the event that a last sale price is not available, the latest ask price shall be used instead of a bid price. Foreign securities and currencies are converted to U.S. dollars using the applicable exchange rate in effect as of the daily close of the New York Stock Exchange (“NYSE”). When market quotations are not readily available or deemed unreliable, or events or circumstances that may affect the value of portfolio securities held by the Funds are identified between the closing of their principal markets and the time the net asset value (“NAV”) is determined, securities may be valued at fair value as determined in good faith under procedures established by and under the supervision of the Funds’ Trustees. Circumstances in which fair value pricing may be utilized include, but are not limited to: (i) a significant event that may affect the securities of a single issuer, such as a merger, bankruptcy, or significant issuer specific development; (ii) an event
88 | JUNE 30, 2013
that may affect an entire market, such as a natural disaster or significant governmental action; (iii) a nonsignificant event such as a market closing early or not opening, or a security trading halt; and (iv) pricing of a non-valued security and a restricted or non-public security. The Funds use systematic fair valuation models provided by independent third parties to value international equity securities in order to adjust for stale pricing, which may occur between the close of certain foreign exchanges and the close of the NYSE. Restricted and illiquid securities are valued in accordance with procedures established by the Funds’ Trustees.
Investment Transactions and Investment Income
Investment transactions are accounted for as of the date purchased or sold (trade date). Dividend income is recorded on the ex-dividend date. Certain dividends from foreign securities will be recorded as soon as the Trust is informed of the dividend, if such information is obtained subsequent to the ex-dividend date. Dividends from foreign securities may be subject to withholding taxes in foreign jurisdictions. Interest income is recorded on the accrual basis and includes amortization of premiums and accretion of discounts. Gains and losses are determined on the identified cost basis, which is the same basis used for federal income tax purposes. Income, as well as gains and losses, both realized and unrealized, are allocated daily to each class of shares based upon the ratio of net assets represented by each class as a percentage of total net assets.
Expenses
Each Fund bears expenses incurred specifically on its behalf, as well as a portion of general expenses, which may be allocated pro rata to each Fund. Each class of shares bears expenses incurred specifically on its behalf and, in addition, each class bears a portion of general expenses, which are allocated daily to each class of shares based upon the ratio of net assets represented by each class as a percentage of total net assets. Expenses directly attributable to a specific class of shares are charged against the operations of such class.
Estimates
The preparation of financial statements in conformity with accounting principles generally accepted in the United States of America requires management to make estimates and assumptions that affect the reported amount of assets and liabilities and disclosure of contingent assets and liabilities at the date of the financial statements, and the reported amounts of income and expenses during the reporting period. Actual results could differ from those estimates.
Foreign Currency Translations
The Funds do not isolate that portion of the results of operations resulting from the effect of changes in foreign exchange rates on investments from the fluctuations arising from changes in market prices of securities held at the date of the financial statements. Net unrealized appreciation or depreciation of investments and foreign currency translations arise from changes in the value of assets and liabilities, including investments in securities held at the date of the financial statements, resulting from changes in the exchange rates and changes in market prices of securities held.
Currency gains and losses are also calculated on payables and receivables that are denominated in foreign currencies. The payables and receivables are generally related to foreign security transactions and income translations.
Foreign currency-denominated assets and forward currency contracts may involve more risks than domestic transactions, including currency risk, political and economic risk, regulatory risk and equity risk. Risks may arise from the potential inability of a counterparty to meet the terms of a contract and from unanticipated movements in the value of foreign currencies relative to the U.S. dollar.
Dividend Distributions
Dividends of net investment income for INTECH Global Dividend Fund are normally declared and distributed monthly, and realized capital gains (if any) are distributed annually. The other Funds generally declare and distribute dividends of net investment income and realized capital gains (if any) annually.
The Funds may make certain investments in real estate investment trusts (“REITs”) which pay dividends to their shareholders based upon funds available from operations. It is quite common for these dividends to exceed the REITs’ taxable earnings and profits, resulting in the excess portion of such dividends being designated as a return of capital. If the Funds distribute such amounts, such distributions could constitute a return of capital to shareholders for federal income tax purposes.
Federal Income Taxes
Each Fund intends to continue to qualify as a regulated investment company and distribute all of its taxable income. Management has analyzed each Fund’s tax positions taken for all open federal income tax years, generally a three-year period, and has concluded that no provision for federal income tax is required in the Funds’ financial statements.
Janus Mathematical Funds | 89
Notes to Financial Statements (continued)
Valuation Inputs Summary
In accordance with FASB guidance, the Funds utilize the “Fair Value Measurements” to define fair value, establish a framework for measuring fair value, and expand disclosure requirements regarding fair value measurements. The Fair Value Measurement Standard does not require new fair value measurements, but is applied to the extent that other accounting pronouncements require or permit fair value measurements. This standard emphasizes that fair value is a market-based measurement that should be determined based on the assumptions that market participants would use in pricing an asset or liability. Various inputs are used in determining the value of the Funds’ investments defined pursuant to this standard. These inputs are summarized into three broad levels:
Level 1 – Quoted prices in active markets for identical securities.
Level 2 – Prices determined using other significant observable inputs. Observable inputs are inputs that reflect the assumptions market participants would use in pricing a security and are developed based on market data obtained from sources independent of the reporting entity. These may include quoted prices for similar securities, interest rates, prepayment speeds, credit risk, and others.
Debt securities are valued in accordance with the evaluated bid price supplied by the pricing service and generally categorized as Level 2 in the hierarchy. Securities traded on OTC markets and listed securities for which no sales are reported are valued at the latest bid price (or yield equivalent thereof) obtained from one or more dealers transacting in a market for such securities or by a pricing service approved by the Funds’ Trustees and are categorized as Level 2 in the hierarchy. Short-term securities with maturities of 60 days or less are valued at amortized cost, which approximates market value and are categorized as Level 2 in the hierarchy. Other securities that may be categorized as Level 2 in the hierarchy include, but are not limited to, preferred stocks, bank loans, American Depositary Receipts (“ADRs”), Global Depositary Receipts (“GDRs”), warrants, swaps, investments in mutual funds, OTC options, and forward contracts. The Funds use systematic fair valuation models provided by independent third parties to value international equity securities in order to adjust for stale pricing, which may occur between the close of certain foreign exchanges and the close of the NYSE. These are generally categorized as Level 2 in the hierarchy.
Level 3 – Prices determined using significant unobservable inputs. In situations where quoted prices or observable inputs are unavailable or deemed less relevant (for example, when there is little or no market activity for an investment at the end of the period), unobservable inputs may be used. Unobservable inputs are inputs that reflect the reporting entity’s own assumptions about the factors market participants would use in pricing the security and would be based on the best information available under the circumstances.
For restricted equity securities and private placements where observable inputs are limited, assumptions about market activity and risk are used in employing valuation techniques such as the market approach, the income approach, or the cost approach, as defined under the FASB Guidance. These are categorized as Level 3 in the hierarchy.
There have been no significant changes in valuation techniques used in valuing any such positions held by the Funds since the beginning of the fiscal year.
The inputs or methodology used for valuing securities are not necessarily an indication of the risk associated with investing in those securities. The summary of inputs used as of June 30, 2013 to value the Funds’ investments in securities and other financial instruments is included in the “Valuation Inputs Summary” in the Notes to Schedules of Investments and Other Information.
FASB Accounting Standards Update, “Amendments to Achieve Common Fair Value Measurement and Disclosure Requirements” requires disclosures about amounts and reasons for all transfers in and out of Level 1 and Level 2 fair value measurements. For fair value measurements categorized within Level 3 of the fair value hierarchy, the Funds shall provide quantitative information about the significant unobservable inputs used in the fair value measurement. To meet the objective of the quantitative disclosure, the Funds may need to further disaggregate to provide more meaningful information about the significant unobservable inputs used and how these inputs vary over time.
The Funds are not required to create quantitative information to comply with this disclosure requirement if quantitative unobservable inputs are not developed by the Funds when measuring fair value (for example, when a Fund uses prices from prior transactions or third-party pricing information without adjustment). However, when providing this disclosure, the Funds cannot ignore quantitative unobservable inputs that are significant to the fair value measurement and are reasonably available to the Funds.
In addition, the Accounting Standards Update requires the Funds to provide a narrative sensitivity disclosure of the
90 | JUNE 30, 2013
fair value measurement changes in unobservable inputs and the interrelationships between those unobservable inputs for fair value measurements categorized within Level 3 of the fair value hierarchy.
The following table shows transfers in or out of Level 1, Level 2 and Level 3 of the fair value hierarchy during the year ended June 30, 2013.
| | | | | | | |
| | | Transfers Out
| | | |
| | | of Level 2 to
| | | |
| Fund | | Level 1 | | | |
| |
| |
| INTECH Global Dividend Fund | | $ | 3,654,880 | | | |
| INTECH International Fund | | | 18,112,802 | | | |
| |
| |
Financial assets were transferred from Level 2 to Level 1 since certain foreign equity prices were applied a fair valuation adjustment factor at the end of the prior fiscal year and no factor was applied at the end of the current fiscal year.
The Funds recognize transfers between the levels as of the beginning of the fiscal year.
| |
| 2. | Other investments and strategies |
Additional Investment Risk
The financial crisis that began in 2008 has caused a significant decline in the value and liquidity of many securities of issuers worldwide in the equity and fixed-income/credit markets. In response to the crisis, the United States and certain foreign governments, along with the U.S. Federal Reserve and certain foreign central banks have taken steps to support the financial markets. The withdrawal of this support, failure of efforts to respond to the crisis, or investor perception that such efforts are not succeeding each could also negatively affect financial markets generally, and the value and liquidity of specific securities. In addition, policy and legislative changes in the United States and in other countries are impacting many aspects of financial regulation. The effect of these changes on the markets, and the practical implications for market participants, including a Fund, may not be fully known for some time. Because the situation is unprecedented and widespread, it may also be unusually difficult to identify both investment risks and opportunities, which could limit or preclude a Fund’s ability to achieve its investment objective. Therefore, it is important to understand that the value of your investment may fall, sometimes sharply, and you could lose money.
The Dodd-Frank Wall Street Reform and Consumer Protection Act (the “Dodd-Frank Act”) in July 2010 is dramatically changing the way in which the U.S. financial system is supervised and regulated. The Dodd-Frank Act provides for widespread regulation of financial institutions, consumer financial products and services, broker-dealers, OTC derivatives, investment advisers, credit rating agencies, and mortgage lending, which expands federal oversight in the financial sector, including the investment management industry. Many provisions of the Dodd-Frank Act will be implemented through future rulemaking. Therefore, the ultimate impact of the Dodd-Frank Act and the regulations under the Dodd-Frank Act, on the Funds and the investment management industry as a whole, is not yet certain.
A number of countries in the European Union (“EU”) have experienced severe economic and financial difficulties. As a result, financial markets in the EU have been subject to extreme volatility and declines in asset values and liquidity. Responses to these financial problems by European governments, central banks, and others, including austerity measures and reforms, may not work, may result in social unrest, and may limit future growth and economic recovery or have other unintended consequences. Further defaults or restructuring by governments and others of their debt could have additional adverse effects on economies, financial markets, and asset valuations around the world.
Certain areas of the world have historically been prone to and economically sensitive to environmental events such as, but not limited to, hurricanes, earthquakes, typhoons, flooding, tidal waves, tsunamis, erupting volcanoes, wildfires or droughts, tornadoes, mudslides, or other weather-related phenomena. Such disasters, and the resulting physical or economic damage, could have a severe and negative impact on a Fund’s investment portfolio and, in the longer term, could impair the ability of issuers in which the Fund invests to conduct their businesses as they would under normal conditions. Adverse weather conditions may also have a particularly significant negative effect on issuers in the agricultural sector and on insurance companies that insure against the impact of natural disasters.
Counterparties
Fund transactions involving a counterparty are subject to the risk that the counterparty or a third party will not fulfill its obligation to a Fund (“counterparty risk”). Counterparty risk may arise because of the counterparty’s financial condition (i.e., financial difficulties, bankruptcy, or insolvency), market activities and developments, or other reasons, whether foreseen or not. A counterparty’s inability to fulfill its obligation may result in significant financial loss to a Fund. A Fund may be unable to recover its investment from the counterparty or may obtain a limited recovery, and/or recovery may be delayed. The extent of a Fund’s exposure to counterparty risk in respect to financial assets approximates its carrying value as recorded on the Fund’s Statement of Assets and Liabilities.
A Fund may be exposed to counterparty risk through participation in various programs including, but not limited
Janus Mathematical Funds | 91
Notes to Financial Statements (continued)
to, lending its securities to third parties, cash sweep arrangements whereby a Fund’s cash balance is invested in one or more types of cash management vehicles, as well as investments in, but not limited to, repurchase agreements, debt securities, and derivatives, including various types of swaps, futures and options. A Fund intends to enter into financial transactions with counterparties that Janus Capital believes to be creditworthy at the time of the transaction. There is always the risk that Janus Capital’s analysis of a counterparty’s creditworthiness is incorrect or may change due to market conditions. To the extent that a Fund focuses its transactions with a limited number of counterparties, it will have greater exposure to the risks associated with one or more counterparties.
Real Estate Investing
To the extent that real estate-related securities may be included in a Fund’s named benchmark index, INTECH’s mathematical investment process may select equity and debt securities of real estate-related companies. Such companies may include those in the real estate industry or real estate-related industries. These securities may include common stocks, preferred stocks, and other equity securities, including, but not limited to, mortgage-backed securities, real estate-backed securities, securities of REITs and similar REIT-like entities. A REIT is a trust that invests in real estate-related projects, such as properties, mortgage loans, and construction loans. REITs are generally categorized as equity, mortgage, or hybrid REITs. A REIT may be listed on an exchange or traded OTC.
| |
| 3. | Investment Advisory Agreements and Other Transactions with Affiliates |
Each Fund pays Janus Capital an investment advisory fee which is calculated daily and paid monthly. The following table reflects each Fund’s contractual investment advisory fee rate or base fee rate, as applicable (expressed as an annual rate).
| | | | | | | | | |
| | | | | Contractual
| | |
| | | | | Investment
| | |
| | | | | Advisory Fee/
| | |
| | | Average Daily Net
| | Base Fee Rate (%)
| | |
| Fund | | Assets of the Fund | | (annual rate) | | |
| |
| |
| INTECH Global Dividend Fund | | | All Asset Levels | | | 0.55 | | |
| INTECH International Fund | | | All Asset Levels | | | 0.55 | | |
| INTECH U.S. Core Fund | | | N/A | | | 0.50 | | |
| INTECH U.S. Growth Fund | | | All Asset Levels | | | 0.50 | | |
| INTECH U.S. Value Fund | | | All Asset Levels | | | 0.50 | | |
| |
| |
For INTECH U.S. Core Fund, the investment advisory fee rate is determined by calculating a base fee and applying a performance adjustment. The base fee rate is the same as the contractual investment advisory fee rate shown in the table above. The performance adjustment either increases or decreases the base fee depending on how well the Fund has performed relative to its benchmark index, as shown below:
| | | | | | |
| Fund | | Benchmark Index | | |
| |
| |
| INTECH U.S. Core Fund | | | S&P 500® Index | | |
| |
| |
The calculation of the performance adjustment applies as follows:
Investment Advisory Fee = Base Fee Rate +/- Performance Adjustment
The investment advisory fee rate paid to Janus Capital by INTECH U.S. Core Fund consists of two components: (1) a base fee calculated by applying the contractual fixed rate of the advisory fee to the Fund’s average daily net assets during the previous month (“Base Fee Rate”), plus or minus (2) a performance-fee adjustment (“Performance Adjustment”) calculated by applying a variable rate of up to 0.15% (positive or negative) to the Fund’s average daily net assets during the applicable performance measurement period. The Performance Adjustment is based on a rolling 36-month performance measurement period. Any applicable Performance Adjustments began January 2007 for the Fund.
No Performance Adjustment is applied unless the difference between the Fund’s investment performance and the cumulative investment record of the Fund’s benchmark index is 0.50% or greater (positive or negative) during the applicable performance measurement period. The Base Fee Rate is subject to an upward or downward Performance Adjustment for every full 0.50% increment by which the Fund outperforms or underperforms its benchmark index. Because the Performance Adjustment is tied to the Fund’s relative performance compared to its benchmark index (and not its absolute performance), the Performance Adjustment could increase Janus Capital’s fee even if the Fund’s Shares lose value during the performance measurement period and could decrease Janus Capital’s fee even if the Fund’s Shares increase in value during the performance measurement period. For purposes of computing the Base Fee Rate and the Performance Adjustment, net assets are averaged over different periods (average daily net assets during the previous month for the Base Fee Rate, versus average daily net assets during the performance measurement period for the Performance Adjustment). Performance of the Fund is calculated net of expenses, whereas the Fund’s benchmark index does not have any fees or expenses. Reinvestment of dividends and distributions is included in calculating both the performance of the Fund and the Fund’s benchmark
92 | JUNE 30, 2013
index. The Base Fee Rate is calculated and accrued daily. The Performance Adjustment is calculated monthly in arrears and is accrued throughout the month. The investment fee is paid monthly in arrears. Under extreme circumstances involving underperformance by a rapidly shrinking Fund, the dollar amount of the Performance Adjustment could be more than the dollar amount of the Base Fee Rate. In such circumstances, Janus Capital would reimburse the Fund.
The application of an expense limit, if any, will have a positive effect upon the Fund’s performance and may result in an increase in the Performance Adjustment. It is possible that the cumulative dollar amount of additional compensation ultimately payable to Janus Capital may, under some circumstances, exceed the cumulative dollar amount of management fees waived by Janus Capital.
The investment performance of the Fund’s Class A Shares (waiving the upfront sales load) for the performance measurement period is used to calculate the Performance Adjustment. After Janus Capital determines whether the Fund’s performance was above or below its benchmark index by comparing the investment performance of the Fund’s load-waived Class A Shares against the cumulative investment record of the Fund’s benchmark index, Janus Capital applies the same Performance Adjustment (positive or negative) across each other class of shares of the Fund, as applicable.
It is not possible to predict the effect of the Performance Adjustment on future overall compensation to Janus Capital since it depends on the performance of INTECH U.S. Core Fund relative to the record of the Fund’s benchmark index and future changes to the size of INTECH U.S. Core Fund.
INTECH U.S. Core Fund’s prospectuses and statement of additional information contain additional information about performance-based fees. The amount shown as advisory fees on the Statements of Operations reflects the Base Fee Rate plus/minus any Performance Adjustment, if applicable.
During the year ended June 30, 2013, INTECH U.S. Core Fund recorded a Performance Adjustment as indicated in the table below:
| | | | | | |
| | | Performance
| | |
| Fund | | Adjustment | | |
| |
| |
| INTECH U.S. Core Fund | | $ | 370,651 | | |
| |
| |
INTECH Investment Management LLC (“INTECH”) serves as subadviser to each Fund. Janus Capital owns approximately 97% of INTECH.
Janus Capital pays INTECH a subadvisory fee rate equal to 50% of the investment advisory fee paid by the Funds to Janus Capital (calculated after any applicable performance fee adjustment for INTECH U.S. Core Fund, and after any fee waivers and expense reimbursements for INTECH Global Dividend Fund, INTECH International Fund and INTECH U.S. Value Fund). The subadvisory fee paid by Janus Capital to INTECH on behalf of INTECH U.S. Core Fund adjusts up or down based on the Fund’s performance relative to its benchmark index over the performance measurement period.
Janus Services LLC (“Janus Services”), a wholly-owned subsidiary of Janus Capital, is the Funds’ transfer agent. In addition, Janus Services provides or arranges for the provision of certain other administrative services including, but not limited to, recordkeeping, accounting, order processing, and other shareholder services for the Funds.
Certain, but not all, intermediaries charge administrative fees to investors in Class A Shares, Class C Shares, and Class I Shares for administrative services provided on behalf of such investors. These administrative fees are paid by the Class A Shares, Class C Shares, and Class I Shares of the Funds to Janus Services, which uses such fees to reimburse intermediaries. Consistent with the Transfer Agency Agreement between Janus Services and the Funds, Janus Services may negotiate the level, structure, and/or terms of the administrative fees with intermediaries requiring such fees on behalf of the Funds. Janus Capital and its affiliates benefit from an increase in assets that may result from such relationships.
Class D Shares pay an annual administrative services fee of 0.12% of net assets. These administrative services fees are paid by Class D Shares for shareholder services provided by Janus Services.
Janus Services receives an administrative services fee at an annual rate of up to 0.25% of the average daily net assets of Class S Shares and Class T Shares of the Funds for providing or procuring administrative services to investors in Class S Shares and Class T Shares of the Funds. Janus Services expects to use all or a significant portion of this fee to compensate retirement plan service providers, broker-dealers, bank trust departments, financial advisors, and other financial intermediaries for providing these services. Janus Services or its affiliates may also pay fees for services provided by intermediaries to the extent the fees charged by intermediaries exceed the 0.25% of net assets charged to Class S Shares and Class T Shares of each Fund. Janus Services may keep certain amounts retained for reimbursement of out-of-pocket costs incurred for servicing clients of Class S Shares and Class T Shares.
Services provided by these financial intermediaries may include, but are not limited to, recordkeeping, subaccounting, order processing, providing order
Janus Mathematical Funds | 93
Notes to Financial Statements (continued)
confirmations, periodic statements, forwarding prospectuses, shareholder reports, and other materials to existing customers, answering inquiries regarding accounts, and other administrative services. Order processing includes the submission of transactions through the National Securities Clearing Corporation (“NSCC”) or similar systems, or those processed on a manual basis with Janus Capital.
Janus Services is compensated for its services related to Class D Shares, and receives reimbursement for its out-of-pocket costs on all other share classes. Included in out-of-pocket expenses are the expenses Janus Services incurs for serving as transfer agent and providing servicing to shareholders.
Janus Distributors LLC (“Janus Distributors”), a wholly-owned subsidiary of Janus Capital, is the distributor of the Funds. The Funds have adopted a Distribution and Shareholder Servicing Plan (the “Plan”) pursuant to Rule 12b-1 under the 1940 Act. The Plan authorizes payments by the Funds to intermediaries at an annual rate, as determined from time to time by the Board of Trustees, of up to 0.25% of the Class A Shares average daily net assets, of up to 1.00% of the Class C Shares average daily net assets, and of up to 0.25% of the Class S Shares average daily net assets. Payments under the Plan are not tied exclusively to actual distribution and shareholder service expenses, and the payments may exceed distribution and shareholder service expenses actually incurred by the Funds. If any of a Fund’s actual distribution and shareholder service expenses incurred during a calendar year are less than the payments made during a calendar year, the Fund will be refunded the difference. Refunds, if any, are included in “Distribution fees and shareholder servicing fees” in the Statements of Operations.
Janus Capital has contractually agreed to waive the advisory fee payable by each Fund listed below in an amount equal to the amount, if any, that the Fund’s normal operating expenses in any fiscal year, including the investment advisory fee, but excluding any performance adjustments to management fees, the distribution and shareholder servicing fees (applicable to Class A Shares, Class C Shares, and Class S Shares), administrative services fees payable pursuant to the Transfer Agency Agreement, brokerage commissions, interest, dividends, taxes, acquired fund fees and expenses, and extraordinary expenses, exceed the annual rates shown below. Janus Capital has agreed to continue each waiver until at least November 1, 2013. If applicable, amounts reimbursed to the Funds by Janus Capital are disclosed as “Excess Expense Reimbursement” on the Statements of Operations.
| | | | | | |
| | | Expense
| | |
| Fund | | Limit (%) | | |
| |
| |
| INTECH Global Dividend Fund | | | 0.50 | | |
| INTECH International Fund | | | 1.00 | | |
| INTECH U.S. Core Fund | | | 0.89 | | |
| INTECH U.S. Growth Fund | | | 0.90 | | |
| INTECH U.S. Value Fund | | | 0.75 | | |
| |
| |
For a period of three years subsequent to INTECH Global Dividend Fund’s commencement of operations, Janus Capital may recover from the Fund fees and expenses previously waived or reimbursed, which could be then considered a deferral, if the Fund’s expense ratio, including recovered expenses, falls below the expense limit. The recoupment of such reimbursements expires December 15, 2014. For the year ended June 30, 2013, total reimbursement by Janus Capital was $170,590 for the Fund. As of June 30, 2013, the aggregate amount of recoupment that may potentially be made to Janus Capital is $342,832.
The Board of Trustees has adopted a deferred compensation plan (the “Deferred Plan”) for independent Trustees to elect to defer receipt of all or a portion of the annual compensation they are entitled to receive from the Funds. All deferred fees are credited to an account established in the name of the Trustees. The amounts credited to the account then increase or decrease, as the case may be, in accordance with the performance of one or more of the Janus funds that are selected by the Trustees. The account balance continues to fluctuate in accordance with the performance of the selected fund or funds until final payment of all amounts are credited to the account. The fluctuation of the account balance is recorded by the Funds as unrealized appreciation/(depreciation) and is shown as of June 30, 2013 on the Statements of Assets and Liabilities as an asset, “Non-interested Trustees’ deferred compensation,” and a liability, “Non-interested Trustees’ deferred compensation fees.” Additionally, the recorded unrealized appreciation/(depreciation) is included in “Unrealized net appreciation/(depreciation) of investments, foreign currency translations and non-interested Trustees’ deferred compensation” on the Statements of Assets and Liabilities. Deferred compensation expenses for the year ended June 30, 2013 are included in “Non-interested Trustees’ fees and expenses” on the Statements of Operations. Trustees are allowed to change their designation of mutual funds from time to time. Amounts will be deferred until distributed in accordance with the Deferred Plan. Deferred fees of $243,941 were paid by the Trust to a Trustee under the Deferred Plan during the year ended June 30, 2013.
Certain officers of the Funds may also be officers and/or directors of Janus Capital. Each Fund pays for the salaries, fees, and expenses of certain Janus Capital
94 | JUNE 30, 2013
employees and Fund officers, with respect to certain specified administration functions they perform on behalf of the Funds. Administration costs are separate and apart from advisory fees and other expenses paid in connection with the investment advisory services Janus Capital (or the subadviser) provides to each Fund. Some expenses related to compensation payable to the Funds’ Chief Compliance Officer and compliance staff are shared with the Funds. Total compensation of $487,826 was paid to the Chief Compliance Officer and certain compliance staff by the Trust during the year ended June 30, 2013. Each Fund’s portion is reported as part of “Other Expenses” on the Statements of Operations.
Class A Shares include a 5.75% upfront sales charge of the offering price of the Funds. The sales charge is allocated between Janus Distributors and financial intermediaries. During the year ended June 30, 2013, Janus Distributors retained the following upfront sales charges:
| | | | | | |
| | | Upfront
| | |
| Fund (Class A Shares) | | Sales Charge | | |
| |
| |
| INTECH Global Dividend Fund | | $ | 1,937 | | |
| INTECH International Fund | | | 511 | | |
| INTECH U.S. Core Fund | | | 3,965 | | |
| INTECH U.S. Growth Fund | | | 536 | | |
| INTECH U.S. Value Fund | | | 588 | | |
| |
| |
A contingent deferred sales charge (“CDSC”) of 1.00% will be deducted with respect to Class A Shares purchased without a sales load and redeemed within 12 months of purchase, unless waived, as discussed in the Prospectus. Any applicable CDSC will be 1.00% of the lesser of the original purchase price or the value of the redemption of the Class A Shares redeemed. There were no CDSCs paid by redeeming shareholders of Class A Shares to Janus Distributors during the year ended June 30, 2013.
Class C Shares include a 1.00% CDSC paid by redeeming shareholders to Janus Distributors. The CDSC applies to shares redeemed within 12 months of purchase. The redemption price may differ from the NAV per share. During the year ended June 30, 2013, redeeming shareholders of Class C Shares paid the following CDSCs:
| | | | | | |
| Fund (Class C Shares) | | CDSC | | |
| |
| |
| INTECH Global Dividend Fund | | $ | 118 | | |
| INTECH U.S. Core Fund | | | 413 | | |
| INTECH U.S. Growth Fund | | | 45 | | |
| |
| |
The Funds’ expenses may be reduced by expense offsets from an unaffiliated custodian and/or transfer agent. Such credits or offsets are included in “Expense and Fee Offset” on the Statements of Operations (if applicable). The Funds could have employed the assets used by the custodian and/or transfer agent to produce income if they had not entered into an expense offset arrangement.
Pursuant to the provisions of the 1940 Act and rules promulgated thereunder, the Funds may participate in an affiliated or nonaffiliated cash sweep program. In the cash sweep program, uninvested cash balances of the Funds may be used to purchase shares of affiliated or nonaffiliated money market funds or cash management pooled investment vehicles. The Funds are eligible to participate in the cash sweep program (the “Investing Funds”). Janus Cash Liquidity Fund LLC is an affiliated unregistered cash management pooled investment vehicle that invests primarily in highly-rated short-term fixed-income securities. Janus Cash Liquidity Fund LLC currently maintains a NAV of $1.00 per share and distributes income daily in a manner consistent with a registered 2a-7 product. There are no restrictions on the Funds’ ability to withdraw investments from Janus Cash Liquidity Fund LLC at will, and there are no unfunded capital commitments due from the Funds to Janus Cash Liquidity Fund LLC. As adviser, Janus Capital has an inherent conflict of interest because of its fiduciary duties to the affiliated cash management pooled investment vehicles and the Investing Funds.
During the year ended June 30, 2013, any recorded distributions from affiliated investments as affiliated dividend income, and affiliated purchases and sales can be found in the Notes to Schedules of Investments and Other Information.
Janus Mathematical Funds | 95
Notes to Financial Statements (continued)
Janus Capital or an affiliate invested and/or redeemed initial seed capital during the year ended June 30, 2013, as indicated in the following table.
| | | | | | | | | | | | | | | | | | | | | |
| | | Seed Capital
| | | | Date of
| | | | Date of
| | Seed Capital
| | |
| Fund | | at 6/30/12 | | Purchases | | Purchases | | Redemptions | | Redemptions | | at 6/30/13 | | |
| |
| |
| INTECH Global Dividend Fund - Class A Shares | | $ | 833,333 | | $ | – | | | – | | $ | (650,522) | | | 2/25/13, 5/1/13 | | $ | 182,811 | | |
| INTECH Global Dividend Fund - Class C Shares | | | 833,333 | | | – | | | – | | | (631,190) | | | 2/25/13, 5/1/13 | | | 202,143 | | |
| INTECH Global Dividend Fund - Class D Shares | | | 833,334 | | | – | | | – | | | (833,334) | | | 2/25/13, 5/1/13 | | | – | | |
| INTECH Global Dividend Fund - Class I Shares | | | 833,333 | | | – | | | – | | | (802,050) | | | 2/25/13, 5/1/13 | | | 31,283 | | |
| INTECH Global Dividend Fund - Class S Shares | | | 833,333 | | | – | | | – | | | (621,559) | | | 2/25/13, 5/1/13 | | | 211,774 | | |
| INTECH Global Dividend Fund - Class T Shares | | | 833,334 | | | – | | | – | | | (694,375) | | | 2/25/13, 5/1/13 | | | 138,959 | | |
| INTECH International Fund - Class A Shares | | | 411,445 | | | – | | | – | | | (411,445) | | | 9/20/12, 2/25/13 | | | – | | |
| INTECH International Fund - Class C Shares | | | 411,445 | | | – | | | – | | | (411,445) | | | 9/20/12, 2/25/13 | | | – | | |
| INTECH International Fund - Class I Shares | | | 686,890 | | | – | | | – | | | (686,890) | | | 9/20/12 | | | – | | |
| INTECH International Fund - Class S Shares | | | 411,445 | | | – | | | – | | | (411,445) | | | 9/20/12, 2/25/13 | | | – | | |
| INTECH International Fund - Class T Shares | | | 11,000 | | | – | | | – | | | (11,000) | | | 2/25/13 | | | – | | |
| INTECH U.S. Value Fund - Class S Shares | | | 190,524 | | | – | | | – | | | (168,977) | | | 9/20/12, 2/25/13 | | | 21,547 | | |
| |
| |
The tax components of capital shown in the table below represent: (1) distribution requirements the Funds must satisfy under the income tax regulations; (2) losses or deductions the Funds may be able to offset against income and gains realized in future years; and (3) unrealized appreciation or depreciation of investments for federal income tax purposes.
Other book to tax differences may consist of deferred compensation, derivatives and foreign currency contract adjustments. The Funds have elected to treat gains and losses on forward foreign currency contracts as capital gains and losses, if applicable. Other foreign currency gains and losses on debt instruments are treated as ordinary income for federal income tax purposes pursuant to Section 988 of the Internal Revenue Code.
| | | | | | | | | | | | | | | | | | | | | | | | |
| | | Undistributed
| | Undistributed
| | | | Loss Deferrals | | Other Book
| | | | |
| | | Ordinary
| | Long-Term
| | Accumulated
| | Late-Year
| | Post-October
| | to Tax
| | Net Tax
| | |
| Fund | | Income | | Gains | | Capital Losses | | Ordinary Loss | | Capital Loss | | Differences | | Appreciation | | |
| |
| |
| INTECH Global Dividend Fund | | $ | 278,582 | | $ | 455,383 | | $ | – | | $ | – | | $ | – | | $ | (562) | | $ | 342,915 | | |
| INTECH International Fund | | | 558,154 | | | – | | | (2,583,629) | | | – | | | – | | | (5,067) | | | 3,677,746 | | |
| INTECH U.S. Core Fund | | | 1,394,779 | | | – | | | (12,191,995) | | | – | | | – | | | (6,958) | | | 81,111,483 | | |
| INTECH U.S. Growth Fund | | | 714,989 | | | – | | | (188,178,781) | | | – | | | – | | | (4,237) | | | 56,042,795 | | |
| INTECH U.S. Value Fund | | | 778,595 | | | 8,988,186 | | | – | | | – | | | – | | | (1,388) | | | 15,018,713 | | |
| |
| |
Accumulated capital losses noted below represent net capital loss carryovers, as of June 30, 2013, that may be available to offset future realized capital gains and thereby reduce future taxable gains distributions. Under the Regulated Investment Company Modernization Act of 2010, the Funds are permitted to carry forward capital losses incurred in taxable years beginning after December 22, 2010 for an unlimited period. Losses incurred during those years will be required to be utilized prior to the losses incurred in pre-enactment taxable years. As a result of this ordering rule, pre-enactment capital loss carryforwards may more likely expire unused. Also, post-enactment capital losses that are carried forward will retain their character as either short-term or long-term capital losses rather than being considered all short-term as under previous law. The following table shows these capital loss carryovers.
Capital Loss Carryover Expiration Schedule
For the year ended June 30, 2013
| | | | | | | | | | | | | | | | | | | | | |
| | | | | | | | | No Expiration | | Accumulated
| | |
| Fund | | June 30, 2016 | | June 30, 2017 | | June 30, 2018 | | Short-Term | | Long-Term | | Capital Losses | | |
| |
| |
INTECH International Fund(1) | | $ | – | | $ | (477,452) | | $ | (2,035,662) | | $ | (70,515) | | $ | – | | $ | (2,583,629) | | |
INTECH U.S. Core Fund(1) | | | (10,191,816) | | | (2,000,179) | | | – | | | – | | | – | | | (12,191,995) | | |
| INTECH U.S. Growth Fund | | | – | | | (7,077,037) | | | (181,101,744) | | | – | | | – | | | (188,178,781) | | |
| |
| |
| | | |
(1) | | Capital loss carryovers subject to annual limitations. |
96 | JUNE 30, 2013
During the year ended June 30, 2013, the following capital loss carryovers were utilized by the Funds as indicated in the table:
| | | | | | | | | | | | | | | |
| | | | | | | | | Capital Loss
| | |
| | | | | | | | | Carryover
| | |
| Fund | | | | | | | | Utilized | | |
| |
| |
| INTECH International Fund | | | | | | | | | | | $ | 2,418,149 | | |
| INTECH U.S. Core Fund | | | | | | | | | | | | 28,983,400 | | |
| INTECH U.S. Growth Fund | | | | | | | | | | | | 38,462,586 | | |
| INTECH U.S. Value Fund | | | | | | | | | | | | 7,398,674 | | |
| |
| |
The aggregate cost of investments and the composition of unrealized appreciation and depreciation of investment securities for federal income tax purposes as of June 30, 2013 are noted below.
Unrealized appreciation and unrealized depreciation in the table below exclude appreciation/(depreciation) on foreign currency translations. The primary differences between book and tax appreciation or depreciation of investments are wash sale loss deferrals and investments in partnerships and passive foreign investment companies.
| | | | | | | | | | | | |
| | | Federal Tax
| | Unrealized
| | Unrealized
| | |
| Fund | | Cost | | Appreciation | | (Depreciation) | | |
| |
| |
| INTECH Global Dividend Fund | | $ | 9,083,144 | | $ | 547,902 | | $ | (204,987) | | |
| INTECH International Fund | | | 56,888,161 | | | 5,321,997 | | | (1,644,251) | | |
| INTECH U.S. Core Fund | | | 348,868,282 | | | 82,903,822 | | | (1,792,339) | | |
| INTECH U.S. Growth Fund | | | 205,920,942 | | | 58,275,677 | | | (2,232,882) | | |
| INTECH U.S. Value Fund | | | 70,811,471 | | | 15,503,819 | | | (485,106) | | |
| |
| |
Income and capital gains distributions are determined in accordance with income tax regulations that may differ from accounting principles generally accepted in the United States of America. These differences are due to differing treatments for items such as net short-term gains, deferral of wash sale losses, foreign currency transactions, passive foreign investment companies, net investment losses and capital loss carryovers. Certain permanent differences such as tax returns of capital and net investment losses noted below have been reclassified to paid-in capital.
For the year ended June 30, 2013
| | | | | | | | | | | | | | | | | | |
| | | Distributions | | | | | | |
| | | From Ordinary
| | From Long-Term
| | Tax Return of
| | Net Investment
| | | | |
| Fund | | Income | | Capital Gains | | Capital | | Loss | | | | |
| |
| |
| INTECH Global Dividend Fund | | $ | 308,551 | | $ | – | | $ | – | | $ | – | | | | | |
| INTECH International Fund | | | 963,306 | | | – | | | – | | | – | | | | | |
| INTECH U.S. Core Fund | | | 4,956,769 | | | – | | | – | | | – | | | | | |
| INTECH U.S. Growth Fund | | | 3,987,618 | | | – | | | – | | | – | | | | | |
| INTECH U.S. Value Fund | | | 2,060,998 | | | – | | | – | | | – | | | | | |
| |
| |
For the year or period ended June 30, 2012
| | | | | | | | | | | | | | | | | | |
| | | Distributions | | | | | | |
| | | From Ordinary
| | From Long-Term
| | Tax Return of
| | Net Investment
| | | | |
| Fund | | Income | | Capital Gains | | Capital | | Loss | | | | |
| |
| |
INTECH Global Dividend Fund(1) | | $ | 119,576 | | $ | – | | $ | – | | $ | – | | | | | |
| INTECH International Fund | | | 313,259 | | | – | | | – | | | – | | | | | |
| INTECH U.S. Core Fund | | | 2,999,640 | | | – | | | – | | | – | | | | | |
| INTECH U.S. Growth Fund | | | 2,678,829 | | | – | | | – | | | – | | | | | |
| INTECH U.S. Value Fund | | | 1,608,528 | | | – | | | – | | | – | | | | | |
| |
| |
| | | |
(1) | | Period from December 15, 2011 (inception date) through June 30, 2012. |
Janus Mathematical Funds | 97
Notes to Financial Statements (continued)
| |
| 5. | Capital Share Transactions |
| | | | | | | | | | | | | | | | | | | | | | | | | | | | | | | | | | | | | | | | | | | |
| | | INTECH
| | | INTECH
| | | INTECH
| | | INTECH
| | | INTECH
| | | |
| | | Global Dividend
| | | International
| | | U.S. Core
| | | U.S. Growth
| | | U.S. Value
| | | |
For each year or period ended June 30
| | Fund | | | Fund | | | Fund | | | Fund | | | Fund | | | |
| (all numbers in thousands) | | 2013 | | | 2012(1) | | | 2013 | | | 2012 | | | 2013 | | | 2012 | | | 2013 | | | 2012 | | | 2013 | | | 2012 | | | |
| |
| Transactions in Fund Shares – Class A Shares: | | | | | | | | | | | | | | | | | | | | | | | | | | | | | | | | | | | | | | | | | | |
| Shares sold | | | 116 | | | | 88 | | | | 42 | | | | – | | | | 388 | | | | 223 | | | | 92 | | | | 130 | | | | 121 | | | | 122 | | | |
| Reinvested dividends and distributions | | | 3 | | | | 1 | | | | 1 | | | | 1 | | | | 10 | | | | 8 | | | | 3 | | | | 4 | | | | 10 | | | | 7 | | | |
| Shares repurchased | | | (68) | | | | – | | | | (50) | | | | – | | | | (394) | | | | (331) | | | | (279) | | | | (281) | | | | (82) | | | | (85) | | | |
| Net Increase/(Decrease) in Fund Shares | | | 51 | | | | 89 | | | | (7) | | | | 1 | | | | 4 | | | | (100) | | | | (184) | | | | (147) | | | | 49 | | | | 44 | | | |
| Shares Outstanding, Beginning of Period | | | 89 | | | | – | | | | 66 | | | | 65 | | | | 916 | | | | 1,016 | | | | 508 | | | | 655 | | | | 541 | | | | 497 | | | |
| Shares Outstanding, End of Period | | | 140 | | | | 89 | | | | 59 | | | | 66 | | | | 920 | | | | 916 | | | | 324 | | | | 508 | | | | 590 | | | | 541 | | | |
| Transactions in Fund Shares – Class C Shares: | | | | | | | | | | | | | | | | | | | | | | | | | | | | | | | | | | | | | | | | | | |
| Shares sold | | | 14 | | | | 89 | | | | – | | | | 60 | | | | 154 | | | | 74 | | | | 33 | | | | 32 | | | | 16 | | | | 7 | | | |
| Reinvested dividends and distributions | | | 2 | | | | 2 | | | | 1 | | | | 1 | | | | 1 | | | | – | | | | – | | | | – | | | | – | | | | – | | | |
| Shares repurchased | | | (65) | | | | – | | | | (51) | | | | (66) | | | | (74) | | | | (109) | | | | (30) | | | | (109) | | | | – | | | | (14) | | | |
| Net Increase/(Decrease) in Fund Shares | | | (49) | | | | 91 | | | | (50) | | | | (5) | | | | 81 | | | | (35) | | | | 3 | | | | (77) | | | | 16 | | | | (7) | | | |
| Shares Outstanding, Beginning of Period | | | 91 | | | | – | | | | 64 | | | | 69 | | | | 439 | | | | 474 | | | | 197 | | | | 274 | | | | 15 | | | | 22 | | | |
| Shares Outstanding, End of Period | | | 42 | | | | 91 | | | | 14 | | | | 64 | | | | 520 | | | | 439 | | | | 200 | | | | 197 | | | | 31 | | | | 15 | | | |
| Transactions in Fund Shares – Class D Shares: | | | | | | | | | | | | | | | | | | | | | | | | | | | | | | | | | | | | | | | | | | |
| Shares sold | | | 393 | | | | 221 | | | | N/A | | | | N/A | | | | 2,156 | | | | 1,621 | | | | N/A | | | | N/A | | | | N/A | | | | N/A | | | |
| Reinvested dividends and distributions | | | 10 | | | | 3 | | | | N/A | | | | N/A | | | | 167 | | | | 118 | | | | N/A | | | | N/A | | | | N/A | | | | N/A | | | |
| Shares repurchased | | | (201) | | | | (19) | | | | N/A | | | | N/A | | | | (1,704) | | | | (1,968) | | | | N/A | | | | N/A | | | | N/A | | | | N/A | | | |
| Net Increase/(Decrease) in Fund Shares | | | 202 | | | | 205 | | | | N/A | | | | N/A | | | | 619 | | | | (229) | | | | N/A | | | | N/A | | | | N/A | | | | N/A | | | |
| Shares Outstanding, Beginning of Period | | | 205 | | | | – | | | | N/A | | | | N/A | | | | 11,861 | | | | 12,090 | | | | N/A | | | | N/A | | | | N/A | | | | N/A | | | |
| Shares Outstanding, End of Period | | | 407 | | | | 205 | | | | N/A | | | | N/A | | | | 12,480 | | | | 11,861 | | | | N/A | | | | N/A | | | | N/A | | | | N/A | | | |
| Transactions in Fund Shares – Class I Shares: | | | | | | | | | | | | | | | | | | | | | | | | | | | | | | | | | | | | | | | | | | |
| Shares sold | | | 49 | | | | 186 | | | | 3,168 | | | | 3,172 | | | | 1,802 | | | | 871 | | | | 1,103 | | | | 1,531 | | | | 493 | | | | 925 | | | |
| Reinvested dividends and distributions | | | 6 | | | | 3 | | | | 125 | | | | 46 | | | | 36 | | | | 29 | | | | 210 | | | | 160 | | | | 174 | | | | 157 | | | |
| Shares repurchased | | | (102) | | | | (7) | | | | (1,080) | | | | (531) | | | | (1,191) | | | | (1,377) | | | | (6,609) | | | | (6,422) | | | | (3,665) | | | | (1,181) | | | |
| Net Increase/(Decrease) in Fund Shares | | | (47) | | | | 182 | | | | 2,213 | | | | 2,687 | | | | 647 | | | | (477) | | | | (5,296) | | | | (4,731) | | | | (2,998) | | | | (99) | | | |
| Shares Outstanding, Beginning of Period | | | 182 | | | | – | | | | 5,258 | | | | 2,571 | | | | 3,402 | | | | 3,879 | | | | 18,425 | | | | 23,156 | | | | 9,202 | | | | 9,301 | | | |
| Shares Outstanding, End of Period | | | 135 | | | | 182 | | | | 7,471 | | | | 5,258 | | | | 4,049 | | | | 3,402 | | | | 13,129 | | | | 18,425 | | | | 6,204 | | | | 9,202 | | | |
| Transactions in Fund Shares – Class S Shares: | | | | | | | | | | | | | | | | | | | | | | | | | | | | | | | | | | | | | | | | | | |
| Shares sold | | | – | | | | 83 | | | | – | | | | 1 | | | | 150 | | | | 108 | | | | 185 | | | | 608 | | | | – | | | | – | | | |
| Reinvested dividends and distributions | | | 2 | | | | 2 | | | | 1 | | | | 1 | | | | 3 | | | | 2 | | | | 10 | | | | 6 | | | | – | | | | – | | | |
| Shares repurchased | | | (62) | | | | – | | | | (48) | | | | (1) | | | | (129) | | | | (133) | | | | (267) | | | | (410) | | | | (17) | | | | – | | | |
| Net Increase/(Decrease) in Fund Shares | | | (60) | | | | 85 | | | | (47) | | | | 1 | | | | 24 | | | | (23) | | | | (72) | | | | 204 | | | | (17) | | | | – | | | |
| Shares Outstanding, Beginning of Period | | | 85 | | | | – | | | | 62 | | | | 61 | | | | 315 | | | | 338 | | | | 1,200 | | | | 996 | | | | 22 | | | | 22 | | | |
| Shares Outstanding, End of Period | | | 25 | | | | 85 | | | | 15 | | | | 62 | | | | 339 | | | | 315 | | | | 1,128 | | | | 1,200 | | | | 5 | | | | 22 | | | |
| Transactions in Fund Shares – Class T Shares: | | | | | | | | | | | | | | | | | | | | | | | | | | | | | | | | | | | | | | | | | | |
| Shares sold | | | 52 | | | | 118 | | | | 22 | | | | 3 | | | | 1,736 | | | | 1,604 | | | | 988 | | | | 6 | | | | 36 | | | | 4 | | | |
| Reinvested dividends and distributions | | | 4 | | | | 2 | | | | – | | | | – | | | | 78 | | | | 46 | | | | 3 | | | | – | | | | – | | | | – | | | |
| Shares repurchased | | | (122) | | | | (1) | | | | (6) | | | | – | | | | (1,295) | | | | (1,181) | | | | (56) | | | | (4) | | | | (4) | | | | – | | | |
| Net Increase/(Decrease) in Fund Shares | | | (66) | | | | 119 | | | | 16 | | | | 3 | | | | 519 | | | | 469 | | | | 935 | | | | 2 | | | | 32 | | | | 4 | | | |
| Shares Outstanding, Beginning of Period | | | 119 | | | | – | | | | 9 | | | | 6 | | | | 5,673 | | | | 5,204 | | | | 6 | | | | 4 | | | | 6 | | | | 2 | | | |
| Shares Outstanding, End of Period | | | 53 | | | | 119 | | | | 25 | | | | 9 | | | | 6,192 | | | | 5,673 | | | | 941 | | | | 6 | | | | 38 | | | | 6 | | | |
| | | |
| (1) | | Period from December 15, 2011 (inception date) through June 30, 2012. |
98 | JUNE 30, 2013
| |
| 6. | Purchases and Sales of Investment Securities |
For the year ended June 30, 2013, the aggregate cost of purchases and proceeds from sales of investment securities (excluding any short-term securities, short-term options contracts, and in-kind transactions) was as follows:
| | | | | | | | | | | | | | | |
| | | | | | | Purchases of Long-
| | Proceeds from Sales
| | |
| | | Purchases of
| | Proceeds from Sales
| | Term U.S. Government
| | of Long-Term U.S.
| | |
| Fund | | Securities | | of Securities | | Obligations | | Government Obligations | | |
| |
| INTECH Global Dividend Fund | | $ | 10,447,818 | | $ | 10,089,368 | | $ | – | | $ | – | | |
| INTECH International Fund | | | 80,434,491 | | | 63,309,667 | | | – | | | – | | |
| INTECH U.S. Core Fund | | | 276,070,040 | | | 245,994,682 | | | – | | | – | | |
| INTECH U.S. Growth Fund | | | 233,621,083 | | | 307,361,789 | | | – | | | – | | |
| INTECH U.S. Value Fund | | | 98,036,933 | | | 132,922,439 | | | – | | | – | | |
| |
| |
| |
| 7. | New Accounting Pronouncements |
In December 2011, the FASB issued Accounting Standards Update No. 2011-11, “Disclosures about Offsetting Assets and Liabilities.” This update creates disclosure requirements requiring entities to disclose both gross and net information for derivatives and other financial instruments that are either offset in the Statements of Assets and Liabilities or subject to an enforceable master netting arrangement or similar agreement. In January 2013, the FASB issued Accounting Standards Update No. 2013-01, “Clarifying the Scope of Disclosures about Offsetting Assets and Liabilities.” This update limits the scope of the new Statements of Assets and Liabilities offsetting disclosures to derivatives, repurchase agreements, reverse repurchase agreements, securities borrowing and securities lending transactions that are either offset in the Statements of Assets and Liabilities or subject to an enforceable master netting arrangement or similar agreement. These disclosure requirements are effective for annual reporting periods beginning on or after January 1, 2013, and interim periods within those annual periods. Management is currently evaluating the impact these updates may have on the Funds’ financial statements.
Management has evaluated whether any other events or transactions occurred subsequent to June 30, 2013 and through the date of issuance of the Funds’ financial statements and determined that there were no material events or transactions that would require recognition or disclosure in the Funds’ financial statements.
Janus Mathematical Funds | 99
Report of Independent Registered Public Accounting Firm
To the Board of Trustees and Shareholders
of Janus Investment Fund:
In our opinion, the accompanying statements of assets and liabilities, including the schedules of investments, and the related statements of operations and of changes in net assets and the financial highlights present fairly, in all material respects, the financial position of INTECH Global Dividend Fund, INTECH International Fund, INTECH U.S. Core Fund, INTECH U.S. Growth Fund, and INTECH U.S. Value Fund (five of the funds constituting Janus Investment Fund, hereafter referred to as the “Funds”) at June 30, 2013 and the results of each of their operations for the year then ended, the changes in each of their net assets for each of the two years in the period then ended, and the financial highlights for each of the periods presented, in conformity with accounting principles generally accepted in the United States of America. These financial statements and financial highlights (hereafter referred to as ‘financial statements‘) are the responsibility of the Funds’ management; our responsibility is to express an opinion on these financial statements based on our audits. We conducted our audits of these financial statements in accordance with the standards of the Public Company Accounting Oversight Board (United States). Those standards require that we plan and perform the audit to obtain reasonable assurance about whether the financial statements are free of material misstatement. An audit includes examining, on a test basis, evidence supporting the amounts and disclosures in the financial statements, assessing the accounting principles used and significant estimates made by management, and evaluating the overall financial statement presentation. We believe that our audits, which included confirmation of securities at June 30, 2013 by correspondence with the custodian, transfer agent and brokers, provide a reasonable basis for our opinion.
Denver, Colorado
August 19, 2013
100 | JUNE 30, 2013
Additional Information (unaudited)
Proxy Voting Policies and Voting Record
A description of the policies and procedures that the Funds use to determine how to vote proxies relating to their portfolio securities is available without charge: (i) upon request, by calling 1-800-525-0020 (toll free); (ii) on the Funds’ website at janus.com/proxyvoting; and (iii) on the SEC’s website at http://www.sec.gov. Additionally, information regarding each Fund’s proxy voting record for the most recent twelve-month period ended June 30 is also available, free of charge, through janus.com/proxyvoting and from the SEC’s website at http://www.sec.gov.
Quarterly Portfolio Holdings
The Funds file their complete portfolio holdings (schedule of investments) with the SEC for the first and third quarters of each fiscal year on Form N-Q within 60 days of the end of such fiscal quarter. The Funds’ Form N-Q: (i) is available on the SEC’s website at http://www.sec.gov; (ii) may be reviewed and copied at the SEC’s Public Reference Room in Washington, D.C. (information on the Public Reference Room may be obtained by calling 1-800-SEC-0330); and (iii) is available without charge, upon request, by calling Janus at 1-800-525-0020 (toll free).
Approval of Advisory Agreements During the Period
The Trustees of Janus Investment Fund, none of whom has ever been affiliated with Janus Capital and each of whom serves as an “independent” Trustee (the “Trustees”), oversee the management of each Fund and, as required by law, determine annually whether to continue the investment advisory agreement for each Fund and the subadvisory agreements for the nine Funds that utilize subadvisers.
In connection with their most recent consideration of those agreements for each Fund, the Trustees received and reviewed a substantial amount of information provided by Janus Capital and the respective subadvisers in response to requests of the Trustees and their independent legal counsel. They also received and reviewed a considerable amount of information and analysis provided by, and in response to requests of, their independent fee consultant. Throughout their consideration of the agreements, the Trustees were advised by their independent legal counsel. The Trustees met with management to consider the agreements, and also met separately in executive session with their independent legal counsel and their independent fee consultant.
At a meeting held on December 7, 2012, based on the Trustees’ evaluation of the information provided by Janus Capital, the subadvisers and the independent fee consultant, as well as other information, the Trustees determined that the overall arrangements between each Fund and Janus Capital and each subadviser, as applicable, were fair and reasonable in light of the nature, extent and quality of the services provided by Janus Capital, its affiliates and the subadvisers, the fees charged for those services, and other matters that the Trustees considered relevant in the exercise of their business judgment. At that meeting, the Trustees unanimously approved the continuation of the investment advisory agreement for each Fund, and the subadvisory agreement for each subadvised Fund, for the period from February 1, 2013 through February 1, 2014, subject to earlier termination as provided for in each agreement.
In considering the continuation of those agreements, the Trustees reviewed and analyzed various factors that they determined were relevant, including the factors described below, none of which by itself was considered dispositive. However, the material factors and conclusions that formed the basis for the Trustees’ determination to approve the continuation of the agreements are discussed separately below. Also included is a summary of the independent fee consultant’s conclusions and opinions that arose during, and were included as part of, the Trustees’ consideration of the agreements.
Nature, Extent and Quality of Services
The Trustees reviewed the nature, extent and quality of the services provided by Janus Capital and the subadvisers to the Funds, taking into account the investment objective and strategy of each Fund and the knowledge the Trustees gained from their regular meetings with management on at least a quarterly basis and their ongoing review of information related to the Funds. In addition, the Trustees reviewed the resources and key personnel of Janus Capital and each subadviser, particularly noting those employees who provide investment and risk management services to the Funds. The Trustees also considered other services provided to the Funds by Janus Capital or the subadvisers, such as managing the execution of portfolio transactions and the selection of broker-dealers for those transactions. The Trustees considered Janus Capital’s role as administrator to the Funds, noting that Janus Capital does not receive a fee for its services but is reimbursed for its out-of-pocket costs. The Trustees considered the role of Janus Capital in monitoring adherence to the Funds’ investment restrictions, providing support services for the Trustees and Trustee committees, communicating with shareholders and overseeing the activities of other service providers, including monitoring compliance with various policies and
Janus Mathematical Funds | 101
Additional Information (unaudited) (continued)
procedures of the Funds and with applicable securities laws and regulations.
In this regard, the independent fee consultant noted that Janus Capital provides a number of different services for the Funds of Janus Investment Fund and the Portfolios of Janus Aspen Series (such Funds and Portfolios, together the “Janus Funds”) and Janus Fund shareholders, ranging from investment management services to various other servicing functions, and that, in its opinion, Janus Capital is a capable provider of those services. The independent fee consultant also provided its belief that Janus Capital has developed institutional competitive advantages that should be able to provide superior investment management returns over the long term.
The Trustees concluded that the nature, extent and quality of the services provided by Janus Capital or the subadviser to each Fund were appropriate and consistent with the terms of the respective advisory and subadvisory agreements, and that, taking into account steps taken to address those Funds whose performance lagged that of their peers for certain periods, the quality of those services had been consistent with or superior to quality norms in the industry and the Funds were likely to benefit from the continued provision of those services. They also concluded that Janus Capital and each subadviser had sufficient personnel, with the appropriate education and experience, to serve the Funds effectively and had demonstrated its continuing ability to attract well-qualified personnel.
Performance of the Funds
The Trustees considered the performance results of each Fund over various time periods. They reviewed information comparing each Fund’s performance with the performance of comparable funds and peer groups identified by independent data providers, and with the Fund’s benchmark index. In this regard, the independent fee consultant found that the Janus Funds have had some recent performance challenges, but performance has improved recently, and for the 36 months ended September 30, 2012, approximately 47% of the Janus Funds were in the top two quartiles of performance and for the 12 months ended September 30, 2012, approximately 54% of the Janus Funds were in the top two quartiles of performance. The Trustees concluded that the performance of certain Funds was good under current market conditions. Although the performance of other Funds lagged that of their peers for certain periods, the Trustees also concluded that Janus Capital had taken or was taking appropriate steps to address those instances of under-performance.
Costs of Services Provided
The Trustees examined information regarding the fees and expenses of each Fund in comparison to similar information for other comparable funds as provided by independent data providers. They also reviewed an analysis of that information provided by their independent fee consultant and noted that the rate of management (investment advisory and any administration) fees for most of the Funds, after applicable contractual expense limitations, was below the mean management fee rate of the respective peer group of funds selected by the independent data providers.
In this regard, the independent fee consultant provided its belief that the management fees charged by Janus Capital to each of the Janus Funds under the current investment advisory and administration agreements are reasonable in relation to the services provided by Janus Capital. The independent fee consultant found (1) the total expenses and management fees of the Janus Funds to be reasonable relative to other mutual funds; (2) total expenses, on average, were 16% below the mean total expenses of their respective Lipper Expense Group peers and 23% below the mean total expenses for their Lipper Expense Universes; (3) management fees for the Janus Funds, on average, were 9% below the mean management fees for their Expense Groups and 12% below the mean for their Expense Universes; and (4) Janus Funds expenses at the functional level for each asset and share class category were reasonable. The independent fee consultant concluded that based on its strategic review of expenses at the complex, category and individual fund level, Janus Funds expenses were found to be reasonable relative to both Expense Group and Expense Universe benchmarks. Further, for certain Funds the independent fee consultant also performed a systematic “focus list” analysis of expenses in the context of the performance or service delivered to each set of investors in each share class in each selected Fund. Based on this analysis, the independent fee consultant found that the combination of service quality/ performance and expenses on these individual Funds and share classes were reasonable in light of performance trends, performance histories and existence of performance fees on such Funds.
The Trustees considered the methodology used by Janus Capital and each subadviser in determining compensation payable to portfolio managers, the competitive environment for investment management talent and the competitive market for mutual funds in different distribution channels. They concluded that the compensation methodology provided a good alignment of the interests of the portfolio managers with the interests of Fund shareholders.
102 | JUNE 30, 2013
The Trustees also reviewed management fees charged by Janus Capital and each subadviser to their separate account clients and to non-affiliated funds subadvised by Janus Capital or by a subadviser (for which Janus Capital or the subadviser provides only portfolio management services). Although in most instances subadvisory and separate account fee rates for various investment strategies were lower than management fee rates for Funds having a similar strategy, the Trustees noted that, under the terms of the management agreements with the Funds, Janus Capital performs significant additional services for the Funds that it does not provide to those other clients, including administration services, oversight of the Funds’ other service providers, trustee support, regulatory compliance and numerous other services, and that, in serving the Funds, Janus Capital assumes many legal risks that it does not assume in servicing its other clients. Moreover, they noted the research conducted and conclusions reached by their independent fee consultant.
In this regard, the independent fee consultant found that (1) the management fees Janus Capital charges to the Janus Funds are reasonable in relation to the management fees Janus Capital charges to its institutional and subadvised accounts; (2) these institutional and subadvised accounts have different service and infrastructure needs; and (3) the average spread between management fees charged to the Janus Funds and those charged to Janus Capital’s institutional and subadvised accounts is reasonable relative to the average spreads seen in the industry.
The Trustees reviewed information on the profitability to Janus Capital and its affiliates of their relationships with each Fund, as well as an explanation of the methodology utilized in allocating various expenses of Janus Capital and its affiliates among the Funds and other clients. The Trustees also reviewed the financial statements and corporate structure of Janus Capital’s parent company. In their review, the Trustees considered whether Janus Capital and each subadviser receive adequate incentives to manage the Funds effectively. The Trustees recognized that profitability comparisons among fund managers are difficult because very little comparative information is publicly available and the profitability of any fund manager is affected by numerous factors, including the organizational structure of the particular fund manager, the types of funds and other accounts it manages, possible other lines of business, the methodology for allocating expenses and the fund manager’s capital structure and cost of capital. However, taking into account those factors and the analysis provided by the Trustees’ independent fee consultant, and based on the information available, the Trustees concluded that Janus Capital’s profitability with respect to each Fund in relation to the services rendered was not unreasonable.
In this regard, the independent fee consultant found that, while assessing the reasonability of expenses in light of Janus Capital’s profits is dependent on comparisons with other publicly-traded mutual fund advisers, and that these comparisons are limited in accuracy by differences in complex size, business mix, institutional account orientation, and other factors, after accepting these limitations, the level of profit earned by Janus Capital from managing the Janus Funds is reasonable.
The Trustees concluded that the management fees and other compensation payable by each Fund to Janus Capital and its affiliates, as well as the fees paid by Janus Capital to the subadvisers of the subadvised Funds, were reasonable in relation to the nature, extent and quality of the services provided, taking into account the fees charged by other advisers for managing comparable mutual funds with similar strategies, the fees Janus Capital and the subadvisers charge to other clients, and, as applicable, the impact of fund performance on fees payable by the Funds. The Trustees also concluded that the overall expense ratio of each Fund was reasonable, taking into account the size of the Fund, the quality of services provided by Janus Capital and any subadviser, the investment performance of the Fund and any expense limitations agreed to by Janus Capital.
Economies of Scale
The Trustees considered information about the potential for Janus Capital to realize economies of scale as the assets of the Funds increase. They noted that, although many Funds pay advisory fees at a base fixed rate as a percentage of net assets, without any breakpoints, the actual management fee rate paid by most of the Funds, after any contractual expense limitations, was below the mean management fee rate of the Fund’s peer group identified by independent data providers; and, for those Funds whose expenses are being reduced by the contractual expense limitations of Janus Capital, Janus Capital is subsidizing the Funds because they have not reached adequate scale. Moreover, as the assets of many of the Funds have declined in the past few years, certain Funds have benefited from having advisory fee rates that have remained constant rather than increasing as assets declined. In addition, performance fee structures have been implemented for various Funds that have caused or will cause the effective rate of advisory fees payable by such a Fund to vary depending on the investment performance of the Fund relative to its benchmark index over the measurement period; and the five Funds that have fee schedules with breakpoints and reduced fee rates above certain asset levels. The Trustees also noted
Janus Mathematical Funds | 103
Additional Information (unaudited) (continued)
that the Funds share directly in economies of scale through the lower charges of third-party service providers that are based in part on the combined scale of all of the Funds. Based on all of the information they reviewed, including research and analysis conducted by the Trustees’ independent fee consultant, the Trustees concluded that the current fee structure of each Fund was reasonable and that the current rates of fees do reflect a sharing between Janus Capital and the Fund of economies of scale at the current asset level of the Fund.
In this regard, the independent fee consultant concluded that, based on analysis it completed, and given the limitations in these analytical approaches and their conflicting results, it could not confirm or deny the existence of economies of scale in the Janus complex. Further, the independent fee consultant provided its belief that Janus Fund investors are well-served by the fee levels and performance fee structures in place on the Janus Funds in light of any economies of scale that may be present at Janus Capital.
Other Benefits to Janus Capital
The Trustees also considered benefits that accrue to Janus Capital and its affiliates from their relationships with the Funds. They recognized that two affiliates of Janus Capital separately serve the Funds as transfer agent and distributor, respectively, and the transfer agent receives compensation directly from the non-money market funds for services provided. The Trustees also considered Janus Capital’s past and proposed use of commissions paid by the Funds on their portfolio brokerage transactions to obtain proprietary and third-party research products and services benefiting the Fund and/or other clients of Janus Capital. The Trustees concluded that Janus Capital’s use of these types of client commission arrangements to obtain proprietary and third-party research products and services was consistent with regulatory requirements and guidelines and was likely to benefit each Fund. The Trustees also concluded that, other than the services provided by Janus Capital and its affiliates pursuant to the agreements and the fees to be paid by each Fund therefor, the Funds and Janus Capital may potentially benefit from their relationship with each other in other ways. They concluded that Janus Capital benefits from the receipt of research products and services acquired through commissions paid on portfolio transactions of the Funds and that the Funds benefit from Janus Capital’s receipt of those products and services as well as research products and services acquired through commissions paid by other clients of Janus Capital. They further concluded that success of any Fund could attract other business to Janus Capital or other Janus Funds, and that the success of Janus Capital could enhance Janus Capital’s ability to serve the Funds.
After full consideration of the above factors, as well as other factors, the Trustees, each of whom is an independent Trustee, concluded at their December 7, 2012 meeting that the proposed continuation of the investment advisory agreement and, if applicable, the subadvisory agreement for each Fund for another year was in the best interest of the respective Funds and their shareholders.
104 | JUNE 30, 2013
Useful Information About Your Fund Report (unaudited)
The Management Commentary in this report includes valuable insight from each of the Fund’s investment personnel as well as statistical information to help you understand how your Fund’s performance and characteristics stack up against those of comparable indices.
If the Fund invests in foreign securities, this report may include information about country exposure. Country exposure is based primarily on the country of risk. The Fund’s investment personnel may allocate a company to a country based on other factors such as location of the company’s principal office, the location of the principal trading market for the company’s securities, or the country where a majority of the company’s revenues are derived.
Please keep in mind that the opinions expressed by the Fund’s investment personnel in the Management Commentary are just that: opinions. They are a reflection of the investment personnel’s best judgment at the time this report was compiled, which was June 30, 2013. As the investing environment changes, so could their opinions. These views are unique to them and aren’t necessarily shared by fellow employees or by Janus in general.
Performance overview graphs compare the performance of a hypothetical $10,000 investment in the Fund with one or more widely used market indices. The hypothetical example does not represent the returns of any particular investment.
When comparing the performance of the Fund with an index, keep in mind that market indices do not include brokerage commissions that would be incurred if you purchased the individual securities in the index. They also do not include taxes payable on dividends and interest or operating expenses incurred if you maintained the Fund invested in the index.
Average annual total returns are quoted for a Fund with more than one year of performance history. Average annual total return is calculated by taking the growth or decline in value of an investment over a period of time, including reinvestment of dividends and distributions, then calculating the annual compounded percentage rate that would have produced the same result had the rate of growth been constant throughout the period. Average annual total return does not reflect the deduction of taxes that a shareholder would pay on Fund distributions or redemptions of Fund shares.
Cumulative total returns are quoted for a Fund with less than one year of performance history. Cumulative total return is the growth or decline in value of an investment over time, independent of the period of time involved. Cumulative total return does not reflect the deduction of taxes that a shareholder would pay on Fund distributions or redemptions of Fund shares.
Pursuant to federal securities rules, expense ratios shown in the performance chart reflect subsidized (if applicable) and unsubsidized ratios. The total annual fund operating expenses ratio is gross of any fee waivers, reflecting the Fund’s unsubsidized expense ratio. The net annual fund operating expenses ratio (if applicable) includes contractual waivers of Janus Capital and reflects the Fund’s subsidized expense ratio. Ratios may be higher or lower than those shown in the “Financial Highlights” in this report.
| |
| 3. | Schedule of Investments |
Following the performance overview section is the Fund’s Schedule of Investments. This schedule reports the types of securities held in the Fund on the last day of the reporting period. Securities are usually listed by type (common stock, corporate bonds, U.S. Government obligations, etc.) and by industry classification (banking, communications, insurance, etc.). Holdings are subject to change without notice.
The value of each security is quoted as of the last day of the reporting period. The value of securities denominated in foreign currencies is converted into U.S. dollars.
If the Fund invests in foreign securities, it will also provide a summary of investments by country. This summary reports the Fund’s exposure to different countries by providing the percentage of securities invested in each country. The country of each security represents the country of risk. The Fund’s Schedule of Investments relies upon the industry group and country classifications published by Bloomberg L.P. and/or MSCI Inc.
Tables listing details of individual forward currency contracts, futures, written options and swaps follow the Fund’s Schedule of Investments (if applicable).
| |
| 4. | Statement of Assets and Liabilities |
This statement is often referred to as the “balance sheet.” It lists the assets and liabilities of the Fund on the last day of the reporting period.
The Fund’s assets are calculated by adding the value of the securities owned, the receivable for securities sold but not yet settled, the receivable for dividends declared but not yet received on securities owned and the receivable for Fund shares sold to investors but not yet settled. The Fund’s liabilities include payables for securities purchased
Janus Mathematical Funds | 105
Useful Information About Your Fund Report (unaudited) (continued)
but not yet settled, Fund shares redeemed but not yet paid and expenses owed but not yet paid. Additionally, there may be other assets and liabilities such as unrealized gain or loss on forward currency contracts.
The section entitled “Net Assets Consist of” breaks down the components of the Fund’s net assets. Because the Fund must distribute substantially all earnings, you will notice that a significant portion of net assets is shareholder capital.
The last section of this statement reports the net asset value (“NAV”) per share on the last day of the reporting period. The NAV is calculated by dividing the Fund’s net assets for each share class (assets minus liabilities) by the number of shares outstanding.
| |
| 5. | Statement of Operations |
This statement details the Fund’s income, expenses, realized gains and losses on securities and currency transactions, and changes in unrealized appreciation or depreciation of Fund holdings.
The first section in this statement, entitled “Investment Income,” reports the dividends earned from securities and interest earned from interest-bearing securities in the Fund.
The next section reports the expenses incurred by the Fund, including the advisory fee paid to the investment adviser, transfer agent fees and expenses, and printing and postage for mailing statements, financial reports and prospectuses. Expense offsets and expense reimbursements, if any, are also shown.
The last section lists the amounts of realized gains or losses from investment and foreign currency transactions, and changes in unrealized appreciation or depreciation of investments and foreign currency-denominated assets and liabilities. The Fund will realize a gain (or loss) when it sells its position in a particular security. A change in unrealized gain (or loss) refers to the change in net appreciation or depreciation of the Fund during the reporting period. “Net Realized and Unrealized Gain/(Loss) on Investments” is affected both by changes in the market value of Fund holdings and by gains (or losses) realized during the reporting period.
| |
| 6. | Statements of Changes in Net Assets |
These statements report the increase or decrease in the Fund’s net assets during the reporting period. Changes in the Fund’s net assets are attributable to investment operations, dividends and distributions to investors and capital share transactions. This is important to investors because it shows exactly what caused the Fund’s net asset size to change during the period.
The first section summarizes the information from the Statement of Operations regarding changes in net assets due to the Fund’s investment operations. The Fund’s net assets may also change as a result of dividend and capital gains distributions to investors. If investors receive their dividends and/or distributions in cash, money is taken out of the Fund to pay the dividend and/or distribution. If investors reinvest their dividends and/or distributions, the Fund’s net assets will not be affected. If you compare the Fund’s “Net Decrease from Dividends and Distributions” to “Reinvested Dividends and Distributions,” you will notice that dividends and distributions have little effect on the Fund’s net assets. This is because the majority of the Fund’s investors reinvest their dividends and/or distributions.
The reinvestment of dividends and distributions is included under “Capital Share Transactions.” “Capital Shares” refers to the money investors contribute to the Fund through purchases or withdrawals via redemptions. The Fund’s net assets will increase and decrease in value as investors purchase and redeem shares from the Fund.
This schedule provides a per-share breakdown of the components that affect the Fund’s NAV for current and past reporting periods as well as total return, asset size, ratios and portfolio turnover rate.
The first line in the table reflects the NAV per share at the beginning of the reporting period. The next line reports the net investment income/(loss) per share. Following is the per share total of net gains/(losses), realized and unrealized. Per share dividends and distributions to investors are then subtracted to arrive at the NAV per share at the end of the period. The next line reflects the total return for the period. The total return may include adjustments in accordance with generally accepted accounting principles required at the period end for financial reporting purposes. As a result, the total return may differ from the total return reflected for individual shareholder transactions. Also included are ratios of expenses and net investment income to average net assets.
The Fund’s expenses may be reduced through expense offsets and expense reimbursements. The ratios shown reflect expenses before and after any such offsets and reimbursements.
The ratio of net investment income/(loss) summarizes the income earned less expenses, divided by the average net assets of the Fund during the reporting period. Don’t
106 | JUNE 30, 2013
confuse this ratio with the Fund’s yield. The net investment income ratio is not a true measure of the Fund’s yield because it doesn’t take into account the dividends distributed to the Fund’s investors.
The next figure is the portfolio turnover rate, which measures the buying and selling activity in the Fund. Portfolio turnover is affected by market conditions, changes in the asset size of the Fund, fluctuating volume of shareholder purchase and redemption orders, the nature of the Fund’s investments, and the investment style and/or outlook of the investment personnel. A 100% rate implies that an amount equal to the value of the entire portfolio was replaced once during the fiscal year; a 50% rate means that an amount equal to the value of half the portfolio is traded in a year; and a 200% rate means that an amount equal to the value of the entire portfolio is traded every six months.
Janus Mathematical Funds | 107
Designation Requirements (unaudited)
For federal income tax purposes, the Funds designated the following for the year ended June 30, 2013:
Foreign Taxes Paid and Foreign Source Income
| | | | | | | | | | | |
| Fund | | Foreign Taxes Paid | | Foreign Source Income | | |
| |
| |
| INTECH Global Dividend Fund | | $ | 21,933 | | | $ | 286,804 | | | |
| INTECH International Fund | | | 64,314 | | | | 1,267,214 | | | |
| |
| |
Dividends Received Deduction Percentage
| | | | | | | | | | | |
| Fund | | | | | | |
| |
| |
| INTECH Global Dividend Fund | | | | | | | 25% | | | |
| INTECH International Fund | | | | | | | 0% | | | |
| INTECH U.S. Core Fund | | | | | | | 100% | | | |
| INTECH U.S. Growth Fund | | | | | | | 100% | | | |
| INTECH U.S. Value Fund | | | | | | | 100% | | | |
| |
| |
Qualified Dividend Income
| | | | | | | | | | | |
| Fund | | | | | | |
| |
| |
| INTECH Global Dividend Fund | | | | | | | 81% | | | |
| INTECH International Fund | | | | | | | 100% | | | |
| INTECH U.S. Core Fund | | | | | | | 100% | | | |
| INTECH U.S. Growth Fund | | | | | | | 100% | | | |
| INTECH U.S. Value Fund | | | | | | | 100% | | | |
| |
| |
Janus Mathematical Funds | 108
Trustees and Officers (unaudited)
The Funds’ Statement of Additional Information includes additional information about the Trustees and officers and is available, without charge, by calling 1-877-335-2687.
The following are the Trustees and officers of the Trust, together with a brief description of their principal occupations during the last five years (principal occupations for certain Trustees may include periods over five years).
Each Trustee has served in that capacity since he or she was originally elected or appointed. The Trustees do not serve a specified term of office. Each Trustee will hold office until the termination of the Trust or his or her earlier death, resignation, retirement, incapacity, or removal. Pursuant to the Funds’ Governance Procedures and Guidelines, Trustees are required to retire no later than the end of the calendar year in which the Trustee turns 72. The Trustees review the Funds’ Governance Procedures and Guidelines from time to time and may make changes they deem appropriate. The Trust’s Nominating and Governance Committee will consider nominees for the position of Trustee recommended by shareholders. Shareholders may submit the name of a candidate for consideration by the Committee by submitting their recommendations to the Trust’s Secretary. Each Trustee is currently a Trustee of one other registered investment company advised by Janus Capital: Janus Aspen Series. Collectively, these two registered investment companies consist of 56 series or funds.
The Trust’s officers are elected annually by the Trustees for a one-year term. Certain officers also serve as officers of Janus Aspen Series. Certain officers of the Funds may also be officers and/or directors of Janus Capital. Fund officers receive no compensation from the Funds, except for the Funds’ Chief Compliance Officer, as authorized by the Trustees.
TRUSTEES
| | | | | | | | | | | |
| | | | | | | | | Number of Portfolios/Funds
| | Other Directorships
|
| | | Positions Held
| | Length of
| | Principal Occupations
| | in Fund Complex
| | Held by Trustee
|
| Name, Address, and Age | | with the Trust | | Time Served | | During the Past Five Years | | Overseen by Trustee | | During the Past Five Years |
| |
| |
Independent Trustees | | | | | | | | | | |
| | | | | | | | | | | |
William F. McCalpin
151 Detroit Street
Denver, CO 80206
DOB: 1957 | | Chairman
Trustee | | 1/08-Present
6/02-Present | | Managing Director, Holos Consulting LLC (provides consulting services to foundations and other nonprofit organizations). Formerly, Executive Vice President and Chief Operating Officer of The Rockefeller Brothers Fund (a private family foundation) (1998-2006). | | 56 | | Chairman of the Board and Director of The Investment Fund for Foundations Investment Program (TIP) (consisting of 2 funds); and Director of the F.B. Heron Foundation (a private grantmaking foundation). |
| | | | | | | | | | | |
Alan A. Brown
151 Detroit Street
Denver, CO 80206
DOB: 1962 | | Trustee | | 1/13-Present | | Managing Director, Institutional Markets, of Dividend Capital Group (private equity real estate investment management firm) (since 2012). Formerly, Executive Vice President and Co-Head, Global Private Client Group (2007-2010), Executive Vice President, Mutual Funds (2005-2007), and Chief Marketing Officer (2001-2005) of Nuveen Investments, Inc. (asset management). | | 56 | | Director of MotiveQuest LLC (strategic social market research company) (since 2003); and Director of WTTW (PBS affiliate) (since 2003). Formerly, Director of Nuveen Global Investors LLC (2007-2011); Director of Communities in Schools (2004-2010); and Director of Mutual Fund Education Alliance (until 2010). |
Janus Mathematical Funds | 109
Trustees and Officers (unaudited) (continued)
TRUSTEES (continued)
| | | | | | | | | | | |
| | | | | | | | | Number of Portfolios/Funds
| | Other Directorships
|
| | | Positions Held
| | Length of
| | Principal Occupations
| | in Fund Complex
| | Held by Trustee
|
| Name, Address, and Age | | with the Trust | | Time Served | | During the Past Five Years | | Overseen by Trustee | | During the Past Five Years |
| |
| |
| | | | | | | | | | | |
William D. Cvengros
151 Detroit Street
Denver, CO 80206
DOB: 1948 | | Trustee | | 1/11-Present | | Managing Member and Chief Executive Officer of SJC Capital, LLC (a personal investment company and consulting firm) (since 2002). Formerly, Venture Partner for The Edgewater Funds (a middle market private equity firm) (2002-2004); Chief Executive Officer and President of PIMCO Advisors Holdings L.P. (a publicly traded investment management firm) (1994-2000); and Chief Investment Officer of Pacific Life Insurance Company (a mutual life insurance and annuity company (1987-1994). | | 56 | | Chairman, National Retirement Partners, Inc. (formerly a network of advisors to 401(k) plans) (since 2005). Formerly, Director of Prospect Acquisition Corp. (a special purpose acquisition corporation) (2007-2009); Director of RemedyTemp, Inc. (temporary help services company) (1996-2006); and Trustee of PIMCO Funds Multi-Manager Series (1990-2000) and Pacific Life Variable Life & Annuity Trusts (1987-1994). |
| | | | | | | | | | | |
James T. Rothe
151 Detroit Street
Denver, CO 80206
DOB: 1943 | | Trustee | | 1/97-Present | | Co-founder and Managing Director of Roaring Fork Capital SBIC, L.P. (SBA SBIC fund focusing on private investment in public equity firms), and Professor Emeritus of Business of the University of Colorado, Colorado Springs, CO (since 2004). Formerly, Professor of Business of the University of Colorado (2002-2004), and Distinguished Visiting Professor of Business (2001-2002) of Thunderbird (American Graduate School of International Management), Glendale, AZ. | | 56 | | Director of Red Robin Gourmet Burgers, Inc. (RRGB) (since 2004). |
| | | | | | | | | | | |
William D. Stewart
151 Detroit Street
Denver, CO 80206
DOB: 1944 | | Trustee | | 6/84-Present | | Retired. Formerly, Corporate Vice President and General Manager of MKS Instruments - HPS Products, Boulder, CO (a manufacturer of vacuum fittings and valves) and PMFC Division, Andover, MA (manufacturing pressure measurement and flow products) (1976-2012). | | 56 | | None |
110 | JUNE 30, 2013
TRUSTEES (continued)
| | | | | | | | | | | |
| | | | | | | | | Number of Portfolios/Funds
| | Other Directorships
|
| | | Positions Held
| | Length of
| | Principal Occupations
| | in Fund Complex
| | Held by Trustee
|
| Name, Address, and Age | | with the Trust | | Time Served | | During the Past Five Years | | Overseen by Trustee | | During the Past Five Years |
| |
| |
| | | | | | | | | | | |
Linda S. Wolf
151 Detroit Street
Denver, CO 80206
DOB: 1947 | | Trustee | | 11/05-Present | | Retired. Formerly, Chairman and Chief Executive Officer of Leo Burnett (Worldwide) (advertising agency) (2001-2005). | | 56 | | Director of Chicago Convention & Tourism Bureau, Chicago Council on Global Affairs, The Field Museum of Natural History (Chicago, IL), InnerWorkings (U.S. provider of print procurement solutions to corporate clients), Lurie Children’s Hospital
(Chicago, IL), Rehabilitation Institute of Chicago, Wal-Mart, and Wrapports, LLC (digital communications company). |
| |
| |
Janus Mathematical Funds | 111
OFFICERS
| | | | | | | |
| | | Positions Held
| | Term of Office* and
| | Principal Occupations
|
| Name, Address, and Age | | with the Trust | | Length of Time Served | | During the Past Five Years |
| |
| |
| | | | | | | |
Robin C. Beery
151 Detroit Street
Denver, CO 80206
DOB: 1967 | | President and Chief Executive Officer | | 4/08-Present | | Executive Vice President and Head of U.S. Distribution of Janus Capital Group Inc., Janus Capital, Janus Distributors LLC, and Janus Services LLC; Director of The Janus Foundation; Director of Perkins Investment Management LLC; and Working Director of INTECH Investment Management LLC. Formerly, Head of Intermediary Distribution, Global Marketing and Product of Janus Capital Group Inc., Janus Capital, Janus Distributors LLC, and Janus Services LLC (2009-2010); and Chief Marketing Officer of Janus Capital Group Inc. and Janus Capital (2002-2009). |
| | | | | | | |
Stephanie Grauerholz-Lofton
151 Detroit Street
Denver, CO 80206
DOB: 1970 | | Chief Legal Counsel and Secretary
Vice President | | 1/06-Present
3/06-Present | | Vice President and Assistant General Counsel of Janus Capital, and Vice President and Assistant Secretary of Janus Distributors LLC. |
| | | | | | | |
David R. Kowalski
151 Detroit Street
Denver, CO 80206
DOB: 1957 | | Vice President, Chief Compliance Officer, and Anti-Money Laundering Officer | | 6/02-Present | | Senior Vice President and Chief Compliance Officer of Janus Capital, Janus Distributors LLC, and Janus Services LLC; and Vice President of INTECH Investment Management LLC and Perkins Investment Management LLC. Formerly, Chief Compliance Officer of Bay Isle Financial LLC (2003-2008). |
| | | | | | | |
Jesper Nergaard
151 Detroit Street
Denver, CO 80206
DOB: 1962 | | Chief Financial Officer
Vice President, Treasurer, and Principal Accounting Officer | | 3/05-Present
2/05-Present | | Vice President of Janus Capital and Janus Services LLC. |
* Officers are elected at least annually by the Trustees for a one-year term and may also be elected from time to time by the Trustees for an interim period.
Janus Mathematical Funds | 112
Notes
Janus Mathematical Funds | 113
Janus provides access to a wide range of investment disciplines.
Alternative
Janus alternative funds seek to deliver strong risk-adjusted returns over a full market cycle with lower correlation to equity markets than traditional investments.
Asset Allocation
Janus’ asset allocation funds utilize our fundamental, bottom-up research to balance risk over the long term. From fund options that meet investors’ risk tolerance and objectives to a method that incorporates non-traditional investment choices to seek non-correlated sources of risk and return, Janus’ asset allocation funds aim to allocate risk more effectively.
Fixed Income
Janus fixed income funds attempt to provide less risk relative to equities while seeking to deliver a competitive total return through high current income and appreciation. Janus money market funds seek capital preservation and liquidity with current income as a secondary objective.
Global & International
Janus global and international funds seek to leverage Janus’ research capabilities by taking advantage of inefficiencies in foreign markets, where accurate information and analytical insight are often at a premium.
Growth & Core
Janus growth funds focus on companies believed to be the leaders in their respective industries, with solid management teams, expanding market share, margins and efficiencies. Janus core funds seek investments in more stable and predictable companies. Our core funds look for a strategic combination of steady growth and, for certain funds, some degree of income.
Mathematical
Our mathematical funds seek to outperform their respective indices while maintaining a risk profile equal to or lower than the index itself. Managed by INTECH (a Janus subsidiary), these funds use a mathematical process in an attempt to build a more “efficient” portfolio than the index.
Value
Our value funds, managed by Perkins (a Janus subsidiary), seek to identify companies with favorable reward to risk characteristics by conducting rigorous downside analysis before determining upside potential.
For more information about our funds, contact your investment professional or go to janus.com/advisor/mutual-funds (or janus.com/allfunds if you hold Shares directly with Janus).
Please consider the charges, risks, expenses and investment objectives carefully before investing. For a prospectus or, if available, a summary prospectus containing this and other information, please call Janus at 877.33JANUS (52687) (or 800.525.3713 if you hold Shares directly with Janus); or download the file from janus.com/info (or janus.com/reports if you hold Shares directly with Janus). Read it carefully before you invest or send money.
Funds distributed by Janus Distributors LLC (08/13)
| | | | | | | | | | |
| Investment products offered are: | | | NOT FDIC-INSURED | | | MAY LOSE VALUE | | | NO BANK GUARANTEE |
| | | | | | | | | | |
| |
| C-0813-42993 | 125-02-93006 08-13 |
ANNUAL REPORT
June 30, 2013
Janus Value Funds
Perkins Large Cap Value FundPerkins Mid Cap Value Fund
Perkins Select Value Fund
Perkins Small Cap Value Fund
Perkins Value Plus Income Fund
HIGHLIGHTS
| |
| • | Portfolio management perspective |
| • | Investment strategy behind your fund |
| • | Fund performance, characteristics and holdings |
Table of Contents
Janus Value Funds
| | | |
| | 1 |
| | |
| | 3 |
| | 14 |
| | 25 |
| | 35 |
| | 46 |
| | 65 |
| | 70 |
| | 74 |
| | 76 |
| | 80 |
| | 101 |
| | 120 |
| | 121 |
| | 125 |
| | 128 |
| | 129 |
Please consider the charges, risks, expenses and investment objectives carefully before investing. For a prospectus or, if available, a summary prospectus containing this and other information, please call Janus at 877.33JANUS (52687) (or 800.525.3713 if you hold Shares directly with Janus); or download the file from janus.com/info (or janus.com/reports if you hold Shares directly with Janus). Read it carefully before you invest or send money.
Chief Investment Officer’s Market Perspective (unaudited)
Jeff Kautz
Chief Investment Officer
Strong gains end with spike in volatility
U.S. stocks climbed higher during the period, but it took a volatile path late, with the Chicago Board of Options Exchange (CBOE) Volatility Index spiking over 40% off its recent lows. Overall, the S&P 500 Index delivered an impressive 20.6% increase in the past year and a whopping 158% since bottoming out in March 2009 during the financial crisis.
Still, the late-period stumble seems like a precursor for what may lie ahead. The sell-off was largely prompted by the Federal Reserve’s (Fed) mere mention that it might start scaling back its economic stimulus program later this year. The sharp declines in stock, bond and commodity prices worldwide show just how reliant markets have become on the Fed’s loose monetary policies, but investors cannot expect the central banks – either here or abroad – to hold the global economy together forever.
On the plus side, there is now some degree of clarity around future tapering action, but the Fed is also caught in a bit of a tight spot, given its self-stated dual goals of targeting both inflation and unemployment. It remains our belief that the Fed is reaching its limit in terms of how much support monetary policy can lend to the U.S. economy. The Fed has been trying to buy time until the economy can get on more solid footing, but at some point there needs to be a fiscal response to put the U.S. firmly back on a path toward normalized growth.
Marked improvements in housing and employment markets notwithstanding, the truth is that the U.S. economy is far from being in strong growth mode and still remains extremely susceptible to external shocks. For example, continued economic slowdowns from across the globe could easily dampen U.S. projections. China, in particular, remains a concern. While the country completed its leadership transition in November, economic growth continues to be a wild card. The world has come to rely on China as a core growth engine, and any slowdown, even marginal, is likely to have reverberations worldwide.
Best house on a bad block
This is not to say that stocks appear to be a poor investment choice at the moment, despite the elevated potential downside risk we continue to see in the market. Equities generally remain fairly valued, with the S&P 500 trading around 14.6 times 2013 earnings estimates. However, it is worth reminding our investors that the market is fairly valued only if profit margins are sustainable at current levels. Should margins revert toward the long-term average, there could be a meaningful pullback in equities.
With the thin trading levels that have driven equity markets during the past few quarters, it would not take much in bad economic news to prompt a negative short-term sell-off. As such, we expect an increase in volatility as these macro issues, such as Fed tapering, continue to rise to the forefront. In our view, however, a little volatility can be a good thing, offering us the opportunity to put money to work at attractive reward/risk ratios. Currently, our cash levels across strategies are generally in line with our long-term averages, but we may become more fully invested as temporary pricing dislocations present the chance to buy high-quality companies on sale.
Focus on long-term quality
Our risk-disciplined investment methodology focuses on identifying attractively priced companies with healthy balance sheets and solid, recurring free cash flows, competitively positioned for long-term success. These types of high-quality firms have historically helped us limit downside portfolio exposure in weak periods, while participating in market rallies.
The key to this research-intensive approach is keeping a long-term perspective and remembering that markets tend to revert to the mean. It can be easy for investors to slip into a trader mentality during high-beta momentum markets, when all stocks seem to keep rising. When markets turn, however, the importance of carefully researched quality can quickly become apparent. This bias toward quality extends beyond a simply defensive measure. Our research has shown high-quality stocks have delivered higher risk-adjusted return potential over the long term as well.
Janus Value Funds | 1
(unaudited) (continued)
Looking ahead, we believe our portfolios continue to be well positioned to navigate the current market climate, in terms of both risk exposure and long-term upside potential. Our investment team spends a significant amount of time carefully researching each and every stock, and we remain confident that this focus on finding investment value without sacrificing absolute risk will continue to serve our clients well, especially if volatility returns to the markets.
Thank you for the trust and confidence you have placed in Perkins Investment Management. We remain firmly committed to our value discipline, and our investment team continues to be heavily invested in our strategies right alongside you. We look forward to finding compelling investment opportunities on all of our behalf for many years to come.
Sincerely,
Jeff Kautz
Chief Investment Officer
Past performance is no guarantee of future results.
2 | JUNE 30, 2013
Perkins Large Cap Value Fund (unaudited)
| | | | | | | |
Fund Snapshot
The Fund seeks to invest in what we believe are fundamentally and financially strong large-capitalization companies exhibiting favorable reward to risk characteristics. We believe in the timeless adage of the power of compounding and in doing so our focus is on mitigating losses in difficult markets. We invest in securities we believe have favorable reward to risk ratios by focusing first on rigorous downside analysis prior to determining upside potential. We seek to outperform both our benchmark and peers over a full market cycle by building a diversified portfolio of high-quality, undervalued stocks.
| | | | 
Tom Perkins
co-portfolio manager | | 
Kevin Preloger
co-portfolio manager |
Performance Overview
During the 12 months ended June 30, 2013, Perkins Large Cap Value Fund’s Class I Shares returned 20.43% while its benchmark, the Russell 1000 Value Index, returned 25.32%. Our average 11.22% cash weighting weighed the most on performance followed by our holdings in information technology and materials. Relative contributors included our underweights in utilities and energy and our holdings in health care and financials.
Market Environment
Equity markets rallied hard early in the period given the continued flood of liquidity supplied by central banks on a global basis. While market participants continued to focus on the plight of the euro zone, indications by the European Central Bank (ECB) that monetary policy would become much more aggressive was met with a positive response. In addition, in September the U.S. Federal Reserve (Fed) announced that it would keep Fed funds interest rates at 0 to 0.25% well into 2015 and that it would embark upon a more open-ended quantitative easing policy of purchasing nearly $85 billion of securities on a monthly basis.
The rally was more modestly extended in the fourth quarter of 2012. U.S. gross domestic product (GDP) was up a surprising 3%, and the Fed stated it would not raise rates until unemployment falls to 6.5% and inflation does not rise above 2.5%. European markets were firm as the ECB’s promise “to do whatever it takes” and small steps toward political cooperation have had a calming effect. This was despite signs that GDP in Europe was heading to negative territory. China’s political transition appeared orderly and, with signs the economy was stabilizing in the area of 7% growth, its stock market rallied off its three-year bottom. However, early in 2013 it became apparent that the central planners in China decided that growth needed to slow and policy actions adopted to date seemed to have the desired effect. The question for investors is the repercussions on other economies given China’s slower growth.
The strong rally in 2012’s second half extended into the first quarter of 2013. U.S. GDP was essentially flat as government, business and consumer spending were impacted by year-end government policy uncertainty and inventories were drawn down. At year end, Washington came to agreement to push out the debt ceiling debate and tax rate reductions for all but the top brackets were extended; however, payroll taxes increased for all. This clarity on tax policy relieved some of the year-end anxiety.
U.S. stocks continued to climb higher in the second quarter, but they took a volatile path as the second quarter drew to a close. The CBOE VIX Index, a general measure of market volatility, spiked over 40% off its recent lows, which created some opportunities to purchase high-quality companies on sale. As a result, our cash position ended lower than our average for the period. Equities generally remain fairly valued, with the S&P 500 Index trading around 14.6 times 2013 earnings estimates. The index’s 6.85% forward earnings yield also remained attractive compared with the 10-year U.S. Treasury note’s roughly 2.50% yield, even after the recent run-up in interest rates. Corporate balance sheets remain on solid footing, which bodes well for future dividend increases and greater merger activity, both factors that we view as supportive of equity prices.
Holdings That Detracted
Goldcorp was our largest individual detractor. Shares of this high-quality, low-cost gold producer declined 33%, as the underlying spot gold price declined 24% during the period. Goldcorp has among the lowest production costs and the best production growth outlook of any major gold miner as four major projects are expected to enter production in the next few years. Goldcorp also has a net
Janus Value Funds | 3
Perkins Large Cap Value Fund (unaudited)
debt-free balance sheet, and high-quality assets that are unlikely to need a write-down in value, unlike the actions its competitors have recently taken. With valuations based on tangible book value near multiyear lows, and spot prices below the all-in production costs of higher-cost competitors, we maintain a position.
Staying in materials, Canadian metallurgical coal and copper producer Teck Resources also weighed on performance. The shares were hit due to significant oversupply of coal as well as lagging demand from China given the slowing economy there. Those supply additions, in combination with increased domestic Chinese metallurgical coal production forced us to re-evaluate our downside and upside cases for the stock. As a result of our lower proprietary reward to risk ratio, we eliminated our position.
Integrated utility Exelon was another detractor. The shares were weak as the company slashed its dividend early in the year due to continued weak demand for power. In addition, power auction results were significantly below previous forecasts that resulted in earnings estimates being reduced. Furthermore, many utility stocks fared poorly as interest rates rose significantly on fears that the Fed would slow its quantitative easing monetary policy. We think Exelon remains well positioned longer term to benefit from improving power prices driven by federal regulation and retirement of old, inefficient coal plants.
Holdings that Contributed
Berkshire Hathaway led the strong relative performance of our financial holdings. The conglomerate continued to put its large cash position to work through accretive acquisitions. Additionally, Berkshire’s investment portfolio appreciated with the market rally, helping to raise its book value. The fundamentals are strong across Berkshire’s business lines, including manufacturing, insurance and railroads. This continues to be our largest holding in the Fund, given what we consider its fortress-like balance sheet and the shares trading at 1.5 times book value, a discount to its historical price-to-book average.
Staying in financials, American International Group (AIG) was also a key contributor. AIG is among the most infamous names from the financial crisis. It took a large bailout from the government to stay alive after making leveraged collateralized debt obligation (CDO) investments and having a poor risk architecture. AIG is now a simple property and casualty and life insurance company. On the P&C side, AIG is making significant progress in increasing efficiency and risk controls while at the same time reducing costs. This has shown through with positive results in late 2012 and early 2013. In addition, AIG is using excess capital to retire expensive debt securities, and potentially later in 2013, the company will initiate a modest dividend and buy back common stock. We believe AIG is in the early innings of its turnaround. Selling at over a 30% discount to book value, 11 times estimated 2013 earnings, and less than 8 times normalized earnings, we maintained our relatively large position.
Ameriprise Financial, another top contributor, also had strong gains during the period. The stock rose after the financial planning and wealth management company reported good earnings driven by cost controls. Ameriprise also boosted its dividend and continued to buy back stock and is returning a significant portion of its earnings to shareholders. We trimmed our position as we felt the stock’s risk/reward profile became less attractive. While Ameriprise’s valuation has risen, we believe the company is well positioned for growth and well capitalized, generates strong free cash flow and has been disciplined in returning capital to shareholders; therefore, it warranted holding a position.
Market Outlook
Despite some confusion over recent Fed statements concerning its quantitative easing bond buying program, some of the bullish arguments for equity prices still hold: Fed liquidity will continue for the time being with rate hikes not on tap until 2015, equity valuations appear fair, and the U.S. remains the “best house on a bad block” as the world muddles through this anemic growth environment. Conversely, the negative market factors have not gone away and would indicate that caution is still warranted as various issues such as fiscal policy, debt issues, and the promotion of effective growth measures have not been addressed in a serious manner. Given slow economic growth, corporate earnings comparisons could also be disappointing. The new near-term risk factor is the uncertainty regarding the impact of higher interest rates on a fragile economy.
Marked improvements in housing and employment markets notwithstanding, the truth is that the U.S. economy is far from being in a strong growth mode and still remains extremely susceptible to external shocks. GDP expanded at an annual rate of 1.8% in the first quarter, notably higher than the 0.4% gain from fourth quarter 2012, but well below the 2.4% pace estimated in March. The Fed still expects GDP growth to pick up steam ahead, given diminished downside risks for the labor market and economic activity, with a 2.3% to 2.6% forecast range for 2013 and an upgraded outlook to 3.0% to 3.5% in 2014. However, the Fed’s forecasts have been
4 | JUNE 30, 2013
(unaudited)
overly optimistic in the past and it remains to be seen if any of the ongoing macroeconomic uncertainties suddenly flare up and shift this positive view. Various threats from across the globe could easily dampen U.S. projections.
In the case of Europe, economic weakness is more and more apparent in the peripheral countries with concern that it has spread to the core. Related issues in Europe are the degree of policy coordination, more levered balance sheets and political instability. The unknown will be the contagion impact, not only in Europe, but to the U.S. and rest of the world as well.
Concerning China, while the country completed its leadership transition in November, economic growth continues to be a wild card. The government lowered its 2013 growth projections from 8% to 7.5%, though weaker global GDP could make this expansion more difficult to achieve. Dislocations in the economy and possibly in the financial system could be problematic. The world has come to rely on China as a core growth engine, and any slowdown, even marginal, is likely to have reverberations worldwide.
In the Fund, our largest weights continue to be in the financial services sector, where we have preference for regional banks, and we remain underweight in the utilities sector. With stocks fairly valued and an uncertain macroeconomic backdrop, we continue to remain cautious on the equity market. However, market pullbacks could provide opportunities to take advantage of price dislocations. As an example, in the most recent quarter we added to real estate investment trusts (REITs), as they were unusually weak as the market focused on interest rate increases.
The key to our research-intensive approach is keeping a long-term perspective and remembering that markets tend to revert to the mean. It can be easy for investors to slip into a complacent mentality during highly volatile momentum markets, when all stocks seem to keep rising. When markets turn, however, the importance of carefully researched quality can quickly become apparent.
Our risk-disciplined investment methodology focuses on identifying attractively priced companies with healthy balance sheets and solid recurring free cash flows that are competitively positioned for long-term success. These types of high-quality firms have historically helped us limit downside portfolio exposure in weak periods, while participating in market rallies. This bias toward quality extends beyond a simply defensive measure. Our research has shown high-quality stocks have delivered higher risk-adjusted return potential over the long term as well.
Looking ahead, we believe our Fund is well positioned to navigate the current market climate, in terms of both risk exposure and long-term upside potential. Our investment team spends a significant amount of time carefully researching each and every stock, and we remain confident that this focus on finding investment value while mitigating absolute risk exposure will serve our clients well, especially if markets experience heightened volatility.
Thank you for your investment with us in Perkins Large Cap Value Fund.
Janus Value Funds | 5
Perkins Large Cap Value Fund (unaudited)
Perkins Large Cap Value Fund At A Glance
5 Top Performers – Holdings
| | | | | |
| | | Contribution |
| |
| Berkshire Hathaway, Inc. – Class B | | | 0.79% | |
| American International Group, Inc. | | | 0.62% | |
| Ameriprise Financial, Inc. | | | 0.54% | |
| Novartis A.G. (ADR) | | | 0.54% | |
| State Street Corp. | | | 0.50% | |
5 Bottom Performers – Holdings
| | | | | |
| | | Contribution |
| |
| Goldcorp, Inc. (U.S. Shares) | | | –0.31% | |
| Teck Resources, Ltd. – Class B | | | –0.20% | |
| SPDR Gold Trust (ETF) | | | –0.15% | |
| Exelon Corp. | | | –0.13% | |
| Freeport-McMoRan Copper & Gold, Inc. | | | –0.13% | |
5 Top Performers – Sectors*
| | | | | | | | | | | | | |
| | | | | Fund Weighting
| | Russell 1000® Value
|
| | | Fund Contribution | | (Average % of Equity) | | Index Weighting |
| |
| Utilities | | | 0.62% | | | | 2.38% | | | | 6.67% | |
| Energy | | | 0.46% | | | | 10.94% | | | | 16.19% | |
| Health Care | | | 0.38% | | | | 16.19% | | | | 11.74% | |
| Financials | | | 0.34% | | | | 20.59% | | | | 27.24% | |
| Industrials | | | 0.31% | | | | 8.45% | | | | 9.06% | |
5 Bottom Performers – Sectors*
| | | | | | | | | | | | | |
| | | | | Fund Weighting
| | Russell 1000® Value
|
| | | Fund Contribution | | (Average % of Equity) | | Index Weighting |
| |
| Other** | | | –3.44% | | | | 11.93% | | | | 0.00% | |
| Information Technology | | | –0.99% | | | | 9.08% | | | | 6.51% | |
| Materials | | | –0.90% | | | | 3.29% | | | | 3.74% | |
| Consumer Discretionary | | | –0.51% | | | | 5.94% | | | | 8.16% | |
| Telecommunication Services | | | –0.17% | | | | 3.81% | | | | 3.42% | |
| | | |
| | | Security contribution to performance is measured by using an algorithm that multiplies the daily performance of each security with the previous day’s ending weight in the portfolio and is gross of advisory fees. Fixed income securities and certain equity securities, such as private placements and some share classes of equity securities, are excluded. |
| * | | Based on sector classification according to the Global Industry Classification Standard (“GICS”) codes, which are the exclusive property and a service mark of MSCI Inc. and Standard & Poor’s. |
| | | |
| ** | | Not a GICS classified sector. |
6 | JUNE 30, 2013
(unaudited)
5 Largest Equity Holdings – (% of Net Assets)
As of June 30, 2013
| | | | | |
Berkshire Hathaway, Inc. – Class B
Reinsurance | | | 2.6% | |
American International Group, Inc.
Multi-Line Insurance | | | 2.3% | |
Royal Dutch Shell PLC (ADR)
Oil Companies – Integrated | | | 2.1% | |
Vodafone Group PLC (ADR)
Cellular Telecommunications | | | 2.0% | |
Novartis A.G. (ADR)
Medical – Drugs | | | 2.0% | |
| | | | | |
| | | | 11.0% | |
Asset Allocation – (% of Net Assets)
As of June 30, 2013
Top Country Allocations – Long Positions (% of Investment Securities)
As of June 30, 2013
Janus Value Funds | 7
Perkins Large Cap Value Fund (unaudited)
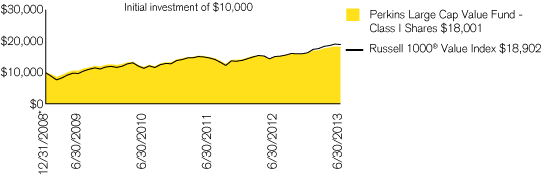
| | | | | | | | |
| Average Annual Total Return – for the periods ended June 30, 2013 | | | | | Expense Ratios – per the October 26, 2012 prospectuses |
| | | One
| | Since
| | | Total Annual Fund
|
| | | Year | | Inception* | | | Operating Expenses |
| | | | | | | | |
| Perkins Large Cap Value Fund – Class A Shares | | | | | | | |
| | | | | | | | |
| NAV | | 19.88% | | 13.59% | | | 1.13% |
| | | | | | | | |
| MOP | | 12.99% | | 12.11% | | | |
| | | | | | | | |
| Perkins Large Cap Value Fund – Class C Shares | | | | | | | |
| | | | | | | | |
| NAV | | 19.17% | | 12.75% | | | 1.92% |
| | | | | | | | |
| CDSC | | 18.17% | | 12.75% | | | |
| | | | | | | | |
| Perkins Large Cap Value Fund – Class D Shares(1) | | 20.25% | | 13.50% | | | 0.95% |
| | | | | | | | |
| Perkins Large Cap Value Fund – Class I Shares | | 20.43% | | 13.97% | | | 0.77% |
| | | | | | | | |
| Perkins Large Cap Value Fund – Class N Shares | | 20.39% | | 13.97% | | | 0.76% |
| | | | | | | | |
| Perkins Large Cap Value Fund – Class S Shares | | 19.84% | | 13.44% | | | 1.25% |
| | | | | | | | |
| Perkins Large Cap Value Fund – Class T Shares | | 20.21% | | 13.61% | | | 1.00% |
| | | | | | | | |
| Russell 1000® Value Index | | 25.32% | | 15.21% | | | |
| | | | | | | | |
| Morningstar Quartile – Class I Shares | | 3rd | | 3rd | | | |
| | | | | | | | |
| Morningstar Ranking – based on total returns for Large Value Funds | | 897/1,237 | | 738/1,136 | | | |
| | | | | | | | |
| Visit janus.com/advisor/mutual-funds (or janus.com/allfunds if you hold Shares directly with Janus Capital) to view current performance and characteristic information | | | |
| | | | | | | | |
Returns quoted are past performance and do not guarantee future results; current performance may be lower or higher. Investment returns and principal value will vary; there may be a gain or loss when shares are sold. For the most recent month-end performance call 877.33JANUS(52687) (or 800.525.3713 if you hold shares directly with Janus Capital) or visit janus.com/advisor/mutual-funds (or janus.com/allfunds if you hold shares directly with Janus Capital).
Performance shown for Class A Shares at Maximum Offering Price (MOP) includes the Fund’s maximum sales charge of 5.75%. Performance shown at Net Asset Value (NAV) does not include this charge and would have been lower had this charge been taken into account.
Performance shown for Class C Shares includes a 1% contingent deferred sales charge (CDSC) on periods of less than 12 months. Performance shown at Net Asset Value (NAV) does not include this sales charge and would have been lower had this sales charge been taken into account.
See important disclosures on the next page.
8 | JUNE 30, 2013
(unaudited)
The expense ratios for Class N Shares are estimated.
The Fund has a performance-based management fee that adjusts up or down based on the Fund’s performance relative to an approved benchmark index over a performance measurement period. See the Fund’s prospectuses or Statement of Additional Information for more details.
The Fund’s performance may be affected by risks that include those associated with undervalued or overlooked companies, investments in specific industries or countries and potential conflicts of interest with the Janus “funds of funds.” Additional risks to the Fund may include those associated with investing in foreign securities, emerging markets, initial public offerings (“IPOs”), real estate investment trusts (“REITs”), and derivatives. Please see the Fund’s prospectuses or janus.com/info (or janus.com/reports if you hold shares directly with Janus Capital) for more information about risks, portfolio holdings and other details.
The Fund invests in REITs, which may be subject to a higher degree of market risk because of concentration in a specific industry, sector or geographic region. REITs may be subject to risks including, but not limited to: legal, political, liquidity, interest rate risks, a decline in the value of real estate, risks related to general and economic conditions, changes in the value of the underlying property owned by the trust and defaults by borrowers. To the extent the Fund invests in foreign REITs, the Fund may be subject to fluctuations in currency rates or political or economic conditions in a particular country.
The Fund will normally invest at least 80% of its net assets, measured at the time of purchase, in the type of securities described by its name.
Holding a meaningful portion of assets in cash or cash equivalents may negatively affect performance.
Returns include reinvestment of all dividends and distributions. The returns do not include adjustments in accordance with generally accepted accounting principles required at the period end for financial reporting purposes.
Class A Shares, Class C Shares, Class I Shares, and Class S Shares of the Fund commenced operations on July 6, 2009. The performance shown for periods prior to July 6, 2009 reflects the historical performance of each respective share class of the predecessor fund, calculated using the fees and expenses of each respective share class accounting for, when applicable and permitted, any fee and expense limitations or waivers.
Class D Shares of the Fund commenced operations on February 16, 2010. The performance shown for periods prior to February 16, 2010 reflects the historical performance of the Fund’s and predecessor fund’s Class I Shares, calculated using the fees and expenses of Class D Shares without the effect of any fee and expense limitations or waivers.
Class N Shares of the Fund commenced operations on May 31, 2012. The performance shown for periods prior to May 31, 2012 reflects the historical performance of a similar share class of the Fund and predecessor fund.
Class T Shares of the Fund commenced operations on July 6, 2009. The performance shown for periods prior to July 6, 2009 reflects the historical performance of the predecessor fund’s Class I Shares, calculated using the fees and expenses of Class T Shares without the effect of any fee and expense limitations or waivers.
If each share class of the Fund had been available during periods prior to its commencement, the performance shown may have been different. The performance shown for periods following the Fund’s commencement of each share class reflects the fees and expenses of each respective share class, net of any applicable fee and expense limitations or waivers. Please refer to the Fund’s prospectuses for further details concerning historical performance.
Ranking is for the share class shown only; other classes may have different performance characteristics. When an expense waiver is in effect, it may have a material effect on the total return, and therefore the ranking for the period.
© 2013 Morningstar, Inc. All Rights Reserved.
There is no assurance that the investment process will consistently lead to successful investing.
See Notes to Schedules of Investments and Other Information for index definitions.
The Fund’s portfolio may differ significantly from the securities held in the index. The index is unmanaged and is not available for direct investment; therefore, its performance does not reflect the expenses associated with the active management of an actual portfolio.
See “Useful Information About Your Fund Report.”
| | | |
| * | | The predecessor Fund’s inception date – December 31, 2008 |
| (1) | | Closed to new investors. |
Janus Value Funds | 9
Perkins Large Cap Value Fund (unaudited)
As a shareholder of the Fund, you incur two types of costs: (1) transaction costs, such as sales charges (loads) on purchase payments (applicable to Class A Shares only); and (2) ongoing costs, including management fees; distribution and shareholder servicing (12b-1) fees; administrative services fees payable pursuant to the Transfer Agency Agreement; and other Fund expenses. This example is intended to help you understand your ongoing costs (in dollars) of investing in the Fund and to compare these costs with the ongoing costs of investing in other mutual funds. To do so, compare this 5% hypothetical example with the 5% hypothetical examples that appear in the shareholder reports of the other funds. The example is based upon an investment of $1,000 invested at the beginning of the period and held for the six-months indicated, unless noted otherwise in the table and footnotes below.
Actual Expenses
The information in the table under the heading “Actual” provides information about actual account values and actual expenses. You may use the information in these columns, together with the amount you invested, to estimate the expenses that you paid over the period. Simply divide your account value by $1,000 (for example, an $8,600 account value divided by $1,000 = 8.6), then multiply the result by the number in the appropriate column for your share class under the heading entitled “Expenses Paid During Period” to estimate the expenses you paid on your account during the period.
Hypothetical Example for Comparison Purposes
The information in the table under the heading “Hypothetical (5% return before expenses)” provides information about hypothetical account values and hypothetical expenses based upon the Fund’s actual expense ratio and an assumed rate of return of 5% per year before expenses, which is not the Fund’s actual return. The hypothetical account values and expenses may not be used to estimate the actual ending account balance or expenses you paid for the period. You may use this information to compare the ongoing costs of investing in the Fund and other funds. To do so, compare this 5% hypothetical example with the 5% hypothetical examples that appear in the shareholder reports of the other funds. Additionally, for an analysis of the fees associated with an investment in any share class or other similar funds, please visit www.finra.org/fundanalyzer.
Please note that the expenses shown in the table are meant to highlight your ongoing costs only and do not reflect any transaction costs. These fees are fully described in the Fund’s prospectuses. Therefore, the hypothetical examples are useful in comparing ongoing costs only, and will not help you determine the relative total costs of owning different funds. In addition, if these transaction costs were included, your costs would have been higher.
| | | | | | | | | | | | | | | | | | | | | | | | | | | | | | | |
| | | | | Hypothetical
| | | | |
| | | Actual | | (5% return before expenses) | | | | |
| | | Beginning
| | Ending
| | Expenses
| | Beginning
| | Ending
| | Expenses
| | | | |
| | | Account
| | Account
| | Paid During
| | Account
| | Account
| | Paid During
| | Net Annualized
| | |
| | | Value
| | Value
| | Period
| | Value
| | Value
| | Period
| | Expense Ratio
| | |
| | | (1/1/13) | | (6/30/13) | | (1/1/13 - 6/30/13)† | | (1/1/13) | | (6/30/13) | | (1/1/13 - 6/30/13)† | | (1/1/13 - 6/30/13) | | |
| |
| |
| Class A Shares | | $ | 1,000.00 | | | $ | 1,130.20 | | | $ | 6.44 | | | $ | 1,000.00 | | | $ | 1,018.74 | | | $ | 6.11 | | | | 1.22% | | | |
| |
| |
| Class C Shares | | $ | 1,000.00 | | | $ | 1,127.00 | | | $ | 9.18 | | | $ | 1,000.00 | | | $ | 1,016.17 | | | $ | 8.70 | | | | 1.74% | | | |
| |
| |
| Class D Shares | | $ | 1,000.00 | | | $ | 1,133.20 | | | $ | 4.07 | | | $ | 1,000.00 | | | $ | 1,020.98 | | | $ | 3.86 | | | | 0.77% | | | |
| |
| |
| Class I Shares | | $ | 1,000.00 | | | $ | 1,133.50 | | | $ | 3.44 | | | $ | 1,000.00 | | | $ | 1,021.57 | | | $ | 3.26 | | | | 0.65% | | | |
| |
| |
| Class N Shares | | $ | 1,000.00 | | | $ | 1,133.60 | | | $ | 3.33 | | | $ | 1,000.00 | | | $ | 1,021.67 | | | $ | 3.16 | | | | 0.63% | | | |
| |
| |
| Class S Shares | | $ | 1,000.00 | | | $ | 1,130.20 | | | $ | 6.02 | | | $ | 1,000.00 | | | $ | 1,019.14 | | | $ | 5.71 | | | | 1.14% | | | |
| |
| |
| Class T Shares | | $ | 1,000.00 | | | $ | 1,132.60 | | | $ | 4.65 | | | $ | 1,000.00 | | | $ | 1,020.43 | | | $ | 4.41 | | | | 0.88% | | | |
| |
| |
| | | |
| † | | Expenses Paid During Period are equal to the Net Annualized Expense Ratio multiplied by the average account value over the period, multiplied by the number of days in the most recent six-month period, divided by the number of days in the fiscal year. Expenses in the examples include the effect of applicable fee waivers and/or expense reimbursements, if any. Had such waivers and/or reimbursements not been in effect, your expenses would have been higher. Please refer to the Notes to Financial Statements or the Fund’s prospectuses for more information regarding waivers and/or reimbursements. |
10 | JUNE 30, 2013
Perkins Large Cap Value Fund
Schedule of Investments
As of June 30, 2013
| | | | | | | | | | | |
| Shares or Principal Amount | | Value | | | |
| |
| Common Stock – 89.8% | | | | | | |
| Aerospace and Defense – 1.9% | | | | | | |
| | 22,500 | | | General Dynamics Corp. | | $ | 1,762,425 | | | |
| | 11,200 | | | Rockwell Collins, Inc. | | | 710,192 | | | |
| | | | | | | | 2,472,617 | | | |
| Aerospace and Defense – Equipment – 0.6% | | | | | | |
| | 8,000 | | | United Technologies Corp. | | | 743,520 | | | |
| Agricultural Chemicals – 0.7% | | | | | | |
| | 16,800 | | | Mosaic Co. | | | 904,008 | | | |
| Applications Software – 2.3% | | | | | | |
| | 23,000 | | | Check Point Software Technologies, Ltd.* | | | 1,142,640 | | | |
| | 56,800 | | | Microsoft Corp. | | | 1,961,304 | | | |
| | | | | | | | 3,103,944 | | | |
| Automotive – Truck Parts and Equipment – Original – 0.5% | | | | | | |
| | 18,400 | | | Johnson Controls, Inc. | | | 658,536 | | | |
| Beverages – Non-Alcoholic – 1.3% | | | | | | |
| | 21,300 | | | PepsiCo, Inc. | | | 1,742,127 | | | |
| Brewery – 0.5% | | | | | | |
| | 12,600 | | | Molson Coors Brewing Co. – Class B | | | 603,036 | | | |
| Cable/Satellite Television – 0.8% | | | | | | |
| | 25,600 | | | Comcast Corp. – Class A | | | 1,072,128 | | | |
| Cellular Telecommunications – 2.0% | | | | | | |
| | 93,000 | | | Vodafone Group PLC (ADR) | | | 2,672,820 | | | |
| Commercial Banks – 0.8% | | | | | | |
| | 32,000 | | | BB&T Corp. | | | 1,084,160 | | | |
| Commercial Services – Finance – 0.5% | | | | | | |
| | 42,000 | | | Western Union Co. | | | 718,620 | | | |
| Computer Services – 0.7% | | | | | | |
| | 5,700 | | | Accenture PLC – Class A (U.S. Shares) | | | 410,172 | | | |
| | 2,400 | | | International Business Machines Corp. | | | 458,664 | | | |
| | | | | | | | 868,836 | | | |
| Computers – Memory Devices – 0.7% | | | | | | |
| | 40,000 | | | EMC Corp. | | | 944,800 | | | |
| Cosmetics and Toiletries – 1.4% | | | | | | |
| | 24,000 | | | Procter & Gamble Co. | | | 1,847,760 | | | |
| Diversified Banking Institutions – 3.0% | | | | | | |
| | 34,400 | | | Citigroup, Inc. | | | 1,650,168 | | | |
| | 4,400 | | | Goldman Sachs Group, Inc. | | | 665,500 | | | |
| | 22,000 | | | JPMorgan Chase & Co. | | | 1,161,380 | | | |
| | 20,000 | | | Morgan Stanley | | | 488,600 | | | |
| | | | | | | | 3,965,648 | | | |
| Diversified Operations – 1.0% | | | | | | |
| | 54,400 | | | General Electric Co. | | | 1,261,536 | | | |
| Electric – Integrated – 2.6% | | | | | | |
| | 10,000 | | | Entergy Corp. | | | 696,800 | | | |
| | 28,000 | | | Exelon Corp. | | | 864,640 | | | |
| | 61,000 | | | PPL Corp. | | | 1,845,860 | | | |
| | | | | | | | 3,407,300 | | | |
| Electronic Components – Semiconductors – 1.5% | | | | | | |
| | 36,000 | | | Altera Corp. | | | 1,187,640 | | | |
| | 32,000 | | | Intel Corp. | | | 775,040 | | | |
| | | | | | | | 1,962,680 | | | |
| Electronic Security Devices – 0.6% | | | | | | |
| | 25,600 | | | Tyco International, Ltd. (U.S. Shares) | | | 843,520 | | | |
| Engineering – Research and Development Services – 1.3% | | | | | | |
| | 17,000 | | | Jacobs Engineering Group, Inc.* | | | 937,210 | | | |
| | 25,500 | | | KBR, Inc. | | | 828,750 | | | |
| | | | | | | | 1,765,960 | | | |
| Enterprise Software/Services – 1.6% | | | | | | |
| | 29,000 | | | CA, Inc. | | | 830,270 | | | |
| | 40,000 | | | Oracle Corp. | | | 1,228,800 | | | |
| | | | | | | | 2,059,070 | | | |
| Fiduciary Banks – 0.9% | | | | | | |
| | 18,800 | | | State Street Corp. | | | 1,225,948 | | | |
| Finance – Credit Card – 0.8% | | | | | | |
| | 20,800 | | | Discover Financial Services | | | 990,912 | | | |
| Finance – Other Services – 0.9% | | | | | | |
| | 6,400 | | | IntercontinentalExchange, Inc.* | | | 1,137,664 | | | |
| Food – Miscellaneous/Diversified – 2.1% | | | | | | |
| | 28,000 | | | General Mills, Inc. | | | 1,358,840 | | | |
| | 33,600 | | | Unilever PLC (ADR) | | | 1,359,120 | | | |
| | | | | | | | 2,717,960 | | | |
| Food – Retail – 0.6% | | | | | | |
| | 24,000 | | | Kroger Co. | | | 828,960 | | | |
| Gold Mining – 0.5% | | | | | | |
| | 28,000 | | | Goldcorp, Inc. (U.S. Shares) | | | 692,440 | | | |
| Instruments – Controls – 0.6% | | | | | | |
| | 9,300 | | | Honeywell International, Inc. | | | 737,862 | | | |
| Instruments – Scientific – 0.8% | | | | | | |
| | 12,000 | | | Thermo Fisher Scientific, Inc. | | | 1,015,560 | | | |
| Insurance Brokers – 0.9% | | | | | | |
| | 30,000 | | | Marsh & McLennan Cos., Inc. | | | 1,197,600 | | | |
| Investment Management and Advisory Services – 1.4% | | | | | | |
| | 12,900 | | | Ameriprise Financial, Inc. | | | 1,043,352 | | | |
| | 27,000 | | | Invesco, Ltd. | | | 858,600 | | | |
| | | | | | | | 1,901,952 | | | |
| Machinery – Farm – 0.4% | | | | | | |
| | 7,200 | | | Deere & Co. | | | 585,000 | | | |
| Medical – Biomedical and Genetic – 1.1% | | | | | | |
| | 7,000 | | | Amgen, Inc. | | | 690,620 | | | |
| | 16,000 | | | Gilead Sciences, Inc.* | | | 819,360 | | | |
| | | | | | | | 1,509,980 | | | |
| Medical – Drugs – 8.1% | | | | | | |
| | 14,400 | | | Abbott Laboratories | | | 502,272 | | | |
| | 17,000 | | | AbbVie, Inc. | | | 702,780 | | | |
| | 21,600 | | | Johnson & Johnson | | | 1,854,576 | | | |
| | 56,000 | | | Merck & Co., Inc. | | | 2,601,200 | | | |
| | 37,600 | | | Novartis A.G. (ADR) | | | 2,658,696 | | | |
| | 84,800 | | | Pfizer, Inc. | | | 2,375,248 | | | |
| | | | | | | | 10,694,772 | | | |
| Medical – Generic Drugs – 1.2% | | | | | | |
| | 41,600 | | | Teva Pharmaceutical Industries, Ltd. (ADR) | | | 1,630,720 | | | |
| Medical – HMO – 0.7% | | | | | | |
| | 11,100 | | | WellPoint, Inc. | | | 908,424 | | | |
| Medical – Wholesale Drug Distributors – 0.8% | | | | | | |
| | 9,600 | | | McKesson Corp. | | | 1,099,200 | | | |
| Medical Instruments – 0.6% | | | | | | |
| | 15,200 | | | Medtronic, Inc. | | | 782,344 | | | |
| | | | | | | | | | | |
See Notes to Schedules of Investments and Other Information and Notes to Financial Statements.
Janus Value Funds | 11
Perkins Large Cap Value Fund
Schedule of Investments
As of June 30, 2013
| | | | | | | | | | | |
| Shares or Principal Amount | | Value | | | |
| |
| Medical Labs and Testing Services – 0.9% | | | | | | |
| | 11,600 | | | Laboratory Corp. of America Holdings* | | $ | 1,161,160 | | | |
| Medical Products – 2.1% | | | | | | |
| | 14,000 | | | Baxter International, Inc. | | | 969,780 | | | |
| | 16,300 | | | Stryker Corp. | | | 1,054,284 | | | |
| | 10,400 | | | Zimmer Holdings, Inc. | | | 779,376 | | | |
| | | | | | | | 2,803,440 | | | |
| Metal – Copper – 0.4% | | | | | | |
| | 19,200 | | | Freeport-McMoRan Copper & Gold, Inc. | | | 530,112 | | | |
| Multi-Line Insurance – 3.1% | | | | | | |
| | 20,800 | | | Allstate Corp. | | | 1,000,896 | | | |
| | 68,000 | | | American International Group, Inc. | | | 3,039,600 | | | |
| | | | | | | | 4,040,496 | | | |
| Multimedia – 1.7% | | | | | | |
| | 24,800 | | | Time Warner, Inc. | | | 1,433,936 | | | |
| | 12,400 | | | Walt Disney Co. | | | 783,060 | | | |
| | | | | | | | 2,216,996 | | | |
| Networking Products – 0.9% | | | | | | |
| | 48,800 | | | Cisco Systems, Inc. | | | 1,186,328 | | | |
| Non-Hazardous Waste Disposal – 0.9% | | | | | | |
| | 36,000 | | | Republic Services, Inc. | | | 1,221,840 | | | |
| Oil – Field Services – 0.9% | | | | | | |
| | 15,700 | | | Schlumberger, Ltd. (U.S. Shares) | | | 1,125,062 | | | |
| Oil and Gas Drilling – 0.8% | | | | | | |
| | 18,000 | | | Ensco PLC – Class A | | | 1,046,160 | | | |
| Oil Companies – Exploration and Production – 5.2% | | | | | | |
| | 12,000 | | | Anadarko Petroleum Corp. | | | 1,031,160 | | | |
| | 23,400 | | | Noble Energy, Inc. | | | 1,404,936 | | | |
| | 29,500 | | | Occidental Petroleum Corp. | | | 2,632,285 | | | |
| | 37,200 | | | QEP Resources, Inc. | | | 1,033,416 | | | |
| | 17,200 | | | Whiting Petroleum Corp.* | | | 792,748 | | | |
| | | | | | | | 6,894,545 | | | |
| Oil Companies – Integrated – 3.6% | | | | | | |
| | 10,000 | | | Chevron Corp. | | | 1,183,400 | | | |
| | 13,200 | | | Hess Corp. | | | 877,668 | | | |
| | 43,000 | | | Royal Dutch Shell PLC (ADR) | | | 2,743,400 | | | |
| | | | | | | | 4,804,468 | | | |
| Oil Field Machinery and Equipment – 0.8% | | | | | | |
| | 16,000 | | | National Oilwell Varco, Inc. | | | 1,102,400 | | | |
| Pipelines – 0.5% | | | | | | |
| | 11,200 | | | Enterprise Products Partners L.P. | | | 696,080 | | | |
| Property and Casualty Insurance – 0.6% | | | | | | |
| | 10,000 | | | Travelers Cos., Inc. | | | 799,200 | | | |
| Reinsurance – 3.1% | | | | | | |
| | 30,400 | | | Berkshire Hathaway, Inc. – Class B* | | | 3,402,368 | | | |
| | 5,200 | | | Everest Re Group, Ltd. | | | 666,952 | | | |
| | | | | | | | 4,069,320 | | | |
| REIT – Apartments – 0.3% | | | | | | |
| | 6,824 | | | Equity Residential | | | 396,201 | | | |
| REIT – Diversified – 1.1% | | | | | | |
| | 50,000 | | | Weyerhaeuser Co. | | | 1,424,500 | | | |
| REIT – Health Care – 1.0% | | | | | | |
| | 30,000 | | | HCP, Inc. | | | 1,363,200 | | | |
| Retail – Discount – 1.4% | | | | | | |
| | 17,600 | | | Target Corp. | | | 1,211,936 | | | |
| | 8,000 | | | Wal-Mart Stores, Inc. | | | 595,920 | | | |
| | | | | | | | 1,807,856 | | | |
| Retail – Drug Store – 0.7% | | | | | | |
| | 15,600 | | | CVS Caremark Corp. | | | 892,008 | | | |
| Retail – Regional Department Stores – 0.6% | | | | | | |
| | 17,000 | | | Kohl’s Corp. | | | 858,670 | | | |
| Retail – Restaurants – 0.8% | | | | | | |
| | 11,200 | | | McDonald’s Corp. | | | 1,108,800 | | | |
| Semiconductor Components/Integrated Circuits – 1.8% | | | | | | |
| | 21,000 | | | Analog Devices, Inc. | | | 946,260 | | | |
| | 22,500 | | | QUALCOMM, Inc. | | | 1,374,300 | | | |
| | | | | | | | 2,320,560 | | | |
| Semiconductor Equipment – 0.6% | | | | | | |
| | 52,000 | | | Applied Materials, Inc. | | | 775,320 | | | |
| Super-Regional Banks – 5.0% | | | | | | |
| | 76,000 | | | Fifth Third Bancorp | | | 1,371,800 | | | |
| | 19,500 | | | PNC Financial Services Group, Inc. | | | 1,421,940 | | | |
| | 26,000 | | | SunTrust Banks, Inc. | | | 820,820 | | | |
| | 20,800 | | | U.S. Bancorp | | | 751,920 | | | |
| | 52,800 | | | Wells Fargo & Co. | | | 2,179,056 | | | |
| | | | | | | | 6,545,536 | | | |
| Telephone – Integrated – 0.5% | | | | | | |
| | 17,000 | | | AT&T, Inc. | | | 601,800 | | | |
| Tools – Hand Held – 0.6% | | | | | | |
| | 9,600 | | | Stanley Black & Decker, Inc. | | | 742,080 | | | |
| Transportation – Railroad – 0.5% | | | | | | |
| | 9,600 | | | Norfolk Southern Corp. | | | 697,440 | | | |
| Transportation – Services – 0.7% | | | | | | |
| | 10,000 | | | FedEx Corp. | | | 985,800 | | | |
| |
| |
| Total Common Stock (cost $93,950,454) | | | 118,577,302 | | | |
| |
| |
| Exchange-Traded Fund – 0.4% | | | | | | |
| Commodity – 0.4% | | | | | | |
| | 4,800 | | | SPDR Gold Trust (ETF)* (cost $751,196) | | | 571,920 | | | |
| |
| |
| Repurchase Agreement – 10.9% | | | | | | |
| | $14,400,000 | | | ING Financial Markets LLC, 0.0100%, dated 6/28/13, maturing 7/1/13 to be repurchased at $14,400,012 collateralized by $1,162,725 in a U.S. Government Agency 4.0000%, 2/20/40 and $11,571,372 in U.S. Treasuries 0.2500%-8.8750%, 2/28/15-2/15/19 with respective values of $1,238,460 and $13,449,666
(cost $14,400,000) | | | 14,400,000 | | | |
| |
| |
| Total Investments (total cost $109,101,650) – 101.1% | | | 133,549,222 | | | |
| |
| |
| Liabilities, net of Cash, Receivables and Other Assets– (1.1)% | | | (1,450,097) | | | |
| |
| |
| Net Assets – 100% | | $ | 132,099,125 | | | |
| |
| |
See Notes to Schedules of Investments and Other Information and Notes to Financial Statements.
12 | JUNE 30, 2013
Schedule of Investments
As of June 30, 2013
Summary of Investments by Country – (Long Positions) (unaudited)
| | | | | | | | | |
| | | | | | % of Investment
| |
| Country | | Value | | | Securities | |
| |
| |
| Canada | | $ | 692,440 | | | | 0.5% | |
| Israel | | | 2,773,360 | | | | 2.1% | |
| Switzerland | | | 2,658,696 | | | | 2.0% | |
| United Kingdom | | | 6,775,340 | | | | 5.1% | |
United States†† | | | 120,649,386 | | | | 90.3% | |
| |
| |
| Total | | $ | 133,549,222 | | | | 100.0% | |
| | | |
| †† | | Includes Cash Equivalents of 10.8%. |
See Notes to Schedules of Investments and Other Information and Notes to Financial Statements.
Janus Value Funds | 13
Perkins Mid Cap Value Fund (unaudited)(closed to certain new investors)
| | | | | | | |
Fund Snapshot
The Fund seeks to invest in what we believe are fundamentally and financially strong mid-size companies exhibiting favorable risk-reward characteristics. We believe in the timeless adage of the power of compounding and in doing so our focus is on mitigating losses in difficult markets. We invest in securities we believe have favorable reward to risk ratios by focusing first on rigorous downside analysis prior to determining upside potential. We seek to outperform both our benchmark and peers over a full market cycle by building a diversified portfolio of high-quality, undervalued stocks.
| |
Tom Perkins
co-portfolio manager | | 
Jeff Kautz
co-portfolio manager | |
Kevin Preloger
co-portfolio manager |
Performance Overview
During the 12 months ended June 30, 2013, Perkins Mid Cap Value Fund’s Class T Shares returned 19.56% compared with a 27.65% return for its benchmark, the Russell Midcap Value Index. Our 10.94% average cash weighting was our most significant detractor from relative performance, followed by our holdings in information technology and telecommunication services. Our financial holdings were our most significant relative contributors.
Co-Portfolio Manager Added
During the period, Kevin Preloger was added as a co-portfolio manager alongside Tom Perkins and Jeffrey Kautz. Mr. Preloger, who has 16 years of financial industry experience, will also continue to serve as co-portfolio manager of Perkins Large Cap Value Fund. Since joining Perkins in 2002, Mr. Preloger has become an integral part of the Perkins team and demonstrated his skill as an analyst and portfolio manager. As the financial services analyst from 2002-09, he helped the Perkins portfolios navigate difficult markets, including the financial crisis of 2008.
Economic Environment
The period opened with a good rally. The most important positive factor affecting the markets were statements from Mario Draghi, head of the European Central Bank (ECB), that European monetary policy would become much more aggressive in providing liquidity conditioned upon defined deleveraging programs. In addition, in September the U.S. Federal Reserve (Fed) announced that it would keep Fed funds interest rates at 0% to 0.25% well into 2015 and that it would embark upon a more open-ended quantitative easing policy.
The rally was more modestly extended in the fourth quarter of 2012. U.S. gross domestic product (GDP) was up a surprising 3%, and the Fed stated it would not raise rates until unemployment falls to 6.5% and inflation does not rise above 2.5%. European markets were firm as the ECB’s promise “to do whatever it takes” and small steps toward political cooperation had a calming effect. This was despite signs that GDP in Europe was heading to negative territory. China’s political transition appeared orderly and, with signs the economy was stabilizing in the area of 7% growth, its stock market rallied off its three-year bottom.
The strong rally in 2012’s second half extended into the first quarter. U.S. GDP was essentially flat as government, business and consumer spending were impacted by year-end government policy uncertainty and inventories were drawn down. At year end, Washington came to agreement to push out the debt ceiling debate and tax rate reductions for all but the top brackets were extended; however, payroll taxes increased for all. This clarity on tax policy relieved some of the year-end anxiety.
U.S. stocks continued to climb higher in the second quarter, but they took a volatile path to get there. The CBOE VIX Index, a general measure of market volatility, spiked over 40% off its recent lows, which created some opportunities to purchase high-quality companies on sale. As a result, our cash position ended lower than our average for the period. Equities generally remain fairly valued, with the S&P 500 Index trading around 14.6 times 2013 earnings estimates. The index’s 6.85% forward earnings yield also remained attractive compared with the 10-year U.S. Treasury note’s 2.49% yield, even after the recent run-up in interest rates. Corporate balance sheets remain on solid footing, which bodes well for future dividend increases and greater merger activity, both factors that we view as supportive of equity prices.
14 | JUNE 30, 2013
(unaudited)(closed to certain new investors)
Holdings That Detracted
Goldcorp was our largest individual detractor. Shares of this high-quality, low-cost gold producer declined 33%, as the underlying spot gold price declined 24% during the period. Goldcorp has among the lowest production costs and the best production growth outlook of any major gold miner as four major projects are expected to enter production in the next four years. Goldcorp also has a net debt-free balance sheet, and high-quality assets that are unlikely to need a write-down in value, unlike the actions its competitors have recently taken. With valuations based on tangible book value near multiyear lows, and spot prices below the all-in production costs of higher-cost competitors, we maintain a position.
Staying in materials, Canadian metallurgical coal and copper producer Teck Resources also weighed on performance. The shares were hit by significant oversupply, as the largest metallurgical coal producer, BHP, announced its intention to increase coal production from several new projects, despite deterioration in pricing. Those supply additions, in combination with increased domestic Chinese metallurgical coal production and a slowing Chinese economy, forced us to re-evaluate our downside and upside cases for the stock. As a result of our lower proprietary reward to risk ratio, we eliminated our position.
Integrated utility Exelon was another detractor. The shares were weak as the PJM Interconnection (a regional transmission organization serving many Eastern states) power auction results were significantly below previous forecasts. Furthermore, many utility stocks fared poorly as interest rates rose significantly on fears that the Fed would slow its quantitative easing monetary policy. We think Exelon remains well positioned longer term to benefit from improving power prices driven by federal regulation and retirement of old, inefficient coal plants.
Holdings That Contributed
Ameriprise Financial led the strong relative performance of our financial holdings. The stock rose after the financial planning and wealth management company reported good earnings driven by cost controls. Ameriprise also boosted its dividend and continued to buy back stock. We trimmed our position as we felt the stock’s risk/reward profile became less attractive. While Ameriprise’s valuation has risen, we believe the company is well positioned for growth and well capitalized, generates strong free cash flow and has been disciplined in returning capital to shareholders; therefore, it warranted holding a position.
Science tool provider Thermo Fisher Scientific, another key contributor, also had strong gains during the year. Shares of this long-term holding rebounded from underperforming levels in 2011 as earnings continued its growth and investors became less concerned about health care reform. We continue to hold a position. The stock still has a below average valuation and strong free cash flow – in fact the company initiated a dividend.
In industrials, Jacobs Engineering Group was an important contributor. After eight quarters of growing its backlog of business, shares of the company surged during the first quarter of 2013 as the market began to realize that Jacobs is one of the strongest-positioned engineering and construction firms. With significant net cash on the balance sheet, we think this best-of-breed contractor can return to its mid-teens earnings growth track record. Specifically, with strong positions in upstream Canadian oil and gas, North American chemicals, and global downstream production, the company is especially well positioned to take advantage of continued worldwide growth in nontraditional energy production and consumption. The strength in the stock made its risk/reward profile less positive, so we trimmed our large position.
Derivatives
A small investment in index put options was maintained during some of the period for hedging purposes (making an investment in an attempt to reduce the risk of adverse price movements) reflecting our concerns about macroeconomic issues, but these puts expired at the end of 2012 and were not replaced. Currently we are not using index put options and do not have plans to resume this hedging strategy. In aggregate, these positions detracted from the Fund’s performance in the period. Please see “Notes to Financial Statements” for a discussion of derivatives used by the Fund.
Market Outlook and Positioning
Despite some confusion over recent Fed statements concerning its quantitative easing bond buying program, some of the bullish arguments for equity prices still hold: Fed liquidity will continue for the time being with rate hikes not on tap until 2015, equity valuations appear fair, and the U.S. remains the “best house on a bad block” as the world muddles through this anemic growth environment. Conversely, the negative market factors have not gone away and would indicate that caution is still warranted as various issues such as fiscal policy, debt issues, and the promotion of effective growth measures have not been addressed in a serious manner. Given slow
Janus Value Funds | 15
Perkins Mid Cap Value Fund (unaudited)(closed to certain new investors)
economic growth, corporate earnings comparisons could be disappointing. The new near term risk factor is the uncertainty regarding the impact of higher interest rates on a fragile economy.
Marked improvements in housing and employment markets notwithstanding, the truth is that the U.S. economy is far from being in a strong growth mode and still remains extremely susceptible to external shocks. GDP expanded at an annual rate of 1.8% in the first quarter, notably higher than the 0.4% gain from fourth quarter 2012, but well below the 2.4% pace estimated in March. The Fed still expects GDP growth to pick up steam ahead, given diminished downside risks for the labor market and economic activity, with a 2.3% to 2.6% forecast range for 2013 and an upgraded outlook to 3.0% to 3.5% in 2014. However, the Fed’s forecasts have been overly optimistic in the past and it remains to be seen if any of the ongoing macroeconomic uncertainties suddenly flare up and shift this positive view. Various threats from across the globe could easily dampen U.S. projections.
In the case of Europe, economic weakness is more and more apparent in the peripheral countries with concern that it has spread to the core. Related issues in Europe are the degree of policy coordination, more levered balance sheets and political instability. The unknown will be the contagion impact, not only in Europe, but to the U.S. and rest of the world as well.
Concerning China, while the country completed its leadership transition in November, economic growth continues to be a wild card. The government lowered its 2013 growth projections from 8% to 7.5%, though weaker global GDP could make this expansion more difficult to achieve. Dislocations in the economy and possibly in the financial system could be problematic. The world has come to rely on China as a core growth engine, and any slowdown, even marginal, is likely to have reverberations worldwide.
In the Fund, our largest weights continue to be in the financial services sector, particularly the regional banks, and we remain underweight in the utilities sector. With stocks appearing fairly valued and an uncertain macroeconomic backdrop, we continue to remain cautious on the equity market. However market pullbacks could provide opportunities to take advantage of price dislocations. As an example, in this quarter we added to real estate investment trusts (REITs), as they were unusually weak as the market focused on interest rate increases.
The key to our research-intensive approach is keeping a long-term perspective and remembering that markets tend to revert to the mean. It can be easy for investors to slip into a complacent mentality during highly volatile momentum markets, when all stocks seem to keep rising. When markets turn, however, the importance of carefully researched quality can quickly become apparent.
Our risk-disciplined investment methodology focuses on identifying attractively priced companies with healthy balance sheets and solid recurring free cash flows that are competitively positioned for long-term success. These types of high-quality firms have historically helped us limit downside portfolio exposure in weak periods, while participating in market rallies. This bias toward quality extends beyond a simply defensive measure. Our research has shown high-quality stocks have delivered higher risk-adjusted return potential over the long term as well.
Looking ahead, we believe our Fund is well positioned to navigate the current market climate, in terms of both risk exposure and long-term upside potential. Our investment team spends a significant amount of time carefully researching each and every stock, and we remain confident that this focus on finding investment value while mitigating absolute risk exposure will serve our clients well, especially if markets experience heightened volatility.
Thank you for your investment with us in Perkins Mid Cap Value Fund.
16 | JUNE 30, 2013
(unaudited)(closed to certain new investors)
Perkins Mid Cap Value Fund At A Glance
5 Top Performers – Holdings
| | | | | |
| | | Contribution |
| |
| Ameriprise Financial, Inc. | | | 0.70% | |
| Thermo Fisher Scientific, Inc. | | | 0.65% | |
| Jacobs Engineering Group, Inc. | | | 0.61% | |
| Aetna, Inc. | | | 0.53% | |
| Kirby Corp. | | | 0.52% | |
5 Bottom Performers – Holdings
| | | | | |
| | | Contribution |
| |
| Goldcorp, Inc. (U.S. Shares) | | | –0.46% | |
| Teck Resources, Ltd. – Class B | | | –0.17% | |
| Exelon Corp. | | | –0.15% | |
| QLogic Corp. | | | –0.14% | |
| QEP Resources, Inc. | | | –0.10% | |
5 Top Performers – Sectors*
| | | | | | | | | | | | | |
| | | | | Fund Weighting
| | Russell Midcap® Value
|
| | | Fund Contribution | | (Average % of Equity) | | Index Weighting |
| |
| Financials | | | 1.15% | | | | 27.67% | | | | 30.56% | |
| Utilities | | | 0.44% | | | | 3.41% | | | | 10.32% | |
| Health Care | | | 0.02% | | | | 12.02% | | | | 7.11% | |
| Energy | | | –0.16% | | | | 9.37% | | | | 9.08% | |
| Consumer Staples | | | –0.17% | | | | 3.17% | | | | 4.83% | |
5 Bottom Performers – Sectors*
| | | | | | | | | | | | | |
| | | | | Fund Weighting
| | Russell Midcap® Value
|
| | | Fund Contribution | | (Average % of Equity) | | Index Weighting |
| |
| Other** | | | –3.20% | | | | 9.83% | | | | 0.00% | |
| Information Technology | | | –1.57% | | | | 9.12% | | | | 10.21% | |
| Telecommunication Services | | | –0.91% | | | | 1.91% | | | | 1.38% | |
| Materials | | | –0.75% | | | | 3.58% | | | | 6.00% | |
| Industrials | | | –0.72% | | | | 12.14% | | | | 11.10% | |
| | | |
| | | Security contribution to performance is measured by using an algorithm that multiplies the daily performance of each security with the previous day’s ending weight in the portfolio and is gross of advisory fees. Fixed income securities and certain equity securities, such as private placements and some share classes of equity securities, are excluded. |
| * | | Based on sector classification according to the Global Industry Classification Standard (“GICS”) codes, which are the exclusive property and a service mark of MSCI Inc. and Standard & Poor’s. |
| | | |
| ** | | Not a GICS classified sector. |
Janus Value Funds | 17
Perkins Mid Cap Value Fund (unaudited)(closed to certain new investors)
5 Largest Equity Holdings – (% of Net Assets)
As of June 30, 2013
| | | | | |
Marsh & McLennan Cos., Inc.
Insurance Brokers | | | 1.9% | |
PPL Corp.
Electric – Integrated | | | 1.7% | |
Republic Services, Inc.
Non-Hazardous Waste Disposal | | | 1.7% | |
CIT Group, Inc.
Commercial Banks | | | 1.5% | |
Laboratory Corp. of America Holdings
Medical Labs and Testing Services | | | 1.5% | |
| | | | | |
| | | | 8.3% | |
Asset Allocation – (% of Net Assets)
As of June 30, 2013
Top Country Allocations – Long Positions (% of Investment Securities)
As of June 30, 2013
18 | JUNE 30, 2013
(unaudited)(closed to certain new investors)
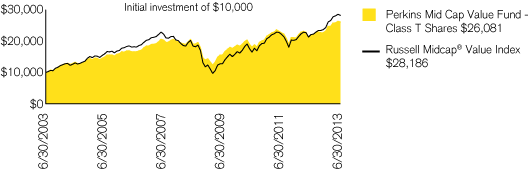
| | | | | | | | | | | | | | |
| Average Annual Total Return – for the periods ended June 30, 2013 | | | Expense Ratios – per the October 26, 2012 prospectuses |
| | | One
| | Five
| | Ten
| | Since
| | | Total Annual Fund
| | Net Annual Fund
|
| | | Year | | Year | | Year | | Inception* | | | Operating Expenses | | Operating Expenses |
| | | | | | | | | | | | | | |
Perkins Mid Cap Value Fund –
Class A Shares(1) | | | | | | | | | | | | | |
| | | | | | | | | | | | | | |
| NAV | | 19.33% | | 6.28% | | 9.84% | | 11.98% | | | 1.05% | | 1.01% |
| | | | | | | | | | | | | | |
| MOP | | 12.45% | | 5.03% | | 9.19% | | 11.53% | | | | | |
| | | | | | | | | | | | | | |
Perkins Mid Cap Value Fund –
Class C Shares(1) | | | | | | | | | | | | | |
| | | | | | | | | | | | | | |
| NAV | | 18.45% | | 5.59% | | 9.05% | | 11.25% | | | 1.78% | | 1.76% |
| | | | | | | | | | | | | | |
| CDSC | | 17.45% | | 5.59% | | 9.05% | | 11.25% | | | | | |
| | | | | | | | | | | | | | |
Perkins Mid Cap Value Fund –
Class D Shares(1) | | 19.72% | | 6.53% | | 10.10% | | 12.16% | | | 0.74% | | 0.74% |
| | | | | | | | | | | | | | |
Perkins Mid Cap Value Fund –
Class I Shares(1) | | 19.71% | | 6.46% | | 10.06% | | 12.13% | | | 0.73% | | 0.73% |
| | | | | | | | | | | | | | |
Perkins Mid Cap Value Fund –
Class L Shares(1) | | 19.83% | | 6.66% | | 10.26% | | 12.30% | | | 0.84% | | 0.84% |
| | | | | | | | | | | | | | |
Perkins Mid Cap Value Fund –
Class N Shares(1) | | 19.89% | | 6.46% | | 10.06% | | 12.13% | | | 0.58% | | 0.58% |
| | | | | | | | | | | | | | |
Perkins Mid Cap Value Fund –
Class R Shares(1) | | 18.97% | | 5.96% | | 9.45% | | 11.65% | | | 1.34% | | 1.34% |
| | | | | | | | | | | | | | |
Perkins Mid Cap Value Fund –
Class S Shares(1) | | 19.27% | | 6.20% | | 9.72% | | 11.88% | | | 1.09% | | 1.09% |
| | | | | | | | | | | | | | |
Perkins Mid Cap Value Fund –
Class T Shares(1) | | 19.56% | | 6.46% | | 10.06% | | 12.13% | | | 0.84% | | 0.84% |
| | | | | | | | | | | | | | |
| Russell Midcap® Value Index | | 27.65% | | 8.87% | | 10.92% | | 9.22% | | | | | |
| | | | | | | | | | | | | | |
| Morningstar Quartile – Class T Shares | | 4th | | 3rd | | 2nd | | 1st | | | | | |
| | | | | | | | | | | | | | |
| Morningstar Ranking – based on total returns for Mid-Cap Value Funds | | 403/435 | | 267/378 | | 112/280 | | 15/138 | | | | | |
| | | | | | | | | | | | | | |
| Visit janus.com/advisor/mutual-funds (or janus.com/allfunds if you hold Shares directly with Janus Capital) to view current performance and characteristic information | | | | | |
| | | | | | | | | | | | | | |
Returns quoted are past performance and do not guarantee future results; current performance may be lower or higher. Investment returns and principal value will vary; there may be a gain or loss when shares are sold. For the most recent month-end performance call 877.33JANUS(52687) (or 800.525.3713 if you hold shares directly with Janus Capital) or visit janus.com/advisor/mutual-funds (or janus.com/allfunds if you hold shares directly with Janus Capital).
See important disclosures on the next page.
Janus Value Funds | 19
Perkins Mid Cap Value Fund (unaudited)(closed to certain new investors)
Performance shown for Class A Shares at Maximum Offering Price (MOP) includes the Fund’s maximum sales charge of 5.75%. Performance shown at Net Asset Value (NAV) does not include this charge and would have been lower had this charge been taken into account.
Performance shown for Class C Shares includes a 1% contingent deferred sales charge (CDSC) on periods of less than 12 months. Performance shown at Net Asset Value (NAV) does not include this sales charge and would have been lower had this sales charge been taken into account.
Net expense ratios reflect the expense waiver, if any, Janus Capital has contractually agreed to through November 1, 2013.
For Class L Shares, net expense ratios reflect the administrative fee waiver, if any, Janus Services LLC has voluntarily agreed to, which could be changed or terminated at any time.
The expense ratios for Class N Shares are estimated.
The Fund has a performance-based management fee that adjusts up or down based on the Fund’s performance relative to an approved benchmark index over a performance measurement period. See the Fund’s prospectuses or Statement of Additional Information for more details.
The Fund’s performance may be affected by risks that include those associated with undervalued or overlooked companies, investments in specific industries or countries and potential conflicts of interest with the Janus “funds of funds.” Additional risks to the Fund may include those associated with investing in foreign securities, emerging markets, initial public offerings (“IPOs”), real estate investment trusts (“REITs”), and derivatives. Please see the Fund’s prospectuses or janus.com/info (or janus.com/reports if you hold shares directly with Janus Capital) for more information about risks, portfolio holdings and other details.
Foreign securities have additional risks including exchange rate changes, political and economic upheaval, the relative lack of information, relatively low market liquidity and the potential lack of strict financial and accounting controls and standards. These risks are magnified in emerging markets. The prices of foreign securities held by the Fund, and therefore the Fund’s performance, may decline in response to such risks.
The Fund invests in REITs, which may be subject to a higher degree of market risk because of concentration in a specific industry, sector or geographic region. REITs may be subject to risks including, but not limited to: legal, political, liquidity, interest rate risks, a decline in the value of real estate, risks related to general and economic conditions, changes in the value of the underlying property owned by the trust and defaults by borrowers. To the extent the Fund invests in foreign REITs, the Fund may be subject to fluctuations in currency rates or political or economic conditions in a particular country.
The Fund invests in derivatives which can be highly volatile and involve additional risks than if the underlying securities were held directly by the Fund. Such risks include gains or losses which, as a result of leverage, can be substantially greater than the derivatives’ original cost. There is also a possibility that derivatives may not perform as intended which can reduce opportunity for gains or result in losses by offsetting positive returns in other securities the Fund owns.
The Fund will normally invest at least 80% of its net assets, measured at the time of purchase, in the type of securities described by its name.
Holding a meaningful portion of assets in cash or cash equivalents may negatively affect performance.
Returns include reinvestment of all dividends and distributions. The returns do not include adjustments in accordance with generally accepted accounting principles required at the period end for financial reporting purposes.
Class A Shares, Class C Shares, Class R Shares, and Class S Shares of the Fund commenced operations on July 6, 2009. The performance shown for periods prior to July 6, 2009 reflects the historical performance of a similar share class of the Fund and predecessor fund, calculated using the fees and expenses of each respective share class without the effect of any fee and expense limitations or waivers.
Class D Shares of the Fund commenced operations on February 16, 2010, as a result of the restructuring of Class J Shares, the predecessor share class. The performance shown for periods prior to February 16, 2010 reflects the historical performance of the Fund’s predecessor share class.
Class I Shares of the Fund commenced operations on July 6, 2009. The performance shown for periods prior to July 6, 2009 reflects the historical performance of a similar share class of the Fund and predecessor fund.
Class L Shares of the Fund commenced operations on April 21, 2003. The performance shown for periods prior to April 21, 2003 reflects the historical performance of a prior share class of the predecessor fund.
Class N Shares of the Fund commenced operations on May 31, 2012. The performance shown for periods prior to May 31, 2012 reflects the historical performance of a similar share class of the Fund and predecessor fund.
Class T Shares of the Fund commenced operations with the Fund’s inception. The performance shown for periods prior to April 21, 2003 reflects the historical performance of a prior share class of the predecessor fund.
If each share class of the Fund had been available during periods prior to its commencement, the performance shown may have been different. The performance shown for periods following the Fund’s commencement of each share class reflects the fees and expenses of each respective share class, net of any applicable fee and expense limitations or waivers. Please refer to the Fund’s prospectuses for further details concerning historical performance.
Ranking is for the share class shown only; other classes may have different performance characteristics. When an expense waiver is in effect, it may have a material effect on the total return, and therefore the ranking for the period.
© 2013 Morningstar, Inc. All Rights Reserved.
20 | JUNE 30, 2013
(unaudited)(closed to certain new investors)
There is no assurance that the investment process will consistently lead to successful investing.
See Notes to Schedules of Investments and Other Information for index definitions.
The Fund’s portfolio may differ significantly from the securities held in the index. The index is unmanaged and is not available for direct investment; therefore, its performance does not reflect the expenses associated with the active management of an actual portfolio.
See “Useful Information About Your Fund Report.”
Effective April 1, 2013, Tom Perkins, Jeff Kautz and Kevin Preloger are Co-Portfolio Managers of the Fund.
| | | |
| * | | The predecessor Fund’s inception date – August 12, 1998 |
(1) Closed to certain distribution channels. Please see current prospectuses for details.
As a shareholder of the Fund, you incur two types of costs: (1) transaction costs, such as sales charges (loads) on purchase payments (applicable to Class A Shares only); and (2) ongoing costs, including management fees; distribution and shareholder servicing (12b-1) fees; administrative services fees payable pursuant to the Transfer Agency Agreement; and other Fund expenses. This example is intended to help you understand your ongoing costs (in dollars) of investing in the Fund and to compare these costs with the ongoing costs of investing in other mutual funds. To do so, compare this 5% hypothetical example with the 5% hypothetical examples that appear in the shareholder reports of the other funds. The example is based upon an investment of $1,000 invested at the beginning of the period and held for the six-months indicated, unless noted otherwise in the table and footnotes below.
Actual Expenses
The information in the table under the heading “Actual” provides information about actual account values and actual expenses. You may use the information in these columns, together with the amount you invested, to estimate the expenses that you paid over the period. Simply divide your account value by $1,000 (for example, an $8,600 account value divided by $1,000 = 8.6), then multiply the result by the number in the appropriate column for your share class under the heading entitled “Expenses Paid During Period” to estimate the expenses you paid on your account during the period.
Hypothetical Example for Comparison Purposes
The information in the table under the heading “Hypothetical (5% return before expenses)” provides information about hypothetical account values and hypothetical expenses based upon the Fund’s actual expense ratio and an assumed rate of return of 5% per year before expenses, which is not the Fund’s actual return. The hypothetical account values and expenses may not be used to estimate the actual ending account balance or expenses you paid for the period. You may use this information to compare the ongoing costs of investing in the Fund and other funds. To do so, compare this 5% hypothetical example with the 5% hypothetical examples that appear in the shareholder reports of the other funds. Additionally, for an analysis of the fees associated with an investment in any share class or other similar funds, please visit www.finra.org/fundanalyzer.
Please note that the expenses shown in the table are meant to highlight your ongoing costs only and do not reflect any transaction costs. These fees are fully described in the Fund’s prospectuses. Therefore, the hypothetical examples are useful in comparing ongoing costs only, and will not help you determine the relative total costs of owning different funds. In addition, if these transaction costs were included, your costs would have been higher.
| | | | | | | | | | | | | | | | | | | | | | | | | | | | | | | |
| | | | | Hypothetical
| | | | |
| | | Actual | | (5% return before expenses) | | | | |
| | | Beginning
| | Ending
| | Expenses
| | Beginning
| | Ending
| | Expenses
| | | | |
| | | Account
| | Account
| | Paid During
| | Account
| | Account
| | Paid During
| | Net Annualized
| | |
| | | Value
| | Value
| | Period
| | Value
| | Value
| | Period
| | Expense Ratio
| | |
| | | (1/1/13) | | (6/30/13) | | (1/1/13 - 6/30/13)† | | (1/1/13) | | (6/30/13) | | (1/1/13 - 6/30/13)† | | (1/1/13 - 6/30/13) | | |
| |
| |
| Class A Shares | | $ | 1,000.00 | | | $ | 1,123.80 | | | $ | 5.00 | | | $ | 1,000.00 | | | $ | 1,020.08 | | | $ | 4.76 | | | | 0.95% | | | |
| |
| |
| Class C Shares | | $ | 1,000.00 | | | $ | 1,119.80 | | | $ | 8.94 | | | $ | 1,000.00 | | | $ | 1,016.36 | | | $ | 8.50 | | | | 1.70% | | | |
| |
| |
| Class D Shares | | $ | 1,000.00 | | | $ | 1,125.50 | | | $ | 3.58 | | | $ | 1,000.00 | | | $ | 1,021.42 | | | $ | 3.41 | | | | 0.68% | | | |
| |
| |
| Class I Shares | | $ | 1,000.00 | | | $ | 1,125.60 | | | $ | 3.27 | | | $ | 1,000.00 | | | $ | 1,021.72 | | | $ | 3.11 | | | | 0.62% | | | |
| |
| |
| Class L Shares | | $ | 1,000.00 | | | $ | 1,125.80 | | | $ | 3.22 | | | $ | 1,000.00 | | | $ | 1,021.77 | | | $ | 3.06 | | | | 0.61% | | | |
| |
| |
| Class N Shares | | $ | 1,000.00 | | | $ | 1,126.10 | | | $ | 2.74 | | | $ | 1,000.00 | | | $ | 1,022.22 | | | $ | 2.61 | | | | 0.52% | | | |
| |
| |
| Class R Shares | | $ | 1,000.00 | | | $ | 1,122.50 | | | $ | 6.63 | | | $ | 1,000.00 | | | $ | 1,018.55 | | | $ | 6.31 | | | | 1.26% | | | |
| |
| |
| Class S Shares | | $ | 1,000.00 | | | $ | 1,123.60 | | | $ | 5.32 | | | $ | 1,000.00 | | | $ | 1,019.79 | | | $ | 5.06 | | | | 1.01% | | | |
| |
| |
| Class T Shares | | $ | 1,000.00 | | | $ | 1,125.10 | | | $ | 3.95 | | | $ | 1,000.00 | | | $ | 1,021.08 | | | $ | 3.76 | | | | 0.75% | | | |
| |
| |
| | | |
| † | | Expenses Paid During Period are equal to the Net Annualized Expense Ratio multiplied by the average account value over the period, multiplied by the number of days in the most recent six-month period, divided by the number of days in the fiscal year. Expenses in the examples include the effect of applicable fee waivers and/or expense reimbursements, if any. Had such waivers and/or reimbursements not been in effect, your expenses would have been higher. Please refer to the Notes to Financial Statements or the Fund’s prospectuses for more information regarding waivers and/or reimbursements. |
Janus Value Funds | 21
Perkins Mid Cap Value Fund
Schedule of Investments
As of June 30, 2013
| | | | | | | | | | | |
| Shares or Principal Amount | | Value | | | |
| |
| Common Stock – 90.6% | | | | | | |
| Aerospace and Defense – 1.9% | | | | | | |
| | 1,500,000 | | | General Dynamics Corp. | | $ | 117,495,000 | | | |
| | 1,569,919 | | | Rockwell Collins, Inc. | | | 99,548,564 | | | |
| | | | | | | | 217,043,564 | | | |
| Agricultural Chemicals – 0.6% | | | | | | |
| | 1,400,000 | | | Mosaic Co. | | | 75,334,000 | | | |
| Apparel Manufacturers – 0.7% | | | | | | |
| | 400,000 | | | VF Corp. | | | 77,224,000 | | | |
| Applications Software – 1.1% | | | | | | |
| | 2,500,000 | | | Check Point Software Technologies, Ltd.* | | | 124,200,000 | | | |
| Automotive – Truck Parts and Equipment – Original – 1.6% | | | | | | |
| | 1,700,000 | | | Johnson Controls, Inc. | | | 60,843,000 | | | |
| | 1,050,000 | | | Lear Corp. | | | 63,483,000 | | | |
| | 884,960 | | | TRW Automotive Holdings Corp.* | | | 58,796,742 | | | |
| | | | | | | | 183,122,742 | | | |
| Beverages – Non-Alcoholic – 0.9% | | | | | | |
| | 2,277,900 | | | Dr. Pepper Snapple Group, Inc. | | | 104,623,947 | | | |
| Brewery – 1.0% | | | | | | |
| | 2,400,000 | | | Molson Coors Brewing Co. – Class B | | | 114,864,000 | | | |
| Cellular Telecommunications – 1.2% | | | | | | |
| | 4,800,636 | | | Vodafone Group PLC (ADR) | | | 137,970,279 | | | |
| Commercial Banks – 5.8% | | | | | | |
| | 2,200,000 | | | Bank of Hawaii Corp. | | | 110,704,000 | | | |
| | 3,800,000 | | | CIT Group, Inc.* | | | 177,194,000 | | | |
| | 2,326,000 | | | Cullen / Frost Bankers, Inc. | | | 155,307,020 | | | |
| | 3,000,000 | | | First Republic Bank | | | 115,440,000 | | | |
| | 7,300,000 | | | Fulton Financial Corp. | | | 83,804,000 | | | |
| | 1,400,000 | | | Zions Bancorp | | | 40,432,000 | | | |
| | | | | | | | 682,881,020 | | | |
| Commercial Services – Finance – 1.3% | | | | | | |
| | 1,400,000 | | | Global Payments, Inc. | | | 64,848,000 | | | |
| | 5,327,040 | | | Western Union Co. | | | 91,145,654 | | | |
| | | | | | | | 155,993,654 | | | |
| Computer Aided Design – 0.6% | | | | | | |
| | 2,200,000 | | | Autodesk, Inc.* | | | 74,668,000 | | | |
| Computers – Integrated Systems – 1.3% | | | | | | |
| | 2,800,000 | | | Diebold, Inc. | | | 94,332,000 | | | |
| | 1,400,000 | | | MICROS Systems, Inc.* | | | 60,410,000 | | | |
| | | | | | | | 154,742,000 | | | |
| Dental Supplies and Equipment – 1.0% | | | | | | |
| | 3,100,000 | | | Patterson Cos., Inc. | | | 116,560,000 | | | |
| Electric – Integrated – 2.8% | | | | | | |
| | 166,926 | | | Alliant Energy Corp. | | | 8,416,409 | | | |
| | 700,544 | | | Entergy Corp. | | | 48,813,906 | | | |
| | 2,400,000 | | | Exelon Corp. | | | 74,112,000 | | | |
| | 6,600,000 | | | PPL Corp. | | | 199,716,000 | | | |
| | | | | | | | 331,058,315 | | | |
| Electronic Components – Miscellaneous – 0.3% | | | | | | |
| | 1,000,000 | | | Garmin, Ltd. | | | 36,160,000 | | | |
| Electronic Components – Semiconductors – 0.9% | | | | | | |
| | 3,100,000 | | | Altera Corp. | | | 102,269,000 | | | |
| Electronic Design Automation – 0.9% | | | | | | |
| | 2,800,000 | | | Synopsys, Inc.* | | | 100,100,000 | | | |
| Electronic Measuring Instruments – 0.6% | | | | | | |
| | 1,700,000 | | | Agilent Technologies, Inc. | | | 72,692,000 | | | |
| Electronic Security Devices – 1.0% | | | | | | |
| | 3,546,036 | | | Tyco International, Ltd. (U.S. Shares) | | | 116,841,886 | | | |
| Engineering – Research and Development Services – 1.6% | | | | | | |
| | 1,650,800 | | | Jacobs Engineering Group, Inc.* | | | 91,008,604 | | | |
| | 2,900,057 | | | KBR, Inc. | | | 94,251,853 | | | |
| | | | | | | | 185,260,457 | | | |
| Enterprise Software/Services – 0.7% | | | | | | |
| | 2,700,000 | | | CA, Inc. | | | 77,301,000 | | | |
| Fiduciary Banks – 0.6% | | | | | | |
| | 1,150,000 | | | State Street Corp. | | | 74,991,500 | | | |
| Finance – Credit Card – 1.4% | | | | | | |
| | 3,350,000 | | | Discover Financial Services | | | 159,594,000 | | | |
| Finance – Investment Bankers/Brokers – 1.3% | | | | | | |
| | 3,500,000 | | | Raymond James Financial, Inc. | | | 150,430,000 | | | |
| Finance – Other Services – 0.6% | | | | | | |
| | 400,000 | | | IntercontinentalExchange, Inc.* | | | 71,104,000 | | | |
| Food – Miscellaneous/Diversified – 0.7% | | | | | | |
| | 2,000,320 | | | Unilever PLC (ADR) | | | 80,912,944 | | | |
| Food – Retail – 0.9% | | | | | | |
| | 2,900,000 | | | Kroger Co. | | | 100,166,000 | | | |
| Food – Wholesale/Distribution – 0.6% | | | | | | |
| | 2,100,000 | | | Sysco Corp. | | | 71,736,000 | | | |
| Gas – Transportation – 0.5% | | | | | | |
| | 1,381,200 | | | AGL Resources, Inc. | | | 59,198,232 | | | |
| Gold Mining – 0.7% | | | | | | |
| | 3,300,000 | | | Goldcorp, Inc. (U.S. Shares) | | | 81,609,000 | | | |
| Human Resources – 1.1% | | | | | | |
| | 3,917,900 | | | Robert Half International, Inc. | | | 130,191,817 | | | |
| Instruments – Scientific – 1.6% | | | | | | |
| | 1,615,000 | | | PerkinElmer, Inc. | | | 52,487,500 | | | |
| | 1,551,119 | | �� | Thermo Fisher Scientific, Inc. | | | 131,271,201 | | | |
| | | | | | | | 183,758,701 | | | |
| Insurance Brokers – 1.9% | | | | | | |
| | 5,600,000 | | | Marsh & McLennan Cos., Inc. | | | 223,552,000 | | | |
| Internet Security – 0.3% | | | | | | |
| | 1,700,000 | | | Symantec Corp. | | | 38,199,000 | | | |
| Investment Management and Advisory Services – 1.2% | | | | | | |
| | 910,979 | | | Ameriprise Financial, Inc. | | | 73,679,981 | | | |
| | 2,093,821 | | | Invesco, Ltd. | | | 66,583,508 | | | |
| | | | | | | | 140,263,489 | | | |
| Life and Health Insurance – 1.4% | | | | | | |
| | 2,500,000 | | | Torchmark Corp. | | | 162,850,000 | | | |
| Machine Tools and Related Products – 0.5% | | | | | | |
| | 1,581,700 | | | Kennametal, Inc. | | | 61,417,411 | | | |
| Machinery – Farm – 0.5% | | | | | | |
| | 784,960 | | | Deere & Co. | | | 63,778,000 | | | |
| Machinery – General Industrial – 1.0% | | | | | | |
| | 3,743,598 | | | Babcock & Wilcox Co. | | | 112,420,248 | | | |
| | | | | | | | | | | |
See Notes to Schedules of Investments and Other Information and Notes to Financial Statements.
22 | JUNE 30, 2013
Schedule of Investments
As of June 30, 2013
| | | | | | | | | | | |
| Shares or Principal Amount | | Value | | | |
| |
| Medical – Biomedical and Genetic – 0.8% | | | | | | |
| | 2,291,690 | | | Charles River Laboratories International, Inc.* | | $ | 94,028,041 | | | |
| Medical – Generic Drugs – 1.1% | | | | | | |
| | 3,157,306 | | | Teva Pharmaceutical Industries, Ltd. (ADR) | | | 123,766,395 | | | |
| Medical – HMO – 1.6% | | | | | | |
| | 1,800,000 | | | Aetna, Inc. | | | 114,372,000 | | | |
| | 1,079,321 | | | Health Net, Inc.* | | | 34,343,994 | | | |
| | 479,320 | | | WellPoint, Inc. | | | 39,227,549 | | | |
| | | | | | | | 187,943,543 | | | |
| Medical – Wholesale Drug Distributors – 1.1% | | | | | | |
| | 1,150,000 | | | McKesson Corp. | | | 131,675,000 | | | |
| Medical Labs and Testing Services – 2.5% | | | | | | |
| | 1,750,000 | | | Laboratory Corp. of America Holdings* | | | 175,175,000 | | | |
| | 1,832,000 | | | Quest Diagnostics, Inc. | | | 111,074,160 | | | |
| | | | | | | | 286,249,160 | | | |
| Medical Products – 2.8% | | | | | | |
| | 1,500,000 | | | Hill-Rom Holdings, Inc. | | | 50,520,000 | | | |
| | 1,900,000 | | | Stryker Corp. | | | 122,892,000 | | | |
| | 900,000 | | | Varian Medical Systems, Inc.* | | | 60,705,000 | | | |
| | 1,250,000 | | | Zimmer Holdings, Inc. | | | 93,675,000 | | | |
| | | | | | | | 327,792,000 | | | |
| Medical Sterilization Products – 0.4% | | | | | | |
| | 1,200,000 | | | STERIS Corp.£ | | | 51,456,000 | | | |
| Multi-Line Insurance – 1.3% | | | | | | |
| | 3,201,028 | | | Allstate Corp. | | | 154,033,467 | | | |
| Networking Products – 0.3% | | | | | | |
| | 3,800,987 | | | Polycom, Inc.* | | | 40,062,403 | | | |
| Non-Hazardous Waste Disposal – 1.7% | | | | | | |
| | 5,700,000 | | | Republic Services, Inc. | | | 193,458,000 | | | |
| Oil and Gas Drilling – 0.8% | | | | | | |
| | 1,700,000 | | | Ensco PLC – Class A | | | 98,804,000 | | | |
| Oil Companies – Exploration and Production – 3.3% | | | | | | |
| | 831,200 | | | Anadarko Petroleum Corp. | | | 71,425,016 | | | |
| | 1,901,000 | | | Noble Energy, Inc. | | | 114,136,040 | | | |
| | 3,800,001 | | | QEP Resources, Inc. | | | 105,564,028 | | | |
| | 2,100,000 | | | Whiting Petroleum Corp.* | | | 96,789,000 | | | |
| | | | | | | | 387,914,084 | | | |
| Oil Companies – Integrated – 0.6% | | | | | | |
| | 1,050,000 | | | Hess Corp. | | | 69,814,500 | | | |
| Oil Field Machinery and Equipment – 0.7% | | | | | | |
| | 1,150,000 | | | National Oilwell Varco, Inc. | | | 79,235,000 | | | |
| Pipelines – 1.3% | | | | | | |
| | 2,772,205 | | | Plains All American Pipeline L.P. | | | 154,716,761 | | | |
| Property and Casualty Insurance – 0.5% | | | | | | |
| | 700,000 | | | Travelers Cos., Inc. | | | 55,944,000 | | | |
| Reinsurance – 1.6% | | | | | | |
| | 551,769 | | | Everest Re Group, Ltd. | | | 70,769,892 | | | |
| | 1,600,000 | | | Reinsurance Group of America, Inc. | | | 110,576,000 | | | |
| | | | | | | | 181,345,892 | | | |
| REIT – Apartments – 2.4% | | | | | | |
| | 2,000,000 | | | American Campus Communities, Inc. | | | 81,320,000 | | | |
| | 950,000 | | | AvalonBay Communities, Inc. | | | 128,164,500 | | | |
| | 294,114 | | | Home Properties, Inc. | | | 19,226,232 | | | |
| | 700,000 | | | Mid-America Apartment Communities, Inc. | | | 47,439,000 | | | |
| | | | | | | | 276,149,732 | | | |
| REIT – Diversified – 2.3% | | | | | | |
| | 1,222,871 | | | Potlatch Corp.£ | | | 49,452,903 | | | |
| | 1,766,161 | | | Rayonier, Inc. | | | 97,827,658 | | | |
| | 4,100,599 | | | Weyerhaeuser Co. | | | 116,826,066 | | | |
| | | | | | | | 264,106,627 | | | |
| REIT – Health Care – 0.7% | | | | | | |
| | 1,852,100 | | | HCP, Inc. | | | 84,159,424 | | | |
| REIT – Hotels – 0.6% | | | | | | |
| | 7,684,217 | | | DiamondRock Hospitality Co. | | | 71,616,902 | | | |
| REIT – Mortgage – 1.2% | | | | | | |
| | 2,500,000 | | | Redwood Trust, Inc. | | | 42,500,000 | | | |
| | 9,500,000 | | | Two Harbors Investment Corp. | | | 97,375,000 | | | |
| | | | | | | | 139,875,000 | | | |
| REIT – Multi-Housing – 0.6% | | | | | | |
| | 850,000 | | | Equity Lifestyle Properties, Inc. | | | 66,801,500 | | | |
| REIT – Office Property – 1.4% | | | | | | |
| | 1,229,556 | | | Alexandria Real Estate Equities, Inc. | | | 80,806,420 | | | |
| | 784,961 | | | Boston Properties, Inc. | | | 82,789,837 | | | |
| | | | | | | | 163,596,257 | | | |
| REIT – Regional Malls – 0.6% | | | | | | |
| | 984,958 | | | Taubman Centers, Inc. | | | 74,019,594 | | | |
| REIT – Storage – 0.4% | | | | | | |
| | 313,895 | | | Public Storage | | | 48,129,520 | | | |
| Retail – Apparel and Shoe – 0.5% | | | | | | |
| | 1,500,000 | | | Men’s Wearhouse, Inc. | | | 56,775,000 | | | |
| Retail – Major Department Stores – 0.9% | | | | | | |
| | 1,700,000 | | | Nordstrom, Inc. | | | 101,898,000 | | | |
| Retail – Pet Food and Supplies – 1.1% | | | | | | |
| | 2,000,000 | | | PetSmart, Inc. | | | 133,980,000 | | | |
| Retail – Regional Department Stores – 1.0% | | | | | | |
| | 1,434,196 | | | Kohl’s Corp. | | | 72,441,240 | | | |
| | 973,679 | | | Macy’s, Inc. | | | 46,736,592 | | | |
| | | | | | | | 119,177,832 | | | |
| Savings/Loan/Thrifts – 0.6% | | | | | | |
| | 4,000,958 | | | Washington Federal, Inc.£ | | | 75,538,087 | | | |
| Security Services – 0.8% | | | | | | |
| | 2,268,700 | | | ADT Corp. | | | 90,407,695 | | | |
| Semiconductor Components/Integrated Circuits – 1.2% | | | | | | |
| | 3,200,000 | | | Analog Devices, Inc. | | | 144,192,000 | | | |
| Semiconductor Equipment – 0.2% | | | | | | |
| | 1,800,000 | | | Applied Materials, Inc. | | | 26,838,000 | | | |
| Super-Regional Banks – 2.4% | | | | | | |
| | 1,583,300 | | | Comerica, Inc. | | | 63,062,839 | | | |
| | 6,800,799 | | | Fifth Third Bancorp | | | 122,754,422 | | | |
| | 2,900,400 | | | SunTrust Banks, Inc. | | | 91,565,628 | | | |
| | | | | | | | 277,382,889 | | | |
| Telephone – Integrated – 0.7% | | | | | | |
| | 2,151,120 | | | CenturyLink, Inc. | | | 76,042,092 | | | |
| | | | | | | | | | | |
See Notes to Schedules of Investments and Other Information and Notes to Financial Statements.
Janus Value Funds | 23
Perkins Mid Cap Value Fund
Schedule of Investments
As of June 30, 2013
| | | | | | | | | | | |
| Shares or Principal Amount | | Value | | | |
| |
| Tools – Hand Held – 1.0% | | | | | | |
| | 1,500,000 | | | Stanley Black & Decker, Inc. | | $ | 115,950,000 | | | |
| Transportation – Marine – 1.3% | | | | | | |
| | 1,500,341 | | | Kirby Corp.* | | | 119,337,123 | | | |
| | 600,721 | | | Tidewater, Inc. | | | 34,223,076 | | | |
| | | | | | | | 153,560,199 | | | |
| Transportation – Railroad – 1.7% | | | | | | |
| | 800,000 | | | Canadian Pacific Railway, Ltd. (U.S. Shares) | | | 97,104,000 | | | |
| | 490,388 | | | Kansas City Southern | | | 51,961,512 | | | |
| | 750,000 | | | Norfolk Southern Corp. | | | 54,487,500 | | | |
| | | | | | | | 203,553,012 | | | |
| |
| |
| Total Common Stock (cost $8,644,356,071) | | | 10,589,069,814 | | | |
| |
| |
| Repurchase Agreements – 9.7% | | | | | | |
| | $75,000,000 | | | Credit Agricole, New York Branch, 0.0700%, dated 6/28/13, maturing 7/1/13 to be repurchased at $75,000,438 collateralized by $75,750,930 in U.S. Treasuries 0.7500%-1.7500%, 1/31/14-5/31/20 with a value of $76,500,029 | | | 75,000,000 | | | |
| | 100,000,000 | | | Credit Suisse Securities (USA) LLC, 0.1000%, dated 6/28/13, maturing 7/1/13 to be repurchased at $100,000,833 collateralized by $99,775,000 in a U.S. Treasury 1.3750%, 11/30/15 with a value of $102,000,173 | | | 100,000,000 | | | |
| | 300,000,000 | | | HSBC Securities (USA), Inc., 0.1000%, dated 6/28/13, maturing 7/1/13 to be repurchased at $300,002,500 collateralized by $891,785,625 in U.S. Treasuries 0.0000%-4.7500%, 2/15/15-2/15/43 with a value of $306,000,221 | | | 300,000,000 | | | |
| | 61,700,000 | | | ING Financial Markets LLC, 0.0100%, dated 6/28/13, maturing 7/1/13 to be repurchased at $61,700,051 collateralized by $4,981,956 in a U.S. Government Agency 4.0000%, 2/20/40 and $49,580,114 in U.S. Treasuries 0.2500%-8.8750%,
2/28/15-2/15/19 with respective values of $5,306,459 and $57,628,081 | | | 61,700,000 | | | |
| | 600,000,000 | | | RBC Capital Markets Corp., 0.1000%, dated 6/28/13, maturing 7/1/13 to be repurchased at $600,005,000 collateralized by $600,021,857 in U.S. Treasuries 0.0000%-9.2500%, 7/1/13-2/15/42 with a value of $612,000,029 | | | 600,000,000 | | | |
| |
| |
| Total Repurchase Agreements (cost $1,136,700,000) | | | 1,136,700,000 | | | |
| |
| |
| Total Investments (total cost $9,781,056,071) – 100.3% | | | 11,725,769,814 | | | |
| |
| |
| Liabilities, net of Cash, Receivables and Other Assets– (0.3)% | | | (34,374,097) | | | |
| |
| |
| Net Assets – 100% | | $ | 11,691,395,717 | | | |
| |
| |
Summary of Investments by Country – (Long Positions) (unaudited)
| | | | | | | | | |
| | | | | | % of Investment
| |
| Country | | Value | | | Securities | |
| |
| |
| Canada | | $ | 178,713,000 | | | | 1.5% | |
| Israel | | | 247,966,395 | | | | 2.1% | |
| United Kingdom | | | 218,883,223 | | | | 1.9% | |
United States†† | | | 11,080,207,196 | | | | 94.5% | |
| |
| |
| Total | | $ | 11,725,769,814 | | | | 100.0% | |
| | | |
| †† | | Includes Cash Equivalents of 9.7%. |
See Notes to Schedules of Investments and Other Information and Notes to Financial Statements.
24 | JUNE 30, 2013
Perkins Select Value Fund (unaudited)
| | | | | | | |
Fund Snapshot
We believe in the timeless adage of the power of compounding and in doing so our focus is on mitigating losses in difficult markets. We invest in securities we believe to have favorable reward to risk ratios by focusing first on rigorous downside analysis prior to determining upside potential. We seek to outperform both our benchmark and peers over a full market cycle by building a diversified portfolio of high-quality, undervalued stocks.
| | | | 
Robert Perkins
co-portfolio manager | | 
Alec Perkins
co-portfolio manager |
Performance Overview
During the 12 months ended June 30, 2013, Perkins Select Value Fund’s Class I Shares returned 17.61%, while the Fund’s benchmark, the Russell 3000 Value Index, returned 25.28%. Our 18.86% average cash holdings weighed the most on performance, followed by our holdings and underweights in financials and consumer discretionary. Relative contributors included our underweights in utilities and energy and our holdings in telecommunication services.
Co-Portfolio Manager Change
During the period, Alec Perkins replaced Kevin Preloger as co-portfolio manager on Perkins Select Value Fund. Mr. Preloger transitioned off the Fund to join the Perkins Mid Cap Value strategy as co-portfolio manager. Mr. Perkins, who has been a member of the Perkins team since 2002 and will maintain his role as co-portfolio manager of the All Cap Value strategy, joins Bob Perkins as co-portfolio manager on Perkins Select Value Fund.
Economic Environment
The period opened with a good rally. The most important positive factor affecting the markets were statements from Mario Draghi, head of the European Central Bank (ECB), that European monetary policy would become much more aggressive in providing liquidity conditioned upon defined deleveraging programs. In addition, in September the U.S. Federal Reserve (Fed) announced that it would keep Fed funds interest rates at 0% to 0.25% well into 2015 and that it would embark upon a more open-ended quantitative easing policy.
The rally was more modestly extended in the fourth quarter of 2012. U.S. gross domestic product (GDP) was up a surprising 3%, and the Fed stated it would not raise rates until unemployment falls to 6.5% and inflation does not rise above 2.5%. European markets were firm as the ECB’s promise “to do whatever it takes” and small steps toward political cooperation had a calming effect. This was despite signs that GDP in Europe was heading to negative territory. China’s political transition appeared orderly and, with signs the economy was stabilizing in the area of 7% growth, its stock market rallied off its three-year bottom.
The strong rally in 2012’s second half extended into the first quarter. U.S. GDP was essentially flat as government, business and consumer spending were impacted by year-end government policy uncertainty and inventories were drawn down. At year end, Washington came to agreement to push out the debt ceiling debate and tax rate reductions for all but the top brackets were extended; however, payroll taxes increased for all. This clarity on tax policy relieved some of the year-end anxiety.
U.S. stocks continued to climb higher in the second quarter, but they took a volatile path to get there. The Chicago Board of Options Exchange Volatility Index (CBOE VIX Index), a general measure of market volatility, spiked over 40% off its recent lows, which created some opportunities to purchase high-quality companies on sale. Equities generally remain fairly valued, with the S&P 500 Index trading around 14.6 times 2013 earnings estimates. The Index’s 6.85% forward earnings yield at period end also remained attractive compared with the 10-year U.S. Treasury note’s 2.49% yield, even after the recent run-up in interest rates. Corporate balance sheets remain on solid footing, which bodes well for future dividend increases and greater merger activity, both factors that we view as supportive of equity prices.
Detractors from Performance
Canadian metallurgical coal and copper producer Teck Resources was our largest individual detractor. Shares were hit by significant oversupply, as the largest metallurgical coal producer, BHP, announced its intention to increase coal production from several new projects, despite deterioration in pricing. Those supply additions, in combination with increased domestic Chinese metallurgical coal production and a slowing Chinese economy, forced us to re-evaluate our downside and
Janus Value Funds | 25
Perkins Select Value Fund (unaudited)
upside cases for the stock. As a result of our lower proprietary reward to risk ratio, we eliminated our position.
In industrials, Sterling Construction was a key detractor. Weakness in road construction spending negatively impacted the company. While the long-term highway bill was stalled in Congress (a two-year spending program was approved in June 2012), there was fierce bidding on short-term construction projects. Unfortunately for Sterling, many of these turned out to be unprofitable. The shares trade at a significant discount to both book and liquidation value, in our view, so we maintained our position.
Oil and gas exploration and production firm QEP Resources also weighed on performance. The company’s quarterly earnings report confirmed that production growth would be lumpy for the year, as the company is ramping up drilling in the Bakken Shale field in North Dakota. Investors were also underwhelmed by the low level of asset sales, which were an indication that there remains a sizable gulf between buyers’ and sellers’ valuation expectations for gas-related assets. We believe that QEP Resources is taking the right steps to unlock value. Its most recent operations update detailed improved well results in the Bakken Shale and it remains on track to spin out a portion of its midstream assets into a master limited partnership. We kept our position.
Contributors to Performance
Omnicell led our individual contributors. The automated drug dispensing provider benefited from strong earnings and a new contract to supply the Department of Veterans Affairs. We like the growth potential for Omnicell since most hospitals have not automated their drug delivery systems. In addition, the balance sheet is very strong with net cash representing a significant portion of its stock price.
Kaydon was our top industrials contributor. The stock benefited from a stronger-than-expected earnings report in May. We appreciate the company’s solid balance sheet and high-margin specialty bearings franchise.
In technology, Symantec was a key contributor. Shares of the security software manufacturer bounced back early in the period due to better-than-expected quarterly results and a new CEO. The board replaced the prior CEO after uneven revenue results and poor operating expense management. The run-up in the shares of the company left a less favorable reward/risk ratio; therefore, we sold the position.
Market Outlook and Fund Positioning
Despite some confusion in the market over recent Fed statements concerning its quantitative easing bond buying program, some of the bullish arguments for equity prices still hold. Fed liquidity will continue for the time being with rate hikes not on tap until 2015, equity valuations appear fair, and the U.S. remains the “best house on a bad block” as the world muddles through this anemic growth environment. Conversely, the negative market factors have not gone away and would indicate that caution is still warranted as various issues such as fiscal policy, debt issues and the promotion of effective growth measures have not been addressed in a serious manner. Given slow economic growth, corporate earnings comparisons could be disappointing. The new near-term risk factor is the uncertainty regarding the impact of higher interest rates on a fragile economy.
Marked improvements in housing and employment markets notwithstanding, the truth is that the U.S. economy is far from a strong growth mode and still remains extremely susceptible to external shocks. GDP expanded at an annual rate of 1.8% in the first quarter, notably higher than the 0.4% gain from fourth quarter 2012, but well below the 2.4% pace estimated in March. The Fed still expects GDP growth to pick up steam in the future, given diminished downside risks for the labor market and economic activity, with a 2.3% to 2.6% forecast range for 2013 and an upgraded outlook to 3.0% to 3.5% in 2014. However, it remains to be seen if any of the ongoing macroeconomic uncertainties (listed below) will suddenly flare up and shift this optimistic view going forward. Various threats from across the globe could easily dampen U.S. projections.
In the case of Europe, economic weakness is more and more apparent in the peripheral countries, with concern that it has spread to the core. Related issues in Europe are the lack of policy coordination among European Union countries, more levered balance sheets and political instability. The unknown will be the contagion impact, not only in Europe, but to the U.S. and rest of the world as well. What we do know however is that over 40% of S&P 500 Index company revenues come from outside the U.S., so while U.S. equities may be a relatively safe haven, they are far from immune from what happens around the world.
Concerning China, while the country completed its leadership transition in November, economic growth continues to be a wild card. The government lowered its 2013 growth projections from 8% to 7.5%, and weaker global GDP could make this expansion more difficult to
26 | JUNE 30, 2013
(unaudited)
achieve. Dislocations in the economy and possibly in the financial system could be problematic. The world has come to rely on China as a core growth engine, and any slowdown, even marginal, is likely to have reverberations worldwide.
In the Fund, our largest weights continue to be in the financial services sector and in health care. More specifically, we have maintained a significant weighting to pharmaceutical companies, which are generally trading at below market multiples with healthy dividend yields. We remain underweight in the utilities sector. With stocks appearing fairly valued and an uncertain macroeconomic backdrop we continue to remain cautious on the equity market, however, market pullbacks could provide opportunities to take advantage of price dislocations. While rising rates continue to be an issue, we have maintained a decent-size position in regional banks and added to real estate investment trusts (REITs) as they were unusually weak.
The key to our research-intensive approach is keeping a long-term perspective and remembering that markets tend to revert to the mean. It can be easy for investors to slip into a complacent mentality during high-volatility momentum markets, when all stocks seem to keep rising. When markets turn, however, the importance of carefully researched quality can quickly become apparent.
Our risk-disciplined investment methodology focuses on identifying attractively priced companies with healthy balance sheets and solid recurring free cash flows that are competitively positioned for long-term success. This bias toward quality extends beyond a simply defensive measure. Our research has shown high-quality stocks have delivered higher risk-adjusted return potential over the long term as well.
Looking ahead, we believe our Fund is well positioned to navigate the current market climate, in terms of risk exposure and long-term upside potential. Our investment team spends a significant amount of time carefully researching each and every stock, and we remain confident that this focus on finding investment value while mitigating absolute risk exposure will serve our clients well, especially if markets experience heightened volatility.
Thank you for your investment with us in Perkins Select Value Fund.
Janus Value Funds | 27
Perkins Select Value Fund (unaudited)
Perkins Select Value Fund At A Glance
5 Top Performers – Holdings
| | | | | |
| | | Contribution |
| |
| Omnicell, Inc. | | | 0.83% | |
| Kaydon Corp. | | | 0.74% | |
| Symantec Corp. | | | 0.69% | |
| Irish Continental Group PLC | | | 0.67% | |
| Novartis A.G. (ADR) | | | 0.61% | |
5 Bottom Performers – Holdings
| | | | | |
| | | Contribution |
| |
| Teck Resources, Ltd. – Class B | | | –0.21% | |
| Sterling Construction Co., Inc. | | | –0.15% | |
| QEP Resources, Inc. | | | –0.15% | |
| Goldcorp, Inc. (U.S. Shares) | | | –0.14% | |
| Progress Software Corp. | | | –0.12% | |
5 Top Performers – Sectors*
| | | | | | | | | | | | | |
| | | | | Fund Weighting
| | Russell 3000® Value
|
| | | Fund Contribution | | (Average % of Equity) | | Index Weighting |
| |
| Utilities | | | 1.11% | | | | 0.33% | | | | 6.66% | |
| Telecommunication Services | | | 0.73% | | | | 2.92% | | | | 3.20% | |
| Energy | | | 0.31% | | | | 10.11% | | | | 15.45% | |
| Industrials | | | 0.26% | | | | 11.92% | | | | 9.34% | |
| Health Care | | | 0.16% | | | | 17.76% | | | | 11.19% | |
5 Bottom Performers – Sectors*
| | | | | | | | | | | | | |
| | | | | Fund Weighting
| | Russell 3000® Value
|
| | | Fund Contribution | | (Average % of Equity) | | Index Weighting |
| |
| Other** | | | –4.72% | | | | 19.07% | | | | 0.00% | |
| Financials | | | –1.22% | | | | 15.93% | | | | 27.98% | |
| Consumer Discretionary | | | –1.09% | | | | 3.85% | | | | 8.45% | |
| Materials | | | –0.67% | | | | 4.54% | | | | 3.87% | |
| Information Technology | | | –0.49% | | | | 8.96% | | | | 6.93% | |
| | | |
| | | Security contribution to performance is measured by using an algorithm that multiplies the daily performance of each security with the previous day’s ending weight in the portfolio and is gross of advisory fees. Fixed income securities and certain equity securities, such as private placements and some share classes of equity securities, are excluded. |
| * | | Based on sector classification according to the Global Industry Classification Standard (“GICS”) codes, which are the exclusive property and a service mark of MSCI Inc. and Standard & Poor’s. |
| | | |
| ** | | Not a GICS classified sector. |
28 | JUNE 30, 2013
(unaudited)
5 Largest Equity Holdings – (% of Net Assets)
As of June 30, 2013
| | | | | |
| | | | | |
Casey’s General Stores, Inc.
Retail – Convenience Stores | | | 2.9% | |
OceanFirst Financial Corp.
Savings/Loan/Thrifts | | | 2.8% | |
Irish Continental Group PLC
Transportation – Marine | | | 2.7% | |
Occidental Petroleum Corp.
Oil Companies – Exploration and Production | | | 2.7% | |
Orkla A.S.A.
Diversified Operations | | | 2.6% | |
| | | | | |
| | | | 13.7% | |
Asset Allocation – (% of Net Assets)
As of June 30, 2013
Top Country Allocations – Long Positions (% of Investment Securities)
As of June 30, 2013
Janus Value Funds | 29
Perkins Select Value Fund (unaudited)
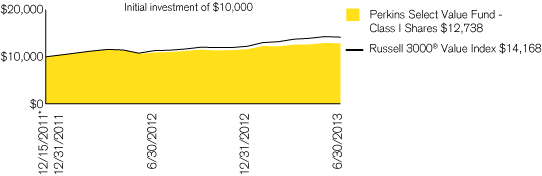
| | | | | | | | | | |
| Average Annual Total Return – for the periods ended June 30, 2013 | | | Expense Ratios – per the October 26, 2012 prospectuses |
| | | One
| | Since
| | | Total Annual Fund
| | Net Annual Fund
|
| | | Year | | Inception* | | | Operating Expenses | | Operating Expenses |
| | | | | | | | | | |
| Perkins Select Value Fund – Class A Shares | | | | | | | | | |
| | | | | | | | | | |
| NAV | | 17.16% | | 16.62% | | | 1.51% | | 1.27% |
| | | | | | | | | | |
| MOP | | 10.42% | | 12.23% | | | | | |
| | | | | | | | | | |
| Perkins Select Value Fund – Class C Shares | | | | | | | | | |
| | | | | | | | | | |
| NAV | | 16.24% | | 15.75% | | | 2.43% | | 2.02% |
| | | | | | | | | | |
| CDSC | | 15.24% | | 15.75% | | | | | |
| | | | | | | | | | |
| Perkins Select Value Fund – Class D Shares(1) | | 17.34% | | 16.81% | | | 1.74% | | 1.19% |
| | | | | | | | | | |
| Perkins Select Value Fund – Class I Shares | | 17.61% | | 16.99% | | | 1.26% | | 1.02% |
| | | | | | | | | | |
| Perkins Select Value Fund – Class S Shares | | 17.02% | | 16.39% | | | 1.73% | | 1.52% |
| | | | | | | | | | |
| Perkins Select Value Fund – Class T Shares | | 17.25% | | 16.68% | | | 1.44% | | 1.27% |
| | | | | | | | | | |
| Russell 3000® Value Index | | 25.28% | | 25.34% | | | | | |
| | | | | | | | | | |
| Morningstar Quartile – Class I Shares | | 4th | | 4th | | | | | |
| | | | | | | | | | |
| Morningstar Ranking – based on total returns for Mid-Cap Value Funds | | 419/435 | | 408/423 | | | | | |
| | | | | | | | | | |
| Visit janus.com/advisor/mutual-funds (or janus.com/allfunds if you hold Shares directly with Janus Capital) to view current performance and characteristic information | | | | | |
| | | | | | | | | | |
Returns quoted are past performance and do not guarantee future results; current performance may be lower or higher. Investment returns and principal value will vary; there may be a gain or loss when shares are sold. For the most recent month-end performance call 877.33JANUS(52687) (or 800.525.3713 if you hold shares directly with Janus Capital) or visit janus.com/advisor/mutual-funds (or janus.com/allfunds if you hold shares directly with Janus Capital).
Performance shown for Class A Shares at Maximum Offering Price (MOP) includes the Fund’s maximum sales charge of 5.75%. Performance shown at Net Asset Value (NAV) does not include this charge and would have been lower had this charge been taken into account.
Performance shown for Class C Shares includes a 1% contingent deferred sales charge (CDSC) on periods of less than 12 months. Performance shown at Net Asset Value (NAV) does not include this sales charge and would have been lower had this sales charge been taken into account.
See important disclosures on the next page.
30 | JUNE 30, 2013
(unaudited)
Net expense ratios reflect the expense waiver, if any, Janus Capital has contractually agreed to through November 1, 2013.
The Fund has a performance-based management fee that adjusts up or down based on the Fund’s performance relative to an approved benchmark index over a performance measurement period. See the Fund’s prospectuses or Statement of Additional Information for more details.
The Fund’s performance may be affected by risks that include those associated with undervalued or overlooked companies, investments in specific industries or countries and potential conflicts of interest with the Janus “funds of funds.” Additional risks to the Fund may include those associated with investing in foreign securities, emerging markets, initial public offerings (“IPOs”), real estate investment trusts (“REITs”), and derivatives. Please see the Fund’s prospectuses or janus.com/info (or janus.com/reports if you hold shares directly with Janus Capital) for more information about risks, portfolio holdings and other details.
The Fund invests in REITs, which may be subject to a higher degree of market risk because of concentration in a specific industry, sector or geographic region. REITs may be subject to risks including, but not limited to: legal, political, liquidity, interest rate risks, a decline in the value of real estate, risks related to general and economic conditions, changes in the value of the underlying property owned by the trust and defaults by borrowers. To the extent the Fund invests in foreign REITs, the Fund may be subject to fluctuations in currency rates or political or economic conditions in a particular country.
Holding a meaningful portion of assets in cash or cash equivalents may negatively affect performance.
Returns include reinvestment of all dividends and distributions. The returns do not include adjustments in accordance with generally accepted accounting principles required at the period end for financial reporting purposes.
Ranking is for the share class shown only; other classes may have different performance characteristics. When an expense waiver is in effect, it may have a material effect on the total return, and therefore the ranking for the period.
© 2013 Morningstar, Inc. All Rights Reserved.
There is no assurance that the investment process will consistently lead to successful investing.
See Notes to Schedules of Investments and Other Information for index definitions.
The Fund’s portfolio may differ significantly from the securities held in the index. The index is unmanaged and is not available for direct investment; therefore, its performance does not reflect the expenses associated with the active management of an actual portfolio.
See “Useful Information About Your Fund Report.”
Effective April 1, 2013, Robert Perkins and Alec Perkins are Co-Portfolio Managers of the Fund.
| | | |
| * | | The Fund’s inception date – December 15, 2011 |
| (1) | | Closed to new investors. |
Janus Value Funds | 31
Perkins Select Value Fund (unaudited)
As a shareholder of the Fund, you incur two types of costs: (1) transaction costs, such as sales charges (loads) on purchase payments (applicable to Class A Shares only); and (2) ongoing costs, including management fees; distribution and shareholder servicing (12b-1) fees; administrative services fees payable pursuant to the Transfer Agency Agreement; and other Fund expenses. This example is intended to help you understand your ongoing costs (in dollars) of investing in the Fund and to compare these costs with the ongoing costs of investing in other mutual funds. To do so, compare this 5% hypothetical example with the 5% hypothetical examples that appear in the shareholder reports of the other funds. The example is based upon an investment of $1,000 invested at the beginning of the period and held for the six-months indicated, unless noted otherwise in the table and footnotes below.
Actual Expenses
The information in the table under the heading “Actual” provides information about actual account values and actual expenses. You may use the information in these columns, together with the amount you invested, to estimate the expenses that you paid over the period. Simply divide your account value by $1,000 (for example, an $8,600 account value divided by $1,000 = 8.6), then multiply the result by the number in the appropriate column for your share class under the heading entitled “Expenses Paid During Period” to estimate the expenses you paid on your account during the period.
Hypothetical Example for Comparison Purposes
The information in the table under the heading “Hypothetical (5% return before expenses)” provides information about hypothetical account values and hypothetical expenses based upon the Fund’s actual expense ratio and an assumed rate of return of 5% per year before expenses, which is not the Fund’s actual return. The hypothetical account values and expenses may not be used to estimate the actual ending account balance or expenses you paid for the period. You may use this information to compare the ongoing costs of investing in the Fund and other funds. To do so, compare this 5% hypothetical example with the 5% hypothetical examples that appear in the shareholder reports of the other funds. Additionally, for an analysis of the fees associated with an investment in any share class or other similar funds, please visit www.finra.org/fundanalyzer.
Please note that the expenses shown in the table are meant to highlight your ongoing costs only and do not reflect any transaction costs. These fees are fully described in the Fund’s prospectuses. Therefore, the hypothetical examples are useful in comparing ongoing costs only, and will not help you determine the relative total costs of owning different funds. In addition, if these transaction costs were included, your costs would have been higher.
| | | | | | | | | | | | | | | | | | | | | | | | | | | | | | | |
| | | | | Hypothetical
| | | | |
| | | Actual | | (5% return before expenses) | | | | |
| | | Beginning
| | Ending
| | Expenses
| | Beginning
| | Ending
| | Expenses
| | | | |
| | | Account
| | Account
| | Paid During
| | Account
| | Account
| | Paid During
| | Net Annualized
| | |
| | | Value
| | Value
| | Period
| | Value
| | Value
| | Period
| | Expense Ratio
| | |
| | | (1/1/13) | | (6/30/13) | | (1/1/13 - 6/30/13)† | | (1/1/13) | | (6/30/13) | | (1/1/13 - 6/30/13)† | | (1/1/13 - 6/30/13) | | |
| |
| |
| Class A Shares | | $ | 1,000.00 | | | $ | 1,105.30 | | | $ | 6.00 | | | $ | 1,000.00 | | | $ | 1,019.09 | | | $ | 5.76 | | | | 1.15% | | | |
| |
| |
| Class C Shares | | $ | 1,000.00 | | | $ | 1,100.80 | | | $ | 9.90 | | | $ | 1,000.00 | | | $ | 1,015.37 | | | $ | 9.49 | | | | 1.90% | | | |
| |
| |
| Class D Shares | | $ | 1,000.00 | | | $ | 1,106.10 | | | $ | 4.80 | | | $ | 1,000.00 | | | $ | 1,020.23 | | | $ | 4.61 | | | | 0.92% | | | |
| |
| |
| Class I Shares | | $ | 1,000.00 | | | $ | 1,106.90 | | | $ | 4.02 | | | $ | 1,000.00 | | | $ | 1,020.98 | | | $ | 3.86 | | | | 0.77% | | | |
| |
| |
| Class S Shares | | $ | 1,000.00 | | | $ | 1,105.20 | | | $ | 6.16 | | | $ | 1,000.00 | | | $ | 1,018.94 | | | $ | 5.91 | | | | 1.18% | | | |
| |
| |
| Class T Shares | | $ | 1,000.00 | | | $ | 1,105.20 | | | $ | 5.32 | | | $ | 1,000.00 | | | $ | 1,019.74 | | | $ | 5.11 | | | | 1.02% | | | |
| |
| |
| | | |
| † | | Expenses Paid During Period are equal to the Net Annualized Expense Ratio multiplied by the average account value over the period, multiplied by the number of days in the most recent six-month period, divided by the number of days in the fiscal year. Expenses in the examples include the effect of applicable fee waivers and/or expense reimbursements, if any. Had such waivers and/or reimbursements not been in effect, your expenses would have been higher. Please refer to the Notes to Financial Statements or the Fund’s prospectuses for more information regarding waivers and/or reimbursements. |
32 | JUNE 30, 2013
Perkins Select Value Fund
Schedule of Investments
As of June 30, 2013
| | | | | | | | | | | |
| Shares or Principal Amount | | Value | | | |
| |
| Common Stock – 86.9% | | | | | | |
| Aerospace and Defense – 0.6% | | | | | | |
| | 6,000 | | | General Dynamics Corp. | | $ | 469,980 | | | |
| Agricultural Chemicals – 1.2% | | | | | | |
| | 16,000 | | | Mosaic Co. | | | 860,960 | | | |
| Applications Software – 1.2% | | | | | | |
| | 18,000 | | | Check Point Software Technologies, Ltd.* | | | 894,240 | | | |
| Building – Heavy Construction – 1.6% | | | | | | |
| | 12,000 | | | Granite Construction, Inc. | | | 357,120 | | | |
| | 84,000 | | | Sterling Construction Co., Inc.* | | | 761,040 | | | |
| | | | | | | | 1,118,160 | | | |
| Cellular Telecommunications – 2.2% | | | | | | |
| | 54,000 | | | Vodafone Group PLC (ADR) | | | 1,551,960 | | | |
| Chemicals – Specialty – 2.3% | | | | | | |
| | 380,000 | | | Borregaard A.S.A | | | 1,658,405 | | | |
| Commercial Banks – 3.7% | | | | | | |
| | 20,000 | | | Bank of Hawaii Corp. | | | 1,006,400 | | | |
| | 62,000 | | | Fulton Financial Corp. | | | 711,760 | | | |
| | 10,000 | | | Heritage Financial Corp. | | | 146,500 | | | |
| | 42,000 | | | Univest Corp. of Pennsylvania | | | 800,940 | | | |
| | | | | | | | 2,665,600 | | | |
| Commercial Services – Finance – 0.6% | | | | | | |
| | 26,000 | | | Western Union Co. | | | 444,860 | | | |
| Computers – Integrated Systems – 2.6% | | | | | | |
| | 40,000 | | | Diebold, Inc. | | | 1,347,600 | | | |
| | 12,000 | | | MICROS Systems, Inc.* | | | 517,800 | | | |
| | | | | | | | 1,865,400 | | | |
| Distribution/Wholesale – 0.4% | | | | | | |
| | 8,000 | | | Owens & Minor, Inc. | | | 270,640 | | | |
| Diversified Operations – 2.6% | | | | | | |
| | 232,000 | | | Orkla A.S.A. | | | 1,901,207 | | | |
| Electronic Components – Miscellaneous – 1.5% | | | | | | |
| | 30,000 | | | Garmin, Ltd. | | | 1,084,800 | | | |
| Electronic Components – Semiconductors – 0.7% | | | | | | |
| | 16,000 | | | Altera Corp. | | | 527,840 | | | |
| Engineering – Research and Development Services – 2.4% | | | | | | |
| | 13,312 | | | Jacobs Engineering Group, Inc.* | | | 733,891 | | | |
| | 30,000 | | | KBR, Inc. | | | 975,000 | | | |
| | | | | | | | 1,708,891 | | | |
| Enterprise Software/Services – 2.7% | | | | | | |
| | 20,000 | | | CA, Inc. | | | 572,600 | | | |
| | 66,000 | | | Omnicell, Inc.* | | | 1,356,300 | | | |
| | | | | | | | 1,928,900 | | | |
| Environmental Consulting and Engineering – 0.8% | | | | | | |
| | 26,000 | | | Tetra Tech, Inc.* | | | 611,260 | | | |
| Food – Retail – 1.6% | | | | | | |
| | 24,000 | | | Harris Teeter Supermarkets, Inc. | | | 1,124,640 | | | |
| Gold Mining – 0.5% | | | | | | |
| | 14,000 | | | Goldcorp, Inc. (U.S. Shares) | | | 346,220 | | | |
| Instruments – Scientific – 0.6% | | | | | | |
| | 5,000 | | | Thermo Fisher Scientific, Inc. | | | 423,150 | | | |
| Investment Management and Advisory Services – 0.5% | | | | | | |
| | 11,000 | | | Invesco, Ltd. | | | 349,800 | | | |
| Machine Tools and Related Products – 1.0% | | | | | | |
| | 18,000 | | | Kennametal, Inc. | | | 698,940 | | | |
| Medical – Drugs – 7.7% | | | | | | |
| | 14,000 | | | Abbott Laboratories | | | 488,320 | | | |
| | 18,000 | | | AbbVie, Inc. | | | 744,120 | | | |
| | 24,000 | | | GlaxoSmithKline PLC (ADR) | | | 1,199,280 | | | |
| | 33,000 | | | Merck & Co., Inc. | | | 1,532,850 | | | |
| | 22,000 | | | Novartis A.G. (ADR) | | | 1,555,620 | | | |
| | | | | | | | 5,520,190 | | | |
| Medical – Generic Drugs – 1.8% | | | | | | |
| | 33,000 | | | Teva Pharmaceutical Industries, Ltd. (ADR) | | | 1,293,600 | | | |
| Medical Labs and Testing Services – 1.1% | | | | | | |
| | 8,000 | | | Laboratory Corp. of America Holdings* | | | 800,800 | | | |
| Medical Products – 5.9% | | | | | | |
| | 12,000 | | | Baxter International, Inc. | | | 831,240 | | | |
| | 49,000 | | | Hill-Rom Holdings, Inc. | | | 1,650,320 | | | |
| | 16,000 | | | Orthofix International N.V. (U.S. Shares)* | | | 430,400 | | | |
| | 21,000 | | | Stryker Corp. | | | 1,358,280 | | | |
| | | | | | | | 4,270,240 | | | |
| Metal Processors and Fabricators – 2.0% | | | | | | |
| | 52,000 | | | Kaydon Corp. | | | 1,432,600 | | | |
| Multi-Line Insurance – 0.9% | | | | | | |
| | 18,000 | | | Kemper Corp. | | | 616,500 | | | |
| Networking Products – 1.3% | | | | | | |
| | 88,000 | | | Polycom, Inc.* | | | 927,520 | | | |
| Oil – Field Services – 1.2% | | | | | | |
| | 40,000 | | | PAA Natural Gas Storage L.P. | | | 841,600 | | | |
| Oil Companies – Exploration and Production – 7.2% | | | | | | |
| | 12,000 | | | Noble Energy, Inc. | | | 720,480 | | | |
| | 22,000 | | | Occidental Petroleum Corp. | | | 1,963,060 | | | |
| | 48,000 | | | QEP Resources, Inc. | | | 1,333,440 | | | |
| | 25,000 | | | Whiting Petroleum Corp.* | | | 1,152,250 | | | |
| | | | | | | | 5,169,230 | | | |
| Pipelines – 1.4% | | | | | | |
| | 28,000 | | | MPLX L.P. | | | 1,030,680 | | | |
| Real Estate Operating/Development – 1.3% | | | | | | |
| | 45,000 | | | St. Joe Co.* | | | 947,250 | | | |
| REIT – Apartments – 1.6% | | | | | | |
| | 18,000 | | | Home Properties, Inc. | | | 1,176,660 | | | |
| REIT – Diversified – 2.1% | | | | | | |
| | 16,000 | | | Potlatch Corp. | | | 647,040 | | | |
| | 30,000 | | | Weyerhaeuser Co. | | | 854,700 | | | |
| | | | | | | | 1,501,740 | | | |
| REIT – Health Care – 1.9% | | | | | | |
| | 18,000 | | | HCP, Inc. | | | 817,920 | | | |
| | 22,000 | | | Healthcare Realty Trust, Inc. | | | 561,000 | | | |
| | | | | | | | 1,378,920 | | | |
| REIT – Office Property – 0.7% | | | | | | |
| | 7,500 | | | Alexandria Real Estate Equities, Inc. | | | 492,900 | | | |
| Retail – Apparel and Shoe – 0.5% | | | | | | |
| | 18,000 | | | American Eagle Outfitters, Inc. | | | 328,680 | | | |
| Retail – Convenience Stores – 2.9% | | | | | | |
| | 35,000 | | | Casey’s General Stores, Inc. | | | 2,105,600 | | | |
| | | | | | | | | | | |
See Notes to Schedules of Investments and Other Information and Notes to Financial Statements.
Janus Value Funds | 33
Perkins Select Value Fund
Schedule of Investments
As of June 30, 2013
| | | | | | | | | | | |
| Shares or Principal Amount | | Value | | | |
| |
| Retail – Leisure Products – 0.8% | | | | | | |
| | 52,000 | | | MarineMax, Inc.* | | $ | 589,160 | | | |
| Savings/Loan/Thrifts – 2.8% | | | | | | |
| | 130,000 | | | OceanFirst Financial Corp. | | | 2,021,500 | | | |
| Semiconductor Equipment – 1.5% | | | | | | |
| | 40,000 | | | MKS Instruments, Inc. | | | 1,061,600 | | | |
| Super-Regional Banks – 3.3% | | | | | | |
| | 60,000 | | | Fifth Third Bancorp | | | 1,083,000 | | | |
| | 18,000 | | | PNC Financial Services Group, Inc. | | | 1,312,560 | | | |
| | | | | | | | 2,395,560 | | | |
| Tools – Hand Held – 0.9% | | | | | | |
| | 8,000 | | | Stanley Black & Decker, Inc. | | | 618,400 | | | |
| Transportation – Marine – 2.7% | | | | | | |
| | 68,000 | | | Irish Continental Group PLC | | | 1,964,755 | | | |
| Transportation – Railroad – 1.0% | | | | | | |
| | 10,000 | | | Norfolk Southern Corp. | | | 726,500 | | | |
| Transportation – Services – 1.1% | | | | | | |
| | 8,000 | | | FedEx Corp. | | | 788,640 | | | |
| |
| |
| Total Common Stock (cost $54,483,012) | | | 62,506,678 | | | |
| |
| |
| Corporate Bond – 1.7% | | | | | | |
| Oil Companies – Exploration and Production – 1.7% | | | | | | |
| | $1,707,000 | | | Lone Pine Resources Canada, Ltd.
10.3750%, 2/15/17 (cost $1,724,594) | | | 1,229,040 | | | |
| |
| |
| Preferred Stock – 0.5% | | | | | | |
| Commercial Banks – 0.5% | | | | | | |
| | 15,000 | | | First Republic Bank, 6.2000% (cost $390,100) | | | 372,750 | | | |
| |
| |
| Repurchase Agreement – 10.7% | | | | | | |
| | $7,700,000 | | | HSBC Securities (USA), Inc., 0.1000%, dated 6/28/13, maturing 7/1/13 to be repurchased at $7,700,064 collateralized by $22,889,164 in U.S. Treasuries 0.0000%-4.7500%, 2/15/15-2/15/43
with a value of $7,854,006
(cost $7,700,000) | | | 7,700,000 | | | |
| |
| |
| Total Investments (total cost $64,297,706) – 99.8% | | | 71,808,468 | | | |
| |
| |
| Cash, Receivables and Other Assets, net of Liabilities – 0.2% | | | 167,997 | | | |
| |
| |
| Net Assets – 100% | | $ | 71,976,465 | | | |
| |
| |
Summary of Investments by Country – (Long Positions) (unaudited)
| | | | | | | | | |
| | | | | | % of Investment
| |
| Country | | Value | | | Securities | |
| |
| |
| Canada | | $ | 1,575,260 | | | | 2.2% | |
| Ireland | | | 1,964,755 | | | | 2.7% | |
| Israel | | | 2,187,840 | | | | 3.0% | |
| Norway | | | 3,559,612 | | | | 5.0% | |
| Switzerland | | | 1,555,620 | | | | 2.2% | |
| United Kingdom | | | 2,751,240 | | | | 3.8% | |
United States†† | | | 58,214,141 | | | | 81.1% | |
| |
| |
| Total | | $ | 71,808,468 | | | | 100.0% | |
| | | |
| †† | | Includes Cash Equivalents of 10.7%. |
See Notes to Schedules of Investments and Other Information and Notes to Financial Statements.
34 | JUNE 30, 2013
Perkins Small Cap Value Fund (unaudited)(closed to certain new investors)
| | | | | | | |
Fund Snapshot
We believe in the timeless adage of the power of compounding and in doing so our focus is on mitigating losses in difficult markets. We invest in securities that we believe to have favorable reward to risk ratios by focusing first on rigorous downside analysis prior to determining upside potential. We seek to outperform both our benchmark and peers over a full market cycle by building diversified portfolios of high-quality, undervalued stocks.
| |
Robert Perkins
co-portfolio manager | | 
Justin Tugman
co-portfolio manager | | 
Tom Reynolds
co-portfolio manager |
Performance Overview
During the 12 months ended June 30, 2013, Perkins Small Cap Value Fund’s Class T Shares returned 18.44% versus 24.76% for the Fund’s benchmark, the Russell 2000 Value Index. Our 14.28% average cash holdings weighed the most on performance, followed by our holdings in consumer discretionary and information technology. Relative contributors included our holdings in financials and consumer staples, our lack of exposure in utilities and our holdings in health care.
Co-Portfolio Manager Change
During the period, Tom Reynolds replaced Todd Perkins as co-portfolio manager of Perkins Small Cap Value Fund. Mr. Perkins, who had served on the Fund since 2004, retired effective March 31, 2013. Mr. Reynolds, who joins Bob Perkins and Justin Tugman, has 14 years of investment experience. He will continue to oversee the firm’s coverage of the financial sector, which he has done since 2009. Mr. Reynolds holds a bachelor of arts degree from Dartmouth College and an MBA from the University of Chicago Booth School of Business, where he graduated with honors.
Economic Environment
Early in the period, the most important positive factor affecting the markets were statements from Mario Draghi, head of the European Central Bank (ECB), that European monetary policy would become much more aggressive in providing liquidity conditioned upon defined deleveraging programs. In addition, in September the U.S. Federal Reserve (Fed) announced that it would keep Fed funds interest rates at 0 to 0.25% well into 2015 and that it would embark upon a more open-ended and substantial quantitative easing policy, including mortgage backed securities.
The rally was more modestly extended in the fourth quarter of 2012. U.S. gross domestic product (GDP) was up a surprising 3%, and the Fed stated it would not raise rates until unemployment falls to 6.5% and inflation does not rise above 2.5%. European markets were firm as the ECB’s promise “to do whatever it takes” and small steps toward political cooperation had a calming effect. This was despite signs that GDP in Europe was heading to negative territory. China’s political transition appeared orderly and, with signs the economy was stabilizing in the area of 7% growth, its stock market rallied off its three-year bottom.
The strong rally in 2012’s second half extended into the first quarter. U.S. GDP was essentially flat as government, business and consumer spending were impacted by year-end government policy uncertainty and inventories were drawn down. At year-end, Washington came to agreement to push out the debt ceiling debate and tax rate reductions for all but the top brackets were extended; however, payroll taxes increased for all. This clarity on tax policy relieved some of the year-end anxiety.
U.S. stocks continued to climb higher in the second quarter, but they took a volatile path to get there. The CBOE VIX Index, a general measure of market volatility, spiked over 40% off its recent lows, which created some opportunities to purchase high-quality companies on sale. Equities generally remain fairly valued, with the S&P 500 Index trading around 14.6x 2013 earnings estimates. The Index’s 6.85% forward earnings yield at period end also remained attractive compared with the 10-year U.S. Treasury note’s 2.49% yield, even after the recent run-up in interest rates. Corporate balance sheets remain on solid footing, which bodes well for future dividend increases and greater merger activity, both factors that we view as supportive of equity prices.
Holdings That Detracted
Lone Pine Resources was our largest individual detractor. The Canadian-based oil and gas producer’s stock declined on disappointing production results. Lone Pine endured a costly and arduous process to increase oil and natural gas liquids production to improve cash flow and margins. However, with the company spending too much to make
Janus Value Funds | 35
Perkins Small Cap Value Fund (unaudited)(closed to certain new investors)
this transition, the balance sheet came under strain, which would require asset sales to improve its financial position. Management had indicated that they were pursuing divestitures, but given that other companies were in a similar position, it was not guaranteed that the company would be successful in its efforts or realize full value for its assets. Given these uncertainties, we exited our position.
Harte-Hanks also weighed on performance. The company’s direct marketing business was experiencing slower growth and margin pressure. Local advertising spending had been soft and more client money had been going to the Internet. While we believe Harte-Hanks has valuable assets along with an attractive dividend yield, we sold the position based on our concerns the business was in a secular decline, a significant change to our initial investment thesis.
In technology, QLogic was a key detractor. The network infrastructure provider underperformed after the company missed its revenue estimate and was unable to offset lower sales with cost cuts. Costs continue to remain elevated since QLogic will bring to market a number of new products over the next two quarters, which should help revenue. At the same time, the company’s core HBA (host bus adapter) revenue continues to decline, driven by weaker server sales and a shift to different technology within some data centers. The company is also in the process of replacing its former CEO; we expect a new CEO to be named in the near future. We believe downside is limited, with over $4 per share in net cash and a free cash flow yield of 13%. We also expect the company to cut costs over the next year. We added to our position.
Holdings That Contributed
Flowers Foods was our largest individual contributor. Shares of the Georgia-based bakery company gained 46% in the period. The company initially benefited from the bankruptcy of Hostess Brands, but it also purchased the Hostess breads business during the bankruptcy proceedings. Flowers should benefit from less competition in a market in which price discounting has been an issue, and from increased geographic reach the Hostess business provides. Given the acquisition, earnings estimates for the company increased, leading to gains in the share price. Although we trimmed our holdings in the stock given the strong performance, we maintain a position in the name given the company’s improving prospects, solid balance sheet, high dividend yield and an active share buyback program.
First Niagara Financial also aided performance. In 2011, First Niagara announced a merger and acquisition (M&A) transaction that was dilutive to earnings, capital and book value during the height of the U.S. debt crisis. As such the stock suffered meaningfully and the equity raised for the deal was completed at very low levels. In 2012, First Niagara suffered from the low interest rate environment and poor investment securities selection. With First Niagara’s management and board of directors having lost credibility with investors, the stock traded at a discount to peers. In 2013, the company took the first steps toward recovering credibility by firing its CEO. This move, coupled with higher interest rates and a steeper yield curve, led First Niagara’s valuation to expand toward peers. We trimmed our position on strength.
In industrials, Kirby Corp. was a key contributor. The Houston-based operator of a fleet of U.S. tank barges rose significantly due to booming shale energy production which has led to a very favorable environment for petrochemical companies, a key market for Kirby, increasing shipping demand. Oil output rose faster than supply of new pipelines, forcing refineries to look to railroads and barges to move crude. We added to our position in Kirby during the period.
Market Outlook
Numerous analogies have been proffered as to the recent Fed proclamation that the latest quantitative easing liquidity inducing scheme has a finite life. Whether the extraction of liquidity from the system is akin to “putting the toothpaste back in the tube,” or Fed Chairman Ben Bernanke not wanting to be “the guy who left the hose on and walked away,” the bottom line is that the prices for risk assets will have to adjust to an environment where the Fed is no longer giving away money for free. Some of the bullish arguments for equity prices still hold: Fed liquidity will continue for the time being with rate hikes not on tap until 2015, equity valuations appear fair, and the U.S. remains the “best house on a bad block” as the world muddles through this period of anemic economic growth. Conversely, the negative market factors have not gone away and would indicate that caution is still warranted as various issues such as fiscal policy, debt issues and the promotion of effective growth measures have not been addressed in a serious manner. The new risk factor is now the uncertainty regarding the impact of higher interest rates on a fragile economy.
In the case of Europe, a problem area that is re-emerging to dominate the discussion, economic weakness is more and more apparent in the peripheral countries, with concern that it has spread to the core. The unknown will
36 | JUNE 30, 2013
(unaudited)(closed to certain new investors)
be the contagion impact, not only in Europe, but to the U.S. and rest of the world as well. In the U.S., as growth expectations have been ratcheted down, equity markets appear fairly valued on a historical basis, but the slowing in Europe, China and elsewhere bears watching as to the negative effects on the U.S. economy.
Marked improvements in housing and employment markets notwithstanding, the truth is that the U.S. economy is far from a strong growth mode and still remains extremely susceptible to external shocks. GDP expanded at an annual rate of 1.8% in the first quarter, notably higher than the 0.4% gain from fourth quarter 2012, but well below the 2.4% pace estimated in March. The Fed still expects GDP growth to pick up steam, given diminished downside risks for the labor market and economic activity, with a 2.3% to 2.6% forecast range for 2013 and an upgraded outlook to 3.0% to 3.5% in 2014. However, it remains to be seen if any of the ongoing macroeconomic uncertainties suddenly flare up and shift this optimistic outlook, as has occurred in the past. Various threats from across the globe could easily dampen U.S. projections. China, in particular, remains a concern. While the country completed its leadership transition in November, economic growth continues to be a wild card. The government lowered its 2013 growth projections from 8.0% to 7.5%, though weaker global GDP could make this expansion more difficult to achieve. The world has come to rely on China as a core growth engine, and any slowdown, even marginal, is likely to have reverberations worldwide.
In the Fund, we remain overweight health care and consumer staples, although we have pared back our exposure to consumer staples as valuations have increased, and we remain underweight utilities. We continue to be significantly underweight real estate investment trusts (REITs), but we are beginning to see some attractive opportunities, given the sell-off in the names on fears of higher interest rates. We continue to be overweight industrials, adding to several names on weakness during the quarter. As a result of the uncertain macroeconomic backdrop we continue to remain cautious on the equity market, but constructive on pullbacks in which we expect to take advantage of price dislocations. We have added to several of our higher conviction names within the Fund, believing that high-quality names will serve our shareholders well over time.
The key to our research-intensive approach is keeping a long-term perspective and remembering that markets tend to revert to the mean. It can be easy for investors to slip into a trader mentality during high-volatility momentum markets, when all stocks seem to keep rising. When markets turn, however, the importance of carefully researched quality can quickly become apparent. This bias toward quality extends beyond a simply defensive measure. Our research has shown high-quality stocks have delivered higher risk-adjusted return potential over the long term as well.
Looking ahead, we believe our Fund is well positioned to navigate the current market climate, in terms of both risk exposure and long-term upside potential. Our investment team spends a significant amount of time carefully researching each and every stock, and we remain confident that this focus on finding investment value while mitigating absolute risk exposure will serve our clients well, especially if markets experience heightened volatility.
Thank you for your investment in Perkins Small Cap Value Fund.
Janus Value Funds | 37
Perkins Small Cap Value Fund (unaudited)(closed to certain new investors)
Perkins Small Cap Value Fund At A Glance
5 Top Performers – Holdings
| | | | | |
| | | Contribution |
| |
| Flowers Foods, Inc. | | | 0.70% | |
| First Niagara Financial Group, Inc. | | | 0.58% | |
| Kirby Corp. | | | 0.57% | |
| Covance, Inc. | | | 0.57% | |
| Alterra Capital Holdings, Ltd. | | | 0.52% | |
5 Bottom Performers – Holdings
| | | | | |
| | | Contribution |
| |
| Lone Pine Resources, Inc. | | | –0.29% | |
| Harte-Hanks, Inc. | | | –0.26% | |
| QLogic Corp. | | | –0.25% | |
| Globe Specialty Metals, Inc. | | | –0.18% | |
| Deckers Outdoor Corp. | | | –0.17% | |
5 Top Performers – Sectors*
| | | | | | | | | | | | | |
| | | | | Fund Weighting
| | Russell 2000®
|
| | | Fund Contribution | | (Average % of Equity) | | Value Index Weighting |
| |
| Financials | | | 1.19% | | | | 29.09% | | | | 37.06% | |
| Utilities | | | 0.64% | | | | 0.00% | | | | 6.51% | |
| Health Care | | | 0.53% | | | | 10.11% | | | | 4.56% | |
| Consumer Staples | | | 0.43% | | | | 5.92% | | | | 2.57% | |
| Telecommunication Services | | | 0.09% | | | | 0.00% | | | | 0.56% | |
5 Bottom Performers – Sectors*
| | | | | | | | | | | | | |
| | | | | Fund Weighting
| | Russell 2000®
|
| | | Fund Contribution | | (Average % of Equity) | | Value Index Weighting |
| |
| Other** | | | –3.77% | | | | 14.28% | | | | 0.00% | |
| Consumer Discretionary | | | –2.20% | | | | 6.09% | | | | 11.99% | |
| Information Technology | | | –1.57% | | | | 9.65% | | | | 12.09% | |
| Energy | | | –0.36% | | | | 8.32% | | | | 6.43% | |
| Industrials | | | –0.19% | | | | 12.06% | | | | 12.79% | |
| | | |
| | | Security contribution to performance is measured by using an algorithm that multiplies the daily performance of each security with the previous day’s ending weight in the portfolio and is gross of advisory fees. Fixed income securities and certain equity securities, such as private placements and some share classes of equity securities, are excluded. |
| * | | Based on sector classification according to the Global Industry Classification Standard (“GICS”) codes, which are the exclusive property and a service mark of MSCI Inc. and Standard & Poor’s. |
| | | |
| ** | | Not a GICS classified sector. |
38 | JUNE 30, 2013
(unaudited)(closed to certain new investors)
5 Largest Equity Holdings – (% of Net Assets)
As of June 30, 2013
| | | | | |
Owens & Minor, Inc.
Distribution/Wholesale | | | 2.5% | |
Hill-Rom Holdings, Inc.
Medical Products | | | 2.2% | |
Casey’s General Stores, Inc.
Retail – Convenience Stores | | | 2.1% | |
Fulton Financial Corp.
Commercial Banks | | | 2.0% | |
Home Properties, Inc.
REIT – Apartments | | | 1.9% | |
| | | | | |
| | | | 10.7% | |
Asset Allocation – (% of Net Assets)
As of June 30, 2013
Top Country Allocations – Long Positions (% of Investment Securities)
As of June 30, 2013
Janus Value Funds | 39
Perkins Small Cap Value Fund (unaudited)(closed to certain new investors)
| | | | | | | | | | | | |
| Average Annual Total Return – for the periods ended June 30, 2013 | | | Expense Ratios – per the October 26, 2012 prospectuses |
| | | One
| | Five
| | Ten
| | | Total Annual Fund
| | Net Annual Fund
|
| | | Year | | Year | | Year | | | Operating Expenses | | Operating Expenses |
| | | | | | | | | | | | |
| Perkins Small Cap Value Fund – Class A Shares(1) | | | | | | | | | | | |
| | | | | | | | | | | | |
| NAV | | 18.27% | | 10.26% | | 9.86% | | | 1.39% | | 1.24% |
| | | | | | | | | | | | |
| MOP | | 11.48% | | 8.96% | | 9.21% | | | | | |
| | | | | | | | | | | | |
| Perkins Small Cap Value Fund – Class C Shares(1) | | | | | | | | | | | |
| | | | | | | | | | | | |
| NAV | | 17.31% | | 9.56% | | 9.07% | | | 2.05% | | 1.99% |
| | | | | | | | | | | | |
| CDSC | | 16.31% | | 9.56% | | 9.07% | | | | | |
| | | | | | | | | | | | |
| Perkins Small Cap Value Fund – Class D Shares(1) | | 18.58% | | 10.46% | | 10.15% | | | 0.95% | | 0.95% |
| | | | | | | | | | | | |
| Perkins Small Cap Value Fund – Class I Shares(1) | | 18.62% | | 10.38% | | 10.12% | | | 0.89% | | 0.89% |
| | | | | | | | | | | | |
| Perkins Small Cap Value Fund – Class L Shares(1) | | 18.74% | | 10.64% | | 10.37% | | | 1.02% | | 1.02% |
| | | | | | | | | | | | |
| Perkins Small Cap Value Fund – Class N Shares(1) | | 18.77% | | 10.38% | | 10.12% | | | 0.79% | | 0.79% |
| | | | | | | | | | | | |
| Perkins Small Cap Value Fund – Class R Shares(1) | | 17.93% | | 9.95% | | 9.58% | | | 1.54% | | 1.54% |
| | | | | | | | | | | | |
| Perkins Small Cap Value Fund – Class S Shares(1) | | 18.19% | | 10.17% | | 9.85% | | | 1.29% | | 1.29% |
| | | | | | | | | | | | |
| Perkins Small Cap Value Fund – Class T Shares(1) | | 18.44% | | 10.38% | | 10.12% | | | 1.05% | | 1.05% |
| | | | | | | | | | | | |
| Russell 2000® Value Index | | 24.76% | | 8.59% | | 9.30% | | | | | |
| | | | | | | | | | | | |
| Morningstar Quartile – Class T Shares | | 4th | | 2nd | | 2nd | | | | | |
| | | | | | | | | | | | |
| Morningstar Ranking – based on total returns for Small Value Funds | | 353/380 | | 96/320 | | 111/241 | | | | | |
| | | | | | | | | | | | |
| Visit janus.com/advisor/mutual-funds (or janus.com/allfunds if you hold Shares directly with Janus Capital) to view current performance and characteristic information | | | | | |
| | | | | | | | | | | | |
Returns quoted are past performance and do not guarantee future results; current performance may be lower or higher. Investment returns and principal value will vary; there may be a gain or loss when shares are sold. For the most recent month-end performance call 877.33JANUS(52687) (or 800.525.3713 if you hold shares directly with Janus Capital) or visit janus.com/advisor/mutual-funds (or janus.com/allfunds if you hold shares directly with Janus Capital).
Performance shown for Class A Shares at Maximum Offering Price (MOP) includes the Fund’s maximum sales charge of 5.75%. Performance shown at Net Asset Value (NAV) does not include this charge and would have been lower had this charge been taken into account.
Performance shown for Class C Shares includes a 1% contingent deferred sales charge (CDSC) on periods of less than 12 months. Performance shown at Net Asset Value (NAV) does not include this sales charge and would have been lower had this sales charge been taken into account.
See important disclosures on the next page.
40 | JUNE 30, 2013
(unaudited)(closed to certain new investors)
Net expense ratios reflect the expense waiver, if any, Janus Capital has contractually agreed to through November 1, 2013.
For Class L Shares, net expense ratios reflect the administrative fee waiver, if any, Janus Services LLC has voluntarily agreed to, which could be changed or terminated at any time.
The expense ratios for Class N Shares are estimated.
The Fund has a performance-based management fee that adjusts up or down based on the Fund’s performance relative to an approved benchmark index over a performance measurement period. See the Fund’s prospectuses or Statement of Additional Information for more details.
The Fund’s performance may be affected by risks that include those associated with undervalued or overlooked companies, investments in specific industries or countries and potential conflicts of interest with the Janus “funds of funds.” Additional risks to the Fund may include those associated with investing in foreign securities, emerging markets, initial public offerings (“IPOs”), real estate investment trusts (“REITs”), and derivatives. Please see the Fund’s prospectuses or janus.com/info (or janus.com/reports if you hold shares directly with Janus Capital) for more information about risks, portfolio holdings and other details.
The Fund invests in REITs, which may be subject to a higher degree of market risk because of concentration in a specific industry, sector or geographic region. REITs may be subject to risks including, but not limited to: legal, political, liquidity, interest rate risks, a decline in the value of real estate, risks related to general and economic conditions, changes in the value of the underlying property owned by the trust and defaults by borrowers. To the extent the Fund invests in foreign REITs, the Fund may be subject to fluctuations in currency rates or political or economic conditions in a particular country.
The Fund will normally invest at least 80% of its net assets, measured at the time of purchase, in the type of securities described by its name.
Holding a meaningful portion of assets in cash or cash equivalents may negatively affect performance.
Returns include reinvestment of all dividends and distributions. The returns do not include adjustments in accordance with generally accepted accounting principles required at the period end for financial reporting purposes.
Class A Shares, Class C Shares, Class R Shares and Class S Shares of the Fund commenced operations on July 6, 2009. The performance shown for periods prior to July 6, 2009 reflects the historical performance of a similar share class of the Fund and predecessor fund, calculated using the fees and expenses of each respective share class without the effect of any fee and expense limitations or waivers.
Class D Shares of the Fund commenced operations on February 16, 2010 as a result of the restructuring of Class J Shares, the predecessor share class. The performance shown for periods prior to February 16, 2010 reflects the historical performance of the Fund’s predecessor share class.
Class I Shares of the Fund commenced operations on July 6, 2009. The performance shown for periods prior to July 6, 2009 reflects the historical performance of a similar share class of the Fund and predecessor fund.
Class L Shares of the Fund commenced operations on April 21, 2003. The performance shown for periods prior to April 21, 2003 reflects the historical performance of a prior share class of the predecessor fund.
Class N Shares of the Fund commenced operations on May 31, 2012. The performance shown for periods prior to May 31, 2012 reflects the historical performance of a similar share class of the Fund and predecessor fund.
Class T Shares of the Fund commenced operations with the Fund’s inception. The performance shown for periods prior to April 21, 2003 reflects the historical performance of a prior share class of the predecessor fund.
If each share class of the Fund had been available during periods prior to its commencement, the performance shown may have been different. The performance shown for periods following the Fund’s commencement of each share class reflects the fees and expenses of each respective share class, net of any applicable fee and expense limitations or waivers. Please refer to the Fund’s prospectuses for further details concerning historical performance.
Ranking is for the share class shown only; other classes may have different performance characteristics. When an expense waiver is in effect, it may have a material effect on the total return, and therefore the ranking for the period.
© 2013 Morningstar, Inc. All Rights Reserved.
There is no assurance that the investment process will consistently lead to successful investing.
See Notes to Schedules of Investments and Other Information for index definitions.
The Fund’s portfolio may differ significantly from the securities held in the index. The index is unmanaged and is not available for direct investment; therefore, its performance does not reflect the expenses associated with the active management of an actual portfolio.
See “Useful Information About Your Fund Report.”
Effective April 1, 2013, Robert Perkins, Justin Tugman and Tom Reynolds are Co-Portfolio Managers of the Fund.
| | | |
| (1) | | Closed to certain new investors. Please see current prospectuses for details. |
Janus Value Funds | 41
Perkins Small Cap Value Fund (unaudited)(closed to certain new investors)
As a shareholder of the Fund, you incur two types of costs: (1) transaction costs, such as sales charges (loads) on purchase payments (applicable to Class A Shares only); and (2) ongoing costs, including management fees; distribution and shareholder servicing (12b-1) fees; administrative services fees payable pursuant to the Transfer Agency Agreement; and other Fund expenses. This example is intended to help you understand your ongoing costs (in dollars) of investing in the Fund and to compare these costs with the ongoing costs of investing in other mutual funds. To do so, compare this 5% hypothetical example with the 5% hypothetical examples that appear in the shareholder reports of the other funds. The example is based upon an investment of $1,000 invested at the beginning of the period and held for the six-months indicated, unless noted otherwise in the table and footnotes below.
Actual Expenses
The information in the table under the heading “Actual” provides information about actual account values and actual expenses. You may use the information in these columns, together with the amount you invested, to estimate the expenses that you paid over the period. Simply divide your account value by $1,000 (for example, an $8,600 account value divided by $1,000 = 8.6), then multiply the result by the number in the appropriate column for your share class under the heading entitled “Expenses Paid During Period” to estimate the expenses you paid on your account during the period.
Hypothetical Example for Comparison Purposes
The information in the table under the heading “Hypothetical (5% return before expenses)” provides information about hypothetical account values and hypothetical expenses based upon the Fund’s actual expense ratio and an assumed rate of return of 5% per year before expenses, which is not the Fund’s actual return. The hypothetical account values and expenses may not be used to estimate the actual ending account balance or expenses you paid for the period. You may use this information to compare the ongoing costs of investing in the Fund and other funds. To do so, compare this 5% hypothetical example with the 5% hypothetical examples that appear in the shareholder reports of the other funds. Additionally, for an analysis of the fees associated with an investment in any share class or other similar funds, please visit www.finra.org/fundanalyzer.
Please note that the expenses shown in the table are meant to highlight your ongoing costs only and do not reflect any transaction costs. These fees are fully described in the Fund’s prospectuses. Therefore, the hypothetical examples are useful in comparing ongoing costs only, and will not help you determine the relative total costs of owning different funds. In addition, if these transaction costs were included, your costs would have been higher.
| | | | | | | | | | | | | | | | | | | | | | | | | | | | | | | |
| | | | | Hypothetical
| | | | |
| | | Actual | | (5% return before expenses) | | | | |
| | | Beginning
| | Ending
| | Expenses
| | Beginning
| | Ending
| | Expenses
| | | | |
| | | Account
| | Account
| | Paid During
| | Account
| | Account
| | Paid During
| | Net Annualized
| | |
| | | Value
| | Value
| | Period
| | Value
| | Value
| | Period
| | Expense Ratio
| | |
| | | (1/1/13) | | (6/30/13) | | (1/1/13 - 6/30/13)† | | (1/1/13) | | (6/30/13) | | (1/1/13 - 6/30/13)† | | (1/1/13 - 6/30/13) | | |
| |
| |
| Class A Shares | | $ | 1,000.00 | | | $ | 1,124.20 | | | $ | 5.00 | | | $ | 1,000.00 | | | $ | 1,020.08 | | | $ | 4.76 | | | | 0.95% | | | |
| |
| |
| Class C Shares | | $ | 1,000.00 | | | $ | 1,119.60 | | | $ | 9.35 | | | $ | 1,000.00 | | | $ | 1,015.97 | | | $ | 8.90 | | | | 1.78% | | | |
| |
| |
| Class D Shares | | $ | 1,000.00 | | | $ | 1,125.60 | | | $ | 4.01 | | | $ | 1,000.00 | | | $ | 1,021.03 | | | $ | 3.81 | | | | 0.76% | | | |
| |
| |
| Class I Shares | | $ | 1,000.00 | | | $ | 1,125.90 | | | $ | 3.64 | | | $ | 1,000.00 | | | $ | 1,021.37 | | | $ | 3.46 | | | | 0.69% | | | |
| |
| |
| Class L Shares | | $ | 1,000.00 | | | $ | 1,126.30 | | | $ | 3.27 | | | $ | 1,000.00 | | | $ | 1,021.72 | | | $ | 3.11 | | | | 0.62% | | | |
| |
| |
| Class N Shares | | $ | 1,000.00 | | | $ | 1,126.40 | | | $ | 3.16 | | | $ | 1,000.00 | | | $ | 1,021.82 | | | $ | 3.01 | | | | 0.60% | | | |
| |
| |
| Class R Shares | | $ | 1,000.00 | | | $ | 1,122.70 | | | $ | 7.00 | | | $ | 1,000.00 | | | $ | 1,018.20 | | | $ | 6.66 | | | | 1.33% | | | |
| |
| |
| Class S Shares | | $ | 1,000.00 | | | $ | 1,123.70 | | | $ | 5.79 | | | $ | 1,000.00 | | | $ | 1,019.34 | | | $ | 5.51 | | | | 1.10% | | | |
| |
| |
| Class T Shares | | $ | 1,000.00 | | | $ | 1,125.10 | | | $ | 4.37 | | | $ | 1,000.00 | | | $ | 1,020.68 | | | $ | 4.16 | | | | 0.83% | | | |
| |
| |
| | | |
| † | | Expenses Paid During Period are equal to the Net Annualized Expense Ratio multiplied by the average account value over the period, multiplied by the number of days in the most recent six-month period, divided by the number of days in the fiscal year. Expenses in the examples include the effect of applicable fee waivers and/or expense reimbursements, if any. Had such waivers and/or reimbursements not been in effect, your expenses would have been higher. Please refer to the Notes to Financial Statements or the Fund’s prospectuses for more information regarding waivers and/or reimbursements. |
42 | JUNE 30, 2013
Perkins Small Cap Value Fund
Schedule of Investments
As of June 30, 2013
| | | | | | | | | | | |
| Shares or Principal Amount | | Value | | | |
| |
| Common Stock – 92.4% | | | | | | |
| Agricultural Chemicals – 0.3% | | | | | | |
| | 400,000 | | | Intrepid Potash, Inc. | | $ | 7,620,000 | | | |
| Apparel Manufacturers – 0.7% | | | | | | |
| | 265,000 | | | Columbia Sportswear Co. | | | 16,602,250 | | | |
| Automotive – Truck Parts and Equipment – Original – 0.9% | | | | | | |
| | 1,120,000 | | | Dana Holding Corp. | | | 21,571,200 | | | |
| Building – Heavy Construction – 1.7% | | | | | | |
| | 1,100,000 | | | Granite Construction, Inc. | | | 32,736,000 | | | |
| | 975,000 | | | Sterling Construction Co., Inc.*,£ | | | 8,833,500 | | | |
| | | | | | | | 41,569,500 | | | |
| Coal – 0.5% | | | | | | |
| | 700,000 | | | Cloud Peak Energy, Inc.* | | | 11,536,000 | | | |
| Commercial Banks – 13.7% | | | | | | |
| | 1,100,000 | | | BancorpSouth, Inc. | | | 19,470,000 | | | |
| | 600,000 | | | Bank of Hawaii Corp. | | | 30,192,000 | | | |
| | 3,000,000 | | | BBCN Bancorp, Inc. | | | 42,660,000 | | | |
| | 360,000 | | | City National Corp. | | | 22,813,200 | | | |
| | 969,514 | | | Columbia Banking System, Inc. | | | 23,084,128 | | | |
| | 4,261,573 | | | Fulton Financial Corp. | | | 48,922,858 | | | |
| | 750,000 | | | Glacier Bancorp, Inc. | | | 16,642,500 | | | |
| | 1,250,000 | | | Hancock Holding Co. | | | 37,587,500 | | | |
| | 900,000 | | | PacWest Bancorp | | | 27,585,000 | | | |
| | 750,000 | | | Prosperity Bancshares, Inc. | | | 38,842,500 | | | |
| | 675,000 | | | Texas Capital Bancshares, Inc.* | | | 29,943,000 | | | |
| | | | | | | | 337,742,686 | | | |
| Commercial Services – Finance – 0.7% | | | | | | |
| | 375,000 | | | Global Payments, Inc. | | | 17,370,000 | | | |
| Computers – Integrated Systems – 2.2% | | | | | | |
| | 850,000 | | | Diebold, Inc. | | | 28,636,500 | | | |
| | 325,000 | | | MICROS Systems, Inc.* | | | 14,023,750 | | | |
| | 450,000 | | | Netscout Systems, Inc.* | | | 10,503,000 | | | |
| | | | | | | | 53,163,250 | | | |
| Containers – Paper and Plastic – 1.9% | | | | | | |
| | 200,000 | | | Packaging Corp. of America | | | 9,792,000 | | | |
| | 1,100,000 | | | Sonoco Products Co. | | | 38,027,000 | | | |
| | | | | | | | 47,819,000 | | | |
| Dental Supplies and Equipment – 1.9% | | | | | | |
| | 1,225,000 | | | Patterson Cos., Inc. | | | 46,060,000 | | | |
| Distribution/Wholesale – 2.5% | | | | | | |
| | 1,850,000 | | | Owens & Minor, Inc. | | | 62,585,500 | | | |
| Electronic Components – Semiconductors – 1.7% | | | | | | |
| | 2,000,000 | | | QLogic Corp.* | | | 19,120,000 | | | |
| | 675,000 | | | Semtech Corp.* | | | 23,645,250 | | | |
| | | | | | | | 42,765,250 | | | |
| Electronic Design Automation – 1.1% | | | | | | |
| | 750,000 | | | Synopsys, Inc.* | | | 26,812,500 | | | |
| Engineering – Research and Development Services – 1.8% | | | | | | |
| | 625,000 | | | EMCOR Group, Inc. | | | 25,406,250 | | | |
| | 550,000 | | | KBR, Inc. | | | 17,875,000 | | | |
| | | | | | | | 43,281,250 | | | |
| Engines – Internal Combustion – 0.8% | | | | | | |
| | 950,000 | | | Briggs & Stratton Corp. | | | 18,810,000 | | | |
| Enterprise Software/Services – 0.7% | | | | | | |
| | 900,000 | | | Omnicell, Inc.* | | | 18,495,000 | | | |
| Environmental Consulting and Engineering – 1.0% | | | | | | |
| | 1,100,000 | | | Tetra Tech, Inc.* | | | 25,861,000 | | | |
| Filtration and Separations Products – 1.2% | | | | | | |
| | 575,000 | | | CLARCOR, Inc. | | | 30,020,750 | | | |
| Finance – Investment Bankers/Brokers – 1.5% | | | | | | |
| | 340,000 | | | Evercore Partners, Inc. – Class A | | | 13,355,200 | | | |
| | 740,000 | | | Lazard, Ltd. – Class A | | | 23,791,000 | | | |
| | | | | | | | 37,146,200 | | | |
| Finance – Leasing Companies – 0.6% | | | | | | |
| | 800,000 | | | AerCap Holdings N.V. (U.S. Shares)* | | | 13,968,000 | | | |
| Food – Baking – 0.7% | | | | | | |
| | 825,000 | | | Flowers Foods, Inc. | | | 18,191,250 | | | |
| Food – Miscellaneous/Diversified – 1.2% | | | | | | |
| | 380,000 | | | J&J Snack Foods Corp. | | | 29,564,000 | | | |
| Food – Retail – 0.9% | | | | | | |
| | 457,206 | | | Harris Teeter Supermarkets, Inc. | | | 21,424,673 | | | |
| Footwear and Related Apparel – 0.6% | | | | | | |
| | 250,000 | | | Wolverine World Wide, Inc. | | | 13,652,500 | | | |
| Golf – 0.6% | | | | | | |
| | 2,200,000 | | | Callaway Golf Co.£ | | | 14,476,000 | | | |
| Instruments – Scientific – 1.1% | | | | | | |
| | 800,000 | | | PerkinElmer, Inc. | | | 26,000,000 | | | |
| Insurance Brokers – 1.0% | | | | | | |
| | 800,000 | | | Brown & Brown, Inc. | | | 25,792,000 | | | |
| Lasers – Systems and Components – 0.6% | | | | | | |
| | 874,008 | | | II-VI, Inc.* | | | 14,211,370 | | | |
| Machine Tools and Related Products – 2.4% | | | | | | |
| | 680,000 | | | Kennametal, Inc. | | | 26,404,400 | | | |
| | 575,000 | | | Lincoln Electric Holdings, Inc. | | | 32,930,250 | | | |
| | | | | | | | 59,334,650 | | | |
| Machinery – Construction and Mining – 0.9% | | | | | | |
| | 625,000 | | | Astec Industries, Inc. | | | 21,431,250 | | | |
| Machinery – General Industrial – 0.4% | | | | | | |
| | 325,000 | | | Albany International Corp. – Class A | | | 10,718,500 | | | |
| Medical – Biomedical and Genetic – 1.3% | | | | | | |
| | 790,000 | | | Charles River Laboratories International, Inc.* | | | 32,413,700 | | | |
| Medical Instruments – 1.0% | | | | | | |
| | 900,000 | | | AngioDynamics, Inc.* | | | 10,152,000 | | | |
| | 500,000 | | | Thoratec Corp.* | | | 15,655,000 | | | |
| | | | | | | | 25,807,000 | | | |
| Medical Labs and Testing Services – 1.2% | | | | | | |
| | 230,000 | | | Covance, Inc.* | | | 17,512,200 | | | |
| | 360,000 | | | ICON PLC* | | | 12,754,800 | | | |
| | | | | | | | 30,267,000 | | | |
| Medical Products – 2.8% | | | | | | |
| | 1,625,000 | | | Hill-Rom Holdings, Inc. | | | 54,730,000 | | | |
| | 525,000 | | | Orthofix International N.V. (U.S. Shares)* | | | 14,122,500 | | | |
| | | | | | | | 68,852,500 | | | |
| Medical Sterilization Products – 0.5% | | | | | | |
| | 300,000 | | | STERIS Corp. | | | 12,864,000 | | | |
| | | | | | | | | | | |
See Notes to Schedules of Investments and Other Information and Notes to Financial Statements.
Janus Value Funds | 43
Perkins Small Cap Value Fund
Schedule of Investments
As of June 30, 2013
| | | | | | | | | | | |
| Shares or Principal Amount | | Value | | | |
| |
| Metal Processors and Fabricators – 1.4% | | | | | | |
| | 1,275,000 | | | Kaydon Corp.£ | | $ | 35,126,250 | | | |
| Miscellaneous Manufacturing – 1.2% | | | | | | |
| | 525,000 | | | Aptargroup, Inc. | | | 28,985,250 | | | |
| Multi-Line Insurance – 1.4% | | | | | | |
| | 1,000,000 | | | Kemper Corp. | | | 34,250,000 | | | |
| Networking Products – 0.7% | | | | | | |
| | 1,600,000 | | | Polycom, Inc.* | | | 16,864,000 | | | |
| Non-Ferrous Metals – 0.4% | | | | | | |
| | 900,000 | | | Globe Specialty Metals, Inc. | | | 9,783,000 | | | |
| Oil – Field Services – 1.2% | | | | | | |
| | 1,150,000 | | | PAA Natural Gas Storage L.P. | | | 24,196,000 | | | |
| | 500,000 | | | Tesco Corp.* | | | 6,625,000 | | | |
| | | | | | | | 30,821,000 | | | |
| Oil Companies – Exploration and Production – 2.0% | | | | | | |
| | 950,000 | | | QEP Resources, Inc. | | | 26,391,000 | | | |
| | 500,000 | | | Whiting Petroleum Corp.* | | | 23,045,000 | | | |
| | | | | | | | 49,436,000 | | | |
| Paper and Related Products – 1.4% | | | | | | |
| | 409,465 | | | Buckeye Technologies, Inc. | | | 15,166,584 | | | |
| | 750,000 | | | PH Glatfelter Co. | | | 18,825,000 | | | |
| | | | | | | | 33,991,584 | | | |
| Pipelines – 1.0% | | | | | | |
| | 400,000 | | | Western Gas Partners L.P. | | | 25,956,000 | | | |
| Poultry – 0.5% | | | | | | |
| | 190,000 | | | Sanderson Farms, Inc. | | | 12,619,800 | | | |
| Printing Services – 1.5% | | | | | | |
| | 1,175,000 | | | Brady Corp. – Class A | | | 36,107,750 | | | |
| Property and Casualty Insurance – 1.5% | | | | | | |
| | 400,000 | | | Infinity Property & Casualty Corp. | | | 23,904,000 | | | |
| | 220,000 | | | Navigators Group, Inc.* | | | 12,548,800 | | | |
| | | | | | | | 36,452,800 | | | |
| Real Estate Operating/Development – 0.5% | | | | | | |
| | 630,000 | | | St. Joe Co.* | | | 13,261,500 | | | |
| Reinsurance – 2.1% | | | | | | |
| | 200,000 | | | Endurance Specialty Holdings, Ltd. | | | 10,290,000 | | | |
| | 775,856 | | | Montpelier Re Holdings, Ltd. | | | 19,404,159 | | | |
| | 315,000 | | | Reinsurance Group of America, Inc. | | | 21,769,650 | | | |
| | | | | | | | 51,463,809 | | | |
| REIT – Apartments – 2.9% | | | | | | |
| | 1,650,000 | | | Education Realty Trust, Inc. | | | 16,879,500 | | | |
| | 725,000 | | | Home Properties, Inc. | | | 47,393,250 | | | |
| | 133,282 | | | Post Properties, Inc. | | | 6,596,126 | | | |
| | | | | | | | 70,868,876 | | | |
| REIT – Diversified – 1.3% | | | | | | |
| | 800,000 | | | Potlatch Corp. | | | 32,352,000 | | | |
| REIT – Health Care – 0.4% | | | | | | |
| | 425,000 | | | Healthcare Realty Trust, Inc. | | | 10,837,500 | | | |
| REIT – Hotels – 1.1% | | | | | | |
| | 3,000,000 | | | DiamondRock Hospitality Co. | | | 27,960,000 | | | |
| REIT – Mortgage – 0.5% | | | | | | |
| | 1,100,000 | | | Two Harbors Investment Corp. | | | 11,275,000 | | | |
| REIT – Office Property – 0.3% | | | | | | |
| | 385,000 | | | BioMed Realty Trust, Inc. | | | 7,788,550 | | | |
| Retail – Apparel and Shoe – 2.1% | | | | | | |
| | 600,000 | | | Aeropostale, Inc.* | | | 8,280,000 | | | |
| | 725,000 | | | Ascena Retail Group, Inc.* | | | 12,651,250 | | | |
| | 155,869 | | | Genesco, Inc.* | | | 10,441,664 | | | |
| | 525,000 | | | Men’s Wearhouse, Inc. | | | 19,871,250 | | | |
| | | | | | | | 51,244,164 | | | |
| Retail – Convenience Stores – 2.1% | | | | | | |
| | 875,000 | | | Casey’s General Stores, Inc. | | | 52,640,000 | | | |
| Retail – Leisure Products – 0.6% | | | | | | |
| | 1,250,000 | | | MarineMax, Inc.*,£ | | | 14,162,500 | | | |
| Savings/Loan/Thrifts – 4.5% | | | | | | |
| | 2,200,000 | | | First Niagara Financial Group, Inc. | | | 22,154,000 | | | |
| | 1,300,000 | | | Investors Bancorp, Inc. | | | 27,404,000 | | | |
| | 1,300,000 | | | Provident Financial Services, Inc. | | | 20,514,000 | | | |
| | 2,150,000 | | | Washington Federal, Inc. | | | 40,592,000 | | | |
| | | | | | | | 110,664,000 | | | |
| Semiconductor Components/Integrated Circuits – 0.6% | | | | | | |
| | 275,000 | | | Hittite Microwave Corp.* | | | 15,950,000 | | | |
| Semiconductor Equipment – 1.5% | | | | | | |
| | 1,000,000 | | | Brooks Automation, Inc. | | | 9,730,000 | | | |
| | 1,075,000 | | | MKS Instruments, Inc. | | | 28,530,500 | | | |
| | | | | | | | 38,260,500 | | | |
| Telecommunication Equipment – 1.0% | | | | | | |
| | 700,000 | | | NICE Systems, Ltd. (ADR) | | | 25,823,000 | | | |
| Transportation – Marine – 2.1% | | | | | | |
| | 525,000 | | | Kirby Corp.* | | | 41,758,500 | | | |
| | 170,000 | | | Tidewater, Inc. | | | 9,684,900 | | | |
| | | | | | | | 51,443,400 | | | |
| |
| |
| Total Common Stock (cost $1,876,147,897) | | | 2,282,187,962 | | | |
| |
| |
| Repurchase Agreements – 8.8% | | | | | | |
| | $92,300,000 | | | HSBC Securities (USA), Inc., 0.1000%, dated 6/28/13, maturing 7/1/13 to be repurchased at $92,300,769 collateralized by $274,372,711 in U.S. Treasuries 0.0000%-4.7500%, 2/15/15-2/15/43 with a value of $94,146,068 | | | 92,300,000 | | | |
See Notes to Schedules of Investments and Other Information and Notes to Financial Statements.
44 | JUNE 30, 2013
Schedule of Investments
As of June 30, 2013
| | | | | | | | | | | |
| Shares or Principal Amount | | Value | | | |
| |
| | $25,200,000 | | | ING Financial Markets LLC, 0.0100%, dated 6/28/13, maturing 7/1/13 to be repurchased at $25,200,021 collateralized by $2,034,770 in a U.S. Government Agency 4.0000%, 2/20/40 and $20,249,901 in U.S. Treasuries 0.2500%-8.8750%, 2/28/15-2/15/19 with respective values of $2,167,306 and $23,536,915 | | $ | 25,200,000 | | | |
| | 99,200,000 | | | RBC Capital Markets Corp., 0.1000%, dated 6/28/13, maturing 7/1/13 to be repurchased at $99,200,827 collateralized by $99,203,614 in U.S. Treasuries 0.0000%-9.2500%, 7/1/13-2/15/42 with a value of $101,184,005 | | | 99,200,000 | | | |
| |
| |
| Total Repurchase Agreements (cost $216,700,000) | | | 216,700,000 | | | |
| |
| |
| Total Investments (total cost $2,092,847,897) – 101.2% | | | 2,498,887,962 | | | |
| |
| |
| Liabilities, net of Cash, Receivables and Other Assets– (1.2)% | | | (30,054,887) | | | |
| |
| |
| Net Assets – 100% | | $ | 2,468,833,075 | | | |
| |
| |
Summary of Investments by Country – (Long Positions) (unaudited)
| | | | | | | | | |
| | | | | | % of Investment
| |
| Country | | Value | | | Securities | |
| |
| |
| Ireland | | $ | 12,754,800 | | | | 0.5% | |
| Israel | | | 25,823,000 | | | | 1.0% | |
United States†† | | | 2,460,310,162 | | | | 98.5% | |
| |
| |
| Total | | $ | 2,498,887,962 | | | | 100.0% | |
| | | |
| †† | | Includes Cash Equivalents of 8.7%. |
See Notes to Schedules of Investments and Other Information and Notes to Financial Statements.
Janus Value Funds | 45
Perkins Value Plus Income Fund (unaudited)
Performance Overview
For the 12-month period ended June 30, 2013, Perkins Value Plus Income Fund’s Class I Shares returned 13.16%, while the Fund’s primary benchmark, the Russell 1000 Value Index, returned 25.32%. Its blended benchmark, the Value Income Index, a hypothetical internally-calculated index that combines the total returns from the Russell 1000 Value Index (50%) and the Barclays U.S. Aggregate Bond Index (50%), returned 11.70%. The Fund’s secondary benchmark, the Barclays U.S. Aggregate Bond Index (the “Agg”), returned -0.69% during the period.
Market Environment
The period opened with a good equity rally. The most important positive factor affecting the markets were statements from Mario Draghi, head of the European Central Bank (ECB), that European monetary policy would become much more aggressive in providing liquidity conditioned upon defined deleveraging programs. In addition, in September the U.S. Federal Reserve (Fed) announced that it would keep Fed funds interest rates at 0 to 0.25% well into 2015 and that it would embark upon a more open-ended quantitative easing policy.
The rally was more modestly extended in the fourth quarter of 2012. U.S. gross domestic product (GDP) was up a surprising 3%, and the Fed stated it would not raise rates until unemployment falls to 6.5% and inflation does not rise above 2.5%. European markets were firm as the ECB’s promise “to do whatever it takes” and small steps toward political cooperation had a calming effect. This was despite signs that GDP in Europe was heading to negative territory. China’s political transition appeared orderly and, with signs the economy was stabilizing in the area of 7% growth, its stock market rallied off its three-year bottom.
The strong rally in 2012’s second half extended into the first quarter. U.S. GDP was essentially flat as government, business and consumer spending were impacted by year-end government policy uncertainty and inventories were drawn down. At year end, Washington came to agreement to push out the debt ceiling debate and tax rate reductions for all but the top brackets were extended; however, payroll taxes increased for all. This clarity on tax policy relieved some of the year-end anxiety.
U.S. stocks continued to climb higher in the second quarter, but they took a volatile path to get there. The CBOE VIX Index, a general measure of market volatility, spiked over 40% off its recent lows, which created some opportunities to purchase high-quality companies on sale. Equities generally remain fairly valued, with the S&P 500 Index trading around 14.6 times 2013 earnings estimates. The index’s 6.85% forward earnings yield also remained attractive compared with the 10-year U.S. Treasury note’s 2.49% yield, even after the recent run-up in interest rates. Corporate balance sheets remain on solid footing, which bodes well for future dividend increases and greater merger activity, both factors that we view as supportive of equity prices.
Fixed income markets were largely characterized by concern about global fiscal policies and the impact on economic growth. Overall, both investment-grade and high-yield corporate credit spreads and mortgage-backed securities (MBS) spreads narrowed during the period. Meanwhile, U.S. Treasury bond yields rose, particularly in the final months of the period as U.S. economic data began to improve.
Portfolio Comments
Our overweight to equities (57% at period end) combined with our underweight to fixed income (43%) contributed to returns relative to the Value Income Index. Our equity weighting was at the upper end of our 40%-60% range.
46 | JUNE 30, 2013
(unaudited)
Our equity sleeve in aggregate underperformed the Russell 1000 Value Index, with our holdings and underweight in financials weighing the most, as well as our holdings in information technology. Contributors included our underweights in utilities and energy, followed by our holdings in telecommunication services.
Meanwhile, our fixed income sleeve significantly outperformed the Barclays U.S. Aggregate Bond Index. Our sizeable overweight and security selection in corporate bonds were the primary contributors to relative performance, followed by our security selection in MBS.
In our joint management of the Fund, both Perkins and Janus investment teams are at least as focused on absolute total returns as we are relative returns, and therefore, are focused on the long term. Our emphasis on determining the potential downside or risk of an opportunity, both within fixed income and equities, has served us well as shown by the Fund’s (I Shares) placement in the top quartile of its Morningstar group since inception.
Equity Holdings That Detracted
Goldcorp was our largest individual detractor. Shares of this high-quality, low-cost gold producer declined 33%, as the underlying spot gold price declined 24% during the period. We sold our position.
American Capital Agency, a mortgage real estate investment trust (REIT), was also a key detractor. The company’s book value fell sharply in the first and second quarters of 2013 as interest rates moved quickly higher and the company’s hedges proved inadequate and ineffective. The company underestimated the potential for spread widening in its sector and therefore didn’t hedge appropriately, causing the large book value drop. We believe the steeper Treasury yield curve makes for a more attractive investment environment for the company, and the stock traded at a discount to book value versus its historic premium at period end.
Equity Holdings That Contributed
SK Telecom, our top individual contributor, is South Korea’s leading wireless telecom operator with 51% market share, and owns stakes in other (in some cases related) companies including SK Broadband, SK Hynix and Posco. Despite being engaged in a fierce marketing battle for next-generation network subscribers, the company reported better-than-expected earnings. There was also optimism for a significant recovery in earnings. We reduced our position, given the rise in valuation.
JPMorgan Chase, another top contributor, benefited from strong earnings and a significant increase in its quarterly dividend. Improving macroeconomic data also helped boost the shares. We continue to like the stock as the bank’s strong capital position and robust balance sheet allow it to take market share from its weaker competitors. JPMorgan Chase remains among the best capitalized of the global financial intermediaries, in our view. We continue to find the bank attractive on a book value and earnings basis.
Please see the Derivative Instruments section in the “Notes to Financial Statements” for a discussion of derivatives used by the Fund.
Fixed Income Holdings That Contributed
On an individual credit basis, our security selection in GE Capital contributed to outperformance, particularly our allocation to hybrids/preferred stock, which performed well on a relative basis compared with other types of corporate debt as interest rates rose toward the end of the period. GE Capital Corp. provides financing, mortgage and insurance services. GE Capital has undergone a significant balance sheet transformation since the 2007-2008 financial crisis, making significant strides in reducing leverage, increasing reserves, cutting reliance on short-term funding and improving capital. Its management team has been committed to reducing the size of the company, which should reduce debt outstanding and improve the quality of its balance sheet.
Another top contributor was Goodman Group, a REIT with industrial properties in Australia, New Zealand, the UK, Asia and Europe. Goodman’s operating performance was stronger than expected during the 12-month period; its European portfolio, in particular, outperformed expectations. Goodman also raised equity during the period for growth, which was viewed as positive for its corporate credit. We have favored Goodman for its high-quality asset base and focus on keeping leverage low.
Fixed Income Holdings That Detracted
Diversified company Loews Corp. detracted, partly because we held longer-duration securities, which tend to perform relatively worse when interest rates rise, as they did during the period. We sold our Loews credit during the period.
ADT Corp., which provides home security monitoring services, also weighed on performance due to our holdings in relatively longer-duration securities, which tend to fare relatively worse than shorter-duration securities during rising-rate periods. Spun off from Tyco International
Janus Value Funds | 47
Perkins Value Plus Income Fund (unaudited)
in 2012, ADT’s business model is attractive, as the company has long-term contracts that provide stability of earnings and free cash flow. Consumers have been adopting its new home automation package ADT Pulse, which we believe should help boost earnings and lead to gradual deleveraging of the company’s capital structure over time.
Market Outlook and Fund Positioning
Despite some confusion over recent Fed statements concerning its quantitative easing bond buying program, some of the bullish arguments for equity prices still hold: Fed liquidity will continue for the time being with rate hikes not on tap until 2015, equity valuations appear fair, and the U.S. remains the “best house on a bad block” as the world muddles through this anemic growth environment. Conversely, the negative market factors have not gone away and would indicate that caution is still warranted as various issues such as fiscal policy, debt issues, and the promotion of effective growth measures have not been addressed in a serious manner. Given slow economic growth, corporate earnings comparisons could be disappointing. The new near term risk factor is the uncertainty regarding the impact of higher interest rates on a fragile economy.
Marked improvements in housing and employment markets notwithstanding, the truth is that the U.S. economy is far from being in a strong growth mode and still remains extremely susceptible to external shocks. GDP expanded at an annual rate of 1.8% in the first quarter, notably higher than the 0.4% gain from fourth quarter 2012, but well below the 2.4% pace estimated in March. The Fed still expects GDP growth to pick up steam ahead, given diminished downside risks for the labor market and economic activity, with a 2.3% to 2.6% forecast range for 2013 and an upgraded outlook to 3.0% to 3.5% in 2014. However, the Fed’s forecasts have been overly optimistic in the past and it remains to be seen if any of the ongoing macroeconomic uncertainties suddenly flare up and shift this positive view. Various threats from across the globe could easily dampen U.S. projections.
In the case of Europe, economic weakness is more and more apparent in the peripheral countries with concern that it has spread to the core. Related issues in Europe are the degree of policy coordination, more levered balance sheets and political instability. The unknown will be the contagion impact, not only in Europe, but to the U.S. and rest of the world as well.
Concerning China, while the country completed its leadership transition in November, economic growth continues to be a wild card. The government lowered its 2013 growth projections from 8% to 7.5%, though weaker global GDP could make this expansion more difficult to achieve. Dislocations in the economy and possibly in the financial system could be problematic. The world has come to rely on China as a core growth engine, and any slowdown, even marginal, is likely to have reverberations worldwide.
In the Fund, our largest equity weights continue to be in the financial services sector, where we have preference for regional banks, and we remain underweight in the utilities sector. With stocks appearing fairly valued and an uncertain macroeconomic backdrop, we continue to remain cautious on the equity market. However market pullbacks could provide opportunities to take advantage of price dislocations. As an example, in this quarter we added to REITs, as they were unusually weak as the market focused on interest rate increases.
The key to our research-intensive approach is keeping a long-term perspective and remembering that markets tend to revert to the mean. It can be easy for investors to slip into a complacent mentality during highly volatile momentum markets, when all stocks seem to keep rising. When markets turn, however, the importance of carefully researched quality can quickly become apparent.
Our risk-disciplined investment methodology focuses on identifying attractively priced companies with healthy balance sheets and solid recurring free cash flows that are competitively positioned for long-term success. These types of high-quality firms have historically helped us limit downside portfolio exposure in weak periods, while participating in market rallies. This bias toward quality extends beyond a simply defensive measure. Our research has shown high-quality stocks have delivered higher risk-adjusted return potential over the long term as well.
In fixed income, the Fed’s unconventional monetary policies have suppressed U.S. Treasury rates to unprecedented lows in an effort to stimulate economic growth. Recent U.S. economic data reflects modest acceleration that may give the Fed the support it needs to begin tapering quantitative easing. However, we still believe the Fed will leave short-term interest rates unchanged for an extended period.
While some investors may believe that rates will continue to move higher from here and that we’ve seen the end of the bull market in fixed income, it’s important to recognize that the impact of rising rates will not be uniform across all fixed-income securities. In our view, the biggest effect is likely to be on securities with 10 or more years to maturity. We view that segment of the yield curve as
48 | JUNE 30, 2013
(unaudited)
containing the greatest potential for capital loss and the greatest volatility. We have reduced exposure to longer-duration securities in an effort to buffer the effect of rising rates. Some corporate credit names tend to be more sensitive to interest rate changes than others, and we have reduced our exposure to those, as well. We also continue to look for opportunities in products that have served in the past as alternatives to government bonds and corporate credit, including bank loans and agency MBS.
Security selection in fixed income has become extremely important, in our view, as valuations have become stretched due to investors’ search for yield and the growing risk of higher interest rates. In this environment, we believe that preservation of capital must take priority over aggressive return seeking. This is not to say that great opportunities have disappeared from the fixed income market – they have not, and we are still finding some – but the universe of securities to select from today is much narrower than it has been over the last four years. Fortunately, a back-up in rates may have the positive effect of lowering fixed income valuations and opening up fresh opportunities for investing at more attractive levels in credits that we believe offer the potential for good risk-adjusted returns.
Because we have tended to generate the majority of our excess return through security selection, we see this as a time of great opportunity. Credit risk (i.e., the risk that borrowers will default) has been relatively low for years due to the excess levels of cash held on corporate balance sheets, and we believe that will continue. We believe returns this year will be significantly influenced not just by what we own, but by what we have chosen not to own: There are many securities that offer what we view as asymmetric risk profiles, with greater downside risk exposure, and we intend to steer around them. In our view, the key to success for the remainder of the year will be driving performance through security selection while navigating interest-rate volatility.
Thank you for your investment with us in Perkins Value Plus Income Fund.
Janus Value Funds | 49
Perkins Value Plus Income Fund (unaudited)
Perkins Value Plus Income Fund At A Glance
5 Top Performers – Equity Holdings
| | | | | |
| | | Contribution |
| |
| SK Telecom Co., Ltd. (ADR) | | | 1.06% | |
| JPMorgan Chase & Co. | | | 0.71% | |
| Aetna, Inc. | | | 0.56% | |
| Novartis A.G. (ADR) | | | 0.54% | |
| Two Harbors Investment Corp. | | | 0.48% | |
5 Bottom Performers – Equity Holdings
| | | | | |
| | | Contribution |
| |
| Goldcorp, Inc. (U.S. Shares) | | | –0.37% | |
| American Capital Agency Corp. | | | –0.31% | |
| Teck Resources, Ltd. – Class B | | | –0.21% | |
| Exelon Corp. | | | –0.19% | |
| Hewlett-Packard Co. | | | –0.17% | |
5 Top Performers – Sectors*
| | | | | | | | | | | | | |
| | | | | Fund Weighting
| | Russell 1000® Value
|
| | | Fund Contribution | | (Average % of Equity) | | Index Weighting |
| |
| Utilities | | | 0.64% | | | | 3.29% | | | | 6.67% | |
| Energy | | | 0.61% | | | | 9.88% | | | | 16.19% | |
| Telecommunication Services | | | 0.36% | | | | 7.20% | | | | 3.42% | |
| Industrials | | | 0.32% | | | | 7.40% | | | | 9.06% | |
| Health Care | | | 0.24% | | | | 16.79% | | | | 11.74% | |
5 Bottom Performers – Sectors*
| | | | | | | | | | | | | |
| | | | | Fund Weighting
| | Russell 1000® Value
|
| | | Fund Contribution | | (Average % of Equity) | | Index Weighting |
| |
| Financials | | | –1.42% | | | | 23.14% | | | | 27.24% | |
| Other** | | | –1.39% | | | | 3.32% | | | | 0.00% | |
| Information Technology | | | –1.09% | | | | 9.31% | | | | 6.51% | |
| Materials | | | –0.58% | | | | 5.49% | | | | 3.74% | |
| Consumer Discretionary | | | –0.56% | | | | 6.94% | | | | 8.16% | |
| | | |
| | | Security contribution to performance is measured by using an algorithm that multiplies the daily performance of each security with the previous day’s ending weight in the portfolio and is gross of advisory fees. Fixed income securities and certain equity securities, such as private placements and some share classes of equity securities, are excluded. |
| * | | Based on sector classification according to the Global Industry Classification Standard (“GICS”) codes, which are the exclusive property and a service mark of MSCI Inc. and Standard & Poor’s. |
| | | |
| ** | | Not a GICS classified sector. |
50 | JUNE 30, 2013
(unaudited)
5 Largest Equity Holdings – (% of Net Assets)
As of June 30, 2013
| | | | | |
Occidental Petroleum Corp.
Oil Companies – Exploration and Production | | | 1.4% | |
Vodafone Group PLC (ADR)
Cellular Telecommunications | | | 1.4% | |
Tesco PLC
Food – Retail | | | 1.2% | |
Wells Fargo & Co.
Super-Regional Banks | | | 1.1% | |
Two Harbors Investment Corp.
REIT – Mortgage | | | 1.1% | |
| | | | | |
| | | | 6.2% | |
Asset Allocation – (% of Net Assets)
As of June 30, 2013
Top Country Allocations – Long Positions (% of Investment Securities)
As of June 30, 2013
Janus Value Funds | 51
Perkins Value Plus Income Fund (unaudited)
| | | | | | | | | | |
| Average Annual Total Return – for the periods ended June 30, 2013 | | | Expense Ratios – per the October 26, 2012 prospectuses |
| | | One
| | Since
| | | Total Annual Fund
| | Net Annual Fund
|
| | | Year | | Inception* | | | Operating Expenses | | Operating Expenses |
| | | | | | | | | | |
| Perkins Value Plus Income Fund – Class A Shares | | | | | | | | | |
| | | | | | | | | | |
| NAV | | 12.91% | | 10.67% | | | 1.50% | | 1.02% |
| | | | | | | | | | |
| MOP | | 6.44% | | 8.44% | | | | | |
| | | | | | | | | | |
| Perkins Value Plus Income Fund – Class C Shares | | | | | | | | | |
| | | | | | | | | | |
| NAV | | 12.03% | | 9.97% | | | 2.26% | | 1.77% |
| | | | | | | | | | |
| CDSC | | 11.03% | | 9.97% | | | | | |
| | | | | | | | | | |
| Perkins Value Plus Income Fund – Class D Shares(1) | | 13.02% | | 10.78% | | | 1.41% | | 0.91% |
| | | | | | | | | | |
| Perkins Value Plus Income Fund – Class I Shares | | 13.16% | | 10.91% | | | 1.25% | | 0.77% |
| | | | | | | | | | |
| Perkins Value Plus Income Fund – Class S Shares | | 12.79% | | 10.45% | | | 1.73% | | 1.27% |
| | | | | | | | | | |
| Perkins Value Plus Income Fund – Class T Shares | | 13.01% | | 10.70% | | | 1.48% | | 1.02% |
| | | | | | | | | | |
| Russell 1000® Value Index | | 25.32% | | 16.44% | | | | | |
| | | | | | | | | | |
| Barclays U.S. Aggregate Bond Index | | –0.69% | | 3.23% | | | | | |
| | | | | | | | | | |
| Value Income Index | | 11.70% | | 9.96% | | | | | |
| | | | | | | | | | |
| Morningstar Quartile – Class I Shares | | 2nd | | 1st | | | | | |
| | | | | | | | | | |
| Morningstar Ranking – based on total returns for Moderate Allocation Funds | | 345/951 | | 194/848 | | | | | |
| | | | | | | | | | |
| Visit janus.com/advisor/mutual-funds (or janus.com/allfunds if you hold Shares directly with Janus Capital) to view current performance and characteristic information | | | | | |
| | | | | | | | | | |
Returns quoted are past performance and do not guarantee future results; current performance may be lower or higher. Investment returns and principal value will vary; there may be a gain or loss when shares are sold. For the most recent month-end performance call 877.33JANUS(52687) (or 800.525.3713 if you hold shares directly with Janus Capital) or visit janus.com/advisor/mutual-funds (or janus.com/allfunds if you hold shares directly with Janus Capital).
Performance shown for Class A Shares at Maximum Offering Price (MOP) includes the Fund’s maximum sales charge of 5.75%. Performance shown at Net Asset Value (NAV) does not include this charge and would have been lower had this charge been taken into account.
Performance shown for Class C Shares includes a 1% contingent deferred sales charge (CDSC) on periods of less than 12 months. Performance shown at Net Asset Value (NAV) does not include this sales charge and would have been lower had this sales charge been taken into account.
See important disclosures on the next page.
52 | JUNE 30, 2013
(unaudited)
Net expense ratios reflect the expense waiver, if any, Janus Capital has contractually agreed to through November 1, 2013.
The Fund’s performance may be affected by risks that include those associated with undervalued or overlooked companies, investments in specific industries or countries and potential conflicts of interest with the Janus “funds of funds.” Additional risks to the Fund may include those associated with investing in foreign securities, emerging markets, initial public offerings (“IPOs”), real estate investment trusts (“REITs”), and derivatives. Please see the Fund’s prospectuses or janus.com/info (or janus.com/reports if you hold shares directly with Janus Capital) for more information about risks, portfolio holdings and other details.
Foreign securities have additional risks including exchange rate changes, political and economic upheaval, the relative lack of information, relatively low market liquidity and the potential lack of strict financial and accounting controls and standards. These risks are magnified in emerging markets. The prices of foreign securities held by the Fund, and therefore the Fund’s performance, may decline in response to such risks.
The Fund invests in REITs, which may be subject to a higher degree of market risk because of concentration in a specific industry, sector or geographic region. REITs may be subject to risks including, but not limited to: legal, political, liquidity, interest rate risks, a decline in the value of real estate, risks related to general and economic conditions, changes in the value of the underlying property owned by the trust and defaults by borrowers. To the extent the Fund invests in foreign REITs, the Fund may be subject to fluctuations in currency rates or political or economic conditions in a particular country.
The Fund invests in derivatives which can be highly volatile and involve additional risks than if the underlying securities were held directly by the Fund. Such risks include gains or losses which, as a result of leverage, can be substantially greater than the derivatives’ original cost. There is also a possibility that derivatives may not perform as intended which can reduce opportunity for gains or result in losses by offsetting positive returns in other securities the Fund owns.
Funds that invest in bonds have the same interest rate, inflation, and credit risks that are associated with the underlying bonds owned by the fund. Unlike owning individual bonds, there are ongoing fees and expenses associated with owning shares of bonds funds. The return of principal is not guaranteed due to net asset value fluctuation that is caused by changes in the price of specific bonds held in the fund and selling of bonds within the fund by the portfolio managers.
High-yield/high-risk bonds, also known as “junk” bonds, involve a greater risk of default and price volatility than investment grade bonds. High-yield/high-risk bonds can experience sudden and sharp price swings which will affect net asset value.
For a period of three years subsequent to the Fund’s commencement of operations, Janus Capital may recover from the Fund fees and expenses previously waived or reimbursed, which could then be considered a deferral, if the Fund’s expense ratio, including recovered expenses, falls below the expense limit.
Returns include reinvestment of all dividends and distributions. The returns do not include adjustments in accordance with generally accepted accounting principles required at the period end for financial reporting purposes.
Ranking is for the share class shown only; other classes may have different performance characteristics. When an expense waiver is in effect, it may have a material effect on the total return, and therefore the ranking for the period.
© 2013 Morningstar, Inc. All Rights Reserved.
There is no assurance that the investment process will consistently lead to successful investing.
See Notes to Schedules of Investments and Other Information for index definitions.
The Fund’s portfolio may differ significantly from the securities held in the indices. The indices are unmanaged and are not available for direct investment; therefore, their performance does not reflect the expenses associated with the active management of an actual portfolio.
See “Useful Information About Your Fund Report.”
| | | |
| * | | The Fund’s inception date – July 30, 2010 |
| (1) | | Closed to new investors. |
Janus Value Funds | 53
Perkins Value Plus Income Fund (unaudited)
As a shareholder of the Fund, you incur two types of costs: (1) transaction costs, such as sales charges (loads) on purchase payments (applicable to Class A Shares only); and (2) ongoing costs, including management fees; distribution and shareholder servicing (12b-1) fees; administrative services fees payable pursuant to the Transfer Agency Agreement; and other Fund expenses. This example is intended to help you understand your ongoing costs (in dollars) of investing in the Fund and to compare these costs with the ongoing costs of investing in other mutual funds. To do so, compare this 5% hypothetical example with the 5% hypothetical examples that appear in the shareholder reports of the other funds. The example is based upon an investment of $1,000 invested at the beginning of the period and held for the six-months indicated, unless noted otherwise in the table and footnotes below.
Actual Expenses
The information in the table under the heading “Actual” provides information about actual account values and actual expenses. You may use the information in these columns, together with the amount you invested, to estimate the expenses that you paid over the period. Simply divide your account value by $1,000 (for example, an $8,600 account value divided by $1,000 = 8.6), then multiply the result by the number in the appropriate column for your share class under the heading entitled “Expenses Paid During Period” to estimate the expenses you paid on your account during the period.
Hypothetical Example for Comparison Purposes
The information in the table under the heading “Hypothetical (5% return before expenses)” provides information about hypothetical account values and hypothetical expenses based upon the Fund’s actual expense ratio and an assumed rate of return of 5% per year before expenses, which is not the Fund’s actual return. The hypothetical account values and expenses may not be used to estimate the actual ending account balance or expenses you paid for the period. You may use this information to compare the ongoing costs of investing in the Fund and other funds. To do so, compare this 5% hypothetical example with the 5% hypothetical examples that appear in the shareholder reports of the other funds. Additionally, for an analysis of the fees associated with an investment in any share class or other similar funds, please visit www.finra.org/fundanalyzer.
Please note that the expenses shown in the table are meant to highlight your ongoing costs only and do not reflect any transaction costs. These fees are fully described in the Fund’s prospectuses. Therefore, the hypothetical examples are useful in comparing ongoing costs only, and will not help you determine the relative total costs of owning different funds. In addition, if these transaction costs were included, your costs would have been higher.
| | | | | | | | | | | | | | | | | | | | | | | | | | | | | | | |
| | | | | Hypothetical
| | | | |
| | | Actual | | (5% return before expenses) | | | | |
| | | Beginning
| | Ending
| | Expenses
| | Beginning
| | Ending
| | Expenses
| | | | |
| | | Account
| | Account
| | Paid During
| | Account
| | Account
| | Paid During
| | Net Annualized
| | |
| | | Value
| | Value
| | Period
| | Value
| | Value
| | Period
| | Expense Ratio
| | |
| | | (1/1/13) | | (6/30/13) | | (1/1/13 - 6/30/13)† | | (1/1/13) | | (6/30/13) | | (1/1/13 - 6/30/13)† | | (1/1/13 - 6/30/13) | | |
| |
| |
| Class A Shares | | $ | 1,000.00 | | | $ | 1,064.80 | | | $ | 5.17 | | | $ | 1,000.00 | | | $ | 1,019.79 | | | $ | 5.06 | | | | 1.01% | | | |
| |
| |
| Class C Shares | | $ | 1,000.00 | | | $ | 1,061.60 | | | $ | 9.00 | | | $ | 1,000.00 | | | $ | 1,016.07 | | | $ | 8.80 | | | | 1.76% | | | |
| |
| |
| Class D Shares | | $ | 1,000.00 | | | $ | 1,066.20 | | | $ | 4.56 | | | $ | 1,000.00 | | | $ | 1,020.38 | | | $ | 4.46 | | | | 0.89% | | | |
| |
| |
| Class I Shares | | $ | 1,000.00 | | | $ | 1,067.00 | | | $ | 3.90 | | | $ | 1,000.00 | | | $ | 1,021.03 | | | $ | 3.81 | | | | 0.76% | | | |
| |
| |
| Class S Shares | | $ | 1,000.00 | | | $ | 1,065.60 | | | $ | 5.28 | | | $ | 1,000.00 | | | $ | 1,019.69 | | | $ | 5.16 | | | | 1.03% | | | |
| |
| |
| Class T Shares | | $ | 1,000.00 | | | $ | 1,065.70 | | | $ | 4.25 | | | $ | 1,000.00 | | | $ | 1,020.68 | | | $ | 4.16 | | | | 0.83% | | | |
| |
| |
| | | |
| † | | Expenses Paid During Period are equal to the Net Annualized Expense Ratio multiplied by the average account value over the period, multiplied by the number of days in the most recent six-month period, divided by the number of days in the fiscal year. Expenses in the examples include the effect of applicable fee waivers and/or expense reimbursements, if any. Had such waivers and/or reimbursements not been in effect, your expenses would have been higher. Please refer to the Notes to Financial Statements or the Fund’s prospectuses for more information regarding waivers and/or reimbursements. |
54 | JUNE 30, 2013
Perkins Value Plus Income Fund
Schedule of Investments
As of June 30, 2013
| | | | | | | | | | | |
| Shares or Principal Amount | | Value | | | |
| |
| Asset-Backed/Commercial Mortgage-Backed Securities – 1.4% | | | | | | |
| | $49,000 | | | AmeriCredit Automobile Receivables Trust
3.3800%, 4/9/18 | | $ | 50,026 | | | |
| | 69,000 | | | AmeriCredit Automobile Receivables Trust
2.6800%, 10/9/18 | | | 68,503 | | | |
| | 20,000 | | | Commercial Mortgage Trust
5.6500%, 12/10/49 | | | 20,447 | | | |
| | 127,000 | | | Commercial Mortgage Trust
5.8670%, 12/10/49‡ | | | 136,050 | | | |
| | 85,009 | | | FREMF 2010 K-SCT Mortgage Trust
2.0000%, 1/25/20§ | | | 70,159 | | | |
| | 34,000 | | | FREMF Mortgage Trust
2.8037%, 5/25/19 (144A),‡ | | | 34,180 | | | |
| | 100,000 | | | GS Mortgage Securities Corp. II
3.5495%, 12/10/27 (144A),‡ | | | 85,504 | | | |
| | 120,000 | | | GS Mortgage Securities Corp. Trust
3.5510%, 4/10/34 (144A),‡ | | | 118,153 | | | |
| | 27,000 | | | Santander Drive Auto Receivables Trust
2.5200%, 9/15/16 | | | 26,660 | | | |
| | 9,000 | | | Santander Drive Auto Receivables Trust
3.6400%, 5/15/18 | | | 9,194 | | | |
| | 28,000 | | | Santander Drive Auto Receivables Trust
3.3000%, 9/17/18 | | | 28,240 | | | |
| | 81,000 | | | Wachovia Bank Commercial Mortgage Trust
5.3830%, 12/15/43 | | | 85,389 | | | |
| | 55,000 | | | Wachovia Bank Commercial Mortgage Trust
5.5910%, 4/15/47‡ | | | 58,291 | | | |
| |
| |
| Total Asset-Backed/Commercial Mortgage-Backed Securities (cost $814,655) | | | 790,796 | | | |
| |
| |
| Bank Loans – 0.3% | | | | | | |
| Casino Hotels – 0.2% | | | | | | |
| | 97,510 | | | MGM Resorts International
3.5000%, 12/20/19‡ | | | 96,779 | | | |
| Pharmaceuticals – 0.1% | | | | | | |
| | 48,106 | | | Quintiles Transnational Corp.
4.5000%, 6/8/18‡ | | | 48,045 | | | |
| |
| |
| Total Bank Loans (cost $145,161) | | | 144,824 | | | |
| |
| |
| Common Stock – 56.1% | | | | | | |
| Aerospace and Defense – 0.8% | | | | | | |
| | 6,000 | | | General Dynamics Corp. | | | 469,980 | | | |
| Aerospace and Defense – Equipment – 0.3% | | | | | | |
| | 45,000 | | | BBA Aviation PLC** | | | 191,677 | | | |
| Agricultural Chemicals – 0.3% | | | | | | |
| | 3,500 | | | Mosaic Co. | | | 188,335 | | | |
| Apparel Manufacturers – 0.4% | | | | | | |
| | 2,500 | | | Coach, Inc.** | | | 142,725 | | | |
| | 600 | | | VF Corp.** | | | 115,836 | | | |
| | | | | | | | 258,561 | | | |
| Applications Software – 1.3% | | | | | | |
| | 2,200 | | | Intuit, Inc.** | | | 134,266 | | | |
| | 16,800 | | | Microsoft Corp.** | | | 580,104 | | | |
| | | | | | | | 714,370 | | | |
| Automotive – Truck Parts and Equipment – Original – 0.2% | | | | | | |
| | 3,000 | | | Johnson Controls, Inc.** | | | 107,370 | | | |
| Beverages – Non-Alcoholic – 0.9% | | | | | | |
| | 6,000 | | | Dr. Pepper Snapple Group, Inc.** | | | 275,580 | | | |
| | 3,200 | | | PepsiCo, Inc. | | | 261,728 | | | |
| | | | | | | | 537,308 | | | |
| Building – Residential and Commercial – 0.2% | | | | | | |
| | 4,000 | | | M.D.C. Holdings, Inc. | | | 130,040 | | | |
| Cellular Telecommunications – 2.3% | | | | | | |
| | 14,000 | | | NTT DOCOMO, Inc. (ADR) | | | 219,100 | | | |
| | 15,000 | | | SK Telecom Co., Ltd. (ADR) | | | 304,950 | | | |
| | 27,000 | | | Vodafone Group PLC (ADR)** | | | 775,980 | | | |
| | | | | | | | 1,300,030 | | | |
| Chemicals – Specialty – 0.7% | | | | | | |
| | 86,700 | | | Borregaard A.S.A | | | 378,378 | | | |
| Commercial Banks – 1.9% | | | | | | |
| | 5,700 | | | Bank of Hawaii Corp. | | | 286,824 | | | |
| | 7,500 | | | Columbia Banking System, Inc. | | | 178,575 | | | |
| | 3,500 | | | Cullen / Frost Bankers, Inc. | | | 233,695 | | | |
| | 28,100 | | | Fulton Financial Corp. | | | 322,588 | | | |
| | 4,234 | | | Univest Corp. of Pennsylvania | | | 80,742 | | | |
| | | | | | | | 1,102,424 | | | |
| Commercial Services – Finance – 0.2% | | | | | | |
| | 7,700 | | | Western Union Co.** | | | 131,747 | | | |
| Computers – 0.3% | | | | | | |
| | 500 | | | Apple, Inc.** | | | 198,040 | | | |
| Computers – Integrated Systems – 0.4% | | | | | | |
| | 6,000 | | | Diebold, Inc.** | | | 202,140 | | | |
| Computers – Memory Devices – 0.3% | | | | | | |
| | 6,700 | | | EMC Corp.** | | | 158,254 | | | |
| Containers – Metal and Glass – 0.5% | | | | | | |
| | 5,000 | | | Greif, Inc. – Class A | | | 263,350 | | | |
| Cosmetics and Toiletries – 0.6% | | | | | | |
| | 4,200 | | | Procter & Gamble Co.** | | | 323,358 | | | |
| Cruise Lines – 0.4% | | | | | | |
| | 7,400 | | | Carnival Corp. (U.S. Shares) | | | 253,746 | | | |
| Dental Supplies and Equipment – 0.4% | | | | | | |
| | 6,000 | | | Patterson Cos., Inc. | | | 225,600 | | | |
| Diagnostic Kits – 0.4% | | | | | | |
| | 10,500 | | | Meridian Bioscience, Inc. | | | 225,750 | | | |
| Diversified Banking Institutions – 0.9% | | | | | | |
| | 10,000 | | | JPMorgan Chase & Co.** | | | 527,900 | | | |
| Diversified Operations – 0.7% | | | | | | |
| | 2,500 | | | Koppers Holdings, Inc. | | | 95,450 | | | |
| | 40,000 | | | Orkla A.S.A. | | | 327,794 | | | |
| | | | | | | | 423,244 | | | |
| Electric – Integrated – 1.4% | | | | | | |
| | 2,500 | | | Alliant Energy Corp. | | | 126,050 | | | |
| | 5,000 | | | Hawaiian Electric Industries, Inc. | | | 126,550 | | | |
| | 18,000 | | | PPL Corp. | | | 544,680 | | | |
| | | | | | | | 797,280 | | | |
| Electronic Components – Semiconductors – 1.5% | | | | | | |
| | 6,900 | | | Altera Corp.** | | | 227,631 | | | |
| | 7,000 | | | Intel Corp. | | | 169,540 | | | |
See Notes to Schedules of Investments and Other Information and Notes to Financial Statements.
Janus Value Funds | 55
Perkins Value Plus Income Fund
Schedule of Investments
As of June 30, 2013
| | | | | | | | | | | |
| Shares or Principal Amount | | Value | | | |
| |
| Electronic Components – Semiconductors – (continued) | | | | | | |
| | 7,000 | | | Microchip Technology, Inc. | | $ | 260,750 | | | |
| | 5,000 | | | Xilinx, Inc.** | | | 198,050 | | | |
| | | | | | | | 855,971 | | | |
| Electronic Measuring Instruments – 0.4% | | | | | | |
| | 5,000 | | | Agilent Technologies, Inc.** | | | 213,800 | | | |
| Electronic Security Devices – 0.4% | | | | | | |
| | 6,500 | | | Tyco International, Ltd. (U.S. Shares)** | | | 214,175 | | | |
| Enterprise Software/Services – 0.3% | | | | | | |
| | 6,100 | | | CA, Inc.** | | | 174,643 | | | |
| Food – Baking – 0.3% | | | | | | |
| | 7,200 | | | Flowers Foods, Inc. | | | 158,760 | | | |
| Food – Miscellaneous/Diversified – 0.3% | | | | | | |
| | 4,700 | | | Unilever PLC (ADR)** | | | 190,115 | | | |
| Food – Retail – 1.6% | | | | | | |
| | 135,000 | | | Tesco PLC** | | | 680,348 | | | |
| | 4,700 | | | Weis Markets, Inc. | | | 211,829 | | | |
| | | | | | | | 892,177 | | | |
| Food – Wholesale/Distribution – 0.3% | | | | | | |
| | 5,000 | | | Sysco Corp. | | | 170,800 | | | |
| Human Resources – 0.2% | | | | | | |
| | 2,500 | | | Manpowergroup, Inc.** | | | 137,000 | | | |
| Industrial Gases – 0.3% | | | | | | |
| | 1,800 | | | Air Products & Chemicals, Inc. | | | 164,826 | | | |
| Insurance Brokers – 0.7% | | | | | | |
| | 10,500 | | | Marsh & McLennan Cos., Inc. | | | 419,160 | | | |
| Investment Management and Advisory Services – 0.4% | | | | | | |
| | 2,500 | | | Ameriprise Financial, Inc.** | | | 202,200 | | | |
| Machinery – Construction and Mining – 0.4% | | | | | | |
| | 6,900 | | | Astec Industries, Inc. | | | 236,601 | | | |
| Medical – Drugs – 3.5% | | | | | | |
| | 3,100 | | | AbbVie, Inc.** | | | 128,154 | | | |
| | 5,500 | | | GlaxoSmithKline PLC (ADR)** | | | 274,835 | | | |
| | 2,000 | | | Johnson & Johnson** | | | 171,720 | | | |
| | 5,600 | | | Merck & Co., Inc. | | | 260,120 | | | |
| | 8,600 | | | Novartis A.G. (ADR) | | | 608,106 | | | |
| | 18,800 | | | Pfizer, Inc.** | | | 526,588 | | | |
| | | | | | | | 1,969,523 | | | |
| Medical – Generic Drugs – 0.9% | | | | | | |
| | 12,400 | | | Teva Pharmaceutical Industries, Ltd. (ADR) | | | 486,080 | | | |
| Medical – HMO – 1.3% | | | | | | |
| | 3,500 | | | Aetna, Inc. | | | 222,390 | | | |
| | 2,000 | | | Humana, Inc.** | | | 168,760 | | | |
| | 4,000 | | | WellPoint, Inc. | | | 327,360 | | | |
| | | | | | | | 718,510 | | | |
| Medical – Wholesale Drug Distributors – 0.3% | | | | | | |
| | 1,500 | | | McKesson Corp.** | | | 171,750 | | | |
| Medical Labs and Testing Services – 0.7% | | | | | | |
| | 6,300 | | | Quest Diagnostics, Inc.** | | | 381,969 | | | |
| Medical Products – 1.5% | | | | | | |
| | 2,100 | | | Baxter International, Inc.** | | | 145,467 | | | |
| | 2,500 | | | Covidien PLC (U.S. Shares) | | | 157,100 | | | |
| | 7,000 | | | Hill-Rom Holdings, Inc. | | | 235,760 | | | |
| | 4,900 | | | Stryker Corp.** | | | 316,932 | | | |
| | | | | | | | 855,259 | | | |
| Medical Sterilization Products – 0.2% | | | | | | |
| | 2,600 | | | STERIS Corp. | | | 111,488 | | | |
| Multi-Line Insurance – 0.3% | | | | | | |
| | 3,800 | | | Allstate Corp. | | | 182,856 | | | |
| Networking Products – 0.4% | | | | | | |
| | 10,000 | | | Cisco Systems, Inc. | | | 243,100 | | | |
| Non-Hazardous Waste Disposal – 0.9% | | | | | | |
| | 15,000 | | | Republic Services, Inc. | | | 509,100 | | | |
| Oil – Field Services – 0.6% | | | | | | |
| | 4,900 | | | Schlumberger, Ltd. (U.S. Shares)** | | | 351,134 | | | |
| Oil and Gas Drilling – 0.3% | | | | | | |
| | 3,000 | | | Ensco PLC – Class A** | | | 174,360 | | | |
| Oil Companies – Exploration and Production – 1.8% | | | | | | |
| | 4,000 | | | Noble Energy, Inc.** | | | 240,160 | | | |
| | 8,700 | | | Occidental Petroleum Corp.** | | | 776,301 | | | |
| | | | | | | | 1,016,461 | | | |
| Oil Companies – Integrated – 3.3% | | | | | | |
| | 7,500 | | | BP PLC (ADR)** | | | 313,050 | | | |
| | 3,200 | | | Chevron Corp.** | | | 378,688 | | | |
| | 2,000 | | | Exxon Mobil Corp.** | | | 180,700 | | | |
| | 7,500 | | | Royal Dutch Shell PLC (ADR)** | | | 478,500 | | | |
| | 10,500 | | | Total S.A. (ADR)** | | | 511,350 | | | |
| | | | | | | | 1,862,288 | | | |
| Printing Services – 0.2% | | | | | | |
| | 4,000 | | | Brady Corp. – Class A | | | 122,920 | | | |
| Protection – Safety – 0.4% | | | | | | |
| | 4,500 | | | Landauer, Inc. | | | 217,395 | | | |
| Publishing – Periodicals – 0.1% | | | | | | |
| | 8,500 | | | UBM PLC** | | | 84,794 | | | |
| Real Estate Management/Services – 0.3% | | | | | | |
| | 14,100 | | | Brookfield Real Estate Services, Inc. | | | 163,610 | | | |
| Reinsurance – 0.3% | | | | | | |
| | 1,200 | | | Everest Re Group, Ltd. | | | 153,912 | | | |
| REIT – Apartments – 1.7% | | | | | | |
| | 7,500 | | | American Campus Communities, Inc. | | | 304,950 | | | |
| | 2,400 | | | AvalonBay Communities, Inc. | | | 323,784 | | | |
| | 5,000 | | | Home Properties, Inc. | | | 326,850 | | | |
| | 1 | | | Silver Bay Realty Trust Corp. | | | 17 | | | |
| | | | | | | | 955,601 | | | |
| REIT – Diversified – 0.9% | | | | | | |
| | 4,000 | | | Potlatch Corp. | | | 161,760 | | | |
| | 3,450 | | | Rayonier, Inc. | | | 191,096 | | | |
| | 5,000 | | | Weyerhaeuser Co. | | | 142,450 | | | |
| | | | | | | | 495,306 | | | |
| REIT – Health Care – 0.3% | | | | | | |
| | 15,300 | | | Healthcare Trust of America, Inc. – Class A | | | 171,819 | | | |
| REIT – Hotels – 0.4% | | | | | | |
| | 22,500 | | | DiamondRock Hospitality Co. | | | 209,700 | | | |
| | | | | | | | | | | |
See Notes to Schedules of Investments and Other Information and Notes to Financial Statements.
56 | JUNE 30, 2013
Schedule of Investments
As of June 30, 2013
| | | | | | | | | | | |
| Shares or Principal Amount | | Value | | | |
| |
| REIT – Mortgage – 1.7% | | | | | | |
| | 14,400 | | | American Capital Agency Corp. | | $ | 331,056 | | | |
| | 60,000 | | | Two Harbors Investment Corp.** | | | 615,000 | | | |
| | | | | | | | 946,056 | | | |
| REIT – Office Property – 0.3% | | | | | | |
| | 8,400 | | | BioMed Realty Trust, Inc. | | | 169,932 | | | |
| REIT – Single Tenant – 0.2% | | | | | | |
| | 7,300 | | | Spirit Realty Capital, Inc. | | | 129,356 | | | |
| Retail – Apparel and Shoe – 0.3% | | | | | | |
| | 4,000 | | | Men’s Wearhouse, Inc.** | | | 151,400 | | | |
| Retail – Major Department Stores – 0.6% | | | | | | |
| | 5,500 | | | Nordstrom, Inc.** | | | 329,670 | | | |
| Retail – Regional Department Stores – 0.3% | | | | | | |
| | 3,000 | | | Kohl’s Corp. | | | 151,530 | | | |
| Retail – Restaurants – 0.7% | | | | | | |
| | 4,000 | | | Darden Restaurants, Inc. | | | 201,920 | | | |
| | 2,200 | | | McDonald’s Corp.** | | | 217,800 | | | |
| | | | | | | | 419,720 | | | |
| Savings/Loan/Thrifts – 0.4% | | | | | | |
| | 3,800 | | | Berkshire Hills Bancorp, Inc. | | | 105,488 | | | |
| | 8,800 | | | OceanFirst Financial Corp. | | | 136,840 | | | |
| | | | | | | | 242,328 | | | |
| Security Services – 0.5% | | | | | | |
| | 7,000 | | | ADT Corp.** | | | 278,950 | | | |
| Semiconductor Components/Integrated Circuits – 1.1% | | | | | | |
| | 5,900 | | | Analog Devices, Inc. | | | 265,854 | | | |
| | 5,500 | | | QUALCOMM, Inc. | | | 335,940 | | | |
| | | | | | | | 601,794 | | | |
| Semiconductor Equipment – 0.6% | | | | | | |
| | 12,200 | | | MKS Instruments, Inc. | | | 323,788 | | | |
| Super-Regional Banks – 2.0% | | | | | | |
| | 12,200 | | | Fifth Third Bancorp | | | 220,210 | | | |
| | 3,500 | | | PNC Financial Services Group, Inc.** | | | 255,220 | | | |
| | 15,500 | | | Wells Fargo & Co.** | | | 639,685 | | | |
| | | | | | | | 1,115,115 | | | |
| Telecommunication Services – 0.6% | | | | | | |
| | 10,000 | | | Telenor A.S.A. | | | 198,284 | | | |
| | 7,750 | | | Vivendi S.A.** | | | 146,761 | | | |
| | | | | | | | 345,045 | | | |
| Telephone – Integrated – 1.0% | | | | | | |
| | 6,000 | | | AT&T, Inc.** | | | 212,400 | | | |
| | 9,700 | | | CenturyLink, Inc.** | | | 342,895 | | | |
| | | | | | | | 555,295 | | | |
| Tobacco – 0.3% | | | | | | |
| | 4,300 | | | Altria Group, Inc. | | | 150,457 | | | |
| Tools – Hand Held – 0.3% | | | | | | |
| | 2,400 | | | Stanley Black & Decker, Inc. | | | 185,520 | | | |
| Transportation & Logistics – 0.2% | | | | | | |
| | 5,500 | | | Hamburger Hafen und Logistik A.G.** | | | 117,682 | | | |
| Transportation – Marine – 0.5% | | | | | | |
| | 10,000 | | | Irish Continental Group PLC** | | | 288,935 | | | |
| Transportation – Railroad – 0.6% | | | | | | |
| | 1,600 | | | Canadian Pacific Railway, Ltd. (U.S. Shares) | | | 194,208 | | | |
| | 1,000 | | | Union Pacific Corp. | | | 154,280 | | | |
| | | | | | | | 348,488 | | | |
| Water – 0.4% | | | | | | |
| | 16,000 | | | Suez Environment Co.** | | | 206,659 | | | |
| |
| |
| Total Common Stock (cost $28,141,630) | | | 31,805,765 | | | |
| |
| |
| Corporate Bonds – 23.9% | | | | | | |
| Aerospace and Defense – Equipment – 0.3% | | | | | | |
| | $61,000 | | | Exelis, Inc.
4.2500%, 10/1/16 | | | 64,316 | | | |
| | 28,000 | | | Exelis, Inc.
5.5500%, 10/1/21 | | | 28,445 | | | |
| | 51,000 | | | TransDigm, Inc.
7.7500%, 12/15/18 | | | 53,677 | | | |
| | | | | | | | 146,438 | | | |
| Agricultural Chemicals – 0.1% | | | | | | |
| | 36,000 | | | Phibro Animal Health Corp.
9.2500%, 7/1/18 (144A) | | | 38,700 | | | |
| Airlines – 0.1% | | | | | | |
| | 53,000 | | | Southwest Airlines Co.
5.1250%, 3/1/17 | | | 57,138 | | | |
| Beverages – Wine and Spirits – 0% | | | | | | |
| | 13,000 | | | Constellation Brands, Inc.
3.7500%, 5/1/21 | | | 12,171 | | | |
| Building – Residential and Commercial – 0.1% | | | | | | |
| | 31,000 | | | D.R. Horton, Inc.
4.7500%, 5/15/17 | | | 32,007 | | | |
| | 9,000 | | | D.R. Horton, Inc.
4.3750%, 9/15/22 | | | 8,550 | | | |
| | 23,000 | | | Toll Brothers Finance Corp.
5.8750%, 2/15/22 | | | 24,035 | | | |
| | 15,000 | | | Toll Brothers Finance Corp.
4.3750%, 4/15/23 | | | 13,950 | | | |
| | | | | | | | 78,542 | | | |
| Casino Hotels – 0.1% | | | | | | |
| | 46,000 | | | Wynn Las Vegas LLC / Wynn Las Vegas Capital Corp.
4.2500%, 5/30/23 (144A) | | | 42,550 | | | |
| Cellular Telecommunications – 0.1% | | | | | | |
| | 81,000 | | | Sprint Nextel Corp.
7.0000%, 8/15/20 | | | 85,050 | | | |
| Chemicals – Diversified – 0.6% | | | | | | |
| | 288,000 | | | LyondellBasell Industries N.V.
5.0000%, 4/15/19 | | | 313,372 | | | |
| Chemicals – Specialty – 0.4% | | | | | | |
| | 49,000 | | | Ashland, Inc.
3.8750%, 4/15/18 (144A) | | | 48,510 | | | |
| | 50,000 | | | Ashland, Inc.
4.7500%, 8/15/22 (144A) | | | 49,500 | | | |
| | 71,000 | | | Ashland, Inc.
6.8750%, 5/15/43 (144A) | | | 72,420 | | | |
| | 61,000 | | | Ecolab, Inc.
3.0000%, 12/8/16 | | | 63,643 | | | |
| | | | | | | | 234,073 | | | |
| | | | | | | | | | | |
See Notes to Schedules of Investments and Other Information and Notes to Financial Statements.
Janus Value Funds | 57
Perkins Value Plus Income Fund
Schedule of Investments
As of June 30, 2013
| | | | | | | | | | | |
| Shares or Principal Amount | | Value | | | |
| |
| Commercial Banks – 1.0% | | | | | | |
| | $19,000 | | | CIT Group, Inc.
4.7500%, 2/15/15 (144A) | | $ | 19,309 | | | |
| | 158,000 | | | CIT Group, Inc.
4.2500%, 8/15/17 | | | 158,790 | | | |
| | 29,000 | | | CIT Group, Inc.
6.6250%, 4/1/18 (144A) | | | 31,320 | | | |
| | 129,000 | | | CIT Group, Inc.
5.5000%, 2/15/19 (144A) | | | 133,193 | | | |
| | 56,000 | | | SVB Financial Group
5.3750%, 9/15/20 | | | 61,292 | | | |
| | 52,000 | | | Zions Bancorp
4.5000%, 3/27/17 | | | 54,992 | | | |
| | 131,000 | | | Zions Bancorp
5.8000%, 12/15/99‡ | | | 123,140 | | | |
| | | | | | | | 582,036 | | | |
| Computer Aided Design – 0.2% | | | | | | |
| | 38,000 | | | Autodesk, Inc.
1.9500%, 12/15/17 | | | 37,074 | | | |
| | 57,000 | | | Autodesk, Inc.
3.6000%, 12/15/22 | | | 54,404 | | | |
| | | | | | | | 91,478 | | | |
| Consulting Services – 0.7% | | | | | | |
| | 49,000 | | | Verisk Analytics, Inc.
4.8750%, 1/15/19 | | | 52,508 | | | |
| | 214,000 | | | Verisk Analytics, Inc.
5.8000%, 5/1/21 | | | 236,204 | | | |
| | 87,000 | | | Verisk Analytics, Inc.
4.1250%, 9/12/22 | | | 86,448 | | | |
| | | | | | | | 375,160 | | | |
| Data Processing and Management – 0.1% | | | | | | |
| | 37,000 | | | Fiserv, Inc.
3.1250%, 10/1/15 | | | 38,595 | | | |
| | 26,000 | | | Fiserv, Inc.
3.1250%, 6/15/16 | | | 27,112 | | | |
| | | | | | | | 65,707 | | | |
| Dialysis Centers – 0.1% | | | | | | |
| | 41,000 | | | Fresenius Medical Care U.S. Finance II, Inc.
5.8750%, 1/31/22 (144A),** | | | 43,153 | | | |
| Diversified Banking Institutions – 1.8% | | | | | | |
| | 15,000 | | | Bank of America Corp.
4.5000%, 4/1/15 | | | 15,734 | | | |
| | 72,000 | | | Bank of America Corp.
1.5000%, 10/9/15 | | | 71,836 | | | |
| | 60,000 | | | Bank of America Corp.
3.6250%, 3/17/16 | | | 62,676 | | | |
| | 90,000 | | | Bank of America Corp.
3.7500%, 7/12/16 | | | 94,346 | | | |
| | 36,000 | | | Bank of America Corp.
2.0000%, 1/11/18 | | | 34,870 | | | |
| | 68,000 | | | Bank of America Corp.
8.0000%, 7/30/99‡ | | | 75,735 | | | |
| | 12,000 | | | Bank of America Corp.
8.1250%, 11/15/99‡ | | | 13,500 | | | |
| | 72,000 | | | Citigroup, Inc.
5.0000%, 9/15/14 | | | 74,824 | | | |
| | 59,000 | | | Citigroup, Inc.
5.3500%, 11/15/99‡ | | | 55,313 | | | |
| | 34,000 | | | Goldman Sachs Group, Inc.
5.6250%, 1/15/17 | | | 36,849 | | | |
| | 213,000 | | | Goldman Sachs Group, Inc.
2.3750%, 1/22/18 | | | 209,130 | | | |
| | 100,000 | | | Morgan Stanley
3.4500%, 11/2/15 | | | 103,186 | | | |
| | 30,000 | | | Morgan Stanley
4.7500%, 3/22/17 | | | 31,820 | | | |
| | 102,000 | | | Morgan Stanley
2.1250%, 4/25/18 | | | 97,617 | | | |
| | 15,000 | | | Royal Bank of Scotland Group PLC
2.5500%, 9/18/15** | | | 15,251 | | | |
| | 54,000 | | | Royal Bank of Scotland Group PLC
6.1000%, 6/10/23** | | | 51,231 | | | |
| | | | | | | | 1,043,918 | | | |
| Diversified Financial Services – 0.7% | | | | | | |
| | 53,000 | | | Carlyle Holdings Finance LLC
3.8750%, 2/1/23 (144A) | | | 51,293 | | | |
| | 7,000 | | | General Electric Capital Corp.
6.3750%, 11/15/67‡ | | | 7,280 | | | |
| | 100,000 | | | General Electric Capital Corp.
6.2500%, 12/15/99‡ | | | 106,250 | | | |
| | 200,000 | | | General Electric Capital Corp.
7.1250%, 12/15/99‡ | | | 226,000 | | | |
| | | | | | | | 390,823 | | | |
| Diversified Minerals – 0.1% | | | | | | |
| | 68,000 | | | FMG Resources (August 2006) Pty, Ltd.
7.0000%, 11/1/15 (144A) | | | 68,680 | | | |
| Diversified Operations – 0.4% | | | | | | |
| | 45,000 | | | Danaher Corp.
2.3000%, 6/23/16 | | | 46,529 | | | |
| | 33,000 | | | GE Capital Trust I
6.3750%, 11/15/67‡ | | | 34,196 | | | |
| | 124,000 | | | Ingersoll-Rand Global Holding Co., Ltd.
4.2500%, 6/15/23 (144A) | | | 123,221 | | | |
| | | | | | | | 203,946 | | | |
| Electric – Generation – 0% | | | | | | |
| | 9,000 | | | AES Corp.
7.7500%, 10/15/15 | | | 9,923 | | | |
| Electric – Integrated – 0.5% | | | | | | |
| | 51,000 | | | CMS Energy Corp.
4.2500%, 9/30/15 | | | 54,089 | | | |
| | 38,000 | | | CMS Energy Corp.
5.0500%, 2/15/18 | | | 42,212 | | | |
| | 39,000 | | | Great Plains Energy, Inc.
4.8500%, 6/1/21 | | | 41,423 | | | |
| | 78,000 | | | PPL Energy Supply LLC
4.6000%, 12/15/21 | | | 79,375 | | | |
| | 46,000 | | | PPL WEM Holdings PLC
3.9000%, 5/1/16 (144A) | | | 48,074 | | | |
| | 32,000 | | | PPL WEM Holdings PLC
5.3750%, 5/1/21 (144A) | | | 35,092 | | | |
| | | | | | | | 300,265 | | | |
| Electronic Components – Semiconductors – 0.4% | | | | | | |
| | 214,000 | | | Samsung Electronics America, Inc.
1.7500%, 4/10/17 (144A) | | | 211,967 | | | |
| | | | | | | | | | | |
See Notes to Schedules of Investments and Other Information and Notes to Financial Statements.
58 | JUNE 30, 2013
Schedule of Investments
As of June 30, 2013
| | | | | | | | | | | |
| Shares or Principal Amount | | Value | | | |
| |
| Electronic Connectors – 0.1% | | | | | | |
| | $43,000 | | | Amphenol Corp.
4.0000%, 2/1/22 | | $ | 42,912 | | | |
| Electronic Measuring Instruments – 0.3% | | | | | | |
| | 60,000 | | | Agilent Technologies, Inc.
2.5000%, 7/15/13 | | | 60,037 | | | |
| | 84,000 | | | FLIR Systems, Inc.
3.7500%, 9/1/16 | | | 86,823 | | | |
| | | | | | | | 146,860 | | | |
| Engineering – Research and Development Services – 0.2% | | | | | | |
| | 60,000 | | | URS Corp.
4.3500%, 4/1/17 (144A) | | | 61,124 | | | |
| | 59,000 | | | URS Corp.
5.5000%, 4/1/22 (144A) | | | 60,882 | | | |
| | | | | | | | 122,006 | | | |
| Finance – Auto Loans – 1.3% | | | | | | |
| | 200,000 | | | Ford Motor Credit Co. LLC
3.8750%, 1/15/15 | | | 206,149 | | | |
| | 210,000 | | | Ford Motor Credit Co. LLC
6.6250%, 8/15/17 | | | 237,677 | | | |
| | 200,000 | | | Ford Motor Credit Co. LLC
5.8750%, 8/2/21 | | | 218,050 | | | |
| | 39,000 | | | General Motors Financial Co., Inc.
3.2500%, 5/15/18 (144A) | | | 37,927 | | | |
| | 54,000 | | | General Motors Financial Co., Inc.
4.2500%, 5/15/23 (144A) | | | 50,287 | | | |
| | | | | | | | 750,090 | | | |
| Finance – Credit Card – 0.2% | | | | | | |
| | 67,000 | | | American Express Co.
6.8000%, 9/1/66‡ | | | 71,523 | | | |
| | 46,000 | | | American Express Credit Corp.
1.7500%, 6/12/15 | | | 46,624 | | | |
| | | | | | | | 118,147 | | | |
| Finance – Investment Bankers/Brokers – 0.7% | | | | | | |
| | 75,000 | | | Charles Schwab Corp.
7.0000%, 8/1/99‡ | | | 83,625 | | | |
| | 51,000 | | | Lazard Group LLC
7.1250%, 5/15/15 | | | 55,379 | | | |
| | 13,000 | | | Lazard Group LLC
6.8500%, 6/15/17 | | | 14,541 | | | |
| | 215,000 | | | Raymond James Financial, Inc.
5.6250%, 4/1/24 | | | 226,445 | | | |
| | | | | | | | 379,990 | | | |
| Finance – Leasing Companies – 0.3% | | | | | | |
| | 200,000 | | | LeasePlan Corp. N.V.
2.5000%, 5/16/18 (144A),** | | | 192,742 | | | |
| Finance – Mortgage Loan Banker – 0.2% | | | | | | |
| | 100,000 | | | Northern Rock Asset Management PLC
5.6250%, 6/22/17 (144A),** | | | 113,232 | | | |
| Finance – Other Services – 0.1% | | | | | | |
| | 53,000 | | | CNH Capital LLC
3.6250%, 4/15/18 (144A) | | | 50,483 | | | |
| Food – Meat Products – 0.3% | | | | | | |
| | 100,000 | | | Tyson Foods, Inc.
6.6000%, 4/1/16 | | | 112,954 | | | |
| | 78,000 | | | Tyson Foods, Inc.
4.5000%, 6/15/22 | | | 79,702 | | | |
| | | | | | | | 192,656 | | | |
| Food – Miscellaneous/Diversified – 0.5% | | | | | | |
| | 25,000 | | | Hawk Acquisition Sub, Inc.
4.2500%, 10/15/20 (144A) | | | 23,906 | | | |
| | 232,000 | | | Kraft Foods Group, Inc.
2.2500%, 6/5/17 | | | 233,628 | | | |
| | | | | | | | 257,534 | | | |
| Food – Retail – 0.2% | | | | | | |
| | 22,000 | | | Safeway, Inc.
3.9500%, 8/15/20 | | | 21,573 | | | |
| | 99,000 | | | Safeway, Inc.
4.7500%, 12/1/21 | | | 100,865 | | | |
| | | | | | | | 122,438 | | | |
| Hotels and Motels – 0.2% | | | | | | |
| | 50,000 | | | Starwood Hotels & Resorts Worldwide, Inc.
6.7500%, 5/15/18 | | | 59,118 | | | |
| | 50,000 | | | Starwood Hotels & Resorts Worldwide, Inc.
7.1500%, 12/1/19 | | | 60,389 | | | |
| | | | | | | | 119,507 | | | |
| Investment Management and Advisory Services – 0.4% | | | | | | |
| | 65,000 | | | Ameriprise Financial, Inc.
7.5180%, 6/1/66‡ | | | 71,012 | | | |
| | 100,000 | | | Neuberger Berman Group LLC / Neuberger Berman Finance Corp.
5.6250%, 3/15/20 (144A) | | | 103,500 | | | |
| | 60,000 | | | Neuberger Berman Group LLC / Neuberger Berman Finance Corp.
5.8750%, 3/15/22 (144A) | | | 61,200 | | | |
| | | | | | | | 235,712 | | | |
| Life and Health Insurance – 0.3% | | | | | | |
| | 152,000 | | | Primerica, Inc.
4.7500%, 7/15/22 | | | 160,827 | | | |
| Linen Supply & Related Items – 0.1% | | | | | | |
| | 31,000 | | | Cintas Corp. No. 2
2.8500%, 6/1/16 | | | 32,364 | | | |
| | 34,000 | | | Cintas Corp. No. 2
4.3000%, 6/1/21 | | | 35,605 | | | |
| | | | | | | | 67,969 | | | |
| Medical – Biomedical and Genetic – 0.3% | | | | | | |
| | 12,000 | | | Bio-Rad Laboratories, Inc.
8.0000%, 9/15/16 | | | 12,557 | | | |
| | 142,000 | | | Life Technologies Corp.
6.0000%, 3/1/20 | | | 159,973 | | | |
| | | | | | | | 172,530 | | | |
| Medical – Drugs – 0.4% | | | | | | |
| | 114,000 | | | AbbVie, Inc.
1.7500%, 11/6/17 (144A) | | | 111,688 | | | |
| | 19,000 | | | AbbVie, Inc.
2.0000%, 11/6/18 (144A) | | | 18,423 | | | |
| | 90,000 | | | VPII Escrow Corp.
6.7500%, 8/15/18 (144A) | | | 92,250 | | | |
| | | | | | | | 222,361 | | | |
| | | | | | | | | | | |
See Notes to Schedules of Investments and Other Information and Notes to Financial Statements.
Janus Value Funds | 59
Perkins Value Plus Income Fund
Schedule of Investments
As of June 30, 2013
| | | | | | | | | | | |
| Shares or Principal Amount | | Value | | | |
| |
| Medical – Generic Drugs – 0.2% | | | | | | |
| | $119,000 | | | Actavis, Inc.
1.8750%, 10/1/17 | | $ | 116,008 | | | |
| Metal Processors and Fabricators – 0.2% | | | | | | |
| | 91,000 | | | Precision Castparts Corp.
1.2500%, 1/15/18 | | | 88,471 | | | |
| Multi-Line Insurance – 0.8% | | | | | | |
| | 94,000 | | | American International Group, Inc.
4.2500%, 9/15/14 | | | 97,482 | | | |
| | 26,000 | | | American International Group, Inc.
5.6000%, 10/18/16 | | | 28,972 | | | |
| | 47,000 | | | American International Group, Inc.
5.4500%, 5/18/17 | | | 51,810 | | | |
| | 129,000 | | | American International Group, Inc.
8.1750%, 5/15/58‡ | | | 157,380 | | | |
| | 48,000 | | | ING U.S., Inc.
2.9000%, 2/15/18 (144A) | | | 48,241 | | | |
| | 56,000 | | | ING U.S., Inc.
5.6500%, 5/15/53 (144A),‡ | | | 52,640 | | | |
| | 10,000 | | | Loews Corp.
2.6250%, 5/15/23 | | | 9,096 | | | |
| | | | | | | | 445,621 | | | |
| Oil – Field Services – 0.4% | | | | | | |
| | 200,000 | | | Korea National Oil Corp.
4.0000%, 10/27/16 (144A) | | | 211,501 | | | |
| Oil and Gas Drilling – 0.3% | | | | | | |
| | 100,000 | | | Nabors Industries, Inc.
5.0000%, 9/15/20 | | | 101,941 | | | |
| | 43,000 | | | Rowan Cos., Inc.
5.0000%, 9/1/17 | | | 46,474 | | | |
| | | | | | | | 148,415 | | | |
| Oil Companies – Exploration and Production – 1.6% | | | | | | |
| | 250,000 | | | Chesapeake Energy Corp.
5.3750%, 6/15/21 | | | 248,750 | | | |
| | 81,000 | | | Cimarex Energy Co.
5.8750%, 5/1/22 | | | 83,835 | | | |
| | 15,000 | | | Continental Resources, Inc.
7.1250%, 4/1/21 | | | 16,500 | | | |
| | 160,000 | | | Continental Resources, Inc.
5.0000%, 9/15/22 | | | 162,800 | | | |
| | 39,000 | | | Occidental Petroleum Corp.
1.7500%, 2/15/17 | | | 38,969 | | | |
| | 53,000 | | | Petrohawk Energy Corp.
10.5000%, 8/1/14 | | | 55,703 | | | |
| | 128,000 | | | Petrohawk Energy Corp.
7.8750%, 6/1/15 | | | 130,752 | | | |
| | 37,000 | | | Plains Exploration & Production Co.
6.5000%, 11/15/20 | | | 39,228 | | | |
| | 117,000 | | | Plains Exploration & Production Co.
6.8750%, 2/15/23 | | | 125,178 | | | |
| | | | | | | | 901,715 | | | |
| Oil Companies – Integrated – 0.1% | | | | | | |
| | 35,000 | | | Phillips 66
2.9500%, 5/1/17 | | | 36,072 | | | |
| Oil Refining and Marketing – 0.1% | | | | | | |
| | 50,000 | | | Motiva Enterprises LLC
5.7500%, 1/15/20 (144A) | | | 57,057 | | | |
| Pharmacy Services – 0.7% | | | | | | |
| | 75,000 | | | Express Scripts Holding Co.
2.1000%, 2/12/15 | | | 76,274 | | | |
| | 55,000 | | | Express Scripts Holding Co.
3.1250%, 5/15/16 | | | 57,192 | | | |
| | 258,000 | | | Express Scripts Holding Co.
2.6500%, 2/15/17 | | | 262,709 | | | |
| | | | | | | | 396,175 | | | |
| Pipelines – 1.5% | | | | | | |
| | 50,000 | | | Crosstex Energy L.P. / Crosstex Energy Finance Corp.
8.8750%, 2/15/18 | | | 53,000 | | | |
| | 37,000 | | | DCP Midstream Operating L.P.
3.2500%, 10/1/15 | | | 38,347 | | | |
| | 120,000 | | | DCP Midstream Operating L.P.
4.9500%, 4/1/22 | | | 123,003 | | | |
| | 90,000 | | | El Paso LLC
7.0000%, 6/15/17 | | | 97,844 | | | |
| | 50,000 | | | El Paso Pipeline Partners Operating Co. LLC
6.5000%, 4/1/20 | | | 57,871 | | | |
| | 37,000 | | | El Paso Pipeline Partners Operating Co. LLC
5.0000%, 10/1/21 | | | 39,698 | | | |
| | 151,000 | | | Kinder Morgan Finance Co. LLC
5.7000%, 1/5/16 | | | 161,735 | | | |
| | 50,000 | | | Plains All American Pipeline L.P. / PAA Finance Corp.
3.9500%, 9/15/15 | | | 53,030 | | | |
| | 157,000 | | | Western Gas Partners L.P.
5.3750%, 6/1/21 | | | 168,470 | | | |
| | 61,000 | | | Williams Cos., Inc.
3.7000%, 1/15/23 | | | 56,674 | | | |
| | | | | | | | 849,672 | | | |
| Publishing – Newspapers – 0% | | | | | | |
| | 6,000 | | | Gannett Co., Inc.
6.3750%, 9/1/15 | | | 6,480 | | | |
| Publishing – Periodicals – 0.1% | | | | | | |
| | 58,000 | | | UBM PLC
5.7500%, 11/3/20 (144A),** | | | 58,797 | | | |
| Real Estate Management/Services – 0.2% | | | | | | |
| | 23,000 | | | CBRE Services, Inc.
6.6250%, 10/15/20 | | | 24,265 | | | |
| | 102,000 | | | Jones Lang LaSalle, Inc.
4.4000%, 11/15/22 | | | 100,090 | | | |
| | | | | | | | 124,355 | | | |
| Real Estate Operating/Development – 0.1% | | | | | | |
| | 37,000 | | | Post Apartment Homes L.P.
4.7500%, 10/15/17 | | | 39,872 | | | |
| REIT – Diversified – 0.9% | | | | | | |
| | 88,000 | | | American Tower Trust I
1.5510%, 3/15/18 (144A) | | | 86,476 | | | |
| | 181,000 | | | American Tower Trust I
3.0700%, 3/15/23 (144A) | | | 172,879 | | | |
| | 250,000 | | | Goodman Funding Pty, Ltd.
6.3750%, 4/15/21 (144A) | | | 279,981 | | | |
| | | | | | | | 539,336 | | | |
| REIT – Health Care – 0.1% | | | | | | |
| | 27,000 | | | Senior Housing Properties Trust
6.7500%, 12/15/21 | | | 29,829 | | | |
| | | | | | | | | | | |
See Notes to Schedules of Investments and Other Information and Notes to Financial Statements.
60 | JUNE 30, 2013
Schedule of Investments
As of June 30, 2013
| | | | | | | | | | | |
| Shares or Principal Amount | | Value | | | |
| |
| REIT – Hotels – 0.1% | | | | | | |
| | $24,000 | | | Host Hotels & Resorts L.P.
6.7500%, 6/1/16 | | $ | 24,355 | | | |
| | 18,000 | | | Host Hotels & Resorts L.P.
3.7500%, 10/15/23 | | | 16,509 | | | |
| | | | | | | | 40,864 | | | |
| REIT – Office Property – 0.6% | | | | | | |
| | 120,000 | | | Alexandria Real Estate Equities, Inc.
4.6000%, 4/1/22 | | | 122,295 | | | |
| | 210,000 | | | SL Green Realty Corp. / SL Green Operating Partnership / Reckson Operating Partnership
5.0000%, 8/15/18 | | | 223,588 | | | |
| | | | | | | | 345,883 | | | |
| Retail – Regional Department Stores – 0% | | | | | | |
| | 21,000 | | | Macy’s Retail Holdings, Inc.
5.9000%, 12/1/16 | | | 23,855 | | | |
| Retail – Restaurants – 0.2% | | | | | | |
| | 144,000 | | | Brinker International, Inc.
3.8750%, 5/15/23 | | | 135,044 | | | |
| Retail – Toy Store – 0.1% | | | | | | |
| | 50,000 | | | Toys R Us Property Co. II LLC
8.5000%, 12/1/17 | | | 51,938 | | | |
| Security Services – 0.3% | | | | | | |
| | 198,000 | | | ADT Corp.
4.1250%, 6/15/23 | | | 186,498 | | | |
| Semiconductor Components/Integrated Circuits – 0.4% | | | | | | |
| | 250,000 | | | TSMC Global, Ltd.
1.6250%, 4/3/18 (144A) | | | 240,337 | | | |
| Steel – Producers – 0.2% | | | | | | |
| | 48,000 | | | ArcelorMittal
5.0000%, 2/25/17** | | | 48,600 | | | |
| | 35,000 | | | Reliance Steel & Aluminum Co.
4.5000%, 4/15/23 | | | 33,193 | | | |
| | 34,000 | | | Steel Dynamics, Inc.
5.2500%, 4/15/23 (144A) | | | 33,320 | | | |
| | | | | | | | 115,113 | | | |
| Super-Regional Banks – 0.1% | | | | | | |
| | 37,000 | | | Wells Fargo & Co.
7.9800%, 9/15/99‡ | | | 41,810 | | | |
| Telecommunication Services – 0.1% | | | | | | |
| | 50,000 | | | SBA Tower Trust
2.9330%, 12/15/17 (144A) | | | 50,458 | | | |
| Telephone – Integrated – 0.3% | | | | | | |
| | 124,000 | | | Qwest Communications International, Inc.
7.1250%, 4/1/18 | | | 128,650 | | | |
| | 35,000 | | | Sprint Capital Corp.
6.9000%, 5/1/19 | | | 36,400 | | | |
| | | | | | | | 165,050 | | | |
| Transportation – Services – 0% | | | | | | |
| | 7,000 | | | Asciano Finance, Ltd.
3.1250%, 9/23/15 (144A) | | | 7,153 | | | |
| Transportation – Truck – 0.1% | | | | | | |
| | 55,000 | | | JB Hunt Transport Services, Inc.
3.3750%, 9/15/15 | | | 57,342 | | | |
| Trucking and Leasing – 0.2% | | | | | | |
| | 13,000 | | | Penske Truck Leasing Co. L.P. / PTL Finance Corp.
2.5000%, 3/15/16 (144A) | | | 13,223 | | | |
| | 92,000 | | | Penske Truck Leasing Co. L.P. / PTL Finance Corp.
3.3750%, 3/15/18 (144A) | | | 94,588 | | | |
| | 34,000 | | | Penske Truck Leasing Co. L.P. / PTL Finance Corp.
4.2500%, 1/17/23 (144A) | | | 33,610 | | | |
| | | | | | | | 141,421 | | | |
| |
| |
| Total Corporate Bonds (cost $13,320,924) | | | 13,515,228 | | | |
| |
| |
| Mortgage-Backed Securities – 9.3% | | | | | | |
| | | | | Fannie Mae: | | | | | | |
| | 21,468 | | | 5.5000%, 1/1/25 | | | 23,172 | | | |
| | 45,682 | | | 5.5000%, 7/1/25 | | | 49,245 | | | |
| | 64,588 | | | 5.0000%, 9/1/29 | | | 69,938 | | | |
| | 22,883 | | | 5.0000%, 1/1/30 | | | 24,804 | | | |
| | 12,709 | | | 5.5000%, 1/1/33 | | | 14,016 | | | |
| | 34,556 | | | 5.0000%, 9/1/33 | | | 38,586 | | | |
| | 8,925 | | | 5.0000%, 11/1/33 | | | 9,656 | | | |
| | 18,688 | | | 5.0000%, 12/1/33 | | | 20,217 | | | |
| | 10,113 | | | 5.0000%, 2/1/34 | | | 10,940 | | | |
| | 143,455 | | | 5.5000%, 7/1/35 | | | 157,285 | | | |
| | 27,683 | | | 5.0000%, 10/1/35 | | | 29,835 | | | |
| | 68,914 | | | 6.0000%, 12/1/35 | | | 76,950 | | | |
| | 28,619 | | | 5.5000%, 1/1/36 | | | 31,213 | | | |
| | 9,516 | | | 6.0000%, 2/1/37 | | | 10,687 | | | |
| | 16,569 | | | 6.0000%, 5/1/37 | | | 18,030 | | | |
| | 15,455 | | | 5.5000%, 7/1/37 | | | 16,762 | | | |
| | 93,278 | | | 6.0000%, 9/1/37 | | | 102,034 | | | |
| | 16,178 | | | 5.5000%, 3/1/38 | | | 17,836 | | | |
| | 62,884 | | | 6.0000%, 10/1/38 | | | 70,679 | | | |
| | 17,174 | | | 6.0000%, 11/1/38 | | | 18,688 | | | |
| | 28,747 | | | 7.0000%, 2/1/39 | | | 32,268 | | | |
| | 20,658 | | | 6.0000%, 10/1/39 | | | 22,875 | | | |
| | 53,447 | | | 5.0000%, 2/1/40 | | | 58,527 | | | |
| | 35,053 | | | 6.0000%, 4/1/40 | | | 38,145 | | | |
| | 25,268 | | | 5.0000%, 6/1/40 | | | 27,870 | | | |
| | 53,249 | | | 5.0000%, 6/1/40 | | | 58,261 | | | |
| | 70,819 | | | 5.0000%, 6/1/40 | | | 77,848 | | | |
| | 116,905 | | | 6.0000%, 7/1/40 | | | 130,394 | | | |
| | 16,940 | | | 4.5000%, 10/1/40 | | | 18,252 | | | |
| | 168,347 | | | 5.0000%, 2/1/41 | | | 184,261 | | | |
| | 17,219 | | | 5.0000%, 3/1/41 | | | 19,004 | | | |
| | 27,862 | | | 4.5000%, 4/1/41 | | | 30,081 | | | |
| | 33,628 | | | 5.0000%, 4/1/41 | | | 36,809 | | | |
| | 47,782 | | | 5.0000%, 4/1/41 | | | 52,748 | | | |
| | 45,844 | | | 4.5000%, 5/1/41 | | | 49,673 | | | |
| | 26,351 | | | 5.0000%, 5/1/41 | | | 29,094 | | | |
| | 34,987 | | | 5.0000%, 5/1/41 | | | 39,000 | | | |
| | 97,391 | | | 4.5000%, 6/1/41 | | | 105,461 | | | |
| | 51,740 | | | 5.0000%, 6/1/41 | | | 56,574 | | | |
| | 261,806 | | | 5.0000%, 6/1/41 | | | 291,653 | | | |
| | 23,690 | | | 5.0000%, 7/1/41 | | | 25,964 | | | |
| | 68,555 | | | 5.0000%, 7/1/41 | | | 75,072 | | | |
| | 317,279 | | | 4.5000%, 8/1/41 | | | 345,859 | | | |
| | 33,897 | | | 5.0000%, 10/1/41 | | | 36,930 | | | |
| | | | | Freddie Mac: | | | | | | |
| | 19,646 | | | 5.0000%, 1/1/19 | | | 20,765 | | | |
| | 14,043 | | | 5.0000%, 2/1/19 | | | 14,842 | | | |
See Notes to Schedules of Investments and Other Information and Notes to Financial Statements.
Janus Value Funds | 61
Perkins Value Plus Income Fund
Schedule of Investments
As of June 30, 2013
| | | | | | | | | | | |
| Shares or Principal Amount | | Value | | | |
| |
| Mortgage-Backed Securities – (continued) | | | | | | |
| | | | | Freddie Mac: (continued) | | | | | | |
| | $19,003 | | | 5.5000%, 8/1/19 | | $ | 20,300 | | | |
| | 30,165 | | | 5.0000%, 6/1/20 | | | 32,315 | | | |
| | 62,797 | | | 5.5000%, 12/1/28 | | | 68,693 | | | |
| | 82,082 | | | 5.0000%, 1/1/36 | | | 90,826 | | | |
| | 43,363 | | | 5.5000%, 10/1/36 | | | 47,927 | | | |
| | 25,000 | | | 5.0000%, 11/1/36 | | | 26,735 | | | |
| | 34,732 | | | 6.0000%, 1/1/38 | | | 37,721 | | | |
| | 12,724 | | | 5.5000%, 5/1/38 | | | 13,870 | | | |
| | 204,382 | | | 6.0000%, 11/1/38 | | | 228,863 | | | |
| | 70,804 | | | 5.0000%, 5/1/39 | | | 77,268 | | | |
| | 39,202 | | | 5.5000%, 10/1/39 | | | 42,874 | | | |
| | 42,788 | | | 4.5000%, 1/1/41 | | | 45,898 | | | |
| | 92,348 | | | 5.0000%, 5/1/41 | | | 101,404 | | | |
| | 28,808 | | | 5.0000%, 9/1/41 | | | 31,150 | | | |
| | | | | Ginnie Mae: | | | | | | |
| | 55,971 | | | 5.1000%, 12/15/29 | | | 63,107 | | | |
| | 32,753 | | | 6.0000%, 11/20/34 | | | 36,516 | | | |
| | 10,564 | | | 5.5000%, 9/15/35 | | | 11,851 | | | |
| | 12,891 | | | 5.5000%, 5/20/36 | | | 14,194 | | | |
| | 23,026 | | | 6.0000%, 1/20/39 | | | 25,885 | | | |
| | 23,734 | | | 5.0000%, 4/15/39 | | | 25,723 | | | |
| | 161,455 | | | 5.5000%, 8/15/39 | | | 182,090 | | | |
| | 32,802 | | | 5.0000%, 10/15/39 | | | 35,932 | | | |
| | 55,078 | | | 5.0000%, 11/15/39 | | | 60,962 | | | |
| | 15,802 | | | 5.0000%, 1/15/40 | | | 17,490 | | | |
| | 11,739 | | | 5.0000%, 4/15/40 | | | 12,994 | | | |
| | 18,412 | | | 5.0000%, 4/15/40 | | | 20,662 | | | |
| | 22,049 | | | 5.0000%, 5/15/40 | | | 24,246 | | | |
| | 29,295 | | | 5.0000%, 5/20/40 | | | 32,273 | | | |
| | 8,241 | | | 5.0000%, 7/15/40 | | | 9,122 | | | |
| | 54,870 | | | 5.0000%, 7/15/40 | | | 60,732 | | | |
| | 55,698 | | | 5.0000%, 2/15/41 | | | 61,135 | | | |
| | 21,684 | | | 5.0000%, 5/15/41 | | | 23,936 | | | |
| | 12,898 | | | 4.5000%, 7/15/41 | | | 13,837 | | | |
| | 52,542 | | | 4.5000%, 7/15/41 | | | 56,299 | | | |
| | 123,947 | | | 4.5000%, 8/15/41 | | | 135,228 | | | |
| | 16,899 | | | 5.0000%, 9/15/41 | | | 18,436 | | | |
| | 9,466 | | | 5.5000%, 9/20/41 | | | 10,368 | | | |
| | 105,243 | | | 5.0000%, 10/15/41 | | | 114,156 | | | |
| | 64,911 | | | 4.5000%, 10/20/41 | | | 69,394 | | | |
| | 38,893 | | | 5.0000%, 10/20/41 | | | 42,331 | | | |
| | 9,503 | | | 6.0000%, 10/20/41 | | | 10,662 | | | |
| | 30,286 | | | 6.0000%, 12/20/41 | | | 33,992 | | | |
| | 27,862 | | | 6.0000%, 1/20/42 | | | 31,259 | | | |
| | 28,099 | | | 6.0000%, 2/20/42 | | | 31,525 | | | |
| | 16,930 | | | 6.0000%, 3/20/42 | | | 18,986 | | | |
| | 49,707 | | | 6.0000%, 4/20/42 | | | 55,744 | | | |
| | 22,277 | | | 3.5000%, 5/20/42 | | | 23,014 | | | |
| | 39,204 | | | 6.0000%, 5/20/42 | | | 43,994 | | | |
| | 101,601 | | | 5.5000%, 7/20/42 | | | 111,420 | | | |
| | 26,171 | | | 6.0000%, 7/20/42 | | | 29,370 | | | |
| | 27,843 | | | 6.0000%, 8/20/42 | | | 31,244 | | | |
| | 33,626 | | | 6.0000%, 9/20/42 | | | 37,710 | | | |
| | 24,714 | | | 6.0000%, 11/20/42 | | | 27,738 | | | |
| | 28,344 | | | 6.0000%, 2/20/43 | | | 31,787 | | | |
| |
| |
| Total Mortgage-Backed Securities (cost $5,298,735) | | | 5,251,991 | | | |
| |
| |
| Preferred Stock – 0.3% | | | | | | |
| Diversified Financial Services – 0.1% | | | | | | |
| | 1,500 | | | Citigroup Capital XIII, 7.8750% | | | 41,775 | | | |
| Electric – Integrated – 0.1% | | | | | | |
| | 600 | | | PPL Corp., 8.7500% | | | 32,412 | | | |
| Finance – Credit Card – 0.1% | | | | | | |
| | 4,275 | | | Discover Financial Services, 6.5000% | | | 107,302 | | | |
| |
| |
| Total Preferred Stock (cost $178,973) | | | 181,489 | | | |
| |
| |
| U.S. Treasury Notes/Bonds – 8.1% | | | | | | |
| | | | | U.S. Treasury Notes/Bonds: | | | | | | |
| | $570,000 | | | 0.1250%, 12/31/14 | | | 568,976 | | | |
| | 1,710,000 | | | 0.1250%, 4/30/15 | | | 1,703,521 | | | |
| | 1,155,000 | | | 0.2500%, 5/31/15 | | | 1,152,969 | | | |
| | 875,000 | | | 0.3750%, 2/15/16 | | | 871,104 | | | |
| | 111,000 | | | 1.7500%, 5/15/23 | | | 103,958 | | | |
| | 243,000 | | | 2.8750%, 5/15/43 | | | 215,055 | | | |
| |
| |
| Total U.S. Treasury Notes/Bonds (cost $4,620,175) | | | 4,615,583 | | | |
| |
| |
| Money Market – 0.6% | | | | | | |
| | 368,000 | | | Janus Cash Liquidity Fund LLC, 0%£
(cost $368,000) | | | 368,000 | | | |
| |
| |
| Total Investments (total cost $52,888,253) – 100.0% | | | 56,673,676 | | | |
| |
| |
| Liabilities, net of Cash, Receivables and Other Assets– (0.0)% | | | (11,241) | | | |
| |
| |
| Net Assets – 100% | | $ | 56,662,435 | | | |
| |
| |
Summary of Investments by Country – (Long Positions) (unaudited)
| | | | | | | | | |
| | | | | | % of Investment
| |
| Country | | Value | | | Securities | |
| |
| |
| Australia | | $ | 355,814 | | | | 0.6% | |
| Canada | | | 450,068 | | | | 0.8% | |
| France | | | 864,770 | | | | 1.5% | |
| Germany | | | 160,835 | | | | 0.3% | |
| Ireland | | | 288,935 | | | | 0.5% | |
| Israel | | | 486,080 | | | | 0.9% | |
| Japan | | | 219,100 | | | | 0.4% | |
| Luxembourg | | | 48,600 | | | | 0.1% | |
| Netherlands | | | 192,742 | | | | 0.3% | |
| Norway | | | 904,456 | | | | 1.6% | |
| South Korea | | | 728,418 | | | | 1.3% | |
| Switzerland | | | 608,106 | | | | 1.1% | |
| Taiwan | | | 240,337 | | | | 0.4% | |
| United Kingdom | | | 3,227,810 | | | | 5.7% | |
United States†† | | | 47,897,605 | | | | 84.5% | |
| |
| |
| Total | | $ | 56,673,676 | | | | 100.0% | |
| | | |
| †† | | Includes Cash Equivalents of 0.6%. |
See Notes to Schedules of Investments and Other Information and Notes to Financial Statements.
62 | JUNE 30, 2013
Schedule of Investments
As of June 30, 2013
Forward Currency Contracts, Open
| | | | | | | | | | | | | |
| | | | | | | | | Unrealized
| |
| | | Currency Units
| | | Currency
| | | Appreciation/
| |
| Counterparty/Currency and Settlement Date | | Sold | | | Value U.S. $ | | | (Depreciation) | |
| | |
| Credit Suisse Securities (USA) LLC: | | | | | | | | | | | | |
| British Pound 8/8/13 | | | 55,000 | | | $ | 83,615 | | | $ | 294 | |
| Euro 8/8/13 | | | 149,000 | | | | 193,955 | | | | (164) | |
| |
| |
| | | | | | | | 277,570 | | | | 130 | |
| |
| |
| HSBC Securities (USA), Inc.: | | | | | | | | | | | | |
| British Pound 8/15/13 | | | 1,184,000 | | | | 1,799,914 | | | | 8,889 | |
| Euro 8/15/13 | | | 800,000 | | | | 1,041,406 | | | | (6) | |
| |
| |
| | | | | | | | 2,841,320 | | | | 8,883 | |
| |
| |
| Total | | | | | | $ | 3,118,890 | | | $ | 9,013 | |
| |
| |
| | | | | |
| Schedule of Written Options – Calls | | Value | |
| | |
AbbVie, Inc.
expires July 2013
15 contracts
exercise price $47.50 | | $ | (28) | |
ADT Corp.
expires July 2013
16 contracts
exercise price $45.00 | | | (107) | |
Agilent Technologies, Inc.
expires July 2013
15 contracts
exercise price $49.00 | | | (31) | |
Altera Corp.
expires July 2013
20 contracts
exercise price $36.00 | | | (250) | |
Ameriprise Financial, Inc.
expires July 2013
8 contracts
exercise price $90.00 | | | (85) | |
Baxter International, Inc.
expires July 2013
9 contracts
exercise price $75.00 | | | (43) | |
CA, Inc.
expires July 2013
23 contracts
exercise price $30.00 | | | (344) | |
CenturyLink, Inc.
expires July 2013
18 contracts
exercise price $38.00 | | | (42) | |
Chevron Corp.
expires July 2013
5 contracts
exercise price $125.00 | | | (31) | |
Coach, Inc.
expires July 2013
11 contracts
exercise price $62.50 | | | (42) | |
Diebold, Inc.
expires July 2013
3 contracts
exercise price $35.00 | | | (85) | |
Dr. Pepper Snapple Group, Inc.
expires July 2013
14 contracts
exercise price $50.00 | | | (38) | |
Exxon Mobil Corp.
expires July 2013
7 contracts
exercise price $95.00 | | | (68) | |
Humana, Inc.
expires July 2013
8 contracts
exercise price $90.00 | | | (344) | |
Intuit, Inc.
expires July 2013
11 contracts
exercise price $65.00 | | | (552) | |
Johnson & Johnson
expires July 2013
8 contracts
exercise price $90.00 | | | (49) | |
Johnson Controls, Inc.
expires July 2013
12 contracts
exercise price $39.00 | | | (74) | |
JPMorgan Chase & Co.
expires July 2013
12 contracts
exercise price $57.50 | | | (33) | |
Manpowergroup, Inc.
expires July 2013
12 contracts
exercise price $60.00 | | | (151) | |
McDonald’s Corp.
expires July 2013
7 contracts
exercise price $105.00 | | | (22) | |
McKesson Corp.
expires July 2013
6 contracts
exercise price $120.00 | | | (302) | |
Men’s Wearhouse, Inc.
expires July 2013
18 contracts
exercise price $40.00 | | | (576) | |
Microsoft Corp.
expires July 2013
19 contracts
exercise price $38.00 | | | (21) | |
Noble Energy, Inc.
expires July 2013
11 contracts
exercise price $67.50 | | | (57) | |
See Notes to Schedules of Investments and Other Information and Notes to Financial Statements.
Janus Value Funds | 63
Perkins Value Plus Income Fund
Schedule of Investments
As of June 30, 2013
| | | | | |
| | | Value | |
| | |
| Schedule of Written Options – Calls – (continued) | |
Nordstrom, Inc.
expires July 2013
11 contracts
exercise price $65.00 | | $ | (43) | |
Occidental Petroleum Corp.
expires July 2013
7 contracts
exercise price $100.00 | | | (17) | |
Pfizer, Inc.
expires July 2013
22 contracts
exercise price $32.00 | | | (10) | |
PNC Financial Services Group, Inc.
expires July 2013
9 contracts
exercise price $75.00 | | | (435) | |
Procter & Gamble Co.
expires July 2013
8 contracts
exercise price $82.50 | | | (34) | |
Quest Diagnostics, Inc.
expires July 2013
10 contracts
exercise price $65.00 | | | (159) | |
Schlumberger, Ltd. (U.S. Shares)
expires July 2013
9 contracts
exercise price $80.00 | | | (24) | |
Stryker Corp.
expires July 2013
10 contracts
exercise price $70.00 | | | (57) | |
Tyco International, Ltd. (U.S. Shares)
expires July 2013
19 contracts
exercise price $35.00 | | | (63) | |
VF Corp.
expires July 2013
2 contracts
exercise price $200.00 | | | (221) | |
Wells Fargo & Co.
expires July 2013
16 contracts
exercise price $43.00 | | | (271) | |
Western Union Co.
expires July 2013
38 contracts
exercise price $18.00 | | | (345) | |
Xilinx, Inc.
expires July 2013
16 contracts
exercise price $44.00 | | | (46) | |
| |
| |
Total Written Options – Calls
(premiums received $10,238) | | $ | (5,100) | |
| |
| |
| Schedule of Written Options – Puts | | | |
ADT Corp.
expires July 2013
8 contracts
exercise price $35.00 | | $ | (47) | |
Apple, Inc.
expires July 2013
2 contracts
exercise price $360.00 | | | (235) | |
EMC Corp.
expires July 2013
13 contracts
exercise price $21.00 | | | (49) | |
Ensco PLC – Class A
expires July 2013
6 contracts
exercise price $50.00 | | | (31) | |
Exxon Mobil Corp.
expires July 2013
4 contracts
exercise price $80.00 | | | (18) | |
McKesson Corp.
expires July 2013
3 contracts
exercise price $100.00 | | | (13) | |
Men’s Wearhouse, Inc.
expires July 2013
9 contracts
exercise price $31.00 | | | (12) | |
| |
| |
Total Written Options – Puts
(premiums received $821) | | $ | (405) | |
| |
| |
See Notes to Schedules of Investments and Other Information and Notes to Financial Statements.
64 | JUNE 30, 2013
Notes to Schedules of Investments and Other Information
| | |
| Barclays U.S. Aggregate Bond Index | | Made up of the Barclays U.S. Government/Corporate Bond Index, Mortgage-Backed Securities Index, and Asset-Backed Securities Index, including securities that are of investment grade quality or better, have at least one year to maturity, and have an outstanding par value of at least $100 million. |
| |
| CBOE VIX Index | | The Chicago Board of Options Exchange (CBOE) Volatility Index (“VIX”) shows the market’s expectation of 30-day volatility. It is constructed using the implied volatilities of a wide range of S&P 500 index options and is a widely used measure of market risk and is often referred to as the “investor fear” gauge. |
| |
| Russell 1000® Value Index | | Measures the performance of those Russell 1000® Index companies with lower price-to-book ratios and lower forecasted growth values. |
| |
| Russell 2000® Value Index | | Measures the performance of those Russell 2000® Index companies with lower price-to-book ratios and lower forecasted growth values. |
| |
| Russell 3000® Value Index | | Measures the performance of the broad value segment of the U.S. equity universe. The index includes those Russell 3000® Index companies with lower price-to-book ratios and lower forecasted growth values. |
| |
| Russell Midcap® Value Index | | Measures the performance of those Russell Midcap® Index companies with lower price-to-book ratios and lower forecasted growth values. |
| |
| S&P 500® Index | | A commonly recognized, market-capitalization weighted index of 500 widely held equity securities, designed to measure broad U.S. equity performance. |
| |
| Value Income Index | | Value Income Index is a hypothetical internally-calculated index which combines the total returns from the Russell 1000® Value Index (50%) and the Barclays U.S. Aggregate Bond Index (50%). |
| |
| A.G. | | Aktiengesellschaft: German term for Public Limited Company. |
| |
| ADR | | American Depositary Receipt |
| |
| A.S.A. | | Allmennaksjeselskap: Norwegian term for Public Limited Company. |
| |
| ETF | | Exchange-Traded Fund |
| |
| L.P. | | Limited Partnership |
| |
| LLC | | Limited Liability Company |
| |
| N.V. | | Naamloze Vennootschap: Dutch term for Public Limited Liability Company. |
| |
| PLC | | Public Limited Company |
| |
| REIT | | Real Estate Investment Trust |
| |
| S.A. | | Sociedad Anonima: Spanish term for publicly-traded company. |
| |
| SPDR | | Standard & Poor’s Depositary Receipt |
| |
| U.S. Shares | | Securities of foreign companies trading on an American Stock Exchange. |
Repurchase agreements held by a Fund are fully collateralized, and such collateral is in the possession of the Fund’s custodian or, for tri-party agreements, the custodian designated by the agreement. The collateral is evaluated daily to ensure its market value exceeds the current market value of the repurchase agreements, including accrued interest. In the event of default on the obligation to repurchase, the Fund has the right to liquidate the collateral and apply the proceeds in satisfaction of the obligation. In the event of default or bankruptcy by the other party to the agreement, realization and/or retention of the collateral or proceeds may be subject to legal proceedings.
| | | |
| 144A | | Securities sold under Rule 144A of the Securities Act of 1933, as amended, are subject to legal and/or contractual restrictions on resale and may not be publicly sold without registration under the 1933 Act. These securities have been determined to be liquid under guidelines established by the Board of Trustees. The total value of 144A securities as of the year ended June 30, 2013 is indicated in the table below: |
| | | | | | | | | | | |
| | | | | | Value as a %
| | | |
| Fund | | Value | | | of Net Assets | | | |
| |
| Perkins Value Plus Income Fund | | $ | 3,672,724 | | | | 6.5 | % | | |
| |
| |
| | | |
| * | | Non-income producing security. |
| | | |
Janus Value Funds | 65
Notes to Schedules of Investments and Other Information (continued)
| | | |
| ** | | A portion of this security has been segregated to cover margin or segregation requirements on open futures contracts, forward currency contracts, options contracts, short sales, swap agreements, and/or securities with extended settlement dates, the value of which, as of June 30, 2013, is noted below. |
| | | | | | |
| Fund | | Aggregate Value | | |
| |
| |
| Perkins Value Plus Income Fund | | $ | 7,892,428 | | |
| |
| |
| | | |
| ‡ | | The interest rate on floating rate notes is based on an index or market interest rates and is subject to change. Rate in the security description is as of year end. |
| |
| § | Schedule of Restricted and Illiquid Securities (as of June 30, 2013) |
| | | | | | | | | | | | | |
| | | Acquisition
| | Acquisition
| | | | Value as a
| | |
| | | Date | | Cost | | Value | | % of Net Assets | | |
| |
| |
Perkins Value Plus Income Fund | | | | | | | | | | | | |
| FREMF 2010 K-SCT Mortgage Trust, 2.0000%, 1/25/20 | | 4/29/13 | | $ | 72,158 | | $ | 70,159 | | 0.1% | | |
| |
| |
The Fund has registration rights for certain restricted securities held as of June 30, 2013. The issuer incurs all registration costs.
| |
| £ | The Funds may invest in certain securities that are considered affiliated companies. As defined by the Investment Company Act of 1940, as amended, an affiliated company is one in which the fund owns 5% or more of the outstanding voting securities, or a company which is under common ownership or control. Based on the Funds’ relative ownership, the following securities were considered affiliated companies for all or some portion of the year ended June 30, 2013. Except for the value at year end, all other information in the table is for the year ended June 30, 2013. |
| | | | | | | | | | | | | | | | | | | | | | |
| | | Purchases | | Sales | | Realized
| | Dividend
| | Value
| | |
| | | Shares | | Cost | | Shares | | Cost | | Gain/(Loss) | | Income | | at 6/30/13 | | |
| |
Perkins Mid Cap Value Fund | | | | | | | | | | | | | | | | | | | | | |
Potlatch Corp.(1) | | – | | $ | – | | (827,429) | | $ | (26,807,471) | | $ | 5,003,620 | | $ | 1,953,000 | | | N/A | | |
| QLogic Corp.* | | 584,406 | | | 6,182,130 | | (5,084,606) | | | (71,329,509) | | | (18,675,494) | | | – | | $ | – | | |
STERIS Corp.(1) | | – | | | – | | (1,800,000) | | | (60,087,979) | | | 7,103,123 | | | 1,539,000 | | | N/A | | |
Washington Federal, Inc.(1) | | 310,000 | | | 4,989,323 | | (2,109,042) | | | (41,945,785) | | | (5,013,080) | | | 1,706,740 | | | N/A | | |
| WMS Industries, Inc.* | | 1,492,843 | | | 25,338,478 | | (2,926,962) | | | (53,654,351) | | | (5,233,183) | | | – | | | – | | |
| |
| |
| | | | | $ | 36,509,931 | | | | $ | (253,825,095) | | $ | (16,815,014) | | $ | 5,198,740 | | $ | – | | |
| |
| |
Perkins Small Cap Value Fund | | | | | | | | | | | | | | | | | | | | | |
Callaway Golf Co.(1) | | – | | $ | – | | (1,839,000) | | $ | (14,151,713) | | $ | (2,100,212) | | $ | 113,000 | | | N/A | | |
Kaydon Corp.(1) | | 100,000 | | | 2,320,361 | | (388,500) | | | (13,261,631) | | | (3,693,079) | | | 1,155,400 | | | N/A | | |
| MarineMax, Inc.* | | 200,000 | | | 1,440,715 | | (675,000) | | | (5,064,185) | | | 3,490,820 | | | – | | $ | 14,162,500 | | |
| Petroquest Energy, Inc.* | | – | | | – | | (3,548,000) | | | (25,566,303) | | | (8,175,989) | | | – | | | – | | |
| Sterling Construction Co., Inc.* | | – | | | – | | (213,179) | | | (3,883,205) | | | (1,547,366) | | | – | | | 8,833,500 | | |
| |
| |
| | | | | $ | 3,761,076 | | | | $ | (61,927,037) | | $ | (12,025,826) | | $ | 1,268,400 | | $ | 22,996,000 | | |
| |
| |
Perkins Value Plus Income Fund | | | | | | | | | | | | | | | | | | | | | |
| Janus Cash Liquidity Fund LLC | | 21,445,889 | | $ | 21,445,889 | | (21,507,781) | | $ | (21,507,781) | | $ | – | | $ | 1,911 | | $ | 368,000 | | |
| |
| |
| | |
| (1) | | Company was no longer an affiliate as of June 30, 2013. |
66 | JUNE 30, 2013
The following is a summary of the inputs that were used to value the Funds’ investments in securities and other financial instruments as of June 30, 2013. See Notes to Financial Statements for more information.
Valuation Inputs Summary (as of June 30, 2013)
| | | | | | | | | | | | |
| | | | | Level 2 – Other Significant
| | Level 3 – Significant
| | |
| | | Level 1 – Quoted Prices | | Observable Inputs | | Unobservable Inputs | | |
| |
Investments in Securities: | | | | | | | | | | | |
| Perkins Large Cap Value Fund | | | | | | | | | | | |
Common Stock | | | | | | | | | | | |
| Cellular Telecommunications | | $ | – | | $ | 2,672,820 | | $ | – | | |
| Food – Miscellaneous/Diversified | | | 1,358,840 | | | 1,359,120 | | | – | | |
| Medical – Drugs | | | 8,036,076 | | | 2,658,696 | | | – | | |
| Medical – Generic Drugs | | | – | | | 1,630,720 | | | – | | |
| Oil Companies – Integrated | | | 2,061,068 | | | 2,743,400 | | | – | | |
| All Other | | | 96,056,562 | | | – | | | – | | |
| | | | – | | | – | | | | | |
Exchange-Traded Fund | | | 571,920 | | | – | | | – | | |
| | | | | | | | | | | | |
Repurchase Agreement | | | – | | | 14,400,000 | | | – | | |
| | | | | | | | | | | | |
| Total Investments in Securities | | $ | 108,084,466 | | $ | 25,464,756 | | $ | – | | |
| |
| |
Investments in Securities: | | | | | | | | | | | |
| Perkins Mid Cap Value Fund | | | | | | | | | | | |
Common Stock | | | | | | | | | | | |
| Cellular Telecommunications | | $ | – | | $ | 137,970,279 | | $ | – | | |
| Food – Miscellaneous/Diversified | | | – | | | 80,912,944 | | | – | | |
| Medical – Generic Drugs | | | – | | | 123,766,395 | | | – | | |
| All Other | | | 10,246,420,196 | | | – | | | – | | |
| | | | | | | | | | | | |
Repurchase Agreements | | | – | | | 1,136,700,000 | | | – | | |
| | | | | | | | | | | | |
| Total Investments in Securities | | $ | 10,246,420,196 | | $ | 1,479,349,618 | | $ | – | | |
| |
| |
Investments in Securities: | | | | | | | | | | | |
| Perkins Select Value Fund | | | | | | | | | | | |
Common Stock | | | | | | | | | | | |
| Cellular Telecommunications | | $ | – | | $ | 1,551,960 | | $ | – | | |
| Medical – Drugs | | | 2,765,290 | | | 2,754,900 | | | – | | |
| Medical – Generic Drugs | | | – | | | 1,293,600 | | | – | | |
| All Other | | | 54,140,928 | | | – | | | – | | |
| | | | | | | | | | | | |
Corporate Bond | | | – | | | 1,229,040 | | | – | | |
| | | | | | | | | | | | |
Preferred Stock | | | – | | | 372,750 | | | – | | |
| | | | | | | | | | | | |
Repurchase Agreement | | | – | | | 7,700,000 | | | – | | |
| | | | | | | | | | | | |
| Total Investments in Securities | | $ | 56,906,218 | | $ | 14,902,250 | | $ | – | | |
| |
| |
Investments in Securities: | | | | | | | | | | | |
| Perkins Small Cap Value Fund | | | | | | | | | | | |
Common Stock | | | | | | | | | | | |
| Telecommunication Equipment | | $ | – | | $ | 25,823,000 | | $ | – | | |
| All Other | | | 2,256,364,962 | | | – | | | – | | |
| | | | | | | | | | | | |
Repurchase Agreements | | | – | | | 216,700,000 | | | – | | |
| | | | | | | | | | | | |
| Total Investments in Securities | | $ | 2,256,364,962 | | $ | 242,523,000 | | $ | – | | |
| |
| |
Janus Value Funds | 67
Notes to Schedules of Investments and Other Information (continued)
| | | | | | | | | | | | |
| | | | | Level 2 – Other Significant
| | Level 3 – Significant
| | |
| | | Level 1 – Quoted Prices | | Observable Inputs | | Unobservable Inputs | | |
| |
Investments in Securities: | | | | | | | | | | | |
| Perkins Value Plus Income Fund | | | | | | | | | | | |
Asset-Backed/Commercial Mortgage-Backed Securities | | $ | – | | $ | 790,796 | | $ | – | | |
| | | | | | | | | | | | |
Bank Loans | | | – | | | 144,824 | | | – | | |
| | | | | | | | | | | | |
Common Stock | | | | | | | | | | | |
| Cellular Telecommunications | | | – | | | 1,300,030 | | | – | | |
| Food – Miscellaneous/Diversified | | | – | | | 190,115 | | | – | | |
| Medical – Drugs | | | 1,086,582 | | | 882,941 | | | – | | |
| Medical – Generic Drugs | | | – | | | 486,080 | | | – | | |
| Oil Companies – Integrated | | | 559,388 | | | 1,302,900 | | | – | | |
| All Other | | | 25,997,729 | | | – | | | – | | |
| | | | | | | | | | | | |
Corporate Bonds | | | – | | | 13,515,228 | | | – | | |
| | | | | | | | | | | | |
Mortgage-Backed Securities | | | – | | | 5,251,991 | | | – | | |
| | | | | | | | | | | | |
Preferred Stock | | | – | | | 181,489 | | | – | | |
| | | | | | | | | | | | |
U.S. Treasury Notes/Bonds | | | – | | | 4,615,583 | | | – | | |
| | | | | | | | | | | | |
Money Market | | | – | | | 368,000 | | | – | | |
| | | | | | | | | | | | |
| Total Investments in Securities | | $ | 27,643,699 | | $ | 29,029,977 | | $ | – | | |
| | | | | | | | | | | | |
Other Financial Instruments(a) – Assets: | | | | | | | | | | | |
Forward currency contracts | | $ | – | | $ | 9,183 | | $ | – | | |
| | | | | | | | | | | | |
Other Financial Instruments(a) – Liabilities: | | | | | | | | | | | |
Options written, at value | | $ | – | | $ | 5,505 | | $ | – | | |
Forward currency contracts | | | – | | | 170 | | | – | | |
| |
| |
| | | |
| (a) | | Other financial instruments include futures, forward currency, written option, and swap contracts. Forward currency contracts and swap contracts are reported at their unrealized appreciation/(depreciation) at measurement date, which represents the change in the contract’s value from trade date. Futures are reported at their variation margin at measurement date, which represents the amount due to/from the Fund at that date. Options are reported at their market value at measurement date. |
68 | JUNE 30, 2013
[This page intentionally left blank.]
Janus Value Funds | 69
Statements of Assets and Liabilities
| | | | | | | | | | | | | | | | | | | | | |
As of June 30, 2013
| | | | | | | | | | |
| (all numbers in thousands except net asset value per share) | | Perkins Large Cap Value Fund | | Perkins Mid Cap Value Fund | | Perkins Select Value Fund | | Perkins Small Cap Value Fund | | Perkins Value Plus Income Fund |
|
| |
| Assets: | | | | | | | | | | | | | | | | | | | | |
Investments at cost(1) | | $ | 109,102 | | | $ | 9,781,056 | | | $ | 64,298 | | | $ | 2,092,848 | | | $ | 52,888 | |
| Unaffiliated investments at value | | $ | 119,149 | | | $ | 10,589,070 | | | $ | 64,108 | | | $ | 2,259,192 | | | $ | 56,306 | |
| Affiliated investments at value | | | – | | | | – | | | | – | | | | 22,996 | | | | 368 | |
| Repurchase agreements | | | 14,400 | | | | 1,136,700 | | | | 7,700 | | | | 216,700 | | | | – | |
| Cash | | | – | | | | 53,519 | | | | 54 | | | | 59 | | | | – | |
| Receivables: | | | | | | | | | | | | | | | | | | | | |
| Investments sold | | | 463 | | | | 97,862 | | | | – | | | | 26,636 | | | | 1,635 | |
| Closed foreign currency contracts | | | – | | | | – | | | | – | | | | – | | | | 39 | |
| Fund shares sold | | | 84 | | | | 8,477 | | | | 17 | | | | 19,896 | | | | 15 | |
| Dividends | | | 264 | | | | 22,025 | | | | 147 | | | | 1,864 | | | | 161 | |
| Foreign dividend tax reclaim | | | – | | | | – | | | | 30 | | | | – | | | | 3 | |
| Interest | | | – | | | | 14 | | | | 67 | | | | 2 | | | | 173 | |
| Non-interested Trustees’ deferred compensation | | | 2 | | | | 204 | | | | 1 | | | | 43 | | | | 1 | |
| Other assets | | | 1 | | | | 34 | | | | – | | | | 7 | | | | – | |
| Forward currency contracts | | | – | | | | – | | | | – | | | | – | | | | 9 | |
| Total Assets | | | 134,363 | | | | 11,907,905 | | | | 72,124 | | | | 2,547,395 | | | | 58,710 | |
| Liabilities: | | | | | | | | | | | | | | | | | | | | |
| Payables: | | | | | | | | | | | | | | | | | | | | |
Options written, at value(2) | | | – | | | | – | | | | – | | | | – | | | | 6 | |
| Due to custodian | | | 4 | | | | – | | | | – | | | | – | | | | 2 | |
| Investments purchased | | | 2,053 | | | | 157,814 | | | | 55 | | | | 33,055 | | | | 1,920 | |
| Fund shares repurchased | | | 84 | | | | 50,010 | | | | 1 | | | | 43,662 | | | | 3 | |
| Dividends | | | – | | | | – | | | | – | | | | – | | | | 3 | |
| Advisory fees | | | 54 | | | | 4,663 | | | | 33 | | | | 1,117 | | | | 20 | |
| Fund administration fees | | | 1 | | | | 97 | | | | 1 | | | | 21 | | | | – | |
| Internal servicing cost | | | 1 | | | | 39 | | | | 1 | | | | 9 | | | | – | |
| Administrative services fees | | | 4 | | | | 1,439 | | | | 1 | | | | 213 | | | | 4 | |
| Distribution fees and shareholder servicing fees | | | 3 | | | | 565 | | | | – | | | | 68 | | | | 7 | |
| Administrative, networking and omnibus fees | | | 6 | | | | 733 | | | | – | | | | 75 | | | | 1 | |
| Non-interested Trustees’ fees and expenses | | | 1 | | | | 97 | | | | 1 | | | | 24 | | | | – | |
| Non-interested Trustees’ deferred compensation fees | | | 2 | | | | 204 | | | | 1 | | | | 43 | | | | 1 | |
| Accrued expenses and other payables | | | 51 | | | | 848 | | | | 54 | | | | 275 | | | | 81 | |
| Forward currency contracts | | | – | | | | – | | | | – | | | | – | | | | – | |
| Total Liabilities | | | 2,264 | | | | 216,509 | | | | 148 | | | | 78,562 | | | | 2,048 | |
| Net Assets | | $ | 132,099 | | | $ | 11,691,396 | | | $ | 71,976 | | | $ | 2,468,833 | | | $ | 56,662 | |
See footnotes at the end of the Statements.
See Notes to Financial Statements.
70 | JUNE 30, 2013
This page intentionally left blank. The content of this page is part of a ‘Double Page Spread’ table and appears on the previous page.
71
Statements of Assets and Liabilities (continued)
| | | | | | | | | | | | | | | | | | | | | |
As of June 30, 2013
| | | | | | | | | | |
| (all numbers in thousands except net asset value per share) | | Perkins Large Cap Value Fund | | Perkins Mid Cap Value Fund | | Perkins Select Value Fund | | Perkins Small Cap Value Fund | | Perkins Value Plus Income Fund |
|
| |
| Net Assets Consist of: | | | | | | | | | | | | | | | | | | | | |
| Capital (par value and paid-in surplus)* | | $ | 97,486 | | | $ | 8,905,321 | | | $ | 61,900 | | | $ | 2,017,560 | | | $ | 50,945 | |
| Undistributed net investment income* | | | 853 | | | | 140,970 | | | | 577 | | | | 20,453 | | | | 181 | |
| Undistributed net realized gain from investment and foreign currency transactions* | | | 9,312 | | | | 700,377 | | | | 1,988 | | | | 24,777 | | | | 1,736 | |
| Unrealized net appreciation of investments, foreign currency translations and non-interested Trustees’ deferred compensation | | | 24,448 | | | | 1,944,728 | | | | 7,511 | | | | 406,043 | | | | 3,800 | |
| Total Net Assets | | $ | 132,099 | | | $ | 11,691,396 | | | $ | 71,976 | | | $ | 2,468,833 | | | $ | 56,662 | |
| Net Assets - Class A Shares | | $ | 3,390 | | | $ | 896,589 | | | $ | 109 | | | $ | 115,675 | | | $ | 6,200 | |
| Shares Outstanding, $0.01 Par Value (unlimited shares authorized) | | | 217 | | | | 37,419 | | | | 9 | | | | 4,897 | | | | 531 | |
Net Asset Value Per Share(3) | | $ | 15.62 | | | $ | 23.96 | | | $ | 11.76 | | | $ | 23.62 | | | $ | 11.68 | |
Maximum Offering Price Per Share(4) | | $ | 16.57 | | | $ | 25.42 | | | $ | 12.48 | | | $ | 25.06 | | | $ | 12.39 | |
| Net Assets - Class C Shares | | $ | 3,014 | | | $ | 189,096 | | | $ | 124 | | | $ | 17,316 | | | $ | 5,485 | |
| Shares Outstanding, $0.01 Par Value (unlimited shares authorized) | | | 195 | | | | 7,996 | | | | 11 | | | | 749 | | | | 469 | |
Net Asset Value Per Share(3) | | $ | 15.44 | | | $ | 23.65 | | | $ | 11.68 | | | $ | 23.13 | | | $ | 11.71 | |
| Net Assets - Class D Shares | | $ | 32,031 | | | $ | 869,066 | | | $ | 5,742 | | | $ | 74,980 | | | $ | 24,811 | |
| Shares Outstanding, $0.01 Par Value (unlimited shares authorized) | | | 2,057 | | | | 36,173 | | | | 488 | | | | 3,169 | | | | 2,123 | |
| Net Asset Value Per Share | | $ | 15.57 | | | $ | 24.03 | | | $ | 11.78 | | | $ | 23.66 | | | $ | 11.69 | |
| Net Assets - Class I Shares | | $ | 40,943 | | | $ | 3,033,537 | | | $ | 64,631 | | | $ | 821,829 | | | $ | 9,903 | |
| Shares Outstanding, $0.01 Par Value (unlimited shares authorized) | | | 2,621 | | | | 126,272 | | | | 5,478 | | | | 34,672 | | | | 847 | |
| Net Asset Value Per Share | | $ | 15.62 | | | $ | 24.02 | | | $ | 11.80 | | | $ | 23.70 | | | $ | 11.70 | |
| Net Assets - Class L Shares | | | N/A | | | $ | 24,332 | | | | N/A | | | $ | 230,021 | | | | N/A | |
| Shares Outstanding, $0.01 Par Value (unlimited shares authorized) | | | N/A | | | | 1,003 | | | | N/A | | | | 9,551 | | | | N/A | |
| Net Asset Value Per Share | | | N/A | | | $ | 24.26 | | | | N/A | | | $ | 24.08 | | | | N/A | |
| Net Assets - Class N Shares | | $ | 49,186 | | | $ | 222,244 | | | | N/A | | | $ | 251,691 | | | | N/A | |
| Shares Outstanding, $0.01 Par Value (unlimited shares authorized) | | | 3,152 | | | | 9,248 | | | | N/A | | | | 10,616 | | | | N/A | |
| Net Asset Value Per Share | | $ | 15.61 | | | $ | 24.03 | | | | N/A | | | $ | 23.71 | | | | N/A | |
| Net Assets - Class R Shares | | | N/A | | | $ | 163,302 | | | | N/A | | | $ | 30,415 | | | | N/A | |
| Shares Outstanding, $0.01 Par Value (unlimited shares authorized) | | | N/A | | | | 6,853 | | | | N/A | | | | 1,303 | | | | N/A | |
| Net Asset Value Per Share | | | N/A | | | $ | 23.83 | | | | N/A | | | $ | 23.34 | | | | N/A | |
| Net Assets - Class S Shares | | $ | 480 | | | $ | 709,171 | | | $ | 13 | | | $ | 80,862 | | | $ | 4,453 | |
| Shares Outstanding, $0.01 Par Value (unlimited shares authorized) | | | 31 | | | | 29,655 | | | | 1 | | | | 3,437 | | | | 381 | |
| Net Asset Value Per Share | | $ | 15.62 | | | $ | 23.91 | | | $ | 11.77 | | | $ | 23.53 | | | $ | 11.69 | |
| Net Assets - Class T Shares | | $ | 3,055 | | | $ | 5,584,059 | | | $ | 1,357 | | | $ | 846,044 | | | $ | 5,810 | |
| Shares Outstanding, $0.01 Par Value (unlimited shares authorized) | | | 197 | | | | 232,559 | | | | 115 | | | | 35,769 | | | | 497 | |
| Net Asset Value Per Share | | $ | 15.55 | | | $ | 24.01 | | | $ | 11.77 | | | $ | 23.65 | | | $ | 11.69 | |
| | | |
| * | | See Note 5 in Notes to Financial Statements. |
| (1) | | Includes cost of repurchase agreements of $14,400,000, $1,136,700,000, $7,700,000 and $216,700,000 for Perkins Large Cap Value Fund, Perkins Mid Cap Value Fund, Perkins Select Value Fund and Perkins Small Cap Value Fund, respectively. |
| (2) | | Includes premiums of $11,059 on written options for Perkins Value Plus Income Fund. |
| (3) | | Redemption price per share may be reduced for any applicable contingent deferred sales charge. |
| (4) | | Maximum offering price is computed at 100/94.25 of net asset value. |
| | | |
| | | |
See Notes to Financial Statements.
72 | JUNE 30, 2013
This page intentionally left blank. The content of this page is part of a ‘Double Page Spread’ table and appears on the previous page.
73
Statements of Operations
| | | | | | | | | | | | | | | | | | | | | | | | | |
For the year ended June 30, 2013
| | | | | | | | | | | | |
| (all numbers in thousands) | | Perkins Large Cap Value Fund | | Perkins Mid Cap Value Fund | | Perkins Select Value Fund | | Perkins Small Cap Value Fund | | Perkins Value Plus Income Fund | | |
|
| |
| Investment Income: | | | | | | | | | | | | | | | | | | | | | | | | |
| Interest | | $ | 22 | | | $ | 1,702 | | | $ | 190 | | | $ | 503 | | | $ | 699 | | | | | |
| Dividends | | | 3,245 | | | | 236,248 | | | | 1,452 | | | | 41,597 | | | | 1,122 | | | | | |
| Dividends from affiliates | | | – | | | | 5,199 | | | | – | | | | 1,268 | | | | 2 | | | | | |
| Other Income | | | – | | | | – | | | | – | | | | – | | | | 12 | | | | | |
| Foreign tax withheld | | | (53) | | | | (1,609) | | | | (62) | | | | (16) | | | | (41) | | | | | |
| Total Investment Income | | | 3,214 | | | | 241,540 | | | | 1,580 | | | | 43,352 | | | | 1,794 | | | | | |
| Expenses: | | | | | | | | | | | | | | | | | | | | | | | | |
| Advisory fees | | | 766 | | | | 59,665 | | | | 425 | | | | 14,818 | | | | 316 | | | | | |
| Internal servicing expense - Class A Shares | | | – | | | | 154 | | | | – | | | | 19 | | | | 1 | | | | | |
| Internal servicing expense - Class C Shares | | | 1 | | | | 81 | | | | – | | | | 8 | | | | 2 | | | | | |
| Internal servicing expense - Class I Shares | | | 4 | | | | 228 | | | | 4 | | | | 81 | | | | 1 | | | | | |
| Shareholder reports expense | | | 14 | | | | 1,675 | | | | 3 | | | | 269 | | | | 8 | | | | | |
| Transfer agent fees and expenses | | | 11 | | | | 450 | | | | 2 | | | | 65 | | | | 7 | | | | | |
| Registration fees | | | 123 | | | | 191 | | | | 82 | | | | 217 | | | | 97 | | | | | |
| Custodian fees | | | 4 | | | | 53 | | | | 3 | | | | 20 | | | | 6 | | | | | |
| Professional fees | | | 59 | | | | 134 | | | | 51 | | | | 94 | | | | 80 | | | | | |
| Non-interested Trustees’ fees and expenses | | | 5 | | | | 378 | | | | 2 | | | | 71 | | | | 2 | | | | | |
| Fund administration fees | | | 15 | | | | 1,238 | | | | 7 | | | | 265 | | | | 5 | | | | | |
| Administrative services fees - Class D Shares | | | 30 | | | | 1,009 | | | | 5 | | | | 87 | | | | 27 | | | | | |
| Administrative services fees - Class L Shares | | | N/A | | | | 73 | | | | N/A | | | | 563 | | | | N/A | | | | | |
| Administrative services fees - Class R Shares | | | N/A | | | | 407 | | | | N/A | | | | 78 | | | | N/A | | | | | |
| Administrative services fees - Class S Shares | | | 1 | | | | 1,928 | | | | – | | | | 216 | | | | 10 | | | | | |
| Administrative services fees - Class T Shares | | | 6 | | | | 15,011 | | | | 3 | | | | 2,200 | | | | 14 | | | | | |
| Distribution fees and shareholder servicing fees - Class A Shares | | | 8 | | | | 2,490 | | | | 1 | | | | 322 | | | | 14 | | | | | |
| Distribution fees and shareholder servicing fees - Class C Shares | | | 27 | | | | 2,039 | | | | 1 | | | | 188 | | | | 52 | | | | | |
| Distribution fees and shareholder servicing fees - Class R Shares | | | N/A | | | | 806 | | | | N/A | | | | 153 | | | | N/A | | | | | |
| Distribution fees and shareholder servicing fees - Class S Shares | | | 1 | | | | 1,927 | | | | – | | | | 216 | | | | 11 | | | | | |
| Administrative, networking and omnibus fees - Class A Shares | | | 6 | | | | 2,132 | | | | – | | | | 171 | | | | 1 | | | | | |
| Administrative, networking and omnibus fees - Class C Shares | | | 3 | | | | 322 | | | | – | | | | 40 | | | | 1 | | | | | |
| Administrative, networking and omnibus fees - Class I Shares | | | 6 | | | | 3,439 | | | | – | | | | 1,101 | | | | – | | | | | |
| Accounting system fee | | | 11 | | | | 290 | | | | 8 | | | | 75 | | | | 57 | | | | | |
| Other expenses | | | 3 | | | | 339 | | | | 2 | | | | 76 | | | | 1 | | | | | |
| Total Expenses | | | 1,104 | | | | 96,459 | | | | 599 | | | | 21,413 | | | | 713 | | | | | |
| Expense and Fee Offset | | | – | | | | (7) | | | | – | | | | – | | | | – | | | | | |
| Less: Excess Expense Reimbursement | | | – | | | | (847) | | | | – | | | | (564) | | | | (187) | | | | | |
| Net Expenses after Waivers and Expense Offsets | | | 1,104 | | | | 95,605 | | | | 599 | | | | 20,849 | | | | 526 | | | | | |
| Net Investment Income | | | 2,110 | | | | 145,935 | | | | 981 | | | | 22,503 | | | | 1,268 | | | | | |
| Net Realized and Unrealized Gain/(Loss) on Investments: | | | | | | | | | | | | | | | | | | | | | | | | |
Net realized gain from investment and foreign currency transactions(1) | | | 10,594 | | | | 948,042(2) | | | | 2,145 | | | | 55,068 | | | | 2,309 | | | | | |
| Net realized gain from written options contracts | | | – | | | | 33,146 | | | | – | | | | – | | | | 54 | | | | | |
| Change in unrealized net appreciation/(depreciation) of investments, foreign currency translations and non-interested Trustees’ deferred compensation | | | 14,797 | | | | 1,112,479 | | | | 7,643 | | | | 373,946 | | | | 2,596 | | | | | |
| Change in unrealized net appreciation/(depreciation) of written option contracts | | | – | | | | (17,994) | | | | – | | | | – | | | | 8 | | | | | |
| Net Gain on Investments | | | 25,391 | | | | 2,075,673 | | | | 9,788 | | | | 429,014 | | | | 4,967 | | | | | |
| Net Increase in Net Assets Resulting from Operations | | $ | 27,501 | | | $ | 2,221,608 | | | $ | 10,769 | | | $ | 451,517 | | | $ | 6,235 | | | | | |
| | | |
| (1) | | Includes realized gain/(loss) from affiliates. See affiliates table in Notes to Schedules of Investments and Other Information. |
| (2) | | Includes $15,244,051 of realized gains resulting from a redemption-in-kind during the year ended June 30, 2013 for Perkins Mid Cap Value Fund. |
| | | |
| | | |
See Notes to Financial Statements.
74 | JUNE 30, 2013
This page intentionally left blank. The content of this page is part of a ‘Double Page Spread’ table and appears on the previous page.
75
Statements of Changes in Net Assets
| | | | | | | | | | | | | | | | | | | | | | | | | | | | | | | | | | | | | | | | | |
| | | Perkins Large Cap
| | Perkins Mid Cap
| | | | | | Perkins Small Cap
| | Perkins Value Plus
|
For the years or periods ended June 30
| | Value Fund | | Value Fund | | Perkins Select Value Fund | | Value Fund | | Income Fund |
| (all numbers in thousands) | | 2013 | | 2012(1) | | 2013 | | 2012(1) | | 2013 | | 2012(2) | | 2013 | | 2012(1) | | 2013 | | 2012 |
|
| |
| Operations: | | | | | | | | | | | | | | | | | | | | | | | | | | | | | | | | | | | | | | | | |
| Net investment income | | $ | 2,110 | | | $ | 1,956 | | | $ | 145,935 | | | $ | 152,066 | | | $ | 981 | | | $ | 427 | | | $ | 22,503 | | | $ | 36,977 | | | $ | 1,268 | | | $ | 1,218 | |
Net realized gain from investment and foreign currency transactions(3) | | | 10,594 | | | | 3,792 | | | | 981,188 | | | | 614,644 | | | | 2,145 | | | | 4,169 | | | | 55,068 | | | | 114,441 | | | | 2,363 | | | | 832 | |
| Change in unrealized net appreciation/(depreciation) of investments, foreign currency translations and non-interested Trustees’ deferred compensation | | | 14,797 | | | | (3,701) | | | | 1,094,485 | | | | (1,346,983) | | | | 7,643 | | | | (132) | | | | 373,946 | | | | (289,889) | | | | 2,604 | | | | (193) | |
| Net Increase/(Decrease) in Net Assets Resulting from Operations | | | 27,501 | | | | 2,047 | | | | 2,221,608 | | | | (580,273) | | | | 10,769 | | | | 4,464 | | | | 451,517 | | | | (138,471) | | | | 6,235 | | | | 1,857 | |
| Dividends and Distributions to Shareholders: | | | | | | | | | | | | | | | | | | | | | | | | | | | | | | | | | | | | | | | | |
| Net Investment Income* | | | | | | | | | | | | | | | | | | | | | | | | | | | | | | | | | | | | | | | | |
| Class A Shares | | | (39) | | | | (28) | | | | (5,609) | | | | (6,645) | | | | (1) | | | | – | | | | (1,222) | | | | (135) | | | | (138) | | | | (148) | |
| Class C Shares | | | (12) | | | | – | | | | (383) | | | | – | | | | – | | | | – | | | | (2) | | | | – | | | | (94) | | | | (106) | |
| Class D Shares | | | (322) | | | | (192) | | | | (6,211) | | | | (7,689) | | | | (38) | | | | – | | | | (971) | | | | (258) | | | | (578) | | | | (507) | |
| Class I Shares | | | (619) | | | | (1,399) | | | | (23,823) | | | | (30,539) | | | | (681) | | | | – | | | | (16,875) | | | | (5,171) | | | | (265) | | | | (269) | |
| Class L Shares | | | N/A | | | | N/A | | | | (209) | | | | (538) | | | | N/A | | | | N/A | | | | (3,545) | | | | (1,368) | | | | N/A | | | | N/A | |
| Class N Shares | | | (1,311) | | | | – | | | | (992) | | | | – | | | | N/A | | | | N/A | | | | (1,015) | | | | – | | | | N/A | | | | N/A | |
| Class R Shares | | | N/A | | | | N/A | | | | (746) | | | | (423) | | | | N/A | | | | N/A | | | | (240) | | | | – | | | | N/A | | | | N/A | |
| Class S Shares | | | (4) | | | | (5) | | | | (4,452) | | | | (4,413) | | | | – | | | | – | | | | (882) | | | | (53) | | | | (101) | | | | (107) | |
| Class T Shares | | | (34) | | | | (25) | | | | (42,393) | | | | (52,212) | | | | (11) | | | | – | | | | (11,027) | | | | (1,998) | | | | (141) | | | | (143) | |
| Net Realized Gain/(Loss) from Investment Transactions* | | | | | | | | | | | | | | | | | | | | | | | | | | | | | | | | | | | | | | | | |
| Class A Shares | | | (58) | | | | (133) | | | | (34,092) | | | | (85,970) | | | | (7) | | | | – | | | | (5,181) | | | | (20,201) | | | | (121) | | | | (169) | |
| Class C Shares | | | (47) | | | | (93) | | | | (7,095) | | | | (15,894) | | | | (7) | | | | – | | | | (768) | | | | (2,976) | | | | (117) | | | | (154) | |
| Class D Shares | | | (422) | | | | (823) | | | | (28,651) | | | | (61,779) | | | | (242) | | | | – | | | | (2,833) | | | | (8,954) | | | | (484) | | | | (523) | |
| Class I Shares | | | (778) | | | | (5,521) | | | | (112,483) | | | | (236,480) | | | | (4,089) | | | | – | | | | (47,041) | | | | (143,900) | | | | (217) | | | | (267) | |
| Class L Shares | | | N/A | | | | N/A | | | | (1,128) | | | | (4,013) | | | | N/A | | | | N/A | | | | (9,262) | | | | (33,189) | | | | N/A | | | | N/A | |
| Class N Shares | | | (1,479) | | | | – | | | | (4,083) | | | | – | | | | N/A | | | | N/A | | | | (2,601) | | | | – | | | | N/A | | | | N/A | |
| Class R Shares | | | N/A | | | | N/A | | | | (5,608) | | | | (11,285) | | | | N/A | | | | N/A | | | | (1,285) | | | | (4,083) | | | | N/A | | | | N/A | |
| Class S Shares | | | (8) | | | | (33) | | | | (26,927) | | | | (58,382) | | | | (1) | | | | – | | | | (3,510) | | | | (10,947) | | | | (95) | | | | (128) | |
| Class T Shares | | | (47) | | | | (115) | | | | (209,230) | | | | (493,500) | | | | (79) | | | | – | | | | (35,337) | | | | (119,912) | | | | (122) | | | | (151) | |
| Net Decrease from Dividends and Distributions | | | (5,180) | | | | (8,367) | | | | (514,115) | | | | (1,069,762) | | | | (5,156) | | | | – | | | | (143,597) | | | | (353,145) | | | | (2,473) | | | | (2,672) | |
See footnotes at the end of the Statements.
See Notes to Financial Statements.
76 | JUNE 30, 2013
This page intentionally left blank. The content of this page is part of a ‘Double Page Spread’ table and appears on the previous page.
77
Statements of Changes in Net Assets (continued)
| | | | | | | | | | | | | | | | | | | | | | | | | | | | | | | | | | | | | | | | | |
| | | Perkins Large Cap
| | Perkins Mid Cap
| | | | | | Perkins Small Cap
| | Perkins Value Plus
|
For the years or periods ended June 30
| | Value Fund | | Value Fund | | Perkins Select Value Fund | | Value Fund | | Income Fund |
| (all numbers in thousands) | | 2013 | | 2012(1) | | 2013 | | 2012(1) | | 2013 | | 2012(2) | | 2013 | | 2012(1) | | 2013 | | 2012 |
|
| |
| Capital Share Transactions: | | | | | | | | | | | | | | | | | | | | | | | | | | | | | | | | | | | | | | | | |
| Shares Sold | | | | | | | | | | | | | | | | | | | | | | | | | | | | | | | | | | | | | | | | |
| Class A Shares | | | 381 | | | | 1,431 | | | | 228,969 | | | | 284,287 | | | | 59 | | | | 98 | | | | 28,435 | | | | 50,362 | | | | 778 | | | | 702 | |
| Class C Shares | | | 1,209 | | | | 1,181 | | | | 25,820 | | | | 41,684 | | | | 66 | | | | 77 | | | | 1,060 | | | | 2,074 | | | | 326 | | | | 725 | |
| Class D Shares | | | 16,012 | | | | 10,281 | | | | 28,839 | | | | 35,644 | | | | 3,156 | | | | 3,610 | | | | 3,533 | | | | 4,354 | | | | 7,241 | | | | 10,235 | |
| Class I Shares | | | 659 | | | | 18,563 | | | | 799,900 | | | | 1,137,831 | | | | 8,740 | | | | 56,981 | | | | 214,492 | | | | 405,182 | | | | 386 | | | | 2,037 | |
| Class L Shares | | | N/A | | | | N/A | | | | 985 | | | | 5,037 | | | | N/A | | | | N/A | | | | 30,601 | | | | 18,923 | | | | N/A | | | | N/A | |
| Class N Shares | | | 13,398 | | | | 64,789 | | | | 248,592 | | | | 21,226 | | | | N/A | | | | N/A | | | | 273,700 | | | | 12,087 | | | | N/A | | | | N/A | |
| Class R Shares | | | N/A | | | | N/A | | | | 49,398 | | | | 56,113 | | | | N/A | | | | N/A | | | | 7,087 | | | | 9,178 | | | | N/A | | | | N/A | |
| Class S Shares | | | – | | | | – | | | | 192,330 | | | | 270,100 | | | | – | | | | 10 | | | | 16,759 | | | | 24,352 | | | | – | | | | – | |
| Class T Shares | | | 1,150 | | | | 887 | | | | 723,441 | | | | 967,374 | | | | 328 | | | | 1,058 | | | | 90,295 | | | | 107,657 | | | | 900 | | | | 812 | |
| Reinvested Dividends and Distributions | | | | | | | | | | | | | | | | | | | | | | | | | | | | | | | | | | | | | | | | |
| Class A Shares | | | 80 | | | | 127 | | | | 33,312 | | | | 79,405 | | | | 8 | | | | – | | | | 4,939 | | | | 14,050 | | | | 252 | | | | 315 | |
| Class C Shares | | | 48 | | | | 71 | | | | 5,524 | | | | 11,148 | | | | 7 | | | | – | | | | 605 | | | | 2,259 | | | | 203 | | | | 249 | |
| Class D Shares | | | 739 | | | | 1,007 | | | | 34,146 | | | | 67,869 | | | | 275 | | | | – | | | | 3,740 | | | | 9,022 | | | | 1,019 | | | | 925 | |
| Class I Shares | | | 1,339 | | | | 6,768 | | | | 115,243 | | | | 229,324 | | | | 4,770 | | | | – | | | | 51,655 | | | | 115,330 | | | | 476 | | | | 534 | |
| Class L Shares | | | N/A | | | | N/A | | | | 1,177 | | | | 4,188 | | | | N/A | | | | N/A | | | | 12,317 | | | | 33,165 | | | | N/A | | | | N/A | |
| Class N Shares | | | 2,790 | | | | – | | | | 5,074 | | | | – | | | | N/A | | | | N/A | | | | 3,616 | | | | – | | | | N/A | | | | N/A | |
| Class R Shares | | | N/A | | | | N/A | | | | 5,788 | | | | 10,523 | | | | N/A | | | | N/A | | | | 1,321 | | | | 3,469 | | | | N/A | | | | N/A | |
| Class S Shares | | | 12 | | | | 38 | | | | 31,312 | | | | 62,682 | | | | 1 | | | | – | | | | 4,391 | | | | 10,999 | | | | 196 | | | | 235 | |
| Class T Shares | | | 81 | | | | 140 | | | | 245,780 | | | | 526,578 | | | | 90 | | | | – | | | | 45,960 | | | | 119,251 | | | | 262 | | | | 293 | |
Shares Repurchased(4)(5) | | | | | | | | | | | | | | | | | | | | | | | | | | | | | | | | | | | | | | | | |
| Class A Shares | | | (531) | | | | (727) | | | | (660,231) | | | | (413,700) | | | | (58) | | | | (9) | | | | (74,005) | | | | (115,644) | | | | (275) | | | | (694) | |
| Class C Shares | | | (1,288) | | | | (1,222) | | | | (80,216) | | | | (56,729) | | | | (35) | | | | – | | | | (7,986) | | | | (7,865) | | | | (233) | | | | (205) | |
| Class D Shares | | | (6,224) | | | | (7,591) | | | | (128,533) | | | | (117,511) | | | | (1,077) | | | | (661) | | | | (13,333) | | | | (14,384) | | | | (4,613) | | | | (4,027) | |
| Class I Shares | | | (15,798) | | | | (82,310) | | | | (1,746,987) | | | | (943,132) | | | | (12,855) | | | | (2,502) | | | | (770,327) | | | | (447,640) | | | | (902) | | | | (1,029) | |
| Class L Shares | | | N/A | | | | N/A | | | | (15,375) | | | | (31,766) | | | | N/A | | | | N/A | | | | (122,888) | | | | (49,500) | | | | N/A | | | | N/A | |
| Class N Shares | | | (44,322) | | | | (401) | | | | (70,035) | | | | (61) | | | | N/A | | | | N/A | | | | (45,362) | | | | (76) | | | | N/A | | | | N/A | |
| Class R Shares | | | N/A | | | | N/A | | | | (74,810) | | | | (56,746) | | | | N/A | | | | N/A | | | | (13,559) | | | | (13,162) | | | | N/A | | | | N/A | |
| Class S Shares | | | (300) | | | | (11) | | | | (415,178) | | | | (276,209) | | | | – | | | | – | | | | (44,055) | | | | (32,287) | | | | – | | | | – | |
| Class T Shares | | | (814) | | | | (863) | | | | (2,413,088) | | | | (2,241,500) | | | | (222) | | | | (16) | | | | (314,057) | | | | (381,654) | | | | (665) | | | | (1,057) | |
| Net Increase/(Decrease) from Capital Share Transactions | | | (31,379) | | | | 12,158 | | | | (2,828,823) | | | | (326,341) | | | | 3,253 | | | | 58,646 | | | | (611,066) | | | | (120,498) | | | | 5,351 | | | | 10,050 | |
| Net Increase/(Decrease) in Net Assets | | | (9,058) | | | | 5,838 | | | | (1,121,330) | | | | (1,976,376) | | | | 8,866 | | | | 63,110 | | | | (303,146) | | | | (612,114) | | | | 9,113 | | | | 9,235 | |
| Net Assets: | | | | | | | | | | | | | | | | | | | | | | | | | | | | | | | | | | | | | | | | |
| Beginning of period | | | 141,157 | | | | 135,319 | | | | 12,812,726 | | | | 14,789,102 | | | | 63,110 | | | | – | | | | 2,771,979 | | | | 3,384,093 | | | | 47,549 | | | | 38,314 | |
| End of period | | $ | 132,099 | | | $ | 141,157 | | | $ | 11,691,396 | | | $ | 12,812,726 | | | $ | 71,976 | | | $ | 63,110 | | | $ | 2,468,833 | | | $ | 2,771,979 | | | $ | 56,662 | | | $ | 47,549 | |
| | | | | | | | | | | | | | | | | | | | | | | | | | | | | | | | | | | | | | | | | |
| Undistributed Net Investment Income* | | $ | 853 | | | $ | 1,121 | | | $ | 140,970 | | | $ | 84,615 | | | $ | 577 | | | $ | 398 | | | $ | 20,453 | | | $ | 35,736 | | | $ | 181 | | | $ | 109 | |
| | | |
| * | | See Note 5 in Notes to Financial Statements. |
| (1) | | Period from May 31, 2012 (inception date) through June 30, 2012 for Class N Shares. |
| (2) | | Period from December 15, 2011 (inception date) through June 30, 2012. |
| (3) | | Includes realized gain/(loss) from affiliates. See affiliates table in Notes to Schedules of Investments and Other Information. |
| (4) | | During the year ended June 30, 2013, Perkins Mid Cap Value Fund disbursed to a redeeming shareholder portfolio securities and cash valued at $210,143,663 and $30,262,908, respectively, at the date of redemption. |
| (5) | | During the year ended June 30, 2012, Perkins Small Cap Value Fund disbursed to a redeeming shareholder portfolio securities and cash valued at $15,940,516 and $2,270,372, respectively, at the date of redemption. |
| | | |
| | | |
See Notes to Financial Statements.
78 | JUNE 30, 2013
This page intentionally left blank. The content of this page is part of a ‘Double Page Spread’ table and appears on the previous page.
79
Financial Highlights
Class A Shares
| | | | | | | | | | | | | | | | | | | | | | | |
For a share outstanding during each year or period ended June 30 and the
| | Perkins Large Cap Value Fund |
| period ended July 31, 2009 | | 2013 | | 2012 | | 2011 | | 2010(1) | | 2009(2) | | |
| |
| Net Asset Value, Beginning of Period | | | $13.44 | | | | $14.21 | | | | $11.56 | | | | $11.14 | | | | $10.00 | | | |
| Income from Investment Operations: | | | | | | | | | | | | | | | | | | | | | | |
| Net investment income/(loss) | | | 0.15 | | | | 0.12 | | | | 0.13 | | | | 0.03 | | | | 0.05 | | | |
| Net gain/(loss) on investments (both realized and unrealized) | | | 2.48 | | | | (0.07) | | | | 2.87 | | | | 0.44 | | | | 1.11 | | | |
| Total from Investment Operations | | | 2.63 | | | | 0.05 | | | | 3.00 | | | | 0.47 | | | | 1.16 | | | |
| Less Distributions: | | | | | | | | | | | | | | | | | | | | | | |
| Dividends (from net investment income)* | | | (0.18) | | | | (0.14) | | | | (0.03) | | | | (0.03) | | | | (0.02) | | | |
| Distributions (from capital gains)* | | | (0.27) | | | | (0.68) | | | | (0.32) | | | | (0.02) | | | | – | | | |
| Total Distributions | | | (0.45) | | | | (0.82) | | | | (0.35) | | | | (0.05) | | | | (0.02) | | | |
| Net Asset Value, End of Period | | | $15.62 | | | | $13.44 | | | | $14.21 | | | | $11.56 | | | | $11.14 | | | |
| Total Return** | | | 19.96% | | | | 0.75% | | | | 26.21% | | | | 4.20% | | | | 11.64% | | | |
| Net Assets, End of Period (in thousands) | | | $3,390 | | | | $2,977 | | | | $2,265 | | | | $1,654 | | | | $718 | | | |
| Average Net Assets for the Period (in thousands) | | | $3,182 | | | | $2,598 | | | | $1,237 | | | | $1,514 | | | | $530 | | | |
| Ratio of Gross Expenses (Absent the Waiver of Certain Fees and Expense Offsets) to Average Net Assets*** | | | 1.15% | | | | 1.13% | | | | 1.18% | | | | 1.32% | | | | 2.19% | | | |
| Ratio of Net Expenses (After Waivers and Expense Offsets) to Average Net Assets*** | | | 1.14% | | | | 1.13% | | | | 1.18% | | | | 1.29% | | | | 1.23% | | | |
| Ratio of Net Investment Income to Average Net Assets*** | | | 1.05% | | | | 1.16% | | | | 1.40% | | | | 0.48% | | | | 1.19% | | | |
| Portfolio Turnover Rate | | | 45% | | | | 52% | | | | 43% | | | | 32%^ | | | | 33%^ | | | |
Class A Shares
| | | | | | | | | | | | | | | | | | | | | | | |
For a share outstanding during each year or period ended June 30
| | Perkins Mid Cap Value Fund |
| and the period ended October 31, 2009 | | 2013 | | 2012 | | 2011 | | 2010(3) | | 2009(4) | | |
| |
| Net Asset Value, Beginning of Period | | | $20.93 | | | | $23.66 | | | | $19.04 | | | | $18.66 | | | | $16.07 | | | |
| Income from Investment Operations: | | | | | | | | | | | | | | | | | | | | | | |
| Net investment income/(loss) | | | 0.28 | | | | 0.18 | | | | 0.19 | | | | 0.04 | | | | (0.01) | | | |
| Net gain/(loss) on investments (both realized and unrealized) | | | 3.66 | | | | (1.15) | | | | 4.57 | | | | 0.36 | | | | 2.60 | | | |
| Total from Investment Operations | | | 3.94 | | | | (0.97) | | | | 4.76 | | | | 0.40 | | | | 2.59 | | | |
| Less Distributions: | | | | | | | | | | | | | | | | | | | | | | |
| Dividends (from net investment income)* | | | (0.13) | | | | (0.13) | | | | (0.14) | | | | (0.02) | | | | – | | | |
| Distributions (from capital gains)* | | | (0.78) | | | | (1.63) | | | | – | | | | – | | | | – | | | |
| Total Distributions | | | (0.91) | | | | (1.76) | | | | (0.14) | | | | (0.02) | | | | – | | | |
| Net Asset Value, End of Period | | | $23.96 | | | | $20.93 | | | | $23.66 | | | | $19.04 | | | | $18.66 | | | |
| Total Return** | | | 19.33% | | | | (3.84)% | | | | 25.04% | | | | 2.17% | | | | 16.12% | | | |
| Net Assets, End of Period (in thousands) | | | $896,589 | | | | $1,157,423 | | | | $1,358,791 | | | | $1,011,334 | | | | $781,960 | | | |
| Average Net Assets for the Period (in thousands) | | | $996,195 | | | | $1,198,373 | | | | $1,228,239 | | | | $966,540 | | | | $736,402 | | | |
| Ratio of Gross Expenses (Absent the Waiver of Certain Fees and Expense Offsets) to Average Net Assets*** | | | 1.00% | | | | 1.06% | | | | 1.20% | | | | 1.17% | | | | 1.27% | | | |
| Ratio of Net Expenses (After Waivers and Expense Offsets) to Average Net Assets*** | | | 0.95% | | | | 1.02% | | | | 1.17% | | | | 1.17% | | | | 1.22% | | | |
| Ratio of Net Investment Income to Average Net Assets*** | | | 0.98% | | | | 0.98% | | | | 0.82% | | | | 0.33% | | | | 0.35% | | | |
| Portfolio Turnover Rate | | | 60% | | | | 54% | | | | 66% | | | | 44%^ | | | | 88% | | | |
| | | |
| * | | See Note 5 in Notes to Financial Statements. |
| ** | | Total return not annualized for periods of less than one full year. |
| *** | | Annualized for periods of less than one full year. |
| ^ | | Rate has been adjusted to conform with current year presentation. |
| (1) | | Period from August 1, 2009 through June 30, 2010. The Fund changed its fiscal year end from July 31 to June 30. |
| (2) | | Period from December 31, 2008 (inception date) through July 31, 2009. |
| (3) | | Period from November 1, 2009 through June 30, 2010. The Fund changed its fiscal year end from October 31 to June 30. |
| (4) | | Period from July 6, 2009 (inception date) through October 31, 2009. |
See Notes to Financial Statements.
80 | JUNE 30, 2013
Class A Shares
| | | | | | | | | | | |
| | | Perkins Select Value Fund | | |
| For a share outstanding during each year or period ended June 30 | | 2013 | | 2012(1) | | |
| |
| Net Asset Value, Beginning of Period | | | $10.82 | | | | $10.00 | | | |
| Income from Investment Operations: | | | | | | | | | | |
| Net investment income/(loss) | | | 0.11 | | | | 0.04 | | | |
| Net gain/(loss) on investments (both realized and unrealized) | | | 1.66 | | | | 0.78 | | | |
| Total from Investment Operations | | | 1.77 | | | | 0.82 | | | |
| Less Distributions: | | | | | | | | | | |
| Dividends (from net investment income)* | | | (0.10) | | | | – | | | |
| Distributions (from capital gains)* | | | (0.73) | | | | – | | | |
| Total Distributions | | | (0.83) | | | | – | | | |
| Net Asset Value, End of Period | | | $11.76 | | | | $10.82 | | | |
| Total Return** | | | 17.16% | | | | 8.20% | | | |
| Net Assets, End of Period (in thousands) | | | $109 | | | | $89 | | | |
| Average Net Assets for the Period (in thousands) | | | $108 | | | | $48 | | | |
| Ratio of Gross Expenses (Absent the Waiver of Certain Fees and Expense Offsets) to Average Net Assets*** | | | 1.35% | | | | 1.51% | | | |
| Ratio of Net Expenses (After Waivers and Expense Offsets) to Average Net Assets*** | | | 1.21% | | | | 1.26% | | | |
| Ratio of Net Investment Income to Average Net Assets*** | | | 1.13% | | | | 1.43% | | | |
| Portfolio Turnover Rate | | | 62% | | | | 80% | | | |
Class A Shares
| | | | | | | | | | | | | | | | | | | | | | | |
For a share outstanding during each year or period ended June 30 and
| | Perkins Small Cap Value Fund |
| the period ended October 31, 2009 | | 2013 | | 2012 | | 2011 | | 2010(2) | | 2009(3) | | |
| |
| Net Asset Value, Beginning of Period | | | $21.02 | | | | $24.89 | | | | $20.92 | | | | $19.48 | | | | $16.47 | | | |
| Income from Investment Operations: | | | | | | | | | | | | | | | | | | | | | | |
| Net investment income/(loss) | | | 0.15 | | | | 0.21 | | | | – | | | | 0.09 | | | | (0.07) | | | |
| Net gain/(loss) on investments (both realized and unrealized) | | | 3.56 | | | | (1.30) | | | | 4.68 | | | | 1.35 | | | | 3.08 | | | |
| Total from Investment Operations | | | 3.71 | | | | (1.09) | | | | 4.68 | | | | 1.44 | | | | 3.01 | | | |
| Less Distributions: | | | | | | | | | | | | | | | | | | | | | | |
| Dividends (from net investment income)* | | | (0.21) | | | | (0.02) | | | | (0.10) | | | | – | | | | – | | | |
| Distributions (from capital gains)* | | | (0.90) | | | | (2.76) | | | | (0.61) | | | | – | | | | – | | | |
| Total Distributions | | | (1.11) | | | | (2.78) | | | | (0.71) | | | | – | | | | – | | | |
| Net Asset Value, End of Period | | | $23.62 | | | | $21.02 | | | | $24.89 | | | | $20.92 | | | | $19.48 | | | |
| Total Return** | | | 18.27% | | | | (4.08)% | | | | 22.53% | | | | 7.39% | | | | 18.28% | | | |
| Net Assets, End of Period (in thousands) | | | $115,675 | | | | $141,049 | | | | $223,229 | | | | $86,403 | | | | $20,039 | | | |
| Average Net Assets for the Period (in thousands) | | | $128,765 | | | | $170,483 | | | | $181,662 | | | | $52,788 | | | | $13,537 | | | |
| Ratio of Gross Expenses (Absent the Waiver of Certain Fees and Expense Offsets) to Average Net Assets*** | | | 1.00% | | | | 1.40% | | | | 1.25% | | | | 1.21% | | | | 1.02% | | | |
| Ratio of Net Expenses (After Waivers and Expense Offsets) to Average Net Assets*** | | | 1.00% | | | | 1.25% | | | | 1.25% | | | | 1.21% | | | | 0.96% | | | |
| Ratio of Net Investment Income to Average Net Assets*** | | | 0.64% | | | | 0.96% | | | | 0.23% | | | | 0.06% | | | | 0.62% | | | |
| Portfolio Turnover Rate | | | 60% | | | | 62% | | | | 64% | | | | 39%^ | | | | 85% | | | |
| | | |
| * | | See Note 5 in Notes to Financial Statements. |
| ** | | Total return not annualized for periods of less than one full year. |
| *** | | Annualized for periods of less than one full year. |
| ^ | | Rate has been adjusted to conform with current year presentation. |
| (1) | | Period from December 15, 2011 (inception date) through June 30, 2012. |
| (2) | | Period from November 1, 2009 through June 30, 2010. The Fund changed its fiscal year end from October 31 to June 30. |
| (3) | | Period from July 6, 2009 (inception date) through October 31, 2009. |
See Notes to Financial Statements.
Janus Value Funds | 81
Financial Highlights (continued)
Class A Shares
| | | | | | | | | | | | | | | |
| | | Perkins Value Plus
| | |
| | | Income Fund | | |
| For a share outstanding during each year or period ended June 30 | | 2013 | | 2012 | | 2011(1) | | |
| |
| Net Asset Value, Beginning of Period | | | $10.86 | | | | $11.15 | | | | $10.00 | | | |
| Income from Investment Operations: | | | | | | | | | | | | | | |
| Net investment income | | | 0.30 | | | | 0.31 | | | | 0.29 | | | |
| Net gain on investments (both realized and unrealized) | | | 1.07 | | | | 0.10 | | | | 1.14 | | | |
| Total from Investment Operations | | | 1.37 | | | | 0.41 | | | | 1.43 | | | |
| Less Distributions: | | | | | | | | | | | | | | |
| Dividends (from net investment income)* | | | (0.29) | | | | (0.33) | | | | (0.24) | | | |
| Distributions (from capital gains)* | | | (0.26) | | | | (0.37) | | | | (0.04) | | | |
| Total Distributions | | | (0.55) | | | | (0.70) | | | | (0.28) | | | |
| Net Asset Value, End of Period | | | $11.68 | | | | $10.86 | | | | $11.15 | | | |
| Total Return** | | | 12.82% | | | | 3.97% | | | | 14.49% | | | |
| Net Assets, End of Period (in thousands) | | | $6,200 | | | | $5,057 | | | | $4,861 | | | |
| Average Net Assets for the Period (in thousands) | | | $5,545 | | | | $4,848 | | | | $3,951 | | | |
| Ratio of Gross Expenses (Absent the Waiver of Certain Fees and Expense Offsets) to Average Net Assets*** | | | 1.36% | | | | 1.50% | | | | 1.86% | | | |
| Ratio of Net Expenses (After Waivers and Expense Offsets) to Average Net Assets*** | | | 1.01% | | | | 1.02% | | | | 0.94% | | | |
| Ratio of Net Investment Income to Average Net Assets*** | | | 2.39% | | | | 2.83% | | | | 3.05% | | | |
| Portfolio Turnover Rate | | | 97% | | | | 100% | | | | 85%^ | | | |
| | | |
| * | | See Note 5 in Notes to Financial Statements. |
| ** | | Total return not annualized for periods of less than one full year. |
| *** | | Annualized for periods of less than one full year. |
| ^ | | Rate has been adjusted to conform with current year presentation. |
| (1) | | Period from July 30, 2010 (inception date) through June 30, 2011. |
See Notes to Financial Statements.
82 | JUNE 30, 2013
Class C Shares
| | | | | | | | | | | | | | | | | | | | | | | |
For a share outstanding during each year or period ended June 30 and the
| | Perkins Large Cap Value Fund |
| period ended July 31, 2009 | | 2013 | | 2012 | | 2011 | | 2010(1) | | 2009(2) | | |
| |
| Net Asset Value, Beginning of Period | | | $13.28 | | | | $14.00 | | | | $11.48 | | | | $11.11 | | | | $10.00 | | | |
| Income from Investment Operations: | | | | | | | | | | | | | | | | | | | | | | |
| Net investment income/(loss) | | | 0.06 | | | | 0.04 | | | | 0.05 | | | | (0.03) | | | | 0.02 | | | |
| Net gain/(loss) on investments (both realized and unrealized) | | | 2.44 | | | | (0.08) | | | | 2.82 | | | | 0.42 | | | | 1.09 | | | |
| Total from Investment Operations | | | 2.50 | | | | (0.04) | | | | 2.87 | | | | 0.39 | | | | 1.11 | | | |
| Less Distributions: | | | | | | | | | | | | | | | | | | | | | | |
| Dividends (from net investment income)* | | | (0.07) | | | | – | | | | (0.03) | | | | – | | | | – | | | |
| Distributions (from capital gains)* | | | (0.27) | | | | (0.68) | | | | (0.32) | | | | (0.02) | | | | – | | | |
| Total Distributions | | | (0.34) | | | | (0.68) | | | | (0.35) | | | | (0.02) | | | | – | | | |
| Net Asset Value, End of Period | | | $15.44 | | | | $13.28 | | | | $14.00 | | | | $11.48 | | | | $11.11 | | | |
| Total Return** | | | 19.08% | | | | 0.01% | | | | 25.21% | | | | 3.54% | | | | 11.10% | | | |
| Net Assets, End of Period (in thousands) | | | $3,014 | | | | $2,629 | | | | $2,797 | | | | $1,336 | | | | $556 | | | |
| Average Net Assets for the Period (in thousands) | | | $2,740 | | | | $2,157 | | | | $2,070 | | | | $929 | | | | $484 | | | |
| Ratio of Gross Expenses (Absent the Waiver of Certain Fees and Expense Offsets) to Average Net Assets*** | | | 1.80% | | | | 1.92% | | | | 1.96% | | | | 2.09% | | | | 2.90% | | | |
| Ratio of Net Expenses (After Waivers and Expense Offsets) to Average Net Assets*** | | | 1.80% | | | | 1.92% | | | | 1.96% | | | | 2.04% | | | | 1.97% | | | |
| Ratio of Net Investment Income/(Loss) to Average Net Assets*** | | | 0.38% | | | | 0.34% | | | | 0.31% | | | | (0.23)% | | | | 0.48% | | | |
| Portfolio Turnover Rate | | | 45% | | | | 52% | | | | 43% | | | | 32%^ | | | | 33%^ | | | |
Class C Shares
| | | | | | | | | | | | | | | | | | | | | | | |
For a share outstanding during each year or period ended June 30 and
| | Perkins Mid Cap Value Fund |
| the period ended October 31, 2009 | | 2013 | | 2012 | | 2011 | | 2010(3) | | 2009(4) | | |
| |
| Net Asset Value, Beginning of Period | | | $20.74 | | | | $23.50 | | | | $18.93 | | | | $18.62 | | | | $16.07 | | | |
| Income from Investment Operations: | | | | | | | | | | | | | | | | | | | | | | |
| Net investment income/(loss) | | | 0.03 | | | | 0.01 | | | | 0.04 | | | | (0.04) | | | | (0.05) | | | |
| Net gain/(loss) on investments (both realized and unrealized) | | | 3.70 | | | | (1.14) | | | | 4.53 | | | | 0.35 | | | | 2.60 | | | |
| Total from Investment Operations | | | 3.73 | | | | (1.13) | | | | 4.57 | | | | 0.31 | | | | 2.55 | | | |
| Less Distributions: | | | | | | | | | | | | | | | | | | | | | | |
| Dividends (from net investment income)* | | | (0.04) | | | | – | | | | –(5) | | | | – | | | | – | | | |
| Distributions (from capital gains)* | | | (0.78) | | | | (1.63) | | | | – | | | | – | | | | – | | | |
| Total Distributions | | | (0.82) | | | | (1.63) | | | | – | | | | – | | | | – | | | |
| Net Asset Value, End of Period | | | $23.65 | | | | $20.74 | | | | $23.50 | | | | $18.93 | | | | $18.62 | | | |
| Total Return** | | | 18.45% | | | | (4.58)% | | | | 24.17% | | | | 1.66% | | | | 15.87% | | | |
| Net Assets, End of Period (in thousands) | | | $189,096 | | | | $210,874 | | | | $242,324 | | | | $168,093 | | | | $121,166 | | | |
| Average Net Assets for the Period (in thousands) | | | $203,923 | | | | $217,116 | | | | $211,474 | | | | $155,180 | | | | $107,362 | | | |
| Ratio of Gross Expenses (Absent the Waiver of Certain Fees and Expense Offsets) to Average Net Assets*** | | | 1.72% | | | | 1.79% | | | | 1.87% | | | | 1.91% | | | | 2.00% | | | |
| Ratio of Net Expenses (After Waivers and Expense Offsets) to Average Net Assets*** | | | 1.71% | | | | 1.77% | | | | 1.87% | | | | 1.91% | | | | 1.97% | | | |
| Ratio of Net Investment Income/(Loss) to Average Net Assets*** | | | 0.24% | | | | 0.23% | | | | 0.11% | | | | (0.41)% | | | | (0.41)% | | | |
| Portfolio Turnover Rate | | | 60% | | | | 54% | | | | 66% | | | | 44%^ | | | | 88% | | | |
| | | |
| * | | See Note 5 in Notes to Financial Statements. |
| ** | | Total return not annualized for periods of less than one full year. |
| *** | | Annualized for periods of less than one full year. |
| ^ | | Rate has been adjusted to conform with current year presentation. |
| (1) | | Period from August 1, 2009 through June 30, 2010. The Fund changed its fiscal year end from July 31 to June 30. |
| (2) | | Period from December 31, 2008 (inception date) through July 31, 2009. |
| (3) | | Period from November 1, 2009 through June 30, 2010. The Fund changed its fiscal year end from October 31 to June 30. |
| (4) | | Period from July 6, 2009 (inception date) through October 31, 2009. |
| (5) | | Dividends (from net investment income) aggregated less than $0.01 on a per share basis. |
See Notes to Financial Statements.
Janus Value Funds | 83
Financial Highlights (continued)
Class C Shares
| | | | | | | | | | | |
| | | Perkins Select Value Fund | | |
| For a share outstanding during each year or period ended June 30 | | 2013 | | 2012(1) | | |
| |
| Net Asset Value, Beginning of Period | | | $10.78 | | | | $10.00 | | | |
| Income from Investment Operations: | | | | | | | | | | |
| Net investment income/(loss) | | | 0.03 | | | | 0.02 | | | |
| Net gain/(loss) on investments (both realized and unrealized) | | | 1.65 | | | | 0.76 | | | |
| Total from Investment Operations | | | 1.68 | | | | 0.78 | | | |
| Less Distributions: | | | | | | | | | | |
| Dividends (from net investment income)* | | | (0.05) | | | | – | | | |
| Distributions (from capital gains)* | | | (0.73) | | | | – | | | |
| Total Distributions | | | (0.78) | | | | – | | | |
| Net Asset Value, End of Period | | | $11.68 | | | | $10.78 | | | |
| Total Return** | | | 16.24% | | | | 7.80% | | | |
| Net Assets, End of Period (in thousands) | | | $124 | | | | $77 | | | |
| Average Net Assets for the Period (in thousands) | | | $103 | | | | $34 | | | |
| Ratio of Gross Expenses (Absent the Waiver of Certain Fees and Expense Offsets) to Average Net Assets*** | | | 2.05% | | | | 2.40% | | | |
| Ratio of Net Expenses (After Waivers and Expense Offsets) to Average Net Assets*** | | | 1.97% | | | | 1.99% | | | |
| Ratio of Net Investment Income/(Loss) to Average Net Assets*** | | | 0.36% | | | | 0.68% | | | |
| Portfolio Turnover Rate | | | 62% | | | | 80% | | | |
Class C Shares
| | | | | | | | | | | | | | | | | | | | | | | |
For a share outstanding during each year or period ended June 30 and the
| | Perkins Small Cap Value Fund |
| period ended October 31, 2009 | | 2013 | | 2012 | | 2011 | | 2010(2) | | 2009(3) | | |
| |
| Net Asset Value, Beginning of Period | | | $20.57 | | | | $24.57 | | | | $20.75 | | | | $19.43 | | | | $16.47 | | | |
| Income from Investment Operations: | | | | | | | | | | | | | | | | | | | | | | |
| Net investment income/(loss) | | | (0.15) | | | | 0.01 | | | | (0.18) | | | | 0.05 | | | | (0.10) | | | |
| Net gain/(loss) on investments (both realized and unrealized) | | | 3.61 | | | | (1.25) | | | | 4.63 | | | | 1.27 | | | | 3.06 | | | |
| Total from Investment Operations | | | 3.46 | | | | (1.24) | | | | 4.45 | | | | 1.32 | | | | 2.96 | | | |
| Less Distributions: | | | | | | | | | | | | | | | | | | | | | | |
| Dividends (from net investment income)* | | | – | | | | – | | | | (0.02) | | | | – | | | | – | | | |
| Distributions (from capital gains)* | | | (0.90) | | | | (2.76) | | | | (0.61) | | | | – | | | | – | | | |
| Total Distributions | | | (0.90) | | | | (2.76) | | | | (0.63) | | | | – | | | | – | | | |
| Net Asset Value, End of Period | | | $23.13 | | | | $20.57 | | | | $24.57 | | | | $20.75 | | | | $19.43 | | | |
| Total Return** | | | 17.31% | | | | (4.78)% | | | | 21.55% | | | | 6.79% | | | | 17.97% | | | |
| Net Assets, End of Period (in thousands) | | | $17,316 | | | | $21,434 | | | | $29,444 | | | | $26,768 | | | | $6,196 | | | |
| Average Net Assets for the Period (in thousands) | | | $18,953 | | | | $24,453 | | | | $29,169 | | | | $16,540 | | | | $3,739 | | | |
| Ratio of Gross Expenses (Absent the Waiver of Certain Fees and Expense Offsets) to Average Net Assets*** | | | 1.85% | | | | 2.05% | | | | 2.05% | | | | 1.96% | | | | 2.13% | | | |
| Ratio of Net Expenses (After Waivers and Expense Offsets) to Average Net Assets*** | | | 1.80% | | | | 1.99% | | | | 2.05% | | | | 1.96% | | | | 1.95% | | | |
| Ratio of Net Investment Income/(Loss) to Average Net Assets*** | | | (0.16)% | | | | 0.25% | | | | (0.52)% | | | | (0.69)% | | | | (0.39)% | | | |
| Portfolio Turnover Rate | | | 60% | | | | 62% | | | | 64% | | | | 39%^ | | | | 85% | | | |
| | | |
| * | | See Note 5 in Notes to Financial Statements. |
| ** | | Total return not annualized for periods of less than one full year. |
| *** | | Annualized for periods of less than one full year. |
| ^ | | Rate has been adjusted to conform with current year presentation. |
| (1) | | Period from December 15, 2011 (inception date) through June 30, 2012. |
| (2) | | Period from November 1, 2009 through June 30, 2010. The Fund changed its fiscal year end from October 31 to June 30. |
| (3) | | Period from July 6, 2009 (inception date) through October 31, 2009. |
See Notes to Financial Statements.
84 | JUNE 30, 2013
Class C Shares
| | | | | | | | | | | | | | | |
| | | Perkins Value Plus
| | |
| | | Income Fund | | |
| For a share outstanding during each year or period ended June 30 | | 2013 | | 2012 | | 2011(1) | | |
| |
| Net Asset Value, Beginning of Period | | | $10.89 | | | | $11.15 | | | | $10.00 | | | |
| Income from Investment Operations: | | | | | | | | | | | | | | |
| Net investment income | | | 0.21 | | | | 0.27 | | | | 0.22 | | | |
| Net gain on investments (both realized and unrealized) | | | 1.08 | | | | 0.09 | | | | 1.14 | | | |
| Total from Investment Operations | | | 1.29 | | | | 0.36 | | | | 1.36 | | | |
| Less Distributions: | | | | | | | | | | | | | | |
| Dividends (from net investment income)* | | | (0.21) | | | | (0.25) | | | | (0.17) | | | |
| Distributions (from capital gains)* | | | (0.26) | | | | (0.37) | | | | (0.04) | | | |
| Total Distributions | | | (0.47) | | | | (0.62) | | | | (0.21) | | | |
| Net Asset Value, End of Period | | | $11.71 | | | | $10.89 | | | | $11.15 | | | |
| Total Return** | | | 12.03% | | | | 3.55% | | | | 13.74% | | | |
| Net Assets, End of Period (in thousands) | | | $5,485 | | | | $4,815 | | | | $4,128 | | | |
| Average Net Assets for the Period (in thousands) | | | $5,223 | | | | $4,453 | | | | $3,701 | | | |
| Ratio of Gross Expenses (Absent the Waiver of Certain Fees and Expense Offsets) to Average Net Assets*** | | | 2.13% | | | | 1.87% | | | | 2.62% | | | |
| Ratio of Net Expenses (After Waivers and Expense Offsets) to Average Net Assets*** | | | 1.76% | | | | 1.38% | | | | 1.69% | | | |
| Ratio of Net Investment Income to Average Net Assets*** | | | 1.64% | | | | 2.48% | | | | 2.27% | | | |
| Portfolio Turnover Rate | | | 97% | | | | 100% | | | | 85%^ | | | |
| | | |
| * | | See Note 5 in Notes to Financial Statements. |
| ** | | Total return not annualized for periods of less than one full year. |
| *** | | Annualized for periods of less than one full year. |
| ^ | | Rate has been adjusted to conform with current year presentation. |
| (1) | | Period from July 30, 2010 (inception date) through June 30, 2011. |
See Notes to Financial Statements.
Janus Value Funds | 85
Financial Highlights (continued)
Class D Shares
| | | | | | | | | | | | | | | | | | | |
| | | Perkins Large Cap Value Fund | | |
| For a share outstanding during each year or period ended June 30 | | 2013 | | 2012 | | 2011 | | 2010(1) | | |
| |
| Net Asset Value, Beginning of Period | | | $13.39 | | | | $14.15 | | | | $11.58 | | | | $12.15 | | | |
| Income from Investment Operations: | | | | | | | | | | | | | | | | | | |
| Net investment income | | | 0.18 | | | | 0.17 | | | | 0.18 | | | | 0.02 | | | |
| Net gain/(loss) on investments (both realized and unrealized) | | | 2.48 | | | | (0.09) | | | | 2.85 | | | | (0.59) | | | |
| Total from Investment Operations | | | 2.66 | | | | 0.08 | | | | 3.03 | | | | (0.57) | | | |
| Less Distributions: | | | | | | | | | | | | | | | | | | |
| Dividends (from net investment income)* | | | (0.21) | | | | (0.16) | | | | (0.14) | | | | – | | | |
| Distributions (from capital gains)* | | | (0.27) | | | | (0.68) | | | | (0.32) | | | | – | | | |
| Total Distributions | | | (0.48) | | | | (0.84) | | | | (0.46) | | | | – | | | |
| Net Asset Value, End of Period | | | $15.57 | | | | $13.39 | | | | $14.15 | | | | $11.58 | | | |
| Total Return** | | | 20.25% | | | | 0.96% | | | | 26.41% | | | | (4.69)% | | | |
| Net Assets, End of Period (in thousands) | | | $32,031 | | | | $17,997 | | | | $15,001 | | | | $2,437 | | | |
| Average Net Assets for the Period (in thousands) | | | $24,538 | | | | $16,727 | | | | $7,705 | | | | $1,548 | | | |
| Ratio of Gross Expenses (Absent the Waiver of Certain Fees and Expense Offsets) to Average Net Assets*** | | | 0.84% | | | | 0.95% | | | | 0.92% | | | | 1.16% | | | |
| Ratio of Net Expenses (After Waivers and Expense Offsets) to Average Net Assets*** | | | 0.84% | | | | 0.95% | | | | 0.92% | | | | 1.16% | | | |
| Ratio of Net Investment Income to Average Net Assets*** | | | 1.36% | | | | 1.33% | | | | 1.26% | | | | 0.70% | | | |
| Portfolio Turnover Rate | | | 45% | | | | 52% | | | | 43% | | | | 32%^ | | | |
Class D Shares
| | | | | | | | | | | | | | | | | | | |
| | | Perkins Mid Cap Value Fund | | |
| For a share outstanding during each year or period ended June 30 | | 2013 | | 2012 | | 2011 | | 2010(1) | | |
| |
| Net Asset Value, Beginning of Period | | | $20.96 | | | | $23.71 | | | | $19.06 | | | | $19.52 | | | |
| Income from Investment Operations: | | | | | | | | | | | | | | | | | | |
| Net investment income | | | 0.30 | | | | 0.24 | | | | 0.26 | | | | 0.04 | | | |
| Net gain/(loss) on investments (both realized and unrealized) | | | 3.72 | | | | (1.16) | | | | 4.57 | | | | (0.50) | | | |
| Total from Investment Operations | | | 4.02 | | | | (0.92) | | | | 4.83 | | | | (0.46) | | | |
| Less Distributions: | | | | | | | | | | | | | | | | | | |
| Dividends (from net investment income)* | | | (0.17) | | | | (0.20) | | | | (0.18) | | | | – | | | |
| Distributions (from capital gains)* | | | (0.78) | | | | (1.63) | | | | – | | | | – | | | |
| Total Distributions | | | (0.95) | | | | (1.83) | | | | (0.18) | | | | – | | | |
| Net Asset Value, End of Period | | | $24.03 | | | | $20.96 | | | | $23.71 | | | | $19.06 | | | |
| Total Return** | | | 19.72% | | | | (3.57)% | | | | 25.40% | | | | (2.36)% | | | |
| Net Assets, End of Period (in thousands) | | | $869,066 | | | | $818,836 | | | | $936,795 | | | | $796,330 | | | |
| Average Net Assets for the Period (in thousands) | | | $840,920 | | | | $848,059 | | | | $896,522 | | | | $868,198 | | | |
| Ratio of Gross Expenses (Absent the Waiver of Certain Fees and Expense Offsets) to Average Net Assets*** | | | 0.68% | | | | 0.74% | | | | 0.88% | | | | 0.93% | | | |
| Ratio of Net Expenses (After Waivers and Expense Offsets) to Average Net Assets*** | | | 0.68% | | | | 0.74% | | | | 0.88% | | | | 0.93% | | | |
| Ratio of Net Investment Income to Average Net Assets*** | | | 1.27% | | | | 1.26% | | | | 1.14% | | | | 0.49% | | | |
| Portfolio Turnover Rate | | | 60% | | | | 54% | | | | 66% | | | | 44%^ | | | |
| | | |
| * | | See Note 5 in Notes to Financial Statements. |
| ** | | Total return not annualized for periods of less than one full year. |
| *** | | Annualized for periods of less than one full year. |
| ^ | | Rate has been adjusted to conform with current year presentation. |
| (1) | | Period from February 16, 2010 (inception date) through June 30, 2010. |
See Notes to Financial Statements.
86 | JUNE 30, 2013
Class D Shares
| | | | | | | | | | | |
| | | Perkins Select Value Fund | | |
| For a share outstanding during each year or period ended June 30 | | 2013 | | 2012(1) | | |
| |
| Net Asset Value, Beginning of Period | | | $10.83 | | | | $10.00 | | | |
| Income from Investment Operations: | | | | | | | | | | |
| Net investment income | | | 0.13 | | | | 0.04 | | | |
| Net gain/(loss) on investments (both realized and unrealized) | | | 1.66 | | | | 0.79 | | | |
| Total from Investment Operations | | | 1.79 | | | | 0.83 | | | |
| Less Distributions: | | | | | | | | | | |
| Dividends (from net investment income)* | | | (0.11) | | | | – | | | |
| Distributions (from capital gains)* | | | (0.73) | | | | – | | | |
| Total Distributions | | | (0.84) | | | | – | | | |
| Net Asset Value, End of Period | | | $11.78 | | | | $10.83 | | | |
| Total Return** | | | 17.34% | | | | 8.30% | | | |
| Net Assets, End of Period (in thousands) | | | $5,742 | | | | $3,004 | | | |
| Average Net Assets for the Period (in thousands) | | | $4,266 | | | | $1,593 | | | |
| Ratio of Gross Expenses (Absent the Waiver of Certain Fees and Expense Offsets) to Average Net Assets*** | | | 1.01% | | | | 1.74% | | | |
| Ratio of Net Expenses (After Waivers and Expense Offsets) to Average Net Assets*** | | | 1.01% | | | | 1.19% | | | |
| Ratio of Net Investment Income to Average Net Assets*** | | | 1.43% | | | | 1.37% | | | |
| Portfolio Turnover Rate | | | 62% | | | | 80% | | | |
Class D Shares
| | | | | | | | | | | | | | | | | | | |
| | | Perkins Small Cap Value Fund | | |
| For a share outstanding during each year or period ended June 30 | | 2013 | | 2012 | | 2011 | | 2010(2) | | |
| |
| Net Asset Value, Beginning of Period | | | $21.10 | | | | $24.96 | | | | $20.92 | | | | $20.79 | | | |
| Income from Investment Operations: | | | | | | | | | | | | | | | | | | |
| Net investment income | | | 0.20 | | | | 0.28 | | | | 0.09 | | | | 0.07 | | | |
| Net gain/(loss) on investments (both realized and unrealized) | | | 3.57 | | | | (1.30) | | | | 4.65 | | | | 0.06 | | | |
| Total from Investment Operations | | | 3.77 | | | | (1.02) | | | | 4.74 | | | | 0.13 | | | |
| Less Distributions: | | | | | | | | | | | | | | | | | | |
| Dividends (from net investment income)* | | | (0.31) | | | | (0.08) | | | | (0.09) | | | | – | | | |
| Distributions (from capital gains)* | | | (0.90) | | | | (2.76) | | | | (0.61) | | | | – | | | |
| Total Distributions | | | (1.21) | | | | (2.84) | | | | (0.70) | | | | – | | | |
| Net Asset Value, End of Period | | | $23.66 | | | | $21.10 | | | | $24.96 | | | | $20.92 | | | |
| Total Return** | | | 18.53% | | | | (3.75)% | | | | 22.83% | | | | 0.63% | | | |
| Net Assets, End of Period (in thousands) | | | $74,980 | | | | $72,646 | | | | $86,402 | | | | $78,237 | | | |
| Average Net Assets for the Period (in thousands) | | | $72,194 | | | | $75,800 | | | | $84,313 | | | | $74,758 | | | |
| Ratio of Gross Expenses (Absent the Waiver of Certain Fees and Expense Offsets) to Average Net Assets*** | | | 0.77% | | | | 0.95% | | | | 0.99% | | | | 0.98% | | | |
| Ratio of Net Expenses (After Waivers and Expense Offsets) to Average Net Assets*** | | | 0.77% | | | | 0.95% | | | | 0.99% | | | | 0.98% | | | |
| Ratio of Net Investment Income to Average Net Assets*** | | | 0.85% | | | | 1.30% | | | | 0.54% | | | | 0.12% | | | |
| Portfolio Turnover Rate | | | 60% | | | | 62% | | | | 64% | | | | 39%^ | | | |
| | | |
| * | | See Note 5 in Notes to Financial Statements. |
| ** | | Total return not annualized for periods of less than one full year. |
| *** | | Annualized for periods of less than one full year. |
| ^ | | Rate has been adjusted to conform with current year presentation. |
| (1) | | Period from December 15, 2011 (inception date) through June 30, 2012. |
| (2) | | Period from February 16, 2010 (inception date) through June 30, 2010. |
See Notes to Financial Statements.
Janus Value Funds | 87
Financial Highlights (continued)
Class D Shares
| | | | | | | | | | | | | | | |
| | | Perkins Value Plus
| | |
| | | Income Fund | | |
| For a share outstanding during each year or period ended June 30 | | 2013 | | 2012 | | 2011(1) | | |
| |
| Net Asset Value, Beginning of Period | | | $10.86 | | | | $11.15 | | | | $10.00 | | | |
| Income from Investment Operations: | | | | | | | | | | | | | | |
| Net investment income | | | 0.31 | | | | 0.32 | | | | 0.29 | | | |
| Net gain on investments (both realized and unrealized) | | | 1.08 | | | | 0.10 | | | | 1.16 | | | |
| Total from Investment Operations | | | 1.39 | | | | 0.42 | | | | 1.45 | | | |
| Less Distributions: | | | | | | | | | | | | | | |
| Dividends (from net investment income)* | | | (0.30) | | | | (0.34) | | | | (0.26) | | | |
| Distributions (from capital gains)* | | | (0.26) | | | | (0.37) | | | | (0.04) | | | |
| Total Distributions | | | (0.56) | | | | (0.71) | | | | (0.30) | | | |
| Net Asset Value, End of Period | | | $11.69 | | | | $10.86 | | | | $11.15 | | | |
| Total Return** | | | 13.02% | | | | 4.08% | | | | 14.62% | | | |
| Net Assets, End of Period (in thousands) | | | $24,811 | | | | $19,581 | | | | $12,627 | | | |
| Average Net Assets for the Period (in thousands) | | | $22,457 | | | | $16,050 | | | | $7,656 | | | |
| Ratio of Gross Expenses (Absent the Waiver of Certain Fees and Expense Offsets) to Average Net Assets*** | | | 1.24% | | | | 1.41% | | | | 1.73% | | | |
| Ratio of Net Expenses (After Waivers and Expense Offsets) to Average Net Assets*** | | | 0.91% | | | | 0.91% | | | | 0.79% | | | |
| Ratio of Net Investment Income to Average Net Assets*** | | | 2.50% | | | | 2.97% | | | | 3.33% | | | |
| Portfolio Turnover Rate | | | 97% | | | | 100% | | | | 85%^ | | | |
| | | |
| * | | See Note 5 in Notes to Financial Statements. |
| ** | | Total return not annualized for periods of less than one full year. |
| *** | | Annualized for periods of less than one full year. |
| ^ | | Rate has been adjusted to conform with current year presentation. |
| (1) | | Period from July 30, 2010 (inception date) through June 30, 2011. |
See Notes to Financial Statements.
88 | JUNE 30, 2013
Class I Shares
| | | | | | | | | | | | | | | | | | | | | | | |
For a share outstanding during each year or period ended June 30 and the
| | Perkins Large Cap Value Fund |
| period ended July 31, 2009 | | 2013 | | 2012 | | 2011 | | 2010(1) | | 2009(2) | | |
| |
| Net Asset Value, Beginning of Period | | | $13.42 | | | | $14.17 | | | | $11.58 | | | | $11.14 | | | | $10.00 | | | |
| Income from Investment Operations: | | | | | | | | | | | | | | | | | | | | | | |
| Net investment income | | | 0.31 | | | | 0.35 | | | | 0.19 | | | | 0.07 | | | | 0.04 | | | |
| Net gain/(loss) on investments (both realized and unrealized) | | | 2.37 | | | | (0.25) | | | | 2.85 | | | | 0.43 | | | | 1.13 | | | |
| Total from Investment Operations | | | 2.68 | | | | 0.10 | | | | 3.04 | | | | 0.50 | | | | 1.17 | | | |
| Less Distributions: | | | | | | | | | | | | | | | | | | | | | | |
| Dividends (from net investment income)* | | | (0.21) | | | | (0.17) | | | | (0.13) | | | | (0.04) | | | | (0.03) | | | |
| Distributions (from capital gains)* | | | (0.27) | | | | (0.68) | | | | (0.32) | | | | (0.02) | | | | – | | | |
| Total Distributions | | | (0.48) | | | | (0.85) | | | | (0.45) | | | | (0.06) | | | | (0.03) | | | |
| Net Asset Value, End of Period | | | $15.62 | | | | $13.42 | | | | $14.17 | | | | $11.58 | | | | $11.14 | | | |
| Total Return** | | | 20.43% | | | | 1.13% | | | | 26.57% | | | | 4.49% | | | | 11.76% | | | |
| Net Assets, End of Period (in thousands) | | | $40,943 | | | | $47,846 | | | | $112,360 | | | | $69,225 | | | | $28,863 | | | |
| Average Net Assets for the Period (in thousands) | | | $43,013 | | | | $106,448 | | | | $91,088 | | | | $53,625 | | | | $17,284 | | | |
| Ratio of Gross Expenses (Absent the Waiver of Certain Fees and Expense Offsets) to Average Net Assets*** | | | 0.71% | | | | 0.77% | | | | 0.84% | | | | 1.08% | | | | 2.15% | | | |
| Ratio of Net Expenses (After Waivers and Expense Offsets) to Average Net Assets*** | | | 0.71% | | | | 0.77% | | | | 0.84% | | | | 1.03% | | | | 1.00% | | | |
| Ratio of Net Investment Income to Average Net Assets*** | | | 1.47% | | | | 1.53% | | | | 1.45% | | | | 0.76% | | | | 1.36% | | | |
| Portfolio Turnover Rate | | | 45% | | | | 52% | | | | 43% | | | | 32%^ | | | | 33%^ | | | |
Class I Shares
| | | | | | | | | | | | | | | | | | | | | | | |
For a share outstanding during each year or period ended
| | Perkins Mid Cap Value Fund |
| June 30 and the period ended October 31, 2009 | | 2013 | | 2012 | | 2011 | | 2010(3) | | 2009(4) | | |
| |
| Net Asset Value, Beginning of Period | | | $20.95 | | | | $23.71 | | | | $19.07 | | | | $18.68 | | | | $16.07 | | | |
| Income from Investment Operations: | | | | | | | | | | | | | | | | | | | | | | |
| Net investment income | | | 0.34 | | | | 0.23 | | | | 0.25 | | | | 0.08 | | | | 0.01 | | | |
| Net gain/(loss) on investments (both realized and unrealized) | | | 3.68 | | | | (1.15) | | | | 4.59 | | | | 0.37 | | | | 2.60 | | | |
| Total from Investment Operations | | | 4.02 | | | | (0.92) | | | | 4.84 | | | | 0.45 | | | | 2.61 | | | |
| Less Distributions: | | | | | | | | | | | | | | | | | | | | | | |
| Dividends (from net investment income)* | | | (0.17) | | | | (0.21) | | | | (0.20) | | | | (0.06) | | | | – | | | |
| Distributions (from capital gains)* | | | (0.78) | | | | (1.63) | | | | – | | | | – | | | | – | | | |
| Total Distributions | | | (0.95) | | | | (1.84) | | | | (0.20) | | | | (0.06) | | | | – | | | |
| Net Asset Value, End of Period | | | $24.02 | | | | $20.95 | | | | $23.71 | | | | $19.07 | | | | $18.68 | | | |
| Total Return** | | | 19.71% | | | | (3.58)% | | | | 25.46% | | | | 2.40% | | | | 16.24% | | | |
| Net Assets, End of Period (in thousands) | | | $3,033,537 | | | | $3,412,395 | | | | $3,385,626 | | | | $2,223,203 | | | | $1,258,548 | | | |
| Average Net Assets for the Period (in thousands) | | | $3,245,850 | | | | $3,277,486 | | | | $2,900,600 | | | | $1,712,121 | | | | $1,058,484 | | | |
| Ratio of Gross Expenses (Absent the Waiver of Certain Fees and Expense Offsets) to Average Net Assets*** | | | 0.63% | | | | 0.73% | | | | 0.84% | | | | 0.83% | | | | 0.81% | | | |
| Ratio of Net Expenses (After Waivers and Expense Offsets) to Average Net Assets*** | | | 0.63% | | | | 0.73% | | | | 0.84% | | | | 0.83% | | | | 0.81% | | | |
| Ratio of Net Investment Income to Average Net Assets*** | | | 1.32% | | | | 1.28% | | | | 1.14% | | | | 0.63% | | | | 0.75% | | | |
| Portfolio Turnover Rate | | | 60% | | | | 54% | | | | 66% | | | | 44%^ | | | | 88% | | | |
| | | |
| * | | See Note 5 in Notes to Financial Statements. |
| ** | | Total return not annualized for periods of less than one full year. |
| *** | | Annualized for periods of less than one full year. |
| ^ | | Rate has been adjusted to conform with current year presentation. |
| (1) | | Period from August 1, 2009 through June 30, 2010. The Fund changed its fiscal year end from July 31 to June 30. |
| (2) | | Period from December 31, 2008 (inception date) through July 31, 2009. |
| (3) | | Period from November 1, 2009 through June 30, 2010. The Fund changed its fiscal year end from October 31 to June 30. |
| (4) | | Period from July 6, 2009 (inception date) through October 31, 2009. |
See Notes to Financial Statements.
Janus Value Funds | 89
Financial Highlights (continued)
Class I Shares
| | | | | | | | | | | |
| | | Perkins Select Value Fund | | |
| For a share outstanding during each year or period ended June 30 | | 2013 | | 2012(1) | | |
| |
| Net Asset Value, Beginning of Period | | | $10.83 | | | | $10.00 | | | |
| Income from Investment Operations: | | | | | | | | | | |
| Net investment income/(loss) | | | 0.15 | | | | 0.07 | | | |
| Net gain/(loss) on investments (both realized and unrealized) | | | 1.67 | | | | 0.76 | | | |
| Total from Investment Operations | | | 1.82 | | | | 0.83 | | | |
| Less Distributions: | | | | | | | | | | |
| Dividends (from net investment income)* | | | (0.12) | | | | – | | | |
| Distributions (from capital gains)* | | | (0.73) | | | | – | | | |
| Total Distributions | | | (0.85) | | | | – | | | |
| Net Asset Value, End of Period | | | $11.80 | | | | $10.83 | | | |
| Total Return** | | | 17.61% | | | | 8.30% | | | |
| Net Assets, End of Period (in thousands) | | | $64,631 | | | | $58,880 | | | |
| Average Net Assets for the Period (in thousands) | | | $61,876 | | | | $58,109 | | | |
| Ratio of Gross Expenses (Absent the Waiver of Certain Fees and Expense Offsets) to Average Net Assets*** | | | 0.87% | | | | 1.26% | | | |
| Ratio of Net Expenses (After Waivers and Expense Offsets) to Average Net Assets*** | | | 0.87% | | | | 1.02% | | | |
| Ratio of Net Investment Income to Average Net Assets*** | | | 1.46% | | | | 1.30% | | | |
| Portfolio Turnover Rate | | | 62% | | | | 80% | | | |
Class I Shares
| | | | | | | | | | | | | | | | | | | | | | | |
For a share outstanding during each year or period ended June 30
| | Perkins Small Cap Value Fund |
| and the period ended October 31, 2009 | | 2013 | | 2012 | | 2011 | | 2010(2) | | 2009(3) | | |
| |
| Net Asset Value, Beginning of Period | | | $21.13 | | | | $25.01 | | | | $20.97 | | | | $19.49 | | | | $16.47 | | | |
| Income from Investment Operations: | | | | | | | | | | | | | | | | | | | | | | |
| Net investment income/(loss) | | | 0.25 | | | | 0.29 | | | | 0.04 | | | | 0.11 | | | | (0.02) | | | |
| Net gain/(loss) on investments (both realized and unrealized) | | | 3.54 | | | | (1.31) | | | | 4.73 | | | | 1.37 | | | | 3.04 | | | |
| Total from Investment Operations | | | 3.79 | | | | (1.02) | | | | 4.77 | | | | 1.48 | | | | 3.02 | | | |
| Less Distributions: | | | | | | | | | | | | | | | | | | | | | | |
| Dividends (from net investment income)* | | | (0.32) | | | | (0.10) | | | | (0.12) | | | | – | | | | – | | | |
| Distributions (from capital gains)* | | | (0.90) | | | | (2.76) | | | | (0.61) | | | | – | | | | – | | | |
| Total Distributions | | | (1.22) | | | | (2.86) | | | | (0.73) | | | | – | | | | – | | | |
| Net Asset Value, End of Period | | | $23.70 | | | | $21.13 | | | | $25.01 | | | | $20.97 | | | | $19.49 | | | |
| Total Return** | | | 18.62% | | | | (3.74)% | | | | 22.89% | | | | 7.59% | | | | 18.34% | | | |
| Net Assets, End of Period (in thousands) | | | $821,829 | | | | $1,195,217 | | | | $1,317,183 | | | | $532,188 | | | | $236,437 | | | |
| Average Net Assets for the Period (in thousands) | | | $1,114,888 | | | | $1,214,236 | | | | $1,091,334 | | | | $408,417 | | | | $42,710 | | | |
| Ratio of Gross Expenses (Absent the Waiver of Certain Fees and Expense Offsets) to Average Net Assets*** | | | 0.71% | | | | 0.89% | | | | 0.93% | | | | 0.85% | | | | 0.77% | | | |
| Ratio of Net Expenses (After Waivers and Expense Offsets) to Average Net Assets*** | | | 0.71% | | | | 0.89% | | | | 0.93% | | | | 0.85% | | | | 0.75% | | | |
| Ratio of Net Investment Income to Average Net Assets*** | | | 0.94% | | | | 1.37% | | | | 0.55% | | | | 0.52% | | | | 0.80% | | | |
| Portfolio Turnover Rate | | | 60% | | | | 62% | | | | 64% | | | | 39%^ | | | | 85% | | | |
| | | |
| * | | See Note 5 in Notes to Financial Statements. |
| ** | | Total return not annualized for periods of less than one full year. |
| *** | | Annualized for periods of less than one full year. |
| ^ | | Rate has been adjusted to conform with current year presentation. |
| (1) | | Period from December 15, 2011 (inception date) through June 30, 2012. |
| (2) | | Period from November 1, 2009 through June 30, 2010. The Fund changed its fiscal year end from October 31 to June 30. |
| (3) | | Period from July 6, 2009 (inception date) through October 31, 2009. |
See Notes to Financial Statements.
90 | JUNE 30, 2013
Class I Shares
| | | | | | | | | | | | | | | |
| | | Perkins Value Plus
| | |
| | | Income Fund | | |
| For a share outstanding during each year or period ended June 30 | | 2013 | | 2012 | | 2011(1) | | |
| |
| Net Asset Value, Beginning of Period | | | $10.87 | | | | $11.15 | | | | $10.00 | | | |
| Income from Investment Operations: | | | | | | | | | | | | | | |
| Net investment income | | | 0.33 | | | | 0.33 | | | | 0.30 | | | |
| Net gain on investments (both realized and unrealized) | | | 1.07 | | | | 0.11 | | | | 1.15 | | | |
| Total from Investment Operations | | | 1.40 | | | | 0.44 | | | | 1.45 | | | |
| Less Distributions: | | | | | | | | | | | | | | |
| Dividends (from net investment income)* | | | (0.31) | | | | (0.35) | | | | (0.26) | | | |
| Distributions (from capital gains)* | | | (0.26) | | | | (0.37) | | | | (0.04) | | | |
| Total Distributions | | | (0.57) | | | | (0.72) | | | | (0.30) | | | |
| Net Asset Value, End of Period | | | $11.70 | | | | $10.87 | | | | $11.15 | | | |
| Total Return** | | | 13.16% | | | | 4.25% | | | | 14.66% | | | |
| Net Assets, End of Period (in thousands) | | | $9,903 | | | | $9,227 | | | | $7,860 | | | |
| Average Net Assets for the Period (in thousands) | | | $9,764 | | | | $8,365 | | | | $6,004 | | | |
| Ratio of Gross Expenses (Absent the Waiver of Certain Fees and Expense Offsets) to Average Net Assets*** | | | 1.10% | | | | 1.25% | | | | 1.61% | | | |
| Ratio of Net Expenses (After Waivers and Expense Offsets) to Average Net Assets*** | | | 0.76% | | | | 0.77% | | | | 0.77% | | | |
| Ratio of Net Investment Income to Average Net Assets*** | | | 2.63% | | | | 3.09% | | | | 3.27% | | | |
| Portfolio Turnover Rate | | | 97% | | | | 100% | | | | 85%^ | | | |
| | | |
| * | | See Note 5 in Notes to Financial Statements. |
| ** | | Total return not annualized for periods of less than one full year. |
| *** | | Annualized for periods of less than one full year. |
| ^ | | Rate has been adjusted to conform with current year presentation. |
| (1) | | Period from July 30, 2010 (inception date) through June 30, 2011. |
See Notes to Financial Statements.
Janus Value Funds | 91
Financial Highlights (continued)
Class L Shares
| | | | | | | | | | | | | | | | | | | | | | | | | | | |
For a share outstanding during each year or period ended
| | Perkins Mid Cap Value Fund | | |
| June 30 and each year ended October 31 | | 2013 | | 2012 | | 2011 | | 2010(1) | | 2009 | | 2008 | | |
| |
| Net Asset Value, Beginning of Period | | | $21.12 | | | | $23.90 | | | | $19.18 | | | | $18.79 | | | | $16.75 | | | | $26.69 | | | |
| Income from Investment Operations: | | | | | | | | | | | | | | | | | | | | | | | | | | |
| Net investment income | | | 2.82 | | | | 1.89 | | | | 0.73 | | | | 1.72 | | | | 0.23 | | | | 0.49 | | | |
| Net gain/(loss) on investments (both realized and unrealized) | | | 1.25 | | | | (2.82) | | | | 4.18 | | | | (1.28) | | | | 2.93 | | | | (7.31) | | | |
| Total from Investment Operations | | | 4.07 | | | | (0.93) | | | | 4.91 | | | | 0.44 | | | | 3.16 | | | | (6.82) | | | |
| Less Distributions: | | | | | | | | | | | | | | | | | | | | | | | | | | |
| Dividends (from net investment income)* | | | (0.15) | | | | (0.22) | | | | (0.19) | | | | (0.05) | | | | (0.33) | | | | (0.39) | | | |
| Distributions (from capital gains)* | | | (0.78) | | | | (1.63) | | | | – | | | | – | | | | (0.79) | | | | (2.73) | | | |
| Total Distributions | | | (0.93) | | | | (1.85) | | | | (0.19) | | | | (0.05) | | | | (1.12) | | | | (3.12) | | | |
| Net Asset Value, End of Period | | | $24.26 | | | | $21.12 | | | | $23.90 | | | | $19.18 | | | | $18.79 | | | | $16.75 | | | |
| Total Return** | | | 19.77% | | | | (3.59)% | | | | 25.66% | | | | 2.36% | | | | 20.67% | | | | (28.49)% | | | |
| Net Assets, End of Period (in thousands) | | | $24,332 | | | | $33,875 | | | | $63,549 | | | | $61,880 | | | | $350,003 | | | | $365,505 | | | |
| Average Net Assets for the Period (in thousands) | | | $29,252 | | | | $54,047 | | | | $66,281 | | | | $347,623 | | | | $298,741 | | | | $759,342 | | | |
| Ratio of Gross Expenses (Absent of Certain Fees and Expense Offsets) to Average Net Assets*** | | | 0.77% | | | | 0.84% | | | | 0.99% | | | | 1.02% | | | | 1.13% | | | | 1.04% | | | |
| Ratio of Net Expenses (After Waivers and Expense Offsets) to Average Net Assets*** | | | 0.60% | | | | 0.77% | | | | 0.74% | | | | 0.76% | | | | 0.87% | | | | 0.84% | | | |
| Ratio of Net Investment Income to Average Net Assets*** | | | 1.38% | | | | 1.27% | | | | 1.32% | | | | 0.85% | | | | 1.11% | | | | 1.76% | | | |
| Portfolio Turnover Rate | | | 60% | | | | 54% | | | | 66% | | | | 44%^ | | | | 88% | | | | 103% | | | |
Class L Shares
| | | | | | | | | | | | | | | | | | | | | | | | | | | |
For a share outstanding during each year or period ended
| | Perkins Small Cap Value Fund | | |
| June 30 and each year ended October 31 | | 2013 | | 2012 | | 2011 | | 2010(1) | | 2009 | | 2008 | | |
| |
| Net Asset Value, Beginning of Period | | | $21.45 | | | | $25.34 | | | | $21.21 | | | | $19.72 | | | | $18.24 | | | | $28.20 | | | |
| Income from Investment Operations: | | | | | | | | | | | | | | | | | | | | | | | | | | |
| Net investment income | | | 0.53 | | | | 0.31 | | | | 0.51 | | | | 0.18 | | | | 0.09 | | | | 0.33 | | | |
| Net gain/(loss) on investments (both realized and unrealized) | | | 3.34 | | | | (1.33) | | | | 4.34 | | | | 1.31 | | | | 3.45 | | | | (5.86) | | | |
| Total from Investment Operations | | | 3.87 | | | | (1.02) | | | | 4.85 | | | | 1.49 | | | | 3.54 | | | | (5.53) | | | |
| Less Distributions and Other: | | | | | | | | | | | | | | | | | | | | | | | | | | |
| Dividends (from net investment income)* | | | (0.34) | | | | (0.11) | | | | (0.11) | | | | – | | | | (0.38) | | | | (0.35) | | | |
| Distributions (from capital gains)* | | | (0.90) | | | | (2.76) | | | | (0.61) | | | | – | | | | (1.62) | | | | (4.08) | | | |
| Return of capital | | | N/A | | | | N/A | | | | N/A | | | | N/A | | | | (0.06) | | | | N/A | | | |
| Total Distributions and Other | | | (1.24) | | | | (2.87) | | | | (0.72) | | | | – | | | | (2.06) | | | | (4.43) | | | |
| Net Asset Value, End of Period | | | $24.08 | | | | $21.45 | | | | $25.34 | | | | $21.21 | | | | $19.72 | | | | $18.24 | | | |
| Total Return** | | | 18.74% | | | | (3.67)% | | | | 23.03% | | | | 7.56% | | | | 23.12% | | | | (22.39)% | | | |
| Net Assets, End of Period (in thousands) | | | $230,021 | | | | $280,294 | | | | $325,503 | | | | $657,562 | | | | $706,873 | | | | $563,464 | | | |
| Average Net Assets for the Period (in thousands) | | | $251,154 | | | | $287,560 | | | | $419,652 | | | | $706,615 | | | | $613,826 | | | | $664,935 | | | |
| Ratio of Gross Expenses (Absent of Certain Fees and Expense Offsets) to Average Net Assets*** | | | 0.83% | | | | 1.02% | | | | 1.08% | | | | 1.08% | | | | 1.10% | | | | 1.02% | | | |
| Ratio of Net Expenses (After Waivers and Expense Offsets) to Average Net Assets*** | | | 0.63% | | | | 0.79% | | | | 0.84% | | | | 0.83% | | | | 0.85% | | | | 0.81% | | | |
| Ratio of Net Investment Income to Average Net Assets*** | | | 1.00% | | | | 1.45% | | | | 0.76% | | | | 0.70% | | | | 1.28% | | | | 1.65% | | | |
| Portfolio Turnover Rate | | | 60% | | | | 62% | | | | 64% | | | | 39%^ | | | | 85% | | | | 112% | | | |
| | | |
| * | | See Note 5 in Notes to Financial Statements. |
| ** | | Total return not annualized for periods of less than one full year. |
| *** | | Annualized for periods of less than one full year. |
| ^ | | Rate has been adjusted to conform with current year presentation. |
| (1) | | Period from November 1, 2009 through June 30, 2010. The Fund changed its fiscal year end from October 31 to June 30. |
See Notes to Financial Statements.
92 | JUNE 30, 2013
Class N Shares
| | | | | | | | | | | | | | | | | | | |
| | | Perkins Large Cap Value Fund | | Perkins Mid Cap Value Fund | | |
| For a share outstanding during each year or period ended June 30 | | 2013 | | 2012(1) | | 2013 | | 2012(1) | | |
| |
| Net Asset Value, Beginning of Period | | | $13.43 | | | | $12.91 | | | | $20.95 | | | | $20.44 | | | |
| Income from Investment Operations: | | | | | | | | | | | | | | | | | | |
| Net investment income/(loss) | | | 0.16 | | | | – | | | | 0.31 | | | | (0.04) | | | |
| Net gain on investments (both realized and unrealized) | | | 2.53 | | | | 0.52 | | | | 3.74 | | | | 0.55 | | | |
| Total from Investment Operations | | | 2.69 | | | | 0.52 | | | | 4.05 | | | | 0.51 | | | |
| Less Distributions: | | | | | | | | | | | | | | | | | | |
| Dividends (from net investment income)* | | | (0.24) | | | | – | | | | (0.19) | | | | – | | | |
| Distributions (from capital gains)* | | | (0.27) | | | | – | | | | (0.78) | | | | – | | | |
| Total Distributions | | | (0.51) | | | | – | | | | (0.97) | | | | – | | | |
| Net Asset Value, End of Period | | | $15.61 | | | | $13.43 | | | | $24.03 | | | | $20.95 | | | |
| Total Return** | | | 20.45% | | | | 4.03% | | | | 19.89% | | | | 2.50% | | | |
| Net Assets, End of Period (in thousands) | | | $49,186 | | | | $66,766 | | | | $222,244 | | | | $21,405 | | | |
| Average Net Assets for the Period (in thousands) | | | $69,975 | | | | $48,137 | | | | $129,631 | | | | $8,142 | | | |
| Ratio of Gross Expenses (Absent the Waiver of Certain Fees and Expense Offsets) to Average Net Assets*** | | | 0.68% | | | | 0.72% | | | | 0.52% | | | | 0.58% | | | |
| Ratio of Net Expenses (After Waivers and Expense Offsets) to Average Net Assets*** | | | 0.68% | | | | 0.72% | | | | 0.52% | | | | 0.57% | | | |
| Ratio of Net Investment Income/(Loss) to Average Net Assets*** | | | 1.52% | | | | 0.66% | | | | 1.44% | | | | (3.02)% | | | |
| Portfolio Turnover Rate | | | 45% | | | | 52% | | | | 60% | | | | 54% | | | |
Class N Shares
| | | | | | | | | | | |
| | | Perkins Small Cap Value Fund | | |
| For a share outstanding during each year or period ended June 30 | | 2013 | | 2012(1) | | |
| |
| Net Asset Value, Beginning of Period | | | $21.14 | | | | $20.63 | | | |
| Income from Investment Operations: | | | | | | | | | | |
| Net investment income/(loss) | | | 0.33 | | | | (0.03) | | | |
| Net gain on investments (both realized and unrealized) | | | 3.49 | | | | 0.54 | | | |
| Total from Investment Operations | | | 3.82 | | | | 0.51 | | | |
| Less Distributions: | | | | | | | | | | |
| Dividends (from net investment income)* | | | (0.35) | | | | – | | | |
| Distributions (from capital gains)* | | | (0.90) | | | | – | | | |
| Total Distributions | | | (1.25) | | | | – | | | |
| Net Asset Value, End of Period | | | $23.71 | | | | $21.14 | | | |
| Total Return** | | | 18.78% | | | | 2.47% | | | |
| Net Assets, End of Period (in thousands) | | | $251,691 | | | | $12,300 | | | |
| Average Net Assets for the Period (in thousands) | | | $64,999 | | | | $8,788 | | | |
| Ratio of Gross Expenses (Absent the Waiver of Certain Fees and Expense Offsets) to Average Net Assets*** | | | 0.60% | | | | 0.63% | | | |
| Ratio of Net Expenses (After Waivers and Expense Offsets) to Average Net Assets*** | | | 0.60% | | | | 0.63% | | | |
| Ratio of Net Investment Income/(Loss) to Average Net Assets*** | | | 0.92% | | | | (1.65)% | | | |
| Portfolio Turnover Rate | | | 60% | | | | 62% | | | |
| | | |
| * | | See Note 5 in Notes to Financial Statements. |
| ** | | Total return not annualized for periods of less than one full year. |
| *** | | Annualized for periods of less than one full year. |
| (1) | | Period from May 31, 2012 (inception date) through June 30, 2012. |
See Notes to Financial Statements.
Janus Value Funds | 93
Financial Highlights (continued)
Class R Shares
| | | | | | | | | | | | | | | | | | | | | | | |
For a share outstanding during each year or period ended June 30 and
| | Perkins Mid Cap Value Fund |
| the period ended October 31, 2009 | | 2013 | | 2012 | | 2011 | | 2010(1) | | 2009(2) | | |
| |
| Net Asset Value, Beginning of Period | | | $20.86 | | | | $23.59 | | | | $19.00 | | | | $18.64 | | | | $16.07 | | | |
| Income from Investment Operations: | | | | | | | | | | | | | | | | | | | | | | |
| Net investment income/(loss) | | | 0.16 | | | | 0.10 | | | | 0.12 | | | | – | | | | (0.03) | | | |
| Net gain/(loss) on investments (both realized and unrealized) | | | 3.69 | | | | (1.14) | | | | 4.56 | | | | 0.36 | | | | 2.60 | | | |
| Total from Investment Operations | | | 3.85 | | | | (1.04) | | | | 4.68 | | | | 0.36 | | | | 2.57 | | | |
| Less Distributions: | | | | | | | | | | | | | | | | | | | | | | |
| Dividends (from net investment income)* | | | (0.10) | | | | (0.06) | | | | (0.09) | | | | – | | | | – | | | |
| Distributions (from capital gains)* | | | (0.78) | | | | (1.63) | | | | – | | | | – | | | | – | | | |
| Total Distributions | | | (0.88) | | | | (1.69) | | | | (0.09) | | | | – | | | | – | | | |
| Net Asset Value, End of Period | | | $23.83 | | | | $20.86 | | | | $23.59 | | | | $19.00 | | | | $18.64 | | | |
| Total Return** | | | 18.97% | | | | (4.15)% | | | | 24.64% | | | | 1.93% | | | | 15.99% | | | |
| Net Assets, End of Period (in thousands) | | | $163,302 | | | | $161,056 | | | | $170,602 | | | | $103,961 | | | | $71,203 | | | |
| Average Net Assets for the Period (in thousands) | | | $162,747 | | | | $157,701 | | | | $146,674 | | | | $94,163 | | | | $64,070 | | | |
| Ratio of Gross Expenses (Absent the Waiver of Certain Fees and Expense Offsets) to Average Net Assets*** | | | 1.26% | | | | 1.34% | | | | 1.49% | | | | 1.52% | | | | 1.53% | | | |
| Ratio of Net Expenses (After Waivers and Expense Offsets) to Average Net Assets*** | | | 1.26% | | | | 1.34% | | | | 1.49% | | | | 1.52% | | | | 1.53% | | | |
| Ratio of Net Investment Income/(Loss) to Average Net Assets*** | | | 0.69% | | | | 0.66% | | | | 0.47% | | | | (0.04)% | | | | 0.03% | | | |
| Portfolio Turnover Rate | | | 60% | | | | 54% | | | | 66% | | | | 44%^ | | | | 88% | | | |
Class R Shares
| | | | | | | | | | | | | | | | | | | | | | | |
For a share outstanding during each year or period ended June 30 and the
| | Perkins Small Cap Value Fund |
| period ended October 31, 2009 | | 2013 | | 2012 | | 2011 | | 2010(1) | | 2009(2) | | |
| |
| Net Asset Value, Beginning of Period | | | $20.81 | | | | $24.71 | | | | $20.83 | | | | $19.46 | | | | $16.47 | | | |
| Income from Investment Operations: | | | | | | | | | | | | | | | | | | | | | | |
| Net investment income/(loss) | | | 0.04 | | | | 0.15 | | | | (0.04) | | | | 0.11 | | | | (0.12) | | | |
| Net gain/(loss) on investments (both realized and unrealized) | | | 3.56 | | | | (1.29) | | | | 4.61 | | | | 1.26 | | | | 3.11 | | | |
| Total from Investment Operations | | | 3.60 | | | | (1.14) | | | | 4.57 | | | | 1.37 | | | | 2.99 | | | |
| Less Distributions: | | | | | | | | | | | | | | | | | | | | | | |
| Dividends (from net investment income)* | | | (0.17) | | | | – | | | | (0.08) | | | | – | | | | – | | | |
| Distributions (from capital gains)* | | | (0.90) | | | | (2.76) | | | | (0.61) | | | | – | | | | – | | | |
| Total Distributions | | | (1.07) | | | | (2.76) | | | | (0.69) | | | | – | | | | – | | | |
| Net Asset Value, End of Period | | | $23.34 | | | | $20.81 | | | | $24.71 | | | | $20.83 | | | | $19.46 | | | |
| Total Return** | | | 17.87% | | | | (4.32)% | | | | 22.10% | | | | 7.04% | | | | 18.15% | | | |
| Net Assets, End of Period (in thousands) | | | $30,415 | | | | $31,997 | | | | $38,302 | | | | $21,450 | | | | $3,734 | | | |
| Average Net Assets for the Period (in thousands) | | | $31,106 | | | | $34,159 | | | | $32,917 | | | | $8,368 | | | | $3,362 | | | |
| Ratio of Gross Expenses (Absent the Waiver of Certain Fees and Expense Offsets) to Average Net Assets*** | | | 1.34% | | | | 1.53% | | | | 1.60% | | | | 1.57% | | | | 1.54% | | | |
| Ratio of Net Expenses (After Waivers and Expense Offsets) to Average Net Assets*** | | | 1.34% | | | | 1.53% | | | | 1.60% | | | | 1.57% | | | | 1.54% | | | |
| Ratio of Net Investment Income/(Loss) to Average Net Assets*** | | | 0.29% | | | | 0.73% | | | | (0.10)% | | | | (0.28)% | | | | 0.10% | | | |
| Portfolio Turnover Rate | | | 60% | | | | 62% | | | | 64% | | | | 39%^ | | | | 85% | | | |
| | | |
| * | | See Note 5 in Notes to Financial Statements. |
| ** | | Total return not annualized for periods of less than one full year. |
| *** | | Annualized for periods of less than one full year. |
| ^ | | Rate has been adjusted to conform with current year presentation. |
| (1) | | Period from November 1, 2009 through June 30, 2010. The Fund changed its fiscal year end from October 31 to June 30. |
| (2) | | Period from July 6, 2009 (inception date) through October 31, 2009. |
See Notes to Financial Statements.
94 | JUNE 30, 2013
Class S Shares
| | | | | | | | | | | | | | | | | | | | | | | |
For a share outstanding during each year or period ended June 30 and the
| | Perkins Large Cap Value Fund |
| period ended July 31, 2009 | | 2013 | | 2012 | | 2011 | | 2010(1) | | 2009(2) | | |
| |
| Net Asset Value, Beginning of Period | | | $13.41 | | | | $14.15 | | | | $11.56 | | | | $11.13 | | | | $10.00 | | | |
| Income from Investment Operations: | | | | | | | | | | | | | | | | | | | | | | |
| Net investment income/(loss) | | | 0.27 | | | | 0.14 | | | | 0.14 | | | | 0.03 | | | | 0.04 | | | |
| Net gain/(loss) on investments (both realized and unrealized) | | | 2.34 | | | | (0.10) | | | | 2.84 | | | | 0.42 | | | | 1.10 | | | |
| Total from Investment Operations | | | 2.61 | | | | 0.04 | | | | 2.98 | | | | 0.45 | | | | 1.14 | | | |
| Less Distributions: | | | | | | | | | | | | | | | | | | | | | | |
| Dividends (from net investment income)* | | | (0.13) | | | | (0.10) | | | | (0.07) | | | | – | | | | (0.01) | | | |
| Distributions (from capital gains)* | | | (0.27) | | | | (0.68) | | | | (0.32) | | | | (0.02) | | | | – | | | |
| Total Distributions | | | (0.40) | | | | (0.78) | | | | (0.39) | | | | (0.02) | | | | (0.01) | | | |
| Net Asset Value, End of Period | | | $15.62 | | | | $13.41 | | | | $14.15 | | | | $11.56 | | | | $11.13 | | | |
| Total Return** | | | 19.84% | | | | 0.67% | | | | 26.01% | | | | 4.07% | | | | 11.40% | | | |
| Net Assets, End of Period (in thousands) | | | $480 | | | | $680 | | | | $685 | | | | $580 | | | | $557 | | | |
| Average Net Assets for the Period (in thousands) | | | $508 | | | | $656 | | | | $685 | | | | $616 | | | | $484 | | | |
| Ratio of Gross Expenses (Absent the Waiver of Certain Fees and Expense Offsets) to Average Net Assets*** | | | 1.19% | | | | 1.25% | | | | 1.34% | | | | 1.65% | | | | 2.32% | | | |
| Ratio of Net Expenses (After Waivers and Expense Offsets) to Average Net Assets*** | | | 1.19% | | | | 1.19% | | | | 1.34% | | | | 1.53% | | | | 1.47% | | | |
| Ratio of Net Investment Income to Average Net Assets*** | | | 0.98% | | | | 1.08% | | | | 0.97% | | | | 0.28% | | | | 0.98% | | | |
| Portfolio Turnover Rate | | | 45% | | | | 52% | | | | 43% | | | | 32%^ | | | | 33%^ | | | |
Class S Shares
| | | | | | | | | | | | | | | | | | | | | | | |
For a share outstanding during each year or period ended June 30 and
| | Perkins Mid Cap Value Fund |
| the period ended October 31, 2009 | | 2013 | | 2012 | | 2011 | | 2010(3) | | 2009(4) | | |
| |
| Net Asset Value, Beginning of Period | | | $20.90 | | | | $23.64 | | | | $19.03 | | | | $18.66 | | | | $16.07 | | | |
| Income from Investment Operations: | | | | | | | | | | | | | | | | | | | | | | |
| Net investment income/(loss) | | | 0.23 | | | | 0.16 | | | | 0.17 | | | | 0.03 | | | | (0.02) | | | |
| Net gain/(loss) on investments (both realized and unrealized) | | | 3.69 | | | | (1.15) | | | | 4.56 | | | | 0.36 | | | | 2.61 | | | |
| Total from Investment Operations | | | 3.92 | | | | (0.99) | | | | 4.73 | | | | 0.39 | | | | 2.59 | | | |
| Less Distributions: | | | | | | | | | | | | | | | | | | | | | | |
| Dividends (from net investment income)* | | | (0.13) | | | | (0.12) | | | | (0.12) | | | | (0.02) | | | | – | | | |
| Distributions (from capital gains)* | | | (0.78) | | | | (1.63) | | | | – | | | | – | | | | – | | | |
| Total Distributions | | | (0.91) | | | | (1.75) | | | | (0.12) | | | | (0.02) | | | | – | | | |
| Net Asset Value, End of Period | | | $23.91 | | | | $20.90 | | | | $23.64 | | | | $19.03 | | | | $18.66 | | | |
| Total Return** | | | 19.27% | | | | (3.90)% | | | | 24.91% | | | | 2.09% | | | | 16.12% | | | |
| Net Assets, End of Period (in thousands) | | | $709,171 | | | | $794,421 | | | | $834,778 | | | | $569,777 | | | | $434,615 | | | |
| Average Net Assets for the Period (in thousands) | | | $770,990 | | | | $795,213 | | | | $742,692 | | | | $559,518 | | | | $397,613 | | | |
| Ratio of Gross Expenses (Absent the Waiver of Certain Fees and Expense Offsets) to Average Net Assets*** | | | 1.02% | | | | 1.09% | | | | 1.24% | | | | 1.27% | | | | 1.28% | | | |
| Ratio of Net Expenses (After Waivers and Expense Offsets) to Average Net Assets*** | | | 1.01% | | | | 1.09% | | | | 1.24% | | | | 1.27% | | | | 1.28% | | | |
| Ratio of Net Investment Income to Average Net Assets*** | | | 0.93% | | | | 0.92% | | | | 0.74% | | | | 0.22% | | | | 0.28% | | | |
| Portfolio Turnover Rate | | | 60% | | | | 54% | | | | 66% | | | | 44%^ | | | | 88% | | | |
| | | |
| * | | See Note 5 in Notes to Financial Statements. |
| ** | | Total return not annualized for periods of less than one full year. |
| *** | | Annualized for periods of less than one full year. |
| ^ | | Rate has been adjusted to conform with current year presentation. |
| (1) | | Period from August 1, 2009 through June 30, 2010. The Fund changed its fiscal year end from July 31 to June 30. |
| (2) | | Period from December 31, 2008 (inception date) through July 31, 2009. |
| (3) | | Period from November 1, 2009 through June 30, 2010. The Fund changed its fiscal year end from October 31 to June 30. |
| (4) | | Period from July 6, 2009 (inception date) through October 31, 2009. |
See Notes to Financial Statements.
Janus Value Funds | 95
Financial Highlights (continued)
Class S Shares
| | | | | | | | | | | |
| | | Perkins Select Value Fund | | |
| For a share outstanding during each year or period ended June 30 | | 2013 | | 2012(1) | | |
| |
| Net Asset Value, Beginning of Period | | | $10.81 | | | | $10.00 | | | |
| Income from Investment Operations: | | | | | | | | | | |
| Net investment income/(loss) | | | 0.09 | | | | 0.04 | | | |
| Net gain/(loss) on investments (both realized and unrealized) | | | 1.66 | | | | 0.77 | | | |
| Total from Investment Operations | | | 1.75 | | | | 0.81 | | | |
| Less Distributions: | | | | | | | | | | |
| Dividends (from net investment income)* | | | (0.06) | | | | – | | | |
| Distributions (from capital gains)* | | | (0.73) | | | | – | | | |
| Total Distributions | | | (0.79) | | | | – | | | |
| Net Asset Value, End of Period | | | $11.77 | | | | $10.81 | | | |
| Total Return** | | | 16.91% | | | | 8.10% | | | |
| Net Assets, End of Period (in thousands) | | | $13 | | | | $11 | | | |
| Average Net Assets for the Period (in thousands) | | | $12 | | | | $11 | | | |
| Ratio of Gross Expenses (Absent the Waiver of Certain Fees and Expense Offsets) to Average Net Assets*** | | | 1.52% | | | | 1.70% | | | |
| Ratio of Net Expenses (After Waivers and Expense Offsets) to Average Net Assets*** | | | 1.40% | | | | 1.47% | | | |
| Ratio of Net Investment Income to Average Net Assets*** | | | 0.94% | | | | 0.78% | | | |
| Portfolio Turnover Rate | | | 62% | | | | 80% | | | |
Class S Shares
| | | | | | | | | | | | | | | | | | | | | | | |
For a share outstanding during each year or period ended June 30 and the
| | Perkins Small Cap Value Fund |
| period ended October 31, 2009 | | 2013 | | 2012 | | 2011 | | 2010(2) | | 2009(3) | | |
| |
| Net Asset Value, Beginning of Period | | | $20.97 | | | | $24.84 | | | | $20.88 | | | | $19.47 | | | | $16.47 | | | |
| Income from Investment Operations: | | | | | | | | | | | | | | | | | | | | | | |
| Net investment income/(loss) | | | 0.12 | | | | 0.20 | | | | – | | | | 0.11 | | | | (0.10) | | | |
| Net gain/(loss) on investments (both realized and unrealized) | | | 3.57 | | | | (1.30) | | | | 4.65 | | | | 1.30 | | | | 3.10 | | | |
| Total from Investment Operations | | | 3.69 | | | | (1.10) | | | | 4.65 | | | | 1.41 | | | | 3.00 | | | |
| Less Distributions: | | | | | | | | | | | | | | | | | | | | | | |
| Dividends (from net investment income)* | | | (0.23) | | | | (0.01) | | | | (0.08) | | | | – | | | | – | | | |
| Distributions (from capital gains)* | | | (0.90) | | | | (2.76) | | | | (0.61) | | | | – | | | | – | | | |
| Total Distributions | | | (1.13) | | | | (2.77) | | | | (0.69) | | | | – | | | | – | | | |
| Net Asset Value, End of Period | | | $23.53 | | | | $20.97 | | | | $24.84 | | | | $20.88 | | | | $19.47 | | | |
| Total Return** | | | 18.19% | | | | (4.11)% | | | | 22.40% | | | | 7.24% | | | | 18.21% | | | |
| Net Assets, End of Period (in thousands) | | | $80,862 | | | | $93,910 | | | | $106,549 | | | | $51,460 | | | | $26,401 | | | |
| Average Net Assets for the Period (in thousands) | | | $86,346 | | | | $94,960 | | | | $83,981 | | | | $44,047 | | | | $24,792 | | | |
| Ratio of Gross Expenses (Absent the Waiver of Certain Fees and Expense Offsets) to Average Net Assets*** | | | 1.10% | | | | 1.28% | | | | 1.35% | | | | 1.32% | | | | 1.29% | | | |
| Ratio of Net Expenses (After Waivers and Expense Offsets) to Average Net Assets*** | | | 1.10% | | | | 1.28% | | | | 1.35% | | | | 1.32% | | | | 1.20% | | | |
| Ratio of Net Investment Income to Average Net Assets*** | | | 0.53% | | | | 0.97% | | | | 0.14% | | | | 0.07% | | | | 0.46% | | | |
| Portfolio Turnover Rate | | | 60% | | | | 62% | | | | 64% | | | | 39%^ | | | | 85% | | | |
| | | |
| * | | See Note 5 in Notes to Financial Statements. |
| ** | | Total return not annualized for periods of less than one full year. |
| *** | | Annualized for periods of less than one full year. |
| ^ | | Rate has been adjusted to conform with current year presentation. |
| (1) | | Period from December 15, 2011 (inception date) through June 30, 2012. |
| (2) | | Period from November 1, 2009 through June 30, 2010. The Fund changed its fiscal year end from October 31 to June 30. |
| (3) | | Period from July 6, 2009 (inception date) through October 31, 2009. |
See Notes to Financial Statements.
96 | JUNE 30, 2013
Class S Shares
| | | | | | | | | | | | | | | |
| | | Perkins Value Plus
| | |
| | | Income Fund | | |
| For a share outstanding during each year or period ended June 30 | | 2013 | | 2012 | | 2011(1) | | |
| |
| Net Asset Value, Beginning of Period | | | $10.86 | | | | $11.15 | | | | $10.00 | | | |
| Income from Investment Operations: | | | | | | | | | | | | | | |
| Net investment income | | | 0.28 | | | | 0.29 | | | | 0.27 | | | |
| Net gain on investments (both realized and unrealized) | | | 1.08 | | | | 0.09 | | | | 1.14 | | | |
| Total from Investment Operations | | | 1.36 | | | | 0.38 | | | | 1.41 | | | |
| Less Distributions: | | | | | | | | | | | | | | |
| Dividends (from net investment income)* | | | (0.27) | | | | (0.30) | | | | (0.22) | | | |
| Distributions (from capital gains)* | | | (0.26) | | | | (0.37) | | | | (0.04) | | | |
| Total Distributions | | | (0.53) | | | | (0.67) | | | | (0.26) | | | |
| Net Asset Value, End of Period | | | $11.69 | | | | $10.86 | | | | $11.15 | | | |
| Total Return** | | | 12.79% | | | | 3.74% | | | | 14.24% | | | |
| Net Assets, End of Period (in thousands) | | | $4,453 | | | | $3,950 | | | | $3,808 | | | |
| Average Net Assets for the Period (in thousands) | | | $4,258 | | | | $3,784 | | | | $3,596 | | | |
| Ratio of Gross Expenses (Absent the Waiver of Certain Fees and Expense Offsets) to Average Net Assets*** | | | 1.59% | | | | 1.73% | | | | 2.12% | | | |
| Ratio of Net Expenses (After Waivers and Expense Offsets) to Average Net Assets*** | | | 1.15% | | | | 1.21% | | | | 1.20% | | | |
| Ratio of Net Investment Income to Average Net Assets*** | | | 2.25% | | | | 2.64% | | | | 2.75% | | | |
| Portfolio Turnover Rate | | | 97% | | | | 100% | | | | 85%^ | | | |
| | | |
| * | | See Note 5 in Notes to Financial Statements. |
| ** | | Total return not annualized for periods of less than one full year. |
| *** | | Annualized for periods of less than one full year. |
| ^ | | Rate has been adjusted to conform with current year presentation. |
| (1) | | Period from July 30, 2010 (inception date) through June 30, 2011. |
See Notes to Financial Statements.
Janus Value Funds | 97
Financial Highlights (continued)
Class T Shares
| | | | | | | | | | | | | | | | | | | | | | | |
For a share outstanding during each year or period ended June 30 and the
| | Perkins Large Cap Value Fund |
| period ended July 31, 2009 | | 2013 | | 2012 | | 2011 | | 2010(1) | | 2009(2) | | |
| |
| Net Asset Value, Beginning of Period | | | $13.37 | | | | $14.13 | | | | $11.56 | | | | $11.13 | | | | $10.22 | | | |
| Income from Investment Operations: | | | | | | | | | | | | | | | | | | | | | | |
| Net investment income | | | 0.17 | | | | 0.16 | | | | 0.17 | | | | 0.04 | | | | – | | | |
| Net gain/(loss) on investments (both realized and unrealized) | | | 2.48 | | | | (0.10) | | | | 2.85 | | | | 0.44 | | | | 0.91 | | | |
| Total from Investment Operations | | | 2.65 | | | | 0.06 | | | | 3.02 | | | | 0.48 | | | | 0.91 | | | |
| Less Distributions: | | | | | | | | | | | | | | | | | | | | | | |
| Dividends (from net investment income)* | | | (0.20) | | | | (0.14) | | | | (0.13) | | | | (0.03) | | | | – | | | |
| Distributions (from capital gains)* | | | (0.27) | | | | (0.68) | | | | (0.32) | | | | (0.02) | | | | – | | | |
| Total Distributions | | | (0.47) | | | | (0.82) | | | | (0.45) | | | | (0.05) | | | | – | | | |
| Net Asset Value, End of Period | | | $15.55 | | | | $13.37 | | | | $14.13 | | | | $11.56 | | | | $11.13 | | | |
| Total Return** | | | 20.21% | | | | 0.84% | | | | 26.37% | | | | 4.32% | | | | 8.90% | | | |
| Net Assets, End of Period (in thousands) | | | $3,055 | | | | $2,262 | | | | $2,211 | | | | $594 | | | | $1 | | | |
| Average Net Assets for the Period (in thousands) | | | $2,531 | | | | $2,236 | | | | $1,402 | | | | $142 | | | | $1 | | | |
| Ratio of Gross Expenses (Absent the Waiver of Certain Fees and Expense Offsets) to Average Net Assets*** | | | 0.94% | | | | 1.00% | | | | 1.05% | | | | 1.29% | | | | 4.49% | | | |
| Ratio of Net Expenses (After Waivers and Expense Offsets) to Average Net Assets*** | | | 0.94% | | | | 1.00% | | | | 1.05% | | | | 1.29% | | | | 1.25% | | | |
| Ratio of Net Investment Income to Average Net Assets*** | | | 1.25% | | | | 1.27% | | | | 1.16% | | | | 0.53% | | | | 1.39% | | | |
| Portfolio Turnover Rate | | | 45% | | | | 52% | | | | 43% | | | | 32%^ | | | | 33%^ | | | |
Class T Shares
| | | | | | | | | | | | | | | | | | | | | | | | | | | |
For a share outstanding during each year or
| | | | | | | | | | | | | | |
period ended June 30 and each year ended
| | Perkins Mid Cap Value Fund | | |
| October 31 | | 2013 | | 2012 | | 2011 | | 2010(3) | | 2009 | | 2008 | | |
| |
| Net Asset Value, Beginning of Period | | | $20.96 | | | | $23.70 | | | | $19.06 | | | | $18.67 | | | | $16.63 | | | | $26.56 | | | |
| Income from Investment Operations: | | | | | | | | | | | | | | | | | | | | | | | | | | |
| Net investment income | | | 0.32 | | | | 0.23 | | | | 0.24 | | | | 0.06 | | | | 0.11 | | | | 0.29 | | | |
| Net gain/(loss) on investments (both realized and unrealized) | | | 3.67 | | | | (1.17) | | | | 4.56 | | | | 0.37 | | | | 2.97 | | | | (7.09) | | | |
| Total from Investment Operations | | | 3.99 | | | | (0.94) | | | | 4.80 | | | | 0.43 | | | | 3.08 | | | | (6.80) | | | |
| Less Distributions: | | | | | | | | | | | | | | | | | | | | | | | | | | |
| Dividends (from net investment income)* | | | (0.16) | | | | (0.17) | | | | (0.16) | | | | (0.04) | | | | (0.25) | | | | (0.40) | | | |
| Distributions (from capital gains)* | | | (0.78) | | | | (1.63) | | | | – | | | | – | | | | (0.79) | | | | (2.73) | | | |
| Total Distributions | | | (0.94) | | | | (1.80) | | | | (0.16) | | | | (0.04) | | | | (1.04) | | | | (3.13) | | | |
| Net Asset Value, End of Period | | | $24.01 | | | | $20.96 | | | | $23.70 | | | | $19.06 | | | | $18.67 | | | | $16.63 | | | |
| Total Return** | | | 19.56% | | | | (3.66)% | | | | 25.24% | | | | 2.27% | | | | 20.27% | | | | (28.59)% | | | |
| Net Assets, End of Period (in thousands) | | | $5,584,059 | | | | $6,202,441 | | | | $7,796,637 | | | | $6,830,168 | | | | $7,321,160 | | | | $5,170,228 | | | |
| Average Net Assets for the Period (in thousands) | | | $6,004,535 | | | | $6,737,743 | | | | $7,597,129 | | | | $7,518,444 | | | | $5,907,999 | | | | $6,009,064 | | | |
| Ratio of Gross Expenses (Absent the Waiver of Certain Fees and Expense Offsets) to Average Net Assets*** | | | 0.77% | | | | 0.84% | | | | 0.99% | | | | 1.03% | | | | 1.11% | | | | 1.07% | | | |
| Ratio of Net Expenses (After Waivers and Expense Offsets) to Average Net Assets*** | | | 0.76% | | | | 0.83% | | | | 0.99% | | | | 1.03% | | | | 1.11% | | | | 1.06% | | | |
| Ratio of Net Investment Income to Average Net Assets*** | | | 1.19% | | | | 1.16% | | | | 1.02% | | | | 0.49% | | | | 0.84% | | | | 1.47% | | | |
| Portfolio Turnover Rate | | | 60% | | | | 54% | | | | 66% | | | | 44%^ | | | | 88% | | | | 103% | | | |
| | | |
| * | | See Note 5 in Notes to Financial Statements. |
| ** | | Total return not annualized for periods of less than one full year. |
| *** | | Annualized for periods of less than one full year. |
| ^ | | Rate has been adjusted to conform with current year presentation. |
| (1) | | Period from August 1, 2009 through June 30, 2010. The Fund changed its fiscal year end from July 31 to June 30. |
| (2) | | Period from July 6, 2009 (inception date) through July 31, 2009. |
| (3) | | Period from November 1, 2009 through June 30, 2010. The Fund changed its fiscal year end from October 31 to June 30. |
See Notes to Financial Statements.
98 | JUNE 30, 2013
Class T Shares
| | | | | | | | | | | |
| | | Perkins Select Value Fund | | |
| For a share outstanding during each year or period ended June 30 | | 2013 | | 2012(1) | | |
| |
| Net Asset Value, Beginning of Period | | | $10.82 | | | | $10.00 | | | |
| Income from Investment Operations: | | | | | | | | | | |
| Net investment income | | | 0.13 | | | | 0.04 | | | |
| Net gain/(loss) on investments (both realized and unrealized) | | | 1.65 | | | | 0.78 | | | |
| Total from Investment Operations | | | 1.78 | | | | 0.82 | | | |
| Less Distributions: | | | | | | | | | | |
| Dividends (from net investment income)* | | | (0.10) | | | | – | | | |
| Distributions (from capital gains)* | | | (0.73) | | | | – | | | |
| Total Distributions | | | (0.83) | | | | – | | | |
| Net Asset Value, End of Period | | | $11.77 | | | | $10.82 | | | |
| Total Return** | | | 17.25% | | | | 8.20% | | | |
| Net Assets, End of Period (in thousands) | | | $1,357 | | | | $1,049 | | | |
| Average Net Assets for the Period (in thousands) | | | $1,274 | | | | $649 | | | |
| Ratio of Gross Expenses (Absent the Waiver of Certain Fees and Expense Offsets) to Average Net Assets*** | | | 1.11% | | | | 1.44% | | | |
| Ratio of Net Expenses (After Waivers and Expense Offsets) to Average Net Assets*** | | | 1.11% | | | | 1.26% | | | |
| Ratio of Net Investment Income to Average Net Assets*** | | | 1.25% | | | | 1.32% | | | |
| Portfolio Turnover Rate | | | 62% | | | | 80% | | | |
Class T Shares
| | | | | | | | | | | | | | | | | | | | | | | | | | | |
For a share outstanding during each year or period
| | Perkins Small Cap Value Fund | | |
| ended June 30 and each year ended October 31 | | 2013 | | 2012 | | 2011 | | 2010(2) | | 2009 | | 2008 | | |
| |
| Net Asset Value, Beginning of Period | | | $21.08 | | | | $24.93 | | | | $20.92 | | | | $19.47 | | | | $17.98 | | | | $27.90 | | | |
| Income from Investment Operations: | | | | | | | | | | | | | | | | | | | | | | | | | | |
| Net investment income | | | 0.20 | | | | 0.27 | | | | 0.05 | | | | 0.12 | | | | 0.08 | | | | 0.32 | | | |
| Net gain/(loss) on investments (both realized and unrealized) | | | 3.55 | | | | (1.31) | | | | 4.66 | | | | 1.33 | | | | 3.39 | | | | (5.83) | | | |
| Total from Investment Operations | | | 3.75 | | | | (1.04) | | | | 4.71 | | | | 1.45 | | | | 3.47 | | | | (5.51) | | | |
| Less Distributions and Other: | | | | | | | | | | | | | | | | | | | | | | | | | | |
| Dividends (from net investment income)* | | | (0.28) | | | | (0.05) | | | | (0.09) | | | | – | | | | (0.31) | | | | (0.33) | | | |
| Distributions (from capital gains)* | | | (0.90) | | | | (2.76) | | | | (0.61) | | | | – | | | | (1.62) | | | | (4.08) | | | |
| Return of capital | | | N/A | | | | N/A | | | | N/A | | | | N/A | | | | (0.05) | | | | N/A | | | |
| Total Distributions and Other | | | (1.18) | | | | (2.81) | | | | (0.70) | | | | – | | | | (1.98) | | | | (4.41) | | | |
| Net Asset Value, End of Period | | | $23.65 | | | | $21.08 | | | | $24.93 | | | | $20.92 | | | | $19.47 | | | | $17.98 | | | |
| Total Return** | | | 18.44% | | | | (3.86)% | | | | 22.65% | | | | 7.45% | | | | 22.87% | | | | (22.57)% | | | |
| Net Assets, End of Period (in thousands) | | | $846,044 | | | | $923,132 | | | | $1,257,481 | | | | $1,010,405 | | | | $659,087 | | | | $503,335 | | | |
| Average Net Assets for the Period (in thousands) | | | $880,189 | | | | $1,023,747 | | | | $1,219,414 | | | | $936,037 | | | | $441,820 | | | | $662,033 | | | |
| Ratio of Gross Expenses (Absent the Waiver of Certain Fees and Expense Offsets) to Average Net Assets*** | | | 0.85% | | | | 1.05% | | | | 1.10% | | | | 1.08% | | | | 1.11% | | | | 1.03% | | | |
| Ratio of Net Expenses (After Waivers and Expense Offsets) to Average Net Assets*** | | | 0.84% | | | | 1.04% | | | | 1.10% | | | | 1.08% | | | | 1.11% | | | | 1.03% | | | |
| Ratio of Net Investment Income to Average Net Assets*** | | | 0.79% | | | | 1.20% | | | | 0.42% | | | | 0.35% | | | | 1.06% | | | | 1.44% | | | |
| Portfolio Turnover Rate | | | 60% | | | | 62% | | | | 64% | | | | 39%^ | | | | 85% | | | | 112% | | | |
| | | |
| * | | See Note 5 in Notes to Financial Statements. |
| ** | | Total return not annualized for periods of less than one full year. |
| *** | | Annualized for periods of less than one full year. |
| ^ | | Rate has been adjusted to conform with current year presentation. |
| (1) | | Period from December 15, 2011 (inception date) through June 30, 2012. |
| (2) | | Period from November 1, 2009 through June 30, 2010. The Fund changed its fiscal year end from October 31 to June 30. |
See Notes to Financial Statements.
Janus Value Funds | 99
Financial Highlights (continued)
Class T Shares
| | | | | | | | | | | | | | | |
| | | Perkins Value Plus
| | |
| | | Income Fund | | |
| For a share outstanding during each year or period ended June 30 | | 2013 | | 2012 | | 2011(1) | | |
| |
| Net Asset Value, Beginning of Period | | | $10.86 | | | | $11.15 | | | | $10.00 | | | |
| Income from Investment Operations: | | | | | | | | | | | | | | |
| Net investment income | | | 0.31 | | | | 0.32 | | | | 0.29 | | | |
| Net gain on investments (both realized and unrealized) | | | 1.08 | | | | 0.09 | | | | 1.14 | | | |
| Total from Investment Operations | | | 1.39 | | | | 0.41 | | | | 1.43 | | | |
| Less Distributions: | | | | | | | | | | | | | | |
| Dividends (from net investment income)* | | | (0.30) | | | | (0.33) | | | | (0.24) | | | |
| Distributions (from capital gains)* | | | (0.26) | | | | (0.37) | | | | (0.04) | | | |
| Total Distributions | | | (0.56) | | | | (0.70) | | | | (0.28) | | | |
| Net Asset Value, End of Period | | | $11.69 | | | | $10.86 | | | | $11.15 | | | |
| Total Return** | | | 13.01% | | | | 3.97% | | | | 14.49% | | | |
| Net Assets, End of Period (in thousands) | | | $5,810 | | | | $4,919 | | | | $5,030 | | | |
| Average Net Assets for the Period (in thousands) | | | $5,470 | | | | $4,702 | | | | $4,002 | | | |
| Ratio of Gross Expenses (Absent the Waiver of Certain Fees and Expense Offsets) to Average Net Assets*** | | | 1.33% | | | | 1.48% | | | | 1.86% | | | |
| Ratio of Net Expenses (After Waivers and Expense Offsets) to Average Net Assets*** | | | 0.92% | | | | 0.97% | | | | 0.94% | | | |
| Ratio of Net Investment Income to Average Net Assets*** | | | 2.48% | | | | 2.87% | | | | 3.08% | | | |
| Portfolio Turnover Rate | | | 97% | | | | 100% | | | | 85%^ | | | |
| | | |
| * | | See Note 5 in Notes to Financial Statements. |
| ** | | Total return not annualized for periods of less than one full year. |
| *** | | Annualized for periods of less than one full year. |
| ^ | | Rate has been adjusted to conform with current year presentation. |
| (1) | | Period from July 30, 2010 (inception date) through June 30, 2011. |
See Notes to Financial Statements.
100 | JUNE 30, 2013
Notes to Financial Statements
The following section describes the organization and significant accounting policies and provides more detailed information about the schedules and tables that appear throughout this report. In addition, the Notes to Financial Statements explain the methods used in preparing and presenting this report.
| |
| 1. | Organization and Significant Accounting Policies |
Perkins Large Cap Value Fund, Perkins Mid Cap Value Fund, Perkins Select Value Fund, Perkins Small Cap Value Fund and Perkins Value Plus Income Fund (individually, a “Fund” and collectively, the “Funds”) are series funds. The Funds are part of Janus Investment Fund (the “Trust”), which is organized as a Massachusetts business trust and is registered under the Investment Company Act of 1940, as amended (the “1940 Act”), as an open-end management investment company. The financial statements include information for the year ended June 30, 2013. The Trust offers forty-four funds which include multiple series of shares, with differing investment objectives and policies. Perkins Value Plus Income Fund invests in a combination of equity and fixed-income securities. The other Funds invest primarily in equity securities. Each Fund in this report is classified as diversified, as defined in the 1940 Act.
Each Fund in this report offers multiple classes of shares in order to meet the needs of various types of investors. Each class represents an interest in the same portfolio of investments. Certain financial intermediaries may not offer all classes of shares.
Class A Shares and Class C Shares are generally offered through financial intermediary platforms including, but not limited to, traditional brokerage platforms, mutual fund wrap fee programs, bank trust platforms, and retirement platforms. The maximum purchase in Class C Shares is $500,000 for any single purchase.
Class D Shares are generally no longer being made available to new investors. The Shares are available only to investors who hold accounts directly with the Janus funds and to immediate family members or members of the same household of an eligible individual investor. The Shares are not offered through financial intermediaries.
Class I Shares are available through certain financial intermediary platforms including, but not limited to, mutual fund wrap fee programs, managed account programs, asset allocation programs, and bank trust platforms, as well as certain retirement platforms. Class I Shares are also available to certain institutional investors including, but not limited to, corporations, certain retirement plans, public plans, and foundations/endowments.
Class L Shares are designed for pension and profit-sharing plans, employee benefit trusts, endowments, foundations and corporations, as well as high net worth individuals and financial intermediaries who are willing to maintain a minimum account balance of $250,000.
Class N Shares are generally available only to financial intermediaries purchasing on behalf of 401(k) plans, 457 plans, 403(b) plans, Taft-Hartley multi-employer plans, profit-sharing and money purchase pension plans, defined benefit plans and nonqualified deferred compensation plans.
Class R Shares are offered through financial intermediary platforms including, but not limited to, retirement platforms.
Class S Shares are offered through financial intermediary platforms including, but not limited to, retirement platforms and asset allocation, mutual fund wrap, or other discretionary or nondiscretionary fee-based investment advisory programs. In addition, Class S Shares may be available through certain financial intermediaries who have an agreement with Janus Capital Management LLC (“Janus Capital”) or its affiliates to offer Class S Shares on their supermarket platforms.
Class T Shares are available through certain financial intermediary platforms including, but not limited to, mutual fund wrap fee programs, managed account programs, asset allocation programs, bank trust platforms, as well as certain retirement platforms. In addition, Class T Shares may be available through certain financial intermediaries who have an agreement with Janus Capital or its affiliates to offer Class T Shares on their supermarket platforms.
The following accounting policies have been followed by the Funds and are in conformity with accounting principles generally accepted in the United States of America.
Investment Valuation
Securities are valued at the last sales price or the official closing price for securities traded on a principal securities exchange (U.S. or foreign) and on the NASDAQ National Market. Securities traded on over-the-counter (“OTC”) markets and listed securities for which no sales are reported are valued at the latest bid price (or yield equivalent thereof) obtained from one or more dealers transacting in a market for such securities or by a pricing service approved by the Funds’ Trustees. Short-term securities with maturities of 60 days or less may be valued at amortized cost, which approximates market value. Debt securities with a remaining maturity of greater than 60 days are valued in accordance with the evaluated bid price supplied by the pricing service. The evaluated bid price supplied by the pricing service is an evaluation that reflects such factors as security prices, yields, maturities and ratings. Short positions shall be valued in accordance
Janus Value Funds | 101
Notes to Financial Statements (continued)
with the same methodologies, except that in the event that a last sale price is not available, the latest ask price shall be used instead of a bid price. Foreign securities and currencies are converted to U.S. dollars using the applicable exchange rate in effect as of the daily close of the New York Stock Exchange (“NYSE”). When market quotations are not readily available or deemed unreliable, or events or circumstances that may affect the value of portfolio securities held by the Funds are identified between the closing of their principal markets and the time the net asset value (“NAV”) is determined, securities may be valued at fair value as determined in good faith under procedures established by and under the supervision of the Funds’ Trustees. Circumstances in which fair value pricing may be utilized include, but are not limited to: (i) a significant event that may affect the securities of a single issuer, such as a merger, bankruptcy, or significant issuer specific development; (ii) an event that may affect an entire market, such as a natural disaster or significant governmental action; (iii) a nonsignificant event such as a market closing early or not opening, or a security trading halt; and (iv) pricing of a non-valued security and a restricted or non-public security. The Funds use systematic fair valuation models provided by independent third parties to value international equity securities in order to adjust for stale pricing, which may occur between the close of certain foreign exchanges and the close of the NYSE. Restricted and illiquid securities are valued in accordance with procedures established by the Funds’ Trustees.
Investment Transactions and Investment Income
Investment transactions are accounted for as of the date purchased or sold (trade date). Dividend income is recorded on the ex-dividend date. Certain dividends from foreign securities will be recorded as soon as the Trust is informed of the dividend, if such information is obtained subsequent to the ex-dividend date. Dividends from foreign securities may be subject to withholding taxes in foreign jurisdictions. Interest income is recorded on the accrual basis and includes amortization of premiums and accretion of discounts. Gains and losses are determined on the identified cost basis, which is the same basis used for federal income tax purposes. Income, as well as gains and losses, both realized and unrealized, are allocated daily to each class of shares based upon the ratio of net assets represented by each class as a percentage of total net assets.
Expenses
Each Fund bears expenses incurred specifically on its behalf, as well as a portion of general expenses, which may be allocated pro rata to each Fund. Each class of shares bears expenses incurred specifically on its behalf and, in addition, each class bears a portion of general expenses, which are allocated daily to each class of shares based upon the ratio of net assets represented by each class as a percentage of total net assets. Expenses directly attributable to a specific class of shares are charged against the operations of such class.
Estimates
The preparation of financial statements in conformity with accounting principles generally accepted in the United States of America requires management to make estimates and assumptions that affect the reported amount of assets and liabilities and disclosure of contingent assets and liabilities at the date of the financial statements, and the reported amounts of income and expenses during the reporting period. Actual results could differ from those estimates.
Foreign Currency Translations
The Funds do not isolate that portion of the results of operations resulting from the effect of changes in foreign exchange rates on investments from the fluctuations arising from changes in market prices of securities held at the date of the financial statements. Net unrealized appreciation or depreciation of investments and foreign currency translations arise from changes in the value of assets and liabilities, including investments in securities held at the date of the financial statements, resulting from changes in the exchange rates and changes in market prices of securities held.
Currency gains and losses are also calculated on payables and receivables that are denominated in foreign currencies. The payables and receivables are generally related to foreign security transactions and income translations.
Foreign currency-denominated assets and forward currency contracts may involve more risks than domestic transactions, including currency risk, political and economic risk, regulatory risk and equity risk. Risks may arise from the potential inability of a counterparty to meet the terms of a contract and from unanticipated movements in the value of foreign currencies relative to the U.S. dollar.
Dividend Distributions
Dividends of net investment income for Perkins Value Plus Income Fund are normally declared and distributed monthly, and realized capital gains (if any) are distributed annually. The other Funds generally declare and distribute dividends of net investment income and realized capital gains (if any) annually.
The Funds may make certain investments in real estate investment trusts (“REITs”) which pay dividends to their
102 | JUNE 30, 2013
shareholders based upon funds available from operations. It is quite common for these dividends to exceed the REITs’ taxable earnings and profits, resulting in the excess portion of such dividends being designated as a return of capital. If the Funds distribute such amounts, such distributions could constitute a return of capital to shareholders for federal income tax purposes.
Federal Income Taxes
Each Fund intends to continue to qualify as a regulated investment company and distribute all of its taxable income. Management has analyzed each Fund’s tax positions taken for all open federal income tax years, generally a three-year period, and has concluded that no provision for federal income tax is required in the Funds’ financial statements.
Valuation Inputs Summary
In accordance with FASB guidance, the Funds utilize the “Fair Value Measurements” to define fair value, establish a framework for measuring fair value, and expand disclosure requirements regarding fair value measurements. The Fair Value Measurement Standard does not require new fair value measurements, but is applied to the extent that other accounting pronouncements require or permit fair value measurements. This standard emphasizes that fair value is a market-based measurement that should be determined based on the assumptions that market participants would use in pricing an asset or liability. Various inputs are used in determining the value of the Funds’ investments defined pursuant to this standard. These inputs are summarized into three broad levels:
Level 1 – Quoted prices in active markets for identical securities.
Level 2 – Prices determined using other significant observable inputs. Observable inputs are inputs that reflect the assumptions market participants would use in pricing a security and are developed based on market data obtained from sources independent of the reporting entity. These may include quoted prices for similar securities, interest rates, prepayment speeds, credit risk, and others.
Debt securities are valued in accordance with the evaluated bid price supplied by the pricing service and generally categorized as Level 2 in the hierarchy. Securities traded on OTC markets and listed securities for which no sales are reported are valued at the latest bid price (or yield equivalent thereof) obtained from one or more dealers transacting in a market for such securities or by a pricing service approved by the Funds’ Trustees and are categorized as Level 2 in the hierarchy. Short-term securities with maturities of 60 days or less are valued at amortized cost, which approximates market value and are categorized as Level 2 in the hierarchy. Other securities that may be categorized as Level 2 in the hierarchy include, but are not limited to, preferred stocks, bank loans, American Depositary Receipts (“ADRs”), Global Depositary Receipts (“GDRs”), warrants, swaps, investments in mutual funds, OTC options, and forward contracts. The Funds use systematic fair valuation models provided by independent third parties to value international equity securities in order to adjust for stale pricing, which may occur between the close of certain foreign exchanges and the close of the NYSE. These are generally categorized as Level 2 in the hierarchy.
Level 3 – Prices determined using significant unobservable inputs. In situations where quoted prices or observable inputs are unavailable or deemed less relevant (for example, when there is little or no market activity for an investment at the end of the period), unobservable inputs may be used. Unobservable inputs are inputs that reflect the reporting entity’s own assumptions about the factors market participants would use in pricing the security and would be based on the best information available under the circumstances.
For restricted equity securities and private placements where observable inputs are limited, assumptions about market activity and risk are used in employing valuation techniques such as the market approach, the income approach, or the cost approach, as defined under the FASB Guidance. These are categorized as Level 3 in the hierarchy.
There have been no significant changes in valuation techniques used in valuing any such positions held by the Funds since the beginning of the fiscal year.
The inputs or methodology used for valuing securities are not necessarily an indication of the risk associated with investing in those securities. The summary of inputs used as of June 30, 2013 to value the Funds’ investments in securities and other financial instruments is included in the “Valuation Inputs Summary” in the Notes to Schedules of Investments and Other Information.
FASB Accounting Standards Update, “Amendments to Achieve Common Fair Value Measurement and Disclosure Requirements” requires disclosures about amounts and reasons for all transfers in and out of Level 1 and Level 2 fair value measurements. For fair value measurements categorized within Level 3 of the fair value hierarchy, the Funds shall provide quantitative information about the significant unobservable inputs used in the fair value measurement. To meet the objective of the quantitative disclosure, the Funds may need to further disaggregate to
Janus Value Funds | 103
Notes to Financial Statements (continued)
provide more meaningful information about the significant unobservable inputs used and how these inputs vary over time.
The Funds are not required to create quantitative information to comply with this disclosure requirement if quantitative unobservable inputs are not developed by the Funds when measuring fair value (for example, when a Fund uses prices from prior transactions or third-party pricing information without adjustment). However, when providing this disclosure, the Funds cannot ignore quantitative unobservable inputs that are significant to the fair value measurement and are reasonably available to the Funds.
In addition, the Accounting Standards Update requires the Funds to provide a narrative sensitivity disclosure of the fair value measurement changes in unobservable inputs and the interrelationships between those unobservable inputs for fair value measurements categorized within Level 3 of the fair value hierarchy.
The following table shows transfers in or out of Level 1, Level 2 and Level 3 of the fair value hierarchy during the year ended June 30, 2013.
| | | | | | | |
| | | Transfers Out
| | | |
| | | of Level 2
| | | |
| Fund | | to Level 1 | | | |
| |
| |
| Perkins Select Value Fund | | $ | 1,016,688 | | | |
| Perkins Value Plus Income Fund | | | 1,161,492 | | | |
| |
| |
Financial assets were transferred from Level 2 to Level 1 since certain foreign equity prices were applied a fair valuation adjustment factor at the end of the prior fiscal year and no factor was applied at the end of the current fiscal year.
The Funds recognize transfers between the levels as of the beginning of the fiscal year.
| |
| 2. | Derivative Instruments |
The Funds may invest in various types of derivatives, which may at times result in significant derivative exposure. A derivative is a financial instrument whose performance is derived from the performance of another asset. The Funds may invest in derivative instruments including, but not limited to: futures contracts, put options, call options, options on future contracts, options on foreign currencies, swaps, forward contracts, structured investments, and other equity-linked derivatives. Each derivative instrument that was held by one or more of the Funds during the year ended June 30, 2013 is discussed in further detail below. A summary of derivative activity by Fund is reflected in the tables at the end of this section.
The Funds may use derivative instruments for hedging (to offset risks associated with an investment, currency exposure, or market conditions) or for speculative (to seek to enhance returns) purposes. When the Funds invest in a derivative for speculative purposes, the Funds will be fully exposed to the risks of loss of that derivative, which may sometimes be greater than the derivative’s cost. The Funds may not use any derivative to gain exposure to an asset or class of assets in which they would be prohibited by their respective investment restrictions from purchasing directly. The Funds’ ability to use derivative instruments may also be limited by tax considerations.
Investments in derivatives in general are subject to market risks that may cause their prices to fluctuate over time. Investments in derivatives may not directly correlate with the price movements of the underlying instrument. As a result, the use of derivatives may expose the Funds to additional risks that they would not be subject to if they invested directly in the securities underlying those derivatives. The use of derivatives may result in larger losses or smaller gains than otherwise would be the case. Derivatives can be volatile and may involve significant risks, including, but not limited to, counterparty risk, credit risk, currency risk, equity risk, index risk, interest rate risk, leverage risk, and liquidity risk, as described below.
Derivatives may generally be traded OTC or on an exchange. Derivatives traded OTC, such as options and structured notes, are agreements that are individually negotiated between parties and can be tailored to meet a purchaser’s needs.
OTC derivatives are not guaranteed by a clearing agency and may be subject to increased credit risk. In an effort to mitigate credit risk associated with derivatives traded OTC, the Funds may enter into collateral agreements with certain counterparties whereby, subject to certain minimum exposure requirements, a Fund may require the counterparty to post collateral if the Fund has a net aggregate unrealized gain on all OTC derivative contracts with a particular counterparty. There is no guarantee that counterparty exposure is reduced and these arrangements are dependent on Janus Capital’s ability to establish and maintain appropriate systems and trading.
In pursuit of their investment objectives, each Fund may seek to use derivatives to increase or decrease exposure to the following market risk factors:
| | |
| | • | Counterparty Risk – Counterparty risk is the risk that the counterparty (the party on the other side of the transaction) on a derivative transaction will be unable to honor its financial obligation to a Fund. |
| |
| | • | Credit Risk – Credit risk is the risk an issuer will be unable to make principal and interest payments when due, or will default on its obligations. |
104 | JUNE 30, 2013
| | |
| | • | Currency Risk – Currency risk is the risk that changes in the exchange rate between currencies will adversely affect the value (in U.S. dollar terms) of an investment. |
| |
| | • | Equity Risk – Equity risk relates to the change in value of equity securities as they relate to increases or decreases in the general market. |
| |
| | • | Index Risk – If the derivative is linked to the performance of an index, it will be subject to the risks associated with changes in that index. If the index changes, a Fund could receive lower interest payments or experience a reduction in the value of the derivative to below what the Fund paid. Certain indexed securities, including inverse securities (which move in an opposite direction to the index), may create leverage, to the extent that they increase or decrease in value at a rate that is a multiple of the changes in the applicable index. |
| |
| | • | Interest Rate Risk – Interest rate risk is the risk that the value of fixed-income securities will generally decline as prevailing interest rates rise, which may cause a Fund’s NAV to likewise decrease, and vice versa. |
| |
| | • | Leverage Risk – Leverage risk is the risk associated with certain types of leveraged investments or trading strategies pursuant to which relatively small market movements may result in large changes in the value of an investment. A Fund creates leverage by using borrowed capital to increase the amount invested, or investing in instruments, including derivatives, where the investment loss can exceed the original amount invested. Certain investments or trading strategies that involve leverage can result in losses that greatly exceed the amount originally invested. |
| |
| | • | Liquidity Risk – Liquidity risk is the risk that certain securities may be difficult or impossible to sell at the time that the seller would like or at the price that the seller believes the security is currently worth. |
Forward Foreign Currency Exchange Contracts
A forward foreign currency exchange contract (“forward currency contract”) is an obligation to buy or sell a specified currency at a future date at a negotiated rate (which may be U.S. dollars or a foreign currency). The Funds may enter into forward currency contracts for hedging purposes, including, but not limited to, reducing exposure to changes in foreign currency exchange rates on foreign portfolio holdings and locking in the U.S. dollar cost of firm purchase and sale commitments for securities denominated in or exposed to foreign currencies. The Funds may also invest in forward currency contracts for nonhedging purposes such as seeking to enhance returns. The Funds are subject to currency risk in the normal course of pursuing their investment objectives through their investments in forward currency contracts.
The gain or loss arising from the difference between the U.S. dollar cost of the original contract and the value of the foreign currency in U.S. dollars upon closing a contract is included in “Net realized gain/(loss) from investment and foreign currency transactions” on the Statements of Operations (if applicable).
The Funds do not require the counterparty to post collateral for forward currency contracts; however, the Funds will segregate cash or high-grade securities with their custodian in an amount at all times equal to or greater than the Funds’ commitment with respect to these contracts. Such segregated assets are denoted on the accompanying Schedules of Investments and are evaluated daily to ensure their market value equals or exceeds the current market value of the Funds’ corresponding forward currency contracts.
Options Contracts
An options contract provides the purchaser with the right, but not the obligation, to buy (call option) or sell (put option) a financial instrument at an agreed upon price. The Funds are subject to interest rate risk, liquidity risk, equity risk, and currency risk in the normal course of pursuing their investment objectives through their investments in options contracts. The Funds may use options contracts to hedge against changes in interest rates, the values of equities, or foreign currencies. The Funds may utilize American-style and European-style options. An American-style option is an option contract that can be exercised at any time between the time of purchase and the option’s expiration date. A European-style option is an option contract that can only be exercised on the option’s expiration date. The Funds may also purchase or write put and call options on foreign currencies in a manner similar to that in which futures or forward contracts on foreign currencies will be utilized. The Funds generally invest in options to hedge against adverse movements in the value of portfolio holdings.
When an option is written, the Funds receive a premium and become obligated to sell or purchase the underlying security at a fixed price, upon exercise of the option. In writing an option, the Funds bear the risk of an unfavorable change in the price of the security underlying the written option. Exercise of an option written by the Funds could result in the Funds buying or selling a security at a price different from the current market value.
Janus Value Funds | 105
Notes to Financial Statements (continued)
When an option is exercised, the proceeds on sales for a written call option, the purchase cost for a written put option, or the cost of the security for a purchased put or call option are adjusted by the amount of premium received or paid.
The Funds may also purchase and write exchange-listed and OTC put and call options on domestic securities indices, and on foreign securities indices listed on domestic and foreign securities exchanges. Options on securities indices are similar to options on securities except that (1) the expiration cycles of securities index options are monthly, while those of securities options are currently quarterly, and (2) the delivery requirements are different. Instead of giving the right to take or make delivery of securities at a specified price, an option on a securities index gives the holder the right to receive a cash “exercise settlement amount” equal to (a) the amount, if any, by which the fixed exercise price of the option exceeds (in the case of a put) or is less than (in the case of a call) the closing value of the underlying index on the date of exercise, multiplied by (b) a fixed “index multiplier.” Receipt of this cash amount will depend upon the closing level of the securities index upon which the option is based being greater than, in the case of a call, or less than, in the case of a put, the exercise price of the index and the exercise price of the option times a specified multiple. The writer of the option is obligated, in return for the premium received, to make delivery of this amount.
Options traded on an exchange are regulated and the terms of the options are standardized. Options traded OTC expose the Funds to counterparty risk in the event that the counterparty does not perform. This risk is mitigated by having a netting arrangement between the Funds and the counterparty and by having the counterparty post collateral to cover the Funds’ exposure to the counterparty.
Holdings of the Funds designated to cover outstanding written options are noted on the Schedules of Investments (if applicable). Options written are reported as a liability on the Statements of Assets and Liabilities as “Options written at value” (if applicable). Realized gains and losses are reported as “Net realized gain/(loss) from written options contracts” on the Statements of Operations (if applicable).
The risk in writing call options is that the Funds give up the opportunity for profit if the market price of the security increases and the options are exercised. The risk in writing put options is that the Funds may incur a loss if the market price of the security decreases and the options are exercised. The risk in buying options is that the Funds pay a premium whether or not the options are exercised. The use of such instruments may involve certain additional risks as a result of unanticipated movements in the market. A lack of correlation between the value of an instrument underlying an option and the asset being hedged, or unexpected adverse price movements, could render the Funds’ hedging strategy unsuccessful. In addition, there can be no assurance that a liquid secondary market will exist for any option purchased or sold. There is no limit to the loss the Funds may recognize due to written call options.
Written option activity for the year ended June 30, 2013 is indicated in the tables below:
| | | | | | | | | |
| | | Number of
| | Premiums
| | |
| Put Options | | Contracts | | Received | | |
| |
| |
| Perkins Mid Cap Value Fund | | | | | | | | |
| Options outstanding at June 30, 2012 | | | 170,670 | | $ | 27,324,315 | | |
| Options written | | | 156,695 | | | 17,634,411 | | |
| Options closed | | | (305,415) | | | (42,261,994) | | |
| Options expired | | | (21,950) | | | (2,696,732) | | |
| Options exercised | | | – | | | – | | |
| |
| |
| Options outstanding at June 30, 2013 | | | – | | $ | – | | |
| |
| |
| | | | | | | | | |
| | | Number of
| | Premiums
| | |
| Call Options | | Contracts | | Received | | |
| |
| |
| Perkins Value Plus Income Fund | | | | | | | | |
| Options outstanding at June 30, 2012 | | | 110 | | $ | 1,905 | | |
| Options written | | | 3,290 | | | 79,650 | | |
| Options closed | | | (170) | | | (3,229) | | |
| Options expired | | | (2,175) | | | (52,299) | | |
| Options exercised | | | (590) | | | (15,789) | | |
| |
| |
| Options outstanding at June 30, 2013 | | | 465 | | $ | 10,238 | | |
| |
| |
| | | | | | | | | |
| | | Number of
| | Premiums
| | |
| Put Options | | Contracts | | Received | | |
| |
| |
| Perkins Value Plus Income Fund | | | | | | | | |
| Options outstanding at June 30, 2012 | | | – | | $ | – | | |
| Options written | | | 118 | | | 3,389 | | |
| Options closed | | | – | | | – | | |
| Options expired | | | (65) | | | (2,166) | | |
| Options exercised | | | (8) | | | (402) | | |
| |
| |
| Options outstanding at June 30, 2013 | | | 45 | | $ | 821 | | |
| |
| |
106 | JUNE 30, 2013
The following tables, grouped by derivative type, provide information about the fair value and location of derivatives within the Statements of Assets and Liabilities as of June 30, 2013.
Fair Value of Derivative Instruments as of June 30, 2013
| | | | | | | | | | | | | |
Derivatives not accounted for as
| | Asset Derivatives | | | Liability Derivatives | |
| hedging instruments | | Statements of Assets and Liabilities Location | | Fair Value | | | Statements of Assets and Liabilities Location | | Fair Value | |
| |
| |
Perkins Value Plus Income Fund | | | | | | | | | | | | |
| Equity Contracts | | | | | | | | Options written, at value | | $ | 5,505 | |
| Foreign Exchange Contracts | | Forward currency contracts | | $ | 9,183 | | | Forward currency contracts | | | 170 | |
| |
| |
| Total | | | | $ | 9,183 | | | | | $ | 5,675 | |
| |
| |
The following tables provide information about the effect of derivatives and hedging activities on the Funds’ Statements of Operations for the year ended June 30, 2013.
The effect of Derivative Instruments on the Statements of Operations for the year ended June 30, 2013
| | | | | | | | | | | | | | | | | | | | | |
| Amount of Realized Gain/(Loss) on Derivatives Recognized in Income | |
| Derivatives not accounted for as hedging instruments | | Futures | | | Swaps | | | Options | | | Forward Currency Contracts | | | Total | |
| |
| |
Perkins Mid Cap Value Fund | | | | | | | | | | | | | | | | | | | | |
| |
| |
| Equity Contracts | | $ | – | | | $ | – | | | $ | (66,533,951 | ) | | $ | – | | | $ | (66,533,951 | ) |
| |
| |
| Total | | $ | – | | | $ | – | | | $ | (66,533,951 | ) | | $ | – | | | $ | (66,533,951 | ) |
| |
| |
| | | | | | | | | | | | | | | | | | | | | |
| Change in Unrealized Appreciation/(Depreciation) on Derivatives Recognized in Income | |
| Derivatives not accounted for as hedging instruments | | Futures | | | Swaps | | | Options | | | Forward Currency Contracts | | | Total | |
| |
| |
Perkins Mid Cap Value Fund | | | | | | | | | | | | | | | | | | | | |
| |
| |
| Equity Contracts | | $ | – | | | $ | – | | | $ | 18,962,584 | | | $ | – | | | $ | 18,962,584 | |
| |
| |
| Total | | $ | – | | | $ | – | | | $ | 18,962,584 | | | $ | – | | | $ | 18,962,584 | |
| |
| |
| | | | | | | | | | | | | | | | | | | | | |
| Amount of Realized Gain/(Loss) on Derivatives Recognized in Income | |
| Derivatives not accounted for as hedging instruments | | Futures | | | Swaps | | | Options | | | Forward Currency Contracts | | | Total | |
| |
| |
Perkins Value Plus Income Fund | | | | | | | | | | | | | | | | | | | | |
| |
| |
| Equity Contracts | | $ | – | | | $ | – | | | $ | 53,916 | | | $ | – | | | $ | 53,916 | |
| |
| |
| Foreign Exchange Contracts | | | – | | | | – | | | | – | | | | (11,854 | ) | | | (11,854 | ) |
| |
| |
| Total | | $ | – | | | $ | – | | | $ | 53,916 | | | $ | (11,854 | ) | | $ | 42,062 | |
| |
| |
| | | | | | | | | | | | | | | | | | | | | |
| Change in Unrealized Appreciation/(Depreciation) on Derivatives Recognized in Income | |
| Derivatives not accounted for as hedging instruments | | Futures | | | Swaps | | | Options | | | Forward Currency Contracts | | | Total | |
| |
| |
Perkins Value Plus Income Fund | | | | | | | | | | | | | | | | | | | | |
| |
| |
| Equity Contracts | | $ | – | | | $ | – | | | $ | 7,708 | | | $ | – | | | $ | 7,708 | |
| |
| |
| Foreign Exchange Contracts | | | – | | | | – | | | | – | | | | 14,609 | | | | 14,609 | |
| |
| |
| Total | | $ | – | | | $ | – | | | $ | 7,708 | | | $ | 14,609 | | | $ | 22,317 | |
| |
| |
Please see the Funds’ Statements of Operations for the Funds’ “Net Realized and Unrealized Gain/(Loss) on Investments.”
The value of derivative instruments at period end and the effect of derivatives on the Statements of Operations are indicative of the Funds’ volumes throughout the period.
| |
| 3. | Other investments and strategies |
Additional Investment Risk
The Funds, particularly Perkins Value Plus Income Fund, may be invested in lower-rated debt securities that have a higher risk of default or loss of value since these securities may be sensitive to economic changes, political changes or adverse developments specific to the issuer.
The financial crisis that began in 2008 has caused a significant decline in the value and liquidity of many securities of issuers worldwide in the equity and fixed-income/credit markets. In response to the crisis, the United States and certain foreign governments, along with the U.S. Federal Reserve and certain foreign central banks have taken steps to support the financial markets. The withdrawal of this support, failure of efforts to respond to the crisis, or investor perception that such efforts are not
Janus Value Funds | 107
Notes to Financial Statements (continued)
succeeding each could also negatively affect financial markets generally, and the value and liquidity of specific securities. In addition, policy and legislative changes in the United States and in other countries are impacting many aspects of financial regulation. The effect of these changes on the markets, and the practical implications for market participants, including a Fund, may not be fully known for some time. Because the situation is unprecedented and widespread, it may also be unusually difficult to identify both investment risks and opportunities, which could limit or preclude a Fund’s ability to achieve its investment objective. Therefore, it is important to understand that the value of your investment may fall, sometimes sharply, and you could lose money.
The Dodd-Frank Wall Street Reform and Consumer Protection Act (the “Dodd-Frank Act”) in July 2010 is dramatically changing the way in which the U.S. financial system is supervised and regulated. The Dodd-Frank Act provides for widespread regulation of financial institutions, consumer financial products and services, broker-dealers, OTC derivatives, investment advisers, credit rating agencies, and mortgage lending, which expands federal oversight in the financial sector, including the investment management industry. Many provisions of the Dodd-Frank Act will be implemented through future rulemaking. Therefore, the ultimate impact of the Dodd-Frank Act and the regulations under the Dodd-Frank Act, on the Funds and the investment management industry as a whole, is not yet certain.
A number of countries in the European Union (“EU”) have experienced severe economic and financial difficulties. As a result, financial markets in the EU have been subject to extreme volatility and declines in asset values and liquidity. Responses to these financial problems by European governments, central banks, and others, including austerity measures and reforms, may not work, may result in social unrest, and may limit future growth and economic recovery or have other unintended consequences. Further defaults or restructuring by governments and others of their debt could have additional adverse effects on economies, financial markets, and asset valuations around the world.
Certain areas of the world have historically been prone to and economically sensitive to environmental events such as, but not limited to, hurricanes, earthquakes, typhoons, flooding, tidal waves, tsunamis, erupting volcanoes, wildfires or droughts, tornadoes, mudslides, or other weather-related phenomena. Such disasters, and the resulting physical or economic damage, could have a severe and negative impact on a Fund’s investment portfolio and, in the longer term, could impair the ability of issuers in which the Fund invests to conduct their businesses as they would under normal conditions. Adverse weather conditions may also have a particularly significant negative effect on issuers in the agricultural sector and on insurance companies that insure against the impact of natural disasters.
Bank Loans
Perkins Value Plus Income Fund may invest in bank loans, which include institutionally traded floating and fixed-rate debt securities generally acquired as an assignment from another holder of, or participation interest in, loans originated by a bank or financial institution (the “Lender”) that acts as agent for all holders. Some bank loans may be purchased on a “when-issued” basis. The agent administers the terms of the loan, as specified in the loan agreement. When investing in a loan participation, the Fund has the right to receive payments of principal, interest and any fees to which it is entitled only from the Lender selling the loan agreement and only upon receipt by the Lender of payments from the borrower. The Fund generally has no right to enforce compliance with the terms of the loan agreement with the borrower. Assignments and participations involve credit, interest rate, and liquidity risk. Interest rates on floating rate securities adjust with interest rate changes and/or issuer credit quality, and unexpected changes in such rates could result in losses to a Fund. The interest rates paid on a floating rate security in which the Fund invests generally are readjusted periodically to an increment over a designated benchmark rate, such as the one-month, three-month, six-month, or one-year London Interbank Offered Rate (“LIBOR”). LIBOR is a short-term interest rate that banks charge one another and is generally representative of the most competitive and current cash rates.
The Fund may have difficulty trading assignments and participations to third parties. There may be restrictions on transfer and only limited opportunities may exist to sell such securities in secondary markets. As a result, the Fund may be unable to sell assignments or participations at the desired time or may be able to sell only at a price less than fair market value. The Fund utilizes an independent third party to value individual bank loans on a daily basis.
The average monthly value of borrowings outstanding under bank loan arrangements and the related rate range during the year ended June 30, 2013 is indicated in the table below:
| | | | | | | | | |
| | | Average Monthly
| | | | |
| Fund | | Value | | Rates | | |
| |
| |
| Perkins Value Plus Income Fund | | $ | 85,950 | | | 3.5000% - 4.5000% | | |
| |
| |
108 | JUNE 30, 2013
Counterparties
Fund transactions involving a counterparty are subject to the risk that the counterparty or a third party will not fulfill its obligation to a Fund (“counterparty risk”). Counterparty risk may arise because of the counterparty’s financial condition (i.e., financial difficulties, bankruptcy, or insolvency), market activities and developments, or other reasons, whether foreseen or not. A counterparty’s inability to fulfill its obligation may result in significant financial loss to a Fund. A Fund may be unable to recover its investment from the counterparty or may obtain a limited recovery, and/or recovery may be delayed. The extent of a Fund’s exposure to counterparty risk in respect to financial assets approximates its carrying value as recorded on the Fund’s Statement of Assets and Liabilities.
A Fund may be exposed to counterparty risk through participation in various programs including, but not limited to, lending its securities to third parties, cash sweep arrangements whereby a Fund’s cash balance is invested in one or more types of cash management vehicles, as well as investments in, but not limited to, repurchase agreements, debt securities, and derivatives, including various types of swaps, futures and options. A Fund intends to enter into financial transactions with counterparties that Janus Capital believes to be creditworthy at the time of the transaction. There is always the risk that Janus Capital’s analysis of a counterparty’s creditworthiness is incorrect or may change due to market conditions. To the extent that a Fund focuses its transactions with a limited number of counterparties, it will have greater exposure to the risks associated with one or more counterparties.
Exchange-Traded Funds
The Funds may invest in exchange-traded funds (“ETFs”) which generally are index-based investment companies that hold substantially all of their assets in securities representing their specific index. As a shareholder of another investment company, a Fund would bear its pro rata portion of the other investment company’s expenses, including advisory fees, in addition to the expenses the Fund bears directly in connection with its own operations.
Floating Rate Loans
The Funds may invest in secured and unsecured floating rate loans. Floating rate loans are debt securities that have floating interest rates, that adjust periodically, and are tied to a benchmark lending rate, such as LIBOR. In other cases, the lending rate could be tied to the prime rate offered by one or more major U.S. banks or the rate paid on large certificates of deposit traded in the secondary markets. If the benchmark lending rate changes, the rate payable to lenders under the loan will change at the next scheduled adjustment date specified in the loan agreement. Floating rate loans are typically issued to companies (“borrowers”) in connection with recapitalizations, acquisitions, and refinancings. Floating rate loan investments are generally below investment grade. Senior floating rate loans are secured by specific collateral of a borrower and are senior in the borrower’s capital structure. The senior position in the borrower’s capital structure generally gives holders of senior loans a claim on certain of the borrower’s assets that is senior to subordinated debt and preferred and common stock in the case of a borrower’s default. Floating rate loan investments may involve foreign borrowers, and investments may be denominated in foreign currencies. Floating rate loans often involve borrowers whose financial condition is troubled or uncertain and companies that are highly leveraged. The Funds may invest in obligations of borrowers who are in bankruptcy proceedings. While the Funds generally expect to invest in fully funded term loans, certain of the loans in which the Funds may invest include revolving loans, bridge loans, and delayed draw term loans.
Purchasers of floating rate loans may pay and/or receive certain fees. The Funds may receive fees such as covenant waiver fees or prepayment penalty fees. A Fund may pay fees such as facility fees. Such fees may affect the Fund’s return.
Mortgage- and Asset-Backed Securities
The Funds may purchase fixed or variable rate mortgage-backed securities issued by the Government National Mortgage Association (“Ginnie Mae”), the Federal National Mortgage Association (“Fannie Mae”), the Federal Home Loan Mortgage Corporation (“Freddie Mac”), or other governmental or government-related entities. Ginnie Mae’s guarantees are backed by the full faith and credit of the U.S. Government. Historically, Fannie Maes and Freddie Macs were not backed by the full faith and credit of the U.S. Government, and may not be in the future. In September 2008, the Federal Housing Finance Agency (“FHFA”), an agency of the U.S. Government, placed Fannie Mae and Freddie Mac under conservatorship. Under the conservatorship, the management of Fannie Mae and Freddie Mac was replaced. Since 2008, Fannie Mae and Freddie Mac have received capital support through U.S. Treasury preferred stock purchases, and Treasury and Federal Reserve purchases of their mortgage-backed securities. The FHFA and the U.S. Treasury have imposed strict limits on the size of these entities’ mortgage portfolios. The FHFA has the power to cancel any contract entered into by Fannie Mae and Freddie Mac prior to FHFA’s appointment as conservator or receiver, including the guarantee obligations of Fannie Mae and Freddie Mac.
Janus Value Funds | 109
Notes to Financial Statements (continued)
The Funds may purchase other mortgage- and asset-backed securities through single- and multi-seller conduits, collateralized debt obligations, structured investment vehicles, and other similar securities. Asset-backed securities may be backed by automobile loans, equipment leases, credit card receivables, or other collateral. In the event the underlying assets fail to perform, these investment vehicles could be forced to sell the assets and recognize losses on such assets, which could impact the Funds’ yield and your return.
Unlike traditional debt instruments, payments on these securities include both interest and a partial payment of principal. Prepayment risk, which results from prepayments of the principal of underlying loans at a faster pace than expected, may shorten the effective maturities of these securities and may result in the Fund having to reinvest proceeds at a lower interest rate.
In addition to prepayment risk, investments in mortgage-backed securities, including those comprised of subprime mortgages, and investments in other asset-backed securities comprised of under-performing assets may be subject to a higher degree of credit risk, valuation risk, and liquidity risk. Additionally, although mortgages and mortgage-related securities are generally supported by some form of government or private guarantee and/or insurance, there is no assurance that private guarantors or insurers will meet their obligations.
Mortgage- and asset-backed securities are also subject to extension risk, which is the risk that rising interest rates could cause mortgages or other obligations underlying these securities to be paid more slowly than expected, increasing the Funds’ sensitivity to interest rate changes and causing its price to decline.
Real Estate Investing
The Funds may invest in equity and debt securities of real estate-related companies. Such companies may include those in the real estate industry or real estate-related industries. These securities may include common stocks, preferred stocks, and other equity securities, including, but not limited to, mortgage-backed securities, real estate-backed securities, securities of REITs and similar REIT-like entities. A REIT is a trust that invests in real estate-related projects, such as properties, mortgage loans, and construction loans. REITs are generally categorized as equity, mortgage, or hybrid REITs. A REIT may be listed on an exchange or traded OTC.
Restricted Security Transactions
Restricted securities held by the Funds may not be sold except in exempt transactions or in a public offering registered under the Securities Act of 1933, as amended. The risk of investing in such securities is generally greater than the risk of investing in the securities of widely held, publicly traded companies. Lack of a secondary market and resale restrictions may result in the inability of the Funds to sell a security at a fair price and may substantially delay the sale of the security. In addition, these securities may exhibit greater price volatility than securities for which secondary markets exist.
Sovereign Debt
A Fund may invest in U.S. and foreign government debt securities (“sovereign debt”). Investments in U.S. sovereign debt are considered low risk. However, investments in non-U.S. sovereign debt can involve a high degree of risk, including the risk that the governmental entity that controls the repayment of sovereign debt may not be willing or able to repay the principal and/or to pay the interest on its sovereign debt in a timely manner. A sovereign debtor’s willingness or ability to satisfy its debt obligation may be affected by various factors, including its cash flow situation, the extent of its foreign currency reserves, the availability of foreign exchange when a payment is due, the relative size of its debt position in relation to its economy as a whole, the sovereign debtor’s policy toward international lenders, and local political constraints to which the governmental entity may be subject. Sovereign debtors may also be dependent on expected disbursements from foreign governments, multilateral agencies, and other entities. The failure of a sovereign debtor to implement economic reforms, achieve specified levels of economic performance, or repay principal or interest when due may result in the cancellation of third party commitments to lend funds to the sovereign debtor, which may further impair such debtor’s ability or willingness to timely service its debts. A Fund may be requested to participate in the rescheduling of such sovereign debt and to extend further loans to governmental entities, which may adversely affect the Fund’s holdings. In the event of default, there may be limited or no legal remedies for collecting sovereign debt and there may be no bankruptcy proceedings through which the Fund may collect all or part of the sovereign debt that a governmental entity has not repaid.
When-Issued Securities
The Funds may purchase or sell securities on a when-issued or delayed delivery basis. When-issued and delayed delivery securities in which the Funds may invest include U.S. Treasury Securities, municipal bonds, bank loans, and other similar instruments. The price of the underlying securities and date when the securities will be delivered and paid for are fixed at the time the transaction is negotiated. Losses may arise due to changes in the market value of the securities or from the inability of counterparties to meet the terms of the contract. In
110 | JUNE 30, 2013
connection with such purchases, the Funds may hold liquid assets as collateral with the Funds’ custodian sufficient to cover the purchase price.
| |
| 4. | Investment Advisory Agreements and Other Transactions with Affiliates |
Each Fund pays Janus Capital an investment advisory fee which is calculated daily and paid monthly. The following table reflects each Fund’s contractual investment advisory fee rate or base fee rate, as applicable (expressed as an annual rate).
| | | | | | | | | |
| | | | | Contractual
| | |
| | | | | Investment
| | |
| | | | | Advisory Fee/
| | |
| | | Average Daily Net
| | Base Fee Rate (%)
| | |
| Fund | | Assets of the Fund | | (annual rate) | | |
| |
| |
| Perkins Large Cap Value Fund | | | N/A | | | 0.64 | | |
| Perkins Mid Cap Value Fund | | | N/A | | | 0.64 | | |
| Perkins Select Value Fund | | | N/A | | | 0.70 | | |
| Perkins Small Cap Value Fund | | | N/A | | | 0.72 | | |
| Perkins Value Plus Income Fund | | | All Asset Levels | | | 0.60 | | |
| |
| |
For each Fund, except Perkins Value Plus Income Fund, the investment advisory fee rate is determined by calculating a base fee and applying a performance adjustment. The base fee rate is the same as the contractual investment advisory fee rate shown in the table above. The performance adjustment either increases or decreases the base fee depending on how well each Fund has performed relative to its benchmark index, as shown below:
| | | | | | |
| Fund | | Benchmark Index | | |
| |
| |
| Perkins Large Cap Value Fund | | | Russell 1000® Value Index | | |
| Perkins Mid Cap Value Fund | | | Russell Midcap® Value Index | | |
| Perkins Select Value Fund | | | Russell 3000® Value Index | | |
| Perkins Small Cap Value Fund | | | Russell 2000® Value Index | | |
| |
| |
The calculation of the performance adjustment applies as follows:
Investment Advisory Fee = Base Fee Rate +/- Performance Adjustment
The investment advisory fee rate paid to Janus Capital by each of the Funds listed above consists of two components: (1) a base fee calculated by applying the contractual fixed rate of the advisory fee to the Fund’s average daily net assets during the previous month (“Base Fee Rate”), plus or minus (2) a performance-fee adjustment (“Performance Adjustment”) calculated by applying a variable rate of up to 0.15% (positive or negative) to the Fund’s average daily net assets during the applicable performance measurement period. The performance measurement period generally is the previous 36 months, although no Performance Adjustment is made until a Fund’s performance-based fee structure has been in effect for at least 12 months. When a Fund’s performance-based fee structure has been in effect for at least 12 months, but less than 36 months, the performance measurement period will be equal to the time that has elapsed since the performance-based fee structure took effect. Any applicable Performance Adjustments began February 2007 for Perkins Mid Cap Value Fund, January 2010 for each of Perkins Large Cap Value Fund and Perkins Small Cap Value Fund, and January 2013 for Perkins Select Value Fund.
No Performance Adjustment is applied unless the difference between a Fund’s investment performance and the cumulative investment record of the Fund’s benchmark index is 0.50% or greater (positive or negative) during the applicable performance measurement period. The Base Fee Rate is subject to an upward or downward Performance Adjustment for every full 0.50% increment by which a Fund outperforms or underperforms its benchmark index. Because the Performance Adjustment is tied to a Fund’s relative performance compared to its benchmark index (and not its absolute performance), the Performance Adjustment could increase Janus Capital’s fee even if the Fund’s Shares lose value during the performance measurement period and could decrease Janus Capital’s fee even if the Fund’s Shares increase in value during the performance measurement period. For purposes of computing the Base Fee Rate and the Performance Adjustment, net assets are averaged over different periods (average daily net assets during the previous month for the Base Fee Rate, versus average daily net assets during the performance measurement period for the Performance Adjustment). Performance of a Fund is calculated net of expenses, whereas a Fund’s benchmark index does not have any fees or expenses. Reinvestment of dividends and distributions is included in calculating both the performance of a Fund and the Fund’s benchmark index. The Base Fee Rate is calculated and accrued daily. The Performance Adjustment is calculated monthly in arrears and is accrued throughout the month. The investment fee is paid monthly in arrears. Under extreme circumstances involving underperformance by a rapidly shrinking Fund, the dollar amount of the Performance Adjustment could be more than the dollar amount of the Base Fee Rate. In such circumstances, Janus Capital would reimburse the applicable Fund.
The application of an expense limit, if any, will have a positive effect upon a Fund’s performance and may result in an increase in the Performance Adjustment. It is possible that the cumulative dollar amount of additional compensation ultimately payable to Janus Capital may,
Janus Value Funds | 111
Notes to Financial Statements (continued)
under some circumstances, exceed the cumulative dollar amount of management fees waived by Janus Capital.
The investment performance of a Fund’s Class A Shares (waiving the upfront sales load) for the performance measurement period is used to calculate the Performance Adjustment. After Janus Capital determines whether a particular Fund’s performance was above or below its benchmark index by comparing the investment performance of the Fund’s load-waived Class A Shares against the cumulative investment record of the Fund’s benchmark index, Janus Capital applies the same Performance Adjustment (positive or negative) across each other class of shares of the Fund, as applicable.
It is not possible to predict the effect of the Performance Adjustment on future overall compensation to Janus Capital since it depends on the performance of each Fund relative to the record of the Fund’s benchmark index and future changes to the size of each Fund.
The Funds’ prospectuses and statement of additional information contain additional information about performance-based fees. The amount shown as advisory fees on the Statements of Operations reflects the Base Fee Rate plus/minus any Performance Adjustment, if applicable.
During the year ended June 30, 2013, the following Funds recorded a Performance Adjustment as indicated in the table below:
| | | | | | |
| | | Performance
| | |
| Fund | | Adjustment | | |
| |
| |
| Perkins Large Cap Value Fund | | $ | (171,134) | | |
| Perkins Mid Cap Value Fund | | | (19,591,547) | | |
| Perkins Select Value Fund | | | (48,359) | | |
| Perkins Small Cap Value Fund | | | (4,252,036) | | |
| |
| |
Perkins Investment Management LLC (“Perkins”) serves as subadviser to the Funds. Janus Capital pays Perkins a fee equal to 50% of the advisory fee paid by each of Perkins Large Cap Value Fund, Perkins Mid Cap Value Fund, Perkins Select Value Fund, and Perkins Small Cap Value Fund to Janus Capital (calculated after any applicable performance fee adjustment, fee waivers, and expense reimbursements) and 50% of the advisory fee payable by the equity portion of Perkins Value Plus Income Fund to Janus Capital (net of any fee waivers and expense reimbursements). The subadvisory fee paid by Janus Capital to Perkins adjusts up or down based on each of Perkins Large Cap Value Fund’s, Perkins Mid Cap Value Fund’s, Perkins Select Value Fund’s, and Perkins Small Cap Value Fund’s performance relative to each Fund’s respective benchmark index over the performance measurement period.
Perkins or its predecessors have been in the investment management business since 1984 and serves as investment adviser or subadviser to other Janus registered investment companies and other accounts. Janus Capital owns approximately 78% of Perkins. Perkins has the option to require Janus Capital to purchase all or part of its remaining ownership interests following certain anniversary dates. On February 1, 2013, Perkins exercised its rights to put 98% of its interests to Janus Capital. The transaction is expected to close in August 2013.
Janus Services LLC (“Janus Services”), a wholly-owned subsidiary of Janus Capital, is the Funds’ transfer agent. In addition, Janus Services provides or arranges for the provision of certain other administrative services including, but not limited to, recordkeeping, accounting, order processing, and other shareholder services for the Funds.
Certain, but not all, intermediaries charge administrative fees to investors in Class A Shares, Class C Shares, and Class I Shares for administrative services provided on behalf of such investors. These administrative fees are paid by the Class A Shares, Class C Shares, and Class I Shares of the Funds to Janus Services, which uses such fees to reimburse intermediaries. Consistent with the Transfer Agency Agreement between Janus Services and the Funds, Janus Services may negotiate the level, structure, and/or terms of the administrative fees with intermediaries requiring such fees on behalf of the Funds. Janus Capital and its affiliates benefit from an increase in assets that may result from such relationships.
Class D Shares pay an annual administrative services fee of 0.12% of net assets. These administrative services fees are paid by Class D Shares for shareholder services provided by Janus Services.
Janus Services receives an administrative services fee at an annual rate of up to 0.25% of the average daily net assets of Class R Shares, Class S Shares and Class T Shares of the Funds for providing or procuring administrative services to investors in Class R Shares, Class S Shares and Class T Shares of the Funds. Janus Services expects to use all or a significant portion of this fee to compensate retirement plan service providers, broker-dealers, bank trust departments, financial advisors, and other financial intermediaries for providing these services. Janus Services or its affiliates may also pay fees for services provided by intermediaries to the extent the fees charged by intermediaries exceed the 0.25% of net assets charged to Class R Shares, Class S Shares, and Class T Shares of each Fund. Janus Services may keep certain amounts retained for reimbursement of out-of-pocket costs incurred for servicing clients of Class R Shares, Class S Shares, and Class T Shares.
Services provided by these financial intermediaries may include, but are not limited to, recordkeeping, subaccounting, order processing, providing order
112 | JUNE 30, 2013
confirmations, periodic statements, forwarding prospectuses, shareholder reports, and other materials to existing customers, answering inquiries regarding accounts, and other administrative services. Order processing includes the submission of transactions through the National Securities Clearing Corporation (“NSCC”) or similar systems, or those processed on a manual basis with Janus Capital.
For transfer agency and other services, Janus Services receives an asset-weighted fee from the Class L Shares of Perkins Mid Cap Value Fund and Perkins Small Cap Value Fund based on the average proportion of each Fund’s total net assets sold directly and the average proportion of each Fund’s net assets sold through financial intermediaries on a monthly basis. The asset-weighted fee is calculated by applying a blended annual fee rate of 0.12% on average net assets for the proportion of assets sold directly and 0.25% on average net assets for the proportion of assets sold through financial intermediaries.
Janus Services has agreed to waive all or a portion of the administrative fees payable by the Class L Shares of Perkins Mid Cap Value Fund and Perkins Small Cap Value Fund. Such waiver is voluntary and could change or be terminated at any time at the discretion of Janus Services or Janus Capital without prior notification to shareholders. Removal of this fee waiver may have a significant impact on Class L Shares’ total expense ratio. If applicable, amounts waived to the Funds by Janus Capital are disclosed as “Excess Expense Reimbursement” on the Statements of Operations.
Janus Services is compensated for its services related to Class D Shares, and receives reimbursement for its out-of-pocket costs on all other share classes. Included in out-of-pocket expenses are the expenses Janus Services incurs for serving as transfer agent and providing servicing to shareholders.
Janus Distributors LLC (“Janus Distributors”), a wholly-owned subsidiary of Janus Capital, is the distributor of the Funds. The Funds have adopted a Distribution and Shareholder Servicing Plan (the “Plan”) pursuant to Rule 12b-1 under the 1940 Act. The Plan authorizes payments by the Funds to intermediaries at an annual rate, as determined from time to time by the Board of Trustees, of up to 0.25% of the Class A Shares average daily net assets, of up to 1.00% of the Class C Shares average daily net assets, of up to 0.50% of the Class R Shares average daily net assets, and of up to 0.25% of the Class S Shares average daily net assets. Payments under the Plan are not tied exclusively to actual distribution and shareholder service expenses, and the payments may exceed distribution and shareholder service expenses actually incurred by the Funds. If any of a Fund’s actual distribution and shareholder service expenses incurred during a calendar year are less than the payments made during a calendar year, the Fund will be refunded the difference. Refunds, if any, are included in “Distribution fees and shareholder servicing fees” in the Statements of Operations.
Janus Capital has contractually agreed to waive the advisory fee payable by each Fund listed below in an amount equal to the amount, if any, that the Fund’s normal operating expenses in any fiscal year, including the investment advisory fee, but excluding any performance adjustments to management fees, the distribution and shareholder servicing fees (applicable to Class A Shares, Class C Shares, Class R Shares, and Class S Shares), administrative services fees payable pursuant to the Transfer Agency Agreement, brokerage commissions, interest, dividends, taxes, acquired fund fees and expenses, and extraordinary expenses, exceed the annual rates shown below. Janus Capital has agreed to continue each waiver until at least November 1, 2013. If applicable, amounts reimbursed to the Funds by Janus Capital are disclosed as “Excess Expense Reimbursement” on the Statements of Operations.
| | | | | | |
| | | Expense
| | |
| Fund | | Limit (%) | | |
| |
| |
| Perkins Large Cap Value Fund | | | 1.00 | | |
| Perkins Mid Cap Value Fund | | | 0.86 | | |
| Perkins Select Value Fund | | | 1.00 | | |
| Perkins Small Cap Value Fund | | | 0.96 | | |
| Perkins Value Plus Income Fund | | | 0.76 | | |
| |
| |
For a period of three years subsequent to Perkins Value Plus Income Fund’s commencement of operations, Janus Capital may recover from the Fund fees and expenses previously waived or reimbursed, which could be then considered a deferral, if the Fund’s expense ratio, including recovered expenses, falls below the expense limit. The recoupment of such reimbursements expires July 30, 2013 for Perkins Value Plus Income Fund. For the year ended June 30, 2013, total reimbursement by Janus Capital was $177,313 for the Fund. As of June 30, 2013, the aggregate amount of recoupment that may potentially be made to Janus Capital is $624,730.
The Board of Trustees has adopted a deferred compensation plan (the “Deferred Plan”) for independent Trustees to elect to defer receipt of all or a portion of the annual compensation they are entitled to receive from the Funds. All deferred fees are credited to an account established in the name of the Trustees. The amounts credited to the account then increase or decrease, as the case may be, in accordance with the performance of one or more of the Janus funds that are selected by the Trustees. The account balance continues to fluctuate in
Janus Value Funds | 113
Notes to Financial Statements (continued)
accordance with the performance of the selected fund or funds until final payment of all amounts are credited to the account. The fluctuation of the account balance is recorded by the Funds as unrealized appreciation/(depreciation) and is shown as of June 30, 2013 on the Statements of Assets and Liabilities as an asset, “Non-interested Trustees’ deferred compensation,” and a liability, “Non-interested Trustees’ deferred compensation fees.” Additionally, the recorded unrealized appreciation/(depreciation) is included in “Unrealized net appreciation/(depreciation) of investments, foreign currency translations and non-interested Trustees’ deferred compensation” on the Statements of Assets and Liabilities. Deferred compensation expenses for the year ended June 30, 2013 are included in “Non-interested Trustees’ fees and expenses” on the Statements of Operations. Trustees are allowed to change their designation of mutual funds from time to time. Amounts will be deferred until distributed in accordance with the Deferred Plan. Deferred fees of $243,941 were paid by the Trust to a Trustee under the Deferred Plan during the year ended June 30, 2013.
Certain officers of the Funds may also be officers and/or directors of Janus Capital. Each Fund pays for the salaries, fees, and expenses of certain Janus Capital employees and Fund officers, with respect to certain specified administration functions they perform on behalf of the Funds. Administration costs are separate and apart from advisory fees and other expenses paid in connection with the investment advisory services Janus Capital (or the subadviser) provides to each Fund. Some expenses related to compensation payable to the Funds’ Chief Compliance Officer and compliance staff are shared with the Funds. Total compensation of $487,826 was paid to the Chief Compliance Officer and certain compliance staff by the Trust during the year ended June 30, 2013. Each Fund’s portion is reported as part of “Other Expenses” on the Statements of Operations.
Class A Shares include a 5.75% upfront sales charge of the offering price of the Funds. The sales charge is allocated between Janus Distributors and financial intermediaries. During the year ended June 30, 2013, Janus Distributors retained the following upfront sales charges:
| | | | | | |
| | | Upfront
| | |
| Fund (Class A Shares) | | Sales Charge | | |
| |
| |
| Perkins Large Cap Value Fund | | $ | 1,562 | | |
| Perkins Mid Cap Value Fund | | | 29,929 | | |
| Perkins Small Cap Value Fund | | | 705 | | |
| Perkins Value Plus Income Fund | | | 894 | | |
| |
| |
A contingent deferred sales charge (“CDSC”) of 1.00% will be deducted with respect to Class A Shares purchased without a sales load and redeemed within 12 months of purchase, unless waived, as discussed in the Prospectus. Any applicable CDSC will be 1.00% of the lesser of the original purchase price or the value of the redemption of the Class A Shares redeemed. During the year ended June 30, 2013, redeeming shareholders of Class A Shares paid the following CDSCs to Janus Distributors:
| | | | | | |
| Fund (Class A Shares) | | CDSC | | |
| |
| |
| Perkins Mid Cap Value Fund | | $ | 168 | | |
| |
| |
Class C Shares include a 1.00% CDSC paid by redeeming shareholders to Janus Distributors. The CDSC applies to shares redeemed within 12 months of purchase. The redemption price may differ from the NAV per share. During the year ended June 30, 2013, redeeming shareholders of Class C Shares paid the following CDSCs:
| | | | | | |
| Fund (Class C Shares) | | CDSC | | |
| |
| |
| Perkins Large Cap Value Fund | | $ | 231 | | |
| Perkins Mid Cap Value Fund | | | 14,348 | | |
| Perkins Small Cap Value Fund | | | 318 | | |
| |
| |
The Funds’ expenses may be reduced by expense offsets from an unaffiliated custodian and/or transfer agent. Such credits or offsets are included in “Expense and Fee Offset” on the Statements of Operations (if applicable). The Funds could have employed the assets used by the custodian and/or transfer agent to produce income if they had not entered into an expense offset arrangement.
Pursuant to the provisions of the 1940 Act and rules promulgated thereunder, the Funds may participate in an affiliated or nonaffiliated cash sweep program. In the cash sweep program, uninvested cash balances of the Funds may be used to purchase shares of affiliated or nonaffiliated money market funds or cash management pooled investment vehicles. The Funds are eligible to participate in the cash sweep program (the “Investing Funds”). Janus Cash Liquidity Fund LLC is an affiliated unregistered cash management pooled investment vehicle that invests primarily in highly-rated short-term fixed-income securities. Janus Cash Liquidity Fund LLC currently maintains a NAV of $1.00 per share and distributes income daily in a manner consistent with a registered 2a-7 product. There are no restrictions on the Funds’ ability to withdraw investments from Janus Cash Liquidity Fund LLC at will, and there are no unfunded capital commitments due from the Funds to Janus Cash Liquidity Fund LLC. As adviser, Janus Capital has an inherent conflict of interest because of its fiduciary duties to the affiliated cash management pooled investment vehicles and the Investing Funds.
During the year ended June 30, 2013, any recorded distributions from affiliated investments as affiliated dividend income, and affiliated purchases and sales can be found in the Notes to Schedules of Investments and Other Information.
114 | JUNE 30, 2013
Janus Capital or an affiliate invested and/or redeemed initial seed capital during the year ended June 30, 2013, as indicated in the following table.
| | | | | | | | | | | | | | | | | | | | | |
| | | Seed Capital
| | | | Date of
| | | | Date of
| | Seed Capital
| | |
| Fund | | at 6/30/12 | | Purchases | | Purchases | | Redemptions | | Redemptions | | at 6/30/13 | | |
| |
| |
| Perkins Large Cap Value Fund - Class C Shares | | $ | 140,288 | | $ | – | | | – | | $ | (140,288) | | | 9/20/12 | | $ | – | | |
| Perkins Large Cap Value Fund - Class N Shares | | | 10,000 | | | – | | | – | | | (10,000) | | | 9/20/12 | | | – | | |
| Perkins Large Cap Value Fund - Class S Shares | | | 460,826 | | | – | | | – | | | (208,252) | | | 9/20/12 | | | 252,574 | | |
| Perkins Mid Cap Value Fund - Class N Shares | | | 10,000 | | | – | | | – | | | (10,000) | | | 9/20/12 | | | – | | |
| Perkins Select Value Fund - Class A Shares | | | 10,000 | | | – | | | – | | | (10,000) | | | 9/20/12 | | | – | | |
| Perkins Select Value Fund - Class C Shares | | | 10,000 | | | – | | | – | | | (10,000) | | | 9/20/12 | | | – | | |
| Perkins Select Value Fund - Class D Shares | | | 10,000 | | | – | | | – | | | (10,000) | | | 9/20/12 | | | – | | |
| Perkins Select Value Fund - Class I Shares | | | 10,000 | | | – | | | – | | | (10,000) | | | 9/20/12 | | | – | | |
| Perkins Select Value Fund - Class S Shares | | | 10,000 | | | – | | | – | | | – | | | – | | | 10,000 | | |
| Perkins Select Value Fund - Class T Shares | | | 10,000 | | | – | | | – | | | (10,000) | | | 9/20/12 | | | – | | |
| Perkins Small Cap Value Fund - Class N Shares | | | 10,000 | | | – | | | – | | | (10,000) | | | 9/20/12 | | | – | | |
| Perkins Value Plus Income Fund - Class A Shares | | | 3,333,333 | | | – | | | – | | | – | | | – | | | 3,333,333 | | |
| Perkins Value Plus Income Fund - Class C Shares | | | 3,333,333 | | | – | | | – | | | – | | | – | | | 3,333,333 | | |
| Perkins Value Plus Income Fund - Class D Shares | | | 3,333,333 | | | – | | | – | | | – | | | – | | | 3,333,333 | | |
| Perkins Value Plus Income Fund - Class I Shares | | | 3,333,334 | | | – | | | – | | | – | | | – | | | 3,333,334 | | |
| Perkins Value Plus Income Fund - Class S Shares | | | 3,333,333 | | | – | | | – | | | – | | | – | | | 3,333,333 | | |
| Perkins Value Plus Income Fund - Class T Shares | | | 3,333,334 | | | – | | | – | | | – | | | – | | | 3,333,334 | | |
| |
| |
The tax components of capital shown in the table below represent: (1) distribution requirements the Funds must satisfy under the income tax regulations; (2) losses or deductions the Funds may be able to offset against income and gains realized in future years; and (3) unrealized appreciation or depreciation of investments for federal income tax purposes.
Other book to tax differences may consist of deferred compensation, derivatives and foreign currency contract adjustments. The Funds have elected to treat gains and losses on forward foreign currency contracts as capital gains and losses, if applicable. Other foreign currency gains and losses on debt instruments are treated as ordinary income for federal income tax purposes pursuant to Section 988 of the Internal Revenue Code.
| | | | | | | | | | | | | | | | | | | | | | | | |
| | | Undistributed
| | Undistributed
| | | | Loss Deferrals | | Other Book
| | | | |
| | | Ordinary
| | Long-Term
| | Accumulated
| | Late-Year
| | Post-October
| | to Tax
| | Net Tax
| | |
| Fund | | Income | | Gains | | Capital Losses | | Ordinary Loss | | Capital Loss | | Differences | | Appreciation | | |
| |
| |
| Perkins Large Cap Value Fund | | $ | 1,396,394 | | $ | 8,899,281 | | $ | – | | $ | – | | $ | – | | $ | (2,136) | | $ | 24,319,008 | | |
| Perkins Mid Cap Value Fund | | | 141,173,475 | | | 735,837,219 | | | – | | | – | | | – | | | (189,715) | | | 1,909,253,488 | | |
| Perkins Select Value Fund | | | 861,294 | | | 1,614,074 | | | – | | | – | | | – | | | (967) | | | 7,602,219 | | |
| Perkins Small Cap Value Fund | | | 20,496,345 | | | 25,863,384 | | | (5,962,986) | | | – | | | – | | | (40,306) | | | 410,916,860 | | |
| Perkins Value Plus Income Fund | | | 660,502 | | | 1,295,549 | | | – | | | – | | | – | | | 4,565 | | | 3,756,648 | | |
| |
| |
Accumulated capital losses noted below represent net capital loss carryovers, as of June 30, 2013, that may be available to offset future realized capital gains and thereby reduce future taxable gains distributions. Under the Regulated Investment Company Modernization Act of 2010, the Funds are permitted to carry forward capital losses incurred in taxable years beginning after December 22, 2010 for an unlimited period. Losses incurred during those years will be required to be utilized prior to the losses incurred in pre-enactment taxable years. As a result of this ordering rule, pre-enactment capital loss carryforwards may more likely expire unused. Also, post-enactment capital losses that are carried forward will retain their character as either short-term or long-term capital losses rather than being considered all short-term as under previous law. The following table shows these capital loss carryovers.
Janus Value Funds | 115
Notes to Financial Statements (continued)
Capital Loss Carryover Expiration Schedule
For the year ended June 30, 2013
| | | | | | | | | |
| | | | | Accumulated
| | |
| Fund | | June 30, 2016 | | Capital Losses | | |
| |
| |
Perkins Small Cap Value Fund(1) | | $ | (5,962,986) | | $ | (5,962,986) | | |
| |
| |
| | | |
| (1) | | Capital loss carryover subject to annual limitations. |
During the year ended June 30, 2013, the following capital loss carryovers were utilized by the Funds as indicated in the table:
| | | | | | | | | | | | | | | |
| | | | | | | | | Capital Loss
| | |
| | | | | | | | | Carryover
| | |
| Fund | | | | | | | | Utilized | | |
| |
| |
| Perkins Small Cap Value Fund | | | | | | | | | | | $ | 1,987,662 | | |
| |
| |
The aggregate cost of investments and the composition of unrealized appreciation and depreciation of investment securities for federal income tax purposes as of June 30, 2013 are noted below.
Unrealized appreciation and unrealized depreciation in the table below exclude appreciation/(depreciation) on foreign currency translations. The primary differences between book and tax appreciation or depreciation of investments are wash sale loss deferrals and investments in partnerships.
| | | | | | | | | | | | |
| | | Federal Tax
| | Unrealized
| | Unrealized
| | |
| Fund | | Cost | | Appreciation | | (Depreciation) | | |
| |
| |
| Perkins Large Cap Value Fund | | $ | 109,230,214 | | $ | 25,780,903 | | $ | (1,461,895) | | |
| Perkins Mid Cap Value Fund | | | 9,816,516,326 | | | 1,983,292,196 | | | (74,038,708) | | |
| Perkins Select Value Fund | | | 64,206,249 | | | 8,601,227 | | | (999,008) | | |
| Perkins Small Cap Value Fund | | | 2,087,971,102 | | | 424,935,250 | | | (14,018,390) | | |
| Perkins Value Plus Income Fund | | | 52,917,028 | | | 4,454,270 | | | (697,622) | | |
| |
| |
Income and capital gains distributions are determined in accordance with income tax regulations that may differ from accounting principles generally accepted in the United States of America. These differences are due to differing treatments for items such as net short-term gains, deferral of wash sale losses, foreign currency transactions, net investment losses and capital loss carryovers. Certain permanent differences such as tax returns of capital and net investment losses noted below have been reclassified to paid-in capital.
For the year ended June 30, 2013
| | | | | | | | | | | | | | | | | | |
| | | Distributions | | | | | | |
| | | From Ordinary
| | From Long-Term
| | Tax Return of
| | Net Investment
| | | | |
| Fund | | Income | | Capital Gains | | Capital | | Loss | | | | |
| |
| |
| Perkins Large Cap Value Fund | | $ | 2,341,525 | | $ | 2,840,572 | | $ | – | | $ | – | | | | | |
| Perkins Mid Cap Value Fund | | | 84,817,950 | | | 429,296,214 | | | – | | | – | | | | | |
| Perkins Select Value Fund | | | 5,155,941 | | | – | | | – | | | – | | | | | |
| Perkins Small Cap Value Fund | | | 35,780,137 | | | 107,817,090 | | | – | | | – | | | | | |
| Perkins Value Plus Income Fund | | | 1,874,229 | | | 598,590 | | | – | | | – | | | | | |
| |
| |
For the year ended June 30, 2012
| | | | | | | | | | | | | | | | | | |
| | | Distributions | | | | | | |
| | | From Ordinary
| | From Long-Term
| | Tax Return of
| | Net Investment
| | | | |
| Fund | | Income | | Capital Gains | | Capital | | Loss | | | | |
| |
| |
| Perkins Large Cap Value Fund | | $ | 3,790,921 | | $ | 4,577,106 | | $ | – | | $ | – | | | | | |
| Perkins Mid Cap Value Fund | | | 186,409,820 | | | 883,352,613 | | | – | | | – | | | | | |
| Perkins Small Cap Value Fund | | | 116,402,065 | | | 236,744,026 | | | – | | | – | | | | | |
| Perkins Value Plus Income Fund | | | 2,533,669 | | | 139,429 | | | – | | | – | | | | | |
| |
| |
116 | JUNE 30, 2013
| |
| 6. | Capital Share Transactions |
| | | | | | | | | | | | | | | | | | | | | | | | | | | | | | | | | | | | | | | | | | | |
| | | Perkins Large Cap
| | | Perkins Mid Cap
| | | Perkins Select
| | | Perkins Small Cap
| | | Perkins Value Plus
| | | |
For the years or periods ended June 30
| | Value Fund | | | Value Fund | | | Value Fund | | | Value Fund | | | Income Fund | | | |
| (all numbers in thousands) | | 2013 | | | 2012(1) | | | 2013 | | | 2012(1) | | | 2013 | | | 2012(2) | | | 2013 | | | 2012(1) | | | 2013 | | | 2012 | | | |
| |
| Transactions in Fund Shares – Class A Shares: | | | | | | | | | | | | | | | | | | | | | | | | | | | | | | | | | | | | | | | | | | |
| Shares sold | | | 26 | | | | 108 | | | | 10,214 | | | | 13,285 | | | | 5 | | | | 9 | | | | 1,297 | | | | 2,297 | | | | 67 | | | | 66 | | | |
| Reinvested dividends and distributions | | | 5 | | | | 10 | | | | 1,549 | | | | 3,931 | | | | 1 | | | | – | | | | 233 | | | | 686 | | | | 22 | | | | 30 | | | |
| Shares repurchased | | | (36) | | | | (55) | | | | (29,651) | | | | (19,338) | | | | (5) | | | | (1) | | | | (3,344) | | | | (5,242) | | | | (24) | | | | (66) | | | |
| Net Increase/(Decrease) in Fund Shares | | | (5) | | | | 63 | | | | (17,888) | | | | (2,122) | | | | 1 | | | | 8 | | | | (1,814) | | | | (2,259) | | | | 65 | | | | 30 | | | |
| Shares Outstanding, Beginning of Period | | | 222 | | | | 159 | | | | 55,307 | | | | 57,429 | | | | 8 | | | | – | | | | 6,711 | | | | 8,970 | | | | 466 | | | | 436 | | | |
| Shares Outstanding, End of Period | | | 217 | | | | 222 | | | | 37,419 | | | | 55,307 | | | | 9 | | | | 8 | | | | 4,897 | | | | 6,711 | | | | 531 | | | | 466 | | | |
| Transactions in Fund Shares – Class C Shares: | | | | | | | | | | | | | | | | | | | | | | | | | | | | | | | | | | | | | | | | | | |
| Shares sold | | | 84 | | | | 90 | | | | 1,165 | | | | 1,967 | | | | 6 | | | | 7 | | | | 50 | | | | 99 | | | | 29 | | | | 67 | | | |
| Reinvested dividends and distributions | | | 3 | | | | 6 | | | | 259 | | | | 555 | | | | 1 | | | | – | | | | 29 | | | | 112 | | | | 18 | | | | 24 | | | |
| Shares repurchased | | | (90) | | | | (98) | | | | (3,597) | | | | (2,667) | | | | (3) | | | | – | | | | (372) | | | | (367) | | | | (20) | | | | (19) | | | |
| Net Increase/(Decrease) in Fund Shares | | | (3) | | | | (2) | | | | (2,173) | | | | (145) | | | | 4 | | | | 7 | | | | (293) | | | | (156) | | | | 27 | | | | 72 | | | |
| Shares Outstanding, Beginning of Period | | | 198 | | | | 200 | | | | 10,169 | | | | 10,314 | | | | 7 | | | | – | | | | 1,042 | | | | 1,198 | | | | 442 | | | | 370 | | | |
| Shares Outstanding, End of Period | | | 195 | | | | 198 | | | | 7,996 | | | | 10,169 | | | | 11 | | | | 7 | | | | 749 | | | | 1,042 | | | | 469 | | | | 442 | | | |
| Transactions in Fund Shares – Class D Shares: | | | | | | | | | | | | | | | | | | | | | | | | | | | | | | | | | | | | | | | | | | |
| Shares sold | | | 1,088 | | | | 783 | | | | 1,275 | | | | 1,655 | | | | 280 | | | | 337 | | | | 159 | | | | 198 | | | | 631 | | | | 958 | | | |
| Reinvested dividends and distributions | | | 53 | | | | 80 | | | | 1,587 | | | | 3,358 | | | | 26 | | | | – | | | | 177 | | | | 440 | | | | 90 | | | | 87 | | | |
| Shares repurchased | | | (428) | | | | (579) | | | | (5,750) | | | | (5,456) | | | | (95) | | | | (60) | | | | (611) | | | | (656) | | | | (401) | | | | (374) | | | |
| Net Increase/(Decrease) in Fund Shares | | | 713 | | | | 284 | | | | (2,888) | | | | (443) | | | | 211 | | | | 277 | | | | (275) | | | | (18) | | | | 320 | | | | 671 | | | |
| Shares Outstanding, Beginning of Period | | | 1,344 | | | | 1,060 | | | | 39,061 | | | | 39,504 | | | | 277 | | | | – | | | | 3,444 | | | | 3,462 | | | | 1,803 | | | | 1,132 | | | |
| Shares Outstanding, End of Period | | | 2,057 | | | | 1,344 | | | | 36,173 | | | | 39,061 | | | | 488 | | | | 277 | | | | 3,169 | | | | 3,444 | | | | 2,123 | | | | 1,803 | | | |
| Transactions in Fund Shares – Class I Shares: | | | | | | | | | | | | | | | | | | | | | | | | | | | | | | | | | | | | | | | | | | |
| Shares sold | | | 45 | | | | 1,428 | | | | 35,686 | | | | 52,978 | | | | 778 | | | | 5,656 | | | | 9,827 | | | | 18,637 | | | | 34 | | | | 189 | | | |
| Reinvested dividends and distributions | | | 96 | | | | 538 | | | | 5,355 | | | | 11,353 | | | | 444 | | | | – | | | | 2,435 | | | | 5,615 | | | | 42 | | | | 50 | | | |
| Shares repurchased | | | (1,085) | | | | (6,328) | | | | (77,666) | | | | (44,213) | | | | (1,179) | | | | (221) | | | | (34,156) | | | | (20,356) | | | | (78) | | | | (95) | | | |
| Net Increase/(Decrease) in Fund Shares | | | (944) | | | | (4,362) | | | | (36,625) | | | | 20,118 | | | | 43 | | | | 5,435 | | | | (21,894) | | | | 3,896 | | | | (2) | | | | 144 | | | |
| Shares Outstanding, Beginning of Period | | | 3,565 | | | | 7,927 | | | | 162,897 | | | | 142,779 | | | | 5,435 | | | | – | | | | 56,566 | | | | 52,670 | | | | 849 | | | | 705 | | | |
| Shares Outstanding, End of Period | | | 2,621 | | | | 3,565 | | | | 126,272 | | | | 162,897 | | | | 5,478 | | | | 5,435 | | | | 34,672 | | | | 56,566 | | | | 847 | | | | 849 | | | |
| Transactions in Fund Shares – Class L Shares: | | | | | | | | | | | | | | | | | | | | | | | | | | | | | | | | | | | | | | | | | | |
| Shares sold | | | N/A | | | | N/A | | | | 45 | | | | 235 | | | | N/A | | | | N/A | | | | 1,380 | | | | 848 | | | | N/A | | | | N/A | | | |
| Reinvested dividends and distributions | | | N/A | | | | N/A | | | | 54 | | | | 206 | | | | N/A | | | | N/A | | | | 572 | | | | 1,591 | | | | N/A | | | | N/A | | | |
| Shares repurchased | | | N/A | | | | N/A | | | | (700) | | | | (1,496) | | | | N/A | | | | N/A | | | | (5,466) | | | | (2,221) | | | | N/A | | | | N/A | | | |
| Net Increase/(Decrease) in Fund Shares | | | N/A | | | | N/A | | | | (601) | | | | (1,055) | | | | N/A | | | | N/A | | | | (3,514) | | | | 218 | | | | N/A | | | | N/A | | | |
| Shares Outstanding, Beginning of Period | | | N/A | | | | N/A | | | | 1,604 | | | | 2,659 | | | | N/A | | | | N/A | | | | 13,065 | | | | 12,847 | | | | N/A | | | | N/A | | | |
| Shares Outstanding, End of Period | | | N/A | | | | N/A | | | | 1,003 | | | | 1,604 | | | | N/A | | | | N/A | | | | 9,551 | | | | 13,065 | | | | N/A | | | | N/A | | | |
| Transactions in Fund Shares – Class N Shares: | | | | | | | | | | | | | | | | | | | | | | | | | | | | | | | | | | | | | | | | | | |
| Shares sold | | | 925 | | | | 5,003 | | | | 11,077 | | | | 1,025 | | | | N/A | | | | N/A | | | | 11,795 | | | | 586 | | | | N/A | | | | N/A | | | |
| Reinvested dividends and distributions | | | 200 | | | | – | | | | 236 | | | | – | | | | N/A | | | | N/A | | | | 171 | | | | – | | | | N/A | | | | N/A | | | |
| Shares repurchased | | | (2,945) | | | | (31) | | | | (3,087) | | | | (3) | | | | N/A | | | | N/A | | | | (1,932) | | | | (4) | | | | N/A | | | | N/A | | | |
| Net Increase/(Decrease) in Fund Shares | | | (1,820) | | | | 4,972 | | | | 8,226 | | | | 1,022 | | | | N/A | | | | N/A | | | | 10,034 | | | | 582 | | | | N/A | | | | N/A | | | |
| Shares Outstanding, Beginning of Period | | | 4,972 | | | | – | | | | 1,022 | | | | – | | | | N/A | | | | N/A | | | | 582 | | | | – | | | | N/A | | | | N/A | | | |
| Shares Outstanding, End of Period | | | 3,152 | | | | 4,972 | | | | 9,248 | | | | 1,022 | | | | N/A | | | | N/A | | | | 10,616 | | | | 582 | | | | N/A | | | | N/A | | | |
| Transactions in Fund Shares – Class R Shares: | | | | | | | | | | | | | | | | | | | | | | | | | | | | | | | | | | | | | | | | | | |
| Shares sold | | | N/A | | | | N/A | | | | 2,201 | | | | 2,625 | | | | N/A | | | | N/A | | | | 325 | | | | 425 | | | | N/A | | | | N/A | | | |
| Reinvested dividends and distributions | | | N/A | | | | N/A | | | | 270 | | | | 522 | | | | N/A | | | | N/A | | | | 63 | | | | 171 | | | | N/A | | | | N/A | | | |
| Shares repurchased | | | N/A | | | | N/A | | | | (3,340) | | | | (2,657) | | | | N/A | | | | N/A | | | | (623) | | | | (608) | | | | N/A | | | | N/A | | | |
| Net Increase/(Decrease) in Fund Shares | | | N/A | | | | N/A | | | | (869) | | | | 490 | | | | N/A | | | | N/A | | | | (235) | | | | (12) | | | | N/A | | | | N/A | | | |
| Shares Outstanding, Beginning of Period | | | N/A | | | | N/A | | | | 7,722 | | | | 7,232 | | | | N/A | | | | N/A | | | | 1,538 | | | | 1,550 | | | | N/A | | | | N/A | | | |
| Shares Outstanding, End of Period | | | N/A | | | | N/A | | | | 6,853 | | | | 7,722 | | | | N/A | | | | N/A | | | | 1,303 | | | | 1,538 | | | | N/A | | | | N/A | | | |
Janus Value Funds | 117
Notes to Financial Statements (continued)
| | | | | | | | | | | | | | | | | | | | | | | | | | | | | | | | | | | | | | | | | | | |
| | | Perkins Large Cap
| | | Perkins Mid Cap
| | | Perkins Select
| | | Perkins Small Cap
| | | Perkins Value Plus
| | | |
For the years or periods ended June 30
| | Value Fund | | | Value Fund | | | Value Fund | | | Value Fund | | | Income Fund | | | |
| (all numbers in thousands) | | 2013 | | | 2012(1) | | | 2013 | | | 2012(1) | | | 2013 | | | 2012(2) | | | 2013 | | | 2012(1) | | | 2013 | | | 2012 | | | |
| |
| Transactions in Fund Shares – Class S Shares: | | | | | | | | | | | | | | | | | | | | | | | | | | | | | | | | | | | | | | | | | | |
| Shares sold | | | – | | | | – | | | | 8,631 | | | | 12,570 | | | | – | | | | 1 | | | | 761 | | | | 1,117 | | | | – | | | | – | | | |
| Reinvested dividends and distributions | | | 1 | | | | 4 | | | | 1,459 | | | | 3,106 | | | | – | | | | – | | | | 208 | | | | 539 | | | | 17 | | | | 22 | | | |
| Shares repurchased | | | (21) | | | | (1) | | | | (18,446) | | | | (12,971) | | | | – | | | | – | | | | (2,010) | | | | (1,467) | | | | – | | | | – | | | |
| Net Increase/(Decrease) in Fund Shares | | | (20) | | | | 3 | | | | (8,356) | | | | 2,705 | | | | – | | | | 1 | | | | (1,041) | | | | 189 | | | | 17 | | | | 22 | | | |
| Shares Outstanding, Beginning of Period | | | 51 | | | | 48 | | | | 38,011 | | | | 35,306 | | | | 1 | | | | – | | | | 4,478 | | | | 4,289 | | | | 364 | | | | 342 | | | |
| Shares Outstanding, End of Period | | | 31 | | | | 51 | | | | 29,655 | | | | 38,011 | | | | 1 | | | | 1 | | | | 3,437 | | | | 4,478 | | | | 381 | | | | 364 | | | |
| Transactions in Fund Shares – Class T Shares: | | | | | | | | | | | | | | | | | | | | | | | | | | | | | | | | | | | | | | | | | | |
| Shares sold | | | 78 | | | | 66 | | | | 32,336 | | | | 45,005 | | | | 29 | | | | 98 | | | | 4,082 | | | | 4,927 | | | | 79 | | | | 76 | | | |
| Reinvested dividends and distributions | | | 6 | | | | 11 | | | | 11,421 | | | | 26,055 | | | | 8 | | | | – | | | | 2,170 | | | | 5,817 | | | | 23 | | | | 28 | | | |
| Shares repurchased | | | (56) | | | | (65) | | | | (107,157) | | | | (104,088) | | | | (19) | | | | (1) | | | | (14,281) | | | | (17,387) | | | | (58) | | | | (102) | | | |
| Net Increase/(Decrease) in Fund Shares | | | 28 | | | | 12 | | | | (63,400) | | | | (33,028) | | | | 18 | | | | 97 | | | | (8,029) | | | | (6,643) | | | | 44 | | | | 2 | | | |
| Shares Outstanding, Beginning of Period | | | 169 | | | | 157 | | | | 295,959 | | | | 328,987 | | | | 97 | | | | – | | | | 43,798 | | | | 50,441 | | | | 453 | | | | 451 | | | |
| Shares Outstanding, End of Period | | | 197 | | | | 169 | | | | 232,559 | | | | 295,959 | | | | 115 | | | | 97 | | | | 35,769 | | | | 43,798 | | | | 497 | | | | 453 | | | |
| | | |
| (1) | | Period from May 31, 2012 (inception date) through June 30, 2012 for Class N Shares. |
| (2) | | Period from December 15, 2011 (inception date) through June 30, 2012. |
118 | JUNE 30, 2013
| |
| 7. | Purchases and Sales of Investment Securities |
For the year ended June 30, 2013, the aggregate cost of purchases and proceeds from sales of investment securities (excluding any short-term securities, short-term options contracts, and in-kind transactions) was as follows:
| | | | | | | | | | | | | | | |
| | | | | | | Purchases of Long-
| | Proceeds from Sales
| | |
| | | Purchases of
| | Proceeds from Sales
| | Term U.S. Government
| | of Long-Term U.S.
| | |
| Fund | | Securities | | of Securities | | Obligations | | Government Obligations | | |
| |
| Perkins Large Cap Value Fund | | $ | 57,162,982 | | $ | 87,175,220 | | $ | – | | $ | – | | |
| Perkins Mid Cap Value Fund | | | 6,657,336,847 | | | 9,203,560,073 | | | – | | | – | | |
| Perkins Select Value Fund | | | 47,233,767 | | | 34,137,998 | | | – | | | – | | |
| Perkins Small Cap Value Fund | | | 1,358,923,967 | | | 1,821,008,920 | | | – | | | – | | |
| Perkins Value Plus Income Fund | | | 39,499,853 | | | 38,553,624 | | | 14,919,789 | | | 11,222,936 | | |
| |
| |
| |
| 8. | New Accounting Pronouncements |
In December 2011, the FASB issued Accounting Standards Update No. 2011-11, “Disclosures about Offsetting Assets and Liabilities.” This update creates disclosure requirements requiring entities to disclose both gross and net information for derivatives and other financial instruments that are either offset in the Statements of Assets and Liabilities or subject to an enforceable master netting arrangement or similar agreement. In January 2013, the FASB issued Accounting Standards Update No. 2013-01, “Clarifying the Scope of Disclosures about Offsetting Assets and Liabilities.” This update limits the scope of the new Statements of Assets and Liabilities offsetting disclosures to derivatives, repurchase agreements, reverse repurchase agreements, securities borrowing and securities lending transactions that are either offset in the Statements of Assets and Liabilities or subject to an enforceable master netting arrangement or similar agreement. These disclosure requirements are effective for annual reporting periods beginning on or after January 1, 2013, and interim periods within those annual periods. Management is currently evaluating the impact these updates may have on the Funds’ financial statements.
Management has evaluated whether any other events or transactions occurred subsequent to June 30, 2013 and through the date of issuance of the Funds’ financial statements and determined that there were no material events or transactions that would require recognition or disclosure in the Funds’ financial statements.
Janus Value Funds | 119
Report of Independent Registered Public Accounting Firm
To the Board of Trustees and Shareholders
of Janus Investment Fund:
In our opinion, the accompanying statements of assets and liabilities, including the schedules of investments, and the related statements of operations and of changes in net assets and the financial highlights present fairly, in all material respects, the financial position of Perkins Large Cap Value Fund, Perkins Mid Cap Value Fund, Perkins Select Value Fund, Perkins Small Cap Value Fund, and Perkins Value Plus Income Fund (five of the funds constituting Janus Investment Fund, hereafter referred to as the “Funds”) at June 30, 2013 and the results of each of their operations for the year then ended, the changes in each of their net assets for each of the two years in the period then ended, and the financial highlights for each of the periods presented, in conformity with accounting principles generally accepted in the United States of America. These financial statements and financial highlights (hereafter referred to as “financial statements”) are the responsibility of the Funds’ management; our responsibility is to express an opinion on these financial statements based on our audits. We conducted our audits of these financial statements in accordance with the standards of the Public Company Accounting Oversight Board (United States). Those standards require that we plan and perform the audit to obtain reasonable assurance about whether the financial statements are free of material misstatement. An audit includes examining, on a test basis, evidence supporting the amounts and disclosures in the financial statements, assessing the accounting principles used and significant estimates made by management, and evaluating the overall financial statement presentation. We believe that our audits, which included confirmation of securities at June 30, 2013 by correspondence with the custodian, transfer agent and brokers, provide a reasonable basis for our opinion.
Denver, Colorado
August 19, 2013
120 | JUNE 30, 2013
Additional Information (unaudited)
Proxy Voting Policies and Voting Record
A description of the policies and procedures that the Funds use to determine how to vote proxies relating to their portfolio securities is available without charge: (i) upon request, by calling 1-800-525-0020 (toll free); (ii) on the Funds’ website at janus.com/proxyvoting; and (iii) on the SEC’s website at http://www.sec.gov. Additionally, information regarding each Fund’s proxy voting record for the most recent twelve-month period ended June 30 is also available, free of charge, through janus.com/proxyvoting and from the SEC’s website at http://www.sec.gov.
Quarterly Portfolio Holdings
The Funds file their complete portfolio holdings (schedule of investments) with the SEC for the first and third quarters of each fiscal year on Form N-Q within 60 days of the end of such fiscal quarter. The Funds’ Form N-Q: (i) is available on the SEC’s website at http://www.sec.gov; (ii) may be reviewed and copied at the SEC’s Public Reference Room in Washington, D.C. (information on the Public Reference Room may be obtained by calling 1-800-SEC-0330); and (iii) is available without charge, upon request, by calling Janus at 1-800-525-0020 (toll free).
Approval of Advisory Agreements During the Period
The Trustees of Janus Investment Fund, none of whom has ever been affiliated with Janus Capital and each of whom serves as an “independent” Trustee (the “Trustees”), oversee the management of each Fund and, as required by law, determine annually whether to continue the investment advisory agreement for each Fund and the subadvisory agreements for the nine Funds that utilize subadvisers.
In connection with their most recent consideration of those agreements for each Fund, the Trustees received and reviewed a substantial amount of information provided by Janus Capital and the respective subadvisers in response to requests of the Trustees and their independent legal counsel. They also received and reviewed a considerable amount of information and analysis provided by, and in response to requests of, their independent fee consultant. Throughout their consideration of the agreements, the Trustees were advised by their independent legal counsel. The Trustees met with management to consider the agreements, and also met separately in executive session with their independent legal counsel and their independent fee consultant.
At a meeting held on December 7, 2012, based on the Trustees’ evaluation of the information provided by Janus Capital, the subadvisers and the independent fee consultant, as well as other information, the Trustees determined that the overall arrangements between each Fund and Janus Capital and each subadviser, as applicable, were fair and reasonable in light of the nature, extent and quality of the services provided by Janus Capital, its affiliates and the subadvisers, the fees charged for those services, and other matters that the Trustees considered relevant in the exercise of their business judgment. At that meeting, the Trustees unanimously approved the continuation of the investment advisory agreement for each Fund, and the subadvisory agreement for each subadvised Fund, for the period from February 1, 2013 through February 1, 2014, subject to earlier termination as provided for in each agreement.
In considering the continuation of those agreements, the Trustees reviewed and analyzed various factors that they determined were relevant, including the factors described below, none of which by itself was considered dispositive. However, the material factors and conclusions that formed the basis for the Trustees’ determination to approve the continuation of the agreements are discussed separately below. Also included is a summary of the independent fee consultant’s conclusions and opinions that arose during, and were included as part of, the Trustees’ consideration of the agreements.
Nature, Extent and Quality of Services
The Trustees reviewed the nature, extent and quality of the services provided by Janus Capital and the subadvisers to the Funds, taking into account the investment objective and strategy of each Fund and the knowledge the Trustees gained from their regular meetings with management on at least a quarterly basis and their ongoing review of information related to the Funds. In addition, the Trustees reviewed the resources and key personnel of Janus Capital and each subadviser, particularly noting those employees who provide investment and risk management services to the Funds. The Trustees also considered other services provided to the Funds by Janus Capital or the subadvisers, such as managing the execution of portfolio transactions and the selection of broker-dealers for those transactions. The Trustees considered Janus Capital’s role as administrator to the Funds, noting that Janus Capital does not receive a fee for its services but is reimbursed for its out-of-pocket costs. The Trustees considered the role of Janus Capital in monitoring adherence to the Funds’ investment restrictions, providing support services for the Trustees and Trustee committees, communicating with shareholders and overseeing the activities of other service providers, including monitoring compliance with various policies and
Janus Value Funds | 121
Additional Information (unaudited) (continued)
procedures of the Funds and with applicable securities laws and regulations.
In this regard, the independent fee consultant noted that Janus Capital provides a number of different services for the Funds of Janus Investment Fund and the Portfolios of Janus Aspen Series (such Funds and Portfolios, together the “Janus Funds”) and Janus Fund shareholders, ranging from investment management services to various other servicing functions, and that, in its opinion, Janus Capital is a capable provider of those services. The independent fee consultant also provided its belief that Janus Capital has developed institutional competitive advantages that should be able to provide superior investment management returns over the long term.
The Trustees concluded that the nature, extent and quality of the services provided by Janus Capital or the subadviser to each Fund were appropriate and consistent with the terms of the respective advisory and subadvisory agreements, and that, taking into account steps taken to address those Funds whose performance lagged that of their peers for certain periods, the quality of those services had been consistent with or superior to quality norms in the industry and the Funds were likely to benefit from the continued provision of those services. They also concluded that Janus Capital and each subadviser had sufficient personnel, with the appropriate education and experience, to serve the Funds effectively and had demonstrated its continuing ability to attract well-qualified personnel.
Performance of the Funds
The Trustees considered the performance results of each Fund over various time periods. They reviewed information comparing each Fund’s performance with the performance of comparable funds and peer groups identified by independent data providers, and with the Fund’s benchmark index. In this regard, the independent fee consultant found that the Janus Funds have had some recent performance challenges, but performance has improved recently, and for the 36 months ended September 30, 2012, approximately 47% of the Janus Funds were in the top two quartiles of performance and for the 12 months ended September 30, 2012, approximately 54% of the Janus Funds were in the top two quartiles of performance. The Trustees concluded that the performance of certain Funds was good under current market conditions. Although the performance of other Funds lagged that of their peers for certain periods, the Trustees also concluded that Janus Capital had taken or was taking appropriate steps to address those instances of under-performance.
Costs of Services Provided
The Trustees examined information regarding the fees and expenses of each Fund in comparison to similar information for other comparable funds as provided by independent data providers. They also reviewed an analysis of that information provided by their independent fee consultant and noted that the rate of management (investment advisory and any administration) fees for most of the Funds, after applicable contractual expense limitations, was below the mean management fee rate of the respective peer group of funds selected by the independent data providers.
In this regard, the independent fee consultant provided its belief that the management fees charged by Janus Capital to each of the Janus Funds under the current investment advisory and administration agreements are reasonable in relation to the services provided by Janus Capital. The independent fee consultant found (1) the total expenses and management fees of the Janus Funds to be reasonable relative to other mutual funds; (2) total expenses, on average, were 16% below the mean total expenses of their respective Lipper Expense Group peers and 23% below the mean total expenses for their Lipper Expense Universes; (3) management fees for the Janus Funds, on average, were 9% below the mean management fees for their Expense Groups and 12% below the mean for their Expense Universes; and (4) Janus Funds expenses at the functional level for each asset and share class category were reasonable. The independent fee consultant concluded that based on its strategic review of expenses at the complex, category and individual fund level, Janus Funds expenses were found to be reasonable relative to both Expense Group and Expense Universe benchmarks. Further, for certain Funds the independent fee consultant also performed a systematic “focus list” analysis of expenses in the context of the performance or service delivered to each set of investors in each share class in each selected Fund. Based on this analysis, the independent fee consultant found that the combination of service quality/ performance and expenses on these individual Funds and share classes were reasonable in light of performance trends, performance histories and existence of performance fees on such Funds.
The Trustees considered the methodology used by Janus Capital and each subadviser in determining compensation payable to portfolio managers, the competitive environment for investment management talent and the competitive market for mutual funds in different distribution channels. They concluded that the compensation methodology provided a good alignment of the interests of the portfolio managers with the interests of Fund shareholders.
122 | JUNE 30, 2013
The Trustees also reviewed management fees charged by Janus Capital and each subadviser to their separate account clients and to non-affiliated funds subadvised by Janus Capital or by a subadviser (for which Janus Capital or the subadviser provides only portfolio management services). Although in most instances subadvisory and separate account fee rates for various investment strategies were lower than management fee rates for Funds having a similar strategy, the Trustees noted that, under the terms of the management agreements with the Funds, Janus Capital performs significant additional services for the Funds that it does not provide to those other clients, including administration services, oversight of the Funds’ other service providers, trustee support, regulatory compliance and numerous other services, and that, in serving the Funds, Janus Capital assumes many legal risks that it does not assume in servicing its other clients. Moreover, they noted the research conducted and conclusions reached by their independent fee consultant.
In this regard, the independent fee consultant found that (1) the management fees Janus Capital charges to the Janus Funds are reasonable in relation to the management fees Janus Capital charges to its institutional and subadvised accounts; (2) these institutional and subadvised accounts have different service and infrastructure needs; and (3) the average spread between management fees charged to the Janus Funds and those charged to Janus Capital’s institutional and subadvised accounts is reasonable relative to the average spreads seen in the industry.
The Trustees reviewed information on the profitability to Janus Capital and its affiliates of their relationships with each Fund, as well as an explanation of the methodology utilized in allocating various expenses of Janus Capital and its affiliates among the Funds and other clients. The Trustees also reviewed the financial statements and corporate structure of Janus Capital’s parent company. In their review, the Trustees considered whether Janus Capital and each subadviser receive adequate incentives to manage the Funds effectively. The Trustees recognized that profitability comparisons among fund managers are difficult because very little comparative information is publicly available and the profitability of any fund manager is affected by numerous factors, including the organizational structure of the particular fund manager, the types of funds and other accounts it manages, possible other lines of business, the methodology for allocating expenses and the fund manager’s capital structure and cost of capital. However, taking into account those factors and the analysis provided by the Trustees’ independent fee consultant, and based on the information available, the Trustees concluded that Janus Capital’s profitability with respect to each Fund in relation to the services rendered was not unreasonable.
In this regard, the independent fee consultant found that, while assessing the reasonability of expenses in light of Janus Capital’s profits is dependent on comparisons with other publicly-traded mutual fund advisers, and that these comparisons are limited in accuracy by differences in complex size, business mix, institutional account orientation, and other factors, after accepting these limitations, the level of profit earned by Janus Capital from managing the Janus Funds is reasonable.
The Trustees concluded that the management fees and other compensation payable by each Fund to Janus Capital and its affiliates, as well as the fees paid by Janus Capital to the subadvisers of the subadvised Funds, were reasonable in relation to the nature, extent and quality of the services provided, taking into account the fees charged by other advisers for managing comparable mutual funds with similar strategies, the fees Janus Capital and the subadvisers charge to other clients, and, as applicable, the impact of fund performance on fees payable by the Funds. The Trustees also concluded that the overall expense ratio of each Fund was reasonable, taking into account the size of the Fund, the quality of services provided by Janus Capital and any subadviser, the investment performance of the Fund and any expense limitations agreed to by Janus Capital.
Economies of Scale
The Trustees considered information about the potential for Janus Capital to realize economies of scale as the assets of the Funds increase. They noted that, although many Funds pay advisory fees at a base fixed rate as a percentage of net assets, without any breakpoints, the actual management fee rate paid by most of the Funds, after any contractual expense limitations, was below the mean management fee rate of the Fund’s peer group identified by independent data providers; and, for those Funds whose expenses are being reduced by the contractual expense limitations of Janus Capital, Janus Capital is subsidizing the Funds because they have not reached adequate scale. Moreover, as the assets of many of the Funds have declined in the past few years, certain Funds have benefited from having advisory fee rates that have remained constant rather than increasing as assets declined. In addition, performance fee structures have been implemented for various Funds that have caused or will cause the effective rate of advisory fees payable by such a Fund to vary depending on the investment performance of the Fund relative to its benchmark index over the measurement period; and the five Funds that have fee schedules with breakpoints and reduced fee rates above certain asset levels. The Trustees also noted
Janus Value Funds | 123
Additional Information (unaudited) (continued)
that the Funds share directly in economies of scale through the lower charges of third-party service providers that are based in part on the combined scale of all of the Funds. Based on all of the information they reviewed, including research and analysis conducted by the Trustees’ independent fee consultant, the Trustees concluded that the current fee structure of each Fund was reasonable and that the current rates of fees do reflect a sharing between Janus Capital and the Fund of economies of scale at the current asset level of the Fund.
In this regard, the independent fee consultant concluded that, based on analysis it completed, and given the limitations in these analytical approaches and their conflicting results, it could not confirm or deny the existence of economies of scale in the Janus complex. Further, the independent fee consultant provided its belief that Janus Fund investors are well-served by the fee levels and performance fee structures in place on the Janus Funds in light of any economies of scale that may be present at Janus Capital.
Other Benefits to Janus Capital
The Trustees also considered benefits that accrue to Janus Capital and its affiliates from their relationships with the Funds. They recognized that two affiliates of Janus Capital separately serve the Funds as transfer agent and distributor, respectively, and the transfer agent receives compensation directly from the non-money market funds for services provided. The Trustees also considered Janus Capital’s past and proposed use of commissions paid by the Funds on their portfolio brokerage transactions to obtain proprietary and third-party research products and services benefiting the Fund and/or other clients of Janus Capital. The Trustees concluded that Janus Capital’s use of these types of client commission arrangements to obtain proprietary and third-party research products and services was consistent with regulatory requirements and guidelines and was likely to benefit each Fund. The Trustees also concluded that, other than the services provided by Janus Capital and its affiliates pursuant to the agreements and the fees to be paid by each Fund therefor, the Funds and Janus Capital may potentially benefit from their relationship with each other in other ways. They concluded that Janus Capital benefits from the receipt of research products and services acquired through commissions paid on portfolio transactions of the Funds and that the Funds benefit from Janus Capital’s receipt of those products and services as well as research products and services acquired through commissions paid by other clients of Janus Capital. They further concluded that success of any Fund could attract other business to Janus Capital or other Janus Funds, and that the success of Janus Capital could enhance Janus Capital’s ability to serve the Funds.
After full consideration of the above factors, as well as other factors, the Trustees, each of whom is an independent Trustee, concluded at their December 7, 2012 meeting that the proposed continuation of the investment advisory agreement and, if applicable, the subadvisory agreement for each Fund for another year was in the best interest of the respective Funds and their shareholders.
124 | JUNE 30, 2013
Useful Information About Your Fund Report (unaudited)
The Management Commentary in this report includes valuable insight from each of the Fund’s managers as well as statistical information to help you understand how your Fund’s performance and characteristics stack up against those of comparable indices.
If the Fund invests in foreign securities, this report may include information about country exposure. Country exposure is based primarily on the country of risk. The Fund’s managers may allocate a company to a country based on other factors such as location of the company’s principal office, the location of the principal trading market for the company’s securities, or the country where a majority of the company’s revenues are derived.
Please keep in mind that the opinions expressed by the Chief Investment Officer(s) in the Market Perspective and by the Fund’s managers in the Management Commentary are just that: opinions. They are a reflection of the Chief Investment Officer(s) and managers’ best judgment at the time this report was compiled, which was June 30, 2013. As the investing environment changes, so could their opinions. These views are unique to them and aren’t necessarily shared by fellow employees or by Janus in general.
Performance overview graphs compare the performance of a hypothetical $10,000 investment in the Fund with one or more widely used market indices. The hypothetical example does not represent the returns of any particular investment.
When comparing the performance of the Fund with an index, keep in mind that market indices do not include brokerage commissions that would be incurred if you purchased the individual securities in the index. They also do not include taxes payable on dividends and interest or operating expenses incurred if you maintained the Fund invested in the index.
Average annual total returns are quoted for a Fund with more than one year of performance history. Average annual total return is calculated by taking the growth or decline in value of an investment over a period of time, including reinvestment of dividends and distributions, then calculating the annual compounded percentage rate that would have produced the same result had the rate of growth been constant throughout the period. Average annual total return does not reflect the deduction of taxes that a shareholder would pay on Fund distributions or redemptions of Fund shares.
Cumulative total returns are quoted for a Fund with less than one year of performance history. Cumulative total return is the growth or decline in value of an investment over time, independent of the period of time involved. Cumulative total return does not reflect the deduction of taxes that a shareholder would pay on Fund distributions or redemptions of Fund shares.
Pursuant to federal securities rules, expense ratios shown in the performance chart reflect subsidized (if applicable) and unsubsidized ratios. The total annual fund operating expenses ratio is gross of any fee waivers, reflecting the Fund’s unsubsidized expense ratio. The net annual fund operating expenses ratio (if applicable) includes contractual waivers of Janus Capital and reflects the Fund’s subsidized expense ratio. Ratios may be higher or lower than those shown in the “Financial Highlights” in this report.
| |
| 3. | Schedule of Investments |
Following the performance overview section is the Fund’s Schedule of Investments. This schedule reports the types of securities held in the Fund on the last day of the reporting period. Securities are usually listed by type (common stock, corporate bonds, U.S. Government obligations, etc.) and by industry classification (banking, communications, insurance, etc.). Holdings are subject to change without notice.
The value of each security is quoted as of the last day of the reporting period. The value of securities denominated in foreign currencies is converted into U.S. dollars.
If the Fund invests in foreign securities, it will also provide a summary of investments by country. This summary reports the Fund’s exposure to different countries by providing the percentage of securities invested in each country. The country of each security represents the country of risk. The Fund’s Schedule of Investments relies upon the industry group and country classifications published by Bloomberg L.P. and/or MSCI Inc.
Tables listing details of individual forward currency contracts, futures, written options and swaps follow the Fund’s Schedule of Investments (if applicable).
| |
| 4. | Statement of Assets and Liabilities |
This statement is often referred to as the “balance sheet.” It lists the assets and liabilities of the Fund on the last day of the reporting period.
The Fund’s assets are calculated by adding the value of the securities owned, the receivable for securities sold but not yet settled, the receivable for dividends declared but not yet received on securities owned and the receivable for Fund shares sold to investors but not yet settled. The Fund’s liabilities include payables for securities purchased
Janus Value Funds | 125
Useful Information About Your Fund Report (unaudited) (continued)
but not yet settled, Fund shares redeemed but not yet paid and expenses owed but not yet paid. Additionally, there may be other assets and liabilities such as unrealized gain or loss on forward currency contracts.
The section entitled “Net Assets Consist of” breaks down the components of the Fund’s net assets. Because the Fund must distribute substantially all earnings, you will notice that a significant portion of net assets is shareholder capital.
The last section of this statement reports the net asset value (“NAV”) per share on the last day of the reporting period. The NAV is calculated by dividing the Fund’s net assets for each share class (assets minus liabilities) by the number of shares outstanding.
| |
| 5. | Statement of Operations |
This statement details the Fund’s income, expenses, realized gains and losses on securities and currency transactions, and changes in unrealized appreciation or depreciation of Fund holdings.
The first section in this statement, entitled “Investment Income,” reports the dividends earned from securities and interest earned from interest-bearing securities in the Fund.
The next section reports the expenses incurred by the Fund, including the advisory fee paid to the investment adviser, transfer agent fees and expenses, and printing and postage for mailing statements, financial reports and prospectuses. Expense offsets and expense reimbursements, if any, are also shown.
The last section lists the amounts of realized gains or losses from investment and foreign currency transactions, and changes in unrealized appreciation or depreciation of investments and foreign currency-denominated assets and liabilities. The Fund will realize a gain (or loss) when it sells its position in a particular security. A change in unrealized gain (or loss) refers to the change in net appreciation or depreciation of the Fund during the reporting period. “Net Realized and Unrealized Gain/(Loss) on Investments” is affected both by changes in the market value of Fund holdings and by gains (or losses) realized during the reporting period.
| |
| 6. | Statements of Changes in Net Assets |
These statements report the increase or decrease in the Fund’s net assets during the reporting period. Changes in the Fund’s net assets are attributable to investment operations, dividends and distributions to investors and capital share transactions. This is important to investors because it shows exactly what caused the Fund’s net asset size to change during the period.
The first section summarizes the information from the Statement of Operations regarding changes in net assets due to the Fund’s investment operations. The Fund’s net assets may also change as a result of dividend and capital gains distributions to investors. If investors receive their dividends and/or distributions in cash, money is taken out of the Fund to pay the dividend and/or distribution. If investors reinvest their dividends and/or distributions, the Fund’s net assets will not be affected. If you compare the Fund’s “Net Decrease from Dividends and Distributions” to “Reinvested Dividends and Distributions,” you will notice that dividends and distributions have little effect on the Fund’s net assets. This is because the majority of the Fund’s investors reinvest their dividends and/or distributions.
The reinvestment of dividends and distributions is included under “Capital Share Transactions.” “Capital Shares” refers to the money investors contribute to the Fund through purchases or withdrawals via redemptions. The Fund’s net assets will increase and decrease in value as investors purchase and redeem shares from the Fund.
This schedule provides a per-share breakdown of the components that affect the Fund’s NAV for current and past reporting periods as well as total return, asset size, ratios and portfolio turnover rate.
The first line in the table reflects the NAV per share at the beginning of the reporting period. The next line reports the net investment income/(loss) per share. Following is the per share total of net gains/(losses), realized and unrealized. Per share dividends and distributions to investors are then subtracted to arrive at the NAV per share at the end of the period. The next line reflects the total return for the period. The total return may include adjustments in accordance with generally accepted accounting principles required at the period end for financial reporting purposes. As a result, the total return may differ from the total return reflected for individual shareholder transactions. Also included are ratios of expenses and net investment income to average net assets.
The Fund’s expenses may be reduced through expense offsets and expense reimbursements. The ratios shown reflect expenses before and after any such offsets and reimbursements.
The ratio of net investment income/(loss) summarizes the income earned less expenses, divided by the average net assets of the Fund during the reporting period. Don’t
126 | JUNE 30, 2013
confuse this ratio with the Fund’s yield. The net investment income ratio is not a true measure of the Fund’s yield because it doesn’t take into account the dividends distributed to the Fund’s investors.
The next figure is the portfolio turnover rate, which measures the buying and selling activity in the Fund. Portfolio turnover is affected by market conditions, changes in the asset size of the Fund, fluctuating volume of shareholder purchase and redemption orders, the nature of the Fund’s investments, and the investment style and/or outlook of the portfolio managers. A 100% rate implies that an amount equal to the value of the entire portfolio was replaced once during the fiscal year; a 50% rate means that an amount equal to the value of half the portfolio is traded in a year; and a 200% rate means that an amount equal to the value of the entire portfolio is traded every six months.
Janus Value Funds | 127
Designation Requirements (unaudited)
For federal income tax purposes, the Funds designated the following for the year ended June 30, 2013:
Capital Gain Distributions
| | | | | | | | | | | |
| Fund | | | | | | |
| |
| |
| Perkins Large Cap Value Fund | | $ | 2,840,572 | | | | | | | |
| Perkins Mid Cap Value Fund | | | 429,296,214 | | | | | | | |
| Perkins Small Cap Value Fund | | | 107,817,090 | | | | | | | |
| Perkins Value Plus Income Fund | | | 598,590 | | | | | | | |
| |
| |
Dividends Received Deduction Percentage
| | | | | | | | | | | |
| Fund | | | | | | |
| |
| |
| Perkins Large Cap Value Fund | | | 100% | | | | | | | |
| Perkins Mid Cap Value Fund | | | 100% | | | | | | | |
| Perkins Select Value Fund | | | 100% | | | | | | | |
| Perkins Small Cap Value Fund | | | 100% | | | | | | | |
| Perkins Value Plus Income Fund | | | 52% | | | | | | | |
| |
| |
Qualified Dividend Income
| | | | | | | | | | | |
| Fund | | | | | | |
| |
| |
| Perkins Large Cap Value Fund | | | 100% | | | | | | | |
| Perkins Mid Cap Value Fund | | | 100% | | | | | | | |
| Perkins Select Value Fund | | | 100% | | | | | | | |
| Perkins Small Cap Value Fund | | | 100% | | | | | | | |
| Perkins Value Plus Income Fund | | | 58% | | | | | | | |
| |
| |
128 | JUNE 30, 2013
Trustees and Officers (unaudited)
The Funds’ Statement of Additional Information includes additional information about the Trustees and officers and is available, without charge, by calling 1-877-335-2687.
The following are the Trustees and officers of the Trust, together with a brief description of their principal occupations during the last five years (principal occupations for certain Trustees may include periods over five years).
Each Trustee has served in that capacity since he or she was originally elected or appointed. The Trustees do not serve a specified term of office. Each Trustee will hold office until the termination of the Trust or his or her earlier death, resignation, retirement, incapacity, or removal. Pursuant to the Funds’ Governance Procedures and Guidelines, Trustees are required to retire no later than the end of the calendar year in which the Trustee turns 72. The Trustees review the Funds’ Governance Procedures and Guidelines from time to time and may make changes they deem appropriate. The Trust’s Nominating and Governance Committee will consider nominees for the position of Trustee recommended by shareholders. Shareholders may submit the name of a candidate for consideration by the Committee by submitting their recommendations to the Trust’s Secretary. Each Trustee is currently a Trustee of one other registered investment company advised by Janus Capital: Janus Aspen Series. Collectively, these two registered investment companies consist of 56 series or funds.
The Trust’s officers are elected annually by the Trustees for a one-year term. Certain officers also serve as officers of Janus Aspen Series. Certain officers of the Funds may also be officers and/or directors of Janus Capital. Fund officers receive no compensation from the Funds, except for the Funds’ Chief Compliance Officer, as authorized by the Trustees.
TRUSTEES
| | | | | | | | | | | |
| | | | | | | | | Number of Portfolios/Funds
| | Other Directorships
|
| | | Positions Held
| | Length of
| | Principal Occupations
| | in Fund Complex
| | Held by Trustee
|
| Name, Address, and Age | | with the Trust | | Time Served | | During the Past Five Years | | Overseen by Trustee | | During the Past Five Years |
| |
| |
Independent Trustees | | | | | | | | | | |
| | | | | | | | | | | |
William F. McCalpin
151 Detroit Street
Denver, CO 80206
DOB: 1957 | | Chairman
Trustee | | 1/08-Present
6/02-Present | | Managing Director, Holos Consulting LLC (provides consulting services to foundations and other nonprofit organizations). Formerly, Executive Vice President and Chief Operating Officer of The Rockefeller Brothers Fund (a private family foundation) (1998-2006). | | 56 | | Chairman of the Board and Director of The Investment Fund for Foundations Investment Program (TIP) (consisting of 2 funds); and Director of the F.B. Heron Foundation (a private grantmaking foundation). |
| | | | | | | | | | | |
Alan A. Brown
151 Detroit Street
Denver, CO 80206
DOB: 1962 | | Trustee | | 1/13-Present | | Managing Director, Institutional Markets, of Dividend Capital Group (private equity real estate investment management firm) (since 2012). Formerly, Executive Vice President and Co-Head, Global Private Client Group (2007-2010), Executive Vice President, Mutual Funds (2005-2007), and Chief Marketing Officer (2001-2005) of Nuveen Investments, Inc. (asset management). | | 56 | | Director of MotiveQuest LLC (strategic social market research company) (since 2003); and Director of WTTW (PBS affiliate) (since 2003). Formerly, Director of Nuveen Global Investors LLC (2007-2011); Director of Communities in Schools (2004-2010); and Director of Mutual Fund Education Alliance (until 2010). |
Janus Value Funds | 129
Trustees and Officers (unaudited) (continued)
TRUSTEES (continued)
| | | | | | | | | | | |
| | | | | | | | | Number of Portfolios/Funds
| | Other Directorships
|
| | | Positions Held
| | Length of
| | Principal Occupations
| | in Fund Complex
| | Held by Trustee
|
| Name, Address, and Age | | with the Trust | | Time Served | | During the Past Five Years | | Overseen by Trustee | | During the Past Five Years |
| |
| |
| | | | | | | | | | | |
William D. Cvengros
151 Detroit Street
Denver, CO 80206
DOB: 1948 | | Trustee | | 1/11-Present | | Managing Member and Chief Executive Officer of SJC Capital, LLC (a personal investment company and consulting firm) (since 2002). Formerly, Venture Partner for The Edgewater Funds (a middle market private equity firm) (2002-2004); Chief Executive Officer and President of PIMCO Advisors Holdings L.P. (a publicly traded investment management firm) (1994-2000); and Chief Investment Officer of Pacific Life Insurance Company (a mutual life insurance and annuity company (1987-1994). | | 56 | | Chairman, National Retirement Partners, Inc. (formerly a network of advisors to 401(k) plans) (since 2005). Formerly, Director of Prospect Acquisition Corp. (a special purpose acquisition corporation) (2007-2009); Director of RemedyTemp, Inc. (temporary help services company) (1996-2006); and Trustee of PIMCO Funds Multi-Manager Series (1990-2000) and Pacific Life Variable Life & Annuity Trusts (1987-1994). |
| | | | | | | | | | | |
James T. Rothe
151 Detroit Street
Denver, CO 80206
DOB: 1943 | | Trustee | | 1/97-Present | | Co-founder and Managing Director of Roaring Fork Capital SBIC, L.P. (SBA SBIC fund focusing on private investment in public equity firms), and Professor Emeritus of Business of the University of Colorado, Colorado Springs, CO (since 2004). Formerly, Professor of Business of the University of Colorado (2002-2004), and Distinguished Visiting Professor of Business (2001-2002) of Thunderbird (American Graduate School of International Management), Glendale, AZ. | | 56 | | Director of Red Robin Gourmet Burgers, Inc. (RRGB) (since 2004). |
| | | | | | | | | | | |
William D. Stewart
151 Detroit Street
Denver, CO 80206
DOB: 1944 | | Trustee | | 6/84-Present | | Retired. Formerly, Corporate Vice President and General Manager of MKS Instruments - HPS Products, Boulder, CO (a manufacturer of vacuum fittings and valves) and PMFC Division, Andover, MA (manufacturing pressure measurement and flow products) (1976-2012). | | 56 | | None |
130 | JUNE 30, 2013
TRUSTEES (continued)
| | | | | | | | | | | |
| | | | | | | | | Number of Portfolios/Funds
| | Other Directorships
|
| | | Positions Held
| | Length of
| | Principal Occupations
| | in Fund Complex
| | Held by Trustee
|
| Name, Address, and Age | | with the Trust | | Time Served | | During the Past Five Years | | Overseen by Trustee | | During the Past Five Years |
| |
| |
| | | | | | | | | | | |
Linda S. Wolf
151 Detroit Street
Denver, CO 80206
DOB: 1947 | | Trustee | | 11/05-Present | | Retired. Formerly, Chairman and Chief Executive Officer of Leo Burnett (Worldwide) (advertising agency) (2001-2005). | | 56 | | Director of Chicago Convention & Tourism Bureau, Chicago Council on Global Affairs, The Field Museum of Natural History (Chicago, IL), InnerWorkings (U.S. provider of print procurement solutions to corporate clients), Lurie Children’s Hospital
(Chicago, IL), Rehabilitation Institute of Chicago, Wal-Mart, and Wrapports, LLC (digital communications company). |
| |
| |
Janus Value Funds | 131
Trustees and Officers (unaudited) (continued)
OFFICERS
| | | | | | | |
| | | Positions Held
| | Term of Office* and
| | Principal Occupations
|
| Name, Address, and Age | | with the Trust | | Length of Time Served | | During the Past Five Years |
| |
| |
| | | | | | | |
Gibson Smith
151 Detroit Street
Denver, CO 80206
DOB: 1968 | | Executive Vice President and
Co-Portfolio Manager
Perkins Value Plus Income Fund | | 7/10-Present
| | Co-Chief Investment Officer and Executive Vice President of Janus Capital; Executive Vice President of Janus Distributors LLC and Janus Services LLC; Director of Perkins Investment Management LLC; and Portfolio Manager for other Janus accounts. |
| | | | | | | |
Darrell Watters
151 Detroit Street
Denver, CO 80206
DOB: 1963 | | Executive Vice President and
Co-Portfolio Manager
Perkins Value Plus Income Fund | | 7/10-Present | | Vice President of Janus Capital and Portfolio Manager for other Janus accounts. |
| | | | | | | |
Robin C. Beery
151 Detroit Street
Denver, CO 80206
DOB: 1967 | | President and Chief Executive Officer | | 4/08-Present | | Executive Vice President and Head of U.S. Distribution of Janus Capital Group Inc., Janus Capital, Janus Distributors LLC, and Janus Services LLC; Director of The Janus Foundation; Director of Perkins Investment Management LLC; and Working Director of INTECH Investment Management LLC. Formerly, Head of Intermediary Distribution, Global Marketing and Product of Janus Capital Group Inc., Janus Capital, Janus Distributors LLC, and Janus Services LLC (2009-2010); and Chief Marketing Officer of Janus Capital Group Inc. and Janus Capital (2002-2009). |
| | | | | | | |
Stephanie Grauerholz-Lofton
151 Detroit Street
Denver, CO 80206
DOB: 1970 | | Chief Legal Counsel and Secretary
Vice President | | 1/06-Present
3/06-Present | | Vice President and Assistant General Counsel of Janus Capital, and Vice President and Assistant Secretary of Janus Distributors LLC. |
| | | | | | | |
David R. Kowalski
151 Detroit Street
Denver, CO 80206
DOB: 1957 | | Vice President, Chief Compliance Officer, and Anti-Money Laundering Officer | | 6/02-Present | | Senior Vice President and Chief Compliance Officer of Janus Capital, Janus Distributors LLC, and Janus Services LLC; and Vice President of INTECH Investment Management LLC and Perkins Investment Management LLC. Formerly, Chief Compliance Officer of Bay Isle Financial LLC (2003-2008). |
| | | | | | | |
Jesper Nergaard
151 Detroit Street
Denver, CO 80206
DOB: 1962 | | Chief Financial Officer
Vice President, Treasurer, and Principal Accounting Officer | | 3/05-Present
2/05-Present | | Vice President of Janus Capital and Janus Services LLC. |
| |
| |
* Officers are elected at least annually by the Trustees for a one-year term and may also be elected from time to time by the Trustees for an interim period.
132 | JUNE 30, 2013
Notes
Janus Value Funds | 133
Janus provides access to a wide range of investment disciplines.
Alternative
Janus alternative funds seek to deliver strong risk-adjusted returns over a full market cycle with lower correlation to equity markets than traditional investments.
Asset Allocation
Janus’ asset allocation funds utilize our fundamental, bottom-up research to balance risk over the long term. From fund options that meet investors’ risk tolerance and objectives to a method that incorporates non-traditional investment choices to seek non-correlated sources of risk and return, Janus’ asset allocation funds aim to allocate risk more effectively.
Fixed Income
Janus fixed income funds attempt to provide less risk relative to equities while seeking to deliver a competitive total return through high current income and appreciation. Janus money market funds seek capital preservation and liquidity with current income as a secondary objective.
Global & International
Janus global and international funds seek to leverage Janus’ research capabilities by taking advantage of inefficiencies in foreign markets, where accurate information and analytical insight are often at a premium.
Growth & Core
Janus growth funds focus on companies believed to be the leaders in their respective industries, with solid management teams, expanding market share, margins and efficiencies. Janus core funds seek investments in more stable and predictable companies. Our core funds look for a strategic combination of steady growth and, for certain funds, some degree of income.
Mathematical
Our mathematical funds seek to outperform their respective indices while maintaining a risk profile equal to or lower than the index itself. Managed by INTECH (a Janus subsidiary), these funds use a mathematical process in an attempt to build a more “efficient” portfolio than the index.
Value
Our value funds, managed by Perkins (a Janus subsidiary), seek to identify companies with favorable reward to risk characteristics by conducting rigorous downside analysis before determining upside potential.
For more information about our funds, contact your investment professional or go to janus.com/advisor/mutual-funds (or janus.com/allfunds if you hold Shares directly with Janus).
Please consider the charges, risks, expenses and investment objectives carefully before investing. For a prospectus or, if available, a summary prospectus containing this and other information, please call Janus at 877.33JANUS (52687) (or 800.525.3713 if you hold Shares directly with Janus); or download the file from janus.com/info (or janus.com/reports if you hold Shares directly with Janus). Read it carefully before you invest or send money.
Funds distributed by Janus Distributors LLC (08/13)
| | | | | | | | | | |
| Investment products offered are: | | | NOT FDIC-INSURED | | | MAY LOSE VALUE | | | NO BANK GUARANTEE |
| | | | | | | | | | |
| |
| C-0813-42688 | 125-02-93007 08-13 |
Item 2 - Code of Ethics
As of the end of the period covered by this Form N-CSR, the Registrant has adopted a Code of Ethics (as defined in Item 2(b) of Form N-CSR), which is posted on the Registrant’s website: janus.com. Registrant intends to post any amendments to, or waivers from (as defined in Item 2 of Form N-CSR), such code on janus.com within five business days following the date of such amendment or waiver.
Item 3 - Audit Committee Financial Expert
Janus Investment Fund’s Board of Trustees has determined that the following members of Janus Investment Fund’s Audit Committee are “audit committee financial experts,” as defined in Item 3 to Form N-CSR: William D. Cvengros (Chairman) and William D. Stewart who are each “independent” under the standards set forth in Item 3 to Form N-CSR.
Item 4 - Principal Accountant Fees and Services
The following table shows the amount of fees that PricewaterhouseCoopers LLP (“Auditor”), Janus Investment Fund’s (the “Fund”) auditor, billed to the Fund during the Fund’s last two fiscal years. For the reporting periods, the Audit Committee approved in advance all audit services and non-audit services that Auditor provided to the Fund, except for those non-audit services that were subject to the pre-approval exception under Rule 2-01 of Regulation S-X (the “pre-approval exception”). The pre-approval exception for services provided directly to the Fund waives the pre-approval requirement for services other than audit, review or attest services if: (A) the aggregate amount of all such services provided constitutes no more than 5% of the total amount of revenues paid by the Fund to Auditor during the fiscal year in which the services are provided; (B) the Fund did not recognize the services as non-audit services at the time of the engagement; and (C) the services are promptly brought to the Audit Committee’s attention, and the Committee(or its delegate) approves the services before the audit is completed.
Services that the Fund’s Auditor Billed to the Fund
| | | | | | | | | | | | | | | | | |
| Fiscal Year Ended | | Audit Fees | | Audit-Related | | Tax Fees | | All Other Fees |
| June 30 | | Billed to Fund | | Fees Billed to Fund | | Billed to Fund | | Billed to Fund |
| 2013 | | $ | 846,931 | | | $ | 5,500 | | | $ | 218,880 | | | $ | 0 | |
| Percentage approved pursuant to pre-approval exception | | | 0 | % | | | 0 | % | | | 0 | % | | | 0 | % |
| 2012 | | $ | 878,374 | | | $ | 0 | | | $ | 235,048 | | | $ | 0 | |
| Percentage approved pursuant to pre-approval exception | | | 0 | % | | | 0 | % | | | 0 | % | | | 0 | % |
The above “Audit Fees” were billed for amounts related to the audit of the Fund’s financial statements and services normally provided by the accountant in connection with statutory and regulatory filings. The above “Audit-Related Fees” were billed for amounts related to semi-annual financial statement disclosure review. The above “Tax Fees” were billed for amounts related to tax compliance, tax planning, tax advice, and corporate actions review.
Services that the Fund’s Auditor Billed to the Adviser
and Affiliated Fund Service Providers
The following table shows the amount of fees billed by Auditor to Janus Capital Management LLC (the “Adviser”), and any entity controlling, controlled by or under common control with the Adviser (“Control Affiliate”) that provides ongoing services to the Fund (“Affiliated Fund Service Provider”), for engagements directly related to the Fund’s operations and financial reporting, during the Fund’s last two fiscal years.
The table also shows the percentage of fees, if any, subject to the pre-approval exception. The pre-approval exception for services provided to the Adviser and any Affiliated Fund Service Provider (other than audit, review or attest services) waives the pre-approval requirement if: (A) the aggregate amount of all such services provided constitutes no more than 5% of the total amount of revenues paid to Auditor by the Fund, the Adviser and Affiliated Fund Service Providers during the fiscal years in which the services are provided that would have to be pre-approved by the Audit Committee; (B) the Fund did not recognize the services as non-audit at the time of the engagement; and (C) the services are promptly brought to the Audit Committee’s attention, and the Committee (or its delegate) approves the services before the Fund’s audit is completed.
| | | | | | | | | | | | | |
| | | Audit-Related | | | | | | All Other Fees |
| | | Fees Billed to | | Tax Fees Billed to | | Billed to Adviser |
| | | Adviser and | | Adviser and | | and Affiliated |
| Fiscal Year Ended | | Affiliated Fund | | Affiliated Fund | | Fund Service |
| June 30 | | Service Providers | | Service Providers | | Providers |
| 2013 | | $ | 23,210 | | | $ | 0 | | | $ | 0 | |
| Percentage approved pursuant to pre-approval exception | | | 0 | % | | | 0 | % | | | 0 | % |
| 2012 | | $ | 75,844 | | | $ | 0 | | | $ | 0 | |
| Percentage approved pursuant to pre-approval exception | | | 0 | % | | | 0 | % | | | 0 | % |
The above “Audit-Related Fees” were billed for amounts related to semi-annual financial statement disclosure review, and internal control examination.
Non-Audit Services
The following table shows the amount of fees that Auditor billed during the Fund’s last two fiscal years for non-audit services. The Audit Committee is required to pre-approve non-audit services that Auditor provides to the Adviser and any Affiliated Fund Service Provider, if the engagement relates directly to the Fund’s operations and financial reporting (except for those subject to the pre-approval exception described above). The Audit Committee requested and received information from Auditor about any non-audit services that Auditor rendered during the Fund’s last fiscal years to the Adviser and any Affiliated Fund Service Provider. The Committee considered this information in evaluating Auditor’s independence.
| | | | | | | | | | | | | | | | | |
| | | | | | | Total Non-Audit Fees | | | | |
| | | | | | | billed to Adviser and | | | | |
| | | | | | | Affiliated Fund Service | | Total Non-Audit | | |
| | | | | | | Providers(engagements | | Fees billed to | | |
| | | | | | | related directly to the | | Adviser and | | |
| | | Total | | operations and | | Affiliated Fund | | |
| | | Non-Audit Fees | | financial reporting of | | Service Providers | | |
| Fiscal Year Ended | | Billed to the Fund | | the Fund) | | (all other engagements) | | Total of (A), (B) |
| June 30 | | (A) | | (B) | | (C) | | and (C)1 |
| 2013 | | $ | 0 | | | $ | 0 | | | $ | 0 | | | $ | 0 | |
| 2012 | | $ | 0 | | | $ | 0 | | | $ | 0 | | | $ | 0 | |
| | |
| 1. | | The Audit Committee also considered amounts billed by Auditor to all other Control Affiliates in evaluating Auditor’s independence. |
Pre-Approval Policies
The Fund’s Audit Committee Charter requires the Fund’s Audit Committee to pre-approve any engagement of Auditor (i) to provide Audit or Non-Audit Services to the Fund or (ii) to provide non-audit services to Adviser or any Affiliated Fund Service Provider, if the engagement relates directly to the operations and financial reporting of the Fund, except for those non-audit services that were subject to the pre-approval exception under Rule 2-01 of Regulation S-X. The Chairman of the Audit Committee or, if the Chairman is unavailable, another member of the Audit Committee who is an independent Trustee, may grant the pre-approval. All such delegated pre- approvals must be presented to the Audit Committee no later than the next Audit Committee meeting.
| | |
| Item 5 - | | Audit Committee of Listed Registrants
Not applicable. |
| | (a) | | Schedule of Investments is contained in the Reports to Shareholders included under Item 1 of this Form N-CSR. |
| | |
| Item 7 - | | Disclosure of Proxy Voting Policies and Procedures for Closed-End Management Investment Companies
Not applicable to this Registrant. |
| | |
| Item 8 - | | Portfolio Managers of Closed-End Management Investment Companies
Not applicable to this Registrant. |
| | |
| Item 9 - | | Purchases of Equity Securities by Closed-End Management Investment Company and Affiliated Purchasers
Not applicable to this Registrant. |
| | |
| Item 10 - | | Submission of Matters to a Vote of Security Holders
There have been no material changes to the procedures by which shareholders may recommend nominees to the Registrant’s Board of Trustees. |
| | |
| Item 11 - | | Controls and Procedures |
| | (a) | | The Registrant’s Principal Executive Officer and Principal Financial Officer have evaluated the Registrant’s disclosure controls and procedures (as defined in Rule 30a-3(c) under the Investment Company Act of 1940, as amended) within 90 days of this filing and have concluded that the Registrant’s disclosure controls and procedures were effective, as of that date. |
| | (b) | | There have been no changes in the Registrant’s internal control over financial reporting (as defined in Rule 30a-3(d) under the Investment Company Act of 1940, as amended) that occurred during the Registrant’s second fiscal quarter of the period covered by this report that have materially affected, or are reasonably likely to materially affect, the Registrant’s internal control over financial reporting. |
| | (a)(1) | | Not applicable because the Registrant has posted its Code of Ethics (as defined in Item 2(b) of Form N-CSR) on its website pursuant to paragraph (f)(2) of Item 2 of Form N-CSR. |
| |
| | (a)(2) | | Separate certifications for the Registrant’s Principal Executive Officer and Principal Financial Officer, as required under Rule 30a-2(a) under the Investment Company Act of 1940, as amended, are attached as Ex99.CERT. |
| |
| | (a)(3) | | Not applicable to this Registrant. |
| |
| | (b) | | A certification for the Registrant’s Principal Executive Officer and Principal Financial Officer, as required by Rule 30a-2(b) under the Investment Company Act of 1940, as amended, is attached as Ex99.906CERT. |
Signatures
Pursuant to the requirements of the Securities Exchange Act of 1934, as amended, and the Investment Company Act of 1940, as amended, the Registrant has duly caused this report to be signed on its behalf by the undersigned, thereunto duly authorized.
Janus Investment Fund
| | | | | |
|
| By: | | /s/ Robin C. Beery Robin C. Beery, | | |
| | | President and Chief Executive Officer of Janus Investment Fund | | |
| | | (Principal Executive Officer) | | |
Date: August 29, 2013
Pursuant to the requirements of the Securities Exchange Act of 1934, as amended, and the Investment Company Act of 1940, as amended, this report has been signed below by the following persons on behalf of the Registrant and in the capacities and on the dates indicated.
| | | | | |
|
| By: | | /s/ Robin C. Beery Robin C. Beery, | | |
| | | President and Chief Executive Officer of Janus Investment Fund | | |
| | | (Principal Executive Officer) | | |
Date: August 29, 2013
| | | | | |
|
| By: | | /s/ Jesper Nergaard Jesper Nergaard, | | |
| | | Vice President, Chief Financial Officer, Treasurer and Principal | | |
| | | Accounting Officer of Janus Investment Fund | | |
| | | (Principal Accounting Officer and Principal Financial Officer) | | |
Date: August 29, 2013