Returns quoted are past performance and do not guarantee future results; current performance may be lower or higher. Investment returns and principal value will vary; there may be a gain or loss when shares are sold. For the most recent month-end performance call 800.668.0434 (or 800.525.3713 if you hold shares directly with Janus Henderson) or visit janushenderson.com/performance (or janushenderson.com/allfunds if you hold shares directly with Janus Henderson).
Maximum Offering Price (MOP) returns include the maximum sales charge of 5.75%. Net Asset Value (NAV) returns exclude this charge, which would have reduced returns.
CDSC returns include a 1% contingent deferred sales charge (CDSC) on Shares redeemed within 12 months of purchase. Net Asset Value (NAV) returns exclude this charge, which would have reduced returns.
Net expense ratios reflect the expense waiver, if any, contractually agreed to for at least a one-year period commencing on January 28, 2020.
Performance may be affected by risks that include those associated with non-diversification, portfolio turnover, short sales, potential conflicts of interest, foreign and emerging markets, initial public offerings (IPOs), high-yield and high-risk securities, undervalued, overlooked and smaller capitalization
Janus Henderson Emerging Markets Fund (unaudited)
Performance
companies, real estate related securities including Real Estate Investment Trusts (REITs), derivatives, and commodity-linked investments. Each product has different risks. Please see the prospectus for more information about risks, holdings and other details.
The Fund will normally invest at least 80% of its net assets, measured at the time of purchase, in the type of securities described by its name.
Returns include reinvestment of all dividends and distributions and do not reflect the deduction of taxes that a shareholder would pay on Fund distributions or redemptions of Fund shares. The returns do not include adjustments in accordance with generally accepted accounting principles required at the period end for financial reporting purposes.
Returns of the Fund shown prior to June 5, 2017 are those for Henderson Emerging Markets Fund (the “Predecessor Fund”), which merged into the Fund after the close of business on June 2, 2017. The Predecessor Fund was advised by Henderson Global Investors (North America) Inc. and subadvised by Henderson Investment Management Limited. Class A Shares, Class C Shares, Class I Shares, and Class R6 Shares of the Predecessor Fund were reorganized into Class A Shares, Class C Shares, Class I Shares, and Class N Shares, respectively, of the Fund. In connection with this reorganization, certain shareholders of the Predecessor Fund who held shares directly with the Predecessor Fund and not through an intermediary had the Class A Shares, Class C Shares, Class I Shares, and Class N Shares of the Fund received in the reorganization automatically exchanged for Class D Shares of the Fund following the reorganization. Class A Shares, Class C Shares and Class I Shares of the Predecessor Fund commenced operations with the Predecessor Fund’s inception on December 31, 2010. Class R6 Shares of the Predecessor Fund commenced operations on November 30, 2015. Class D Shares, Class S Shares, and Class T Shares commenced operations on June 5, 2017.
Performance of Class A Shares shown for periods prior to June 5, 2017, reflects the performance of Class A Shares of the Predecessor Fund, calculated using the fees and expenses of Class A Shares of the Predecessor Fund, in effect during the periods shown, net of any applicable fee and expense limitations or waivers.
Performance of Class C Shares shown for periods prior to June 5, 2017, reflects the performance of Class C Shares of the Predecessor Fund, calculated using the fees and expenses of Class C Shares of the Predecessor Fund, in effect during the periods shown, net of any applicable fee and expense limitations or waivers.
Performance of Class I Shares shown for periods prior to June 5, 2017, reflects the performance of Class I Shares of the Predecessor Fund, calculated using the fees and expenses of Class I Shares of the Predecessor Fund, in effect during the periods shown, net of any applicable fee and expense limitations or waivers.
Performance of Class N Shares shown for periods prior to June 5, 2017, reflects the performance of Class R6 Shares of the Predecessor Fund, calculated using the fees and expenses of Class R6 Shares of the Predecessor Fund, in effect during the periods shown, net of any applicable fee and expense limitations or waivers, except that for periods prior to November 30, 2015, performance for Class N Shares reflects the performance of Class I Shares of the Predecessor Fund, calculated using the estimated fees and expenses of Class N Shares, net of any applicable fee and expense limitations or waivers.
Performance of Class S Shares shown for periods prior to June 5, 2017, reflects the performance of Class I Shares of the Predecessor Fund, calculated using the estimated fees and expenses of Class S Shares, net of any applicable fee and expense limitations or waivers.
Performance of Class T Shares shown for periods prior to June 5, 2017, reflects the performance of Class I Shares of the Predecessor Fund, calculated using the estimated fees and expenses of Class T Shares, net of any applicable fee and expense limitations or waivers.
Performance of Class D Shares shown for periods prior to June 5, 2017, reflects the performance of Class I Shares of the Predecessor Fund, calculated using the estimated fees and expenses of Class D Shares, net of any applicable fee and expense limitations or waivers.
If each share class of the Fund had been available during periods prior to its commencement, the performance shown may have been different. The performance shown for periods following the Fund’s commencement of each share class reflects the fees and expenses of each respective share class, net of any applicable fee and expense limitations or waivers. Please refer to the Fund’s prospectuses for further details concerning historical performance.
Ranking is for the share class shown only; other classes may have different performance characteristics. When an expense waiver is in effect, it may have a material effect on the total return, and therefore the ranking for the period.
© 2020 Morningstar, Inc. All Rights Reserved.
There is no assurance that the investment process will consistently lead to successful investing.
See Notes to Schedule of Investments and Other Information for index definitions.
Index performance does not reflect the expenses of managing a portfolio as an index is unmanaged and not available for direct investment.
See “Useful Information About Your Fund Report.”
*The Predecessor Fund’s inception date – December 31, 2010
‡ As stated in the prospectus. See Financial Highlights for actual expense ratios during the reporting period.
(1) Closed to certain new investors.
Janus Henderson Emerging Markets Fund (unaudited)
Expense Examples
As a shareholder of the Fund, you incur two types of costs: (1) transaction costs, such as sales charges (loads) on purchase payments (applicable to Class A Shares only); and (2) ongoing costs, including management fees; 12b-1 distribution and shareholder servicing fees; transfer agent fees and expenses payable pursuant to the Transfer Agency Agreement; and other Fund expenses. This example is intended to help you understand your ongoing costs (in dollars) of investing in the Fund and to compare these costs with the ongoing costs of investing in other mutual funds. To do so, compare this 5% hypothetical example with the 5% hypothetical examples that appear in the shareholder reports of the other funds. The example is based upon an investment of $1,000 invested at the beginning of the period and held for the six-months indicated, unless noted otherwise in the table and footnotes below.
Actual Expenses
The information in the table under the heading “Actual” provides information about actual account values and actual expenses. You may use the information in these columns, together with the amount you invested, to estimate the expenses that you paid over the period. Simply divide your account value by $1,000 (for example, an $8,600 account value divided by $1,000 = 8.6), then multiply the result by the number in the appropriate column for your share class under the heading entitled “Expenses Paid During Period” to estimate the expenses you paid on your account during the period.
Hypothetical Example for Comparison Purposes
The information in the table under the heading “Hypothetical (5% return before expenses)” provides information about hypothetical account values and hypothetical expenses based upon the Fund’s actual expense ratio and an assumed rate of return of 5% per year before expenses, which is not the Fund’s actual return. The hypothetical account values and expenses may not be used to estimate the actual ending account balance or expenses you paid for the period. You may use this information to compare the ongoing costs of investing in the Fund and other funds. To do so, compare this 5% hypothetical example with the 5% hypothetical examples that appear in the shareholder reports of the other funds. Additionally, for an analysis of the fees associated with an investment in any share class or other similar funds, please visit www.finra.org/fundanalyzer.
Please note that the expenses shown in the table are meant to highlight your ongoing costs only and do not reflect any transaction costs. These fees are fully described in the Fund’s prospectuses. Therefore, the hypothetical examples are useful in comparing ongoing costs only, and will not help you determine the relative total costs of owning different funds. In addition, if these transaction costs were included, your costs would have been higher.
| | | | | | | | | | | |
| | | | | | | | | |
| | | | Actual | | Hypothetical
(5% return before expenses) | |
| Beginning
Account
Value
(10/1/19) | Ending
Account
Value
(3/31/20) | Expenses
Paid During
Period
(10/1/19 - 3/31/20)† | | Beginning
Account
Value
(10/1/19) | Ending
Account
Value
(3/31/20) | Expenses
Paid During
Period
(10/1/19 - 3/31/20)† | Net Annualized
Expense Ratio
(10/1/19 - 3/31/20) |
Class A Shares | $1,000.00 | $847.40 | $6.37 | | $1,000.00 | $1,018.10 | $6.96 | 1.38% |
Class C Shares | $1,000.00 | $844.30 | $9.54 | | $1,000.00 | $1,014.65 | $10.43 | 2.07% |
Class D Shares | $1,000.00 | $848.60 | $5.50 | | $1,000.00 | $1,019.05 | $6.01 | 1.19% |
Class I Shares | $1,000.00 | $848.20 | $5.18 | | $1,000.00 | $1,019.40 | $5.65 | 1.12% |
Class N Shares | $1,000.00 | $848.10 | $4.76 | | $1,000.00 | $1,019.85 | $5.20 | 1.03% |
Class S Shares | $1,000.00 | $847.10 | $6.56 | | $1,000.00 | $1,017.90 | $7.16 | 1.42% |
Class T Shares | $1,000.00 | $847.80 | $5.91 | | $1,000.00 | $1,018.60 | $6.46 | 1.28% |
† | Expenses Paid During Period are equal to the Net Annualized Expense Ratio multiplied by the average account value over the period, multiplied by 183/366 (to reflect the one-half year period). Expenses in the examples include the effect of applicable fee waivers and/or expense reimbursements, if any. Had such waivers and/or reimbursements not been in effect, your expenses would have been higher. Please refer to the Notes to Financial Statements or the Fund’s prospectuses for more information regarding waivers and/or reimbursements. |
Janus Henderson Emerging Markets Fund
Schedule of Investments (unaudited)
March 31, 2020
| | | | | | | | |
Shares
| | | Value | |
Common Stocks – 96.9% | | | |
Banks – 5.7% | | | |
| | Banco Bradesco SA | | 295,562 | | | $1,070,106 | |
| | Commercial International Bank Egypt SAE* | | 328,462 | | | 1,190,117 | |
| | HDFC Bank Ltd | | 126,905 | | | 1,428,028 | |
| | | 3,688,251 | |
Beverages – 1.1% | | | |
| | Wuliangye Yibin Co Ltd | | 44,259 | | | 722,211 | |
Biotechnology – 1.7% | | | |
| | Beijing Tiantan Biological Products Corp Ltd | | 213,967 | | | 1,099,002 | |
Building Products – 1.4% | | | |
| | China Lesso Group Holdings Ltd | | 717,000 | | | 940,934 | |
Capital Markets – 1.9% | | | |
| | Hong Kong Exchanges & Clearing Ltd | | 42,100 | | | 1,264,355 | |
Communications Equipment – 1.6% | | | |
| | Accton Technology Corp | | 194,000 | | | 1,029,342 | |
Construction & Engineering – 0.7% | | | |
| | Wijaya Karya Persero Tbk PT | | 9,038,100 | | | 460,870 | |
Diversified Consumer Services – 3.2% | | | |
| | Afya Ltd* | | 63,883 | | | 1,217,610 | |
| | Fu Shou Yuan International Group Ltd | | 990,000 | | | 867,130 | |
| | | 2,084,740 | |
Diversified Financial Services – 1.6% | | | |
| | Chailease Holding Co Ltd | | 351,000 | | | 1,062,565 | |
Electrical Equipment – 2.2% | | | |
| | KEI Industries Ltd | | 141,739 | | | 502,752 | |
| | Voltronic Power Technology Corp | | 46,000 | | | 953,560 | |
| | | 1,456,312 | |
Energy Equipment & Services – 0.9% | | | |
| | Anton Oilfield Services Group/Hong Kong | | 8,694,000 | | | 551,284 | |
Entertainment – 1.5% | | | |
| | NetEase Inc (ADR) | | 3,010 | | | 966,090 | |
Food & Staples Retailing – 0.8% | | | |
| | X5 Retail Group NV (GDR) (REG) | | 18,569 | | | 498,718 | |
Health Care Providers & Services – 0.8% | | | |
| | Notre Dame Intermedica Participacoes SA | | 62,098 | | | 537,395 | |
Hotels, Restaurants & Leisure – 3.6% | | | |
| | Bloomberry Resorts Corp | | 7,443,000 | | | 870,337 | |
| | Leejam Sports Co JSC | | 42,592 | | | 591,746 | |
| | Sands China Ltd | | 245,600 | | | 893,857 | |
| | | 2,355,940 | |
Household Durables – 1.3% | | | |
| | Haier Smart Home Co Ltd | | 415,744 | | | 847,291 | |
Information Technology Services – 1.4% | | | |
| | Network International Holdings PLC (144A)* | | 191,802 | | | 941,079 | |
Insurance – 6.5% | | | |
| | AIA Group Ltd | | 182,400 | | | 1,640,978 | |
| | Ping An Insurance Group Co of China Ltd | | 265,500 | | | 2,597,247 | |
| | | 4,238,225 | |
Interactive Media & Services – 14.4% | | | |
| | AfreecaTV Co Ltd | | 20,517 | | | 874,572 | |
| | NAVER Corp | | 7,835 | | | 1,077,942 | |
| | Tencent Holdings Ltd | | 127,700 | | | 6,227,054 | |
| | Yandex NV* | | 34,727 | | | 1,182,454 | |
| | | 9,362,022 | |
Internet & Direct Marketing Retail – 12.6% | | | |
| | Alibaba Group Holding Ltd (ADR)* | | 28,492 | | | 5,541,124 | |
| | MercadoLibre Inc* | | 1,531 | | | 748,016 | |
| | Naspers Ltd | | 13,612 | | | 1,935,764 | |
| | | 8,224,904 | |
| | |
See Notes to Schedule of Investments and Other Information and Notes to Financial Statements. |
| |
8 | MARCH 31, 2020 |
Janus Henderson Emerging Markets Fund
Schedule of Investments (unaudited)
March 31, 2020
| | | | | | | | |
Shares
| | | Value | |
Common Stocks – (continued) | | | |
Machinery – 3.1% | | | |
| | China Conch Venture Holdings Ltd | | 212,500 | | | $944,800 | |
| | Zhengzhou Yutong Bus Co Ltd | | 553,715 | | | 1,072,359 | |
| | | 2,017,159 | |
Metals & Mining – 1.4% | | | |
| | Ivanhoe Mines Ltd* | | 530,515 | | | 882,244 | |
Oil, Gas & Consumable Fuels – 2.5% | | | |
| | Geopark Ltd | | 73,251 | | | 517,885 | |
| | LUKOIL PJSC (ADR) | | 18,294 | | | 1,090,304 | |
| | | 1,608,189 | |
Paper & Forest Products – 1.0% | | | |
| | Asia Paper Manufacturing Co Ltd | | 30,276 | | | 666,399 | |
Professional Services – 1.6% | | | |
| | NICE Information Service Co Ltd | | 94,423 | | | 1,027,708 | |
Real Estate Management & Development – 3.8% | | | |
| | China World Trade Center Co Ltd | | 418,572 | | | 781,263 | |
| | Logan Property Holdings Co Ltd | | 746,000 | | | 1,143,376 | |
| | Vinhomes JSC (144A) | | 244,260 | | | 563,222 | |
| | | 2,487,861 | |
Road & Rail – 1.0% | | | |
| | United International Transportation Co | | 88,811 | | | 648,054 | |
Semiconductor & Semiconductor Equipment – 6.9% | | | |
| | MediaTek Inc | | 70,000 | | | 745,730 | |
| | Taiwan Semiconductor Manufacturing Co Ltd | | 419,000 | | | 3,740,804 | |
| | | 4,486,534 | |
Specialty Retail – 1.0% | | | |
| | Wilcon Depot Inc | | 2,481,400 | | | 634,748 | |
Technology Hardware, Storage & Peripherals – 6.0% | | | |
| | Samsung Electronics Co Ltd | | 101,062 | | | 3,928,169 | |
Thrifts & Mortgage Finance – 2.1% | | | |
| | Housing Development Finance Corp Ltd | | 62,535 | | | 1,335,728 | |
Wireless Telecommunication Services – 1.6% | | | |
| | Safaricom PLC | | 4,130,279 | | | 1,040,272 | |
Total Common Stocks (cost $72,088,214) | | 63,094,595 | |
Preferred Stocks – 1.2% | | | |
Electric Utilities – 1.2% | | | |
| | Cia Paranaense de Energia (cost $976,731) | | 76,900 | | | 791,898 | |
Investment Companies – 1.6% | | | |
Money Markets – 1.6% | | | |
| | Fidelity Investments Money Market Treasury Portfolio, 0.2600%ºº (cost $1,020,725) | | 1,020,725 | | | 1,020,725 | |
Total Investments (total cost $74,085,670) – 99.7% | | 64,907,218 | |
Cash, Receivables and Other Assets, net of Liabilities – 0.3% | | 167,829 | |
Net Assets – 100% | | $65,075,047 | |
| | |
See Notes to Schedule of Investments and Other Information and Notes to Financial Statements. |
| |
Janus Investment Fund | 9 |
Janus Henderson Emerging Markets Fund
Schedule of Investments (unaudited)
March 31, 2020
| | | | | | |
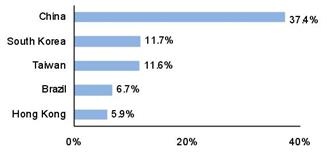
Summary of Investments by Country - (Long Positions) (unaudited) |
| |
| | | | | % of | |
| | | | | Investment | |
Country | | Value | | Securities | |
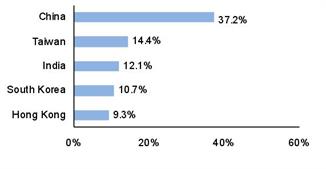
China | | $24,301,165 | | 37.4 | % |
South Korea | | 7,574,790 | | 11.7 | |
Taiwan | | 7,532,001 | | 11.6 | |
Brazil | | 4,365,025 | | 6.7 | |
Hong Kong | | 3,799,190 | | 5.9 | |
India | | 3,266,508 | | 5.0 | |
Russia | | 2,771,476 | | 4.3 | |
South Africa | | 1,935,764 | | 3.0 | |
Philippines | | 1,505,085 | | 2.3 | |
Saudi Arabia | | 1,239,800 | | 1.9 | |
Egypt | | 1,190,117 | | 1.8 | |
Kenya | | 1,040,272 | | 1.6 | |
United States | | 1,020,725 | | 1.6 | |
United Kingdom | | 941,079 | | 1.4 | |
Canada | | 882,244 | | 1.4 | |
Vietnam | | 563,222 | | 0.9 | |
Chile | | 517,885 | | 0.8 | |
Indonesia | | 460,870 | | 0.7 | |
| | |
See Notes to Schedule of Investments and Other Information and Notes to Financial Statements. |
| |
10 | MARCH 31, 2020 |
Janus Henderson Emerging Markets Fund
Notes to Schedule of Investments and Other Information (unaudited)
| | |
MSCI Emerging Markets IndexSM | MSCI Emerging Markets IndexSM reflects the equity market performance of emerging markets. |
| | |
ADR | American Depositary Receipt |
GDR | Global Depositary Receipt |
PJSC | Private Joint Stock Company |
PLC | Public Limited Company |
REG | Registered |
| | |
144A | Securities sold under Rule 144A of the Securities Act of 1933, as amended, are subject to legal and/or contractual restrictions on resale and may not be publicly sold without registration under the 1933 Act. Unless otherwise noted, these securities have been determined to be liquid under guidelines established by the Board of Trustees. The total value of 144A securities as of the period ended March 31, 2020 is $1,504,301, which represents 2.3% of net assets. |
| | |
* | Non-income producing security. |
| | |
ºº | Rate shown is the 7-day yield as of March 31, 2020. |
| | | | | | | | | | | | | |
The following is a summary of the inputs that were used to value the Fund’s investments in securities and other financial instruments as of March 31, 2020. See Notes to Financial Statements for more information. |
| |
Valuation Inputs Summary |
| | | | | | | |
| | | | | Level 2 - | | Level 3 - |
| | | Level 1 - | | Other Significant | | Significant |
| | | Quoted Prices | | Observable Inputs | | Unobservable Inputs |
| | | | | | | |
Assets | | | | | | |
Investments In Securities: | | | | | | |
Common Stocks | | | | | | |
Banks | $ | 1,070,106 | $ | 2,618,145 | $ | - |
Diversified Consumer Services | | 1,217,610 | | 867,130 | | - |
Entertainment | | 966,090 | | - | | - |
Health Care Providers & Services | | 537,395 | | - | | - |
Interactive Media & Services | | 1,182,454 | | 8,179,568 | | - |
Internet & Direct Marketing Retail | | 6,289,140 | | 1,935,764 | | - |
Metals & Mining | | 882,244 | | - | | - |
Oil, Gas & Consumable Fuels | | 517,885 | | 1,090,304 | | - |
All Other | | - | | 35,740,760 | | - |
Preferred Stocks | | - | | 791,898 | | - |
Investment Companies | | 1,020,725 | | - | | - |
Total Assets | $ | 13,683,649 | $ | 51,223,569 | $ | - |
| | | | | | | |
Janus Henderson Emerging Markets Fund
Statement of Assets and Liabilities (unaudited)
March 31, 2020
| |
See footnotes at the end of the Statement. |
| | | | | | | |
| | | | | | |
Assets: | | | | |
| | Investments, at value(1) | | $ | 64,907,218 | |
| | Cash denominated in foreign currency(2) | | | 26,719 | |
| | Non-interested Trustees' deferred compensation | | | 1,284 | |
| | Receivables: | | | | |
| | | Foreign tax reclaims | | | 177,440 | |
| | | Fund shares sold | | | 152,954 | |
| | | Dividends | | | 133,648 | |
| | Other assets | | | 6,471 | |
Total Assets | | | 65,405,734 | |
Liabilities: | | | | |
| | Due to custodian | | | 40 | |
| | Payables: | | | — | |
| | | Fund shares repurchased | | | 195,309 | |
| | | Professional fees | | | 31,355 | |
| | | Advisory fees | | | 28,574 | |
| | | Non-affiliated fund administration fees payable | | | 17,247 | |
| | | Custodian fees | | | 13,587 | |
| | | Transfer agent fees and expenses | | | 9,779 | |
| | | Printing fees | | | 6,884 | |
| | | Registration fees | | | 6,241 | |
| | | Postage fees | | | 4,742 | |
| | | 12b-1 Distribution and shareholder servicing fees | | | 3,064 | |
| | | Non-interested Trustees' deferred compensation fees | | | 1,284 | |
| | | Compliance Office fees | | | 992 | |
| | | Non-interested Trustees' fees and expenses | | | 421 | |
| | | Affiliated fund administration fees payable | | | 151 | |
| | | Accrued expenses and other payables | | | 11,017 | |
Total Liabilities | | | 330,687 | |
Net Assets | | $ | 65,075,047 | |
| | |
See Notes to Financial Statements. |
| |
12 | MARCH 31, 2020 |
Janus Henderson Emerging Markets Fund
Statement of Assets and Liabilities (unaudited)
March 31, 2020
| | | | | | | |
| | | | | | |
| | | | | | | |
Net Assets Consist of: | | | | |
| | Capital (par value and paid-in surplus) | | $ | 87,611,347 | |
| | Total distributable earnings (loss) | | | (22,536,300) | |
Total Net Assets | | $ | 65,075,047 | |
Net Assets - Class A Shares | | $ | 3,606,551 | |
| | Shares Outstanding, $0.01 Par Value (unlimited shares authorized) | | | 494,280 | |
Net Asset Value Per Share(3) | | $ | 7.30 | |
Maximum Offering Price Per Share(4) | | $ | 7.75 | |
Net Assets - Class C Shares | | $ | 2,120,948 | |
| | Shares Outstanding, $0.01 Par Value (unlimited shares authorized) | | | 299,649 | |
Net Asset Value Per Share(3) | | $ | 7.08 | |
Net Assets - Class D Shares | | $ | 8,740,614 | |
| | Shares Outstanding, $0.01 Par Value (unlimited shares authorized) | | | 1,190,997 | |
Net Asset Value Per Share | | $ | 7.34 | |
Net Assets - Class I Shares | | $ | 18,647,079 | |
| | Shares Outstanding, $0.01 Par Value (unlimited shares authorized) | | | 2,546,453 | |
Net Asset Value Per Share | | $ | 7.32 | |
Net Assets - Class N Shares | | $ | 30,099,291 | |
| | Shares Outstanding, $0.01 Par Value (unlimited shares authorized) | | | 4,103,949 | |
Net Asset Value Per Share | | $ | 7.33 | |
Net Assets - Class S Shares | | $ | 63,595 | |
| | Shares Outstanding, $0.01 Par Value (unlimited shares authorized) | | | 8,585 | |
Net Asset Value Per Share | | $ | 7.41 | |
Net Assets - Class T Shares | | $ | 1,796,969 | |
| | Shares Outstanding, $0.01 Par Value (unlimited shares authorized) | | | 244,949 | |
Net Asset Value Per Share | | $ | 7.34 | |
| |
(1) Includes cost of $74,085,670. (2) Includes cost of $26,719. (3) Redemption price per share may be reduced for any applicable contingent deferred sales charge. (4) Maximum offering price is computed at 100/94.25 of net asset value. |
| | |
See Notes to Financial Statements. |
| |
Janus Investment Fund | 13 |
Janus Henderson Emerging Markets Fund
Statement of Operations (unaudited)
For the period ended March 31, 2020
| | | | | | |
| | | | | |
Investment Income: | | | |
| Dividends | $ | 520,423 | |
| | Other income | | 1,069 | |
| | Foreign tax withheld | | (59,791) | |
Total Investment Income | | 461,701 | |
Expenses: | | | |
| | Advisory fees | | 398,418 | |
| | 12b-1 Distribution and shareholder servicing fees: | | | |
| | | Class A Shares | | 6,214 | |
| | | Class C Shares | | 15,968 | |
| | | Class S Shares | | 99 | |
| | Transfer agent administrative fees and expenses: | | | |
| | | Class D Shares | | 6,732 | |
| | | Class S Shares | | 99 | |
| | | Class T Shares | | 3,410 | |
| | Transfer agent networking and omnibus fees: | | | |
| | | Class A Shares | | 2,175 | |
| | | Class C Shares | | 1,329 | |
| | | Class I Shares | | 10,665 | |
| | Other transfer agent fees and expenses: | | | |
| | | Class A Shares | | 224 | |
| | | Class C Shares | | 162 | |
| | | Class D Shares | | 2,378 | |
| | | Class I Shares | | 765 | |
| | | Class N Shares | | 341 | |
| | | Class S Shares | | 3 | |
| | | Class T Shares | | 37 | |
| | Professional fees | | 48,543 | |
| | Non-affiliated fund administration fees | | 35,355 | |
| | Registration fees | | 33,335 | |
| | Custodian fees | | 26,398 | |
| | Shareholder reports expense | | 7,825 | |
| | Affiliated fund administration fees | | 996 | |
| | Non-interested Trustees’ fees and expenses | | 466 | |
| | Other expenses | | 6,830 | |
Total Expenses | | 608,767 | |
Less: Excess Expense Reimbursement and Waivers | | (146,238) | |
Net Expenses | | 462,529 | |
Net Investment Income/(Loss) | | (828) | |
| | | | | | |
| | |
See Notes to Financial Statements. |
| |
14 | MARCH 31, 2020 |
Janus Henderson Emerging Markets Fund
Statement of Operations (unaudited)
For the period ended March 31, 2020
| | | | | | |
| | | | | |
Net Realized Gain/(Loss) on Investments: | | | |
| | Investments and foreign currency transactions | $ | (1,966,474) | |
Total Net Realized Gain/(Loss) on Investments | | (1,966,474) | |
Change in Unrealized Net Appreciation/Depreciation: | | | |
| | Investments, foreign currency translations and non-interested Trustees’ deferred compensation(1) | | (11,645,871) | |
Total Change in Unrealized Net Appreciation/Depreciation | | (11,645,871) | |
Net Increase/(Decrease) in Net Assets Resulting from Operations | $ | (13,613,173) | |
| | | | | | |
| |
(1) Includes change in unrealized appreciation/depreciation of $19,263 due to foreign capital gains tax on investments. |
| | |
See Notes to Financial Statements. |
| |
Janus Investment Fund | 15 |
Janus Henderson Emerging Markets Fund
Statements of Changes in Net Assets
| | | | | | | | | |
| | | | | | | | | |
| | | Period ended
March 31, 2020 (unaudited) | | Year ended
September 30, 2019 | |
| | | | | | | | | |
Operations: | | | | | | |
| | Net investment income/(loss) | $ | (828) | | $ | 1,794,410 | |
| | Net realized gain/(loss) on investments | | (1,966,474) | | | (9,889,702) | |
| | Change in unrealized net appreciation/depreciation | | (11,645,871) | | | 2,911,940 | |
Net Increase/(Decrease) in Net Assets Resulting from Operations | | (13,613,173) | | | (5,183,352) | |
Dividends and Distributions to Shareholders | | | | | | |
| | | Class A Shares | | (63,132) | | | (457,330) | |
| | | Class C Shares | | (15,232) | | | (116,611) | |
| | | Class D Shares | | (176,488) | | | (428,310) | |
| | | Class I Shares | | (542,789) | | | (2,922,779) | |
| | | Class N Shares | | (307,706) | | | (815,126) | |
| | | Class S Shares | | (597) | | | (13,840) | |
| | | Class T Shares | | (42,970) | | | (146,144) | |
Net Decrease from Dividends and Distributions to Shareholders | | (1,148,914) | | | (4,900,140) | |
Capital Share Transactions: | | | | | | |
| | | Class A Shares | | (576,490) | | | (10,008,606) | |
| | | Class C Shares | | (795,565) | | | (2,184,824) | |
| | | Class D Shares | | (452,484) | | | (1,182,282) | |
| | | Class I Shares | | (12,794,125) | | | (66,839,075) | |
| | | Class N Shares | | 22,026,754 | | | (7,083,972) | |
| | | Class S Shares | | (1,187) | | | (1,596,508) | |
| | | Class T Shares | | (931,820) | | | (1,543,913) | |
Net Increase/(Decrease) from Capital Share Transactions | | 6,475,083 | | | (90,439,180) | |
Net Increase/(Decrease) in Net Assets | | (8,287,004) | | | (100,522,672) | |
Net Assets: | | | | | | |
| | Beginning of period | | 73,362,051 | | | 173,884,723 | |
| End of period | $ | 65,075,047 | | $ | 73,362,051 | |
| | | | | | | | | |
| | |
See Notes to Financial Statements. |
| |
16 | MARCH 31, 2020 |
Janus Henderson Emerging Markets Fund
Financial Highlights
| | | | | | | | | | | | | | | | |
Class A Shares | | | | | | | | | | | | |
For a share outstanding during the period ended March 31, 2020 (unaudited) and the year or period ended September 30 | 2020 | | | 2019 | | | 2018 | | | 2017(1) | |
| | Net Asset Value, Beginning of Period | | $8.72 | | | $9.48 | | | $10.36 | | | $10.19 | |
| | Income/(Loss) from Investment Operations: | | | | | | | | | | | | |
| | | Net investment income/(loss)(2) | | (0.01) | | | 0.10 | | | 0.10 | | | 0.04 | |
| | | Net realized and unrealized gain/(loss) | | (1.29) | | | (0.55) | | | (0.67) | | | 0.13 | |
| | Total from Investment Operations | | (1.30) | | | (0.45) | | | (0.57) | | | 0.17 | |
| | Less Dividends and Distributions: | | | | | | | | | | | | |
| | | Dividends (from net investment income) | | (0.12) | | | (0.13) | | | (0.10) | | | — | |
| | | Distributions (from capital gains) | | — | | | (0.18) | | | (0.21) | | | — | |
| | Total Dividends and Distributions | | (0.12) | | | (0.31) | | | (0.31) | | | — | |
| | Net Asset Value, End of Period | | $7.30 | | | $8.72 | | | $9.48 | | | $10.36 | |
| | Total Return* | | (15.26)% | | | (4.66)%(3) | | | (5.80)% | | | 1.67% | |
| | Net Assets, End of Period (in thousands) | | $3,607 | | | $4,859 | | | $15,771 | | | $15,562 | |
| | Average Net Assets for the Period (in thousands) | | $4,906 | | | $8,932 | | | $16,103 | | | $15,471 | |
| | Ratios to Average Net Assets**: | | | | | | | | | | | | |
| | | Ratio of Gross Expenses | | 1.78% | | | 1.65% | | | 1.51% | | | 1.75% | |
| | | Ratio of Net Expenses (After Waivers and Expense Offsets) | | 1.38% | | | 1.30% | | | 1.33% | | | 1.46% | |
| | | Ratio of Net Investment Income/(Loss) | | (0.18)% | | | 1.11% | | | 0.93% | | | 2.18% | |
| | Portfolio Turnover Rate | | 65% | | | 68% | | | 26% | | | 2% | |
| | | | | | | | | | | | | | | | |
| | | | | | | | | | | | | | | | |
Class C Shares | | | | | | | | | | | | |
For a share outstanding during the period ended March 31, 2020 (unaudited) and the year or period ended September 30 | 2020 | | | 2019 | | | 2018 | | | 2017(1) | |
| | Net Asset Value, Beginning of Period | | $8.42 | | | $9.12 | | | $9.98 | | | $9.83 | |
| | Income/(Loss) from Investment Operations: | | | | | | | | | | | | |
| | | Net investment income/(loss)(2) | | (0.04) | | | 0.05 | | | 0.01 | | | 0.02 | |
| | | Net realized and unrealized gain/(loss) | | (1.26) | | | (0.55) | | | (0.65) | | | 0.13 | |
| | Total from Investment Operations | | (1.30) | | | (0.50) | | | (0.64) | | | 0.15 | |
| | Less Dividends and Distributions: | | | | | | | | | | | | |
| | | Dividends (from net investment income) | | (0.04) | | | (0.02) | | | (0.01) | | | — | |
| | | Distributions (from capital gains) | | — | | | (0.18) | | | (0.21) | | | — | |
| | Total Dividends and Distributions | | (0.04) | | | (0.20) | | | (0.22) | | | — | |
| | Net Asset Value, End of Period | | $7.08 | | | $8.42 | | | $9.12 | | | $9.98 | |
| | Total Return* | | (15.57)% | | | (5.38)%(4) | | | (6.59)% | | | 1.53% | |
| | Net Assets, End of Period (in thousands) | | $2,121 | | | $3,432 | | | $5,985 | | | $9,017 | |
| | Average Net Assets for the Period (in thousands) | | $3,365 | | | $4,604 | | | $8,442 | | | $8,877 | |
| | Ratios to Average Net Assets**: | | | | | | | | | | | | |
| | | Ratio of Gross Expenses | | 2.49% | | | 2.54% | | | 2.26% | | | 2.65% | |
| | | Ratio of Net Expenses (After Waivers and Expense Offsets) | | 2.07% | | | 2.11% | | | 2.07% | | | 2.35% | |
| | | Ratio of Net Investment Income/(Loss) | | (0.85)% | | | 0.56% | | | 0.11% | | | 1.29% | |
| | Portfolio Turnover Rate | | 65% | | | 68% | | | 26% | | | 2% | |
| | | | | | | | | | | | | | | | |
| |
* Total return includes adjustments in accordance with generally accepted accounting principles required at the year or period end and are not annualized for periods of less than one full year. ** Annualized for periods of less than one full year. (1) Period from August 1, 2017 through September 30, 2017. The Fund changed its fiscal year end from July 31 to September 30. (2) Per share amounts are calculated based on average shares outstanding during the year or period. (3) Total return without the effect of affiliated payments would have been (4.89)%. Please see Note 3 in the Notes to the Financial Statements. (4) Total return without the effect of affiliated payments would have been (5.61)%. Please see Note 3 in the Notes to the Financial Statements. |
| | |
See Notes to Financial Statements. |
| |
Janus Investment Fund | 17 |
Janus Henderson Emerging Markets Fund
Financial Highlights
| | | | | | | | | | | | | |
Class A Shares | | | | | | | | | |
For a share outstanding during the year ended July 31 | | 2017 | | | 2016 | | | 2015 | |
| | Net Asset Value, Beginning of Period | | $9.10 | | | $8.60 | | | $9.82 | |
| | Income/(Loss) from Investment Operations: | | | | | | | | | |
| | | Net investment income/(loss)(1) | | 0.10 | | | 0.13 | | | 0.02 | |
| | | Net realized and unrealized gain/(loss) | | 1.05 | | | 0.39 | | | (1.24) | |
| | Total from Investment Operations | | 1.15 | | | 0.52 | | | (1.22) | |
| | Less Dividends and Distributions: | | | | | | | | | |
| | | Dividends (from net investment income) | | (0.06) | | | (0.02) | | | — | |
| | Total Dividends and Distributions | | (0.06) | | | (0.02) | | | — | |
| | Net Asset Value, End of Period | | $10.19 | | | $9.10 | | | $8.60 | |
| | Total Return* | | 12.80% | | | 6.07% | | | (12.42)% | |
| | Net Assets, End of Period (in thousands) | | $15,124 | | | $6,510 | | | $8,272 | |
| | Average Net Assets for the Period (in thousands) | | $12,523 | | | $5,958 | | | $8,108 | |
| | Ratios to Average Net Assets**: | | | | | | | | | |
| | | Ratio of Gross Expenses | | 1.76% | | | 2.36%(2) | | | 2.13% | |
| | | Ratio of Net Expenses (After Waivers and Expense Offsets) | | 1.54% | | | 1.79% | | | 1.79% | |
| | | Ratio of Net Investment Income/(Loss) | | 1.05% | | | 1.64% | | | 0.21% | |
| | Portfolio Turnover Rate | | 32% | | | 86% | | | 148% | |
| | | | | | | | | | | | | |
| | | | | | | | | | | | | |
Class C Shares | | | | | | | | | |
For a share outstanding during the year ended July 31 | | 2017 | | | 2016 | | | 2015 | |
| | Net Asset Value, Beginning of Period | | $8.79 | | | $8.35 | | | $9.61 | |
| | Income/(Loss) from Investment Operations: | | | | | | | | | |
| | | Net investment income/(loss)(1) | | 0.03 | | | 0.06 | | | (0.06) | |
| | | Net realized and unrealized gain/(loss) | | 1.02 | | | 0.38 | | | (1.20) | |
| | Total from Investment Operations | | 1.05 | | | 0.44 | | | (1.26) | |
| | Less Dividends and Distributions: | | | | | | | | | |
| | | Dividends (from net investment income) | | (0.01) | | | — | | | — | |
| | Total Dividends and Distributions | | (0.01) | | | — | | | — | |
| | Net Asset Value, End of Period | | $9.83 | | | $8.79 | | | $8.35 | |
| | Total Return* | | 12.03% | | | 5.27% | | | (13.11)% | |
| | Net Assets, End of Period (in thousands) | | $8,530 | | | $3,553 | | | $3,049 | |
| | Average Net Assets for the Period (in thousands) | | $6,219 | | | $3,028 | | | $3,471 | |
| | Ratios to Average Net Assets**: | | | | | | | | | |
| | | Ratio of Gross Expenses | | 2.53% | | | 3.16%(2) | | | 2.90% | |
| | | Ratio of Net Expenses (After Waivers and Expense Offsets) | | 2.29% | | | 2.54% | | | 2.54% | |
| | | Ratio of Net Investment Income/(Loss) | | 0.37% | | | 0.70% | | | (0.62)% | |
| | Portfolio Turnover Rate | | 32% | | | 86% | | | 148% | |
| | | | | | | | | | | | | |
| |
* Total return not annualized for periods of less than one full year. ** Annualized for periods of less than one full year. (1) Per share amounts are calculated based on average shares outstanding during the year or period. (2) The Ratio of Gross Expenses include a reimbursement of prior period custodian out-of-pocket expenses. The Ratio of Gross Expenses would have been 0.07% higher had the custodian not reimbursed the Fund. |
| | |
See Notes to Financial Statements. |
| |
18 | MARCH 31, 2020 |
Janus Henderson Emerging Markets Fund
Financial Highlights
| | | | | | | | | | | | | | | | |
Class D Shares | | | | | | | | | | | | |
For a share outstanding during the period ended March 31, 2020 (unaudited) and the year or period ended September 30 | 2020 | | | 2019 | | | 2018 | | | 2017(1) | |
| | Net Asset Value, Beginning of Period | | $8.78 | | | $9.53 | | | $10.41 | | | $10.24 | |
| | Income/(Loss) from Investment Operations: | | | | | | | | | | | | |
| | | Net investment income/(loss)(2) | | —(3) | | | 0.14 | | | 0.11 | | | 0.04 | |
| | | Net realized and unrealized gain/(loss) | | (1.29) | | | (0.59) | | | (0.67) | | | 0.13 | |
| | Total from Investment Operations | | (1.29) | | | (0.45) | | | (0.56) | | | 0.17 | |
| | Less Dividends and Distributions: | | | | | | | | | | | | |
| | | Dividends (from net investment income) | | (0.15) | | | (0.12) | | | (0.11) | | | — | |
| | | Distributions (from capital gains) | | — | | | (0.18) | | | (0.21) | | | — | |
| | Total Dividends and Distributions | | (0.15) | | | (0.30) | | | (0.32) | | | — | |
| | Net Asset Value, End of Period | | $7.34 | | | $8.78 | | | $9.53 | | | $10.41 | |
| | Total Return* | | (15.14)% | | | (4.59)%(4) | | | (5.64)% | | | 1.66% | |
| | Net Assets, End of Period (in thousands) | | $8,741 | | | $10,957 | | | $13,104 | | | $16,053 | |
| | Average Net Assets for the Period (in thousands) | | $11,365 | | | $12,337 | | | $15,607 | | | $16,501 | |
| | Ratios to Average Net Assets**: | | | | | | | | | | | | |
| | | Ratio of Gross Expenses | | 1.60% | | | 1.80% | | | 1.38% | | | 1.80% | |
| | | Ratio of Net Expenses (After Waivers and Expense Offsets) | | 1.19% | | | 1.19% | | | 1.15% | | | 1.46% | |
| | | Ratio of Net Investment Income/(Loss) | | 0.01% | | | 1.51% | | | 1.08% | | | 2.18% | |
| | Portfolio Turnover Rate | | 65% | | | 68% | | | 26% | | | 2% | |
| | | | | | | | | | | | | | | | |
| | | | | | | | | | | | | | | | |
Class I Shares | | | | | | | | | | | | |
For a share outstanding during the period ended March 31, 2020 (unaudited) and the year or period ended September 30 | 2020 | | | 2019 | | | 2018 | | | 2017(1) | |
| | Net Asset Value, Beginning of Period | | $8.78 | | | $9.52 | | | $10.42 | | | $10.24 | |
| | Income/(Loss) from Investment Operations: | | | | | | | | | | | | |
| | | Net investment income/(loss)(2) | | —(3) | | | 0.14 | | | 0.12 | | | 0.04 | |
| | | Net realized and unrealized gain/(loss) | | (1.29) | | | (0.57) | | | (0.69) | | | 0.14 | |
| | Total from Investment Operations | | (1.29) | | | (0.43) | | | (0.57) | | | 0.18 | |
| | Less Dividends and Distributions: | | | | | | | | | | | | |
| | | Dividends (from net investment income) | | (0.17) | | | (0.13) | | | (0.12) | | | — | |
| | | Distributions (from capital gains) | | — | | | (0.18) | | | (0.21) | | | — | |
| | Total Dividends and Distributions | | (0.17) | | | (0.31) | | | (0.33) | | | — | |
| | Net Asset Value, End of Period | | $7.32 | | | $8.78 | | | $9.52 | | | $10.42 | |
| | Total Return* | | (15.18)% | | | (4.38)%(5) | | | (5.72)% | | | 1.76% | |
| | Net Assets, End of Period (in thousands) | | $18,647 | | | $34,499 | | | $107,276 | | | $112,952 | |
| | Average Net Assets for the Period (in thousands) | | $30,425 | | | $71,330 | | | $119,036 | | | $110,859 | |
| | Ratios to Average Net Assets**: | | | | | | | | | | | | |
| | | Ratio of Gross Expenses | | 1.46% | | | 1.45% | | | 1.26% | | | 1.49% | |
| | | Ratio of Net Expenses (After Waivers and Expense Offsets) | | 1.12% | | | 1.13% | | | 1.09% | | | 1.20% | |
| | | Ratio of Net Investment Income/(Loss) | | 0.09% | | | 1.49% | | | 1.17% | | | 2.42% | |
| | Portfolio Turnover Rate | | 65% | | | 68% | | | 26% | | | 2% | |
| | | | | | | | | | | | | | | | |
| |
* Total return includes adjustments in accordance with generally accepted accounting principles required at the year or period end and are not annualized for periods of less than one full year. ** Annualized for periods of less than one full year. (1) Period from August 1, 2017 through September 30, 2017. The Fund changed its fiscal year end from July 31 to September 30. (2) Per share amounts are calculated based on average shares outstanding during the year or period. (3) Less than $0.005 on a per share basis. (4) Total return without the effect of affiliated payments would have been (4.82)%. Please see Note 3 in the Notes to the Financial Statements. (5) Total return without the effect of affiliated payments would have been (4.61)%. Please see Note 3 in the Notes to the Financial Statements. |
| | |
See Notes to Financial Statements. |
| |
Janus Investment Fund | 19 |
Janus Henderson Emerging Markets Fund
Financial Highlights
| | | | | | | |
Class D Shares | | | |
For a share outstanding during the period ended July 31 | | 2017(1) | |
| | Net Asset Value, Beginning of Period | | $10.05 | |
| | Income/(Loss) from Investment Operations: | | | |
| | | Net investment income/(loss)(2) | | 0.07 | |
| | | Net realized and unrealized gain/(loss) | | 0.12 | |
| | Total from Investment Operations | | 0.19 | |
| | Less Dividends and Distributions: | | | |
| | | Dividends (from net investment income) | | — | |
| | Total Dividends and Distributions | | — | |
| | Net Asset Value, End of Period | | $10.24 | |
| | Total Return* | | 1.89% | |
| | Net Assets, End of Period (in thousands) | | $16,527 | |
| | Average Net Assets for the Period (in thousands) | | $14,711 | |
| | Ratios to Average Net Assets**: | | | |
| | | Ratio of Gross Expenses | | 1.35% | |
| | | Ratio of Net Expenses (After Waivers and Expense Offsets) | | 1.32% | |
| | | Ratio of Net Investment Income/(Loss) | | 4.63% | |
| | Portfolio Turnover Rate | | 32% | |
| | | | | | | |
| | | | | | | | | | | | | |
Class I Shares | | | | | | | | | |
For a share outstanding during the year ended July 31 | | 2017 | | | 2016 | | | 2015 | |
| | Net Asset Value, Beginning of Period | | $9.13 | | | $8.63 | | | $9.86 | |
| | Income/(Loss) from Investment Operations: | | | | | | | | | |
| | | Net investment income/(loss)(2) | | 0.15 | | | 0.13 | | | 0.03 | |
| | | Net realized and unrealized gain/(loss) | | 1.03 | | | 0.42 | | | (1.25) | |
| | Total from Investment Operations | | 1.18 | | | 0.55 | | | (1.22) | |
| | Less Dividends and Distributions: | | | | | | | | | |
| | | Dividends (from net investment income) | | (0.07) | | | (0.05) | | | (0.01) | |
| | Total Dividends and Distributions | | (0.07) | | | (0.05) | | | (0.01) | |
| | Net Asset Value, End of Period | | $10.24 | | | $9.13 | | | $8.63 | |
| | Total Return* | | 13.15% | | | 6.41% | | | (12.34)% | |
| | Net Assets, End of Period (in thousands) | | $107,513 | | | $36,815 | | | $12,652 | |
| | Average Net Assets for the Period (in thousands) | | $62,396 | | | $21,242 | | | $15,071 | |
| | Ratios to Average Net Assets**: | | | | | | | | | |
| | | Ratio of Gross Expenses | | 1.46% | | | 2.09%(3) | | | 1.85% | |
| | | Ratio of Net Expenses (After Waivers and Expense Offsets) | | 1.27% | | | 1.54% | | | 1.54% | |
| | | Ratio of Net Investment Income/(Loss) | | 1.63% | | | 1.52% | | | 0.37% | |
| | Portfolio Turnover Rate | | 32% | | | 86% | | | 148% | |
| | | | | | | | | | | | | |
| |
* Total return not annualized for periods of less than one full year. ** Annualized for periods of less than one full year. (1) Period from June 5, 2017 (inception date) through July 31, 2017. (2) Per share amounts are calculated based on average shares outstanding during the year or period. (3) The Ratio of Gross Expenses include a reimbursement of prior period custodian out-of-pocket expenses. The Ratio of Gross Expenses would have been 0.07% higher had the custodian not reimbursed the Fund. |
| | |
See Notes to Financial Statements. |
| |
20 | MARCH 31, 2020 |
Janus Henderson Emerging Markets Fund
Financial Highlights
| | | | | | | | | | | | | | | | |
Class N Shares | | | | | | | | | | | | |
For a share outstanding during the period ended March 31, 2020 (unaudited) and the year or period ended September 30 | 2020 | | | 2019 | | | 2018 | | | 2017(1) | |
| | Net Asset Value, Beginning of Period | | $8.79 | | | $9.53 | | | $10.42 | | | $10.24 | |
| | Income/(Loss) from Investment Operations: | | | | | | | | | | | | |
| | | Net investment income/(loss)(2) | | —(3) | | | 0.15 | | | 0.12 | | | 0.05 | |
| | | Net realized and unrealized gain/(loss) | | (1.30) | | | (0.57) | | | (0.68) | | | 0.13 | |
| | Total from Investment Operations | | (1.30) | | | (0.42) | | | (0.56) | | | 0.18 | |
| | Less Dividends and Distributions: | | | | | | | | | | | | |
| | | Dividends (from net investment income) | | (0.16) | | | (0.14) | | | (0.12) | | | — | |
| | | Distributions (from capital gains) | | — | | | (0.18) | | | (0.21) | | | — | |
| | Total Dividends and Distributions | | (0.16) | | | (0.32) | | | (0.33) | | | — | |
| | Net Asset Value, End of Period | | $7.33 | | | $8.79 | | | $9.53 | | | $10.42 | |
| | Total Return* | | (15.19)% | | | (4.33)%(4) | | | (5.63)% | | | 1.76% | |
| | Net Assets, End of Period (in thousands) | | $30,099 | | | $16,531 | | | $25,134 | | | $41,206 | |
| | Average Net Assets for the Period (in thousands) | | $26,815 | | | $21,520 | | | $29,832 | | | $41,394 | |
| | Ratios to Average Net Assets**: | | | | | | | | | | | | |
| | | Ratio of Gross Expenses | | 1.37% | | | 1.41% | | | 1.20% | | | 1.35% | |
| | | Ratio of Net Expenses (After Waivers and Expense Offsets) | | 1.03% | | | 1.03% | | | 1.03% | | | 1.05% | |
| | | Ratio of Net Investment Income/(Loss) | | 0.04% | | | 1.65% | | | 1.15% | | | 2.59% | |
| | Portfolio Turnover Rate | | 65% | | | 68% | | | 26% | | | 2% | |
| | | | | | | | | | | | | | | | |
| | | | | | | | | | | | | | | | |
Class S Shares | | | | | | | | | | | | |
For a share outstanding during the period ended March 31, 2020 (unaudited) and the year or period ended September 30 | 2020 | | | 2019 | | | 2018 | | | 2017(1) | |
| | Net Asset Value, Beginning of Period | | $8.81 | | | $9.51 | | | $10.41 | | | $10.23 | |
| | Income/(Loss) from Investment Operations: | | | | | | | | | | | | |
| | | Net investment income/(loss)(2) | | (0.01) | | | 0.08 | | | 0.13 | | | 0.04 | |
| | | Net realized and unrealized gain/(loss) | | (1.32) | | | (0.52) | | | (0.73) | | | 0.14 | |
| | Total from Investment Operations | | (1.33) | | | (0.44) | | | (0.60) | | | 0.18 | |
| | Less Dividends and Distributions: | | | | | | | | | | | | |
| | | Dividends (from net investment income) | | (0.07) | | | (0.08) | | | (0.09) | | | — | |
| | | Distributions (from capital gains) | | — | | | (0.18) | | | (0.21) | | | — | |
| | Total Dividends and Distributions | | (0.07) | | | (0.26) | | | (0.30) | | | — | |
| | Net Asset Value, End of Period | | $7.41 | | | $8.81 | | | $9.51 | | | $10.41 | |
| | Total Return* | | (15.29)% | | | (4.49)%(5) | | | (5.98)% | | | 1.76% | |
| | Net Assets, End of Period (in thousands) | | $64 | | | $77 | | | $1,753 | | | $316 | |
| | Average Net Assets for the Period (in thousands) | | $80 | | | $488 | | | $1,189 | | | $311 | |
| | Ratios to Average Net Assets**: | | | | | | | | | | | | |
| | | Ratio of Gross Expenses | | 5.64% | | | 2.25% | | | 1.85% | | | 1.91% | |
| | | Ratio of Net Expenses (After Waivers and Expense Offsets) | | 1.42% | | | 1.18% | | | 1.47% | | | 1.51% | |
| | | Ratio of Net Investment Income/(Loss) | | (0.20)% | | | 0.89% | | | 1.28% | | | 2.11% | |
| | Portfolio Turnover Rate | | 65% | | | 68% | | | 26% | | | 2% | |
| | | | | | | | | | | | | | | | |
| |
* Total return includes adjustments in accordance with generally accepted accounting principles required at the year or period end and are not annualized for periods of less than one full year. ** Annualized for periods of less than one full year. (1) Period from August 1, 2017 through September 30, 2017. The Fund changed its fiscal year end from July 31 to September 30. (2) Per share amounts are calculated based on average shares outstanding during the year or period. (3) Less than $0.005 on a per share basis. (4) Total return without the effect of affiliated payments would have been (4.56)%. Please see Note 3 in the Notes to the Financial Statements. (5) Total return without the effect of affiliated payments would have been (4.72)%. Please see Note 3 in the Notes to the Financial Statements. |
| | |
See Notes to Financial Statements. |
| |
Janus Investment Fund | 21 |
Janus Henderson Emerging Markets Fund
Financial Highlights
| | | | | | | | | | |
Class N Shares | | | | | | |
For a share outstanding during the year or period ended July 31 | | 2017 | | | 2016(1) | |
| | Net Asset Value, Beginning of Period | | $9.13 | | | $8.06 | |
| | Income/(Loss) from Investment Operations: | | | | | | |
| | | Net investment income/(loss)(2) | | 0.40 | | | 0.06 | |
| | | Net realized and unrealized gain/(loss) | | 0.79 | | | 1.06 | |
| | Total from Investment Operations | | 1.19 | | | 1.12 | |
| | Less Dividends and Distributions: | | | | | | |
| | | Dividends (from net investment income) | | (0.08) | | | (0.05) | |
| | Total Dividends and Distributions | | (0.08) | | | (0.05) | |
| | Net Asset Value, End of Period | | $10.24 | | | $9.13 | |
| | Total Return* | | 13.17% | | | 13.92% | |
| | Net Assets, End of Period (in thousands) | | $40,785 | | | $318 | |
| | Average Net Assets for the Period (in thousands) | | $6,417 | | | $282 | |
| | Ratios to Average Net Assets**: | | | | | | |
| | | Ratio of Gross Expenses | | 1.32% | | | 2.17%(3) | |
| | | Ratio of Net Expenses (After Waivers and Expense Offsets) | | 1.24% | | | 1.54% | |
| | | Ratio of Net Investment Income/(Loss) | | 4.20% | | | 1.07% | |
| | Portfolio Turnover Rate | | 32% | | | 86% | |
| | | | | | | | | | |
| | | | | | | |
Class S Shares | | | |
For a share outstanding during the period ended July 31 | | 2017(4) | |
| | Net Asset Value, Beginning of Period | | $10.05 | |
| | Income/(Loss) from Investment Operations: | | | |
| | | Net investment income/(loss)(2) | | 0.07 | |
| | | Net realized and unrealized gain/(loss) | | 0.11 | |
| | Total from Investment Operations | | 0.18 | |
| | Less Dividends and Distributions: | | | |
| | | Dividends (from net investment income) | | — | |
| | Total Dividends and Distributions | | — | |
| | Net Asset Value, End of Period | | $10.23 | |
| | Total Return* | | 1.79% | |
| | Net Assets, End of Period (in thousands) | | $304 | |
| | Average Net Assets for the Period (in thousands) | | $266 | |
| | Ratios to Average Net Assets**: | | | |
| | | Ratio of Gross Expenses | | 1.69% | |
| | | Ratio of Net Expenses (After Waivers and Expense Offsets) | | 1.59% | |
| | | Ratio of Net Investment Income/(Loss) | | 4.51% | |
| | Portfolio Turnover Rate | | 32% | |
| | | | | | | |
| |
* Total return not annualized for periods of less than one full year. ** Annualized for periods of less than one full year. (1) Period from November 30, 2015 (inception date) through July 31, 2016. (2) Per share amounts are calculated based on average shares outstanding during the year or period. (3) The Ratio of Gross Expenses include a reimbursement of prior period custodian out-of-pocket expenses. The Ratio of Gross Expenses would have been 0.07% higher had the custodian not reimbursed the Fund. (4) Period from June 5, 2017 (inception date) through July 31, 2017. |
| | |
See Notes to Financial Statements. |
| |
22 | MARCH 31, 2020 |
Janus Henderson Emerging Markets Fund
Financial Highlights
| | | | | | | | | | | | | | | | |
Class T Shares | | | | | | | | | | | | |
For a share outstanding during the period ended March 31, 2020 (unaudited) and the year or period ended September 30 | 2020 | | | 2019 | | | 2018 | | | 2017(1) | |
| | Net Asset Value, Beginning of Period | | $8.78 | | | $9.52 | | | $10.42 | | | $10.24 | |
| | Income/(Loss) from Investment Operations: | | | | | | | | | | | | |
| | | Net investment income/(loss)(2) | | —(3) | | | 0.13 | | | 0.10 | | | 0.04 | |
| | | Net realized and unrealized gain/(loss) | | (1.30) | | | (0.57) | | | (0.68) | | | 0.14 | |
| | Total from Investment Operations | | (1.30) | | | (0.44) | | | (0.58) | | | 0.18 | |
| | Less Dividends and Distributions: | | | | | | | | | | | | |
| | | Dividends (from net investment income) | | (0.14) | | | (0.12) | | | (0.11) | | | — | |
| | | Distributions (from capital gains) | | — | | | (0.18) | | | (0.21) | | | — | |
| | Total Dividends and Distributions | | (0.14) | | | (0.30) | | | (0.32) | | | — | |
| | Net Asset Value, End of Period | | $7.34 | | | $8.78 | | | $9.52 | | | $10.42 | |
| | Total Return* | | (15.22)% | | | (4.56)%(4) | | | (5.86)% | | | 1.76% | |
| | Net Assets, End of Period (in thousands) | | $1,797 | | | $3,008 | | | $4,862 | | | $7,770 | |
| | Average Net Assets for the Period (in thousands) | | $2,728 | | | $4,046 | | | $7,275 | | | $7,786 | |
| | Ratios to Average Net Assets**: | | | | | | | | | | | | |
| | | Ratio of Gross Expenses | | 1.73% | | | 1.73% | | | 1.45% | | | 1.62% | |
| | | Ratio of Net Expenses (After Waivers and Expense Offsets) | | 1.28% | | | 1.27% | | | 1.26% | | | 1.30% | |
| | | Ratio of Net Investment Income/(Loss) | | (0.05)% | | | 1.41% | | | 0.93% | | | 2.34% | |
| | Portfolio Turnover Rate | | 65% | | | 68% | | | 26% | | | 2% | |
| | | | | | | | | | | | | | | | |
| |
* Total return includes adjustments in accordance with generally accepted accounting principles required at the year or period end and are not annualized for periods of less than one full year. ** Annualized for periods of less than one full year. (1) Period from August 1, 2017 through September 30, 2017. The Fund changed its fiscal year end from July 31 to September 30. (2) Per share amounts are calculated based on average shares outstanding during the year or period. (3) Less than $0.005 on a per share basis. (4) Total return without the effect of affiliated payments would have been (4.79)%. Please see Note 3 in the Notes to the Financial Statements. |
| | |
See Notes to Financial Statements. |
| |
Janus Investment Fund | 23 |
Janus Henderson Emerging Markets Fund
Financial Highlights
| | | | | | | |
Class T Shares | | | |
For a share outstanding during the period ended July 31 | | 2017(1) | |
| | Net Asset Value, Beginning of Period | | $10.05 | |
| | Income/(Loss) from Investment Operations: | | | |
| | | Net investment income/(loss)(2) | | 0.08 | |
| | | Net realized and unrealized gain/(loss) | | 0.11 | |
| | Total from Investment Operations | | 0.19 | |
| | Less Dividends and Distributions: | | | |
| | | Dividends (from net investment income) | | — | |
| | Total Dividends and Distributions | | — | |
| | Net Asset Value, End of Period | | $10.24 | |
| | Total Return* | | 1.89% | |
| | Net Assets, End of Period (in thousands) | | $7,629 | |
| | Average Net Assets for the Period (in thousands) | | $6,024 | |
| | Ratios to Average Net Assets**: | | | |
| | | Ratio of Gross Expenses | | 1.42% | |
| | | Ratio of Net Expenses (After Waivers and Expense Offsets) | | 1.38% | |
| | | Ratio of Net Investment Income/(Loss) | | 5.01% | |
| | Portfolio Turnover Rate | | 32% | |
| | | | | | | |
| |
* Total return not annualized for periods of less than one full year. ** Annualized for periods of less than one full year. (1) Period from June 5, 2017 (inception date) through July 31, 2017. (2) Per share amounts are calculated based on average shares outstanding during the year or period. |
| | |
See Notes to Financial Statements. |
| |
24 | MARCH 31, 2020 |
Janus Henderson Emerging Markets Fund
Notes to Financial Statements (unaudited)
1. Organization and Significant Accounting Policies
Janus Henderson Emerging Markets Fund (the “Fund”) is a series of Janus Investment Fund (the “Trust”), which is organized as a Massachusetts business trust and is registered under the Investment Company Act of 1940, as amended (the “1940 Act”), as an open-end management investment company, and therefore has applied the specialized accounting and reporting guidance in Financial Accounting Standards Board (“FASB”) Accounting Standards Codification (“ASC”) Topic 946. The Trust offers 46 funds, each of which offers multiple share classes, with differing investment objectives and policies. The Fund seeks long-term growth of capital. The Fund is classified as diversified, as defined in the 1940 Act.
Pursuant to the Agreement and Plan of Reorganization, the Fund acquired all the assets and liabilities of the Henderson Emerging Markets Fund (the “Predecessor Fund”), a series of Henderson Global Funds, in exchange for Class A, Class C, Class I and Class N Fund shares having an aggregate net asset value equal to the value of the aggregate net assets of the same share class of the Predecessor Fund (except that Class R6 Predecessor Fund shares were exchanged for Class N Fund shares) (the “Reorganization”). The Reorganization occurred at the close of business on June 2, 2017.
The Predecessor Fund and the Fund had identical investment objectives and substantially similar investment policies and principal risks. For financial reporting purposes, the Predecessor Fund’s financial and performance history prior to the Reorganization is carried forward and reflected in the Fund’s financial highlights.
The last fiscal year end of the Predecessor Fund was July 31, 2016. The Fund's last fiscal year end was July 31, 2017. Subsequent to July 31, 2017, the Fund changed its fiscal year end to September 30, 2017, to reflect the fiscal year end of certain funds of the Trust.
The Fund offers multiple classes of shares in order to meet the needs of various types of investors. Each class represents an interest in the same portfolio of investments. Certain financial intermediaries may not offer all classes of shares. Class D Shares are closed to certain new investors.
Class A Shares are offered through financial intermediary platforms including, but not limited to, traditional brokerage platforms, mutual fund wrap fee programs, bank trust platforms, and retirement platforms.
Class C Shares are offered through financial intermediary platforms including, but not limited to, traditional brokerage platforms, mutual fund wrap fee programs, and bank trust platforms.
Class C Shares are closed to investments by new employer-sponsored retirement plans and existing employer-sponsored retirement plans are no longer able to make additional purchases or exchanges into Class C Shares.
The Funds have adopted an auto-conversion policy pursuant to which Class C Shares that have been held for ten years will be automatically converted to Class A Shares without the imposition of any sales charge, fee or other charge. The conversion will generally occur no later than ten business days in the month following the month of the tenth anniversary of the date of purchase. Class C Shares purchased through the reinvestment of dividends and other distributions on Class C Shares will convert to Class A Shares at the same time as the Class C Shares with respect to which they were purchased. For Class C Shares held in omnibus accounts on intermediary platforms, the Fund will rely on these intermediaries to implement this conversion feature. Your financial intermediary may have separate policies and procedures as to when and how Class C Shares may be converted to Class A Shares. Please contact your financial intermediary for additional information.
Class D Shares are generally no longer being made available to new investors who do not already have a direct account with the Janus Henderson funds. Class D Shares are available only to investors who hold accounts directly with the Janus Henderson funds, to immediate family members or members of the same household of an eligible individual investor, and to existing beneficial owners of sole proprietorships or partnerships that hold accounts directly with the Janus Henderson funds.
Class I Shares are available through certain financial intermediary platforms including, but not limited to, mutual fund wrap fee programs, managed account programs, asset allocation programs, bank trust platforms, as well as certain retirement platforms. Class I Shares are also available to certain direct institutional investors including, but not limited to, corporations, certain retirement plans, public plans, and foundations/endowments, who established Class I Share accounts before August 4, 2017.
Janus Henderson Emerging Markets Fund
Notes to Financial Statements (unaudited)
Class N Shares are generally available only to financial intermediaries purchasing on behalf of: 1) certain adviser-assisted, employer-sponsored retirement plans, including 401(k) plans, 457 plans, 403(b) plans, Taft-Hartley multi-employer plans, profit-sharing and money purchase pension plans, defined benefit plans and certain welfare benefit plans, such as health savings accounts, and nonqualified deferred compensation plans; and 2) retail investors purchasing in qualified or nonqualified accounts, whose accounts are held through an omnibus account at their financial intermediary, and where the financial intermediary requires no payment or reimbursement from the Fund, Janus Capital Management LLC (“Janus Capital”), or its affiliates. Class N Shares are also available to Janus Henderson proprietary products and to certain direct institutional investors approved by Janus Distributors LLC dba Janus Henderson Distributors (“Janus Henderson Distributors”) including, but not limited to, corporations, certain retirement plans, public plans, and foundations and endowments, subject to minimum investment requirements.
Class S Shares are offered through financial intermediary platforms including, but not limited to, retirement platforms and asset allocation, mutual fund wrap, or other discretionary or nondiscretionary fee-based investment advisory programs. In addition, Class S Shares may be available through certain financial intermediaries who have an agreement with Janus Capital or its affiliates to offer Class S Shares on their supermarket platforms.
Class T Shares are available through certain financial intermediary platforms including, but not limited to, mutual fund wrap fee programs, managed account programs, asset allocation programs, bank trust platforms, as well as certain retirement platforms. In addition, Class T Shares may be available through certain financial intermediaries who have an agreement with Janus Capital or its affiliates to offer Class T Shares on their supermarket platforms.
The following accounting policies have been followed by the Fund and are in conformity with United States of America generally accepted accounting principles ("US GAAP").
Investment Valuation
Securities held by the Fund are valued in accordance with policies and procedures established by and under the supervision of the Trustees (the “Valuation Procedures”). Equity securities traded on a domestic securities exchange are generally valued at the closing prices on the primary market or exchange on which they trade. If such price is lacking for the trading period immediately preceding the time of determination, such securities are valued at their current bid price. Equity securities that are traded on a foreign exchange are generally valued at the closing prices on such markets. In the event that there is no current trading volume on a particular security in such foreign exchange, the bid price from the primary exchange is generally used to value the security. Securities that are traded on the over-the-counter (“OTC”) markets are generally valued at their closing or latest bid prices as available. Foreign securities and currencies are converted to U.S. dollars using the applicable exchange rate in effect at the close of the New York Stock Exchange (“NYSE”). The Fund will determine the market value of individual securities held by it by using prices provided by one or more approved professional pricing services or, as needed, by obtaining market quotations from independent broker-dealers. Most debt securities are valued in accordance with the evaluated bid price supplied by the pricing service that is intended to reflect market value. The evaluated bid price supplied by the pricing service is an evaluation that may consider factors such as security prices, yields, maturities and ratings. Certain short-term securities maturing within 60 days or less may be evaluated and valued on an amortized cost basis provided that the amortized cost determined approximates market value. Securities for which market quotations or evaluated prices are not readily available or deemed unreliable are valued at fair value determined in good faith under the Valuation Procedures. Circumstances in which fair value pricing may be utilized include, but are not limited to: (i) a significant event that may affect the securities of a single issuer, such as a merger, bankruptcy, or significant issuer-specific development; (ii) an event that may affect an entire market, such as a natural disaster or significant governmental action; (iii) a nonsignificant event such as a market closing early or not opening, or a security trading halt; and (iv) pricing of a nonvalued security and a restricted or nonpublic security. Special valuation considerations may apply with respect to “odd-lot” fixed-income transactions which, due to their small size, may receive evaluated prices by pricing services which reflect a large block trade and not what actually could be obtained for the odd-lot position. The Fund uses systematic fair valuation models provided by independent third parties to value international equity securities in order to adjust for stale pricing, which may occur between the close of certain foreign exchanges and the close of the NYSE.
Valuation Inputs Summary
FASB ASC 820, Fair Value Measurements and Disclosures (“ASC 820”), defines fair value, establishes a framework for measuring fair value, and expands disclosure requirements regarding fair value measurements. This standard emphasizes that fair value is a market-based measurement that should be determined based on the assumptions that
Janus Henderson Emerging Markets Fund
Notes to Financial Statements (unaudited)
market participants would use in pricing an asset or liability and establishes a hierarchy that prioritizes inputs to valuation techniques used to measure fair value. These inputs are summarized into three broad levels:
Level 1 – Unadjusted quoted prices in active markets the Fund has the ability to access for identical assets or liabilities.
Level 2 – Observable inputs other than unadjusted quoted prices included in Level 1 that are observable for the asset or liability either directly or indirectly. These inputs may include quoted prices for the identical instrument on an inactive market, prices for similar instruments, interest rates, prepayment speeds, credit risk, yield curves, default rates and similar data.
Assets or liabilities categorized as Level 2 in the hierarchy generally include: debt securities fair valued in accordance with the evaluated bid or ask prices supplied by a pricing service; securities traded on OTC markets and listed securities for which no sales are reported that are fair valued at the latest bid price (or yield equivalent thereof) obtained from one or more dealers transacting in a market for such securities or by a pricing service approved by the Fund’s Trustees; certain short-term debt securities with maturities of 60 days or less that are fair valued at amortized cost; and equity securities of foreign issuers whose fair value is determined by using systematic fair valuation models provided by independent third parties in order to adjust for stale pricing which may occur between the close of certain foreign exchanges and the close of the NYSE. Other securities that may be categorized as Level 2 in the hierarchy include, but are not limited to, preferred stocks, bank loans, swaps, investments in unregistered investment companies, options, and forward contracts.
Level 3 – Unobservable inputs for the asset or liability to the extent that relevant observable inputs are not available, representing the Fund’s own assumptions about the assumptions that a market participant would use in valuing the asset or liability, and that would be based on the best information available.
There have been no significant changes in valuation techniques used in valuing any such positions held by the Fund since the beginning of the fiscal year.
The inputs or methodology used for fair valuing securities are not necessarily an indication of the risk associated with investing in those securities. The summary of inputs used as of March 31, 2020 to fair value the Fund’s investments in securities and other financial instruments is included in the “Valuation Inputs Summary” in the Notes to Schedule of Investments and Other Information.
Investment Transactions and Investment Income
Investment transactions are accounted for as of the date purchased or sold (trade date). Dividend income is recorded on the ex-dividend date. Certain dividends from foreign securities will be recorded as soon as the Fund is informed of the dividend, if such information is obtained subsequent to the ex-dividend date. Dividends from foreign securities may be subject to withholding taxes in foreign jurisdictions. Interest income is recorded daily on an accrual basis and includes amortization of premiums and accretion of discounts. The Fund classifies gains and losses on prepayments received as an adjustment to interest income. Debt securities may be placed in non-accrual status and related interest income may be reduced by stopping current accruals and writing off interest receivables when collection of all or a portion of interest has become doubtful. Gains and losses are determined on the identified cost basis, which is the same basis used for federal income tax purposes. Income, as well as gains and losses, both realized and unrealized, are allocated daily to each class of shares based upon the ratio of net assets represented by each class as a percentage of total net assets.
Expenses
The Fund bears expenses incurred specifically on its behalf. Each class of shares bears a portion of general expenses, which are allocated daily to each class of shares based upon the ratio of net assets represented by each class as a percentage of total net assets. Expenses directly attributable to a specific class of shares are charged against the operations of such class.
Estimates
The preparation of financial statements in conformity with US GAAP requires management to make estimates and assumptions that affect the reported amount of assets and liabilities and disclosure of contingent assets and liabilities at the date of the financial statements, and the reported amounts of income and expenses during the reporting period. Actual results could differ from those estimates.
Janus Henderson Emerging Markets Fund
Notes to Financial Statements (unaudited)
Indemnifications
In the normal course of business, the Fund may enter into contracts that contain provisions for indemnification of other parties against certain potential liabilities. The Fund’s maximum exposure under these arrangements is unknown, and would involve future claims that may be made against the Fund that have not yet occurred. Currently, the risk of material loss from such claims is considered remote.
Foreign Currency Translations
The Fund does not isolate that portion of the results of operations resulting from the effect of changes in foreign exchange rates on investments from the fluctuations arising from changes in market prices of securities held at the date of the financial statements. Net unrealized appreciation or depreciation of investments and foreign currency translations arise from changes in the value of assets and liabilities, including investments in securities held at the date of the financial statements, resulting from changes in the exchange rates and changes in market prices of securities held.
Currency gains and losses are also calculated on payables and receivables that are denominated in foreign currencies. The payables and receivables are generally related to foreign security transactions and income translations.
Foreign currency-denominated assets and forward currency contracts may involve more risks than domestic transactions, including currency risk, counterparty risk, political and economic risk, regulatory risk and equity risk. Risks may arise from unanticipated movements in the value of foreign currencies relative to the U.S. dollar.
Dividends and Distributions
The Fund generally declares and distributes dividends of net investment income and realized capital gains (if any) annually. The Fund may treat a portion of the amount paid to redeem shares as a distribution of investment company taxable income and realized capital gains that are reflected in the net asset value. This practice, commonly referred to as “equalization,” has no effect on the redeeming shareholder or a Fund’s total return, but may reduce the amounts that would otherwise be required to be paid as taxable dividends to the remaining shareholders. It is possible that the Internal Revenue Service (IRS) could challenge the Funds’ equalization methodology or calculations, and any such challenge could result in additional tax, interest, or penalties to be paid by the Fund.
Federal Income Taxes
The Fund intends to continue to qualify as a regulated investment company and distribute all of its taxable income in accordance with the requirements of Subchapter M of the Internal Revenue Code. Management has analyzed the Fund’s tax positions taken for all open federal income tax years, generally a three-year period, and has concluded that no provision for federal income tax is required in the Fund’s financial statements. The Fund is not aware of any tax positions for which it is reasonably possible that the total amounts of unrecognized tax benefits will significantly change in the next twelve months.
2. Other Investments and Strategies
Additional Investment Risk
In the aftermath of the 2007-2008 financial crisis, the financial sector experienced reduced liquidity in credit and other fixed-income markets, and an unusually high degree of volatility, both domestically and internationally. In response to the crisis, the United States and certain foreign governments, along with the U.S. Federal Reserve and certain foreign central banks, took steps to support the financial markets. For example, the enactment of the Dodd-Frank Act in 2010 provided for widespread regulation of financial institutions, consumer financial products and services, broker-dealers, over-the-counter derivatives, investment advisers, credit rating agencies, and mortgage lending, which expanded federal oversight in the financial sector, including the investment management industry. More recently, the U.S. government and the Federal Reserve, as well as certain foreign governments and central banks, are taking extraordinary actions to support local and global economies and the financial markets in response to the COVID-19 pandemic, including by pushing interest rates to very low levels. The withdrawal of support, a failure of measures put in place in response to such economic downturns, or investor perception that such efforts were not sufficient could each negatively affect financial markets generally, and the value and liquidity of specific securities. In addition, policy and legislative changes in the United States and in other countries continue to impact many aspects of financial regulation.
Widespread disease, including pandemics and epidemics, and natural or environmental disasters, such as earthquakes, fires, floods, hurricanes, tsunamis and weather-related phenomena generally, have been and can be highly disruptive to economies and markets, adversely impacting individual companies, sectors, industries, markets, currencies, interest and
Janus Henderson Emerging Markets Fund
Notes to Financial Statements (unaudited)
inflation rates, credit ratings, investor sentiment, and other factors affecting the value of a Fund’s investments. Economies and financial markets throughout the world have become increasingly interconnected, which increases the likelihood that events or conditions in one region or country will adversely affect markets or issuers in other regions or countries, including the United States. These disruptions could prevent a Fund from executing advantageous investment decisions in a timely manner and negatively impact a Fund’s ability to achieve its investment objective(s). Any such event(s) could have a significant adverse impact on the value of a Fund. In addition, these disruptions could also impair the information technology and other operational systems upon which the Fund’s service providers, including Janus Capital or the subadviser (as applicable), rely, and could otherwise disrupt the ability of employees of the Fund’s service providers to perform essential tasks on behalf of the Fund.
A number of countries in the European Union (“EU”) have experienced, and may continue to experience, severe economic and financial difficulties. In particular, many EU nations are susceptible to economic risks associated with high levels of debt. Many non-governmental issuers, and even certain governments, have defaulted on, or been forced to restructure, their debts. Many other issuers have faced difficulties obtaining credit or refinancing existing obligations. Financial institutions have in many cases required government or central bank support, have needed to raise capital, and/or have been impaired in their ability to extend credit. As a result, financial markets in the EU experienced extreme volatility and declines in asset values and liquidity. Responses to these financial problems by European governments, central banks, and others, including austerity measures and reforms, may not work, may result in social unrest, and may limit future growth and economic recovery or have other unintended consequences. The risk of investing in securities in the European markets may also be heightened due to the referendum in which the United Kingdom voted to exit the EU (commonly known as “Brexit”). The United Kingdom formally left the EU on January 31, 2020 and entered into an eleven-month transition period, during which the United Kingdom will remain subject to EU laws and regulations. There is considerable uncertainty relating to the potential consequences of the United Kingdom’s exit and how negotiations for new trade agreements will be conducted or concluded.
Certain areas of the world have historically been prone to and economically sensitive to environmental events such as, but not limited to, hurricanes, earthquakes, typhoons, flooding, tidal waves, tsunamis, erupting volcanoes, wildfires or droughts, tornadoes, mudslides, or other weather-related phenomena. Such disasters, and the resulting physical or economic damage, could have a severe and negative impact on the Fund’s investment portfolio and, in the longer term, could impair the ability of issuers in which the Fund invests to conduct their businesses as they would under normal conditions. Adverse weather conditions may also have a particularly significant negative effect on issuers in the agricultural sector and on insurance and reinsurance companies that insure and reinsure against the impact of natural disasters.
Emerging Market Investing
Within the parameters of its specific investment policies, the Fund may invest in securities of issuers or companies from or with exposure to one or more “developing countries” or “emerging market countries.” To the extent that the Fund invests a significant amount of its assets in one or more of these countries, its returns and net asset value may be affected to a large degree by events and economic conditions in such countries. The risks of foreign investing are heightened when investing in emerging markets, which may result in the price of investments in emerging markets experiencing sudden and sharp price swings. In many developing markets, there is less government supervision and regulation of business and industry practices (including the potential lack of strict finance and accounting controls and standards), stock exchanges, brokers, and listed companies, making these investments potentially more volatile in price and less liquid than investments in developed securities markets, resulting in greater risk to investors. There is a risk in developing countries that a future economic or political crisis could lead to price controls, forced mergers of companies, expropriation or confiscatory taxation, imposition or enforcement of foreign ownership limits, seizure, nationalization, sanctions or imposition of restrictions by various governmental entities on investment and trading, or creation of government monopolies, any of which may have a detrimental effect on the Fund’s investments. In addition, the Fund’s investments may be denominated in foreign currencies and therefore, changes in the value of a country’s currency compared to the U.S. dollar may affect the value of the Fund’s investments. To the extent that the Fund invests a significant portion of its assets in the securities of issuers in or companies of a single country or region, it is more likely to be impacted by events or conditions affecting that country or region, which could have a negative impact on the Fund’s performance. Additionally, foreign and emerging market risks, including, but not limited to, price controls, expropriation or confiscatory taxation, imposition or enforcement of foreign ownership limits, nationalization, and restrictions on repatriation of assets may be heightened to the extent the Fund invests in Chinese local market securities.
Janus Henderson Emerging Markets Fund
Notes to Financial Statements (unaudited)
3. Investment Advisory Agreements and Other Transactions with Affiliates
The Fund pays Janus Capital an investment advisory fee which is calculated daily and paid monthly. The following table reflects the Fund’s contractual investment advisory fee rate (expressed as an annual rate).
| | |
Average Daily Net Assets of the Fund | Contractual Investment Advisory Fee (%) |
First $1 Billion | 1.00 |
Next $1 Billion | 0.90 |
Over $2 Billion | 0.85 |
The Fund’s actual investment advisory fee rate for the reporting period was 1.00% of average annual net assets before any applicable waivers.
Janus Capital has entered into a personnel-sharing arrangement with its foreign (non-U.S.) affiliates, Henderson Global Investors Limited, Henderson Global Investors (Japan) Ltd., and Henderson Global Investors (Singapore) Ltd. (collectively, “HGIL”), pursuant to which HGIL and certain employees of HGIL serve as “associated persons” of Janus Capital. In this capacity, such employees of HGIL are subject to the oversight and supervision of Janus Capital and may provide portfolio management, research, and related services to the Fund on behalf of Janus Capital.
Janus Capital has contractually agreed to waive the advisory fee payable by the Fund or reimburse expenses in an amount equal to the amount, if any, that the Fund’s total annual fund operating expenses, including the investment advisory fee, but excluding the fees payable pursuant to a Rule 12b-1 plan, shareholder servicing fees, such as transfer agency fees (including out-of-pocket costs), administrative services fees and any networking/omnibus/administrative fees payable by any share class, brokerage commissions, interest, dividends, taxes, acquired fund fees and expenses, and extraordinary expenses, exceed the annual rate of 1.03% of the Fund’s average daily net assets. Janus Capital has agreed to continue the waivers for at least a one-year period commencing January 28, 2020. If applicable, amounts waived and/or reimbursed to the Fund by Janus Capital are disclosed as “Excess Expense Reimbursement and Waivers” on the Statement of Operations.
Janus Services LLC (“Janus Services”), a wholly-owned subsidiary of Janus Capital, is the Fund’s transfer agent. In addition, Janus Services provides or arranges for the provision of certain other administrative services including, but not limited to, recordkeeping, accounting, order processing, and other shareholder services for the Fund. Janus Services is not compensated for its services related to the shares, except for out-of-pocket costs. These amounts are disclosed as “Other transfer agent fees and expenses” on the Statement of Operations.
Certain, but not all, intermediaries may charge administrative fees (such as networking and omnibus) to investors in Class A Shares, Class C Shares, and Class I Shares for administrative services provided on behalf of such investors. These administrative fees are paid by the Class A Shares, Class C Shares, and Class I Shares of the Fund to Janus Services, which uses such fees to reimburse intermediaries. Consistent with the Transfer Agency Agreement between Janus Services and the Fund, Janus Services may negotiate the level, structure, and/or terms of the administrative fees with intermediaries requiring such fees on behalf of the Fund. Janus Capital and its affiliates benefit from an increase in assets that may result from such relationships. The Funds’ Trustees have set limits on fees that the Funds may incur with respect to administrative fees paid for omnibus or networked accounts. Such limits are subject to change by the Trustees in the future. These amounts are disclosed as “Transfer agent networking and omnibus fees” on the Statement of Operations.
Effective July 1, 2019, the Board of Trustees of Janus Investment Fund approved a new administrative fee rate for Class D Shares detailed in the table below.
| | |
Average Daily Net Assets of Class D Shares of the Janus Henderson funds | Administrative Services Fee |
Under $40 billion | 0.12% |
$40 billion – $49.9 billion | 0.10% |
Over $49.9 billion | 0.08% |
The Fund’s actual Class D administrative fee rate was 0.12% for the reporting period.
Prior to July 1, 2019, the Fund’s Class D Shares paid an administrative services fee at an annual rate of 0.12% of the average daily net assets of Class D Shares for shareholder services provided by Janus Services. Janus Services
Janus Henderson Emerging Markets Fund
Notes to Financial Statements (unaudited)
provides or arranges for the provision of shareholder services including, but not limited to, recordkeeping, accounting, answering inquiries regarding accounts, transaction processing, transaction confirmations, and the mailing of prospectuses and shareholder reports. These amounts are disclosed as “Transfer agent administrative fees and expenses” on the Statement of Operations.
Janus Services receives an administrative services fee at an annual rate of up to 0.25% of the average daily net assets of the Fund’s Class S Shares and Class T Shares for providing or procuring administrative services to investors in Class S Shares and Class T Shares of the Fund. Janus Services expects to use all or a significant portion of this fee to compensate retirement plan service providers, broker-dealers, bank trust departments, financial advisors, and other financial intermediaries for providing these services. Janus Services or its affiliates may also pay fees for services provided by intermediaries to the extent the fees charged by intermediaries exceed the 0.25% of net assets charged to Class S Shares and Class T Shares of the Fund. Janus Services may keep certain amounts retained for reimbursement of out-of-pocket costs incurred for servicing clients of Class S Shares and Class T Shares. These amounts are disclosed as “Transfer agent administrative fees and expenses” on the Statement of Operations.
Services provided by these financial intermediaries may include, but are not limited to, recordkeeping, subaccounting, order processing, providing order confirmations, periodic statements, forwarding prospectuses, shareholder reports, and other materials to existing customers, answering inquiries regarding accounts, and other administrative services. Order processing includes the submission of transactions through the National Securities Clearing Corporation (“NSCC”) or similar systems, or those processed on a manual basis with Janus Capital. For all share classes, Janus Services also seeks reimbursement for costs it incurs as transfer agent and for providing servicing.
Janus Services is compensated for its services related to the Fund’s Class D Shares. These amounts are disclosed as “Other transfer agent fees and expenses” on the Statement of Operations.
Under a distribution and shareholder servicing plan (the “Plan”) adopted in accordance with Rule 12b-1 under the 1940 Act, the Fund pays the Trust’s distributor, Janus Henderson Distributors, a wholly-owned subsidiary of Janus Capital, a fee for the sale and distribution and/or shareholder servicing of the Shares at an annual rate of up to 0.25% of the Class A Shares’ average daily net assets, of up to 1.00% of the Class C Shares’ average daily net assets and of up to 0.25% of the Class S Shares’ average daily net assets. Under the terms of the Plan, the Trust is authorized to make payments to Janus Henderson Distributors for remittance to retirement plan service providers, broker-dealers, bank trust departments, financial advisors, and other financial intermediaries, as compensation for distribution and/or shareholder services performed by such entities for their customers who are investors in the Fund. These amounts are disclosed as “12b-1 Distribution and shareholder servicing fees” on the Statement of Operations. Payments under the Plan are not tied exclusively to actual 12b-1 distribution and shareholder service expenses, and the payments may exceed 12b-1 distribution and shareholder service expenses actually incurred. If any of the Fund’s actual 12b-1 distribution and shareholder service expenses incurred during a calendar year are less than the payments made during a calendar year, the Fund will be refunded the difference. Refunds, if any, are included in “12b-1 Distribution and shareholder servicing fees” in the Statement of Operations.
Janus Capital serves as administrator to the Fund pursuant to an administration agreement between Janus Capital and the Trust. Under the administration agreement, Janus Capital is obligated to provide or arrange for the provision of certain administration, compliance, and accounting services to the Fund, including providing office space for the Fund, and is reimbursed by the Fund for certain of its costs in providing these services (to the extent Janus Capital seeks reimbursement and such costs are not otherwise waived). In addition, employees of Janus Capital and/or its affiliates may serve as officers of the Trust. The Fund pays for some or all of the salaries, fees, and expenses of Janus Capital employees and Fund officers, with respect to certain specified administration functions they perform on behalf of the Fund. The Fund pays these costs based on out-of-pocket expenses incurred by Janus Capital, and these costs are separate and apart from advisory fees and other expenses paid in connection with the investment advisory services Janus Capital (or any subadvisor, as applicable) provides to the Fund. These amounts are disclosed as “Affiliated fund administration fees” on the Statement of Operations. In addition, some expenses related to compensation payable to the Fund’s Chief Compliance Officer and certain compliance staff, all of whom are employees of Janus Capital and/or its affiliates, are shared with the Fund. Total compensation of $232,673 was paid to the Chief Compliance Officer and certain compliance staff by the Trust during the period ended March 31, 2020. The Fund's portion is reported as part of “Other expenses” on the Statement of Operations.
Janus Henderson Emerging Markets Fund
Notes to Financial Statements (unaudited)
The Board of Trustees has adopted a deferred compensation plan (the “Deferred Plan”) for independent Trustees to elect to defer receipt of all or a portion of the annual compensation they are entitled to receive from the Fund. All deferred fees are credited to an account established in the name of the Trustees. The amounts credited to the account then increase or decrease, as the case may be, in accordance with the performance of one or more of the Janus Henderson funds that are selected by the Trustees. The account balance continues to fluctuate in accordance with the performance of the selected fund or funds until final payment of all amounts are credited to the account. The fluctuation of the account balance is recorded by the Fund as unrealized appreciation/(depreciation) and is included as of March 31, 2020 on the Statement of Assets and Liabilities in the asset, “Non-interested Trustees’ deferred compensation,” and liability, “Non-interested Trustees’ deferred compensation fees.” Additionally, the recorded unrealized appreciation/(depreciation) is included in “Total distributable earnings (loss)” on the Statement of Assets and Liabilities. Deferred compensation expenses for the period ended March 31, 2020 are included in “Non-interested Trustees’ fees and expenses” on the Statement of Operations. Trustees are allowed to change their designation of mutual funds from time to time. Amounts will be deferred until distributed in accordance with the Deferred Plan. Deferred fees of $225,450 were paid by the Trust to the Trustees under the Deferred Plan during the period ended March 31, 2020.
Class A Shares include a 5.75% upfront sales charge of the offering price of the Fund. The sales charge is allocated between Janus Henderson Distributors and financial intermediaries. During the period ended March 31, 2020, Janus Henderson Distributors retained upfront sales charges of $218.
A contingent deferred sales charge (“CDSC”) of 1.00% will be deducted with respect to Class A Shares purchased without a sales load and redeemed within 12 months of purchase, unless waived. Any applicable CDSC will be 1.00% of the lesser of the original purchase price or the value of the redemption of the Class A Shares redeemed. There were no CDSCs paid by redeeming shareholders of Class A Shares to Janus Henderson Distributors during the period ended March 31, 2020.
A CDSC of 1.00% will be deducted with respect to Class C Shares redeemed within 12 months of purchase, unless waived. Any applicable CDSC will be 1.00% of the lesser of the original purchase price or the value of the redemption of the Class C Shares redeemed. There were no CDSCs paid by redeeming shareholders of Class C Shares during the period ended March 31, 2020.
As of March 31, 2020, shares of the Fund were owned by affiliates of Janus Henderson Investors, and/or other funds advised by Janus Henderson, as indicated in the table below:
| | | | | | |
Class | % of Class Owned | | % of Fund Owned | | |
Class A Shares | - | % | - | % | |
Class C Shares | - | | - | | |
Class D Shares | - | | - | | |
Class I Shares | - | | - | | |
Class N Shares | 96 | | 44 | | |
Class S Shares | - | | - | | |
Class T Shares | - | | - | | |
| | | | | | |
In addition, other shareholders, including other funds, individuals, accounts, as well as the Fund’s portfolio manager(s) and/or investment personnel, may from time to time own (beneficially or of record) a significant percentage of the Fund’s Shares and can be considered to “control” the Fund when that ownership exceeds 25% of the Fund’s assets (and which may differ from control as determined in accordance with US GAAP).
During the period ended September 30, 2019, Janus Capital made a contribution to the Fund to cover broker commission fees related to registration of foreign securities. The impact of the contribution on total return was 0.23%.
Janus Henderson Emerging Markets Fund
Notes to Financial Statements (unaudited)
4. Federal Income Tax
Income and capital gains distributions are determined in accordance with income tax regulations that may differ from US GAAP. These differences are due to differing treatments for items such as net short-term gains, deferral of wash sale losses, foreign currency transactions, net investment losses, and capital loss carryovers.
The Fund has elected to treat gains and losses on forward foreign currency contracts as capital gains and losses, if applicable. Other foreign currency gains and losses on debt instruments are treated as ordinary income for federal income tax purposes pursuant to Section 988 of the Internal Revenue Code.
Accumulated capital losses noted below represent net capital loss carryovers, as of September 30, 2019, that may be available to offset future realized capital gains and thereby reduce future taxable gains distributions. The following table shows these capital loss carryovers.
| | | | | | |
| | | | | | |
Capital Loss Carryover Schedule | | |
For the year ended September 30, 2019 | | |
| | No Expiration | | | |
| Short-Term | Long-Term | Accumulated
Capital Losses | | |
| $(4,568,355) | $(6,595,680) | $ (11,164,035) | | |
The aggregate cost of investments and the composition of unrealized appreciation and depreciation of investment securities for federal income tax purposes as of March 31, 2020 are noted below. The primary differences between book and tax appreciation or depreciation of investments are wash sale loss deferrals and investments in passive foreign investment companies.
| | | | |
Federal Tax Cost | Unrealized
Appreciation | Unrealized
(Depreciation) | Net Tax Appreciation/
(Depreciation) |
$ 74,469,475 | $ 1,739,549 | $(11,301,806) | $ (9,562,257) |
Janus Henderson Emerging Markets Fund
Notes to Financial Statements (unaudited)
5. Capital Share Transactions
| | | | | | | |
| | | | | | | |
| | | Period ended March 31, 2020 | | Year ended September 30, 2019 |
| | | Shares | Amount | | Shares | Amount |
| | | | | | | |
Class A Shares: | | | | | |
Shares sold | 172,429 | $ 1,633,325 | | 117,396 | $ 1,066,661 |
Reinvested dividends and distributions | 6,582 | 62,859 | | 53,031 | 456,598 |
Shares repurchased | (242,148) | (2,272,674) | | (1,277,310) | (11,531,865) |
Net Increase/(Decrease) | (63,137) | $ (576,490) | | (1,106,883) | $(10,008,606) |
Class C Shares: | | | | | |
Shares sold | 155,528 | $ 1,484,506 | | 68,357 | $ 581,489 |
Reinvested dividends and distributions | 1,628 | 15,123 | | 13,874 | 115,990 |
Shares repurchased | (265,094) | (2,295,194) | | (330,948) | (2,882,303) |
Net Increase/(Decrease) | (107,938) | $ (795,565) | | (248,717) | $ (2,184,824) |
Class D Shares: | | | | | |
Shares sold | 192,926 | $ 1,737,467 | | 299,067 | $ 2,738,295 |
Reinvested dividends and distributions | 18,120 | 173,947 | | 48,819 | 422,774 |
Shares repurchased | (267,353) | (2,363,898) | | (476,175) | (4,343,351) |
Net Increase/(Decrease) | (56,307) | $ (452,484) | | (128,289) | $ (1,182,282) |
Class I Shares: | | | | | |
Shares sold | 600,784 | $ 5,390,737 | | 2,864,218 | $ 26,094,612 |
Reinvested dividends and distributions | 56,073 | 537,175 | | 337,015 | 2,915,180 |
Shares repurchased | (2,039,469) | (18,722,037) | | (10,535,869) | (95,848,867) |
Net Increase/(Decrease) | (1,382,612) | $(12,794,125) | | (7,334,636) | $(66,839,075) |
Class N Shares: | | | | | |
Shares sold | 2,481,612 | $ 24,259,595 | | 74,824 | $ 684,311 |
Reinvested dividends and distributions | 32,086 | 307,706 | | 94,125 | 815,126 |
Shares repurchased | (290,479) | (2,540,547) | | (925,237) | (8,583,409) |
Net Increase/(Decrease) | 2,223,219 | $ 22,026,754 | | (756,288) | $ (7,083,972) |
Class S Shares: | | | | | |
Shares sold | 438 | $ 3,971 | | 5,649 | $ 51,820 |
Reinvested dividends and distributions | 62 | 597 | | 1,596 | 13,840 |
Shares repurchased | (609) | (5,755) | | (182,908) | (1,662,168) |
Net Increase/(Decrease) | (109) | $ (1,187) | | (175,663) | $ (1,596,508) |
Class T Shares: | | | | | |
Shares sold | 18,064 | $ 159,199 | | 33,594 | $ 299,757 |
Reinvested dividends and distributions | 4,476 | 42,970 | | 16,876 | 146,144 |
Shares repurchased | (120,288) | (1,133,989) | | (218,637) | (1,989,814) |
Net Increase/(Decrease) | (97,748) | $ (931,820) | | (168,167) | $ (1,543,913) |
Janus Henderson Emerging Markets Fund
Notes to Financial Statements (unaudited)
6. Purchases and Sales of Investment Securities
For the period ended March 31, 2020, the aggregate cost of purchases and proceeds from sales of investment securities (excluding any short-term securities, short-term options contracts, TBAs, and in-kind transactions, as applicable) was as follows:
| | | | |
Purchases of
Securities | Proceeds from Sales
of Securities | Purchases of Long-
Term U.S. Government
Obligations | Proceeds from Sales
of Long-Term U.S.
Government Obligations |
$58,213,872 | $ 48,739,631 | $ - | $ - |
7. Recent Accounting Pronouncements
The FASB issued Accounting Standards Update 2018-13, Fair Value Measurement (Topic 820) in August 2018. The new guidance removes, modifies and enhances the disclosures to Topic 820. For public entities, the amendments are effective for financial statements issued for fiscal years beginning after December 15, 2019, and interim periods within those fiscal years. An entity is permitted, and Management has decided, to early adopt the removed and modified disclosures in these financial statements.
8. Other Matters
An outbreak of infectious respiratory illness caused by a novel coronavirus known as COVID-19 was first detected in China in December 2019 and has now been declared a pandemic by the World Health Organization. The impact of COVID-19 has been, and may continue to be, highly disruptive to economies and markets, adversely impacting individual companies, sectors, industries, markets, currencies, interest and inflation rates, credit ratings, investor sentiment, and other factors affecting the value of a Fund's investments. This may impact liquidity in the marketplace, which in turn may affect the Fund's ability to meet redemption requests. Public health crises caused by the COVID-19 pandemic may exacerbate other pre-existing political, social, and economic risks in certain countries or globally. The duration of the COVID-19 pandemic and its effects cannot be determined with certainty, and could prevent a Fund from executing advantageous investment decisions in a timely manner and negatively impact a Fund's ability to achieve its investment objective.
9. Subsequent Event
Management has evaluated whether any events or transactions occurred subsequent to March 31, 2020 and through the date of issuance of the Fund’s financial statements and determined that there were no material events or transactions that would require recognition or disclosure in the Fund’s financial statements.
Janus Henderson Emerging Markets Fund
Additional Information (unaudited)
Proxy Voting Policies and Voting Record
A description of the policies and procedures that the Fund uses to determine how to vote proxies relating to its portfolio securities is available without charge: (i) upon request, by calling 1-800-525-1093; (ii) on the Fund’s website at janushenderson.com/proxyvoting; and (iii) on the SEC’s website at http://www.sec.gov. Additionally, information regarding the Fund’s proxy voting record for the most recent twelve-month period ended June 30 is also available, free of charge, through janushenderson.com/proxyvoting and from the SEC’s website at http://www.sec.gov.
Full Holdings
The Fund is required to disclose its complete holdings as an exhibit to Form N-PORT within 60 days of the end of the first and third fiscal quarters, and in the annual report and semiannual report to Fund shareholders. Historically, the Fund filed its complete portfolio holdings (schedule of investments) with the SEC for the first and third quarters each fiscal year on Form N-Q. The Fund’s Form N-PORT and Form N-Q filings: (i) are available on the SEC’s website at http://www.sec.gov; (ii) may be reviewed and copied at the SEC’s Public Reference Room in Washington, D.C. (information on the Public Reference Room may be obtained by calling 1-800-SEC-0330); and (iii) are available without charge, upon request, by calling a Janus Henderson representative at 1-877-335-2687 (toll free) (or 1-800-525-3713 if you hold Class D Shares). Portfolio holdings consisting of at least the names of the holdings are generally available on a monthly basis with a 30-day lag. Holdings are generally posted approximately two business days thereafter under Full Holdings for the Fund at janushenderson.com/info (or janushenderson.com/reports if you hold Class D Shares).
APPROVAL OF ADVISORY AGREEMENTS DURING THE PERIOD
The Trustees of Janus Aspen Series, each of whom serves as an “independent” Trustee (the “Trustees”), oversee the management of each Portfolio of Janus Aspen Series (each, a “VIT Portfolio,” and collectively, the “VIT Portfolios”), as well as each Fund of Janus Investment Fund (together with the VIT Portfolios, the “Janus Henderson Funds,” and each, a “Janus Henderson Fund”). As required by law, the Trustees determine annually whether to continue the investment advisory agreement for each Janus Henderson Fund and the subadvisory agreements for the Janus Henderson Funds that utilize subadvisers.
In connection with their most recent consideration of those agreements for each Janus Henderson Fund, the Trustees received and reviewed information provided by Janus Capital and the respective subadvisers in response to requests of the Trustees and their independent legal counsel. They also received and reviewed information and analysis provided by, and in response to requests of, their independent fee consultant. Throughout their consideration of the agreements, the Trustees were advised by their independent legal counsel. The Trustees met with management to consider the agreements, and also met separately in executive session with their independent legal counsel and their independent fee consultant.
At a meeting held on December 5, 2019, based on the Trustees’ evaluation of the information provided by Janus Capital, the subadvisers, and the independent fee consultant, as well as other information, the Trustees determined that the overall arrangements between each Janus Henderson Fund and Janus Capital and each subadviser, as applicable, were fair and reasonable in light of the nature, extent and quality of the services provided by Janus Capital, its affiliates and the subadvisers, the fees charged for those services, and other matters that the Trustees considered relevant in the exercise of their business judgment. At that meeting, the Trustees unanimously approved the continuation of the investment advisory agreement for each Janus Henderson Fund, and the subadvisory agreement for each subadvised Janus Henderson Fund, for the period from February 1, 2020 through February 1, 2021, subject to earlier termination as provided for in each agreement.
In considering the continuation of those agreements, the Trustees reviewed and analyzed various factors that they determined were relevant, including the factors described below, none of which by itself was considered dispositive. However, the material factors and conclusions that formed the basis for the Trustees’ determination to approve the continuation of the agreements are discussed separately below. Also included is a summary of the independent fee consultant’s conclusions and opinions that arose during, and were included as part of, the Trustees’ consideration of the agreements. “Management fees,” as used herein, reflect actual annual advisory fees and, for the purpose of peer comparisons any administration fees (excluding out of pocket costs), net of any waivers, paid by a fund as a percentage of average net assets.
Janus Henderson Emerging Markets Fund
Additional Information (unaudited)
Nature, Extent and Quality of Services
The Trustees reviewed the nature, extent and quality of the services provided by Janus Capital and the subadvisers to the Janus Henderson Funds, taking into account the investment objective, strategies and policies of each Janus Henderson Fund, and the knowledge the Trustees gained from their regular meetings with management on at least a quarterly basis and their ongoing review of information related to the Janus Henderson Funds. In addition, the Trustees reviewed the resources and key personnel of Janus Capital and each subadviser, particularly noting those employees who provide investment and risk management services to the Janus Henderson Funds. The Trustees also considered other services provided to the Janus Henderson Funds by Janus Capital or the subadvisers, such as managing the execution of portfolio transactions and the selection of broker-dealers for those transactions. The Trustees considered Janus Capital’s role as administrator to the Janus Henderson Funds, noting that Janus Capital generally, does not receive a fee for its services but is reimbursed for its out-of-pocket costs. The Trustees considered the role of Janus Capital in monitoring adherence to the Janus Henderson Funds’ investment restrictions, providing support services for the Trustees and Trustee committees, and overseeing communications with shareholders and the activities of other service providers, including monitoring compliance with various policies and procedures of the Janus Henderson Funds and with applicable securities laws and regulations.
In this regard, the independent fee consultant noted that Janus Capital provides a number of different services for the Janus Henderson Funds and fund shareholders, ranging from investment management services to various other servicing functions, and that, in its view, Janus Capital is a capable provider of those services. The independent fee consultant also provided its belief that Janus Capital has developed a number of institutional competitive advantages that should enable it to provide superior investment and service performance over the long term.
The Trustees concluded that the nature, extent and quality of the services provided by Janus Capital or the subadviser to each Janus Henderson Fund were appropriate and consistent with the terms of the respective advisory and subadvisory agreements, and that, taking into account steps taken to address those Janus Henderson Funds whose performance lagged that of their peers for certain periods, the Janus Henderson Funds were likely to benefit from the continued provision of those services. They also concluded that Janus Capital and each subadviser had sufficient personnel, with the appropriate education and experience, to serve the Janus Henderson Funds effectively and had demonstrated its ability to attract well-qualified personnel.
Performance of the Funds
The Trustees considered the performance results of each Janus Henderson Fund over various time periods. They noted that they considered Janus Henderson Fund performance data throughout the year, including periodic meetings with each Janus Henderson Fund’s portfolio manager(s), and also reviewed information comparing each Janus Henderson Fund’s performance with the performance of comparable funds and peer groups identified by Broadridge Financial Solutions, Inc. (“Broadridge”), an independent data provider, and with the Janus Henderson Fund’s benchmark index. In this regard, the independent fee consultant found that the overall Janus Henderson Funds’ performance has been reasonable: for the 36 months ended September 30, 2019, approximately 69% of the Janus Henderson Funds were in the top two quartiles of performance, as reported by Morningstar, and for the 12 months ended September 30, 2019, approximately 71% of the Janus Henderson Funds were in the top two quartiles of performance, as reported by Morningstar.
The Trustees considered the performance of each Fund, noting that performance may vary by share class, and noted the following:
Alternative Fund
· For Janus Henderson Diversified Alternatives Fund, the Trustees noted that the Fund’s performance was in the third Broadridge quartile for the 36 months ended May 31, 2019 and the bottom Broadridge quartile for the 12 months ended May 31, 2019. The Trustees noted the reasons for the Fund’s underperformance, the steps Janus Capital had taken or was taking to improve performance.
Asset Allocation Funds
· For Janus Henderson Global Allocation Fund – Conservative, the Trustees noted that the Fund’s performance was in the third Broadridge quartile for the 36 months ended May 31, 2019 and the bottom Broadridge quartile for the 12 months ended May 31, 2019. The Trustees noted the reasons for the Fund’s underperformance, the steps Janus Capital had taken or was taking to improve performance.
Janus Henderson Emerging Markets Fund
Additional Information (unaudited)
· For Janus Henderson Global Allocation Fund – Growth, the Trustees noted that the Fund’s performance was in the third Broadridge quartile for the 36 months ended May 31, 2019 and the bottom Broadridge quartile for the 12 months ended May 31, 2019. The Trustees noted the reasons for the Fund’s underperformance, the steps Janus Capital had taken or was taking to improve performance.
· For Janus Henderson Global Allocation Fund – Moderate, the Trustees noted that the Fund’s performance was in the third Broadridge quartile for the 36 months ended May 31, 2019 and the bottom Broadridge quartile for the 12 months ended May 31, 2019. The Trustees noted the reasons for the Fund’s underperformance, the steps Janus Capital had taken or was taking to improve performance.
Fixed-Income Funds
· For Janus Henderson Absolute Return Income Opportunities Fund, the Trustees noted that the Fund’s performance was in the bottom Broadridge quartile for the 36 months ended May 31, 2019 and the third Broadridge quartile for the 12 months ended May 31, 2019. The Trustees noted the reasons for the Fund’s underperformance and the steps Janus Capital had taken or was taking to improve performance.
· For Janus Henderson Developed World Bond Fund, the Trustees noted the Fund’s performance was in the second Broadridge quartile for the 36 months ended May 31, 2019 and the first quartile for the 12 months ended May 31, 2019.
· For Janus Henderson Flexible Bond Fund, the Trustees noted that the Fund’s performance was in the bottom Broadridge quartile for the 36 months ended May 31, 2019 and the bottom Broadridge quartile for the 12 months ended May 31, 2019. The Trustees noted the reasons for the Fund’s underperformance and the steps Janus Capital had taken or was taking to improve performance.
· For Janus Henderson Global Bond Fund, the Trustees noted that the Fund’s performance was in the bottom Broadridge quartile for the 36 months ended May 31, 2019 and the bottom Broadridge quartile for the 12 months ended May 31, 2019. The Trustees noted the reasons for the Fund’s underperformance, the steps Janus Capital had taken or was taking to improve performance.
· For Janus Henderson High-Yield Fund, the Trustees noted that the Fund’s performance was in the second Broadridge quartile for the 36 months ended May 31, 2019 and the second Broadridge quartile for the 12 months ended May 31, 2019.
· For Janus Henderson Multi-Sector Income Fund, the Trustees noted that the Fund’s performance was in the first Broadridge quartile for the 36 months ended May 31, 2019 and the first Broadridge quartile for the 12 months ended May 31, 2019.
· For Janus Henderson Short-Term Bond Fund, the Trustees noted that the Fund’s performance was in the bottom Broadridge quartile for the 36 months ended May 31, 2019 and the third Broadridge quartile for the 12 months ended May 31, 2019. The Trustees noted the reasons for the Fund’s underperformance and the steps Janus Capital had taken or was taking to improve performance.
Global and International Equity Funds
· For Janus Henderson Asia Equity Fund, the Trustees noted that the Fund’s performance was in the first Broadridge quartile for the 36 months ended May 31, 2019 and the second Broadridge quartile for the 12 months ended May 31, 2019.
· For Janus Henderson Emerging Markets Fund, the Trustees noted that the Fund’s performance was in the bottom Broadridge quartile for the 36 months ended May 31, 2019 and the second Broadridge quartile for the 12 months ended May 31, 2019. The Trustees noted the reasons for the Fund’s underperformance and the steps Janus Capital had taken or was taking to improve performance, and that the performance trend was improving
· For Janus Henderson European Focus Fund, the Trustees noted that the Fund’s performance was in the bottom Broadridge quartile for the 36 months ended May 31, 2019 and the bottom Broadridge quartile for the 12 months ended May 31, 2019. The Trustees noted the reasons for the Fund’s underperformance and the steps Janus Capital had taken or was taking to improve performance.
· For Janus Henderson Global Equity Income Fund, the Trustees noted that the Fund’s performance was in the bottom Broadridge quartile for the 36 months ended May 31, 2019 and the bottom Broadridge quartile for the 12
Janus Henderson Emerging Markets Fund
Additional Information (unaudited)
months ended May 31, 2019. The Trustees noted the reasons for the Fund’s underperformance and the steps Janus Capital had taken or was taking to improve performance.
· For Janus Henderson Global Life Sciences Fund, the Trustees noted that the Fund’s performance was in the first Broadridge quartile for the 36 months ended May 31, 2019 and the second Broadridge quartile for the 12 months ended May 31, 2019.
· For Janus Henderson Global Real Estate Fund, the Trustees noted that the Fund’s performance was in the first Broadridge quartile for the 36 months ended May 31, 2019 and the first Broadridge quartile for the 12 months ended May 31, 2019.
· For Janus Henderson Global Research Fund, the Trustees noted that the Fund’s performance was in the third Broadridge quartile for the 36 months ended May 31, 2019 and the third Broadridge quartile for the 12 months ended May 31, 2019. The Trustees noted the reasons for the Fund’s underperformance, while also noting that the Fund has a performance fee structure that results in lower management fees during periods of underperformance, and the steps Janus Capital had taken or was taking to improve performance.
· For Janus Henderson Global Select Fund, the Trustees noted that the Fund’s performance was in the first Broadridge quartile for the 36 months ended May 31, 2019 and the bottom Broadridge quartile for the 12 months ended May 31, 2019.
· For Janus Henderson Global Technology Fund, the Trustees noted that the Fund’s performance was in the second Broadridge quartile for the 36 months ended May 31, 2019 and the first Broadridge quartile for the 12 months ended May 31, 2019.
· For Janus Henderson Global Value Fund, the Trustees noted that the Fund’s performance was in the second Broadridge quartile for the 36 months ended May 31, 2019 and the first Broadridge quartile for the 12 months ended May 31, 2019.
· For Janus Henderson International Opportunities Fund, the Trustees noted that the Fund’s performance was in the bottom Broadridge quartile for the 36 months ended May 31, 2019 and the bottom Broadridge quartile for the 12 months ended May 31, 2019. The Trustees noted the reasons for the Fund’s underperformance and the steps Janus Capital had taken or was taking to improve performance.
· For Janus Henderson International Small Cap Fund, the Trustees noted that the Fund’s performance was in the bottom Broadridge quartile for the 12 months ended May 31, 2019. The Trustees noted the reasons for the Fund’s underperformance, the steps Janus Capital had taken or was taking to improve performance, and its limited performance history.
· For Janus Henderson International Value Fund, the Trustees noted that the Fund’s performance was in the bottom Broadridge quartile for the 36 months ended May 31, 2019 and the second Broadridge quartile for the 12 months ended May 31, 2019. The Trustees noted the reasons for the Fund’s underperformance and the steps Janus Capital and Perkins had taken or were taking to improve performance, and that the performance trend was improving
· For Janus Henderson Overseas Fund, the Trustees noted that the Fund’s performance was in the second Broadridge quartile for the 36 months ended May 31, 2019 and the bottom Broadridge quartile for the 12 months ended May 31, 2019.
Money Market Funds
· For Janus Henderson Government Money Market Fund, the Trustees noted that the Fund’s performance was in the second Broadridge quartile for the 36 months ended May 31, 2019 and the third Broadridge quartile for the 12 months ended May 31, 2019.
· For Janus Henderson Money Market Fund, the Trustees noted that the Fund’s performance was in the third Broadridge quartile for the 36 months ended May 31, 2019 and the third Broadridge quartile for the 12 months ended May 31, 2019. The Trustees noted the reasons for the Fund’s underperformance and the steps Janus Capital had taken or was taking to improve performance.
Janus Henderson Emerging Markets Fund
Additional Information (unaudited)
Multi-Asset Funds
· For Janus Henderson Adaptive Global Allocation Fund, the Trustees noted that the Fund’s performance was in third quartile for the 36 months ended May 31, 2019 and the third Broadridge quartile for the 12 months ended May 31, 2019. The Trustees noted the reasons for the Fund’s underperformance and the steps Janus Capital had taken or was taking to improve performance.
· For Janus Henderson Dividend & Income Builder Fund, the Trustees noted that the Fund’s performance was in the third Broadridge quartile for the 36 months ended May 31, 2019 and the third Broadridge quartile for the 12 months ended May 31, 2019. The Trustees noted the reasons for the Fund’s underperformance and the steps Janus Capital had taken or was taking to improve performance.
· For Janus Henderson Value Plus Income Fund, the Trustees noted that the Fund’s performance was in the first Broadridge quartile for the 36 months ended May 31, 2019 and the first Broadridge quartile for the 12 months ended May 31, 2019.
Multi-Asset U.S. Equity Funds
· For Janus Henderson Balanced Fund, the Trustees noted that the Fund’s performance was in the first Broadridge quartile for the 36 months ended May 31, 2019 and the first Broadridge quartile for the 12 months ended May 31, 2019.
· For Janus Henderson Contrarian Fund, the Trustees noted that the Fund’s performance was in the second Broadridge quartile for the 36 months ended May 31, 2019 and the first Broadridge quartile for the 12 months ended May 31, 2019.
· For Janus Henderson Enterprise Fund, the Trustees noted that the Fund’s performance was in the first Broadridge quartile for the 36 months ended May 31, 2019 and the first Broadridge quartile for the 12 months ended May 31, 2019.
· For Janus Henderson Forty Fund, the Trustees noted that the Fund’s performance was in the second Broadridge quartile for the 36 months ended May 31, 2019 and the first Broadridge quartile for the 12 months ended May 31, 2019.
· For Janus Henderson Growth and Income Fund, the Trustees noted that the Fund’s performance was in the first Broadridge quartile for the 36 months ended May 31, 2019 and the second Broadridge quartile for the 12 months ended May 31, 2019.
· For Janus Henderson Research Fund, the Trustees noted that the Fund’s performance was in the third Broadridge quartile for the 36 months ended May 31, 2019 and the second Broadridge quartile for the 12 months ended May 31, 2019. The Trustees noted the reasons for the Fund’s underperformance, while also noting that the Fund has a performance fee structure that results in lower management fees during periods of underperformance, and the steps Janus Capital had taken or was taking to improve performance, and that the performance trend was improving.
· For Janus Henderson Triton Fund, the Trustees noted that the Fund’s performance was in the third Broadridge quartile for the 36 months ended May 31, 2019 and the second Broadridge quartile for the 12 months ended May 31, 2019. The Trustees noted the reasons for the Fund’s underperformance, and the steps Janus Capital had taken or was taking to improve performance, and that the performance trend was improving.
· For Janus Henderson U.S. Growth Opportunities Fund, the Trustees noted that the Fund’s performance was in the third Broadridge quartile for the 36 months ended May 31, 2019 and the first Broadridge quartile for the 12 months ended May 31, 2019. The Trustees noted the reasons for the Fund’s underperformance, and the steps Janus Capital and Geneva had taken or were taking to improve performance, and that the performance trend was improving.
· For Janus Henderson Venture Fund, the Trustees noted that the Fund’s performance was in the third Broadridge quartile for the 36 months ended May 31, 2019 and the second Broadridge quartile for the 12 months ended May 31, 2019. The Trustees noted the reasons for the Fund’s underperformance, and the steps Janus Capital had taken or was taking to improve performance, and that the performance trend was improving.
Janus Henderson Emerging Markets Fund
Additional Information (unaudited)
Quantitative Equity Funds
· For Janus Henderson Emerging Markets Managed Volatility Fund, the Trustees noted that the Fund’s performance was in the second Broadridge quartile for the 36 months ended May 31, 2019 and the first Broadridge quartile for the 12 months ended May 31, 2019.
· For Janus Henderson Global Income Managed Volatility Fund, the Trustees noted that the Fund’s performance was in the second Broadridge quartile for the 36 months ended May 31, 2019 and the first Broadridge quartile for the 12 months ended May 31, 2019.
· For Janus Henderson International Managed Volatility Fund, the Trustees noted that the Fund’s performance was in the third Broadridge quartile for the 36 months ended May 31, 2019 and the second Broadridge quartile for the 12 months ended May 31, 2019. The Trustees noted the reasons for the Fund’s underperformance, the steps Janus Capital and Intech had taken or were taking to improve performance, and that the performance trend was improving.
· For Janus Henderson U.S. Managed Volatility Fund, the Trustees noted that the Fund’s performance was in the second Broadridge quartile for the 36 months ended May 31, 2019 and the second Broadridge quartile for the 12 months ended May 31, 2019.
U.S. Equity Funds
· For Janus Henderson Large Cap Value Fund, the Trustees noted that the Fund’s performance was in the second Broadridge quartile for the 36 months ended May 31, 2019 and the first Broadridge quartile for the 12 months ended May 31, 2019.
· For Janus Henderson Mid Cap Value Fund, the Trustees noted that the Fund’s performance was in the second Broadridge quartile for the 36 months ended May 31, 2019 and the second Broadridge quartile for the 12 months ended May 31, 2019.
· For Janus Henderson Small Cap Value Fund, the Trustees noted that the Fund’s performance was in the second Broadridge quartile for the 36 months ended May 31, 2019 and the first Broadridge quartile for the 12 months ended May 31, 2019.
· For Janus Henderson Small-Mid Cap Value Fund, the Trustees noted that the Fund’s performance was in the third Broadridge quartile for the 36 months ended May 31, 2019 and the second Broadridge quartile for the 12 months ended May 31, 2019. The Trustees noted the reasons for the Fund’s underperformance, while also noting that the Fund has a performance fee structure that results in lower management fees during periods of underperformance, and the steps Janus Capital and Perkins had taken or were taking to improve performance, and that the performance trend was improving.
In consideration of each Janus Henderson Fund’s performance, the Trustees concluded that, taking into account the factors relevant to performance, as well as other considerations, including steps taken to improve performance, the Janus Henderson Fund’s performance warranted continuation of such Janus Henderson Fund’s investment advisory and subadvisory agreement(s).
Costs of Services Provided
The Trustees examined information regarding the fees and expenses of each Janus Henderson Fund in comparison to similar information for other comparable funds as provided by Broadridge, an independent data provider. They also reviewed an analysis of that information provided by their independent fee consultant and noted that the rate of management fees (investment advisory and any administration but excluding out-of-pocket costs) for many of the Janus Henderson Funds, after applicable waivers, was below the average management fee rate of the respective peer group of funds selected by an independent data provider. The Trustees also examined information regarding the subadvisory fees charged for subadvisory services, as applicable, noting that all such fees were paid by Janus Capital out of its management fees collected from such Janus Henderson Fund.
The independent fee consultant provided its belief that the management fees charged by Janus Capital to each of the Janus Henderson Funds under the current investment advisory and administration agreements are reasonable in relation to the services provided by Janus Capital. The independent fee consultant found: (1) the total expenses and management fees of the Janus Henderson Funds to be reasonable relative to other mutual funds; (2) the total expenses, on average, were 10% under the average total expenses of their respective Broadridge Expense Group
Janus Henderson Emerging Markets Fund
Additional Information (unaudited)
peers; and (3) and the management fees for the Janus Henderson Funds, on average, were 7% under the average management fees for their Expense Groups. The Trustees also considered the total expenses for each share class of each Janus Henderson Fund compared to the average total expenses for its Broadridge Expense Group peers and to average total expenses for its Broadridge Expense Universe.
For certain Janus Henderson Funds, the independent fee consultant also performed a systematic “focus list” analysis of expenses which assessed fund fees in the context of fund performance being delivered. Based on this analysis, the independent fee consultant found that the combination of service quality/performance and expenses on these individual Janus Henderson Funds was reasonable in light of performance trends, performance histories, and existence of performance fees, breakpoints, and/or expense waivers on such Janus Henderson Funds.
The Trustees considered the methodology used by Janus Capital and each subadviser in determining compensation payable to portfolio managers, the competitive environment for investment management talent, and the competitive market for mutual funds in different distribution channels.
The Trustees also reviewed management fees charged by Janus Capital and each subadviser to comparable separate account clients and to comparable non-affiliated funds subadvised by Janus Capital or by a subadviser (for which Janus Capital or the subadviser provides only or primarily portfolio management services). Although in most instances subadvisory and separate account fee rates for various investment strategies were lower than management fee rates for Janus Henderson Funds having a similar strategy, the Trustees considered that Janus Capital noted that, under the terms of the management agreements with the Janus Henderson Funds, Janus Capital performs significant additional services for the Janus Henderson Funds that it does not provide to those other clients, including administration services, oversight of the Janus Henderson Funds’ other service providers, trustee support, regulatory compliance and numerous other services, and that, in serving the Janus Henderson Funds, Janus Capital assumes many legal risks and other costs that it does not assume in servicing its other clients. Moreover, they noted that the independent fee consultant found that: (1) the management fees Janus Capital charges to the Janus Henderson Funds are reasonable in relation to the management fees Janus Capital charges to funds subadvised by Janus Capital and to the fees Janus Capital charges to its institutional separate account clients; (2) these subadvised and institutional separate accounts have different service and infrastructure needs; and (3) Janus Henderson mutual fund investors enjoy reasonable fees relative to the fees charged to Janus Henderson subadvised fund and separate account investors; (4) 11 of 12 Janus Henderson Funds have lower management fees than similar funds subadvised by Janus Capital; and (5) six of nine Janus Henderson Funds have lower management fees than similar separate accounts managed by Janus Capital.
The Trustees considered the fees for each Fund for its fiscal year ended in 2018, and noted the following with regard to each Fund’s total expenses, net of applicable fee waivers (the Fund’s “total expenses”):
Alternative Fund
· For Janus Henderson Diversified Alternatives Fund, the Trustees noted that, although the Fund’s total expenses exceeded the peer group average for certain share classes, overall the Fund’s total expenses were reasonable. The Trustees also noted that Janus Capital has contractually agreed to limit the Fund’s expenses.
Asset Allocation Funds
· For Janus Henderson Global Allocation Fund – Conservative, the Trustees noted that, although the Fund’s total expenses exceeded the peer group average for certain share classes, overall the Fund’s total expenses were reasonable. The Trustees also noted that Janus Capital has contractually agreed to limit the Fund’s expenses.
· For Janus Henderson Global Allocation Fund – Growth, the Trustees noted that, although the Fund’s total expenses exceeded the peer group average for certain share classes, overall the Fund’s total expenses were reasonable. The Trustees also noted that Janus Capital has contractually agreed to limit the Fund’s expenses.
· For Janus Henderson Global Allocation Fund – Moderate, the Trustees noted that, although the Fund’s total expenses exceeded the peer group average for certain share classes, overall the Fund’s total expenses were reasonable. The Trustees also noted that Janus Capital has contractually agreed to limit the Fund’s expenses.
Janus Henderson Emerging Markets Fund
Additional Information (unaudited)
Fixed-Income Funds
· For Janus Henderson Absolute Return Income Opportunities Fund, the Trustees noted that, although the Fund’s total expenses exceeded the peer group average for certain share classes, overall the Fund’s total expenses were reasonable. The Trustees also noted that Janus Capital has contractually agreed to limit the Fund’s expenses.
· For Janus Henderson Developed World Bond Fund, the Trustees noted that, although the Fund’s total expenses exceeded the peer group average for certain share classes, overall the Fund’s total expenses were reasonable. The Trustees also noted that Janus Capital has contractually agreed to limit the Fund’s expenses.
· For Janus Henderson Flexible Bond Fund, the Trustees noted that, although the Fund’s total expenses exceeded the peer group average for certain share classes, overall the Fund’s total expenses were reasonable. The Trustees also noted that Janus Capital has contractually agreed to limit the Fund’s expenses.
· For Janus Henderson Global Bond Fund, the Trustees noted that, although the Fund’s total expenses exceeded the peer group average for certain share classes, overall the Fund’s total expenses were reasonable. The Trustees also noted that Janus Capital has contractually agreed to limit the Fund’s expenses.
· For Janus Henderson High-Yield Fund, the Trustees noted that, although the Fund’s total expenses exceeded the peer group average for certain share classes, overall the Fund’s total expenses were reasonable. The Trustees also noted that Janus Capital has contractually agreed to limit the Fund’s expenses.
· For Janus Henderson Multi-Sector Income Fund, the Trustees noted that, although the Fund’s total expenses exceeded the peer group average for certain share classes, overall the Fund’s total expenses were reasonable. The Trustees also noted that Janus Capital has contractually agreed to limit the Fund’s expenses.
· For Janus Henderson Short-Term Bond Fund, the Trustees noted that, although the Fund’s total expenses exceeded the peer group average for all share classes, overall the Fund’s total expenses were reasonable. The Trustees also noted that Janus Capital has contractually agreed to limit the Fund’s expenses.
Global and International Equity Funds
· For Janus Henderson Asia Equity Fund, the Trustees noted that, although the Fund’s total expenses exceeded the peer group average for certain share classes, overall the Fund’s total expenses were reasonable. The Trustees also noted that Janus Capital has contractually agreed to limit the Fund’s expenses.
· For Janus Henderson Emerging Markets Fund, the Trustees noted that, although the Fund’s total expenses exceeded the peer group average for one share class, overall the Fund’s total expenses were reasonable. The Trustees also noted that Janus Capital has contractually agreed to limit the Fund’s expenses.
· For Janus Henderson European Focus Fund, the Trustees noted that, although the Fund’s total expenses exceeded the peer group average for certain share classes, overall the Fund’s total expenses were reasonable. The Trustees also noted that Janus Capital has contractually agreed to limit the Fund’s expenses.
· For Janus Henderson Global Equity Income Fund, the Trustees noted that the Fund’s total expenses were below the peer group average for all share classes.
· For Janus Henderson Global Life Sciences Fund, the Trustees noted that the Fund’s total expenses were below the peer group average for all share classes.
· For Janus Henderson Global Real Estate Fund, the Trustees noted although the Fund’s total expenses exceeded the peer group average for one share class, overall the Fund’s total expenses were reasonable. The Trustees also noted that Janus Capital has contractually agreed to limit the Fund’s expenses.
· For Janus Henderson Global Research Fund, the Trustees noted that the Fund’s total expenses were below the peer group average for all share classes.
· For Janus Henderson Global Select Fund, the Trustees noted that, although the Fund’s total expenses exceeded the peer group average for one share class, overall the Fund’s total expenses were reasonable. The Trustees also noted that Janus Capital has contractually agreed to limit the Fund’s expenses.
· For Janus Henderson Global Technology Fund, the Trustees noted that the Fund’s total expenses were below the peer group average for all share classes.
Janus Henderson Emerging Markets Fund
Additional Information (unaudited)
· For Janus Henderson Global Value Fund, the Trustees noted that although the Fund’s total expenses exceeded the peer group average for one share class, overall the Fund’s total expenses were reasonable.
· For Janus Henderson International Opportunities Fund, the Trustees noted that, although the Fund’s total expenses exceeded the peer group average for certain share classes, overall the Fund’s total expenses were reasonable. The Trustees also noted that Janus Capital has contractually agreed to limit the Fund’s expenses.
· For Janus Henderson International Small Cap Fund, the Trustees noted that the Fund’s total expenses were below the peer group average for all share classes.
· For Janus Henderson International Value Fund, the Trustees noted that, although the Fund’s total expenses exceeded the peer group average for certain share classes, overall the Fund’s total expenses were reasonable. The Trustees also noted that Janus Capital has contractually agreed to limit the Fund’s expenses.
· For Janus Henderson Overseas Fund, the Trustees noted that the Fund’s total expenses were below the peer group average for all share classes.
Money Market Funds
· For Janus Henderson Government Money Market Fund, the Trustees noted that the Fund’s total expenses were below the peer group average for both share classes.
· For Janus Henderson Money Market Fund, the Trustees noted that, although the Fund’s total expenses exceeded the peer group average for one share class, overall the Fund’s total expenses were reasonable.
Multi-Asset Funds
· For Janus Henderson Adaptive Global Allocation Fund, the Trustees noted that, although the Fund’s total expenses exceeded the peer group average for one share class, overall the Fund’s total expenses were reasonable. The Trustees also noted that Janus Capital has contractually agreed to limit the Fund’s expenses.
· For Janus Henderson Dividend & Income Builder Fund, the Trustees noted that the Fund’s total expenses were below the peer group average for all share classes.
· For Janus Henderson Value Plus Income Fund, the Trustees noted that the Fund’s total expenses were below the peer group average for all share classes.
Multi-Asset U.S. Equity Funds
· For Janus Henderson Balanced Fund, the Trustees noted that, although the Fund’s total expenses exceeded the peer group average for certain share classes, overall the Fund’s total expenses were reasonable. The Trustees also noted that Janus Capital has contractually agreed to limit the Fund’s expenses, although this limit did not apply because the Fund’s total expenses were already below the applicable fee limit.
· For Janus Henderson Contrarian Fund, the Trustees noted that the Fund’s total expenses exceeded the peer group average for one share class, overall the Fund’s total expenses were reasonable. The Trustees also noted that Janus Capital had contractually agreed to limit the Fund’s expenses.
· For Janus Henderson Enterprise Fund, the Trustees noted that the Fund’s total expenses were below the peer group average for all share classes.
· For Janus Henderson Forty Fund, the Trustees noted that, although the Fund’s total expenses exceeded the peer group average for certain share classes, overall the Fund’s total expenses were reasonable. The Trustees also noted that Janus Capital has contractually agreed to limit the Fund’s expenses, although this limit did not apply because the Fund’s total expenses were already below the applicable fee limit.
· For Janus Henderson Growth and Income Fund, the Trustees noted that, although the Fund’s total expenses exceeded the peer group average for certain share classes, overall the Fund’s total expenses were reasonable. The Trustees also noted that Janus Capital has contractually agreed to limit the Fund’s expenses, although this limit did not apply because the Fund’s total expenses were already below the applicable fee limit.
· For Janus Henderson Research Fund, the Trustees noted that the Fund’s total expenses were below the peer group average for all share classes.
Janus Henderson Emerging Markets Fund
Additional Information (unaudited)
· For Janus Henderson Triton Fund, the Trustees noted that, although the Fund’s expenses exceeded the peer group average for one share class, overall the Fund’s total expenses were reasonable. The Trustees also noted that Janus Capital had contractually agreed to limit the Fund’s expenses, although this limit did not apply because the Fund’s total expenses were already below the applicable fee limit.
· For Janus Henderson U.S. Growth Opportunities Fund, that Trustees noted that the Fund’s total expenses were below the peer group average for all share classes.
· For Janus Henderson Venture Fund, the Trustees noted that, although the Fund’s expenses exceeded the peer group average for one share class, overall the Fund’s total expenses were reasonable. The Trustees also noted that Janus Capital had contractually agreed to limit the Fund’s expenses, although this limit did not apply because the Fund’s total expenses were already below the applicable fee limit.
Quantitative Equity Funds
· For Janus Henderson Emerging Markets Managed Volatility Fund, the Trustees noted that, although the Fund’s total expenses exceeded the peer group average for certain share classes, overall the Fund’s total expenses were reasonable. The Trustees also noted that Janus Capital has contractually agreed to limit the Fund’s expenses.
· For Janus Henderson Global Income Managed Volatility Fund, the Trustees noted that the Fund’s total expenses were below the peer group average for all share classes.
· For Janus Henderson International Managed Volatility Fund, the Trustees noted that, although the Fund’s total expenses exceeded the peer group average for certain share classes, overall the Fund’s total expenses were reasonable. The Trustees also noted that Janus Capital has contractually agreed to limit the Fund’s expenses.
· For Janus Henderson U.S. Managed Volatility Fund, the Trustees noted that the Fund’s total expenses were below the peer group average for all share classes.
U.S. Equity Funds
· For Janus Henderson Large Cap Value Fund, the Trustees noted that the Fund’s total expenses were below the peer group average for all share classes.
· For Janus Henderson Mid Cap Value Fund, the Trustees noted that, although the Fund’s expenses exceeded the peer group average for certain share classes, overall the Fund’s total expenses were reasonable. The Trustees also noted that Janus Capital had contractually agreed to limit the Fund’s expenses, although this limit did not apply because the Fund’s total expenses were already below the applicable fee limit.
· For Janus Henderson Small Cap Value Fund, the Trustees noted that, although the Fund’s total expenses exceeded the peer group average for certain share classes, overall the Fund’s total expenses were reasonable. The Trustees also noted that Janus Capital has contractually agreed to limit the Fund’s expenses, although this limit did not apply because the Fund’s total expenses were already below the applicable fee limit.
· For Janus Henderson Small-Mid Cap Value Fund, the Trustees noted that, although the Fund’s total expenses exceeded the peer group average for certain share classes, overall the Fund’s total expenses were reasonable. The Trustees also noted that Janus Capital has contractually agreed to limit the Fund’s expenses.
The Trustees reviewed information on the overall profitability to Janus Capital and its affiliates of their relationship with the Janus Henderson Funds, and considered profitability data of other publicly traded mutual fund advisers. The Trustees recognized that profitability comparisons among fund managers are difficult because of the variation in the type of comparative information that is publicly available, and the profitability of any fund manager is affected by numerous factors, including the organizational structure of the particular fund manager, differences in complex size, difference in product mix, difference in types of business (mutual fund, institutional and other), differences in the types of funds and other accounts it manages, possible other lines of business, the methodology for allocating expenses, and the fund manager’s capital structure and cost of capital.
Additionally, the Trustees considered the estimated profitability to Janus Capital from the investment management services it provided to each Janus Henderson Fund. In their review, the Trustees considered whether Janus Capital and each subadviser receive adequate incentives and resources to manage the Janus Henderson Funds effectively. In reviewing profitability, the Trustees noted that the estimated profitability for an individual Janus Henderson Fund is
Janus Henderson Emerging Markets Fund
Additional Information (unaudited)
necessarily a product of the allocation methodology utilized by Janus Capital to allocate its expenses as part of the estimated profitability calculation. In this regard, the Trustees noted that the independent fee consultant found that (1) the expense allocation methodology and rationales utilized by Janus Capital were reasonable and (2) no clear correlation between expense allocations and operating margins. The Trustees also considered that the estimated profitability for an individual Janus Henderson Fund was influenced by a number of factors, including not only the allocation methodology selected, but also the presence of fee waivers and expense caps, and whether the Janus Henderson Fund’s investment management agreement contained breakpoints or a performance fee component. The Trustees determined, after taking into account these factors, among others, that Janus Capital’s estimated profitability with respect to each Janus Henderson Fund was not unreasonable in relation to the services provided, and that the variation in the range of such estimated profitability among the Janus Henderson Funds was not a material factor in the Board’s approval of the reasonableness of any Janus Henderson Fund’s investment management fees.
The Trustees concluded that the management fees payable by each Janus Henderson Fund to Janus Capital and its affiliates, as well as the fees paid by Janus Capital to the subadvisers of subadvised Janus Henderson Funds, were reasonable in relation to the nature, extent, and quality of the services provided, taking into account the fees charged by other advisers for managing comparable mutual funds with similar strategies, the fees Janus Capital and the subadvisers charge to other clients, and, as applicable, the impact of fund performance on management fees payable by the Janus Henderson Funds. The Trustees also concluded that each Janus Henderson Fund’s total expenses were reasonable, taking into account the size of the Janus Henderson Fund, the quality of services provided by Janus Capital and any subadviser, the investment performance of the Janus Henderson Fund, and any expense limitations agreed to or provided by Janus Capital.
Economies of Scale
The Trustees considered information about the potential for Janus Capital to realize economies of scale as the assets of the Janus Henderson Funds increase. They noted that their independent fee consultant published a report to the Trustees in November 2019 which provided its research and analysis into economies of scale. They also noted that, although many Janus Henderson Funds pay advisory fees at a base fixed rate as a percentage of net assets, without any breakpoints or performance fees, their independent fee consultant concluded that 64% of these Janus Henderson Funds’ share classes have contractual management fees (gross of waivers) below their Broadridge expense group averages. They also noted the following: (1) that for those Janus Henderson Funds whose expenses are being reduced by the contractual expense limitations of Janus Capital, Janus Capital is subsidizing certain of these Janus Henderson Funds because they have not reached adequate scale; (2) as the assets of some of the Janus Henderson Funds have declined in the past few years, certain Janus Henderson Funds have benefited from having advisory fee rates that have remained constant rather than increasing as assets declined; (3) performance fee structures have been implemented for various Janus Henderson Funds that have caused the effective rate of advisory fees payable by such a Janus Henderson Fund to vary depending on the investment performance of the Janus Henderson Fund relative to its benchmark index over the measurement period; and (4) a few Janus Henderson Funds have fee schedules with breakpoints and reduced fee rates above certain asset levels. The Trustees also noted that the Janus Henderson Funds share directly in economies of scale through the lower charges of third-party service providers that are based in part on the combined scale of all of the Janus Henderson Funds.
The Trustees also considered the independent fee consultant’s conclusion that, given the limitations of various analytical approaches to economies of scale and their conflicting results, it is difficult to analytically confirm or deny the existence of economies of scale in the Janus Henderson complex. In this regard, the independent consultant concluded that (1) to the extent there were economies of scale at Janus Capital, Janus Capital’s general strategy of setting fixed management fees below peers appeared to share any such economies with investors even on smaller Janus Henderson Funds which have not yet achieved those economies and (2) by setting lower fixed fees from the start on these Janus Henderson Funds, Janus Capital appeared to be investing to increase the likelihood that these Janus Henderson Funds will grow to a level to achieve any scale economies that may exist. Further, the independent fee consultant provided its belief that Janus Henderson Fund investors are well-served by the fee levels and performance fee structures in place on the Janus Henderson Funds in light of any economies of scale that may be present at Janus Capital.
Based on all of the information reviewed, including the recent and past research and analysis conducted by the Trustees’ independent fee consultant, the Trustees concluded that the current fee structure of each Janus Henderson Fund was reasonable and that the current rates of fees do reflect a sharing between Janus Capital and the Janus
Janus Henderson Emerging Markets Fund
Additional Information (unaudited)
Henderson Fund of any economies of scale that may be present at the current asset level of the Janus Henderson Fund.
Other Benefits to Janus Capital
The Trustees also considered benefits that accrue to Janus Capital and its affiliates and subadvisers to the Janus Henderson Funds from their relationships with the Janus Henderson Funds. They recognized that two affiliates of Janus Capital separately serve the Janus Henderson Funds as transfer agent and distributor, respectively, and the transfer agent receives compensation directly from the non-money market funds for services provided, and that such compensation contributes to the overall profitability of Janus Capital and its affiliates that results from their relationship with the Janus Henderson Funds. The Trustees also considered Janus Capital’s past and proposed use of commissions paid by the Janus Henderson Funds on portfolio brokerage transactions to obtain proprietary and third-party research products and services benefiting the Janus Henderson Fund and/or other clients of Janus Capital and/or Janus Capital, and/or a subadviser to a Janus Henderson Fund. The Trustees concluded that Janus Capital’s and the subadvisers’ use of these types of client commission arrangements to obtain proprietary and third-party research products and services was consistent with regulatory requirements and guidelines and was likely to benefit each Janus Henderson Fund. The Trustees also concluded that, other than the services provided by Janus Capital and its affiliates and subadvisers pursuant to the agreements and the fees to be paid by each Janus Henderson Fund therefor, the Janus Henderson Funds and Janus Capital and the subadvisers may potentially benefit from their relationship with each other in other ways. They concluded that Janus Capital and its affiliates share directly in economies of scale through the lower charges of third-party service providers that are based in part on the combined scale of the Janus Henderson Funds and other clients serviced by Janus Capital and its affiliates. They also concluded that Janus Capital and/or the subadvisers benefit from the receipt of research products and services acquired through commissions paid on portfolio transactions of the Janus Henderson Funds and that the Janus Henderson Funds benefit from Janus Capital’s and/or the subadvisers’ receipt of those products and services as well as research products and services acquired through commissions paid by other clients of Janus Capital and/or other clients of the subadvisers. They further concluded that the success of any Janus Henderson Fund could attract other business to Janus Capital, the subadvisers or other Janus Henderson funds, and that the success of Janus Capital and the subadvisers could enhance Janus Capital’s and the subadvisers’ ability to serve the Janus Henderson Funds.
Approval of an Amended and Restated Investment Advisory Agreement for Janus Henderson Small-Mid Cap Value Fund (formerly, Janus Henderson Select Value Fund)
Janus Capital Management LLC (“Janus Capital”) met with the Trustees, each of whom serves as an “independent” Trustee (the “Trustees”), on December 5, 2018 and March 14, 2019, to discuss the Amended and Restated Investment Advisory Agreement (the “Amended Advisory Agreement”) for Janus Henderson Small-Mid Cap Value Fund (formerly, Janus Henderson Select Value Fund) (“Small-Mid Cap Value Fund”) and other matters related to investment strategy changes to shift the market capitalization focus of Small-Mid Cap Value Fund (the “Strategy Change”). At these meetings, the Trustees discussed the Amended Advisory Agreement and the Strategy Change with their independent counsel, separately from management. During the course of the meetings, the Trustees requested and considered such information as they deemed relevant to their deliberations. At the meeting held on March 14, 2019, the Trustees, upon the recommendation of Janus Capital, voted unanimously to approve the Amended Advisory Agreement for Small-Mid Cap Value Fund, and recommended that the Amended Advisory Agreement be submitted to shareholders for approval. The Trustees also approved matters related to the Strategy Change, effective upon approval of the Amended Advisory Agreement by the Fund’s shareholders.
In determining whether to approve the Amended Advisory Agreement, the Trustees noted their most recent consideration of Small-Mid Cap Value Fund’s current advisory agreement (the “Current Advisory Agreement”) as part of the Trustees’ annual review and consideration of whether to continue the investment advisory agreement and sub-advisory agreement, as applicable, for each Janus Henderson fund, including Small-Mid Cap Value Fund (the “Annual Review”). The Trustees noted that in connection with the Annual Review: (i) the Trustees received and reviewed information provided by Janus Capital and each sub-adviser, including Perkins Investment Management LLC (“Perkins”), in response to requests of the Trustees and their independent legal counsel, and also received and reviewed information and analysis provided by, and in response to requests of, their independent fee consultant; and (ii) throughout the Annual Review, the Trustees were advised by their independent legal counsel. The Trustees also noted that based on the Trustees’ evaluation of the information provided by Janus Capital, Perkins, and the independent fee consultant, as well as other information, the Trustees determined that the overall arrangements between Small-Mid Cap
Janus Henderson Emerging Markets Fund
Additional Information (unaudited)
Value Fund and Janus Capital and Perkins were fair and reasonable in light of the nature, extent and quality of the services provided by Janus Capital, its affiliates and Perkins, the fees charged for those services, and other matters that the Trustees considered relevant in the exercise of their business judgment, and the Trustees unanimously approved the continuation of the Current Advisory Agreement for another year.
In considering the Amended Advisory Agreement, the Trustees reviewed and analyzed various factors that they determined were relevant, including the factors described below, none of which by itself was considered dispositive. However, the material factors and conclusions that formed the basis for the Trustees’ determination to approve the Amended Advisory Agreement are discussed separately below.
· The Trustees determined that the terms of the Amended Advisory Agreement are substantially similar to those of the Current Advisory Agreement, which the Trustees recently reviewed as part of the Annual Review, and the material changes made to the Amended Advisory Agreement address the proposed change to the benchmark index and the description of the period used for calculating the performance fee in order to allow for continuity of the fee based on Small-Mid Cap Value Fund’s historical performance over a 36-month measurement period.
· As part of the Strategy Change, Small-Mid Cap Value Fund will focus its investments on common stocks of companies that are small- and mid-capitalization stocks. The Trustees determined that the proposed benchmark index, the Russell 2500TM Value Index, is more closely aligned with a small- and mid-cap stock focus than Small-Mid Cap Value Fund’s current benchmark index, the Russell 3000® Value Index.
· Under the Amended Advisory Agreement, the structure of the performance fee was not changing, other than to utilize a different benchmark and performance calculation period to implement the new benchmark over time, and that this structure had been implemented initially for Small-Mid Cap Value Fund based on analysis provided by the independent fee consultant. The Trustees considered the information provided by Janus Capital in this regard, and noted Janus Capital’s belief that this performance fee structure remained reasonable and appropriate for Small-Mid Cap Value Fund. The Trustees concluded that this performance fee structure was reasonable for Small-Mid Cap Value Fund as proposed, and also determined to seek further analysis from their independent fee consultant with respect to this matter. In this regard, Janus Capital agreed to consider further revisions to the proposed performance fee structure should that be needed based on the additional analysis provided.
· As part of the Strategy Change, Perkins will continue to provide sub-advisory services to Small-Mid Cap Value Fund, but will utilize new portfolio managers to implement Small-Mid Cap Value Fund’s focus on common stocks of companies that are small- and mid-capitalization stocks. In this regard, the Trustees noted the information provided by Janus Capital with respect to the qualifications and experience of the new portfolio managers implementing investment strategies similar to the one to be utilized by Small-Mid Cap Value Fund, and also noted that Perkins and the new portfolio managers provide sub-advisory services to other Janus Henderson funds the Trustees oversee.
· The information provided by Janus Capital with respect to (i) the impact of the Amended Advisory Agreement on the potential advisory fees to be paid by Small-Mid Cap Value Fund going forward; and (ii) the potential transaction costs and capital gains to be incurred by Small-Mid Cap Value Fund as part of the efforts to reposition Small-Mid Cap Value Fund’s portfolio to focus its investments on common stocks of companies that are small- and mid-capitalization stocks. In this regard, the Trustees noted that Small-Mid Cap Value Fund’s operating costs were not expected otherwise to materially change under the Amended Advisory Agreement.
· Janus Capital’s reasons for seeking to implement the Strategy Change, including Janus Capital’s belief that current marketplace demands for a small and mid-cap strategy, combined with Perkins’ experience in managing small- and mid-cap stocks, will provide greater opportunity for Small-Mid Cap Value Fund to grow over the long-term, and that the Strategy Change is designed to create asset growth through increased sales for Small-Mid Cap Value Fund, potentially resulting in increased operational efficiencies for Small-Mid Cap Value Fund.
· Janus Capital will pay the fees and expenses related to seeking shareholder approval of the Amended Advisory Agreement, including the costs related to the preparation and distribution of proxy materials, and all other costs incurred in connection with the solicitation of proxies.
After discussion, the Trustees determined that the overall arrangements between Small-Mid Cap Value Fund, Janus Capital, and Perkins under the Amended Advisory Agreement would continue to be fair and reasonable in light of the
Janus Henderson Emerging Markets Fund
Additional Information (unaudited)
nature, extent, and quality of the services expected to be provided by Janus Capital, its affiliates, and Perkins following the Strategy Change.
Janus Henderson Emerging Markets Fund
Useful Information About Your Fund Report (unaudited)
Management Commentary
The Management Commentary in this report includes valuable insight as well as statistical information to help you understand how your Fund’s performance and characteristics stack up against those of comparable indices.
If the Fund invests in foreign securities, this report may include information about country exposure. Country exposure is based primarily on the country of risk. A company may be allocated to a country based on other factors such as location of the company’s principal office, the location of the principal trading market for the company’s securities, or the country where a majority of the company’s revenues are derived.
Please keep in mind that the opinions expressed in the Management Commentary are just that: opinions. They are a reflection based on best judgment at the time this report was compiled, which was March 31, 2020. As the investing environment changes, so could opinions. These views are unique and are not necessarily shared by fellow employees or by Janus Henderson in general.
Performance Overviews
Performance overview graphs compare the performance of a hypothetical $10,000 investment in the Fund with one or more widely used market indices. When comparing the performance of the Fund with an index, keep in mind that market indices are not available for investment and do not reflect deduction of expenses.
Average annual total returns are quoted for a Fund with more than one year of performance history. Average annual total return is calculated by taking the growth or decline in value of an investment over a period of time, including reinvestment of dividends and distributions, then calculating the annual compounded percentage rate that would have produced the same result had the rate of growth been constant throughout the period. Average annual total return does not reflect the deduction of taxes that a shareholder would pay on Fund distributions or redemptions of Fund shares.
Cumulative total returns are quoted for a Fund with less than one year of performance history. Cumulative total return is the growth or decline in value of an investment over time, independent of the period of time involved. Cumulative total return does not reflect the deduction of taxes that a shareholder would pay on Fund distributions or redemptions of Fund shares.
Pursuant to federal securities rules, expense ratios shown in the performance chart reflect subsidized (if applicable) and unsubsidized ratios. The total annual fund operating expenses ratio is gross of any fee waivers, reflecting the Fund’s unsubsidized expense ratio. The net annual fund operating expenses ratio (if applicable) includes contractual waivers of Janus Capital and reflects the Fund’s subsidized expense ratio. Ratios may be higher or lower than those shown in the “Financial Highlights” in this report.
Schedule of Investments
Following the performance overview section is the Fund’s Schedule of Investments. This schedule reports the types of securities held in the Fund on the last day of the reporting period. Securities are usually listed by type (common stock, corporate bonds, U.S. Government obligations, etc.) and by industry classification (banking, communications, insurance, etc.). Holdings are subject to change without notice.
The value of each security is quoted as of the last day of the reporting period. The value of securities denominated in foreign currencies is converted into U.S. dollars.
If the Fund invests in foreign securities, it will also provide a summary of investments by country. This summary reports the Fund exposure to different countries by providing the percentage of securities invested in each country. The country of each security represents the country of risk. The Fund’s Schedule of Investments relies upon the industry group and country classifications published by Barclays and/or MSCI Inc.
Tables listing details of individual forward currency contracts, futures, written options, swaptions, and swaps follow the Fund’s Schedule of Investments (if applicable).
Statement of Assets and Liabilities
This statement is often referred to as the “balance sheet.” It lists the assets and liabilities of the Fund on the last day of the reporting period.
Janus Henderson Emerging Markets Fund
Useful Information About Your Fund Report (unaudited)
The Fund’s assets are calculated by adding the value of the securities owned, the receivable for securities sold but not yet settled, the receivable for dividends declared but not yet received on securities owned, and the receivable for Fund shares sold to investors but not yet settled. The Fund’s liabilities include payables for securities purchased but not yet settled, Fund shares redeemed but not yet paid, and expenses owed but not yet paid. Additionally, there may be other assets and liabilities such as unrealized gain or loss on forward currency contracts.
The section entitled “Net Assets Consist of” breaks down the components of the Fund’s net assets. Because the Fund must distribute substantially all earnings, you will notice that a significant portion of net assets is shareholder capital.
The last section of this statement reports the net asset value (“NAV”) per share on the last day of the reporting period. The NAV is calculated by dividing the Fund’s net assets for each share class (assets minus liabilities) by the number of shares outstanding.
Statement of Operations
This statement details the Fund’s income, expenses, realized gains and losses on securities and currency transactions, and changes in unrealized appreciation or depreciation of Fund holdings.
The first section in this statement, entitled “Investment Income,” reports the dividends earned from securities and interest earned from interest-bearing securities in the Fund.
The next section reports the expenses incurred by the Fund, including the advisory fee paid to the investment adviser, transfer agent fees and expenses, and printing and postage for mailing statements, financial reports and prospectuses. Expense offsets and expense reimbursements, if any, are also shown.
The last section lists the amounts of realized gains or losses from investment and foreign currency transactions, and changes in unrealized appreciation or depreciation of investments and foreign currency-denominated assets and liabilities. The Fund will realize a gain (or loss) when it sells its position in a particular security. A change in unrealized gain (or loss) refers to the change in net appreciation or depreciation of the Fund during the reporting period. “Net Realized and Unrealized Gain/(Loss) on Investments” is affected both by changes in the market value of Fund holdings and by gains (or losses) realized during the reporting period.
Statements of Changes in Net Assets
These statements report the increase or decrease in the Fund’s net assets during the reporting period. Changes in the Fund’s net assets are attributable to investment operations, dividends and distributions to investors, and capital share transactions. This is important to investors because it shows exactly what caused the Fund’s net asset size to change during the period.
The first section summarizes the information from the Statement of Operations regarding changes in net assets due to the Fund’s investment operations. The Fund’s net assets may also change as a result of dividend and capital gains distributions to investors. If investors receive their dividends and/or distributions in cash, money is taken out of the Fund to pay the dividend and/or distribution. If investors reinvest their dividends and/or distributions, the Fund’s net assets will not be affected. If you compare the Fund’s “Net Decrease from Dividends and Distributions” to “Reinvested Dividends and Distributions,” you will notice that dividends and distributions have little effect on the Fund’s net assets. This is because the majority of the Fund’s investors reinvest their dividends and/or distributions.
The reinvestment of dividends and distributions is included under “Capital Share Transactions.” “Capital Shares” refers to the money investors contribute to the Fund through purchases or withdrawals via redemptions. The Fund’s net assets will increase and decrease in value as investors purchase and redeem shares from the Fund.
Financial Highlights
This schedule provides a per-share breakdown of the components that affect the Fund’s NAV for current and past reporting periods as well as total return, asset size, ratios, and portfolio turnover rate.
The first line in the table reflects the NAV per share at the beginning of the reporting period. The next line reports the net investment income/(loss) per share. Following is the per share total of net gains/(losses), realized and unrealized. Per share dividends and distributions to investors are then subtracted to arrive at the NAV per share at the end of the period. The next line reflects the total return for the period. The total return may include adjustments in accordance with generally accepted accounting principles required at the period end for financial reporting purposes. As a result, the
Janus Henderson Emerging Markets Fund
Useful Information About Your Fund Report (unaudited)
total return may differ from the total return reflected for individual shareholder transactions. Also included are ratios of expenses and net investment income to average net assets.
The Fund’s expenses may be reduced through expense offsets and expense reimbursements. The ratios shown reflect expenses before and after any such offsets and reimbursements.
The ratio of net investment income/(loss) summarizes the income earned less expenses, divided by the average net assets of the Fund during the reporting period. Do not confuse this ratio with the Fund’s yield. The net investment income ratio is not a true measure of the Fund’s yield because it does not take into account the dividends distributed to the Fund’s investors.
The next figure is the portfolio turnover rate, which measures the buying and selling activity in the Fund. Portfolio turnover is affected by market conditions, changes in the asset size of the Fund, fluctuating volume of shareholder purchase and redemption orders, the nature of the Fund’s investments, and the investment style and/or outlook of the portfolio manager(s) and/or investment personnel. A 100% rate implies that an amount equal to the value of the entire portfolio was replaced once during the fiscal year; a 50% rate means that an amount equal to the value of half the portfolio is traded in a year; and a 200% rate means that an amount equal to the value of the entire portfolio is traded every six months.
Janus Henderson Emerging Markets Fund
Notes
NotesPage1
Knowledge. Shared
At Janus Henderson, we believe in the sharing of expert insight for better investment and business decisions. We call this ethos Knowledge. Shared.
Learn more by visiting janushenderson.com.
| | | | | | | | | |
| | | | | |

| | | | |
This report is submitted for the general information of shareholders of the Fund. It is not an offer or solicitation for the Fund and is not authorized for distribution to prospective investors unless preceded or accompanied by an effective prospectus. |
Janus Henderson, Janus, Henderson, Perkins, Intech and Knowledge. Shared are trademarks of Janus Henderson Group plc or one of its subsidiaries. © Janus Henderson Group plc. Janus Henderson Distributors |
| | | | | 125-24-93079 05-20 |
| | | | |
| | | |
| | | SEMIANNUAL REPORT March 31, 2020 |
| | |
| | Janus Henderson Enterprise Fund |
| | |
| | Janus Investment Fund |
Beginning on January 1, 2021, as permitted by regulations adopted by the Securities and Exchange Commission, paper copies of the Fund’s shareholder reports will no longer be sent by mail, unless you specifically request paper copies of the reports from the Fund or your plan sponsor, broker-dealer, or financial intermediary, or if you invest directly with the Fund, by contacting a Janus Henderson representative. Instead, the reports will be made available on a website, and you will be notified by mail each time a report is posted and provided with a website link to access the report. If you already elected to receive shareholder reports electronically, you will not be affected by this change and you need not take any action. You may elect to receive shareholder reports and other communications from the Fund electronically by contacting your plan sponsor, broker-dealer, or financial intermediary, or if you invest directly with the Fund, by visiting janushenderson.com/edelivery. You may elect to receive all future reports in paper free of charge. If you do not invest directly with the Fund, you should contact your plan sponsor, broker-dealer, or financial intermediary, to request to continue receiving paper copies of your shareholder reports. If you invest directly with the Fund, you can call 1-800-525-3713 to let the Fund know that you wish to continue receiving paper copies of your shareholder reports. Your election to receive reports in paper will apply to all Janus Henderson mutual funds where held (i.e., all Janus Henderson mutual funds held in your account if you invest through your financial intermediary or all Janus Henderson mutual funds held with the fund complex if you invest directly with a fund). |
| | | HIGHLIGHTS · Portfolio management perspective · Investment strategy behind your fund · Fund performance, characteristics
and holdings |
| | | |
| | | 
|
Table of Contents
Janus Henderson Enterprise Fund
Janus Henderson Enterprise Fund (unaudited)(closed to certain new investors)
| | | | | | |
FUND SNAPSHOT We believe investing in companies with sustainable growth and high return on invested capital can drive consistent returns and allow us to outperform our benchmark and peers over time with moderate risk. We seek to identify mid-cap companies with high-quality management teams that wisely allocate capital to fund and drive growth over time. | | | | 
Brian Demain co-portfolio manager | 
Cody Wheaton co-portfolio manager |
| | | |
PERFORMANCE OVERVIEW
The Janus Henderson Enterprise Fund’s Class I Shares returned -19.55% over the six-month period ended March 31, 2020. The Fund’s benchmark, the Russell Midcap® Growth Index, returned -13.50%.
INVESTMENT ENVIRONMENT
Equities generated strong gains in late 2019. A benign interest rate environment, progress in U.S.-China trade relations and a strong consumer provided a positive backdrop for U.S. equities. However, U.S. stocks faced an unprecedented sell-off in 2020, with speed and magnitude of historic proportions. The exogenous shock of the COVID-19 coronavirus ushered in a period of severe economic uncertainty and market volatility as governments around the world restricted travel, business and social activity to help contain the virus. Contributing to the malaise was a collapse in oil prices when a virus-related drop in demand was met by a flood of supply after OPEC and Russia failed to agree on production cutbacks. Central bank and government stimulus action was swift and aggressive. The Federal Reserve (Fed) cut policy rates to zero, committed to open-ended quantitative easing and introduced programs to support bond market liquidity while Congress approved over $2 trillion in crisis support to consumers and small and large businesses. The historic March market decline erased earlier market gains, and stocks ended the six-month period sharply lower.
PERFORMANCE DISCUSSION
The Fund underperformed its benchmark, the Russell Midcap Growth Index, due largely to weak stock selection in several sectors, including information technology and health care. We are disappointed that our disciplined investment approach and our focus on resilient business models did not better insulate our performance from recent market volatility. In part this was due to the unique nature of the COVID-19 pandemic, which has impacted certain sectors and companies that usually would be shielded from the effects of a traditional economic downturn. Our relative performance was also hindered by our cautious approach to higher-valuation, higher-risk stocks in sectors such as biotechnology and Software as a Service. We have believed for some time that these companies, many of which remain unprofitable, were trading at unsustainably high valuations. Yet these momentum-driven stocks outperformed, not only in the fourth quarter of 2019 but even through the sharp market sell-off in February and March of 2020, a development we would not have expected in a typical recession. Some of these companies were viewed to be direct beneficiaries of the COVID-19 crisis, while others were perceived to be better suited to an increasingly virtual economy. While we appreciate the fundamental outlook for many of these businesses, we continue to believe their valuations are unsustainable.
The steep drop in the price of oil also hurt stock performance for several holdings. These included Magellan Midstream, which owns and operates pipelines that transport crude oil and finished fuels to end markets in the U.S. We like Magellan because in our view its business is much more sensitive to historically stable crude volumes than to historically volatile crude prices. However, a severe and unprecedented drop in miles driven slashed fuel demand, as stay-at-home directives have kept cars off the roads. Despite near-term uncertainty for Magellan’s business, we believe miles driven will eventually normalize, and we have confidence that the company’s strong balance sheet and take-or-pay contracts will help it navigate this period of near-term uncertainty. We continue to hold the position.
Lower oil prices also pressured the stock of payment processing company WEX. This company markets fuel payment cards that trucking companies can use to manage fuel expenses. Returns on this business have been squeezed by lower fuel prices. Additionally, the company is acquiring a travel processing business that
Janus Henderson Enterprise Fund (unaudited)(closed to certain new investors)
now faces near-term uncertainty due to the COVID-19 travel restrictions. As a result, the stock declined.
Positive contributors included companies that either operate in a more virtual arena or have subscription-based business models and recurring revenue streams. NICE Systems provides technology solutions enabling businesses to improve customer service, fight fraud and ensure compliance. In our view, NICE is well positioned to help businesses use software and data analytics to virtualize business operations while its solid recurring revenues may cushion near-term financial performance.
Recurring revenues also benefited long-term holding Crown Castle, another top contributor. Crown Castle owns cell phone towers where telecommunication carriers house their equipment. The demand for bandwidth and rollout of advanced 4G and 5G communications is increasing investment in telecommunications infrastructure, supporting Crown Castle’s business.
DERIVATIVES USE
To the extent we invest in foreign holdings, we may use forward exchange contracts to hedge the foreign currency. During the period, our aggregate derivative positions contributed to relative results. (Please see “Notes to Financial Statements” for information about the derivatives used by the Fund.)
OUTLOOK
Looking ahead, we caution that markets could remain volatile as investors try to assess the likely progression and severity of the pandemic and associated economic fallout as well as the ability of governments and health systems to cope. While we are aware of near-term risks, we believe our competitive advantage lies in our low portfolio turnover and our long-term time horizon. We remain focused on identifying companies we believe will thrive over a three- to five-year period, well beyond this crisis, and are on the lookout for new investment opportunities this volatility may create.
At the same time, we recognize the near-term challenges many companies face, and we have redoubled our efforts to stress test our investments. Our aim is to maximize potential return while minimizing risk across several vectors, including the durability of balance sheets and the resilience of financial performance and business operations. We are also considering how suited business models might be to what the economy may look like on the other end of this crisis. We are looking for companies that are tennis balls and not eggs — meaning they can bounce back from adversity due to strength in their business models, balance sheets and competitive advantages. This is the best path we see to pursue long-term risk-adjusted returns for our investors.
Janus Henderson Enterprise Fund (unaudited)(closed to certain new investors)
Fund At A Glance
March 31, 2020
| | | | | | | | | | |
| | | | | | | | | |
| | | | | | | | | |
| | | | | | | | | |
| 5 Top Contributors - Holdings | 5 Top Detractors - Holdings |
| | Average
Weight | | Relative
Contribution | | | Average
Weight | | Relative
Contribution |
| Crown Castle International Corp | 1.76% | | 0.32% | | Cimpress PLC | 1.15% | | -0.62% |
| Nice Ltd (ADR) | 2.25% | | 0.28% | | Magellan Midstream Partners LP | 1.66% | | -0.54% |
| Catalent Inc | 1.03% | | 0.22% | | WEX Inc | 1.71% | | -0.54% |
| ICU Medical Inc | 0.62% | | 0.21% | | Gildan Activewear Inc | 0.80% | | -0.54% |
| STERIS PLC | 1.61% | | 0.17% | | Norwegian Cruise Line Holdings Ltd | 0.81% | | -0.51% |
| | | | | | | |
| 5 Top Contributors - Sectors* | | | | | |
| | | Relative | | Fund | Russell Midcap Growth Index |
| | | Contribution | | Average Weight | Average Weight |
| Other** | | 1.09% | | 6.70% | 0.00% |
| Communication Services | | 0.57% | | 0.93% | 4.76% |
| Utilities | | -0.01% | | 0.02% | 0.00% |
| Energy | | -0.10% | | 1.66% | 1.13% |
| Real Estate | | -0.13% | | 3.35% | 2.85% |
| | | | | | |
| | | | | | |
| 5 Top Detractors - Sectors* | | | | | |
| | | Relative | | Fund | Russell Midcap Growth Index |
| | | Contribution | | Average Weight | Average Weight |
| Information Technology | | -3.00% | | 32.58% | 33.96% |
| Health Care | | -1.45% | | 16.84% | 15.23% |
| Consumer Discretionary | | -1.28% | | 7.31% | 14.53% |
| Financials | | -0.72% | | 11.85% | 4.45% |
| Industrials | | -0.58% | | 17.67% | 17.05% |
| | | | | | | |
| Relative contribution reflects how the portolio's holdings impacted return relative to the benchmark. Cash and securities not held in the portfolio are not shown. For equity portfolios, relative contribution compares the performance of a security in the portfolio to the benchmark's total return, factoring in the difference in weight of that security in the benchmark. Returns are calculated using daily returns and previous day ending weights rolled up by ticker, excluding fixed income securities, gross of advisory fees, may exclude certain derivatives and will differ from actual performance.
Performance attribution reflects returns gross of advisory fees and may differ from actual returns as they are based on end of day holdings. Attribution is calculated by geometrically linking daily returns for the portfolio and index. |
* | Based on sector classification according to the Global Industry Classification Standard (“GICS”) codes, which are the exclusive property and a service mark of MSCI Inc. and Standard & Poor’s. |
** | Not a GICS classified sector. |
Janus Henderson Enterprise Fund (unaudited)(closed to certain new investors)
Fund At A Glance
March 31, 2020
| | |
5 Largest Equity Holdings - (% of Net Assets) |
Constellation Software Inc/Canada | |
Software | 2.7% |
Nice Ltd (ADR) | |
Software | 2.6% |
Aon PLC | |
Insurance | 2.3% |
Crown Castle International Corp | |
Equity Real Estate Investment Trusts (REITs) | 2.3% |
Global Payments Inc | |
Information Technology Services | 2.3% |
| | 12.2% |
| | | | | | |
Asset Allocation - (% of Net Assets) |
Common Stocks | | 94.1% |
Investment Companies | | 5.6% |
Investments Purchased with Cash Collateral from Securities Lending | | 0.9% |
Limited Partnership Interests | | 0.3% |
Other | | (0.9)% |
| | | 100.0% |
| | |
Top Country Allocations - Long Positions - (% of Investment Securities) |
As of March 31, 2020 
| As of September 30, 2019 
|
Janus Henderson Enterprise Fund (unaudited)(closed to certain new investors)
Performance
| |
See important disclosures on the next page. |
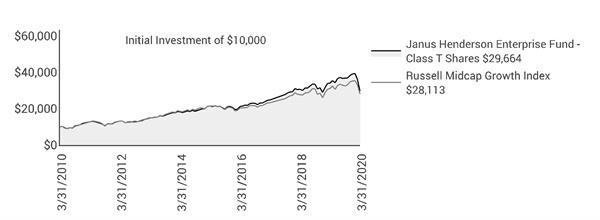
| | | | | | | | | | | |
| | | | | | | | | | |
| | | | | | | | | | | |
Average Annual Total Return - for the periods ended March 31, 2020 | | | Expense Ratios |
| | Fiscal
Year-to-Date | One
Year | Five
Year | Ten
Year | Since
Inception* | | | Total Annual Fund
Operating Expenses‡ |
Class A Shares at NAV(1) | | -19.70% | -13.14% | 6.50% | 11.26% | 10.13% | | | 1.16% |
Class A Shares at MOP(1) | | -24.32% | -18.13% | 5.25% | 10.60% | 9.89% | | | |
Class C Shares at NAV(1) | | -19.93% | -13.63% | 5.86% | 10.52% | 9.36% | | | 1.74% |
Class C Shares at CDSC(1) | | -20.69% | -14.46% | 5.86% | 10.52% | 9.36% | | | |
Class D Shares(1) | | -19.57% | -12.87% | 6.83% | 11.58% | 10.28% | | | 0.81% |
Class I Shares(1) | | -19.55% | -12.83% | 6.89% | 11.67% | 10.31% | | | 0.75% |
Class N Shares(1) | | -19.51% | -12.74% | 6.99% | 11.70% | 10.32% | | | 0.66% |
Class R Shares(1) | | -19.82% | -13.40% | 6.19% | 10.93% | 9.75% | | | 1.41% |
Class S Shares(1) | | -19.71% | -13.18% | 6.46% | 11.21% | 10.01% | | | 1.16% |
Class T Shares(1) | | -19.61% | -12.95% | 6.73% | 11.49% | 10.24% | | | 0.91% |
Russell Midcap Growth Index | | -13.50% | -9.45% | 5.61% | 10.89% | 9.51% | | | |
Morningstar Quartile - Class T Shares | | - | 3rd | 1st | 1st | 2nd | | | |
Morningstar Ranking - based on total returns for Mid-Cap Growth Funds | | - | 443/618 | 119/564 | 86/514 | 45/136 | | | |
Returns quoted are past performance and do not guarantee future results; current performance may be lower or higher. Investment returns and principal value will vary; there may be a gain or loss when shares are sold. For the most recent month-end performance call 800.668.0434 (or 800.525.3713 if you hold shares directly with Janus Henderson) or visit janushenderson.com/performance (or janushenderson.com/allfunds if you hold shares directly with Janus Henderson).
Maximum Offering Price (MOP) returns include the maximum sales charge of 5.75%. Net Asset Value (NAV) returns exclude this charge, which would have reduced returns.
CDSC returns include a 1% contingent deferred sales charge (CDSC) on Shares redeemed within 12 months of purchase. Net Asset Value (NAV) returns exclude this charge, which would have reduced returns.
Performance may be affected by risks that include those associated with non-diversification, portfolio turnover, short sales, potential conflicts of interest, foreign and emerging markets, initial public offerings (IPOs), high-yield and high-risk securities, undervalued, overlooked and smaller capitalization companies, real estate related securities including Real Estate Investment Trusts (REITs), derivatives, and commodity-linked investments. Each product has different risks. Please see the prospectus for more information about risks, holdings and other details.
Janus Henderson Enterprise Fund (unaudited)(closed to certain new investors)
Performance
Returns include reinvestment of all dividends and distributions and do not reflect the deduction of taxes that a shareholder would pay on Fund distributions or redemptions of Fund shares. The returns do not include adjustments in accordance with generally accepted accounting principles required at the period end for financial reporting purposes.
Class A Shares, Class C Shares, Class R Shares, and Class S Shares commenced operations on July 6, 2009. Performance shown for each class for periods prior to July 6, 2009, reflects the performance of the Fund’s Class J Shares, the initial share class (renamed Class T Shares effective February 16, 2010), calculated using the fees and expenses of each respective class, without the effect of any fee and expense limitations or waivers.
Class D Shares commenced operations on February 16, 2010. Performance shown for periods prior to February 16, 2010, reflects the performance of the Fund’s former Class J Shares, calculated using the fees and expenses in effect during the periods shown, net of any applicable fee and expense limitations or waivers.
Class I Shares commenced operations on July 6, 2009. Performance shown for periods prior to July 6, 2009, reflects the performance of the Fund’s former Class J Shares, calculated using the fees and expenses of Class J Shares, net of any applicable fee and expense limitations or waivers.
Class N Shares commenced operations on July 12, 2012. Performance shown for periods prior to July 12, 2012, reflects the performance of the Fund's Class T Shares, calculated using the fees and expenses of Class T Shares, net of any applicable fee and expense limitations or waivers.
If each share class of the Fund had been available during periods prior to its commencement, the performance shown may have been different. The performance shown for periods following the Fund’s commencement of each share class reflects the fees and expenses of each respective share class, net of any applicable fee and expense limitations or waivers. Please refer to the Fund’s prospectuses for further details concerning historical performance.
Ranking is for the share class shown only; other classes may have different performance characteristics. When an expense waiver is in effect, it may have a material effect on the total return, and therefore the ranking for the period.
© 2020 Morningstar, Inc. All Rights Reserved.
There is no assurance that the investment process will consistently lead to successful investing.
See Notes to Schedule of Investments and Other Information for index definitions.
Index performance does not reflect the expenses of managing a portfolio as an index is unmanaged and not available for direct investment.
See “Useful Information About Your Fund Report.”
*The Fund’s inception date – September 1, 1992
‡ As stated in the prospectus. See Financial Highlights for actual expense ratios during the reporting period.
(1) Closed to certain new investors.
Janus Henderson Enterprise Fund (unaudited)(closed to certain new investors)
Expense Examples
As a shareholder of the Fund, you incur two types of costs: (1) transaction costs, such as sales charges (loads) on purchase payments (applicable to Class A Shares only); and (2) ongoing costs, including management fees; 12b-1 distribution and shareholder servicing fees; transfer agent fees and expenses payable pursuant to the Transfer Agency Agreement; and other Fund expenses. This example is intended to help you understand your ongoing costs (in dollars) of investing in the Fund and to compare these costs with the ongoing costs of investing in other mutual funds. To do so, compare this 5% hypothetical example with the 5% hypothetical examples that appear in the shareholder reports of the other funds. The example is based upon an investment of $1,000 invested at the beginning of the period and held for the six-months indicated, unless noted otherwise in the table and footnotes below.
Actual Expenses
The information in the table under the heading “Actual” provides information about actual account values and actual expenses. You may use the information in these columns, together with the amount you invested, to estimate the expenses that you paid over the period. Simply divide your account value by $1,000 (for example, an $8,600 account value divided by $1,000 = 8.6), then multiply the result by the number in the appropriate column for your share class under the heading entitled “Expenses Paid During Period” to estimate the expenses you paid on your account during the period.
Hypothetical Example for Comparison Purposes
The information in the table under the heading “Hypothetical (5% return before expenses)” provides information about hypothetical account values and hypothetical expenses based upon the Fund’s actual expense ratio and an assumed rate of return of 5% per year before expenses, which is not the Fund’s actual return. The hypothetical account values and expenses may not be used to estimate the actual ending account balance or expenses you paid for the period. You may use this information to compare the ongoing costs of investing in the Fund and other funds. To do so, compare this 5% hypothetical example with the 5% hypothetical examples that appear in the shareholder reports of the other funds. Additionally, for an analysis of the fees associated with an investment in any share class or other similar funds, please visit www.finra.org/fundanalyzer.
Please note that the expenses shown in the table are meant to highlight your ongoing costs only and do not reflect any transaction costs. These fees are fully described in the Fund’s prospectuses. Therefore, the hypothetical examples are useful in comparing ongoing costs only, and will not help you determine the relative total costs of owning different funds. In addition, if these transaction costs were included, your costs would have been higher.
| | | | | | | | | | | |
| | | | | | | | | |
| | | | Actual | | Hypothetical
(5% return before expenses) | |
| Beginning
Account
Value
(10/1/19) | Ending
Account
Value
(3/31/20) | Expenses
Paid During
Period
(10/1/19 - 3/31/20)† | | Beginning
Account
Value
(10/1/19) | Ending
Account
Value
(3/31/20) | Expenses
Paid During
Period
(10/1/19 - 3/31/20)† | Net Annualized
Expense Ratio
(10/1/19 - 3/31/20) |
Class A Shares | $1,000.00 | $803.00 | $5.14 | | $1,000.00 | $1,019.30 | $5.76 | 1.14% |
Class C Shares | $1,000.00 | $800.70 | $7.52 | | $1,000.00 | $1,016.65 | $8.42 | 1.67% |
Class D Shares | $1,000.00 | $804.30 | $3.61 | | $1,000.00 | $1,021.00 | $4.04 | 0.80% |
Class I Shares | $1,000.00 | $804.50 | $3.38 | | $1,000.00 | $1,021.25 | $3.79 | 0.75% |
Class N Shares | $1,000.00 | $804.90 | $2.98 | | $1,000.00 | $1,021.70 | $3.34 | 0.66% |
Class R Shares | $1,000.00 | $801.80 | $6.35 | | $1,000.00 | $1,017.95 | $7.11 | 1.41% |
Class S Shares | $1,000.00 | $802.90 | $5.23 | | $1,000.00 | $1,019.20 | $5.86 | 1.16% |
Class T Shares | $1,000.00 | $803.90 | $4.06 | | $1,000.00 | $1,020.50 | $4.55 | 0.90% |
† | Expenses Paid During Period are equal to the Net Annualized Expense Ratio multiplied by the average account value over the period, multiplied by 183/366 (to reflect the one-half year period). Expenses in the examples include the effect of applicable fee waivers and/or expense reimbursements, if any. Had such waivers and/or reimbursements not been in effect, your expenses would have been higher. Please refer to the Notes to Financial Statements or the Fund’s prospectuses for more information regarding waivers and/or reimbursements. |
Janus Henderson Enterprise Fund
Schedule of Investments (unaudited)
March 31, 2020