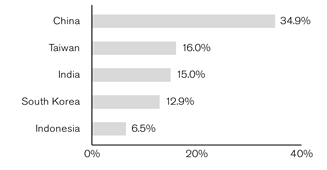
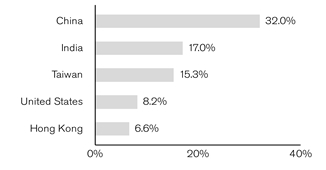
Emerging markets comprised 91.9% of total net assets.
Returns quoted are past performance and do not guarantee future results; current performance may be lower or higher. Investment returns and principal value will vary; there may be a gain or loss when shares are sold. For the most recent month-end performance call 800.668.0434 (or 800.525.3713 if you hold shares directly with Janus Henderson) or visit janushenderson.com/performance (or janushenderson.com/allfunds if you hold shares directly with Janus Henderson).
Maximum Offering Price (MOP) returns include the maximum sales charge of 5.75%. Net Asset Value (NAV) returns exclude this charge, which would have reduced returns.
CDSC returns include a 1% contingent deferred sales charge (CDSC) on Shares redeemed within 12 months of purchase. Net Asset Value (NAV) returns exclude this charge, which would have reduced returns.
This Fund has a performance-based management fee that may adjust up or down based on the Fund’s performance.
Performance may be affected by risks that include those associated with foreign and emerging markets, fixed income securities, high-yield and high-risk securities, undervalued, overlooked and smaller capitalization companies, real estate related securities including Real Estate Investment Trusts (REITs), Environmental, Social and Governance (ESG) factors, non-diversification, portfolio turnover, derivatives, short sales, initial public offerings (IPOs) and potential conflicts of interest. Each product has different risks. Please see the prospectus for more information about risks, holdings and other details.
Returns include reinvestment of all dividends and distributions and do not reflect the deduction of taxes that a shareholder would pay on Fund distributions or redemptions of Fund shares. The returns do not include adjustments in accordance with generally accepted accounting principles required at the period end for financial reporting purposes.
Class N Shares commenced operations on January 26, 2018. Performance shown for periods prior to January 26, 2018, reflects the historical performance of the Fund's Class I Shares, calculated using the fees and expenses of Class N Shares, without the effect of any fee and expense limitations or waivers.
If Class N Shares of the Fund had been available during periods prior to January 26, 2018, the performance shown may have been different. The performance shown for periods following the Fund's commencement of Class N Shares reflects the fees and expenses of Class N Shares, net of any applicable fee and expense limitations or waivers. Please refer to the Fund's prospectuses for further details concerning historical performance.
Ranking is for the share class shown only; other classes may have different performance characteristics. When an expense waiver is in effect, it may have a material effect on the total return, and therefore the ranking for the period.
© 2023 Morningstar, Inc. All Rights Reserved.
There is no assurance that the investment process will consistently lead to successful investing.
See Notes to Schedule of Investments and Other Information for index definitions.
Index performance does not reflect the expenses of managing a portfolio as an index is unmanaged and not available for direct investment.
‡ As stated in the prospectus. See Financial Highlights for actual expense ratios during the reporting period.
As a shareholder of the Fund, you incur two types of costs: (1) transaction costs, such as sales charges (loads) on purchase payments (applicable to Class A Shares only); and (2) ongoing costs, including management fees; 12b-1 distribution and shareholder servicing fees; transfer agent fees and expenses payable pursuant to the Transfer Agency Agreement; and other Fund expenses. This example is intended to help you understand your ongoing costs (in dollars) of investing in the Fund and to compare these costs with the ongoing costs of investing in other mutual funds. To do so, compare this 5% hypothetical example with the 5% hypothetical examples that appear in the shareholder reports of the other funds. The example is based upon an investment of $1,000 invested at the beginning of the period and held for the six-months indicated, unless noted otherwise in the table and footnotes below.
The information in the table under the heading “Actual” provides information about actual account values and actual expenses. You may use the information in these columns, together with the amount you invested, to estimate the expenses that you paid over the period. Simply divide your account value by $1,000 (for example, an $8,600 account value divided by $1,000 = 8.6), then multiply the result by the number in the appropriate column for your share class under the heading entitled “Expenses Paid During Period” to estimate the expenses you paid on your account during the period.
The information in the table under the heading “Hypothetical (5% return before expenses)” provides information about hypothetical account values and hypothetical expenses based upon the Fund’s actual expense ratio and an assumed rate of return of 5% per year before expenses, which is not the Fund’s actual return. The hypothetical account values and expenses may not be used to estimate the actual ending account balance or expenses you paid for the period. You may use this information to compare the ongoing costs of investing in the Fund and other funds. To do so, compare this 5% hypothetical example with the 5% hypothetical examples that appear in the shareholder reports of the other funds. Additionally, for an analysis of the fees associated with an investment in any share class or other similar funds, please visit www.finra.org/fundanalyzer.
Please note that the expenses shown in the table are meant to highlight your ongoing costs only and do not reflect any transaction costs. These fees are fully described in the Fund’s prospectuses. Therefore, the hypothetical examples are useful in comparing ongoing costs only, and will not help you determine the relative total costs of owning different funds. In addition, if these transaction costs were included, your costs would have been higher.
Janus Henderson Asia Equity Fund (the “Fund”) is a series of Janus Investment Fund (the “Trust”), which is organized as a Massachusetts business trust and is registered under the Investment Company Act of 1940, as amended (the “1940 Act”), as an open-end management investment company, and therefore has applied the specialized accounting and reporting guidance in Financial Accounting Standards Board (“FASB”) Accounting Standards Codification (“ASC”) Topic 946. The Trust offers 40 funds, each of which offers multiple share classes, with differing investment objectives and policies. The Fund seeks long-term growth of capital. The Fund is classified as diversified, as defined in the 1940 Act. Janus Henderson Investors US LLC is the investment adviser (the “Adviser”) to the Fund.
The Fund offers multiple classes of shares in order to meet the needs of various types of investors. Each class represents an interest in the same portfolio of investments. Certain financial intermediaries may not offer all classes of shares.
Shareholders, including individuals, accounts, as well as the Fund’s portfolio manager(s) and/or investment personnel, may from time to time own (beneficially or of record) a significant percentage of the Fund’s Shares and can be considered to “control” the Fund when that ownership exceeds 25% of the Fund’s assets (and which may differ from control as determined in accordance with United States of America generally accepted accounting principles ("US GAAP")).
Class A Shares are offered through financial intermediary platforms including, but not limited to, traditional brokerage platforms, mutual fund wrap fee programs, bank trust platforms, and retirement platforms.
Class C Shares are offered through financial intermediary platforms including, but not limited to, traditional brokerage platforms, mutual fund wrap fee programs, and bank trust platforms.
Class C Shares are closed to investments by new employer-sponsored retirement plans and existing employer-sponsored retirement plans are no longer able to make additional purchases or exchanges into Class C Shares.
The Fund currently implements an automatic conversion feature pursuant to which Class C Shares that have been held for eight years are automatically converted to Class A Shares without the imposition of any sales charge, fee or other charge. The conversion will generally occur no later than ten business days in the month following the month of the eighth anniversary of the date of purchase. Class C Shares purchased through the reinvestment of dividends and other distributions on Class C Shares will convert to Class A Shares at the same time as the original Class C Shares with respect to which they were purchased. For Class C Shares held in omnibus accounts on intermediary platforms, the Fund relies on these intermediaries to implement this conversion feature. Your financial intermediary may have separate policies and procedures as to when and how Class C Shares may be converted to Class A Shares.
Effective July 6, 2020, Class D Shares are available to new investors, subject to any closed fund policies for a Fund, as applicable. Previously, Class D Shares were only available to investors who already had a direct account with the Janus Henderson funds; immediate family members or members of the same household of an eligible individual investor; and existing beneficial owners of sole proprietorships or partnerships that hold accounts directly with the Janus Henderson funds.
Class I Shares are available through certain financial intermediary platforms including, but not limited to, mutual fund wrap fee programs, managed account programs, asset allocation programs, bank trust platforms, as well as certain retirement platforms. Class I Shares are also available to certain direct institutional investors including, but not limited to, corporations, certain retirement plans, public plans, and foundations/endowments, who established Class I Share accounts before August 4, 2017.
Class N Shares are generally available only to financial intermediaries purchasing on behalf of: 1) certain adviser-assisted, employer-sponsored retirement plans, including 401(k) plans, 457 plans, 403(b) plans, Taft-Hartley multi-employer plans, profit-sharing and money purchase pension plans, defined benefit plans and certain welfare benefit plans, such as health savings accounts, and nonqualified deferred compensation plans; and 2) retail investors purchasing in qualified or nonqualified accounts, whose accounts are held through an omnibus account at their financial intermediary, and where the financial intermediary requires no payment or reimbursement from the Fund, the Adviser, or its affiliates. Class N Shares are also available to Janus Henderson proprietary products and to certain direct institutional investors approved by Janus Henderson Distributors US LLC (the “Distributor”) including, but not limited to,
corporations, certain retirement plans, public plans, and foundations and endowments, subject to minimum investment requirements.
Class S Shares are offered through financial intermediary platforms including, but not limited to, retirement platforms and asset allocation, mutual fund wrap, or other discretionary or nondiscretionary fee-based investment advisory programs. In addition, Class S Shares may be available through certain financial intermediaries who have an agreement with the Adviser or its affiliates to offer Class S Shares on their supermarket platforms.
Class T Shares are available through certain financial intermediary platforms including, but not limited to, mutual fund wrap fee programs, managed account programs, asset allocation programs, bank trust platforms, as well as certain retirement platforms. In addition, Class T Shares may be available through certain financial intermediaries who have an agreement with the Adviser or its affiliates to offer Class T Shares on their supermarket platforms.
The following accounting policies have been followed by the Fund and are in conformity with US GAAP.
Fund holdings are valued in accordance with policies and procedures established by the Adviser pursuant to Rule 2a-5 under the 1940 Act and approved by and subject to the oversight of the Trustees (the “Valuation Procedures”). Equity securities traded on a domestic securities exchange are generally valued at readily available market quotations, which are (i) the official close prices or (ii) last sale prices on the primary market or exchange in which the securities trade. If such price is lacking for the trading period immediately preceding the time of determination, such securities are generally valued at their current bid price. Equity securities that are traded on a foreign exchange are generally valued at the closing prices on such markets. In the event that there is no current trading volume on a particular security in such foreign exchange, the bid price from the primary exchange is generally used to value the security. Foreign securities and currencies are converted to U.S. dollars using the current spot USD dollar exchange rate in effect at the close of the New York Stock Exchange (“NYSE”). The Fund will determine the market value of individual securities held by it by using prices provided by one or more approved professional pricing services or, as needed, by obtaining market quotations from independent broker-dealers. Most debt securities are valued in accordance with the evaluated bid price supplied by the Adviser-approved pricing service that is intended to reflect market value. The evaluated bid price supplied by the pricing service is an evaluation that may consider factors such as security prices, yields, maturities and ratings. Certain short-term securities maturing within 60 days or less may be evaluated and valued on an amortized cost basis provided that the amortized cost determined approximates market value. Securities for which market quotations or evaluated prices are not readily available or deemed unreliable are valued at fair value determined in good faith by the Adviser pursuant to the Valuation Procedures. Circumstances in which fair valuation may be utilized include, but are not limited to: (i) a significant event that may affect the securities of a single issuer, such as a merger, bankruptcy, or significant issuer-specific development; (ii) an event that may affect an entire market, such as a natural disaster or significant governmental action; (iii) a nonsignificant event such as a market closing early or not opening, or a security trading halt; and (iv) pricing of a nonvalued security and a restricted or nonpublic security. Special valuation considerations may apply with respect to “odd-lot” fixed-income transactions which, due to their small size, may receive evaluated prices by pricing services which reflect a large block trade and not what actually could be obtained for the odd-lot position. The valuation policies provide for the use of systematic fair valuation models provided by independent pricing services to value foreign equity securities in order to adjust for stale pricing, which may occur between the close of certain foreign exchanges and the close of the NYSE. The value of the securities of other mutual funds held by a Fund, if any, will be calculated using the NAV of such mutual funds.
FASB ASC 820, Fair Value Measurements and Disclosures (“ASC 820”), defines fair value, establishes a framework for measuring fair value, and expands disclosure requirements regarding fair value measurements. This standard emphasizes that fair value is a market-based measurement that should be determined based on the assumptions that market participants would use in pricing an asset or liability and establishes a hierarchy that prioritizes inputs to valuation techniques used to measure fair value. These inputs are summarized into three broad levels:
Level 1 – Unadjusted quoted prices in active markets the Fund has the ability to access for identical assets or liabilities.
Level 2 – Observable inputs other than unadjusted quoted prices included in Level 1 that are observable for the asset or liability either directly or indirectly. These inputs may include quoted prices for the identical instrument on
an inactive market, prices for similar instruments, interest rates, prepayment speeds, credit risk, yield curves, default rates and similar data.
Assets or liabilities categorized as Level 2 in the hierarchy generally include: debt securities fair valued in accordance with the evaluated bid or ask prices supplied by a pricing service; securities traded on OTC markets and listed securities for which no sales are reported that are fair valued at the latest bid price (or yield equivalent thereof) obtained from one or more dealers transacting in a market for such securities or by a pricing service approved by the Fund’s Trustees; certain short-term debt securities with maturities of 60 days or less that are fair valued at amortized cost; and equity securities of foreign issuers whose fair value is determined by using systematic fair valuation models provided by independent third parties in order to adjust for stale pricing which may occur between the close of certain foreign exchanges and the close of the NYSE. Other securities that may be categorized as Level 2 in the hierarchy include, but are not limited to, preferred stocks, bank loans, swaps, investments in unregistered investment companies, options, and forward contracts.
Level 3 – Unobservable inputs for the asset or liability to the extent that relevant observable inputs are not available, representing the Fund’s own assumptions about the assumptions that a market participant would use in valuing the asset or liability, and that would be based on the best information available.
There have been no significant changes in valuation techniques used in valuing any such positions held by the Fund since the beginning of the fiscal period.
The inputs or methodology used for fair valuing securities are not necessarily an indication of the risk associated with investing in those securities. The summary of inputs used as of March 31, 2023 to fair value the Fund’s investments in securities and other financial instruments is included in the “Valuation Inputs Summary” in the Notes to Schedule of Investments and Other Information.
The Fund bears expenses incurred specifically on its behalf. Each class of shares bears a portion of general expenses, which are allocated daily to each class of shares based upon the ratio of net assets represented by each class as a percentage of total net assets. Expenses directly attributable to a specific class of shares are charged against the operations of such class.
The preparation of financial statements in conformity with US GAAP requires management to make estimates and assumptions that affect the reported amount of assets and liabilities and disclosure of contingent assets and liabilities at the date of the financial statements, and the reported amounts of income and expenses during the reporting period. Actual results could differ from those estimates.
In the normal course of business, the Fund may enter into contracts that contain provisions for indemnification of other parties against certain potential liabilities. The Fund’s maximum exposure under these arrangements is unknown, and would involve future claims that may be made against the Fund that have not yet occurred. Currently, the risk of material loss from such claims is considered remote.
The Fund does not isolate that portion of the results of operations resulting from the effect of changes in foreign exchange rates on investments from the fluctuations arising from changes in market prices of securities held at the date of the financial statements. Net unrealized appreciation or depreciation of investments and foreign currency translations arise from changes in the value of assets and liabilities, including investments in securities held at the date of the financial statements, resulting from changes in the exchange rates and changes in market prices of securities held.
Currency gains and losses are also calculated on payables and receivables that are denominated in foreign currencies. The payables and receivables are generally related to foreign security transactions and income translations.
Foreign currency-denominated assets and forward currency contracts may involve more risks than domestic transactions, including currency risk, counterparty risk, political and economic risk, regulatory risk and equity risk. Risks may arise from unanticipated movements in the value of foreign currencies relative to the U.S. dollar.
The Fund generally declares and distributes dividends of net investment income and realized capital gains (if any) annually. The Fund may treat a portion of the amount paid to redeem shares as a distribution of investment company taxable income and realized capital gains that are reflected in the net asset value. This practice, commonly referred to as “equalization,” has no effect on the redeeming shareholder or a Fund’s total return, but may reduce the amounts that would otherwise be required to be paid as taxable dividends to the remaining shareholders. It is possible that the Internal Revenue Service (IRS) could challenge the Fund's equalization methodology or calculations, and any such challenge could result in additional tax, interest, or penalties to be paid by the Fund.
The Fund may make certain investments in real estate investment trusts (“REITs”) which pay dividends to their shareholders based upon funds available from operations. It is quite common for these dividends to exceed the REITs’ taxable earnings and profits, resulting in the excess portion of such dividends being designated as a return of capital. If the Fund distributes such amounts, such distributions could constitute a return of capital to shareholders for federal income tax purposes.
The Fund intends to continue to qualify as a regulated investment company and distribute all of its taxable income in accordance with the requirements of Subchapter M of the Internal Revenue Code. Management has analyzed the Fund’s tax positions taken for all open federal income tax years, generally a three-year period, and has concluded that no provision for federal income tax is required in the Fund’s financial statements. The Fund is not aware of any tax positions for which it is reasonably possible that the total amounts of unrecognized tax benefits will significantly change in the next twelve months.
2. Other Investments and Strategies
The U.S. government and the Federal Reserve, as well as certain foreign governments and central banks, have taken extraordinary actions to support local and global economies and the financial markets in response to the COVID-19 pandemic. This and other government intervention into the economy and financial markets to address the COVID-19 pandemic may not work as intended, particularly if the efforts are perceived by investors as being unlikely to achieve the desired results. Government actions to mitigate the economic impact of the pandemic have resulted in a large expansion of government deficits and debt, the long term consequences of which are not known. The COVID-19 pandemic could adversely affect the value and liquidity of a Fund’s investments, impair a Fund’s ability to satisfy redemption requests, and negatively impact a Fund’s performance. In addition, the outbreak of COVID-19, and measures taken to mitigate its effects, could result in disruptions to the services provided to a Fund by its service providers.
Widespread disease, including pandemics and epidemics, and natural or environmental disasters, including those which may be attributable to global climate change, such as earthquakes, fires, floods, hurricanes, tsunamis and weather-related phenomena generally, have been and can be highly disruptive to economies and markets, adversely impacting individual companies, sectors, industries, markets, currencies, interest and inflation rates, credit ratings, investor sentiment, and other factors affecting the value of a Fund’s investments. Economies and financial markets throughout the world have become increasingly interconnected, which increases the likelihood that events or conditions in one
region or country will adversely affect markets or issuers in other regions or countries, including the United States. These disruptions could prevent a Fund from executing advantageous investment decisions in a timely manner and negatively impact a Fund’s ability to achieve its investment objective(s). Any such event(s) could have a significant adverse impact on the value of a Fund. In addition, these disruptions could also impair the information technology and other operational systems upon which the Fund’s service providers, including the Adviser or the subadviser (as applicable), rely, and could otherwise disrupt the ability of employees of the Fund’s service providers to perform essential tasks on behalf of the Fund. Adverse weather conditions may also have a particularly significant negative effect on issuers in the agricultural sector and on insurance and reinsurance companies that insure or reinsure against the impact of natural disasters.
Fund transactions involving a counterparty are subject to the risk that the counterparty or a third party will not fulfill its obligation to the Fund (“counterparty risk”). Counterparty risk may arise because of the counterparty’s financial condition (i.e., financial difficulties, bankruptcy, or insolvency), market activities and developments, or other reasons, whether foreseen or not. A counterparty’s inability to fulfill its obligation may result in significant financial loss to the Fund. The Fund may be unable to recover its investment from the counterparty or may obtain a limited recovery, and/or recovery may be delayed. The extent of the Fund’s exposure to counterparty risk with respect to financial assets and liabilities approximates its carrying value.
The Fund may be exposed to counterparty risk through participation in various programs, including, but not limited to, lending its securities to third parties, cash sweep arrangements whereby the Fund’s cash balance is invested in one or more types of cash management vehicles, as well as investments in, but not limited to, repurchase agreements, debt securities, and derivatives, including various types of swaps, futures and options. The Fund intends to enter into financial transactions with counterparties that the Adviser believes to be creditworthy at the time of the transaction. There is always the risk that the Adviser’s analysis of a counterparty’s creditworthiness is incorrect or may change due to market conditions. To the extent that the Fund focuses its transactions with a limited number of counterparties, it will have greater exposure to the risks associated with one or more counterparties.
Under procedures adopted by the Trustees, the Fund may seek to earn additional income by lending securities to certain qualified broker-dealers and institutions. JPMorgan Chase Bank, National Association acts as securities lending agent and a limited purpose custodian or subcustodian to receive and disburse cash balances and cash collateral, hold short-term investments, hold collateral, and perform other custodial functions in accordance with the Non-Custodial Securities Lending Agreement. For financial reporting purposes, the Fund does not offset financial instruments’ payables and receivables and related collateral on the Statement of Assets and Liabilities. The Fund may lend fund securities in an amount equal to up to 1/3 of its total assets as determined at the time of the loan origination. There is the risk of delay in recovering a loaned security or the risk of loss in collateral rights if the borrower fails financially. In addition, the Adviser makes efforts to balance the benefits and risks from granting such loans. All loans will be continuously secured by collateral which may consist of cash, U.S. Government securities, domestic and foreign short-term debt instruments, letters of credit, time deposits, repurchase agreements, money market mutual funds or other money market accounts, or such other collateral as permitted by the Securities and Exchange Commission (the "SEC"). If the Fund is unable to recover a security on loan, the Fund may use the collateral to purchase replacement securities in the market. There is a risk that the value of the collateral could decrease below the cost of the replacement security by the time the replacement investment is made, resulting in a loss to the Fund. In certain circumstances individual loan transactions could yield negative returns.
Upon receipt of cash collateral, the Adviser may invest it in affiliated or non-affiliated cash management vehicles, whether registered or unregistered entities, as permitted by the 1940 Act and rules promulgated thereunder. The Adviser currently intends to primarily invest the cash collateral in a cash management vehicle for which the Adviser serves as investment adviser, Janus Henderson Cash Collateral Fund LLC, or in time deposits. An investment in Janus Henderson Cash Collateral Fund LLC is generally subject to the same risks that shareholders experience when investing in similarly structured vehicles, such as the potential for significant fluctuations in assets as a result of the purchase and redemption activity of the securities lending program, a decline in the value of the collateral, and possible liquidity issues. Such risks may delay the return of the cash collateral and cause the Fund to violate its agreement to return the cash collateral to a borrower in a timely manner. As adviser to the Fund and Janus Henderson Cash Collateral Fund LLC, the Adviser has an inherent conflict of interest as a result of its fiduciary duties to both the Fund and Janus Henderson Cash Collateral Fund LLC. Additionally, the Adviser receives an investment advisory fee of 0.05% for managing Janus Henderson Cash Collateral Fund LLC, but it may not receive a fee for managing certain other affiliated cash management vehicles in which the Fund may invest, and therefore may have an incentive to allocate preferred investment opportunities to investment vehicles for which it is receiving a fee.
delivered on the next business day. Therefore, the value of the collateral held may be temporarily less than 102% or 105% value of the securities on loan. The cash collateral invested by the Adviser is disclosed in the Schedule of Investments (if applicable).
Income earned from the investment of the cash collateral, net of rebates paid to, or fees paid by, borrowers and less the fees paid to the lending agent are included as “Affiliated securities lending income, net” on the Statement of Operations.
There were no securities on loan as of March 31, 2023.
3. Investment Advisory Agreements and Other Transactions with Affiliates
The Fund pays the Adviser an investment advisory fee rate that may adjust up or down based on the Fund’s performance relative to its benchmark index.
The investment advisory fee rate paid to the Adviser by the Fund consists of two components: (1) a base fee calculated by applying the contractual fixed rate of the advisory fee to the Fund’s average daily net assets during the previous month (the “Base Fee Rate”), plus or minus (2) a performance-fee adjustment (the “Performance Adjustment”) calculated by applying a variable rate of up to 0.15% (positive or negative) to the Fund’s average daily net assets based on the Fund’s relative performance compared to the cumulative investment record of its benchmark index over a 36-month performance measurement period or shorter time period, as applicable. The investment advisory fee rate is calculated daily and paid monthly.
The investment performance of the Fund’s Class A Shares (waiving the upfront sales load) for the performance measurement period is used to calculate the Performance Adjustment. The Fund’s Base Fee Rate prior to any performance adjustment (expressed as an annual rate) is 0.92%, and the Fund’s benchmark index used in the calculation is the MSCI All Country Asia ex-Japan Index.
No Performance Adjustment is applied unless the difference between the Fund’s investment performance and the cumulative investment record of the Fund’s benchmark index is 0.50% or greater (positive or negative) during the applicable performance measurement period. The Base Fee Rate is subject to an upward or downward Performance Adjustment for every full 0.50% increment by which the Fund outperforms or underperforms its benchmark index, up to the Fund’s full performance rate of ±7.00%. Because the Performance Adjustment is tied to a Fund’s relative performance compared to its benchmark index (and not its absolute performance), the Performance Adjustment could increase the Adviser’s fee even if the Fund’s Shares lose value during the performance measurement period and could decrease the Adviser’s fee even if the Fund’s Shares increase in value during the performance measurement period. For purposes of computing the Base Fee Rate and the Performance Adjustment, net assets are averaged over different periods (average daily net assets during the previous month for the Base Fee Rate, versus average daily net assets during the performance measurement period for the Performance Adjustment). Performance of the Fund is calculated net of expenses whereas the Fund’s benchmark index does not have any fees or expenses. Reinvestment of dividends and distributions is included in calculating both the performance of a Fund and the Fund’s benchmark index.
The Fund’s prospectuses and statement(s) of additional information contain additional information about performance-based fees. The amount shown as advisory fees on the Statement of Operations reflects the Base Fee Rate plus/minus any Performance Adjustment. For the period ended March 31, 2023, the performance adjusted investment advisory fee rate before any waivers and/or reimbursements of expenses is 0.74%.
The Adviser has entered into a personnel-sharing arrangement with its foreign (non-U.S.) affiliates, Henderson Global Investors Limited, Henderson Global Investors (Japan) Ltd., and Henderson Global Investors (Singapore) Ltd. (collectively, “HGIL”), pursuant to which HGIL and certain employees of HGIL serve as “associated persons” of the Adviser. In this capacity, such employees of HGIL are subject to the oversight and supervision of the Adviser and may provide portfolio management, research, and related services to the Fund on behalf of the Adviser.
The Adviser has contractually agreed to waive the investment advisory fee and/or reimburse operating expenses to the extent that the Fund’s total annual fund operating expenses, excluding any performance adjustments to management fees (if applicable), the fees payable pursuant to a Rule 12b-1 plan, shareholder servicing fees, such as transfer agency fees (including out-of-pocket costs), administrative services fees and any networking/omnibus payable by any share class, brokerage commissions, interest, dividends, taxes, acquired fund fees and expenses, and extraordinary expenses, exceed the annual rate of 0.94% of the Fund’s average daily net assets. The Adviser has agreed to continue the waiver for at least a one-year period commencing January 27, 2023. The previous expense limit (for the one-year period
commencing January 28, 2022) was 0.99%. If applicable, amounts waived and/or reimbursed to the Fund by the Adviser are disclosed as “Excess Expense Reimbursement and Waivers” on the Statement of Operations.
The Adviser serves as administrator to the Fund pursuant to an administration agreement between the Adviser and the Trust. Under the administration agreement, the Adviser is authorized to perform, or cause others to perform certain administration, compliance, and accounting services to the Fund, including providing office space for the Fund, and is reimbursed by the Fund for certain of its costs in providing these services (to the extent the Adviser seeks reimbursement and such costs are not otherwise waived). In addition, employees of the Adviser and/or its affiliates may serve as officers of the Trust. The Fund pays for some or all of the salaries, fees, and expenses of the Adviser employees and Fund officers, with respect to certain specified administration functions they perform on behalf of the Fund. The Fund pays these costs based on out-of-pocket expenses incurred by the Adviser, and these costs are separate and apart from advisory fees and other expenses paid in connection with the investment advisory services the Adviser (or any subadvisor, as applicable) provides to the Fund. These amounts are disclosed as “Affiliated fund administration fees” on the Statement of Operations. In addition, some expenses related to compensation payable to the Fund’s Chief Compliance Officer and certain compliance staff, all of whom are employees of the Adviser and/or its affiliates, are shared with the Fund. Total compensation of $114,430 was paid to the Chief Compliance Officer and certain compliance staff by the Trust during the period ended March 31, 2023. The Fund's portion is reported as part of “Other expenses” on the Statement of Operations.
Janus Henderson Services US LLC (the “Transfer Agent”), a wholly-owned subsidiary of the Adviser, is the Fund’s transfer agent. The Transfer Agent provides or arranges for the provision of shareholder services including, but not limited to, recordkeeping, subaccounting, answering inquiries regarding accounts, order processing, transaction confirmations, the mailing of prospectuses and shareholder reports, and other shareholder services provided to or on behalf of shareholders. These amounts are disclosed as “Transfer agent administrative fees and expenses” on the Statement of Operations.
Class D Shares of the Fund pay the Transfer Agent an annual administrative services fee based on the average daily net assets of Class D Shares as detailed below.
During the reporting period, the administrative services fee rate was 0.12%.
The Transfer Agent receives an administrative services fee at an annual rate of up to 0.25% of the average daily net assets of the Fund’s Class S Shares and Class T Shares for providing or procuring administrative services to investors in Class S Shares and Class T Shares of the Fund. The Transfer Agent expects to use all or a significant portion of this fee to compensate retirement plan service providers, broker-dealers, bank trust departments, financial advisors, and other financial intermediaries for providing these services. The Transfer Agent may keep certain amounts retained for reimbursement of out-of-pocket costs incurred for servicing clients of Class S Shares and Class T Shares.
Shareholder Services provided by these financial intermediaries may include, but are not limited to, recordkeeping, subaccounting, order processing, providing order confirmations, periodic statements, forwarding prospectuses, shareholder reports, and other materials to existing customers, answering inquiries regarding accounts, and other administrative services. Order processing includes the submission of transactions through the National Securities Clearing Corporation (“NSCC”) or similar systems, or those processed on a manual basis with the Adviser. For all share classes, the Transfer Agent also seeks reimbursement for costs it incurs as transfer agent and for providing servicing.
Certain, but not all, intermediaries may charge administrative fees to investors in Class A Shares, Class C Shares, and Class I Shares for administrative services provided on behalf of such investors. These administrative fees are paid by the Class A Shares, Class C Shares, and Class I Shares of the Fund to the Transfer Agent, which uses such fees to reimburse intermediaries. Consistent with the Transfer Agency Agreement between the Transfer Agent and the Fund, the Transfer Agent may negotiate the level, structure, and/or terms of the administrative fees with intermediaries requiring such fees on behalf of the Fund. The Adviser and its affiliates benefit from an increase in assets that may result from such relationships. The Adviser has agreed to limit these fees up to 0.20% for Class A Shares and Class C Shares, and up to 0.15% for Class I Shares on an annual basis based on the daily net assets of each share class. Such
limits are subject to change by the Trustees in the future. These amounts are disclosed as “Transfer agent networking and omnibus fees” on the Statement of Operations.
The Transfer Agent is not compensated for its services related to the shares, except for out-of-pocket costs, although the Transfer Agent is compensated for its services related to Fund’s Class D Shares. These amounts are disclosed as “Other transfer agent fees and expenses” on the Statement of Operations.
Under distribution and shareholder servicing plans (the “Plans”) adopted in accordance with Rule 12b-1 under the 1940 Act, the Fund pays the Trust’s distributor, the Distributor, a wholly-owned subsidiary of the Adviser, a fee for the sale and distribution and/or shareholder servicing of the shares based on the average daily net assets for each share class at an annual rate of up to 0.25% for Class A Shares, up to 1.00% for Class C Shares, and up to 0.25% for Class S Shares. Under the terms of the Plans, the Trust is authorized to make payments to the Distributor for remittance to retirement plan service providers, broker-dealers, bank trust departments, financial advisors, and other financial intermediaries, as compensation for distribution and/or shareholder services performed by such entities for their customers who are investors in the Fund. These amounts are disclosed as “12b-1 Distribution and shareholder servicing fees” on the Statement of Operations.
Class A Shares include a 5.75% upfront sales charge of the offering price of the Fund. The sales charge is allocated between the Distributor and financial intermediaries. During the period ended March 31, 2023, the Distributor retained upfront sales charges of $23.
A contingent deferred sales charge (“CDSC”) of 1.00% will be deducted with respect to Class A Shares purchased without a sales load and redeemed within 12 months of purchase, unless waived. Any applicable CDSC will be 1.00% of the lesser of the original purchase price or the value of the redemption of the Class A Shares redeemed. There were no CDSCs paid by redeeming shareholders of Class A Shares to the Distributor during the period ended March 31, 2023.
A CDSC of 1.00% will be deducted with respect to Class C Shares redeemed within 12 months of purchase, unless waived. Any applicable CDSC will be 1.00% of the lesser of the original purchase price or the value of the redemption of the Class C Shares redeemed. There were no CDSCs paid by redeeming shareholders of Class C Shares during the period ended March 31, 2023.
The Board of Trustees has adopted a deferred compensation plan (the “Deferred Plan”) for independent Trustees to elect to defer receipt of all or a portion of the annual compensation they are entitled to receive from the Fund. All deferred fees are credited to an account established in the name of the Trustees. The amounts credited to the account then increase or decrease, as the case may be, in accordance with the performance of one or more of the Janus Henderson funds that are selected by the Trustees. The account balance continues to fluctuate in accordance with the performance of the selected fund or funds until final payment of all amounts are credited to the account. The fluctuation of the account balance is recorded by the Fund as unrealized appreciation/(depreciation) and is included as of March 31, 2023 on the Statement of Assets and Liabilities in the asset, “Trustees’ deferred compensation,” and liability, “Trustees’ deferred compensation fees.” Additionally, the recorded unrealized appreciation/(depreciation) is included in “Total distributable earnings (loss)” on the Statement of Assets and Liabilities. Deferred compensation expenses for the period ended March 31, 2023 are included in “Trustees’ fees and expenses” on the Statement of Operations. Trustees are allowed to change their designation of mutual funds from time to time. Amounts will be deferred until distributed in accordance with the Deferred Plan. Deferred fees of $205,688 were paid by the Trust to the Trustees under the Deferred Plan during the period ended March 31, 2023.
Pursuant to the provisions of the 1940 Act and related rules, the Fund may participate in an affiliated or non-affiliated cash sweep program. In the cash sweep program, uninvested cash balances of the Fund may be used to purchase shares of affiliated or non-affiliated money market funds or cash management pooled investment vehicles that operate as money market funds. The Fund is eligible to participate in the cash sweep program (the “Investing Funds”). The Adviser has an inherent conflict of interest because of its fiduciary duties to the affiliated money market funds or cash management pooled investment vehicles and the Investing Funds. Janus Henderson Cash Liquidity Fund LLC (the “Sweep Vehicle”) is an affiliated unregistered cash management pooled investment vehicle that invests primarily in highly-rated short-term fixed-income securities. The Sweep Vehicle operates pursuant to the provisions of the 1940 Act that govern the operation of money market funds and prices its shares at NAV reflecting market-based values of its portfolio securities (i.e., a “floating” NAV) rounded to the fourth decimal place (e.g., $1.0000). The Sweep Vehicle is permitted to impose a liquidity fee (of up to 2%) on redemptions from the Sweep Vehicle or a redemption gate that
temporarily suspends redemptions from the Sweep Vehicle for up to 10 business days during a 90 day period. There are no restrictions on the Fund's ability to withdraw investments from the Sweep Vehicle at will, and there are no unfunded capital commitments due from the Fund to the Sweep Vehicle. The Sweep Vehicle does not charge any management fee, sales charge or service fee.
Any purchases and sales, realized gains/losses and recorded dividends from affiliated investments during the period ended March 31, 2023 can be found in the “Schedules of Affiliated Investments” located in the Schedule of Investments.
As of March 31, 2023, shares of the Fund were owned by affiliates of the Adviser, and/or other funds advised by the Adviser, as indicated in the table below:
4. Federal Income Tax
Income and capital gains distributions are determined in accordance with income tax regulations that may differ from US GAAP. These differences are due to differing treatments for items such as net short-term gains, deferral of wash sale losses, foreign currency transactions, net investment losses, and capital loss carryovers.
The Fund has elected to treat gains and losses on forward foreign currency contracts as capital gains and losses, if applicable. Other foreign currency gains and losses on debt instruments are treated as ordinary income for federal income tax purposes pursuant to Section 988 of the Internal Revenue Code.
Accumulated capital losses noted below represent net capital loss carryovers, as of September 30, 2022, that may be available to offset future realized capital gains and thereby reduce future taxable gains distributions. The following table shows these capital loss carryovers.
The aggregate cost of investments and the composition of unrealized appreciation and depreciation of investment securities for federal income tax purposes as of March 31, 2023 are noted below. The primary differences between book and tax appreciation or depreciation of investments are wash sale loss deferrals and investments in passive foreign investment companies.
5. Capital Share Transactions
6. Purchases and Sales of Investment Securities
For the period ended March 31, 2023, the aggregate cost of purchases and proceeds from sales of investment securities (excluding any short-term securities, short-term options contracts, TBAs, and in-kind transactions, as applicable) was as follows:
7. Subsequent Event
Management has evaluated whether any events or transactions occurred subsequent to March 31, 2023 and through the date of issuance of the Fund’s financial statements and determined that there were no material events or transactions that would require recognition or disclosure in the Fund’s financial statements.
A description of the policies and procedures that the Fund uses to determine how to vote proxies relating to its portfolio securities is available without charge: (i) upon request, by calling 1-800-525-1093; (ii) on the Fund’s website at janushenderson.com/proxyvoting; and (iii) on the SEC’s website at http://www.sec.gov. Additionally, information regarding the Fund’s proxy voting record for the most recent twelve-month period ended June 30 is also available, free of charge, through janushenderson.com/proxyvoting and from the SEC’s website at http://www.sec.gov.
The Fund files its complete portfolio holdings (schedule of investments) with the SEC as an exhibit to Form N-PORT within 60 days of the end of the first and third fiscal quarters, and in the annual report and semiannual report to shareholders. The Fund’s Form N-PORT filings and annual and semiannual reports: (i) are available on the SEC’s website at http://www.sec.gov; and (ii) are available without charge, upon request, by calling a Janus Henderson representative at 1-877-335-2687 (toll free) (or 1-800-525-3713 if you hold Class D Shares). Portfolio holdings consisting of at least the names of the holdings are generally available on a monthly basis with a 30-day lag under Full Holdings for the Fund at janushenderson.com/info (or janushenderson.com/reports if you hold Class D Shares).
The Trustees of Janus Aspen Series, each of whom serves as an “independent” Trustee (the “Trustees”), oversee the management of each portfolio of Janus Aspen Series (each, a “VIT Portfolio,” and collectively, the “VIT Portfolios”), as well as each fund of Janus Investment Fund (each, a “Fund,” and collectively, the “Funds” and together with the VIT Portfolios, the “Janus Henderson Funds,” and each, a “Janus Henderson Fund”). As required by law, the Trustees determine annually whether to continue the investment advisory agreement for each Janus Henderson Fund.
In connection with their most recent consideration of those agreements for each Janus Henderson Fund, the Trustees received and reviewed information provided by Janus Henderson Investors US LLC (the “Adviser”) in response to requests of the Trustees and their independent legal counsel. They also received and reviewed information and analysis provided by, and in response to requests of, their independent fee consultant. Throughout their consideration of the agreements, the Trustees were advised by their independent legal counsel. The Trustees met with management to consider the agreements, and also met separately in executive session with their independent legal counsel and their independent fee consultant.
At meetings held on November 9-10, 2022 and December 13-14, 2022, the Trustees evaluated the information provided by the Adviser and the independent fee consultant, as well as other information provided by the Adviser and the independent fee consultant during the year. Following such evaluation, the Trustees determined that the overall arrangements between each Janus Henderson Fund and the Adviser were fair and reasonable in light of the nature, extent, and quality of the services provided by the Adviser and its affiliates, the fees charged for those services, and other matters that the Trustees considered relevant in the exercise of their business judgment, and unanimously approved the continuation of the investment advisory agreement for each Janus Henderson Fund for the period from February 1, 2023 through February 1, 2024, subject to earlier termination as provided for in each agreement.
In considering the continuation of those agreements, the Trustees reviewed and analyzed various factors that they determined were relevant, including the factors described below, none of which by itself was considered dispositive. However, the material factors and conclusions that formed the basis for the Trustees’ determination to approve the continuation of the agreements are discussed separately below. Also included is a summary of the independent fee consultant’s conclusions and opinions that arose during, and were included as part of, the Trustees’ consideration of the agreements. “Management fees,” as used herein, reflect actual annual advisory fees and, for the purpose of peer comparisons any administration fees (excluding out of pocket costs), net of any waivers, paid by a fund as a percentage of average net assets.
The Trustees reviewed the nature, extent, and quality of the services provided by the Adviser to the Janus Henderson Funds, taking into account the investment objective, strategies, and policies of each Janus Henderson Fund, and the knowledge the Trustees gained from their regular meetings with management on at least a quarterly basis and their ongoing review of information related to the Janus Henderson Funds. In addition, the Trustees reviewed the resources and key personnel of the Adviser, particularly noting those employees who provide investment and risk management services to the Janus Henderson Funds. The Trustees also considered other services provided to the Janus Henderson
Funds by the Adviser, such as managing the execution of portfolio transactions and the selection of broker-dealers for those transactions. The Trustees considered the Adviser’s role as administrator to the Janus Henderson Funds, noting that the Adviser generally does not receive a fee for its services as administrator, but is reimbursed for its out-of-pocket costs. The Trustees considered the role of the Adviser in monitoring adherence to the Janus Henderson Funds’ investment restrictions, providing support services for the Trustees and Trustee committees, and overseeing communications with Janus Henderson Fund shareholders and the activities of other service providers, including monitoring compliance with various policies and procedures of the Janus Henderson Funds and with applicable securities laws and regulations.
In this regard, the independent fee consultant noted that the Adviser provides a number of different services for the Janus Henderson Funds and their shareholders, ranging from investment management services to various other servicing functions, and that, in its view, the Adviser is a capable provider of those services. The independent fee consultant also provided its belief that the Adviser has developed a number of institutional competitive advantages that should enable it to provide superior investment and service performance over the long term.
The Trustees concluded that the nature, extent, and quality of the services provided by the Adviser to each Janus Henderson Fund were appropriate and consistent with the terms of the respective advisory agreements, and that, taking into account steps taken to address those Janus Henderson Funds whose performance lagged that of their peers for certain periods, the Janus Henderson Funds were likely to benefit from the continued provision of those services. They also concluded that the Adviser had sufficient personnel, with the appropriate education and experience, to serve the Janus Henderson Funds effectively and had demonstrated its ability to attract well-qualified personnel.
The Trustees considered the performance results of each Janus Henderson Fund over various time periods. They noted that they considered Janus Henderson Fund performance data throughout the year, including periodic meetings with each Janus Henderson Fund’s portfolio manager(s), and also reviewed information comparing each Janus Henderson Fund’s performance with the performance of comparable fund peer groups identified by Broadridge Financial Solutions, Inc. (“Broadridge”), an independent data provider, and with the Janus Henderson Fund’s benchmark index. In this regard, the independent fee consultant found that the overall Janus Henderson Funds’ performance has been reasonable, noting that: (i) for the 36 months ended May 31, 2022, approximately 38% of the Janus Henderson Funds were in the top two quartiles of their Broadridge peer groups; (ii) for the 36 months ended September 30, 2022, approximately 45% of the Janus Henderson Funds were in the top two quartiles of performance as reported by Morningstar, and (iii) for the 12 months ended September 30, 2022, approximately 55% of the Janus Henderson Funds were in the top two quartiles of performance as reported by Morningstar.
The Trustees considered the performance of each Janus Henderson Fund, noting that performance may vary by share class, and noted the following with respect to the Funds:
the steps the Adviser had taken or was taking to improve performance, and that the performance trend was improving.
U.S. Equity Funds
In consideration of each Janus Henderson Fund’s performance, the Trustees concluded that, taking into account the factors relevant to performance, as well as other considerations, including steps taken to improve performance, as applicable, the Janus Henderson Fund’s performance warranted continuation of such Janus Henderson Fund’s investment advisory agreement.
The Trustees examined information regarding the fees and expenses of each Janus Henderson Fund in comparison to similar information for other comparable funds as provided by Broadridge, an independent data provider. They also reviewed an analysis of that information provided by their independent fee consultant. The independent fee consultant provided its belief that the management fees charged by the Adviser to each of the Janus Henderson Funds under the current investment advisory and administration agreements are reasonable in relation to the services provided by the Adviser. The independent fee consultant found: (1) the total expenses and management fees of the Janus Henderson Funds to be reasonable relative to other comparable mutual funds; (2) the total expenses, on average, were 6% under the average total expenses of the respective Broadridge peer group; and (3) the management fees for the Janus Henderson Funds, on average, were 5% under the average management fees for the respective Broadridge peer group. The Trustees also considered the total expenses for each share class of each Janus Henderson Fund compared to the average total expenses for its Broadridge Expense Group and to average total expenses for its Broadridge Expense Universe.
For Janus Henderson Funds with three or more years of performance history, the independent fee consultant also performed a systematic “focus list” analysis of expenses which assessed fund fees in the context of fund performance being delivered. Based on this analysis, the independent fee consultant found that the combination of service quality/performance and expenses on these individual Janus Henderson Funds was reasonable in light of performance trends, performance histories, changes in portfolio management, relative average net asset levels, and the existence of performance fees, breakpoints, and/or expense waivers on such Janus Henderson Funds.
The Trustees considered the methodology used by the Adviser in determining compensation payable to portfolio managers, the competitive environment for investment management talent, and the competitive market for mutual funds in different distribution channels.
The Trustees also reviewed management fees charged by the Adviser to comparable separate account clients and to comparable non-affiliated funds subadvised by the Adviser (for which the Adviser provides only or primarily portfolio management services). Although in most instances subadvisory and separate account fee rates for various investment strategies were lower than management fee rates for Janus Henderson Funds having a similar strategy, the Trustees considered that the Adviser noted that, under the terms of the management agreements with the Janus Henderson Funds, the Adviser performs significant additional services for the Janus Henderson Funds that it does not provide to those other clients, including administration services, oversight of the Janus Henderson Funds’ other service providers, Trustee support, regulatory compliance and numerous other services, and that, in serving the Janus Henderson Funds, the Adviser assumes many legal risks and other costs that it does not assume in servicing its other clients. Moreover, the Trustees noted that the independent fee consultant found that: (1) the management fees the Adviser charges to the Janus Henderson Funds are reasonable in relation to the management fees the Adviser charges to funds subadvised by the Adviser and to the fees the Adviser charges to its institutional separate account clients; (2) these subadvised and institutional separate accounts have different service and infrastructure needs and operate in markets very different from the retail fund market; (3) Janus Henderson mutual fund investors enjoy reasonable fees relative to the fees charged in these other markets; and (4) as part of its 2022 review, 9 of 11 Janus Henderson Funds have lower management fees than similar funds subadvised by the Adviser. The Trustees noted that for the two Janus Henderson Funds that did not, management fees for each were under the average of its 15(c) peer group.
The Trustees considered the fees for each Janus Henderson Fund for its fiscal year ended in 2021 and noted the following with regard to each Janus Henderson Fund’s total expenses, net of applicable fee waivers (the Fund’s “total expenses”) as reflected in the comparative information provided by Broadridge:
U.S. Equity Funds
The Trustees reviewed information on the overall profitability to the Adviser and its affiliates from their relationships with the Janus Henderson Funds, and considered profitability data of other publicly traded mutual fund advisers. The Trustees recognized that profitability comparisons among fund managers are difficult because of the variation in the type of comparative information that is publicly available, and the profitability of any fund manager is affected by numerous factors, including the organizational structure of the particular fund manager, differences in complex size, difference in product mix, difference in types of business (mutual fund, institutional and other), differences in the types of funds and other accounts it manages, possible other lines of business, the methodology for allocating expenses and the fund manager’s capital structure and cost of capital.
Additionally, the Trustees considered the estimated profitability to the Adviser from the investment management services it provided to each Janus Henderson Fund. In their review, the Trustees considered whether the Adviser receive adequate incentives and resources to manage the Janus Henderson Funds effectively. In reviewing profitability, the Trustees noted that the estimated profitability for an individual Janus Henderson Fund is necessarily a product of the allocation methodology utilized by the Adviser to allocate its expenses as part of the estimated profitability calculation. In this regard, the Trustees noted that the independent fee consultant found as part of its 2022 review that (1) the expense allocation methodology and rationales utilized by the Adviser were reasonable and (2) no clear correlation exists between expense allocations and operating margins. The Trustees also considered that the estimated profitability for an individual Janus Henderson Fund was influenced by a number of factors, including not only the allocation methodology selected, but also the presence of fee waivers and expense caps, and whether the Janus Henderson Fund’s investment management agreement contained breakpoints or a performance fee component. The Trustees determined, after taking into account these factors, among others, that the Adviser’s estimated profitability with respect to each Janus Henderson Fund was not unreasonable in relation to the services provided, and that the variation in the range of such estimated profitability among the Janus Henderson Funds was not a material factor in the Board’s approval of the reasonableness of any Janus Henderson Fund’s investment management fees.
The Trustees concluded that the management fees payable by each Janus Henderson Fund to the Adviser were reasonable in relation to the nature, extent, and quality of the services provided, taking into account the fees charged by other advisers for managing comparable mutual funds with similar strategies, the fees the Adviser charges to other clients, and, as applicable, the impact of fund performance on management fees payable by the Janus Henderson Funds. The Trustees also concluded that each Janus Henderson Fund’s total expenses were reasonable, taking into account the size of the Janus Henderson Fund, the quality of services provided by the Adviser, the investment performance of the Janus Henderson Fund, and any expense limitations agreed to or provided by the Adviser.
The Trustees considered information about the potential for the Adviser to realize economies of scale as the assets of the Janus Henderson Funds increase. They noted that their independent fee consultant published a report to the Trustees in June 2022 which provided its research and analysis into economies of scale. They also noted that, although many Janus Henderson Funds pay advisory fees at a fixed base rate as a percentage of net assets, without any breakpoints or performance fees, their independent fee consultant concluded that 75% of these Janus Henderson Funds’ have contractual management fees (gross of waivers) below their Broadridge Expense Group averages. The Trustees also noted the following from the independent fee consultant’s report: (1) that 31% of Janus Henderson Funds had management fee breakpoints in place whereby investors pay lower management fees as fund AUM increases; (2) that 29% of Janus Henderson Funds have low flat-rate fees and performance fees where the Adviser is incentivized to invest in resources which drive Janus Henderson Fund performance; and (3) that 39% of Janus Henderson Funds have low flat-rate fees versus peers where investors pay low fixed fees when the Janus Henderson Fund is small/midsized and higher fees when the Janus Henderson Fund grows in assets. The Trustees also noted that the Janus Henderson Funds share directly in economies of scale through the significant investments made by the Adviser and its affiliates related to services provided to the Funds and the lower charges of third-party service providers that are based in part on the combined scale of all of the Janus Henderson Funds.
The Trustees also considered the independent fee consultant’s conclusion that, given the limitations of various analytical approaches to economies of scale and their conflicting results, it is difficult to analytically confirm or deny the existence of economies of scale in the Janus Henderson complex. In this regard, the independent consultant concluded that (1) to the extent there were economies of scale at the Adviser, the Adviser’s general strategy of setting fixed management fees below peers appeared to share any such economies with investors even on smaller Janus Henderson Funds which have not yet achieved those economies and (2) by setting lower fixed fees from the start on these Janus Henderson Funds, the Adviser appeared to be investing to increase the likelihood that these Janus Henderson Funds will grow to a level to achieve any economies of scale that may exist. Further, the independent fee consultant provided its belief that Janus Henderson Fund investors are well-served by the fee levels and performance fee structures in place on the Janus Henderson Funds in light of any economies of scale that may be present at the Adviser.
Based on all of the information reviewed, including the recent and past research and analysis conducted by the Trustees’ independent fee consultant, the Trustees concluded that the current fee structure of each Janus Henderson Fund was reasonable and that the current rates of fees do reflect a sharing between the Adviser and the Janus Henderson Fund of any economies of scale that may be present at the current asset level of the Janus Henderson Fund.
The Trustees also considered benefits that accrue to the Adviser and its affiliates from their relationships with the Janus Henderson Funds. They recognized that two affiliates of the Adviser separately serve the Janus Henderson Funds as transfer agent and distributor, respectively, and the transfer agent receives compensation directly from the non-money market Janus Henderson Funds for services provided, and that such compensation contributes to the overall profitability of the Adviser and its affiliates that results from their relationship with the Janus Henderson Funds. The Trustees also considered the Adviser’s past and proposed use of commissions paid by the Janus Henderson Funds on portfolio brokerage transactions to obtain proprietary and third-party research products and services benefiting the Janus Henderson Fund and/or other clients of the Adviser and/or the Adviser. The Trustees concluded that the Adviser’s use of these types of client commission arrangements to obtain proprietary and third-party research products and services was consistent with regulatory requirements and guidelines and was likely to benefit each Janus Henderson Fund. The Trustees also concluded that, other than the services provided by the Adviser and its affiliates pursuant to the agreements and the fees to be paid by each Janus Henderson Fund therefor, the Janus Henderson
Funds and the Adviser may potentially benefit from their relationship with each other in other ways. They concluded that the Adviser and its affiliates share directly in economies of scale through the lower charges of third-party service providers that are based in part on the combined scale of the Janus Henderson Funds and other clients serviced by the Adviser and its affiliates. They also concluded that the Adviser benefits from the receipt of research products and services acquired through commissions paid on portfolio transactions of the Janus Henderson Funds and that the Janus Henderson Funds benefit from the Adviser’s receipt of those products and services as well as research products and services acquired through commissions paid by other clients of the Adviser. They further concluded that the success of any Janus Henderson Fund could attract other business to the Adviser or other Janus Henderson Funds, and that the success of the Adviser could enhance the Adviser’s ability to serve the Janus Henderson Funds.
Rule 22e-4 under the Investment Company Act of 1940, as amended (the “Liquidity Rule”), requires open-end funds (but not money market funds) to adopt and implement a written liquidity risk management program (the “LRMP”) that is reasonably designed to assess and manage liquidity risk, which is the risk that a fund could not meet redemption requests without significant dilution of remaining investors’ interest in the fund. The Fund has implemented a LRMP, which incorporates the following elements: (i) assessment, management, and periodic review of liquidity risk; (ii) classification of portfolio holdings; (iii) the establishment and monitoring of a highly liquid investment minimum, as applicable; (iv) a 15% limitation on a Fund’s illiquid investments; (v) redemptions in-kind; and (vi) board oversight.
The Trustees of the Fund (the “Trustees”) have designated Janus Henderson Investors US LLC, the Fund’s investment adviser (the “Adviser”), as the Program Administrator for the LRMP responsible for administering the LRMP and carrying out the specific responsibilities of the LRMP. A working group comprised of various teams within the Adviser’s business is responsible for administering the LRMP and carrying out the specific responsibilities of different aspects of the LRMP (the “Liquidity Risk Working Group”). In assessing each Fund’s liquidity risk, the Liquidity Risk Working Group periodically considers, as relevant, factors including (i) the liquidity of a Fund’s portfolio investments during normal and reasonably foreseeable stressed conditions; (ii) whether a Fund’s investment strategy is appropriate for an open-end fund; (iii) the extent to which a Fund’s strategy involves a relatively concentrated portfolio or large positions in any issuer; (iv) a Fund’s use of borrowing for investment purposes; and (v) a Fund’s use of derivatives.
The Liquidity Rule requires the Trustees to review at least annually a written report provided by the Program Administrator that addresses the operation of the LRMP and assesses its adequacy and the effectiveness of its implementation, including, if applicable, the operation of the highly liquid investment minimum, and any material changes to the LRMP (the “Program Administrator Report”). At a meeting held on March 15, 2023, the Adviser provided the Program Administrator Report to the Trustees which covered the operation of the LRMP from January 1, 2022 through December 31, 2022 (the “Reporting Period”).
The Program Administrator Report discussed the operation and effectiveness of the LRMP during the Reporting Period. Among other things, the Program Administrator Report indicated that there were no material changes to the LRMP during the Reporting Period, although there were certain methodology adjustments implemented relating to a change in data provider. Additionally, the findings presented in the Program Administrator Report indicated that the LRMP operated adequately during the Reporting Period. These findings included that the Fund was able to meet redemptions during the normal course of business during the Reporting Period. The Program Administrator Report also stated that the Fund did not exceed the 15% limit on illiquid assets during the Reporting Period, with the exception of extended market closures due to planned holidays, that the Fund held primarily highly liquid assets, and was considered to be a primarily highly liquid fund during the Reporting Period. Also included among the Program Administrator Report’s findings was the determination that the Fund’s investment strategy remains appropriate for an open-end fund. In addition, the Adviser expressed its belief in the Program Administrator Report that the LRMP is reasonably designed and adequate to assess and manage the Fund’s liquidity risk, considering the Fund’s particular risks and circumstances, and includes policies and procedures reasonably designed to implement each required component of the Liquidity Rule.
There can be no assurance that the LRMP will achieve its objectives in the future. Please refer to your Fund’s prospectus for more information regarding the risks to which an investment in the Fund may be subject.
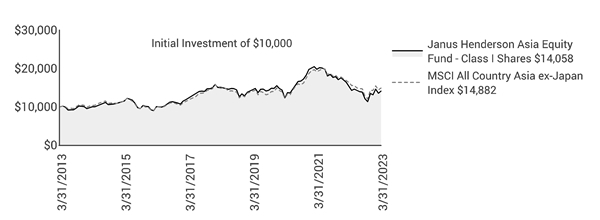
Performance overview graphs compare the performance of a hypothetical $10,000 investment in the Fund with one or more widely used market indices. When comparing the performance of the Fund with an index, keep in mind that market indices are not available for investment and do not reflect deduction of expenses.
Average annual total returns are quoted for a Fund with more than one year of performance history. Average annual total return is calculated by taking the growth or decline in value of an investment over a period of time, including reinvestment of dividends and distributions, then calculating the annual compounded percentage rate that would have produced the same result had the rate of growth been constant throughout the period. Average annual total return does not reflect the deduction of taxes that a shareholder would pay on Fund distributions or redemptions of Fund shares.
Cumulative total returns are quoted for a Fund with less than one year of performance history. Cumulative total return is the growth or decline in value of an investment over time, independent of the period of time involved. Cumulative total return does not reflect the deduction of taxes that a shareholder would pay on Fund distributions or redemptions of Fund shares.
Pursuant to federal securities rules, expense ratios shown in the performance chart reflect subsidized (if applicable) and unsubsidized ratios. The total annual fund operating expenses ratio is gross of any fee waivers, reflecting the Fund’s unsubsidized expense ratio. The net annual fund operating expenses ratio (if applicable) includes contractual waivers of the Adviser and reflects the Fund’s subsidized expense ratio. Ratios may be higher or lower than those shown in the “Financial Highlights” in this report.
Following the performance overview section is the Fund’s Schedule of Investments. This schedule reports the types of securities held in the Fund on the last day of the reporting period. Securities are usually listed by type (common stock, corporate bonds, U.S. Government obligations, etc.) and by industry classification (banking, communications, insurance, etc.). Holdings are subject to change without notice.
The value of each security is quoted as of the last day of the reporting period. The value of securities denominated in foreign currencies is converted into U.S. dollars.
If the Fund invests in foreign securities, it will also provide a summary of investments by country. This summary reports the Fund exposure to different countries by providing the percentage of securities invested in each country. The country of each security represents the country of risk. A company may be allocated to a country based on other factors such as location of the company’s principal office, the location of the principal trading market for the company’s securities, or the country where a majority of the company’s revenues are derived. The Fund’s Schedule of Investments relies upon the industry group and country classifications published by Bloomberg and/or MSCI Inc.
Tables listing details of individual forward currency contracts, futures, written options, swaptions, and swaps follow the Fund’s Schedule of Investments (if applicable).
This statement is often referred to as the “balance sheet.” It lists the assets and liabilities of the Fund on the last day of the reporting period.
The Fund’s assets are calculated by adding the value of the securities owned, the receivable for securities sold but not yet settled, the receivable for dividends declared but not yet received on securities owned, and the receivable for Fund shares sold to investors but not yet settled. The Fund’s liabilities include payables for securities purchased but not yet settled, Fund shares redeemed but not yet paid, and expenses owed but not yet paid. Additionally, there may be other assets and liabilities such as unrealized gain or loss on forward currency contracts.
The section entitled “Net Assets Consist of” breaks down the components of the Fund’s net assets. Because the Fund must distribute substantially all earnings, you will notice that a significant portion of net assets is shareholder capital.
The last section of this statement reports the net asset value (“NAV”) per share on the last day of the reporting period. The NAV is calculated by dividing the Fund’s net assets for each share class (assets minus liabilities) by the number of shares outstanding.
This statement details the Fund’s income, expenses, realized gains and losses on securities and currency transactions, and changes in unrealized appreciation or depreciation of Fund holdings.
The first section in this statement, entitled “Investment Income,” reports the dividends earned from securities and interest earned from interest-bearing securities in the Fund.
The next section reports the expenses incurred by the Fund, including the advisory fee paid to the investment adviser, transfer agent fees and expenses, and printing and postage for mailing statements, financial reports and prospectuses. Expense offsets and expense reimbursements, if any, are also shown.
The last section lists the amounts of realized gains or losses from investment and foreign currency transactions, and changes in unrealized appreciation or depreciation of investments and foreign currency-denominated assets and liabilities. The Fund will realize a gain (or loss) when it sells its position in a particular security. A change in unrealized gain (or loss) refers to the change in net appreciation or depreciation of the Fund during the reporting period. “Net Realized and Unrealized Gain/(Loss) on Investments” is affected both by changes in the market value of Fund holdings and by gains (or losses) realized during the reporting period.
These statements report the increase or decrease in the Fund’s net assets during the reporting period. Changes in the Fund’s net assets are attributable to investment operations, dividends and distributions to investors, and capital share transactions. This is important to investors because it shows exactly what caused the Fund’s net asset size to change during the period.
The first section summarizes the information from the Statement of Operations regarding changes in net assets due to the Fund’s investment operations. The Fund’s net assets may also change as a result of dividend and capital gains distributions to investors. If investors receive their dividends and/or distributions in cash, money is taken out of the Fund to pay the dividend and/or distribution. If investors reinvest their dividends and/or distributions, the Fund’s net assets will not be affected.
The reinvestment of dividends and distributions is included under “Capital Share Transactions.” “Capital Shares” refers to the money investors contribute to the Fund through purchases or withdrawals via redemptions. The Fund’s net assets will increase and decrease in value as investors purchase and redeem shares from the Fund.
This schedule provides a per-share breakdown of the components that affect the Fund’s NAV for current and past reporting periods as well as total return, asset size, ratios, and portfolio turnover rate.
The Fund’s expenses may be reduced through expense offsets and expense reimbursements. The ratios shown reflect expenses before and after any such offsets and reimbursements.
The ratio of net investment income/(loss) summarizes the income earned less expenses, divided by the average net assets of the Fund during the reporting period. Do not confuse this ratio with the Fund’s yield. The net investment income ratio is not a true measure of the Fund’s yield because it does not take into account the dividends distributed to the Fund’s investors.
The next figure is the portfolio turnover rate, which measures the buying and selling activity in the Fund. Portfolio turnover is affected by market conditions, changes in the asset size of the Fund, fluctuating volume of shareholder purchase and redemption orders, the nature of the Fund’s investments, and the investment style and/or outlook of the portfolio manager(s) and/or investment personnel. A 100% rate implies that an amount equal to the value of the entire portfolio was replaced once during the fiscal year; a 50% rate means that an amount equal to the value of half the
portfolio is traded in a year; and a 200% rate means that an amount equal to the value of the entire portfolio is traded every six months.
| | | | |
| | | |
| | | SEMIANNUAL REPORT March 31, 2023 |
| | |
| | Janus Henderson Balanced Fund |
| | |
| | Janus Investment Fund |
| |
| | | HIGHLIGHTS · Investment strategy behind your fund · Fund performance, characteristics
and holdings |
Table of Contents
Janus Henderson Balanced Fund
| | | | | | |
| | | | 
Jeremiah Buckley co-portfolio manager | 
Michael Keough co-portfolio manager | 
Greg Wilensky co-portfolio manager |
| | | |
Janus Henderson Balanced Fund (unaudited)
Fund At A Glance
March 31, 2023
| | | | | | | | | | |
| | | | | | | | | |
| | | | | | | | | |
| | | | | | | | | |
| 5 Top Contributors - Equity Sleeve Holdings | 5 Top Detractors - Equity Sleeve Holdings |
| | Average
Weight | | Relative
Contribution | | | Average
Weight | | Relative
Contribution |
| Lam Research Corp | 1.95% | | 0.48% | | UnitedHealth Group Inc | 3.76% | | -0.53% |
| NIKE Inc - Class B | 1.87% | | 0.41% | | Dollar General Corp | 1.62% | | -0.46% |
| NVIDIA Corp | 1.75% | | 0.33% | | ConocoPhillips | 1.76% | | -0.25% |
| Mastercard Inc | 3.56% | | 0.30% | | Bank of America Corp | 2.02% | | -0.25% |
| Booking Holdings Inc | 0.87% | | 0.24% | | Hasbro Inc | 0.47% | | -0.19% |
| | | | | | | |
| 5 Top Contributors - Equity Sleeve Sectors* | | | | | |
| | | Relative | | Equity Sleeve | S&P 500 Index |
| | | Contribution | | Average Weight | Average Weight |
| Consumer Discretionary | | 1.22% | | 14.68% | 10.46% |
| Financials | | 0.62% | | 13.21% | 11.62% |
| Information Technology | | 0.47% | | 26.58% | 26.45% |
| Utilities | | 0.33% | | 0.00% | 2.99% |
| Health Care | | 0.27% | | 16.20% | 15.03% |
| | | | | | |
| | | | | | |
| 5 Top Detractors - Equity Sleeve Sectors* | | | | | |
| | | Relative | | Equity Sleeve | S&P 500 Index |
| | | Contribution | | Average Weight | Average Weight |
| Communication Services | | -0.50% | | 7.04% | 7.66% |
| Energy | | -0.49% | | 2.26% | 5.05% |
| Materials | | -0.27% | | 1.43% | 2.69% |
| Industrials | | -0.19% | | 10.62% | 8.44% |
| Consumer Staples | | -0.03% | | 7.53% | 6.93% |
| | | | | | | |
| Relative contribution reflects how the portolio's holdings impacted return relative to the benchmark. Cash and securities not held in the portfolio are not shown. For equity portfolios, relative contribution compares the performance of a security in the portfolio to the benchmark's total return, factoring in the difference in weight of that security in the benchmark. Returns are calculated using daily returns and previous day ending weights rolled up by ticker, excluding fixed income securities, gross of advisory fees, may exclude certain derivatives and will differ from actual performance.
Performance attribution reflects returns gross of advisory fees and may differ from actual returns as they are based on end of day holdings. Attribution is calculated by geometrically linking daily returns for the portfolio and index. |
* | Based on sector classification according to the Global Industry Classification Standard (“GICS”) codes, which are the exclusive property and a service mark of MSCI Inc. and Standard & Poor’s. |
Janus Henderson Balanced Fund (unaudited)
Fund At A Glance
March 31, 2023
| | |
5 Largest Equity Holdings - (% of Net Assets) |
Microsoft Corp | |
Software | 5.1% |
Apple Inc | |
Technology Hardware, Storage & Peripherals | 3.3% |
Alphabet Inc - Class C | |
Interactive Media & Services | 2.2% |
Mastercard Inc | |
Diversified Financial Services | 2.2% |
UnitedHealth Group Inc | |
Health Care Providers & Services | 1.9% |
| | 14.7% |
| | | | | | |
Asset Allocation - (% of Net Assets) | |
Common Stocks | | 60.3% | |
Mortgage-Backed Securities | | 11.4% | |
United States Treasury Notes/Bonds | | 11.0% | |
Corporate Bonds | | 8.4% | |
Asset-Backed/Commercial Mortgage-Backed Securities | | 8.2% | |
Investment Companies | | 3.2% | |
Other | | (2.5)% |
| | | 100.0% |
| | |
Top Country Allocations - Long Positions - (% of Investment Securities) |
As of March 31, 2023 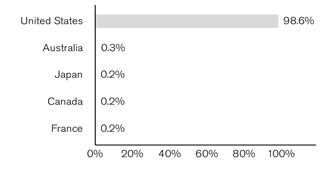
| As of September 30, 2022 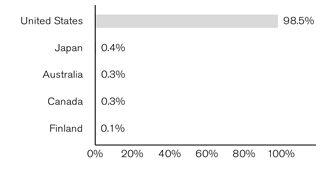
|
Janus Henderson Balanced Fund (unaudited)
Performance
| |
See important disclosures on the next page. |
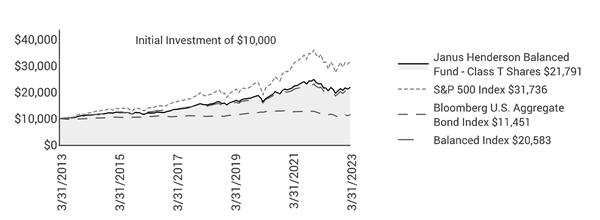
| | | | | | | | | | | |
| | | | | | | | | |
| | | | | | | | | | |
Average Annual Total Return - for the periods ended March 31, 2023 | | | Prospectus Expense Ratios |
| | Fiscal
Year-to-Date | One
Year | Five
Year | Ten
Year | Since
Inception* | | | Total Annual Fund
Operating Expenses‡ |
Class A Shares at NAV | | 10.94% | -6.49% | 7.37% | 7.99% | 9.27% | | | 0.89% |
Class A Shares at MOP | | 4.56% | -11.86% | 6.11% | 7.36% | 9.06% | | | |
Class C Shares at NAV | | 10.52% | -7.16% | 6.62% | 7.23% | 8.59% | | | 1.64% |
Class C Shares at CDSC | | 9.52% | -8.07% | 6.62% | 7.23% | 8.59% | | | |
Class D Shares | | 11.03% | -6.32% | 7.59% | 8.21% | 9.38% | | | 0.70% |
Class I Shares | | 11.08% | -6.27% | 7.65% | 8.29% | 9.42% | | | 0.66% |
Class N Shares | | 11.11% | -6.20% | 7.72% | 8.37% | 9.43% | | | 0.57% |
Class R Shares | | 10.70% | -6.88% | 6.93% | 7.56% | 8.88% | | | 1.32% |
Class S Shares | | 10.81% | -6.68% | 7.19% | 7.83% | 9.12% | | | 1.07% |
Class T Shares | | 10.96% | -6.43% | 7.47% | 8.10% | 9.33% | | | 0.82% |
S&P 500 Index | | 15.62% | -7.73% | 11.19% | 12.24% | 9.91% | | | |
Bloomberg U.S. Aggregate Bond Index | | 4.89% | -4.78% | 0.91% | 1.36% | 4.60% | | | |
Balanced Index | | 10.84% | -6.10% | 6.83% | 7.49% | 7.80% | | | |
Morningstar Quartile - Class T Shares | | - | 3rd | 1st | 1st | 1st | | | |
Morningstar Ranking - based on total returns for Allocation - 50% to 70% Equity Funds | | - | 381/746 | 44/691 | 38/605 | 15/185 | | | |
Returns quoted are past performance and do not guarantee future results; current performance may be lower or higher. Investment returns and principal value will vary; there may be a gain or loss when shares are sold. For the most recent month-end performance call 800.668.0434 (or 800.525.3713 if you hold shares directly with Janus Henderson) or visit janushenderson.com/performance (or janushenderson.com/allfunds if you hold shares directly with Janus Henderson).
Maximum Offering Price (MOP) returns include the maximum sales charge of 5.75%. Net Asset Value (NAV) returns exclude this charge, which would have reduced returns.
CDSC returns include a 1% contingent deferred sales charge (CDSC) on Shares redeemed within 12 months of purchase. Net Asset Value (NAV) returns exclude this charge, which would have reduced returns.
Janus Henderson Balanced Fund (unaudited)
Performance
Performance may be affected by risks that include those associated with foreign and emerging markets, fixed income securities, high-yield and high-risk securities, undervalued, overlooked and smaller capitalization companies, real estate related securities including Real Estate Investment Trusts (REITs), Environmental, Social and Governance (ESG) factors, non-diversification, portfolio turnover, derivatives, short sales, initial public offerings (IPOs) and potential conflicts of interest. Each product has different risks. Please see the prospectus for more information about risks, holdings and other details.
Returns include reinvestment of all dividends and distributions and do not reflect the deduction of taxes that a shareholder would pay on Fund distributions or redemptions of Fund shares. The returns do not include adjustments in accordance with generally accepted accounting principles required at the period end for financial reporting purposes.
Class A Shares, Class C Shares, Class R Shares, and Class S Shares commenced operations on July 6, 2009. Performance shown for each class for periods prior to July 6, 2009, reflects the performance of the Fund’s Class J Shares, the initial share class (renamed Class T Shares effective February 16, 2010), calculated using the fees and expenses of each respective class, without the effect of any fee and expense limitations or waivers.
Class D Shares commenced operations on February 16, 2010. Performance shown for periods prior to February 16, 2010, reflects the performance of the Fund’s former Class J Shares, calculated using the fees and expenses in effect during the periods shown, net of any applicable fee and expense limitations or waivers.
Class I Shares commenced operations on July 6, 2009. Performance shown for periods prior to July 6, 2009, reflects the performance of the Fund’s former Class J Shares, calculated using the fees and expenses of Class J Shares, net of any applicable fee and expense limitations or waivers.
Class N Shares commenced operations on May 31, 2012. Performance shown for periods prior to May 31, 2012, reflects the performance of the Fund’s Class T Shares, calculated using the fees and expenses of Class T Shares, net of any applicable fee and expense limitations or waivers.
If each share class of the Fund had been available during periods prior to its commencement, the performance shown may have been different. The performance shown for periods following the Fund’s commencement of each share class reflects the fees and expenses of each respective share class, net of any applicable fee and expense limitations or waivers. Please refer to the Fund’s prospectuses for further details concerning historical performance.
Ranking is for the share class shown only; other classes may have different performance characteristics. When an expense waiver is in effect, it may have a material effect on the total return, and therefore the ranking for the period.
© 2023 Morningstar, Inc. All Rights Reserved.
There is no assurance that the investment process will consistently lead to successful investing.
See Notes to Schedule of Investments and Other Information for index definitions.
Index performance does not reflect the expenses of managing a portfolio as an index is unmanaged and not available for direct investment.
See “Useful Information About Your Fund Report.”
*The Fund’s inception date – September 1, 1992
‡ As stated in the prospectus. See Financial Highlights for actual expense ratios during the reporting period.
Janus Henderson Balanced Fund (unaudited)
Expense Examples
As a shareholder of the Fund, you incur two types of costs: (1) transaction costs, such as sales charges (loads) on purchase payments (applicable to Class A Shares only); and (2) ongoing costs, including management fees; 12b-1 distribution and shareholder servicing fees; transfer agent fees and expenses payable pursuant to the Transfer Agency Agreement; and other Fund expenses. This example is intended to help you understand your ongoing costs (in dollars) of investing in the Fund and to compare these costs with the ongoing costs of investing in other mutual funds. To do so, compare this 5% hypothetical example with the 5% hypothetical examples that appear in the shareholder reports of the other funds. The example is based upon an investment of $1,000 invested at the beginning of the period and held for the six-months indicated, unless noted otherwise in the table and footnotes below.
Actual Expenses
The information in the table under the heading “Actual” provides information about actual account values and actual expenses. You may use the information in these columns, together with the amount you invested, to estimate the expenses that you paid over the period. Simply divide your account value by $1,000 (for example, an $8,600 account value divided by $1,000 = 8.6), then multiply the result by the number in the appropriate column for your share class under the heading entitled “Expenses Paid During Period” to estimate the expenses you paid on your account during the period.
Hypothetical Example for Comparison Purposes
The information in the table under the heading “Hypothetical (5% return before expenses)” provides information about hypothetical account values and hypothetical expenses based upon the Fund’s actual expense ratio and an assumed rate of return of 5% per year before expenses, which is not the Fund’s actual return. The hypothetical account values and expenses may not be used to estimate the actual ending account balance or expenses you paid for the period. You may use this information to compare the ongoing costs of investing in the Fund and other funds. To do so, compare this 5% hypothetical example with the 5% hypothetical examples that appear in the shareholder reports of the other funds. Additionally, for an analysis of the fees associated with an investment in any share class or other similar funds, please visit www.finra.org/fundanalyzer.
Please note that the expenses shown in the table are meant to highlight your ongoing costs only and do not reflect any transaction costs. These fees are fully described in the Fund’s prospectuses. Therefore, the hypothetical examples are useful in comparing ongoing costs only, and will not help you determine the relative total costs of owning different funds. In addition, if these transaction costs were included, your costs would have been higher.
| | | | | | | | | | | |
| | | | | | | | |
| | | Actual | | Hypothetical
(5% return before expenses) | |
| Beginning
Account
Value
(10/1/22) | Ending
Account
Value
(3/31/23) | Expenses
Paid During
Period
(10/1/22 - 3/31/23)† | | Beginning
Account
Value
(10/1/22) | Ending
Account
Value
(3/31/23) | Expenses
Paid During
Period
(10/1/22 - 3/31/23)† | Net Annualized
Expense Ratio
(10/1/22 - 3/31/23) |
Class A Shares | $1,000.00 | $1,109.40 | $4.68 | | $1,000.00 | $1,020.49 | $4.48 | 0.89% |
Class C Shares | $1,000.00 | $1,105.20 | $8.29 | | $1,000.00 | $1,017.05 | $7.95 | 1.58% |
Class D Shares | $1,000.00 | $1,110.30 | $3.74 | | $1,000.00 | $1,021.39 | $3.58 | 0.71% |
Class I Shares | $1,000.00 | $1,110.80 | $3.53 | | $1,000.00 | $1,021.59 | $3.38 | 0.67% |
Class N Shares | $1,000.00 | $1,111.10 | $3.00 | | $1,000.00 | $1,022.09 | $2.87 | 0.57% |
Class R Shares | $1,000.00 | $1,107.00 | $6.93 | | $1,000.00 | $1,018.35 | $6.64 | 1.32% |
Class S Shares | $1,000.00 | $1,108.10 | $5.62 | | $1,000.00 | $1,019.60 | $5.39 | 1.07% |
Class T Shares | $1,000.00 | $1,109.60 | $4.26 | | $1,000.00 | $1,020.89 | $4.08 | 0.81% |
† | Expenses Paid During Period are equal to the Net Annualized Expense Ratio multiplied by the average account value over the period, multiplied by 182/365 (to reflect the one-half year period). Expenses in the examples include the effect of applicable fee waivers and/or expense reimbursements, if any. Had such waivers and/or reimbursements not been in effect, your expenses would have been higher. Please refer to the Notes to Financial Statements or the Fund’s prospectuses for more information regarding waivers and/or reimbursements. |
Janus Henderson Balanced Fund
Schedule of Investments (unaudited)
March 31, 2023
| | | | | | | | |
Shares or
Principal Amounts | | | Value | |
Asset-Backed/Commercial Mortgage-Backed Securities– 8.2% | | | |
| | 208 Park Avenue Mortgage Trust 2017-280P, | | | | | | |
| | ICE LIBOR USD 1 Month + 0.8800%, 5.5990%, 9/15/34 (144A)‡ | | $11,417,538 | | | $11,083,218 | |
| | ACC Auto Trust 2022-A A, 4.5800%, 7/15/26 (144A) | | 5,699,774 | | | 5,604,386 | |
| | Affirm Asset Securitization Trust 2021-B A, 1.0300%, 8/17/26 (144A) | | 12,148,000 | | | 11,742,648 | |
| | Aimco 2020-11A AR, | | | | | | |
| | ICE LIBOR USD 3 Month + 1.1300%, 5.9224%, 10/17/34 (144A)‡ | | 5,821,000 | | | 5,668,071 | |
| | Angel Oak Mortgage Trust I LLC 2019-5, 2.5930%, 10/25/49 (144A)‡ | | 1,448,404 | | | 1,388,093 | |
| | Angel Oak Mortgage Trust I LLC 2019-6, | | | | | | |
| | ICE LIBOR USD 12 Month + 0.9500%, 2.6200%, 11/25/59 (144A)‡ | | 1,261,337 | | | 1,185,208 | |
| | Angel Oak Mortgage Trust I LLC 2020-3, | | | | | | |
| | ICE LIBOR USD 12 Month + 1.0000%, 2.4100%, 4/25/65 (144A)‡ | | 3,074,830 | | | 2,820,201 | |
| | Aqua Finance Trust 2021-A A, 1.5400%, 7/17/46 (144A) | | 5,130,118 | | | 4,629,393 | |
| | ARES CLO Ltd 2021-60A A, | | | | | | |
| | ICE LIBOR USD 3 Month + 1.1200%, 5.9147%, 7/18/34 (144A)‡ | | 5,454,000 | | | 5,304,669 | |
| | Arivo Acceptance Auto Loan Receivables 2022-1A A, 3.9300%, 5/15/28 (144A) | | 5,959,073 | | | 5,827,141 | |
| | Babson CLO Ltd 2018-3A A1, | | | | | | |
| | ICE LIBOR USD 3 Month + 0.9500%, 5.7577%, 7/20/29 (144A)‡ | | 8,340,104 | | | 8,288,787 | |
| | Babson CLO Ltd 2019-3A A1R, | | | | | | |
| | ICE LIBOR USD 3 Month + 1.0700%, 5.8777%, 4/20/31 (144A)‡ | | 22,450,000 | | | 22,153,525 | |
| | Babson CLO Ltd 2020-4A A, | | | | | | |
| | ICE LIBOR USD 3 Month + 1.2200%, 6.0277%, 1/20/32 (144A)‡ | | 7,293,853 | | | 7,193,205 | |
| | Barclays Commercial Mortgage Securities LLC 2015-SRCH, | | | | | | |
| | 4.1970%, 8/10/35 (144A) | | 8,386,000 | | | 7,658,414 | |
| | Barclays Commercial Mortgage Securities LLC 2017-DELC, | | | | | | |
| | ICE LIBOR USD 1 Month + 0.9750%, 5.6594%, 8/15/36 (144A)‡ | | 7,553,000 | | | 7,481,478 | |
| | BPR Trust 2022-OANA A, | | | | | | |
| | CME Term SOFR 1 Month + 1.8980%, 6.7251%, 4/15/37 (144A)‡ | | 33,039,000 | | | 31,746,779 | |
| | BX Commercial Mortgage Trust 2019-OC11, 3.6050%, 12/9/41 (144A) | | 4,134,000 | | | 3,462,507 | |
| | BX Commercial Mortgage Trust 2019-OC11, 3.8560%, 12/9/41 (144A) | | 8,218,000 | | | 6,816,188 | |
| | BX Commercial Mortgage Trust 2019-XL, | | | | | | |
| | CME Term SOFR 1 Month + 1.0345%, 5.8616%, 10/15/36 (144A)‡ | | 20,264,599 | | | 20,033,264 | |
| | BX Commercial Mortgage Trust 2019-XL, | | | | | | |
| | CME Term SOFR 1 Month + 1.1945%, 6.0216%, 10/15/36 (144A)‡ | | 6,531,400 | | | 6,410,841 | |
| | BX Commercial Mortgage Trust 2020-VKNG A, | | | | | | |
| | CME Term SOFR 1 Month + 1.0445%, 5.8716%, 10/15/37 (144A)‡ | | 3,140,315 | | | 3,064,011 | |
| | BX Commercial Mortgage Trust 2021-LBA AJV, | | | | | | |
| | CME Term SOFR 1 Month + 0.9145%, 5.7425%, 2/15/36 (144A)‡ | | 18,764,000 | | | 17,899,036 | |
| | BX Commercial Mortgage Trust 2021-LBA AV, | | | | | | |
| | CME Term SOFR 1 Month + 0.9145%, 5.7425%, 2/15/36 (144A)‡ | | 18,857,000 | | | 17,970,443 | |
| | BX Commercial Mortgage Trust 2021-VINO A, | | | | | | |
| | ICE LIBOR USD 1 Month + 0.6523%, 5.3363%, 5/15/38 (144A)‡ | | 18,990,000 | | | 18,229,401 | |
| | BX Commercial Mortgage Trust 2021-VOLT B, | | | | | | |
| | ICE LIBOR USD 1 Month + 0.9500%, 5.6344%, 9/15/36 (144A)‡ | | 15,945,000 | | | 15,127,977 | |
| | BX Commercial Mortgage Trust 2021-VOLT D, | | | | | | |
| | ICE LIBOR USD 1 Month + 1.6500%, 6.3344%, 9/15/36 (144A)‡ | | 16,692,000 | | | 15,676,691 | |
| | BX Commercial Mortgage Trust 2022-FOX2 A2, | | | | | | |
| | CME Term SOFR 1 Month + 0.7492%, 5.5763%, 4/15/39 (144A)‡ | | 18,896,717 | | | 17,766,582 | |
| | BXP Trust 2017-GM, 3.3790%, 6/13/39 (144A) | | 4,190,000 | | | 3,833,289 | |
| | Carvana Auto Receivables Trust 2021-P4 A2, 0.8200%, 4/10/25 | | 3,109,879 | | | 3,084,361 | |
| | CBAM CLO Management 2019-11RA A1, | | | | | | |
| | ICE LIBOR USD 3 Month + 1.1800%, 5.4226%, 1/20/35 (144A)‡ | | 16,984,000 | | | 16,529,729 | |
| | CBAM CLO Management 2019-11RA B, | | | | | | |
| | ICE LIBOR USD 3 Month + 1.7500%, 5.9926%, 1/20/35 (144A)‡ | | 6,819,244 | | | 6,431,631 | |
| | Cedar Funding Ltd 2019-11A A1R, | | | | | | |
| | ICE LIBOR USD 3 Month + 1.0500%, 5.7839%, 5/29/32 (144A)‡ | | 21,276,000 | | | 20,919,542 | |
| | CF Hippolyta Issuer LLC 2021-1A A1, 1.5300%, 3/15/61 (144A) | | 15,921,877 | | | 14,040,453 | |
| | CF Hippolyta Issuer LLC 2021-1A B1, 1.9800%, 3/15/61 (144A) | | 6,012,431 | | | 4,916,907 | |
| | CF Hippolyta Issuer LLC 2022-1A A1, 5.9700%, 8/15/62 (144A) | | 21,399,275 | | | 20,834,687 | |
| | CF Hippolyta Issuer LLC 2022-1A A2, 6.1100%, 8/15/62 (144A) | | 50,015,634 | | | 47,863,977 | |
| | Chase Auto Credit Linked Notes 2021-1 B, 0.8750%, 9/25/28 (144A) | | 2,552,708 | | | 2,473,480 | |
| | |
See Notes to Schedule of Investments and Other Information and Notes to Financial Statements. |
| |
6 | MARCH 31, 2023 |
Janus Henderson Balanced Fund
Schedule of Investments (unaudited)
March 31, 2023
| | | | | | | | |
Shares or
Principal Amounts | | | Value | |
Asset-Backed/Commercial Mortgage-Backed Securities– (continued) | | | |
| | Chase Auto Credit Linked Notes 2021-2 B, 0.8890%, 12/26/28 (144A) | | $5,802,625 | | | $5,602,638 | |
| | Chase Mortgage Finance Corp 2021-CL1 M1, | | | | | | |
| | US 30 Day Average SOFR + 1.2000%, 5.7598%, 2/25/50 (144A)‡ | | 15,412,562 | | | 13,908,715 | |
| | CIFC Funding Ltd 2018-3A A, | | | | | | |
| | ICE LIBOR USD 3 Month + 1.1000%, 5.8947%, 7/18/31 (144A)‡ | | 10,918,000 | | | 10,769,362 | |
| | | | | | | | |
| | CIFC Funding Ltd 2021-4A A, | | | | | | |
| | ICE LIBOR USD 3 Month + 1.0500%, 5.8424%, 7/15/33 (144A)‡ | | 19,742,995 | | | 19,292,223 | |
| | CIFC Funding Ltd 2021-7A B, | | | | | | |
| | ICE LIBOR USD 3 Month + 1.6000%, 6.4153%, 1/23/35 (144A)‡ | | 5,524,216 | | | 5,314,003 | |
| | CIM Trust 2021-NR1 A1, 2.5690%, 7/25/55 (144A)Ç | | 7,794,858 | | | 7,417,584 | |
| | Cold Storage Trust 2020-ICE5 A, | | | | | | |
| | ICE LIBOR USD 1 Month + 0.9000%, 5.5844%, 11/15/37 (144A)‡ | | 24,568,865 | | | 23,904,242 | |
| | Cold Storage Trust 2020-ICE5 B, | | | | | | |
| | ICE LIBOR USD 1 Month + 1.3000%, 5.9844%, 11/15/37 (144A)‡ | | 10,924,957 | | | 10,580,752 | |
| | Cold Storage Trust 2020-ICE5 C, | | | | | | |
| | ICE LIBOR USD 1 Month + 1.6500%, 6.3344%, 11/15/37 (144A)‡ | | 10,966,242 | | | 10,576,955 | |
| | COLT Funding LLC 2020-2, | | | | | | |
| | ICE LIBOR USD 12 Month + 1.5000%, 1.8530%, 3/25/65 (144A)‡ | | 253,129 | | | 247,379 | |
| | COLT Funding LLC 2020-3, | | | | | | |
| | ICE LIBOR USD 12 Month + 1.2000%, 1.5060%, 4/27/65 (144A)‡ | | 1,102,315 | | | 1,020,313 | |
| | Connecticut Avenue Securities Trust 2014-C04, | | | | | | |
| | ICE LIBOR USD 1 Month + 4.9000%, 9.7453%, 11/25/24‡ | | 668,496 | | | 696,429 | |
| | Connecticut Avenue Securities Trust 2015-C01 1M2, | | | | | | |
| | ICE LIBOR USD 1 Month + 4.3000%, 9.1453%, 2/25/25‡ | | 3,998,651 | | | 4,123,484 | |
| | Connecticut Avenue Securities Trust 2018-R07, | | | | | | |
| | ICE LIBOR USD 1 Month + 2.4000%, 7.2453%, 4/25/31 (144A)‡ | | 1,139,805 | | | 1,140,074 | |
| | Connecticut Avenue Securities Trust 2019-R02, | | | | | | |
| | ICE LIBOR USD 1 Month + 2.3000%, 7.1453%, 8/25/31 (144A)‡ | | 281,587 | | | 281,588 | |
| | Connecticut Avenue Securities Trust 2019-R03, | | | | | | |
| | ICE LIBOR USD 1 Month + 2.1500%, 6.9953%, 9/25/31 (144A)‡ | | 530,998 | | | 530,776 | |
| | Connecticut Avenue Securities Trust 2019-R07, | | | | | | |
| | ICE LIBOR USD 1 Month + 2.1000%, 6.9453%, 10/25/39 (144A)‡ | | 783,172 | | | 783,392 | |
| | Connecticut Avenue Securities Trust 2021-R02 2M2, | | | | | | |
| | US 30 Day Average SOFR + 2.0000%, 6.5598%, 11/25/41 (144A)‡ | | 32,659,000 | | | 30,292,409 | |
| | Connecticut Avenue Securities Trust 2021-R03 1M2, | | | | | | |
| | US 30 Day Average SOFR + 1.6500%, 6.2098%, 12/25/41 (144A)‡ | | 10,646,000 | | | 10,077,892 | |
| | Connecticut Avenue Securities Trust 2022-R02 2M2, | | | | | | |
| | US 30 Day Average SOFR + 3.0000%, 7.5598%, 1/25/42 (144A)‡ | | 12,368,000 | | | 11,719,648 | |
| | Connecticut Avenue Securities Trust 2022-R03 1M1, | | | | | | |
| | US 30 Day Average SOFR + 2.1000%, 6.6598%, 3/25/42 (144A)‡ | | 21,750,929 | | | 21,698,817 | |
| | Connecticut Avenue Securities Trust 2022-R04 1M1, | | | | | | |
| | US 30 Day Average SOFR + 2.0000%, 6.5598%, 3/25/42 (144A)‡ | | 9,335,367 | | | 9,312,150 | |
| | Connecticut Avenue Securities Trust 2022-R05 2M1, | | | | | | |
| | US 30 Day Average SOFR + 1.9000%, 6.4598%, 4/25/42 (144A)‡ | | 10,145,647 | | | 10,127,394 | |
| | Connecticut Avenue Securities Trust 2022-R05 2M2, | | | | | | |
| | US 30 Day Average SOFR + 3.0000%, 7.5598%, 4/25/42 (144A)‡ | | 9,001,000 | | | 8,772,901 | |
| | Connecticut Avenue Securities Trust 2022-R06 1M1, | | | | | | |
| | US 30 Day Average SOFR + 2.7500%, 7.3098%, 5/25/42 (144A)‡ | | 6,917,085 | | | 7,002,632 | |
| | Connecticut Avenue Securities Trust 2022-R08 1M1, | | | | | | |
| | US 30 Day Average SOFR + 2.5500%, 7.1098%, 7/25/42 (144A)‡ | | 5,633,739 | | | 5,668,902 | |
| | Connecticut Avenue Securities Trust 2022-R09 2M1, | | | | | | |
| | US 30 Day Average SOFR + 2.5000%, 7.0682%, 9/25/42 (144A)‡ | | 20,754,272 | | | 20,739,702 | |
| | Connecticut Avenue Securities Trust 2023-R01 1M1, | | | | | | |
| | US 30 Day Average SOFR + 2.4000%, 6.9682%, 12/25/42 (144A)‡ | | 9,462,736 | | | 9,448,736 | |
| | Consumer Loan Underlying Bond Credit Trust 2019-P2 C, | | | | | | |
| | 4.4100%, 10/15/26 (144A) | | 1,312,638 | | | 1,308,884 | |
| | Consumer Loan Underlying Bond Credit Trust 2020-P1 C, | | | | | | |
| | 4.6100%, 3/15/28 (144A) | | 685,084 | | | 680,998 | |
| | CP EF Asset Securitization I LLC 2002-1A A, 5.9600%, 4/15/30 (144A) | | 7,860,943 | | | 7,775,684 | |
| | |
See Notes to Schedule of Investments and Other Information and Notes to Financial Statements. |
| |
Janus Investment Fund | 7 |
Janus Henderson Balanced Fund
Schedule of Investments (unaudited)
March 31, 2023
| | | | | | | | |
Shares or
Principal Amounts | | | Value | |
Asset-Backed/Commercial Mortgage-Backed Securities– (continued) | | | |
| | Credit Suisse Commercial Mortgage Trust 2019-ICE4, | | | | | | |
| | ICE LIBOR USD 1 Month + 0.9800%, 5.6640%, 5/15/36 (144A)‡ | | $26,496,081 | | | $26,211,895 | |
| | Credit Suisse Commercial Mortgage Trust 2019-ICE4 C, | | | | | | |
| | ICE LIBOR USD 1 Month + 1.4300%, 6.1140%, 5/15/36 (144A)‡ | | 5,494,331 | | | 5,391,887 | |
| | Credit Suisse Commercial Mortgage Trust 2021-WEHO A, | | | | | | |
| | ICE LIBOR USD 1 Month + 3.9693%, 8.6543%, 4/15/23 (144A)‡ | | 12,440,454 | | | 12,144,296 | |
| | Diamond Infrastructure Funding LLC 2021-1A A, 1.7600%, 4/15/49 (144A) | | 17,354,000 | | | 14,851,874 | |
| | Dryden Senior Loan Fund 2020-83A A, | | | | | | |
| | ICE LIBOR USD 3 Month + 1.2200%, 6.0147%, 1/18/32 (144A)‡ | | 7,111,119 | | | 7,013,099 | |
| | Elmwood CLO VIII Ltd 2019-2A AR, | | | | | | |
| | ICE LIBOR USD 3 Month + 1.1500%, 5.9577%, 4/20/34 (144A)‡ | | 8,217,000 | | | 8,031,723 | |
| | Exeter Automobile Receivables Trust 2019-1, 5.2000%, 1/15/26 (144A) | | 8,200,000 | | | 8,146,689 | |
| | Exeter Automobile Receivables Trust 2021-1A D, 1.0800%, 11/16/26 | | 11,355,000 | | | 10,695,319 | |
| | Extended Stay America Trust 2021-ESH A, | | | | | | |
| | ICE LIBOR USD 1 Month + 1.0800%, 5.7650%, 7/15/38 (144A)‡ | | 8,882,373 | | | 8,610,093 | |
| | Fannie Mae Connecticut Avenue Securities, | | | | | | |
| | ICE LIBOR USD 1 Month + 5.0000%, 9.8453%, 7/25/25‡ | | 3,090,415 | | | 3,214,157 | |
| | Fannie Mae REMICS, 3.0000%, 5/25/48 | | 7,730,344 | | | 7,144,700 | |
| | Fannie Mae REMICS, 3.0000%, 11/25/49 | | 10,270,739 | | | 9,362,917 | |
| | Flagstar Mortgage Trust 2021-13IN A2, 3.0000%, 12/30/51 (144A)‡ | | 33,033,398 | | | 27,826,492 | |
| | Foursight Capital Auto Receivables Trust 2021-1 B, 0.8700%, 1/15/26 (144A) | | 6,135,485 | | | 6,053,215 | |
| | Freddie Mac Structured Agency Credit Risk Debt Notes 2019-DNA4 M2, | | | | | | |
| | ICE LIBOR USD 1 Month + 1.9500%, 6.7953%, 10/25/49 (144A)‡ | | 277,797 | | | 277,109 | |
| | Freddie Mac Structured Agency Credit Risk Debt Notes 2020-DNA6 M2, | | | | | | |
| | US 30 Day Average SOFR + 2.0000%, 6.5598%, 12/25/50 (144A)‡ | | 14,211,718 | | | 14,211,638 | |
| | Freddie Mac Structured Agency Credit Risk Debt Notes 2020-HQA2 M2, | | | | | | |
| | ICE LIBOR USD 1 Month + 3.1000%, 7.9453%, 3/25/50 (144A)‡ | | 4,462,835 | | | 4,552,358 | |
| | Freddie Mac Structured Agency Credit Risk Debt Notes 2020-HQA5 M2, | | | | | | |
| | US 30 Day Average SOFR + 2.6000%, 7.1598%, 11/25/50 (144A)‡ | | 15,664,839 | | | 15,669,302 | |
| | Freddie Mac Structured Agency Credit Risk Debt Notes 2021-DNA2 M2, | | | | | | |
| | US 30 Day Average SOFR + 2.3000%, 6.8598%, 8/25/33 (144A)‡ | | 10,269,549 | | | 10,102,107 | |
| | Freddie Mac Structured Agency Credit Risk Debt Notes 2021-DNA7 M1, | | | | | | |
| | US 30 Day Average SOFR + 0.8500%, 5.4098%, 11/25/41 (144A)‡ | | 12,000,147 | | | 11,821,418 | |
| | Freddie Mac Structured Agency Credit Risk Debt Notes 2021-HQA1 M2, | | | | | | |
| | US 30 Day Average SOFR + 2.2500%, 6.8098%, 8/25/33 (144A)‡ | | 23,429,000 | | | 22,546,696 | |
| | Freddie Mac Structured Agency Credit Risk Debt Notes 2021-HQA4 M1, | | | | | | |
| | US 30 Day Average SOFR + 0.9500%, 5.5098%, 12/25/41 (144A)‡ | | 21,878,691 | | | 21,075,746 | |
| | Freddie Mac Structured Agency Credit Risk Debt Notes 2022-DNA2 M1A, | | | | | | |
| | US 30 Day Average SOFR + 1.3000%, 5.8598%, 2/25/42 (144A)‡ | | 4,673,534 | | | 4,629,909 | |
| | Freddie Mac Structured Agency Credit Risk Debt Notes 2022-DNA3 M1A, | | | | | | |
| | US 30 Day Average SOFR + 2.0000%, 6.5598%, 4/25/42 (144A)‡ | | 4,404,466 | | | 4,403,538 | |
| | Freddie Mac Structured Agency Credit Risk Debt Notes 2022-DNA5 M1A, | | | | | | |
| | US 30 Day Average SOFR + 2.9500%, 7.5098%, 6/25/42 (144A)‡ | | 13,901,611 | | | 14,083,225 | |
| | Freddie Mac Structured Agency Credit Risk Debt Notes 2022-DNA6 M1A, | | | | | | |
| | US 30 Day Average SOFR + 2.1500%, 6.7098%, 9/25/42 (144A)‡ | | 3,577,257 | | | 3,577,847 | |
| | Freddie Mac Structured Agency Credit Risk Debt Notes 2022-HQA1 M1A, | | | | | | |
| | US 30 Day Average SOFR + 2.1000%, 6.6598%, 3/25/42 (144A)‡ | | 9,516,713 | | | 9,505,234 | |
| | Freddie Mac Structured Agency Credit Risk Debt Notes 2022-HQA2 M1A, | | | | | | |
| | US 30 Day Average SOFR + 2.6500%, 7.2098%, 7/25/42 (144A)‡ | | 7,172,179 | | | 7,235,242 | |
| | Freddie Mac Structured Agency Credit Risk Debt Notes 2022-HQA3 M1A, | | | | | | |
| | US 30 Day Average SOFR + 2.3000%, 6.8598%, 8/25/42 (144A)‡ | | 6,433,679 | | | 6,451,732 | |
| | FREED ABS Trust 2019-2 C, 4.8600%, 11/18/26 (144A) | | 508,667 | | | 508,285 | |
| | FREED ABS Trust 2022-3FP A, 4.5000%, 8/20/29 (144A) | | 3,225,739 | | | 3,220,541 | |
| | GCAT 2022-INV1 A1, 3.0000%, 12/25/51 (144A)‡ | | 42,338,769 | | | 35,615,890 | |
| | Great Wolf Trust, | | | | | | |
| | CME Term SOFR 1 Month + 1.1485%, 5.9755%, 12/15/36 (144A)‡ | | 19,125,000 | | | 18,691,794 | |
| | Great Wolf Trust, | | | | | | |
| | CME Term SOFR 1 Month + 1.4485%, 6.2755%, 12/15/36 (144A)‡ | | 4,405,000 | | | 4,287,034 | |
| | Great Wolf Trust, | | | | | | |
| | CME Term SOFR 1 Month + 1.7475%, 6.5745%, 12/15/36 (144A)‡ | | 4,900,000 | | | 4,757,614 | |
| | |
See Notes to Schedule of Investments and Other Information and Notes to Financial Statements. |
| |
8 | MARCH 31, 2023 |
Janus Henderson Balanced Fund
Schedule of Investments (unaudited)
March 31, 2023
| | | | | | | | |
Shares or
Principal Amounts | | | Value | |
Asset-Backed/Commercial Mortgage-Backed Securities– (continued) | | | |
| | Highbridge Loan Management Ltd 2021-16A B, | | | | | | |
| | ICE LIBOR USD 3 Month + 1.7000%, 6.5153%, 1/23/35 (144A)‡ | | $5,360,143 | | | $5,124,570 | |
| | JP Morgan Chase Commercial Mortgage Sec Trust 2020-ACE A, | | | | | | |
| | 3.2865%, 1/10/37 (144A) | | 20,581,000 | | | 19,155,268 | |
| | JP Morgan Chase Commercial Mortgage Sec Trust 2020-ACE B, | | | | | | |
| | 3.6401%, 1/10/37 (144A) | | 14,000,000 | | | 12,792,349 | |
| | LAD Auto Receivables Trust 2021-1A A, 1.3000%, 8/17/26 (144A) | | 5,072,055 | | | 4,916,660 | |
| | LAD Auto Receivables Trust 2022-1A A, 5.2100%, 6/15/27 (144A) | | 18,326,236 | | | 18,224,213 | |
| | LCM LP 24A AR, ICE LIBOR USD 3 Month + 0.9800%, 5.7877%, 3/20/30 (144A)‡ | | 6,924,870 | | | 6,827,333 | |
| | Lendbuzz Securitization Trust 2021-1A A, 4.2200%, 5/17/27 (144A)‡ | | 15,427,599 | | | 14,922,478 | |
| | Lendbuzz Securitization Trust 2023-1A A2, 6.9200%, 8/15/28 (144A) | | 8,680,000 | | | 8,681,352 | |
| | Life Financial Services Trust 2021-BMR A, | | | | | | |
| | CME Term SOFR 1 Month + 0.8145%, 5.6415%, 3/15/38 (144A)‡ | | 26,199,103 | | | 25,391,257 | |
| | Life Financial Services Trust 2021-BMR C, | | | | | | |
| | CME Term SOFR 1 Month + 1.2145%, 6.0415%, 3/15/38 (144A)‡ | | 15,119,064 | | | 14,333,940 | |
| | Life Financial Services Trust 2022-BMR2 A1, | | | | | | |
| | CME Term SOFR 1 Month + 1.2952%, 6.1223%, 5/15/39 (144A)‡ | | 36,759,000 | | | 35,802,626 | |
| | Life Financial Services Trust 2022-BMR2 B, | | | | | | |
| | CME Term SOFR 1 Month + 1.7939%, 6.6210%, 5/15/39 (144A)‡ | | 6,155,000 | | | 5,937,549 | |
| | Madison Park Funding Ltd 2019-35A A1R, | | | | | | |
| | ICE LIBOR USD 3 Month + 0.9900%, 5.7977%, 4/20/32 (144A)‡ | | 28,249,000 | | | 27,799,869 | |
| | MED Trust 2021-MDLN E, | | | | | | |
| | ICE LIBOR USD 1 Month + 3.1500%, 7.8350%, 11/15/38 (144A)‡ | | 21,360,541 | | | 19,855,231 | |
| | | | | | | | |
| | Mello Mortgage Capital Acceptance Trust 2021-INV2 A11, | | | | | | |
| | US 30 Day Average SOFR + 0.9500%, 5.0000%, 8/25/51 (144A)‡ | | 11,057,485 | | | 10,032,697 | |
| | Mello Mortgage Capital Acceptance Trust 2021-INV3 A11, | | | | | | |
| | US 30 Day Average SOFR + 0.9500%, 5.0000%, 10/25/51 (144A)‡ | | 13,790,072 | | | 12,512,150 | |
| | Mello Mortgage Capital Acceptance Trust 2021-INV4 A3, | | | | | | |
| | 2.5000%, 12/25/51 (144A)‡ | | 8,356,667 | | | 6,717,001 | |
| | Mello Mortgage Capital Acceptance Trust 2022-INV1 A2, | | | | | | |
| | 3.0000%, 3/25/52 (144A)‡ | | 28,816,962 | | | 24,409,319 | |
| | Mercury Financial Credit Card Master Trust 2023-1A A, | | | | | | |
| | 8.0400%, 9/20/27 (144A) | | 14,553,000 | | | 14,615,888 | |
| | MHC Commercial Mortgage Trust 2021-MHC A, | | | | | | |
| | ICE LIBOR USD 1 Month + 0.8010%, 5.4850%, 4/15/38 (144A)‡ | | 27,729,249 | | | 26,786,866 | |
| | MHC Commercial Mortgage Trust 2021-MHC C, | | | | | | |
| | ICE LIBOR USD 1 Month + 1.3510%, 6.0350%, 4/15/38 (144A)‡ | | 15,653,295 | | | 14,882,420 | |
| | New Economy Assets Phase 1 Issuer LLC 2021-1 B1, 2.4100%, 10/20/61 (144A) | | 8,554,000 | | | 7,287,805 | |
| | New Residential Mortgage Loan Trust 2018-2, | | | | | | |
| | ICE LIBOR USD 6 Month + 0.6800%, 4.5000%, 2/25/58 (144A)‡ | | 1,394,288 | | | 1,337,389 | |
| | NRZ Excess Spread Collateralized Notes 2020-PLS1 A, | | | | | | |
| | 3.8440%, 12/25/25 (144A) | | 3,677,829 | | | 3,431,167 | |
| | NRZ Excess Spread Collateralized Notes 2021-FHT1 A, 3.1040%, 7/25/26 (144A) | | 9,670,254 | | | 8,757,081 | |
| | Oak Street Investment Grade Net Lease Fund 2020-1A A1, | | | | | | |
| | 1.8500%, 11/20/50 (144A) | | 13,027,415 | | | 11,696,404 | |
| | Oasis Securitization 2022-1A A, 4.7500%, 5/15/34 (144A) | | 5,025,726 | | | 4,949,750 | |
| | Oasis Securitization 2022-2A A, 6.8500%, 10/15/34 (144A) | | 5,457,235 | | | 5,429,122 | |
| | Oceanview Mortgage Trust 2021-5 AF, | | | | | | |
| | US 30 Day Average SOFR + 0.8500%, 5.0000%, 11/25/51 (144A)‡ | | 15,518,419 | | | 13,983,070 | |
| | Oceanview Mortgage Trust 2022-1 A1, 3.0000%, 12/25/51 (144A)‡ | | 17,095,699 | | | 14,431,943 | |
| | Oceanview Mortgage Trust 2022-2 A1, 3.0000%, 12/25/51 (144A)‡ | | 31,909,083 | | | 26,944,657 | |
| | Onslow Bay Financial LLC 2021-INV3 A3, 2.5000%, 10/25/51 (144A)‡ | | 9,696,030 | | | 7,861,344 | |
| | Onslow Bay Financial LLC 2022-INV1 A1, 3.0000%, 12/25/51 (144A)‡ | | 32,183,192 | | | 27,138,064 | |
| | Onslow Bay Financial LLC 2022-INV1 A18, 3.0000%, 12/25/51 (144A)‡ | | 13,646,820 | | | 11,142,562 | |
| | Pagaya AI Debt Selection Trust 2022-1 A, 2.0300%, 10/15/29 (144A) | | 7,355,696 | | | 7,114,873 | |
| | Preston Ridge Partners Mortgage Trust 2020-4 A1, 2.9510%, 10/25/25 (144A)Ç | | 9,217,217 | | | 8,937,587 | |
| | Preston Ridge Partners Mortgage Trust 2021-10 A1, 2.4870%, 10/25/26 (144A)Ç | | 23,771,384 | | | 21,914,052 | |
| | Preston Ridge Partners Mortgage Trust 2021-9 A1, 2.3630%, 10/25/26 (144A)Ç | | 17,306,321 | | | 16,126,753 | |
| | Preston Ridge Partners Mortgage Trust 2022-2 A1, 5.0000%, 3/25/27 (144A)Ç | | 24,426,133 | | | 23,795,106 | |
| | |
See Notes to Schedule of Investments and Other Information and Notes to Financial Statements. |
| |
Janus Investment Fund | 9 |
Janus Henderson Balanced Fund
Schedule of Investments (unaudited)
March 31, 2023
| | | | | | | | |
Shares or
Principal Amounts | | | Value | |
Asset-Backed/Commercial Mortgage-Backed Securities– (continued) | | | |
| | Reach Financial LLC 2022-2A A, 6.6300%, 5/15/30 (144A) | | $4,982,104 | | | $4,973,004 | |
| | Regatta XXIII Funding Ltd 2021-4A B, | | | | | | |
| | ICE LIBOR USD 3 Month + 1.7000%, 6.5077%, 1/20/35 (144A)‡ | | 5,891,224 | | | 5,658,597 | |
| | Santander Bank Auto Credit-Linked Notes 2021-1A B, 1.8330%, 12/15/31 (144A) | | 3,050,702 | | | 2,934,682 | |
| | Santander Bank Auto Credit-Linked Notes 2022-A B, 5.2810%, 5/15/32 (144A) | | 12,075,374 | | | 11,756,435 | |
| | Santander Bank Auto Credit-Linked Notes 2022-B A2, 5.5870%, 8/16/32 (144A) | | 4,881,087 | | | 4,870,057 | |
| | Santander Drive Auto Receivables Trust 2020-3 D, 1.6400%, 11/16/26 | | 27,434,000 | | | 26,584,076 | |
| | Sequoia Mortgage Trust 2013-5, 2.5000%, 5/25/43 (144A)‡ | | 2,242,045 | | | 1,938,098 | |
| | Sequoia Mortgage Trust 2020-2, 3.5000%, 3/25/50 (144A)‡ | | 926,778 | | | 825,779 | |
| | SMRT 2022-MINI A, CME Term SOFR 1 Month + 1.0000%, 5.8280%, 1/15/39 (144A)‡ | | 10,990,000 | | | 10,598,371 | |
| | Sound Point CLO Ltd 2019-1A AR, | | | | | | |
| | ICE LIBOR USD 3 Month + 1.0800%, 5.8877%, 1/20/32 (144A)‡ | | 26,345,000 | | | 25,815,255 | |
| | Spruce Hill Mortgage Loan Trust 2020-SH1 A1, | | | | | | |
| | ICE LIBOR USD 12 Month + 0.9500%, 2.5210%, 1/28/50 (144A)‡ | | 102,565 | | | 101,170 | |
| | Spruce Hill Mortgage Loan Trust 2020-SH1 A2, | | | | | | |
| | ICE LIBOR USD 12 Month + 1.0500%, 2.6240%, 1/28/50 (144A)‡ | | 573,829 | | | 565,299 | |
| | SREIT Trust 2021-MFP A, | | | | | | |
| | ICE LIBOR USD 1 Month + 0.7308%, 5.4152%, 11/15/38 (144A)‡ | | 2,350,000 | | | 2,250,710 | |
| | Tesla Auto Lease Trust 2021-B A3, 0.6000%, 9/22/25 (144A) | | 8,570,000 | | | 8,213,952 | |
| | Tesla Auto Lease Trust 2021-B B, 0.9100%, 9/22/25 (144A) | | 4,395,000 | | | 4,140,626 | |
| | Theorem Funding Trust 2021-1A A, 1.2100%, 12/15/27 (144A) | | 5,413,200 | | | 5,347,081 | |
| | THL Credit Wind River CLO Ltd 2019-1A AR, | | | | | | |
| | ICE LIBOR USD 3 Month + 1.1600%, 5.9677%, 7/20/34 (144A)‡ | | 7,594,000 | | | 7,355,571 | |
| | TPI Re-Remic Trust 2022-FRR1 AK33, 0%, 7/25/46 (144A)◊ | | 8,395,000 | | | 8,225,004 | |
| | TPI Re-Remic Trust 2022-FRR1 AK34, 0%, 7/25/46 (144A)◊ | | 6,915,000 | | | 6,774,973 | |
| | TPI Re-Remic Trust 2022-FRR1 AK35, 0%, 8/25/46 (144A)◊ | | 9,375,000 | | | 9,132,363 | |
| | Tricolor Auto Securitization Trust 2022-1A A, 3.3000%, 2/18/25 (144A) | | 1,430,284 | | | 1,420,440 | |
| | United Wholesale Mortgage LLC 2021-INV1 A9, | | | | | | |
| | US 30 Day Average SOFR + 0.9000%, 5.0000%, 8/25/51 (144A)‡ | | 13,192,235 | | | 11,920,029 | |
| | United Wholesale Mortgage LLC 2021-INV4 A3, 2.5000%, 12/25/51 (144A)‡ | | 6,439,915 | | | 5,233,771 | |
| | Upstart Securitization Trust 2021-4 A, 0.8400%, 9/20/31 (144A) | | 4,078,037 | | | 3,982,479 | |
| | Upstart Securitization Trust 2021-5 A, 1.3100%, 11/20/31 (144A) | | 2,951,859 | | | 2,874,272 | |
| | Upstart Securitization Trust 2022-1 A, 3.1200%, 3/20/32 (144A) | | 14,035,410 | | | 13,687,656 | |
| | Upstart Securitization Trust 2022-2 A, 4.3700%, 5/20/32 (144A) | | 19,445,872 | | | 19,129,763 | |
| | Vantage Data Centers LLC 2020-1A A2, 1.6450%, 9/15/45 (144A) | | 17,832,000 | | | 16,062,035 | |
| | Vantage Data Centers LLC 2020-2A A2, 1.9920%, 9/15/45 (144A) | | 11,511,000 | | | 9,714,289 | |
| | VASA Trust 2021-VASA A, | | | | | | |
| | ICE LIBOR USD 1 Month + 0.9000%, 5.5840%, 7/15/39 (144A)‡ | | 8,418,000 | | | 8,006,891 | |
| | VCAT Asset Securitization LLC 2021-NPL1 A1, 2.2891%, 12/26/50 (144A) | | 2,588,456 | | | 2,462,151 | |
| | VMC Finance LLC 2021-HT1 A, | | | | | | |
| | ICE LIBOR USD 1 Month + 1.6500%, 6.4114%, 1/18/37 (144A)‡ | | 10,311,722 | | | 10,006,522 | |
| | Wells Fargo Commercial Mortgage Trust 2021-SAVE A, | | | | | | |
| | ICE LIBOR USD 1 Month + 1.1500%, 5.8340%, 2/15/40 (144A)‡ | | 5,873,190 | | | 5,481,619 | |
| | Westgate Resorts 2022-1A A, 1.7880%, 8/20/36 (144A) | | 4,789,612 | | | 4,520,312 | |
| | Westlake Automobile Receivable Trust 2020-1A D, 2.8000%, 6/16/25 (144A) | | 12,457,000 | | | 12,285,612 | |
| | Woodward Capital Management 2021-3 A21, | | | | | | |
| | US 30 Day Average SOFR + 0.8000%, 5.0000%, 7/25/51 (144A)‡ | | 9,873,762 | | | 8,961,802 | |
Total Asset-Backed/Commercial Mortgage-Backed Securities (cost $1,997,338,271) | | 1,901,709,997 | |
Corporate Bonds– 8.4% | | | |
Banking – 2.9% | | | |
| | American Express Co, SOFR + 2.2550%, 4.9890%, 5/26/33‡ | | 16,892,000 | | | 16,657,032 | |
| | Bank of America Corp, SOFR + 1.9900%, 6.2040%, 11/10/28‡ | | 29,671,000 | | | 31,017,523 | |
| | Bank of America Corp, ICE LIBOR USD 3 Month + 3.7050%, 6.2500%‡,µ | | 21,700,000 | | | 21,184,625 | |
| | Bank of America Corp, ICE LIBOR USD 3 Month + 3.1350%, 5.2000%‡,µ | | 7,250,000 | | | 7,027,969 | |
| | Bank of Montreal, | | | | | | |
| | US Treasury Yield Curve Rate 5 Year + 1.4000%, 3.0880%, 1/10/37‡ | | 53,212,000 | | | 42,770,645 | |
| | BNP Paribas SA, SOFR + 1.2280%, 2.5910%, 1/20/28 (144A)‡ | | 12,805,000 | | | 11,496,876 | |
| | BNP Paribas SA, | | | | | | |
| | US Treasury Yield Curve Rate 1 Year + 1.4500%, 5.1250%, 1/13/29 (144A)‡ | | 22,678,000 | | | 22,724,452 | |
| | |
See Notes to Schedule of Investments and Other Information and Notes to Financial Statements. |
| |
10 | MARCH 31, 2023 |
Janus Henderson Balanced Fund
Schedule of Investments (unaudited)
March 31, 2023
| | | | | | | | |
Shares or
Principal Amounts | | | Value | |
Corporate Bonds– (continued) | | | |
Banking– (continued) | | | |
| | Citigroup Inc, CME Term SOFR 3 Month + 1.8246%, 3.8870%, 1/10/28‡ | | $36,115,000 | | | $34,505,700 | |
| | Citigroup Inc, CME Term SOFR 3 Month + 3.4660%, 5.3500%‡,µ | | 8,824,000 | | | 8,508,983 | |
| | Citigroup Inc, CME Term SOFR 3 Month + 4.1666%, 5.9500%‡,µ | | 8,361,000 | | | 7,791,997 | |
| | Citigroup Inc, CME Term SOFR 3 Month + 3.6846%, 6.3000%‡,µ | | 2,012,000 | | | 1,911,400 | |
| | Commonwealth Bank of Australia, 3.7840%, 3/14/32 (144A) | | 22,906,000 | | | 19,261,172 | |
| | Cooperatieve Rabobank UA, | | | | | | |
| | US Treasury Yield Curve Rate 1 Year + 1.4000%, 5.5640%, 2/28/29 (144A)‡ | | 31,140,000 | | | 31,348,860 | |
| | Deutsche Bank AG / New York, SOFR + 3.0430%, 3.5470%, 9/18/31‡ | | 3,997,000 | | | 3,278,237 | |
| | Deutsche Bank AG / New York, SOFR + 3.6500%, 7.0790%, 2/10/34‡ | | 11,594,000 | | | 10,752,534 | |
| | Goldman Sachs Group Inc, 3.5000%, 4/1/25 | | 39,166,000 | | | 38,030,307 | |
| | JPMorgan Chase & Co, SOFR + 2.5150%, 2.9560%, 5/13/31‡ | | 22,144,000 | | | 19,141,528 | |
| | JPMorgan Chase & Co, SOFR + 2.5800%, 5.7170%, 9/14/33‡ | | 39,262,000 | | | 40,218,375 | |
| | JPMorgan Chase & Co, CME Term SOFR 3 Month + 3.3800%, 5.0000%‡,µ | | 7,243,000 | | | 6,954,004 | |
| | JPMorgan Chase & Co, CME Term SOFR 3 Month + 3.1250%, 4.6000%‡,µ | | 7,646,000 | | | 7,110,780 | |
| | Mitsubishi UFJ Financial Group Inc, | | | | | | |
| | US Treasury Yield Curve Rate 1 Year + 1.7000%, 4.7880%, 7/18/25‡ | | 15,834,000 | | | 15,678,299 | |
| | Mitsubishi UFJ Financial Group Inc, | | | | | | |
| | US Treasury Yield Curve Rate 1 Year + 1.6300%, 5.4410%, 2/22/34‡ | | 11,770,000 | | | 11,892,950 | |
| | Morgan Stanley, SOFR + 1.9900%, 2.1880%, 4/28/26‡ | | 24,836,000 | | | 23,302,589 | |
| | Morgan Stanley, 4.3500%, 9/8/26 | | 14,618,000 | | | 14,238,749 | |
| | Morgan Stanley, SOFR + 1.2950%, 5.0500%, 1/28/27‡ | | 6,743,000 | | | 6,724,172 | |
| | Morgan Stanley, SOFR + 0.8790%, 1.5930%, 5/4/27‡ | | 11,537,000 | | | 10,339,028 | |
| | Morgan Stanley, SOFR + 1.7300%, 5.1230%, 2/1/29‡ | | 14,927,000 | | | 15,045,583 | |
| | Morgan Stanley, SOFR + 1.2900%, 2.9430%, 1/21/33‡ | | 16,462,000 | | | 13,945,980 | |
| | Morgan Stanley, SOFR + 1.3600%, 2.4840%, 9/16/36‡ | | 33,616,000 | | | 25,538,039 | |
| | Morgan Stanley, | | | | | | |
| | US Treasury Yield Curve Rate 5 Year + 2.4300%, 5.9480%, 1/19/38‡ | | 5,688,000 | | | 5,656,242 | |
| | National Australia Bank Ltd, 2.9900%, 5/21/31 (144A) | | 28,726,000 | | | 23,088,480 | |
| | Nordea Bank Abp, 5.3750%, 9/22/27 (144A) | | 30,280,000 | | | 30,419,927 | |
| | PNC Financial Services Group Inc/The, SOFR + 2.1400%, 6.0370%, 10/28/33‡ | | 13,196,000 | | | 13,884,589 | |
| | PNC Financial Services Group Inc/The, SOFR + 1.9330%, 5.0680%, 1/24/34‡ | | 14,040,000 | | | 13,850,628 | |
| | State Street Corp, SOFR + 1.5670%, 4.8210%, 1/26/34‡ | | 6,668,000 | | | 6,631,238 | |
| | Sumitomo Mitsui Financial Group Inc, 5.7100%, 1/13/30 | | 27,895,000 | | | 28,802,087 | |
| | US Bancorp, SOFR + 2.1100%, 4.9670%, 7/22/33‡ | | 5,612,000 | | | 5,313,319 | |
| | US Bancorp, | | | | | | |
| | US Treasury Yield Curve Rate 5 Year + 0.9500%, 2.4910%, 11/3/36‡ | | 20,457,000 | | | 15,789,433 | |
| | Westpac Banking Corp, | | | | | | |
| | US Treasury Yield Curve Rate 5 Year + 1.7500%, 2.6680%, 11/15/35‡ | | 19,870,000 | | | 15,476,476 | |
| | | 677,310,807 | |
Capital Goods – 0.1% | | | |
| | General Dynamics Corp, 3.5000%, 4/1/27 | | 7,372,000 | | | 7,128,617 | |
| | Regal Rexnord Corp, 6.0500%, 4/15/28 (144A) | | 16,939,000 | | | 16,946,541 | |
| | | 24,075,158 | |
Communications – 0.1% | | | |
| | AT&T Inc, 3.6500%, 9/15/59 | | 2,171,000 | | | 1,551,384 | |
| | Fox Corp, 4.0300%, 1/25/24 | | 8,690,000 | | | 8,595,468 | |
| | | 10,146,852 | |
Consumer Cyclical – 0.1% | | | |
| | GLP Capital LP / GLP Financing II Inc, 5.3750%, 4/15/26 | | 9,419,000 | | | 9,140,664 | |
| | GLP Capital LP / GLP Financing II Inc, 5.3000%, 1/15/29 | | 1,226,000 | | | 1,169,788 | |
| | Lowe's Cos Inc, 5.1500%, 7/1/33 | | 21,775,000 | | | 21,982,605 | |
| | | 32,293,057 | |
Consumer Non-Cyclical – 1.3% | | | |
| | Albertsons Cos Inc / Safeway Inc / New Albertsons LP / Albertsons LLC, | | | | | | |
| | 6.5000%, 2/15/28 (144A) | | 14,308,000 | | | 14,343,770 | |
| | Amgen Inc, 5.1500%, 3/2/28 | | 17,500,000 | | | 17,867,870 | |
| | Amgen Inc, 5.2500%, 3/2/30 | | 13,952,000 | | | 14,269,854 | |
| | Amgen Inc, 5.2500%, 3/2/33 | | 8,984,000 | | | 9,230,153 | |
| | CSL Finance Ltd, 3.8500%, 4/27/27 (144A) | | 6,306,000 | | | 6,145,771 | |
| | |
See Notes to Schedule of Investments and Other Information and Notes to Financial Statements. |
| |
Janus Investment Fund | 11 |
Janus Henderson Balanced Fund
Schedule of Investments (unaudited)
March 31, 2023
| | | | | | | | |
Shares or
Principal Amounts | | | Value | |
Corporate Bonds– (continued) | | | |
Consumer Non-Cyclical– (continued) | | | |
| | CSL Finance Ltd, 4.0500%, 4/27/29 (144A) | | $12,756,000 | | | $12,306,358 | |
| | Diageo Capital PLC, 1.3750%, 9/29/25 | | 11,362,000 | | | 10,495,717 | |
| | GE Healthcare Holding LLC, 5.6500%, 11/15/27 (144A) | | 22,545,000 | | | 23,302,962 | |
| | GE Healthcare Holding LLC, 5.8570%, 3/15/30 (144A) | | 26,924,000 | | | 28,167,741 | |
| | GE Healthcare Holding LLC, 5.9050%, 11/22/32 (144A) | | 22,474,000 | | | 23,930,838 | |
| | GSK Consumer Healthcare Capital US LLC, 3.3750%, 3/24/27 | | 10,875,000 | | | 10,310,500 | |
| | GSK Consumer Healthcare Capital US LLC, 3.3750%, 3/24/29 | | 5,546,000 | | | 5,116,553 | |
| | Hasbro Inc, 3.9000%, 11/19/29 | | 34,171,000 | | | 31,109,155 | |
| | Hasbro Inc, 6.3500%, 3/15/40 | | 4,483,000 | | | 4,528,672 | |
| | Hasbro Inc, 5.1000%, 5/15/44 | | 5,211,000 | | | 4,549,669 | |
| | HCA Inc, 5.8750%, 2/15/26 | | 4,146,000 | | | 4,207,391 | |
| | HCA Inc, 5.3750%, 9/1/26 | | 3,180,000 | | | 3,191,326 | |
| | HCA Inc, 5.6250%, 9/1/28 | | 9,208,000 | | | 9,314,970 | |
| | HCA Inc, 5.8750%, 2/1/29 | | 6,941,000 | | | 7,091,087 | |
| | HCA Inc, 3.6250%, 3/15/32 (144A) | | 10,927,000 | | | 9,632,484 | |
| | Illumina Inc, 5.8000%, 12/12/25 | | 11,709,000 | | | 11,817,144 | |
| | JBS USA LUX SA / JBS USA Food Co / JBS USA Finance Inc, | | | | | | |
| | 5.5000%, 1/15/30 (144A) | | 19,216,000 | | | 18,344,362 | |
| | JBS USA LUX SA / JBS USA Food Co / JBS USA Finance Inc, | | | | | | |
| | 3.6250%, 1/15/32 (144A) | | 9,318,000 | | | 7,724,342 | |
| | JBS USA LUX SA / JBS USA Food Co / JBS USA Finance Inc, | | | | | | |
| | 3.0000%, 5/15/32 (144A) | | 13,810,000 | | | 10,816,130 | |
| | Mondelez International Inc, 2.7500%, 4/13/30 | | 1,182,000 | | | 1,049,571 | |
| | Royalty Pharma PLC, 3.5500%, 9/2/50 | | 14,211,000 | | | 9,796,079 | |
| | | 308,660,469 | |
Electric – 0.3% | | | |
| | American Electric Power Co Inc, 5.6250%, 3/1/33 | | 21,563,000 | | | 22,304,271 | |
| | Duke Energy Corp, 4.3000%, 3/15/28 | | 15,581,000 | | | 15,276,534 | |
| | Duquesne Light Holdings Inc, 2.7750%, 1/7/32 (144A) | | 16,995,000 | | | 13,713,765 | |
| | Exelon Corp, 5.1500%, 3/15/28 | | 10,433,000 | | | 10,614,695 | |
| | Exelon Corp, 5.3000%, 3/15/33 | | 16,707,000 | | | 16,997,083 | |
| | | 78,906,348 | |
Energy – 0.5% | | | |
| | Enbridge Inc, 5.7000%, 3/8/33 | | 11,565,000 | | | 12,029,264 | |
| | Energy Transfer LP, 5.5500%, 2/15/28 | | 14,575,000 | | | 14,800,257 | |
| | Energy Transfer Operating LP, 4.9500%, 6/15/28 | | 626,000 | | | 621,660 | |
| | EQT Corp, 5.6780%, 10/1/25 | | 17,974,000 | | | 17,920,114 | |
| | EQT Corp, 5.7000%, 4/1/28 | | 7,749,000 | | | 7,740,592 | |
| | Hess Midstream Operations LP, 5.1250%, 6/15/28 (144A) | | 11,121,000 | | | 10,558,969 | |
| | Kinder Morgan Inc, 5.2000%, 6/1/33 | | 21,573,000 | | | 21,432,689 | |
| | Southwestern Energy Co, 4.7500%, 2/1/32 | | 12,491,000 | | | 11,029,427 | |
| | Venture Global Calcasieu Pass LLC, 6.2500%, 1/15/30 (144A) | | 22,716,000 | | | 22,886,370 | |
| | | 119,019,342 | |
Finance Companies – 0.4% | | | |
| | AerCap Ireland Capital DAC / AerCap Global Aviation Trust, | | | | | | |
| | 4.6250%, 10/15/27 | | 10,114,000 | | | 9,776,853 | |
| | Air Lease Corp, 1.8750%, 8/15/26 | | 17,148,000 | | | 15,191,837 | |
| | Ares Capital Corp, 2.8750%, 6/15/27 | | 17,055,000 | | | 14,631,534 | |
| | OWL Rock Core Income Corp, 4.7000%, 2/8/27 | | 2,729,000 | | | 2,464,648 | |
| | OWL Rock Core Income Corp, 7.7500%, 9/16/27 (144A) | | 16,398,000 | | | 16,154,251 | |
| | Quicken Loans LLC, 3.8750%, 3/1/31 (144A) | | 12,708,000 | | | 10,536,711 | |
| | Rocket Mortgage LLC / Rocket Mortgage Co-Issuer Inc, | | | | | | |
| | 2.8750%, 10/15/26 (144A) | | 12,331,000 | | | 11,036,245 | |
| | | 79,792,079 | |
Insurance – 0.9% | | | |
| | Athene Global Funding, 2.7170%, 1/7/29 (144A) | | 21,681,000 | | | 18,484,575 | |
| | Athene Global Funding, 2.6460%, 10/4/31 (144A) | | 32,528,000 | | | 25,829,251 | |
| | Brown & Brown Inc, 4.2000%, 3/17/32 | | 6,426,000 | | | 5,777,366 | |
| | Brown & Brown Inc, 4.9500%, 3/17/52 | | 18,886,000 | | | 16,140,382 | |
| | |
See Notes to Schedule of Investments and Other Information and Notes to Financial Statements. |
| |
12 | MARCH 31, 2023 |
Janus Henderson Balanced Fund
Schedule of Investments (unaudited)
March 31, 2023
| | | | | | | | |
Shares or
Principal Amounts | | | Value | |
Corporate Bonds– (continued) | | | |
Insurance– (continued) | | | |
| | Centene Corp, 4.2500%, 12/15/27 | | $53,971,000 | | | $51,997,820 | |
| | Centene Corp, 2.4500%, 7/15/28 | | 16,998,000 | | | 14,788,260 | |
| | Centene Corp, 3.0000%, 10/15/30 | | 18,048,000 | | | 15,197,878 | |
| | Elevance Health Inc, 4.7500%, 2/15/33 | | 19,507,000 | | | 19,604,955 | |
| | Prudential Financial Inc, | | | | | | |
| | US Treasury Yield Curve Rate 5 Year + 3.0350%, 3.7000%, 10/1/50‡ | | 27,945,000 | | | 22,763,132 | |
| | UnitedHealth Group Inc, 5.2500%, 2/15/28 | | 10,004,000 | | | 10,402,436 | |
| | | 200,986,055 | |
Real Estate Investment Trusts (REITs) – 0.3% | | | |
| | Agree LP, 2.0000%, 6/15/28 | | 11,528,000 | | | 9,768,993 | |
| | Agree LP, 2.9000%, 10/1/30 | | 7,437,000 | | | 6,319,948 | |
| | Agree LP, 2.6000%, 6/15/33 | | 8,647,000 | | | 6,814,970 | |
| | American Tower Trust I, 5.4900%, 3/15/28 (144A) | | 33,827,000 | | | 34,143,397 | |
| | Sun Communities Operating LP, 2.7000%, 7/15/31 | | 21,657,000 | | | 17,516,141 | |
| | | 74,563,449 | |
Technology – 1.4% | | | |
| | Analog Devices Inc, 2.9500%, 4/1/25 | | 10,074,000 | | | 9,736,304 | |
| | Broadcom Inc, 2.6000%, 2/15/33 (144A) | | 11,906,000 | | | 9,336,449 | |
| | Broadcom Inc, 3.4690%, 4/15/34 (144A) | | 19,242,000 | | | 15,803,108 | |
| | Broadcom Inc, 3.1370%, 11/15/35 (144A) | | 23,928,000 | | | 18,402,051 | |
| | CoStar Group Inc, 2.8000%, 7/15/30 (144A) | | 12,054,000 | | | 10,099,985 | |
| | Equinix Inc, 2.1500%, 7/15/30 | | 9,552,000 | | | 7,810,238 | |
| | Fiserv Inc, 5.4500%, 3/2/28 | | 17,859,000 | | | 18,240,528 | |
| | Global Payments Inc, 2.1500%, 1/15/27 | | 11,282,000 | | | 9,991,410 | |
| | Leidos Inc, 2.3000%, 2/15/31 | | 4,088,000 | | | 3,317,129 | |
| | Leidos Inc, 5.7500%, 3/15/33 | | 13,585,000 | | | 13,884,427 | |
| | Marvell Technology Inc, 1.6500%, 4/15/26 | | 13,225,000 | | | 11,989,159 | |
| | Marvell Technology Inc, 4.8750%, 6/22/28 | | 14,717,000 | | | 14,452,240 | |
| | Microchip Technology Inc, 2.6700%, 9/1/23 | | 23,076,000 | | | 22,752,295 | |
| | Micron Technology Inc, 6.7500%, 11/1/29 | | 10,141,000 | | | 10,772,995 | |
| | MSCI Inc, 4.0000%, 11/15/29 (144A) | | 1,532,000 | | | 1,397,804 | |
| | MSCI Inc, 3.6250%, 9/1/30 (144A) | | 25,762,000 | | | 22,395,164 | |
| | MSCI Inc, 3.8750%, 2/15/31 (144A) | | 21,571,000 | | | 19,200,347 | |
| | Total System Services Inc, 4.8000%, 4/1/26 | | 11,686,000 | | | 11,446,449 | |
| | Trimble Inc, 4.7500%, 12/1/24 | | 18,923,000 | | | 18,811,612 | |
| | Trimble Inc, 4.9000%, 6/15/28 | | 11,312,000 | | | 11,242,357 | |
| | Trimble Inc, 6.1000%, 3/15/33 | | 35,125,000 | | | 35,458,551 | |
| | TSMC Arizona Corp, 3.8750%, 4/22/27 | | 15,891,000 | | | 15,605,797 | |
| | Workday Inc, 3.5000%, 4/1/27 | | 8,410,000 | | | 8,046,403 | |
| | | 320,192,802 | |
Transportation – 0.1% | | | |
| | GXO Logistics Inc, 1.6500%, 7/15/26 | | 14,940,000 | | | 13,138,451 | |
| | GXO Logistics Inc, 2.6500%, 7/15/31 | | 2,271,000 | | | 1,766,478 | |
| | | 14,904,929 | |
Total Corporate Bonds (cost $2,066,308,742) | | 1,940,851,347 | |
Mortgage-Backed Securities– 11.4% | | | |
Fannie Mae: | | | |
| | 3.0000%, TBA, 30 Year Maturity | | 33,819,226 | | | 30,244,432 | |
| | 5.0000%, TBA, 30 Year Maturity | | 41,785,012 | | | 41,655,938 | |
| | 3.0000%, TBA, 15 Year Maturity | | 73,116,241 | | | 69,309,078 | |
| | 2.5000%, TBA, 15 Year Maturity | | 37,583,400 | | | 34,864,316 | |
| | 4.0000%, TBA, 15 Year Maturity | | 65,269,000 | | | 64,253,937 | |
| | 3.5000%, TBA, 30 Year Maturity | | 93,061 | | | 86,212 | |
| | 4.5000%, TBA, 30 Year Maturity | | 22,828,836 | | | 22,357,215 | |
| | | 262,771,128 | |
Fannie Mae Pool: | | | |
| | 7.5000%, 7/1/28 | | 31,940 | | | 33,082 | |
| | 3.0000%, 10/1/34 | | 1,240,253 | | | 1,180,753 | |
| | |
See Notes to Schedule of Investments and Other Information and Notes to Financial Statements. |
| |
Janus Investment Fund | 13 |
Janus Henderson Balanced Fund
Schedule of Investments (unaudited)
March 31, 2023
| | | | | | | | |
Shares or
Principal Amounts | | | Value | |
Mortgage-Backed Securities– (continued) | | | |
Fannie Mae Pool– (continued) | | | |
| | 2.5000%, 11/1/34 | | $887,672 | | | $827,518 | |
| | 3.0000%, 11/1/34 | | 529,605 | | | 504,197 | |
| | 3.0000%, 12/1/34 | | 552,816 | | | 526,296 | |
| | 6.0000%, 2/1/37 | | 203,216 | | | 214,950 | |
| | 4.5000%, 11/1/42 | | 1,148,665 | | | 1,152,945 | |
| | 3.0000%, 1/1/43 | | 644,765 | | | 593,027 | |
| | 3.0000%, 2/1/43 | | 155,038 | | | 142,597 | |
| | 3.0000%, 5/1/43 | | 1,502,988 | | | 1,381,691 | |
| | 5.0000%, 7/1/44 | | 122,236 | | | 125,100 | |
| | 4.5000%, 10/1/44 | | 2,861,921 | | | 2,901,278 | |
| | 4.5000%, 3/1/45 | | 4,305,385 | | | 4,364,592 | |
| | 4.5000%, 6/1/45 | | 2,228,495 | | | 2,239,393 | |
| | 3.5000%, 12/1/45 | | 1,297,470 | | | 1,224,045 | |
| | 3.0000%, 1/1/46 | | 251,414 | | | 229,691 | |
| | 4.5000%, 2/1/46 | | 5,023,378 | | | 5,042,097 | |
| | 3.5000%, 7/1/46 | | 2,881,063 | | | 2,731,758 | |
| | 3.0000%, 2/1/47 | | 42,760,847 | | | 39,309,895 | |
| | 3.0000%, 3/1/47 | | 5,081,796 | | | 4,647,883 | |
| | 3.5000%, 3/1/47 | | 1,136,978 | | | 1,072,635 | |
| | 3.5000%, 7/1/47 | | 1,008,062 | | | 951,015 | |
| | 3.5000%, 8/1/47 | | 927,078 | | | 871,102 | |
| | 3.5000%, 8/1/47 | | 901,314 | | | 858,836 | |
| | 4.0000%, 10/1/47 | | 4,229,559 | | | 4,109,133 | |
| | 3.5000%, 12/1/47 | | 426,946 | | | 406,825 | |
| | 3.5000%, 12/1/47 | | 266,933 | | | 254,353 | |
| | 3.5000%, 1/1/48 | | 2,591,510 | | | 2,448,035 | |
| | 4.0000%, 1/1/48 | | 9,273,876 | | | 9,121,227 | |
| | 4.0000%, 1/1/48 | | 3,462,785 | | | 3,392,710 | |
| | 3.0000%, 2/1/48 | | 3,230,353 | | | 2,959,005 | |
| | 3.5000%, 3/1/48 | | 418,850 | | | 398,808 | |
| | 4.0000%, 3/1/48 | | 2,629,909 | | | 2,586,602 | |
| | 4.5000%, 3/1/48 | | 117,871 | | | 117,188 | |
| | 5.0000%, 5/1/48 | | 2,668,696 | | | 2,699,102 | |
| | 4.5000%, 6/1/48 | | 4,494,949 | | | 4,468,909 | |
| | 3.5000%, 7/1/48 | | 25,828,522 | | | 24,288,791 | |
| | 4.0000%, 7/1/48 | | 5,196,300 | | | 5,040,731 | |
| | 4.5000%, 8/1/48 | | 66,602 | | | 66,216 | |
| | 4.0000%, 10/1/48 | | 2,021,628 | | | 1,975,476 | |
| | 4.0000%, 11/1/48 | | 6,029,896 | | | 5,849,371 | |
| | 4.0000%, 12/1/48 | | 965,287 | | | 936,388 | |
| | 4.0000%, 2/1/49 | | 1,410,822 | | | 1,368,585 | |
| | 3.5000%, 5/1/49 | | 10,747,765 | | | 10,064,042 | |
| | 4.0000%, 6/1/49 | | 807,509 | | | 781,740 | |
| | 4.5000%, 6/1/49 | | 401,922 | | | 398,842 | |
| | 3.0000%, 8/1/49 | | 3,158,599 | | | 2,852,025 | |
| | 3.0000%, 8/1/49 | | 1,662,618 | | | 1,501,245 | |
| | 4.5000%, 8/1/49 | | 578,857 | | | 574,421 | |
| | 3.0000%, 9/1/49 | | 11,450,920 | | | 10,339,495 | |
| | 3.0000%, 9/1/49 | | 683,503 | | | 625,485 | |
| | 4.0000%, 11/1/49 | | 13,189,181 | | | 12,794,319 | |
| | 4.0000%, 11/1/49 | | 1,176,797 | | | 1,148,078 | |
| | 3.5000%, 12/1/49 | | 33,664,409 | | | 31,631,756 | |
| | 4.5000%, 1/1/50 | | 10,347,666 | | | 10,287,720 | |
| | 4.5000%, 1/1/50 | | 780,966 | | | 774,981 | |
| | 2.5000%, 3/1/50 | | 2,721,795 | | | 2,368,997 | |
| | 4.0000%, 3/1/50 | | 19,231,755 | | | 18,792,717 | |
| | 4.0000%, 3/1/50 | | 10,408,110 | | | 10,096,509 | |
| | 4.0000%, 3/1/50 | | 3,991,296 | | | 3,871,803 | |
| | 4.5000%, 7/1/50 | | 16,762,590 | | | 16,464,390 | |
| | |
See Notes to Schedule of Investments and Other Information and Notes to Financial Statements. |
| |
14 | MARCH 31, 2023 |
Janus Henderson Balanced Fund
Schedule of Investments (unaudited)
March 31, 2023
| | | | | | | | |
Shares or
Principal Amounts | | | Value | |
Mortgage-Backed Securities– (continued) | | | |
Fannie Mae Pool– (continued) | | | |
| | 2.5000%, 8/1/50 | | $55,634,228 | | | $48,683,491 | |
| | 2.5000%, 8/1/50 | | 2,384,000 | | | 2,088,606 | |
| | 4.0000%, 9/1/50 | | 21,881,069 | | | 21,182,813 | |
| | 4.0000%, 10/1/50 | | 21,047,380 | | | 20,533,731 | |
| | 4.5000%, 10/1/50 | | 12,933,643 | | | 12,858,716 | |
| | 3.5000%, 2/1/51 | | 13,929,936 | | | 13,043,778 | |
| | 4.0000%, 3/1/51 | | 53,994,431 | | | 52,271,391 | |
| | 4.0000%, 3/1/51 | | 1,051,094 | | | 1,017,553 | |
| | 4.0000%, 3/1/51 | | 515,012 | | | 499,593 | |
| | 4.0000%, 10/1/51 | | 50,199,898 | | | 48,597,947 | |
| | 4.0000%, 10/1/51 | | 7,512,055 | | | 7,272,334 | |
| | 3.0000%, 12/1/51 | | 145,284,673 | | | 131,149,917 | |
| | 2.5000%, 1/1/52 | | 14,116,605 | | | 12,292,409 | |
| | 3.5000%, 1/1/52 | | 2,863,749 | | | 2,699,554 | |
| | 2.5000%, 2/1/52 | | 69,344,001 | | | 60,313,151 | |
| | 3.5000%, 2/1/52 | | 7,484,179 | | | 7,052,749 | |
| | 2.5000%, 3/1/52 | | 28,628,314 | | | 24,885,231 | |
| | 2.5000%, 3/1/52 | | 28,034,891 | | | 24,383,834 | |
| | 2.5000%, 3/1/52 | | 10,323,595 | | | 8,988,816 | |
| | 2.5000%, 3/1/52 | | 2,489,606 | | | 2,162,743 | |
| | 2.5000%, 3/1/52 | | 2,339,734 | | | 2,033,819 | |
| | 2.5000%, 3/1/52 | | 1,973,884 | | | 1,716,820 | |
| | 2.5000%, 3/1/52 | | 808,329 | | | 703,789 | |
| | 3.0000%, 3/1/52 | | 13,577,809 | | | 12,246,150 | |
| | 3.5000%, 3/1/52 | | 49,021,647 | | | 46,077,491 | |
| | 3.5000%, 3/1/52 | | 18,860,379 | | | 17,662,235 | |
| | 3.5000%, 3/1/52 | | 4,799,167 | | | 4,520,301 | |
| | 3.0000%, 4/1/52 | | 20,599,520 | | | 18,568,181 | |
| | 3.0000%, 4/1/52 | | 11,472,332 | | | 10,374,929 | |
| | 3.0000%, 4/1/52 | | 9,754,369 | | | 8,794,750 | |
| | 3.5000%, 4/1/52 | | 9,815,595 | | | 9,155,502 | |
| | 3.5000%, 4/1/52 | | 7,232,370 | | | 6,798,006 | |
| | 3.5000%, 4/1/52 | | 5,522,132 | | | 5,147,638 | |
| | 3.5000%, 4/1/52 | | 3,275,902 | | | 3,055,600 | |
| | 3.5000%, 4/1/52 | | 1,988,891 | | | 1,854,255 | |
| | 3.5000%, 4/1/52 | | 1,615,988 | | | 1,506,397 | |
| | 4.0000%, 4/1/52 | | 8,096,719 | | | 7,845,856 | |
| | 4.5000%, 4/1/52 | | 1,593,903 | | | 1,561,942 | |
| | 4.5000%, 4/1/52 | | 1,227,076 | | | 1,202,470 | |
| | 4.5000%, 4/1/52 | | 703,692 | | | 689,581 | |
| | 4.5000%, 4/1/52 | | 638,742 | | | 625,934 | |
| | 4.5000%, 4/1/52 | | 558,627 | | | 547,425 | |
| | 4.5000%, 4/1/52 | | 359,698 | | | 352,212 | |
| | 3.5000%, 5/1/52 | | 8,786,222 | | | 8,222,600 | |
| | 3.5000%, 5/1/52 | | 5,500,658 | | | 5,129,890 | |
| | 4.5000%, 5/1/52 | | 1,946,790 | | | 1,907,752 | |
| | 3.5000%, 6/1/52 | | 30,373,714 | | | 28,521,209 | |
| | 3.5000%, 6/1/52 | | 17,642,861 | | | 16,601,242 | |
| | 4.0000%, 6/1/52 | | 6,249,096 | | | 5,977,642 | |
| | 4.0000%, 6/1/52 | | 1,674,795 | | | 1,602,043 | |
| | 3.5000%, 7/1/52 | | 39,252,786 | | | 36,722,585 | |
| | 3.5000%, 7/1/52 | | 4,431,820 | | | 4,161,522 | |
| | 3.5000%, 7/1/52 | | 1,619,090 | | | 1,522,997 | |
| | 4.0000%, 7/1/52 | | 2,671,429 | | | 2,555,385 | |
| | 4.5000%, 7/1/52 | | 7,941,122 | | | 7,783,434 | |
| | 3.5000%, 8/1/52 | | 7,829,213 | | | 7,322,116 | |
| | 3.5000%, 8/1/52 | | 2,888,626 | | | 2,711,550 | |
| | 4.5000%, 8/1/52 | | 30,279,587 | | | 29,678,321 | |
| | 5.0000%, 9/1/52 | | 14,125,528 | | | 14,082,269 | |
| | |
See Notes to Schedule of Investments and Other Information and Notes to Financial Statements. |
| |
Janus Investment Fund | 15 |
Janus Henderson Balanced Fund
Schedule of Investments (unaudited)
March 31, 2023
| | | | | | | | |
Shares or
Principal Amounts | | | Value | |
Mortgage-Backed Securities– (continued) | | | |
Fannie Mae Pool– (continued) | | | |
| | 5.5000%, 9/1/52 | | $37,981,920 | | | $38,509,493 | |
| | 5.0000%, 10/1/52 | | 6,170,993 | | | 6,226,568 | |
| | 5.0000%, 10/1/52 | | 2,713,222 | | | 2,737,657 | |
| | 5.5000%, 10/1/52 | | 6,425,420 | | | 6,585,508 | |
| | 4.5000%, 11/1/52 | | 20,667,583 | | | 20,518,540 | |
| | 5.0000%, 11/1/52 | | 15,307,398 | | | 15,445,256 | |
| | 5.5000%, 11/1/52 | | 13,775,628 | | | 14,118,845 | |
| | 4.5000%, 12/1/52 | | 9,449,048 | | | 9,308,587 | |
| | 5.0000%, 1/1/53 | | 11,890,068 | | | 11,918,935 | |
| | 5.0000%, 3/1/53 | | 3,327,853 | | | 3,323,241 | |
| | 5.0000%, 4/1/53 | | 1,039,671 | | | 1,038,230 | |
| | 5.0000%, 4/1/53 | | 830,413 | | | 829,262 | |
| | 3.5000%, 8/1/56 | | 10,566,656 | | | 9,959,626 | |
| | 3.0000%, 2/1/57 | | 10,604,872 | | | 9,615,872 | |
| | 3.0000%, 6/1/57 | | 195,678 | | | 177,367 | |
| | | 1,270,817,580 | |
Freddie Mac Gold Pool: | | | |
| | 3.5000%, 1/1/47 | | 771,090 | | | 731,998 | |
Freddie Mac Pool: | | | |
| | 3.0000%, 5/1/31 | | 10,998,906 | | | 10,612,550 | |
| | 3.0000%, 9/1/32 | | 2,521,558 | | | 2,414,846 | |
| | 3.0000%, 10/1/32 | | 1,226,682 | | | 1,174,769 | |
| | 3.0000%, 12/1/32 | | 830,027 | | | 787,284 | |
| | 3.0000%, 1/1/33 | | 1,659,208 | | | 1,588,990 | |
| | 2.5000%, 12/1/33 | | 11,463,405 | | | 10,797,409 | |
| | 3.0000%, 10/1/34 | | 2,918,348 | | | 2,778,380 | |
| | 3.0000%, 10/1/34 | | 1,349,224 | | | 1,284,513 | |
| | 2.5000%, 11/1/34 | | 3,635,047 | | | 3,388,645 | |
| | 2.5000%, 11/1/34 | | 911,817 | | | 850,009 | |
| | 6.0000%, 4/1/40 | | 3,170,450 | | | 3,357,183 | |
| | 3.5000%, 7/1/42 | | 571,875 | | | 542,383 | |
| | 3.5000%, 8/1/42 | | 633,427 | | | 600,761 | |
| | 3.5000%, 8/1/42 | | 575,097 | | | 545,439 | |
| | 3.5000%, 2/1/43 | | 1,388,162 | | | 1,317,144 | |
| | 3.0000%, 3/1/43 | | 6,855,565 | | | 6,302,426 | |
| | 3.0000%, 6/1/43 | | 221,836 | | | 199,436 | |
| | 3.5000%, 2/1/44 | | 1,736,915 | | | 1,648,053 | |
| | 4.5000%, 5/1/44 | | 917,805 | | | 922,301 | |
| | 3.5000%, 12/1/44 | | 10,394,782 | | | 9,862,981 | |
| | 3.0000%, 1/1/45 | | 2,690,192 | | | 2,468,063 | |
| | 4.0000%, 4/1/45 | | 23,028 | | | 22,581 | |
| | 3.0000%, 1/1/46 | | 488,115 | | | 449,055 | |
| | 3.5000%, 7/1/46 | | 1,953,869 | | | 1,846,775 | |
| | 4.0000%, 3/1/47 | | 1,055,855 | | | 1,032,882 | |
| | 3.0000%, 4/1/47 | | 1,213,343 | | | 1,107,953 | |
| | 3.5000%, 4/1/47 | | 451,354 | | | 427,979 | |
| | 3.5000%, 9/1/47 | | 3,673,718 | | | 3,451,964 | |
| | 3.5000%, 12/1/47 | | 6,184,147 | | | 5,860,063 | |
| | 3.5000%, 2/1/48 | | 2,209,952 | | | 2,083,239 | |
| | 4.0000%, 3/1/48 | | 2,413,064 | | | 2,373,333 | |
| | 4.5000%, 3/1/48 | | 93,831 | | | 93,288 | |
| | 4.0000%, 4/1/48 | | 2,293,099 | | | 2,246,680 | |
| | 4.0000%, 4/1/48 | | 2,208,341 | | | 2,142,236 | |
| | 4.0000%, 5/1/48 | | 3,996,880 | | | 3,877,237 | |
| | 4.5000%, 7/1/48 | | 608,373 | | | 604,848 | |
| | 5.0000%, 9/1/48 | | 110,840 | | | 112,104 | |
| | 4.0000%, 11/1/48 | | 545,520 | | | 529,191 | |
| | 4.0000%, 12/1/48 | | 6,694,333 | | | 6,493,945 | |
| | 4.5000%, 12/1/48 | | 2,126,442 | | | 2,134,618 | |
| | |
See Notes to Schedule of Investments and Other Information and Notes to Financial Statements. |
| |
16 | MARCH 31, 2023 |
Janus Henderson Balanced Fund
Schedule of Investments (unaudited)
March 31, 2023
| | | | | | | | |
Shares or
Principal Amounts | | | Value | |
Mortgage-Backed Securities– (continued) | | | |
Freddie Mac Pool– (continued) | | | |
| | 4.5000%, 6/1/49 | | $424,985 | | | $421,729 | |
| | 4.5000%, 7/1/49 | | 3,784,147 | | | 3,755,151 | |
| | 4.5000%, 7/1/49 | | 649,859 | | | 644,879 | |
| | 3.0000%, 8/1/49 | | 1,144,598 | | | 1,033,521 | |
| | 4.5000%, 8/1/49 | | 3,251,643 | | | 3,226,728 | |
| | 3.0000%, 12/1/49 | | 1,300,860 | | | 1,174,618 | |
| | 3.0000%, 12/1/49 | | 1,064,359 | | | 961,068 | |
| | 4.5000%, 1/1/50 | | 2,198,053 | | | 2,181,211 | |
| | 4.5000%, 1/1/50 | | 639,126 | | | 634,229 | |
| | 3.5000%, 3/1/50 | | 599,631 | | | 560,438 | |
| | 4.0000%, 3/1/50 | | 6,668,300 | | | 6,468,691 | |
| | 4.5000%, 3/1/50 | | 7,811,440 | | | 7,657,865 | |
| | 4.0000%, 6/1/50 | | 10,813,022 | | | 10,582,661 | |
| | 2.5000%, 8/1/50 | | 1,168,214 | | | 1,023,829 | |
| | 2.5000%, 8/1/50 | | 416,301 | | | 364,719 | |
| | 2.5000%, 9/1/50 | | 2,162,070 | | | 1,893,508 | |
| | 4.5000%, 9/1/50 | | 19,509,500 | | | 19,396,445 | |
| | 4.0000%, 10/1/50 | | 1,987,640 | | | 1,924,211 | |
| | 2.5000%, 6/1/51 | | 17,125,569 | | | 14,954,116 | |
| | 2.5000%, 11/1/51 | | 15,347,307 | | | 13,402,793 | |
| | 2.5000%, 1/1/52 | | 4,431,354 | | | 3,862,423 | |
| | 2.5000%, 1/1/52 | | 2,663,456 | | | 2,318,815 | |
| | 2.5000%, 2/1/52 | | 6,415,214 | | | 5,579,743 | |
| | 3.0000%, 2/1/52 | | 3,555,823 | | | 3,208,035 | |
| | 3.0000%, 2/1/52 | | 2,696,436 | | | 2,440,299 | |
| | 2.5000%, 3/1/52 | | 965,437 | | | 839,143 | |
| | 3.0000%, 3/1/52 | | 3,839,256 | | | 3,473,220 | |
| | 4.5000%, 3/1/52 | | 302,585 | | | 296,518 | |
| | 3.5000%, 4/1/52 | | 4,042,971 | | | 3,771,055 | |
| | 3.5000%, 4/1/52 | | 3,944,850 | | | 3,679,533 | |
| | 3.5000%, 4/1/52 | | 3,128,459 | | | 2,949,109 | |
| | 3.5000%, 4/1/52 | | 1,320,769 | | | 1,231,352 | |
| | 3.5000%, 4/1/52 | | 1,155,106 | | | 1,076,762 | |
| | 3.5000%, 6/1/52 | | 17,585,353 | | | 16,462,628 | |
| | 3.5000%, 6/1/52 | | 5,995,349 | | | 5,649,786 | |
| | 3.5000%, 7/1/52 | | 63,628,362 | | | 59,526,508 | |
| | 4.0000%, 7/1/52 | | 6,002,681 | | | 5,741,875 | |
| | 3.5000%, 8/1/52 | | 11,281,083 | | | 10,553,839 | |
| | 4.0000%, 8/1/52 | | 6,817,498 | | | 6,524,130 | |
| | 4.5000%, 8/1/52 | | 67,230,732 | | | 65,895,921 | |
| | 4.5000%, 8/1/52 | | 28,496,451 | | | 28,004,217 | |
| | 4.5000%, 8/1/52 | | 14,716,733 | | | 14,424,544 | |
| | 5.0000%, 8/1/52 | | 15,181,896 | | | 15,421,834 | |
| | 4.0000%, 9/1/52 | | 15,437,852 | | | 14,779,968 | |
| | 5.5000%, 9/1/52 | | 9,823,411 | | | 10,018,026 | |
| | 4.5000%, 10/1/52 | | 13,132,214 | | | 13,037,520 | |
| | 5.0000%, 10/1/52 | | 18,967,457 | | | 19,138,262 | |
| | 5.0000%, 10/1/52 | | 12,294,022 | | | 12,404,731 | |
| | 5.0000%, 10/1/52 | | 372,830 | | | 376,187 | |
| | 5.5000%, 11/1/52 | | 42,399,330 | | | 43,455,860 | |
| | 5.0000%, 3/1/53 | | 5,240,214 | | | 5,232,933 | |
| | 5.0000%, 3/1/53 | | 938,589 | | | 937,285 | |
| | | 574,908,007 | |
Ginnie Mae: | | | |
| | 5.0000%, TBA, 30 Year Maturity | | 18,848,683 | | | 18,867,532 | |
| | 4.5000%, TBA, 30 Year Maturity | | 23,627,806 | | | 23,273,956 | |
| | 3.5000%, TBA, 30 Year Maturity | | 143,916,177 | | | 134,929,043 | |
| | 3.0000%, TBA, 30 Year Maturity | | 63,950,000 | | | 58,171,478 | |
| | 2.5000%, TBA, 30 Year Maturity | | 175,353,910 | | | 154,317,754 | |
| | |
See Notes to Schedule of Investments and Other Information and Notes to Financial Statements. |
| |
Janus Investment Fund | 17 |
Janus Henderson Balanced Fund
Schedule of Investments (unaudited)
March 31, 2023
| | | | | | | | |
Shares or
Principal Amounts | | | Value | |
Mortgage-Backed Securities– (continued) | | | |
Ginnie Mae– (continued) | | | |
| | 4.0000%, TBA, 30 Year Maturity | | $47,949,459 | | | $46,145,265 | |
| | | 435,705,028 | |
Ginnie Mae I Pool: | | | |
| | 6.0000%, 1/15/34 | | 56,646 | | | 59,888 | |
| | 4.0000%, 1/15/45 | | 9,628,797 | | | 9,487,070 | |
| | 4.5000%, 8/15/46 | | 11,646,804 | | | 11,599,870 | |
| | 4.0000%, 7/15/47 | | 1,969,619 | | | 1,920,298 | |
| | 4.0000%, 8/15/47 | | 241,351 | | | 235,307 | |
| | 4.0000%, 11/15/47 | | 315,343 | | | 307,447 | |
| | 4.0000%, 12/15/47 | | 853,903 | | | 832,521 | |
| | | 24,442,401 | |
Ginnie Mae II Pool: | | | |
| | 4.0000%, 8/20/47 | | 1,188,141 | | | 1,160,380 | |
| | 4.0000%, 8/20/47 | | 239,459 | | | 233,864 | |
| | 4.0000%, 8/20/47 | | 154,728 | | | 151,113 | |
| | 4.5000%, 2/20/48 | | 1,215,837 | | | 1,214,051 | |
| | 4.5000%, 5/20/48 | | 2,027,176 | | | 2,024,203 | |
| | 4.5000%, 5/20/48 | | 409,712 | | | 409,111 | |
| | 4.0000%, 6/20/48 | | 9,312,081 | | | 9,078,450 | |
| | 5.0000%, 8/20/48 | | 3,563,291 | | | 3,618,542 | |
| | 3.0000%, 7/20/51 | | 24,044,667 | | | 21,978,671 | |
| | 3.0000%, 8/20/51 | | 54,201,228 | | | 49,528,981 | |
| | | 89,397,366 | |
Total Mortgage-Backed Securities (cost $2,724,314,105) | | 2,658,773,508 | |
United States Treasury Notes/Bonds– 11.0% | | | |
| | 4.1250%, 1/31/25 | | 45,269,000 | | | 45,256,622 | |
| | 4.6250%, 2/28/25 | | 10,448,000 | | | 10,549,623 | |
| | 4.6250%, 3/15/26 | | 90,545,000 | | | 92,610,558 | |
| | 0.8750%, 6/30/26 | | 235,686,000 | | | 214,906,965 | |
| | 3.5000%, 1/31/28 | | 170,161,900 | | | 169,271,208 | |
| | 4.0000%, 2/29/28 | | 259,772,800 | | | 264,460,889 | |
| | 3.6250%, 3/31/28 | | 194,929,000 | | | 195,248,804 | |
| | 4.0000%, 2/28/30 | | 4,976,000 | | | 5,107,397 | |
| | 3.6250%, 3/31/30 | | 106,320,000 | | | 106,818,375 | |
| | 3.5000%, 2/15/33 | | 487,035,000 | | | 487,795,992 | |
| | 4.0000%, 11/15/42 | | 304,894,000 | | | 313,183,306 | |
| | 3.8750%, 2/15/43 | | 318,901,100 | | | 321,741,313 | |
| | 4.0000%, 11/15/52 | | 310,609,000 | | | 329,633,801 | |
Total United States Treasury Notes/Bonds (cost $2,537,406,872) | | 2,556,584,853 | |
Common Stocks– 60.3% | | | |
Aerospace & Defense – 1.2% | | | |
| | General Dynamics Corp | | 784,285 | | | 178,981,680 | |
| | L3Harris Technologies Inc | | 458,029 | | | 89,883,611 | |
| | | 268,865,291 | |
Air Freight & Logistics – 1.5% | | | |
| | United Parcel Service Inc | | 1,841,919 | | | 357,313,867 | |
Banks – 2.2% | | | |
| | Bank of America Corp | | 7,805,644 | | | 223,241,418 | |
| | JPMorgan Chase & Co | | 2,133,809 | | | 278,056,651 | |
| | | 501,298,069 | |
Beverages – 1.4% | | | |
| | Constellation Brands Inc - Class A | | 423,129 | | | 95,580,610 | |
| | Monster Beverage Corp | | 4,162,518 | | | 224,817,597 | |
| | | 320,398,207 | |
Biotechnology – 1.2% | | | |
| | AbbVie Inc | | 1,754,822 | | | 279,665,982 | |
Building Products – 0.5% | | | |
| | Trane Technologies PLC | | 587,106 | | | 108,015,762 | |
| | |
See Notes to Schedule of Investments and Other Information and Notes to Financial Statements. |
| |
18 | MARCH 31, 2023 |
Janus Henderson Balanced Fund
Schedule of Investments (unaudited)
March 31, 2023
| | | | | | | | |
Shares or
Principal Amounts | | | Value | |
Common Stocks– (continued) | | | |
Capital Markets – 2.5% | | | |
| | Charles Schwab Corp | | 988,997 | | | $51,803,663 | |
| | CME Group Inc | | 890,052 | | | 170,462,759 | |
| | Goldman Sachs Group Inc | | 368,374 | | | 120,498,819 | |
| | Morgan Stanley | | 2,634,798 | | | 231,335,264 | |
| | | 574,100,505 | |
Chemicals – 0.8% | | | |
| | Corteva Inc | | 2,305,299 | | | 139,032,583 | |
| | Sherwin-Williams Co | | 246,213 | | | 55,341,296 | |
| | | 194,373,879 | |
Communications Equipment – 0.3% | | | |
| | Cisco Systems Inc | | 1,227,159 | | | 64,149,737 | |
Consumer Finance – 1.1% | | | |
| | American Express Co | | 1,562,272 | | | 257,696,766 | |
Diversified Financial Services – 2.2% | | | |
| | Mastercard Inc | | 1,391,078 | | | 505,531,656 | |
Electrical Equipment – 0.4% | | | |
| | Rockwell Automation Inc | | 288,594 | | | 84,687,909 | |
Electronic Equipment, Instruments & Components – 0.6% | | | |
| | TE Connectivity Ltd | | 1,000,020 | | | 131,152,623 | |
Entertainment – 0.9% | | | |
| | Walt Disney Co* | | 1,993,619 | | | 199,621,070 | |
Food & Staples Retailing – 2.3% | | | |
| | Costco Wholesale Corp | | 308,283 | | | 153,176,574 | |
| | Dollar General Corp | | 1,056,418 | | | 222,333,732 | |
| | Sysco Corp | | 2,048,571 | | | 158,211,138 | |
| | | 533,721,444 | |
Food Products – 0.6% | | | |
| | Hershey Co | | 547,314 | | | 139,242,155 | |
Health Care Equipment & Supplies – 1.7% | | | |
| | Abbott Laboratories | | 1,897,414 | | | 192,132,142 | |
| | Edwards Lifesciences Corp* | | 866,978 | | | 71,725,090 | |
| | Stryker Corp | | 498,386 | | | 142,274,251 | |
| | | 406,131,483 | |
Health Care Providers & Services – 2.2% | | | |
| | HCA Healthcare Inc | | 222,104 | | | 58,564,383 | |
| | UnitedHealth Group Inc | | 955,289 | | | 451,460,028 | |
| | | 510,024,411 | |
Hotels, Restaurants & Leisure – 3.8% | | | |
| | Booking Holdings Inc* | | 60,737 | | | 161,099,426 | |
| | Hilton Worldwide Holdings Inc | | 1,565,564 | | | 220,541,001 | |
| | McDonald's Corp | | 1,079,828 | | | 301,930,707 | |
| | Starbucks Corp | | 2,015,122 | | | 209,834,654 | |
| | | 893,405,788 | |
Household Products – 0.9% | | | |
| | Procter & Gamble Co | | 1,474,146 | | | 219,190,769 | |
Industrial Conglomerates – 0.7% | | | |
| | Honeywell International Inc | | 900,554 | | | 172,113,880 | |
Information Technology Services – 1.1% | | | |
| | Accenture PLC | | 890,805 | | | 254,600,977 | |
Insurance – 1.6% | | | |
| | Progressive Corp/The | | 2,547,898 | | | 364,502,288 | |
Interactive Media & Services – 2.2% | | | |
| | Alphabet Inc - Class C* | | 4,993,825 | | | 519,357,800 | |
Leisure Products – 0.1% | | | |
| | Hasbro Inc | | 579,852 | | | 31,132,254 | |
Life Sciences Tools & Services – 1.1% | | | |
| | Thermo Fisher Scientific Inc | | 444,817 | | | 256,379,174 | |
Machinery – 2.0% | | | |
| | Cummins Inc | | 191,166 | | | 45,665,734 | |
| | |
See Notes to Schedule of Investments and Other Information and Notes to Financial Statements. |
| |
Janus Investment Fund | 19 |
Janus Henderson Balanced Fund
Schedule of Investments (unaudited)
March 31, 2023
| | | | | | | | |
Shares or
Principal Amounts | | | Value | |
Common Stocks– (continued) | | | |
Machinery– (continued) | | | |
| | Deere & Co | | 739,945 | | | $305,508,492 | |
| | Illinois Tool Works Inc | | 95,713 | | | 23,301,330 | |
| | Parker-Hannifin Corp | | 278,871 | | | 93,731,332 | |
| | | 468,206,888 | |
Media – 1.2% | | | |
| | Comcast Corp - Class A | | 7,084,296 | | | 268,565,661 | |
Multiline Retail – 0.8% | | | |
| | Amazon.com Inc* | | 1,791,306 | | | 185,023,997 | |
Oil, Gas & Consumable Fuels – 1.4% | | | |
| | Chevron Corp | | 773,825 | | | 126,257,287 | |
| | ConocoPhillips | | 2,076,834 | | | 206,042,701 | |
| | | 332,299,988 | |
Pharmaceuticals – 2.8% | | | |
| | Eli Lilly & Co | | 800,379 | | | 274,866,156 | |
| | Merck & Co Inc | | 2,475,784 | | | 263,398,660 | |
| | Zoetis Inc | | 703,921 | | | 117,160,611 | |
| | | 655,425,427 | |
Professional Services – 0.5% | | | |
| | Automatic Data Processing Inc | | 472,449 | | | 105,181,321 | |
Real Estate Management & Development – 0.2% | | | |
| | CBRE Group Inc* | | 754,041 | | | 54,901,725 | |
Semiconductor & Semiconductor Equipment – 4.5% | | | |
| | Advanced Micro Devices Inc* | | 1,105,769 | | | 108,376,420 | |
| | KLA Corp | | 251,968 | | | 100,578,067 | |
| | Lam Research Corp | | 569,726 | | | 302,023,147 | |
| | NVIDIA Corp | | 1,189,684 | | | 330,458,525 | |
| | Texas Instruments Inc | | 1,053,039 | | | 195,875,784 | |
| | | 1,037,311,943 | |
Software – 5.6% | | | |
| | Cadence Design Systems Inc* | | 295,711 | | | 62,125,924 | |
| | Intuit Inc | | 127,374 | | | 56,787,150 | |
| | Microsoft Corp | | 4,140,704 | | | 1,193,764,963 | |
| | | 1,312,678,037 | |
Specialty Retail – 1.8% | | | |
| | Home Depot Inc | | 745,866 | | | 220,119,974 | |
| | TJX Cos Inc | | 2,562,994 | | | 200,836,210 | |
| | | 420,956,184 | |
Technology Hardware, Storage & Peripherals �� 3.3% | | | |
| | Apple Inc | | 4,720,963 | | | 778,486,799 | |
Textiles, Apparel & Luxury Goods – 1.1% | | | |
| | NIKE Inc - Class B | | 2,079,616 | | | 255,044,106 | |
Total Common Stocks (cost $7,925,559,308) | | 14,020,755,822 | |
Investment Companies– 3.2% | | | |
Money Markets – 3.2% | | | |
| | Janus Henderson Cash Liquidity Fund LLC, 4.7988%ºº,£((cost $752,396,569) | | 752,322,743 | | | 752,473,208 | |
Total Investments (total cost $18,003,323,867) – 102.5% | | 23,831,148,735 | |
Liabilities, net of Cash, Receivables and Other Assets – (2.5)% | | (586,567,254) | |
Net Assets – 100% | | $23,244,581,481 | |
| | |
See Notes to Schedule of Investments and Other Information and Notes to Financial Statements. |
| |
20 | MARCH 31, 2023 |
Janus Henderson Balanced Fund
Schedule of Investments (unaudited)
March 31, 2023
| | | | | | |
Summary of Investments by Country - (Long Positions) (unaudited) |
| |
| | | | | % of | |
| | | | | Investment | |
Country | | Value | | Securities | |
United States | | $23,497,797,980 | | 98.6 | % |
Australia | | 76,278,257 | | 0.3 | |
Japan | | 56,373,336 | | 0.2 | |
Canada | | 54,799,909 | | 0.2 | |
France | | 34,221,328 | | 0.2 | |
Netherlands | | 31,348,860 | | 0.1 | |
Finland | | 30,419,927 | | 0.1 | |
Taiwan | | 15,605,797 | | 0.1 | |
Germany | | 14,030,771 | | 0.1 | |
United Kingdom | | 10,495,717 | | 0.1 | |
Ireland | | 9,776,853 | | 0.0 | |
| | | | | | |
| | | | | | |
Total | | $23,831,148,735 | | 100.0 | % |
Schedules of Affiliated Investments – (% of Net Assets)
| | | | | | | | | | | |
| | Dividend Income | Realized Gain/(Loss) | Change in Unrealized Appreciation/ Depreciation | Value at 3/31/23 |
Investment Companies - 3.2% |
Money Markets - 3.2% | |
| | Janus Henderson Cash Liquidity Fund LLC, 4.7988%ºº | $ | 23,297,678 | $ | 63,217 | $ | 47,862 | $ | 752,473,208 |
| |
| | | | | | | | | | | |
| | Value at 9/30/22 | Purchases | Sales Proceeds | Value at 3/31/23 |
Investment Companies - 3.2% |
Money Markets - 3.2% | |
| | Janus Henderson Cash Liquidity Fund LLC, 4.7988%ºº | | 1,202,737,581 | | 3,098,363,983 | | (3,548,739,435) | | 752,473,208 |
| | |
See Notes to Schedule of Investments and Other Information and Notes to Financial Statements. |
| |
Janus Investment Fund | 21 |
Janus Henderson Balanced Fund
Schedule of Investments (unaudited)
March 31, 2023
Schedule of Futures
| | | | | | | | | | | | | | | |
Description | | Number of Contracts | | Expiration Date | | Notional Amount | | Value and Unrealized Appreciation/(Depreciation) | | |
Futures Long: | | | | | | | | | | |
10 Year US Treasury Note | | 2,134 | | 6/30/23 | $ | 245,243,281 | $ | 5,105,420 | |
2 Year US Treasury Note | | 5,055 | | 7/6/23 | | 1,043,620,552 | | 9,103,864 | |
5 Year US Treasury Note | | 6,120 | | 7/6/23 | | 670,187,813 | | 13,174,493 | |
Ultra Long Term US Treasury Bond | | 1,105 | | 6/30/23 | | 155,943,125 | | 6,129,297 | |
Total - Futures Long | | | | | | | | 33,513,074 | |
Futures Short: | | | | | | | | | | |
Ultra 10-Year Treasury Note | | 1,519 | | 6/30/23 | | (184,012,609) | | (5,874,266) | |
Total | | | | | | | $ | 27,638,808 | | |
The following table, grouped by derivative type, provides information about the fair value and location of derivatives within the Statement of Assets and Liabilities as of March 31, 2023.
| | | | | | |
Fair Value of Derivative Instruments (not accounted for as hedging instruments) as of March 31, 2023 |
| | | | | |
| | | | | Interest Rate
Contracts |
Asset Derivatives: | | | |
*Futures contracts | | | $33,513,074 |
| | | | |
Liability Derivatives: | | | |
*Futures contracts | | | $ 5,874,266 |
| | | | |
*The fair value presented includes net cumulative unrealized appreciation (depreciation) on futures contracts and centrally cleared swaps. In the Statement of Assets and Liabilities, only current day's variation margin is reported in receivables or payables and the net cumulative unrealized appreciation (depreciation) is included in total distributable earnings (loss). |
The following tables provide information about the effect of derivatives and hedging activities on the Fund’s Statement of Operations for the period ended March 31, 2023.
| | | | | | | | | |
The effect of Derivative Instruments (not accounted for as hedging instruments) on the Statement of Operations for the period ended March 31, 2023 |
| | | | | | | | |
Amount of Realized Gain/(Loss) Recognized on Derivatives |
Derivative | | Credit
Contracts | | Interest Rate
Contracts | | Total |
Futures contracts | | $ - | | $(28,808,722) | | $(28,808,722) |
Swap contracts | | (8,467,505) | | - | | $ (8,467,505) |
| | | | | | | | | |
Total | | $(8,467,505) | | $(28,808,722) | | $(37,276,227) |
| | | | | | | | | |
| | | | | | | | | |
Amount of Change in Unrealized Appreciation/Depreciation Recognized on Derivatives |
Derivative | | Credit
Contracts | | Interest Rate
Contracts | | Total |
Futures contracts | | $ - | | $ 58,077,616 | | $ 58,077,616 |
| | | | | | | | | |
| | |
See Notes to Schedule of Investments and Other Information and Notes to Financial Statements. |
| |
22 | MARCH 31, 2023 |
Janus Henderson Balanced Fund
Schedule of Investments (unaudited)
March 31, 2023
Please see the "Net Realized Gain/(Loss) on investments" and "Change in Unrealized Net Appreciation/Depreciation" sections of the Fund’s Statement of Operations.
| | |
Average Ending Monthly Value of Derivative Instruments During the Period Ended March 31, 2023 |
| |
| |
Futures contracts: | |
Average notional amount of contracts - long | $1,594,800,835 |
Average notional amount of contracts - short | (229,416,784) |
| | |
| |
| |
| |
| | |
See Notes to Schedule of Investments and Other Information and Notes to Financial Statements. |
| |
Janus Investment Fund | 23 |
Janus Henderson Balanced Fund
Notes to Schedule of Investments and Other Information (unaudited)
| | |
Balanced Index | Balanced Index is an internally-calculated, hypothetical combination of total returns from the S&P 500® Index (55%) and the Bloomberg U.S. Aggregate Bond Index (45%). |
Bloomberg U.S. Aggregate Bond Index | Bloomberg U.S. Aggregate Bond Index is a broad-based measure of the investment grade, US dollar-denominated, fixed-rate taxable bond market. |
S&P 500® Index | S&P 500® Index reflects U.S. large-cap equity performance and represents broad U.S. equity market performance. |
| | |
ICE | Intercontinental Exchange |
LIBOR | London Interbank Offered Rate |
LLC | Limited Liability Company |
LP | Limited Partnership |
PLC | Public Limited Company |
SOFR | Secured Overnight Financing Rate |
TBA | (To Be Announced) Securities are purchased/sold on a forward commitment basis with an approximate principal amount and no defined maturity date. The actual principal and maturity date will be determined upon settlement when specific mortgage pools are assigned. |
| | |
144A | Securities sold under Rule 144A of the Securities Act of 1933, as amended, are subject to legal and/or contractual restrictions on resale and may not be publicly sold without registration under the 1933 Act. Unless otherwise noted, these securities have been determined to be liquid under guidelines established by the Board of Trustees. The total value of 144A securities as of the period ended March 31, 2023 is $2,406,784,062, which represents 10.4% of net assets. |
| | |
* | Non-income producing security. |
| | |
‡ | Variable or floating rate security. Rate shown is the current rate as of March 31, 2023. Certain variable rate securities are not based on a published reference rate and spread; they are determined by the issuer or agent and current market conditions. Reference rate is as of reset date and may vary by security, which may not indicate a reference rate and/or spread in their description. |
| | |
ºº | Rate shown is the 7-day yield as of March 31, 2023. |
| | |
µ | Perpetual security. Perpetual securities have no stated maturity date, but they may be called/redeemed by the issuer. The date indicated, if any, represents the next call date. |
| | |
Ç | Step bond. The coupon rate will increase or decrease periodically based upon a predetermined schedule. The rate shown reflects the current rate. |
| | |
£ | The Fund may invest in certain securities that are considered affiliated companies. As defined by the Investment Company Act of 1940, as amended, an affiliated company is one in which the Fund owns 5% or more of the outstanding voting securities, or a company which is under common ownership or control. |
Janus Henderson Balanced Fund
Notes to Schedule of Investments and Other Information (unaudited)
| | | | | | | | | | | | | | |
The following is a summary of the inputs that were used to value the Fund’s investments in securities and other financial instruments as of March 31, 2023. See Notes to Financial Statements for more information. |
| |
Valuation Inputs Summary |
| | | | | | | |
| | | | | Level 2 - | | Level 3 - |
| | | Level 1 - | | Other Significant | | Significant |
| | | Quoted Prices | | Observable Inputs | | Unobservable Inputs |
| | | | | | | |
Assets | | | | | | |
Investments In Securities: | | | | | | |
Asset-Backed/Commercial Mortgage-Backed Securities | $ | - | $ | 1,901,709,997 | $ | - |
Corporate Bonds | | - | | 1,940,851,347 | | - |
Mortgage-Backed Securities | | - | | 2,658,773,508 | | - |
United States Treasury Notes/Bonds | | - | | 2,556,584,853 | | - |
Common Stocks | | 14,020,755,822 | | - | | - |
Investment Companies | | - | | 752,473,208 | | - |
Total Investments in Securities | $ | 14,020,755,822 | $ | 9,810,392,913 | $ | - |
Other Financial Instruments(a): | | | | | | |
Futures Contracts | | 33,513,074 | | - | | - |
Total Assets | $ | 14,054,268,896 | $ | 9,810,392,913 | $ | - |
Liabilities | | | | | | |
Other Financial Instruments(a): | | | | | | |
Futures Contracts | $ | 5,874,266 | $ | - | $ | - |
| | | | | | | |
(a) | Other financial instruments may include forward foreign currency exchange contracts, futures, written options, written swaptions, and swap contracts. Forward foreign currency exchange contracts, futures contracts, and swap contracts are reported at their unrealized appreciation/(depreciation) at measurement date, which represents the change in the contract's value from trade date. Written options and written swaptions are reported at their market value at measurement date. |
Janus Henderson Balanced Fund
Statement of Assets and Liabilities (unaudited)
March 31, 2023
| |
See footnotes at the end of the Statement. |
| | | | | | | |
| | | | | | |
Assets: | | | | |
| Unaffiliated investments, at value (cost $17,250,927,298) | | $ | 23,078,675,527 | |
| Affiliated investments, at value (cost $752,396,569) | | | 752,473,208 | |
| Deposits with brokers for centrally cleared derivatives | | | 18,558,515 | |
| Deposits with brokers for futures | | | 24,220,000 | |
| Variation margin receivable on futures contracts | | | 4,061,731 | |
| Trustees' deferred compensation | | | 571,336 | |
| Receivables: | | | | |
| | Investments sold | | | 586,018,168 | |
| | TBA investments sold | | | 64,799,082 | |
| | Interest | | | 49,901,314 | |
| | Fund shares sold | | | 20,904,017 | |
| | Dividends | | | 6,760,017 | |
| | Dividends from affiliates | | | 3,356,387 | |
| Other assets | | | 182,655 | |
Total Assets | | | 24,610,481,957 | |
Liabilities: | | | | |
| Due to custodian | | | 4,383 | |
| Variation margin payable on futures contracts | | | 830,703 | |
| Payables: | | | — | |
| | TBA investments purchased | | | 756,312,849 | |
| | Investments purchased | | | 538,871,903 | |
| | Fund shares repurchased | | | 37,888,032 | |
| | Dividends | | | 13,102,554 | |
| | Advisory fees | | | 11,343,499 | |
| | Transfer agent fees and expenses | | | 2,990,191 | |
| | 12b-1 Distribution and shareholder servicing fees | | | 2,641,908 | |
| | Trustees' deferred compensation fees | | | 571,336 | |
| | Trustees' fees and expenses | | | 156,000 | |
| | Professional fees | | | 66,182 | |
| | Affiliated fund administration fees payable | | | 51,561 | |
| | Custodian fees | | | 25,712 | |
| | Accrued expenses and other payables | | | 1,043,663 | |
Total Liabilities | | | 1,365,900,476 | |
Net Assets | | $ | 23,244,581,481 | |
| | |
See Notes to Financial Statements. |
| |
26 | MARCH 31, 2023 |
Janus Henderson Balanced Fund
Statement of Assets and Liabilities (unaudited)
March 31, 2023
| | | | | | | |
| | | | | | |
| | | | | | | |
Net Assets Consist of: | | | | |
| Capital (par value and paid-in surplus) | | $ | 17,602,916,665 | |
| Total distributable earnings (loss) | | | 5,641,664,816 | |
Total Net Assets | | $ | 23,244,581,481 | |
Net Assets - Class A Shares | | $ | 1,875,053,998 | |
| Shares Outstanding, $0.01 Par Value (unlimited shares authorized) | | | 47,927,395 | |
Net Asset Value Per Share(1) | | $ | 39.12 | |
Maximum Offering Price Per Share(2) | | $ | 41.51 | |
Net Assets - Class C Shares | | $ | 2,209,701,272 | |
| Shares Outstanding, $0.01 Par Value (unlimited shares authorized) | | | 57,223,963 | |
Net Asset Value Per Share(1) | | $ | 38.61 | |
Net Assets - Class D Shares | | $ | 2,098,858,872 | |
| Shares Outstanding, $0.01 Par Value (unlimited shares authorized) | | | 53,470,654 | |
Net Asset Value Per Share | | $ | 39.25 | |
Net Assets - Class I Shares | | $ | 9,913,459,200 | |
| Shares Outstanding, $0.01 Par Value (unlimited shares authorized) | | | 252,457,951 | |
Net Asset Value Per Share | | $ | 39.27 | |
Net Assets - Class N Shares | | $ | 1,953,775,402 | |
| Shares Outstanding, $0.01 Par Value (unlimited shares authorized) | | | 49,811,997 | |
Net Asset Value Per Share | | $ | 39.22 | |
Net Assets - Class R Shares | | $ | 391,363,061 | |
| Shares Outstanding, $0.01 Par Value (unlimited shares authorized) | | | 10,076,384 | |
Net Asset Value Per Share | | $ | 38.84 | |
Net Assets - Class S Shares | | $ | 377,155,577 | |
| Shares Outstanding, $0.01 Par Value (unlimited shares authorized) | | | 9,642,906 | |
Net Asset Value Per Share | | $ | 39.11 | |
Net Assets - Class T Shares | | $ | 4,425,214,099 | |
| Shares Outstanding, $0.01 Par Value (unlimited shares authorized) | | | 112,914,246 | |
Net Asset Value Per Share | | $ | 39.19 | |
| |
(1) Redemption price per share may be reduced for any applicable contingent deferred sales charge. (2) Maximum offering price is computed at 100/94.25 of net asset value. |
| | |
See Notes to Financial Statements. |
| |
Janus Investment Fund | 27 |
Janus Henderson Balanced Fund
Statement of Operations (unaudited)
For the period ended March 31, 2023
| | | | | | |
| | | | | |
Investment Income: | | | |
| Interest | $ | 177,202,862 | |
| Dividends | | 103,323,279 | |
| Dividends from affiliates | | 23,297,678 | |
| Other income | | 357,482 | |
| Foreign withholding tax income | | 211,021 | |
Total Investment Income | | 304,392,322 | |
Expenses: | | | |
| Advisory fees | | 62,979,378 | |
| 12b-1 Distribution and shareholder servicing fees: | | | |
| | Class A Shares | | 2,289,524 | |
| | Class C Shares | | 10,467,595 | |
| | Class R Shares | | 953,590 | |
| | Class S Shares | | 475,057 | |
| Transfer agent administrative fees and expenses: | | | |
| | Class D Shares | | 1,205,195 | |
| | Class R Shares | | 477,445 | |
| | Class S Shares | | 475,409 | |
| | Class T Shares | | 5,489,787 | |
| Transfer agent networking and omnibus fees: | | | |
| | Class A Shares | | 616,272 | |
| | Class C Shares | | 744,803 | |
| | Class I Shares | | 4,447,109 | |
| Other transfer agent fees and expenses: | | | |
| | Class A Shares | | 64,349 | |
| | Class C Shares | | 50,166 | |
| | Class D Shares | | 106,757 | |
| | Class I Shares | | 274,572 | |
| | Class N Shares | | 41,111 | |
| | Class R Shares | | 1,865 | |
| | Class S Shares | | 1,888 | |
| | Class T Shares | | 18,371 | |
| Shareholder reports expense | | 388,805 | |
| Trustees’ fees and expenses | | 348,926 | |
| Affiliated fund administration fees | | 286,270 | |
| Registration fees | | 221,689 | |
| Custodian fees | | 165,868 | |
| Professional fees | | 153,344 | |
| Other expenses | | 643,565 | |
Total Expenses | | 93,388,710 | |
Less: Excess Expense Reimbursement and Waivers | | (268,800) | |
Net Expenses | | 93,119,910 | |
Net Investment Income/(Loss) | | 211,272,412 | |
| | | | | |
| | |
See Notes to Financial Statements. |
| |
28 | MARCH 31, 2023 |
Janus Henderson Balanced Fund
Statement of Operations (unaudited)
For the period ended March 31, 2023
| | | | | | |
| | | | | |
Net Realized Gain/(Loss) on Investments: | | | |
| Investments | $ | (126,707,572) | |
| Investments in affiliates | | 63,217 | |
| Futures contracts | | (28,808,722) | |
| Swap contracts | | (8,467,505) | |
Total Net Realized Gain/(Loss) on Investments | | (163,920,582) | |
Change in Unrealized Net Appreciation/Depreciation: | | | |
| Investments, foreign currency translations and Trustees’ deferred compensation | | 2,265,957,403 | |
| Investments in affiliates | | 47,862 | |
| Futures contracts | | 58,077,616 | |
Total Change in Unrealized Net Appreciation/Depreciation | | 2,324,082,881 | |
Net Increase/(Decrease) in Net Assets Resulting from Operations | $ | 2,371,434,711 | |
| | | | | |
| | |
See Notes to Financial Statements. |
| |
Janus Investment Fund | 29 |
Janus Henderson Balanced Fund
Statements of Changes in Net Assets
| | | | | | | | | |
| | | | | | | | |
| | | Period ended
March 31, 2023 (unaudited) | | Year ended
September 30, 2022 | |
| | | | | | | | | |
Operations: | | | | | | |
| Net investment income/(loss) | $ | 211,272,412 | | $ | 230,064,671 | |
| Net realized gain/(loss) on investments | | (163,920,582) | | | 337,478,101 | |
| Change in unrealized net appreciation/depreciation | | 2,324,082,881 | | | (4,673,512,240) | |
Net Increase/(Decrease) in Net Assets Resulting from Operations | | 2,371,434,711 | | | (4,105,969,468) | |
Dividends and Distributions to Shareholders: | | | | | | |
| | Class A Shares | | (33,465,281) | | | (93,860,314) | |
| | Class C Shares | | (33,110,223) | | | (112,296,142) | |
| | Class D Shares | | (39,082,244) | | | (111,180,078) | |
| | Class I Shares | | (187,519,995) | | | (566,344,120) | |
| | Class N Shares | | (37,411,924) | | | (94,817,591) | |
| | Class R Shares | | (6,210,121) | | | (20,085,711) | |
| | Class S Shares | | (6,597,906) | | | (23,632,020) | |
| | Class T Shares | | (81,250,468) | | | (254,266,348) | |
Net Decrease from Dividends and Distributions to Shareholders | | (424,648,162) | | | (1,276,482,324) | |
Capital Share Transactions: | | | | | | |
| | Class A Shares | | (28,183,073) | | | 201,004,623 | |
| | Class C Shares | | (160,813,186) | | | (98,921,615) | |
| | Class D Shares | | (20,369,308) | | | 41,772,637 | |
| | Class I Shares | | (375,994,094) | | | 118,058,604 | |
| | Class N Shares | | 17,857,813 | | | 577,810,669 | |
| | Class R Shares | | (9,341,187) | | | (13,564,711) | |
| | Class S Shares | | (28,509,489) | | | (96,353,423) | |
| | Class T Shares | | (238,053,195) | | | (291,459,655) | |
Net Increase/(Decrease) from Capital Share Transactions | | (843,405,719) | | | 438,347,129 | |
Net Increase/(Decrease) in Net Assets | | 1,103,380,830 | | | (4,944,104,663) | |
Net Assets: | | | | | | |
| Beginning of period | | 22,141,200,651 | | | 27,085,305,314 | |
| End of period | $ | 23,244,581,481 | | $ | 22,141,200,651 | |
| | | | | | | | |
| | |
See Notes to Financial Statements. |
| |
30 | MARCH 31, 2023 |
Janus Henderson Balanced Fund
Financial Highlights
| | | | | | | | | | | | | | | | | | | | | | |
Class A Shares | | | | | | | | | | | | | | | | | | |
For a share outstanding during the period ended March 31, 2023 (unaudited) and the year ended September 30 | 2023 | | | 2022 | | | 2021 | | | 2020 | | | 2019 | | | 2018 | |
| Net Asset Value, Beginning of Period | | $35.92 | | | $44.26 | | | $38.77 | | | $35.45 | | | $35.22 | | | $32.46 | |
| Income/(Loss) from Investment Operations: | | | | | | | | | | | | | | | | | | |
| | Net investment income/(loss)(1) | | 0.34 | | | 0.34 | | | 0.34 | | | 0.49 | | | 0.60 | | | 0.50 | |
| | Net realized and unrealized gain/(loss) | | 3.56 | | | (6.67) | | | 6.02 | | | 3.75 | | | 1.82 | | | 3.87 | |
| Total from Investment Operations | | 3.90 | | | (6.33) | | | 6.36 | | | 4.24 | | | 2.42 | | | 4.37 | |
| Less Dividends and Distributions: | | | | | | | | | | | | | | | | | | |
| | Dividends (from net investment income) | | (0.38) | | | (0.33) | | | (0.41) | | | (0.53) | | | (0.60) | | | (0.50) | |
| | Distributions (from capital gains) | | (0.32) | | | (1.68) | | | (0.46) | | | (0.39) | | | (1.59) | | | (1.11) | |
| Total Dividends and Distributions | | (0.70) | | | (2.01) | | | (0.87) | | | (0.92) | | | (2.19) | | | (1.61) | |
| Net Asset Value, End of Period | | $39.12 | | | $35.92 | | | $44.26 | | | $38.77 | | | $35.45 | | | $35.22 | |
| Total Return* | | 10.91% | | | (15.13)% | | | 16.58% | | | 12.14% | | | 7.73% | | | 13.81% | |
| Net Assets, End of Period (in thousands) | | $1,875,054 | | | $1,748,525 | | | $1,963,351 | | | $1,519,093 | | | $1,082,508 | | | $768,529 | |
| Average Net Assets for the Period (in thousands) | | $1,835,646 | | | $2,006,053 | | | $1,788,265 | | | $1,249,156 | | | $905,165 | | | $666,296 | |
| Ratios to Average Net Assets**: | | | | | | | | | | | | | | | | | | |
| | Ratio of Gross Expenses | | 0.89% | | | 0.89% | | | 0.89% | | | 0.90% | | | 0.93% | | | 0.95% | |
| | Ratio of Net Expenses (After Waivers and Expense Offsets) | | 0.89% | | | 0.89% | | | 0.89% | | | 0.90% | | | 0.93% | | | 0.95% | |
| | Ratio of Net Investment Income/(Loss) | | 1.77% | | | 0.80% | | | 0.80% | | | 1.34% | | | 1.78% | | | 1.48% | |
| Portfolio Turnover Rate | | 52%(2) | | | 79%(2) | | | 60%(2) | | | 90%(2) | | | 81%(2) | | | 88% | |
| | | | | | | | | | | | | | | | | | | | | | |
| |
* Total return includes adjustments in accordance with generally accepted accounting principles required at the year or period end and are not annualized for periods of less than one full year. ** Annualized for periods of less than one full year. (1) Per share amounts are calculated based on average shares outstanding during the year or period. (2) Portfolio Turnover Rate excludes TBA (to be announced) purchase and sales commitments. |
| | |
See Notes to Financial Statements. |
| |
Janus Investment Fund | 31 |
Janus Henderson Balanced Fund
Financial Highlights
| | | | | | | | | | | | | | | | | | | | | | |
Class C Shares | | | | | | | | | | | | | | | | | | |
For a share outstanding during the period ended March 31, 2023 (unaudited) and the year ended September 30 | 2023 | | | 2022 | | | 2021 | | | 2020 | | | 2019 | | | 2018 | |
| Net Asset Value, Beginning of Period | | $35.46 | | | $43.74 | | | $38.34 | | | $35.09 | | | $34.90 | | | $32.19 | |
| Income/(Loss) from Investment Operations: | | | | | | | | | | | | | | | | | | |
| | Net investment income/(loss)(1) | | 0.20 | | | 0.03 | | | 0.04 | | | 0.23 | | | 0.37 | | | 0.27 | |
| | Net realized and unrealized gain/(loss) | | 3.52 | | | (6.57) | | | 5.95 | | | 3.71 | | | 1.79 | | | 3.84 | |
| Total from Investment Operations | | 3.72 | | | (6.54) | | | 5.99 | | | 3.94 | | | 2.16 | | | 4.11 | |
| Less Dividends and Distributions: | | | | | | | | | | | | | | | | | | |
| | Dividends (from net investment income) | | (0.25) | | | (0.06) | | | (0.13) | | | (0.30) | | | (0.38) | | | (0.29) | |
| | Distributions (from capital gains) | | (0.32) | | | (1.68) | | | (0.46) | | | (0.39) | | | (1.59) | | | (1.11) | |
| Total Dividends and Distributions | | (0.57) | | | (1.74) | | | (0.59) | | | (0.69) | | | (1.97) | | | (1.40) | |
| Net Asset Value, End of Period | | $38.61 | | | $35.46 | | | $43.74 | | | $38.34 | | | $35.09 | | | $34.90 | |
| Total Return* | | 10.53% | | | (15.75)% | | | 15.76% | | | 11.37% | | | 6.98% | | | 13.06% | |
| Net Assets, End of Period (in thousands) | | $2,209,701 | | | $2,180,941 | | | $2,817,466 | | | $2,415,890 | | | $1,992,062 | | | $1,594,610 | |
| Average Net Assets for the Period (in thousands) | | $2,233,162 | | | $2,683,015 | | | $2,671,210 | | | $2,207,746 | | | $1,743,474 | | | $1,403,777 | |
| Ratios to Average Net Assets**: | | | | | | | | | | | | | | | | | | |
| | Ratio of Gross Expenses | | 1.58% | | | 1.60% | | | 1.60% | | | 1.61% | | | 1.62% | | | 1.62% | |
| | Ratio of Net Expenses (After Waivers and Expense Offsets) | | 1.58% | | | 1.60% | | | 1.60% | | | 1.61% | | | 1.62% | | | 1.62% | |
| | Ratio of Net Investment Income/(Loss) | | 1.08% | | | 0.08% | | | 0.10% | | | 0.64% | | | 1.10% | | | 0.81% | |
| Portfolio Turnover Rate | | 52%(2) | | | 79%(2) | | | 60%(2) | | | 90%(2) | | | 81%(2) | | | 88% | |
| | | | | | | | | | | | | | | | | | | | | | |
| |
* Total return includes adjustments in accordance with generally accepted accounting principles required at the year or period end and are not annualized for periods of less than one full year. ** Annualized for periods of less than one full year. (1) Per share amounts are calculated based on average shares outstanding during the year or period. (2) Portfolio Turnover Rate excludes TBA (to be announced) purchase and sales commitments. |
| | |
See Notes to Financial Statements. |
| |
32 | MARCH 31, 2023 |
Janus Henderson Balanced Fund
Financial Highlights
| | | | | | | | | | | | | | | | | | | | | | |
Class D Shares | | | | | | | | | | | | | | | | | | |
For a share outstanding during the period ended March 31, 2023 (unaudited) and the year ended September 30 | 2023 | | | 2022 | | | 2021 | | | 2020 | | | 2019 | | | 2018 | |
| Net Asset Value, Beginning of Period | | $36.04 | | | $44.40 | | | $38.89 | | | $35.54 | | | $35.30 | | | $32.52 | |
| Income/(Loss) from Investment Operations: | | | | | | | | | | | | | | | | | | |
| | Net investment income/(loss)(1) | | 0.37 | | | 0.41 | | | 0.42 | | | 0.56 | | | 0.68 | | | 0.58 | |
| | Net realized and unrealized gain/(loss) | | 3.58 | | | (6.68) | | | 6.04 | | | 3.77 | | | 1.82 | | | 3.89 | |
| Total from Investment Operations | | 3.95 | | | (6.27) | | | 6.46 | | | 4.33 | | | 2.50 | | | 4.47 | |
| Less Dividends and Distributions: | | | | | | | | | | | | | | | | | | |
| | Dividends (from net investment income) | | (0.42) | | | (0.41) | | | (0.49) | | | (0.59) | | | (0.67) | | | (0.58) | |
| | Distributions (from capital gains) | | (0.32) | | | (1.68) | | | (0.46) | | | (0.39) | | | (1.59) | | | (1.11) | |
| Total Dividends and Distributions | | (0.74) | | | (2.09) | | | (0.95) | | | (0.98) | | | (2.26) | | | (1.69) | |
| Net Asset Value, End of Period | | $39.25 | | | $36.04 | | | $44.40 | | | $38.89 | | | $35.54 | | | $35.30 | |
| Total Return* | | 11.00% | | | (14.97)% | | | 16.80% | | | 12.39% | | | 7.95% | | | 14.10% | |
| Net Assets, End of Period (in thousands) | | $2,098,859 | | | $1,946,256 | | | $2,362,421 | | | $2,022,689 | | | $1,860,900 | | | $1,761,817 | |
| Average Net Assets for the Period (in thousands) | | $2,046,999 | | | $2,286,371 | | | $2,246,350 | | | $1,895,563 | | | $1,759,287 | | | $1,667,210 | |
| Ratios to Average Net Assets**: | | | | | | | | | | | | | | | | | | |
| | Ratio of Gross Expenses | | 0.71% | | | 0.70% | | | 0.70% | | | 0.71% | | | 0.72% | | | 0.71% | |
| | Ratio of Net Expenses (After Waivers and Expense Offsets) | | 0.71% | | | 0.70% | | | 0.70% | | | 0.71% | | | 0.72% | | | 0.71% | |
| | Ratio of Net Investment Income/(Loss) | | 1.96% | | | 0.98% | | | 0.99% | | | 1.54% | | | 2.00% | | | 1.71% | |
| Portfolio Turnover Rate | | 52%(2) | | | 79%(2) | | | 60%(2) | | | 90%(2) | | | 81%(2) | | | 88% | |
| | | | | | | | | | | | | | | | | | | | | | |
| |
* Total return includes adjustments in accordance with generally accepted accounting principles required at the year or period end and are not annualized for periods of less than one full year. ** Annualized for periods of less than one full year. (1) Per share amounts are calculated based on average shares outstanding during the year or period. (2) Portfolio Turnover Rate excludes TBA (to be announced) purchase and sales commitments. |
| | |
See Notes to Financial Statements. |
| |
Janus Investment Fund | 33 |
Janus Henderson Balanced Fund
Financial Highlights
| | | | | | | | | | | | | | | | | | | | | | |
Class I Shares | | | | | | | | | | | | | | | | | | |
For a share outstanding during the period ended March 31, 2023 (unaudited) and the year ended September 30 | 2023 | | | 2022 | | | 2021 | | | 2020 | | | 2019 | | | 2018 | |
| Net Asset Value, Beginning of Period | | $36.05 | | | $44.41 | | | $38.90 | | | $35.55 | | | $35.31 | | | $32.53 | |
| Income/(Loss) from Investment Operations: | | | | | | | | | | | | | | | | | | |
| | Net investment income/(loss)(1) | | 0.38 | | | 0.43 | | | 0.44 | | | 0.58 | | | 0.70 | | | 0.61 | |
| | Net realized and unrealized gain/(loss) | | 3.58 | | | (6.68) | | | 6.04 | | | 3.77 | | | 1.83 | | | 3.88 | |
| Total from Investment Operations | | 3.96 | | | (6.25) | | | 6.48 | | | 4.35 | | | 2.53 | | | 4.49 | |
| Less Dividends and Distributions: | | | | | | | | | | | | | | | | | | |
| | Dividends (from net investment income) | | (0.42) | | | (0.43) | | | (0.51) | | | (0.61) | | | (0.70) | | | (0.60) | |
| | Distributions (from capital gains) | | (0.32) | | | (1.68) | | | (0.46) | | | (0.39) | | | (1.59) | | | (1.11) | |
| Total Dividends and Distributions | | (0.74) | | | (2.11) | | | (0.97) | | | (1.00) | | | (2.29) | | | (1.71) | |
| Net Asset Value, End of Period | | $39.27 | | | $36.05 | | | $44.41 | | | $38.90 | | | $35.55 | | | $35.31 | |
| Total Return* | | 11.05% | | | (14.93)% | | | 16.86% | | | 12.45% | | | 8.02% | | | 14.18% | |
| Net Assets, End of Period (in thousands) | | $9,913,459 | | | $9,457,091 | | | $11,674,873 | | | $7,688,726 | | | $5,225,684 | | | $3,197,893 | |
| Average Net Assets for the Period (in thousands) | | $9,782,759 | | | $11,504,986 | | | $9,205,809 | | | $6,311,815 | | | $4,116,708 | | | $2,460,247 | |
| Ratios to Average Net Assets**: | | | | | | | | | | | | | | | | | | |
| | Ratio of Gross Expenses | | 0.67% | | | 0.66% | | | 0.65% | | | 0.65% | | | 0.65% | | | 0.64% | |
| | Ratio of Net Expenses (After Waivers and Expense Offsets) | | 0.67% | | | 0.66% | | | 0.65% | | | 0.65% | | | 0.65% | | | 0.64% | |
| | Ratio of Net Investment Income/(Loss) | | 1.99% | | | 1.02% | | | 1.04% | | | 1.59% | | | 2.07% | | | 1.80% | |
| Portfolio Turnover Rate | | 52%(2) | | | 79%(2) | | | 60%(2) | | | 90%(2) | | | 81%(2) | | | 88% | |
| | | | | | | | | | | | | | | | | | | | | | |
| |
* Total return includes adjustments in accordance with generally accepted accounting principles required at the year or period end and are not annualized for periods of less than one full year. ** Annualized for periods of less than one full year. (1) Per share amounts are calculated based on average shares outstanding during the year or period. (2) Portfolio Turnover Rate excludes TBA (to be announced) purchase and sales commitments. |
| | |
See Notes to Financial Statements. |
| |
34 | MARCH 31, 2023 |
Janus Henderson Balanced Fund
Financial Highlights
| | | | | | | | | | | | | | | | | | | | | | |
Class N Shares | | | | | | | | | | | | | | | | | | |
For a share outstanding during the period ended March 31, 2023 (unaudited) and the year ended September 30 | 2023 | | | 2022 | | | 2021 | | | 2020 | | | 2019 | | | 2018 | |
| Net Asset Value, Beginning of Period | | $36.01 | | | $44.37 | | | $38.86 | | | $35.51 | | | $35.28 | | | $32.50 | |
| Income/(Loss) from Investment Operations: | | | | | | | | | | | | | | | | | | |
| | Net investment income/(loss)(1) | | 0.40 | | | 0.47 | | | 0.48 | | | 0.61 | | | 0.73 | | | 0.63 | |
| | Net realized and unrealized gain/(loss) | | 3.57 | | | (6.69) | | | 6.03 | | | 3.76 | | | 1.81 | | | 3.88 | |
| Total from Investment Operations | | 3.97 | | | (6.22) | | | 6.51 | | | 4.37 | | | 2.54 | | | 4.51 | |
| Less Dividends and Distributions: | | | | | | | | | | | | | | | | | | |
| | Dividends (from net investment income) | | (0.44) | | | (0.46) | | | (0.54) | | | (0.63) | | | (0.72) | | | (0.62) | |
| | Distributions (from capital gains) | | (0.32) | | | (1.68) | | | (0.46) | | | (0.39) | | | (1.59) | | | (1.11) | |
| Total Dividends and Distributions | | (0.76) | | | (2.14) | | | (1.00) | | | (1.02) | | | (2.31) | | | (1.73) | |
| Net Asset Value, End of Period | | $39.22 | | | $36.01 | | | $44.37 | | | $38.86 | | | $35.51 | | | $35.28 | |
| Total Return* | | 11.08% | | | (14.87)% | | | 16.96% | | | 12.53% | | | 8.07% | | | 14.26% | |
| Net Assets, End of Period (in thousands) | | $1,953,775 | | | $1,777,708 | | | $1,611,032 | | | $1,285,159 | | | $946,741 | | | $2,480,945 | |
| Average Net Assets for the Period (in thousands) | | $1,891,401 | | | $1,904,719 | | | $1,562,471 | | | $1,142,389 | | | $1,651,136 | | | $2,273,486 | |
| Ratios to Average Net Assets**: | | | | | | | | | | | | | | | | | | |
| | Ratio of Gross Expenses | | 0.57% | | | 0.57% | | | 0.57% | | | 0.57% | | | 0.58% | | | 0.57% | |
| | Ratio of Net Expenses (After Waivers and Expense Offsets) | | 0.57% | | | 0.57% | | | 0.57% | | | 0.57% | | | 0.58% | | | 0.57% | |
| | Ratio of Net Investment Income/(Loss) | | 2.09% | | | 1.13% | | | 1.12% | | | 1.67% | | | 2.19% | | | 1.86% | |
| Portfolio Turnover Rate | | 52%(2) | | | 79%(2) | | | 60%(2) | | | 90%(2) | | | 81%(2) | | | 88% | |
| | | | | | | | | | | | | | | | | | | | | | |
| |
* Total return includes adjustments in accordance with generally accepted accounting principles required at the year or period end and are not annualized for periods of less than one full year. ** Annualized for periods of less than one full year. (1) Per share amounts are calculated based on average shares outstanding during the year or period. (2) Portfolio Turnover Rate excludes TBA (to be announced) purchase and sales commitments. |
| | |
See Notes to Financial Statements. |
| |
Janus Investment Fund | 35 |
Janus Henderson Balanced Fund
Financial Highlights
| | | | | | | | | | | | | | | | | | | | | | |
Class R Shares | | | | | | | | | | | | | | | | | | |
For a share outstanding during the period ended March 31, 2023 (unaudited) and the year ended September 30 | 2023 | | | 2022 | | | 2021 | | | 2020 | | | 2019 | | | 2018 | |
| Net Asset Value, Beginning of Period | | $35.67 | | | $43.96 | | | $38.52 | | | $35.23 | | | $35.02 | | | $32.29 | |
| Income/(Loss) from Investment Operations: | | | | | | | | | | | | | | | | | | |
| | Net investment income/(loss)(1) | | 0.25 | | | 0.15 | | | 0.16 | | | 0.34 | | | 0.47 | | | 0.37 | |
| | Net realized and unrealized gain/(loss) | | 3.54 | | | (6.61) | | | 5.97 | | | 3.73 | | | 1.80 | | | 3.85 | |
| Total from Investment Operations | | 3.79 | | | (6.46) | | | 6.13 | | | 4.07 | | | 2.27 | | | 4.22 | |
| Less Dividends and Distributions: | | | | | | | | | | | | | | | | | | |
| | Dividends (from net investment income) | | (0.30) | | | (0.15) | | | (0.23) | | | (0.39) | | | (0.47) | | | (0.38) | |
| | Distributions (from capital gains) | | (0.32) | | | (1.68) | | | (0.46) | | | (0.39) | | | (1.59) | | | (1.11) | |
| Total Dividends and Distributions | | (0.62) | | | (1.83) | | | (0.69) | | | (0.78) | | | (2.06) | | | (1.49) | |
| Net Asset Value, End of Period | | $38.84 | | | $35.67 | | | $43.96 | | | $38.52 | | | $35.23 | | | $35.02 | |
| Total Return* | | 10.67% | | | (15.50)% | | | 16.08% | | | 11.71% | | | 7.29% | | | 13.38% | |
| Net Assets, End of Period (in thousands) | | $391,363 | | | $368,360 | | | $473,663 | | | $404,420 | | | $366,621 | | | $345,667 | |
| Average Net Assets for the Period (in thousands) | | $382,840 | | | $456,123 | | | $450,253 | | | $375,839 | | | $347,861 | | | $339,637 | |
| Ratios to Average Net Assets**: | | | | | | | | | | | | | | | | | | |
| | Ratio of Gross Expenses | | 1.32% | | | 1.32% | | | 1.32% | | | 1.32% | | | 1.32% | | | 1.32% | |
| | Ratio of Net Expenses (After Waivers and Expense Offsets) | | 1.32% | | | 1.32% | | | 1.31% | | | 1.32% | | | 1.32% | | | 1.32% | |
| | Ratio of Net Investment Income/(Loss) | | 1.34% | | | 0.35% | | | 0.38% | | | 0.93% | | | 1.39% | | | 1.11% | |
| Portfolio Turnover Rate | | 52%(2) | | | 79%(2) | | | 60%(2) | | | 90%(2) | | | 81%(2) | | | 88% | |
| | | | | | | | | | | | | | | | | | | | | | |
| |
* Total return includes adjustments in accordance with generally accepted accounting principles required at the year or period end and are not annualized for periods of less than one full year. ** Annualized for periods of less than one full year. (1) Per share amounts are calculated based on average shares outstanding during the year or period. (2) Portfolio Turnover Rate excludes TBA (to be announced) purchase and sales commitments. |
| | |
See Notes to Financial Statements. |
| |
36 | MARCH 31, 2023 |
Janus Henderson Balanced Fund
Financial Highlights
| | | | | | | | | | | | | | | | | | | | | | |
Class S Shares | | | | | | | | | | | | | | | | | | |
For a share outstanding during the period ended March 31, 2023 (unaudited) and the year ended September 30 | 2023 | | | 2022 | | | 2021 | | | 2020 | | | 2019 | | | 2018 | |
| Net Asset Value, Beginning of Period | | $35.91 | | | $44.24 | | | $38.76 | | | $35.43 | | | $35.20 | | | $32.44 | |
| Income/(Loss) from Investment Operations: | | | | | | | | | | | | | | | | | | |
| | Net investment income/(loss)(1) | | 0.30 | | | 0.25 | | | 0.27 | | | 0.43 | | | 0.55 | | | 0.46 | |
| | Net realized and unrealized gain/(loss) | | 3.57 | | | (6.65) | | | 6.00 | | | 3.76 | | | 1.82 | | | 3.87 | |
| Total from Investment Operations | | 3.87 | | | (6.40) | | | 6.27 | | | 4.19 | | | 2.37 | | | 4.33 | |
| Less Dividends and Distributions: | | | | | | | | | | | | | | | | | | |
| | Dividends (from net investment income) | | (0.35) | | | (0.25) | | | (0.33) | | | (0.47) | | | (0.55) | | | (0.46) | |
| | Distributions (from capital gains) | | (0.32) | | | (1.68) | | | (0.46) | | | (0.39) | | | (1.59) | | | (1.11) | |
| Total Dividends and Distributions | | (0.67) | | | (1.93) | | | (0.79) | | | (0.86) | | | (2.14) | | | (1.57) | |
| Net Asset Value, End of Period | | $39.11 | | | $35.91 | | | $44.24 | | | $38.76 | | | $35.43 | | | $35.20 | |
| Total Return* | | 10.81% | | | (15.29)% | | | 16.35% | | | 11.99% | | | 7.56% | | | 13.67% | |
| Net Assets, End of Period (in thousands) | | $377,156 | | | $373,119 | | | $566,156 | | | $551,605 | | | $551,985 | | | $589,812 | |
| Average Net Assets for the Period (in thousands) | | $381,415 | | | $503,092 | | | $570,377 | | | $532,958 | | | $549,514 | | | $610,278 | |
| Ratios to Average Net Assets**: | | | | | | | | | | | | | | | | | | |
| | Ratio of Gross Expenses | | 1.07% | | | 1.07% | | | 1.07% | | | 1.07% | | | 1.08% | | | 1.07% | |
| | Ratio of Net Expenses (After Waivers and Expense Offsets) | | 1.07% | | | 1.07% | | | 1.07% | | | 1.07% | | | 1.07% | | | 1.07% | |
| | Ratio of Net Investment Income/(Loss) | | 1.59% | | | 0.59% | | | 0.63% | | | 1.18% | | | 1.64% | | | 1.36% | |
| Portfolio Turnover Rate | | 52%(2) | | | 79%(2) | | | 60%(2) | | | 90%(2) | | | 81%(2) | | | 88% | |
| | | | | | | | | | | | | | | | | | | | | | |
| |
* Total return includes adjustments in accordance with generally accepted accounting principles required at the year or period end and are not annualized for periods of less than one full year. ** Annualized for periods of less than one full year. (1) Per share amounts are calculated based on average shares outstanding during the year or period. (2) Portfolio Turnover Rate excludes TBA (to be announced) purchase and sales commitments. |
| | |
See Notes to Financial Statements. |
| |
Janus Investment Fund | 37 |
Janus Henderson Balanced Fund
Financial Highlights
| | | | | | | | | | | | | | | | | | | | | | |
Class T Shares | | | | | | | | | | | | | | | | | | |
For a share outstanding during the period ended March 31, 2023 (unaudited) and the year ended September 30 | 2023 | | | 2022 | | | 2021 | | | 2020 | | | 2019 | | | 2018 | |
| Net Asset Value, Beginning of Period | | $35.98 | | | $44.34 | | | $38.83 | | | $35.49 | | | $35.26 | | | $32.49 | |
| Income/(Loss) from Investment Operations: | | | | | | | | | | | | | | | | | | |
| | Net investment income/(loss)(1) | | 0.35 | | | 0.36 | | | 0.38 | | | 0.52 | | | 0.64 | | | 0.54 | |
| | Net realized and unrealized gain/(loss) | | 3.58 | | | (6.68) | | | 6.02 | | | 3.76 | | | 1.82 | | | 3.88 | |
| Total from Investment Operations | | 3.93 | | | (6.32) | | | 6.40 | | | 4.28 | | | 2.46 | | | 4.42 | |
| Less Dividends and Distributions: | | | | | | | | | | | | | | | | | | |
| | Dividends (from net investment income) | | (0.40) | | | (0.36) | | | (0.43) | | | (0.55) | | | (0.64) | | | (0.54) | |
| | Distributions (from capital gains) | | (0.32) | | | (1.68) | | | (0.46) | | | (0.39) | | | (1.59) | | | (1.11) | |
| Total Dividends and Distributions | | (0.72) | | | (2.04) | | | (0.89) | | | (0.94) | | | (2.23) | | | (1.65) | |
| Net Asset Value, End of Period | | $39.19 | | | $35.98 | | | $44.34 | | | $38.83 | | | $35.49 | | | $35.26 | |
| Total Return* | | 10.96% | | | (15.09)% | | | 16.67% | | | 12.26% | | | 7.82% | | | 13.97% | |
| Net Assets, End of Period (in thousands) | | $4,425,214 | | | $4,289,200 | | | $5,616,342 | | | $6,473,729 | | | $5,813,161 | | | $5,422,276 | |
| Average Net Assets for the Period (in thousands) | | $4,403,432 | | | $5,242,961 | | | $6,945,465 | | | $6,067,333 | | | $5,475,178 | | | $5,098,558 | |
| Ratios to Average Net Assets**: | | | | | | | | | | | | | | | | | | |
| | Ratio of Gross Expenses | | 0.82% | | | 0.82% | | | 0.82% | | | 0.82% | | | 0.83% | | | 0.82% | |
| | Ratio of Net Expenses (After Waivers and Expense Offsets) | | 0.81% | | | 0.81% | | | 0.81% | | | 0.82% | | | 0.82% | | | 0.82% | |
| | Ratio of Net Investment Income/(Loss) | | 1.85% | | | 0.87% | | | 0.89% | | | 1.43% | | | 1.90% | | | 1.61% | |
| Portfolio Turnover Rate | | 52%(2) | | | 79%(2) | | | 60%(2) | | | 90%(2) | | | 81%(2) | | | 88% | |
| | | | | | | | | | | | | | | | | | | | | | |
| |
* Total return includes adjustments in accordance with generally accepted accounting principles required at the year or period end and are not annualized for periods of less than one full year. ** Annualized for periods of less than one full year. (1) Per share amounts are calculated based on average shares outstanding during the year or period. (2) Portfolio Turnover Rate excludes TBA (to be announced) purchase and sales commitments. |
| | |
See Notes to Financial Statements. |
| |
38 | MARCH 31, 2023 |
Janus Henderson Balanced Fund
Notes to Financial Statements (unaudited)
1. Organization and Significant Accounting Policies
Janus Henderson Balanced Fund (the “Fund”) is a series of Janus Investment Fund (the “Trust”), which is organized as a Massachusetts business trust and is registered under the Investment Company Act of 1940, as amended (the “1940 Act”), as an open-end management investment company, and therefore has applied the specialized accounting and reporting guidance in Financial Accounting Standards Board (“FASB”) Accounting Standards Codification (“ASC”) Topic 946. The Trust offers 40 funds, each of which offers multiple share classes, with differing investment objectives and policies. The Fund seeks long-term capital growth, consistent with preservation of capital and balanced by current income. The Fund is classified as diversified, as defined in the 1940 Act. Janus Henderson Investors US LLC is the investment adviser (the “Adviser”) to the Fund.
The Fund offers multiple classes of shares in order to meet the needs of various types of investors. Each class represents an interest in the same portfolio of investments. Certain financial intermediaries may not offer all classes of shares.
Shareholders, including other funds, individuals, accounts, as well as the Fund’s portfolio manager(s) and/or investment personnel, may from time to time own (beneficially or of record) a significant percentage of the Fund’s Shares and can be considered to “control” the Fund when that ownership exceeds 25% of the Fund’s assets (and which may differ from control as determined in accordance with United States of America generally accepted accounting principles ("US GAAP")).
Class A Shares are offered through financial intermediary platforms including, but not limited to, traditional brokerage platforms, mutual fund wrap fee programs, bank trust platforms, and retirement platforms.
Class C Shares are offered through financial intermediary platforms including, but not limited to, traditional brokerage platforms, mutual fund wrap fee programs, and bank trust platforms.
Class C Shares are closed to investments by new employer-sponsored retirement plans and existing employer-sponsored retirement plans are no longer able to make additional purchases or exchanges into Class C Shares.
The Fund currently implements an automatic conversion feature pursuant to which Class C Shares that have been held for eight years are automatically converted to Class A Shares without the imposition of any sales charge, fee or other charge. The conversion will generally occur no later than ten business days in the month following the month of the eighth anniversary of the date of purchase. Class C Shares purchased through the reinvestment of dividends and other distributions on Class C Shares will convert to Class A Shares at the same time as the original Class C Shares with respect to which they were purchased. For Class C Shares held in omnibus accounts on intermediary platforms, the Fund relies on these intermediaries to implement this conversion feature. Your financial intermediary may have separate policies and procedures as to when and how Class C Shares may be converted to Class A Shares.
Effective July 6, 2020, Class D Shares are available to new investors, subject to any closed fund policies for a Fund, as applicable. Previously, Class D Shares were only available to investors who already had a direct account with the Janus Henderson funds; immediate family members or members of the same household of an eligible individual investor; and existing beneficial owners of sole proprietorships or partnerships that hold accounts directly with the Janus Henderson funds.
Class I Shares are available through certain financial intermediary platforms including, but not limited to, mutual fund wrap fee programs, managed account programs, asset allocation programs, bank trust platforms, as well as certain retirement platforms. Class I Shares are also available to certain direct institutional investors including, but not limited to, corporations, certain retirement plans, public plans, and foundations/endowments, who established Class I Share accounts before August 4, 2017.
Class N Shares are generally available only to financial intermediaries purchasing on behalf of: 1) certain adviser-assisted, employer-sponsored retirement plans, including 401(k) plans, 457 plans, 403(b) plans, Taft-Hartley multi-employer plans, profit-sharing and money purchase pension plans, defined benefit plans and certain welfare benefit plans, such as health savings accounts, and nonqualified deferred compensation plans; and 2) retail investors purchasing in qualified or nonqualified accounts, whose accounts are held through an omnibus account at their financial intermediary, and where the financial intermediary requires no payment or reimbursement from the Fund, the Adviser, or its affiliates. Class N Shares are also available to Janus Henderson proprietary products and to certain direct institutional investors approved by Janus Henderson Distributors US LLC (the “Distributor”) including, but not limited to,
Janus Henderson Balanced Fund
Notes to Financial Statements (unaudited)
corporations, certain retirement plans, public plans, and foundations and endowments, subject to minimum investment requirements.
Class R Shares are offered through financial intermediary platforms including, but not limited to, retirement platforms.
Class S Shares are offered through financial intermediary platforms including, but not limited to, retirement platforms and asset allocation, mutual fund wrap, or other discretionary or nondiscretionary fee-based investment advisory programs. In addition, Class S Shares may be available through certain financial intermediaries who have an agreement with the Adviser or its affiliates to offer Class S Shares on their supermarket platforms.
Class T Shares are available through certain financial intermediary platforms including, but not limited to, mutual fund wrap fee programs, managed account programs, asset allocation programs, bank trust platforms, as well as certain retirement platforms. In addition, Class T Shares may be available through certain financial intermediaries who have an agreement with the Adviser or its affiliates to offer Class T Shares on their supermarket platforms.
The following accounting policies have been followed by the Fund and are in conformity with US GAAP.
Investment Valuation
Fund holdings are valued in accordance with policies and procedures established by the Adviser pursuant to Rule 2a-5 under the 1940 Act and approved by and subject to the oversight of the Trustees (the “Valuation Procedures”). Equity securities traded on a domestic securities exchange are generally valued at readily available market quotations, which are (i) the official close prices or (ii) last sale prices on the primary market or exchange in which the securities trade. If such price is lacking for the trading period immediately preceding the time of determination, such securities are generally valued at their current bid price. Equity securities that are traded on a foreign exchange are generally valued at the closing prices on such markets. In the event that there is no current trading volume on a particular security in such foreign exchange, the bid price from the primary exchange is generally used to value the security. Foreign securities and currencies are converted to U.S. dollars using the current spot USD dollar exchange rate in effect at the close of the New York Stock Exchange (“NYSE”). The Fund will determine the market value of individual securities held by it by using prices provided by one or more approved professional pricing services or, as needed, by obtaining market quotations from independent broker-dealers. Most debt securities are valued in accordance with the evaluated bid price supplied by the Adviser-approved pricing service that is intended to reflect market value. The evaluated bid price supplied by the pricing service is an evaluation that may consider factors such as security prices, yields, maturities and ratings. Certain short-term securities maturing within 60 days or less may be evaluated and valued on an amortized cost basis provided that the amortized cost determined approximates market value. Securities for which market quotations or evaluated prices are not readily available or deemed unreliable are valued at fair value determined in good faith by the Adviser pursuant to the Valuation Procedures. Circumstances in which fair valuation may be utilized include, but are not limited to: (i) a significant event that may affect the securities of a single issuer, such as a merger, bankruptcy, or significant issuer-specific development; (ii) an event that may affect an entire market, such as a natural disaster or significant governmental action; (iii) a nonsignificant event such as a market closing early or not opening, or a security trading halt; and (iv) pricing of a nonvalued security and a restricted or nonpublic security. Special valuation considerations may apply with respect to “odd-lot” fixed-income transactions which, due to their small size, may receive evaluated prices by pricing services which reflect a large block trade and not what actually could be obtained for the odd-lot position. The valuation policies provide for the use of systematic fair valuation models provided by independent pricing services to value foreign equity securities in order to adjust for stale pricing, which may occur between the close of certain foreign exchanges and the close of the NYSE. The value of the securities of other mutual funds held by a Fund, if any, will be calculated using the NAV of such mutual funds.
Valuation Inputs Summary
FASB ASC 820, Fair Value Measurements and Disclosures (“ASC 820”), defines fair value, establishes a framework for measuring fair value, and expands disclosure requirements regarding fair value measurements. This standard emphasizes that fair value is a market-based measurement that should be determined based on the assumptions that market participants would use in pricing an asset or liability and establishes a hierarchy that prioritizes inputs to valuation techniques used to measure fair value. These inputs are summarized into three broad levels:
Level 1 – Unadjusted quoted prices in active markets the Fund has the ability to access for identical assets or liabilities.
Janus Henderson Balanced Fund
Notes to Financial Statements (unaudited)
Level 2 – Observable inputs other than unadjusted quoted prices included in Level 1 that are observable for the asset or liability either directly or indirectly. These inputs may include quoted prices for the identical instrument on an inactive market, prices for similar instruments, interest rates, prepayment speeds, credit risk, yield curves, default rates and similar data.
Assets or liabilities categorized as Level 2 in the hierarchy generally include: debt securities fair valued in accordance with the evaluated bid or ask prices supplied by a pricing service; securities traded on OTC markets and listed securities for which no sales are reported that are fair valued at the latest bid price (or yield equivalent thereof) obtained from one or more dealers transacting in a market for such securities or by a pricing service approved by the Fund’s Trustees; certain short-term debt securities with maturities of 60 days or less that are fair valued at amortized cost; and equity securities of foreign issuers whose fair value is determined by using systematic fair valuation models provided by independent third parties in order to adjust for stale pricing which may occur between the close of certain foreign exchanges and the close of the NYSE. Other securities that may be categorized as Level 2 in the hierarchy include, but are not limited to, preferred stocks, bank loans, swaps, investments in unregistered investment companies, options, and forward contracts.
Level 3 – Unobservable inputs for the asset or liability to the extent that relevant observable inputs are not available, representing the Fund’s own assumptions about the assumptions that a market participant would use in valuing the asset or liability, and that would be based on the best information available.
There have been no significant changes in valuation techniques used in valuing any such positions held by the Fund since the beginning of the fiscal period.
The inputs or methodology used for fair valuing securities are not necessarily an indication of the risk associated with investing in those securities. The summary of inputs used as of March 31, 2023 to fair value the Fund’s investments in securities and other financial instruments is included in the “Valuation Inputs Summary” in the Notes to Schedule of Investments and Other Information.
Investment Transactions and Investment Income
Investment transactions are accounted for as of the date purchased or sold (trade date). Dividend income is recorded on the ex-dividend date. Certain dividends from foreign securities will be recorded as soon as the Fund is informed of the dividend, if such information is obtained subsequent to the ex-dividend date. Dividends from foreign securities may be subject to withholding taxes in foreign jurisdictions. Non-cash dividends, if any, are recorded on the ex-dividend date at fair value. Interest income is recorded daily on an accrual basis and includes amortization of premiums and accretion of discounts. The Fund classifies gains and losses on prepayments received as an adjustment to interest income. Debt securities may be placed in non-accrual status and related interest income may be reduced by stopping current accruals and writing off interest receivables when collection of all or a portion of interest has become doubtful. Gains and losses are determined on the identified cost basis, which is the same basis used for federal income tax purposes. Income, as well as gains and losses, both realized and unrealized, are allocated daily to each class of shares based upon the ratio of net assets represented by each class as a percentage of total net assets.
Expenses
The Fund bears expenses incurred specifically on its behalf. Each class of shares bears a portion of general expenses, which are allocated daily to each class of shares based upon the ratio of net assets represented by each class as a percentage of total net assets. Expenses directly attributable to a specific class of shares are charged against the operations of such class.
Estimates
The preparation of financial statements in conformity with US GAAP requires management to make estimates and assumptions that affect the reported amount of assets and liabilities and disclosure of contingent assets and liabilities at the date of the financial statements, and the reported amounts of income and expenses during the reporting period. Actual results could differ from those estimates.
Indemnifications
In the normal course of business, the Fund may enter into contracts that contain provisions for indemnification of other parties against certain potential liabilities. The Fund’s maximum exposure under these arrangements is unknown, and would involve future claims that may be made against the Fund that have not yet occurred. Currently, the risk of material loss from such claims is considered remote.
Janus Henderson Balanced Fund
Notes to Financial Statements (unaudited)
Foreign Currency Translations
The Fund does not isolate that portion of the results of operations resulting from the effect of changes in foreign exchange rates on investments from the fluctuations arising from changes in market prices of securities held at the date of the financial statements. Net unrealized appreciation or depreciation of investments and foreign currency translations arise from changes in the value of assets and liabilities, including investments in securities held at the date of the financial statements, resulting from changes in the exchange rates and changes in market prices of securities held.
Currency gains and losses are also calculated on payables and receivables that are denominated in foreign currencies. The payables and receivables are generally related to foreign security transactions and income translations.
Foreign currency-denominated assets and forward currency contracts may involve more risks than domestic transactions, including currency risk, counterparty risk, political and economic risk, regulatory risk and equity risk. Risks may arise from unanticipated movements in the value of foreign currencies relative to the U.S. dollar.
Dividends and Distributions
Dividends of net investment income are generally declared and distributed quarterly, and realized capital gains (if any) are distributed annually. The Fund may treat a portion of the amount paid to redeem shares as a distribution of investment company taxable income and realized capital gains that are reflected in the net asset value. This practice, commonly referred to as “equalization,” has no effect on the redeeming shareholder or a Fund’s total return, but may reduce the amounts that would otherwise be required to be paid as taxable dividends to the remaining shareholders. It is possible that the Internal Revenue Service (IRS) could challenge the Fund's equalization methodology or calculations, and any such challenge could result in additional tax, interest, or penalties to be paid by the Fund.
The Fund may make certain investments in real estate investment trusts (“REITs”) which pay dividends to their shareholders based upon funds available from operations. It is quite common for these dividends to exceed the REITs’ taxable earnings and profits, resulting in the excess portion of such dividends being designated as a return of capital. If the Fund distributes such amounts, such distributions could constitute a return of capital to shareholders for federal income tax purposes.
Federal Income Taxes
The Fund intends to continue to qualify as a regulated investment company and distribute all of its taxable income in accordance with the requirements of Subchapter M of the Internal Revenue Code. Management has analyzed the Fund’s tax positions taken for all open federal income tax years, generally a three-year period, and has concluded that no provision for federal income tax is required in the Fund’s financial statements. The Fund is not aware of any tax positions for which it is reasonably possible that the total amounts of unrecognized tax benefits will significantly change in the next twelve months.
2. Derivative Instruments
The Fund may invest in various types of derivatives, which may at times result in significant derivative exposure. A derivative is a financial instrument whose performance is derived from the performance of another asset. The Fund may invest in derivative instruments including, but not limited to: futures contracts, put options, call options, options on futures contracts, options on foreign currencies, options on recovery locks, options on security and commodity indices, swaps, forward contracts, structured investments, and other equity-linked derivatives. Each derivative instrument that was held by the Fund during the period ended March 31, 2023 is discussed in further detail below. A summary of derivative activity by the Fund is reflected in the tables at the end of this section.
The Fund may use derivative instruments for hedging purposes (to offset risks associated with an investment, currency exposure, or market conditions), to adjust currency exposure relative to a benchmark index, or for speculative purposes (to earn income and seek to enhance returns). When the Fund invests in a derivative for speculative purposes, the Fund will be fully exposed to the risks of loss of that derivative, which may sometimes be greater than the derivative’s cost. The Fund may not use any derivative to gain exposure to an asset or class of assets that it would be prohibited by its investment restrictions from purchasing directly. The Fund’s ability to use derivative instruments may also be limited by tax considerations.
Investments in derivatives in general are subject to market risks that may cause their prices to fluctuate over time. Investments in derivatives may not directly correlate with the price movements of the underlying instrument. As a result, the use of derivatives may expose the Fund to additional risks that it would not be subject to if it invested directly in the
Janus Henderson Balanced Fund
Notes to Financial Statements (unaudited)
securities underlying those derivatives. The use of derivatives may result in larger losses or smaller gains than otherwise would be the case. Derivatives can be volatile and may involve significant risks.
In pursuit of its investment objective, the Fund may seek to use derivatives to increase or decrease exposure to the following market risk factors:
· Commodity Risk – the risk related to the change in value of commodities or commodity-linked investments due to changes in the overall market movements, volatility of the underlying benchmark, changes in interest rates, or other factors affecting a particular industry or commodity such as drought, floods, weather, livestock disease, embargoes, tariffs, and international economic, political, and regulatory developments.
· Counterparty Risk – the risk that the counterparty (the party on the other side of the transaction) on a derivative transaction will be unable to honor its financial obligation to the Fund.
· Credit Risk – the risk an issuer will be unable to make principal and interest payments when due, or will default on its obligations.
· Currency Risk – the risk that changes in the exchange rate between currencies will adversely affect the value (in U.S. dollar terms) of an investment.
· Equity Risk – the risk related to the change in value of equity securities as they relate to increases or decreases in the general market.
· Index Risk – if the derivative is linked to the performance of an index, it will be subject to the risks associated with changes in that index. If the index changes, the Fund could receive lower interest payments or experience a reduction in the value of the derivative to below what the Fund paid. Certain indexed securities, including inverse securities (which move in an opposite direction to the index), may create leverage, to the extent that they increase or decrease in value at a rate that is a multiple of the changes in the applicable index.
· Interest Rate Risk – the risk that the value of fixed-income securities will generally decline as prevailing interest rates rise, which may cause the Fund’s NAV to likewise decrease.
· Leverage Risk – the risk associated with certain types of leveraged investments or trading strategies pursuant to which relatively small market movements may result in large changes in the value of an investment. The Fund creates leverage by investing in instruments, including derivatives, where the investment loss can exceed the original amount invested. Certain investments or trading strategies, such as short sales, that involve leverage can result in losses that greatly exceed the amount originally invested.
· Liquidity Risk – the risk that certain securities may be difficult or impossible to sell at the time that the seller would like or at the price that the seller believes the security is currently worth.
Derivatives may generally be traded OTC or on an exchange. Derivatives traded OTC are agreements that are individually negotiated between parties and can be tailored to meet a purchaser’s needs. OTC derivatives are not guaranteed by a clearing agency and may be subject to increased credit risk.
In an effort to mitigate credit risk associated with derivatives traded OTC, the Fund may enter into collateral agreements with certain counterparties whereby, subject to certain minimum exposure requirements, the Fund may require the counterparty to post collateral if the Fund has a net aggregate unrealized gain on all OTC derivative contracts with a particular counterparty. Additionally, the Fund may deposit cash and/or treasuries as collateral with the counterparty and/or custodian daily (based on the daily valuation of the financial asset) if the Fund has a net aggregate unrealized loss on OTC derivative contracts with a particular counterparty. All liquid securities and restricted cash are considered to cover in an amount at all times equal to or greater than the Fund’s commitment with respect to certain exchange-traded derivatives, centrally cleared derivatives, forward foreign currency exchange contracts, short sales, and/or securities with extended settlement dates. There is no guarantee that counterparty exposure is reduced and these arrangements are dependent on the Adviser’s ability to establish and maintain appropriate systems and trading.
Futures Contracts
A futures contract is an exchange-traded agreement to take or make delivery of an underlying asset at a specific time in the future for a specific predetermined negotiated price. The Fund may enter into futures contracts to gain exposure to the stock market or other markets pending investment of cash balances or to meet liquidity needs. The Fund is
Janus Henderson Balanced Fund
Notes to Financial Statements (unaudited)
subject to interest rate risk, equity risk, and currency risk in the normal course of pursuing its investment objective through its investments in futures contracts. The Fund may also use such derivative instruments to hedge or protect from adverse movements in securities prices, currency rates or interest rates. The use of futures contracts may involve risks such as the possibility of illiquid markets or imperfect correlation between the values of the contracts and the underlying securities, or that the counterparty will fail to perform its obligations.
Futures contracts are valued at the settlement price on valuation date on the exchange as reported by an approved vendor. Mini contracts, as defined in the description of the contract, shall be valued using the Actual Settlement Price or “ASET” price type as reported by an approved vendor. In the event that foreign futures trade when the foreign equity markets are closed, the last foreign futures trade price shall be used.
Futures contracts are marked-to-market daily, and the daily variation margin is recorded as a receivable or payable on the Statement of Assets and Liabilities (if applicable). The change in unrealized net appreciation/depreciation is reported on the Statement of Operations (if applicable). When a contract is closed, a realized gain or loss is reported on the Statement of Operations (if applicable), equal to the difference between the opening and closing value of the contract.
Securities held by the Fund that are designated as collateral for market value on futures contracts are noted on the Schedule of Investments (if applicable). Such collateral is in the possession of the Fund’s futures commission merchant.
With futures, there is minimal counterparty credit risk to the Fund since futures are exchange-traded and the exchange’s clearinghouse, as counterparty to all exchange-traded futures, guarantees the futures against default.
During the period, the Fund purchased interest rate futures to increase exposure to interest rate risk.
During the period, the Fund sold interest rate futures to decrease exposure to interest rate risk.
Swaps
Swap agreements are two-party contracts entered into primarily by institutional investors for periods ranging from a day to more than one year to exchange one set of cash flows for another. The most significant factor in the performance of swap agreements is the change in value of the specific index, security, or currency, or other factors that determine the amounts of payments due to and from the Fund. The use of swaps is a highly specialized activity which involves investment techniques and risks different from those associated with ordinary portfolio securities transactions. Swap transactions may in some instances involve the delivery of securities or other underlying assets by the Fund or its counterparty to collateralize obligations under the swap. If the other party to a swap that is not collateralized defaults, the Fund would risk the loss of the net amount of the payments that it contractually is entitled to receive. Swap agreements entail the risk that a party will default on its payment obligations to the Fund. If the other party to a swap defaults, the Fund would risk the loss of the net amount of the payments that it contractually is entitled to receive. If the Fund utilizes a swap at the wrong time or judges market conditions incorrectly, the swap may result in a loss to the Fund and reduce the Fund’s total return.
Swap agreements also bear the risk that the Fund will not be able to meet its obligation to the counterparty. Swap agreements are typically privately negotiated and entered into in the OTC market. However, certain swap agreements are required to be cleared through a clearinghouse and traded on an exchange or swap execution facility. Swaps that are required to be cleared are required to post initial and variation margins in accordance with the exchange requirements. Regulations enacted require the Fund to centrally clear certain interest rate and credit default index swaps through a clearinghouse or central counterparty (“CCP”). To clear a swap with a CCP, the Fund will submit the swap to, and post collateral with, a futures clearing merchant (“FCM”) that is a clearinghouse member. Alternatively, the Fund may enter into a swap with a financial institution other than the FCM (the “Executing Dealer”) and arrange for the swap to be transferred to the FCM for clearing. The Fund may also enter into a swap with the FCM itself. The CCP, the FCM, and the Executing Dealer are all subject to regulatory oversight by the U.S. Commodity Futures Trading Commission (“CFTC”). A default or failure by a CCP or an FCM, or the failure of a swap to be transferred from an Executing Dealer to the FCM for clearing, may expose the Fund to losses, increase its costs, or prevent the Fund from entering or exiting swap positions, accessing collateral, or fully implementing its investment strategies. The regulatory requirement to clear certain swaps could, either temporarily or permanently, reduce the liquidity of cleared swaps or increase the costs of entering into those swaps.
Index swaps, interest rate swaps, inflation swaps and credit default swaps are valued using an approved vendor supplied price. Basket swaps are valued using a broker supplied price. Equity swaps that consist of a single underlying
Janus Henderson Balanced Fund
Notes to Financial Statements (unaudited)
equity are valued either at the closing price, the latest bid price, or the last sale price on the primary market or exchange it trades. The market value of swap contracts are aggregated by positive and negative values and are disclosed separately as an asset or liability on the Fund’s Statement of Assets and Liabilities (if applicable). Realized gains and losses are reported on the Fund’s Statement of Operations (if applicable). The change in unrealized net appreciation or depreciation during the period is included in the Statement of Operations (if applicable).
The Fund’s maximum risk of loss from counterparty risk or credit risk is the discounted value of the payments to be received from/paid to the counterparty over the contract’s remaining life, to the extent that the amount is positive. The risk is mitigated by having a netting arrangement between the Fund and the counterparty and by the posting of collateral by the counterparty to cover the Fund’s exposure to the counterparty.
The Fund may enter into various types of credit default swap agreements, including OTC credit default swap agreements, for investment purposes, to add leverage to its Fund, or to hedge against widening credit spreads on high-yield/high-risk bonds. Credit default swaps are a specific kind of counterparty agreement that allow the transfer of third party credit risk from one party to the other. One party in the swap is a lender and faces credit risk from a third party, and the counterparty in the credit default swap agrees to insure this risk in exchange for regular periodic payments. Credit default swaps could result in losses if the Fund does not correctly evaluate the creditworthiness of the company or companies on which the credit default swap is based. Credit default swap agreements may involve greater risks than if the Fund had invested in the reference obligation directly since, in addition to risks relating to the reference obligation, credit default swaps are subject to illiquidity risk, counterparty risk, and credit risk. The Fund will generally incur a greater degree of risk when it sells a credit default swap than when it purchases a credit default swap. As a buyer of a credit default swap, the Fund may lose its investment and recover nothing should no credit event occur and the swap is held to its termination date. As seller of a credit default swap, if a credit event were to occur, the value of any deliverable obligation received by the Fund, coupled with the upfront or periodic payments previously received, may be less than what it pays to the buyer, resulting in a loss of value to the Fund.
As a buyer of credit protection, the Fund is entitled to receive the par (or other agreed-upon) value of a referenced debt obligation from the counterparty to the contract in the event of a default or other credit event by a third party, such as a U.S. or foreign issuer, on the debt obligation. In return, the Fund as buyer would pay to the counterparty a periodic stream of payments over the term of the contract provided that no credit event has occurred. If no credit event occurs, the Fund would have spent the stream of payments and potentially received no benefit from the contract.
If the Fund is the seller of credit protection against a particular security, the Fund would receive an up-front or periodic payment to compensate against potential credit events. As the seller in a credit default swap contract, the Fund would be required to pay the par value (the “notional value”) (or other agreed-upon value) of a referenced debt obligation to the counterparty in the event of a default by a third party, such as a U.S. or foreign corporate issuer, on the debt obligation. In return, the Fund would receive from the counterparty a periodic stream of payments over the term of the contract provided that no event of default has occurred. If no default occurs, the Fund would keep the stream of payments and would have no payment obligations. As the seller, the Fund would effectively add leverage to its portfolio because, in addition to its total net assets, the Fund would be subject to investment exposure on the notional value of the swap. The maximum potential amount of future payments (undiscounted) that the Fund as a seller could be required to make in a credit default transaction would be the notional amount of the agreement.
The Fund may invest in CDXs. A CDX is a swap on an index of credit default swaps. CDXs allow an investor to manage credit risk or take a position on a basket of credit entities (such as credit default swaps or commercial mortgage-backed securities) in a more efficient manner than transacting in a single-name CDS. If a credit event occurs in one of the underlying companies, the protection is paid out via the delivery of the defaulted bond by the buyer of protection in return for a payment of notional value of the defaulted bond by the seller of protection or it may be settled through a cash settlement between the two parties. The underlying company is then removed from the index. If the Fund holds a long position in a CDX, the Fund would indirectly bear its proportionate share of any expenses paid by a CDX. A Fund holding a long position in CDXs typically receives income from principal or interest paid on the underlying securities. By investing in CDXs, the Fund could be exposed to illiquidity risk, counterparty risk, and credit risk of the issuers of the underlying loan obligations and of the CDX markets. If there is a default by the CDX counterparty, the Fund will have contractual remedies pursuant to the agreements related to the transaction. CDXs also bear the risk that the Fund will not be able to meet its obligation to the counterparty.
Janus Henderson Balanced Fund
Notes to Financial Statements (unaudited)
During the period, the Fund purchased protection via the credit default swap market in order to reduce credit risk exposure to individual corporates, countries and/or credit indices where reducing this exposure via the cash bond market was less attractive.
There were no credit default swaps held at March 31, 2023.
3. Other Investments and Strategies
Additional Investment Risk
The U.S. government and the Federal Reserve, as well as certain foreign governments and central banks, have taken extraordinary actions to support local and global economies and the financial markets in response to the COVID-19 pandemic. This and other government intervention into the economy and financial markets to address the COVID-19 pandemic may not work as intended, particularly if the efforts are perceived by investors as being unlikely to achieve the desired results. Government actions to mitigate the economic impact of the pandemic have resulted in a large expansion of government deficits and debt, the long term consequences of which are not known. The COVID-19 pandemic could adversely affect the value and liquidity of a Fund’s investments, impair a Fund’s ability to satisfy redemption requests, and negatively impact a Fund’s performance. In addition, the outbreak of COVID-19, and measures taken to mitigate its effects, could result in disruptions to the services provided to a Fund by its service providers.
Widespread disease, including pandemics and epidemics, and natural or environmental disasters, including those which may be attributable to global climate change, such as earthquakes, fires, floods, hurricanes, tsunamis and weather-related phenomena generally, have been and can be highly disruptive to economies and markets, adversely impacting individual companies, sectors, industries, markets, currencies, interest and inflation rates, credit ratings, investor sentiment, and other factors affecting the value of a Fund’s investments. Economies and financial markets throughout the world have become increasingly interconnected, which increases the likelihood that events or conditions in one region or country will adversely affect markets or issuers in other regions or countries, including the United States. These disruptions could prevent a Fund from executing advantageous investment decisions in a timely manner and negatively impact a Fund’s ability to achieve its investment objective(s). Any such event(s) could have a significant adverse impact on the value of a Fund. In addition, these disruptions could also impair the information technology and other operational systems upon which the Fund’s service providers, including the Adviser or the subadviser (as applicable), rely, and could otherwise disrupt the ability of employees of the Fund’s service providers to perform essential tasks on behalf of the Fund. Adverse weather conditions may also have a particularly significant negative effect on issuers in the agricultural sector and on insurance and reinsurance companies that insure or reinsure against the impact of natural disasters.
A number of countries in the European Union (the “EU”) have experienced, and may continue to experience, severe economic and financial difficulties. In particular, many EU nations are susceptible to economic risks associated with high levels of debt. Many non-governmental issuers, and even certain governments, have defaulted on, or been forced to restructure, their debts. Many other issuers have faced difficulties obtaining credit or refinancing existing obligations. Financial institutions have in many cases required government or central bank support, have needed to raise capital, and/or have been impaired in their ability to extend credit. As a result, financial markets in the EU have experienced extreme volatility and declines in asset values and liquidity. These difficulties may continue, worsen, or spread further within the EU. Responses to these financial problems by European governments, central banks, and others, including austerity measures and reforms, may not work, may result in social unrest, and may limit future growth and economic recovery or have other unintended consequences. Among other things, these developments have adversely affected the value and exchange rate of the euro and pound sterling, and may continue to significantly affect the economies of all EU countries, which in turn may have a material adverse effect on the Fund’s investments in such countries, other countries that depend on EU countries for significant amounts of trade or investment, or issuers with exposure to debt issued by certain EU countries.
Mortgage- and Asset-Backed Securities
Mortgage- and asset-backed securities represent interests in “pools” of commercial or residential mortgages or other assets, including consumer and commercial loans or receivables. The Fund may purchase fixed or variable rate commercial or residential mortgage-backed securities issued by the Government National Mortgage Association (“Ginnie Mae”), the Federal National Mortgage Association (“Fannie Mae”), the Federal Home Loan Mortgage Corporation (“Freddie Mac”), or other governmental or government-related entities. Ginnie Mae’s guarantees are backed
Janus Henderson Balanced Fund
Notes to Financial Statements (unaudited)
as to the timely payment of principal and interest by the full faith and credit of the U.S. Government. Fannie Mae and Freddie Mac securities are not backed by the full faith and credit of the U.S. Government. In September 2008, the Federal Housing Finance Agency (“FHFA”), an agency of the U.S. Government, placed Fannie Mae and Freddie Mac under conservatorship. Since that time, Fannie Mae and Freddie Mac have received capital support through U.S. Treasury preferred stock purchases and Treasury and Federal Reserve purchases of their mortgage-backed securities. The FHFA and the U.S. Treasury have imposed strict limits on the size of these entities’ mortgage portfolios. The FHFA has the power to cancel any contract entered into by Fannie Mae and Freddie Mac prior to FHFA’s appointment as conservator or receiver, including the guarantee obligations of Fannie Mae and Freddie Mac.
The Fund may also purchase other mortgage- and asset-backed securities through single- and multi-seller conduits, collateralized debt obligations, structured investment vehicles, and other similar securities. Asset-backed securities may be backed by various consumer obligations, including automobile loans, equipment leases, credit card receivables, or other collateral. In the event the underlying loans are not paid, the securities’ issuer could be forced to sell the assets and recognize losses on such assets, which could impact your return. Unlike traditional debt instruments, payments on these securities include both interest and a partial payment of principal. Mortgage- and asset-backed securities are subject to both extension risk, where borrowers pay off their debt obligations more slowly in times of rising interest rates, and prepayment risk, where borrowers pay off their debt obligations sooner than expected in times of declining interest rates. These risks may reduce the Fund’s returns. In addition, investments in mortgage- and asset-backed securities, including those comprised of subprime mortgages, may be subject to a higher degree of credit risk, valuation risk, extension risk (if interest rates rise), and liquidity risk than various other types of fixed-income securities. Additionally, although mortgage-backed securities are generally supported by some form of government or private guarantee and/or insurance, there is no assurance that guarantors or insurers will meet their obligations.
Real Estate Investing
The Fund may invest in equity and debt securities of real estate-related companies. Such companies may include those in the real estate industry or real estate-related industries. These securities may include common stocks, corporate bonds, preferred stocks, and other equity securities, including, but not limited to, mortgage-backed securities, real estate-backed securities, securities of REITs and similar REIT-like entities. A REIT is a trust that invests in real estate-related projects, such as properties, mortgage loans, and construction loans. REITs are generally categorized as equity, mortgage, or hybrid REITs. A REIT may be listed on an exchange or traded OTC.
Sovereign Debt
The Fund may invest in U.S. and non-U.S. government debt securities (“sovereign debt”). Some investments in sovereign debt, such as U.S. sovereign debt, are considered low risk. However, investments in sovereign debt, especially the debt of less developed countries, can involve a high degree of risk, including the risk that the governmental entity that controls the repayment of sovereign debt may not be willing or able to repay the principal and/or to pay the interest on its sovereign debt in a timely manner. A sovereign debtor’s willingness or ability to satisfy its debt obligation may be affected by various factors including, but not limited to, its cash flow situation, the extent of its foreign currency reserves, the availability of foreign exchange when a payment is due, the relative size of its debt position in relation to its economy as a whole, the sovereign debtor’s policy toward international lenders, and local political constraints to which the governmental entity may be subject. Sovereign debtors may also be dependent on expected disbursements from foreign governments, multilateral agencies, and other entities. The failure of a sovereign debtor to implement economic reforms, achieve specified levels of economic performance, or repay principal or interest when due may result in the cancellation of third party commitments to lend funds to the sovereign debtor, which may further impair such debtor’s ability or willingness to timely service its debts. The Fund may be requested to participate in the rescheduling of such sovereign debt and to extend further loans to governmental entities, which may adversely affect the Fund’s holdings. In the event of default, there may be limited or no legal remedies for collecting sovereign debt and there may be no bankruptcy proceedings through which the Fund may collect all or part of the sovereign debt that a governmental entity has not repaid. In addition, to the extent the Fund invests in non-U.S. sovereign debt, it may be subject to currency risk.
TBA Commitments
The Fund may enter into “to be announced” or “TBA” commitments. TBAs are forward agreements for the purchase or sale of securities, including mortgage-backed securities, for a fixed price, with payment and delivery on an agreed upon future settlement date. The specific securities to be delivered are not identified at the trade date. However, delivered securities must meet specified terms, including issuer, rate, and mortgage terms. Although the particular TBA securities must meet industry-accepted “good delivery” standards, there can be no assurance that a security purchased on
Janus Henderson Balanced Fund
Notes to Financial Statements (unaudited)
forward commitment basis will ultimately be issued or delivered by the counterparty. During the settlement period, the Fund will still bear the risk of any decline in the value of the security to be delivered. Because TBA commitments do not require the delivery of a specific security, the characteristics of the security delivered to the Fund may be less favorable than expected. If the counterparty to a transaction fails to deliver the security, the Fund could suffer a loss. To facilitate TBA commitments, the Fund will segregate or otherwise earmark liquid assets marked to market daily in an amount at least equal to such TBA commitments. Proposed rules of the Financial Industry Regulatory Authority (“FINRA”) include mandatory margin requirements for TBA commitments which, in some circumstances, will require the Fund to also post collateral. These collateral requirements may increase costs associated with the Fund’s participation in the TBA market.
When-Issued, Delayed Delivery and Forward Commitment Transactions
The Fund may purchase or sell securities on a when-issued, delayed delivery, or forward commitment basis. When purchasing a security on a when-issued, delayed delivery, or forward commitment basis, the Fund assumes the rights and risks of ownership of the security, including the risk of price and yield fluctuations, and takes such fluctuations into account when determining its net asset value. Typically, no income accrues on securities the Fund has committed to purchase prior to the time delivery of the securities is made. Because the Fund is not required to pay for the security until the delivery date, these risks are in addition to the risks associated with the Fund’s other investments. If the other party to a transaction fails to deliver the securities, the Fund could miss a favorable price or yield opportunity. If the Fund remains substantially fully invested at a time when when-issued, delayed delivery, or forward commitment purchases are outstanding, the purchases may result in a form of leverage. If the Fund remains substantially fully invested at a time when when-issued, delayed delivery, or forward commitment purchases (including TBA commitments) are outstanding, the purchases may result in a form of leverage.
When the Fund has sold a security on a when-issued, delayed delivery, or forward commitment basis, the Fund does not participate in future gains or losses with respect to the security. If the other party to a transaction fails to pay for the securities, the Fund could suffer a loss. Additionally, when selling a security on a when-issued, delayed delivery, or forward commitment basis without owning the security, the Fund will incur a loss if the security’s price appreciates in value such that the security’s price is above the agreed upon price on the settlement date. The Fund may dispose of or renegotiate a transaction after it is entered into, and may purchase or sell when-issued, delayed delivery or forward commitment securities before the settlement date, which may result in a gain or loss.
4. Investment Advisory Agreements and Other Transactions with Affiliates
The Fund pay the Adviser an investment advisory fee which is calculated daily and paid monthly. The Fund’s contractual investment advisory fee rate (expressed as an annual rate) is 0.55% of its average daily net assets.
The Adviser has contractually agreed to waive the investment advisory fee and/or reimburse operating expenses to the extent that the Fund’s total annual fund operating expenses, excluding the fees payable pursuant to a Rule 12b-1 plan, shareholder servicing fees, such as transfer agency fees (including out-of-pocket costs), administrative services fees and any networking/omnibus payable by any share class, brokerage commissions, interest, dividends, taxes, acquired fund fees and expenses, and extraordinary expenses, exceed the annual rate of 0.68% of the Fund’s average daily net assets. The Adviser has agreed to continue the waivers for at least a one-year period commencing January 27, 2023. If applicable, amounts waived and/or reimbursed to the Fund by the Adviser are disclosed as “Excess Expense Reimbursement and Waivers” on the Statement of Operations.
The Adviser serves as administrator to the Fund pursuant to an administration agreement between the Adviser and the Trust. Under the administration agreement, the Adviser is authorized to perform, or cause others to perform certain administration, compliance, and accounting services to the Fund, including providing office space for the Fund, and is reimbursed by the Fund for certain of its costs in providing these services (to the extent the Adviser seeks reimbursement and such costs are not otherwise waived). In addition, employees of the Adviser and/or its affiliates may serve as officers of the Trust. The Fund pays for some or all of the salaries, fees, and expenses of the Adviser employees and Fund officers, with respect to certain specified administration functions they perform on behalf of the Fund. The Fund pays these costs based on out-of-pocket expenses incurred by the Adviser, and these costs are separate and apart from advisory fees and other expenses paid in connection with the investment advisory services the Adviser (or any subadvisor, as applicable) provides to the Fund. These amounts are disclosed as “Affiliated fund administration fees” on the Statement of Operations. In addition, some expenses related to compensation payable to the Fund’s Chief Compliance Officer and certain compliance staff, all of whom are employees of the Adviser and/or its affiliates, are shared with the Fund. Total compensation of $114,430 was paid to the Chief Compliance Officer and
Janus Henderson Balanced Fund
Notes to Financial Statements (unaudited)
certain compliance staff by the Trust during the period ended March 31, 2023. The Fund's portion is reported as part of “Other expenses” on the Statement of Operations.
Janus Henderson Services US LLC (the “Transfer Agent”), a wholly-owned subsidiary of the Adviser, is the Fund’s transfer agent. The Transfer Agent provides or arranges for the provision of shareholder services including, but not limited to, recordkeeping, subaccounting, answering inquiries regarding accounts, order processing, transaction confirmations, the mailing of prospectuses and shareholder reports, and other shareholder services provided to or on behalf of shareholders. These amounts are disclosed as “Transfer agent administrative fees and expenses” on the Statement of Operations.
Class D Shares of the Fund pay the Transfer Agent an annual administrative services fee based on the average daily net assets of Class D Shares as detailed below.
| | |
Average Daily Net Assets of Class D Shares of the Janus Henderson funds | Administrative Services Fee |
Under $40 billion | 0.12% |
$40 billion – $49.9 billion | 0.10% |
Over $49.9 billion | 0.08% |
During the reporting period, the administrative services fee rate was 0.12%.
The Transfer Agent receives an administrative services fee at an annual rate of up to 0.25% of the average daily net assets of the Fund’s Class R Shares, Class S Shares, and Class T Shares for providing or procuring administrative services to investors in Class R Shares, Class S Shares, and Class T Shares of the Fund. The Transfer Agent expects to use all or a significant portion of this fee to compensate retirement plan service providers, broker-dealers, bank trust departments, financial advisors, and other financial intermediaries for providing these services. The Transfer Agent may keep certain amounts retained for reimbursement of out-of-pocket costs incurred for servicing clients of Class R Shares, Class S Shares, and Class T Shares.
Shareholder Services provided by these financial intermediaries may include, but are not limited to, recordkeeping, subaccounting, order processing, providing order confirmations, periodic statements, forwarding prospectuses, shareholder reports, and other materials to existing customers, answering inquiries regarding accounts, and other administrative services. Order processing includes the submission of transactions through the National Securities Clearing Corporation (“NSCC”) or similar systems, or those processed on a manual basis with the Adviser. For all share classes, the Transfer Agent also seeks reimbursement for costs it incurs as transfer agent and for providing servicing.
Certain, but not all, intermediaries may charge administrative fees to investors in Class A Shares, Class C Shares, and Class I Shares for administrative services provided on behalf of such investors. These administrative fees are paid by the Class A Shares, Class C Shares, and Class I Shares of the Fund to the Transfer Agent, which uses such fees to reimburse intermediaries. Consistent with the Transfer Agency Agreement between the Transfer Agent and the Fund, the Transfer Agent may negotiate the level, structure, and/or terms of the administrative fees with intermediaries requiring such fees on behalf of the Fund. The Adviser and its affiliates benefit from an increase in assets that may result from such relationships. The Adviser has agreed to limit these fees up to 0.20% for Class A Shares and Class C Shares, and up to 0.15% for Class I Shares on an annual basis based on the daily net assets of each share class. Such limits are subject to change by the Trustees in the future. These amounts are disclosed as “Transfer agent networking and omnibus fees” on the Statement of Operations.
The Transfer Agent is not compensated for its services related to the shares, except for out-of-pocket costs, although the Transfer Agent is compensated for its services related to Fund’s Class D Shares. These amounts are disclosed as “Other transfer agent fees and expenses” on the Statement of Operations.
Under distribution and shareholder servicing plans (the “Plans”) adopted in accordance with Rule 12b-1 under the 1940 Act, the Fund pays the Trust’s distributor, the Distributor, a wholly-owned subsidiary of the Adviser, a fee for the sale and distribution and/or shareholder servicing of the shares based on the average daily net assets for each share class at an annual rate of up to 0.25% for Class A Shares, up to 1.00% for Class C Shares, of up to 0.50% of the Class R Shares' average daily net assets, and up to 0.25% for Class S Shares. Under the terms of the Plans, the Trust is authorized to make payments to the Distributor for remittance to retirement plan service providers, broker-dealers, bank trust departments, financial advisors, and other financial intermediaries, as compensation for distribution and/or
Janus Henderson Balanced Fund
Notes to Financial Statements (unaudited)
shareholder services performed by such entities for their customers who are investors in the Fund. These amounts are disclosed as “12b-1 Distribution and shareholder servicing fees” on the Statement of Operations.
Class A Shares include a 5.75% upfront sales charge of the offering price of the Fund. The sales charge is allocated between the Distributor and financial intermediaries. During the period ended March 31, 2023, the Distributor retained upfront sales charges of $155,144.
A contingent deferred sales charge (“CDSC”) of 1.00% will be deducted with respect to Class A Shares purchased without a sales load and redeemed within 12 months of purchase, unless waived. Any applicable CDSC will be 1.00% of the lesser of the original purchase price or the value of the redemption of the Class A Shares redeemed. During the period ended March 31, 2023, redeeming shareholders of Class A Shares paid CDSCs of $18,380 to Janus Henderson Distributors.
A CDSC of 1.00% will be deducted with respect to Class C Shares redeemed within 12 months of purchase, unless waived. Any applicable CDSC will be 1.00% of the lesser of the original purchase price or the value of the redemption of the Class C Shares redeemed. During the period ended March 31, 2023, redeeming shareholders of Class C Shares paid CDSCs of $96,581.
The Board of Trustees has adopted a deferred compensation plan (the “Deferred Plan”) for independent Trustees to elect to defer receipt of all or a portion of the annual compensation they are entitled to receive from the Fund. All deferred fees are credited to an account established in the name of the Trustees. The amounts credited to the account then increase or decrease, as the case may be, in accordance with the performance of one or more of the Janus Henderson funds that are selected by the Trustees. The account balance continues to fluctuate in accordance with the performance of the selected fund or funds until final payment of all amounts are credited to the account. The fluctuation of the account balance is recorded by the Fund as unrealized appreciation/(depreciation) and is included as of March 31, 2023 on the Statement of Assets and Liabilities in the asset, “Trustees’ deferred compensation,” and liability, “Trustees’ deferred compensation fees.” Additionally, the recorded unrealized appreciation/(depreciation) is included in “Total distributable earnings (loss)” on the Statement of Assets and Liabilities. Deferred compensation expenses for the period ended March 31, 2023 are included in “Trustees’ fees and expenses” on the Statement of Operations. Trustees are allowed to change their designation of mutual funds from time to time. Amounts will be deferred until distributed in accordance with the Deferred Plan. Deferred fees of $205,688 were paid by the Trust to the Trustees under the Deferred Plan during the period ended March 31, 2023.
Pursuant to the provisions of the 1940 Act and related rules, the Fund may participate in an affiliated or non-affiliated cash sweep program. In the cash sweep program, uninvested cash balances of the Fund may be used to purchase shares of affiliated or non-affiliated money market funds or cash management pooled investment vehicles that operate as money market funds. The Fund is eligible to participate in the cash sweep program (the “Investing Funds”). The Adviser has an inherent conflict of interest because of its fiduciary duties to the affiliated money market funds or cash management pooled investment vehicles and the Investing Funds. Janus Henderson Cash Liquidity Fund LLC (the “Sweep Vehicle”) is an affiliated unregistered cash management pooled investment vehicle that invests primarily in highly-rated short-term fixed-income securities. The Sweep Vehicle operates pursuant to the provisions of the 1940 Act that govern the operation of money market funds and prices its shares at NAV reflecting market-based values of its portfolio securities (i.e., a “floating” NAV) rounded to the fourth decimal place (e.g., $1.0000). The Sweep Vehicle is permitted to impose a liquidity fee (of up to 2%) on redemptions from the Sweep Vehicle or a redemption gate that temporarily suspends redemptions from the Sweep Vehicle for up to 10 business days during a 90 day period. There are no restrictions on the Fund's ability to withdraw investments from the Sweep Vehicle at will, and there are no unfunded capital commitments due from the Fund to the Sweep Vehicle. The Sweep Vehicle does not charge any management fee, sales charge or service fee.
Any purchases and sales, realized gains/losses and recorded dividends from affiliated investments during the period ended March 31, 2023 can be found in the “Schedules of Affiliated Investments” located in the Schedule of Investments.
5. Federal Income Tax
Income and capital gains distributions are determined in accordance with income tax regulations that may differ from US GAAP. These differences are due to differing treatments for items such as net short-term gains, deferral of wash sale losses, foreign currency transactions, net investment losses, and capital loss carryovers.
Janus Henderson Balanced Fund
Notes to Financial Statements (unaudited)
The Fund has elected to treat gains and losses on forward foreign currency contracts as capital gains and losses, if applicable. Other foreign currency gains and losses on debt instruments are treated as ordinary income for federal income tax purposes pursuant to Section 988 of the Internal Revenue Code.
The aggregate cost of investments and the composition of unrealized appreciation and depreciation of investment securities for federal income tax purposes as of March 31, 2023 are noted below. The primary differences between book and tax appreciation or depreciation of investments are wash sale loss deferrals and investments in partnerships.
| | | | |
Federal Tax Cost | Unrealized
Appreciation | Unrealized
(Depreciation) | Net Tax Appreciation/
(Depreciation) |
$ 18,084,517,934 | $6,207,561,126 | $(460,930,325) | $ 5,746,630,801 |
Janus Henderson Balanced Fund
Notes to Financial Statements (unaudited)
6. Capital Share Transactions
| | | | | | | |
| | | | | | |
| | Period ended March 31, 2023 | | Year ended September 30, 2022 |
| | Shares | Amount | | Shares | Amount |
| | | | | | | |
Class A Shares: | | | | | |
Shares sold | 4,012,659 | $ 153,271,731 | | 11,215,506 | $ 483,931,491 |
Reinvested dividends and distributions | 734,310 | 28,091,291 | | 1,748,607 | 77,348,564 |
Shares repurchased | (5,496,419) | (209,546,095) | | (8,644,941) | (360,275,432) |
Net Increase/(Decrease) | (749,450) | $ (28,183,073) | | 4,319,172 | $ 201,004,623 |
Class C Shares: | | | | | |
Shares sold | 2,066,996 | $ 77,822,789 | | 8,116,014 | $ 346,462,334 |
Reinvested dividends and distributions | 803,851 | 30,343,738 | | 2,307,498 | 102,685,111 |
Shares repurchased | (7,145,028) | (268,979,713) | | (13,341,146) | (548,069,060) |
Net Increase/(Decrease) | (4,274,181) | $ (160,813,186) | | (2,917,634) | $ (98,921,615) |
Class D Shares: | | | | | |
Shares sold | 1,021,209 | $ 39,122,813 | | 3,365,077 | $ 144,011,071 |
Reinvested dividends and distributions | 982,732 | 37,716,661 | | 2,435,454 | 107,803,525 |
Shares repurchased | (2,539,881) | (97,208,782) | | (5,003,519) | (210,041,959) |
Net Increase/(Decrease) | (535,940) | $ (20,369,308) | | 797,012 | $ 41,772,637 |
Class I Shares: | | | | | |
Shares sold | 23,684,666 | $ 906,659,681 | | 60,564,553 | $ 2,612,624,805 |
Reinvested dividends and distributions | 4,467,209 | 171,500,673 | | 11,626,166 | 514,657,671 |
Shares repurchased | (38,015,874) | (1,454,154,448) | | (72,736,618) | (3,009,223,872) |
Net Increase/(Decrease) | (9,863,999) | $ (375,994,094) | | (545,899) | $ 118,058,604 |
Class N Shares: | | | | | |
Shares sold | 4,827,295 | $ 184,813,858 | | 19,919,433 | $ 857,849,812 |
Reinvested dividends and distributions | 889,530 | 34,114,166 | | 1,949,229 | 85,765,840 |
Shares repurchased | (5,271,780) | (201,070,211) | | (8,813,944) | (365,804,983) |
Net Increase/(Decrease) | 445,045 | $ 17,857,813 | | 13,054,718 | $ 577,810,669 |
Class R Shares: | | | | | |
Shares sold | 409,286 | $ 15,588,610 | | 1,715,273 | $ 73,018,763 |
Reinvested dividends and distributions | 162,818 | 6,184,905 | | 450,411 | 20,015,516 |
Shares repurchased | (823,487) | (31,114,702) | | (2,613,108) | (106,598,990) |
Net Increase/(Decrease) | (251,383) | $ (9,341,187) | | (447,424) | $ (13,564,711) |
Class S Shares: | | | | | |
Shares sold | 651,356 | $ 24,817,958 | | 1,674,243 | $ 71,189,873 |
Reinvested dividends and distributions | 169,988 | 6,497,304 | | 525,517 | 23,439,800 |
Shares repurchased | (1,568,188) | (59,824,751) | | (4,606,241) | (190,983,096) |
Net Increase/(Decrease) | (746,844) | $ (28,509,489) | | (2,406,481) | $ (96,353,423) |
Class T Shares: | | | | | |
Shares sold | 3,909,225 | $ 150,064,854 | | 11,382,563 | $ 488,017,295 |
Reinvested dividends and distributions | 2,095,581 | 80,289,471 | | 5,661,980 | 251,115,612 |
Shares repurchased | (12,293,934) | (468,407,520) | | (24,520,523) | (1,030,592,562) |
Net Increase/(Decrease) | (6,289,128) | $ (238,053,195) | | (7,475,980) | $ (291,459,655) |
7. Purchases and Sales of Investment Securities
For the period ended March 31, 2023, the aggregate cost of purchases and proceeds from sales of investment securities (excluding any short-term securities, short-term options contracts, TBAs, and in-kind transactions, as applicable) was as follows:
| | | | |
Purchases of
Securities | Proceeds from Sales
of Securities | Purchases of Long-
Term U.S. Government
Obligations | Proceeds from Sales
of Long-Term U.S.
Government Obligations |
$ 4,059,368,959 | $ 3,399,925,509 | $ 7,290,552,379 | $ 8,592,553,884 |
Janus Henderson Balanced Fund
Notes to Financial Statements (unaudited)
8. Subsequent Event
Management has evaluated whether any events or transactions occurred subsequent to March 31, 2023 and through the date of issuance of the Fund’s financial statements and determined that there were no material events or transactions that would require recognition or disclosure in the Fund’s financial statements.
Janus Henderson Balanced Fund
Additional Information (unaudited)
Proxy Voting Policies and Voting Record
A description of the policies and procedures that the Fund uses to determine how to vote proxies relating to its portfolio securities is available without charge: (i) upon request, by calling 1-800-525-1093; (ii) on the Fund’s website at janushenderson.com/proxyvoting; and (iii) on the SEC’s website at http://www.sec.gov. Additionally, information regarding the Fund’s proxy voting record for the most recent twelve-month period ended June 30 is also available, free of charge, through janushenderson.com/proxyvoting and from the SEC’s website at http://www.sec.gov.
Full Holdings
The Fund files its complete portfolio holdings (schedule of investments) with the SEC as an exhibit to Form N-PORT within 60 days of the end of the first and third fiscal quarters, and in the annual report and semiannual report to shareholders. The Fund’s Form N-PORT filings and annual and semiannual reports: (i) are available on the SEC’s website at http://www.sec.gov; and (ii) are available without charge, upon request, by calling a Janus Henderson representative at 1-877-335-2687 (toll free) (or 1-800-525-3713 if you hold Class D Shares). Portfolio holdings consisting of at least the names of the holdings are generally available on a monthly basis with a 30-day lag under Full Holdings for the Fund at janushenderson.com/info (or janushenderson.com/reports if you hold Class D Shares).
APPROVAL OF ADVISORY AGREEMENTS DURING THE PERIOD
The Trustees of Janus Aspen Series, each of whom serves as an “independent” Trustee (the “Trustees”), oversee the management of each portfolio of Janus Aspen Series (each, a “VIT Portfolio,” and collectively, the “VIT Portfolios”), as well as each fund of Janus Investment Fund (each, a “Fund,” and collectively, the “Funds” and together with the VIT Portfolios, the “Janus Henderson Funds,” and each, a “Janus Henderson Fund”). As required by law, the Trustees determine annually whether to continue the investment advisory agreement for each Janus Henderson Fund.
In connection with their most recent consideration of those agreements for each Janus Henderson Fund, the Trustees received and reviewed information provided by Janus Henderson Investors US LLC (the “Adviser”) in response to requests of the Trustees and their independent legal counsel. They also received and reviewed information and analysis provided by, and in response to requests of, their independent fee consultant. Throughout their consideration of the agreements, the Trustees were advised by their independent legal counsel. The Trustees met with management to consider the agreements, and also met separately in executive session with their independent legal counsel and their independent fee consultant.
At meetings held on November 9-10, 2022 and December 13-14, 2022, the Trustees evaluated the information provided by the Adviser and the independent fee consultant, as well as other information provided by the Adviser and the independent fee consultant during the year. Following such evaluation, the Trustees determined that the overall arrangements between each Janus Henderson Fund and the Adviser were fair and reasonable in light of the nature, extent, and quality of the services provided by the Adviser and its affiliates, the fees charged for those services, and other matters that the Trustees considered relevant in the exercise of their business judgment, and unanimously approved the continuation of the investment advisory agreement for each Janus Henderson Fund for the period from February 1, 2023 through February 1, 2024, subject to earlier termination as provided for in each agreement.
In considering the continuation of those agreements, the Trustees reviewed and analyzed various factors that they determined were relevant, including the factors described below, none of which by itself was considered dispositive. However, the material factors and conclusions that formed the basis for the Trustees’ determination to approve the continuation of the agreements are discussed separately below. Also included is a summary of the independent fee consultant’s conclusions and opinions that arose during, and were included as part of, the Trustees’ consideration of the agreements. “Management fees,” as used herein, reflect actual annual advisory fees and, for the purpose of peer comparisons any administration fees (excluding out of pocket costs), net of any waivers, paid by a fund as a percentage of average net assets.
Nature, Extent and Quality of Services
The Trustees reviewed the nature, extent, and quality of the services provided by the Adviser to the Janus Henderson Funds, taking into account the investment objective, strategies, and policies of each Janus Henderson Fund, and the knowledge the Trustees gained from their regular meetings with management on at least a quarterly basis and their ongoing review of information related to the Janus Henderson Funds. In addition, the Trustees reviewed the resources and key personnel of the Adviser, particularly noting those employees who provide investment and risk management services to the Janus Henderson Funds. The Trustees also considered other services provided to the Janus Henderson
Janus Henderson Balanced Fund
Additional Information (unaudited)
Funds by the Adviser, such as managing the execution of portfolio transactions and the selection of broker-dealers for those transactions. The Trustees considered the Adviser’s role as administrator to the Janus Henderson Funds, noting that the Adviser generally does not receive a fee for its services as administrator, but is reimbursed for its out-of-pocket costs. The Trustees considered the role of the Adviser in monitoring adherence to the Janus Henderson Funds’ investment restrictions, providing support services for the Trustees and Trustee committees, and overseeing communications with Janus Henderson Fund shareholders and the activities of other service providers, including monitoring compliance with various policies and procedures of the Janus Henderson Funds and with applicable securities laws and regulations.
In this regard, the independent fee consultant noted that the Adviser provides a number of different services for the Janus Henderson Funds and their shareholders, ranging from investment management services to various other servicing functions, and that, in its view, the Adviser is a capable provider of those services. The independent fee consultant also provided its belief that the Adviser has developed a number of institutional competitive advantages that should enable it to provide superior investment and service performance over the long term.
The Trustees concluded that the nature, extent, and quality of the services provided by the Adviser to each Janus Henderson Fund were appropriate and consistent with the terms of the respective advisory agreements, and that, taking into account steps taken to address those Janus Henderson Funds whose performance lagged that of their peers for certain periods, the Janus Henderson Funds were likely to benefit from the continued provision of those services. They also concluded that the Adviser had sufficient personnel, with the appropriate education and experience, to serve the Janus Henderson Funds effectively and had demonstrated its ability to attract well-qualified personnel.
Performance of the Funds
The Trustees considered the performance results of each Janus Henderson Fund over various time periods. They noted that they considered Janus Henderson Fund performance data throughout the year, including periodic meetings with each Janus Henderson Fund’s portfolio manager(s), and also reviewed information comparing each Janus Henderson Fund’s performance with the performance of comparable fund peer groups identified by Broadridge Financial Solutions, Inc. (“Broadridge”), an independent data provider, and with the Janus Henderson Fund’s benchmark index. In this regard, the independent fee consultant found that the overall Janus Henderson Funds’ performance has been reasonable, noting that: (i) for the 36 months ended May 31, 2022, approximately 38% of the Janus Henderson Funds were in the top two quartiles of their Broadridge peer groups; (ii) for the 36 months ended September 30, 2022, approximately 45% of the Janus Henderson Funds were in the top two quartiles of performance as reported by Morningstar, and (iii) for the 12 months ended September 30, 2022, approximately 55% of the Janus Henderson Funds were in the top two quartiles of performance as reported by Morningstar.
The Trustees considered the performance of each Janus Henderson Fund, noting that performance may vary by share class, and noted the following with respect to the Funds:
Asset Allocation Funds
· For Janus Henderson Global Allocation Fund – Conservative, the Trustees noted that the Fund’s performance was in the third Broadridge quartile for the 36 months ended May 31, 2022 and the bottom Broadridge quartile for the 12 months ended May 31, 2022. The Trustees noted the reasons for the Fund’s underperformance and the steps the Adviser had taken or was taking to improve performance.
· For Janus Henderson Global Allocation Fund – Growth, the Trustees noted that the Fund’s performance was in the bottom Broadridge quartile for the 36 months ended May 31, 2022 and the bottom Broadridge quartile for the 12 months ended May 31, 2022. The Trustees noted the reasons for the Fund’s underperformance and the steps the Adviser had taken or was taking to improve performance.
· For Janus Henderson Global Allocation Fund – Moderate, the Trustees noted that the Fund’s performance was in the bottom Broadridge quartile for the 36 months ended May 31, 2022 and the bottom Broadridge quartile for the 12 months ended May 31, 2022. The Trustees noted the reasons for the Fund’s underperformance and the steps the Adviser had taken or was taking to improve performance.
Fixed-Income Funds
· For Janus Henderson Absolute Return Income Opportunities Fund, the Trustees noted that the Fund’s performance was in the third Broadridge quartile for the 36 months ended May 31, 2022 and the first Broadridge quartile for the 12 months ended May 31, 2022. The Trustees noted the reasons for the Fund’s underperformance,
Janus Henderson Balanced Fund
Additional Information (unaudited)
the steps the Adviser had taken or was taking to improve performance, and that the performance trend was improving.
· For Janus Developed World Bond Fund, the Trustees noted that the Fund’s performance was in the bottom Broadridge quartile for the 36 months ended May 31, 2022 and the bottom Broadridge quartile for the 12 months ended May 31, 2022. The Trustees noted the reasons for the Fund’s underperformance and the steps the Adviser had taken or was taking to improve performance.
· For Janus Henderson Flexible Bond Fund, the Trustees noted that the Fund’s performance was in the first Broadridge quartile for the 36 months ended May 31, 2022 and the second Broadridge quartile for the 12 months ended May 31, 2022.
· For Janus Henderson Global Bond Fund, the Trustees noted that the Fund’s performance was in the third Broadridge quartile for the 36 months ended May 31, 2022 and the bottom Broadridge quartile for the 12 months ended May 31, 2022. The Trustees noted the reasons for the Fund’s underperformance and the steps the Adviser had taken or was taking to improve performance.
· For Janus Henderson High-Yield Fund, the Trustees noted that the Fund’s performance was in the third Broadridge quartile for the 36 months ended May 31, 2022 and the bottom Broadridge quartile for the 12 months ended May 31, 2022. The Trustees noted the reasons for the Fund’s underperformance and the steps the Adviser had taken or was taking to improve performance.
· For Janus Henderson Multi-Sector Income Fund, the Trustees noted that the Fund’s performance was in the second Broadridge quartile for the 36 months ended May 31, 2022 and the third Broadridge quartile for the 12 months ended May 31, 2022.
· For Janus Henderson Short Duration Flexible Bond Fund, the Trustees noted that the Fund’s performance was in the third Broadridge quartile for the 36 months ended May 31, 2022 and the bottom Broadridge quartile for the 12 months ended May 31, 2022. The Trustees noted the reasons for the Fund’s underperformance and the steps the Adviser had taken or was taking to improve performance.
Global and International Equity Funds
· For Janus Henderson Asia Equity Fund, the Trustees noted that the Fund’s performance was in the third Broadridge quartile for the 36 months ended May 31, 2022 and the third Broadridge quartile for the 12 months ended May 31, 2022. The Trustees noted the reasons for the Fund’s underperformance, while also noting that the Fund has a performance fee structure that results in lower management fees during periods of underperformance, and the steps the Adviser had taken or was taking to improve performance.
· For Janus Henderson Emerging Markets Fund, the Trustees noted that the Fund’s performance was in the third Broadridge quartile for the 36 months ended May 31, 2022 and the third Broadridge quartile for the 12 months ended May 31, 2022. The Trustees noted the reasons for the Fund’s underperformance and the steps the Adviser had taken or was taking to improve performance.
· For Janus Henderson European Focus Fund, the Trustees noted that the Fund’s performance was in the first Broadridge quartile for the 36 months ended May 31, 2022 and the second Broadridge quartile for the 12 months ended May 31, 2022.
· For Janus Henderson Global Equity Income Fund, the Trustees noted that the Fund’s performance was in the third Broadridge quartile for the 36 months ended May 31, 2022 and the first Broadridge quartile for the 12 months ended May 31, 2022. The Trustees noted the reasons for the Fund’s underperformance, the steps the Adviser had taken or was taking to improve performance, and that the performance trend was improving.
· For Janus Henderson Global Life Sciences Fund, the Trustees noted that the Fund’s performance was in the third Broadridge quartile for the 36 months ended May 31, 2022 and the second Broadridge quartile for the 12 months ended May 31, 2022. The Trustees noted the reasons for the Fund’s underperformance, the steps the Adviser had taken or was taking to improve performance, and that the performance trend was improving.
· For Janus Henderson Global Sustainable Equity Fund, the Trustees noted that the Fund’s performance was in the second Broadridge quartile for the 12 months ended May 31, 2022. The Trustees noted that 36 month-end performance was not yet available.
Janus Henderson Balanced Fund
Additional Information (unaudited)
· For Janus Henderson Global Real Estate Fund, the Trustees noted that the Fund’s performance was in the second Broadridge quartile for the 36 months ended May 31, 2022 and the bottom Broadridge quartile for the 12 months ended May 31, 2022.
· For Janus Henderson Global Research Fund, the Trustees noted that the Fund’s performance was in the second Broadridge quartile for the 36 months ended May 31, 2022 and the first Broadridge quartile for the 12 months ended May 31, 2022.
· For Janus Henderson Global Select Fund, the Trustees noted that the Fund’s performance was in the first Broadridge quartile for the 36 months ended May 31, 2022 and the first Broadridge quartile for the 12 months ended May 31, 2022.
· For Janus Henderson Global Technology and Innovation Fund, the Trustees noted that the Fund’s performance was in the second Broadridge quartile for the 36 months ended May 31, 2022 and the second Broadridge quartile for the 12 months ended May 31, 2022.
· For Janus Henderson International Opportunities Fund, the Trustees noted that the Fund’s performance was in the bottom Broadridge quartile for the 36 months ended May 31, 2022 and the third Broadridge quartile for the 12 months ended May 31, 2022. The Trustees noted the reasons for the Fund’s underperformance and the steps the Adviser had taken or was taking to improve performance.
· For Janus Henderson Overseas Fund, the Trustees noted that the Fund’s performance was in the first Broadridge quartile for the 36 months ended May 31, 2022 and the first Broadridge quartile for the 12 months ended May 31, 2022.
· For Janus Henderson Responsible International Dividend Fund (formerly the Janus Henderson Dividend & Income Builder Fund), the Trustees noted that the Fund’s performance was in the bottom Broadridge quartile for the 36 months ended May 31, 2022 and the bottom Broadridge quartile for the 12 months ended May 31, 2022. The Trustees noted the reasons for the Fund’s underperformance and the steps the Adviser had taken or was taking to improve performance.
Money Market Funds
· For Janus Henderson Government Money Market Fund, the Trustees noted that the Fund’s performance was in the third Broadridge quartile for the 36 months ended May 31, 2022 and the bottom Broadridge quartile for the 12 months ended May 31, 2022. The Trustees noted the reasons for the Fund’s underperformance and the steps the Adviser had taken or was taking to improve performance.
· For Janus Henderson Money Market Fund, the Trustees noted that the Fund’s performance was in the third Broadridge quartile for the 36 months ended May 31, 2022 and the bottom Broadridge quartile for the 12 months ended May 31, 2022. The Trustees noted the reasons for the Fund’s underperformance and the steps the Adviser had taken or was taking to improve performance.
Multi-Asset Funds
· For Janus Henderson Adaptive Global Allocation Fund, the Trustees noted that the Fund’s performance was in bottom Broadridge quartile for the 36 months ended May 31, 2022 and the second Broadridge quartile for the 12 months ended May 31, 2022. The Trustees noted the reasons for the Fund’s underperformance, the steps the Adviser had taken or was taking to improve performance, and that the performance trend was improving.
· For Janus Henderson Balanced Fund, the Trustees noted that the Fund’s performance was in the first Broadridge quartile for the 36 months ended May 31, 2022 and the first Broadridge quartile for the 12 months ended May 31, 2022.
U.S. Equity Funds
· For Janus Henderson Adaptive Risk Managed U.S. Equity Fund, the Trustees noted that the Fund’s performance was in the bottom Broadridge quartile for the 36 months ended May 31, 2022 and the second Broadridge quartile for the 12 months ended May 31, 2022. The Trustees noted the reasons for the Fund’s underperformance, the steps the Adviser had taken or were taking to improve performance, and that the performance trend was improving.
Janus Henderson Balanced Fund
Additional Information (unaudited)
· For Janus Henderson Contrarian Fund, the Trustees noted that the Fund’s performance was in the first Broadridge quartile for the 36 months ended May 31, 2022 and the bottom Broadridge quartile for the 12 months ended May 31, 2022.
· For Janus Henderson Enterprise Fund, the Trustees noted that the Fund’s performance was in the second Broadridge quartile for the 36 months ended May 31, 2022 and the first Broadridge quartile for the 12 months ended May 31, 2022.
· For Janus Henderson Forty Fund, the Trustees noted that the Fund’s performance was in the third Broadridge quartile for the 36 months ended May 31, 2022 and the bottom Broadridge quartile for the 12 months ended May 31, 2022. The Trustees noted the reasons for the Fund’s underperformance and the steps the Adviser had taken or was taking to improve performance.
· For Janus Henderson Growth and Income Fund, the Trustees noted that the Fund’s performance was in the bottom Broadridge quartile for the 36 months ended May 31, 2022 and the first Broadridge quartile for the 12 months ended May 31, 2022. The Trustees noted the reasons for the Fund’s underperformance, the steps the Adviser had taken or was taking to improve performance, and that the performance trend was improving.
· For Janus Henderson Mid Cap Value Fund, the Trustees noted that the Fund’s performance was in the bottom Broadridge quartile for the 36 months ended May 31, 2022 and the second Broadridge quartile for the 12 months ended May 31, 2022. The Trustees noted the reasons for the Fund’s underperformance, while also noting that the Fund has a performance fee structure that results in lower management fees during periods of underperformance, the steps the Adviser had taken or was taking to improve performance, and that the performance trend was improving.
· For Janus Henderson Research Fund, the Trustees noted that the Fund’s performance was in the third Broadridge quartile for the 36 months ended May 31, 2022 and the third Broadridge quartile for the 12 months ended May 31, 2022. The Trustees noted the reasons for the Fund’s underperformance, while also noting that the Fund has a performance fee structure that results in lower management fees during periods of underperformance and the steps the Adviser had taken or was taking to improve performance.
· For Janus Henderson Small Cap Value Fund, the Trustees noted that the Fund’s performance was in the bottom Broadridge quartile for the 36 months ended May 31, 2022 and the second Broadridge quartile for the 12 months ended May 31, 2022. The Trustees noted the reasons for the Fund’s underperformance, while also noting that the Fund has a performance fee structure that results in lower management fees during periods of underperformance, the steps the Adviser had taken or was taking to improve performance, and that the performance trend was improving.
· For Janus Henderson Small-Mid Cap Value Fund, the Trustees noted that the Fund’s performance was in the bottom Broadridge quartile for the 36 months ended May 31, 2022 and the second Broadridge quartile for the 12 months ended May 31, 2022. The Trustees noted the reasons for the Fund’s underperformance, while also noting that the Fund has a performance fee structure that results in lower management fees during periods of underperformance, the steps the Adviser had taken or was taking to improve performance, and that the performance trend is improving.
· For Janus Henderson Triton Fund, the Trustees noted that the Fund’s performance was in the bottom Broadridge quartile for the 36 months ended May 31, 2022 and the second Broadridge quartile for the 12 months ended May 31, 2022. The Trustees noted the reasons for the Fund’s underperformance, the steps the Adviser had taken or was taking to improve performance, and that the performance trend was improving.
· For Janus Henderson Venture Fund, the Trustees noted that the Fund’s performance was in the bottom Broadridge quartile for the 36 months ended May 31, 2022 and the second Broadridge quartile for the 12 months ended May 31, 2022. The Trustees noted the reasons for the Fund’s underperformance, the steps the Adviser had taken or was taking to improve performance, and that the performance trend was improving.
In consideration of each Janus Henderson Fund’s performance, the Trustees concluded that, taking into account the factors relevant to performance, as well as other considerations, including steps taken to improve performance, as applicable, the Janus Henderson Fund’s performance warranted continuation of such Janus Henderson Fund’s investment advisory agreement.
Janus Henderson Balanced Fund
Additional Information (unaudited)
Costs of Services Provided
The Trustees examined information regarding the fees and expenses of each Janus Henderson Fund in comparison to similar information for other comparable funds as provided by Broadridge, an independent data provider. They also reviewed an analysis of that information provided by their independent fee consultant. The independent fee consultant provided its belief that the management fees charged by the Adviser to each of the Janus Henderson Funds under the current investment advisory and administration agreements are reasonable in relation to the services provided by the Adviser. The independent fee consultant found: (1) the total expenses and management fees of the Janus Henderson Funds to be reasonable relative to other comparable mutual funds; (2) the total expenses, on average, were 6% under the average total expenses of the respective Broadridge peer group; and (3) the management fees for the Janus Henderson Funds, on average, were 5% under the average management fees for the respective Broadridge peer group. The Trustees also considered the total expenses for each share class of each Janus Henderson Fund compared to the average total expenses for its Broadridge Expense Group and to average total expenses for its Broadridge Expense Universe.
For Janus Henderson Funds with three or more years of performance history, the independent fee consultant also performed a systematic “focus list” analysis of expenses which assessed fund fees in the context of fund performance being delivered. Based on this analysis, the independent fee consultant found that the combination of service quality/performance and expenses on these individual Janus Henderson Funds was reasonable in light of performance trends, performance histories, changes in portfolio management, relative average net asset levels, and the existence of performance fees, breakpoints, and/or expense waivers on such Janus Henderson Funds.
The Trustees considered the methodology used by the Adviser in determining compensation payable to portfolio managers, the competitive environment for investment management talent, and the competitive market for mutual funds in different distribution channels.
The Trustees also reviewed management fees charged by the Adviser to comparable separate account clients and to comparable non-affiliated funds subadvised by the Adviser (for which the Adviser provides only or primarily portfolio management services). Although in most instances subadvisory and separate account fee rates for various investment strategies were lower than management fee rates for Janus Henderson Funds having a similar strategy, the Trustees considered that the Adviser noted that, under the terms of the management agreements with the Janus Henderson Funds, the Adviser performs significant additional services for the Janus Henderson Funds that it does not provide to those other clients, including administration services, oversight of the Janus Henderson Funds’ other service providers, Trustee support, regulatory compliance and numerous other services, and that, in serving the Janus Henderson Funds, the Adviser assumes many legal risks and other costs that it does not assume in servicing its other clients. Moreover, the Trustees noted that the independent fee consultant found that: (1) the management fees the Adviser charges to the Janus Henderson Funds are reasonable in relation to the management fees the Adviser charges to funds subadvised by the Adviser and to the fees the Adviser charges to its institutional separate account clients; (2) these subadvised and institutional separate accounts have different service and infrastructure needs and operate in markets very different from the retail fund market; (3) Janus Henderson mutual fund investors enjoy reasonable fees relative to the fees charged in these other markets; and (4) as part of its 2022 review, 9 of 11 Janus Henderson Funds have lower management fees than similar funds subadvised by the Adviser. The Trustees noted that for the two Janus Henderson Funds that did not, management fees for each were under the average of its 15(c) peer group.
The Trustees considered the fees for each Janus Henderson Fund for its fiscal year ended in 2021 and noted the following with regard to each Janus Henderson Fund’s total expenses, net of applicable fee waivers (the Fund’s “total expenses”) as reflected in the comparative information provided by Broadridge:
Asset Allocation Funds
· For Janus Henderson Global Allocation Fund – Conservative, the Trustees noted that, although the Fund’s total expenses exceeded the peer group average for certain share classes, overall the Fund’s total expenses were reasonable. The Trustees also noted that the Adviser has contractually agreed to limit the Fund’s expenses.
· For Janus Henderson Global Allocation Fund – Growth, the Trustees noted that, although the Fund’s total expenses exceeded the peer group average for certain share classes, overall the Fund’s total expenses were reasonable. The Trustees also noted that the Adviser has contractually agreed to limit the Fund’s expenses, although this limit did not apply because the Fund’s total expenses as shown were below the applicable fee limit.
Janus Henderson Balanced Fund
Additional Information (unaudited)
· For Janus Henderson Global Allocation Fund – Moderate, the Trustees noted that, although the Fund’s total expenses exceeded the peer group average for one share class, overall the Fund’s total expenses were reasonable. The Trustees also noted that the Adviser has contractually agreed to limit the Fund’s expenses.
Fixed-Income Funds
· For Janus Henderson Absolute Return Income Opportunities Fund, the Trustees noted that, although the Fund’s total expenses exceeded the peer group average for certain share classes, overall the Fund’s total expenses were reasonable. The Trustees also noted that the Adviser has contractually agreed to limit the Fund’s expenses.
· For Janus Henderson Developed World Bond Fund, the Trustees noted that, although the Fund’s total expenses exceeded the peer group average for one share class, overall the Fund’s total expenses were reasonable. The Trustees also noted that the Adviser has contractually agreed to limit the Fund’s expenses.
· For Janus Henderson Flexible Bond Fund, the Trustees noted that, although the Fund’s total expenses exceeded the peer group average for certain share classes, overall the Fund’s total expenses were reasonable. The Trustees also noted that the Adviser has contractually agreed to limit the Fund’s expenses, although this limit did not apply because the Fund’s total expenses as shown were below the applicable fee limit.
· For Janus Henderson Global Bond Fund, the Trustees noted that, although the Fund’s total expenses exceeded the peer group average for certain share classes, overall the Fund’s total expenses were reasonable. The Trustees also noted that the Adviser has contractually agreed to limit the Fund’s expenses.
· For Janus Henderson High-Yield Fund, the Trustees noted that, although the Fund’s total expenses exceeded the peer group average for certain share classes, overall the Fund’s total expenses were reasonable. The Trustees also noted that the Adviser has contractually agreed to limit the Fund’s expenses.
· For Janus Henderson Multi-Sector Income Fund, the Trustees noted that, although the Fund’s total expenses exceeded the peer group average for certain share classes, overall the Fund’s total expenses were reasonable. The Trustees also noted that the Adviser has contractually agreed to limit the Fund’s expenses.
· For Janus Henderson Short Duration Flexible Bond Fund, the Trustees noted that, although the Fund’s total expenses exceeded the peer group average for certain share classes, overall the Fund’s total expenses were reasonable. The Trustees also noted that the Adviser has contractually agreed to limit the Fund’s expenses.
Global and International Equity Funds
· For Janus Henderson Asia Equity Fund, the Trustees noted that, although the Fund’s total expenses exceeded the peer group average for certain share classes, overall the Fund’s total expenses were reasonable. The Trustees also noted that the Adviser has contractually agreed to limit the Fund’s expenses.
· For Janus Henderson Emerging Markets Fund, the Trustees noted that, although the Fund’s total expenses exceeded the peer group average for certain share classes, overall the Fund’s total expenses were reasonable. The Trustees also noted that the Adviser has contractually agreed to limit the Fund’s expenses.
· For Janus Henderson European Focus Fund, the Trustees noted that, although the Fund’s total expenses exceeded the peer group average for one share class, overall the Fund’s expenses were reasonable. The Trustees also noted that the Adviser has contractually agreed to limit the Fund’s expenses.
· For Janus Henderson Global Equity Income Fund, the Trustees noted that, although the Fund’s total expenses exceeded the peer group average for one share class, overall the Fund’s total expenses were reasonable. The Trustees also noted that the Adviser has contractually agreed to limit the Fund’s expenses, although this limit did not apply because the Fund’s total expenses as shown were below the applicable fee limit.
· For Janus Henderson Global Life Sciences Fund, the Trustees noted that the Fund’s total expenses were below the peer group average for all share classes.
· For Janus Henderson Global Real Estate Fund, the Trustees noted that, although the Fund’s total expenses exceeded the peer group average for certain share classes, overall the Fund’s total expenses were reasonable. The Trustees also noted that the Adviser has contractually agreed to limit the Fund’s expenses, although this limit did not apply because the Fund’s total expenses as shown were below the applicable fee limit.
Janus Henderson Balanced Fund
Additional Information (unaudited)
· For Janus Henderson Global Research Fund, the Trustees noted that, although the Fund’s total expenses exceeded the peer group average for one share class, overall the Fund’s total expenses were reasonable. The Trustees also noted that the Adviser has contractually agreed to limit the Fund’s expenses, although this limit did not apply because the Fund’s total expenses as shown were below the applicable fee limit.
· For Janus Henderson Global Select Fund, the Trustees noted that, although the Fund’s total expenses exceeded the peer group average for certain share classes, overall the Fund’s total expenses were reasonable. The Trustees also noted that the Adviser has contractually agreed to limit the Fund’s expenses.
· For Janus Henderson Global Sustainable Equity Fund, the Trustees noted that, although the Fund’s total expenses exceeded the peer group average for certain share classes, overall the Fund’s expenses were reasonable. The Trustees also noted that the Adviser has contractually agreed to limit the Fund’s expenses.
· For Janus Henderson Global Technology and Innovation Fund, the Trustees noted that the Fund’s total expenses were below the peer group average for all share classes.
· For Janus Henderson International Opportunities Fund, the Trustees noted that, although the Fund’s total expenses exceeded the peer group average for certain share classes, overall the Fund’s expenses were reasonable. The Trustees also noted that the Adviser has contractually agreed to limit the Fund’s expenses.
· For Janus Henderson Overseas Fund, the Trustees noted that although the Fund’s total expenses exceeded the peer group average for certain share classes, overall the Fund’s total expenses were reasonable. The Trustees also noted that the Adviser has contractually agreed to limit the Fund’s expenses, although this limit did not apply because the Fund’s total expenses as shown were below the applicable fee limit.
· For Janus Henderson Responsible International Dividend Fund (formerly the Janus Henderson Dividend & Income Builder Fund), the Trustees noted that, although the Fund’s total expenses exceeded the peer group for one share class, overall the Fund’s total expenses were reasonable. The Trustees also noted that the Adviser has contractually agreed to limit the Fund’s expenses.
Money Market Funds
· For Janus Henderson Government Money Market Fund, the Trustees noted that the Fund’s total expenses were below the peer group average for all share classes.
· For Janus Henderson Money Market Fund, the Trustees noted that the Fund’s total expenses were below the peer group average for all share classes.
Multi-Asset Funds
· For Janus Henderson Adaptive Global Allocation Fund, the Trustees noted that, that the Fund’s total expenses were below the peer group average for all share classes.
· For Janus Henderson Balanced Fund, the Trustees noted that, although the Fund’s total expenses exceeded the peer group average for certain share classes, overall the Fund’s total expenses were reasonable. The Trustees also noted that the Adviser has contractually agreed to limit the Fund’s expenses, although this limit did not apply because the Fund’s total expenses as shown were below the applicable fee limit.
U.S. Equity Funds
· For Janus Henderson Adaptive Risk Managed U.S. Equity Fund, the Trustees noted that, although the Fund’s total expenses exceeded the peer group average for certain share classes, overall the Fund’s total expenses were reasonable. The Trustees also noted that the Adviser has contractually agreed to limit the Fund’s expenses, although this limit did not apply because the Fund’s total expenses as shown were below the applicable fee limit.
· For Janus Henderson Contrarian Fund, the Trustees noted that, although the Fund’s total expenses exceeded the peer group average for all share classes, overall the Fund’s total expenses were reasonable. The Trustees also noted that the Adviser had contractually agreed to limit the Fund’s expenses.
· For Janus Henderson Enterprise Fund, the Trustees noted that, although the Fund’s total expenses exceeded the peer group average for certain share classes, overall the Fund’s total expenses were reasonable. The Trustees also noted that the Adviser has contractually agreed to limit the Fund’s expenses, although this limit did not apply because the Fund’s total expenses as shown were below the applicable fee limit.
Janus Henderson Balanced Fund
Additional Information (unaudited)
· For Janus Henderson Forty Fund, the Trustees noted that, although the Fund’s total expenses exceeded the peer group average for certain share classes, overall the Fund’s total expenses were reasonable. The Trustees also noted that the Adviser has contractually agreed to limit the Fund’s expenses, although this limit did not apply because the Fund’s total expenses as shown were below the applicable fee limit.
· For Janus Henderson Growth and Income Fund, the Trustees noted that, although the Fund’s total expenses exceeded the peer group average for certain share classes, overall the Fund’s total expenses were reasonable. The Trustees also noted that the Adviser has contractually agreed to limit the Fund’s expenses, although this limit did not apply because the Fund’s total expenses as shown were below the applicable fee limit.
· For Janus Henderson Mid Cap Value Fund, the Trustees noted that the Fund’s total expenses were below the peer group average for all share classes.
· For Janus Henderson Research Fund, the Trustees noted that, although the Fund’s total expenses exceeded the peer group average for certain share classes, overall the Fund’s total expenses were reasonable. The Trustees also noted that the Adviser has contractually agreed to limit the Fund’s expenses.
· For Janus Henderson Small Cap Value Fund, the Trustees noted that, although the Fund’s total expenses exceeded the peer group average for one share class, overall the Fund’s total expenses were reasonable. The Trustees also noted that the Adviser has contractually agreed to limit the Fund’s expenses, although this limit did not apply because the Fund’s total expenses as shown were below the applicable fee limit.
· For Janus Henderson Small-Mid Cap Value Fund, the Trustees noted that the Fund’s total expenses were below the peer group average for all share classes.
· For Janus Henderson Triton Fund, the Trustees noted that, although the Fund’s total expenses exceeded the peer group average for one share class, overall the Fund’s total expenses were reasonable. The Trustees also noted that the Adviser has contractually agreed to limit the Fund’s expenses, although this limit did not apply because the Fund’s total expenses as shown were below the applicable fee limit.
· For Janus Henderson Venture Fund, the Trustees noted that although the Fund’s total expenses exceeded the peer group average for one share class, overall the Fund’s total expenses were reasonable. The Trustees also noted that the Adviser has contractually agreed to limit the Fund’s expenses, although this limit did not apply because the Fund’s total expenses as shown were below the applicable fee limit.
The Trustees reviewed information on the overall profitability to the Adviser and its affiliates from their relationships with the Janus Henderson Funds, and considered profitability data of other publicly traded mutual fund advisers. The Trustees recognized that profitability comparisons among fund managers are difficult because of the variation in the type of comparative information that is publicly available, and the profitability of any fund manager is affected by numerous factors, including the organizational structure of the particular fund manager, differences in complex size, difference in product mix, difference in types of business (mutual fund, institutional and other), differences in the types of funds and other accounts it manages, possible other lines of business, the methodology for allocating expenses and the fund manager’s capital structure and cost of capital.
Additionally, the Trustees considered the estimated profitability to the Adviser from the investment management services it provided to each Janus Henderson Fund. In their review, the Trustees considered whether the Adviser receive adequate incentives and resources to manage the Janus Henderson Funds effectively. In reviewing profitability, the Trustees noted that the estimated profitability for an individual Janus Henderson Fund is necessarily a product of the allocation methodology utilized by the Adviser to allocate its expenses as part of the estimated profitability calculation. In this regard, the Trustees noted that the independent fee consultant found as part of its 2022 review that (1) the expense allocation methodology and rationales utilized by the Adviser were reasonable and (2) no clear correlation exists between expense allocations and operating margins. The Trustees also considered that the estimated profitability for an individual Janus Henderson Fund was influenced by a number of factors, including not only the allocation methodology selected, but also the presence of fee waivers and expense caps, and whether the Janus Henderson Fund’s investment management agreement contained breakpoints or a performance fee component. The Trustees determined, after taking into account these factors, among others, that the Adviser’s estimated profitability with respect to each Janus Henderson Fund was not unreasonable in relation to the services provided, and that the variation in the range of such estimated profitability among the Janus Henderson Funds was not a material factor in the Board’s approval of the reasonableness of any Janus Henderson Fund’s investment management fees.
Janus Henderson Balanced Fund
Additional Information (unaudited)
The Trustees concluded that the management fees payable by each Janus Henderson Fund to the Adviser were reasonable in relation to the nature, extent, and quality of the services provided, taking into account the fees charged by other advisers for managing comparable mutual funds with similar strategies, the fees the Adviser charges to other clients, and, as applicable, the impact of fund performance on management fees payable by the Janus Henderson Funds. The Trustees also concluded that each Janus Henderson Fund’s total expenses were reasonable, taking into account the size of the Janus Henderson Fund, the quality of services provided by the Adviser, the investment performance of the Janus Henderson Fund, and any expense limitations agreed to or provided by the Adviser.
Economies of Scale
The Trustees considered information about the potential for the Adviser to realize economies of scale as the assets of the Janus Henderson Funds increase. They noted that their independent fee consultant published a report to the Trustees in June 2022 which provided its research and analysis into economies of scale. They also noted that, although many Janus Henderson Funds pay advisory fees at a fixed base rate as a percentage of net assets, without any breakpoints or performance fees, their independent fee consultant concluded that 75% of these Janus Henderson Funds’ have contractual management fees (gross of waivers) below their Broadridge Expense Group averages. The Trustees also noted the following from the independent fee consultant’s report: (1) that 31% of Janus Henderson Funds had management fee breakpoints in place whereby investors pay lower management fees as fund AUM increases; (2) that 29% of Janus Henderson Funds have low flat-rate fees and performance fees where the Adviser is incentivized to invest in resources which drive Janus Henderson Fund performance; and (3) that 39% of Janus Henderson Funds have low flat-rate fees versus peers where investors pay low fixed fees when the Janus Henderson Fund is small/midsized and higher fees when the Janus Henderson Fund grows in assets. The Trustees also noted that the Janus Henderson Funds share directly in economies of scale through the significant investments made by the Adviser and its affiliates related to services provided to the Funds and the lower charges of third-party service providers that are based in part on the combined scale of all of the Janus Henderson Funds.
The Trustees also considered the independent fee consultant’s conclusion that, given the limitations of various analytical approaches to economies of scale and their conflicting results, it is difficult to analytically confirm or deny the existence of economies of scale in the Janus Henderson complex. In this regard, the independent consultant concluded that (1) to the extent there were economies of scale at the Adviser, the Adviser’s general strategy of setting fixed management fees below peers appeared to share any such economies with investors even on smaller Janus Henderson Funds which have not yet achieved those economies and (2) by setting lower fixed fees from the start on these Janus Henderson Funds, the Adviser appeared to be investing to increase the likelihood that these Janus Henderson Funds will grow to a level to achieve any economies of scale that may exist. Further, the independent fee consultant provided its belief that Janus Henderson Fund investors are well-served by the fee levels and performance fee structures in place on the Janus Henderson Funds in light of any economies of scale that may be present at the Adviser.
Based on all of the information reviewed, including the recent and past research and analysis conducted by the Trustees’ independent fee consultant, the Trustees concluded that the current fee structure of each Janus Henderson Fund was reasonable and that the current rates of fees do reflect a sharing between the Adviser and the Janus Henderson Fund of any economies of scale that may be present at the current asset level of the Janus Henderson Fund.
Other Benefits to the Adviser
The Trustees also considered benefits that accrue to the Adviser and its affiliates from their relationships with the Janus Henderson Funds. They recognized that two affiliates of the Adviser separately serve the Janus Henderson Funds as transfer agent and distributor, respectively, and the transfer agent receives compensation directly from the non-money market Janus Henderson Funds for services provided, and that such compensation contributes to the overall profitability of the Adviser and its affiliates that results from their relationship with the Janus Henderson Funds. The Trustees also considered the Adviser’s past and proposed use of commissions paid by the Janus Henderson Funds on portfolio brokerage transactions to obtain proprietary and third-party research products and services benefiting the Janus Henderson Fund and/or other clients of the Adviser and/or the Adviser. The Trustees concluded that the Adviser’s use of these types of client commission arrangements to obtain proprietary and third-party research products and services was consistent with regulatory requirements and guidelines and was likely to benefit each Janus Henderson Fund. The Trustees also concluded that, other than the services provided by the Adviser and its affiliates pursuant to the agreements and the fees to be paid by each Janus Henderson Fund therefor, the Janus Henderson
Janus Henderson Balanced Fund
Additional Information (unaudited)
Funds and the Adviser may potentially benefit from their relationship with each other in other ways. They concluded that the Adviser and its affiliates share directly in economies of scale through the lower charges of third-party service providers that are based in part on the combined scale of the Janus Henderson Funds and other clients serviced by the Adviser and its affiliates. They also concluded that the Adviser benefits from the receipt of research products and services acquired through commissions paid on portfolio transactions of the Janus Henderson Funds and that the Janus Henderson Funds benefit from the Adviser’s receipt of those products and services as well as research products and services acquired through commissions paid by other clients of the Adviser. They further concluded that the success of any Janus Henderson Fund could attract other business to the Adviser or other Janus Henderson Funds, and that the success of the Adviser could enhance the Adviser’s ability to serve the Janus Henderson Funds.
Janus Henderson Balanced Fund
Liquidity Risk Management Program (unaudited)
Liquidity Risk Management Program
Rule 22e-4 under the Investment Company Act of 1940, as amended (the “Liquidity Rule”), requires open-end funds (but not money market funds) to adopt and implement a written liquidity risk management program (the “LRMP”) that is reasonably designed to assess and manage liquidity risk, which is the risk that a fund could not meet redemption requests without significant dilution of remaining investors’ interest in the fund. The Fund has implemented a LRMP, which incorporates the following elements: (i) assessment, management, and periodic review of liquidity risk; (ii) classification of portfolio holdings; (iii) the establishment and monitoring of a highly liquid investment minimum, as applicable; (iv) a 15% limitation on a Fund’s illiquid investments; (v) redemptions in-kind; and (vi) board oversight.
The Trustees of the Fund (the “Trustees”) have designated Janus Henderson Investors US LLC, the Fund’s investment adviser (the “Adviser”), as the Program Administrator for the LRMP responsible for administering the LRMP and carrying out the specific responsibilities of the LRMP. A working group comprised of various teams within the Adviser’s business is responsible for administering the LRMP and carrying out the specific responsibilities of different aspects of the LRMP (the “Liquidity Risk Working Group”). In assessing each Fund’s liquidity risk, the Liquidity Risk Working Group periodically considers, as relevant, factors including (i) the liquidity of a Fund’s portfolio investments during normal and reasonably foreseeable stressed conditions; (ii) whether a Fund’s investment strategy is appropriate for an open-end fund; (iii) the extent to which a Fund’s strategy involves a relatively concentrated portfolio or large positions in any issuer; (iv) a Fund’s use of borrowing for investment purposes; and (v) a Fund’s use of derivatives.
The Liquidity Rule requires the Trustees to review at least annually a written report provided by the Program Administrator that addresses the operation of the LRMP and assesses its adequacy and the effectiveness of its implementation, including, if applicable, the operation of the highly liquid investment minimum, and any material changes to the LRMP (the “Program Administrator Report”). At a meeting held on March 15, 2023, the Adviser provided the Program Administrator Report to the Trustees which covered the operation of the LRMP from January 1, 2022 through December 31, 2022 (the “Reporting Period”).
The Program Administrator Report discussed the operation and effectiveness of the LRMP during the Reporting Period. Among other things, the Program Administrator Report indicated that there were no material changes to the LRMP during the Reporting Period, although there were certain methodology adjustments implemented relating to a change in data provider. Additionally, the findings presented in the Program Administrator Report indicated that the LRMP operated adequately during the Reporting Period. These findings included that the Fund was able to meet redemptions during the normal course of business during the Reporting Period. The Program Administrator Report also stated that the Fund did not exceed the 15% limit on illiquid assets during the Reporting Period, that the Fund held primarily highly liquid assets, and was considered to be a primarily highly liquid fund during the Reporting Period. Also included among the Program Administrator Report’s findings was the determination that the Fund’s investment strategy remains appropriate for an open-end fund. In addition, the Adviser expressed its belief in the Program Administrator Report that the LRMP is reasonably designed and adequate to assess and manage the Fund’s liquidity risk, considering the Fund’s particular risks and circumstances, and includes policies and procedures reasonably designed to implement each required component of the Liquidity Rule.
There can be no assurance that the LRMP will achieve its objectives in the future. Please refer to your Fund’s prospectus for more information regarding the risks to which an investment in the Fund may be subject.
Janus Henderson Balanced Fund
Useful Information About Your Fund Report (unaudited)
Performance Overviews
Performance overview graphs compare the performance of a hypothetical $10,000 investment in the Fund with one or more widely used market indices. When comparing the performance of the Fund with an index, keep in mind that market indices are not available for investment and do not reflect deduction of expenses.
Average annual total returns are quoted for a Fund with more than one year of performance history. Average annual total return is calculated by taking the growth or decline in value of an investment over a period of time, including reinvestment of dividends and distributions, then calculating the annual compounded percentage rate that would have produced the same result had the rate of growth been constant throughout the period. Average annual total return does not reflect the deduction of taxes that a shareholder would pay on Fund distributions or redemptions of Fund shares.
Cumulative total returns are quoted for a Fund with less than one year of performance history. Cumulative total return is the growth or decline in value of an investment over time, independent of the period of time involved. Cumulative total return does not reflect the deduction of taxes that a shareholder would pay on Fund distributions or redemptions of Fund shares.
Pursuant to federal securities rules, expense ratios shown in the performance chart reflect subsidized (if applicable) and unsubsidized ratios. The total annual fund operating expenses ratio is gross of any fee waivers, reflecting the Fund’s unsubsidized expense ratio. The net annual fund operating expenses ratio (if applicable) includes contractual waivers of the Adviser and reflects the Fund’s subsidized expense ratio. Ratios may be higher or lower than those shown in the “Financial Highlights” in this report.
Schedule of Investments
Following the performance overview section is the Fund’s Schedule of Investments. This schedule reports the types of securities held in the Fund on the last day of the reporting period. Securities are usually listed by type (common stock, corporate bonds, U.S. Government obligations, etc.) and by industry classification (banking, communications, insurance, etc.). Holdings are subject to change without notice.
The value of each security is quoted as of the last day of the reporting period. The value of securities denominated in foreign currencies is converted into U.S. dollars.
If the Fund invests in foreign securities, it will also provide a summary of investments by country. This summary reports the Fund exposure to different countries by providing the percentage of securities invested in each country. The country of each security represents the country of risk. A company may be allocated to a country based on other factors such as location of the company’s principal office, the location of the principal trading market for the company’s securities, or the country where a majority of the company’s revenues are derived. The Fund’s Schedule of Investments relies upon the industry group and country classifications published by Bloomberg and/or MSCI Inc.
Tables listing details of individual forward currency contracts, futures, written options, swaptions, and swaps follow the Fund’s Schedule of Investments (if applicable).
Statement of Assets and Liabilities
This statement is often referred to as the “balance sheet.” It lists the assets and liabilities of the Fund on the last day of the reporting period.
The Fund’s assets are calculated by adding the value of the securities owned, the receivable for securities sold but not yet settled, the receivable for dividends declared but not yet received on securities owned, and the receivable for Fund shares sold to investors but not yet settled. The Fund’s liabilities include payables for securities purchased but not yet settled, Fund shares redeemed but not yet paid, and expenses owed but not yet paid. Additionally, there may be other assets and liabilities such as unrealized gain or loss on forward currency contracts.
The section entitled “Net Assets Consist of” breaks down the components of the Fund’s net assets. Because the Fund must distribute substantially all earnings, you will notice that a significant portion of net assets is shareholder capital.
The last section of this statement reports the net asset value (“NAV”) per share on the last day of the reporting period. The NAV is calculated by dividing the Fund’s net assets for each share class (assets minus liabilities) by the number of shares outstanding.
Janus Henderson Balanced Fund
Useful Information About Your Fund Report (unaudited)
Statement of Operations
This statement details the Fund’s income, expenses, realized gains and losses on securities and currency transactions, and changes in unrealized appreciation or depreciation of Fund holdings.
The first section in this statement, entitled “Investment Income,” reports the dividends earned from securities and interest earned from interest-bearing securities in the Fund.
The next section reports the expenses incurred by the Fund, including the advisory fee paid to the investment adviser, transfer agent fees and expenses, and printing and postage for mailing statements, financial reports and prospectuses. Expense offsets and expense reimbursements, if any, are also shown.
The last section lists the amounts of realized gains or losses from investment and foreign currency transactions, and changes in unrealized appreciation or depreciation of investments and foreign currency-denominated assets and liabilities. The Fund will realize a gain (or loss) when it sells its position in a particular security. A change in unrealized gain (or loss) refers to the change in net appreciation or depreciation of the Fund during the reporting period. “Net Realized and Unrealized Gain/(Loss) on Investments” is affected both by changes in the market value of Fund holdings and by gains (or losses) realized during the reporting period.
Statements of Changes in Net Assets
These statements report the increase or decrease in the Fund’s net assets during the reporting period. Changes in the Fund’s net assets are attributable to investment operations, dividends and distributions to investors, and capital share transactions. This is important to investors because it shows exactly what caused the Fund’s net asset size to change during the period.
The first section summarizes the information from the Statement of Operations regarding changes in net assets due to the Fund’s investment operations. The Fund’s net assets may also change as a result of dividend and capital gains distributions to investors. If investors receive their dividends and/or distributions in cash, money is taken out of the Fund to pay the dividend and/or distribution. If investors reinvest their dividends and/or distributions, the Fund’s net assets will not be affected.
The reinvestment of dividends and distributions is included under “Capital Share Transactions.” “Capital Shares” refers to the money investors contribute to the Fund through purchases or withdrawals via redemptions. The Fund’s net assets will increase and decrease in value as investors purchase and redeem shares from the Fund.
Financial Highlights
This schedule provides a per-share breakdown of the components that affect the Fund’s NAV for current and past reporting periods as well as total return, asset size, ratios, and portfolio turnover rate.
The first line in the table reflects the NAV per share at the beginning of the reporting period. The next line reports the net investment income/(loss) per share. Following is the per share total of net gains/(losses), realized and unrealized. Per share dividends and distributions to investors are then subtracted to arrive at the NAV per share at the end of the period. The next line reflects the total return for the period. The total return may include adjustments in accordance with generally accepted accounting principles required at the period end for financial reporting purposes. As a result, the total return may differ from the total return reflected for individual shareholder transactions. Also included are ratios of expenses and net investment income to average net assets.
The Fund’s expenses may be reduced through expense offsets and expense reimbursements. The ratios shown reflect expenses before and after any such offsets and reimbursements.
The ratio of net investment income/(loss) summarizes the income earned less expenses, divided by the average net assets of the Fund during the reporting period. Do not confuse this ratio with the Fund’s yield. The net investment income ratio is not a true measure of the Fund’s yield because it does not take into account the dividends distributed to the Fund’s investors.
The next figure is the portfolio turnover rate, which measures the buying and selling activity in the Fund. Portfolio turnover is affected by market conditions, changes in the asset size of the Fund, fluctuating volume of shareholder purchase and redemption orders, the nature of the Fund’s investments, and the investment style and/or outlook of the portfolio manager(s) and/or investment personnel. A 100% rate implies that an amount equal to the value of the entire portfolio was replaced once during the fiscal year; a 50% rate means that an amount equal to the value of half the
Janus Henderson Balanced Fund
Useful Information About Your Fund Report (unaudited)
portfolio is traded in a year; and a 200% rate means that an amount equal to the value of the entire portfolio is traded every six months.
Janus Henderson Balanced Fund
Notes
NotesPage1
| | | | | | | | |
| | | | | |

| | | | |
This report is submitted for the general information of shareholders of the Fund. It is not an offer or solicitation for the Fund and is not authorized for distribution to prospective investors unless preceded or accompanied by an effective prospectus. |
Janus Henderson is a trademark of Janus Henderson Group plc or one of its subsidiaries. © Janus Henderson Group plc. Janus Henderson Group is the ultimate parent of Janus Henderson Distributors US LLC. Janus Henderson Distributors US LLC |
| | | | 125-24-93037 05-23 |
| | | | |
| | | |
| | | SEMIANNUAL REPORT March 31, 2023 |
| | |
| | Janus Henderson Contrarian Fund |
| | |
| | Janus Investment Fund |
| |
| | | HIGHLIGHTS · Investment strategy behind your fund · Fund performance, characteristics
and holdings |
Table of Contents
Janus Henderson Contrarian Fund
| | | | | | |
| | | | | | 
Nick Schommer portfolio manager |
| | | |
Janus Henderson Contrarian Fund (unaudited)
Fund At A Glance
March 31, 2023
| | | | | | | | | | |
| | | | | | | | | |
| | | | | | | | | |
| | | | | | | | | |
| 5 Top Contributors - Holdings | 5 Top Detractors - Holdings |
| | Average
Weight | | Relative
Contribution | | | Average
Weight | | Relative
Contribution |
| Caesars Entertainment Inc | 5.84% | | 1.53% | | Cullen/Frost Bankers Inc | 2.83% | | -1.18% |
| Horizon Therapeutics PLC | 3.00% | | 1.47% | | Sweetgreen Inc - Class A | 0.87% | | -1.06% |
| Freeport-McMoRan Inc | 3.76% | | 1.21% | | Crown Holdings Inc | 5.92% | | -0.70% |
| Advanced Micro Devices Inc | 3.11% | | 1.12% | | Occidental Petroleum Corp | 3.80% | | -0.51% |
| Howmet Aerospace Inc | 5.40% | | 1.06% | | Hasbro Inc | 0.60% | | -0.49% |
| | | | | | | |
| 5 Top Contributors - Sectors* | | | | | |
| | | Relative | | Fund | S&P 500 Index |
| | | Contribution | | Average Weight | Average Weight |
| Health Care | | 3.54% | | 17.89% | 15.03% |
| Consumer Discretionary | | 1.69% | | 16.08% | 10.46% |
| Materials | | 1.22% | | 12.18% | 2.69% |
| Industrials | | 0.54% | | 10.13% | 8.44% |
| Financials | | 0.20% | | 10.02% | 11.62% |
| | | | | | |
| | | | | | |
| 5 Top Detractors - Sectors* | | | | | |
| | | Relative | | Fund | S&P 500 Index |
| | | Contribution | | Average Weight | Average Weight |
| Information Technology | | -0.91% | | 14.00% | 26.45% |
| Energy | | -0.58% | | 3.80% | 5.05% |
| Other** | | -0.36% | | 1.54% | 0.00% |
| Communication Services | | -0.19% | | 4.36% | 7.66% |
| Utilities | | -0.14% | | 4.19% | 2.99% |
| | | | | | | |
| Relative contribution reflects how the portolio's holdings impacted return relative to the benchmark. Cash and securities not held in the portfolio are not shown. For equity portfolios, relative contribution compares the performance of a security in the portfolio to the benchmark's total return, factoring in the difference in weight of that security in the benchmark. Returns are calculated using daily returns and previous day ending weights rolled up by ticker, excluding fixed income securities, gross of advisory fees, may exclude certain derivatives and will differ from actual performance.
Performance attribution reflects returns gross of advisory fees and may differ from actual returns as they are based on end of day holdings. Attribution is calculated by geometrically linking daily returns for the portfolio and index. |
* | Based on sector classification according to the Global Industry Classification Standard (“GICS”) codes, which are the exclusive property and a service mark of MSCI Inc. and Standard & Poor’s. |
** | Not a GICS classified sector. |
Janus Henderson Contrarian Fund (unaudited)
Fund At A Glance
March 31, 2023
| | |
5 Largest Equity Holdings - (% of Net Assets) |
Caesars Entertainment Inc | |
Hotels, Restaurants & Leisure | 5.9% |
Howmet Aerospace Inc | |
Aerospace & Defense | 5.4% |
Crown Holdings Inc | |
Containers & Packaging | 5.4% |
Occidental Petroleum Corp | |
Oil, Gas & Consumable Fuels | 4.2% |
Advanced Micro Devices Inc | |
Semiconductor & Semiconductor Equipment | 4.1% |
| | 25.0% |
| | | | | | |
Asset Allocation - (% of Net Assets) | |
Common Stocks | | 95.8% | |
Investment Companies | | 2.6% | |
Corporate Bonds | | 1.5% | |
Other | | 0.1% |
| | | 100.0% |
| | |
Top Country Allocations - Long Positions - (% of Investment Securities) |
As of March 31, 2023 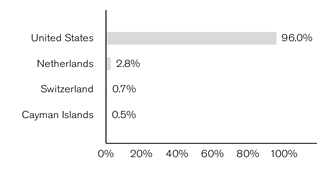
| As of September 30, 2022 
|
Janus Henderson Contrarian Fund (unaudited)
Performance
| |
See important disclosures on the next page. |
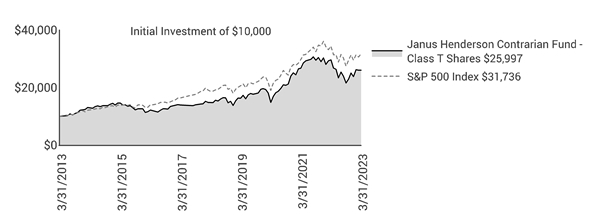
| | | | | | | | | | | | |
| | | | | | | | | | |
| | | | | | | | | | |
Average Annual Total Return - for the periods ended March 31, 2023 | | | Prospectus Expense Ratios |
| | Fiscal
Year-to-Date | One
Year | Five
Year | Ten
Year | Since
Inception* | | | Total Annual Fund
Operating Expenses‡ | Net Annual Fund
Operating Expenses‡ |
Class A Shares at NAV | | 20.11% | -12.38% | 11.77% | 9.89% | 7.71% | | | 1.08% | 1.08% |
Class A Shares at MOP | | 13.22% | -17.43% | 10.45% | 9.24% | 7.44% | | | | |
Class C Shares at NAV | | 19.76% | -13.00% | 11.01% | 9.11% | 6.92% | | | 1.83% | 1.83% |
Class C Shares at CDSC | | 18.76% | -13.87% | 11.01% | 9.11% | 6.92% | | | | |
Class D Shares | | 20.25% | -12.15% | 12.02% | 10.12% | 7.91% | | | 0.86% | 0.86% |
Class I Shares | | 20.28% | -12.13% | 12.07% | 10.20% | 7.95% | | | 0.83% | 0.83% |
Class N Shares | | 20.36% | -12.02% | 12.18% | 10.17% | 7.92% | | | 0.73% | 0.73% |
Class R Shares | | 19.84% | -12.76% | 11.17% | 9.39% | 7.23% | | | 1.63% | 1.57% |
Class S Shares | | 20.04% | -12.55% | 11.50% | 9.68% | 7.51% | | | 1.41% | 1.31% |
Class T Shares | | 20.19% | -12.27% | 11.92% | 10.03% | 7.85% | | | 0.98% | 0.98% |
S&P 500 Index | | 15.62% | -7.73% | 11.19% | 12.24% | 6.90% | | | | |
Morningstar Quartile - Class T Shares | | - | 4th | 1st | 1st | 3rd | | | | |
Morningstar Ranking - based on total returns for Mid-Cap Blend Funds | | - | 363/415 | 5/363 | 50/284 | 78/158 | | | | |
Returns quoted are past performance and do not guarantee future results; current performance may be lower or higher. Investment returns and principal value will vary; there may be a gain or loss when shares are sold. For the most recent month-end performance call 800.668.0434 (or 800.525.3713 if you hold shares directly with Janus Henderson) or visit janushenderson.com/performance (or janushenderson.com/allfunds if you hold shares directly with Janus Henderson).
Maximum Offering Price (MOP) returns include the maximum sales charge of 5.75%. Net Asset Value (NAV) returns exclude this charge, which would have reduced returns.
CDSC returns include a 1% contingent deferred sales charge (CDSC) on Shares redeemed within 12 months of purchase. Net Asset Value (NAV) returns exclude this charge, which would have reduced returns.
Net expense ratios reflect the expense waiver, if any, contractually agreed to for at least a one-year period commencing on January 27, 2023. This contractual waiver may be terminated or modified only at the discretion of the Board of Trustees.
Janus Henderson Contrarian Fund (unaudited)
Performance
This Fund has a performance-based management fee that may adjust up or down based on the Fund’s performance.
Performance may be affected by risks that include those associated with foreign and emerging markets, fixed income securities, high-yield and high-risk securities, undervalued, overlooked and smaller capitalization companies, real estate related securities including Real Estate Investment Trusts (REITs), Environmental, Social and Governance (ESG) factors, non-diversification, portfolio turnover, derivatives, short sales, initial public offerings (IPOs) and potential conflicts of interest. Each product has different risks. Please see the prospectus for more information about risks, holdings and other details.
Returns include reinvestment of all dividends and distributions and do not reflect the deduction of taxes that a shareholder would pay on Fund distributions or redemptions of Fund shares. The returns do not include adjustments in accordance with generally accepted accounting principles required at the period end for financial reporting purposes.
Class A Shares, Class C Shares, Class R Shares, and Class S Shares commenced operations on July 6, 2009. Performance shown for each class for periods prior to July 6, 2009, reflects the performance of the Fund’s Class J Shares, the initial share class (renamed Class T Shares effective February 16, 2010), calculated using the fees and expenses of each respective class, without the effect of any fee and expense limitations or waivers.
Class D Shares commenced operations on February 16, 2010. Performance shown for periods prior to February 16, 2010, reflects the performance of the Fund’s former Class J Shares, calculated using the fees and expenses in effect during the periods shown, net of any applicable fee and expense limitations or waivers.
Class I Shares commenced operations on July 6, 2009. Performance shown for periods prior to July 6, 2009, reflects the performance of the Fund’s former Class J Shares, calculated using the fees and expenses of Class J Shares, net of any applicable fee and expense limitations or waivers.
Class N Shares commenced operations on August 4, 2017. Performance shown for periods prior to August 4, 2017, reflects the performance of the Fund’s Class T Shares, calculated using the fees and expenses of Class T Shares, net of any applicable fee and expense limitations or waivers.
If each share class of the Fund had been available during periods prior to its commencement, the performance shown may have been different. The performance shown for periods following the Fund’s commencement of each share class reflects the fees and expenses of each respective share class, net of any applicable fee and expense limitations or waivers. Please refer to the Fund’s prospectuses for further details concerning historical performance.
Ranking is for the share class shown only; other classes may have different performance characteristics. When an expense waiver is in effect, it may have a material effect on the total return, and therefore the ranking for the period.
© 2023 Morningstar, Inc. All Rights Reserved.
There is no assurance that the investment process will consistently lead to successful investing.
See Notes to Schedule of Investments and Other Information for index definitions.
Index performance does not reflect the expenses of managing a portfolio as an index is unmanaged and not available for direct investment.
See “Useful Information About Your Fund Report.”
*The Fund’s inception date – February 29, 2000
‡ As stated in the prospectus. See Financial Highlights for actual expense ratios during the reporting period.
Janus Henderson Contrarian Fund (unaudited)
Expense Examples
As a shareholder of the Fund, you incur two types of costs: (1) transaction costs, such as sales charges (loads) on purchase payments (applicable to Class A Shares only); and (2) ongoing costs, including management fees; 12b-1 distribution and shareholder servicing fees; transfer agent fees and expenses payable pursuant to the Transfer Agency Agreement; and other Fund expenses. This example is intended to help you understand your ongoing costs (in dollars) of investing in the Fund and to compare these costs with the ongoing costs of investing in other mutual funds. To do so, compare this 5% hypothetical example with the 5% hypothetical examples that appear in the shareholder reports of the other funds. The example is based upon an investment of $1,000 invested at the beginning of the period and held for the six-months indicated, unless noted otherwise in the table and footnotes below.
Actual Expenses
The information in the table under the heading “Actual” provides information about actual account values and actual expenses. You may use the information in these columns, together with the amount you invested, to estimate the expenses that you paid over the period. Simply divide your account value by $1,000 (for example, an $8,600 account value divided by $1,000 = 8.6), then multiply the result by the number in the appropriate column for your share class under the heading entitled “Expenses Paid During Period” to estimate the expenses you paid on your account during the period.
Hypothetical Example for Comparison Purposes
The information in the table under the heading “Hypothetical (5% return before expenses)” provides information about hypothetical account values and hypothetical expenses based upon the Fund’s actual expense ratio and an assumed rate of return of 5% per year before expenses, which is not the Fund’s actual return. The hypothetical account values and expenses may not be used to estimate the actual ending account balance or expenses you paid for the period. You may use this information to compare the ongoing costs of investing in the Fund and other funds. To do so, compare this 5% hypothetical example with the 5% hypothetical examples that appear in the shareholder reports of the other funds. Additionally, for an analysis of the fees associated with an investment in any share class or other similar funds, please visit www.finra.org/fundanalyzer.
Please note that the expenses shown in the table are meant to highlight your ongoing costs only and do not reflect any transaction costs. These fees are fully described in the Fund’s prospectuses. Therefore, the hypothetical examples are useful in comparing ongoing costs only, and will not help you determine the relative total costs of owning different funds. In addition, if these transaction costs were included, your costs would have been higher.
| | | | | | | | | | | |
| | | | | | | | |
| | | Actual | | Hypothetical
(5% return before expenses) | |
| Beginning
Account
Value
(10/1/22) | Ending
Account
Value
(3/31/23) | Expenses
Paid During
Period
(10/1/22 - 3/31/23)† | | Beginning
Account
Value
(10/1/22) | Ending
Account
Value
(3/31/23) | Expenses
Paid During
Period
(10/1/22 - 3/31/23)† | Net Annualized
Expense Ratio
(10/1/22 - 3/31/23) |
Class A Shares | $1,000.00 | $1,201.10 | $5.32 | | $1,000.00 | $1,020.09 | $4.89 | 0.97% |
Class C Shares | $1,000.00 | $1,197.60 | $8.99 | | $1,000.00 | $1,016.75 | $8.25 | 1.64% |
Class D Shares | $1,000.00 | $1,202.50 | $4.06 | | $1,000.00 | $1,021.24 | $3.73 | 0.74% |
Class I Shares | $1,000.00 | $1,202.80 | $3.90 | | $1,000.00 | $1,021.39 | $3.58 | 0.71% |
Class N Shares | $1,000.00 | $1,203.60 | $3.30 | | $1,000.00 | $1,021.94 | $3.02 | 0.60% |
Class R Shares | $1,000.00 | $1,198.40 | $7.89 | | $1,000.00 | $1,017.75 | $7.24 | 1.44% |
Class S Shares | $1,000.00 | $1,200.40 | $6.53 | | $1,000.00 | $1,019.00 | $5.99 | 1.19% |
Class T Shares | $1,000.00 | $1,201.90 | $4.56 | | $1,000.00 | $1,020.79 | $4.18 | 0.83% |
† | Expenses Paid During Period are equal to the Net Annualized Expense Ratio multiplied by the average account value over the period, multiplied by 182/365 (to reflect the one-half year period). Expenses in the examples include the effect of applicable fee waivers and/or expense reimbursements, if any. Had such waivers and/or reimbursements not been in effect, your expenses would have been higher. Please refer to the Notes to Financial Statements or the Fund’s prospectuses for more information regarding waivers and/or reimbursements. |
Janus Henderson Contrarian Fund
Schedule of Investments (unaudited)
March 31, 2023
| | | | | | | | |
Shares or
Principal Amounts | | | Value | |
Corporate Bonds– 1.5% | | | |
Consumer Cyclical – 1.5% | | | |
| | Colt Merger Sub Inc, 5.7500%, 7/1/25 (144A)((cost $64,408,986) | | $65,270,000 | | | $65,283,955 | |
Common Stocks– 95.8% | | | |
Aerospace & Defense – 5.4% | | | |
| | Howmet Aerospace Inc | | 5,621,106 | | | 238,166,261 | |
Banks – 2.5% | | | |
| | Cullen/Frost Bankers Inc | | 1,050,266 | | | 110,635,020 | |
Biotechnology – 10.9% | | | |
| | AbbVie Inc | | 880,534 | | | 140,330,704 | |
| | Amicus Therapeutics Inc* | | 6,711,624 | | | 74,431,910 | |
| | Apellis Pharmaceuticals Inc* | | 968,013 | | | 63,850,137 | |
| | Horizon Therapeutics PLC* | | 1,179,109 | | | 128,687,956 | |
| | Madrigal Pharmaceuticals Inc* | | 210,509 | | | 50,997,910 | |
| | Vaxcyte Inc* | | 552,875 | | | 20,721,755 | |
| | | 479,020,372 | |
Capital Markets – 0.5% | | | |
| | Patria Investments Ltd - Class A | | 1,372,637 | | | 20,315,028 | |
Consumer Finance – 3.4% | | | |
| | Capital One Financial Corp | | 864,187 | | | 83,100,222 | |
| | OneMain Holdings Inc | | 1,835,999 | | | 68,078,843 | |
| | | 151,179,065 | |
Containers & Packaging – 5.4% | | | |
| | Crown Holdings Inc | | 2,850,474 | | | 235,762,705 | |
Diversified Financial Services – 0.7% | | | |
| | Apollo Global Management Inc | | 517,257 | | | 32,669,952 | |
Electric Utilities – 1.7% | | | |
| | American Electric Power Co Inc | | 818,048 | | | 74,434,188 | |
Entertainment – 1.0% | | | |
| | Liberty Media Corp-Liberty Formula One* | | 577,145 | | | 43,187,760 | |
Health Care Equipment & Supplies – 5.7% | | | |
| | Boston Scientific Corp* | | 1,085,420 | | | 54,303,563 | |
| | Globus Medical Inc* | | 1,952,013 | | | 110,562,016 | |
| | Teleflex Inc | | 346,319 | | | 87,726,066 | |
| | | 252,591,645 | |
Hotels, Restaurants & Leisure – 8.6% | | | |
| | Caesars Entertainment Inc* | | 5,272,456 | | | 257,350,513 | |
| | Monarch Casino & Resort Inc | | 124,901 | | | 9,261,409 | |
| | Sportradar Group AG - Class A* | | 2,726,991 | | | 31,714,905 | |
| | Sweetgreen Inc - Class A* | | 3,282,810 | | | 25,737,230 | |
| | Wynn Resorts Ltd* | | 499,336 | | | 55,880,692 | |
| | | 379,944,749 | |
Life Sciences Tools & Services – 1.0% | | | |
| | Sotera Health Co* | | 2,559,492 | | | 45,840,502 | |
Machinery – 0.6% | | | |
| | Chart Industries Inc* | | 211,052 | | | 26,465,921 | |
Metals & Mining – 6.1% | | | |
| | Constellium SE*,£ | | 8,143,411 | | | 124,431,320 | |
| | Freeport-McMoRan Inc | | 3,477,703 | | | 142,272,830 | |
| | | 266,704,150 | |
Multiline Retail – 3.1% | | | |
| | Amazon.com Inc* | | 1,332,123 | | | 137,594,985 | |
Multi-Utilities – 3.0% | | | |
| | Sempra Energy | | 869,824 | | | 131,482,596 | |
Oil, Gas & Consumable Fuels – 4.2% | | | |
| | Occidental Petroleum Corp | | 2,975,339 | | | 185,750,414 | |
Personal Products – 3.0% | | | |
| | Beauty Health Co/The*,£ | | 10,392,563 | | | 131,258,071 | |
Pharmaceuticals – 2.3% | | | |
| | Catalent Inc* | | 1,540,044 | | | 101,196,291 | |
| | |
See Notes to Schedule of Investments and Other Information and Notes to Financial Statements. |
| |
6 | MARCH 31, 2023 |
Janus Henderson Contrarian Fund
Schedule of Investments (unaudited)
March 31, 2023
| | | | | | | | |
Shares or
Principal Amounts | | | Value | |
Common Stocks– (continued) | | | |
Semiconductor & Semiconductor Equipment – 11.0% | | | |
| | Advanced Micro Devices Inc* | | 1,818,086 | | | $178,190,609 | |
| | Analog Devices Inc | | 459,115 | | | 90,546,660 | |
| | Lam Research Corp | | 144,038 | | | 76,357,425 | |
| | Marvell Technology Inc | | 3,175,952 | | | 137,518,722 | |
| | | 482,613,416 | |
Software – 4.6% | | | |
| | Ceridian HCM Holding Inc* | | 881,478 | | | 64,541,819 | |
| | Workday Inc - Class A* | | 672,456 | | | 138,889,062 | |
| | | 203,430,881 | |
Specialized Real Estate Investment Trusts (REITs) – 2.8% | | | |
| | VICI Properties Inc | | 3,791,871 | | | 123,690,832 | |
Textiles, Apparel & Luxury Goods – 1.9% | | | |
| | Deckers Outdoor Corp* | | 184,734 | | | 83,047,170 | |
Trading Companies & Distributors – 4.2% | | | |
| | Core & Main Inc - Class A* | | 4,174,342 | | | 96,427,300 | |
| | Ferguson PLC | | 644,966 | | | 86,264,203 | |
| | | 182,691,503 | |
Wireless Telecommunication Services – 2.2% | | | |
| | T-Mobile US Inc* | | 662,430 | | | 95,946,361 | |
Total Common Stocks (cost $3,542,394,458) | | 4,215,619,838 | |
Investment Companies– 2.6% | | | |
Money Markets – 2.6% | | | |
| | Janus Henderson Cash Liquidity Fund LLC, 4.7988%ºº,£((cost $113,468,959) | | 113,448,791 | | | 113,471,481 | |
Total Investments (total cost $3,720,272,403) – 99.9% | | 4,394,375,274 | |
Cash, Receivables and Other Assets, net of Liabilities – 0.1% | | 2,669,684 | |
Net Assets – 100% | | $4,397,044,958 | |
| | | | | | |
Summary of Investments by Country - (Long Positions) (unaudited) |
| |
| | | | | % of | |
| | | | | Investment | |
Country | | Value | | Securities | |
United States | | $4,217,914,021 | | 96.0 | % |
Netherlands | | 124,431,320 | | 2.8 | |
Switzerland | | 31,714,905 | | 0.7 | |
Cayman Islands | | 20,315,028 | | 0.5 | |
| | | | | | |
| | | | | | |
Total | | $4,394,375,274 | | 100.0 | % |
| | |
See Notes to Schedule of Investments and Other Information and Notes to Financial Statements. |
| |
Janus Investment Fund | 7 |
Janus Henderson Contrarian Fund
Schedule of Investments (unaudited)
March 31, 2023
Schedules of Affiliated Investments – (% of Net Assets)
| | | | | | | | | | | |
| | Dividend Income(1) | Realized Gain/(Loss)(1) | Change in Unrealized Appreciation/ Depreciation(1) | Value at 3/31/23 |
Common Stocks - 5.8% |
Metals & Mining - 2.8% | |
| | Constellium SE* | $ | - | $ | - | $ | 40,578,558 | $ | 124,431,320 |
Personal Products - 3.0% | |
| | Beauty Health Co/The* | | - | | (11,597,122) | | 22,960,310 | | 131,258,071 |
Total Common Stocks | $ | - | $ | (11,597,122) | $ | 63,538,868 | $ | 255,689,391 |
Investment Companies - 2.6% |
Money Markets - 2.6% | |
| | Janus Henderson Cash Liquidity Fund LLC, 4.7988%ºº | | 1,332,731 | | 6,047 | | (2,167) | | 113,471,481 |
Investments Purchased with Cash Collateral from Securities Lending - N/A |
Investment Companies - N/A | |
| | Janus Henderson Cash Collateral Fund LLC, 4.8170%ºº | | 51,046∆ | | - | | - | | - |
Total Affiliated Investments - 8.4% | $ | 1,383,777 | $ | (11,591,075) | $ | 63,536,701 | $ | 369,160,872 |
(1) For securities that were affiliated for a portion of the period ended March 31, 2023, this column reflects amounts for the entire period ended March 31, 2023 and not just the period in which the security was affiliated.
| | | | | | | | | | | |
| | Value at 9/30/22 | Purchases | Sales Proceeds | Value at 3/31/23 |
Common Stocks - 5.8% |
Metals & Mining - 2.8% | |
| | Constellium SE* | | 77,042,311 | | 6,810,451 | | - | | 124,431,320 |
Personal Products - 3.0% | |
| | Beauty Health Co/The* | | 124,219,782 | | 14,552,795 | | (18,877,694) | | 131,258,071 |
Investment Companies - 2.6% |
Money Markets - 2.6% | |
| | Janus Henderson Cash Liquidity Fund LLC, 4.7988%ºº | | 108,427,823 | | 551,810,148 | | (546,770,370) | | 113,471,481 |
Investments Purchased with Cash Collateral from Securities Lending - N/A |
Investment Companies - N/A | |
| | Janus Henderson Cash Collateral Fund LLC, 4.8170%ºº | | 68,142,291 | | 109,882,505 | | (178,024,796) | | - |
| | |
See Notes to Schedule of Investments and Other Information and Notes to Financial Statements. |
| |
8 | MARCH 31, 2023 |
Janus Henderson Contrarian Fund
Schedule of Investments (unaudited)
March 31, 2023
The following tables provide information about the effect of derivatives and hedging activities on the Fund’s Statement of Operations for the period ended March 31, 2023.
| | | | | |
The effect of Derivative Instruments (not accounted for as hedging instruments) on the Statement of Operations for the period ended March 31, 2023 |
| | | | |
Amount of Realized Gain/(Loss) Recognized on Derivatives |
Derivative | | Equity
Contracts |
Written options contracts | | $2,301,726 |
| | | | | |
| | | | | |
| | | | | |
Amount of Change in Unrealized Appreciation/Depreciation Recognized on Derivatives |
Derivative | | Equity
Contracts |
Written options contracts | | $ (553,455) |
| | | | | |
Please see the "Net Realized Gain/(Loss) on Investments" and "Change in Unrealized Net Appreciation/Depreciation" sections of the Fund’s Statement of Operations.
| | |
Average Ending Monthly Value of Derivative Instruments During the Period Ended March 31, 2023 |
| |
| |
Options: | |
Average value of option contracts written | $(557,030) |
| | |
| |
| |
| |
| | |
See Notes to Schedule of Investments and Other Information and Notes to Financial Statements. |
| |
Janus Investment Fund | 9 |
Janus Henderson Contrarian Fund
Notes to Schedule of Investments and Other Information (unaudited)
| | |
S&P 500® Index | S&P 500® Index reflects U.S. large-cap equity performance and represents broad U.S. equity market performance. |
| | |
LLC | Limited Liability Company |
PLC | Public Limited Company |
| | |
144A | Securities sold under Rule 144A of the Securities Act of 1933, as amended, are subject to legal and/or contractual restrictions on resale and may not be publicly sold without registration under the 1933 Act. Unless otherwise noted, these securities have been determined to be liquid under guidelines established by the Board of Trustees. The total value of 144A securities as of the period ended March 31, 2023 is $65,283,955, which represents 1.5% of net assets. |
| | |
* | Non-income producing security. |
| | |
ºº | Rate shown is the 7-day yield as of March 31, 2023. |
| | |
£ | The Fund may invest in certain securities that are considered affiliated companies. As defined by the Investment Company Act of 1940, as amended, an affiliated company is one in which the Fund owns 5% or more of the outstanding voting securities, or a company which is under common ownership or control. |
| | |
∆ | Net of income paid to the securities lending agent and rebates paid to the borrowing counterparties. |
| | | | | | | | | | | | | |
The following is a summary of the inputs that were used to value the Fund’s investments in securities and other financial instruments as of March 31, 2023. See Notes to Financial Statements for more information. |
| |
Valuation Inputs Summary |
| | | | | | | |
| | | | | Level 2 - | | Level 3 - |
| | | Level 1 - | | Other Significant | | Significant |
| | | Quoted Prices | | Observable Inputs | | Unobservable Inputs |
| | | | | | | |
Assets | | | | | | |
Investments In Securities: | | | | | | |
Corporate Bonds | $ | - | $ | 65,283,955 | $ | - |
Common Stocks | | 4,215,619,838 | | - | | - |
Investment Companies | | - | | 113,471,481 | | - |
Total Assets | $ | 4,215,619,838 | $ | 178,755,436 | $ | - |
| | | | | | | |
Janus Henderson Contrarian Fund
Statement of Assets and Liabilities (unaudited)
March 31, 2023
| | | | | | | |
| | | | | | |
Assets: | | | | |
| Unaffiliated investments, at value (cost $3,393,577,381) | | $ | 4,025,214,402 | |
| Affiliated investments, at value (cost $326,695,022) | | | 369,160,872 | |
| Trustees' deferred compensation | | | 108,784 | |
| Receivables: | | | | |
| | Investments sold | | | 28,485,876 | |
| | Dividends | | | 3,778,424 | |
| | Fund shares sold | | | 3,027,281 | |
| | Interest | | | 959,106 | |
| | Dividends from affiliates | | | 249,926 | |
| Other assets | | | 33,301 | |
Total Assets | | | 4,431,017,972 | |
Liabilities: | | | | |
| Payables: | | | — | |
| | Investments purchased | | | 27,022,389 | |
| | Fund shares repurchased | | | 3,147,783 | |
| | Advisory fees | | | 2,592,903 | |
| | Transfer agent fees and expenses | | | 659,479 | |
| | Trustees' deferred compensation fees | | | 108,784 | |
| | Professional fees | | | 38,689 | |
| | 12b-1 Distribution and shareholder servicing fees | | | 34,541 | |
| | Trustees' fees and expenses | | | 28,168 | |
| | Affiliated fund administration fees payable | | | 9,696 | |
| | Custodian fees | | | 5,558 | |
| | Accrued expenses and other payables | | | 325,024 | |
Total Liabilities | | | 33,973,014 | |
Net Assets | | $ | 4,397,044,958 | |
| | |
See Notes to Financial Statements. |
| |
Janus Investment Fund | 11 |
Janus Henderson Contrarian Fund
Statement of Assets and Liabilities (unaudited)
March 31, 2023
| | | | | | | |
| | | | | | |
| | | | | | | |
Net Assets Consist of: | | | | |
| Capital (par value and paid-in surplus) | | $ | 3,613,881,548 | |
| Total distributable earnings (loss) | | | 783,163,410 | |
Total Net Assets | | $ | 4,397,044,958 | |
Net Assets - Class A Shares | | $ | 61,187,778 | |
| Shares Outstanding, $0.01 Par Value (unlimited shares authorized) | | | 2,447,163 | |
Net Asset Value Per Share(1) | | $ | 25.00 | |
Maximum Offering Price Per Share(2) | | $ | 26.53 | |
Net Assets - Class C Shares | | $ | 22,357,937 | |
| Shares Outstanding, $0.01 Par Value (unlimited shares authorized) | | | 997,267 | |
Net Asset Value Per Share(1) | | $ | 22.42 | |
Net Assets - Class D Shares | | $ | 2,492,249,074 | |
| Shares Outstanding, $0.01 Par Value (unlimited shares authorized) | | | 99,177,348 | |
Net Asset Value Per Share | | $ | 25.13 | |
Net Assets - Class I Shares | | $ | 743,517,881 | |
| Shares Outstanding, $0.01 Par Value (unlimited shares authorized) | | | 29,590,201 | |
Net Asset Value Per Share | | $ | 25.13 | |
Net Assets - Class N Shares | | $ | 89,040,449 | |
| Shares Outstanding, $0.01 Par Value (unlimited shares authorized) | | | 3,550,806 | |
Net Asset Value Per Share | | $ | 25.08 | |
Net Assets - Class R Shares | | $ | 1,658,518 | |
| Shares Outstanding, $0.01 Par Value (unlimited shares authorized) | | | 69,521 | |
Net Asset Value Per Share | | $ | 23.86 | |
Net Assets - Class S Shares | | $ | 1,869,443 | |
| Shares Outstanding, $0.01 Par Value (unlimited shares authorized) | | | 74,999 | |
Net Asset Value Per Share | | $ | 24.93 | |
Net Assets - Class T Shares | | $ | 985,163,878 | |
| Shares Outstanding, $0.01 Par Value (unlimited shares authorized) | | | 39,245,973 | |
Net Asset Value Per Share | | $ | 25.10 | |
| |
(1) Redemption price per share may be reduced for any applicable contingent deferred sales charge. (2) Maximum offering price is computed at 100/94.25 of net asset value. |
| | |
See Notes to Financial Statements. |
| |
12 | MARCH 31, 2023 |
Janus Henderson Contrarian Fund
Statement of Operations (unaudited)
For the period ended March 31, 2023
| | | | | | |
| | | | | |
Investment Income: | | | |
| Dividends | $ | 30,662,106 | |
| Interest | | 1,741,206 | |
| Dividends from affiliates | | 1,332,731 | |
| Affiliated securities lending income, net | | 51,046 | |
| Unaffiliated securities lending income, net | | 13,569 | |
| Other income | | 11 | |
Total Investment Income | | 33,800,669 | |
Expenses: | | | |
| Advisory fees | | 12,105,500 | |
| 12b-1 Distribution and shareholder servicing fees: | | | |
| | Class A Shares | | 72,852 | |
| | Class C Shares | | 104,041 | |
| | Class R Shares | | 4,253 | |
| | Class S Shares | | 2,111 | |
| Transfer agent administrative fees and expenses: | | | |
| | Class D Shares | | 1,399,421 | |
| | Class R Shares | | 2,131 | |
| | Class S Shares | | 2,092 | |
| | Class T Shares | | 1,185,790 | |
| Transfer agent networking and omnibus fees: | | | |
| | Class A Shares | | 32,432 | |
| | Class C Shares | | 11,596 | |
| | Class I Shares | | 435,763 | |
| Other transfer agent fees and expenses: | | | |
| | Class A Shares | | 2,161 | |
| | Class C Shares | | 625 | |
| | Class D Shares | | 171,289 | |
| | Class I Shares | | 22,886 | |
| | Class N Shares | | 2,178 | |
| | Class R Shares | | 72 | |
| | Class S Shares | | 28 | |
| | Class T Shares | | 5,222 | |
| Shareholder reports expense | | 182,427 | |
| Registration fees | | 163,816 | |
| Trustees’ fees and expenses | | 62,314 | |
| Affiliated fund administration fees | | 53,042 | |
| Professional fees | | 44,264 | |
| Custodian fees | | 10,638 | |
| Other expenses | | 155,138 | |
Total Expenses | | 16,234,082 | |
Less: Excess Expense Reimbursement and Waivers | | (70,164) | |
Net Expenses | | 16,163,918 | |
Net Investment Income/(Loss) | | 17,636,751 | |
| | | | | |
| | |
See Notes to Financial Statements. |
| |
Janus Investment Fund | 13 |
Janus Henderson Contrarian Fund
Statement of Operations (unaudited)
For the period ended March 31, 2023
| | | | | | |
| | | | | |
Net Realized Gain/(Loss) on Investments: | | | |
| Investments | $ | 136,017,301 | |
| Investments in affiliates | | (11,591,075) | |
| Written options contracts | | 2,301,726 | |
Total Net Realized Gain/(Loss) on Investments | | 126,727,952 | |
Change in Unrealized Net Appreciation/Depreciation: | | | |
| Investments, foreign currency translations and Trustees’ deferred compensation | | 562,786,381 | |
| Investments in affiliates | | 63,536,701 | |
| Written options contracts | | (553,455) | |
Total Change in Unrealized Net Appreciation/Depreciation | | 625,769,627 | |
Net Increase/(Decrease) in Net Assets Resulting from Operations | $ | 770,134,330 | |
| | | | | |
| | |
See Notes to Financial Statements. |
| |
14 | MARCH 31, 2023 |
Janus Henderson Contrarian Fund
Statements of Changes in Net Assets
| | | | | | | | | |
| | | | | | | | |
| | | Period ended
March 31, 2023 (unaudited) | | Year ended
September 30, 2022 | |
| | | | | | | | | |
Operations: | | | | | | |
| Net investment income/(loss) | $ | 17,636,751 | | $ | 15,127,601 | |
| Net realized gain/(loss) on investments | | 126,727,952 | | | 26,823,065 | |
| Change in unrealized net appreciation/depreciation | | 625,769,627 | | | (1,475,668,831) | |
Net Increase/(Decrease) in Net Assets Resulting from Operations | | 770,134,330 | | | (1,433,718,165) | |
Dividends and Distributions to Shareholders: | | | | | | |
| | Class A Shares | | (147,675) | | | (6,096,729) | |
| | Class C Shares | | — | | | (2,439,370) | |
| | Class D Shares | | (12,243,408) | | | (269,945,160) | |
| | Class I Shares | | (4,035,161) | | | (67,446,782) | |
| | Class N Shares | | (561,120) | | | (9,363,778) | |
| | Class R Shares | | — | | | (166,324) | |
| | Class S Shares | | (2,546) | | | (163,299) | |
| | Class T Shares | | (3,822,339) | | | (112,642,510) | |
Net Decrease from Dividends and Distributions to Shareholders | | (20,812,249) | | | (468,263,952) | |
Capital Share Transactions: | | | | | | |
| | Class A Shares | | (3,866,298) | | | 17,894,480 | |
| | Class C Shares | | (3,466,872) | | | 11,141,869 | |
| | Class D Shares | | (44,960,761) | | | 151,564,946 | |
| | Class I Shares | | (147,490,676) | | | 410,367,339 | |
| | Class N Shares | | (10,399,087) | | | 44,703,842 | |
| | Class R Shares | | (273,024) | | | 974,674 | |
| | Class S Shares | | 190,446 | | | 1,330,650 | |
| | Class T Shares | | (48,444,944) | | | 44,527,280 | |
Net Increase/(Decrease) from Capital Share Transactions | | (258,711,216) | | | 682,505,080 | |
Net Increase/(Decrease) in Net Assets | | 490,610,865 | | | (1,219,477,037) | |
Net Assets: | | | | | | |
| Beginning of period | | 3,906,434,093 | | | 5,125,911,130 | |
| End of period | $ | 4,397,044,958 | | $ | 3,906,434,093 | |
| | | | | | | | |
| | |
See Notes to Financial Statements. |
| |
Janus Investment Fund | 15 |
Janus Henderson Contrarian Fund
Financial Highlights
| | | | | | | | | | | | | | | | | | | | | | |
Class A Shares | | | | | | | | | | | | | | | | | | |
For a share outstanding during the period ended March 31, 2023 (unaudited) and the year ended September 30 | 2023 | | | 2022 | | | 2021 | | | 2020 | | | 2019 | | | 2018 | |
| Net Asset Value, Beginning of Period | | $20.87 | | | $31.37 | | | $22.46 | | | $21.63 | | | $21.61 | | | $19.92 | |
| Income/(Loss) from Investment Operations: | | | | | | | | | | | | | | | | | | |
| | Net investment income/(loss)(1) | | 0.07 | | | 0.03 | | | 0.04 | | | 0.12 | | | 0.12 | | | 0.06 | |
| | Net realized and unrealized gain/(loss) | | 4.12 | | | (7.74) | | | 9.28 | | | 3.17 | | | 1.36 | | | 3.10 | |
| Total from Investment Operations | | 4.19 | | | (7.71) | | | 9.32 | | | 3.29 | | | 1.48 | | | 3.16 | |
| Less Dividends and Distributions: | | | | | | | | | | | | | | | | | | |
| | Dividends (from net investment income) | | (0.06) | | | (0.05) | | | (0.10) | | | (0.14) | | | (0.04) | | | — | |
| | Distributions (from capital gains) | | — | | | (2.74) | | | (0.31) | | | (2.32) | | | (1.42) | | | (1.47) | |
| Total Dividends and Distributions | | (0.06) | | | (2.79) | | | (0.41) | | | (2.46) | | | (1.46) | | | (1.47) | |
| Net Asset Value, End of Period | | $25.00 | | | $20.87 | | | $31.37 | | | $22.46 | | | $21.63 | | | $21.61 | |
| Total Return* | | 20.11% | | | (26.77)% | | | 41.82% | | | 16.01% | | | 8.76% | | | 16.89% | |
| Net Assets, End of Period (in thousands) | | $61,188 | | | $54,652 | | | $63,005 | | | $28,123 | | | $20,126 | | | $14,940 | |
| Average Net Assets for the Period (in thousands) | | $58,389 | | | $66,066 | | | $45,546 | | | $23,713 | | | $17,754 | | | $13,854 | |
| Ratios to Average Net Assets**: | | | | | | | | | | | | | | | | | | |
| | Ratio of Gross Expenses | | 0.97% | | | 1.08% | | | 1.12% | | | 0.97% | | | 0.94% | | | 0.87% | |
| | Ratio of Net Expenses (After Waivers and Expense Offsets) | | 0.97% | | | 1.08% | | | 1.12% | | | 0.97% | | | 0.94% | | | 0.87% | |
| | Ratio of Net Investment Income/(Loss) | | 0.62% | | | 0.11% | | | 0.14% | | | 0.60% | | | 0.58% | | | 0.31% | |
| Portfolio Turnover Rate | | 21% | | | 48% | | | 37% | | | 68% | | | 76% | | | 59% | |
| | | | | | | | | | | | | | | | | | | | | | |
| |
* Total return includes adjustments in accordance with generally accepted accounting principles required at the year or period end and are not annualized for periods of less than one full year. ** Annualized for periods of less than one full year. (1) Per share amounts are calculated based on average shares outstanding during the year or period. |
| | |
See Notes to Financial Statements. |
| |
16 | MARCH 31, 2023 |
Janus Henderson Contrarian Fund
Financial Highlights
| | | | | | | | | | | | | | | | | | | | | | |
Class C Shares | | | | | | | | | | | | | | | | | | |
For a share outstanding during the period ended March 31, 2023 (unaudited) and the year ended September 30 | 2023 | | | 2022 | | | 2021 | | | 2020 | | | 2019 | | | 2018 | |
| Net Asset Value, Beginning of Period | | $18.72 | | | $28.59 | | | $20.55 | | | $19.98 | | | $20.16 | | | $18.80 | |
| Income/(Loss) from Investment Operations: | | | | | | | | | | | | | | | | | | |
| | Net investment income/(loss)(1) | | (0.01) | | | (0.15) | | | (0.14) | | | (0.03) | | | (0.02) | | | (0.07) | |
| | Net realized and unrealized gain/(loss) | | 3.71 | | | (6.98) | | | 8.49 | | | 2.92 | | | 1.26 | | | 2.90 | |
| Total from Investment Operations | | 3.70 | | | (7.13) | | | 8.35 | | | 2.89 | | | 1.24 | | | 2.83 | |
| Less Dividends and Distributions: | | | | | | | | | | | | | | | | | | |
| | Dividends (from net investment income) | | — | | | — | | | — | | | — | | | — | | | — | |
| | Distributions (from capital gains) | | — | | | (2.74) | | | (0.31) | | | (2.32) | | | (1.42) | | | (1.47) | |
| Total Dividends and Distributions | | — | | | (2.74) | | | (0.31) | | | (2.32) | | | (1.42) | | | (1.47) | |
| Net Asset Value, End of Period | | $22.42 | | | $18.72 | | | $28.59 | | | $20.55 | | | $19.98 | | | $20.16 | |
| Total Return* | | 19.76% | | | (27.34)% | | | 40.91% | | | 15.20% | | | 8.08% | | | 16.10% | |
| Net Assets, End of Period (in thousands) | | $22,358 | | | $21,790 | | | $21,150 | | | $7,178 | | | $10,556 | | | $19,126 | |
| Average Net Assets for the Period (in thousands) | | $22,581 | | | $24,560 | | | $12,788 | | | $9,451 | | | $12,089 | | | $21,999 | |
| Ratios to Average Net Assets**: | | | | | | | | | | | | | | | | | | |
| | Ratio of Gross Expenses | | 1.64% | | | 1.82% | | | 1.81% | | | 1.63% | | | 1.58% | | | 1.56% | |
| | Ratio of Net Expenses (After Waivers and Expense Offsets) | | 1.64% | | | 1.82% | | | 1.81% | | | 1.63% | | | 1.58% | | | 1.56% | |
| | Ratio of Net Investment Income/(Loss) | | (0.05)% | | | (0.63)% | | | (0.52)% | | | (0.15)% | | | (0.10)% | | | (0.38)% | |
| Portfolio Turnover Rate | | 21% | | | 48% | | | 37% | | | 68% | | | 76% | | | 59% | |
| | | | | | | | | | | | | | | | | | | | | | |
| |
* Total return includes adjustments in accordance with generally accepted accounting principles required at the year or period end and are not annualized for periods of less than one full year. ** Annualized for periods of less than one full year. (1) Per share amounts are calculated based on average shares outstanding during the year or period. |
| | |
See Notes to Financial Statements. |
| |
Janus Investment Fund | 17 |
Janus Henderson Contrarian Fund
Financial Highlights
| | | | | | | | | | | | | | | | | | | | | | |
Class D Shares | | | | | | | | | | | | | | | | | | |
For a share outstanding during the period ended March 31, 2023 (unaudited) and the year ended September 30 | 2023 | | | 2022 | | | 2021 | | | 2020 | | | 2019 | | | 2018 | |
| Net Asset Value, Beginning of Period | | $21.01 | | | $31.54 | | | $22.56 | | | $21.70 | | | $21.65 | | | $19.97 | |
| Income/(Loss) from Investment Operations: | | | | | | | | | | | | | | | | | | |
| | Net investment income/(loss)(1) | | 0.10 | | | 0.09 | | | 0.10 | | | 0.17 | | | 0.16 | | | 0.11 | |
| | Net realized and unrealized gain/(loss) | | 4.14 | | | (7.79) | | | 9.33 | | | 3.19 | | | 1.37 | | | 3.11 | |
| Total from Investment Operations | | 4.24 | | | (7.70) | | | 9.43 | | | 3.36 | | | 1.53 | | | 3.22 | |
| Less Dividends and Distributions: | | | | | | | | | | | | | | | | | | |
| | Dividends (from net investment income) | | (0.12) | | | (0.09) | | | (0.14) | | | (0.18) | | | (0.06) | | | (0.07) | |
| | Distributions (from capital gains) | | — | | | (2.74) | | | (0.31) | | | (2.32) | | | (1.42) | | | (1.47) | |
| Total Dividends and Distributions | | (0.12) | | | (2.83) | | | (0.45) | | | (2.50) | | | (1.48) | | | (1.54) | |
| Net Asset Value, End of Period | | $25.13 | | | $21.01 | | | $31.54 | | | $22.56 | | | $21.70 | | | $21.65 | |
| Total Return* | | 20.25% | | | (26.60)% | | | 42.18% | | | 16.29% | | | 8.99% | | | 17.20% | |
| Net Assets, End of Period (in thousands) | | $2,492,249 | | | $2,122,792 | | | $3,021,999 | | | $2,152,848 | | | $1,988,711 | | | $1,925,749 | |
| Average Net Assets for the Period (in thousands) | | $2,375,227 | | | $2,758,198 | | | $2,773,321 | | | $1,994,412 | | | $1,855,826 | | | $1,841,765 | |
| Ratios to Average Net Assets**: | | | | | | | | | | | | | | | | | | |
| | Ratio of Gross Expenses | | 0.74% | | | 0.86% | | | 0.90% | | | 0.72% | | | 0.71% | | | 0.65% | |
| | Ratio of Net Expenses (After Waivers and Expense Offsets) | | 0.74% | | | 0.86% | | | 0.90% | | | 0.72% | | | 0.71% | | | 0.65% | |
| | Ratio of Net Investment Income/(Loss) | | 0.85% | | | 0.33% | | | 0.34% | | | 0.83% | | | 0.80% | | | 0.53% | |
| Portfolio Turnover Rate | | 21% | | | 48% | | | 37% | | | 68% | | | 76% | | | 59% | |
| | | | | | | | | | | | | | | | | | | | | | |
| |
* Total return includes adjustments in accordance with generally accepted accounting principles required at the year or period end and are not annualized for periods of less than one full year. ** Annualized for periods of less than one full year. (1) Per share amounts are calculated based on average shares outstanding during the year or period. |
| | |
See Notes to Financial Statements. |
| |
18 | MARCH 31, 2023 |
Janus Henderson Contrarian Fund
Financial Highlights
| | | | | | | | | | | | | | | | | | | | | | |
Class I Shares | | | | | | | | | | | | | | | | | | |
For a share outstanding during the period ended March 31, 2023 (unaudited) and the year ended September 30 | 2023 | | | 2022 | | | 2021 | | | 2020 | | | 2019 | | | 2018 | |
| Net Asset Value, Beginning of Period | | $21.01 | | | $31.55 | | | $22.58 | | | $21.73 | | | $21.68 | | | $19.99 | |
| Income/(Loss) from Investment Operations: | | | | | | | | | | | | | | | | | | |
| | Net investment income/(loss)(1) | | 0.10 | | | 0.10 | | | 0.14 | | | 0.18 | | | 0.17 | | | 0.12 | |
| | Net realized and unrealized gain/(loss) | | 4.15 | | | (7.79) | | | 9.30 | | | 3.20 | | | 1.37 | | | 3.12 | |
| Total from Investment Operations | | 4.25 | | | (7.69) | | | 9.44 | | | 3.38 | | | 1.54 | | | 3.24 | |
| Less Dividends and Distributions: | | | | | | | | | | | | | | | | | | |
| | Dividends (from net investment income) | | (0.13) | | | (0.11) | | | (0.16) | | | (0.21) | | | (0.07) | | | (0.08) | |
| | Distributions (from capital gains) | | — | | | (2.74) | | | (0.31) | | | (2.32) | | | (1.42) | | | (1.47) | |
| Total Dividends and Distributions | | (0.13) | | | (2.85) | | | (0.47) | | | (2.53) | | | (1.49) | | | (1.55) | |
| Net Asset Value, End of Period | | $25.13 | | | $21.01 | | | $31.55 | | | $22.58 | | | $21.73 | | | $21.68 | |
| Total Return* | | 20.28% | | | (26.57)% | | | 42.18% | | | 16.37% | | | 9.05% | | | 17.29% | |
| Net Assets, End of Period (in thousands) | | $743,518 | | | $754,492 | | | $679,220 | | | $79,528 | | | $90,754 | | | $54,348 | |
| Average Net Assets for the Period (in thousands) | | $752,283 | | | $815,397 | | | $316,791 | | | $86,316 | | | $59,058 | | | $58,166 | |
| Ratios to Average Net Assets**: | | | | | | | | | | | | | | | | | | |
| | Ratio of Gross Expenses | | 0.71% | | | 0.83% | | | 0.85% | | | 0.66% | | | 0.65% | | | 0.57% | |
| | Ratio of Net Expenses (After Waivers and Expense Offsets) | | 0.71% | | | 0.83% | | | 0.85% | | | 0.66% | | | 0.65% | | | 0.57% | |
| | Ratio of Net Investment Income/(Loss) | | 0.88% | | | 0.36% | | | 0.48% | | | 0.84% | | | 0.85% | | | 0.60% | |
| Portfolio Turnover Rate | | 21% | | | 48% | | | 37% | | | 68% | | | 76% | | | 59% | |
| | | | | | | | | | | | | | | | | | | | | | |
| |
* Total return includes adjustments in accordance with generally accepted accounting principles required at the year or period end and are not annualized for periods of less than one full year. ** Annualized for periods of less than one full year. (1) Per share amounts are calculated based on average shares outstanding during the year or period. |
| | |
See Notes to Financial Statements. |
| |
Janus Investment Fund | 19 |
Janus Henderson Contrarian Fund
Financial Highlights
| | | | | | | | | | | | | | | | | | | | | | |
Class N Shares | | | | | | | | | | | | | | | | | | |
For a share outstanding during the period ended March 31, 2023 (unaudited) and the year ended September 30 | 2023 | | | 2022 | | | 2021 | | | 2020 | | | 2019 | | | 2018 | |
| Net Asset Value, Beginning of Period | | $20.98 | | | $31.50 | | | $22.54 | | | $21.68 | | | $21.63 | | | $19.96 | |
| Income/(Loss) from Investment Operations: | | | | | | | | | | | | | | | | | | |
| | Net investment income/(loss)(1) | | 0.12 | | | 0.12 | | | 0.13 | | | 0.20 | | | 0.19 | | | 0.14 | |
| | Net realized and unrealized gain/(loss) | | 4.14 | | | (7.77) | | | 9.31 | | | 3.20 | | | 1.36 | | | 3.10 | |
| Total from Investment Operations | | 4.26 | | | (7.65) | | | 9.44 | | | 3.40 | | | 1.55 | | | 3.24 | |
| Less Dividends and Distributions: | | | | | | | | | | | | | | | | | | |
| | Dividends (from net investment income) | | (0.16) | | | (0.13) | | | (0.17) | | | (0.22) | | | (0.08) | | | (0.10) | |
| | Distributions (from capital gains) | | — | | | (2.74) | | | (0.31) | | | (2.32) | | | (1.42) | | | (1.47) | |
| Total Dividends and Distributions | | (0.16) | | | (2.87) | | | (0.48) | | | (2.54) | | | (1.50) | | | (1.57) | |
| Net Asset Value, End of Period | | $25.08 | | | $20.98 | | | $31.50 | | | $22.54 | | | $21.68 | | | $21.63 | |
| Total Return* | | 20.36% | | | (26.50)% | | | 42.28% | | | 16.50% | | | 9.16% | | | 17.37% | |
| Net Assets, End of Period (in thousands) | | $89,040 | | | $83,560 | | | $78,699 | | | $48,111 | | | $39,056 | | | $26,808 | |
| Average Net Assets for the Period (in thousands) | | $88,967 | | | $98,909 | | | $60,719 | | | $39,349 | | | $28,593 | | | $24,664 | |
| Ratios to Average Net Assets**: | | | | | | | | | | | | | | | | | | |
| | Ratio of Gross Expenses | | 0.60% | | | 0.73% | | | 0.77% | | | 0.58% | | | 0.58% | | | 0.50% | |
| | Ratio of Net Expenses (After Waivers and Expense Offsets) | | 0.60% | | | 0.73% | | | 0.77% | | | 0.58% | | | 0.58% | | | 0.50% | |
| | Ratio of Net Investment Income/(Loss) | | 1.00% | | | 0.46% | | | 0.46% | | | 0.97% | | | 0.92% | | | 0.69% | |
| Portfolio Turnover Rate | | 21% | | | 48% | | | 37% | | | 68% | | | 76% | | | 59% | |
| | | | | | | | | | | | | | | | | | | | | | |
| |
* Total return includes adjustments in accordance with generally accepted accounting principles required at the year or period end and are not annualized for periods of less than one full year. ** Annualized for periods of less than one full year. (1) Per share amounts are calculated based on average shares outstanding during the year or period. |
| | |
See Notes to Financial Statements. |
| |
20 | MARCH 31, 2023 |
Janus Henderson Contrarian Fund
Financial Highlights
| | | | | | | | | | | | | | | | | | | | | | |
Class R Shares | | | | | | | | | | | | | | | | | | |
For a share outstanding during the period ended March 31, 2023 (unaudited) and the year ended September 30 | 2023 | | | 2022 | | | 2021 | | | 2020 | | | 2019 | | | 2018 | |
| Net Asset Value, Beginning of Period | | $19.91 | | | $30.14 | | | $21.62 | | | $20.88 | | | $20.97 | | | $19.47 | |
| Income/(Loss) from Investment Operations: | | | | | | | | | | | | | | | | | | |
| | Net investment income/(loss)(1) | | 0.02 | | | (0.09) | | | (0.10) | | | 0.01 | | | 0.01 | | | (0.05) | |
| | Net realized and unrealized gain/(loss) | | 3.93 | | | (7.40) | | | 8.93 | | | 3.05 | | | 1.32 | | | 3.02 | |
| Total from Investment Operations | | 3.95 | | | (7.49) | | | 8.83 | | | 3.06 | | | 1.33 | | | 2.97 | |
| Less Dividends and Distributions: | | | | | | | | | | | | | | | | | | |
| | Dividends (from net investment income) | | — | | | — | | | — | | | — | | | — | | | — | |
| | Distributions (from capital gains) | | — | | | (2.74) | | | (0.31) | | | (2.32) | | | (1.42) | | | (1.47) | |
| Total Dividends and Distributions | | — | | | (2.74) | | | (0.31) | | | (2.32) | | | (1.42) | | | (1.47) | |
| Net Asset Value, End of Period | | $23.86 | | | $19.91 | | | $30.14 | | | $21.62 | | | $20.88 | | | $20.97 | |
| Total Return* | | 19.84% | | | (27.11)% | | | 41.11% | | | 15.37% | | | 8.21% | | | 16.26% | |
| Net Assets, End of Period (in thousands) | | $1,659 | | | $1,628 | | | $1,450 | | | $410 | | | $780 | | | $676 | |
| Average Net Assets for the Period (in thousands) | | $1,711 | | | $1,877 | | | $1,227 | | | $804 | | | $695 | | | $667 | |
| Ratios to Average Net Assets**: | | | | | | | | | | | | | | | | | | |
| | Ratio of Gross Expenses | | 1.52% | | | 1.62% | | | 1.76% | | | 1.70% | | | 1.74% | | | 1.47% | |
| | Ratio of Net Expenses (After Waivers and Expense Offsets) | | 1.44% | | | 1.55% | | | 1.61% | | | 1.50% | | | 1.48% | | | 1.41% | |
| | Ratio of Net Investment Income/(Loss) | | 0.15% | | | (0.36)% | | | (0.33)% | | | 0.07% | | | 0.04% | | | (0.24)% | |
| Portfolio Turnover Rate | | 21% | | | 48% | | | 37% | | | 68% | | | 76% | | | 59% | |
| | | | | | | | | | | | | | | | | | | | | | |
| |
* Total return includes adjustments in accordance with generally accepted accounting principles required at the year or period end and are not annualized for periods of less than one full year. ** Annualized for periods of less than one full year. (1) Per share amounts are calculated based on average shares outstanding during the year or period. |
| | |
See Notes to Financial Statements. |
| |
Janus Investment Fund | 21 |
Janus Henderson Contrarian Fund
Financial Highlights
| | | | | | | | | | | | | | | | | | | | | | |
Class S Shares | | | | | | | | | | | | | | | | | | |
For a share outstanding during the period ended March 31, 2023 (unaudited) and the year ended September 30 | 2023 | | | 2022 | | | 2021 | | | 2020 | | | 2019 | | | 2018 | |
| Net Asset Value, Beginning of Period | | $20.80 | | | $31.34 | | | $22.41 | | | $21.55 | | | $21.53 | | | $19.89 | |
| Income/(Loss) from Investment Operations: | | | | | | | | | | | | | | | | | | |
| | Net investment income/(loss)(1) | | 0.05 | | | (0.02) | | | (0.03) | | | 0.05 | | | 0.07 | | | 0.02 | |
| | Net realized and unrealized gain/(loss) | | 4.11 | | | (7.74) | | | 9.27 | | | 3.18 | | | 1.37 | | | 3.09 | |
| Total from Investment Operations | | 4.16 | | | (7.76) | | | 9.24 | | | 3.23 | | | 1.44 | | | 3.11 | |
| Less Dividends and Distributions: | | | | | | | | | | | | | | | | | | |
| | Dividends (from net investment income) | | (0.03) | | | (0.04) | | | — | | | (0.05) | | | — | | | — | |
| | Distributions (from capital gains) | | — | | | (2.74) | | | (0.31) | | | (2.32) | | | (1.42) | | | (1.47) | |
| Total Dividends and Distributions | | (0.03) | | | (2.78) | | | (0.31) | | | (2.37) | | | (1.42) | | | (1.47) | |
| Net Asset Value, End of Period | | $24.93 | | | $20.80 | | | $31.34 | | | $22.41 | | | $21.55 | | | $21.53 | |
| Total Return* | | 20.04% | | | (26.94)% | | | 41.49% | | | 15.71% | | | 8.52% | | | 16.65% | |
| Net Assets, End of Period (in thousands) | | $1,869 | | | $1,402 | | | $739 | | | $451 | | | $1,032 | | | $1,033 | |
| Average Net Assets for the Period (in thousands) | | $1,674 | | | $1,622 | | | $628 | | | $756 | | | $996 | | | $3,068 | |
| Ratios to Average Net Assets**: | | | | | | | | | | | | | | | | | | |
| | Ratio of Gross Expenses | | 1.29% | | | 1.41% | | | 1.74% | | | 1.46% | | | 1.35% | | | 1.04% | |
| | Ratio of Net Expenses (After Waivers and Expense Offsets) | | 1.19% | | | 1.30% | | | 1.35% | | | 1.21% | | | 1.18% | | | 1.03% | |
| | Ratio of Net Investment Income/(Loss) | | 0.39% | | | (0.08)% | | | (0.09)% | | | 0.27% | | | 0.33% | | | 0.10% | |
| Portfolio Turnover Rate | | 21% | | | 48% | | | 37% | | | 68% | | | 76% | | | 59% | |
| | | | | | | | | | | | | | | | | | | | | | |
| |
* Total return includes adjustments in accordance with generally accepted accounting principles required at the year or period end and are not annualized for periods of less than one full year. ** Annualized for periods of less than one full year. (1) Per share amounts are calculated based on average shares outstanding during the year or period. |
| | |
See Notes to Financial Statements. |
| |
22 | MARCH 31, 2023 |
Janus Henderson Contrarian Fund
Financial Highlights
| | | | | | | | | | | | | | | | | | | | | | |
Class T Shares | | | | | | | | | | | | | | | | | | |
For a share outstanding during the period ended March 31, 2023 (unaudited) and the year ended September 30 | 2023 | | | 2022 | | | 2021 | | | 2020 | | | 2019 | | | 2018 | |
| Net Asset Value, Beginning of Period | | $20.97 | | | $31.48 | | | $22.54 | | | $21.68 | | | $21.63 | | | $19.95 | |
| Income/(Loss) from Investment Operations: | | | | | | | | | | | | | | | | | | |
| | Net investment income/(loss)(1) | | 0.09 | | | 0.06 | | | 0.07 | | | 0.15 | | | 0.14 | | | 0.09 | |
| | Net realized and unrealized gain/(loss) | | 4.14 | | | (7.77) | | | 9.30 | | | 3.19 | | | 1.38 | | | 3.11 | |
| Total from Investment Operations | | 4.23 | | | (7.71) | | | 9.37 | | | 3.34 | | | 1.52 | | | 3.20 | |
| Less Dividends and Distributions: | | | | | | | | | | | | | | | | | | |
| | Dividends (from net investment income) | | (0.10) | | | (0.06) | | | (0.12) | | | (0.16) | | | (0.05) | | | (0.05) | |
| | Distributions (from capital gains) | | — | | | (2.74) | | | (0.31) | | | (2.32) | | | (1.42) | | | (1.47) | |
| Total Dividends and Distributions | | (0.10) | | | (2.80) | | | (0.43) | | | (2.48) | | | (1.47) | | | (1.52) | |
| Net Asset Value, End of Period | | $25.10 | | | $20.97 | | | $31.48 | | | $22.54 | | | $21.68 | | | $21.63 | |
| Total Return* | | 20.19% | | | (26.66)% | | | 41.94% | | | 16.22% | | | 8.92% | | | 17.11% | |
| Net Assets, End of Period (in thousands) | | $985,164 | | | $866,118 | | | $1,259,649 | | | $773,177 | | | $730,400 | | | $676,452 | |
| Average Net Assets for the Period (in thousands) | | $950,174 | | | $1,149,894 | | | $1,076,107 | | | $731,491 | | | $652,848 | | | $656,674 | |
| Ratios to Average Net Assets**: | | | | | | | | | | | | | | | | | | |
| | Ratio of Gross Expenses | | 0.85% | | | 0.98% | | | 1.01% | | | 0.82% | | | 0.81% | | | 0.74% | |
| | Ratio of Net Expenses (After Waivers and Expense Offsets) | | 0.83% | | | 0.96% | | | 1.00% | | | 0.81% | | | 0.79% | | | 0.73% | |
| | Ratio of Net Investment Income/(Loss) | | 0.76% | | | 0.23% | | | 0.24% | | | 0.73% | | | 0.72% | | | 0.44% | |
| Portfolio Turnover Rate | | 21% | | | 48% | | | 37% | | | 68% | | | 76% | | | 59% | |
| | | | | | | | | | | | | | | | | | | | | | |
| |
* Total return includes adjustments in accordance with generally accepted accounting principles required at the year or period end and are not annualized for periods of less than one full year. ** Annualized for periods of less than one full year. (1) Per share amounts are calculated based on average shares outstanding during the year or period. |
| | |
See Notes to Financial Statements. |
| |
Janus Investment Fund | 23 |
Janus Henderson Contrarian Fund
Notes to Financial Statements (unaudited)
1. Organization and Significant Accounting Policies
Janus Henderson Contrarian Fund (the “Fund”) is a series of Janus Investment Fund (the “Trust”), which is organized as a Massachusetts business trust and is registered under the Investment Company Act of 1940, as amended (the “1940 Act”), as an open-end management investment company, and therefore has applied the specialized accounting and reporting guidance in Financial Accounting Standards Board (“FASB”) Accounting Standards Codification (“ASC”) Topic 946. The Trust offers 40 funds, each of which offers multiple share classes, with differing investment objectives and policies. The Fund seeks long-term growth of capital. The Fund is classified as nondiversified, as defined in the 1940 Act. Janus Henderson Investors US LLC is the investment adviser (the “Adviser”) to the Fund.
The Fund offers multiple classes of shares in order to meet the needs of various types of investors. Each class represents an interest in the same portfolio of investments. Certain financial intermediaries may not offer all classes of shares.
Shareholders, including individuals, accounts, as well as the Fund’s portfolio manager(s) and/or investment personnel, may from time to time own (beneficially or of record) a significant percentage of the Fund’s Shares and can be considered to “control” the Fund when that ownership exceeds 25% of the Fund’s assets (and which may differ from control as determined in accordance with United States of America generally accepted accounting principles ("US GAAP")).
Class A Shares are offered through financial intermediary platforms including, but not limited to, traditional brokerage platforms, mutual fund wrap fee programs, bank trust platforms, and retirement platforms.
Class C Shares are offered through financial intermediary platforms including, but not limited to, traditional brokerage platforms, mutual fund wrap fee programs, and bank trust platforms.
Class C Shares are closed to investments by new employer-sponsored retirement plans and existing employer-sponsored retirement plans are no longer able to make additional purchases or exchanges into Class C Shares.
The Fund currently implements an automatic conversion feature pursuant to which Class C Shares that have been held for eight years are automatically converted to Class A Shares without the imposition of any sales charge, fee or other charge. The conversion will generally occur no later than ten business days in the month following the month of the eighth anniversary of the date of purchase. Class C Shares purchased through the reinvestment of dividends and other distributions on Class C Shares will convert to Class A Shares at the same time as the original Class C Shares with respect to which they were purchased. For Class C Shares held in omnibus accounts on intermediary platforms, the Fund relies on these intermediaries to implement this conversion feature. Your financial intermediary may have separate policies and procedures as to when and how Class C Shares may be converted to Class A Shares.
Effective July 6, 2020, Class D Shares are available to new investors, subject to any closed fund policies for a Fund, as applicable. Previously, Class D Shares were only available to investors who already had a direct account with the Janus Henderson funds; immediate family members or members of the same household of an eligible individual investor; and existing beneficial owners of sole proprietorships or partnerships that hold accounts directly with the Janus Henderson funds.
Class I Shares are available through certain financial intermediary platforms including, but not limited to, mutual fund wrap fee programs, managed account programs, asset allocation programs, bank trust platforms, as well as certain retirement platforms. Class I Shares are also available to certain direct institutional investors including, but not limited to, corporations, certain retirement plans, public plans, and foundations/endowments, who established Class I Share accounts before August 4, 2017.
Class N Shares are generally available only to financial intermediaries purchasing on behalf of: 1) certain adviser-assisted, employer-sponsored retirement plans, including 401(k) plans, 457 plans, 403(b) plans, Taft-Hartley multi-employer plans, profit-sharing and money purchase pension plans, defined benefit plans and certain welfare benefit plans, such as health savings accounts, and nonqualified deferred compensation plans; and 2) retail investors purchasing in qualified or nonqualified accounts, whose accounts are held through an omnibus account at their financial intermediary, and where the financial intermediary requires no payment or reimbursement from the Fund, the Adviser, or its affiliates. Class N Shares are also available to Janus Henderson proprietary products and to certain direct institutional investors approved by Janus Henderson Distributors US LLC (the “Distributor”) including, but not limited to,
Janus Henderson Contrarian Fund
Notes to Financial Statements (unaudited)
corporations, certain retirement plans, public plans, and foundations and endowments, subject to minimum investment requirements.
Class R Shares are offered through financial intermediary platforms including, but not limited to, retirement platforms.
Class S Shares are offered through financial intermediary platforms including, but not limited to, retirement platforms and asset allocation, mutual fund wrap, or other discretionary or nondiscretionary fee-based investment advisory programs. In addition, Class S Shares may be available through certain financial intermediaries who have an agreement with the Adviser or its affiliates to offer Class S Shares on their supermarket platforms.
Class T Shares are available through certain financial intermediary platforms including, but not limited to, mutual fund wrap fee programs, managed account programs, asset allocation programs, bank trust platforms, as well as certain retirement platforms. In addition, Class T Shares may be available through certain financial intermediaries who have an agreement with the Adviser or its affiliates to offer Class T Shares on their supermarket platforms.
The following accounting policies have been followed by the Fund and are in conformity with US GAAP.
Investment Valuation
Fund holdings are valued in accordance with policies and procedures established by the Adviser pursuant to Rule 2a-5 under the 1940 Act and approved by and subject to the oversight of the Trustees (the “Valuation Procedures”). Equity securities traded on a domestic securities exchange are generally valued at readily available market quotations, which are (i) the official close prices or (ii) last sale prices on the primary market or exchange in which the securities trade. If such price is lacking for the trading period immediately preceding the time of determination, such securities are generally valued at their current bid price. Equity securities that are traded on a foreign exchange are generally valued at the closing prices on such markets. In the event that there is no current trading volume on a particular security in such foreign exchange, the bid price from the primary exchange is generally used to value the security. Foreign securities and currencies are converted to U.S. dollars using the current spot USD dollar exchange rate in effect at the close of the New York Stock Exchange (“NYSE”). The Fund will determine the market value of individual securities held by it by using prices provided by one or more approved professional pricing services or, as needed, by obtaining market quotations from independent broker-dealers. Most debt securities are valued in accordance with the evaluated bid price supplied by the Adviser-approved pricing service that is intended to reflect market value. The evaluated bid price supplied by the pricing service is an evaluation that may consider factors such as security prices, yields, maturities and ratings. Certain short-term securities maturing within 60 days or less may be evaluated and valued on an amortized cost basis provided that the amortized cost determined approximates market value. Securities for which market quotations or evaluated prices are not readily available or deemed unreliable are valued at fair value determined in good faith by the Adviser pursuant to the Valuation Procedures. Circumstances in which fair valuation may be utilized include, but are not limited to: (i) a significant event that may affect the securities of a single issuer, such as a merger, bankruptcy, or significant issuer-specific development; (ii) an event that may affect an entire market, such as a natural disaster or significant governmental action; (iii) a nonsignificant event such as a market closing early or not opening, or a security trading halt; and (iv) pricing of a nonvalued security and a restricted or nonpublic security. Special valuation considerations may apply with respect to “odd-lot” fixed-income transactions which, due to their small size, may receive evaluated prices by pricing services which reflect a large block trade and not what actually could be obtained for the odd-lot position. The valuation policies provide for the use of systematic fair valuation models provided by independent pricing services to value foreign equity securities in order to adjust for stale pricing, which may occur between the close of certain foreign exchanges and the close of the NYSE. The value of the securities of other mutual funds held by a Fund, if any, will be calculated using the NAV of such mutual funds.
Valuation Inputs Summary
FASB ASC 820, Fair Value Measurements and Disclosures (“ASC 820”), defines fair value, establishes a framework for measuring fair value, and expands disclosure requirements regarding fair value measurements. This standard emphasizes that fair value is a market-based measurement that should be determined based on the assumptions that market participants would use in pricing an asset or liability and establishes a hierarchy that prioritizes inputs to valuation techniques used to measure fair value. These inputs are summarized into three broad levels:
Level 1 – Unadjusted quoted prices in active markets the Fund has the ability to access for identical assets or liabilities.
Janus Henderson Contrarian Fund
Notes to Financial Statements (unaudited)
Level 2 – Observable inputs other than unadjusted quoted prices included in Level 1 that are observable for the asset or liability either directly or indirectly. These inputs may include quoted prices for the identical instrument on an inactive market, prices for similar instruments, interest rates, prepayment speeds, credit risk, yield curves, default rates and similar data.
Assets or liabilities categorized as Level 2 in the hierarchy generally include: debt securities fair valued in accordance with the evaluated bid or ask prices supplied by a pricing service; securities traded on OTC markets and listed securities for which no sales are reported that are fair valued at the latest bid price (or yield equivalent thereof) obtained from one or more dealers transacting in a market for such securities or by a pricing service approved by the Fund’s Trustees; certain short-term debt securities with maturities of 60 days or less that are fair valued at amortized cost; and equity securities of foreign issuers whose fair value is determined by using systematic fair valuation models provided by independent third parties in order to adjust for stale pricing which may occur between the close of certain foreign exchanges and the close of the NYSE. Other securities that may be categorized as Level 2 in the hierarchy include, but are not limited to, preferred stocks, bank loans, swaps, investments in unregistered investment companies, options, and forward contracts.
Level 3 – Unobservable inputs for the asset or liability to the extent that relevant observable inputs are not available, representing the Fund’s own assumptions about the assumptions that a market participant would use in valuing the asset or liability, and that would be based on the best information available.
There have been no significant changes in valuation techniques used in valuing any such positions held by the Fund since the beginning of the fiscal period.
The inputs or methodology used for fair valuing securities are not necessarily an indication of the risk associated with investing in those securities. The summary of inputs used as of March 31, 2023 to fair value the Fund’s investments in securities and other financial instruments is included in the “Valuation Inputs Summary” in the Notes to Schedule of Investments and Other Information.
Investment Transactions and Investment Income
Investment transactions are accounted for as of the date purchased or sold (trade date). Dividend income is recorded on the ex-dividend date. Certain dividends from foreign securities will be recorded as soon as the Fund is informed of the dividend, if such information is obtained subsequent to the ex-dividend date. Dividends from foreign securities may be subject to withholding taxes in foreign jurisdictions. Non-cash dividends, if any, are recorded on the ex-dividend date at fair value. Interest income is recorded daily on an accrual basis and includes amortization of premiums and accretion of discounts. The Fund classifies gains and losses on prepayments received as an adjustment to interest income. Debt securities may be placed in non-accrual status and related interest income may be reduced by stopping current accruals and writing off interest receivables when collection of all or a portion of interest has become doubtful. Gains and losses are determined on the identified cost basis, which is the same basis used for federal income tax purposes. Income, as well as gains and losses, both realized and unrealized, are allocated daily to each class of shares based upon the ratio of net assets represented by each class as a percentage of total net assets.
Expenses
The Fund bears expenses incurred specifically on its behalf. Each class of shares bears a portion of general expenses, which are allocated daily to each class of shares based upon the ratio of net assets represented by each class as a percentage of total net assets. Expenses directly attributable to a specific class of shares are charged against the operations of such class.
Estimates
The preparation of financial statements in conformity with US GAAP requires management to make estimates and assumptions that affect the reported amount of assets and liabilities and disclosure of contingent assets and liabilities at the date of the financial statements, and the reported amounts of income and expenses during the reporting period. Actual results could differ from those estimates.
Indemnifications
In the normal course of business, the Fund may enter into contracts that contain provisions for indemnification of other parties against certain potential liabilities. The Fund’s maximum exposure under these arrangements is unknown, and would involve future claims that may be made against the Fund that have not yet occurred. Currently, the risk of material loss from such claims is considered remote.
Janus Henderson Contrarian Fund
Notes to Financial Statements (unaudited)
Foreign Currency Translations
The Fund does not isolate that portion of the results of operations resulting from the effect of changes in foreign exchange rates on investments from the fluctuations arising from changes in market prices of securities held at the date of the financial statements. Net unrealized appreciation or depreciation of investments and foreign currency translations arise from changes in the value of assets and liabilities, including investments in securities held at the date of the financial statements, resulting from changes in the exchange rates and changes in market prices of securities held.
Currency gains and losses are also calculated on payables and receivables that are denominated in foreign currencies. The payables and receivables are generally related to foreign security transactions and income translations.
Foreign currency-denominated assets and forward currency contracts may involve more risks than domestic transactions, including currency risk, counterparty risk, political and economic risk, regulatory risk and equity risk. Risks may arise from unanticipated movements in the value of foreign currencies relative to the U.S. dollar.
Dividends and Distributions
The Fund generally declares and distributes dividends of net investment income and realized capital gains (if any) annually. The Fund may treat a portion of the amount paid to redeem shares as a distribution of investment company taxable income and realized capital gains that are reflected in the net asset value. This practice, commonly referred to as “equalization,” has no effect on the redeeming shareholder or a Fund’s total return, but may reduce the amounts that would otherwise be required to be paid as taxable dividends to the remaining shareholders. It is possible that the Internal Revenue Service (IRS) could challenge the Fund's equalization methodology or calculations, and any such challenge could result in additional tax, interest, or penalties to be paid by the Fund.
The Fund may make certain investments in real estate investment trusts (“REITs”) which pay dividends to their shareholders based upon funds available from operations. It is quite common for these dividends to exceed the REITs’ taxable earnings and profits, resulting in the excess portion of such dividends being designated as a return of capital. If the Fund distributes such amounts, such distributions could constitute a return of capital to shareholders for federal income tax purposes.
Federal Income Taxes
The Fund intends to continue to qualify as a regulated investment company and distribute all of its taxable income in accordance with the requirements of Subchapter M of the Internal Revenue Code. Management has analyzed the Fund’s tax positions taken for all open federal income tax years, generally a three-year period, and has concluded that no provision for federal income tax is required in the Fund’s financial statements. The Fund is not aware of any tax positions for which it is reasonably possible that the total amounts of unrecognized tax benefits will significantly change in the next twelve months.
2. Derivative Instruments
The Fund may invest in various types of derivatives, which may at times result in significant derivative exposure. A derivative is a financial instrument whose performance is derived from the performance of another asset. The Fund may invest in derivative instruments including, but not limited to: futures contracts, put options, call options, options on futures contracts, options on foreign currencies, options on recovery locks, options on security and commodity indices, swaps, forward contracts, structured investments, and other equity-linked derivatives. Each derivative instrument that was held by the Fund during the period ended March 31, 2023 is discussed in further detail below. A summary of derivative activity by the Fund is reflected in the tables at the end of the Schedule of Investments.
The Fund may use derivative instruments for hedging purposes (to offset risks associated with an investment, currency exposure, or market conditions), to adjust currency exposure relative to a benchmark index, or for speculative purposes (to earn income and seek to enhance returns). When the Fund invests in a derivative for speculative purposes, the Fund will be fully exposed to the risks of loss of that derivative, which may sometimes be greater than the derivative’s cost. The Fund may not use any derivative to gain exposure to an asset or class of assets that it would be prohibited by its investment restrictions from purchasing directly. The Fund’s ability to use derivative instruments may also be limited by tax considerations.
Investments in derivatives in general are subject to market risks that may cause their prices to fluctuate over time. Investments in derivatives may not directly correlate with the price movements of the underlying instrument. As a result, the use of derivatives may expose the Fund to additional risks that it would not be subject to if it invested directly in the
Janus Henderson Contrarian Fund
Notes to Financial Statements (unaudited)
securities underlying those derivatives. The use of derivatives may result in larger losses or smaller gains than otherwise would be the case. Derivatives can be volatile and may involve significant risks.
In pursuit of its investment objective, the Fund may seek to use derivatives to increase or decrease exposure to the following market risk factors:
· Commodity Risk – the risk related to the change in value of commodities or commodity-linked investments due to changes in the overall market movements, volatility of the underlying benchmark, changes in interest rates, or other factors affecting a particular industry or commodity such as drought, floods, weather, livestock disease, embargoes, tariffs, and international economic, political, and regulatory developments.
· Counterparty Risk – the risk that the counterparty (the party on the other side of the transaction) on a derivative transaction will be unable to honor its financial obligation to the Fund.
· Credit Risk – the risk an issuer will be unable to make principal and interest payments when due, or will default on its obligations.
· Currency Risk – the risk that changes in the exchange rate between currencies will adversely affect the value (in U.S. dollar terms) of an investment.
· Equity Risk – the risk related to the change in value of equity securities as they relate to increases or decreases in the general market.
· Index Risk – if the derivative is linked to the performance of an index, it will be subject to the risks associated with changes in that index. If the index changes, the Fund could receive lower interest payments or experience a reduction in the value of the derivative to below what the Fund paid. Certain indexed securities, including inverse securities (which move in an opposite direction to the index), may create leverage, to the extent that they increase or decrease in value at a rate that is a multiple of the changes in the applicable index.
· Interest Rate Risk – the risk that the value of fixed-income securities will generally decline as prevailing interest rates rise, which may cause the Fund’s NAV to likewise decrease.
· Leverage Risk – the risk associated with certain types of leveraged investments or trading strategies pursuant to which relatively small market movements may result in large changes in the value of an investment. The Fund creates leverage by investing in instruments, including derivatives, where the investment loss can exceed the original amount invested. Certain investments or trading strategies, such as short sales, that involve leverage can result in losses that greatly exceed the amount originally invested.
· Liquidity Risk – the risk that certain securities may be difficult or impossible to sell at the time that the seller would like or at the price that the seller believes the security is currently worth.
Derivatives may generally be traded OTC or on an exchange. Derivatives traded OTC are agreements that are individually negotiated between parties and can be tailored to meet a purchaser’s needs. OTC derivatives are not guaranteed by a clearing agency and may be subject to increased credit risk.
In an effort to mitigate credit risk associated with derivatives traded OTC, the Fund may enter into collateral agreements with certain counterparties whereby, subject to certain minimum exposure requirements, the Fund may require the counterparty to post collateral if the Fund has a net aggregate unrealized gain on all OTC derivative contracts with a particular counterparty. Additionally, the Fund may deposit cash and/or treasuries as collateral with the counterparty and/or custodian daily (based on the daily valuation of the financial asset) if the Fund has a net aggregate unrealized loss on OTC derivative contracts with a particular counterparty. All liquid securities and restricted cash are considered to cover in an amount at all times equal to or greater than the Fund’s commitment with respect to certain exchange-traded derivatives, centrally cleared derivatives, forward foreign currency exchange contracts, short sales, and/or securities with extended settlement dates. There is no guarantee that counterparty exposure is reduced and these arrangements are dependent on the Adviser’s ability to establish and maintain appropriate systems and trading.
Options Contracts
An options contract provides the purchaser with the right, but not the obligation, to buy (call option) or sell (put option) a financial instrument at an agreed upon price on or before a specified date. The purchaser pays a premium to the seller for this right. The seller has the corresponding obligation to sell or buy a financial instrument if the purchaser (owner)
Janus Henderson Contrarian Fund
Notes to Financial Statements (unaudited)
"exercises" the option. When an option is exercised, the proceeds on sales for a written call option, the purchase cost for a written put option, or the cost of the security for a purchased put or call option are adjusted by the amount of premium received or paid. Upon expiration, or closing of the option transaction, a realized gain or loss is reported on the Statement of Operations (if applicable). The difference between the premium paid/received and the market value of the option is recorded as unrealized appreciation or depreciation. The net change in unrealized appreciation or depreciation is reported on the Statement of Operations (if applicable). Option contracts are typically valued using an approved vendor’s option valuation model. To the extent reliable market quotations are available, option contracts are valued using market quotations. In cases when an approved vendor cannot provide coverage for an option and there is no reliable market quotation, a broker quotation or an internal valuation using the Black-Scholes model, the Cox-Rubinstein Binomial Option Pricing Model, or other appropriate option pricing model is used. Certain options contracts are marked-to-market daily, and the daily variation margin is recorded as a receivable or payable on the Statement of Assets and Liabilities as “Variation margin receivable” or “Variation margin payable” (if applicable).
The Fund may use options contracts to hedge against changes in interest rates, the values of equities, or foreign currencies. The Fund generally invests in options to hedge against adverse movements in the value of portfolio holdings. The use of such instruments may involve certain additional risks as a result of unanticipated movements in the market. A lack of correlation between the value of an instrument underlying an option and the asset being hedged, or unexpected adverse price movements, could render the Fund’s hedging strategy unsuccessful. In addition, there can be no assurance that a liquid secondary market will exist for any option purchased or sold. The Fund may be subject to counterparty risk, interest rate risk, liquidity risk, equity risk, commodity risk, and currency risk in the normal course of pursuing its investment objective through its investments in options contracts.
Options traded on an exchange are regulated and the terms of the options are standardized. Options traded OTC expose the Fund to counterparty risk in the event that the counterparty does not perform. This risk is mitigated by having a netting arrangement between the Fund and the counterparty and by having the counterparty post collateral to cover the Fund’s exposure to the counterparty.
In writing an option, the Fund bears the risk of an unfavorable change in the price of the security underlying the written option. When an option is written, the Fund receives a premium and becomes obligated to sell or purchase the underlying security at a fixed price, upon exercise of the option. Options written are reported as a liability on the Statement of Assets and Liabilities as “Options written, at value” (if applicable). The risk in writing call options is that the Fund gives up the opportunity for profit if the market price of the security increases and the options are exercised. The risk in writing put options is that the Fund may incur a loss if the market price of the security decreases and the options are exercised. The risk in buying options is that the Fund pays a premium whether or not the options are exercised. Exercise of an option written by the Fund could result in the Fund buying or selling a security at a price different from the current market value.
During the period, the Fund wrote call options on various equity securities for the purpose of decreasing exposure to individual equity risk and/or generating income.
There were no written options held at March 31, 2023.
3. Other Investments and Strategies
Additional Investment Risk
The U.S. government and the Federal Reserve, as well as certain foreign governments and central banks, have taken extraordinary actions to support local and global economies and the financial markets in response to the COVID-19 pandemic. This and other government intervention into the economy and financial markets to address the COVID-19 pandemic may not work as intended, particularly if the efforts are perceived by investors as being unlikely to achieve the desired results. Government actions to mitigate the economic impact of the pandemic have resulted in a large expansion of government deficits and debt, the long term consequences of which are not known. The COVID-19 pandemic could adversely affect the value and liquidity of a Fund’s investments, impair a Fund’s ability to satisfy redemption requests, and negatively impact a Fund’s performance. In addition, the outbreak of COVID-19, and measures taken to mitigate its effects, could result in disruptions to the services provided to a Fund by its service providers.
Widespread disease, including pandemics and epidemics, and natural or environmental disasters, including those which may be attributable to global climate change, such as earthquakes, fires, floods, hurricanes, tsunamis and weather-
Janus Henderson Contrarian Fund
Notes to Financial Statements (unaudited)
related phenomena generally, have been and can be highly disruptive to economies and markets, adversely impacting individual companies, sectors, industries, markets, currencies, interest and inflation rates, credit ratings, investor sentiment, and other factors affecting the value of a Fund’s investments. Economies and financial markets throughout the world have become increasingly interconnected, which increases the likelihood that events or conditions in one region or country will adversely affect markets or issuers in other regions or countries, including the United States. These disruptions could prevent a Fund from executing advantageous investment decisions in a timely manner and negatively impact a Fund’s ability to achieve its investment objective(s). Any such event(s) could have a significant adverse impact on the value of a Fund. In addition, these disruptions could also impair the information technology and other operational systems upon which the Fund’s service providers, including the Adviser or the subadviser (as applicable), rely, and could otherwise disrupt the ability of employees of the Fund’s service providers to perform essential tasks on behalf of the Fund. Adverse weather conditions may also have a particularly significant negative effect on issuers in the agricultural sector and on insurance and reinsurance companies that insure or reinsure against the impact of natural disasters.
A number of countries in the European Union (the “EU”) have experienced, and may continue to experience, severe economic and financial difficulties. In particular, many EU nations are susceptible to economic risks associated with high levels of debt. Many non-governmental issuers, and even certain governments, have defaulted on, or been forced to restructure, their debts. Many other issuers have faced difficulties obtaining credit or refinancing existing obligations. Financial institutions have in many cases required government or central bank support, have needed to raise capital, and/or have been impaired in their ability to extend credit. As a result, financial markets in the EU have experienced extreme volatility and declines in asset values and liquidity. These difficulties may continue, worsen, or spread further within the EU. Responses to these financial problems by European governments, central banks, and others, including austerity measures and reforms, may not work, may result in social unrest, and may limit future growth and economic recovery or have other unintended consequences. Among other things, these developments have adversely affected the value and exchange rate of the euro and pound sterling, and may continue to significantly affect the economies of all EU countries, which in turn may have a material adverse effect on the Fund’s investments in such countries, other countries that depend on EU countries for significant amounts of trade or investment, or issuers with exposure to debt issued by certain EU countries.
Real Estate Investing
The Fund may invest in equity and debt securities of real estate-related companies. Such companies may include those in the real estate industry or real estate-related industries. These securities may include common stocks, corporate bonds, preferred stocks, and other equity securities, including, but not limited to, mortgage-backed securities, real estate-backed securities, securities of REITs and similar REIT-like entities. A REIT is a trust that invests in real estate-related projects, such as properties, mortgage loans, and construction loans. REITs are generally categorized as equity, mortgage, or hybrid REITs. A REIT may be listed on an exchange or traded OTC.
Counterparties
Fund transactions involving a counterparty are subject to the risk that the counterparty or a third party will not fulfill its obligation to the Fund (“counterparty risk”). Counterparty risk may arise because of the counterparty’s financial condition (i.e., financial difficulties, bankruptcy, or insolvency), market activities and developments, or other reasons, whether foreseen or not. A counterparty’s inability to fulfill its obligation may result in significant financial loss to the Fund. The Fund may be unable to recover its investment from the counterparty or may obtain a limited recovery, and/or recovery may be delayed. The extent of the Fund’s exposure to counterparty risk with respect to financial assets and liabilities approximates its carrying value. See the "Offsetting Assets and Liabilities" section of this Note for further details.
The Fund may be exposed to counterparty risk through participation in various programs, including, but not limited to, lending its securities to third parties, cash sweep arrangements whereby the Fund’s cash balance is invested in one or more types of cash management vehicles, as well as investments in, but not limited to, repurchase agreements, debt securities, and derivatives, including various types of swaps, futures and options. The Fund intends to enter into financial transactions with counterparties that the Adviser believes to be creditworthy at the time of the transaction. There is always the risk that the Adviser’s analysis of a counterparty’s creditworthiness is incorrect or may change due to market conditions. To the extent that the Fund focuses its transactions with a limited number of counterparties, it will have greater exposure to the risks associated with one or more counterparties.
Janus Henderson Contrarian Fund
Notes to Financial Statements (unaudited)
Securities Lending
Under procedures adopted by the Trustees, the Fund may seek to earn additional income by lending securities to certain qualified broker-dealers and institutions. JPMorgan Chase Bank, National Association acts as securities lending agent and a limited purpose custodian or subcustodian to receive and disburse cash balances and cash collateral, hold short-term investments, hold collateral, and perform other custodial functions in accordance with the Non-Custodial Securities Lending Agreement. For financial reporting purposes, the Fund does not offset financial instruments’ payables and receivables and related collateral on the Statement of Assets and Liabilities. The Fund may lend fund securities in an amount equal to up to 1/3 of its total assets as determined at the time of the loan origination. There is the risk of delay in recovering a loaned security or the risk of loss in collateral rights if the borrower fails financially. In addition, the Adviser makes efforts to balance the benefits and risks from granting such loans. All loans will be continuously secured by collateral which may consist of cash, U.S. Government securities, domestic and foreign short-term debt instruments, letters of credit, time deposits, repurchase agreements, money market mutual funds or other money market accounts, or such other collateral as permitted by the Securities and Exchange Commission (the "SEC"). If the Fund is unable to recover a security on loan, the Fund may use the collateral to purchase replacement securities in the market. There is a risk that the value of the collateral could decrease below the cost of the replacement security by the time the replacement investment is made, resulting in a loss to the Fund. In certain circumstances individual loan transactions could yield negative returns.
Upon receipt of cash collateral, the Adviser may invest it in affiliated or non-affiliated cash management vehicles, whether registered or unregistered entities, as permitted by the 1940 Act and rules promulgated thereunder. The Adviser currently intends to primarily invest the cash collateral in a cash management vehicle for which the Adviser serves as investment adviser, Janus Henderson Cash Collateral Fund LLC, or in time deposits. An investment in Janus Henderson Cash Collateral Fund LLC is generally subject to the same risks that shareholders experience when investing in similarly structured vehicles, such as the potential for significant fluctuations in assets as a result of the purchase and redemption activity of the securities lending program, a decline in the value of the collateral, and possible liquidity issues. Such risks may delay the return of the cash collateral and cause the Fund to violate its agreement to return the cash collateral to a borrower in a timely manner. As adviser to the Fund and Janus Henderson Cash Collateral Fund LLC, the Adviser has an inherent conflict of interest as a result of its fiduciary duties to both the Fund and Janus Henderson Cash Collateral Fund LLC. Additionally, the Adviser receives an investment advisory fee of 0.05% for managing Janus Henderson Cash Collateral Fund LLC, but it may not receive a fee for managing certain other affiliated cash management vehicles in which the Fund may invest, and therefore may have an incentive to allocate preferred investment opportunities to investment vehicles for which it is receiving a fee.
The value of the collateral must be at least 102% of the market value of the loaned securities that are denominated in U.S. dollars and 105% of the market value of the loaned securities that are not denominated in U.S. dollars. Loaned securities and related collateral are marked-to-market each business day based upon the market value of the loaned securities at the close of business, employing the most recent available pricing information. Collateral levels are then adjusted based on this mark-to-market evaluation. Additional required collateral, or excess collateral returned, is delivered on the next business day. Therefore, the value of the collateral held may be temporarily less than 102% or 105% value of the securities on loan. The cash collateral invested by the Adviser is disclosed in the Schedule of Investments (if applicable).
Income earned from the investment of the cash collateral, net of rebates paid to, or fees paid by, borrowers and less the fees paid to the lending agent are included as “Affiliated securities lending income, net” on the Statement of Operations.
There were no securities on loan as of March 31, 2023.
4. Investment Advisory Agreements and Other Transactions with Affiliates
The Fund pays the Adviser an investment advisory fee rate that may adjust up or down based on the Fund’s performance relative to its benchmark index.
The investment advisory fee rate paid to the Adviser by the Fund consists of two components: (1) a base fee calculated by applying the contractual fixed rate of the advisory fee to the Fund’s average daily net assets during the previous month (the “Base Fee Rate”), plus or minus (2) a performance-fee adjustment (the “Performance Adjustment”) calculated by applying a variable rate of up to 0.15% (positive or negative) to the Fund’s average daily net assets based on the Fund’s relative performance compared to the cumulative investment record of its benchmark index over a 36-
Janus Henderson Contrarian Fund
Notes to Financial Statements (unaudited)
month performance measurement period or shorter time period, as applicable. The investment advisory fee rate is calculated daily and paid monthly.
The investment performance of the Fund’s Class A Shares (waiving the upfront sales load) for the performance measurement period is used to calculate the Performance Adjustment. The Fund’s Base Fee Rate prior to any performance adjustment (expressed as an annual rate) is 0.64%, and the Fund’s benchmark index used in the calculation is the S&P 500® Index.
No Performance Adjustment is applied unless the difference between the Fund’s investment performance and the cumulative investment record of the Fund’s benchmark index is 0.50% or greater (positive or negative) during the applicable performance measurement period. The Base Fee Rate is subject to an upward or downward Performance Adjustment for every full 0.50% increment by which the Fund outperforms or underperforms its benchmark index, up to the Fund’s full performance rate of ±7.00%. Because the Performance Adjustment is tied to a Fund’s relative performance compared to its benchmark index (and not its absolute performance), the Performance Adjustment could increase the Adviser’s fee even if the Fund’s Shares lose value during the performance measurement period and could decrease the Adviser’s fee even if the Fund’s Shares increase in value during the performance measurement period. For purposes of computing the Base Fee Rate and the Performance Adjustment, net assets are averaged over different periods (average daily net assets during the previous month for the Base Fee Rate, versus average daily net assets during the performance measurement period for the Performance Adjustment). Performance of the Fund is calculated net of expenses whereas the Fund’s benchmark index does not have any fees or expenses. Reinvestment of dividends and distributions is included in calculating both the performance of a Fund and the Fund’s benchmark index.
The Fund’s prospectuses and statement(s) of additional information contain additional information about performance-based fees. The amount shown as advisory fees on the Statement of Operations reflects the Base Fee Rate plus/minus any Performance Adjustment. For the period ended March 31, 2023, the performance adjusted investment advisory fee rate before any waivers and/or reimbursements of expenses is 0.57%.
The Adviser has contractually agreed to waive the investment advisory fee and/or reimburse operating expenses to the extent that the Fund’s total annual fund operating expenses, excluding any performance adjustments to management fees (if applicable), the fees payable pursuant to a Rule 12b-1 plan, shareholder servicing fees, such as transfer agency fees (including out-of-pocket costs), administrative services fees and any networking/omnibus payable by any share class, brokerage commissions, interest, dividends, taxes, acquired fund fees and expenses, and extraordinary expenses, exceed the annual rate of 0.75% of the Fund’s average daily net assets. The Adviser has agreed to continue the waivers for at least a one-year period commencing January 27, 2023. If applicable, amounts waived and/or reimbursed to the Fund by the Adviser are disclosed as “Excess Expense Reimbursement and Waivers” on the Statement of Operations.
The Adviser serves as administrator to the Fund pursuant to an administration agreement between the Adviser and the Trust. Under the administration agreement, the Adviser is authorized to perform, or cause others to perform certain administration, compliance, and accounting services to the Fund, including providing office space for the Fund, and is reimbursed by the Fund for certain of its costs in providing these services (to the extent the Adviser seeks reimbursement and such costs are not otherwise waived). In addition, employees of the Adviser and/or its affiliates may serve as officers of the Trust. The Fund pays for some or all of the salaries, fees, and expenses of the Adviser employees and Fund officers, with respect to certain specified administration functions they perform on behalf of the Fund. The Fund pays these costs based on out-of-pocket expenses incurred by the Adviser, and these costs are separate and apart from advisory fees and other expenses paid in connection with the investment advisory services the Adviser (or any subadvisor, as applicable) provides to the Fund. These amounts are disclosed as “Affiliated fund administration fees” on the Statement of Operations. In addition, some expenses related to compensation payable to the Fund’s Chief Compliance Officer and certain compliance staff, all of whom are employees of the Adviser and/or its affiliates, are shared with the Fund. Total compensation of $114,430 was paid to the Chief Compliance Officer and certain compliance staff by the Trust during the period ended March 31, 2023. The Fund's portion is reported as part of “Other expenses” on the Statement of Operations.
Janus Henderson Services US LLC (the “Transfer Agent”), a wholly-owned subsidiary of the Adviser, is the Fund’s transfer agent. The Transfer Agent provides or arranges for the provision of shareholder services including, but not limited to, recordkeeping, subaccounting, answering inquiries regarding accounts, order processing, transaction confirmations, the mailing of prospectuses and shareholder reports, and other shareholder services provided to or on
Janus Henderson Contrarian Fund
Notes to Financial Statements (unaudited)
behalf of shareholders. These amounts are disclosed as “Transfer agent administrative fees and expenses” on the Statement of Operations.
Class D Shares of the Fund pay the Transfer Agent an annual administrative services fee based on the average daily net assets of Class D Shares as detailed below.
| | |
Average Daily Net Assets of Class D Shares of the Janus Henderson funds | Administrative Services Fee |
Under $40 billion | 0.12% |
$40 billion – $49.9 billion | 0.10% |
Over $49.9 billion | 0.08% |
During the reporting period, the administrative services fee rate was 0.12%.
The Transfer Agent receives an administrative services fee at an annual rate of up to 0.25% of the average daily net assets of the Fund’s Class R Shares, Class S Shares, and Class T Shares for providing or procuring administrative services to investors in Class R Shares, Class S Shares, and Class T Shares of the Fund. The Transfer Agent expects to use all or a significant portion of this fee to compensate retirement plan service providers, broker-dealers, bank trust departments, financial advisors, and other financial intermediaries for providing these services. The Transfer Agent may keep certain amounts retained for reimbursement of out-of-pocket costs incurred for servicing clients of Class R Shares, Class S Shares, and Class T Shares.
Shareholder Services provided by these financial intermediaries may include, but are not limited to, recordkeeping, subaccounting, order processing, providing order confirmations, periodic statements, forwarding prospectuses, shareholder reports, and other materials to existing customers, answering inquiries regarding accounts, and other administrative services. Order processing includes the submission of transactions through the National Securities Clearing Corporation (“NSCC”) or similar systems, or those processed on a manual basis with the Adviser. For all share classes, the Transfer Agent also seeks reimbursement for costs it incurs as transfer agent and for providing servicing.
Certain, but not all, intermediaries may charge administrative fees to investors in Class A Shares, Class C Shares, and Class I Shares for administrative services provided on behalf of such investors. These administrative fees are paid by the Class A Shares, Class C Shares, and Class I Shares of the Fund to the Transfer Agent, which uses such fees to reimburse intermediaries. Consistent with the Transfer Agency Agreement between the Transfer Agent and the Fund, the Transfer Agent may negotiate the level, structure, and/or terms of the administrative fees with intermediaries requiring such fees on behalf of the Fund. The Adviser and its affiliates benefit from an increase in assets that may result from such relationships. The Adviser has agreed to limit these fees up to 0.20% for Class A Shares and Class C Shares, and up to 0.15% for Class I Shares on an annual basis based on the daily net assets of each share class. Such limits are subject to change by the Trustees in the future. These amounts are disclosed as “Transfer agent networking and omnibus fees” on the Statement of Operations.
The Transfer Agent is not compensated for its services related to the shares, except for out-of-pocket costs, although the Transfer Agent is compensated for its services related to Fund’s Class D Shares. These amounts are disclosed as “Other transfer agent fees and expenses” on the Statement of Operations.
Under distribution and shareholder servicing plans (the “Plans”) adopted in accordance with Rule 12b-1 under the 1940 Act, the Fund pays the Trust’s distributor, the Distributor, a wholly-owned subsidiary of the Adviser, a fee for the sale and distribution and/or shareholder servicing of the shares based on the average daily net assets for each share class at an annual rate of up to 0.25% for Class A Shares, up to 1.00% for Class C Shares, of up to 0.50% of the Class R Shares' average daily net assets, and up to 0.25% for Class S Shares. Under the terms of the Plans, the Trust is authorized to make payments to the Distributor for remittance to retirement plan service providers, broker-dealers, bank trust departments, financial advisors, and other financial intermediaries, as compensation for distribution and/or shareholder services performed by such entities for their customers who are investors in the Fund. These amounts are disclosed as “12b-1 Distribution and shareholder servicing fees” on the Statement of Operations.
Class A Shares include a 5.75% upfront sales charge of the offering price of the Fund. The sales charge is allocated between the Distributor and financial intermediaries. During the period ended March 31, 2023, the Distributor retained upfront sales charges of $6,062.
Janus Henderson Contrarian Fund
Notes to Financial Statements (unaudited)
A contingent deferred sales charge (“CDSC”) of 1.00% will be deducted with respect to Class A Shares purchased without a sales load and redeemed within 12 months of purchase, unless waived. Any applicable CDSC will be 1.00% of the lesser of the original purchase price or the value of the redemption of the Class A Shares redeemed. There were no CDSCs paid by redeeming shareholders of Class A Shares to the Distributor during the period ended March 31, 2023.
A CDSC of 1.00% will be deducted with respect to Class C Shares redeemed within 12 months of purchase, unless waived. Any applicable CDSC will be 1.00% of the lesser of the original purchase price or the value of the redemption of the Class C Shares redeemed. During the period ended March 31, 2023, redeeming shareholders of Class C Shares paid CDSCs of $2,148.
The Board of Trustees has adopted a deferred compensation plan (the “Deferred Plan”) for independent Trustees to elect to defer receipt of all or a portion of the annual compensation they are entitled to receive from the Fund. All deferred fees are credited to an account established in the name of the Trustees. The amounts credited to the account then increase or decrease, as the case may be, in accordance with the performance of one or more of the Janus Henderson funds that are selected by the Trustees. The account balance continues to fluctuate in accordance with the performance of the selected fund or funds until final payment of all amounts are credited to the account. The fluctuation of the account balance is recorded by the Fund as unrealized appreciation/(depreciation) and is included as of March 31, 2023 on the Statement of Assets and Liabilities in the asset, “Trustees’ deferred compensation,” and liability, “Trustees’ deferred compensation fees.” Additionally, the recorded unrealized appreciation/(depreciation) is included in “Total distributable earnings (loss)” on the Statement of Assets and Liabilities. Deferred compensation expenses for the period ended March 31, 2023 are included in “Trustees’ fees and expenses” on the Statement of Operations. Trustees are allowed to change their designation of mutual funds from time to time. Amounts will be deferred until distributed in accordance with the Deferred Plan. Deferred fees of $205,688 were paid by the Trust to the Trustees under the Deferred Plan during the period ended March 31, 2023.
Pursuant to the provisions of the 1940 Act and related rules, the Fund may participate in an affiliated or non-affiliated cash sweep program. In the cash sweep program, uninvested cash balances of the Fund may be used to purchase shares of affiliated or non-affiliated money market funds or cash management pooled investment vehicles that operate as money market funds. The Fund is eligible to participate in the cash sweep program (the “Investing Funds”). The Adviser has an inherent conflict of interest because of its fiduciary duties to the affiliated money market funds or cash management pooled investment vehicles and the Investing Funds. Janus Henderson Cash Liquidity Fund LLC (the “Sweep Vehicle”) is an affiliated unregistered cash management pooled investment vehicle that invests primarily in highly-rated short-term fixed-income securities. The Sweep Vehicle operates pursuant to the provisions of the 1940 Act that govern the operation of money market funds and prices its shares at NAV reflecting market-based values of its portfolio securities (i.e., a “floating” NAV) rounded to the fourth decimal place (e.g., $1.0000). The Sweep Vehicle is permitted to impose a liquidity fee (of up to 2%) on redemptions from the Sweep Vehicle or a redemption gate that temporarily suspends redemptions from the Sweep Vehicle for up to 10 business days during a 90 day period. There are no restrictions on the Fund's ability to withdraw investments from the Sweep Vehicle at will, and there are no unfunded capital commitments due from the Fund to the Sweep Vehicle. The Sweep Vehicle does not charge any management fee, sales charge or service fee.
Any purchases and sales, realized gains/losses and recorded dividends from affiliated investments during the period ended March 31, 2023 can be found in the “Schedules of Affiliated Investments” located in the Schedule of Investments.
Janus Henderson Contrarian Fund
Notes to Financial Statements (unaudited)
As of March 31, 2023, shares of the Fund were owned by affiliates of the Adviser, and/or other funds advised by the Adviser, as indicated in the table below:
| | | | | | |
Class | % of Class Owned | | % of Fund Owned | | |
Class A Shares | - | % | - | % | |
Class C Shares | - | | - | | |
Class D Shares | - | | - | | |
Class I Shares | - | | - | | |
Class N Shares | 30 | | 1 | | |
Class R Shares | - | | - | | |
Class S Shares | - | | - | | |
Class T Shares | - | | - | | |
| | | | | | |
The Fund is permitted to purchase or sell securities (“cross-trade”) between itself and other funds or accounts managed by the Adviser in accordance with Rule 17a-7 under the Investment Company Act of 1940 (“Rule 17a-7”), when the transaction is consistent with the investment objectives and policies of the Fund and in accordance with the Internal Cross Trade Procedures adopted by the Trust’s Board of Trustees. These procedures have been designed to ensure that any cross-trade of securities by the Fund from or to another fund or account that is or could be considered an affiliate of the Fund under certain limited circumstances by virtue of having a common investment adviser, common Officer, or common Trustee complies with Rule 17a-7. Under these procedures, each cross-trade is effected at the current market price to save costs where allowed. During the period ended March 31, 2023, the Fund engaged in cross trades amounting to $8,680,390 in purchases.
5. Federal Income Tax
Income and capital gains distributions are determined in accordance with income tax regulations that may differ from US GAAP. These differences are due to differing treatments for items such as net short-term gains, deferral of wash sale losses, foreign currency transactions, net investment losses, and capital loss carryovers.
The Fund has elected to treat gains and losses on forward foreign currency contracts as capital gains and losses, if applicable. Other foreign currency gains and losses on debt instruments are treated as ordinary income for federal income tax purposes pursuant to Section 988 of the Internal Revenue Code.
The aggregate cost of investments and the composition of unrealized appreciation and depreciation of investment securities for federal income tax purposes as of March 31, 2023 are noted below. The primary differences between book and tax appreciation or depreciation of investments are wash sale loss deferrals and investments in partnerships.
| | | | |
Federal Tax Cost | Unrealized
Appreciation | Unrealized
(Depreciation) | Net Tax Appreciation/
(Depreciation) |
$ 3,733,371,302 | $866,035,891 | $(205,031,919) | $ 661,003,972 |
Janus Henderson Contrarian Fund
Notes to Financial Statements (unaudited)
6. Capital Share Transactions
| | | | | | | |
| | | | | | |
| | Period ended March 31, 2023 | | Year ended September 30, 2022 |
| | Shares | Amount | | Shares | Amount |
| | | | | | | |
Class A Shares: | | | | | |
Shares sold | 307,182 | $ 7,296,322 | | 1,152,866 | $ 31,636,833 |
Reinvested dividends and distributions | 5,300 | 120,670 | | 164,479 | 4,559,347 |
Shares repurchased | (484,032) | (11,283,290) | | (707,120) | (18,301,700) |
Net Increase/(Decrease) | (171,550) | $ (3,866,298) | | 610,225 | $ 17,894,480 |
Class C Shares: | | | | | |
Shares sold | 57,334 | $ 1,203,090 | | 617,444 | $ 15,569,116 |
Reinvested dividends and distributions | - | - | | 90,315 | 2,258,775 |
Shares repurchased | (223,768) | (4,669,962) | | (283,921) | (6,686,022) |
Net Increase/(Decrease) | (166,434) | $ (3,466,872) | | 423,838 | $ 11,141,869 |
Class D Shares: | | | | | |
Shares sold | 1,125,072 | $ 27,102,882 | | 3,662,392 | $103,307,288 |
Reinvested dividends and distributions | 516,912 | 11,821,791 | | 9,388,581 | 261,472,004 |
Shares repurchased | (3,523,136) | (83,885,434) | | (7,821,632) | (213,214,346) |
Net Increase/(Decrease) | (1,881,152) | $ (44,960,761) | | 5,229,341 | $151,564,946 |
Class I Shares: | | | | | |
Shares sold | 6,126,687 | $ 145,959,629 | | 29,363,877 | $803,303,253 |
Reinvested dividends and distributions | 171,713 | 3,925,364 | | 2,326,660 | 64,774,205 |
Shares repurchased | (12,624,925) | (297,375,669) | | (17,300,101) | (457,710,119) |
Net Increase/(Decrease) | (6,326,525) | $(147,490,676) | | 14,390,436 | $410,367,339 |
Class N Shares: | | | | | |
Shares sold | 652,619 | $ 15,181,955 | | 2,203,210 | $ 63,036,485 |
Reinvested dividends and distributions | 24,281 | 553,853 | | 333,560 | 9,266,301 |
Shares repurchased | (1,109,347) | (26,134,895) | | (1,051,858) | (27,598,944) |
Net Increase/(Decrease) | (432,447) | $ (10,399,087) | | 1,484,912 | $ 44,703,842 |
Class R Shares: | | | | | |
Shares sold | 8,181 | $ 183,043 | | 43,552 | $ 1,187,322 |
Reinvested dividends and distributions | - | - | | 6,157 | 163,350 |
Shares repurchased | (20,458) | (456,067) | | (16,025) | (375,998) |
Net Increase/(Decrease) | (12,277) | $ (273,024) | | 33,684 | $ 974,674 |
Class S Shares: | | | | | |
Shares sold | 16,383 | $ 387,065 | | 56,730 | $ 1,672,145 |
Reinvested dividends and distributions | 112 | 2,546 | | 5,902 | 163,299 |
Shares repurchased | (8,874) | (199,165) | | (18,824) | (504,794) |
Net Increase/(Decrease) | 7,621 | $ 190,446 | | 43,808 | $ 1,330,650 |
Class T Shares: | | | | | |
Shares sold | 1,156,847 | $ 27,835,527 | | 5,894,110 | $168,434,652 |
Reinvested dividends and distributions | 164,102 | 3,749,719 | | 3,963,364 | 110,260,797 |
Shares repurchased | (3,381,011) | (80,030,190) | | (8,559,479) | (234,168,169) |
Net Increase/(Decrease) | (2,060,062) | $ (48,444,944) | | 1,297,995 | $ 44,527,280 |
7. Purchases and Sales of Investment Securities
For the period ended March 31, 2023, the aggregate cost of purchases and proceeds from sales of investment securities (excluding any short-term securities, short-term options contracts, TBAs, and in-kind transactions, as applicable) was as follows:
| | | | |
Purchases of
Securities | Proceeds from Sales
of Securities | Purchases of Long-
Term U.S. Government
Obligations | Proceeds from Sales
of Long-Term U.S.
Government Obligations |
$876,562,465 | $1,160,775,543 | $ - | $ - |
Janus Henderson Contrarian Fund
Notes to Financial Statements (unaudited)
8. Subsequent Event
Management has evaluated whether any events or transactions occurred subsequent to March 31, 2023 and through the date of issuance of the Fund’s financial statements and determined that there were no material events or transactions that would require recognition or disclosure in the Fund’s financial statements.
Janus Henderson Contrarian Fund
Additional Information (unaudited)
Proxy Voting Policies and Voting Record
A description of the policies and procedures that the Fund uses to determine how to vote proxies relating to its portfolio securities is available without charge: (i) upon request, by calling 1-800-525-1093; (ii) on the Fund’s website at janushenderson.com/proxyvoting; and (iii) on the SEC’s website at http://www.sec.gov. Additionally, information regarding the Fund’s proxy voting record for the most recent twelve-month period ended June 30 is also available, free of charge, through janushenderson.com/proxyvoting and from the SEC’s website at http://www.sec.gov.
Full Holdings
The Fund files its complete portfolio holdings (schedule of investments) with the SEC as an exhibit to Form N-PORT within 60 days of the end of the first and third fiscal quarters, and in the annual report and semiannual report to shareholders. The Fund’s Form N-PORT filings and annual and semiannual reports: (i) are available on the SEC’s website at http://www.sec.gov; and (ii) are available without charge, upon request, by calling a Janus Henderson representative at 1-877-335-2687 (toll free) (or 1-800-525-3713 if you hold Class D Shares). Portfolio holdings consisting of at least the names of the holdings are generally available on a monthly basis with a 30-day lag under Full Holdings for the Fund at janushenderson.com/info (or janushenderson.com/reports if you hold Class D Shares).
APPROVAL OF ADVISORY AGREEMENTS DURING THE PERIOD
The Trustees of Janus Aspen Series, each of whom serves as an “independent” Trustee (the “Trustees”), oversee the management of each portfolio of Janus Aspen Series (each, a “VIT Portfolio,” and collectively, the “VIT Portfolios”), as well as each fund of Janus Investment Fund (each, a “Fund,” and collectively, the “Funds” and together with the VIT Portfolios, the “Janus Henderson Funds,” and each, a “Janus Henderson Fund”). As required by law, the Trustees determine annually whether to continue the investment advisory agreement for each Janus Henderson Fund.
In connection with their most recent consideration of those agreements for each Janus Henderson Fund, the Trustees received and reviewed information provided by Janus Henderson Investors US LLC (the “Adviser”) in response to requests of the Trustees and their independent legal counsel. They also received and reviewed information and analysis provided by, and in response to requests of, their independent fee consultant. Throughout their consideration of the agreements, the Trustees were advised by their independent legal counsel. The Trustees met with management to consider the agreements, and also met separately in executive session with their independent legal counsel and their independent fee consultant.
At meetings held on November 9-10, 2022 and December 13-14, 2022, the Trustees evaluated the information provided by the Adviser and the independent fee consultant, as well as other information provided by the Adviser and the independent fee consultant during the year. Following such evaluation, the Trustees determined that the overall arrangements between each Janus Henderson Fund and the Adviser were fair and reasonable in light of the nature, extent, and quality of the services provided by the Adviser and its affiliates, the fees charged for those services, and other matters that the Trustees considered relevant in the exercise of their business judgment, and unanimously approved the continuation of the investment advisory agreement for each Janus Henderson Fund for the period from February 1, 2023 through February 1, 2024, subject to earlier termination as provided for in each agreement.
In considering the continuation of those agreements, the Trustees reviewed and analyzed various factors that they determined were relevant, including the factors described below, none of which by itself was considered dispositive. However, the material factors and conclusions that formed the basis for the Trustees’ determination to approve the continuation of the agreements are discussed separately below. Also included is a summary of the independent fee consultant’s conclusions and opinions that arose during, and were included as part of, the Trustees’ consideration of the agreements. “Management fees,” as used herein, reflect actual annual advisory fees and, for the purpose of peer comparisons any administration fees (excluding out of pocket costs), net of any waivers, paid by a fund as a percentage of average net assets.
Nature, Extent and Quality of Services
The Trustees reviewed the nature, extent, and quality of the services provided by the Adviser to the Janus Henderson Funds, taking into account the investment objective, strategies, and policies of each Janus Henderson Fund, and the knowledge the Trustees gained from their regular meetings with management on at least a quarterly basis and their ongoing review of information related to the Janus Henderson Funds. In addition, the Trustees reviewed the resources and key personnel of the Adviser, particularly noting those employees who provide investment and risk management services to the Janus Henderson Funds. The Trustees also considered other services provided to the Janus Henderson
Janus Henderson Contrarian Fund
Additional Information (unaudited)
Funds by the Adviser, such as managing the execution of portfolio transactions and the selection of broker-dealers for those transactions. The Trustees considered the Adviser’s role as administrator to the Janus Henderson Funds, noting that the Adviser generally does not receive a fee for its services as administrator, but is reimbursed for its out-of-pocket costs. The Trustees considered the role of the Adviser in monitoring adherence to the Janus Henderson Funds’ investment restrictions, providing support services for the Trustees and Trustee committees, and overseeing communications with Janus Henderson Fund shareholders and the activities of other service providers, including monitoring compliance with various policies and procedures of the Janus Henderson Funds and with applicable securities laws and regulations.
In this regard, the independent fee consultant noted that the Adviser provides a number of different services for the Janus Henderson Funds and their shareholders, ranging from investment management services to various other servicing functions, and that, in its view, the Adviser is a capable provider of those services. The independent fee consultant also provided its belief that the Adviser has developed a number of institutional competitive advantages that should enable it to provide superior investment and service performance over the long term.
The Trustees concluded that the nature, extent, and quality of the services provided by the Adviser to each Janus Henderson Fund were appropriate and consistent with the terms of the respective advisory agreements, and that, taking into account steps taken to address those Janus Henderson Funds whose performance lagged that of their peers for certain periods, the Janus Henderson Funds were likely to benefit from the continued provision of those services. They also concluded that the Adviser had sufficient personnel, with the appropriate education and experience, to serve the Janus Henderson Funds effectively and had demonstrated its ability to attract well-qualified personnel.
Performance of the Funds
The Trustees considered the performance results of each Janus Henderson Fund over various time periods. They noted that they considered Janus Henderson Fund performance data throughout the year, including periodic meetings with each Janus Henderson Fund’s portfolio manager(s), and also reviewed information comparing each Janus Henderson Fund’s performance with the performance of comparable fund peer groups identified by Broadridge Financial Solutions, Inc. (“Broadridge”), an independent data provider, and with the Janus Henderson Fund’s benchmark index. In this regard, the independent fee consultant found that the overall Janus Henderson Funds’ performance has been reasonable, noting that: (i) for the 36 months ended May 31, 2022, approximately 38% of the Janus Henderson Funds were in the top two quartiles of their Broadridge peer groups; (ii) for the 36 months ended September 30, 2022, approximately 45% of the Janus Henderson Funds were in the top two quartiles of performance as reported by Morningstar, and (iii) for the 12 months ended September 30, 2022, approximately 55% of the Janus Henderson Funds were in the top two quartiles of performance as reported by Morningstar.
The Trustees considered the performance of each Janus Henderson Fund, noting that performance may vary by share class, and noted the following with respect to the Funds:
Asset Allocation Funds
· For Janus Henderson Global Allocation Fund – Conservative, the Trustees noted that the Fund’s performance was in the third Broadridge quartile for the 36 months ended May 31, 2022 and the bottom Broadridge quartile for the 12 months ended May 31, 2022. The Trustees noted the reasons for the Fund’s underperformance and the steps the Adviser had taken or was taking to improve performance.
· For Janus Henderson Global Allocation Fund – Growth, the Trustees noted that the Fund’s performance was in the bottom Broadridge quartile for the 36 months ended May 31, 2022 and the bottom Broadridge quartile for the 12 months ended May 31, 2022. The Trustees noted the reasons for the Fund’s underperformance and the steps the Adviser had taken or was taking to improve performance.
· For Janus Henderson Global Allocation Fund – Moderate, the Trustees noted that the Fund’s performance was in the bottom Broadridge quartile for the 36 months ended May 31, 2022 and the bottom Broadridge quartile for the 12 months ended May 31, 2022. The Trustees noted the reasons for the Fund’s underperformance and the steps the Adviser had taken or was taking to improve performance.
Fixed-Income Funds
· For Janus Henderson Absolute Return Income Opportunities Fund, the Trustees noted that the Fund’s performance was in the third Broadridge quartile for the 36 months ended May 31, 2022 and the first Broadridge quartile for the 12 months ended May 31, 2022. The Trustees noted the reasons for the Fund’s underperformance,
Janus Henderson Contrarian Fund
Additional Information (unaudited)
the steps the Adviser had taken or was taking to improve performance, and that the performance trend was improving.
· For Janus Developed World Bond Fund, the Trustees noted that the Fund’s performance was in the bottom Broadridge quartile for the 36 months ended May 31, 2022 and the bottom Broadridge quartile for the 12 months ended May 31, 2022. The Trustees noted the reasons for the Fund’s underperformance and the steps the Adviser had taken or was taking to improve performance.
· For Janus Henderson Flexible Bond Fund, the Trustees noted that the Fund’s performance was in the first Broadridge quartile for the 36 months ended May 31, 2022 and the second Broadridge quartile for the 12 months ended May 31, 2022.
· For Janus Henderson Global Bond Fund, the Trustees noted that the Fund’s performance was in the third Broadridge quartile for the 36 months ended May 31, 2022 and the bottom Broadridge quartile for the 12 months ended May 31, 2022. The Trustees noted the reasons for the Fund’s underperformance and the steps the Adviser had taken or was taking to improve performance.
· For Janus Henderson High-Yield Fund, the Trustees noted that the Fund’s performance was in the third Broadridge quartile for the 36 months ended May 31, 2022 and the bottom Broadridge quartile for the 12 months ended May 31, 2022. The Trustees noted the reasons for the Fund’s underperformance and the steps the Adviser had taken or was taking to improve performance.
· For Janus Henderson Multi-Sector Income Fund, the Trustees noted that the Fund’s performance was in the second Broadridge quartile for the 36 months ended May 31, 2022 and the third Broadridge quartile for the 12 months ended May 31, 2022.
· For Janus Henderson Short Duration Flexible Bond Fund, the Trustees noted that the Fund’s performance was in the third Broadridge quartile for the 36 months ended May 31, 2022 and the bottom Broadridge quartile for the 12 months ended May 31, 2022. The Trustees noted the reasons for the Fund’s underperformance and the steps the Adviser had taken or was taking to improve performance.
Global and International Equity Funds
· For Janus Henderson Asia Equity Fund, the Trustees noted that the Fund’s performance was in the third Broadridge quartile for the 36 months ended May 31, 2022 and the third Broadridge quartile for the 12 months ended May 31, 2022. The Trustees noted the reasons for the Fund’s underperformance, while also noting that the Fund has a performance fee structure that results in lower management fees during periods of underperformance, and the steps the Adviser had taken or was taking to improve performance.
· For Janus Henderson Emerging Markets Fund, the Trustees noted that the Fund’s performance was in the third Broadridge quartile for the 36 months ended May 31, 2022 and the third Broadridge quartile for the 12 months ended May 31, 2022. The Trustees noted the reasons for the Fund’s underperformance and the steps the Adviser had taken or was taking to improve performance.
· For Janus Henderson European Focus Fund, the Trustees noted that the Fund’s performance was in the first Broadridge quartile for the 36 months ended May 31, 2022 and the second Broadridge quartile for the 12 months ended May 31, 2022.
· For Janus Henderson Global Equity Income Fund, the Trustees noted that the Fund’s performance was in the third Broadridge quartile for the 36 months ended May 31, 2022 and the first Broadridge quartile for the 12 months ended May 31, 2022. The Trustees noted the reasons for the Fund’s underperformance, the steps the Adviser had taken or was taking to improve performance, and that the performance trend was improving.
· For Janus Henderson Global Life Sciences Fund, the Trustees noted that the Fund’s performance was in the third Broadridge quartile for the 36 months ended May 31, 2022 and the second Broadridge quartile for the 12 months ended May 31, 2022. The Trustees noted the reasons for the Fund’s underperformance, the steps the Adviser had taken or was taking to improve performance, and that the performance trend was improving.
· For Janus Henderson Global Sustainable Equity Fund, the Trustees noted that the Fund’s performance was in the second Broadridge quartile for the 12 months ended May 31, 2022. The Trustees noted that 36 month-end performance was not yet available.
Janus Henderson Contrarian Fund
Additional Information (unaudited)
· For Janus Henderson Global Real Estate Fund, the Trustees noted that the Fund’s performance was in the second Broadridge quartile for the 36 months ended May 31, 2022 and the bottom Broadridge quartile for the 12 months ended May 31, 2022.
· For Janus Henderson Global Research Fund, the Trustees noted that the Fund’s performance was in the second Broadridge quartile for the 36 months ended May 31, 2022 and the first Broadridge quartile for the 12 months ended May 31, 2022.
· For Janus Henderson Global Select Fund, the Trustees noted that the Fund’s performance was in the first Broadridge quartile for the 36 months ended May 31, 2022 and the first Broadridge quartile for the 12 months ended May 31, 2022.
· For Janus Henderson Global Technology and Innovation Fund, the Trustees noted that the Fund’s performance was in the second Broadridge quartile for the 36 months ended May 31, 2022 and the second Broadridge quartile for the 12 months ended May 31, 2022.
· For Janus Henderson International Opportunities Fund, the Trustees noted that the Fund’s performance was in the bottom Broadridge quartile for the 36 months ended May 31, 2022 and the third Broadridge quartile for the 12 months ended May 31, 2022. The Trustees noted the reasons for the Fund’s underperformance and the steps the Adviser had taken or was taking to improve performance.
· For Janus Henderson Overseas Fund, the Trustees noted that the Fund’s performance was in the first Broadridge quartile for the 36 months ended May 31, 2022 and the first Broadridge quartile for the 12 months ended May 31, 2022.
· For Janus Henderson Responsible International Dividend Fund (formerly the Janus Henderson Dividend & Income Builder Fund), the Trustees noted that the Fund’s performance was in the bottom Broadridge quartile for the 36 months ended May 31, 2022 and the bottom Broadridge quartile for the 12 months ended May 31, 2022. The Trustees noted the reasons for the Fund’s underperformance and the steps the Adviser had taken or was taking to improve performance.
Money Market Funds
· For Janus Henderson Government Money Market Fund, the Trustees noted that the Fund’s performance was in the third Broadridge quartile for the 36 months ended May 31, 2022 and the bottom Broadridge quartile for the 12 months ended May 31, 2022. The Trustees noted the reasons for the Fund’s underperformance and the steps the Adviser had taken or was taking to improve performance.
· For Janus Henderson Money Market Fund, the Trustees noted that the Fund’s performance was in the third Broadridge quartile for the 36 months ended May 31, 2022 and the bottom Broadridge quartile for the 12 months ended May 31, 2022. The Trustees noted the reasons for the Fund’s underperformance and the steps the Adviser had taken or was taking to improve performance.
Multi-Asset Funds
· For Janus Henderson Adaptive Global Allocation Fund, the Trustees noted that the Fund’s performance was in bottom Broadridge quartile for the 36 months ended May 31, 2022 and the second Broadridge quartile for the 12 months ended May 31, 2022. The Trustees noted the reasons for the Fund’s underperformance, the steps the Adviser had taken or was taking to improve performance, and that the performance trend was improving.
· For Janus Henderson Balanced Fund, the Trustees noted that the Fund’s performance was in the first Broadridge quartile for the 36 months ended May 31, 2022 and the first Broadridge quartile for the 12 months ended May 31, 2022.
U.S. Equity Funds
· For Janus Henderson Adaptive Risk Managed U.S. Equity Fund, the Trustees noted that the Fund’s performance was in the bottom Broadridge quartile for the 36 months ended May 31, 2022 and the second Broadridge quartile for the 12 months ended May 31, 2022. The Trustees noted the reasons for the Fund’s underperformance, the steps the Adviser had taken or were taking to improve performance, and that the performance trend was improving.
Janus Henderson Contrarian Fund
Additional Information (unaudited)
· For Janus Henderson Contrarian Fund, the Trustees noted that the Fund’s performance was in the first Broadridge quartile for the 36 months ended May 31, 2022 and the bottom Broadridge quartile for the 12 months ended May 31, 2022.
· For Janus Henderson Enterprise Fund, the Trustees noted that the Fund’s performance was in the second Broadridge quartile for the 36 months ended May 31, 2022 and the first Broadridge quartile for the 12 months ended May 31, 2022.
· For Janus Henderson Forty Fund, the Trustees noted that the Fund’s performance was in the third Broadridge quartile for the 36 months ended May 31, 2022 and the bottom Broadridge quartile for the 12 months ended May 31, 2022. The Trustees noted the reasons for the Fund’s underperformance and the steps the Adviser had taken or was taking to improve performance.
· For Janus Henderson Growth and Income Fund, the Trustees noted that the Fund’s performance was in the bottom Broadridge quartile for the 36 months ended May 31, 2022 and the first Broadridge quartile for the 12 months ended May 31, 2022. The Trustees noted the reasons for the Fund’s underperformance, the steps the Adviser had taken or was taking to improve performance, and that the performance trend was improving.
· For Janus Henderson Mid Cap Value Fund, the Trustees noted that the Fund’s performance was in the bottom Broadridge quartile for the 36 months ended May 31, 2022 and the second Broadridge quartile for the 12 months ended May 31, 2022. The Trustees noted the reasons for the Fund’s underperformance, while also noting that the Fund has a performance fee structure that results in lower management fees during periods of underperformance, the steps the Adviser had taken or was taking to improve performance, and that the performance trend was improving.
· For Janus Henderson Research Fund, the Trustees noted that the Fund’s performance was in the third Broadridge quartile for the 36 months ended May 31, 2022 and the third Broadridge quartile for the 12 months ended May 31, 2022. The Trustees noted the reasons for the Fund’s underperformance, while also noting that the Fund has a performance fee structure that results in lower management fees during periods of underperformance and the steps the Adviser had taken or was taking to improve performance.
· For Janus Henderson Small Cap Value Fund, the Trustees noted that the Fund’s performance was in the bottom Broadridge quartile for the 36 months ended May 31, 2022 and the second Broadridge quartile for the 12 months ended May 31, 2022. The Trustees noted the reasons for the Fund’s underperformance, while also noting that the Fund has a performance fee structure that results in lower management fees during periods of underperformance, the steps the Adviser had taken or was taking to improve performance, and that the performance trend was improving.
· For Janus Henderson Small-Mid Cap Value Fund, the Trustees noted that the Fund’s performance was in the bottom Broadridge quartile for the 36 months ended May 31, 2022 and the second Broadridge quartile for the 12 months ended May 31, 2022. The Trustees noted the reasons for the Fund’s underperformance, while also noting that the Fund has a performance fee structure that results in lower management fees during periods of underperformance, the steps the Adviser had taken or was taking to improve performance, and that the performance trend is improving.
· For Janus Henderson Triton Fund, the Trustees noted that the Fund’s performance was in the bottom Broadridge quartile for the 36 months ended May 31, 2022 and the second Broadridge quartile for the 12 months ended May 31, 2022. The Trustees noted the reasons for the Fund’s underperformance, the steps the Adviser had taken or was taking to improve performance, and that the performance trend was improving.
· For Janus Henderson Venture Fund, the Trustees noted that the Fund’s performance was in the bottom Broadridge quartile for the 36 months ended May 31, 2022 and the second Broadridge quartile for the 12 months ended May 31, 2022. The Trustees noted the reasons for the Fund’s underperformance, the steps the Adviser had taken or was taking to improve performance, and that the performance trend was improving.
In consideration of each Janus Henderson Fund’s performance, the Trustees concluded that, taking into account the factors relevant to performance, as well as other considerations, including steps taken to improve performance, as applicable, the Janus Henderson Fund’s performance warranted continuation of such Janus Henderson Fund’s investment advisory agreement.
Janus Henderson Contrarian Fund
Additional Information (unaudited)
Costs of Services Provided
The Trustees examined information regarding the fees and expenses of each Janus Henderson Fund in comparison to similar information for other comparable funds as provided by Broadridge, an independent data provider. They also reviewed an analysis of that information provided by their independent fee consultant. The independent fee consultant provided its belief that the management fees charged by the Adviser to each of the Janus Henderson Funds under the current investment advisory and administration agreements are reasonable in relation to the services provided by the Adviser. The independent fee consultant found: (1) the total expenses and management fees of the Janus Henderson Funds to be reasonable relative to other comparable mutual funds; (2) the total expenses, on average, were 6% under the average total expenses of the respective Broadridge peer group; and (3) the management fees for the Janus Henderson Funds, on average, were 5% under the average management fees for the respective Broadridge peer group. The Trustees also considered the total expenses for each share class of each Janus Henderson Fund compared to the average total expenses for its Broadridge Expense Group and to average total expenses for its Broadridge Expense Universe.
For Janus Henderson Funds with three or more years of performance history, the independent fee consultant also performed a systematic “focus list” analysis of expenses which assessed fund fees in the context of fund performance being delivered. Based on this analysis, the independent fee consultant found that the combination of service quality/performance and expenses on these individual Janus Henderson Funds was reasonable in light of performance trends, performance histories, changes in portfolio management, relative average net asset levels, and the existence of performance fees, breakpoints, and/or expense waivers on such Janus Henderson Funds.
The Trustees considered the methodology used by the Adviser in determining compensation payable to portfolio managers, the competitive environment for investment management talent, and the competitive market for mutual funds in different distribution channels.
The Trustees also reviewed management fees charged by the Adviser to comparable separate account clients and to comparable non-affiliated funds subadvised by the Adviser (for which the Adviser provides only or primarily portfolio management services). Although in most instances subadvisory and separate account fee rates for various investment strategies were lower than management fee rates for Janus Henderson Funds having a similar strategy, the Trustees considered that the Adviser noted that, under the terms of the management agreements with the Janus Henderson Funds, the Adviser performs significant additional services for the Janus Henderson Funds that it does not provide to those other clients, including administration services, oversight of the Janus Henderson Funds’ other service providers, Trustee support, regulatory compliance and numerous other services, and that, in serving the Janus Henderson Funds, the Adviser assumes many legal risks and other costs that it does not assume in servicing its other clients. Moreover, the Trustees noted that the independent fee consultant found that: (1) the management fees the Adviser charges to the Janus Henderson Funds are reasonable in relation to the management fees the Adviser charges to funds subadvised by the Adviser and to the fees the Adviser charges to its institutional separate account clients; (2) these subadvised and institutional separate accounts have different service and infrastructure needs and operate in markets very different from the retail fund market; (3) Janus Henderson mutual fund investors enjoy reasonable fees relative to the fees charged in these other markets; and (4) as part of its 2022 review, 9 of 11 Janus Henderson Funds have lower management fees than similar funds subadvised by the Adviser. The Trustees noted that for the two Janus Henderson Funds that did not, management fees for each were under the average of its 15(c) peer group.
The Trustees considered the fees for each Janus Henderson Fund for its fiscal year ended in 2021 and noted the following with regard to each Janus Henderson Fund’s total expenses, net of applicable fee waivers (the Fund’s “total expenses”) as reflected in the comparative information provided by Broadridge:
Asset Allocation Funds
· For Janus Henderson Global Allocation Fund – Conservative, the Trustees noted that, although the Fund’s total expenses exceeded the peer group average for certain share classes, overall the Fund’s total expenses were reasonable. The Trustees also noted that the Adviser has contractually agreed to limit the Fund’s expenses.
· For Janus Henderson Global Allocation Fund – Growth, the Trustees noted that, although the Fund’s total expenses exceeded the peer group average for certain share classes, overall the Fund’s total expenses were reasonable. The Trustees also noted that the Adviser has contractually agreed to limit the Fund’s expenses, although this limit did not apply because the Fund’s total expenses as shown were below the applicable fee limit.
Janus Henderson Contrarian Fund
Additional Information (unaudited)
· For Janus Henderson Global Allocation Fund – Moderate, the Trustees noted that, although the Fund’s total expenses exceeded the peer group average for one share class, overall the Fund’s total expenses were reasonable. The Trustees also noted that the Adviser has contractually agreed to limit the Fund’s expenses.
Fixed-Income Funds
· For Janus Henderson Absolute Return Income Opportunities Fund, the Trustees noted that, although the Fund’s total expenses exceeded the peer group average for certain share classes, overall the Fund’s total expenses were reasonable. The Trustees also noted that the Adviser has contractually agreed to limit the Fund’s expenses.
· For Janus Henderson Developed World Bond Fund, the Trustees noted that, although the Fund’s total expenses exceeded the peer group average for one share class, overall the Fund’s total expenses were reasonable. The Trustees also noted that the Adviser has contractually agreed to limit the Fund’s expenses.
· For Janus Henderson Flexible Bond Fund, the Trustees noted that, although the Fund’s total expenses exceeded the peer group average for certain share classes, overall the Fund’s total expenses were reasonable. The Trustees also noted that the Adviser has contractually agreed to limit the Fund’s expenses, although this limit did not apply because the Fund’s total expenses as shown were below the applicable fee limit.
· For Janus Henderson Global Bond Fund, the Trustees noted that, although the Fund’s total expenses exceeded the peer group average for certain share classes, overall the Fund’s total expenses were reasonable. The Trustees also noted that the Adviser has contractually agreed to limit the Fund’s expenses.
· For Janus Henderson High-Yield Fund, the Trustees noted that, although the Fund’s total expenses exceeded the peer group average for certain share classes, overall the Fund’s total expenses were reasonable. The Trustees also noted that the Adviser has contractually agreed to limit the Fund’s expenses.
· For Janus Henderson Multi-Sector Income Fund, the Trustees noted that, although the Fund’s total expenses exceeded the peer group average for certain share classes, overall the Fund’s total expenses were reasonable. The Trustees also noted that the Adviser has contractually agreed to limit the Fund’s expenses.
· For Janus Henderson Short Duration Flexible Bond Fund, the Trustees noted that, although the Fund’s total expenses exceeded the peer group average for certain share classes, overall the Fund’s total expenses were reasonable. The Trustees also noted that the Adviser has contractually agreed to limit the Fund’s expenses.
Global and International Equity Funds
· For Janus Henderson Asia Equity Fund, the Trustees noted that, although the Fund’s total expenses exceeded the peer group average for certain share classes, overall the Fund’s total expenses were reasonable. The Trustees also noted that the Adviser has contractually agreed to limit the Fund’s expenses.
· For Janus Henderson Emerging Markets Fund, the Trustees noted that, although the Fund’s total expenses exceeded the peer group average for certain share classes, overall the Fund’s total expenses were reasonable. The Trustees also noted that the Adviser has contractually agreed to limit the Fund’s expenses.
· For Janus Henderson European Focus Fund, the Trustees noted that, although the Fund’s total expenses exceeded the peer group average for one share class, overall the Fund’s expenses were reasonable. The Trustees also noted that the Adviser has contractually agreed to limit the Fund’s expenses.
· For Janus Henderson Global Equity Income Fund, the Trustees noted that, although the Fund’s total expenses exceeded the peer group average for one share class, overall the Fund’s total expenses were reasonable. The Trustees also noted that the Adviser has contractually agreed to limit the Fund’s expenses, although this limit did not apply because the Fund’s total expenses as shown were below the applicable fee limit.
· For Janus Henderson Global Life Sciences Fund, the Trustees noted that the Fund’s total expenses were below the peer group average for all share classes.
· For Janus Henderson Global Real Estate Fund, the Trustees noted that, although the Fund’s total expenses exceeded the peer group average for certain share classes, overall the Fund’s total expenses were reasonable. The Trustees also noted that the Adviser has contractually agreed to limit the Fund’s expenses, although this limit did not apply because the Fund’s total expenses as shown were below the applicable fee limit.
Janus Henderson Contrarian Fund
Additional Information (unaudited)
· For Janus Henderson Global Research Fund, the Trustees noted that, although the Fund’s total expenses exceeded the peer group average for one share class, overall the Fund’s total expenses were reasonable. The Trustees also noted that the Adviser has contractually agreed to limit the Fund’s expenses, although this limit did not apply because the Fund’s total expenses as shown were below the applicable fee limit.
· For Janus Henderson Global Select Fund, the Trustees noted that, although the Fund’s total expenses exceeded the peer group average for certain share classes, overall the Fund’s total expenses were reasonable. The Trustees also noted that the Adviser has contractually agreed to limit the Fund’s expenses.
· For Janus Henderson Global Sustainable Equity Fund, the Trustees noted that, although the Fund’s total expenses exceeded the peer group average for certain share classes, overall the Fund’s expenses were reasonable. The Trustees also noted that the Adviser has contractually agreed to limit the Fund’s expenses.
· For Janus Henderson Global Technology and Innovation Fund, the Trustees noted that the Fund’s total expenses were below the peer group average for all share classes.
· For Janus Henderson International Opportunities Fund, the Trustees noted that, although the Fund’s total expenses exceeded the peer group average for certain share classes, overall the Fund’s expenses were reasonable. The Trustees also noted that the Adviser has contractually agreed to limit the Fund’s expenses.
· For Janus Henderson Overseas Fund, the Trustees noted that although the Fund’s total expenses exceeded the peer group average for certain share classes, overall the Fund’s total expenses were reasonable. The Trustees also noted that the Adviser has contractually agreed to limit the Fund’s expenses, although this limit did not apply because the Fund’s total expenses as shown were below the applicable fee limit.
· For Janus Henderson Responsible International Dividend Fund (formerly the Janus Henderson Dividend & Income Builder Fund), the Trustees noted that, although the Fund’s total expenses exceeded the peer group for one share class, overall the Fund’s total expenses were reasonable. The Trustees also noted that the Adviser has contractually agreed to limit the Fund’s expenses.
Money Market Funds
· For Janus Henderson Government Money Market Fund, the Trustees noted that the Fund’s total expenses were below the peer group average for all share classes.
· For Janus Henderson Money Market Fund, the Trustees noted that the Fund’s total expenses were below the peer group average for all share classes.
Multi-Asset Funds
· For Janus Henderson Adaptive Global Allocation Fund, the Trustees noted that, that the Fund’s total expenses were below the peer group average for all share classes.
· For Janus Henderson Balanced Fund, the Trustees noted that, although the Fund’s total expenses exceeded the peer group average for certain share classes, overall the Fund’s total expenses were reasonable. The Trustees also noted that the Adviser has contractually agreed to limit the Fund’s expenses, although this limit did not apply because the Fund’s total expenses as shown were below the applicable fee limit.
U.S. Equity Funds
· For Janus Henderson Adaptive Risk Managed U.S. Equity Fund, the Trustees noted that, although the Fund’s total expenses exceeded the peer group average for certain share classes, overall the Fund’s total expenses were reasonable. The Trustees also noted that the Adviser has contractually agreed to limit the Fund’s expenses, although this limit did not apply because the Fund’s total expenses as shown were below the applicable fee limit.
· For Janus Henderson Contrarian Fund, the Trustees noted that, although the Fund’s total expenses exceeded the peer group average for all share classes, overall the Fund’s total expenses were reasonable. The Trustees also noted that the Adviser had contractually agreed to limit the Fund’s expenses.
· For Janus Henderson Enterprise Fund, the Trustees noted that, although the Fund’s total expenses exceeded the peer group average for certain share classes, overall the Fund’s total expenses were reasonable. The Trustees also noted that the Adviser has contractually agreed to limit the Fund’s expenses, although this limit did not apply because the Fund’s total expenses as shown were below the applicable fee limit.
Janus Henderson Contrarian Fund
Additional Information (unaudited)
· For Janus Henderson Forty Fund, the Trustees noted that, although the Fund’s total expenses exceeded the peer group average for certain share classes, overall the Fund’s total expenses were reasonable. The Trustees also noted that the Adviser has contractually agreed to limit the Fund’s expenses, although this limit did not apply because the Fund’s total expenses as shown were below the applicable fee limit.
· For Janus Henderson Growth and Income Fund, the Trustees noted that, although the Fund’s total expenses exceeded the peer group average for certain share classes, overall the Fund’s total expenses were reasonable. The Trustees also noted that the Adviser has contractually agreed to limit the Fund’s expenses, although this limit did not apply because the Fund’s total expenses as shown were below the applicable fee limit.
· For Janus Henderson Mid Cap Value Fund, the Trustees noted that the Fund’s total expenses were below the peer group average for all share classes.
· For Janus Henderson Research Fund, the Trustees noted that, although the Fund’s total expenses exceeded the peer group average for certain share classes, overall the Fund’s total expenses were reasonable. The Trustees also noted that the Adviser has contractually agreed to limit the Fund’s expenses.
· For Janus Henderson Small Cap Value Fund, the Trustees noted that, although the Fund’s total expenses exceeded the peer group average for one share class, overall the Fund’s total expenses were reasonable. The Trustees also noted that the Adviser has contractually agreed to limit the Fund’s expenses, although this limit did not apply because the Fund’s total expenses as shown were below the applicable fee limit.
· For Janus Henderson Small-Mid Cap Value Fund, the Trustees noted that the Fund’s total expenses were below the peer group average for all share classes.
· For Janus Henderson Triton Fund, the Trustees noted that, although the Fund’s total expenses exceeded the peer group average for one share class, overall the Fund’s total expenses were reasonable. The Trustees also noted that the Adviser has contractually agreed to limit the Fund’s expenses, although this limit did not apply because the Fund’s total expenses as shown were below the applicable fee limit.
· For Janus Henderson Venture Fund, the Trustees noted that although the Fund’s total expenses exceeded the peer group average for one share class, overall the Fund’s total expenses were reasonable. The Trustees also noted that the Adviser has contractually agreed to limit the Fund’s expenses, although this limit did not apply because the Fund’s total expenses as shown were below the applicable fee limit.
The Trustees reviewed information on the overall profitability to the Adviser and its affiliates from their relationships with the Janus Henderson Funds, and considered profitability data of other publicly traded mutual fund advisers. The Trustees recognized that profitability comparisons among fund managers are difficult because of the variation in the type of comparative information that is publicly available, and the profitability of any fund manager is affected by numerous factors, including the organizational structure of the particular fund manager, differences in complex size, difference in product mix, difference in types of business (mutual fund, institutional and other), differences in the types of funds and other accounts it manages, possible other lines of business, the methodology for allocating expenses and the fund manager’s capital structure and cost of capital.
Additionally, the Trustees considered the estimated profitability to the Adviser from the investment management services it provided to each Janus Henderson Fund. In their review, the Trustees considered whether the Adviser receive adequate incentives and resources to manage the Janus Henderson Funds effectively. In reviewing profitability, the Trustees noted that the estimated profitability for an individual Janus Henderson Fund is necessarily a product of the allocation methodology utilized by the Adviser to allocate its expenses as part of the estimated profitability calculation. In this regard, the Trustees noted that the independent fee consultant found as part of its 2022 review that (1) the expense allocation methodology and rationales utilized by the Adviser were reasonable and (2) no clear correlation exists between expense allocations and operating margins. The Trustees also considered that the estimated profitability for an individual Janus Henderson Fund was influenced by a number of factors, including not only the allocation methodology selected, but also the presence of fee waivers and expense caps, and whether the Janus Henderson Fund’s investment management agreement contained breakpoints or a performance fee component. The Trustees determined, after taking into account these factors, among others, that the Adviser’s estimated profitability with respect to each Janus Henderson Fund was not unreasonable in relation to the services provided, and that the variation in the range of such estimated profitability among the Janus Henderson Funds was not a material factor in the Board’s approval of the reasonableness of any Janus Henderson Fund’s investment management fees.
Janus Henderson Contrarian Fund
Additional Information (unaudited)
The Trustees concluded that the management fees payable by each Janus Henderson Fund to the Adviser were reasonable in relation to the nature, extent, and quality of the services provided, taking into account the fees charged by other advisers for managing comparable mutual funds with similar strategies, the fees the Adviser charges to other clients, and, as applicable, the impact of fund performance on management fees payable by the Janus Henderson Funds. The Trustees also concluded that each Janus Henderson Fund’s total expenses were reasonable, taking into account the size of the Janus Henderson Fund, the quality of services provided by the Adviser, the investment performance of the Janus Henderson Fund, and any expense limitations agreed to or provided by the Adviser.
Economies of Scale
The Trustees considered information about the potential for the Adviser to realize economies of scale as the assets of the Janus Henderson Funds increase. They noted that their independent fee consultant published a report to the Trustees in June 2022 which provided its research and analysis into economies of scale. They also noted that, although many Janus Henderson Funds pay advisory fees at a fixed base rate as a percentage of net assets, without any breakpoints or performance fees, their independent fee consultant concluded that 75% of these Janus Henderson Funds’ have contractual management fees (gross of waivers) below their Broadridge Expense Group averages. The Trustees also noted the following from the independent fee consultant’s report: (1) that 31% of Janus Henderson Funds had management fee breakpoints in place whereby investors pay lower management fees as fund AUM increases; (2) that 29% of Janus Henderson Funds have low flat-rate fees and performance fees where the Adviser is incentivized to invest in resources which drive Janus Henderson Fund performance; and (3) that 39% of Janus Henderson Funds have low flat-rate fees versus peers where investors pay low fixed fees when the Janus Henderson Fund is small/midsized and higher fees when the Janus Henderson Fund grows in assets. The Trustees also noted that the Janus Henderson Funds share directly in economies of scale through the significant investments made by the Adviser and its affiliates related to services provided to the Funds and the lower charges of third-party service providers that are based in part on the combined scale of all of the Janus Henderson Funds.
The Trustees also considered the independent fee consultant’s conclusion that, given the limitations of various analytical approaches to economies of scale and their conflicting results, it is difficult to analytically confirm or deny the existence of economies of scale in the Janus Henderson complex. In this regard, the independent consultant concluded that (1) to the extent there were economies of scale at the Adviser, the Adviser’s general strategy of setting fixed management fees below peers appeared to share any such economies with investors even on smaller Janus Henderson Funds which have not yet achieved those economies and (2) by setting lower fixed fees from the start on these Janus Henderson Funds, the Adviser appeared to be investing to increase the likelihood that these Janus Henderson Funds will grow to a level to achieve any economies of scale that may exist. Further, the independent fee consultant provided its belief that Janus Henderson Fund investors are well-served by the fee levels and performance fee structures in place on the Janus Henderson Funds in light of any economies of scale that may be present at the Adviser.
Based on all of the information reviewed, including the recent and past research and analysis conducted by the Trustees’ independent fee consultant, the Trustees concluded that the current fee structure of each Janus Henderson Fund was reasonable and that the current rates of fees do reflect a sharing between the Adviser and the Janus Henderson Fund of any economies of scale that may be present at the current asset level of the Janus Henderson Fund.
Other Benefits to the Adviser
The Trustees also considered benefits that accrue to the Adviser and its affiliates from their relationships with the Janus Henderson Funds. They recognized that two affiliates of the Adviser separately serve the Janus Henderson Funds as transfer agent and distributor, respectively, and the transfer agent receives compensation directly from the non-money market Janus Henderson Funds for services provided, and that such compensation contributes to the overall profitability of the Adviser and its affiliates that results from their relationship with the Janus Henderson Funds. The Trustees also considered the Adviser’s past and proposed use of commissions paid by the Janus Henderson Funds on portfolio brokerage transactions to obtain proprietary and third-party research products and services benefiting the Janus Henderson Fund and/or other clients of the Adviser and/or the Adviser. The Trustees concluded that the Adviser’s use of these types of client commission arrangements to obtain proprietary and third-party research products and services was consistent with regulatory requirements and guidelines and was likely to benefit each Janus Henderson Fund. The Trustees also concluded that, other than the services provided by the Adviser and its affiliates pursuant to the agreements and the fees to be paid by each Janus Henderson Fund therefor, the Janus Henderson
Janus Henderson Contrarian Fund
Additional Information (unaudited)
Funds and the Adviser may potentially benefit from their relationship with each other in other ways. They concluded that the Adviser and its affiliates share directly in economies of scale through the lower charges of third-party service providers that are based in part on the combined scale of the Janus Henderson Funds and other clients serviced by the Adviser and its affiliates. They also concluded that the Adviser benefits from the receipt of research products and services acquired through commissions paid on portfolio transactions of the Janus Henderson Funds and that the Janus Henderson Funds benefit from the Adviser’s receipt of those products and services as well as research products and services acquired through commissions paid by other clients of the Adviser. They further concluded that the success of any Janus Henderson Fund could attract other business to the Adviser or other Janus Henderson Funds, and that the success of the Adviser could enhance the Adviser’s ability to serve the Janus Henderson Funds.
Janus Henderson Contrarian Fund
Liquidity Risk Management Program (unaudited)
Liquidity Risk Management Program
Rule 22e-4 under the Investment Company Act of 1940, as amended (the “Liquidity Rule”), requires open-end funds (but not money market funds) to adopt and implement a written liquidity risk management program (the “LRMP”) that is reasonably designed to assess and manage liquidity risk, which is the risk that a fund could not meet redemption requests without significant dilution of remaining investors’ interest in the fund. The Fund has implemented a LRMP, which incorporates the following elements: (i) assessment, management, and periodic review of liquidity risk; (ii) classification of portfolio holdings; (iii) the establishment and monitoring of a highly liquid investment minimum, as applicable; (iv) a 15% limitation on a Fund’s illiquid investments; (v) redemptions in-kind; and (vi) board oversight.
The Trustees of the Fund (the “Trustees”) have designated Janus Henderson Investors US LLC, the Fund’s investment adviser (the “Adviser”), as the Program Administrator for the LRMP responsible for administering the LRMP and carrying out the specific responsibilities of the LRMP. A working group comprised of various teams within the Adviser’s business is responsible for administering the LRMP and carrying out the specific responsibilities of different aspects of the LRMP (the “Liquidity Risk Working Group”). In assessing each Fund’s liquidity risk, the Liquidity Risk Working Group periodically considers, as relevant, factors including (i) the liquidity of a Fund’s portfolio investments during normal and reasonably foreseeable stressed conditions; (ii) whether a Fund’s investment strategy is appropriate for an open-end fund; (iii) the extent to which a Fund’s strategy involves a relatively concentrated portfolio or large positions in any issuer; (iv) a Fund’s use of borrowing for investment purposes; and (v) a Fund’s use of derivatives.
The Liquidity Rule requires the Trustees to review at least annually a written report provided by the Program Administrator that addresses the operation of the LRMP and assesses its adequacy and the effectiveness of its implementation, including, if applicable, the operation of the highly liquid investment minimum, and any material changes to the LRMP (the “Program Administrator Report”). At a meeting held on March 15, 2023, the Adviser provided the Program Administrator Report to the Trustees which covered the operation of the LRMP from January 1, 2022 through December 31, 2022 (the “Reporting Period”).
The Program Administrator Report discussed the operation and effectiveness of the LRMP during the Reporting Period. Among other things, the Program Administrator Report indicated that there were no material changes to the LRMP during the Reporting Period, although there were certain methodology adjustments implemented relating to a change in data provider. Additionally, the findings presented in the Program Administrator Report indicated that the LRMP operated adequately during the Reporting Period. These findings included that the Fund was able to meet redemptions during the normal course of business during the Reporting Period. The Program Administrator Report also stated that the Fund did not exceed the 15% limit on illiquid assets during the Reporting Period, that the Fund held primarily highly liquid assets, and was considered to be a primarily highly liquid fund during the Reporting Period. Also included among the Program Administrator Report’s findings was the determination that the Fund’s investment strategy remains appropriate for an open-end fund. In addition, the Adviser expressed its belief in the Program Administrator Report that the LRMP is reasonably designed and adequate to assess and manage the Fund’s liquidity risk, considering the Fund’s particular risks and circumstances, and includes policies and procedures reasonably designed to implement each required component of the Liquidity Rule.
There can be no assurance that the LRMP will achieve its objectives in the future. Please refer to your Fund’s prospectus for more information regarding the risks to which an investment in the Fund may be subject.
Janus Henderson Contrarian Fund
Useful Information About Your Fund Report (unaudited)
Performance Overviews
Performance overview graphs compare the performance of a hypothetical $10,000 investment in the Fund with one or more widely used market indices. When comparing the performance of the Fund with an index, keep in mind that market indices are not available for investment and do not reflect deduction of expenses.
Average annual total returns are quoted for a Fund with more than one year of performance history. Average annual total return is calculated by taking the growth or decline in value of an investment over a period of time, including reinvestment of dividends and distributions, then calculating the annual compounded percentage rate that would have produced the same result had the rate of growth been constant throughout the period. Average annual total return does not reflect the deduction of taxes that a shareholder would pay on Fund distributions or redemptions of Fund shares.
Cumulative total returns are quoted for a Fund with less than one year of performance history. Cumulative total return is the growth or decline in value of an investment over time, independent of the period of time involved. Cumulative total return does not reflect the deduction of taxes that a shareholder would pay on Fund distributions or redemptions of Fund shares.
Pursuant to federal securities rules, expense ratios shown in the performance chart reflect subsidized (if applicable) and unsubsidized ratios. The total annual fund operating expenses ratio is gross of any fee waivers, reflecting the Fund’s unsubsidized expense ratio. The net annual fund operating expenses ratio (if applicable) includes contractual waivers of the Adviser and reflects the Fund’s subsidized expense ratio. Ratios may be higher or lower than those shown in the “Financial Highlights” in this report.
Schedule of Investments
Following the performance overview section is the Fund’s Schedule of Investments. This schedule reports the types of securities held in the Fund on the last day of the reporting period. Securities are usually listed by type (common stock, corporate bonds, U.S. Government obligations, etc.) and by industry classification (banking, communications, insurance, etc.). Holdings are subject to change without notice.
The value of each security is quoted as of the last day of the reporting period. The value of securities denominated in foreign currencies is converted into U.S. dollars.
If the Fund invests in foreign securities, it will also provide a summary of investments by country. This summary reports the Fund exposure to different countries by providing the percentage of securities invested in each country. The country of each security represents the country of risk. A company may be allocated to a country based on other factors such as location of the company’s principal office, the location of the principal trading market for the company’s securities, or the country where a majority of the company’s revenues are derived. The Fund’s Schedule of Investments relies upon the industry group and country classifications published by Bloomberg and/or MSCI Inc.
Tables listing details of individual forward currency contracts, futures, written options, swaptions, and swaps follow the Fund’s Schedule of Investments (if applicable).
Statement of Assets and Liabilities
This statement is often referred to as the “balance sheet.” It lists the assets and liabilities of the Fund on the last day of the reporting period.
The Fund’s assets are calculated by adding the value of the securities owned, the receivable for securities sold but not yet settled, the receivable for dividends declared but not yet received on securities owned, and the receivable for Fund shares sold to investors but not yet settled. The Fund’s liabilities include payables for securities purchased but not yet settled, Fund shares redeemed but not yet paid, and expenses owed but not yet paid. Additionally, there may be other assets and liabilities such as unrealized gain or loss on forward currency contracts.
The section entitled “Net Assets Consist of” breaks down the components of the Fund’s net assets. Because the Fund must distribute substantially all earnings, you will notice that a significant portion of net assets is shareholder capital.
The last section of this statement reports the net asset value (“NAV”) per share on the last day of the reporting period. The NAV is calculated by dividing the Fund’s net assets for each share class (assets minus liabilities) by the number of shares outstanding.
Janus Henderson Contrarian Fund
Useful Information About Your Fund Report (unaudited)
Statement of Operations
This statement details the Fund’s income, expenses, realized gains and losses on securities and currency transactions, and changes in unrealized appreciation or depreciation of Fund holdings.
The first section in this statement, entitled “Investment Income,” reports the dividends earned from securities and interest earned from interest-bearing securities in the Fund.
The next section reports the expenses incurred by the Fund, including the advisory fee paid to the investment adviser, transfer agent fees and expenses, and printing and postage for mailing statements, financial reports and prospectuses. Expense offsets and expense reimbursements, if any, are also shown.
The last section lists the amounts of realized gains or losses from investment and foreign currency transactions, and changes in unrealized appreciation or depreciation of investments and foreign currency-denominated assets and liabilities. The Fund will realize a gain (or loss) when it sells its position in a particular security. A change in unrealized gain (or loss) refers to the change in net appreciation or depreciation of the Fund during the reporting period. “Net Realized and Unrealized Gain/(Loss) on Investments” is affected both by changes in the market value of Fund holdings and by gains (or losses) realized during the reporting period.
Statements of Changes in Net Assets
These statements report the increase or decrease in the Fund’s net assets during the reporting period. Changes in the Fund’s net assets are attributable to investment operations, dividends and distributions to investors, and capital share transactions. This is important to investors because it shows exactly what caused the Fund’s net asset size to change during the period.
The first section summarizes the information from the Statement of Operations regarding changes in net assets due to the Fund’s investment operations. The Fund’s net assets may also change as a result of dividend and capital gains distributions to investors. If investors receive their dividends and/or distributions in cash, money is taken out of the Fund to pay the dividend and/or distribution. If investors reinvest their dividends and/or distributions, the Fund’s net assets will not be affected.
The reinvestment of dividends and distributions is included under “Capital Share Transactions.” “Capital Shares” refers to the money investors contribute to the Fund through purchases or withdrawals via redemptions. The Fund’s net assets will increase and decrease in value as investors purchase and redeem shares from the Fund.
Financial Highlights
This schedule provides a per-share breakdown of the components that affect the Fund’s NAV for current and past reporting periods as well as total return, asset size, ratios, and portfolio turnover rate.
The first line in the table reflects the NAV per share at the beginning of the reporting period. The next line reports the net investment income/(loss) per share. Following is the per share total of net gains/(losses), realized and unrealized. Per share dividends and distributions to investors are then subtracted to arrive at the NAV per share at the end of the period. The next line reflects the total return for the period. The total return may include adjustments in accordance with generally accepted accounting principles required at the period end for financial reporting purposes. As a result, the total return may differ from the total return reflected for individual shareholder transactions. Also included are ratios of expenses and net investment income to average net assets.
The Fund’s expenses may be reduced through expense offsets and expense reimbursements. The ratios shown reflect expenses before and after any such offsets and reimbursements.
The ratio of net investment income/(loss) summarizes the income earned less expenses, divided by the average net assets of the Fund during the reporting period. Do not confuse this ratio with the Fund’s yield. The net investment income ratio is not a true measure of the Fund’s yield because it does not take into account the dividends distributed to the Fund’s investors.
The next figure is the portfolio turnover rate, which measures the buying and selling activity in the Fund. Portfolio turnover is affected by market conditions, changes in the asset size of the Fund, fluctuating volume of shareholder purchase and redemption orders, the nature of the Fund’s investments, and the investment style and/or outlook of the portfolio manager(s) and/or investment personnel. A 100% rate implies that an amount equal to the value of the entire portfolio was replaced once during the fiscal year; a 50% rate means that an amount equal to the value of half the
Janus Henderson Contrarian Fund
Useful Information About Your Fund Report (unaudited)
portfolio is traded in a year; and a 200% rate means that an amount equal to the value of the entire portfolio is traded every six months.
Janus Henderson Contrarian Fund
Notes
NotesPage1
| | | | | | | | |
| | | | | |

| | | | |
This report is submitted for the general information of shareholders of the Fund. It is not an offer or solicitation for the Fund and is not authorized for distribution to prospective investors unless preceded or accompanied by an effective prospectus. |
Janus Henderson is a trademark of Janus Henderson Group plc or one of its subsidiaries. © Janus Henderson Group plc. Janus Henderson Group is the ultimate parent of Janus Henderson Distributors US LLC. Janus Henderson Distributors US LLC |
| | | | 125-24-93038 05-23 |
| | | | |
| | | |
| | | SEMIANNUAL REPORT March 31, 2023 |
| | |
| | Janus Henderson Emerging Markets Fund |
| | |
| | Janus Investment Fund |
| |
| | | HIGHLIGHTS · Investment strategy behind your fund · Fund performance, characteristics
and holdings |
Table of Contents
Janus Henderson Emerging Markets Fund
| | | | | | |
| | | | | 
Matthew Culley co-portfolio manager | 
Daniel J. Graña co-portfolio manager |
| | | |
Janus Henderson Emerging Markets Fund (unaudited)
Fund At A Glance
March 31, 2023
| | | | | | | | | | |
| | | | | | | | | |
| | | | | | | | | |
| | | | | | | | | |
| 5 Top Contributors - Holdings | 5 Top Detractors - Holdings |
| | Average
Weight | | Relative
Contribution | | | Average
Weight | | Relative
Contribution |
| New Horizon Health Ltd | 1.81% | | 0.89% | | Masan Group Corp | 1.72% | | -0.62% |
| Regional SAB de CV | 2.32% | | 0.45% | | JD.Com Inc - Class A | 2.72% | | -0.59% |
| Becle SAB de CV | 1.67% | | 0.45% | | Al Rajhi Bank | 2.05% | | -0.51% |
| Structure Therapeutics Inc - Series B | 0.71% | | 0.41% | | Fertiglobe PLC | 1.02% | | -0.50% |
| Ivanhoe Mines Ltd | 1.69% | | 0.36% | | Alinma Bank | 1.41% | | -0.47% |
| | | | | | | |
| 5 Top Contributors - Sectors* | | | | | |
| | | Relative | | Fund | MSCI Emerging Markets Index |
| | | Contribution | | Average Weight | Average Weight |
| Health Care | | 0.87% | | 6.08% | 3.98% |
| Consumer Staples | | 0.62% | | 8.50% | 6.37% |
| Utilities | | 0.48% | | 1.78% | 2.90% |
| Industrials | | 0.48% | | 5.48% | 5.99% |
| Financials | | 0.42% | | 23.37% | 21.97% |
| | | | | | |
| | | | | | |
| 5 Top Detractors - Sectors* | | | | | |
| | | Relative | | Fund | MSCI Emerging Markets Index |
| | | Contribution | | Average Weight | Average Weight |
| Materials | | -1.41% | | 6.94% | 8.88% |
| Communication Services | | -1.06% | | 11.13% | 9.80% |
| Information Technology | | -0.97% | | 21.09% | 19.49% |
| Other** | | -0.40% | | 2.57% | 0.00% |
| Consumer Discretionary | | -0.29% | | 11.11% | 13.72% |
| | | | | | | |
| Relative contribution reflects how the portolio's holdings impacted return relative to the benchmark. Cash and securities not held in the portfolio are not shown. For equity portfolios, relative contribution compares the performance of a security in the portfolio to the benchmark's total return, factoring in the difference in weight of that security in the benchmark. Returns are calculated using daily returns and previous day ending weights rolled up by ticker, excluding fixed income securities, gross of advisory fees, may exclude certain derivatives and will differ from actual performance.
Performance attribution reflects returns gross of advisory fees and may differ from actual returns as they are based on end of day holdings. Attribution is calculated by geometrically linking daily returns for the portfolio and index. |
* | Based on sector classification according to the Global Industry Classification Standard (“GICS”) codes, which are the exclusive property and a service mark of MSCI Inc. and Standard & Poor’s. |
** | Not a GICS classified sector. |
Janus Henderson Emerging Markets Fund (unaudited)
Fund At A Glance
March 31, 2023
| | |
5 Largest Equity Holdings - (% of Net Assets) |
Taiwan Semiconductor Manufacturing Co Ltd | |
Semiconductor & Semiconductor Equipment | 9.4% |
Samsung Electronics Co Ltd | |
Technology Hardware, Storage & Peripherals | 7.9% |
Tencent Holdings Ltd | |
Interactive Media & Services | 3.9% |
Alibaba Group Holding Ltd | |
Multiline Retail | 2.9% |
JD.Com Inc - Class A | |
Multiline Retail | 2.6% |
| | 26.7% |
| | | | | | |
Asset Allocation - (% of Net Assets) | |
Common Stocks | | 98.4% | |
Private Placements | | 1.4% | |
Other | | 0.2% |
| | | 100.0% |
Emerging markets comprised 94.2% of total net assets.
| | |
Top Country Allocations - Long Positions - (% of Investment Securities) |
As of March 31, 2023 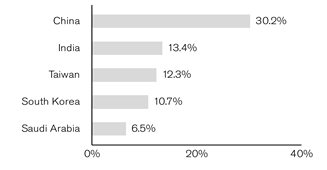
| As of September 30, 2022 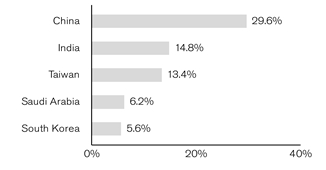
|
Janus Henderson Emerging Markets Fund (unaudited)
Performance
| |
See important disclosures on the next page. |
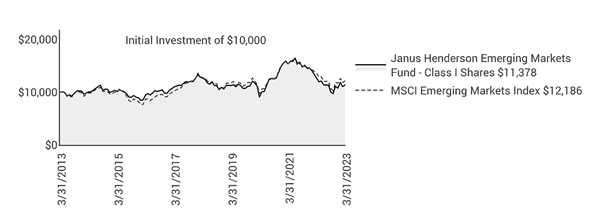
| | | | | | | | | | | | |
| | | | | | | | | | |
| | | | | | | | | | |
Average Annual Total Return - for the periods ended March 31, 2023 | | | Prospectus Expense Ratios |
| | Fiscal
Year-to-Date | One
Year | Five
Year | Ten
Year | Since
Inception* | | | Total Annual Fund
Operating Expenses‡ | Net Annual Fund
Operating Expenses‡ |
Class A Shares at NAV | | 12.95% | -11.56% | -2.49% | 1.04% | 0.09% | | | 1.75% | 1.37% |
Class A Shares at MOP | | 6.47% | -16.63% | -3.65% | 0.44% | -0.40% | | | | |
Class C Shares at NAV | | 12.67% | -12.25% | -3.20% | 0.28% | -0.66% | | | 2.64% | 2.12% |
Class C Shares at CDSC | | 11.67% | -13.13% | -3.20% | 0.28% | -0.66% | | | | |
Class D Shares | | 13.13% | -11.39% | -2.31% | 1.12% | 0.15% | | | 1.55% | 1.19% |
Class I Shares | | 13.16% | -11.32% | -2.23% | 1.30% | 0.34% | | | 1.45% | 1.12% |
Class N Shares | | 13.26% | -11.20% | -2.17% | 1.27% | 0.27% | | | 1.35% | 1.03% |
Class S Shares | | 12.92% | -11.79% | -2.56% | 0.84% | -0.14% | | | 5.24% | 1.54% |
Class T Shares | | 13.14% | -11.49% | -2.41% | 1.04% | 0.06% | | | 1.72% | 1.28% |
MSCI Emerging Markets Index | | 14.04% | -10.70% | -0.91% | 2.00% | 1.19% | | | | |
Morningstar Quartile - Class I Shares | | - | 3rd | 4th | 3rd | 4th | | | | |
Morningstar Ranking - based on total returns for Diversified Emerging Markets Funds | | - | 602/839 | 517/699 | 340/509 | 308/390 | | | | |
Returns quoted are past performance and do not guarantee future results; current performance may be lower or higher. Investment returns and principal value will vary; there may be a gain or loss when shares are sold. For the most recent month-end performance call 800.668.0434 (or 800.525.3713 if you hold shares directly with Janus Henderson) or visit janushenderson.com/performance (or janushenderson.com/allfunds if you hold shares directly with Janus Henderson).
Maximum Offering Price (MOP) returns include the maximum sales charge of 5.75%. Net Asset Value (NAV) returns exclude this charge, which would have reduced returns.
CDSC returns include a 1% contingent deferred sales charge (CDSC) on Shares redeemed within 12 months of purchase. Net Asset Value (NAV) returns exclude this charge, which would have reduced returns.
Net expense ratios reflect the expense waiver, if any, contractually agreed to for at least a one-year period commencing on January 27, 2023. This contractual waiver may be terminated or modified only at the discretion of the Board of Trustees.
Janus Henderson Emerging Markets Fund (unaudited)
Performance
Performance may be affected by risks that include those associated with foreign and emerging markets, fixed income securities, high-yield and high-risk securities, undervalued, overlooked and smaller capitalization companies, real estate related securities including Real Estate Investment Trusts (REITs), Environmental, Social and Governance (ESG) factors, non-diversification, portfolio turnover, derivatives, short sales, initial public offerings (IPOs) and potential conflicts of interest. Each product has different risks. Please see the prospectus for more information about risks, holdings and other details.
Returns include reinvestment of all dividends and distributions and do not reflect the deduction of taxes that a shareholder would pay on Fund distributions or redemptions of Fund shares. The returns do not include adjustments in accordance with generally accepted accounting principles required at the period end for financial reporting purposes.
Returns of the Fund shown prior to June 5, 2017 are those for Henderson Emerging Markets Fund (the “Predecessor Fund”), which merged into the Fund after the close of business on June 2, 2017. The Predecessor Fund was advised by Henderson Global Investors (North America) Inc. and subadvised by Henderson Investment Management Limited. Class A Shares, Class C Shares, Class I Shares, and Class R6 Shares of the Predecessor Fund were reorganized into Class A Shares, Class C Shares, Class I Shares, and Class N Shares, respectively, of the Fund. In connection with this reorganization, certain shareholders of the Predecessor Fund who held shares directly with the Predecessor Fund and not through an intermediary had the Class A Shares, Class C Shares, Class I Shares, and Class N Shares of the Fund received in the reorganization automatically exchanged for Class D Shares of the Fund following the reorganization. Class A Shares, Class C Shares and Class I Shares of the Predecessor Fund commenced operations with the Predecessor Fund’s inception on December 31, 2010. Class R6 Shares of the Predecessor Fund commenced operations on November 30, 2015. Class D Shares, Class S Shares, and Class T Shares commenced operations on June 5, 2017.
Performance of Class A Shares shown for periods prior to June 5, 2017, reflects the performance of Class A Shares of the Predecessor Fund, calculated using the fees and expenses of Class A Shares of the Predecessor Fund, in effect during the periods shown, net of any applicable fee and expense limitations or waivers.
Performance of Class C Shares shown for periods prior to June 5, 2017, reflects the performance of Class C Shares of the Predecessor Fund, calculated using the fees and expenses of Class C Shares of the Predecessor Fund, in effect during the periods shown, net of any applicable fee and expense limitations or waivers.
Performance of Class I Shares shown for periods prior to June 5, 2017, reflects the performance of Class I Shares of the Predecessor Fund, calculated using the fees and expenses of Class I Shares of the Predecessor Fund, in effect during the periods shown, net of any applicable fee and expense limitations or waivers.
Performance of Class N Shares shown for periods prior to June 5, 2017, reflects the performance of Class R6 Shares of the Predecessor Fund, calculated using the fees and expenses of Class R6 Shares of the Predecessor Fund, in effect during the periods shown, net of any applicable fee and expense limitations or waivers, except that for periods prior to November 30, 2015, performance for Class N Shares reflects the performance of Class I Shares of the Predecessor Fund, calculated using the estimated fees and expenses of Class N Shares, net of any applicable fee and expense limitations or waivers.
Performance of Class S Shares shown for periods prior to June 5, 2017, reflects the performance of Class I Shares of the Predecessor Fund, calculated using the estimated fees and expenses of Class S Shares, net of any applicable fee and expense limitations or waivers.
Performance of Class T Shares shown for periods prior to June 5, 2017, reflects the performance of Class I Shares of the Predecessor Fund, calculated using the estimated fees and expenses of Class T Shares, net of any applicable fee and expense limitations or waivers.
Performance of Class D Shares shown for periods prior to June 5, 2017, reflects the performance of Class I Shares of the Predecessor Fund, calculated using the estimated fees and expenses of Class D Shares, net of any applicable fee and expense limitations or waivers.
If each share class of the Fund had been available during periods prior to its commencement, the performance shown may have been different. The performance shown for periods following the Fund’s commencement of each share class reflects the fees and expenses of each respective share class, net of any applicable fee and expense limitations or waivers. Please refer to the Fund’s prospectuses for further details concerning historical performance.
Ranking is for the share class shown only; other classes may have different performance characteristics. When an expense waiver is in effect, it may have a material effect on the total return, and therefore the ranking for the period.
© 2023 Morningstar, Inc. All Rights Reserved.
There is no assurance that the investment process will consistently lead to successful investing.
See Notes to Schedule of Investments and Other Information for index definitions.
Index performance does not reflect the expenses of managing a portfolio as an index is unmanaged and not available for direct investment.
See “Useful Information About Your Fund Report.”
*The Predecessor Fund’s inception date – December 31, 2010
‡ As stated in the prospectus. See Financial Highlights for actual expense ratios during the reporting period.
Janus Henderson Emerging Markets Fund (unaudited)
Expense Examples
As a shareholder of the Fund, you incur two types of costs: (1) transaction costs, such as sales charges (loads) on purchase payments (applicable to Class A Shares only); and (2) ongoing costs, including management fees; 12b-1 distribution and shareholder servicing fees; transfer agent fees and expenses payable pursuant to the Transfer Agency Agreement; and other Fund expenses. This example is intended to help you understand your ongoing costs (in dollars) of investing in the Fund and to compare these costs with the ongoing costs of investing in other mutual funds. To do so, compare this 5% hypothetical example with the 5% hypothetical examples that appear in the shareholder reports of the other funds. The example is based upon an investment of $1,000 invested at the beginning of the period and held for the six-months indicated, unless noted otherwise in the table and footnotes below.
Actual Expenses
The information in the table under the heading “Actual” provides information about actual account values and actual expenses. You may use the information in these columns, together with the amount you invested, to estimate the expenses that you paid over the period. Simply divide your account value by $1,000 (for example, an $8,600 account value divided by $1,000 = 8.6), then multiply the result by the number in the appropriate column for your share class under the heading entitled “Expenses Paid During Period” to estimate the expenses you paid on your account during the period.
Hypothetical Example for Comparison Purposes
The information in the table under the heading “Hypothetical (5% return before expenses)” provides information about hypothetical account values and hypothetical expenses based upon the Fund’s actual expense ratio and an assumed rate of return of 5% per year before expenses, which is not the Fund’s actual return. The hypothetical account values and expenses may not be used to estimate the actual ending account balance or expenses you paid for the period. You may use this information to compare the ongoing costs of investing in the Fund and other funds. To do so, compare this 5% hypothetical example with the 5% hypothetical examples that appear in the shareholder reports of the other funds. Additionally, for an analysis of the fees associated with an investment in any share class or other similar funds, please visit www.finra.org/fundanalyzer.
Please note that the expenses shown in the table are meant to highlight your ongoing costs only and do not reflect any transaction costs. These fees are fully described in the Fund’s prospectuses. Therefore, the hypothetical examples are useful in comparing ongoing costs only, and will not help you determine the relative total costs of owning different funds. In addition, if these transaction costs were included, your costs would have been higher.
| | | | | | | | | | | |
| | | | | | | | |
| | | Actual | | Hypothetical
(5% return before expenses) | |
| Beginning
Account
Value
(10/1/22) | Ending
Account
Value
(3/31/23) | Expenses
Paid During
Period
(10/1/22 - 3/31/23)† | | Beginning
Account
Value
(10/1/22) | Ending
Account
Value
(3/31/23) | Expenses
Paid During
Period
(10/1/22 - 3/31/23)† | Net Annualized
Expense Ratio
(10/1/22 - 3/31/23) |
Class A Shares | $1,000.00 | $1,129.50 | $7.38 | | $1,000.00 | $1,018.00 | $6.99 | 1.39% |
Class C Shares | $1,000.00 | $1,126.70 | $11.35 | | $1,000.00 | $1,014.26 | $10.75 | 2.14% |
Class D Shares | $1,000.00 | $1,131.30 | $6.43 | | $1,000.00 | $1,018.90 | $6.09 | 1.21% |
Class I Shares | $1,000.00 | $1,131.60 | $6.06 | | $1,000.00 | $1,019.25 | $5.74 | 1.14% |
Class N Shares | $1,000.00 | $1,132.60 | $5.58 | | $1,000.00 | $1,019.70 | $5.29 | 1.05% |
Class S Shares | $1,000.00 | $1,129.20 | $8.23 | | $1,000.00 | $1,017.20 | $7.80 | 1.55% |
Class T Shares | $1,000.00 | $1,131.40 | $6.85 | | $1,000.00 | $1,018.50 | $6.49 | 1.29% |
† | Expenses Paid During Period are equal to the Net Annualized Expense Ratio multiplied by the average account value over the period, multiplied by 182/365 (to reflect the one-half year period). Expenses in the examples include the effect of applicable fee waivers and/or expense reimbursements, if any. Had such waivers and/or reimbursements not been in effect, your expenses would have been higher. Please refer to the Notes to Financial Statements or the Fund’s prospectuses for more information regarding waivers and/or reimbursements. |
Janus Henderson Emerging Markets Fund
Schedule of Investments (unaudited)
March 31, 2023
| | | | | | | | |
Shares
| | | Value | |
Common Stocks– 98.4% | | | |
Automobiles – 2.2% | | | |
| | BYD Co Ltd | | 22,000 | | | $646,441 | |
| | Eicher Motors Ltd | | 21,282 | | | 764,601 | |
| | | 1,411,042 | |
Banks – 16.9% | | | |
| | Al Rajhi Bank | | 51,262 | | | 1,007,624 | |
| | Alinma Bank | | 197,308 | | | 1,552,737 | |
| | Bank Negara Indonesia Persero Tbk PT | | 2,197,900 | | | 1,375,486 | |
| | BDO Unibank Inc | | 551,890 | | | 1,310,130 | |
| | HDFC Bank Ltd | | 81,219 | | | 1,596,864 | |
| | ICICI Bank Ltd | | 146,281 | | | 1,568,845 | |
| | NU Holdings Ltd/Cayman Islands - Class A* | | 140,472 | | | 668,647 | |
| | Regional SAB de CV | | 130,858 | | | 1,000,013 | |
| | Vietnam Technological & Commercial Joint Stock Bank* | | 756,400 | | | 918,379 | |
| | | 10,998,725 | |
Beverages – 2.5% | | | |
| | Becle SAB de CV | | 468,299 | | | 1,212,577 | |
| | Wuliangye Yibin Co Ltd | | 13,539 | | | 387,080 | |
| | | 1,599,657 | |
Biotechnology – 0.2% | | | |
| | CANbridge Pharmaceuticals Inc* | | 597,481 | | | 154,598 | |
Capital Markets – 2.4% | | | |
| | CITIC Securities Co Ltd | | 737,500 | | | 1,579,959 | |
Chemicals – 1.0% | | | |
| | Fertiglobe PLC | | 600,748 | | | 654,997 | |
Communications Equipment – 1.3% | | | |
| | Accton Technology Corp | | 78,000 | | | 825,564 | |
Diversified Consumer Services – 1.0% | | | |
| | Fu Shou Yuan International Group Ltd | | 783,000 | | | 632,548 | |
Diversified Financial Services – 2.4% | | | |
| | Housing Development Finance Corp Ltd | | 34,454 | | | 1,104,048 | |
| | NHN KCP Corp | | 49,860 | | | 487,098 | |
| | | 1,591,146 | |
Diversified Telecommunication Services – 3.7% | | | |
| | Saudi Telecom Co | | 109,074 | | | 1,166,723 | |
| | Telekomunikasi Indonesia Persero Tbk PT | | 4,546,100 | | | 1,232,865 | |
| | | 2,399,588 | |
Electrical Equipment – 1.7% | | | |
| | KEI Industries Ltd | | 27,440 | | | 568,284 | |
| | Ming Yang Smart Engergy Group Ltd - Class A | | 169,333 | | | 554,177 | |
| | | 1,122,461 | |
Electronic Equipment, Instruments & Components – 1.6% | | | |
| | E Ink Holdings Inc | | 88,000 | | | 539,029 | |
| | Sinbon Electronics Co Ltd | | 43,000 | | | 484,540 | |
| | | 1,023,569 | |
Food & Staples Retailing – 3.6% | | | |
| | BGF retail Co Ltd | | 5,209 | | | 728,123 | |
| | Wal-Mart de Mexico SAB de CV | | 409,497 | | | 1,637,188 | |
| | | 2,365,311 | |
Food Products – 2.0% | | | |
| | Masan Group Corp | | 304,960 | | | 1,014,570 | |
| | Tingyi Cayman Islands Holding Corp | | 158,000 | | | 264,034 | |
| | | 1,278,604 | |
Health Care Equipment & Supplies – 1.5% | | | |
| | Shenzhen Mindray Bio-Medical Electronics Co Ltd - Class A | | 20,783 | | | 947,112 | |
Health Care Providers & Services – 2.0% | | | |
| | New Horizon Health Ltd (144A)* | | 373,500 | | | 1,301,526 | |
Hotels, Restaurants & Leisure – 2.6% | | | |
| | Alamar Foods | | 12,280 | | | 472,476 | |
| | |
See Notes to Schedule of Investments and Other Information and Notes to Financial Statements. |
| |
6 | MARCH 31, 2023 |
Janus Henderson Emerging Markets Fund
Schedule of Investments (unaudited)
March 31, 2023
| | | | | | | | |
Shares
| | | Value | |
Common Stocks– (continued) | | | |
Hotels, Restaurants & Leisure– (continued) | | | |
| | H World Group Ltd* | | 159,200 | | | $778,047 | |
| | MakeMyTrip Ltd* | | 16,966 | | | 415,158 | |
| | | 1,665,681 | |
Household Durables – 0.9% | | | |
| | Hangzhou Robam Appliances Co Ltd - Class A | | 138,276 | | | 570,994 | |
Insurance – 2.0% | | | |
| | AIA Group Ltd | | 122,200 | | | 1,284,035 | |
Interactive Media & Services – 3.9% | | | |
| | Tencent Holdings Ltd | | 51,800 | | | 2,531,186 | |
Life Sciences Tools & Services – 1.1% | | | |
| | Syngene International Ltd (144A) | | 96,056 | | | 695,164 | |
Machinery – 1.5% | | | |
| | Sany Heavy Industry Co Ltd | | 188,877 | | | 471,044 | |
| | Shenzhen Inovance Technology Co Ltd - Class A | | 49,364 | | | 505,819 | |
| | | 976,863 | |
Metals & Mining – 5.4% | | | |
| | Allkem Ltd* | | 120,602 | | | 965,829 | |
| | Companhia Brasileira de Aluminio | | 289,287 | | | 432,683 | |
| | Ivanhoe Mines Ltd* | | 103,010 | | | 930,772 | |
| | Merdeka Copper Gold Tbk PT* | | 2,667,300 | | | 748,166 | |
| | Solaris Resources Inc* | | 84,904 | | | 411,545 | |
| | | 3,488,995 | |
Multiline Retail – 5.5% | | | |
| | Alibaba Group Holding Ltd* | | 149,332 | | | 1,899,209 | |
| | JD.Com Inc - Class A | | 76,942 | | | 1,686,356 | |
| | | 3,585,565 | |
Oil, Gas & Consumable Fuels – 1.4% | | | |
| | 3R Petroleum Oleo e Gas SA* | | 157,310 | | | 914,763 | |
Pharmaceuticals – 0.5% | | | |
| | Structure Therapeutics Inc (ADR)* | | 2,350 | | | 55,906 | |
| | Zhaoke Ophthalmology Ltd (144A)* | | 516,500 | | | 254,575 | |
| | | 310,481 | |
Road & Rail – 2.0% | | | |
| | Full Truck Alliance Co (ADR)* | | 170,958 | | | 1,300,990 | |
Semiconductor & Semiconductor Equipment – 11.5% | | | |
| | LEENO Industrial Inc | | 5,412 | | | 601,124 | |
| | LONGi Green Energy Technology Co Ltd - Class A | | 132,765 | | | 782,381 | |
| | Taiwan Semiconductor Manufacturing Co Ltd | | 345,000 | | | 6,112,477 | |
| | | 7,495,982 | |
Software – 1.4% | | | |
| | Linklogis Inc - Class B (144A)* | | 1,994,939 | | | 925,945 | |
Technology Hardware, Storage & Peripherals – 7.9% | | | |
| | Samsung Electronics Co Ltd | | 102,842 | | | 5,100,349 | |
Textiles, Apparel & Luxury Goods – 0.9% | | | |
| | Kalyan Jewellers India Ltd* | | 467,333 | | | 602,028 | |
Transportation Infrastructure – 1.0% | | | |
| | International Container Terminal Services Inc | | 166,420 | | | 653,990 | |
Water Utilities – 1.2% | | | |
| | China Water Affairs Group Ltd | | 948,000 | | | 776,643 | |
Wireless Telecommunication Services – 1.7% | | | |
| | Bharti Airtel Ltd | | 123,197 | | | 1,124,337 | |
Total Common Stocks (cost $64,518,082) | | 63,890,398 | |
Private Placements– 1.4% | | | |
Biotechnology – 1.0% | | | |
| | Structure Therapeutics Inc - Series B*,¢,§ | | 92,696 | | | 661,571 | |
| | |
See Notes to Schedule of Investments and Other Information and Notes to Financial Statements. |
| |
Janus Investment Fund | 7 |
Janus Henderson Emerging Markets Fund
Schedule of Investments (unaudited)
March 31, 2023
| | | | | | | | |
Shares
| | | Value | |
Private Placements– (continued) | | | |
Health Care Providers & Services – 0.4% | | | |
| | API Holdings Private Ltd*,¢,§ | | 758,340 | | | $269,312 | |
Total Private Placements (cost $926,137) | | 930,883 | |
Total Investments (total cost $65,444,219) – 99.8% | | 64,821,281 | |
Cash, Receivables and Other Assets, net of Liabilities – 0.2% | | 107,664 | |
Net Assets – 100% | | $64,928,945 | |
| | | | | | |
Summary of Investments by Country - (Long Positions) (unaudited) |
| |
| | | | | % of | |
| | | | | Investment | |
Country | | Value | | Securities | |
China | | $19,612,235 | | 30.2 | % |
India | | 8,708,641 | | 13.4 | |
Taiwan | | 7,961,610 | | 12.3 | |
South Korea | | 6,916,694 | | 10.7 | |
Saudi Arabia | | 4,199,560 | | 6.5 | |
Mexico | | 3,849,778 | | 5.9 | |
Indonesia | | 3,356,517 | | 5.2 | |
Brazil | | 2,016,093 | | 3.1 | |
Philippines | | 1,964,120 | | 3.0 | |
Vietnam | | 1,932,949 | | 3.0 | |
Canada | | 1,342,317 | | 2.1 | |
Hong Kong | | 1,284,035 | | 2.0 | |
Australia | | 965,829 | | 1.5 | |
United Arab Emirates | | 654,997 | | 1.0 | |
United States | | 55,906 | | 0.1 | |
| | |
See Notes to Schedule of Investments and Other Information and Notes to Financial Statements. |
| |
8 | MARCH 31, 2023 |
Janus Henderson Emerging Markets Fund
Schedule of Investments (unaudited)
March 31, 2023
Schedules of Affiliated Investments – (% of Net Assets)
| | | | | | | | | | | |
| | Dividend Income | Realized Gain/(Loss) | Change in Unrealized Appreciation/ Depreciation | Value at 3/31/23 |
Investment Companies - N/A |
Money Markets - N/A | |
| | Janus Henderson Cash Liquidity Fund LLC, 4.7988%ºº | $ | 24,604 | $ | 67 | $ | (43) | $ | - |
| |
| | | | | | | | | | | |
| | Value at 9/30/22 | Purchases | Sales Proceeds | Value at 3/31/23 |
Investment Companies - N/A |
Money Markets - N/A | |
| | Janus Henderson Cash Liquidity Fund LLC, 4.7988%ºº | | 1,012,636 | | 15,564,727 | | (16,577,387) | | - |
| | |
See Notes to Schedule of Investments and Other Information and Notes to Financial Statements. |
| |
Janus Investment Fund | 9 |
Janus Henderson Emerging Markets Fund
Notes to Schedule of Investments and Other Information (unaudited)
| | |
MSCI Emerging Markets IndexSM | MSCI Emerging Markets IndexSM reflects the equity market performance of emerging markets. |
| | |
ADR | American Depositary Receipt |
LLC | Limited Liability Company |
PLC | Public Limited Company |
| | |
144A | Securities sold under Rule 144A of the Securities Act of 1933, as amended, are subject to legal and/or contractual restrictions on resale and may not be publicly sold without registration under the 1933 Act. Unless otherwise noted, these securities have been determined to be liquid under guidelines established by the Board of Trustees. The total value of 144A securities as of the period ended March 31, 2023 is $3,177,210, which represents 4.9% of net assets. |
| | |
* | Non-income producing security. |
| | |
ºº | Rate shown is the 7-day yield as of March 31, 2023. |
| | |
¢ | Security is valued using significant unobservable inputs. The total value of Level 3 securities as of the period ended March 31, 2023 is $930,883, which represents 1.4% of net assets. |
| | | | | | | | | | | |
§ | Schedule of Restricted Securities (as of March 31, 2023) |
| | | | | | | | Value as a | |
| | Acquisition | | | | | | % of Net | |
| | Date | | Cost | | Value | | Assets | |
API Holdings Private Ltd | 9/27/21 | $ | 550,876 | $ | 269,312 | | 0.4 | % |
Structure Therapeutics Inc - Series B | 7/30/21 | | 375,261 | | 661,571 | | 1.0 | |
Total | | $ | 926,137 | $ | 930,883 | | 1.4 | % |
| | | | | | | | | |
The Fund has registration rights for certain restricted securities held as of March 31, 2023. The issuer incurs all registration costs. | |
| | | | | | | | | | | | | |
The following is a summary of the inputs that were used to value the Fund’s investments in securities and other financial instruments as of March 31, 2023. See Notes to Financial Statements for more information. |
| |
Valuation Inputs Summary |
| | | | | | | |
| | | | | Level 2 - | | Level 3 - |
| | | Level 1 - | | Other Significant | | Significant |
| | | Quoted Prices | | Observable Inputs | | Unobservable Inputs |
| | | | | | | |
Assets | | | | | | |
Investments In Securities: | | | | | | |
Common Stocks | | | | | | |
Banks | $ | 1,668,660 | $ | 9,330,065 | $ | - |
Beverages | | 1,212,577 | | 387,080 | | - |
Food & Staples Retailing | | 1,637,188 | | 728,123 | | - |
Hotels, Restaurants & Leisure | | 415,158 | | 1,250,523 | | - |
Metals & Mining | | 1,775,000 | | 1,713,995 | | - |
Oil, Gas & Consumable Fuels | | 914,763 | | - | | - |
Pharmaceuticals | | 55,906 | | 254,575 | | - |
Road & Rail | | 1,300,990 | | - | | - |
All Other | | - | | 41,245,795 | | - |
Private Placements | | - | | - | | 930,883 |
Total Assets | $ | 8,980,242 | $ | 54,910,156 | $ | 930,883 |
| | | | | | | |
Janus Henderson Emerging Markets Fund
Notes to Schedule of Investments and Other Information (unaudited)
| | | | | | | | |
Level 3 Valuation Reconciliation of Assets (for the period ended March 31, 2023) |
| | | | | | | |
| Balance
as of
September 30, 2022 | Realized
Gain/(Loss) | Change in
Unrealized
Appreciation/
Depreciation(a) | Gross
Purchases | Gross
Sales | Transfers In
and/or
Out of Level 3 | Balance
as of
March 31, 2023 |
Investment in Securities: | | | | | | | |
Private Placements | | | | | | | |
Biotechnology | $ 375,261 | $ - | $ 286,310 | $ - | $ - | $ - | $ 661,571 |
Health Care Providers & Services | 282,869 | - | (13,557) | - | - | - | 269,312 |
Total | $ 658,130 | $ - | $ 272,753 | $ - | $ - | $ - | $ 930,883 |
(a) Included in "Change in unrealized net appreciation/depreciation of investments, foreign currency translations and non-interested Trustees' deferred compensation" on the Statement of Operations. |
| | | | | | | |
| | | | | | | |
Janus Henderson Emerging Markets Fund
Statement of Assets and Liabilities (unaudited)
March 31, 2023
| |
See footnotes at the end of the Statement. |
| | | | | | | |
| | | | | | |
Assets: | | | | |
| Investments, at value (cost $65,444,219) | | $ | 64,821,281 | |
| Cash denominated in foreign currency (cost $5,179) | | | 5,179 | |
| Trustees' deferred compensation | | | 1,607 | |
| Receivables: | | | | |
| | Investments sold | | | 198,319 | |
| | Dividends | | | 178,407 | |
| | Foreign tax reclaims | | | 7,788 | |
| | Dividends from affiliates | | | 5,321 | |
| | Fund shares sold | | | 2,511 | |
| Other assets | | | 17,773 | |
Total Assets | | | 65,238,186 | |
Liabilities: | | | | |
| Due to custodian | | | 2,088 | |
| Payables: | | | — | |
| | Investments purchased | | | 178,496 | |
| | Advisory fees | | | 28,559 | |
| | Fund shares repurchased | | | 21,150 | |
| | Custodian fees | | | 14,616 | |
| | Professional fees | | | 8,569 | |
| | Transfer agent fees and expenses | | | 4,936 | |
| | Trustees' deferred compensation fees | | | 1,607 | |
| | 12b-1 Distribution and shareholder servicing fees | | | 1,419 | |
| | Trustees' fees and expenses | | | 436 | |
| | Affiliated fund administration fees payable | | | 144 | |
| | Accrued expenses and other payables | | | 47,221 | |
Total Liabilities | | | 309,241 | |
Net Assets | | $ | 64,928,945 | |
| | |
See Notes to Financial Statements. |
| |
12 | MARCH 31, 2023 |
Janus Henderson Emerging Markets Fund
Statement of Assets and Liabilities (unaudited)
March 31, 2023
| | | | | | | |
| | | | | | |
| | | | | | | |
Net Assets Consist of: | | | | |
| Capital (par value and paid-in surplus) | | $ | 79,902,454 | |
| Total distributable earnings (loss) | | | (14,973,509) | |
Total Net Assets | | $ | 64,928,945 | |
Net Assets - Class A Shares | | $ | 3,099,995 | |
| Shares Outstanding, $0.01 Par Value (unlimited shares authorized) | | | 355,429 | |
Net Asset Value Per Share(1) | | $ | 8.72 | |
Maximum Offering Price Per Share(2) | | $ | 9.25 | |
Net Assets - Class C Shares | | $ | 803,882 | |
| Shares Outstanding, $0.01 Par Value (unlimited shares authorized) | | | 95,164 | |
Net Asset Value Per Share(1) | | $ | 8.45 | |
Net Assets - Class D Shares | | $ | 13,550,428 | |
| Shares Outstanding, $0.01 Par Value (unlimited shares authorized) | | | 1,541,914 | |
Net Asset Value Per Share | | $ | 8.79 | |
Net Assets - Class I Shares | | $ | 8,757,390 | |
| Shares Outstanding, $0.01 Par Value (unlimited shares authorized) | | | 998,929 | |
Net Asset Value Per Share | | $ | 8.77 | |
Net Assets - Class N Shares | | $ | 36,874,246 | |
| Shares Outstanding, $0.01 Par Value (unlimited shares authorized) | | | 4,192,632 | |
Net Asset Value Per Share | | $ | 8.80 | |
Net Assets - Class S Shares | | $ | 81,349 | |
| Shares Outstanding, $0.01 Par Value (unlimited shares authorized) | | | 9,210 | |
Net Asset Value Per Share | | $ | 8.83 | |
Net Assets - Class T Shares | | $ | 1,761,655 | |
| Shares Outstanding, $0.01 Par Value (unlimited shares authorized) | | | 200,738 | |
Net Asset Value Per Share | | $ | 8.78 | |
| |
(1) Redemption price per share may be reduced for any applicable contingent deferred sales charge. (2) Maximum offering price is computed at 100/94.25 of net asset value. |
| | |
See Notes to Financial Statements. |
| |
Janus Investment Fund | 13 |
Janus Henderson Emerging Markets Fund
Statement of Operations (unaudited)
For the period ended March 31, 2023
| | | | | | |
| | | | | |
Investment Income: |
| Dividends | $ | 436,876 | |
| Non-cash dividends | | 185,984 | |
| Dividends from affiliates | | 24,604 | |
| Other income | | 2,044 | |
| Foreign tax withheld | | (52,668) | |
Total Investment Income | | 596,840 | |
Expenses: | | | |
| Advisory fees | | 323,250 | |
| 12b-1 Distribution and shareholder servicing fees: |
| | Class A Shares | | 4,082 | |
| | Class C Shares | | 4,275 | |
| | Class S Shares | | 102 | |
| Transfer agent administrative fees and expenses: | | |
| | Class D Shares | | 7,429 | |
| | Class S Shares | | 102 | |
| | Class T Shares | | 1,868 | |
| Transfer agent networking and omnibus fees: | | | |
| | Class A Shares | | 1,476 | |
| | Class C Shares | | 399 | |
| | Class I Shares | | 4,048 | |
| Other transfer agent fees and expenses: | | | |
| | Class A Shares | | 151 | |
| | Class C Shares | | 36 | |
| | Class D Shares | | 2,827 | |
| | Class I Shares | | 348 | |
| | Class N Shares | | 1,075 | |
| | Class S Shares | | 4 | |
| | Class T Shares | | 30 | |
| Registration fees | | 40,270 | |
| Custodian fees | | 34,876 | |
| Professional fees | | 32,413 | |
| Non-affiliated fund administration fees | | 32,202 | |
| Shareholder reports expense | | 4,668 | |
| Trustees’ fees and expenses | | 945 | |
| Affiliated fund administration fees | | 810 | |
| Other expenses | | 6,897 | |
Total Expenses | | 504,583 | |
Less: Excess Expense Reimbursement and Waivers | | (139,778) | |
Net Expenses | | 364,805 | |
Net Investment Income/(Loss) | | 232,035 | |
| | | | | |
| | |
See Notes to Financial Statements. |
| |
14 | MARCH 31, 2023 |
Janus Henderson Emerging Markets Fund
Statement of Operations (unaudited)
For the period ended March 31, 2023
| | | | | | |
| | | | | |
Net Realized Gain/(Loss) on Investments: | |
| Investments and foreign currency transactions (net of foreign taxes of $159,970) | $ | (4,122,092) | |
| Investments in affiliates | | 67 | |
Total Net Realized Gain/(Loss) on Investments | (4,122,025) | |
Change in Unrealized Net Appreciation/Depreciation: |
| Investments, foreign currency translations and Trustees’ deferred compensation (net of decrease in deferred foreign taxes of $51,740) | | 11,775,381 | |
| Investments in affiliates | | (43) | |
Total Change in Unrealized Net Appreciation/Depreciation | 11,775,338 | |
Net Increase/(Decrease) in Net Assets Resulting from Operations | $ | 7,885,348 | |
| | | | | |
| | |
See Notes to Financial Statements. |
| |
Janus Investment Fund | 15 |
Janus Henderson Emerging Markets Fund
Statements of Changes in Net Assets
| | | | | | | | | |
| | | | | | | | |
| | | Period ended
March 31, 2023 (unaudited) | | Year ended
September 30, 2022 | |
| | | | | | | | | |
Operations: | | | | | | |
| Net investment income/(loss) | $ | 232,035 | | $ | 526,579 | |
| Net realized gain/(loss) on investments | | (4,122,025) | | | (6,176,703) | |
| Change in unrealized net appreciation/depreciation | 11,775,338 | | | (25,044,610) | |
Net Increase/(Decrease) in Net Assets Resulting from Operations | 7,885,348 | | | (30,694,734) | |
Dividends and Distributions to Shareholders: | | | | | | |
| | Class A Shares | | — | | | (133,124) | |
| | Class C Shares | | — | | | (23,265) | |
| | Class D Shares | | — | | | (481,190) | |
| | Class I Shares | | — | | | (539,900) | |
| | Class N Shares | | — | | | (1,789,591) | |
| | Class S Shares | | — | | | (2,399) | |
| | Class T Shares | | — | | | (77,857) | |
Net Decrease from Dividends and Distributions to Shareholders | — | | | (3,047,326) | |
Capital Share Transactions: | | | | | | |
| | Class A Shares | | (627,632) | | | 44,305 | |
| | Class C Shares | | (237,196) | | | (329,265) | |
| | Class D Shares | | 925,822 | | | (936,106) | |
| | Class I Shares | | (2,223,692) | | | (3,610,108) | |
| | Class N Shares | | (4,698,485) | | | (4,367,939) | |
| | Class S Shares | | (5,269) | | | 19,488 | |
| | Class T Shares | | (106,603) | | | (325,699) | |
Net Increase/(Decrease) from Capital Share Transactions | (6,973,055) | | | (9,505,324) | |
Net Increase/(Decrease) in Net Assets | | 912,293 | | | (43,247,384) | |
Net Assets: | | | | | | |
| Beginning of period | | 64,016,652 | | | 107,264,036 | |
| End of period | $ | 64,928,945 | | $ | 64,016,652 | |
| | | | | | | | |
| | |
See Notes to Financial Statements. |
| |
16 | MARCH 31, 2023 |
Janus Henderson Emerging Markets Fund
Financial Highlights
| | | | | | | | | | | | | | | | | | | | | | |
Class A Shares | | | | | | | | | | | | | | | | | | |
For a share outstanding during the period ended March 31, 2023 (unaudited) and the year ended September 30 | 2023 | | | 2022 | | | 2021 | | | 2020 | | | 2019 | | | 2018 | |
| Net Asset Value, Beginning of Period | | $7.71 | | | $11.68 | | | $10.02 | | | $8.72 | | | $9.48 | | | $10.36 | |
| Income/(Loss) from Investment Operations: | | | | | | | | | | | | | | | | | | |
| | Net investment income/(loss)(1) | | 0.02(2) | | | 0.04 | | | (0.03) | | | 0.02 | | | 0.10 | | | 0.10 | |
| | Net realized and unrealized gain/(loss) | | 0.99 | | | (3.70) | | | 1.79 | | | 1.40 | | | (0.55) | | | (0.67) | |
| Total from Investment Operations | | 1.01 | | | (3.66) | | | 1.76 | | | 1.42 | | | (0.45) | | | (0.57) | |
| Less Dividends and Distributions: | | | | | | | | | | | | | | | | | | |
| | Dividends (from net investment income) | | — | | | (0.31) | | | (0.10) | | | (0.12) | | | (0.13) | | | (0.10) | |
| | Distributions (from capital gains) | | — | | | — | | | — | | | — | | | (0.18) | | | (0.21) | |
| Total Dividends and Distributions | | — | | | (0.31) | | | (0.10) | | | (0.12) | | | (0.31) | | | (0.31) | |
| Net Asset Value, End of Period | | $8.72 | | | $7.71 | | | $11.68 | | | $10.02 | | | $8.72 | | | $9.48 | |
| Total Return* | | 13.10% | | | (32.11)% | | | 17.58% | | | 16.32% | | | (4.66)%(3) | | | (5.80)% | |
| Net Assets, End of Period (in thousands) | | $3,100 | | | $3,311 | | | $4,986 | | | $4,000 | | | $4,859 | | | $15,771 | |
| Average Net Assets for the Period (in thousands) | | $3,280 | | | $4,320 | | | $4,989 | | | $4,394 | | | $8,932 | | | $16,103 | |
| Ratios to Average Net Assets**: | | | | | | | | | | | | | | | | | | |
| | Ratio of Gross Expenses | | 1.87% | | | 1.75% | | | 1.66% | | | 1.87% | | | 1.65% | | | 1.51% | |
| | Ratio of Net Expenses (After Waivers and Expense Offsets) | | 1.39% | | | 1.38% | | | 1.37% | | | 1.37% | | | 1.30% | | | 1.33% | |
| | Ratio of Net Investment Income/(Loss) | | 0.44%(2) | | | 0.35% | | | (0.25)% | | | 0.27% | | | 1.11% | | | 0.93% | |
| Portfolio Turnover Rate | | 37% | | | 63% | | | 76% | | | 110% | | | 68% | | | 26% | |
| | | | | | | | | | | | | | | | | | | | | | |
| |
* Total return includes adjustments in accordance with generally accepted accounting principles required at the year or period end and are not annualized for periods of less than one full year. ** Annualized for periods of less than one full year. (1) Per share amounts are calculated based on average shares outstanding during the year or period. (2) Net investment income/(loss) per share and Ratio of Net Investment Income/(Loss) to Average Net Assets include a special dividend from Tencent Holdings Ltd in January 2023. The impact of the special dividend to Net investment income/(loss) per share and Ratio of Net Investment Income/(Loss) to Average Net Assets is $0.02 and 0.58%, respectively. (3) Total return without the effect of affiliated payments would have been (4.89)%. |
| | |
See Notes to Financial Statements. |
| |
Janus Investment Fund | 17 |
Janus Henderson Emerging Markets Fund
Financial Highlights
| | | | | | | | | | | | | | | | | | | | | | |
Class C Shares | | | | | | | | | | | | | | | | | | |
For a share outstanding during the period ended March 31, 2023 (unaudited) and the year ended September 30 | 2023 | | | 2022 | | | 2021 | | | 2020 | | | 2019 | | | 2018 | |
| Net Asset Value, Beginning of Period | | $7.49 | | | $11.29 | | | $9.69 | | | $8.42 | | | $9.12 | | | $9.98 | |
| Income/(Loss) from Investment Operations: | | | | | | | | | | | | | | | | | | |
| | Net investment income/(loss)(1) | | (0.01)(2) | | | (0.04) | | | (0.12) | | | (0.04) | | | 0.05 | | | 0.01 | |
| | Net realized and unrealized gain/(loss) | | 0.97 | | | (3.60) | | | 1.74 | | | 1.35 | | | (0.55) | | | (0.65) | |
| Total from Investment Operations | | 0.96 | | | (3.64) | | | 1.62 | | | 1.31 | | | (0.50) | | | (0.64) | |
| Less Dividends and Distributions: | | | | | | | | | | | | | | | | | | |
| | Dividends (from net investment income) | | — | | | (0.16) | | | (0.02) | | | (0.04) | | | (0.02) | | | (0.01) | |
| | Distributions (from capital gains) | | — | | | — | | | — | | | — | | | (0.18) | | | (0.21) | |
| Total Dividends and Distributions | | — | | | (0.16) | | | (0.02) | | | (0.04) | | | (0.20) | | | (0.22) | |
| Net Asset Value, End of Period | | $8.45 | | | $7.49 | | | $11.29 | | | $9.69 | | | $8.42 | | | $9.12 | |
| Total Return* | | 12.82% | | | (32.66)% | | | 16.67% | | | 15.56% | | | (5.38)%(3) | | | (6.59)% | |
| Net Assets, End of Period (in thousands) | | $804 | | | $938 | | | $1,802 | | | $2,573 | | | $3,432 | | | $5,985 | |
| Average Net Assets for the Period (in thousands) | | $859 | | | $1,432 | | | $2,385 | | | $2,927 | | | $4,604 | | | $8,442 | |
| Ratios to Average Net Assets**: | | | | | | | | | | | | | | | | | | |
| | Ratio of Gross Expenses | | 2.88% | | | 2.63% | | | 2.48% | | | 2.61% | | | 2.54% | | | 2.26% | |
| | Ratio of Net Expenses (After Waivers and Expense Offsets) | | 2.14% | | | 2.11% | | | 2.11% | | | 2.09% | | | 2.11% | | | 2.07% | |
| | Ratio of Net Investment Income/(Loss) | | (0.28)%(2) | | | (0.40)% | | | (1.06)% | | | (0.44)% | | | 0.56% | | | 0.11% | |
| Portfolio Turnover Rate | | 37% | | | 63% | | | 76% | | | 110% | | | 68% | | | 26% | |
| | | | | | | | | | | | | | | | | | | | | | |
| |
* Total return includes adjustments in accordance with generally accepted accounting principles required at the year or period end and are not annualized for periods of less than one full year. ** Annualized for periods of less than one full year. (1) Per share amounts are calculated based on average shares outstanding during the year or period. (2) Net investment income/(loss) per share and Ratio of Net Investment Income/(Loss) to Average Net Assets include a special dividend from Tencent Holdings Ltd in January 2023. The impact of the special dividend to Net investment income/(loss) per share and Ratio of Net Investment Income/(Loss) to Average Net Assets is $0.02 and 0.58%, respectively. (3) Total return without the effect of affiliated payments would have been (5.61)%. |
| | |
See Notes to Financial Statements. |
| |
18 | MARCH 31, 2023 |
Janus Henderson Emerging Markets Fund
Financial Highlights
| | | | | | | | | | | | | | | | | | | | | | |
Class D Shares | | | | | | | | | | | | | | | | | | |
For a share outstanding during the period ended March 31, 2023 (unaudited) and the year ended September 30 | 2023 | | | 2022 | | | 2021 | | | 2020 | | | 2019 | | | 2018 | |
| Net Asset Value, Beginning of Period | | $7.76 | | | $11.77 | | | $10.09 | | | $8.78 | | | $9.53 | | | $10.41 | |
| Income/(Loss) from Investment Operations: | | | | | | | | | | | | | | | | | | |
| | Net investment income/(loss)(1) | | 0.03(2) | | | 0.05 | | | (0.01) | | | 0.05 | | | 0.14 | | | 0.11 | |
| | Net realized and unrealized gain/(loss) | | 1.00 | | | (3.72) | | | 1.81 | | | 1.41 | | | (0.59) | | | (0.67) | |
| Total from Investment Operations | | 1.03 | | | (3.67) | | | 1.80 | | | 1.46 | | | (0.45) | | | (0.56) | |
| Less Dividends and Distributions: | | | | | | | | | | | | | | | | | | |
| | Dividends (from net investment income) | | — | | | (0.34) | | | (0.12) | | | (0.15) | | | (0.12) | | | (0.11) | |
| | Distributions (from capital gains) | | — | | | — | | | — | | | — | | | (0.18) | | | (0.21) | |
| Total Dividends and Distributions | | — | | | (0.34) | | | (0.12) | | | (0.15) | | | (0.30) | | | (0.32) | |
| Net Asset Value, End of Period | | $8.79 | | | $7.76 | | | $11.77 | | | $10.09 | | | $8.78 | | | $9.53 | |
| Total Return* | | 13.27% | | | (32.03)% | | | 17.85% | | | 16.66% | | | (4.59)%(3) | | | (5.64)% | |
| Net Assets, End of Period (in thousands) | | $13,550 | | | $11,223 | | | $17,993 | | | $10,854 | | | $10,957 | | | $13,104 | |
| Average Net Assets for the Period (in thousands) | | $12,606 | | | $14,826 | | | $20,727 | | | $10,785 | | | $12,337 | | | $15,607 | |
| Ratios to Average Net Assets**: | | | | | | | | | | | | | | | | | | |
| | Ratio of Gross Expenses | | 1.67% | | | 1.55% | | | 1.45% | | | 1.70% | | | 1.80% | | | 1.38% | |
| | Ratio of Net Expenses (After Waivers and Expense Offsets) | | 1.21% | | | 1.19% | | | 1.17% | | | 1.19% | | | 1.19% | | | 1.15% | |
| | Ratio of Net Investment Income/(Loss) | | 0.65%(2) | | | 0.53% | | | (0.07)% | | | 0.50% | | | 1.51% | | | 1.08% | |
| Portfolio Turnover Rate | | 37% | | | 63% | | | 76% | | | 110% | | | 68% | | | 26% | |
| | | | | | | | | | | | | | | | | | | | | | |
| |
* Total return includes adjustments in accordance with generally accepted accounting principles required at the year or period end and are not annualized for periods of less than one full year. ** Annualized for periods of less than one full year. (1) Per share amounts are calculated based on average shares outstanding during the year or period. (2) Net investment income/(loss) per share and Ratio of Net Investment Income/(Loss) to Average Net Assets include a special dividend from Tencent Holdings Ltd in January 2023. The impact of the special dividend to Net investment income/(loss) per share and Ratio of Net Investment Income/(Loss) to Average Net Assets is $0.02 and 0.58%, respectively. (3) Total return without the effect of affiliated payments would have been (4.82)%. |
| | |
See Notes to Financial Statements. |
| |
Janus Investment Fund | 19 |
Janus Henderson Emerging Markets Fund
Financial Highlights
| | | | | | | | | | | | | | | | | | | | | | |
Class I Shares | | | | | | | | | | | | | | | | | | |
For a share outstanding during the period ended March 31, 2023 (unaudited) and the year ended September 30 | 2023 | | | 2022 | | | 2021 | | | 2020 | | | 2019 | | | 2018 | |
| Net Asset Value, Beginning of Period | | $7.74 | | | $11.74 | | | $10.07 | | | $8.78 | | | $9.52 | | | $10.42 | |
| Income/(Loss) from Investment Operations: | | | | | | | | | | | | | | | | | | |
| | Net investment income/(loss)(1) | | 0.03(2) | | | 0.06 | | | —(3) | | | 0.05 | | | 0.14 | | | 0.12 | |
| | Net realized and unrealized gain/(loss) | | 1.00 | | | (3.71) | | | 1.80 | | | 1.41 | | | (0.57) | | | (0.69) | |
| Total from Investment Operations | | 1.03 | | | (3.65) | | | 1.80 | | | 1.46 | | | (0.43) | | | (0.57) | |
| Less Dividends and Distributions: | | | | | | | | | | | | | | | | | | |
| | Dividends (from net investment income) | | — | | | (0.35) | | | (0.13) | | | (0.17) | | | (0.13) | | | (0.12) | |
| | Distributions (from capital gains) | | — | | | — | | | — | | | — | | | (0.18) | | | (0.21) | |
| Total Dividends and Distributions | | — | | | (0.35) | | | (0.13) | | | (0.17) | | | (0.31) | | | (0.33) | |
| Net Asset Value, End of Period | | $8.77 | | | $7.74 | | | $11.74 | | | $10.07 | | | $8.78 | | | $9.52 | |
| Total Return* | | 13.31% | | | (31.97)% | | | 17.94% | | | 16.68% | | | (4.38)%(4) | | | (5.72)% | |
| Net Assets, End of Period (in thousands) | | $8,757 | | | $9,817 | | | $19,208 | | | $19,939 | | | $34,499 | | | $107,276 | |
| Average Net Assets for the Period (in thousands) | | $9,178 | | | $15,044 | | | $21,247 | | | $25,327 | | | $71,330 | | | $119,036 | |
| Ratios to Average Net Assets**: | | | | | | | | | | | | | | | | | | |
| | Ratio of Gross Expenses | | 1.56% | | | 1.45% | | | 1.37% | | | 1.54% | | | 1.45% | | | 1.26% | |
| | Ratio of Net Expenses (After Waivers and Expense Offsets) | | 1.14% | | | 1.12% | | | 1.11% | | | 1.11% | | | 1.13% | | | 1.09% | |
| | Ratio of Net Investment Income/(Loss) | | 0.70%(2) | | | 0.58% | | | (0.02)% | | | 0.50% | | | 1.49% | | | 1.17% | |
| Portfolio Turnover Rate | | 37% | | | 63% | | | 76% | | | 110% | | | 68% | | | 26% | |
| | | | | | | | | | | | | | | | | | | | | | |
| |
* Total return includes adjustments in accordance with generally accepted accounting principles required at the year or period end and are not annualized for periods of less than one full year. ** Annualized for periods of less than one full year. (1) Per share amounts are calculated based on average shares outstanding during the year or period. (2) Net investment income/(loss) per share and Ratio of Net Investment Income/(Loss) to Average Net Assets include a special dividend from Tencent Holdings Ltd in January 2023. The impact of the special dividend to Net investment income/(loss) per share and Ratio of Net Investment Income/(Loss) to Average Net Assets is $0.02 and 0.58%, respectively. (3) Less than $0.005 on a per share basis. (4) Total return without the effect of affiliated payments would have been (4.61)%. |
| | |
See Notes to Financial Statements. |
| |
20 | MARCH 31, 2023 |
Janus Henderson Emerging Markets Fund
Financial Highlights
| | | | | | | | | | | | | | | | | | | | | | |
Class N Shares | | | | | | | | | | | | | | | | | | |
For a share outstanding during the period ended March 31, 2023 (unaudited) and the year ended September 30 | 2023 | | | 2022 | | | 2021 | | | 2020 | | | 2019 | | | 2018 | |
| Net Asset Value, Beginning of Period | | $7.76 | | | $11.77 | | | $10.09 | | | $8.79 | | | $9.53 | | | $10.42 | |
| Income/(Loss) from Investment Operations: | | | | | | | | | | | | | | | | | | |
| | Net investment income/(loss)(1) | | 0.03(2) | | | 0.07 | | | 0.01 | | | 0.06 | | | 0.15 | | | 0.12 | |
| | Net realized and unrealized gain/(loss) | | 1.01 | | | (3.72) | | | 1.80 | | | 1.40 | | | (0.57) | | | (0.68) | |
| Total from Investment Operations | | 1.04 | | | (3.65) | | | 1.81 | | | 1.46 | | | (0.42) | | | (0.56) | |
| Less Dividends and Distributions: | | | | | | | | | | | | | | | | | | |
| | Dividends (from net investment income) | | — | | | (0.36) | | | (0.13) | | | (0.16) | | | (0.14) | | | (0.12) | |
| | Distributions (from capital gains) | | — | | | — | | | — | | | — | | | (0.18) | | | (0.21) | |
| Total Dividends and Distributions | | — | | | (0.36) | | | (0.13) | | | (0.16) | | | (0.32) | | | (0.33) | |
| Net Asset Value, End of Period | | $8.80 | | | $7.76 | | | $11.77 | | | $10.09 | | | $8.79 | | | $9.53 | |
| Total Return* | | 13.40% | | | (31.91)% | | | 18.00% | | | 16.74% | | | (4.33)%(3) | | | (5.63)% | |
| Net Assets, End of Period (in thousands) | | $36,874 | | | $36,963 | | | $60,241 | | | $35,207 | | | $16,531 | | | $25,134 | |
| Average Net Assets for the Period (in thousands) | | $37,320 | | | $49,362 | | | $53,668 | | | $30,308 | | | $21,520 | | | $29,832 | |
| Ratios to Average Net Assets**: | | | | | | | | | | | | | | | | | | |
| | Ratio of Gross Expenses | | 1.45% | | | 1.35% | | | 1.28% | | | 1.48% | | | 1.41% | | | 1.20% | |
| | Ratio of Net Expenses (After Waivers and Expense Offsets) | | 1.05% | | | 1.04% | | | 1.03% | | | 1.03% | | | 1.03% | | | 1.03% | |
| | Ratio of Net Investment Income/(Loss) | | 0.80%(2) | | | 0.69% | | | 0.10% | | | 0.68% | | | 1.65% | | | 1.15% | |
| Portfolio Turnover Rate | | 37% | | | 63% | | | 76% | | | 110% | | | 68% | | | 26% | |
| | | | | | | | | | | | | | | | | | | | | | |
| |
* Total return includes adjustments in accordance with generally accepted accounting principles required at the year or period end and are not annualized for periods of less than one full year. ** Annualized for periods of less than one full year. (1) Per share amounts are calculated based on average shares outstanding during the year or period. (2) Net investment income/(loss) per share and Ratio of Net Investment Income/(Loss) to Average Net Assets include a special dividend from Tencent Holdings Ltd in January 2023. The impact of the special dividend to Net investment income/(loss) per share and Ratio of Net Investment Income/(Loss) to Average Net Assets is $0.02 and 0.58%, respectively. (3) Total return without the effect of affiliated payments would have been (4.56)%. |
| | |
See Notes to Financial Statements. |
| |
Janus Investment Fund | 21 |
Janus Henderson Emerging Markets Fund
Financial Highlights
| | | | | | | | | | | | | | | | | | | | | | |
Class S Shares | | | | | | | | | | | | | | | | | | |
For a share outstanding during the period ended March 31, 2023 (unaudited) and the year ended September 30 | 2023 | | | 2022 | | | 2021 | | | 2020 | | | 2019 | | | 2018 | |
| Net Asset Value, Beginning of Period | | $7.82 | | | $11.85 | | | $10.17 | | | $8.81 | | | $9.51 | | | $10.41 | |
| Income/(Loss) from Investment Operations: | | | | | | | | | | | | | | | | | | |
| | Net investment income/(loss)(1) | | 0.01(2) | | | 0.02 | | | (0.05) | | | 0.02 | | | 0.08 | | | 0.13 | |
| | Net realized and unrealized gain/(loss) | | 1.00 | | | (3.75) | | | 1.83 | | | 1.41 | | | (0.52) | | | (0.73) | |
| Total from Investment Operations | | 1.01 | | | (3.73) | | | 1.78 | | | 1.43 | | | (0.44) | | | (0.60) | |
| Less Dividends and Distributions: | | | | | | | | | | | | | | | | | | |
| | Dividends (from net investment income) | | — | | | (0.30) | | | (0.10) | | | (0.07) | | | (0.08) | | | (0.09) | |
| | Distributions (from capital gains) | | — | | | — | | | — | | | — | | | (0.18) | | | (0.21) | |
| Total Dividends and Distributions | | — | | | (0.30) | | | (0.10) | | | (0.07) | | | (0.26) | | | (0.30) | |
| Net Asset Value, End of Period | | $8.83 | | | $7.82 | | | $11.85 | | | $10.17 | | | $8.81 | | | $9.51 | |
| Total Return* | | 12.92% | | | (32.21)% | | | 17.47% | | | 16.26% | | | (4.49)%(3) | | | (5.98)% | |
| Net Assets, End of Period (in thousands) | | $81 | | | $76 | | | $93 | | | $95 | | | $77 | | | $1,753 | |
| Average Net Assets for the Period (in thousands) | | $82 | | | $89 | | | $113 | | | $79 | | | $488 | | | $1,189 | |
| Ratios to Average Net Assets**: | | | | | | | | | | | | | | | | | | |
| | Ratio of Gross Expenses | | 5.62% | | | 5.24% | | | 4.44% | | | 5.74% | | | 2.25% | | | 1.85% | |
| | Ratio of Net Expenses (After Waivers and Expense Offsets) | | 1.55% | | | 1.55% | | | 1.49% | | | 1.46% | | | 1.18% | | | 1.47% | |
| | Ratio of Net Investment Income/(Loss) | | 0.33%(2) | | | 0.22% | | | (0.38)% | | | 0.27% | | | 0.89% | | | 1.28% | |
| Portfolio Turnover Rate | | 37% | | | 63% | | | 76% | | | 110% | | | 68% | | | 26% | |
| | | | | | | | | | | | | | | | | | | | | | |
| |
* Total return includes adjustments in accordance with generally accepted accounting principles required at the year or period end and are not annualized for periods of less than one full year. ** Annualized for periods of less than one full year. (1) Per share amounts are calculated based on average shares outstanding during the year or period. (2) Net investment income/(loss) per share and Ratio of Net Investment Income/(Loss) to Average Net Assets include a special dividend from Tencent Holdings Ltd in January 2023. The impact of the special dividend to Net investment income/(loss) per share and Ratio of Net Investment Income/(Loss) to Average Net Assets is $0.02 and 0.58%, respectively. (3) Total return without the effect of affiliated payments would have been (4.72)%. |
| | |
See Notes to Financial Statements. |
| |
22 | MARCH 31, 2023 |
Janus Henderson Emerging Markets Fund
Financial Highlights
| | | | | | | | | | | | | | | | | | | | | | |
Class T Shares | | | | | | | | | | | | | | | | | | |
For a share outstanding during the period ended March 31, 2023 (unaudited) and the year ended September 30 | 2023 | | | 2022 | | | 2021 | | | 2020 | | | 2019 | | | 2018 | |
| Net Asset Value, Beginning of Period | | $7.75 | | | $11.75 | | | $10.08 | | | $8.78 | | | $9.52 | | | $10.42 | |
| Income/(Loss) from Investment Operations: | | | | | | | | | | | | | | | | | | |
| | Net investment income/(loss)(1) | | 0.02(2) | | | 0.04 | | | (0.02) | | | 0.04 | | | 0.13 | | | 0.10 | |
| | Net realized and unrealized gain/(loss) | | 1.01 | | | (3.72) | | | 1.80 | | | 1.40 | | | (0.57) | | | (0.68) | |
| Total from Investment Operations | | 1.03 | | | (3.68) | | | 1.78 | | | 1.44 | | | (0.44) | | | (0.58) | |
| Less Dividends and Distributions: | | | | | | | | | | | | | | | | | | |
| | Dividends (from net investment income) | | — | | | (0.32) | | | (0.11) | | | (0.14) | | | (0.12) | | | (0.11) | |
| | Distributions (from capital gains) | | — | | | — | | | — | | | — | | | (0.18) | | | (0.21) | |
| Total Dividends and Distributions | | — | | | (0.32) | | | (0.11) | | | (0.14) | | | (0.30) | | | (0.32) | |
| Net Asset Value, End of Period | | $8.78 | | | $7.75 | | | $11.75 | | | $10.08 | | | $8.78 | | | $9.52 | |
| Total Return* | | 13.29% | | | (32.10)% | | | 17.69% | | | 16.43% | | | (4.56)%(3) | | | (5.86)% | |
| Net Assets, End of Period (in thousands) | | $1,762 | | | $1,689 | | | $2,940 | | | $2,444 | | | $3,008 | | | $4,862 | |
| Average Net Assets for the Period (in thousands) | | $1,498 | | | $2,419 | | | $3,095 | | | $2,477 | | | $4,046 | | | $7,275 | |
| Ratios to Average Net Assets**: | | | | | | | | | | | | | | | | | | |
| | Ratio of Gross Expenses | | 1.89% | | | 1.72% | | | 1.62% | | | 1.82% | | | 1.73% | | | 1.45% | |
| | Ratio of Net Expenses (After Waivers and Expense Offsets) | | 1.29% | | | 1.28% | | | 1.28% | | | 1.28% | | | 1.27% | | | 1.26% | |
| | Ratio of Net Investment Income/(Loss) | | 0.55%(2) | | | 0.44% | | | (0.18)% | | | 0.40% | | | 1.41% | | | 0.93% | |
| Portfolio Turnover Rate | | 37% | | | 63% | | | 76% | | | 110% | | | 68% | | | 26% | |
| | | | | | | | | | | | | | | | | | | | | | |
| |
* Total return includes adjustments in accordance with generally accepted accounting principles required at the year or period end and are not annualized for periods of less than one full year. ** Annualized for periods of less than one full year. (1) Per share amounts are calculated based on average shares outstanding during the year or period. (2) Net investment income/(loss) per share and Ratio of Net Investment Income/(Loss) to Average Net Assets include a special dividend from Tencent Holdings Ltd in January 2023. The impact of the special dividend to Net investment income/(loss) per share and Ratio of Net Investment Income/(Loss) to Average Net Assets is $0.02 and 0.58%, respectively. (3) Total return without the effect of affiliated payments would have been (4.79)%. |
| | |
See Notes to Financial Statements. |
| |
Janus Investment Fund | 23 |
Janus Henderson Emerging Markets Fund
Notes to Financial Statements (unaudited)
1. Organization and Significant Accounting Policies
Janus Henderson Emerging Markets Fund (the “Fund”) is a series of Janus Investment Fund (the “Trust”), which is organized as a Massachusetts business trust and is registered under the Investment Company Act of 1940, as amended (the “1940 Act”), as an open-end management investment company, and therefore has applied the specialized accounting and reporting guidance in Financial Accounting Standards Board (“FASB”) Accounting Standards Codification (“ASC”) Topic 946. The Trust offers 40 funds, each of which offers multiple share classes, with differing investment objectives and policies. The Fund seeks long-term growth of capital. The Fund is classified as diversified, as defined in the 1940 Act. Janus Henderson Investors US LLC is the investment adviser (the “Adviser”) to the Fund.
The Fund offers multiple classes of shares in order to meet the needs of various types of investors. Each class represents an interest in the same portfolio of investments. Certain financial intermediaries may not offer all classes of shares.
Shareholders, including individuals, accounts, as well as the Fund’s portfolio manager(s) and/or investment personnel, may from time to time own (beneficially or of record) a significant percentage of the Fund’s Shares and can be considered to “control” the Fund when that ownership exceeds 25% of the Fund’s assets (and which may differ from control as determined in accordance with United States of America generally accepted accounting principles ("US GAAP")).
Class A Shares are offered through financial intermediary platforms including, but not limited to, traditional brokerage platforms, mutual fund wrap fee programs, bank trust platforms, and retirement platforms.
Class C Shares are offered through financial intermediary platforms including, but not limited to, traditional brokerage platforms, mutual fund wrap fee programs, and bank trust platforms.
Class C Shares are closed to investments by new employer-sponsored retirement plans and existing employer-sponsored retirement plans are no longer able to make additional purchases or exchanges into Class C Shares.
The Fund currently implements an automatic conversion feature pursuant to which Class C Shares that have been held for eight years are automatically converted to Class A Shares without the imposition of any sales charge, fee or other charge. The conversion will generally occur no later than ten business days in the month following the month of the eighth anniversary of the date of purchase. Class C Shares purchased through the reinvestment of dividends and other distributions on Class C Shares will convert to Class A Shares at the same time as the original Class C Shares with respect to which they were purchased. For Class C Shares held in omnibus accounts on intermediary platforms, the Fund relies on these intermediaries to implement this conversion feature. Your financial intermediary may have separate policies and procedures as to when and how Class C Shares may be converted to Class A Shares.
Effective July 6, 2020, Class D Shares are available to new investors, subject to any closed fund policies for a Fund, as applicable. Previously, Class D Shares were only available to investors who already had a direct account with the Janus Henderson funds; immediate family members or members of the same household of an eligible individual investor; and existing beneficial owners of sole proprietorships or partnerships that hold accounts directly with the Janus Henderson funds.
Class I Shares are available through certain financial intermediary platforms including, but not limited to, mutual fund wrap fee programs, managed account programs, asset allocation programs, bank trust platforms, as well as certain retirement platforms. Class I Shares are also available to certain direct institutional investors including, but not limited to, corporations, certain retirement plans, public plans, and foundations/endowments, who established Class I Share accounts before August 4, 2017.
Class N Shares are generally available only to financial intermediaries purchasing on behalf of: 1) certain adviser-assisted, employer-sponsored retirement plans, including 401(k) plans, 457 plans, 403(b) plans, Taft-Hartley multi-employer plans, profit-sharing and money purchase pension plans, defined benefit plans and certain welfare benefit plans, such as health savings accounts, and nonqualified deferred compensation plans; and 2) retail investors purchasing in qualified or nonqualified accounts, whose accounts are held through an omnibus account at their financial intermediary, and where the financial intermediary requires no payment or reimbursement from the Fund, the Adviser, or its affiliates. Class N Shares are also available to Janus Henderson proprietary products and to certain direct institutional investors approved by Janus Henderson Distributors US LLC (the “Distributor”) including, but not limited to,
Janus Henderson Emerging Markets Fund
Notes to Financial Statements (unaudited)
corporations, certain retirement plans, public plans, and foundations and endowments, subject to minimum investment requirements.
Class S Shares are offered through financial intermediary platforms including, but not limited to, retirement platforms and asset allocation, mutual fund wrap, or other discretionary or nondiscretionary fee-based investment advisory programs. In addition, Class S Shares may be available through certain financial intermediaries who have an agreement with the Adviser or its affiliates to offer Class S Shares on their supermarket platforms.
Class T Shares are available through certain financial intermediary platforms including, but not limited to, mutual fund wrap fee programs, managed account programs, asset allocation programs, bank trust platforms, as well as certain retirement platforms. In addition, Class T Shares may be available through certain financial intermediaries who have an agreement with the Adviser or its affiliates to offer Class T Shares on their supermarket platforms.
The following accounting policies have been followed by the Fund and are in conformity with US GAAP.
Investment Valuation
Fund holdings are valued in accordance with policies and procedures established by the Adviser pursuant to Rule 2a-5 under the 1940 Act and approved by and subject to the oversight of the Trustees (the “Valuation Procedures”). Equity securities traded on a domestic securities exchange are generally valued at readily available market quotations, which are (i) the official close prices or (ii) last sale prices on the primary market or exchange in which the securities trade. If such price is lacking for the trading period immediately preceding the time of determination, such securities are generally valued at their current bid price. Equity securities that are traded on a foreign exchange are generally valued at the closing prices on such markets. In the event that there is no current trading volume on a particular security in such foreign exchange, the bid price from the primary exchange is generally used to value the security. Foreign securities and currencies are converted to U.S. dollars using the current spot USD dollar exchange rate in effect at the close of the New York Stock Exchange (“NYSE”). The Fund will determine the market value of individual securities held by it by using prices provided by one or more approved professional pricing services or, as needed, by obtaining market quotations from independent broker-dealers. Most debt securities are valued in accordance with the evaluated bid price supplied by the Adviser-approved pricing service that is intended to reflect market value. The evaluated bid price supplied by the pricing service is an evaluation that may consider factors such as security prices, yields, maturities and ratings. Certain short-term securities maturing within 60 days or less may be evaluated and valued on an amortized cost basis provided that the amortized cost determined approximates market value. Securities for which market quotations or evaluated prices are not readily available or deemed unreliable are valued at fair value determined in good faith by the Adviser pursuant to the Valuation Procedures. Circumstances in which fair valuation may be utilized include, but are not limited to: (i) a significant event that may affect the securities of a single issuer, such as a merger, bankruptcy, or significant issuer-specific development; (ii) an event that may affect an entire market, such as a natural disaster or significant governmental action; (iii) a nonsignificant event such as a market closing early or not opening, or a security trading halt; and (iv) pricing of a nonvalued security and a restricted or nonpublic security. Special valuation considerations may apply with respect to “odd-lot” fixed-income transactions which, due to their small size, may receive evaluated prices by pricing services which reflect a large block trade and not what actually could be obtained for the odd-lot position. The valuation policies provide for the use of systematic fair valuation models provided by independent pricing services to value foreign equity securities in order to adjust for stale pricing, which may occur between the close of certain foreign exchanges and the close of the NYSE. The value of the securities of other mutual funds held by a Fund, if any, will be calculated using the NAV of such mutual funds.
Valuation Inputs Summary
FASB ASC 820, Fair Value Measurements and Disclosures (“ASC 820”), defines fair value, establishes a framework for measuring fair value, and expands disclosure requirements regarding fair value measurements. This standard emphasizes that fair value is a market-based measurement that should be determined based on the assumptions that market participants would use in pricing an asset or liability and establishes a hierarchy that prioritizes inputs to valuation techniques used to measure fair value. These inputs are summarized into three broad levels:
Level 1 – Unadjusted quoted prices in active markets the Fund has the ability to access for identical assets or liabilities.
Level 2 – Observable inputs other than unadjusted quoted prices included in Level 1 that are observable for the asset or liability either directly or indirectly. These inputs may include quoted prices for the identical instrument on
Janus Henderson Emerging Markets Fund
Notes to Financial Statements (unaudited)
an inactive market, prices for similar instruments, interest rates, prepayment speeds, credit risk, yield curves, default rates and similar data.
Assets or liabilities categorized as Level 2 in the hierarchy generally include: debt securities fair valued in accordance with the evaluated bid or ask prices supplied by a pricing service; securities traded on OTC markets and listed securities for which no sales are reported that are fair valued at the latest bid price (or yield equivalent thereof) obtained from one or more dealers transacting in a market for such securities or by a pricing service approved by the Fund’s Trustees; certain short-term debt securities with maturities of 60 days or less that are fair valued at amortized cost; and equity securities of foreign issuers whose fair value is determined by using systematic fair valuation models provided by independent third parties in order to adjust for stale pricing which may occur between the close of certain foreign exchanges and the close of the NYSE. Other securities that may be categorized as Level 2 in the hierarchy include, but are not limited to, preferred stocks, bank loans, swaps, investments in unregistered investment companies, options, and forward contracts.
Level 3 – Unobservable inputs for the asset or liability to the extent that relevant observable inputs are not available, representing the Fund’s own assumptions about the assumptions that a market participant would use in valuing the asset or liability, and that would be based on the best information available. For private placements where observable inputs are limited, assumptions about market activity and risk are used in employing valuation techniques such as the market approach, the income approach, or the cost approach, as defined under ASC 820. These are categorized as Level 3 in the hierarchy.
For significant fair value measurements categorized within Level 3 of the fair value hierarchy, the table below summarizes the valuation techniques and provides quantitative information about the significant unobservable inputs. In addition, the table provides a narrative description of the uncertainty of the fair value measurement based on the use of significant unobservable inputs that have been different, or that reasonable could have been different, at the reporting date.
| | | | | | |
Asset | Fair Value at March 31, 2023 | Valuation Technique | Unobservable Input | Input Amount or Range | Impact to Valuation from an Increase in Input |
Private Placements | | | | | |
Biotechnology | $661,571 | Market Approach | Discount | 10% | Decrease |
Health Care Providers & Services | $269,312 | Market Approach | Broker Model | INR 29.184 | Increase |
INR Indian Rupee
There have been no significant changes in valuation techniques used in valuing any such positions held by the Fund since the beginning of the fiscal period.
The inputs or methodology used for fair valuing securities are not necessarily an indication of the risk associated with investing in those securities. The summary of inputs used as of March 31, 2023 to fair value the Fund’s investments in securities and other financial instruments is included in the “Valuation Inputs Summary” in the Notes to Schedule of Investments and Other Information.
Investment Transactions and Investment Income
Investment transactions are accounted for as of the date purchased or sold (trade date). Dividend income is recorded on the ex-dividend date. Certain dividends from foreign securities will be recorded as soon as the Fund is informed of the dividend, if such information is obtained subsequent to the ex-dividend date. Dividends from foreign securities may be subject to withholding taxes in foreign jurisdictions. Non-cash dividends, if any, are recorded on the ex-dividend date at fair value. Interest income is recorded daily on an accrual basis and includes amortization of premiums and accretion of discounts. The Fund classifies gains and losses on prepayments received as an adjustment to interest income. Debt securities may be placed in non-accrual status and related interest income may be reduced by stopping current accruals and writing off interest receivables when collection of all or a portion of interest has become doubtful. Gains
Janus Henderson Emerging Markets Fund
Notes to Financial Statements (unaudited)
and losses are determined on the identified cost basis, which is the same basis used for federal income tax purposes. Income, as well as gains and losses, both realized and unrealized, are allocated daily to each class of shares based upon the ratio of net assets represented by each class as a percentage of total net assets.
Expenses
The Fund bears expenses incurred specifically on its behalf. Each class of shares bears a portion of general expenses, which are allocated daily to each class of shares based upon the ratio of net assets represented by each class as a percentage of total net assets. Expenses directly attributable to a specific class of shares are charged against the operations of such class.
Estimates
The preparation of financial statements in conformity with US GAAP requires management to make estimates and assumptions that affect the reported amount of assets and liabilities and disclosure of contingent assets and liabilities at the date of the financial statements, and the reported amounts of income and expenses during the reporting period. Actual results could differ from those estimates.
Indemnifications
In the normal course of business, the Fund may enter into contracts that contain provisions for indemnification of other parties against certain potential liabilities. The Fund’s maximum exposure under these arrangements is unknown, and would involve future claims that may be made against the Fund that have not yet occurred. Currently, the risk of material loss from such claims is considered remote.
Foreign Currency Translations
The Fund does not isolate that portion of the results of operations resulting from the effect of changes in foreign exchange rates on investments from the fluctuations arising from changes in market prices of securities held at the date of the financial statements. Net unrealized appreciation or depreciation of investments and foreign currency translations arise from changes in the value of assets and liabilities, including investments in securities held at the date of the financial statements, resulting from changes in the exchange rates and changes in market prices of securities held.
Currency gains and losses are also calculated on payables and receivables that are denominated in foreign currencies. The payables and receivables are generally related to foreign security transactions and income translations.
Foreign currency-denominated assets and forward currency contracts may involve more risks than domestic transactions, including currency risk, counterparty risk, political and economic risk, regulatory risk and equity risk. Risks may arise from unanticipated movements in the value of foreign currencies relative to the U.S. dollar.
Dividends and Distributions
The Fund generally declares and distributes dividends of net investment income and realized capital gains (if any) annually. The Fund may treat a portion of the amount paid to redeem shares as a distribution of investment company taxable income and realized capital gains that are reflected in the net asset value. This practice, commonly referred to as “equalization,” has no effect on the redeeming shareholder or a Fund’s total return, but may reduce the amounts that would otherwise be required to be paid as taxable dividends to the remaining shareholders. It is possible that the Internal Revenue Service (IRS) could challenge the Fund's equalization methodology or calculations, and any such challenge could result in additional tax, interest, or penalties to be paid by the Fund.
The Fund may make certain investments in real estate investment trusts (“REITs”) which pay dividends to their shareholders based upon funds available from operations. It is quite common for these dividends to exceed the REITs’ taxable earnings and profits, resulting in the excess portion of such dividends being designated as a return of capital. If the Fund distributes such amounts, such distributions could constitute a return of capital to shareholders for federal income tax purposes.
Federal Income Taxes
The Fund intends to continue to qualify as a regulated investment company and distribute all of its taxable income in accordance with the requirements of Subchapter M of the Internal Revenue Code. Management has analyzed the Fund’s tax positions taken for all open federal income tax years, generally a three-year period, and has concluded that no provision for federal income tax is required in the Fund’s financial statements. The Fund is not aware of any tax positions for which it is reasonably possible that the total amounts of unrecognized tax benefits will significantly change in the next twelve months.
Janus Henderson Emerging Markets Fund
Notes to Financial Statements (unaudited)
2. Other Investments and Strategies
Additional Investment Risk
The U.S. government and the Federal Reserve, as well as certain foreign governments and central banks, have taken extraordinary actions to support local and global economies and the financial markets in response to the COVID-19 pandemic. This and other government intervention into the economy and financial markets to address the COVID-19 pandemic may not work as intended, particularly if the efforts are perceived by investors as being unlikely to achieve the desired results. Government actions to mitigate the economic impact of the pandemic have resulted in a large expansion of government deficits and debt, the long term consequences of which are not known. The COVID-19 pandemic could adversely affect the value and liquidity of a Fund’s investments, impair a Fund’s ability to satisfy redemption requests, and negatively impact a Fund’s performance. In addition, the outbreak of COVID-19, and measures taken to mitigate its effects, could result in disruptions to the services provided to a Fund by its service providers.
Widespread disease, including pandemics and epidemics, and natural or environmental disasters, including those which may be attributable to global climate change, such as earthquakes, fires, floods, hurricanes, tsunamis and weather-related phenomena generally, have been and can be highly disruptive to economies and markets, adversely impacting individual companies, sectors, industries, markets, currencies, interest and inflation rates, credit ratings, investor sentiment, and other factors affecting the value of a Fund’s investments. Economies and financial markets throughout the world have become increasingly interconnected, which increases the likelihood that events or conditions in one region or country will adversely affect markets or issuers in other regions or countries, including the United States. These disruptions could prevent a Fund from executing advantageous investment decisions in a timely manner and negatively impact a Fund’s ability to achieve its investment objective(s). Any such event(s) could have a significant adverse impact on the value of a Fund. In addition, these disruptions could also impair the information technology and other operational systems upon which the Fund’s service providers, including the Adviser or the subadviser (as applicable), rely, and could otherwise disrupt the ability of employees of the Fund’s service providers to perform essential tasks on behalf of the Fund. Adverse weather conditions may also have a particularly significant negative effect on issuers in the agricultural sector and on insurance and reinsurance companies that insure or reinsure against the impact of natural disasters.
A number of countries in the European Union (the “EU”) have experienced, and may continue to experience, severe economic and financial difficulties. In particular, many EU nations are susceptible to economic risks associated with high levels of debt. Many non-governmental issuers, and even certain governments, have defaulted on, or been forced to restructure, their debts. Many other issuers have faced difficulties obtaining credit or refinancing existing obligations. Financial institutions have in many cases required government or central bank support, have needed to raise capital, and/or have been impaired in their ability to extend credit. As a result, financial markets in the EU have experienced extreme volatility and declines in asset values and liquidity. These difficulties may continue, worsen, or spread further within the EU. Responses to these financial problems by European governments, central banks, and others, including austerity measures and reforms, may not work, may result in social unrest, and may limit future growth and economic recovery or have other unintended consequences. Among other things, these developments have adversely affected the value and exchange rate of the euro and pound sterling, and may continue to significantly affect the economies of all EU countries, which in turn may have a material adverse effect on the Fund’s investments in such countries, other countries that depend on EU countries for significant amounts of trade or investment, or issuers with exposure to debt issued by certain EU countries.
Emerging Market Investing
Within the parameters of its specific investment policies, the Fund may invest in securities of issuers or companies from or with exposure to one or more “developing countries” or “emerging market countries.” Such countries include but are not limited to countries included in the MSCI Emerging Markets IndexSM. Emerging market countries in which the Fund may invest include frontier market countries, the economies of which are less developed than other emerging market countries. To the extent that the Fund invests a significant amount of its assets in one or more of these countries, its returns and net asset value may be affected to a large degree by events and economic conditions in such countries. The risks of foreign investing are heightened when investing in emerging markets, which may result in the price of investments in emerging markets experiencing sudden and sharp price swings. In many developing markets, there is less government supervision and regulation of stock exchanges, brokers, and listed companies, making these investments potentially more volatile in price and less liquid than investments in developed securities markets, resulting
Janus Henderson Emerging Markets Fund
Notes to Financial Statements (unaudited)
in greater risk to investors. Similarly, issuers in such markets may not be subject to regulatory, accounting, auditing, and financial reporting and recordkeeping standards comparable to those to which U.S. companies are subject. There is a risk in developing countries that a current or future economic or political crisis could lead to price controls, forced mergers of companies, expropriation or confiscatory taxation, imposition or enforcement of foreign ownership limits, seizure, nationalization, sanctions or imposition of restrictions by various governmental entities on investment and trading, or creation of government monopolies, any of which may have a detrimental effect on the Fund’s investments. In addition, the Fund’s investments may be denominated in foreign currencies and therefore, changes in the value of a country’s currency compared to the U.S. dollar may affect the value of the Fund’s investments. To the extent that the Fund invests a significant portion of its assets in the securities of issuers in or companies of a single country or region, it is more likely to be impacted by events or conditions affecting that country or region, which could have a negative impact on the Fund’s performance. Developing countries may also experience a higher level of exposure and vulnerability to the adverse effects of climate change. This can be attributed to both the geographic location of emerging market countries and/or a country’s lack of access to technology or resources to adjust and adapt to its effects. An increased occurrence and severity of natural disasters and extreme weather events such as droughts and decreased crop yields, heat waves, flooding and rising sea levels, and increased spread of disease, could cause harmful effects to the performance of affected economies. Additionally, foreign and emerging market risks, including, but not limited to, price controls, expropriation or confiscatory taxation, imposition or enforcement of foreign ownership limits, nationalization, and restrictions on repatriation of assets may be heightened to the extent the Fund invests in Chinese local market securities.
Restricted Security Transactions
Restricted securities held by the Fund may not be sold except in exempt transactions or in a public offering registered under the Securities Act of 1933, as amended. The risk of investing in such securities is generally greater than the risk of investing in the securities of widely held, publicly traded companies. Lack of a secondary market and resale restrictions may result in the inability of the Fund to sell a security at a fair price and may substantially delay the sale of the security. In addition, these securities may exhibit greater price volatility than securities for which secondary markets exist.
3. Investment Advisory Agreements and Other Transactions with Affiliates
The Fund pays the Adviser an investment advisory fee which is calculated daily and paid monthly. The following table reflects the Fund’s contractual investment advisory fee rate (expressed as an annual rate).
| | |
Average Daily Net Assets of the Fund | Contractual Investment Advisory Fee (%) |
First $1 Billion | 1.00 |
Next $1 Billion | 0.90 |
Over $2 Billion | 0.85 |
The Fund’s actual investment advisory fee rate for the reporting period was 1.00% of average annual net assets before any applicable waivers.
The Adviser has entered into a personnel-sharing arrangement with its foreign (non-U.S.) affiliates, Henderson Global Investors Limited, Henderson Global Investors (Japan) Ltd., and Henderson Global Investors (Singapore) Ltd. (collectively, “HGIL”), pursuant to which HGIL and certain employees of HGIL serve as “associated persons” of the Adviser. In this capacity, such employees of HGIL are subject to the oversight and supervision of the Adviser and may provide portfolio management, research, and related services to the Fund on behalf of the Adviser.
The Adviser has contractually agreed to waive the investment advisory fee and/or reimburse operating expenses to the extent that the Fund’s total annual fund operating expenses, excluding the fees payable pursuant to a Rule 12b-1 plan, shareholder servicing fees, such as transfer agency fees (including out-of-pocket costs), administrative services fees and any networking/omnibus payable by any share class, brokerage commissions, interest, dividends, taxes, acquired fund fees and expenses, and extraordinary expenses, exceed the annual rate of 1.03% of the Fund’s average daily net assets. The Adviser has agreed to continue the waivers for at least a one-year period commencing January 27, 2023. If applicable, amounts waived and/or reimbursed to the Fund by the Adviser are disclosed as “Excess Expense Reimbursement and Waivers” on the Statement of Operations.
Janus Henderson Emerging Markets Fund
Notes to Financial Statements (unaudited)
The Adviser serves as administrator to the Fund pursuant to an administration agreement between the Adviser and the Trust. Under the administration agreement, the Adviser is authorized to perform, or cause others to perform certain administration, compliance, and accounting services to the Fund, including providing office space for the Fund, and is reimbursed by the Fund for certain of its costs in providing these services (to the extent the Adviser seeks reimbursement and such costs are not otherwise waived). In addition, employees of the Adviser and/or its affiliates may serve as officers of the Trust. The Fund pays for some or all of the salaries, fees, and expenses of the Adviser employees and Fund officers, with respect to certain specified administration functions they perform on behalf of the Fund. The Fund pays these costs based on out-of-pocket expenses incurred by the Adviser, and these costs are separate and apart from advisory fees and other expenses paid in connection with the investment advisory services the Adviser (or any subadvisor, as applicable) provides to the Fund. These amounts are disclosed as “Affiliated fund administration fees” on the Statement of Operations. In addition, some expenses related to compensation payable to the Fund’s Chief Compliance Officer and certain compliance staff, all of whom are employees of the Adviser and/or its affiliates, are shared with the Fund. Total compensation of $114,430 was paid to the Chief Compliance Officer and certain compliance staff by the Trust during the period ended March 31, 2023. The Fund's portion is reported as part of “Other expenses” on the Statement of Operations.
Janus Henderson Services US LLC (the “Transfer Agent”), a wholly-owned subsidiary of the Adviser, is the Fund’s transfer agent. The Transfer Agent provides or arranges for the provision of shareholder services including, but not limited to, recordkeeping, subaccounting, answering inquiries regarding accounts, order processing, transaction confirmations, the mailing of prospectuses and shareholder reports, and other shareholder services provided to or on behalf of shareholders. These amounts are disclosed as “Transfer agent administrative fees and expenses” on the Statement of Operations.
Class D Shares of the Fund pay the Transfer Agent an annual administrative services fee based on the average daily net assets of Class D Shares as detailed below.
| | |
Average Daily Net Assets of Class D Shares of the Janus Henderson funds | Administrative Services Fee |
Under $40 billion | 0.12% |
$40 billion – $49.9 billion | 0.10% |
Over $49.9 billion | 0.08% |
During the reporting period, the administrative services fee rate was 0.12%.
The Transfer Agent receives an administrative services fee at an annual rate of up to 0.25% of the average daily net assets of the Fund’s Class S Shares and Class T Shares for providing or procuring administrative services to investors in Class S Shares and Class T Shares of the Fund. The Transfer Agent expects to use all or a significant portion of this fee to compensate retirement plan service providers, broker-dealers, bank trust departments, financial advisors, and other financial intermediaries for providing these services. The Transfer Agent may keep certain amounts retained for reimbursement of out-of-pocket costs incurred for servicing clients of Class S Shares and Class T Shares.
Shareholder Services provided by these financial intermediaries may include, but are not limited to, recordkeeping, subaccounting, order processing, providing order confirmations, periodic statements, forwarding prospectuses, shareholder reports, and other materials to existing customers, answering inquiries regarding accounts, and other administrative services. Order processing includes the submission of transactions through the National Securities Clearing Corporation (“NSCC”) or similar systems, or those processed on a manual basis with the Adviser. For all share classes, the Transfer Agent also seeks reimbursement for costs it incurs as transfer agent and for providing servicing.
Certain, but not all, intermediaries may charge administrative fees to investors in Class A Shares, Class C Shares, and Class I Shares for administrative services provided on behalf of such investors. These administrative fees are paid by the Class A Shares, Class C Shares, and Class I Shares of the Fund to the Transfer Agent, which uses such fees to reimburse intermediaries. Consistent with the Transfer Agency Agreement between the Transfer Agent and the Fund, the Transfer Agent may negotiate the level, structure, and/or terms of the administrative fees with intermediaries requiring such fees on behalf of the Fund. The Adviser and its affiliates benefit from an increase in assets that may result from such relationships. The Adviser has agreed to limit these fees up to 0.20% for Class A Shares and Class C Shares, and up to 0.15% for Class I Shares on an annual basis based on the daily net assets of each share class. Such limits are subject to change by the Trustees in the future. These amounts are disclosed as “Transfer agent networking and omnibus fees” on the Statement of Operations.
Janus Henderson Emerging Markets Fund
Notes to Financial Statements (unaudited)
The Transfer Agent is not compensated for its services related to the shares, except for out-of-pocket costs, although the Transfer Agent is compensated for its services related to Fund’s Class D Shares. These amounts are disclosed as “Other transfer agent fees and expenses” on the Statement of Operations.
Under distribution and shareholder servicing plans (the “Plans”) adopted in accordance with Rule 12b-1 under the 1940 Act, the Fund pays the Trust’s distributor, the Distributor, a wholly-owned subsidiary of the Adviser, a fee for the sale and distribution and/or shareholder servicing of the shares based on the average daily net assets for each share class at an annual rate of up to 0.25% for Class A Shares, up to 1.00% for Class C Shares, and up to 0.25% for Class S Shares. Under the terms of the Plans, the Trust is authorized to make payments to the Distributor for remittance to retirement plan service providers, broker-dealers, bank trust departments, financial advisors, and other financial intermediaries, as compensation for distribution and/or shareholder services performed by such entities for their customers who are investors in the Fund. These amounts are disclosed as “12b-1 Distribution and shareholder servicing fees” on the Statement of Operations.
Class A Shares include a 5.75% upfront sales charge of the offering price of the Fund. The sales charge is allocated between the Distributor and financial intermediaries. During the period ended March 31, 2023, the Distributor retained upfront sales charges of $24.
A contingent deferred sales charge (“CDSC”) of 1.00% will be deducted with respect to Class A Shares purchased without a sales load and redeemed within 12 months of purchase, unless waived. Any applicable CDSC will be 1.00% of the lesser of the original purchase price or the value of the redemption of the Class A Shares redeemed. There were no CDSCs paid by redeeming shareholders of Class A Shares to the Distributor during the period ended March 31, 2023.
A CDSC of 1.00% will be deducted with respect to Class C Shares redeemed within 12 months of purchase, unless waived. Any applicable CDSC will be 1.00% of the lesser of the original purchase price or the value of the redemption of the Class C Shares redeemed. There were no CDSCs paid by redeeming shareholders of Class C Shares during the period ended March 31, 2023.
The Board of Trustees has adopted a deferred compensation plan (the “Deferred Plan”) for independent Trustees to elect to defer receipt of all or a portion of the annual compensation they are entitled to receive from the Fund. All deferred fees are credited to an account established in the name of the Trustees. The amounts credited to the account then increase or decrease, as the case may be, in accordance with the performance of one or more of the Janus Henderson funds that are selected by the Trustees. The account balance continues to fluctuate in accordance with the performance of the selected fund or funds until final payment of all amounts are credited to the account. The fluctuation of the account balance is recorded by the Fund as unrealized appreciation/(depreciation) and is included as of March 31, 2023 on the Statement of Assets and Liabilities in the asset, “Trustees’ deferred compensation,” and liability, “Trustees’ deferred compensation fees.” Additionally, the recorded unrealized appreciation/(depreciation) is included in “Total distributable earnings (loss)” on the Statement of Assets and Liabilities. Deferred compensation expenses for the period ended March 31, 2023 are included in “Trustees’ fees and expenses” on the Statement of Operations. Trustees are allowed to change their designation of mutual funds from time to time. Amounts will be deferred until distributed in accordance with the Deferred Plan. Deferred fees of $205,688 were paid by the Trust to the Trustees under the Deferred Plan during the period ended March 31, 2023.
Pursuant to the provisions of the 1940 Act and related rules, the Fund may participate in an affiliated or non-affiliated cash sweep program. In the cash sweep program, uninvested cash balances of the Fund may be used to purchase shares of affiliated or non-affiliated money market funds or cash management pooled investment vehicles that operate as money market funds. The Fund is eligible to participate in the cash sweep program (the “Investing Funds”). The Adviser has an inherent conflict of interest because of its fiduciary duties to the affiliated money market funds or cash management pooled investment vehicles and the Investing Funds. Janus Henderson Cash Liquidity Fund LLC (the “Sweep Vehicle”) is an affiliated unregistered cash management pooled investment vehicle that invests primarily in highly-rated short-term fixed-income securities. The Sweep Vehicle operates pursuant to the provisions of the 1940 Act that govern the operation of money market funds and prices its shares at NAV reflecting market-based values of its portfolio securities (i.e., a “floating” NAV) rounded to the fourth decimal place (e.g., $1.0000). The Sweep Vehicle is permitted to impose a liquidity fee (of up to 2%) on redemptions from the Sweep Vehicle or a redemption gate that temporarily suspends redemptions from the Sweep Vehicle for up to 10 business days during a 90 day period. There are no restrictions on the Fund's ability to withdraw investments from the Sweep Vehicle at will, and there are no
Janus Henderson Emerging Markets Fund
Notes to Financial Statements (unaudited)
unfunded capital commitments due from the Fund to the Sweep Vehicle. The Sweep Vehicle does not charge any management fee, sales charge or service fee.
Any purchases and sales, realized gains/losses and recorded dividends from affiliated investments during the period ended March 31, 2023 can be found in the “Schedules of Affiliated Investments” located in the Schedule of Investments.
As of March 31, 2023, shares of the Fund were owned by affiliates of the Adviser, and/or other funds advised by the Adviser, as indicated in the table below:
| | | | | | |
Class | % of Class Owned | | % of Fund Owned | | |
Class A Shares | - | % | - | % | |
Class C Shares | - | | - | | |
Class D Shares | - | | - | | |
Class I Shares | - | | - | | |
Class N Shares | 94 | | 53 | | |
Class S Shares | - | | - | | |
Class T Shares | - | | - | | |
| | | | | | |
4. Federal Income Tax
Income and capital gains distributions are determined in accordance with income tax regulations that may differ from US GAAP. These differences are due to differing treatments for items such as net short-term gains, deferral of wash sale losses, foreign currency transactions, net investment losses, and capital loss carryovers.
The Fund has elected to treat gains and losses on forward foreign currency contracts as capital gains and losses, if applicable. Other foreign currency gains and losses on debt instruments are treated as ordinary income for federal income tax purposes pursuant to Section 988 of the Internal Revenue Code.
Accumulated capital losses noted below represent net capital loss carryovers, as of September 30, 2022, that may be available to offset future realized capital gains and thereby reduce future taxable gains distributions. The following table shows these capital loss carryovers.
| | | | | | |
| | | | | |
Capital Loss Carryover Schedule | | |
For the year ended September 30, 2022 | | |
| No Expiration | | | |
| Short-Term | Long-Term | Accumulated
Capital Losses | | |
| $(6,060,132) | $(2,277,174) | $ (8,337,306) | | |
The aggregate cost of investments and the composition of unrealized appreciation and depreciation of investment securities for federal income tax purposes as of March 31, 2023 are noted below. The primary differences between book and tax appreciation or depreciation of investments are wash sale loss deferrals, investments in partnerships, and investments in passive foreign investment companies.
| | | | |
Federal Tax Cost | Unrealized
Appreciation | Unrealized
(Depreciation) | Net Tax Appreciation/
(Depreciation) |
$67,513,433 | $ 6,813,889 | $ (9,506,041) | $ (2,692,152) |
Janus Henderson Emerging Markets Fund
Notes to Financial Statements (unaudited)
5. Capital Share Transactions
| | | | | | | |
| | | | | | |
| | Period ended March 31, 2023 | | Year ended September 30, 2022 |
| | Shares | Amount | | Shares | Amount |
| | | | | | | |
Class A Shares: | | | | | |
Shares sold | 11,526 | $ 94,944 | | 64,466 | $ 636,436 |
Reinvested dividends and distributions | - | - | | 12,270 | 133,124 |
Shares repurchased | (85,594) | (722,576) | | (73,948) | (725,255) |
Net Increase/(Decrease) | (74,068) | $ (627,632) | | 2,788 | $ 44,305 |
Class C Shares: | | | | | |
Shares sold | 11,350 | $ 91,174 | | 12,073 | $ 116,222 |
Reinvested dividends and distributions | - | - | | 2,184 | 23,174 |
Shares repurchased | (41,316) | (328,370) | | (48,716) | (468,661) |
Net Increase/(Decrease) | (29,966) | $ (237,196) | | (34,459) | $ (329,265) |
Class D Shares: | | | | | |
Shares sold | 318,209 | $ 2,837,929 | | 294,071 | $ 3,055,369 |
Reinvested dividends and distributions | - | - | | 43,574 | 475,390 |
Shares repurchased | (222,404) | (1,912,107) | | (420,550) | (4,466,865) |
Net Increase/(Decrease) | 95,805 | $ 925,822 | | (82,905) | $ (936,106) |
Class I Shares: | �� | | | | |
Shares sold | 70,283 | $ 597,361 | | 215,855 | $ 2,137,803 |
Reinvested dividends and distributions | - | - | | 49,669 | 539,900 |
Shares repurchased | (339,906) | (2,821,053) | | (633,258) | (6,287,811) |
Net Increase/(Decrease) | (269,623) | $(2,223,692) | | (367,734) | $(3,610,108) |
Class N Shares: | | | | | |
Shares sold | 98,743 | $ 850,289 | | 545,904 | $ 5,025,205 |
Reinvested dividends and distributions | - | - | | 164,333 | 1,789,591 |
Shares repurchased | (668,540) | (5,548,774) | | (1,065,368) | (11,182,735) |
Net Increase/(Decrease) | (569,797) | $(4,698,485) | | (355,131) | $(4,367,939) |
Class S Shares: | | | | | |
Shares sold | 456 | $ 3,896 | | 1,983 | $ 19,974 |
Reinvested dividends and distributions | - | - | | 218 | 2,399 |
Shares repurchased | (987) | (9,165) | | (304) | (2,885) |
Net Increase/(Decrease) | (531) | $ (5,269) | | 1,897 | $ 19,488 |
Class T Shares: | | | | | |
Shares sold | 66,845 | $ 563,328 | | 103,734 | $ 1,189,907 |
Reinvested dividends and distributions | - | - | | 7,136 | 77,857 |
Shares repurchased | (83,851) | (669,931) | | (143,262) | (1,593,463) |
Net Increase/(Decrease) | (17,006) | $ (106,603) | | (32,392) | $ (325,699) |
6. Purchases and Sales of Investment Securities
For the period ended March 31, 2023, the aggregate cost of purchases and proceeds from sales of investment securities (excluding any short-term securities, short-term options contracts, TBAs, and in-kind transactions, as applicable) was as follows:
| | | | |
Purchases of
Securities | Proceeds from Sales
of Securities | Purchases of Long-
Term U.S. Government
Obligations | Proceeds from Sales
of Long-Term U.S.
Government Obligations |
$22,915,557 | $ 28,730,697 | $ - | $ - |
Janus Henderson Emerging Markets Fund
Notes to Financial Statements (unaudited)
7. Subsequent Event
Management has evaluated whether any events or transactions occurred subsequent to March 31, 2023 and through the date of issuance of the Fund’s financial statements and determined that there were no material events or transactions that would require recognition or disclosure in the Fund’s financial statements.
Janus Henderson Emerging Markets Fund
Additional Information (unaudited)
Proxy Voting Policies and Voting Record
A description of the policies and procedures that the Fund uses to determine how to vote proxies relating to its portfolio securities is available without charge: (i) upon request, by calling 1-800-525-1093; (ii) on the Fund’s website at janushenderson.com/proxyvoting; and (iii) on the SEC’s website at http://www.sec.gov. Additionally, information regarding the Fund’s proxy voting record for the most recent twelve-month period ended June 30 is also available, free of charge, through janushenderson.com/proxyvoting and from the SEC’s website at http://www.sec.gov.
Full Holdings
The Fund files its complete portfolio holdings (schedule of investments) with the SEC as an exhibit to Form N-PORT within 60 days of the end of the first and third fiscal quarters, and in the annual report and semiannual report to shareholders. The Fund’s Form N-PORT filings and annual and semiannual reports: (i) are available on the SEC’s website at http://www.sec.gov; and (ii) are available without charge, upon request, by calling a Janus Henderson representative at 1-877-335-2687 (toll free) (or 1-800-525-3713 if you hold Class D Shares). Portfolio holdings consisting of at least the names of the holdings are generally available on a monthly basis with a 30-day lag under Full Holdings for the Fund at janushenderson.com/info (or janushenderson.com/reports if you hold Class D Shares).
APPROVAL OF ADVISORY AGREEMENTS DURING THE PERIOD
The Trustees of Janus Aspen Series, each of whom serves as an “independent” Trustee (the “Trustees”), oversee the management of each portfolio of Janus Aspen Series (each, a “VIT Portfolio,” and collectively, the “VIT Portfolios”), as well as each fund of Janus Investment Fund (each, a “Fund,” and collectively, the “Funds” and together with the VIT Portfolios, the “Janus Henderson Funds,” and each, a “Janus Henderson Fund”). As required by law, the Trustees determine annually whether to continue the investment advisory agreement for each Janus Henderson Fund.
In connection with their most recent consideration of those agreements for each Janus Henderson Fund, the Trustees received and reviewed information provided by Janus Henderson Investors US LLC (the “Adviser”) in response to requests of the Trustees and their independent legal counsel. They also received and reviewed information and analysis provided by, and in response to requests of, their independent fee consultant. Throughout their consideration of the agreements, the Trustees were advised by their independent legal counsel. The Trustees met with management to consider the agreements, and also met separately in executive session with their independent legal counsel and their independent fee consultant.
At meetings held on November 9-10, 2022 and December 13-14, 2022, the Trustees evaluated the information provided by the Adviser and the independent fee consultant, as well as other information provided by the Adviser and the independent fee consultant during the year. Following such evaluation, the Trustees determined that the overall arrangements between each Janus Henderson Fund and the Adviser were fair and reasonable in light of the nature, extent, and quality of the services provided by the Adviser and its affiliates, the fees charged for those services, and other matters that the Trustees considered relevant in the exercise of their business judgment, and unanimously approved the continuation of the investment advisory agreement for each Janus Henderson Fund for the period from February 1, 2023 through February 1, 2024, subject to earlier termination as provided for in each agreement.
In considering the continuation of those agreements, the Trustees reviewed and analyzed various factors that they determined were relevant, including the factors described below, none of which by itself was considered dispositive. However, the material factors and conclusions that formed the basis for the Trustees’ determination to approve the continuation of the agreements are discussed separately below. Also included is a summary of the independent fee consultant’s conclusions and opinions that arose during, and were included as part of, the Trustees’ consideration of the agreements. “Management fees,” as used herein, reflect actual annual advisory fees and, for the purpose of peer comparisons any administration fees (excluding out of pocket costs), net of any waivers, paid by a fund as a percentage of average net assets.
Nature, Extent and Quality of Services
The Trustees reviewed the nature, extent, and quality of the services provided by the Adviser to the Janus Henderson Funds, taking into account the investment objective, strategies, and policies of each Janus Henderson Fund, and the knowledge the Trustees gained from their regular meetings with management on at least a quarterly basis and their ongoing review of information related to the Janus Henderson Funds. In addition, the Trustees reviewed the resources and key personnel of the Adviser, particularly noting those employees who provide investment and risk management services to the Janus Henderson Funds. The Trustees also considered other services provided to the Janus Henderson
Janus Henderson Emerging Markets Fund
Additional Information (unaudited)
Funds by the Adviser, such as managing the execution of portfolio transactions and the selection of broker-dealers for those transactions. The Trustees considered the Adviser’s role as administrator to the Janus Henderson Funds, noting that the Adviser generally does not receive a fee for its services as administrator, but is reimbursed for its out-of-pocket costs. The Trustees considered the role of the Adviser in monitoring adherence to the Janus Henderson Funds’ investment restrictions, providing support services for the Trustees and Trustee committees, and overseeing communications with Janus Henderson Fund shareholders and the activities of other service providers, including monitoring compliance with various policies and procedures of the Janus Henderson Funds and with applicable securities laws and regulations.
In this regard, the independent fee consultant noted that the Adviser provides a number of different services for the Janus Henderson Funds and their shareholders, ranging from investment management services to various other servicing functions, and that, in its view, the Adviser is a capable provider of those services. The independent fee consultant also provided its belief that the Adviser has developed a number of institutional competitive advantages that should enable it to provide superior investment and service performance over the long term.
The Trustees concluded that the nature, extent, and quality of the services provided by the Adviser to each Janus Henderson Fund were appropriate and consistent with the terms of the respective advisory agreements, and that, taking into account steps taken to address those Janus Henderson Funds whose performance lagged that of their peers for certain periods, the Janus Henderson Funds were likely to benefit from the continued provision of those services. They also concluded that the Adviser had sufficient personnel, with the appropriate education and experience, to serve the Janus Henderson Funds effectively and had demonstrated its ability to attract well-qualified personnel.
Performance of the Funds
The Trustees considered the performance results of each Janus Henderson Fund over various time periods. They noted that they considered Janus Henderson Fund performance data throughout the year, including periodic meetings with each Janus Henderson Fund’s portfolio manager(s), and also reviewed information comparing each Janus Henderson Fund’s performance with the performance of comparable fund peer groups identified by Broadridge Financial Solutions, Inc. (“Broadridge”), an independent data provider, and with the Janus Henderson Fund’s benchmark index. In this regard, the independent fee consultant found that the overall Janus Henderson Funds’ performance has been reasonable, noting that: (i) for the 36 months ended May 31, 2022, approximately 38% of the Janus Henderson Funds were in the top two quartiles of their Broadridge peer groups; (ii) for the 36 months ended September 30, 2022, approximately 45% of the Janus Henderson Funds were in the top two quartiles of performance as reported by Morningstar, and (iii) for the 12 months ended September 30, 2022, approximately 55% of the Janus Henderson Funds were in the top two quartiles of performance as reported by Morningstar.
The Trustees considered the performance of each Janus Henderson Fund, noting that performance may vary by share class, and noted the following with respect to the Funds:
Asset Allocation Funds
· For Janus Henderson Global Allocation Fund – Conservative, the Trustees noted that the Fund’s performance was in the third Broadridge quartile for the 36 months ended May 31, 2022 and the bottom Broadridge quartile for the 12 months ended May 31, 2022. The Trustees noted the reasons for the Fund’s underperformance and the steps the Adviser had taken or was taking to improve performance.
· For Janus Henderson Global Allocation Fund – Growth, the Trustees noted that the Fund’s performance was in the bottom Broadridge quartile for the 36 months ended May 31, 2022 and the bottom Broadridge quartile for the 12 months ended May 31, 2022. The Trustees noted the reasons for the Fund’s underperformance and the steps the Adviser had taken or was taking to improve performance.
· For Janus Henderson Global Allocation Fund – Moderate, the Trustees noted that the Fund’s performance was in the bottom Broadridge quartile for the 36 months ended May 31, 2022 and the bottom Broadridge quartile for the 12 months ended May 31, 2022. The Trustees noted the reasons for the Fund’s underperformance and the steps the Adviser had taken or was taking to improve performance.
Fixed-Income Funds
· For Janus Henderson Absolute Return Income Opportunities Fund, the Trustees noted that the Fund’s performance was in the third Broadridge quartile for the 36 months ended May 31, 2022 and the first Broadridge quartile for the 12 months ended May 31, 2022. The Trustees noted the reasons for the Fund’s underperformance,
Janus Henderson Emerging Markets Fund
Additional Information (unaudited)
the steps the Adviser had taken or was taking to improve performance, and that the performance trend was improving.
· For Janus Developed World Bond Fund, the Trustees noted that the Fund’s performance was in the bottom Broadridge quartile for the 36 months ended May 31, 2022 and the bottom Broadridge quartile for the 12 months ended May 31, 2022. The Trustees noted the reasons for the Fund’s underperformance and the steps the Adviser had taken or was taking to improve performance.
· For Janus Henderson Flexible Bond Fund, the Trustees noted that the Fund’s performance was in the first Broadridge quartile for the 36 months ended May 31, 2022 and the second Broadridge quartile for the 12 months ended May 31, 2022.
· For Janus Henderson Global Bond Fund, the Trustees noted that the Fund’s performance was in the third Broadridge quartile for the 36 months ended May 31, 2022 and the bottom Broadridge quartile for the 12 months ended May 31, 2022. The Trustees noted the reasons for the Fund’s underperformance and the steps the Adviser had taken or was taking to improve performance.
· For Janus Henderson High-Yield Fund, the Trustees noted that the Fund’s performance was in the third Broadridge quartile for the 36 months ended May 31, 2022 and the bottom Broadridge quartile for the 12 months ended May 31, 2022. The Trustees noted the reasons for the Fund’s underperformance and the steps the Adviser had taken or was taking to improve performance.
· For Janus Henderson Multi-Sector Income Fund, the Trustees noted that the Fund’s performance was in the second Broadridge quartile for the 36 months ended May 31, 2022 and the third Broadridge quartile for the 12 months ended May 31, 2022.
· For Janus Henderson Short Duration Flexible Bond Fund, the Trustees noted that the Fund’s performance was in the third Broadridge quartile for the 36 months ended May 31, 2022 and the bottom Broadridge quartile for the 12 months ended May 31, 2022. The Trustees noted the reasons for the Fund’s underperformance and the steps the Adviser had taken or was taking to improve performance.
Global and International Equity Funds
· For Janus Henderson Asia Equity Fund, the Trustees noted that the Fund’s performance was in the third Broadridge quartile for the 36 months ended May 31, 2022 and the third Broadridge quartile for the 12 months ended May 31, 2022. The Trustees noted the reasons for the Fund’s underperformance, while also noting that the Fund has a performance fee structure that results in lower management fees during periods of underperformance, and the steps the Adviser had taken or was taking to improve performance.
· For Janus Henderson Emerging Markets Fund, the Trustees noted that the Fund’s performance was in the third Broadridge quartile for the 36 months ended May 31, 2022 and the third Broadridge quartile for the 12 months ended May 31, 2022. The Trustees noted the reasons for the Fund’s underperformance and the steps the Adviser had taken or was taking to improve performance.
· For Janus Henderson European Focus Fund, the Trustees noted that the Fund’s performance was in the first Broadridge quartile for the 36 months ended May 31, 2022 and the second Broadridge quartile for the 12 months ended May 31, 2022.
· For Janus Henderson Global Equity Income Fund, the Trustees noted that the Fund’s performance was in the third Broadridge quartile for the 36 months ended May 31, 2022 and the first Broadridge quartile for the 12 months ended May 31, 2022. The Trustees noted the reasons for the Fund’s underperformance, the steps the Adviser had taken or was taking to improve performance, and that the performance trend was improving.
· For Janus Henderson Global Life Sciences Fund, the Trustees noted that the Fund’s performance was in the third Broadridge quartile for the 36 months ended May 31, 2022 and the second Broadridge quartile for the 12 months ended May 31, 2022. The Trustees noted the reasons for the Fund’s underperformance, the steps the Adviser had taken or was taking to improve performance, and that the performance trend was improving.
· For Janus Henderson Global Sustainable Equity Fund, the Trustees noted that the Fund’s performance was in the second Broadridge quartile for the 12 months ended May 31, 2022. The Trustees noted that 36 month-end performance was not yet available.
Janus Henderson Emerging Markets Fund
Additional Information (unaudited)
· For Janus Henderson Global Real Estate Fund, the Trustees noted that the Fund’s performance was in the second Broadridge quartile for the 36 months ended May 31, 2022 and the bottom Broadridge quartile for the 12 months ended May 31, 2022.
· For Janus Henderson Global Research Fund, the Trustees noted that the Fund’s performance was in the second Broadridge quartile for the 36 months ended May 31, 2022 and the first Broadridge quartile for the 12 months ended May 31, 2022.
· For Janus Henderson Global Select Fund, the Trustees noted that the Fund’s performance was in the first Broadridge quartile for the 36 months ended May 31, 2022 and the first Broadridge quartile for the 12 months ended May 31, 2022.
· For Janus Henderson Global Technology and Innovation Fund, the Trustees noted that the Fund’s performance was in the second Broadridge quartile for the 36 months ended May 31, 2022 and the second Broadridge quartile for the 12 months ended May 31, 2022.
· For Janus Henderson International Opportunities Fund, the Trustees noted that the Fund’s performance was in the bottom Broadridge quartile for the 36 months ended May 31, 2022 and the third Broadridge quartile for the 12 months ended May 31, 2022. The Trustees noted the reasons for the Fund’s underperformance and the steps the Adviser had taken or was taking to improve performance.
· For Janus Henderson Overseas Fund, the Trustees noted that the Fund’s performance was in the first Broadridge quartile for the 36 months ended May 31, 2022 and the first Broadridge quartile for the 12 months ended May 31, 2022.
· For Janus Henderson Responsible International Dividend Fund (formerly the Janus Henderson Dividend & Income Builder Fund), the Trustees noted that the Fund’s performance was in the bottom Broadridge quartile for the 36 months ended May 31, 2022 and the bottom Broadridge quartile for the 12 months ended May 31, 2022. The Trustees noted the reasons for the Fund’s underperformance and the steps the Adviser had taken or was taking to improve performance.
Money Market Funds
· For Janus Henderson Government Money Market Fund, the Trustees noted that the Fund’s performance was in the third Broadridge quartile for the 36 months ended May 31, 2022 and the bottom Broadridge quartile for the 12 months ended May 31, 2022. The Trustees noted the reasons for the Fund’s underperformance and the steps the Adviser had taken or was taking to improve performance.
· For Janus Henderson Money Market Fund, the Trustees noted that the Fund’s performance was in the third Broadridge quartile for the 36 months ended May 31, 2022 and the bottom Broadridge quartile for the 12 months ended May 31, 2022. The Trustees noted the reasons for the Fund’s underperformance and the steps the Adviser had taken or was taking to improve performance.
Multi-Asset Funds
· For Janus Henderson Adaptive Global Allocation Fund, the Trustees noted that the Fund’s performance was in bottom Broadridge quartile for the 36 months ended May 31, 2022 and the second Broadridge quartile for the 12 months ended May 31, 2022. The Trustees noted the reasons for the Fund’s underperformance, the steps the Adviser had taken or was taking to improve performance, and that the performance trend was improving.
· For Janus Henderson Balanced Fund, the Trustees noted that the Fund’s performance was in the first Broadridge quartile for the 36 months ended May 31, 2022 and the first Broadridge quartile for the 12 months ended May 31, 2022.
U.S. Equity Funds
· For Janus Henderson Adaptive Risk Managed U.S. Equity Fund, the Trustees noted that the Fund’s performance was in the bottom Broadridge quartile for the 36 months ended May 31, 2022 and the second Broadridge quartile for the 12 months ended May 31, 2022. The Trustees noted the reasons for the Fund’s underperformance, the steps the Adviser had taken or were taking to improve performance, and that the performance trend was improving.
Janus Henderson Emerging Markets Fund
Additional Information (unaudited)
· For Janus Henderson Contrarian Fund, the Trustees noted that the Fund’s performance was in the first Broadridge quartile for the 36 months ended May 31, 2022 and the bottom Broadridge quartile for the 12 months ended May 31, 2022.
· For Janus Henderson Enterprise Fund, the Trustees noted that the Fund’s performance was in the second Broadridge quartile for the 36 months ended May 31, 2022 and the first Broadridge quartile for the 12 months ended May 31, 2022.
· For Janus Henderson Forty Fund, the Trustees noted that the Fund’s performance was in the third Broadridge quartile for the 36 months ended May 31, 2022 and the bottom Broadridge quartile for the 12 months ended May 31, 2022. The Trustees noted the reasons for the Fund’s underperformance and the steps the Adviser had taken or was taking to improve performance.
· For Janus Henderson Growth and Income Fund, the Trustees noted that the Fund’s performance was in the bottom Broadridge quartile for the 36 months ended May 31, 2022 and the first Broadridge quartile for the 12 months ended May 31, 2022. The Trustees noted the reasons for the Fund’s underperformance, the steps the Adviser had taken or was taking to improve performance, and that the performance trend was improving.
· For Janus Henderson Mid Cap Value Fund, the Trustees noted that the Fund’s performance was in the bottom Broadridge quartile for the 36 months ended May 31, 2022 and the second Broadridge quartile for the 12 months ended May 31, 2022. The Trustees noted the reasons for the Fund’s underperformance, while also noting that the Fund has a performance fee structure that results in lower management fees during periods of underperformance, the steps the Adviser had taken or was taking to improve performance, and that the performance trend was improving.
· For Janus Henderson Research Fund, the Trustees noted that the Fund’s performance was in the third Broadridge quartile for the 36 months ended May 31, 2022 and the third Broadridge quartile for the 12 months ended May 31, 2022. The Trustees noted the reasons for the Fund’s underperformance, while also noting that the Fund has a performance fee structure that results in lower management fees during periods of underperformance and the steps the Adviser had taken or was taking to improve performance.
· For Janus Henderson Small Cap Value Fund, the Trustees noted that the Fund’s performance was in the bottom Broadridge quartile for the 36 months ended May 31, 2022 and the second Broadridge quartile for the 12 months ended May 31, 2022. The Trustees noted the reasons for the Fund’s underperformance, while also noting that the Fund has a performance fee structure that results in lower management fees during periods of underperformance, the steps the Adviser had taken or was taking to improve performance, and that the performance trend was improving.
· For Janus Henderson Small-Mid Cap Value Fund, the Trustees noted that the Fund’s performance was in the bottom Broadridge quartile for the 36 months ended May 31, 2022 and the second Broadridge quartile for the 12 months ended May 31, 2022. The Trustees noted the reasons for the Fund’s underperformance, while also noting that the Fund has a performance fee structure that results in lower management fees during periods of underperformance, the steps the Adviser had taken or was taking to improve performance, and that the performance trend is improving.
· For Janus Henderson Triton Fund, the Trustees noted that the Fund’s performance was in the bottom Broadridge quartile for the 36 months ended May 31, 2022 and the second Broadridge quartile for the 12 months ended May 31, 2022. The Trustees noted the reasons for the Fund’s underperformance, the steps the Adviser had taken or was taking to improve performance, and that the performance trend was improving.
· For Janus Henderson Venture Fund, the Trustees noted that the Fund’s performance was in the bottom Broadridge quartile for the 36 months ended May 31, 2022 and the second Broadridge quartile for the 12 months ended May 31, 2022. The Trustees noted the reasons for the Fund’s underperformance, the steps the Adviser had taken or was taking to improve performance, and that the performance trend was improving.
In consideration of each Janus Henderson Fund’s performance, the Trustees concluded that, taking into account the factors relevant to performance, as well as other considerations, including steps taken to improve performance, as applicable, the Janus Henderson Fund’s performance warranted continuation of such Janus Henderson Fund’s investment advisory agreement.
Janus Henderson Emerging Markets Fund
Additional Information (unaudited)
Costs of Services Provided
The Trustees examined information regarding the fees and expenses of each Janus Henderson Fund in comparison to similar information for other comparable funds as provided by Broadridge, an independent data provider. They also reviewed an analysis of that information provided by their independent fee consultant. The independent fee consultant provided its belief that the management fees charged by the Adviser to each of the Janus Henderson Funds under the current investment advisory and administration agreements are reasonable in relation to the services provided by the Adviser. The independent fee consultant found: (1) the total expenses and management fees of the Janus Henderson Funds to be reasonable relative to other comparable mutual funds; (2) the total expenses, on average, were 6% under the average total expenses of the respective Broadridge peer group; and (3) the management fees for the Janus Henderson Funds, on average, were 5% under the average management fees for the respective Broadridge peer group. The Trustees also considered the total expenses for each share class of each Janus Henderson Fund compared to the average total expenses for its Broadridge Expense Group and to average total expenses for its Broadridge Expense Universe.
For Janus Henderson Funds with three or more years of performance history, the independent fee consultant also performed a systematic “focus list” analysis of expenses which assessed fund fees in the context of fund performance being delivered. Based on this analysis, the independent fee consultant found that the combination of service quality/performance and expenses on these individual Janus Henderson Funds was reasonable in light of performance trends, performance histories, changes in portfolio management, relative average net asset levels, and the existence of performance fees, breakpoints, and/or expense waivers on such Janus Henderson Funds.
The Trustees considered the methodology used by the Adviser in determining compensation payable to portfolio managers, the competitive environment for investment management talent, and the competitive market for mutual funds in different distribution channels.
The Trustees also reviewed management fees charged by the Adviser to comparable separate account clients and to comparable non-affiliated funds subadvised by the Adviser (for which the Adviser provides only or primarily portfolio management services). Although in most instances subadvisory and separate account fee rates for various investment strategies were lower than management fee rates for Janus Henderson Funds having a similar strategy, the Trustees considered that the Adviser noted that, under the terms of the management agreements with the Janus Henderson Funds, the Adviser performs significant additional services for the Janus Henderson Funds that it does not provide to those other clients, including administration services, oversight of the Janus Henderson Funds’ other service providers, Trustee support, regulatory compliance and numerous other services, and that, in serving the Janus Henderson Funds, the Adviser assumes many legal risks and other costs that it does not assume in servicing its other clients. Moreover, the Trustees noted that the independent fee consultant found that: (1) the management fees the Adviser charges to the Janus Henderson Funds are reasonable in relation to the management fees the Adviser charges to funds subadvised by the Adviser and to the fees the Adviser charges to its institutional separate account clients; (2) these subadvised and institutional separate accounts have different service and infrastructure needs and operate in markets very different from the retail fund market; (3) Janus Henderson mutual fund investors enjoy reasonable fees relative to the fees charged in these other markets; and (4) as part of its 2022 review, 9 of 11 Janus Henderson Funds have lower management fees than similar funds subadvised by the Adviser. The Trustees noted that for the two Janus Henderson Funds that did not, management fees for each were under the average of its 15(c) peer group.
The Trustees considered the fees for each Janus Henderson Fund for its fiscal year ended in 2021 and noted the following with regard to each Janus Henderson Fund’s total expenses, net of applicable fee waivers (the Fund’s “total expenses”) as reflected in the comparative information provided by Broadridge:
Asset Allocation Funds
· For Janus Henderson Global Allocation Fund – Conservative, the Trustees noted that, although the Fund’s total expenses exceeded the peer group average for certain share classes, overall the Fund’s total expenses were reasonable. The Trustees also noted that the Adviser has contractually agreed to limit the Fund’s expenses.
· For Janus Henderson Global Allocation Fund – Growth, the Trustees noted that, although the Fund’s total expenses exceeded the peer group average for certain share classes, overall the Fund’s total expenses were reasonable. The Trustees also noted that the Adviser has contractually agreed to limit the Fund’s expenses, although this limit did not apply because the Fund’s total expenses as shown were below the applicable fee limit.
Janus Henderson Emerging Markets Fund
Additional Information (unaudited)
· For Janus Henderson Global Allocation Fund – Moderate, the Trustees noted that, although the Fund’s total expenses exceeded the peer group average for one share class, overall the Fund’s total expenses were reasonable. The Trustees also noted that the Adviser has contractually agreed to limit the Fund’s expenses.
Fixed-Income Funds
· For Janus Henderson Absolute Return Income Opportunities Fund, the Trustees noted that, although the Fund’s total expenses exceeded the peer group average for certain share classes, overall the Fund’s total expenses were reasonable. The Trustees also noted that the Adviser has contractually agreed to limit the Fund’s expenses.
· For Janus Henderson Developed World Bond Fund, the Trustees noted that, although the Fund’s total expenses exceeded the peer group average for one share class, overall the Fund’s total expenses were reasonable. The Trustees also noted that the Adviser has contractually agreed to limit the Fund’s expenses.
· For Janus Henderson Flexible Bond Fund, the Trustees noted that, although the Fund’s total expenses exceeded the peer group average for certain share classes, overall the Fund’s total expenses were reasonable. The Trustees also noted that the Adviser has contractually agreed to limit the Fund’s expenses, although this limit did not apply because the Fund’s total expenses as shown were below the applicable fee limit.
· For Janus Henderson Global Bond Fund, the Trustees noted that, although the Fund’s total expenses exceeded the peer group average for certain share classes, overall the Fund’s total expenses were reasonable. The Trustees also noted that the Adviser has contractually agreed to limit the Fund’s expenses.
· For Janus Henderson High-Yield Fund, the Trustees noted that, although the Fund’s total expenses exceeded the peer group average for certain share classes, overall the Fund’s total expenses were reasonable. The Trustees also noted that the Adviser has contractually agreed to limit the Fund’s expenses.
· For Janus Henderson Multi-Sector Income Fund, the Trustees noted that, although the Fund’s total expenses exceeded the peer group average for certain share classes, overall the Fund’s total expenses were reasonable. The Trustees also noted that the Adviser has contractually agreed to limit the Fund’s expenses.
· For Janus Henderson Short Duration Flexible Bond Fund, the Trustees noted that, although the Fund’s total expenses exceeded the peer group average for certain share classes, overall the Fund’s total expenses were reasonable. The Trustees also noted that the Adviser has contractually agreed to limit the Fund’s expenses.
Global and International Equity Funds
· For Janus Henderson Asia Equity Fund, the Trustees noted that, although the Fund’s total expenses exceeded the peer group average for certain share classes, overall the Fund’s total expenses were reasonable. The Trustees also noted that the Adviser has contractually agreed to limit the Fund’s expenses.
· For Janus Henderson Emerging Markets Fund, the Trustees noted that, although the Fund’s total expenses exceeded the peer group average for certain share classes, overall the Fund’s total expenses were reasonable. The Trustees also noted that the Adviser has contractually agreed to limit the Fund’s expenses.
· For Janus Henderson European Focus Fund, the Trustees noted that, although the Fund’s total expenses exceeded the peer group average for one share class, overall the Fund’s expenses were reasonable. The Trustees also noted that the Adviser has contractually agreed to limit the Fund’s expenses.
· For Janus Henderson Global Equity Income Fund, the Trustees noted that, although the Fund’s total expenses exceeded the peer group average for one share class, overall the Fund’s total expenses were reasonable. The Trustees also noted that the Adviser has contractually agreed to limit the Fund’s expenses, although this limit did not apply because the Fund’s total expenses as shown were below the applicable fee limit.
· For Janus Henderson Global Life Sciences Fund, the Trustees noted that the Fund’s total expenses were below the peer group average for all share classes.
· For Janus Henderson Global Real Estate Fund, the Trustees noted that, although the Fund’s total expenses exceeded the peer group average for certain share classes, overall the Fund’s total expenses were reasonable. The Trustees also noted that the Adviser has contractually agreed to limit the Fund’s expenses, although this limit did not apply because the Fund’s total expenses as shown were below the applicable fee limit.
Janus Henderson Emerging Markets Fund
Additional Information (unaudited)
· For Janus Henderson Global Research Fund, the Trustees noted that, although the Fund’s total expenses exceeded the peer group average for one share class, overall the Fund’s total expenses were reasonable. The Trustees also noted that the Adviser has contractually agreed to limit the Fund’s expenses, although this limit did not apply because the Fund’s total expenses as shown were below the applicable fee limit.
· For Janus Henderson Global Select Fund, the Trustees noted that, although the Fund’s total expenses exceeded the peer group average for certain share classes, overall the Fund’s total expenses were reasonable. The Trustees also noted that the Adviser has contractually agreed to limit the Fund’s expenses.
· For Janus Henderson Global Sustainable Equity Fund, the Trustees noted that, although the Fund’s total expenses exceeded the peer group average for certain share classes, overall the Fund’s expenses were reasonable. The Trustees also noted that the Adviser has contractually agreed to limit the Fund’s expenses.
· For Janus Henderson Global Technology and Innovation Fund, the Trustees noted that the Fund’s total expenses were below the peer group average for all share classes.
· For Janus Henderson International Opportunities Fund, the Trustees noted that, although the Fund’s total expenses exceeded the peer group average for certain share classes, overall the Fund’s expenses were reasonable. The Trustees also noted that the Adviser has contractually agreed to limit the Fund’s expenses.
· For Janus Henderson Overseas Fund, the Trustees noted that although the Fund’s total expenses exceeded the peer group average for certain share classes, overall the Fund’s total expenses were reasonable. The Trustees also noted that the Adviser has contractually agreed to limit the Fund’s expenses, although this limit did not apply because the Fund’s total expenses as shown were below the applicable fee limit.
· For Janus Henderson Responsible International Dividend Fund (formerly the Janus Henderson Dividend & Income Builder Fund), the Trustees noted that, although the Fund’s total expenses exceeded the peer group for one share class, overall the Fund’s total expenses were reasonable. The Trustees also noted that the Adviser has contractually agreed to limit the Fund’s expenses.
Money Market Funds
· For Janus Henderson Government Money Market Fund, the Trustees noted that the Fund’s total expenses were below the peer group average for all share classes.
· For Janus Henderson Money Market Fund, the Trustees noted that the Fund’s total expenses were below the peer group average for all share classes.
Multi-Asset Funds
· For Janus Henderson Adaptive Global Allocation Fund, the Trustees noted that, that the Fund’s total expenses were below the peer group average for all share classes.
· For Janus Henderson Balanced Fund, the Trustees noted that, although the Fund’s total expenses exceeded the peer group average for certain share classes, overall the Fund’s total expenses were reasonable. The Trustees also noted that the Adviser has contractually agreed to limit the Fund’s expenses, although this limit did not apply because the Fund’s total expenses as shown were below the applicable fee limit.
U.S. Equity Funds
· For Janus Henderson Adaptive Risk Managed U.S. Equity Fund, the Trustees noted that, although the Fund’s total expenses exceeded the peer group average for certain share classes, overall the Fund’s total expenses were reasonable. The Trustees also noted that the Adviser has contractually agreed to limit the Fund’s expenses, although this limit did not apply because the Fund’s total expenses as shown were below the applicable fee limit.
· For Janus Henderson Contrarian Fund, the Trustees noted that, although the Fund’s total expenses exceeded the peer group average for all share classes, overall the Fund’s total expenses were reasonable. The Trustees also noted that the Adviser had contractually agreed to limit the Fund’s expenses.
· For Janus Henderson Enterprise Fund, the Trustees noted that, although the Fund’s total expenses exceeded the peer group average for certain share classes, overall the Fund’s total expenses were reasonable. The Trustees also noted that the Adviser has contractually agreed to limit the Fund’s expenses, although this limit did not apply because the Fund’s total expenses as shown were below the applicable fee limit.
Janus Henderson Emerging Markets Fund
Additional Information (unaudited)
· For Janus Henderson Forty Fund, the Trustees noted that, although the Fund’s total expenses exceeded the peer group average for certain share classes, overall the Fund’s total expenses were reasonable. The Trustees also noted that the Adviser has contractually agreed to limit the Fund’s expenses, although this limit did not apply because the Fund’s total expenses as shown were below the applicable fee limit.
· For Janus Henderson Growth and Income Fund, the Trustees noted that, although the Fund’s total expenses exceeded the peer group average for certain share classes, overall the Fund’s total expenses were reasonable. The Trustees also noted that the Adviser has contractually agreed to limit the Fund’s expenses, although this limit did not apply because the Fund’s total expenses as shown were below the applicable fee limit.
· For Janus Henderson Mid Cap Value Fund, the Trustees noted that the Fund’s total expenses were below the peer group average for all share classes.
· For Janus Henderson Research Fund, the Trustees noted that, although the Fund’s total expenses exceeded the peer group average for certain share classes, overall the Fund’s total expenses were reasonable. The Trustees also noted that the Adviser has contractually agreed to limit the Fund’s expenses.
· For Janus Henderson Small Cap Value Fund, the Trustees noted that, although the Fund’s total expenses exceeded the peer group average for one share class, overall the Fund’s total expenses were reasonable. The Trustees also noted that the Adviser has contractually agreed to limit the Fund’s expenses, although this limit did not apply because the Fund’s total expenses as shown were below the applicable fee limit.
· For Janus Henderson Small-Mid Cap Value Fund, the Trustees noted that the Fund’s total expenses were below the peer group average for all share classes.
· For Janus Henderson Triton Fund, the Trustees noted that, although the Fund’s total expenses exceeded the peer group average for one share class, overall the Fund’s total expenses were reasonable. The Trustees also noted that the Adviser has contractually agreed to limit the Fund’s expenses, although this limit did not apply because the Fund’s total expenses as shown were below the applicable fee limit.
· For Janus Henderson Venture Fund, the Trustees noted that although the Fund’s total expenses exceeded the peer group average for one share class, overall the Fund’s total expenses were reasonable. The Trustees also noted that the Adviser has contractually agreed to limit the Fund’s expenses, although this limit did not apply because the Fund’s total expenses as shown were below the applicable fee limit.
The Trustees reviewed information on the overall profitability to the Adviser and its affiliates from their relationships with the Janus Henderson Funds, and considered profitability data of other publicly traded mutual fund advisers. The Trustees recognized that profitability comparisons among fund managers are difficult because of the variation in the type of comparative information that is publicly available, and the profitability of any fund manager is affected by numerous factors, including the organizational structure of the particular fund manager, differences in complex size, difference in product mix, difference in types of business (mutual fund, institutional and other), differences in the types of funds and other accounts it manages, possible other lines of business, the methodology for allocating expenses and the fund manager’s capital structure and cost of capital.
Additionally, the Trustees considered the estimated profitability to the Adviser from the investment management services it provided to each Janus Henderson Fund. In their review, the Trustees considered whether the Adviser receive adequate incentives and resources to manage the Janus Henderson Funds effectively. In reviewing profitability, the Trustees noted that the estimated profitability for an individual Janus Henderson Fund is necessarily a product of the allocation methodology utilized by the Adviser to allocate its expenses as part of the estimated profitability calculation. In this regard, the Trustees noted that the independent fee consultant found as part of its 2022 review that (1) the expense allocation methodology and rationales utilized by the Adviser were reasonable and (2) no clear correlation exists between expense allocations and operating margins. The Trustees also considered that the estimated profitability for an individual Janus Henderson Fund was influenced by a number of factors, including not only the allocation methodology selected, but also the presence of fee waivers and expense caps, and whether the Janus Henderson Fund’s investment management agreement contained breakpoints or a performance fee component. The Trustees determined, after taking into account these factors, among others, that the Adviser’s estimated profitability with respect to each Janus Henderson Fund was not unreasonable in relation to the services provided, and that the variation in the range of such estimated profitability among the Janus Henderson Funds was not a material factor in the Board’s approval of the reasonableness of any Janus Henderson Fund’s investment management fees.
Janus Henderson Emerging Markets Fund
Additional Information (unaudited)
The Trustees concluded that the management fees payable by each Janus Henderson Fund to the Adviser were reasonable in relation to the nature, extent, and quality of the services provided, taking into account the fees charged by other advisers for managing comparable mutual funds with similar strategies, the fees the Adviser charges to other clients, and, as applicable, the impact of fund performance on management fees payable by the Janus Henderson Funds. The Trustees also concluded that each Janus Henderson Fund’s total expenses were reasonable, taking into account the size of the Janus Henderson Fund, the quality of services provided by the Adviser, the investment performance of the Janus Henderson Fund, and any expense limitations agreed to or provided by the Adviser.
Economies of Scale
The Trustees considered information about the potential for the Adviser to realize economies of scale as the assets of the Janus Henderson Funds increase. They noted that their independent fee consultant published a report to the Trustees in June 2022 which provided its research and analysis into economies of scale. They also noted that, although many Janus Henderson Funds pay advisory fees at a fixed base rate as a percentage of net assets, without any breakpoints or performance fees, their independent fee consultant concluded that 75% of these Janus Henderson Funds’ have contractual management fees (gross of waivers) below their Broadridge Expense Group averages. The Trustees also noted the following from the independent fee consultant’s report: (1) that 31% of Janus Henderson Funds had management fee breakpoints in place whereby investors pay lower management fees as fund AUM increases; (2) that 29% of Janus Henderson Funds have low flat-rate fees and performance fees where the Adviser is incentivized to invest in resources which drive Janus Henderson Fund performance; and (3) that 39% of Janus Henderson Funds have low flat-rate fees versus peers where investors pay low fixed fees when the Janus Henderson Fund is small/midsized and higher fees when the Janus Henderson Fund grows in assets. The Trustees also noted that the Janus Henderson Funds share directly in economies of scale through the significant investments made by the Adviser and its affiliates related to services provided to the Funds and the lower charges of third-party service providers that are based in part on the combined scale of all of the Janus Henderson Funds.
The Trustees also considered the independent fee consultant’s conclusion that, given the limitations of various analytical approaches to economies of scale and their conflicting results, it is difficult to analytically confirm or deny the existence of economies of scale in the Janus Henderson complex. In this regard, the independent consultant concluded that (1) to the extent there were economies of scale at the Adviser, the Adviser’s general strategy of setting fixed management fees below peers appeared to share any such economies with investors even on smaller Janus Henderson Funds which have not yet achieved those economies and (2) by setting lower fixed fees from the start on these Janus Henderson Funds, the Adviser appeared to be investing to increase the likelihood that these Janus Henderson Funds will grow to a level to achieve any economies of scale that may exist. Further, the independent fee consultant provided its belief that Janus Henderson Fund investors are well-served by the fee levels and performance fee structures in place on the Janus Henderson Funds in light of any economies of scale that may be present at the Adviser.
Based on all of the information reviewed, including the recent and past research and analysis conducted by the Trustees’ independent fee consultant, the Trustees concluded that the current fee structure of each Janus Henderson Fund was reasonable and that the current rates of fees do reflect a sharing between the Adviser and the Janus Henderson Fund of any economies of scale that may be present at the current asset level of the Janus Henderson Fund.
Other Benefits to the Adviser
The Trustees also considered benefits that accrue to the Adviser and its affiliates from their relationships with the Janus Henderson Funds. They recognized that two affiliates of the Adviser separately serve the Janus Henderson Funds as transfer agent and distributor, respectively, and the transfer agent receives compensation directly from the non-money market Janus Henderson Funds for services provided, and that such compensation contributes to the overall profitability of the Adviser and its affiliates that results from their relationship with the Janus Henderson Funds. The Trustees also considered the Adviser’s past and proposed use of commissions paid by the Janus Henderson Funds on portfolio brokerage transactions to obtain proprietary and third-party research products and services benefiting the Janus Henderson Fund and/or other clients of the Adviser and/or the Adviser. The Trustees concluded that the Adviser’s use of these types of client commission arrangements to obtain proprietary and third-party research products and services was consistent with regulatory requirements and guidelines and was likely to benefit each Janus Henderson Fund. The Trustees also concluded that, other than the services provided by the Adviser and its affiliates pursuant to the agreements and the fees to be paid by each Janus Henderson Fund therefor, the Janus Henderson
Janus Henderson Emerging Markets Fund
Additional Information (unaudited)
Funds and the Adviser may potentially benefit from their relationship with each other in other ways. They concluded that the Adviser and its affiliates share directly in economies of scale through the lower charges of third-party service providers that are based in part on the combined scale of the Janus Henderson Funds and other clients serviced by the Adviser and its affiliates. They also concluded that the Adviser benefits from the receipt of research products and services acquired through commissions paid on portfolio transactions of the Janus Henderson Funds and that the Janus Henderson Funds benefit from the Adviser’s receipt of those products and services as well as research products and services acquired through commissions paid by other clients of the Adviser. They further concluded that the success of any Janus Henderson Fund could attract other business to the Adviser or other Janus Henderson Funds, and that the success of the Adviser could enhance the Adviser’s ability to serve the Janus Henderson Funds.
Janus Henderson Emerging Markets Fund
Liquidity Risk Management Program (unaudited)
Liquidity Risk Management Program
Rule 22e-4 under the Investment Company Act of 1940, as amended (the “Liquidity Rule”), requires open-end funds (but not money market funds) to adopt and implement a written liquidity risk management program (the “LRMP”) that is reasonably designed to assess and manage liquidity risk, which is the risk that a fund could not meet redemption requests without significant dilution of remaining investors’ interest in the fund. The Fund has implemented a LRMP, which incorporates the following elements: (i) assessment, management, and periodic review of liquidity risk; (ii) classification of portfolio holdings; (iii) the establishment and monitoring of a highly liquid investment minimum, as applicable; (iv) a 15% limitation on a Fund’s illiquid investments; (v) redemptions in-kind; and (vi) board oversight.
The Trustees of the Fund (the “Trustees”) have designated Janus Henderson Investors US LLC, the Fund’s investment adviser (the “Adviser”), as the Program Administrator for the LRMP responsible for administering the LRMP and carrying out the specific responsibilities of the LRMP. A working group comprised of various teams within the Adviser’s business is responsible for administering the LRMP and carrying out the specific responsibilities of different aspects of the LRMP (the “Liquidity Risk Working Group”). In assessing each Fund’s liquidity risk, the Liquidity Risk Working Group periodically considers, as relevant, factors including (i) the liquidity of a Fund’s portfolio investments during normal and reasonably foreseeable stressed conditions; (ii) whether a Fund’s investment strategy is appropriate for an open-end fund; (iii) the extent to which a Fund’s strategy involves a relatively concentrated portfolio or large positions in any issuer; (iv) a Fund’s use of borrowing for investment purposes; and (v) a Fund’s use of derivatives.
The Liquidity Rule requires the Trustees to review at least annually a written report provided by the Program Administrator that addresses the operation of the LRMP and assesses its adequacy and the effectiveness of its implementation, including, if applicable, the operation of the highly liquid investment minimum, and any material changes to the LRMP (the “Program Administrator Report”). At a meeting held on March 15, 2023, the Adviser provided the Program Administrator Report to the Trustees which covered the operation of the LRMP from January 1, 2022 through December 31, 2022 (the “Reporting Period”).
The Program Administrator Report discussed the operation and effectiveness of the LRMP during the Reporting Period. Among other things, the Program Administrator Report indicated that there were no material changes to the LRMP during the Reporting Period, although there were certain methodology adjustments implemented relating to a change in data provider. Additionally, the findings presented in the Program Administrator Report indicated that the LRMP operated adequately during the Reporting Period. These findings included that the Fund was able to meet redemptions during the normal course of business during the Reporting Period. The Program Administrator Report also stated that the Fund did not exceed the 15% limit on illiquid assets during the Reporting Period, with the exception of extended market closures due to planned holidays, that the Fund held primarily highly liquid assets, and was considered to be a primarily highly liquid fund during the Reporting Period. Also included among the Program Administrator Report’s findings was the determination that the Fund’s investment strategy remains appropriate for an open-end fund. In addition, the Adviser expressed its belief in the Program Administrator Report that the LRMP is reasonably designed and adequate to assess and manage the Fund’s liquidity risk, considering the Fund’s particular risks and circumstances, and includes policies and procedures reasonably designed to implement each required component of the Liquidity Rule.
There can be no assurance that the LRMP will achieve its objectives in the future. Please refer to your Fund’s prospectus for more information regarding the risks to which an investment in the Fund may be subject.
Janus Henderson Emerging Markets Fund
Useful Information About Your Fund Report (unaudited)
Performance Overviews
Performance overview graphs compare the performance of a hypothetical $10,000 investment in the Fund with one or more widely used market indices. When comparing the performance of the Fund with an index, keep in mind that market indices are not available for investment and do not reflect deduction of expenses.
Average annual total returns are quoted for a Fund with more than one year of performance history. Average annual total return is calculated by taking the growth or decline in value of an investment over a period of time, including reinvestment of dividends and distributions, then calculating the annual compounded percentage rate that would have produced the same result had the rate of growth been constant throughout the period. Average annual total return does not reflect the deduction of taxes that a shareholder would pay on Fund distributions or redemptions of Fund shares.
Cumulative total returns are quoted for a Fund with less than one year of performance history. Cumulative total return is the growth or decline in value of an investment over time, independent of the period of time involved. Cumulative total return does not reflect the deduction of taxes that a shareholder would pay on Fund distributions or redemptions of Fund shares.
Pursuant to federal securities rules, expense ratios shown in the performance chart reflect subsidized (if applicable) and unsubsidized ratios. The total annual fund operating expenses ratio is gross of any fee waivers, reflecting the Fund’s unsubsidized expense ratio. The net annual fund operating expenses ratio (if applicable) includes contractual waivers of the Adviser and reflects the Fund’s subsidized expense ratio. Ratios may be higher or lower than those shown in the “Financial Highlights” in this report.
Schedule of Investments
Following the performance overview section is the Fund’s Schedule of Investments. This schedule reports the types of securities held in the Fund on the last day of the reporting period. Securities are usually listed by type (common stock, corporate bonds, U.S. Government obligations, etc.) and by industry classification (banking, communications, insurance, etc.). Holdings are subject to change without notice.
The value of each security is quoted as of the last day of the reporting period. The value of securities denominated in foreign currencies is converted into U.S. dollars.
If the Fund invests in foreign securities, it will also provide a summary of investments by country. This summary reports the Fund exposure to different countries by providing the percentage of securities invested in each country. The country of each security represents the country of risk. A company may be allocated to a country based on other factors such as location of the company’s principal office, the location of the principal trading market for the company’s securities, or the country where a majority of the company’s revenues are derived. The Fund’s Schedule of Investments relies upon the industry group and country classifications published by Bloomberg and/or MSCI Inc.
Tables listing details of individual forward currency contracts, futures, written options, swaptions, and swaps follow the Fund’s Schedule of Investments (if applicable).
Statement of Assets and Liabilities
This statement is often referred to as the “balance sheet.” It lists the assets and liabilities of the Fund on the last day of the reporting period.
The Fund’s assets are calculated by adding the value of the securities owned, the receivable for securities sold but not yet settled, the receivable for dividends declared but not yet received on securities owned, and the receivable for Fund shares sold to investors but not yet settled. The Fund’s liabilities include payables for securities purchased but not yet settled, Fund shares redeemed but not yet paid, and expenses owed but not yet paid. Additionally, there may be other assets and liabilities such as unrealized gain or loss on forward currency contracts.
The section entitled “Net Assets Consist of” breaks down the components of the Fund’s net assets. Because the Fund must distribute substantially all earnings, you will notice that a significant portion of net assets is shareholder capital.
The last section of this statement reports the net asset value (“NAV”) per share on the last day of the reporting period. The NAV is calculated by dividing the Fund’s net assets for each share class (assets minus liabilities) by the number of shares outstanding.
Janus Henderson Emerging Markets Fund
Useful Information About Your Fund Report (unaudited)
Statement of Operations
This statement details the Fund’s income, expenses, realized gains and losses on securities and currency transactions, and changes in unrealized appreciation or depreciation of Fund holdings.
The first section in this statement, entitled “Investment Income,” reports the dividends earned from securities and interest earned from interest-bearing securities in the Fund.
The next section reports the expenses incurred by the Fund, including the advisory fee paid to the investment adviser, transfer agent fees and expenses, and printing and postage for mailing statements, financial reports and prospectuses. Expense offsets and expense reimbursements, if any, are also shown.
The last section lists the amounts of realized gains or losses from investment and foreign currency transactions, and changes in unrealized appreciation or depreciation of investments and foreign currency-denominated assets and liabilities. The Fund will realize a gain (or loss) when it sells its position in a particular security. A change in unrealized gain (or loss) refers to the change in net appreciation or depreciation of the Fund during the reporting period. “Net Realized and Unrealized Gain/(Loss) on Investments” is affected both by changes in the market value of Fund holdings and by gains (or losses) realized during the reporting period.
Statements of Changes in Net Assets
These statements report the increase or decrease in the Fund’s net assets during the reporting period. Changes in the Fund’s net assets are attributable to investment operations, dividends and distributions to investors, and capital share transactions. This is important to investors because it shows exactly what caused the Fund’s net asset size to change during the period.
The first section summarizes the information from the Statement of Operations regarding changes in net assets due to the Fund’s investment operations. The Fund’s net assets may also change as a result of dividend and capital gains distributions to investors. If investors receive their dividends and/or distributions in cash, money is taken out of the Fund to pay the dividend and/or distribution. If investors reinvest their dividends and/or distributions, the Fund’s net assets will not be affected.
The reinvestment of dividends and distributions is included under “Capital Share Transactions.” “Capital Shares” refers to the money investors contribute to the Fund through purchases or withdrawals via redemptions. The Fund’s net assets will increase and decrease in value as investors purchase and redeem shares from the Fund.
Financial Highlights
This schedule provides a per-share breakdown of the components that affect the Fund’s NAV for current and past reporting periods as well as total return, asset size, ratios, and portfolio turnover rate.
The first line in the table reflects the NAV per share at the beginning of the reporting period. The next line reports the net investment income/(loss) per share. Following is the per share total of net gains/(losses), realized and unrealized. Per share dividends and distributions to investors are then subtracted to arrive at the NAV per share at the end of the period. The next line reflects the total return for the period. The total return may include adjustments in accordance with generally accepted accounting principles required at the period end for financial reporting purposes. As a result, the total return may differ from the total return reflected for individual shareholder transactions. Also included are ratios of expenses and net investment income to average net assets.
The Fund’s expenses may be reduced through expense offsets and expense reimbursements. The ratios shown reflect expenses before and after any such offsets and reimbursements.
The ratio of net investment income/(loss) summarizes the income earned less expenses, divided by the average net assets of the Fund during the reporting period. Do not confuse this ratio with the Fund’s yield. The net investment income ratio is not a true measure of the Fund’s yield because it does not take into account the dividends distributed to the Fund’s investors.
The next figure is the portfolio turnover rate, which measures the buying and selling activity in the Fund. Portfolio turnover is affected by market conditions, changes in the asset size of the Fund, fluctuating volume of shareholder purchase and redemption orders, the nature of the Fund’s investments, and the investment style and/or outlook of the portfolio manager(s) and/or investment personnel. A 100% rate implies that an amount equal to the value of the entire portfolio was replaced once during the fiscal year; a 50% rate means that an amount equal to the value of half the
Janus Henderson Emerging Markets Fund
Useful Information About Your Fund Report (unaudited)
portfolio is traded in a year; and a 200% rate means that an amount equal to the value of the entire portfolio is traded every six months.
| | | | | | | | |
| | | | | |

| | | | |
This report is submitted for the general information of shareholders of the Fund. It is not an offer or solicitation for the Fund and is not authorized for distribution to prospective investors unless preceded or accompanied by an effective prospectus. |
Janus Henderson is a trademark of Janus Henderson Group plc or one of its subsidiaries. © Janus Henderson Group plc. Janus Henderson Group is the ultimate parent of Janus Henderson Distributors US LLC. Janus Henderson Distributors US LLC |
| | | | 125-24-93079 05-23 |
| | | | |
| | | |
| | | SEMIANNUAL REPORT March 31, 2023 |
| | |
| | Janus Henderson Enterprise Fund |
| | |
| | Janus Investment Fund |
| |
| | | HIGHLIGHTS · Investment strategy behind your fund · Fund performance, characteristics
and holdings |
Table of Contents
Janus Henderson Enterprise Fund
| | | | | | |
| | | | | 
Brian Demain co-portfolio manager | 
Cody Wheaton co-portfolio manager |
| | | |
Janus Henderson Enterprise Fund (unaudited)
Fund At A Glance
March 31, 2023
| | | | | | | | | | |
| | | | | | | | | |
| | | | | | | | | |
| | | | | | | | | |
| 5 Top Contributors - Holdings | 5 Top Detractors - Holdings |
| | Average
Weight | | Relative
Contribution | | | Average
Weight | | Relative
Contribution |
| ON Semiconductor Corp | 4.15% | | 0.57% | | Fidelity National Information Services Inc | 1.05% | | -0.56% |
| Constellation Software Inc/Canada | 2.98% | | 0.52% | | Charles Schwab Corp | 1.13% | | -0.53% |
| WEX Inc | 2.28% | | 0.50% | | Intact Financial Corp | 2.90% | | -0.48% |
| SVB Financial Group | 0.03% | | 0.49% | | L3Harris Technologies Inc | 1.72% | | -0.40% |
| Flex Ltd | 2.23% | | 0.41% | | WR Berkley Corp | 2.14% | | -0.37% |
| | | | | | | |
| 5 Top Contributors - Sectors* | | | | | |
| | | Relative | | Fund | Russell Midcap Growth Index |
| | | Contribution | | Average Weight | Average Weight |
| Information Technology | | 3.48% | | 37.36% | 27.67% |
| Energy | | 0.68% | | 2.14% | 4.83% |
| Industrials | | 0.38% | | 16.05% | 16.05% |
| Communication Services | | 0.37% | | 2.54% | 4.30% |
| Materials | | 0.30% | | 1.64% | 3.81% |
| | | | | | |
| | | | | | |
| 5 Top Detractors - Sectors* | | | | | |
| | | Relative | | Fund | Russell Midcap Growth Index |
| | | Contribution | | Average Weight | Average Weight |
| Financials | | -1.42% | | 11.27% | 5.92% |
| Health Care | | -0.44% | | 16.57% | 17.04% |
| Consumer Discretionary | | -0.42% | | 7.11% | 15.14% |
| Other** | | -0.40% | | 3.31% | 0.00% |
| Utilities | | -0.09% | | 0.64% | 0.26% |
| | | | | | | |
| Relative contribution reflects how the portolio's holdings impacted return relative to the benchmark. Cash and securities not held in the portfolio are not shown. For equity portfolios, relative contribution compares the performance of a security in the portfolio to the benchmark's total return, factoring in the difference in weight of that security in the benchmark. Returns are calculated using daily returns and previous day ending weights rolled up by ticker, excluding fixed income securities, gross of advisory fees, may exclude certain derivatives and will differ from actual performance.
Performance attribution reflects returns gross of advisory fees and may differ from actual returns as they are based on end of day holdings. Attribution is calculated by geometrically linking daily returns for the portfolio and index. |
* | Based on sector classification according to the Global Industry Classification Standard (“GICS”) codes, which are the exclusive property and a service mark of MSCI Inc. and Standard & Poor’s. |
** | Not a GICS classified sector. |
Janus Henderson Enterprise Fund (unaudited)
Fund At A Glance
March 31, 2023
| | |
5 Largest Equity Holdings - (% of Net Assets) |
ON Semiconductor Corp | |
Semiconductor & Semiconductor Equipment | 4.6% |
Constellation Software Inc/Canada | |
Software | 3.3% |
Boston Scientific Corp | |
Health Care Equipment & Supplies | 3.0% |
Amdocs Ltd | |
Information Technology Services | 2.9% |
Intact Financial Corp | |
Insurance | 2.7% |
| | 16.5% |
| | | | | | |
Asset Allocation - (% of Net Assets) | |
Common Stocks | | 95.7% | |
Investment Companies | | 4.5% | |
Investments Purchased with Cash Collateral from Securities Lending | | 0.0% | |
Other | | (0.2)% |
| | | 100.0% |
| | |
Top Country Allocations - Long Positions - (% of Investment Securities) |
As of March 31, 2023 
| As of September 30, 2022 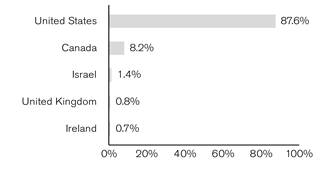
|
Janus Henderson Enterprise Fund (unaudited)
Performance
| |
See important disclosures on the next page. |
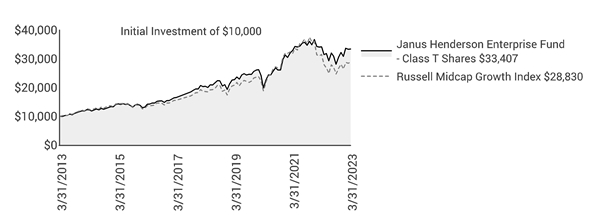
| | | | | | | | | | | |
| | | | | | | | | |
| | | | | | | | | | |
Average Annual Total Return - for the periods ended March 31, 2023 | | | Prospectus Expense Ratios |
| | Fiscal
Year-to-Date | One
Year | Five
Year | Ten
Year | Since
Inception* | | | Total Annual Fund
Operating Expenses‡ |
Class A Shares at NAV | | 18.60% | -2.46% | 10.06% | 12.58% | 10.95% | | | 1.14% |
Class A Shares at MOP | | 11.78% | -8.07% | 8.76% | 11.92% | 10.73% | | | |
Class C Shares at NAV | | 18.29% | -2.95% | 9.45% | 11.91% | 10.19% | | | 1.74% |
Class C Shares at CDSC | | 17.29% | -3.81% | 9.45% | 11.91% | 10.19% | | | |
Class D Shares | | 18.79% | -2.14% | 10.41% | 12.92% | 11.12% | | | 0.79% |
Class I Shares | | 18.80% | -2.10% | 10.46% | 12.99% | 11.16% | | | 0.76% |
Class N Shares | | 18.88% | -2.01% | 10.56% | 13.09% | 11.17% | | | 0.66% |
Class R Shares | | 18.43% | -2.74% | 9.74% | 12.25% | 10.57% | | | 1.42% |
Class S Shares | | 18.58% | -2.49% | 10.01% | 12.54% | 10.84% | | | 1.16% |
Class T Shares | | 18.73% | -2.25% | 10.29% | 12.82% | 11.08% | | | 0.91% |
Russell Midcap Growth Index | | 16.67% | -8.52% | 9.07% | 11.17% | 10.06% | | | |
Morningstar Quartile - Class T Shares | | - | 1st | 1st | 1st | 1st | | | |
Morningstar Ranking - based on total returns for Mid-Cap Growth Funds | | - | 24/580 | 80/529 | 34/489 | 22/128 | | | |
Returns quoted are past performance and do not guarantee future results; current performance may be lower or higher. Investment returns and principal value will vary; there may be a gain or loss when shares are sold. For the most recent month-end performance call 800.668.0434 (or 800.525.3713 if you hold shares directly with Janus Henderson) or visit janushenderson.com/performance (or janushenderson.com/allfunds if you hold shares directly with Janus Henderson).
Maximum Offering Price (MOP) returns include the maximum sales charge of 5.75%. Net Asset Value (NAV) returns exclude this charge, which would have reduced returns.
CDSC returns include a 1% contingent deferred sales charge (CDSC) on Shares redeemed within 12 months of purchase. Net Asset Value (NAV) returns exclude this charge, which would have reduced returns.
Janus Henderson Enterprise Fund (unaudited)
Performance
Performance may be affected by risks that include those associated with foreign and emerging markets, fixed income securities, high-yield and high-risk securities, undervalued, overlooked and smaller capitalization companies, real estate related securities including Real Estate Investment Trusts (REITs), Environmental, Social and Governance (ESG) factors, non-diversification, portfolio turnover, derivatives, short sales, initial public offerings (IPOs) and potential conflicts of interest. Each product has different risks. Please see the prospectus for more information about risks, holdings and other details.
Returns include reinvestment of all dividends and distributions and do not reflect the deduction of taxes that a shareholder would pay on Fund distributions or redemptions of Fund shares. The returns do not include adjustments in accordance with generally accepted accounting principles required at the period end for financial reporting purposes.
Class A Shares, Class C Shares, Class R Shares, and Class S Shares commenced operations on July 6, 2009. Performance shown for each class for periods prior to July 6, 2009, reflects the performance of the Fund’s Class J Shares, the initial share class (renamed Class T Shares effective February 16, 2010), calculated using the fees and expenses of each respective class, without the effect of any fee and expense limitations or waivers.
Class D Shares commenced operations on February 16, 2010. Performance shown for periods prior to February 16, 2010, reflects the performance of the Fund’s former Class J Shares, calculated using the fees and expenses in effect during the periods shown, net of any applicable fee and expense limitations or waivers.
Class I Shares commenced operations on July 6, 2009. Performance shown for periods prior to July 6, 2009, reflects the performance of the Fund’s former Class J Shares, calculated using the fees and expenses of Class J Shares, net of any applicable fee and expense limitations or waivers.
Class N Shares commenced operations on July 12, 2012. Performance shown for periods prior to July 12, 2012, reflects the performance of the Fund's Class T Shares, calculated using the fees and expenses of Class T Shares, net of any applicable fee and expense limitations or waivers.
If each share class of the Fund had been available during periods prior to its commencement, the performance shown may have been different. The performance shown for periods following the Fund’s commencement of each share class reflects the fees and expenses of each respective share class, net of any applicable fee and expense limitations or waivers. Please refer to the Fund’s prospectuses for further details concerning historical performance.
Ranking is for the share class shown only; other classes may have different performance characteristics. When an expense waiver is in effect, it may have a material effect on the total return, and therefore the ranking for the period.
© 2023 Morningstar, Inc. All Rights Reserved.
There is no assurance that the investment process will consistently lead to successful investing.
See Notes to Schedule of Investments and Other Information for index definitions.
Index performance does not reflect the expenses of managing a portfolio as an index is unmanaged and not available for direct investment.
See “Useful Information About Your Fund Report.”
*The Fund’s inception date – September 1, 1992
‡ As stated in the prospectus. See Financial Highlights for actual expense ratios during the reporting period.
Janus Henderson Enterprise Fund (unaudited)
Expense Examples
As a shareholder of the Fund, you incur two types of costs: (1) transaction costs, such as sales charges (loads) on purchase payments (applicable to Class A Shares only); and (2) ongoing costs, including management fees; 12b-1 distribution and shareholder servicing fees; transfer agent fees and expenses payable pursuant to the Transfer Agency Agreement; and other Fund expenses. This example is intended to help you understand your ongoing costs (in dollars) of investing in the Fund and to compare these costs with the ongoing costs of investing in other mutual funds. To do so, compare this 5% hypothetical example with the 5% hypothetical examples that appear in the shareholder reports of the other funds. The example is based upon an investment of $1,000 invested at the beginning of the period and held for the six-months indicated, unless noted otherwise in the table and footnotes below.
Actual Expenses
The information in the table under the heading “Actual” provides information about actual account values and actual expenses. You may use the information in these columns, together with the amount you invested, to estimate the expenses that you paid over the period. Simply divide your account value by $1,000 (for example, an $8,600 account value divided by $1,000 = 8.6), then multiply the result by the number in the appropriate column for your share class under the heading entitled “Expenses Paid During Period” to estimate the expenses you paid on your account during the period.
Hypothetical Example for Comparison Purposes
The information in the table under the heading “Hypothetical (5% return before expenses)” provides information about hypothetical account values and hypothetical expenses based upon the Fund’s actual expense ratio and an assumed rate of return of 5% per year before expenses, which is not the Fund’s actual return. The hypothetical account values and expenses may not be used to estimate the actual ending account balance or expenses you paid for the period. You may use this information to compare the ongoing costs of investing in the Fund and other funds. To do so, compare this 5% hypothetical example with the 5% hypothetical examples that appear in the shareholder reports of the other funds. Additionally, for an analysis of the fees associated with an investment in any share class or other similar funds, please visit www.finra.org/fundanalyzer.
Please note that the expenses shown in the table are meant to highlight your ongoing costs only and do not reflect any transaction costs. These fees are fully described in the Fund’s prospectuses. Therefore, the hypothetical examples are useful in comparing ongoing costs only, and will not help you determine the relative total costs of owning different funds. In addition, if these transaction costs were included, your costs would have been higher.
| | | | | | | | | | | |
| | | | | | | | |
| | | Actual | | Hypothetical
(5% return before expenses) | |
| Beginning
Account
Value
(10/1/22) | Ending
Account
Value
(3/31/23) | Expenses
Paid During
Period
(10/1/22 - 3/31/23)† | | Beginning
Account
Value
(10/1/22) | Ending
Account
Value
(3/31/23) | Expenses
Paid During
Period
(10/1/22 - 3/31/23)† | Net Annualized
Expense Ratio
(10/1/22 - 3/31/23) |
Class A Shares | $1,000.00 | $1,186.00 | $6.10 | | $1,000.00 | $1,019.35 | $5.64 | 1.12% |
Class C Shares | $1,000.00 | $1,182.90 | $8.93 | | $1,000.00 | $1,016.75 | $8.25 | 1.64% |
Class D Shares | $1,000.00 | $1,187.90 | $4.36 | | $1,000.00 | $1,020.94 | $4.03 | 0.80% |
Class I Shares | $1,000.00 | $1,188.00 | $4.20 | | $1,000.00 | $1,021.09 | $3.88 | 0.77% |
Class N Shares | $1,000.00 | $1,188.80 | $3.66 | | $1,000.00 | $1,021.59 | $3.38 | 0.67% |
Class R Shares | $1,000.00 | $1,184.30 | $7.68 | | $1,000.00 | $1,017.90 | $7.09 | 1.41% |
Class S Shares | $1,000.00 | $1,185.80 | $6.32 | | $1,000.00 | $1,019.15 | $5.84 | 1.16% |
Class T Shares | $1,000.00 | $1,187.30 | $4.91 | | $1,000.00 | $1,020.44 | $4.53 | 0.90% |
† | Expenses Paid During Period are equal to the Net Annualized Expense Ratio multiplied by the average account value over the period, multiplied by 182/365 (to reflect the one-half year period). Expenses in the examples include the effect of applicable fee waivers and/or expense reimbursements, if any. Had such waivers and/or reimbursements not been in effect, your expenses would have been higher. Please refer to the Notes to Financial Statements or the Fund’s prospectuses for more information regarding waivers and/or reimbursements. |
Janus Henderson Enterprise Fund
Schedule of Investments (unaudited)
March 31, 2023
| | | | | | | | |
Shares or
Principal Amounts | | | Value | |
Common Stocks– 95.7% | | | |
Aerospace & Defense – 1.5% | | | |
| | L3Harris Technologies Inc | | 1,381,178 | | | $271,042,371 | |
Airlines – 1.1% | | | |
| | Ryanair Holdings PLC (ADR)* | | 2,029,023 | | | 191,316,579 | |
Auto Components – 0.5% | | | |
| | Visteon Corp* | | 579,399 | | | 90,867,145 | |
Biotechnology – 2.5% | | | |
| | Argenx SE (ADR)* | | 351,054 | | | 130,795,699 | |
| | Ascendis Pharma A/S (ADR)* | | 998,487 | | | 107,057,776 | |
| | BioMarin Pharmaceutical Inc* | | 1,328,619 | | | 129,194,912 | |
| | Sarepta Therapeutics Inc* | | 625,115 | | | 86,159,600 | |
| | | 453,207,987 | |
Capital Markets – 3.7% | | | |
| | Cboe Global Markets Inc | | 908,043 | | | 121,895,692 | |
| | Charles Schwab Corp | | 2,592,014 | | | 135,769,693 | |
| | LPL Financial Holdings Inc | | 1,671,238 | | | 338,258,571 | |
| | MSCI Inc | | 145,408 | | | 81,383,404 | |
| | | 677,307,360 | |
Chemicals – 1.0% | | | |
| | Corteva Inc | | 3,001,585 | | | 181,025,591 | |
Commercial Services & Supplies – 3.2% | | | |
| | Cimpress PLC*,£ | | 2,152,710 | | | 94,331,752 | |
| | Clean Harbors Inc* | | 524,972 | | | 74,840,008 | |
| | Rentokil Initial PLC | | 4,431,913 | | | 32,399,822 | |
| | Rentokil Initial PLC (ADR) | | 6,438,855 | | | 235,082,596 | |
| | Ritchie Bros Auctioneers Inc | | 2,421,536 | | | 136,308,261 | |
| | | 572,962,439 | |
Containers & Packaging – 0.5% | | | |
| | Sealed Air Corp | | 2,107,142 | | | 96,738,889 | |
Diversified Consumer Services – 0.5% | | | |
| | Frontdoor Inc* | | 3,434,162 | | | 95,744,437 | |
Diversified Financial Services – 4.1% | | | |
| | Fidelity National Information Services Inc | | 2,650,058 | | | 143,977,651 | |
| | Global Payments Inc | | 1,636,430 | | | 172,217,893 | |
| | WEX Inc*,£ | | 2,340,092 | | | 430,319,518 | |
| | | 746,515,062 | |
Electric Utilities – 0.6% | | | |
| | Alliant Energy Corp | | 1,938,360 | | | 103,508,424 | |
Electrical Equipment – 2.4% | | | |
| | Regal Beloit Corp | | 567,956 | | | 79,928,448 | |
| | Sensata Technologies Holding PLC | | 7,030,687 | | | 351,674,964 | |
| | | 431,603,412 | |
Electronic Equipment, Instruments & Components – 7.3% | | | |
| | Flex Ltd* | | 18,001,617 | | | 414,217,207 | |
| | National Instruments Corp | | 3,391,814 | | | 177,764,972 | |
| | TE Connectivity Ltd | | 2,637,854 | | | 345,954,552 | |
| | Teledyne Technologies Inc* | | 865,012 | | | 386,971,768 | |
| | | 1,324,908,499 | |
Entertainment – 2.3% | | | |
| | Liberty Media Corp-Liberty Formula One* | | 5,361,787 | | | 401,222,521 | |
| | Liberty Media Group* | | 147,780 | | | 9,975,150 | |
| | | 411,197,671 | |
Food & Staples Retailing – 0.6% | | | |
| | Dollar Tree Inc* | | 762,787 | | | 109,498,074 | |
Health Care Equipment & Supplies – 9.5% | | | |
| | Boston Scientific Corp* | | 10,680,652 | | | 534,353,020 | |
| | Cooper Cos Inc | | 496,921 | | | 185,530,425 | |
| | Dentsply Sirona Inc | | 4,710,876 | | | 185,043,209 | |
| | ICU Medical Inc*,£ | | 1,240,213 | | | 204,585,537 | |
| | STERIS PLC | | 917,128 | | | 175,428,244 | |
| | |
See Notes to Schedule of Investments and Other Information and Notes to Financial Statements. |
| |
6 | MARCH 31, 2023 |
Janus Henderson Enterprise Fund
Schedule of Investments (unaudited)
March 31, 2023
| | | | | | | | |
Shares or
Principal Amounts | | | Value | |
Common Stocks– (continued) | | | |
Health Care Equipment & Supplies– (continued) | | | |
| | Teleflex Inc | | 1,676,456 | | | $424,663,069 | |
| | | 1,709,603,504 | |
Hotels, Restaurants & Leisure – 2.3% | | | |
| | Aramark | | 6,804,311 | | | 243,594,334 | |
| | Entain PLC | | 11,306,954 | | | 175,940,662 | |
| | | 419,534,996 | |
Information Technology Services – 5.4% | | | |
| | Amdocs Ltd | | 5,425,052 | | | 520,967,744 | |
| | GoDaddy Inc* | | 5,764,123 | | | 447,987,640 | |
| | | 968,955,384 | |
Insurance – 5.0% | | | |
| | Intact Financial Corp | | 3,443,504 | | | 492,890,212 | |
| | Ryan Specialty Group Holdings Inc - Class A* | | 2,601,760 | | | 104,694,822 | |
| | WR Berkley Corp | | 4,841,935 | | | 301,458,873 | |
| | | 899,043,907 | |
Interactive Media & Services – 0.5% | | | |
| | Ziff Davis Inc* | | 1,212,213 | | | 94,613,225 | |
Life Sciences Tools & Services – 3.4% | | | |
| | Avantor Inc* | | 10,019,312 | | | 211,808,256 | |
| | Illumina Inc* | | 651,306 | | | 151,461,210 | |
| | PerkinElmer Inc | | 1,261,643 | | | 168,126,546 | |
| | Waters Corp* | | 283,610 | | | 87,814,164 | |
| | | 619,210,176 | |
Machinery – 3.6% | | | |
| | Ingersoll Rand Inc | | 6,363,454 | | | 370,225,754 | |
| | Wabtec Corp | | 2,696,724 | | | 272,530,927 | |
| | | 642,756,681 | |
Oil, Gas & Consumable Fuels – 2.2% | | | |
| | Magellan Midstream Partners LP | | 7,147,831 | | | 387,841,310 | |
Pharmaceuticals – 1.4% | | | |
| | Catalent Inc* | | 3,366,863 | | | 221,236,568 | |
| | Elanco Animal Health Inc* | | 3,764,341 | | | 35,384,805 | |
| | | 256,621,373 | |
Professional Services – 4.7% | | | |
| | Broadridge Financial Solutions Inc | | 1,798,479 | | | 263,603,067 | |
| | SS&C Technologies Holdings Inc | | 8,667,933 | | | 489,478,177 | |
| | TransUnion | | 1,608,838 | | | 99,973,193 | |
| | | 853,054,437 | |
Road & Rail – 3.0% | | | |
| | JB Hunt Transport Services Inc | | 2,143,986 | | | 376,183,784 | |
| | TFI International Inc | | 1,454,804 | | | 173,543,569 | |
| | | 549,727,353 | |
Semiconductor & Semiconductor Equipment – 9.8% | | | |
| | KLA Corp | | 375,491 | | | 149,884,742 | |
| | Lam Research Corp | | 242,865 | | | 128,747,594 | |
| | Microchip Technology Inc | | 3,887,337 | | | 325,681,094 | |
| | NXP Semiconductors NV | | 1,813,984 | | | 338,262,666 | |
| | ON Semiconductor Corp* | | 10,116,478 | | | 832,788,469 | |
| | | 1,775,364,565 | |
Software – 7.5% | | | |
| | Atlassian Corp - Class A* | | 399,485 | | | 68,379,847 | |
| | Ceridian HCM Holding Inc* | | 3,394,968 | | | 248,579,557 | |
| | Constellation Software Inc/Canada | | 322,044 | | | 605,553,778 | |
| | Dynatrace Inc* | | 2,529,307 | | | 106,989,686 | |
| | Nice Ltd (ADR)* | | 1,184,202 | | | 271,051,996 | |
| | Topicus.com Inc* | | 856,524 | | | 61,217,411 | |
| | | 1,361,772,275 | |
| | |
See Notes to Schedule of Investments and Other Information and Notes to Financial Statements. |
| |
Janus Investment Fund | 7 |
Janus Henderson Enterprise Fund
Schedule of Investments (unaudited)
March 31, 2023
| | | | | | | | |
Shares or
Principal Amounts | | | Value | |
Common Stocks– (continued) | | | |
Specialized Real Estate Investment Trusts (REITs) – 1.3% | | | |
| | Lamar Advertising Co | | 2,398,119 | | | $239,548,107 | |
Specialty Retail – 1.8% | | | |
| | Burlington Stores Inc* | | 454,059 | | | 91,765,324 | |
| | CarMax Inc* | | 3,511,785 | | | 225,737,540 | |
| | Wayfair Inc - Class A*,# | | 191,238 | | | 6,567,113 | |
| | | 324,069,977 | |
Textiles, Apparel & Luxury Goods – 1.0% | | | |
| | Gildan Activewear Inc | | 5,337,250 | | | 177,143,328 | |
Trading Companies & Distributors – 1.5% | | | |
| | Ferguson PLC | | 2,050,593 | | | 274,266,814 | |
Total Common Stocks (cost $11,108,551,891) | | 17,310,571,352 | |
Investment Companies– 4.5% | | | |
Money Markets – 4.5% | | | |
| | Janus Henderson Cash Liquidity Fund LLC, 4.7988%ºº,£((cost $819,898,361) | | 819,764,033 | | | 819,927,986 | |
Investments Purchased with Cash Collateral from Securities Lending– 0% | | | |
Investment Companies – 0% | | | |
| | Janus Henderson Cash Collateral Fund LLC, 4.8170%ºº,£ | | 3,186,680 | | | 3,186,680 | |
Time Deposits – 0% | | | |
| | Royal Bank of Canada, 4.8000%, 4/3/23 | | $796,670 | | | 796,670 | |
Total Investments Purchased with Cash Collateral from Securities Lending (cost $3,983,350) | | 3,983,350 | |
Total Investments (total cost $11,932,433,602) – 100.2% | | 18,134,482,688 | |
Liabilities, net of Cash, Receivables and Other Assets – (0.2)% | | (38,653,900) | |
Net Assets – 100% | | $18,095,828,788 | |
| | | | | | |
Summary of Investments by Country - (Long Positions) (unaudited) |
| |
| | | | | % of | |
| | | | | Investment | |
Country | | Value | | Securities | |
United States | | $15,344,180,999 | | 84.6 | % |
Canada | | 1,646,656,559 | | 9.1 | |
United Kingdom | | 443,423,080 | | 2.4 | |
Israel | | 271,051,996 | | 1.5 | |
Ireland | | 191,316,579 | | 1.1 | |
Belgium | | 130,795,699 | | 0.7 | |
Denmark | | 107,057,776 | | 0.6 | |
| | | | | | |
| | | | | | |
Total | | $18,134,482,688 | | 100.0 | % |
| | |
See Notes to Schedule of Investments and Other Information and Notes to Financial Statements. |
| |
8 | MARCH 31, 2023 |
Janus Henderson Enterprise Fund
Schedule of Investments (unaudited)
March 31, 2023
Schedules of Affiliated Investments – (% of Net Assets)
| | | | | | | | | | | |
| | Dividend Income(1) | Realized Gain/(Loss)(1) | Change in Unrealized Appreciation/ Depreciation(1) | Value at 3/31/23 |
Common Stocks - 4.0% |
Commercial Services & Supplies - 0.5% | |
| | Cimpress PLC* | $ | - | $ | 4,471 | $ | 41,638,036 | $ | 94,331,752 |
Diversified Financial Services - 2.4% | |
| | WEX Inc* | | - | | 217,175 | | 133,141,833 | | 430,319,518 |
Health Care Equipment & Supplies - 1.1% | |
| | ICU Medical Inc* | | - | | 27,643 | | 17,791,101 | | 204,585,537 |
Total Common Stocks | $ | - | $ | 249,289 | $ | 192,570,970 | $ | 729,236,807 |
Investment Companies - 4.5% |
Money Markets - 4.5% | |
| | Janus Henderson Cash Liquidity Fund LLC, 4.7988%ºº | | 11,380,758 | | 70,283 | | (4,052) | | 819,927,986 |
Investments Purchased with Cash Collateral from Securities Lending - 0.0% |
Investment Companies - 0.0% | |
| | Janus Henderson Cash Collateral Fund LLC, 4.8170%ºº | | 92,017∆ | | - | | - | | 3,186,680 |
Total Affiliated Investments - 8.5% | $ | 11,472,775 | $ | 319,572 | $ | 192,566,918 | $ | 1,552,351,473 |
(1) For securities that were affiliated for a portion of the period ended March 31, 2023, this column reflects amounts for the entire period ended March 31, 2023 and not just the period in which the security was affiliated.
| | | | | | | | | | | |
| | Value at 9/30/22 | Purchases | Sales Proceeds | Value at 3/31/23 |
Common Stocks - 4.0% |
Commercial Services & Supplies - 0.5% | |
| | Cimpress PLC* | | 52,748,035 | | - | | (58,790) | | 94,331,752 |
Diversified Financial Services - 2.4% | |
| | WEX Inc* | | 297,331,435 | | - | | (370,925) | | 430,319,518 |
Health Care Equipment & Supplies - 1.1% | |
| | ICU Medical Inc* | | 186,952,129 | | - | | (185,336) | | 204,585,537 |
Investment Companies - 4.5% |
Money Markets - 4.5% | |
| | Janus Henderson Cash Liquidity Fund LLC, 4.7988%ºº | | 605,370,179 | | 1,423,061,704 | | (1,208,570,128) | | 819,927,986 |
Investments Purchased with Cash Collateral from Securities Lending - 0.0% |
Investment Companies - 0.0% | |
| | Janus Henderson Cash Collateral Fund LLC, 4.8170%ºº | | 22,240,695 | | 372,259,519 | | (391,313,534) | | 3,186,680 |
| | |
See Notes to Schedule of Investments and Other Information and Notes to Financial Statements. |
| |
Janus Investment Fund | 9 |
Janus Henderson Enterprise Fund
Schedule of Investments (unaudited)
March 31, 2023
| | | | | | | |
Schedule of Forward Foreign Currency Exchange Contracts | | | | | | |
| | | | | | | | | |
Counterparty/ Foreign Currency | Settlement Date | Foreign Currency Amount (Sold)/ Purchased | | USD Currency Amount (Sold)/ Purchased | | Market Value and Unrealized Appreciation/ (Depreciation) | |
Barclays Capital, Inc.: | | | | | | | | |
Canadian Dollar | 4/18/23 | (153,640,000) | $ | 111,632,638 | $ | (2,092,469) | | |
Euro | 4/18/23 | (44,365,000) | | 47,044,872 | | (1,104,422) | | |
| | | | | | | | | |
| | | | | | | (3,196,891) | | |
Citibank, National Association: | | | | | | | | |
Canadian Dollar | 4/18/23 | 16,665,000 | | (12,192,668) | | 142,849 | | |
Canadian Dollar | 4/18/23 | (72,911,000) | | 52,921,140 | | (1,047,952) | | |
Euro | 4/18/23 | (76,579,000) | | 81,188,298 | | (1,922,821) | | |
| | | | | | | | | |
| | | | | | | (2,827,924) | | |
Goldman Sachs & Co. LLC: | | | | | | | | |
Canadian Dollar | 4/18/23 | (8,409,000) | | 6,102,991 | | (121,393) | | |
Euro | 4/18/23 | 2,098,000 | | (2,223,347) | | 53,610 | | |
Euro | 4/18/23 | (3,500,000) | | 3,821,972 | | 23,425 | | |
| | | | | | | | | |
| | | | | | | (44,358) | | |
HSBC Securities (USA), Inc.: | | | | | | | | |
Canadian Dollar | 4/18/23 | (121,445,000) | | 88,173,565 | | (1,720,641) | | |
Euro | 4/18/23 | 5,300,000 | | (5,703,506) | | 48,578 | | |
Euro | 4/18/23 | (48,960,000) | | 51,933,331 | | (1,202,911) | | |
| | | | | | | | | |
| | | | | | | (2,874,974) | | |
JPMorgan Chase Bank, National Association: | | | | | | | | |
Canadian Dollar | 4/18/23 | 21,000,000 | | (15,265,448) | | 278,859 | | |
Canadian Dollar | 4/18/23 | (171,643,000) | | 124,481,468 | | (2,569,550) | | |
Euro | 4/18/23 | (47,011,000) | | 49,853,614 | | (1,167,381) | | |
| | | | | | | | | |
| | | | | | | (3,458,072) | | |
State Street Bank and Trust Company: | | | | | | | | |
Canadian Dollar | 4/18/23 | (133,240,000) | | 96,681,116 | | (1,943,808) | | |
Euro | 4/18/23 | 1,200,000 | | (1,307,284) | | (4,925) | | |
Euro | 4/18/23 | (116,364,000) | | 123,353,636 | | (2,936,106) | | |
| | | | | | | | | |
| | | | | | | (4,884,839) | | |
Total | | | | | $ | (17,287,058) | | |
| | |
See Notes to Schedule of Investments and Other Information and Notes to Financial Statements. |
| |
10 | MARCH 31, 2023 |
Janus Henderson Enterprise Fund
Schedule of Investments (unaudited)
March 31, 2023
The following table, grouped by derivative type, provides information about the fair value and location of derivatives within the Statement of Assets and Liabilities as of March 31, 2023.
| | | | | | |
Fair Value of Derivative Instruments (not accounted for as hedging instruments) as of March 31, 2023 |
| | | | | |
| | | | | Currency
Contracts |
Asset Derivatives: | | | |
Forward foreign currency exchange contracts | | | $ 547,321 |
| | | | |
Liability Derivatives: | | | |
Forward foreign currency exchange contracts | | | $17,834,379 |
| | | | |
The following tables provide information about the effect of derivatives and hedging activities on the Fund’s Statement of Operations for the period ended March 31, 2023.
| | | | | |
The effect of Derivative Instruments (not accounted for as hedging instruments) on the Statement of Operations for the period ended March 31, 2023 |
| | | | |
Amount of Realized Gain/(Loss) Recognized on Derivatives |
Derivative | | Currency
Contracts |
Forward foreign currency exchange contracts | | $ 14,070,006 |
| | | | | |
| | | | | |
| | | | | |
Amount of Change in Unrealized Appreciation/Depreciation Recognized on Derivatives |
Derivative | | Currency
Contracts |
Forward foreign currency exchange contracts | | $(45,100,955) |
| | | | | |
Please see the "Net Realized Gain/(Loss) on Investments" and "Change in Unrealized Net Appreciation/Depreciation" sections of the Fund’s Statement of Operations.
| | |
Average Ending Monthly Value of Derivative Instruments During the Period Ended March 31, 2023 |
| |
| |
Forward foreign currency exchange contracts: | |
Average amounts purchased - in USD | $80,749,611 |
Average amounts sold - in USD | 819,520,276 |
| | |
| |
| |
| |
| | |
See Notes to Schedule of Investments and Other Information and Notes to Financial Statements. |
| |
Janus Investment Fund | 11 |
Janus Henderson Enterprise Fund
Schedule of Investments (unaudited)
March 31, 2023
| | | | | | | | | | |
Offsetting of Financial Assets and Derivative Assets |
| |
| | | Gross Amounts | | | | | | |
| | | of Recognized | | Offsetting Asset | | Collateral | | |
Counterparty | | Assets | | or Liability(a) | | Pledged(b) | | Net Amount |
| | | | | | | | | |
Citibank, National Association | $ | 142,849 | $ | (142,849) | $ | — | $ | — |
Goldman Sachs & Co. LLC | | 77,035 | | (77,035) | | — | | — |
HSBC Securities (USA), Inc. | | 48,578 | | (48,578) | | — | | — |
JPMorgan Chase Bank, National Association | | 4,392,791 | | (278,859) | | (4,113,932) | | — |
| | | | | | | | | |
Total | $ | 4,661,253 | $ | (547,321) | $ | (4,113,932) | $ | — |
Offsetting of Financial Liabilities and Derivative Liabilities |
| |
| | | Gross Amounts | | | | | | |
| | | of Recognized | | Offsetting Asset | | Collateral | | |
Counterparty | | Liabilities | | or Liability(a) | | Pledged(b) | | Net Amount |
| | | | | | | | | |
Barclays Capital, Inc. | $ | 3,196,891 | $ | — | $ | — | $ | 3,196,891 |
Citibank, National Association | | 2,970,773 | | (142,849) | | — | | 2,827,924 |
Goldman Sachs & Co. LLC | | 121,393 | | (77,035) | | — | | 44,358 |
HSBC Securities (USA), Inc. | | 2,923,552 | | (48,578) | | — | | 2,874,974 |
JPMorgan Chase Bank, National Association | | 3,736,931 | | (278,859) | | — | | 3,458,072 |
State Street Bank and Trust Company | | 4,884,839 | | — | | — | | 4,884,839 |
| | | | | | | | | |
Total | $ | 17,834,379 | $ | (547,321) | $ | — | $ | 17,287,058 |
(a) | Represents the amount of assets or liabilities that could be offset with the same counterparty under master netting or similar agreements that management elects not to offset on the Statement of Assets and Liabilities. |
(b) | Collateral pledged is limited to the net outstanding amount due to/from an individual counterparty. The actual collateral amounts pledged may exceed these amounts and may fluctuate in value. |
| | |
See Notes to Schedule of Investments and Other Information and Notes to Financial Statements. |
| |
12 | MARCH 31, 2023 |
Janus Henderson Enterprise Fund
Notes to Schedule of Investments and Other Information (unaudited)
| | |
Russell Midcap® Growth Index | Russell Midcap® Growth Index reflects the performance of U.S. mid-cap equities with higher price-to-book ratios and higher forecasted growth values. |
| | |
ADR | American Depositary Receipt |
LLC | Limited Liability Company |
LP | Limited Partnership |
PLC | Public Limited Company |
| | |
* | Non-income producing security. |
| | |
ºº | Rate shown is the 7-day yield as of March 31, 2023. |
| | |
# | Loaned security; a portion of the security is on loan at March 31, 2023. |
| | |
£ | The Fund may invest in certain securities that are considered affiliated companies. As defined by the Investment Company Act of 1940, as amended, an affiliated company is one in which the Fund owns 5% or more of the outstanding voting securities, or a company which is under common ownership or control. |
| | |
∆ | Net of income paid to the securities lending agent and rebates paid to the borrowing counterparties. |
| | | | | | | | | | | | | | |
The following is a summary of the inputs that were used to value the Fund’s investments in securities and other financial instruments as of March 31, 2023. See Notes to Financial Statements for more information. |
| |
Valuation Inputs Summary |
| | | | | | | |
| | | | | Level 2 - | | Level 3 - |
| | | Level 1 - | | Other Significant | | Significant |
| | | Quoted Prices | | Observable Inputs | | Unobservable Inputs |
| | | | | | | |
Assets | | | | | | |
Investments In Securities: | | | | | | |
Common Stocks | | | | | | |
Commercial Services & Supplies | $ | 540,562,617 | $ | 32,399,822 | $ | - |
Hotels, Restaurants & Leisure | | 243,594,334 | | 175,940,662 | | - |
All Other | | 16,318,073,917 | | - | | - |
Investment Companies | | - | | 819,927,986 | | - |
Investments Purchased with Cash Collateral from Securities Lending | | - | | 3,983,350 | | - |
Total Investments in Securities | $ | 17,102,230,868 | $ | 1,032,251,820 | $ | - |
Other Financial Instruments(a): | | | | | | |
Forward Foreign Currency Exchange Contracts | | - | | 547,321 | | - |
Total Assets | $ | 17,102,230,868 | $ | 1,032,799,141 | $ | - |
Liabilities | | | | | | |
Other Financial Instruments(a): | | | | | | |
Forward Foreign Currency Exchange Contracts | $ | - | $ | 17,834,379 | $ | - |
| | | | | | | |
(a) | Other financial instruments may include forward foreign currency exchange contracts, futures, written options, written swaptions, and swap contracts. Forward foreign currency exchange contracts, futures contracts, and swap contracts are reported at their unrealized appreciation/(depreciation) at measurement date, which represents the change in the contract's value from trade date. Written options and written swaptions are reported at their market value at measurement date. |
Janus Henderson Enterprise Fund
Statement of Assets and Liabilities (unaudited)
March 31, 2023
| |
See footnotes at the end of the Statement. |
| | | | | | | |
| | | | | | |
Assets: | | | | |
| Unaffiliated investments, at value (cost $10,451,528,201)(1) | | $ | 16,582,131,215 | |
| Affiliated investments, at value (cost $1,480,905,401) | | | 1,552,351,473 | |
| Cash | | | 37 | |
| Forward foreign currency exchange contracts | | | 547,321 | |
| Trustees' deferred compensation | | | 447,878 | |
| Receivables: | | | | |
| | Fund shares sold | | | 23,054,985 | |
| | Dividends | | | 10,362,768 | |
| | Dividends from affiliates | | | 3,370,849 | |
| Other assets | | | 239,582 | |
Total Assets | | | 18,172,506,108 | |
Liabilities: | | | | |
| Collateral for securities loaned (Note 3) | | | 3,983,350 | |
| Forward foreign currency exchange contracts | | | 17,834,379 | |
| Payables: | | | — | |
| | Fund shares repurchased | | | 30,757,047 | |
| | Advisory fees | | | 10,200,112 | |
| | Investments purchased | | | 10,166,628 | |
| | Transfer agent fees and expenses | | | 1,940,432 | |
| | Trustees' deferred compensation fees | | | 447,878 | |
| | 12b-1 Distribution and shareholder servicing fees | | | 286,110 | |
| | Trustees' fees and expenses | | | 114,597 | |
| | Professional fees | | | 51,418 | |
| | Affiliated fund administration fees payable | | | 39,844 | |
| | Custodian fees | | | 17,210 | |
| | Accrued expenses and other payables | | | 838,315 | |
Total Liabilities | | | 76,677,320 | |
Net Assets | | $ | 18,095,828,788 | |
| | |
See Notes to Financial Statements. |
| |
14 | MARCH 31, 2023 |
Janus Henderson Enterprise Fund
Statement of Assets and Liabilities (unaudited)
March 31, 2023
| | | | | | | |
| | | | | | |
| | | | | | | |
Net Assets Consist of: | | | | |
| Capital (par value and paid-in surplus) | | $ | 11,187,534,394 | |
| Total distributable earnings (loss) | | | 6,908,294,394 | |
Total Net Assets | | $ | 18,095,828,788 | |
Net Assets - Class A Shares | | $ | 384,065,908 | |
| Shares Outstanding, $0.01 Par Value (unlimited shares authorized) | | | 3,095,625 | |
Net Asset Value Per Share(2) | | $ | 124.07 | |
Maximum Offering Price Per Share(3) | | $ | 131.64 | |
Net Assets - Class C Shares | | $ | 112,307,940 | |
| Shares Outstanding, $0.01 Par Value (unlimited shares authorized) | | | 1,049,252 | |
Net Asset Value Per Share(2) | | $ | 107.04 | |
Net Assets - Class D Shares | | $ | 2,252,076,614 | |
| Shares Outstanding, $0.01 Par Value (unlimited shares authorized) | | | 17,347,034 | |
Net Asset Value Per Share | | $ | 129.82 | |
Net Assets - Class I Shares | | $ | 6,315,290,215 | |
| Shares Outstanding, $0.01 Par Value (unlimited shares authorized) | | | 48,254,483 | |
Net Asset Value Per Share | | $ | 130.87 | |
Net Assets - Class N Shares | | $ | 5,237,533,160 | |
| Shares Outstanding, $0.01 Par Value (unlimited shares authorized) | | | 39,750,570 | |
Net Asset Value Per Share | | $ | 131.76 | |
Net Assets - Class R Shares | | $ | 78,367,209 | |
| Shares Outstanding, $0.01 Par Value (unlimited shares authorized) | | | 674,495 | |
Net Asset Value Per Share | | $ | 116.19 | |
Net Assets - Class S Shares | | $ | 304,041,619 | |
| Shares Outstanding, $0.01 Par Value (unlimited shares authorized) | | | 2,474,730 | |
Net Asset Value Per Share | | $ | 122.86 | |
Net Assets - Class T Shares | | $ | 3,412,146,123 | |
| Shares Outstanding, $0.01 Par Value (unlimited shares authorized) | | | 26,566,991 | |
Net Asset Value Per Share | | $ | 128.44 | |
| |
(1) Includes $4,113,932 of securities on loan. See Note 3 in Notes to Financial Statements. (2) Redemption price per share may be reduced for any applicable contingent deferred sales charge. (3) Maximum offering price is computed at 100/94.25 of net asset value. |
| | |
See Notes to Financial Statements. |
| |
Janus Investment Fund | 15 |
Janus Henderson Enterprise Fund
Statement of Operations (unaudited)
For the period ended March 31, 2023
| | | | | | |
| | | | | |
Investment Income: | | | |
| Dividends | $ | 96,940,803 | |
| Dividends from affiliates | | 11,380,758 | |
| Non-cash dividends | | 10,092,913 | |
| Affiliated securities lending income, net | | 92,017 | |
| Unaffiliated securities lending income, net | | 25,404 | |
| Other income | | 632 | |
| Foreign tax withheld | | (2,087,315) | |
Total Investment Income | | 116,445,212 | |
Expenses: | | | |
| Advisory fees | | 55,227,379 | |
| 12b-1 Distribution and shareholder servicing fees: | | | |
| | Class A Shares | | 457,510 | |
| | Class C Shares | | 504,481 | |
| | Class R Shares | | 185,549 | |
| | Class S Shares | | 377,238 | |
| Transfer agent administrative fees and expenses: | | | |
| | Class D Shares | | 1,268,792 | |
| | Class R Shares | | 94,593 | |
| | Class S Shares | | 377,919 | |
| | Class T Shares | | 4,181,157 | |
| Transfer agent networking and omnibus fees: | | | |
| | Class A Shares | | 437,083 | |
| | Class C Shares | | 39,417 | |
| | Class I Shares | | 2,932,729 | |
| Other transfer agent fees and expenses: | | | |
| | Class A Shares | | 13,287 | |
| | Class C Shares | | 2,640 | |
| | Class D Shares | | 130,483 | |
| | Class I Shares | | 172,198 | |
| | Class N Shares | | 116,080 | |
| | Class R Shares | | 674 | |
| | Class S Shares | | 2,822 | |
| | Class T Shares | | 18,475 | |
| Shareholder reports expense | | 408,021 | |
| Trustees’ fees and expenses | | 257,775 | |
| Affiliated fund administration fees | | 215,732 | |
| Registration fees | | 199,774 | |
| Custodian fees | | 156,755 | |
| Professional fees | | 110,610 | |
| Other expenses | | 503,182 | |
Total Expenses | | 68,392,355 | |
Less: Excess Expense Reimbursement and Waivers | | (206,213) | |
Net Expenses | | 68,186,142 | |
Net Investment Income/(Loss) | | 48,259,070 | |
| | | | | |
| | |
See Notes to Financial Statements. |
| |
16 | MARCH 31, 2023 |
Janus Henderson Enterprise Fund
Statement of Operations (unaudited)
For the period ended March 31, 2023
| | | | | | |
| | | | | |
Net Realized Gain/(Loss) on Investments: | | | |
| Investments and foreign currency transactions(1) | $ | 753,994,810 | |
| Investments in affiliates | | 319,572 | |
| Forward foreign currency exchange contracts | | 14,070,006 | |
Total Net Realized Gain/(Loss) on Investments | | 768,384,388 | |
Change in Unrealized Net Appreciation/Depreciation: | | | |
| Investments, foreign currency translations and Trustees’ deferred compensation | | 1,932,245,641 | |
| Investments in affiliates | | 192,566,918 | |
| Forward foreign currency exchange contracts | | (45,100,955) | |
Total Change in Unrealized Net Appreciation/Depreciation | | 2,079,711,604 | |
Net Increase/(Decrease) in Net Assets Resulting from Operations | $ | 2,896,355,062 | |
| | | | | |
| |
(1) Includes $7,970,517 of realized gains and losses resulting from a redemption-in-kind during the period ended March 31, 2023. |
| | |
See Notes to Financial Statements. |
| |
Janus Investment Fund | 17 |
Janus Henderson Enterprise Fund
Statements of Changes in Net Assets
| | | | | | | | | |
| | | | | | | | |
| | | Period ended
March 31, 2023 (unaudited) | | Year ended
September 30, 2022 | |
| | | | | | | | | |
Operations: | | | | | | |
| Net investment income/(loss) | $ | 48,259,070 | | $ | 24,738,619 | |
| Net realized gain/(loss) on investments | | 768,384,388 | | | 1,755,146,247 | |
| Change in unrealized net appreciation/depreciation | | 2,079,711,604 | | | (5,523,461,636) | |
Net Increase/(Decrease) in Net Assets Resulting from Operations | | 2,896,355,062 | | | (3,743,576,770) | |
Dividends and Distributions to Shareholders: | | | | | | |
| | Class A Shares | | (35,587,793) | | | (65,714,839) | |
| | Class C Shares | | (12,338,200) | | | (28,152,759) | |
| | Class D Shares | | (199,834,888) | | | (359,561,565) | |
| | Class I Shares | | (525,051,789) | | | (1,130,089,504) | |
| | Class N Shares | | (463,732,368) | | | (789,979,114) | |
| | Class R Shares | | (7,786,807) | | | (16,455,015) | |
| | Class S Shares | | (29,914,481) | | | (62,009,288) | |
| | Class T Shares | | (316,117,237) | | | (699,266,902) | |
Net Decrease from Dividends and Distributions to Shareholders | | (1,590,363,563) | | | (3,151,228,986) | |
Capital Share Transactions: | | | | | | |
| | Class A Shares | | 31,633,192 | | | (3,987,499) | |
| | Class C Shares | | (5,091,968) | | | (11,161,089) | |
| | Class D Shares | | 153,198,193 | | | 244,637,951 | |
| | Class I Shares | | 467,019,727 | | | (137,205,137) | |
| | Class N Shares | | 167,684,344 | | | 850,530,593 | |
| | Class R Shares | | 3,889,478 | | | (5,979,734) | |
| | Class S Shares | | 80,131 | | | (26,518,543) | |
| | Class T Shares | | (37,366,278) | | | (577,826,097) | |
Net Increase/(Decrease) from Capital Share Transactions | | 781,046,819 | | | 332,490,445 | |
Net Increase/(Decrease) in Net Assets | | 2,087,038,318 | | | (6,562,315,311) | |
Net Assets: | | | | | | |
| Beginning of period | | 16,008,790,470 | | | 22,571,105,781 | |
| End of period | $ | 18,095,828,788 | | $ | 16,008,790,470 | |
| | | | | | | | |
| | |
See Notes to Financial Statements. |
| |
18 | MARCH 31, 2023 |
Janus Henderson Enterprise Fund
Financial Highlights
| | | | | | | | | | | | | | | | | | | | | | |
Class A Shares | | | | | | | | | | | | | | | | | | |
For a share outstanding during the period ended March 31, 2023 (unaudited) and the year ended September 30 | 2023 | | | 2022 | | | 2021 | | | 2020 | | | 2019 | | | 2018 | |
| Net Asset Value, Beginning of Period | | $116.22 | | | $168.35 | | | $137.77 | | | $136.07 | | | $131.70 | | | $111.15 | |
| Income/(Loss) from Investment Operations: | | | | | | | | | | | | | | | | | | |
| | Net investment income/(loss)(1) | | 0.14 | | | (0.30) | | | (0.27) | | | (0.09) | | | (0.02) | | | (0.15) | |
| | Net realized and unrealized gain/(loss) | | 20.28 | | | (27.16) | | | 43.67 | | | 7.94 | | | 11.19 | | | 22.79 | |
| Total from Investment Operations | | 20.42 | | | (27.46) | | | 43.40 | | | 7.85 | | | 11.17 | | | 22.64 | |
| Less Dividends and Distributions: | | | | | | | | | | | | | | | | | | |
| | Dividends (from net investment income) | | — | | | — | | | — | | | — | | | — | | | — | |
| | Distributions (from capital gains) | | (12.57) | | | (24.67) | | | (12.82) | | | (6.15) | | | (6.80) | | | (2.09) | |
| Total Dividends and Distributions | | (12.57) | | | (24.67) | | | (12.82) | | | (6.15) | | | (6.80) | | | (2.09) | |
| Net Asset Value, End of Period | | $124.07 | | | $116.22 | | | $168.35 | | | $137.77 | | | $136.07 | | | $131.70 | |
| Total Return* | | 18.60% | | | (19.08)% | | | 32.57% | | | 5.81% | | | 9.88% | | | 20.63% | |
| Net Assets, End of Period (in thousands) | | $384,066 | | | $327,176 | | | $472,904 | | | $456,433 | | | $547,328 | | | $666,848 | |
| Average Net Assets for the Period (in thousands) | | $366,512 | | | $399,310 | | | $493,097 | | | $493,576 | | | $611,182 | | | $647,856 | |
| Ratios to Average Net Assets**: | | | | | | | | | | | | | | | | | | |
| | Ratio of Gross Expenses | | 1.16% | | | 1.14% | | | 1.13% | | | 1.17% | | | 1.15% | | | 1.16% | |
| | Ratio of Net Expenses (After Waivers and Expense Offsets) | | 1.12% | | | 1.12% | | | 1.11% | | | 1.12% | | | 1.11% | | | 1.12% | |
| | Ratio of Net Investment Income/(Loss) | | 0.23% | | | (0.21)% | | | (0.17)% | | | (0.07)% | | | (0.02)% | | | (0.13)% | |
| Portfolio Turnover Rate | | 6% | | | 9% | | | 12% | | | 14% | | | 13% | | | 13% | |
| | | | | | | | | | | | | | | | | | | | | | |
| |
* Total return includes adjustments in accordance with generally accepted accounting principles required at the year or period end and are not annualized for periods of less than one full year. ** Annualized for periods of less than one full year. (1) Per share amounts are calculated based on average shares outstanding during the year or period. |
| | |
See Notes to Financial Statements. |
| |
Janus Investment Fund | 19 |
Janus Henderson Enterprise Fund
Financial Highlights
| | | | | | | | | | | | | | | | | | | | | | |
Class C Shares | | | | | | | | | | | | | | | | | | |
For a share outstanding during the period ended March 31, 2023 (unaudited) and the year ended September 30 | 2023 | | | 2022 | | | 2021 | | | 2020 | | | 2019 | | | 2018 | |
| Net Asset Value, Beginning of Period | | $102.11 | | | $151.54 | | | $125.75 | | | $125.40 | | | $122.67 | | | $104.26 | |
| Income/(Loss) from Investment Operations: | | | | | | | | | | | | | | | | | | |
| | Net investment income/(loss)(1) | | (0.16) | | | (0.87) | | | (1.06) | | | (0.77) | | | (0.71) | | | (0.81) | |
| | Net realized and unrealized gain/(loss) | | 17.66 | | | (23.89) | | | 39.67 | | | 7.27 | | | 10.24 | | | 21.31 | |
| Total from Investment Operations | | 17.50 | | | (24.76) | | | 38.61 | | | 6.50 | | | 9.53 | | | 20.50 | |
| Less Dividends and Distributions: | | | | | | | | | | | | | | | | | | |
| | Dividends (from net investment income) | | — | | | — | | | — | | | — | | | — | | | — | |
| | Distributions (from capital gains) | | (12.57) | | | (24.67) | | | (12.82) | | | (6.15) | | | (6.80) | | | (2.09) | |
| Total Dividends and Distributions | | (12.57) | | | (24.67) | | | (12.82) | | | (6.15) | | | (6.80) | | | (2.09) | |
| Net Asset Value, End of Period | | $107.04 | | | $102.11 | | | $151.54 | | | $125.75 | | | $125.40 | | | $122.67 | |
| Total Return* | | 18.30% | | | (19.47)% | | | 31.83% | | | 5.21% | | | 9.25% | | | 19.93% | |
| Net Assets, End of Period (in thousands) | | $112,308 | | | $110,936 | | | $179,240 | | | $173,129 | | | $212,985 | | | $254,496 | |
| Average Net Assets for the Period (in thousands) | | $112,681 | | | $153,213 | | | $187,356 | | | $188,953 | | | $219,505 | | | $255,949 | |
| Ratios to Average Net Assets**: | | | | | | | | | | | | | | | | | | |
| | Ratio of Gross Expenses | | 1.64% | | | 1.60% | | | 1.67% | | | 1.69% | | | 1.70% | | | 1.70% | |
| | Ratio of Net Expenses (After Waivers and Expense Offsets) | | 1.64% | | | 1.60% | | | 1.67% | | | 1.69% | | | 1.70% | | | 1.70% | |
| | Ratio of Net Investment Income/(Loss) | | (0.30)% | | | (0.69)% | | | (0.73)% | | | (0.64)% | | | (0.61)% | | | (0.71)% | |
| Portfolio Turnover Rate | | 6% | | | 9% | | | 12% | | | 14% | | | 13% | | | 13% | |
| | | | | | | | | | | | | | | | | | | | | | |
| |
* Total return includes adjustments in accordance with generally accepted accounting principles required at the year or period end and are not annualized for periods of less than one full year. ** Annualized for periods of less than one full year. (1) Per share amounts are calculated based on average shares outstanding during the year or period. |
| | |
See Notes to Financial Statements. |
| |
20 | MARCH 31, 2023 |
Janus Henderson Enterprise Fund
Financial Highlights
| | | | | | | | | | | | | | | | | | | | | | |
Class D Shares | | | | | | | | | | | | | | | | | | |
For a share outstanding during the period ended March 31, 2023 (unaudited) and the year ended September 30 | 2023 | | | 2022 | | | 2021 | | | 2020 | | | 2019 | | | 2018 | |
| Net Asset Value, Beginning of Period | | $120.89 | | | $174.13 | | | $142.10 | | | $139.87 | | | $134.99 | | | $113.64 | |
| Income/(Loss) from Investment Operations: | | | | | | | | | | | | | | | | | | |
| | Net investment income/(loss)(1) | | 0.35 | | | 0.18 | | | 0.25 | | | 0.33 | | | 0.37 | | | 0.23 | |
| | Net realized and unrealized gain/(loss) | | 21.15 | | | (28.23) | | | 45.06 | | | 8.20 | | | 11.50 | | | 23.31 | |
| Total from Investment Operations | | 21.50 | | | (28.05) | | | 45.31 | | | 8.53 | | | 11.87 | | | 23.54 | |
| Less Dividends and Distributions: | | | | | | | | | | | | | | | | | | |
| | Dividends (from net investment income) | | — | | | (0.52) | | | (0.46) | | | (0.15) | | | (0.19) | | | (0.10) | |
| | Distributions (from capital gains) | | (12.57) | | | (24.67) | | | (12.82) | | | (6.15) | | | (6.80) | | | (2.09) | |
| Total Dividends and Distributions | | (12.57) | | | (25.19) | | | (13.28) | | | (6.30) | | | (6.99) | | | (2.19) | |
| Net Asset Value, End of Period | | $129.82 | | | $120.89 | | | $174.13 | | | $142.10 | | | $139.87 | | | $134.99 | |
| Total Return* | | 18.79% | | | (18.82)% | | | 32.99% | | | 6.15% | | | 10.22% | | | 20.99% | |
| Net Assets, End of Period (in thousands) | | $2,252,077 | | | $1,937,787 | | | $2,507,220 | | | $1,983,824 | | | $2,061,471 | | | $1,973,861 | |
| Average Net Assets for the Period (in thousands) | | $2,153,775 | | | $2,337,701 | | | $2,394,871 | | | $1,974,784 | | | $1,930,540 | | | $1,853,456 | |
| Ratios to Average Net Assets**: | | | | | | | | | | | | | | | | | | |
| | Ratio of Gross Expenses | | 0.80% | | | 0.79% | | | 0.79% | | | 0.80% | | | 0.81% | | | 0.81% | |
| | Ratio of Net Expenses (After Waivers and Expense Offsets) | | 0.80% | | | 0.79% | | | 0.79% | | | 0.80% | | | 0.81% | | | 0.81% | |
| | Ratio of Net Investment Income/(Loss) | | 0.55% | | | 0.12% | | | 0.15% | | | 0.25% | | | 0.28% | | | 0.18% | |
| Portfolio Turnover Rate | | 6% | | | 9% | | | 12% | | | 14% | | | 13% | | | 13% | |
| | | | | | | | | | | | | | | | | | | | | | |
| |
* Total return includes adjustments in accordance with generally accepted accounting principles required at the year or period end and are not annualized for periods of less than one full year. ** Annualized for periods of less than one full year. (1) Per share amounts are calculated based on average shares outstanding during the year or period. |
| | |
See Notes to Financial Statements. |
| |
Janus Investment Fund | 21 |
Janus Henderson Enterprise Fund
Financial Highlights
| | | | | | | | | | | | | | | | | | | | | | |
Class I Shares | | | | | | | | | | | | | | | | | | |
For a share outstanding during the period ended March 31, 2023 (unaudited) and the year ended September 30 | 2023 | | | 2022 | | | 2021 | | | 2020 | | | 2019 | | | 2018 | |
| Net Asset Value, Beginning of Period | | $121.76 | | | $175.21 | | | $142.89 | | | $140.62 | | | $135.69 | | | $114.20 | |
| Income/(Loss) from Investment Operations: | | | | | | | | | | | | | | | | | | |
| | Net investment income/(loss)(1) | | 0.38 | | | 0.23 | | | 0.32 | | | 0.40 | | | 0.45 | | | 0.32 | |
| | Net realized and unrealized gain/(loss) | | 21.30 | | | (28.42) | | | 45.33 | | | 8.24 | | | 11.55 | | | 23.42 | |
| Total from Investment Operations | | 21.68 | | | (28.19) | | | 45.65 | | | 8.64 | | | 12.00 | | | 23.74 | |
| Less Dividends and Distributions: | | | | | | | | | | | | | | | | | | |
| | Dividends (from net investment income) | | — | | | (0.59) | | | (0.51) | | | (0.22) | | | (0.27) | | | (0.16) | |
| | Distributions (from capital gains) | | (12.57) | | | (24.67) | | | (12.82) | | | (6.15) | | | (6.80) | | | (2.09) | |
| Total Dividends and Distributions | | (12.57) | | | (25.26) | | | (13.33) | | | (6.37) | | | (7.07) | | | (2.25) | |
| Net Asset Value, End of Period | | $130.87 | | | $121.76 | | | $175.21 | | | $142.89 | | | $140.62 | | | $135.69 | |
| Total Return* | | 18.80% | | | (18.78)% | | | 33.06% | | | 6.20% | | | 10.28% | | | 21.07% | |
| Net Assets, End of Period (in thousands) | | $6,315,290 | | | $5,404,045 | | | $8,014,607 | | | $6,919,545 | | | $7,666,702 | | | $6,443,068 | |
| Average Net Assets for the Period (in thousands) | | $5,857,494 | | | $6,984,545 | | | $7,776,971 | | | $7,335,476 | | | $6,775,060 | | | $5,408,221 | |
| Ratios to Average Net Assets**: | | | | | | | | | | | | | | | | | | |
| | Ratio of Gross Expenses | | 0.77% | | | 0.76% | | | 0.74% | | | 0.75% | | | 0.75% | | | 0.75% | |
| | Ratio of Net Expenses (After Waivers and Expense Offsets) | | 0.77% | | | 0.76% | | | 0.74% | | | 0.75% | | | 0.75% | | | 0.75% | |
| | Ratio of Net Investment Income/(Loss) | | 0.59% | | | 0.16% | | | 0.19% | | | 0.30% | | | 0.34% | | | 0.25% | |
| Portfolio Turnover Rate | | 6% | | | 9% | | | 12% | | | 14% | | | 13% | | | 13% | |
| | | | | | | | | | | | | | | | | | | | | | |
| |
* Total return includes adjustments in accordance with generally accepted accounting principles required at the year or period end and are not annualized for periods of less than one full year. ** Annualized for periods of less than one full year. (1) Per share amounts are calculated based on average shares outstanding during the year or period. |
| | |
See Notes to Financial Statements. |
| |
22 | MARCH 31, 2023 |
Janus Henderson Enterprise Fund
Financial Highlights
| | | | | | | | | | | | | | | | | | | | | | |
Class N Shares | | | | | | | | | | | | | | | | | | |
For a share outstanding during the period ended March 31, 2023 (unaudited) and the year ended September 30 | 2023 | | | 2022 | | | 2021 | | | 2020 | | | 2019 | | | 2018 | |
| Net Asset Value, Beginning of Period | | $122.44 | | | $176.05 | | | $143.53 | | | $141.19 | | | $136.18 | | | $114.57 | |
| Income/(Loss) from Investment Operations: | | | | | | | | | | | | | | | | | | |
| | Net investment income/(loss)(1) | | 0.44 | | | 0.38 | | | 0.47 | | | 0.53 | | | 0.56 | | | 0.42 | |
| | Net realized and unrealized gain/(loss) | | 21.45 | | | (28.59) | | | 45.53 | | | 8.28 | | | 11.60 | | | 23.51 | |
| Total from Investment Operations | | 21.89 | | | (28.21) | | | 46.00 | | | 8.81 | | | 12.16 | | | 23.93 | |
| Less Dividends and Distributions: | | | | | | | | | | | | | | | | | | |
| | Dividends (from net investment income) | | — | | | (0.73) | | | (0.66) | | | (0.32) | | | (0.35) | | | (0.23) | |
| | Distributions (from capital gains) | | (12.57) | | | (24.67) | | | (12.82) | | | (6.15) | | | (6.80) | | | (2.09) | |
| Total Dividends and Distributions | | (12.57) | | | (25.40) | | | (13.48) | | | (6.47) | | | (7.15) | | | (2.32) | |
| Net Asset Value, End of Period | | $131.76 | | | $122.44 | | | $176.05 | | | $143.53 | | | $141.19 | | | $136.18 | |
| Total Return* | | 18.88% | | | (18.71)% | | | 33.17% | | | 6.30% | | | 10.38% | | | 21.18% | |
| Net Assets, End of Period (in thousands) | | $5,237,533 | | | $4,678,462 | | | $5,636,167 | | | $4,867,667 | | | $4,860,043 | | | $3,947,225 | |
| Average Net Assets for the Period (in thousands) | | $5,065,943 | | | $5,415,323 | | | $5,609,015 | | | $4,941,595 | | | $4,213,287 | | | $3,463,197 | |
| Ratios to Average Net Assets**: | | | | | | | | | | | | | | | | | | |
| | Ratio of Gross Expenses | | 0.67% | | | 0.66% | | | 0.66% | | | 0.66% | | | 0.66% | | | 0.66% | |
| | Ratio of Net Expenses (After Waivers and Expense Offsets) | | 0.67% | | | 0.66% | | | 0.66% | | | 0.66% | | | 0.66% | | | 0.66% | |
| | Ratio of Net Investment Income/(Loss) | | 0.68% | | | 0.26% | | | 0.28% | | | 0.39% | | | 0.43% | | | 0.34% | |
| Portfolio Turnover Rate | | 6% | | | 9% | | | 12% | | | 14% | | | 13% | | | 13% | |
| | | | | | | | | | | | | | | | | | | | | | |
| |
* Total return includes adjustments in accordance with generally accepted accounting principles required at the year or period end and are not annualized for periods of less than one full year. ** Annualized for periods of less than one full year. (1) Per share amounts are calculated based on average shares outstanding during the year or period. |
| | |
See Notes to Financial Statements. |
| |
Janus Investment Fund | 23 |
Janus Henderson Enterprise Fund
Financial Highlights
| | | | | | | | | | | | | | | | | | | | | | |
Class R Shares | | | | | | | | | | | | | | | | | | |
For a share outstanding during the period ended March 31, 2023 (unaudited) and the year ended September 30 | 2023 | | | 2022 | | | 2021 | | | 2020 | | | 2019 | | | 2018 | |
| Net Asset Value, Beginning of Period | | $109.72 | | | $160.72 | | | $132.38 | | | $131.34 | | | $127.76 | | | $108.20 | |
| Income/(Loss) from Investment Operations: | | | | | | | | | | | | | | | | | | |
| | Net investment income/(loss)(1) | | (0.03) | | | (0.67) | | | (0.69) | | | (0.46) | | | (0.39) | | | (0.50) | |
| | Net realized and unrealized gain/(loss) | | 19.07 | | | (25.66) | | | 41.85 | | | 7.65 | | | 10.77 | | | 22.15 | |
| Total from Investment Operations | | 19.04 | | | (26.33) | | | 41.16 | | | 7.19 | | | 10.38 | | | 21.65 | |
| Less Dividends and Distributions: | | | | | | | | | | | | | | | | | | |
| | Dividends (from net investment income) | | — | | | — | | | — | | | — | | | — | | | — | |
| | Distributions (from capital gains) | | (12.57) | | | (24.67) | | | (12.82) | | | (6.15) | | | (6.80) | | | (2.09) | |
| Total Dividends and Distributions | | (12.57) | | | (24.67) | | | (12.82) | | | (6.15) | | | (6.80) | | | (2.09) | |
| Net Asset Value, End of Period | | $116.19 | | | $109.72 | | | $160.72 | | | $132.38 | | | $131.34 | | | $127.76 | |
| Total Return* | | 18.44% | | | (19.32)% | | | 32.18% | | | 5.51% | | | 9.56% | | | 20.27% | |
| Net Assets, End of Period (in thousands) | | $78,367 | | | $69,756 | | | $110,802 | | | $119,190 | | | $150,860 | | | $162,271 | |
| Average Net Assets for the Period (in thousands) | | $75,811 | | | $97,291 | | | $124,162 | | | $130,918 | | | $150,191 | | | $167,123 | |
| Ratios to Average Net Assets**: | | | | | | | | | | | | | | | | | | |
| | Ratio of Gross Expenses | | 1.41% | | | 1.41% | | | 1.40% | | | 1.41% | | | 1.41% | | | 1.41% | |
| | Ratio of Net Expenses (After Waivers and Expense Offsets) | | 1.41% | | | 1.41% | | | 1.40% | | | 1.41% | | | 1.41% | | | 1.41% | |
| | Ratio of Net Investment Income/(Loss) | | (0.06)% | | | (0.50)% | | | (0.45)% | | | (0.36)% | | | (0.32)% | | | (0.43)% | |
| Portfolio Turnover Rate | | 6% | | | 9% | | | 12% | | | 14% | | | 13% | | | 13% | |
| | | | | | | | | | | | | | | | | | | | | | |
| |
* Total return includes adjustments in accordance with generally accepted accounting principles required at the year or period end and are not annualized for periods of less than one full year. ** Annualized for periods of less than one full year. (1) Per share amounts are calculated based on average shares outstanding during the year or period. |
| | |
See Notes to Financial Statements. |
| |
24 | MARCH 31, 2023 |
Janus Henderson Enterprise Fund
Financial Highlights
| | | | | | | | | | | | | | | | | | | | | | |
Class S Shares | | | | | | | | | | | | | | | | | | |
For a share outstanding during the period ended March 31, 2023 (unaudited) and the year ended September 30 | 2023 | | | 2022 | | | 2021 | | | 2020 | | | 2019 | | | 2018 | |
| Net Asset Value, Beginning of Period | | $115.22 | | | $167.17 | | | $136.94 | | | $135.34 | | | $131.09 | | | $110.70 | |
| Income/(Loss) from Investment Operations: | | | | | | | | | | | | | | | | | | |
| | Net investment income/(loss)(1) | | 0.11 | | | (0.36) | | | (0.34) | | | (0.14) | | | (0.08) | | | (0.21) | |
| | Net realized and unrealized gain/(loss) | | 20.10 | | | (26.92) | | | 43.39 | | | 7.89 | | | 11.13 | | | 22.69 | |
| Total from Investment Operations | | 20.21 | | | (27.28) | | | 43.05 | | | 7.75 | | | 11.05 | | | 22.48 | |
| Less Dividends and Distributions: | | | | | | | | | | | | | | | | | | |
| | Dividends (from net investment income) | | — | | | — | | | — | | | — | | | — | | | — | |
| | Distributions (from capital gains) | | (12.57) | | | (24.67) | | | (12.82) | | | (6.15) | | | (6.80) | | | (2.09) | |
| Total Dividends and Distributions | | (12.57) | | | (24.67) | | | (12.82) | | | (6.15) | | | (6.80) | | | (2.09) | |
| Net Asset Value, End of Period | | $122.86 | | | $115.22 | | | $167.17 | | | $136.94 | | | $135.34 | | | $131.09 | |
| Total Return* | | 18.58% | | | (19.12)% | | | 32.51% | | | 5.77% | | | 9.84% | | | 20.57% | |
| Net Assets, End of Period (in thousands) | | $304,042 | | | $283,177 | | | $442,011 | | | $465,207 | | | $589,792 | | | $626,458 | |
| Average Net Assets for the Period (in thousands) | | $303,022 | | | $375,663 | | | $480,226 | | | $538,012 | | | $592,420 | | | $593,963 | |
| Ratios to Average Net Assets**: | | | | | | | | | | | | | | | | | | |
| | Ratio of Gross Expenses | | 1.16% | | | 1.16% | | | 1.16% | | | 1.16% | | | 1.16% | | | 1.16% | |
| | Ratio of Net Expenses (After Waivers and Expense Offsets) | | 1.16% | | | 1.16% | | | 1.16% | | | 1.16% | | | 1.16% | | | 1.16% | |
| | Ratio of Net Investment Income/(Loss) | | 0.18% | | | (0.25)% | | | (0.21)% | | | (0.11)% | | | (0.06)% | | | (0.17)% | |
| Portfolio Turnover Rate | | 6% | | | 9% | | | 12% | | | 14% | | | 13% | | | 13% | |
| | | | | | | | | | | | | | | | | | | | | | |
| |
* Total return includes adjustments in accordance with generally accepted accounting principles required at the year or period end and are not annualized for periods of less than one full year. ** Annualized for periods of less than one full year. (1) Per share amounts are calculated based on average shares outstanding during the year or period. |
| | |
See Notes to Financial Statements. |
| |
Janus Investment Fund | 25 |
Janus Henderson Enterprise Fund
Financial Highlights
| | | | | | | | | | | | | | | | | | | | | | |
Class T Shares | | | | | | | | | | | | | | | | | | |
For a share outstanding during the period ended March 31, 2023 (unaudited) and the year ended September 30 | 2023 | | | 2022 | | | 2021 | | | 2020 | | | 2019 | | | 2018 | |
| Net Asset Value, Beginning of Period | | $119.78 | | | $172.66 | | | $141.02 | | | $138.90 | | | $134.10 | | | $112.96 | |
| Income/(Loss) from Investment Operations: | | | | | | | | | | | | | | | | | | |
| | Net investment income/(loss)(1) | | 0.28 | | | 0.01 | | | 0.07 | | | 0.20 | | | 0.24 | | | 0.11 | |
| | Net realized and unrealized gain/(loss) | | 20.95 | | | (27.97) | | | 44.71 | | | 8.13 | | | 11.44 | | | 23.17 | |
| Total from Investment Operations | | 21.23 | | | (27.96) | | | 44.78 | | | 8.33 | | | 11.68 | | | 23.28 | |
| Less Dividends and Distributions: | | | | | | | | | | | | | | | | | | |
| | Dividends (from net investment income) | | — | | | (0.25) | | | (0.32) | | | (0.06) | | | (0.08) | | | (0.05) | |
| | Distributions (from capital gains) | | (12.57) | | | (24.67) | | | (12.82) | | | (6.15) | | | (6.80) | | | (2.09) | |
| Total Dividends and Distributions | | (12.57) | | | (24.92) | | | (13.14) | | | (6.21) | | | (6.88) | | | (2.14) | |
| Net Asset Value, End of Period | | $128.44 | | | $119.78 | | | $172.66 | | | $141.02 | | | $138.90 | | | $134.10 | |
| Total Return* | | 18.74% | | | (18.91)% | | | 32.84% | | | 6.04% | | | 10.12% | | | 20.88% | |
| Net Assets, End of Period (in thousands) | | $3,412,146 | | | $3,197,451 | | | $5,208,155 | | | $5,203,521 | | | $5,461,958 | | | $5,344,306 | |
| Average Net Assets for the Period (in thousands) | | $3,352,736 | | | $4,131,052 | | | $5,723,820 | | | $5,246,105 | | | $5,059,206 | | | $4,920,845 | |
| Ratios to Average Net Assets**: | | | | | | | | | | | | | | | | | | |
| | Ratio of Gross Expenses | | 0.91% | | | 0.91% | | | 0.91% | | | 0.91% | | | 0.91% | | | 0.91% | |
| | Ratio of Net Expenses (After Waivers and Expense Offsets) | | 0.90% | | | 0.90% | | | 0.90% | | | 0.90% | | | 0.91% | | | 0.91% | |
| | Ratio of Net Investment Income/(Loss) | | 0.44% | | | 0.01% | | | 0.05% | | | 0.15% | | | 0.19% | | | 0.09% | |
| Portfolio Turnover Rate | | 6% | | | 9% | | | 12% | | | 14% | | | 13% | | | 13% | |
| | | | | | | | | | | | | | | | | | | | | | |
| |
* Total return includes adjustments in accordance with generally accepted accounting principles required at the year or period end and are not annualized for periods of less than one full year. ** Annualized for periods of less than one full year. (1) Per share amounts are calculated based on average shares outstanding during the year or period. |
| | |
See Notes to Financial Statements. |
| |
26 | MARCH 31, 2023 |
Janus Henderson Enterprise Fund
Notes to Financial Statements (unaudited)
1. Organization and Significant Accounting Policies
Janus Henderson Enterprise Fund (the “Fund”) is a series of Janus Investment Fund (the “Trust”), which is organized as a Massachusetts business trust and is registered under the Investment Company Act of 1940, as amended (the “1940 Act”), as an open-end management investment company, and therefore has applied the specialized accounting and reporting guidance in Financial Accounting Standards Board (“FASB”) Accounting Standards Codification (“ASC”) Topic 946. The Trust offers 40 funds, each of which offers multiple share classes, with differing investment objectives and policies. The Fund seeks long-term growth of capital. The Fund is classified as diversified, as defined in the 1940 Act. Janus Henderson Investors US LLC is the investment adviser (the “Adviser”) to the Fund.
The Fund offers multiple classes of shares in order to meet the needs of various types of investors. Each class represents an interest in the same portfolio of investments. Certain financial intermediaries may not offer all classes of shares.
Shareholders, including other funds, individuals, accounts, as well as the Fund’s portfolio manager(s) and/or investment personnel, may from time to time own (beneficially or of record) a significant percentage of the Fund’s Shares and can be considered to “control” the Fund when that ownership exceeds 25% of the Fund’s assets (and which may differ from control as determined in accordance with United States of America generally accepted accounting principles ("US GAAP")).
Class A Shares are offered through financial intermediary platforms including, but not limited to, traditional brokerage platforms, mutual fund wrap fee programs, bank trust platforms, and retirement platforms.
Class C Shares are offered through financial intermediary platforms including, but not limited to, traditional brokerage platforms, mutual fund wrap fee programs, and bank trust platforms.
Class C Shares are closed to investments by new employer-sponsored retirement plans and existing employer-sponsored retirement plans are no longer able to make additional purchases or exchanges into Class C Shares.
The Fund currently implements an automatic conversion feature pursuant to which Class C Shares that have been held for eight years are automatically converted to Class A Shares without the imposition of any sales charge, fee or other charge. The conversion will generally occur no later than ten business days in the month following the month of the eighth anniversary of the date of purchase. Class C Shares purchased through the reinvestment of dividends and other distributions on Class C Shares will convert to Class A Shares at the same time as the original Class C Shares with respect to which they were purchased. For Class C Shares held in omnibus accounts on intermediary platforms, the Fund relies on these intermediaries to implement this conversion feature. Your financial intermediary may have separate policies and procedures as to when and how Class C Shares may be converted to Class A Shares.
Effective July 6, 2020, Class D Shares are available to new investors, subject to any closed fund policies for a Fund, as applicable. Previously, Class D Shares were only available to investors who already had a direct account with the Janus Henderson funds; immediate family members or members of the same household of an eligible individual investor; and existing beneficial owners of sole proprietorships or partnerships that hold accounts directly with the Janus Henderson funds.
Class I Shares are available through certain financial intermediary platforms including, but not limited to, mutual fund wrap fee programs, managed account programs, asset allocation programs, bank trust platforms, as well as certain retirement platforms. Class I Shares are also available to certain direct institutional investors including, but not limited to, corporations, certain retirement plans, public plans, and foundations/endowments, who established Class I Share accounts before August 4, 2017.
Class N Shares are generally available only to financial intermediaries purchasing on behalf of: 1) certain adviser-assisted, employer-sponsored retirement plans, including 401(k) plans, 457 plans, 403(b) plans, Taft-Hartley multi-employer plans, profit-sharing and money purchase pension plans, defined benefit plans and certain welfare benefit plans, such as health savings accounts, and nonqualified deferred compensation plans; and 2) retail investors purchasing in qualified or nonqualified accounts, whose accounts are held through an omnibus account at their financial intermediary, and where the financial intermediary requires no payment or reimbursement from the Fund, the Adviser, or its affiliates. Class N Shares are also available to Janus Henderson proprietary products and to certain direct institutional investors approved by Janus Henderson Distributors US LLC (the “Distributor”) including, but not limited to,
Janus Henderson Enterprise Fund
Notes to Financial Statements (unaudited)
corporations, certain retirement plans, public plans, and foundations and endowments, subject to minimum investment requirements.
Class R Shares are offered through financial intermediary platforms including, but not limited to, retirement platforms.
Class S Shares are offered through financial intermediary platforms including, but not limited to, retirement platforms and asset allocation, mutual fund wrap, or other discretionary or nondiscretionary fee-based investment advisory programs. In addition, Class S Shares may be available through certain financial intermediaries who have an agreement with the Adviser or its affiliates to offer Class S Shares on their supermarket platforms.
Class T Shares are available through certain financial intermediary platforms including, but not limited to, mutual fund wrap fee programs, managed account programs, asset allocation programs, bank trust platforms, as well as certain retirement platforms. In addition, Class T Shares may be available through certain financial intermediaries who have an agreement with the Adviser or its affiliates to offer Class T Shares on their supermarket platforms.
The following accounting policies have been followed by the Fund and are in conformity with US GAAP.
Investment Valuation
Fund holdings are valued in accordance with policies and procedures established by the Adviser pursuant to Rule 2a-5 under the 1940 Act and approved by and subject to the oversight of the Trustees (the “Valuation Procedures”). Equity securities traded on a domestic securities exchange are generally valued at readily available market quotations, which are (i) the official close prices or (ii) last sale prices on the primary market or exchange in which the securities trade. If such price is lacking for the trading period immediately preceding the time of determination, such securities are generally valued at their current bid price. Equity securities that are traded on a foreign exchange are generally valued at the closing prices on such markets. In the event that there is no current trading volume on a particular security in such foreign exchange, the bid price from the primary exchange is generally used to value the security. Foreign securities and currencies are converted to U.S. dollars using the current spot USD dollar exchange rate in effect at the close of the New York Stock Exchange (“NYSE”). The Fund will determine the market value of individual securities held by it by using prices provided by one or more approved professional pricing services or, as needed, by obtaining market quotations from independent broker-dealers. Most debt securities are valued in accordance with the evaluated bid price supplied by the Adviser-approved pricing service that is intended to reflect market value. The evaluated bid price supplied by the pricing service is an evaluation that may consider factors such as security prices, yields, maturities and ratings. Certain short-term securities maturing within 60 days or less may be evaluated and valued on an amortized cost basis provided that the amortized cost determined approximates market value. Securities for which market quotations or evaluated prices are not readily available or deemed unreliable are valued at fair value determined in good faith by the Adviser pursuant to the Valuation Procedures. Circumstances in which fair valuation may be utilized include, but are not limited to: (i) a significant event that may affect the securities of a single issuer, such as a merger, bankruptcy, or significant issuer-specific development; (ii) an event that may affect an entire market, such as a natural disaster or significant governmental action; (iii) a nonsignificant event such as a market closing early or not opening, or a security trading halt; and (iv) pricing of a nonvalued security and a restricted or nonpublic security. Special valuation considerations may apply with respect to “odd-lot” fixed-income transactions which, due to their small size, may receive evaluated prices by pricing services which reflect a large block trade and not what actually could be obtained for the odd-lot position. The valuation policies provide for the use of systematic fair valuation models provided by independent pricing services to value foreign equity securities in order to adjust for stale pricing, which may occur between the close of certain foreign exchanges and the close of the NYSE. The value of the securities of other mutual funds held by a Fund, if any, will be calculated using the NAV of such mutual funds.
Valuation Inputs Summary
FASB ASC 820, Fair Value Measurements and Disclosures (“ASC 820”), defines fair value, establishes a framework for measuring fair value, and expands disclosure requirements regarding fair value measurements. This standard emphasizes that fair value is a market-based measurement that should be determined based on the assumptions that market participants would use in pricing an asset or liability and establishes a hierarchy that prioritizes inputs to valuation techniques used to measure fair value. These inputs are summarized into three broad levels:
Level 1 – Unadjusted quoted prices in active markets the Fund has the ability to access for identical assets or liabilities.
Janus Henderson Enterprise Fund
Notes to Financial Statements (unaudited)
Level 2 – Observable inputs other than unadjusted quoted prices included in Level 1 that are observable for the asset or liability either directly or indirectly. These inputs may include quoted prices for the identical instrument on an inactive market, prices for similar instruments, interest rates, prepayment speeds, credit risk, yield curves, default rates and similar data.
Assets or liabilities categorized as Level 2 in the hierarchy generally include: debt securities fair valued in accordance with the evaluated bid or ask prices supplied by a pricing service; securities traded on OTC markets and listed securities for which no sales are reported that are fair valued at the latest bid price (or yield equivalent thereof) obtained from one or more dealers transacting in a market for such securities or by a pricing service approved by the Fund’s Trustees; certain short-term debt securities with maturities of 60 days or less that are fair valued at amortized cost; and equity securities of foreign issuers whose fair value is determined by using systematic fair valuation models provided by independent third parties in order to adjust for stale pricing which may occur between the close of certain foreign exchanges and the close of the NYSE. Other securities that may be categorized as Level 2 in the hierarchy include, but are not limited to, preferred stocks, bank loans, swaps, investments in unregistered investment companies, options, and forward contracts.
Level 3 – Unobservable inputs for the asset or liability to the extent that relevant observable inputs are not available, representing the Fund’s own assumptions about the assumptions that a market participant would use in valuing the asset or liability, and that would be based on the best information available.
There have been no significant changes in valuation techniques used in valuing any such positions held by the Fund since the beginning of the fiscal period.
The inputs or methodology used for fair valuing securities are not necessarily an indication of the risk associated with investing in those securities. The summary of inputs used as of March 31, 2023 to fair value the Fund’s investments in securities and other financial instruments is included in the “Valuation Inputs Summary” in the Notes to Schedule of Investments and Other Information.
Investment Transactions and Investment Income
Investment transactions are accounted for as of the date purchased or sold (trade date). Dividend income is recorded on the ex-dividend date. Certain dividends from foreign securities will be recorded as soon as the Fund is informed of the dividend, if such information is obtained subsequent to the ex-dividend date. Dividends from foreign securities may be subject to withholding taxes in foreign jurisdictions. Non-cash dividends, if any, are recorded on the ex-dividend date at fair value. Interest income is recorded daily on an accrual basis and includes amortization of premiums and accretion of discounts. The Fund classifies gains and losses on prepayments received as an adjustment to interest income. Debt securities may be placed in non-accrual status and related interest income may be reduced by stopping current accruals and writing off interest receivables when collection of all or a portion of interest has become doubtful. Gains and losses are determined on the identified cost basis, which is the same basis used for federal income tax purposes. Income, as well as gains and losses, both realized and unrealized, are allocated daily to each class of shares based upon the ratio of net assets represented by each class as a percentage of total net assets.
Expenses
The Fund bears expenses incurred specifically on its behalf. Each class of shares bears a portion of general expenses, which are allocated daily to each class of shares based upon the ratio of net assets represented by each class as a percentage of total net assets. Expenses directly attributable to a specific class of shares are charged against the operations of such class.
Estimates
The preparation of financial statements in conformity with US GAAP requires management to make estimates and assumptions that affect the reported amount of assets and liabilities and disclosure of contingent assets and liabilities at the date of the financial statements, and the reported amounts of income and expenses during the reporting period. Actual results could differ from those estimates.
Indemnifications
In the normal course of business, the Fund may enter into contracts that contain provisions for indemnification of other parties against certain potential liabilities. The Fund’s maximum exposure under these arrangements is unknown, and would involve future claims that may be made against the Fund that have not yet occurred. Currently, the risk of material loss from such claims is considered remote.
Janus Henderson Enterprise Fund
Notes to Financial Statements (unaudited)
Foreign Currency Translations
The Fund does not isolate that portion of the results of operations resulting from the effect of changes in foreign exchange rates on investments from the fluctuations arising from changes in market prices of securities held at the date of the financial statements. Net unrealized appreciation or depreciation of investments and foreign currency translations arise from changes in the value of assets and liabilities, including investments in securities held at the date of the financial statements, resulting from changes in the exchange rates and changes in market prices of securities held.
Currency gains and losses are also calculated on payables and receivables that are denominated in foreign currencies. The payables and receivables are generally related to foreign security transactions and income translations.
Foreign currency-denominated assets and forward currency contracts may involve more risks than domestic transactions, including currency risk, counterparty risk, political and economic risk, regulatory risk and equity risk. Risks may arise from unanticipated movements in the value of foreign currencies relative to the U.S. dollar.
Dividends and Distributions
The Fund generally declares and distributes dividends of net investment income and realized capital gains (if any) annually. The Fund may treat a portion of the amount paid to redeem shares as a distribution of investment company taxable income and realized capital gains that are reflected in the net asset value. This practice, commonly referred to as “equalization,” has no effect on the redeeming shareholder or a Fund’s total return, but may reduce the amounts that would otherwise be required to be paid as taxable dividends to the remaining shareholders. It is possible that the Internal Revenue Service (IRS) could challenge the Fund's equalization methodology or calculations, and any such challenge could result in additional tax, interest, or penalties to be paid by the Fund.
The Fund may make certain investments in real estate investment trusts (“REITs”) which pay dividends to their shareholders based upon funds available from operations. It is quite common for these dividends to exceed the REITs’ taxable earnings and profits, resulting in the excess portion of such dividends being designated as a return of capital. If the Fund distributes such amounts, such distributions could constitute a return of capital to shareholders for federal income tax purposes.
Federal Income Taxes
The Fund intends to continue to qualify as a regulated investment company and distribute all of its taxable income in accordance with the requirements of Subchapter M of the Internal Revenue Code. Management has analyzed the Fund’s tax positions taken for all open federal income tax years, generally a three-year period, and has concluded that no provision for federal income tax is required in the Fund’s financial statements. The Fund is not aware of any tax positions for which it is reasonably possible that the total amounts of unrecognized tax benefits will significantly change in the next twelve months.
2. Derivative Instruments
The Fund may invest in various types of derivatives, which may at times result in significant derivative exposure. A derivative is a financial instrument whose performance is derived from the performance of another asset. The Fund may invest in derivative instruments including, but not limited to: futures contracts, put options, call options, options on futures contracts, options on foreign currencies, options on recovery locks, options on security and commodity indices, swaps, forward contracts, structured investments, and other equity-linked derivatives. Each derivative instrument that was held by the Fund during the period ended March 31, 2023 is discussed in further detail below. A summary of derivative activity by the Fund is reflected in the tables at the end of the Schedule of Investments.
The Fund may use derivative instruments for hedging purposes (to offset risks associated with an investment, currency exposure, or market conditions), to adjust currency exposure relative to a benchmark index, or for speculative purposes (to earn income and seek to enhance returns). When the Fund invests in a derivative for speculative purposes, the Fund will be fully exposed to the risks of loss of that derivative, which may sometimes be greater than the derivative’s cost. The Fund may not use any derivative to gain exposure to an asset or class of assets that it would be prohibited by its investment restrictions from purchasing directly. The Fund’s ability to use derivative instruments may also be limited by tax considerations.
Investments in derivatives in general are subject to market risks that may cause their prices to fluctuate over time. Investments in derivatives may not directly correlate with the price movements of the underlying instrument. As a result, the use of derivatives may expose the Fund to additional risks that it would not be subject to if it invested directly in the
Janus Henderson Enterprise Fund
Notes to Financial Statements (unaudited)
securities underlying those derivatives. The use of derivatives may result in larger losses or smaller gains than otherwise would be the case. Derivatives can be volatile and may involve significant risks.
In pursuit of its investment objective, the Fund may seek to use derivatives to increase or decrease exposure to the following market risk factors:
· Commodity Risk – the risk related to the change in value of commodities or commodity-linked investments due to changes in the overall market movements, volatility of the underlying benchmark, changes in interest rates, or other factors affecting a particular industry or commodity such as drought, floods, weather, livestock disease, embargoes, tariffs, and international economic, political, and regulatory developments.
· Counterparty Risk – the risk that the counterparty (the party on the other side of the transaction) on a derivative transaction will be unable to honor its financial obligation to the Fund.
· Credit Risk – the risk an issuer will be unable to make principal and interest payments when due, or will default on its obligations.
· Currency Risk – the risk that changes in the exchange rate between currencies will adversely affect the value (in U.S. dollar terms) of an investment.
· Equity Risk – the risk related to the change in value of equity securities as they relate to increases or decreases in the general market.
· Index Risk – if the derivative is linked to the performance of an index, it will be subject to the risks associated with changes in that index. If the index changes, the Fund could receive lower interest payments or experience a reduction in the value of the derivative to below what the Fund paid. Certain indexed securities, including inverse securities (which move in an opposite direction to the index), may create leverage, to the extent that they increase or decrease in value at a rate that is a multiple of the changes in the applicable index.
· Interest Rate Risk – the risk that the value of fixed-income securities will generally decline as prevailing interest rates rise, which may cause the Fund’s NAV to likewise decrease.
· Leverage Risk – the risk associated with certain types of leveraged investments or trading strategies pursuant to which relatively small market movements may result in large changes in the value of an investment. The Fund creates leverage by investing in instruments, including derivatives, where the investment loss can exceed the original amount invested. Certain investments or trading strategies, such as short sales, that involve leverage can result in losses that greatly exceed the amount originally invested.
· Liquidity Risk – the risk that certain securities may be difficult or impossible to sell at the time that the seller would like or at the price that the seller believes the security is currently worth.
Derivatives may generally be traded OTC or on an exchange. Derivatives traded OTC are agreements that are individually negotiated between parties and can be tailored to meet a purchaser’s needs. OTC derivatives are not guaranteed by a clearing agency and may be subject to increased credit risk.
In an effort to mitigate credit risk associated with derivatives traded OTC, the Fund may enter into collateral agreements with certain counterparties whereby, subject to certain minimum exposure requirements, the Fund may require the counterparty to post collateral if the Fund has a net aggregate unrealized gain on all OTC derivative contracts with a particular counterparty. Additionally, the Fund may deposit cash and/or treasuries as collateral with the counterparty and/or custodian daily (based on the daily valuation of the financial asset) if the Fund has a net aggregate unrealized loss on OTC derivative contracts with a particular counterparty. All liquid securities and restricted cash are considered to cover in an amount at all times equal to or greater than the Fund’s commitment with respect to certain exchange-traded derivatives, centrally cleared derivatives, forward foreign currency exchange contracts, short sales, and/or securities with extended settlement dates. There is no guarantee that counterparty exposure is reduced and these arrangements are dependent on the Adviser’s ability to establish and maintain appropriate systems and trading.
Forward Foreign Currency Exchange Contracts
A forward foreign currency exchange contract (“forward currency contract”) is an obligation to buy or sell a specified currency at a future date at a negotiated rate (which may be U.S. dollars or a foreign currency). The Fund may enter into forward currency contracts for hedging purposes, including, but not limited to, reducing exposure to changes in foreign
Janus Henderson Enterprise Fund
Notes to Financial Statements (unaudited)
currency exchange rates on foreign portfolio holdings and locking in the U.S. dollar cost of firm purchase and sale commitments for securities denominated in or exposed to foreign currencies. The Fund may also invest in forward currency contracts for non-hedging purposes such as seeking to enhance returns. The Fund is subject to currency risk and counterparty risk in the normal course of pursuing its investment objective through its investments in forward currency contracts.
Forward currency contracts are valued by converting the foreign value to U.S. dollars by using the current spot U.S. dollar exchange rate and/or forward rate for that currency. Exchange and forward rates as of the close of the NYSE are used to value the forward currency contracts. The unrealized appreciation/(depreciation) for forward currency contracts is reported in the Statement of Assets and Liabilities as a receivable or payable and in the Statement of Operations for the change in unrealized net appreciation/depreciation (if applicable). The realized gain or loss arising from the difference between the U.S. dollar cost of the original contract and the value of the foreign currency in U.S. dollars upon closing a forward currency contract is reported on the Statement of Operations (if applicable).
During the period, the Fund entered into forward currency contracts with the obligation to purchase foreign currencies in the future at an agreed upon rate in order to decrease exposure to currency risk associated with foreign currency denominated securities held by the Fund.
During the period, the Fund entered into forward currency contracts with the obligation to sell foreign currencies in the future at an agreed upon rate in order to decrease exposure to currency risk associated with foreign currency denominated securities held by the Fund.
3. Other Investments and Strategies
Additional Investment Risk
The U.S. government and the Federal Reserve, as well as certain foreign governments and central banks, have taken extraordinary actions to support local and global economies and the financial markets in response to the COVID-19 pandemic. This and other government intervention into the economy and financial markets to address the COVID-19 pandemic may not work as intended, particularly if the efforts are perceived by investors as being unlikely to achieve the desired results. Government actions to mitigate the economic impact of the pandemic have resulted in a large expansion of government deficits and debt, the long term consequences of which are not known. The COVID-19 pandemic could adversely affect the value and liquidity of a Fund’s investments, impair a Fund’s ability to satisfy redemption requests, and negatively impact a Fund’s performance. In addition, the outbreak of COVID-19, and measures taken to mitigate its effects, could result in disruptions to the services provided to a Fund by its service providers.
Widespread disease, including pandemics and epidemics, and natural or environmental disasters, including those which may be attributable to global climate change, such as earthquakes, fires, floods, hurricanes, tsunamis and weather-related phenomena generally, have been and can be highly disruptive to economies and markets, adversely impacting individual companies, sectors, industries, markets, currencies, interest and inflation rates, credit ratings, investor sentiment, and other factors affecting the value of a Fund’s investments. Economies and financial markets throughout the world have become increasingly interconnected, which increases the likelihood that events or conditions in one region or country will adversely affect markets or issuers in other regions or countries, including the United States. These disruptions could prevent a Fund from executing advantageous investment decisions in a timely manner and negatively impact a Fund’s ability to achieve its investment objective(s). Any such event(s) could have a significant adverse impact on the value of a Fund. In addition, these disruptions could also impair the information technology and other operational systems upon which the Fund’s service providers, including the Adviser or the subadviser (as applicable), rely, and could otherwise disrupt the ability of employees of the Fund’s service providers to perform essential tasks on behalf of the Fund. Adverse weather conditions may also have a particularly significant negative effect on issuers in the agricultural sector and on insurance and reinsurance companies that insure or reinsure against the impact of natural disasters.
A number of countries in the European Union (the “EU”) have experienced, and may continue to experience, severe economic and financial difficulties. In particular, many EU nations are susceptible to economic risks associated with high levels of debt. Many non-governmental issuers, and even certain governments, have defaulted on, or been forced to restructure, their debts. Many other issuers have faced difficulties obtaining credit or refinancing existing obligations. Financial institutions have in many cases required government or central bank support, have needed to raise capital, and/or have been impaired in their ability to extend credit. As a result, financial markets in the EU have experienced
Janus Henderson Enterprise Fund
Notes to Financial Statements (unaudited)
extreme volatility and declines in asset values and liquidity. These difficulties may continue, worsen, or spread further within the EU. Responses to these financial problems by European governments, central banks, and others, including austerity measures and reforms, may not work, may result in social unrest, and may limit future growth and economic recovery or have other unintended consequences. Among other things, these developments have adversely affected the value and exchange rate of the euro and pound sterling, and may continue to significantly affect the economies of all EU countries, which in turn may have a material adverse effect on the Fund’s investments in such countries, other countries that depend on EU countries for significant amounts of trade or investment, or issuers with exposure to debt issued by certain EU countries.
Real Estate Investing
The Fund may invest in equity and debt securities of real estate-related companies. Such companies may include those in the real estate industry or real estate-related industries. These securities may include common stocks, corporate bonds, preferred stocks, and other equity securities, including, but not limited to, mortgage-backed securities, real estate-backed securities, securities of REITs and similar REIT-like entities. A REIT is a trust that invests in real estate-related projects, such as properties, mortgage loans, and construction loans. REITs are generally categorized as equity, mortgage, or hybrid REITs. A REIT may be listed on an exchange or traded OTC.
Counterparties
Fund transactions involving a counterparty are subject to the risk that the counterparty or a third party will not fulfill its obligation to the Fund (“counterparty risk”). Counterparty risk may arise because of the counterparty’s financial condition (i.e., financial difficulties, bankruptcy, or insolvency), market activities and developments, or other reasons, whether foreseen or not. A counterparty’s inability to fulfill its obligation may result in significant financial loss to the Fund. The Fund may be unable to recover its investment from the counterparty or may obtain a limited recovery, and/or recovery may be delayed. The extent of the Fund’s exposure to counterparty risk with respect to financial assets and liabilities approximates its carrying value. See the "Offsetting Assets and Liabilities" section of this Note for further details.
The Fund may be exposed to counterparty risk through participation in various programs, including, but not limited to, lending its securities to third parties, cash sweep arrangements whereby the Fund’s cash balance is invested in one or more types of cash management vehicles, as well as investments in, but not limited to, repurchase agreements, debt securities, and derivatives, including various types of swaps, futures and options. The Fund intends to enter into financial transactions with counterparties that the Adviser believes to be creditworthy at the time of the transaction. There is always the risk that the Adviser’s analysis of a counterparty’s creditworthiness is incorrect or may change due to market conditions. To the extent that the Fund focuses its transactions with a limited number of counterparties, it will have greater exposure to the risks associated with one or more counterparties.
Securities Lending
Under procedures adopted by the Trustees, the Fund may seek to earn additional income by lending securities to certain qualified broker-dealers and institutions. JPMorgan Chase Bank, National Association acts as securities lending agent and a limited purpose custodian or subcustodian to receive and disburse cash balances and cash collateral, hold short-term investments, hold collateral, and perform other custodial functions in accordance with the Non-Custodial Securities Lending Agreement. For financial reporting purposes, the Fund does not offset financial instruments’ payables and receivables and related collateral on the Statement of Assets and Liabilities. The Fund may lend fund securities in an amount equal to up to 1/3 of its total assets as determined at the time of the loan origination. There is the risk of delay in recovering a loaned security or the risk of loss in collateral rights if the borrower fails financially. In addition, the Adviser makes efforts to balance the benefits and risks from granting such loans. All loans will be continuously secured by collateral which may consist of cash, U.S. Government securities, domestic and foreign short-term debt instruments, letters of credit, time deposits, repurchase agreements, money market mutual funds or other money market accounts, or such other collateral as permitted by the SEC. If the Fund is unable to recover a security on loan, the Fund may use the collateral to purchase replacement securities in the market. There is a risk that the value of the collateral could decrease below the cost of the replacement security by the time the replacement investment is made, resulting in a loss to the Fund. In certain circumstances individual loan transactions could yield negative returns.
Upon receipt of cash collateral, the Adviser may invest it in affiliated or non-affiliated cash management vehicles, whether registered or unregistered entities, as permitted by the 1940 Act and rules promulgated thereunder. The Adviser currently intends to primarily invest the cash collateral in a cash management vehicle for which the Adviser serves as investment adviser, Janus Henderson Cash Collateral Fund LLC, or in time deposits. An investment in Janus Henderson Cash Collateral Fund LLC is generally subject to the same risks that shareholders experience when
Janus Henderson Enterprise Fund
Notes to Financial Statements (unaudited)
investing in similarly structured vehicles, such as the potential for significant fluctuations in assets as a result of the purchase and redemption activity of the securities lending program, a decline in the value of the collateral, and possible liquidity issues. Such risks may delay the return of the cash collateral and cause the Fund to violate its agreement to return the cash collateral to a borrower in a timely manner. As adviser to the Fund and Janus Henderson Cash Collateral Fund LLC, the Adviser has an inherent conflict of interest as a result of its fiduciary duties to both the Fund and Janus Henderson Cash Collateral Fund LLC. Additionally, the Adviser receives an investment advisory fee of 0.05% for managing Janus Henderson Cash Collateral Fund LLC, but it may not receive a fee for managing certain other affiliated cash management vehicles in which the Fund may invest, and therefore may have an incentive to allocate preferred investment opportunities to investment vehicles for which it is receiving a fee.
The value of the collateral must be at least 102% of the market value of the loaned securities that are denominated in U.S. dollars and 105% of the market value of the loaned securities that are not denominated in U.S. dollars. Loaned securities and related collateral are marked-to-market each business day based upon the market value of the loaned securities at the close of business, employing the most recent available pricing information. Collateral levels are then adjusted based on this mark-to-market evaluation. Additional required collateral, or excess collateral returned, is delivered on the next business day. Therefore, the value of the collateral held may be temporarily less than 102% or 105% value of the securities on loan. The cash collateral invested by the Adviser is disclosed in the Schedule of Investments (if applicable).
Income earned from the investment of the cash collateral, net of rebates paid to, or fees paid by, borrowers and less the fees paid to the lending agent are included as “Affiliated securities lending income, net” on the Statement of Operations. As of March 31, 2023, securities lending transactions accounted for as secured borrowings with an overnight and continuous contractual maturity are $4,113,932. Gross amounts of recognized liabilities for securities lending (collateral received) as of March 31, 2023 is $3,983,350, resulting in the net amount due from the counterparty of $130,582.
Offsetting Assets and Liabilities
The Fund presents gross and net information about transactions that are either offset in the financial statements or subject to an enforceable master netting arrangement or similar agreement with a designated counterparty, regardless of whether the transactions are actually offset in the Statement of Assets and Liabilities.
In order to better define its contractual rights and to secure rights that will help the Fund mitigate its counterparty risk, the Fund has entered into an International Swaps and Derivatives Association, Inc. Master Agreement (“ISDA Master Agreement”) or similar agreement with its derivative contract counterparties. An ISDA Master Agreement is a bilateral agreement between the Fund and a counterparty that governs OTC derivatives and forward foreign currency exchange contracts and typically contains, among other things, collateral posting terms and netting provisions in the event of a default and/or termination event. Under an ISDA Master Agreement, in the event of a default and/or termination event, the Fund may offset with each counterparty certain derivative financial instruments’ payables and/or receivables with collateral held and/or posted and create one single net payment.
The Offsetting Assets and Liabilities tables located in the Schedule of Investments present gross amounts of recognized assets and/or liabilities and the net amounts after deducting collateral that has been pledged by counterparties or has been pledged to counterparties (if applicable). For corresponding information grouped by type of instrument, see the “Fair Value of Derivative Instruments (not accounted for as hedging instruments) as of March 31, 2023” table located in the Fund’s Schedule of Investments.The Fund generally does not exchange collateral on its forward foreign currency contracts with its counterparties; however, all liquid securities and restricted cash are considered to cover in an amount at all times equal to or greater than the Fund’s commitment with respect to these contracts. Certain securities may be segregated at the Fund’s custodian. These segregated securities are denoted on the accompanying Schedule of Investments and are evaluated daily to ensure their cover and/or market value equals or exceeds the Fund’s corresponding forward foreign currency exchange contract's obligation value.
4. Investment Advisory Agreements and Other Transactions with Affiliates
The Fund pays the Adviser an investment advisory fee which is calculated daily and paid monthly. The Fund’s contractual investment advisory fee rate (expressed as an annual rate) is 0.64% of its average daily net assets.
The Adviser has contractually agreed to waive the investment advisory fee and/or reimburse operating expenses to the extent that the Fund’s total annual fund operating expenses, excluding the fees payable pursuant to a Rule 12b-1 plan, shareholder servicing fees, such as transfer agency fees (including out-of-pocket costs), administrative services fees
Janus Henderson Enterprise Fund
Notes to Financial Statements (unaudited)
and any networking/omnibus payable by any share class, brokerage commissions, interest, dividends, taxes, acquired fund fees and expenses, and extraordinary expenses, exceed the annual rate of 0.80% of the Fund’s average daily net assets. The Adviser has agreed to continue the waivers for at least a one-year period commencing January 27, 2023. If applicable, amounts waived and/or reimbursed to the Fund by the Adviser are disclosed as “Excess Expense Reimbursement and Waivers” on the Statement of Operations.
The Adviser serves as administrator to the Fund pursuant to an administration agreement between the Adviser and the Trust. Under the administration agreement, the Adviser is authorized to perform, or cause others to perform certain administration, compliance, and accounting services to the Fund, including providing office space for the Fund, and is reimbursed by the Fund for certain of its costs in providing these services (to the extent the Adviser seeks reimbursement and such costs are not otherwise waived). In addition, employees of the Adviser and/or its affiliates may serve as officers of the Trust. The Fund pays for some or all of the salaries, fees, and expenses of the Adviser employees and Fund officers, with respect to certain specified administration functions they perform on behalf of the Fund. The Fund pays these costs based on out-of-pocket expenses incurred by the Adviser, and these costs are separate and apart from advisory fees and other expenses paid in connection with the investment advisory services the Adviser (or any subadvisor, as applicable) provides to the Fund. These amounts are disclosed as “Affiliated fund administration fees” on the Statement of Operations. In addition, some expenses related to compensation payable to the Fund’s Chief Compliance Officer and certain compliance staff, all of whom are employees of the Adviser and/or its affiliates, are shared with the Fund. Total compensation of $114,430 was paid to the Chief Compliance Officer and certain compliance staff by the Trust during the period ended March 31, 2023. The Fund's portion is reported as part of “Other expenses” on the Statement of Operations.
Janus Henderson Services US LLC (the “Transfer Agent”), a wholly-owned subsidiary of the Adviser, is the Fund’s transfer agent. The Transfer Agent provides or arranges for the provision of shareholder services including, but not limited to, recordkeeping, subaccounting, answering inquiries regarding accounts, order processing, transaction confirmations, the mailing of prospectuses and shareholder reports, and other shareholder services provided to or on behalf of shareholders. These amounts are disclosed as “Transfer agent administrative fees and expenses” on the Statement of Operations.
Class D Shares of the Fund pay the Transfer Agent an annual administrative services fee based on the average daily net assets of Class D Shares as detailed below.
| | |
Average Daily Net Assets of Class D Shares of the Janus Henderson funds | Administrative Services Fee |
Under $40 billion | 0.12% |
$40 billion – $49.9 billion | 0.10% |
Over $49.9 billion | 0.08% |
During the reporting period, the administrative services fee rate was 0.12%.
The Transfer Agent receives an administrative services fee at an annual rate of up to 0.25% of the average daily net assets of the Fund’s Class R Shares, Class S Shares, and Class T Shares for providing or procuring administrative services to investors in Class R Shares, Class S Shares, and Class T Shares of the Fund. The Transfer Agent expects to use all or a significant portion of this fee to compensate retirement plan service providers, broker-dealers, bank trust departments, financial advisors, and other financial intermediaries for providing these services. The Transfer Agent may keep certain amounts retained for reimbursement of out-of-pocket costs incurred for servicing clients of Class R Shares, Class S Shares, and Class T Shares.
Shareholder Services provided by these financial intermediaries may include, but are not limited to, recordkeeping, subaccounting, order processing, providing order confirmations, periodic statements, forwarding prospectuses, shareholder reports, and other materials to existing customers, answering inquiries regarding accounts, and other administrative services. Order processing includes the submission of transactions through the National Securities Clearing Corporation (“NSCC”) or similar systems, or those processed on a manual basis with the Adviser. For all share classes, the Transfer Agent also seeks reimbursement for costs it incurs as transfer agent and for providing servicing.
Certain, but not all, intermediaries may charge administrative fees to investors in Class A Shares, Class C Shares, and Class I Shares for administrative services provided on behalf of such investors. These administrative fees are paid by the Class A Shares, Class C Shares, and Class I Shares of the Fund to the Transfer Agent, which uses such fees to reimburse intermediaries. Consistent with the Transfer Agency Agreement between the Transfer Agent and the Fund,
Janus Henderson Enterprise Fund
Notes to Financial Statements (unaudited)
the Transfer Agent may negotiate the level, structure, and/or terms of the administrative fees with intermediaries requiring such fees on behalf of the Fund. The Adviser and its affiliates benefit from an increase in assets that may result from such relationships. The Adviser has agreed to limit these fees up to 0.20% for Class A Shares and Class C Shares, and up to 0.15% for Class I Shares on an annual basis based on the daily net assets of each share class. Such limits are subject to change by the Trustees in the future. These amounts are disclosed as “Transfer agent networking and omnibus fees” on the Statement of Operations.
The Transfer Agent is not compensated for its services related to the shares, except for out-of-pocket costs, although the Transfer Agent is compensated for its services related to Fund’s Class D Shares. These amounts are disclosed as “Other transfer agent fees and expenses” on the Statement of Operations.
Under distribution and shareholder servicing plans (the “Plans”) adopted in accordance with Rule 12b-1 under the 1940 Act, the Fund pays the Trust’s distributor, the Distributor, a wholly-owned subsidiary of the Adviser, a fee for the sale and distribution and/or shareholder servicing of the shares based on the average daily net assets for each share class at an annual rate of up to 0.25% for Class A Shares, up to 1.00% for Class C Shares, of up to 0.50% of the Class R Shares' average daily net assets, and up to 0.25% for Class S Shares. Under the terms of the Plans, the Trust is authorized to make payments to the Distributor for remittance to retirement plan service providers, broker-dealers, bank trust departments, financial advisors, and other financial intermediaries, as compensation for distribution and/or shareholder services performed by such entities for their customers who are investors in the Fund. These amounts are disclosed as “12b-1 Distribution and shareholder servicing fees” on the Statement of Operations.
Class A Shares include a 5.75% upfront sales charge of the offering price of the Fund. The sales charge is allocated between the Distributor and financial intermediaries. During the period ended March 31, 2023, the Distributor retained upfront sales charges of $18,371.
A contingent deferred sales charge (“CDSC”) of 1.00% will be deducted with respect to Class A Shares purchased without a sales load and redeemed within 12 months of purchase, unless waived. Any applicable CDSC will be 1.00% of the lesser of the original purchase price or the value of the redemption of the Class A Shares redeemed. There were no CDSCs paid by redeeming shareholders of Class A Shares to the Distributor during the period ended March 31, 2023.
A CDSC of 1.00% will be deducted with respect to Class C Shares redeemed within 12 months of purchase, unless waived. Any applicable CDSC will be 1.00% of the lesser of the original purchase price or the value of the redemption of the Class C Shares redeemed. During the period ended March 31, 2023, redeeming shareholders of Class C Shares paid CDSCs of $884.
The Board of Trustees has adopted a deferred compensation plan (the “Deferred Plan”) for independent Trustees to elect to defer receipt of all or a portion of the annual compensation they are entitled to receive from the Fund. All deferred fees are credited to an account established in the name of the Trustees. The amounts credited to the account then increase or decrease, as the case may be, in accordance with the performance of one or more of the Janus Henderson funds that are selected by the Trustees. The account balance continues to fluctuate in accordance with the performance of the selected fund or funds until final payment of all amounts are credited to the account. The fluctuation of the account balance is recorded by the Fund as unrealized appreciation/(depreciation) and is included as of March 31, 2023 on the Statement of Assets and Liabilities in the asset, “Trustees’ deferred compensation,” and liability, “Trustees’ deferred compensation fees.” Additionally, the recorded unrealized appreciation/(depreciation) is included in “Total distributable earnings (loss)” on the Statement of Assets and Liabilities. Deferred compensation expenses for the period ended March 31, 2023 are included in “Trustees’ fees and expenses” on the Statement of Operations. Trustees are allowed to change their designation of mutual funds from time to time. Amounts will be deferred until distributed in accordance with the Deferred Plan. Deferred fees of $205,688 were paid by the Trust to the Trustees under the Deferred Plan during the period ended March 31, 2023.
Pursuant to the provisions of the 1940 Act and related rules, the Fund may participate in an affiliated or non-affiliated cash sweep program. In the cash sweep program, uninvested cash balances of the Fund may be used to purchase shares of affiliated or non-affiliated money market funds or cash management pooled investment vehicles that operate as money market funds. The Fund is eligible to participate in the cash sweep program (the “Investing Funds”). The Adviser has an inherent conflict of interest because of its fiduciary duties to the affiliated money market funds or cash management pooled investment vehicles and the Investing Funds. Janus Henderson Cash Liquidity Fund LLC (the “Sweep Vehicle”) is an affiliated unregistered cash management pooled investment vehicle that invests primarily in
Janus Henderson Enterprise Fund
Notes to Financial Statements (unaudited)
highly-rated short-term fixed-income securities. The Sweep Vehicle operates pursuant to the provisions of the 1940 Act that govern the operation of money market funds and prices its shares at NAV reflecting market-based values of its portfolio securities (i.e., a “floating” NAV) rounded to the fourth decimal place (e.g., $1.0000). The Sweep Vehicle is permitted to impose a liquidity fee (of up to 2%) on redemptions from the Sweep Vehicle or a redemption gate that temporarily suspends redemptions from the Sweep Vehicle for up to 10 business days during a 90 day period. There are no restrictions on the Fund's ability to withdraw investments from the Sweep Vehicle at will, and there are no unfunded capital commitments due from the Fund to the Sweep Vehicle. The Sweep Vehicle does not charge any management fee, sales charge or service fee.
Any purchases and sales, realized gains/losses and recorded dividends from affiliated investments during the period ended March 31, 2023 can be found in the “Schedules of Affiliated Investments” located in the Schedule of Investments.
The Fund is permitted to purchase or sell securities (“cross-trade”) between itself and other funds or accounts managed by the Adviser in accordance with Rule 17a-7 under the Investment Company Act of 1940 (“Rule 17a-7”), when the transaction is consistent with the investment objectives and policies of the Fund and in accordance with the Internal Cross Trade Procedures adopted by the Trust’s Board of Trustees. These procedures have been designed to ensure that any cross-trade of securities by the Fund from or to another fund or account that is or could be considered an affiliate of the Fund under certain limited circumstances by virtue of having a common investment adviser, common Officer, or common Trustee complies with Rule 17a-7. Under these procedures, each cross-trade is effected at the current market price to save costs where allowed. During the period ended March 31, 2023, the Fund engaged in cross trades amounting to $7,368,553 in sales, resulting in a net realized loss of $1,107,799. The net realized loss is included within the “Net Realized Gain/(Loss) on Investments” section of the Fund’s Statement of Operations.
5. Federal Income Tax
Income and capital gains distributions are determined in accordance with income tax regulations that may differ from US GAAP. These differences are due to differing treatments for items such as net short-term gains, deferral of wash sale losses, foreign currency transactions, net investment losses, and capital loss carryovers.
The Fund has elected to treat gains and losses on forward foreign currency contracts as capital gains and losses, if applicable. Other foreign currency gains and losses on debt instruments are treated as ordinary income for federal income tax purposes pursuant to Section 988 of the Internal Revenue Code.
The aggregate cost of investments and the composition of unrealized appreciation and depreciation of investment securities for federal income tax purposes as of March 31, 2023 are noted below. The primary differences between book and tax appreciation or depreciation of investments are wash sale loss deferrals and investments in partnerships.
| | | | |
Federal Tax Cost | Unrealized
Appreciation | Unrealized
(Depreciation) | Net Tax Appreciation/
(Depreciation) |
$ 11,820,517,389 | $6,892,516,240 | $(578,550,941) | $ 6,313,965,299 |
Janus Henderson Enterprise Fund
Notes to Financial Statements (unaudited)
6. Capital Share Transactions
| | | | | | | |
| | | | | | |
| | Period ended March 31, 2023 | | Year ended September 30, 2022 |
| | Shares | Amount | | Shares | Amount |
| | | | | | | |
Class A Shares: | | | | | |
Shares sold | 466,370 | $ 56,126,279 | | 837,971 | $ 116,608,375 |
Reinvested dividends and distributions | 207,036 | 23,448,932 | | 297,360 | 42,632,523 |
Shares repurchased | (392,877) | (47,942,019) | | (1,129,349) | (163,228,397) |
Net Increase/(Decrease) | 280,529 | $ 31,633,192 | | 5,982 | $ (3,987,499) |
Class C Shares: | | | | | |
Shares sold | 72,089 | $ 7,697,524 | | 62,501 | $ 7,928,856 |
Reinvested dividends and distributions | 125,243 | 12,253,752 | | 217,666 | 27,523,875 |
Shares repurchased | (234,526) | (25,043,244) | | (376,526) | (46,613,820) |
Net Increase/(Decrease) | (37,194) | $ (5,091,968) | | (96,359) | $ (11,161,089) |
Class D Shares: | | | | | |
Shares sold | 283,354 | $ 36,402,928 | | 478,632 | $ 70,710,123 |
Reinvested dividends and distributions | 1,627,079 | 192,646,089 | | 2,340,660 | 348,173,218 |
Shares repurchased | (592,284) | (75,850,824) | | (1,188,599) | (174,245,390) |
Net Increase/(Decrease) | 1,318,149 | $ 153,198,193 | | 1,630,693 | $ 244,637,951 |
Class I Shares: | | | | | |
Shares sold | 9,106,691 | $1,183,253,650 | | 11,811,951 | $1,707,347,149 |
Reinvested dividends and distributions | 3,988,150 | 475,985,691 | | 6,230,188 | 933,095,224 |
Shares repurchased | (9,224,100) | (1,192,219,614) | | (19,402,149) | (2,777,647,510) |
Net Increase/(Decrease) | 3,870,741 | $ 467,019,727 | | (1,360,010) | $ (137,205,137) |
Class N Shares: | | | | | |
Shares sold | 3,300,839 | $ 430,400,710 | | 10,969,680 | $1,521,926,877 |
Reinvested dividends and distributions | 3,462,685 | 415,937,740 | | 5,161,986 | 776,930,572 |
Shares repurchased | (5,221,659) | (678,654,106) | | (9,937,540) | (1,448,326,856) |
Net Increase/(Decrease) | 1,541,865 | $ 167,684,344 | | 6,194,126 | $ 850,530,593 |
Class R Shares: | | | | | |
Shares sold | 50,167 | $ 5,790,211 | | 110,709 | $ 14,873,704 |
Reinvested dividends and distributions | 72,303 | 7,674,941 | | 119,781 | 16,249,554 |
Shares repurchased | (83,724) | (9,575,674) | | (284,150) | (37,102,992) |
Net Increase/(Decrease) | 38,746 | $ 3,889,478 | | (53,660) | $ (5,979,734) |
Class S Shares: | | | | | |
Shares sold | 115,829 | $ 14,203,732 | | 280,458 | $ 39,604,865 |
Reinvested dividends and distributions | 265,955 | 29,832,192 | | 435,205 | 61,877,468 |
Shares repurchased | (364,673) | (43,955,793) | | (902,055) | (128,000,876) |
Net Increase/(Decrease) | 17,111 | $ 80,131 | | (186,392) | $ (26,518,543) |
Class T Shares: | | | | | |
Shares sold | 2,132,545 | $ 267,218,159 | | 5,573,071 | $ 777,199,170 |
Reinvested dividends and distributions | 2,657,848 | 311,420,091 | | 4,668,938 | 688,715,006 |
Shares repurchased | (4,917,228) | (616,004,528) | | (13,712,032) | (2,043,740,273) |
Net Increase/(Decrease) | (126,835) | $ (37,366,278) | | (3,470,023) | $ (577,826,097) |
7. Purchases and Sales of Investment Securities
For the period ended March 31, 2023, the aggregate cost of purchases and proceeds from sales of investment securities (excluding any short-term securities, short-term options contracts, TBAs, and in-kind transactions, as applicable) was as follows:
| | | | |
Purchases of
Securities | Proceeds from Sales
of Securities | Purchases of Long-
Term U.S. Government
Obligations | Proceeds from Sales
of Long-Term U.S.
Government Obligations |
$ 962,959,430 | $ 1,907,952,567 | $ - | $ - |
Janus Henderson Enterprise Fund
Notes to Financial Statements (unaudited)
8. Subsequent Event
Management has evaluated whether any events or transactions occurred subsequent to March 31, 2023 and through the date of issuance of the Fund’s financial statements and determined that there were no material events or transactions that would require recognition or disclosure in the Fund’s financial statements.
Janus Henderson Enterprise Fund
Additional Information (unaudited)
Proxy Voting Policies and Voting Record
A description of the policies and procedures that the Fund uses to determine how to vote proxies relating to its portfolio securities is available without charge: (i) upon request, by calling 1-800-525-1093; (ii) on the Fund’s website at janushenderson.com/proxyvoting; and (iii) on the SEC’s website at http://www.sec.gov. Additionally, information regarding the Fund’s proxy voting record for the most recent twelve-month period ended June 30 is also available, free of charge, through janushenderson.com/proxyvoting and from the SEC’s website at http://www.sec.gov.
Full Holdings
The Fund files its complete portfolio holdings (schedule of investments) with the SEC as an exhibit to Form N-PORT within 60 days of the end of the first and third fiscal quarters, and in the annual report and semiannual report to shareholders. The Fund’s Form N-PORT filings and annual and semiannual reports: (i) are available on the SEC’s website at http://www.sec.gov; and (ii) are available without charge, upon request, by calling a Janus Henderson representative at 1-877-335-2687 (toll free) (or 1-800-525-3713 if you hold Class D Shares). Portfolio holdings consisting of at least the names of the holdings are generally available on a monthly basis with a 30-day lag under Full Holdings for the Fund at janushenderson.com/info (or janushenderson.com/reports if you hold Class D Shares).
APPROVAL OF ADVISORY AGREEMENTS DURING THE PERIOD
The Trustees of Janus Aspen Series, each of whom serves as an “independent” Trustee (the “Trustees”), oversee the management of each portfolio of Janus Aspen Series (each, a “VIT Portfolio,” and collectively, the “VIT Portfolios”), as well as each fund of Janus Investment Fund (each, a “Fund,” and collectively, the “Funds” and together with the VIT Portfolios, the “Janus Henderson Funds,” and each, a “Janus Henderson Fund”). As required by law, the Trustees determine annually whether to continue the investment advisory agreement for each Janus Henderson Fund.
In connection with their most recent consideration of those agreements for each Janus Henderson Fund, the Trustees received and reviewed information provided by Janus Henderson Investors US LLC (the “Adviser”) in response to requests of the Trustees and their independent legal counsel. They also received and reviewed information and analysis provided by, and in response to requests of, their independent fee consultant. Throughout their consideration of the agreements, the Trustees were advised by their independent legal counsel. The Trustees met with management to consider the agreements, and also met separately in executive session with their independent legal counsel and their independent fee consultant.
At meetings held on November 9-10, 2022 and December 13-14, 2022, the Trustees evaluated the information provided by the Adviser and the independent fee consultant, as well as other information provided by the Adviser and the independent fee consultant during the year. Following such evaluation, the Trustees determined that the overall arrangements between each Janus Henderson Fund and the Adviser were fair and reasonable in light of the nature, extent, and quality of the services provided by the Adviser and its affiliates, the fees charged for those services, and other matters that the Trustees considered relevant in the exercise of their business judgment, and unanimously approved the continuation of the investment advisory agreement for each Janus Henderson Fund for the period from February 1, 2023 through February 1, 2024, subject to earlier termination as provided for in each agreement.
In considering the continuation of those agreements, the Trustees reviewed and analyzed various factors that they determined were relevant, including the factors described below, none of which by itself was considered dispositive. However, the material factors and conclusions that formed the basis for the Trustees’ determination to approve the continuation of the agreements are discussed separately below. Also included is a summary of the independent fee consultant’s conclusions and opinions that arose during, and were included as part of, the Trustees’ consideration of the agreements. “Management fees,” as used herein, reflect actual annual advisory fees and, for the purpose of peer comparisons any administration fees (excluding out of pocket costs), net of any waivers, paid by a fund as a percentage of average net assets.
Nature, Extent and Quality of Services
The Trustees reviewed the nature, extent, and quality of the services provided by the Adviser to the Janus Henderson Funds, taking into account the investment objective, strategies, and policies of each Janus Henderson Fund, and the knowledge the Trustees gained from their regular meetings with management on at least a quarterly basis and their ongoing review of information related to the Janus Henderson Funds. In addition, the Trustees reviewed the resources and key personnel of the Adviser, particularly noting those employees who provide investment and risk management services to the Janus Henderson Funds. The Trustees also considered other services provided to the Janus Henderson
Janus Henderson Enterprise Fund
Additional Information (unaudited)
Funds by the Adviser, such as managing the execution of portfolio transactions and the selection of broker-dealers for those transactions. The Trustees considered the Adviser’s role as administrator to the Janus Henderson Funds, noting that the Adviser generally does not receive a fee for its services as administrator, but is reimbursed for its out-of-pocket costs. The Trustees considered the role of the Adviser in monitoring adherence to the Janus Henderson Funds’ investment restrictions, providing support services for the Trustees and Trustee committees, and overseeing communications with Janus Henderson Fund shareholders and the activities of other service providers, including monitoring compliance with various policies and procedures of the Janus Henderson Funds and with applicable securities laws and regulations.
In this regard, the independent fee consultant noted that the Adviser provides a number of different services for the Janus Henderson Funds and their shareholders, ranging from investment management services to various other servicing functions, and that, in its view, the Adviser is a capable provider of those services. The independent fee consultant also provided its belief that the Adviser has developed a number of institutional competitive advantages that should enable it to provide superior investment and service performance over the long term.
The Trustees concluded that the nature, extent, and quality of the services provided by the Adviser to each Janus Henderson Fund were appropriate and consistent with the terms of the respective advisory agreements, and that, taking into account steps taken to address those Janus Henderson Funds whose performance lagged that of their peers for certain periods, the Janus Henderson Funds were likely to benefit from the continued provision of those services. They also concluded that the Adviser had sufficient personnel, with the appropriate education and experience, to serve the Janus Henderson Funds effectively and had demonstrated its ability to attract well-qualified personnel.
Performance of the Funds
The Trustees considered the performance results of each Janus Henderson Fund over various time periods. They noted that they considered Janus Henderson Fund performance data throughout the year, including periodic meetings with each Janus Henderson Fund’s portfolio manager(s), and also reviewed information comparing each Janus Henderson Fund’s performance with the performance of comparable fund peer groups identified by Broadridge Financial Solutions, Inc. (“Broadridge”), an independent data provider, and with the Janus Henderson Fund’s benchmark index. In this regard, the independent fee consultant found that the overall Janus Henderson Funds’ performance has been reasonable, noting that: (i) for the 36 months ended May 31, 2022, approximately 38% of the Janus Henderson Funds were in the top two quartiles of their Broadridge peer groups; (ii) for the 36 months ended September 30, 2022, approximately 45% of the Janus Henderson Funds were in the top two quartiles of performance as reported by Morningstar, and (iii) for the 12 months ended September 30, 2022, approximately 55% of the Janus Henderson Funds were in the top two quartiles of performance as reported by Morningstar.
The Trustees considered the performance of each Janus Henderson Fund, noting that performance may vary by share class, and noted the following with respect to the Funds:
Asset Allocation Funds
· For Janus Henderson Global Allocation Fund – Conservative, the Trustees noted that the Fund’s performance was in the third Broadridge quartile for the 36 months ended May 31, 2022 and the bottom Broadridge quartile for the 12 months ended May 31, 2022. The Trustees noted the reasons for the Fund’s underperformance and the steps the Adviser had taken or was taking to improve performance.
· For Janus Henderson Global Allocation Fund – Growth, the Trustees noted that the Fund’s performance was in the bottom Broadridge quartile for the 36 months ended May 31, 2022 and the bottom Broadridge quartile for the 12 months ended May 31, 2022. The Trustees noted the reasons for the Fund’s underperformance and the steps the Adviser had taken or was taking to improve performance.
· For Janus Henderson Global Allocation Fund – Moderate, the Trustees noted that the Fund’s performance was in the bottom Broadridge quartile for the 36 months ended May 31, 2022 and the bottom Broadridge quartile for the 12 months ended May 31, 2022. The Trustees noted the reasons for the Fund’s underperformance and the steps the Adviser had taken or was taking to improve performance.
Fixed-Income Funds
· For Janus Henderson Absolute Return Income Opportunities Fund, the Trustees noted that the Fund’s performance was in the third Broadridge quartile for the 36 months ended May 31, 2022 and the first Broadridge quartile for the 12 months ended May 31, 2022. The Trustees noted the reasons for the Fund’s underperformance,
Janus Henderson Enterprise Fund
Additional Information (unaudited)
the steps the Adviser had taken or was taking to improve performance, and that the performance trend was improving.
· For Janus Developed World Bond Fund, the Trustees noted that the Fund’s performance was in the bottom Broadridge quartile for the 36 months ended May 31, 2022 and the bottom Broadridge quartile for the 12 months ended May 31, 2022. The Trustees noted the reasons for the Fund’s underperformance and the steps the Adviser had taken or was taking to improve performance.
· For Janus Henderson Flexible Bond Fund, the Trustees noted that the Fund’s performance was in the first Broadridge quartile for the 36 months ended May 31, 2022 and the second Broadridge quartile for the 12 months ended May 31, 2022.
· For Janus Henderson Global Bond Fund, the Trustees noted that the Fund’s performance was in the third Broadridge quartile for the 36 months ended May 31, 2022 and the bottom Broadridge quartile for the 12 months ended May 31, 2022. The Trustees noted the reasons for the Fund’s underperformance and the steps the Adviser had taken or was taking to improve performance.
· For Janus Henderson High-Yield Fund, the Trustees noted that the Fund’s performance was in the third Broadridge quartile for the 36 months ended May 31, 2022 and the bottom Broadridge quartile for the 12 months ended May 31, 2022. The Trustees noted the reasons for the Fund’s underperformance and the steps the Adviser had taken or was taking to improve performance.
· For Janus Henderson Multi-Sector Income Fund, the Trustees noted that the Fund’s performance was in the second Broadridge quartile for the 36 months ended May 31, 2022 and the third Broadridge quartile for the 12 months ended May 31, 2022.
· For Janus Henderson Short Duration Flexible Bond Fund, the Trustees noted that the Fund’s performance was in the third Broadridge quartile for the 36 months ended May 31, 2022 and the bottom Broadridge quartile for the 12 months ended May 31, 2022. The Trustees noted the reasons for the Fund’s underperformance and the steps the Adviser had taken or was taking to improve performance.
Global and International Equity Funds
· For Janus Henderson Asia Equity Fund, the Trustees noted that the Fund’s performance was in the third Broadridge quartile for the 36 months ended May 31, 2022 and the third Broadridge quartile for the 12 months ended May 31, 2022. The Trustees noted the reasons for the Fund’s underperformance, while also noting that the Fund has a performance fee structure that results in lower management fees during periods of underperformance, and the steps the Adviser had taken or was taking to improve performance.
· For Janus Henderson Emerging Markets Fund, the Trustees noted that the Fund’s performance was in the third Broadridge quartile for the 36 months ended May 31, 2022 and the third Broadridge quartile for the 12 months ended May 31, 2022. The Trustees noted the reasons for the Fund’s underperformance and the steps the Adviser had taken or was taking to improve performance.
· For Janus Henderson European Focus Fund, the Trustees noted that the Fund’s performance was in the first Broadridge quartile for the 36 months ended May 31, 2022 and the second Broadridge quartile for the 12 months ended May 31, 2022.
· For Janus Henderson Global Equity Income Fund, the Trustees noted that the Fund’s performance was in the third Broadridge quartile for the 36 months ended May 31, 2022 and the first Broadridge quartile for the 12 months ended May 31, 2022. The Trustees noted the reasons for the Fund’s underperformance, the steps the Adviser had taken or was taking to improve performance, and that the performance trend was improving.
· For Janus Henderson Global Life Sciences Fund, the Trustees noted that the Fund’s performance was in the third Broadridge quartile for the 36 months ended May 31, 2022 and the second Broadridge quartile for the 12 months ended May 31, 2022. The Trustees noted the reasons for the Fund’s underperformance, the steps the Adviser had taken or was taking to improve performance, and that the performance trend was improving.
· For Janus Henderson Global Sustainable Equity Fund, the Trustees noted that the Fund’s performance was in the second Broadridge quartile for the 12 months ended May 31, 2022. The Trustees noted that 36 month-end performance was not yet available.
Janus Henderson Enterprise Fund
Additional Information (unaudited)
· For Janus Henderson Global Real Estate Fund, the Trustees noted that the Fund’s performance was in the second Broadridge quartile for the 36 months ended May 31, 2022 and the bottom Broadridge quartile for the 12 months ended May 31, 2022.
· For Janus Henderson Global Research Fund, the Trustees noted that the Fund’s performance was in the second Broadridge quartile for the 36 months ended May 31, 2022 and the first Broadridge quartile for the 12 months ended May 31, 2022.
· For Janus Henderson Global Select Fund, the Trustees noted that the Fund’s performance was in the first Broadridge quartile for the 36 months ended May 31, 2022 and the first Broadridge quartile for the 12 months ended May 31, 2022.
· For Janus Henderson Global Technology and Innovation Fund, the Trustees noted that the Fund’s performance was in the second Broadridge quartile for the 36 months ended May 31, 2022 and the second Broadridge quartile for the 12 months ended May 31, 2022.
· For Janus Henderson International Opportunities Fund, the Trustees noted that the Fund’s performance was in the bottom Broadridge quartile for the 36 months ended May 31, 2022 and the third Broadridge quartile for the 12 months ended May 31, 2022. The Trustees noted the reasons for the Fund’s underperformance and the steps the Adviser had taken or was taking to improve performance.
· For Janus Henderson Overseas Fund, the Trustees noted that the Fund’s performance was in the first Broadridge quartile for the 36 months ended May 31, 2022 and the first Broadridge quartile for the 12 months ended May 31, 2022.
· For Janus Henderson Responsible International Dividend Fund (formerly the Janus Henderson Dividend & Income Builder Fund), the Trustees noted that the Fund’s performance was in the bottom Broadridge quartile for the 36 months ended May 31, 2022 and the bottom Broadridge quartile for the 12 months ended May 31, 2022. The Trustees noted the reasons for the Fund’s underperformance and the steps the Adviser had taken or was taking to improve performance.
Money Market Funds
· For Janus Henderson Government Money Market Fund, the Trustees noted that the Fund’s performance was in the third Broadridge quartile for the 36 months ended May 31, 2022 and the bottom Broadridge quartile for the 12 months ended May 31, 2022. The Trustees noted the reasons for the Fund’s underperformance and the steps the Adviser had taken or was taking to improve performance.
· For Janus Henderson Money Market Fund, the Trustees noted that the Fund’s performance was in the third Broadridge quartile for the 36 months ended May 31, 2022 and the bottom Broadridge quartile for the 12 months ended May 31, 2022. The Trustees noted the reasons for the Fund’s underperformance and the steps the Adviser had taken or was taking to improve performance.
Multi-Asset Funds
· For Janus Henderson Adaptive Global Allocation Fund, the Trustees noted that the Fund’s performance was in bottom Broadridge quartile for the 36 months ended May 31, 2022 and the second Broadridge quartile for the 12 months ended May 31, 2022. The Trustees noted the reasons for the Fund’s underperformance, the steps the Adviser had taken or was taking to improve performance, and that the performance trend was improving.
· For Janus Henderson Balanced Fund, the Trustees noted that the Fund’s performance was in the first Broadridge quartile for the 36 months ended May 31, 2022 and the first Broadridge quartile for the 12 months ended May 31, 2022.
U.S. Equity Funds
· For Janus Henderson Adaptive Risk Managed U.S. Equity Fund, the Trustees noted that the Fund’s performance was in the bottom Broadridge quartile for the 36 months ended May 31, 2022 and the second Broadridge quartile for the 12 months ended May 31, 2022. The Trustees noted the reasons for the Fund’s underperformance, the steps the Adviser had taken or were taking to improve performance, and that the performance trend was improving.
Janus Henderson Enterprise Fund
Additional Information (unaudited)
· For Janus Henderson Contrarian Fund, the Trustees noted that the Fund’s performance was in the first Broadridge quartile for the 36 months ended May 31, 2022 and the bottom Broadridge quartile for the 12 months ended May 31, 2022.
· For Janus Henderson Enterprise Fund, the Trustees noted that the Fund’s performance was in the second Broadridge quartile for the 36 months ended May 31, 2022 and the first Broadridge quartile for the 12 months ended May 31, 2022.
· For Janus Henderson Forty Fund, the Trustees noted that the Fund’s performance was in the third Broadridge quartile for the 36 months ended May 31, 2022 and the bottom Broadridge quartile for the 12 months ended May 31, 2022. The Trustees noted the reasons for the Fund’s underperformance and the steps the Adviser had taken or was taking to improve performance.
· For Janus Henderson Growth and Income Fund, the Trustees noted that the Fund’s performance was in the bottom Broadridge quartile for the 36 months ended May 31, 2022 and the first Broadridge quartile for the 12 months ended May 31, 2022. The Trustees noted the reasons for the Fund’s underperformance, the steps the Adviser had taken or was taking to improve performance, and that the performance trend was improving.
· For Janus Henderson Mid Cap Value Fund, the Trustees noted that the Fund’s performance was in the bottom Broadridge quartile for the 36 months ended May 31, 2022 and the second Broadridge quartile for the 12 months ended May 31, 2022. The Trustees noted the reasons for the Fund’s underperformance, while also noting that the Fund has a performance fee structure that results in lower management fees during periods of underperformance, the steps the Adviser had taken or was taking to improve performance, and that the performance trend was improving.
· For Janus Henderson Research Fund, the Trustees noted that the Fund’s performance was in the third Broadridge quartile for the 36 months ended May 31, 2022 and the third Broadridge quartile for the 12 months ended May 31, 2022. The Trustees noted the reasons for the Fund’s underperformance, while also noting that the Fund has a performance fee structure that results in lower management fees during periods of underperformance and the steps the Adviser had taken or was taking to improve performance.
· For Janus Henderson Small Cap Value Fund, the Trustees noted that the Fund’s performance was in the bottom Broadridge quartile for the 36 months ended May 31, 2022 and the second Broadridge quartile for the 12 months ended May 31, 2022. The Trustees noted the reasons for the Fund’s underperformance, while also noting that the Fund has a performance fee structure that results in lower management fees during periods of underperformance, the steps the Adviser had taken or was taking to improve performance, and that the performance trend was improving.
· For Janus Henderson Small-Mid Cap Value Fund, the Trustees noted that the Fund’s performance was in the bottom Broadridge quartile for the 36 months ended May 31, 2022 and the second Broadridge quartile for the 12 months ended May 31, 2022. The Trustees noted the reasons for the Fund’s underperformance, while also noting that the Fund has a performance fee structure that results in lower management fees during periods of underperformance, the steps the Adviser had taken or was taking to improve performance, and that the performance trend is improving.
· For Janus Henderson Triton Fund, the Trustees noted that the Fund’s performance was in the bottom Broadridge quartile for the 36 months ended May 31, 2022 and the second Broadridge quartile for the 12 months ended May 31, 2022. The Trustees noted the reasons for the Fund’s underperformance, the steps the Adviser had taken or was taking to improve performance, and that the performance trend was improving.
· For Janus Henderson Venture Fund, the Trustees noted that the Fund’s performance was in the bottom Broadridge quartile for the 36 months ended May 31, 2022 and the second Broadridge quartile for the 12 months ended May 31, 2022. The Trustees noted the reasons for the Fund’s underperformance, the steps the Adviser had taken or was taking to improve performance, and that the performance trend was improving.
In consideration of each Janus Henderson Fund’s performance, the Trustees concluded that, taking into account the factors relevant to performance, as well as other considerations, including steps taken to improve performance, as applicable, the Janus Henderson Fund’s performance warranted continuation of such Janus Henderson Fund’s investment advisory agreement.
Janus Henderson Enterprise Fund
Additional Information (unaudited)
Costs of Services Provided
The Trustees examined information regarding the fees and expenses of each Janus Henderson Fund in comparison to similar information for other comparable funds as provided by Broadridge, an independent data provider. They also reviewed an analysis of that information provided by their independent fee consultant. The independent fee consultant provided its belief that the management fees charged by the Adviser to each of the Janus Henderson Funds under the current investment advisory and administration agreements are reasonable in relation to the services provided by the Adviser. The independent fee consultant found: (1) the total expenses and management fees of the Janus Henderson Funds to be reasonable relative to other comparable mutual funds; (2) the total expenses, on average, were 6% under the average total expenses of the respective Broadridge peer group; and (3) the management fees for the Janus Henderson Funds, on average, were 5% under the average management fees for the respective Broadridge peer group. The Trustees also considered the total expenses for each share class of each Janus Henderson Fund compared to the average total expenses for its Broadridge Expense Group and to average total expenses for its Broadridge Expense Universe.
For Janus Henderson Funds with three or more years of performance history, the independent fee consultant also performed a systematic “focus list” analysis of expenses which assessed fund fees in the context of fund performance being delivered. Based on this analysis, the independent fee consultant found that the combination of service quality/performance and expenses on these individual Janus Henderson Funds was reasonable in light of performance trends, performance histories, changes in portfolio management, relative average net asset levels, and the existence of performance fees, breakpoints, and/or expense waivers on such Janus Henderson Funds.
The Trustees considered the methodology used by the Adviser in determining compensation payable to portfolio managers, the competitive environment for investment management talent, and the competitive market for mutual funds in different distribution channels.
The Trustees also reviewed management fees charged by the Adviser to comparable separate account clients and to comparable non-affiliated funds subadvised by the Adviser (for which the Adviser provides only or primarily portfolio management services). Although in most instances subadvisory and separate account fee rates for various investment strategies were lower than management fee rates for Janus Henderson Funds having a similar strategy, the Trustees considered that the Adviser noted that, under the terms of the management agreements with the Janus Henderson Funds, the Adviser performs significant additional services for the Janus Henderson Funds that it does not provide to those other clients, including administration services, oversight of the Janus Henderson Funds’ other service providers, Trustee support, regulatory compliance and numerous other services, and that, in serving the Janus Henderson Funds, the Adviser assumes many legal risks and other costs that it does not assume in servicing its other clients. Moreover, the Trustees noted that the independent fee consultant found that: (1) the management fees the Adviser charges to the Janus Henderson Funds are reasonable in relation to the management fees the Adviser charges to funds subadvised by the Adviser and to the fees the Adviser charges to its institutional separate account clients; (2) these subadvised and institutional separate accounts have different service and infrastructure needs and operate in markets very different from the retail fund market; (3) Janus Henderson mutual fund investors enjoy reasonable fees relative to the fees charged in these other markets; and (4) as part of its 2022 review, 9 of 11 Janus Henderson Funds have lower management fees than similar funds subadvised by the Adviser. The Trustees noted that for the two Janus Henderson Funds that did not, management fees for each were under the average of its 15(c) peer group.
The Trustees considered the fees for each Janus Henderson Fund for its fiscal year ended in 2021 and noted the following with regard to each Janus Henderson Fund’s total expenses, net of applicable fee waivers (the Fund’s “total expenses”) as reflected in the comparative information provided by Broadridge:
Asset Allocation Funds
· For Janus Henderson Global Allocation Fund – Conservative, the Trustees noted that, although the Fund’s total expenses exceeded the peer group average for certain share classes, overall the Fund’s total expenses were reasonable. The Trustees also noted that the Adviser has contractually agreed to limit the Fund’s expenses.
· For Janus Henderson Global Allocation Fund – Growth, the Trustees noted that, although the Fund’s total expenses exceeded the peer group average for certain share classes, overall the Fund’s total expenses were reasonable. The Trustees also noted that the Adviser has contractually agreed to limit the Fund’s expenses, although this limit did not apply because the Fund’s total expenses as shown were below the applicable fee limit.
Janus Henderson Enterprise Fund
Additional Information (unaudited)
· For Janus Henderson Global Allocation Fund – Moderate, the Trustees noted that, although the Fund’s total expenses exceeded the peer group average for one share class, overall the Fund’s total expenses were reasonable. The Trustees also noted that the Adviser has contractually agreed to limit the Fund’s expenses.
Fixed-Income Funds
· For Janus Henderson Absolute Return Income Opportunities Fund, the Trustees noted that, although the Fund’s total expenses exceeded the peer group average for certain share classes, overall the Fund’s total expenses were reasonable. The Trustees also noted that the Adviser has contractually agreed to limit the Fund’s expenses.
· For Janus Henderson Developed World Bond Fund, the Trustees noted that, although the Fund’s total expenses exceeded the peer group average for one share class, overall the Fund’s total expenses were reasonable. The Trustees also noted that the Adviser has contractually agreed to limit the Fund’s expenses.
· For Janus Henderson Flexible Bond Fund, the Trustees noted that, although the Fund’s total expenses exceeded the peer group average for certain share classes, overall the Fund’s total expenses were reasonable. The Trustees also noted that the Adviser has contractually agreed to limit the Fund’s expenses, although this limit did not apply because the Fund’s total expenses as shown were below the applicable fee limit.
· For Janus Henderson Global Bond Fund, the Trustees noted that, although the Fund’s total expenses exceeded the peer group average for certain share classes, overall the Fund’s total expenses were reasonable. The Trustees also noted that the Adviser has contractually agreed to limit the Fund’s expenses.
· For Janus Henderson High-Yield Fund, the Trustees noted that, although the Fund’s total expenses exceeded the peer group average for certain share classes, overall the Fund’s total expenses were reasonable. The Trustees also noted that the Adviser has contractually agreed to limit the Fund’s expenses.
· For Janus Henderson Multi-Sector Income Fund, the Trustees noted that, although the Fund’s total expenses exceeded the peer group average for certain share classes, overall the Fund’s total expenses were reasonable. The Trustees also noted that the Adviser has contractually agreed to limit the Fund’s expenses.
· For Janus Henderson Short Duration Flexible Bond Fund, the Trustees noted that, although the Fund’s total expenses exceeded the peer group average for certain share classes, overall the Fund’s total expenses were reasonable. The Trustees also noted that the Adviser has contractually agreed to limit the Fund’s expenses.
Global and International Equity Funds
· For Janus Henderson Asia Equity Fund, the Trustees noted that, although the Fund’s total expenses exceeded the peer group average for certain share classes, overall the Fund’s total expenses were reasonable. The Trustees also noted that the Adviser has contractually agreed to limit the Fund’s expenses.
· For Janus Henderson Emerging Markets Fund, the Trustees noted that, although the Fund’s total expenses exceeded the peer group average for certain share classes, overall the Fund’s total expenses were reasonable. The Trustees also noted that the Adviser has contractually agreed to limit the Fund’s expenses.
· For Janus Henderson European Focus Fund, the Trustees noted that, although the Fund’s total expenses exceeded the peer group average for one share class, overall the Fund’s expenses were reasonable. The Trustees also noted that the Adviser has contractually agreed to limit the Fund’s expenses.
· For Janus Henderson Global Equity Income Fund, the Trustees noted that, although the Fund’s total expenses exceeded the peer group average for one share class, overall the Fund’s total expenses were reasonable. The Trustees also noted that the Adviser has contractually agreed to limit the Fund’s expenses, although this limit did not apply because the Fund’s total expenses as shown were below the applicable fee limit.
· For Janus Henderson Global Life Sciences Fund, the Trustees noted that the Fund’s total expenses were below the peer group average for all share classes.
· For Janus Henderson Global Real Estate Fund, the Trustees noted that, although the Fund’s total expenses exceeded the peer group average for certain share classes, overall the Fund’s total expenses were reasonable. The Trustees also noted that the Adviser has contractually agreed to limit the Fund’s expenses, although this limit did not apply because the Fund’s total expenses as shown were below the applicable fee limit.
Janus Henderson Enterprise Fund
Additional Information (unaudited)
· For Janus Henderson Global Research Fund, the Trustees noted that, although the Fund’s total expenses exceeded the peer group average for one share class, overall the Fund’s total expenses were reasonable. The Trustees also noted that the Adviser has contractually agreed to limit the Fund’s expenses, although this limit did not apply because the Fund’s total expenses as shown were below the applicable fee limit.
· For Janus Henderson Global Select Fund, the Trustees noted that, although the Fund’s total expenses exceeded the peer group average for certain share classes, overall the Fund’s total expenses were reasonable. The Trustees also noted that the Adviser has contractually agreed to limit the Fund’s expenses.
· For Janus Henderson Global Sustainable Equity Fund, the Trustees noted that, although the Fund’s total expenses exceeded the peer group average for certain share classes, overall the Fund’s expenses were reasonable. The Trustees also noted that the Adviser has contractually agreed to limit the Fund’s expenses.
· For Janus Henderson Global Technology and Innovation Fund, the Trustees noted that the Fund’s total expenses were below the peer group average for all share classes.
· For Janus Henderson International Opportunities Fund, the Trustees noted that, although the Fund’s total expenses exceeded the peer group average for certain share classes, overall the Fund’s expenses were reasonable. The Trustees also noted that the Adviser has contractually agreed to limit the Fund’s expenses.
· For Janus Henderson Overseas Fund, the Trustees noted that although the Fund’s total expenses exceeded the peer group average for certain share classes, overall the Fund’s total expenses were reasonable. The Trustees also noted that the Adviser has contractually agreed to limit the Fund’s expenses, although this limit did not apply because the Fund’s total expenses as shown were below the applicable fee limit.
· For Janus Henderson Responsible International Dividend Fund (formerly the Janus Henderson Dividend & Income Builder Fund), the Trustees noted that, although the Fund’s total expenses exceeded the peer group for one share class, overall the Fund’s total expenses were reasonable. The Trustees also noted that the Adviser has contractually agreed to limit the Fund’s expenses.
Money Market Funds
· For Janus Henderson Government Money Market Fund, the Trustees noted that the Fund’s total expenses were below the peer group average for all share classes.
· For Janus Henderson Money Market Fund, the Trustees noted that the Fund’s total expenses were below the peer group average for all share classes.
Multi-Asset Funds
· For Janus Henderson Adaptive Global Allocation Fund, the Trustees noted that, that the Fund’s total expenses were below the peer group average for all share classes.
· For Janus Henderson Balanced Fund, the Trustees noted that, although the Fund’s total expenses exceeded the peer group average for certain share classes, overall the Fund’s total expenses were reasonable. The Trustees also noted that the Adviser has contractually agreed to limit the Fund’s expenses, although this limit did not apply because the Fund’s total expenses as shown were below the applicable fee limit.
U.S. Equity Funds
· For Janus Henderson Adaptive Risk Managed U.S. Equity Fund, the Trustees noted that, although the Fund’s total expenses exceeded the peer group average for certain share classes, overall the Fund’s total expenses were reasonable. The Trustees also noted that the Adviser has contractually agreed to limit the Fund’s expenses, although this limit did not apply because the Fund’s total expenses as shown were below the applicable fee limit.
· For Janus Henderson Contrarian Fund, the Trustees noted that, although the Fund’s total expenses exceeded the peer group average for all share classes, overall the Fund’s total expenses were reasonable. The Trustees also noted that the Adviser had contractually agreed to limit the Fund’s expenses.
· For Janus Henderson Enterprise Fund, the Trustees noted that, although the Fund’s total expenses exceeded the peer group average for certain share classes, overall the Fund’s total expenses were reasonable. The Trustees also noted that the Adviser has contractually agreed to limit the Fund’s expenses, although this limit did not apply because the Fund’s total expenses as shown were below the applicable fee limit.
Janus Henderson Enterprise Fund
Additional Information (unaudited)
· For Janus Henderson Forty Fund, the Trustees noted that, although the Fund’s total expenses exceeded the peer group average for certain share classes, overall the Fund’s total expenses were reasonable. The Trustees also noted that the Adviser has contractually agreed to limit the Fund’s expenses, although this limit did not apply because the Fund’s total expenses as shown were below the applicable fee limit.
· For Janus Henderson Growth and Income Fund, the Trustees noted that, although the Fund’s total expenses exceeded the peer group average for certain share classes, overall the Fund’s total expenses were reasonable. The Trustees also noted that the Adviser has contractually agreed to limit the Fund’s expenses, although this limit did not apply because the Fund’s total expenses as shown were below the applicable fee limit.
· For Janus Henderson Mid Cap Value Fund, the Trustees noted that the Fund’s total expenses were below the peer group average for all share classes.
· For Janus Henderson Research Fund, the Trustees noted that, although the Fund’s total expenses exceeded the peer group average for certain share classes, overall the Fund’s total expenses were reasonable. The Trustees also noted that the Adviser has contractually agreed to limit the Fund’s expenses.
· For Janus Henderson Small Cap Value Fund, the Trustees noted that, although the Fund’s total expenses exceeded the peer group average for one share class, overall the Fund’s total expenses were reasonable. The Trustees also noted that the Adviser has contractually agreed to limit the Fund’s expenses, although this limit did not apply because the Fund’s total expenses as shown were below the applicable fee limit.
· For Janus Henderson Small-Mid Cap Value Fund, the Trustees noted that the Fund’s total expenses were below the peer group average for all share classes.
· For Janus Henderson Triton Fund, the Trustees noted that, although the Fund’s total expenses exceeded the peer group average for one share class, overall the Fund’s total expenses were reasonable. The Trustees also noted that the Adviser has contractually agreed to limit the Fund’s expenses, although this limit did not apply because the Fund’s total expenses as shown were below the applicable fee limit.
· For Janus Henderson Venture Fund, the Trustees noted that although the Fund’s total expenses exceeded the peer group average for one share class, overall the Fund’s total expenses were reasonable. The Trustees also noted that the Adviser has contractually agreed to limit the Fund’s expenses, although this limit did not apply because the Fund’s total expenses as shown were below the applicable fee limit.
The Trustees reviewed information on the overall profitability to the Adviser and its affiliates from their relationships with the Janus Henderson Funds, and considered profitability data of other publicly traded mutual fund advisers. The Trustees recognized that profitability comparisons among fund managers are difficult because of the variation in the type of comparative information that is publicly available, and the profitability of any fund manager is affected by numerous factors, including the organizational structure of the particular fund manager, differences in complex size, difference in product mix, difference in types of business (mutual fund, institutional and other), differences in the types of funds and other accounts it manages, possible other lines of business, the methodology for allocating expenses and the fund manager’s capital structure and cost of capital.
Additionally, the Trustees considered the estimated profitability to the Adviser from the investment management services it provided to each Janus Henderson Fund. In their review, the Trustees considered whether the Adviser receive adequate incentives and resources to manage the Janus Henderson Funds effectively. In reviewing profitability, the Trustees noted that the estimated profitability for an individual Janus Henderson Fund is necessarily a product of the allocation methodology utilized by the Adviser to allocate its expenses as part of the estimated profitability calculation. In this regard, the Trustees noted that the independent fee consultant found as part of its 2022 review that (1) the expense allocation methodology and rationales utilized by the Adviser were reasonable and (2) no clear correlation exists between expense allocations and operating margins. The Trustees also considered that the estimated profitability for an individual Janus Henderson Fund was influenced by a number of factors, including not only the allocation methodology selected, but also the presence of fee waivers and expense caps, and whether the Janus Henderson Fund’s investment management agreement contained breakpoints or a performance fee component. The Trustees determined, after taking into account these factors, among others, that the Adviser’s estimated profitability with respect to each Janus Henderson Fund was not unreasonable in relation to the services provided, and that the variation in the range of such estimated profitability among the Janus Henderson Funds was not a material factor in the Board’s approval of the reasonableness of any Janus Henderson Fund’s investment management fees.
Janus Henderson Enterprise Fund
Additional Information (unaudited)
The Trustees concluded that the management fees payable by each Janus Henderson Fund to the Adviser were reasonable in relation to the nature, extent, and quality of the services provided, taking into account the fees charged by other advisers for managing comparable mutual funds with similar strategies, the fees the Adviser charges to other clients, and, as applicable, the impact of fund performance on management fees payable by the Janus Henderson Funds. The Trustees also concluded that each Janus Henderson Fund’s total expenses were reasonable, taking into account the size of the Janus Henderson Fund, the quality of services provided by the Adviser, the investment performance of the Janus Henderson Fund, and any expense limitations agreed to or provided by the Adviser.
Economies of Scale
The Trustees considered information about the potential for the Adviser to realize economies of scale as the assets of the Janus Henderson Funds increase. They noted that their independent fee consultant published a report to the Trustees in June 2022 which provided its research and analysis into economies of scale. They also noted that, although many Janus Henderson Funds pay advisory fees at a fixed base rate as a percentage of net assets, without any breakpoints or performance fees, their independent fee consultant concluded that 75% of these Janus Henderson Funds’ have contractual management fees (gross of waivers) below their Broadridge Expense Group averages. The Trustees also noted the following from the independent fee consultant’s report: (1) that 31% of Janus Henderson Funds had management fee breakpoints in place whereby investors pay lower management fees as fund AUM increases; (2) that 29% of Janus Henderson Funds have low flat-rate fees and performance fees where the Adviser is incentivized to invest in resources which drive Janus Henderson Fund performance; and (3) that 39% of Janus Henderson Funds have low flat-rate fees versus peers where investors pay low fixed fees when the Janus Henderson Fund is small/midsized and higher fees when the Janus Henderson Fund grows in assets. The Trustees also noted that the Janus Henderson Funds share directly in economies of scale through the significant investments made by the Adviser and its affiliates related to services provided to the Funds and the lower charges of third-party service providers that are based in part on the combined scale of all of the Janus Henderson Funds.
The Trustees also considered the independent fee consultant’s conclusion that, given the limitations of various analytical approaches to economies of scale and their conflicting results, it is difficult to analytically confirm or deny the existence of economies of scale in the Janus Henderson complex. In this regard, the independent consultant concluded that (1) to the extent there were economies of scale at the Adviser, the Adviser’s general strategy of setting fixed management fees below peers appeared to share any such economies with investors even on smaller Janus Henderson Funds which have not yet achieved those economies and (2) by setting lower fixed fees from the start on these Janus Henderson Funds, the Adviser appeared to be investing to increase the likelihood that these Janus Henderson Funds will grow to a level to achieve any economies of scale that may exist. Further, the independent fee consultant provided its belief that Janus Henderson Fund investors are well-served by the fee levels and performance fee structures in place on the Janus Henderson Funds in light of any economies of scale that may be present at the Adviser.
Based on all of the information reviewed, including the recent and past research and analysis conducted by the Trustees’ independent fee consultant, the Trustees concluded that the current fee structure of each Janus Henderson Fund was reasonable and that the current rates of fees do reflect a sharing between the Adviser and the Janus Henderson Fund of any economies of scale that may be present at the current asset level of the Janus Henderson Fund.
Other Benefits to the Adviser
The Trustees also considered benefits that accrue to the Adviser and its affiliates from their relationships with the Janus Henderson Funds. They recognized that two affiliates of the Adviser separately serve the Janus Henderson Funds as transfer agent and distributor, respectively, and the transfer agent receives compensation directly from the non-money market Janus Henderson Funds for services provided, and that such compensation contributes to the overall profitability of the Adviser and its affiliates that results from their relationship with the Janus Henderson Funds. The Trustees also considered the Adviser’s past and proposed use of commissions paid by the Janus Henderson Funds on portfolio brokerage transactions to obtain proprietary and third-party research products and services benefiting the Janus Henderson Fund and/or other clients of the Adviser and/or the Adviser. The Trustees concluded that the Adviser’s use of these types of client commission arrangements to obtain proprietary and third-party research products and services was consistent with regulatory requirements and guidelines and was likely to benefit each Janus Henderson Fund. The Trustees also concluded that, other than the services provided by the Adviser and its affiliates pursuant to the agreements and the fees to be paid by each Janus Henderson Fund therefor, the Janus Henderson
Janus Henderson Enterprise Fund
Additional Information (unaudited)
Funds and the Adviser may potentially benefit from their relationship with each other in other ways. They concluded that the Adviser and its affiliates share directly in economies of scale through the lower charges of third-party service providers that are based in part on the combined scale of the Janus Henderson Funds and other clients serviced by the Adviser and its affiliates. They also concluded that the Adviser benefits from the receipt of research products and services acquired through commissions paid on portfolio transactions of the Janus Henderson Funds and that the Janus Henderson Funds benefit from the Adviser’s receipt of those products and services as well as research products and services acquired through commissions paid by other clients of the Adviser. They further concluded that the success of any Janus Henderson Fund could attract other business to the Adviser or other Janus Henderson Funds, and that the success of the Adviser could enhance the Adviser’s ability to serve the Janus Henderson Funds.
Janus Henderson Enterprise Fund
Liquidity Risk Management Program (unaudited)
Liquidity Risk Management Program
Rule 22e-4 under the Investment Company Act of 1940, as amended (the “Liquidity Rule”), requires open-end funds (but not money market funds) to adopt and implement a written liquidity risk management program (the “LRMP”) that is reasonably designed to assess and manage liquidity risk, which is the risk that a fund could not meet redemption requests without significant dilution of remaining investors’ interest in the fund. The Fund has implemented a LRMP, which incorporates the following elements: (i) assessment, management, and periodic review of liquidity risk; (ii) classification of portfolio holdings; (iii) the establishment and monitoring of a highly liquid investment minimum, as applicable; (iv) a 15% limitation on a Fund’s illiquid investments; (v) redemptions in-kind; and (vi) board oversight.
The Trustees of the Fund (the “Trustees”) have designated Janus Henderson Investors US LLC, the Fund’s investment adviser (the “Adviser”), as the Program Administrator for the LRMP responsible for administering the LRMP and carrying out the specific responsibilities of the LRMP. A working group comprised of various teams within the Adviser’s business is responsible for administering the LRMP and carrying out the specific responsibilities of different aspects of the LRMP (the “Liquidity Risk Working Group”). In assessing each Fund’s liquidity risk, the Liquidity Risk Working Group periodically considers, as relevant, factors including (i) the liquidity of a Fund’s portfolio investments during normal and reasonably foreseeable stressed conditions; (ii) whether a Fund’s investment strategy is appropriate for an open-end fund; (iii) the extent to which a Fund’s strategy involves a relatively concentrated portfolio or large positions in any issuer; (iv) a Fund’s use of borrowing for investment purposes; and (v) a Fund’s use of derivatives.
The Liquidity Rule requires the Trustees to review at least annually a written report provided by the Program Administrator that addresses the operation of the LRMP and assesses its adequacy and the effectiveness of its implementation, including, if applicable, the operation of the highly liquid investment minimum, and any material changes to the LRMP (the “Program Administrator Report”). At a meeting held on March 15, 2023, the Adviser provided the Program Administrator Report to the Trustees which covered the operation of the LRMP from January 1, 2022 through December 31, 2022 (the “Reporting Period”).
The Program Administrator Report discussed the operation and effectiveness of the LRMP during the Reporting Period. Among other things, the Program Administrator Report indicated that there were no material changes to the LRMP during the Reporting Period, although there were certain methodology adjustments implemented relating to a change in data provider. Additionally, the findings presented in the Program Administrator Report indicated that the LRMP operated adequately during the Reporting Period. These findings included that the Fund was able to meet redemptions during the normal course of business during the Reporting Period. The Program Administrator Report also stated that the Fund did not exceed the 15% limit on illiquid assets during the Reporting Period, that the Fund held primarily highly liquid assets, and was considered to be a primarily highly liquid fund during the Reporting Period. Also included among the Program Administrator Report’s findings was the determination that the Fund’s investment strategy remains appropriate for an open-end fund. In addition, the Adviser expressed its belief in the Program Administrator Report that the LRMP is reasonably designed and adequate to assess and manage the Fund’s liquidity risk, considering the Fund’s particular risks and circumstances, and includes policies and procedures reasonably designed to implement each required component of the Liquidity Rule.
There can be no assurance that the LRMP will achieve its objectives in the future. Please refer to your Fund’s prospectus for more information regarding the risks to which an investment in the Fund may be subject.
Janus Henderson Enterprise Fund
Useful Information About Your Fund Report (unaudited)
Performance Overviews
Performance overview graphs compare the performance of a hypothetical $10,000 investment in the Fund with one or more widely used market indices. When comparing the performance of the Fund with an index, keep in mind that market indices are not available for investment and do not reflect deduction of expenses.
Average annual total returns are quoted for a Fund with more than one year of performance history. Average annual total return is calculated by taking the growth or decline in value of an investment over a period of time, including reinvestment of dividends and distributions, then calculating the annual compounded percentage rate that would have produced the same result had the rate of growth been constant throughout the period. Average annual total return does not reflect the deduction of taxes that a shareholder would pay on Fund distributions or redemptions of Fund shares.
Cumulative total returns are quoted for a Fund with less than one year of performance history. Cumulative total return is the growth or decline in value of an investment over time, independent of the period of time involved. Cumulative total return does not reflect the deduction of taxes that a shareholder would pay on Fund distributions or redemptions of Fund shares.
Pursuant to federal securities rules, expense ratios shown in the performance chart reflect subsidized (if applicable) and unsubsidized ratios. The total annual fund operating expenses ratio is gross of any fee waivers, reflecting the Fund’s unsubsidized expense ratio. The net annual fund operating expenses ratio (if applicable) includes contractual waivers of the Adviser and reflects the Fund’s subsidized expense ratio. Ratios may be higher or lower than those shown in the “Financial Highlights” in this report.
Schedule of Investments
Following the performance overview section is the Fund’s Schedule of Investments. This schedule reports the types of securities held in the Fund on the last day of the reporting period. Securities are usually listed by type (common stock, corporate bonds, U.S. Government obligations, etc.) and by industry classification (banking, communications, insurance, etc.). Holdings are subject to change without notice.
The value of each security is quoted as of the last day of the reporting period. The value of securities denominated in foreign currencies is converted into U.S. dollars.
If the Fund invests in foreign securities, it will also provide a summary of investments by country. This summary reports the Fund exposure to different countries by providing the percentage of securities invested in each country. The country of each security represents the country of risk. A company may be allocated to a country based on other factors such as location of the company’s principal office, the location of the principal trading market for the company’s securities, or the country where a majority of the company’s revenues are derived. The Fund’s Schedule of Investments relies upon the industry group and country classifications published by Bloomberg and/or MSCI Inc.
Tables listing details of individual forward currency contracts, futures, written options, swaptions, and swaps follow the Fund’s Schedule of Investments (if applicable).
Statement of Assets and Liabilities
This statement is often referred to as the “balance sheet.” It lists the assets and liabilities of the Fund on the last day of the reporting period.
The Fund’s assets are calculated by adding the value of the securities owned, the receivable for securities sold but not yet settled, the receivable for dividends declared but not yet received on securities owned, and the receivable for Fund shares sold to investors but not yet settled. The Fund’s liabilities include payables for securities purchased but not yet settled, Fund shares redeemed but not yet paid, and expenses owed but not yet paid. Additionally, there may be other assets and liabilities such as unrealized gain or loss on forward currency contracts.
The section entitled “Net Assets Consist of” breaks down the components of the Fund’s net assets. Because the Fund must distribute substantially all earnings, you will notice that a significant portion of net assets is shareholder capital.
The last section of this statement reports the net asset value (“NAV”) per share on the last day of the reporting period. The NAV is calculated by dividing the Fund’s net assets for each share class (assets minus liabilities) by the number of shares outstanding.
Janus Henderson Enterprise Fund
Useful Information About Your Fund Report (unaudited)
Statement of Operations
This statement details the Fund’s income, expenses, realized gains and losses on securities and currency transactions, and changes in unrealized appreciation or depreciation of Fund holdings.
The first section in this statement, entitled “Investment Income,” reports the dividends earned from securities and interest earned from interest-bearing securities in the Fund.
The next section reports the expenses incurred by the Fund, including the advisory fee paid to the investment adviser, transfer agent fees and expenses, and printing and postage for mailing statements, financial reports and prospectuses. Expense offsets and expense reimbursements, if any, are also shown.
The last section lists the amounts of realized gains or losses from investment and foreign currency transactions, and changes in unrealized appreciation or depreciation of investments and foreign currency-denominated assets and liabilities. The Fund will realize a gain (or loss) when it sells its position in a particular security. A change in unrealized gain (or loss) refers to the change in net appreciation or depreciation of the Fund during the reporting period. “Net Realized and Unrealized Gain/(Loss) on Investments” is affected both by changes in the market value of Fund holdings and by gains (or losses) realized during the reporting period.
Statements of Changes in Net Assets
These statements report the increase or decrease in the Fund’s net assets during the reporting period. Changes in the Fund’s net assets are attributable to investment operations, dividends and distributions to investors, and capital share transactions. This is important to investors because it shows exactly what caused the Fund’s net asset size to change during the period.
The first section summarizes the information from the Statement of Operations regarding changes in net assets due to the Fund’s investment operations. The Fund’s net assets may also change as a result of dividend and capital gains distributions to investors. If investors receive their dividends and/or distributions in cash, money is taken out of the Fund to pay the dividend and/or distribution. If investors reinvest their dividends and/or distributions, the Fund’s net assets will not be affected.
The reinvestment of dividends and distributions is included under “Capital Share Transactions.” “Capital Shares” refers to the money investors contribute to the Fund through purchases or withdrawals via redemptions. The Fund’s net assets will increase and decrease in value as investors purchase and redeem shares from the Fund.
Financial Highlights
This schedule provides a per-share breakdown of the components that affect the Fund’s NAV for current and past reporting periods as well as total return, asset size, ratios, and portfolio turnover rate.
The first line in the table reflects the NAV per share at the beginning of the reporting period. The next line reports the net investment income/(loss) per share. Following is the per share total of net gains/(losses), realized and unrealized. Per share dividends and distributions to investors are then subtracted to arrive at the NAV per share at the end of the period. The next line reflects the total return for the period. The total return may include adjustments in accordance with generally accepted accounting principles required at the period end for financial reporting purposes. As a result, the total return may differ from the total return reflected for individual shareholder transactions. Also included are ratios of expenses and net investment income to average net assets.
The Fund’s expenses may be reduced through expense offsets and expense reimbursements. The ratios shown reflect expenses before and after any such offsets and reimbursements.
The ratio of net investment income/(loss) summarizes the income earned less expenses, divided by the average net assets of the Fund during the reporting period. Do not confuse this ratio with the Fund’s yield. The net investment income ratio is not a true measure of the Fund’s yield because it does not take into account the dividends distributed to the Fund’s investors.
The next figure is the portfolio turnover rate, which measures the buying and selling activity in the Fund. Portfolio turnover is affected by market conditions, changes in the asset size of the Fund, fluctuating volume of shareholder purchase and redemption orders, the nature of the Fund’s investments, and the investment style and/or outlook of the portfolio manager(s) and/or investment personnel. A 100% rate implies that an amount equal to the value of the entire portfolio was replaced once during the fiscal year; a 50% rate means that an amount equal to the value of half the
Janus Henderson Enterprise Fund
Useful Information About Your Fund Report (unaudited)
portfolio is traded in a year; and a 200% rate means that an amount equal to the value of the entire portfolio is traded every six months.
Janus Henderson Enterprise Fund
Notes
NotesPage1
Janus Henderson Enterprise Fund
Notes
NotesPage2
Janus Henderson Enterprise Fund
Notes
NotesPage3
| | | | | | | | |
| | | | | |

| | | | |
This report is submitted for the general information of shareholders of the Fund. It is not an offer or solicitation for the Fund and is not authorized for distribution to prospective investors unless preceded or accompanied by an effective prospectus. |
Janus Henderson is a trademark of Janus Henderson Group plc or one of its subsidiaries. © Janus Henderson Group plc. Janus Henderson Group is the ultimate parent of Janus Henderson Distributors US LLC. Janus Henderson Distributors US LLC |
| | | | 125-24-93040 05-23 |
| | | | |
| | | |
| | | SEMIANNUAL REPORT March 31, 2023 |
| | |
| | Janus Henderson European Focus Fund |
| | |
| | Janus Investment Fund |
| |
| | | HIGHLIGHTS · Investment strategy behind your fund · Fund performance, characteristics
and holdings |
Table of Contents
Janus Henderson European Focus Fund
| | | | | | |
| | | | | | 
Robert Schramm-Fuchs Portfolio Manager |
| | | |
Janus Henderson European Focus Fund (unaudited)
Fund At A Glance
March 31, 2023
| | | | | | | | | | |
| | | | | | | | | |
| | | | | | | | | |
| | | | | | | | | |
| 5 Top Contributors - Holdings | 5 Top Detractors - Holdings |
| | Average
Weight | | Relative
Contribution | | | Average
Weight | | Relative
Contribution |
| BE Semiconductor Industries NV | 1.89% | | 0.99% | | UPM-Kymmene Oyj | 1.76% | | -0.60% |
| Meyer Burger Technology AG | 1.32% | | 0.70% | | Anglo American PLC | 2.13% | | -0.58% |
| ASM International NV | 1.79% | | 0.69% | | Equinor ASA | 1.34% | | -0.44% |
| KION Group AG | 0.61% | | 0.60% | | Nordic Semiconductor ASA | 1.95% | | -0.42% |
| VAT Group AG | 1.85% | | 0.58% | | RWE AG | 2.35% | | -0.37% |
| | | | | | | |
| 5 Top Contributors - Sectors* | | | | | |
| | | Relative | | Fund | MSCI Europe Index |
| | | Contribution | | Average Weight | Average Weight |
| Information Technology | | 1.85% | | 12.64% | 7.20% |
| Industrials | | 0.99% | | 16.28% | 14.53% |
| Real Estate | | 0.29% | | 0.51% | 0.89% |
| Health Care | | 0.18% | | 10.96% | 15.65% |
| Communication Services | | -0.16% | | 0.20% | 3.41% |
| | | | | | |
| | | | | | |
| 5 Top Detractors - Sectors* | | | | | |
| | | Relative | | Fund | MSCI Europe Index |
| | | Contribution | | Average Weight | Average Weight |
| Materials | | -1.65% | | 9.14% | 7.34% |
| Other** | | -0.61% | | 2.34% | 0.00% |
| Energy | | -0.52% | | 6.68% | 6.50% |
| Utilities | | -0.39% | | 3.07% | 4.22% |
| Consumer Discretionary | | -0.29% | | 9.79% | 10.53% |
| | | | | | | |
| Relative contribution reflects how the portolio's holdings impacted return relative to the benchmark. Cash and securities not held in the portfolio are not shown. For equity portfolios, relative contribution compares the performance of a security in the portfolio to the benchmark's total return, factoring in the difference in weight of that security in the benchmark. Returns are calculated using daily returns and previous day ending weights rolled up by ticker, excluding fixed income securities, gross of advisory fees, may exclude certain derivatives and will differ from actual performance.
Performance attribution reflects returns gross of advisory fees and may differ from actual returns as they are based on end of day holdings. Attribution is calculated by geometrically linking daily returns for the portfolio and index. |
* | Based on sector classification according to the Global Industry Classification Standard (“GICS”) codes, which are the exclusive property and a service mark of MSCI Inc. and Standard & Poor’s. |
** | Not a GICS classified sector. |
Janus Henderson European Focus Fund (unaudited)
Fund At A Glance
March 31, 2023
| | |
5 Largest Equity Holdings - (% of Net Assets) |
Nestle SA (REG) | |
Food Products | 3.9% |
Novo Nordisk A/S | |
Pharmaceuticals | 3.8% |
LVMH Moet Hennessy Louis Vuitton SE | |
Textiles, Apparel & Luxury Goods | 3.6% |
UPM-Kymmene Oyj | |
Paper & Forest Products | 3.1% |
Shell PLC | |
Oil, Gas & Consumable Fuels | 3.0% |
| | 17.4% |
| | | | | | |
Asset Allocation - (% of Net Assets) | |
Common Stocks | | 97.9% | |
Investments Purchased with Cash Collateral from Securities Lending | | 1.9% | |
Preferred Stocks | | 0.6% | |
Other | | (0.4)% |
| | | 100.0% |
| | |
Top Country Allocations - Long Positions - (% of Investment Securities) |
As of March 31, 2023 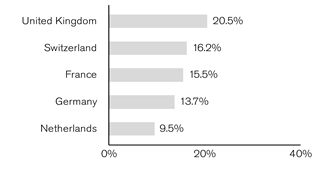
| As of September 30, 2022 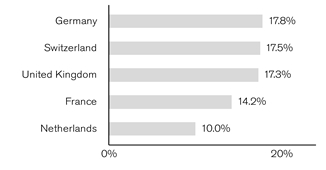
|
Janus Henderson European Focus Fund (unaudited)
Performance
| |
See important disclosures on the next page. |
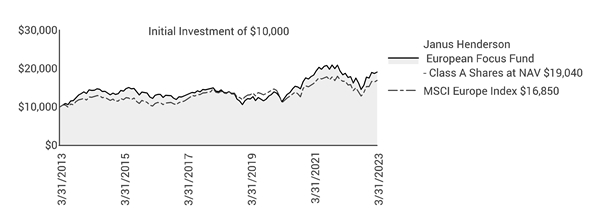
| | | | | | | | | | | | |
| | | | | | | | | | |
| | | | | | | | | | |
Average Annual Total Return - for the periods ended March 31, 2023 | | | Prospectus Expense Ratios |
| | Fiscal
Year-to-Date | One
Year | Five
Year | Ten
Year | Since
Inception* | | | Total Annual Fund
Operating Expenses‡ | Net Annual Fund
Operating Expenses‡ |
Class A Shares at NAV | | 31.53% | 1.70% | 6.43% | 6.65% | 11.30% | | | 1.42% | 1.30% |
Class A Shares at MOP | | 23.98% | -4.16% | 5.18% | 6.02% | 11.00% | | | | |
Class C Shares at NAV | | 31.02% | 0.89% | 5.63% | 5.84% | 10.47% | | | 2.20% | 2.07% |
Class C Shares at CDSC | | 30.02% | -0.11% | 5.63% | 5.84% | 10.47% | | | | |
Class D Shares | | 31.66% | 1.88% | 6.64% | 6.77% | 11.36% | | | 1.30% | 1.11% |
Class I Shares | | 31.67% | 1.94% | 6.71% | 6.93% | 11.50% | | | 1.16% | 1.03% |
Class N Shares | | 31.75% | 2.04% | 6.80% | 6.89% | 11.42% | | | 1.11% | 0.96% |
Class S Shares | | 31.52% | 1.74% | 6.56% | 6.66% | 11.31% | | | 4.77% | 1.47% |
Class T Shares | | 31.54% | 1.72% | 6.54% | 6.71% | 11.33% | | | 1.37% | 1.22% |
MSCI Europe Index | | 31.95% | 1.38% | 4.35% | 5.36% | 5.43% | | | | |
Morningstar Quartile - Class A Shares | | - | 2nd | 1st | 1st | 1st | | | | |
Morningstar Ranking - based on total returns for Europe Stock Funds | | - | 43/94 | 12/90 | 17/71 | 9/55 | | | | |
Returns quoted are past performance and do not guarantee future results; current performance may be lower or higher. Investment returns and principal value will vary; there may be a gain or loss when shares are sold. For the most recent month-end performance call 800.668.0434 (or 800.525.3713 if you hold shares directly with Janus Henderson) or visit janushenderson.com/performance (or janushenderson.com/allfunds if you hold shares directly with Janus Henderson).
Maximum Offering Price (MOP) returns include the maximum sales charge of 5.75%. Net Asset Value (NAV) returns exclude this charge, which would have reduced returns.
CDSC returns include a 1% contingent deferred sales charge (CDSC) on Shares redeemed within 12 months of purchase. Net Asset Value (NAV) returns exclude this charge, which would have reduced returns.
Net expense ratios reflect the expense waiver, if any, contractually agreed to for at least a one-year period commencing on January 27, 2023. This contractual waiver may be terminated or modified only at the discretion of the Board of Trustees.
Janus Henderson European Focus Fund (unaudited)
Performance
Performance may be affected by risks that include those associated with foreign and emerging markets, fixed income securities, high-yield and high-risk securities, undervalued, overlooked and smaller capitalization companies, real estate related securities including Real Estate Investment Trusts (REITs), Environmental, Social and Governance (ESG) factors, non-diversification, portfolio turnover, derivatives, short sales, initial public offerings (IPOs) and potential conflicts of interest. Each product has different risks. Please see the prospectus for more information about risks, holdings and other details.
Returns include reinvestment of all dividends and distributions and do not reflect the deduction of taxes that a shareholder would pay on Fund distributions or redemptions of Fund shares. The returns do not include adjustments in accordance with generally accepted accounting principles required at the period end for financial reporting purposes.
Returns of the Fund shown prior to June 5, 2017, are those for Henderson European Focus Fund (the “Predecessor Fund”), which merged into the Fund after the close of business on June 2, 2017. The Predecessor Fund was advised by Henderson Global Investors (North America) Inc. and subadvised by Henderson Investment Management Limited. Class A Shares, Class C Shares, Class I Shares, and Class R6 Shares of the Predecessor Fund were reorganized into Class A Shares, Class C Shares, Class I Shares, and Class N Shares, respectively, of the Fund. In connection with this reorganization, certain shareholders of the Predecessor Fund who held shares directly with the Predecessor Fund and not through an intermediary had the Class A Shares, Class C Shares, Class I Shares, and Class N Shares of the Fund received in the reorganization automatically exchanged for Class D Shares of the Fund following the reorganization. Class A Shares and Class C Shares of the Predecessor Fund commenced operations with the Predecessor Fund’s inception on August 31, 2001. Class I Shares and Class R6 Shares of the Predecessor Fund commenced operations on March 31, 2009 and November 30, 2015, respectively. Class D Shares, Class S Shares, and Class T Shares commenced operations on June 5, 2017.
Performance of Class A Shares shown for periods prior to June 5, 2017, reflects the performance of Class A Shares of the Predecessor Fund, calculated using the fees and expenses of Class A Shares of the Predecessor Fund, in effect during the periods shown, net of any applicable fee and expense limitations or waivers.
Performance of Class C Shares shown for periods prior to June 5, 2017, reflects the performance of Class C Shares of the Predecessor Fund, calculated using the fees and expenses of Class C Shares of the Predecessor Fund, in effect during the periods shown, net of any applicable fee and expense limitations or waivers.
Performance of Class I Shares shown for periods prior to June 5, 2017, reflects the performance of Class I Shares of the Predecessor Fund, calculated using the fees and expenses of Class I Shares of the Predecessor Fund, in effect during the periods shown, net of any applicable fee and expense limitations or waivers, except that for periods prior to March 31, 2009, performance for Class I Shares reflects the performance of Class A Shares of the Predecessor Fund, calculated using the fees and expenses of Class A Shares of the Predecessor Fund (without sales charges), net of any applicable fee and expense limitations or waivers.
Performance of Class N Shares shown for periods prior to June 5, 2017, reflects the performance of Class R6 Shares of the Predecessor Fund, calculated using the fees and expenses of Class R6 Shares of the Predecessor Fund, in effect during the periods shown, net of any applicable fee and expense limitations or waivers, except that for periods prior to November 30, 2015, performance for Class N Shares reflects the performance of Class A Shares of the Predecessor Fund, calculated using the fees and expenses of Class A Shares of the Predecessor Fund (without sales charges), net of any applicable fee and expense limitations or waivers.
Performance of Class S Shares shown for periods prior to June 5, 2017, reflects the performance of Class A Shares of the Predecessor Fund, calculated using the fees and expenses of Class A Shares of the Predecessor Fund (without sales charges), net of any applicable fee and expense limitations or waivers.
Performance of Class T Shares shown for periods prior to June 5, 2017, reflects the performance of Class A Shares of the Predecessor Fund, calculated using the fees and expenses of Class A Shares of the Predecessor Fund (without sales charges), net of any applicable fee and expense limitations or waivers.
Performance of Class D Shares shown for periods prior to June 5, 2017, reflects the performance of Class A Shares of the Predecessor Fund, calculated using the fees and expenses of Class A Shares of the Predecessor Fund (without sales charges), net of any applicable fee and expense limitations or waivers.
If each share class of the Fund had been available during periods prior to its commencement, the performance shown may have been different. The performance shown for periods following the Fund’s commencement of each share class reflects the fees and expenses of each respective share class, net of any applicable fee and expense limitations or waivers. Please refer to the Fund’s prospectuses for further details concerning historical performance.
Ranking is for the share class shown only; other classes may have different performance characteristics. When an expense waiver is in effect, it may have a material effect on the total return, and therefore the ranking for the period.
© 2023 Morningstar, Inc. All Rights Reserved.
There is no assurance that the investment process will consistently lead to successful investing.
See Notes to Schedule of Investments and Other Information for index definitions.
Index performance does not reflect the expenses of managing a portfolio as an index is unmanaged and not available for direct investment.
See “Useful Information About Your Fund Report.”
See important disclosures on the next page.
Janus Henderson European Focus Fund (unaudited)
Performance
*The Predecessor Fund’s inception date – August 31, 2001
‡ As stated in the prospectus. Net expense ratios reflect the expense waivers, if any, contractually agreed to for at least a one-year period commencing on January 28, 2022. See Financial Highlights for actual expense ratios during the reporting period.
Janus Henderson European Focus Fund (unaudited)
Expense Examples
As a shareholder of the Fund, you incur two types of costs: (1) transaction costs, such as sales charges (loads) on purchase payments (applicable to Class A Shares only); and (2) ongoing costs, including management fees; 12b-1 distribution and shareholder servicing fees; transfer agent fees and expenses payable pursuant to the Transfer Agency Agreement; and other Fund expenses. This example is intended to help you understand your ongoing costs (in dollars) of investing in the Fund and to compare these costs with the ongoing costs of investing in other mutual funds. To do so, compare this 5% hypothetical example with the 5% hypothetical examples that appear in the shareholder reports of the other funds. The example is based upon an investment of $1,000 invested at the beginning of the period and held for the six-months indicated, unless noted otherwise in the table and footnotes below.
Actual Expenses
The information in the table under the heading “Actual” provides information about actual account values and actual expenses. You may use the information in these columns, together with the amount you invested, to estimate the expenses that you paid over the period. Simply divide your account value by $1,000 (for example, an $8,600 account value divided by $1,000 = 8.6), then multiply the result by the number in the appropriate column for your share class under the heading entitled “Expenses Paid During Period” to estimate the expenses you paid on your account during the period.
Hypothetical Example for Comparison Purposes
The information in the table under the heading “Hypothetical (5% return before expenses)” provides information about hypothetical account values and hypothetical expenses based upon the Fund’s actual expense ratio and an assumed rate of return of 5% per year before expenses, which is not the Fund’s actual return. The hypothetical account values and expenses may not be used to estimate the actual ending account balance or expenses you paid for the period. You may use this information to compare the ongoing costs of investing in the Fund and other funds. To do so, compare this 5% hypothetical example with the 5% hypothetical examples that appear in the shareholder reports of the other funds. Additionally, for an analysis of the fees associated with an investment in any share class or other similar funds, please visit www.finra.org/fundanalyzer.
Please note that the expenses shown in the table are meant to highlight your ongoing costs only and do not reflect any transaction costs. These fees are fully described in the Fund’s prospectuses. Therefore, the hypothetical examples are useful in comparing ongoing costs only, and will not help you determine the relative total costs of owning different funds. In addition, if these transaction costs were included, your costs would have been higher.
| | | | | | | | | | | |
| | | | | | | | |
| | | Actual | | Hypothetical
(5% return before expenses) | |
| Beginning
Account
Value
(10/1/22) | Ending
Account
Value
(3/31/23) | Expenses
Paid During
Period
(10/1/22 - 3/31/23)† | | Beginning
Account
Value
(10/1/22) | Ending
Account
Value
(3/31/23) | Expenses
Paid During
Period
(10/1/22 - 3/31/23)† | Net Annualized
Expense Ratio
(10/1/22 - 3/31/23) |
Class A Shares | $1,000.00 | $1,315.30 | $7.85 | | $1,000.00 | $1,018.15 | $6.84 | 1.36% |
Class C Shares | $1,000.00 | $1,310.20 | $12.27 | | $1,000.00 | $1,014.31 | $10.70 | 2.13% |
Class D Shares | $1,000.00 | $1,316.60 | $6.76 | | $1,000.00 | $1,019.10 | $5.89 | 1.17% |
Class I Shares | $1,000.00 | $1,316.70 | $6.35 | | $1,000.00 | $1,019.45 | $5.54 | 1.10% |
Class N Shares | $1,000.00 | $1,317.50 | $5.95 | | $1,000.00 | $1,019.80 | $5.19 | 1.03% |
Class S Shares | $1,000.00 | $1,315.20 | $8.14 | | $1,000.00 | $1,017.90 | $7.09 | 1.41% |
Class T Shares | $1,000.00 | $1,315.40 | $7.56 | | $1,000.00 | $1,018.40 | $6.59 | 1.31% |
† | Expenses Paid During Period are equal to the Net Annualized Expense Ratio multiplied by the average account value over the period, multiplied by 182/365 (to reflect the one-half year period). Expenses in the examples include the effect of applicable fee waivers and/or expense reimbursements, if any. Had such waivers and/or reimbursements not been in effect, your expenses would have been higher. Please refer to the Notes to Financial Statements or the Fund’s prospectuses for more information regarding waivers and/or reimbursements. |
Janus Henderson European Focus Fund
Schedule of Investments (unaudited)
March 31, 2023
| | | | | | | | |
Shares or
Principal Amounts | | | Value | |
Common Stocks– 97.9% | | | |
Aerospace & Defense – 1.5% | | | |
| | Safran SA | | 48,831 | | | $7,251,006 | |
Auto Components – 1.5% | | | |
| | Faurecia SE* | | 335,542 | | | 7,302,035 | |
Automobiles – 1.3% | | | |
| | Ferrari NV | | 23,124 | | | 6,262,290 | |
Banks – 5.6% | | | |
| | BNP Paribas SA | | 124,906 | | | 7,469,898 | |
| | Commerzbank AG* | | 399,236 | | | 4,199,642 | |
| | Natwest Group PLC | | 1,503,603 | | | 4,912,035 | |
| | Nordea Bank Abp | | 929,499 | | | 9,923,693 | |
| | | 26,505,268 | |
Beverages – 1.1% | | | |
| | Diageo PLC | | 117,532 | | | 5,244,631 | |
Building Products – 1.7% | | | |
| | Cie de Saint-Gobain | | 139,857 | | | 7,962,393 | |
Capital Markets – 3.4% | | | |
| | Deutsche Boerse AG | | 39,734 | | | 7,732,369 | |
| | UBS Group AG | | 396,667 | | | 8,378,372 | |
| | | 16,110,741 | |
Chemicals – 1.3% | | | |
| | Wacker Chemie AG | | 37,802 | | | 6,125,545 | |
Containers & Packaging – 1.4% | | | |
| | Smurfit Kappa Group PLC | | 188,077 | | | 6,827,334 | |
Food Products – 8.2% | | | |
| | Chocoladefabriken Lindt & Spruengli AG (PC) | | 652 | | | 7,715,829 | |
| | Danone SA | | 207,290 | | | 12,885,637 | |
| | Nestle SA (REG) | | 152,682 | | | 18,644,026 | |
| | | 39,245,492 | |
Hotels, Restaurants & Leisure – 1.5% | | | |
| | Compass Group PLC | | 277,230 | | | 6,969,499 | |
Independent Power and Renewable Electricity Producers – 2.1% | | | |
| | RWE AG | | 236,683 | | | 10,173,739 | |
Industrial Conglomerates – 1.5% | | | |
| | Siemens AG | | 44,982 | | | 7,280,500 | |
Insurance – 2.2% | | | |
| | Prudential PLC | | 428,449 | | | 5,858,625 | |
| | Sampo Oyj | | 97,593 | | | 4,603,193 | |
| | | 10,461,818 | |
Machinery – 5.3% | | | |
| | Atlas Copco AB - Class A | | 365,784 | | | 4,639,294 | |
| | Daimler Truck Holding AG* | | 177,727 | | | 6,001,797 | |
| | Sandvik AB | | 400,892 | | | 8,522,633 | |
| | VAT Group AG (144A) | | 17,167 | | | 6,203,519 | |
| | | 25,367,243 | |
Marine – 2.0% | | | |
| | Kuehne + Nagel International AG | | 32,474 | | | 9,694,231 | |
Metals & Mining – 7.9% | | | |
| | Anglo American PLC | | 406,313 | | | 13,445,722 | |
| | ArcelorMittal SA | | 180,884 | | | 5,484,544 | |
| | Glencore PLC | | 846,376 | | | 4,867,641 | |
| | Rio Tinto PLC | | 202,594 | | | 13,728,561 | |
| | | 37,526,468 | |
Oil, Gas & Consumable Fuels – 5.0% | | | |
| | BP PLC | | 1,501,737 | | | 9,505,838 | |
| | Shell PLC | | 497,393 | | | 14,240,838 | |
| | | 23,746,676 | |
Paper & Forest Products – 5.4% | | | |
| | Svenska Cellulosa AB SCA# | | 834,361 | | | 10,976,787 | |
| | |
See Notes to Schedule of Investments and Other Information and Notes to Financial Statements. |
| |
Janus Investment Fund | 7 |
Janus Henderson European Focus Fund
Schedule of Investments (unaudited)
March 31, 2023
| | | | | | | | |
Shares or
Principal Amounts | | | Value | |
Common Stocks– (continued) | | | |
Paper & Forest Products– (continued) | | | |
| | UPM-Kymmene Oyj* | | 434,369 | | | $14,585,424 | |
| | | 25,562,211 | |
Personal Products – 3.7% | | | |
| | L'Oreal SA | | 18,870 | | | 8,441,687 | |
| | Unilever PLC | | 177,912 | | | 9,215,711 | |
| | | 17,657,398 | |
Pharmaceuticals – 9.9% | | | |
| | AstraZeneca PLC | | 99,602 | | | 13,822,480 | |
| | Novartis AG | | 40,549 | | | 3,723,613 | |
| | Novo Nordisk A/S | | 114,694 | | | 18,203,076 | |
| | Roche Holding AG | | 40,042 | | | 11,462,647 | |
| | | 47,211,816 | |
Professional Services – 4.4% | | | |
| | RELX PLC | | 326,136 | | | 10,556,048 | |
| | Wolters Kluwer NV | | 83,717 | | | 10,563,180 | |
| | | 21,119,228 | |
Semiconductor & Semiconductor Equipment – 9.0% | | | |
| | ASM International NV | | 18,733 | | | 7,606,618 | |
| | ASML Holding NV | | 7,111 | | | 4,858,457 | |
| | BE Semiconductor Industries NV | | 96,102 | | | 8,403,956 | |
| | Meyer Burger Technology AG* | | 5,928,312 | | | 4,187,623 | |
| | Nordic Semiconductor ASA* | | 625,965 | | | 9,619,128 | |
| | STMicroelectronics NV | | 151,986 | | | 8,129,907 | |
| | | 42,805,689 | |
Technology Hardware, Storage & Peripherals – 1.6% | | | |
| | Logitech International SA (REG) | | 129,731 | | | 7,539,217 | |
Textiles, Apparel & Luxury Goods – 8.1% | | | |
| | adidas AG | | 47,453 | | | 8,377,577 | |
| | Hugo Boss AG | | 176,878 | | | 12,682,942 | |
| | LVMH Moet Hennessy Louis Vuitton SE | | 18,924 | | | 17,341,429 | |
| | | 38,401,948 | |
Trading Companies & Distributors – 1.3% | | | |
| | Azelis Group NV | | 250,965 | | | 6,370,595 | |
Total Common Stocks (cost $409,614,943) | | 466,725,011 | |
Preferred Stocks– 0.6% | | | |
Machinery – 0.6% | | | |
| | Jungheinrich AG((cost $3,064,888) | | 87,933 | | | 3,066,255 | |
Investments Purchased with Cash Collateral from Securities Lending– 1.9% | | | |
Investment Companies – 1.5% | | | |
| | Janus Henderson Cash Collateral Fund LLC, 4.8170%ºº,£ | | 7,075,000 | | | 7,075,000 | |
Time Deposits – 0.4% | | | |
| | Royal Bank of Canada, 4.8000%, 4/3/23 | | $1,768,750 | | | 1,768,750 | |
Total Investments Purchased with Cash Collateral from Securities Lending (cost $8,843,750) | | 8,843,750 | |
Total Investments (total cost $421,523,581) – 100.4% | | 478,635,016 | |
Liabilities, net of Cash, Receivables and Other Assets – (0.4)% | | (1,996,402) | |
Net Assets – 100% | | $476,638,614 | |
| | |
See Notes to Schedule of Investments and Other Information and Notes to Financial Statements. |
| |
8 | MARCH 31, 2023 |
Janus Henderson European Focus Fund
Schedule of Investments (unaudited)
March 31, 2023
| | | | | | |
Summary of Investments by Country - (Long Positions) (unaudited) |
| |
| | | | | % of | |
| | | | | Investment | |
Country | | Value | | Securities | |
United Kingdom | | $98,126,791 | | 20.5 | % |
Switzerland | | 77,549,077 | | 16.2 | |
France | | 74,138,629 | | 15.5 | |
Germany | | 65,640,366 | | 13.7 | |
Netherlands | | 45,673,049 | | 9.5 | |
Finland | | 29,112,310 | | 6.1 | |
Sweden | | 24,138,714 | | 5.1 | |
Denmark | | 18,203,076 | | 3.8 | |
Norway | | 9,619,128 | | 2.0 | |
United States | | 8,843,750 | | 1.9 | |
Singapore | | 8,129,907 | | 1.7 | |
Ireland | | 6,827,334 | | 1.4 | |
Belgium | | 6,370,595 | | 1.3 | |
Italy | | 6,262,290 | | 1.3 | |
| | | | | | |
| | | | | | |
Total | | $478,635,016 | | 100.0 | % |
Schedules of Affiliated Investments – (% of Net Assets)
| | | | | | | | | | | |
| | Dividend Income | Realized Gain/(Loss) | Change in Unrealized Appreciation/ Depreciation | Value at 3/31/23 |
Investment Companies - N/A |
Money Markets - N/A | |
| | Janus Henderson Cash Liquidity Fund LLC, 4.7988%ºº | $ | 205,540 | $ | 1,020 | $ | - | $ | - |
Investments Purchased with Cash Collateral from Securities Lending - 1.5% |
Investment Companies - 1.5% | |
| | Janus Henderson Cash Collateral Fund LLC, 4.8170%ºº | | 7,878∆ | | - | | - | | 7,075,000 |
Total Affiliated Investments - 1.5% | $ | 213,418 | $ | 1,020 | $ | - | $ | 7,075,000 |
| | | | | | | | | | | |
| | Value at 9/30/22 | Purchases | Sales Proceeds | Value at 3/31/23 |
Investment Companies - N/A |
Money Markets - N/A | |
| | Janus Henderson Cash Liquidity Fund LLC, 4.7988%ºº | | 10,391,302 | | 142,253,798 | | (152,646,120) | | - |
Investments Purchased with Cash Collateral from Securities Lending - 1.5% |
Investment Companies - 1.5% | |
| | Janus Henderson Cash Collateral Fund LLC, 4.8170%ºº | | 1,136,698 | | 21,994,482 | | (16,056,180) | | 7,075,000 |
| | |
See Notes to Schedule of Investments and Other Information and Notes to Financial Statements. |
| |
Janus Investment Fund | 9 |
Janus Henderson European Focus Fund
Schedule of Investments (unaudited)
March 31, 2023
The following tables provide information about the effect of derivatives and hedging activities on the Fund’s Statement of Operations for the period ended March 31, 2023.
| | | | | |
The effect of Derivative Instruments (not accounted for as hedging instruments) on the Statement of Operations for the period ended March 31, 2023 |
| | | | |
Amount of Realized Gain/(Loss) Recognized on Derivatives |
Derivative | | Equity
Contracts |
Futures contracts | | $ (282,248) |
Purchased options contracts | | (1,724,559) |
Written options contracts | | 592,920 |
| | | | | |
Total | | $(1,413,887) |
| | | | | |
| | | | | |
| | | | | |
Please see the "Net Realized Gain/(Loss) on Investments" and "Change in Unrealized Net Appreciation/Depreciation" sections of the Fund’s Statement of Operations.
| | |
Average Ending Monthly Value of Derivative Instruments During the Period Ended March 31, 2023 |
| |
| |
Options: | |
Average value of option contracts purchased | $345,978 |
Average value of option contracts written | (154,361) |
| | |
| |
| |
| |
| | | | | | | | | | |
Offsetting of Financial Assets and Derivative Assets |
| |
| | | Gross Amounts | | | | | | |
| | | of Recognized | | Offsetting Asset | | Collateral | | |
Counterparty | | Assets | | or Liability(a) | | Pledged(b) | | Net Amount |
| | | | | | | | | |
JPMorgan Chase Bank, National Association | $ | 8,222,450 | $ | — | $ | (8,222,450) | $ | — |
| | | | | | | | | |
(a) | Represents the amount of assets or liabilities that could be offset with the same counterparty under master netting or similar agreements that management elects not to offset on the Statement of Assets and Liabilities. |
(b) | Collateral pledged is limited to the net outstanding amount due to/from an individual counterparty. The actual collateral amounts pledged may exceed these amounts and may fluctuate in value. |
| | |
See Notes to Schedule of Investments and Other Information and Notes to Financial Statements. |
| |
10 | MARCH 31, 2023 |
Janus Henderson European Focus Fund
Notes to Schedule of Investments and Other Information (unaudited)
| | |
MSCI Europe IndexSM | MSCI Europe IndexSM reflects the equity market performance of developed markets in Europe. |
| | |
LLC | Limited Liability Company |
PC | Participation Certificate |
PLC | Public Limited Company |
REG | Registered |
| | |
144A | Securities sold under Rule 144A of the Securities Act of 1933, as amended, are subject to legal and/or contractual restrictions on resale and may not be publicly sold without registration under the 1933 Act. Unless otherwise noted, these securities have been determined to be liquid under guidelines established by the Board of Trustees. The total value of 144A securities as of the period ended March 31, 2023 is $6,203,519, which represents 1.3% of net assets. |
| | |
* | Non-income producing security. |
| | |
ºº | Rate shown is the 7-day yield as of March 31, 2023. |
| | |
# | Loaned security; a portion of the security is on loan at March 31, 2023. |
| | |
£ | The Fund may invest in certain securities that are considered affiliated companies. As defined by the Investment Company Act of 1940, as amended, an affiliated company is one in which the Fund owns 5% or more of the outstanding voting securities, or a company which is under common ownership or control. |
| | |
∆ | Net of income paid to the securities lending agent and rebates paid to the borrowing counterparties. |
| | | | | | | | | | | | | |
The following is a summary of the inputs that were used to value the Fund’s investments in securities and other financial instruments as of March 31, 2023. See Notes to Financial Statements for more information. |
| |
Valuation Inputs Summary |
| | | | | | | |
| | | | | Level 2 - | | Level 3 - |
| | | Level 1 - | | Other Significant | | Significant |
| | | Quoted Prices | | Observable Inputs | | Unobservable Inputs |
| | | | | | | |
Assets | | | | | | |
Investments In Securities: | | | | | | |
Common Stocks | $ | - | $ | 466,725,011 | $ | - |
Preferred Stocks | | - | | 3,066,255 | | - |
Investments Purchased with Cash Collateral from Securities Lending | | - | | 8,843,750 | | - |
Total Assets | $ | - | $ | 478,635,016 | $ | - |
| | | | | | | |
Janus Henderson European Focus Fund
Statement of Assets and Liabilities (unaudited)
March 31, 2023
| |
See footnotes at the end of the Statement. |
| | | | | | | |
| | | | | | |
Assets: | | | | |
| Unaffiliated investments, at value (cost $414,448,581)(1) | | $ | 471,560,016 | |
| Affiliated investments, at value (cost $7,075,000) | | | 7,075,000 | |
| Cash denominated in foreign currency (cost $1,488,118) | | | 1,488,118 | |
| Variation margin receivable on futures contracts | | | 26 | |
| Trustees' deferred compensation | | | 11,787 | |
| Receivables: | | | | |
| | Foreign tax reclaims | | | 2,966,190 | |
| | Investments sold | | | 2,869,906 | |
| | Dividends | | | 1,863,815 | |
| | Fund shares sold | | | 435,685 | |
| | Dividends from affiliates | | | 17,483 | |
| Other assets | | | 2,897 | |
Total Assets | | | 488,290,923 | |
Liabilities: | | | | |
| Due to custodian | | | 945,963 | |
| Collateral for securities loaned (Note 3) | | | 8,843,750 | |
| Payables: | | | — | |
| | Investments purchased | | | 390,926 | |
| | Advisory fees | | | 361,818 | |
| | Professional fees | | | 303,600 | |
| | Fund shares repurchased | | | 302,907 | |
| | Foreign withholding tax reclaim fee (Note 1) | | | 277,948 | |
| | Transfer agent fees and expenses | | | 44,343 | |
| | 12b-1 Distribution and shareholder servicing fees | | | 36,346 | |
| | Trustees' deferred compensation fees | | | 11,787 | |
| | Custodian fees | | | 11,287 | |
| | Trustees' fees and expenses | | | 2,562 | |
| | Affiliated fund administration fees payable | | | 1,041 | |
| | Accrued expenses and other payables | | | 118,031 | |
Total Liabilities | | | 11,652,309 | |
Net Assets | | $ | 476,638,614 | |
| | |
See Notes to Financial Statements. |
| |
12 | MARCH 31, 2023 |
Janus Henderson European Focus Fund
Statement of Assets and Liabilities (unaudited)
March 31, 2023
| | | | | | | |
| | | | | | |
| | | | | | | |
Net Assets Consist of: | | | | |
| Capital (par value and paid-in surplus) | | $ | 866,668,941 | |
| Total distributable earnings (loss) | | | (390,030,327) | |
Total Net Assets | | $ | 476,638,614 | |
Net Assets - Class A Shares | | $ | 125,670,666 | |
| Shares Outstanding, $0.01 Par Value (unlimited shares authorized) | | | 3,009,144 | |
Net Asset Value Per Share(2) | | $ | 41.76 | |
Maximum Offering Price Per Share(3) | | $ | 44.31 | |
Net Assets - Class C Shares | | $ | 9,640,434 | |
| Shares Outstanding, $0.01 Par Value (unlimited shares authorized) | | | 244,521 | |
Net Asset Value Per Share(2) | | $ | 39.43 | |
Net Assets - Class D Shares | | $ | 9,199,616 | |
| Shares Outstanding, $0.01 Par Value (unlimited shares authorized) | | | 221,932 | |
Net Asset Value Per Share | | $ | 41.45 | |
Net Assets - Class I Shares | | $ | 295,549,193 | |
| Shares Outstanding, $0.01 Par Value (unlimited shares authorized) | | | 7,125,285 | |
Net Asset Value Per Share | | $ | 41.48 | |
Net Assets - Class N Shares | | $ | 21,839,630 | |
| Shares Outstanding, $0.01 Par Value (unlimited shares authorized) | | | 530,055 | |
Net Asset Value Per Share | | $ | 41.20 | |
Net Assets - Class S Shares | | $ | 267,478 | |
| Shares Outstanding, $0.01 Par Value (unlimited shares authorized) | | | 6,742 | |
Net Asset Value Per Share | | $ | 39.67 | |
Net Assets - Class T Shares | | $ | 14,471,597 | |
| Shares Outstanding, $0.01 Par Value (unlimited shares authorized) | | | 349,497 | |
Net Asset Value Per Share | | $ | 41.41 | |
| |
(1) Includes $8,222,450 of securities on loan. See Note 3 in Notes to Financial Statements. (2) Redemption price per share may be reduced for any applicable contingent deferred sales charge. (3) Maximum offering price is computed at 100/94.25 of net asset value. |
| | |
See Notes to Financial Statements. |
| |
Janus Investment Fund | 13 |
Janus Henderson European Focus Fund
Statement of Operations (unaudited)
For the period ended March 31, 2023
| | | | | | |
| | | | | |
Investment Income: | | | |
| Dividends | $ | 4,188,477 | |
| Dividends from affiliates | | 205,540 | |
| Affiliated securities lending income, net | | 7,878 | |
| Unaffiliated securities lending income, net | | 2,041 | |
| Other income | | 433,087 | |
| Foreign withholding tax income (net of foreign withholding tax reclaim fee of $277,948 (Note 1)) | | 1,844,098 | |
Total Investment Income | | 6,681,121 | |
Expenses: | | | |
| Advisory fees | | 2,054,558 | |
| 12b-1 Distribution and shareholder servicing fees: | | | |
| | Class A Shares | | 145,443 | |
| | Class C Shares | | 51,905 | |
| | Class S Shares | | 193 | |
| Transfer agent administrative fees and expenses: | | | |
| | Class D Shares | | 4,863 | |
| | Class S Shares | | 256 | |
| | Class T Shares | | 12,805 | |
| Transfer agent networking and omnibus fees: | | | |
| | Class A Shares | | 46,793 | |
| | Class C Shares | | 5,461 | |
| | Class I Shares | | 89,750 | |
| Other transfer agent fees and expenses: | | | |
| | Class A Shares | | 4,409 | |
| | Class C Shares | | 294 | |
| | Class D Shares | | 1,368 | |
| | Class I Shares | | 7,331 | |
| | Class N Shares | | 468 | |
| | Class S Shares | | 4 | |
| | Class T Shares | | 1,639 | |
| Professional fees | | 299,782 | |
| Registration fees | | 40,190 | |
| Custodian fees | | 25,825 | |
| Shareholder reports expense | | 15,543 | |
| Trustees’ fees and expenses | | 5,716 | |
| Affiliated fund administration fees | | 5,137 | |
| Other expenses | | 55,508 | |
Total Expenses | | 2,875,241 | |
Less: Excess Expense Reimbursement and Waivers | | (406,832) | |
Net Expenses | | 2,468,409 | |
Net Investment Income/(Loss) | | 4,212,712 | |
| | | | | |
| | |
See Notes to Financial Statements. |
| |
14 | MARCH 31, 2023 |
Janus Henderson European Focus Fund
Statement of Operations (unaudited)
For the period ended March 31, 2023
| | | | | | |
| | | | | |
Net Realized Gain/(Loss) on Investments: | | | |
| Investments and foreign currency transactions | $ | 8,121,295 | |
| Investments in affiliates | | 1,020 | |
| Purchased options contracts | | (1,724,559) | |
| Futures contracts | | (282,248) | |
| Written options contracts | | 592,920 | |
Total Net Realized Gain/(Loss) on Investments | | 6,708,428 | |
Change in Unrealized Net Appreciation/Depreciation: | | | |
| Investments, foreign currency translations and Trustees’ deferred compensation | | 93,519,968 | |
Total Change in Unrealized Net Appreciation/Depreciation | | 93,519,968 | |
Net Increase/(Decrease) in Net Assets Resulting from Operations | $ | 104,441,108 | |
| | | | | |
| | |
See Notes to Financial Statements. |
| |
Janus Investment Fund | 15 |
Janus Henderson European Focus Fund
Statements of Changes in Net Assets
| | | | | | | | | |
| | | | | | | | |
| | | Period ended
March 31, 2023 (unaudited) | | Year ended
September 30, 2022 | |
| | | | | | | | | |
Operations: | | | | | | |
| Net investment income/(loss) | $ | 4,212,712 | | $ | 10,557,741 | |
| Net realized gain/(loss) on investments | | 6,708,428 | | | (54,183,652) | |
| Change in unrealized net appreciation/depreciation | | 93,519,968 | | | (83,142,037) | |
Net Increase/(Decrease) in Net Assets Resulting from Operations | | 104,441,108 | | | (126,767,948) | |
Dividends and Distributions to Shareholders: | | | | | | |
| | Class A Shares | | (2,750,434) | | | (199,461) | |
| | Class C Shares | | (115,973) | | | — | |
| | Class D Shares | | (208,349) | | | (33,496) | |
| | Class I Shares | | (6,270,228) | | | (1,094,982) | |
| | Class N Shares | | (560,866) | | | (45,092) | |
| | Class S Shares | | (5,786) | | | (279) | |
| | Class T Shares | | (225,828) | | | (34,594) | |
Net Decrease from Dividends and Distributions to Shareholders | | (10,137,464) | | | (1,407,904) | |
Capital Share Transactions: | | | | | | |
| | Class A Shares | | 1,020,375 | | | (8,375,717) | |
| | Class C Shares | | (2,856,346) | | | (9,044,345) | |
| | Class D Shares | | 349,104 | | | (467,101) | |
| | Class I Shares | | 44,168,354 | | | (26,183,219) | |
| | Class N Shares | | 3,401,805 | | | 8,572,500 | |
| | Class S Shares | | 121,702 | | | 46,405 | |
| | Class T Shares | | 4,812,810 | | | (77,072) | |
Net Increase/(Decrease) from Capital Share Transactions | | 51,017,804 | | | (35,528,549) | |
Net Increase/(Decrease) in Net Assets | | 145,321,448 | | | (163,704,401) | |
Net Assets: | | | | | | |
| Beginning of period | | 331,317,166 | | | 495,021,567 | |
| End of period | $ | 476,638,614 | | $ | 331,317,166 | |
| | | | | | | | |
| | |
See Notes to Financial Statements. |
| |
16 | MARCH 31, 2023 |
Janus Henderson European Focus Fund
Financial Highlights
| | | | | | | | | | | | | | | | | | | | | | |
Class A Shares | | | | | | | | | | | | | | | | | | |
For a share outstanding during the period ended March 31, 2023 (unaudited) and the year ended September 30 | 2023 | | | 2022 | | | 2021 | | | 2020 | | | 2019 | | | 2018 | |
| Net Asset Value, Beginning of Period | | $32.52 | | | $44.48 | | | $34.23 | | | $27.21 | | | $31.73 | | | $35.02 | |
| Income/(Loss) from Investment Operations: | | | | | | | | | | | | | | | | | | |
| | Net investment income/(loss)(1) | | 0.35(2) | | | 0.90 | | | 0.16 | | | 0.11 | | | 0.41 | | | 0.46 | |
| | Net realized and unrealized gain/(loss) | | 9.81 | | | (12.80) | | | 10.20 | | | 7.22 | | | (3.91) | | | (3.16) | |
| Total from Investment Operations | | 10.16 | | | (11.90) | | | 10.36 | | | 7.33 | | | (3.50) | | | (2.70) | |
| Less Dividends and Distributions: | | | | | | | | | | | | | | | | | | |
| | Dividends (from net investment income) | | (0.92) | | | (0.06) | | | (0.11) | | | (0.31) | | | (1.02) | | | (0.59) | |
| Total Dividends and Distributions | | (0.92) | | | (0.06) | | | (0.11) | | | (0.31) | | | (1.02) | | | (0.59) | |
| Net Asset Value, End of Period | | $41.76 | | | $32.52 | | | $44.48 | | | $34.23 | | | $27.21 | | | $31.73 | |
| Total Return* | | 31.53% | | | (26.79)% | | | 30.31% | | | 27.04% | | | (10.61)% | | | (7.84)% | |
| Net Assets, End of Period (in thousands) | | $125,671 | | | $96,858 | | | $141,908 | | | $116,047 | | | $112,110 | | | $176,690 | |
| Average Net Assets for the Period (in thousands) | | $116,365 | | | $128,933 | | | $136,809 | | | $109,879 | | | $135,260 | | | $227,911 | |
| Ratios to Average Net Assets**: | | | | | | | | | | | | | | | | | | |
| | Ratio of Gross Expenses | | 1.55%(3) | | | 1.42% | | | 1.41% | | | 1.45% | | | 1.46% | | | 1.31% | |
| | Ratio of Net Expenses (After Waivers and Expense Offsets) | | 1.36% | | | 1.30% | | | 1.30% | | | 1.31% | | | 1.32% | | | 1.30% | |
| | Ratio of Net Investment Income/(Loss) | | 1.79%(2) | | | 2.17% | | | 0.37% | | | 0.38% | | | 1.49% | | | 1.37% | |
| Portfolio Turnover Rate | | 67% | | | 145% | | | 184% | | | 160% | | | 145% | | | 82% | |
| | | | | | | | | | | | | | | | | | | | | | |
| |
* Total return includes adjustments in accordance with generally accepted accounting principles required at the year or period end and are not annualized for periods of less than one full year. ** Annualized for periods of less than one full year. (1) Per share amounts are calculated based on average shares outstanding during the year or period. (2) Net investment income/(loss) per share and Ratio of Net Investment Income/(Loss) to Average Net Assets include foreign withholding tax reclaims received in January 2023 and March 2023. The impact of the foreign withholding tax reclaims received, net of the related professional fees, to Net investment income/(loss) per share and Ratio of Net Investment Income/(Loss) to Average Net Assets is $0.18 and 0.94%, respectively. (3) Ratio of Gross Expenses includes additional professional fees related to foreign withholding tax reclaims received in January 2023 and March 2023. The impact of the additional professional fees to Ratio of Gross Expenses is 0.14%. |
| | |
See Notes to Financial Statements. |
| |
Janus Investment Fund | 17 |
Janus Henderson European Focus Fund
Financial Highlights
| | | | | | | | | | | | | | | | | | | | | | |
Class C Shares | | | | | | | | | | | | | | | | | | |
For a share outstanding during the period ended March 31, 2023 (unaudited) and the year ended September 30 | 2023 | | | 2022 | | | 2021 | | | 2020 | | | 2019 | | | 2018 | |
| Net Asset Value, Beginning of Period | | $30.43 | | | $41.90 | | | $32.40 | | | $25.69 | | | $29.66 | | | $32.68 | |
| Income/(Loss) from Investment Operations: | | | | | | | | | | | | | | | | | | |
| | Net investment income/(loss)(1) | | 0.16(2) | | | 0.57 | | | (0.18) | | | (0.11) | | | 0.16 | | | 0.21 | |
| | Net realized and unrealized gain/(loss) | | 9.25 | | | (12.04) | | | 9.68 | | | 6.82 | | | (3.57) | | | (2.97) | |
| Total from Investment Operations | | 9.41 | | | (11.47) | | | 9.50 | | | 6.71 | | | (3.41) | | | (2.76) | |
| Less Dividends and Distributions: | | | | | | | | | | | | | | | | | | |
| | Dividends (from net investment income) | | (0.41) | | | — | | | — | | | — | | | (0.56) | | | (0.26) | |
| Total Dividends and Distributions | | (0.41) | | | — | | | — | | | — | | | (0.56) | | | (0.26) | |
| Net Asset Value, End of Period | | $39.43 | | | $30.43 | | | $41.90 | | | $32.40 | | | $25.69 | | | $29.66 | |
| Total Return* | | 31.06% | | | (27.37)% | | | 29.32% | | | 26.12% | | | (11.26)% | | | (8.51)% | |
| Net Assets, End of Period (in thousands) | | $9,640 | | | $9,829 | | | $23,302 | | | $29,652 | | | $43,110 | | | $118,408 | |
| Average Net Assets for the Period (in thousands) | | $10,386 | | | $17,189 | | | $27,919 | | | $37,468 | | | $62,633 | | | $154,929 | |
| Ratios to Average Net Assets**: | | | | | | | | | | | | | | | | | | |
| | Ratio of Gross Expenses | | 2.35%(3) | | | 2.20% | | | 2.17% | | | 2.19% | | | 2.19% | | | 2.04% | |
| | Ratio of Net Expenses (After Waivers and Expense Offsets) | | 2.13% | | | 2.07% | | | 2.05% | | | 2.06% | | | 2.06% | | | 2.02% | |
| | Ratio of Net Investment Income/(Loss) | | 0.87%(2) | | | 1.44% | | | (0.46)% | | | (0.40)% | | | 0.62% | | | 0.65% | |
| Portfolio Turnover Rate | | 67% | | | 145% | | | 184% | | | 160% | | | 145% | | | 82% | |
| | | | | | | | | | | | | | | | | | | | | | |
| |
* Total return includes adjustments in accordance with generally accepted accounting principles required at the year or period end and are not annualized for periods of less than one full year. ** Annualized for periods of less than one full year. (1) Per share amounts are calculated based on average shares outstanding during the year or period. (2) Net investment income/(loss) per share and Ratio of Net Investment Income/(Loss) to Average Net Assets include foreign withholding tax reclaims received in January 2023 and March 2023. The impact of the foreign withholding tax reclaims received, net of the related professional fees, to Net investment income/(loss) per share and Ratio of Net Investment Income/(Loss) to Average Net Assets is $0.17 and 0.94%, respectively. (3) Ratio of Gross Expenses includes additional professional fees related to foreign withholding tax reclaims received in January 2023 and March 2023. The impact of the additional professional fees to Ratio of Gross Expenses is 0.14%. |
| | |
See Notes to Financial Statements. |
| |
18 | MARCH 31, 2023 |
Janus Henderson European Focus Fund
Financial Highlights
| | | | | | | | | | | | | | | | | | | | | | |
Class D Shares | | | | | | | | | | | | | | | | | | |
For a share outstanding during the period ended March 31, 2023 (unaudited) and the year ended September 30 | 2023 | | | 2022 | | | 2021 | | | 2020 | | | 2019 | | | 2018 | |
| Net Asset Value, Beginning of Period | | $32.32 | | | $44.21 | | | $34.01 | | | $27.05 | | | $31.61 | | | $35.02 | |
| Income/(Loss) from Investment Operations: | | | | | | | | | | | | | | | | | | |
| | Net investment income/(loss)(1) | | 0.39(2) | | | 0.98 | | | 0.24 | | | 0.18 | | | 0.49 | | | 0.57 | |
| | Net realized and unrealized gain/(loss) | | 9.74 | | | (12.73) | | | 10.13 | | | 7.16 | | | (3.92) | | | (3.20) | |
| Total from Investment Operations | | 10.13 | | | (11.75) | | | 10.37 | | | 7.34 | | | (3.43) | | | (2.63) | |
| Less Dividends and Distributions: | | | | | | | | | | | | | | | | | | |
| | Dividends (from net investment income) | | (1.00) | | | (0.14) | | | (0.17) | | | (0.38) | | | (1.13) | | | (0.78) | |
| Total Dividends and Distributions | | (1.00) | | | (0.14) | | | (0.17) | | | (0.38) | | | (1.13) | | | (0.78) | |
| Net Asset Value, End of Period | | $41.45 | | | $32.32 | | | $44.21 | | | $34.01 | | | $27.05 | | | $31.61 | |
| Total Return* | | 31.66% | | | (26.66)% | | | 30.57% | | | 27.27% | | | (10.39)% | | | (7.67)% | |
| Net Assets, End of Period (in thousands) | | $9,200 | | | $6,899 | | | $10,102 | | | $3,510 | | | $2,293 | | | $2,875 | |
| Average Net Assets for the Period (in thousands) | | $8,243 | | | $9,366 | | | $6,844 | | | $2,636 | | | $2,421 | | | $3,071 | |
| Ratios to Average Net Assets**: | | | | | | | | | | | | | | | | | | |
| | Ratio of Gross Expenses | | 1.45%(3) | | | 1.30% | | | 1.28% | | | 1.40% | | | 1.59% | | | 1.19% | |
| | Ratio of Net Expenses (After Waivers and Expense Offsets) | | 1.17% | | | 1.11% | | | 1.10% | | | 1.11% | | | 1.14% | | | 1.11% | |
| | Ratio of Net Investment Income/(Loss) | | 2.02%(2) | | | 2.39% | | | 0.57% | | | 0.60% | | | 1.81% | | | 1.71% | |
| Portfolio Turnover Rate | | 67% | | | 145% | | | 184% | | | 160% | | | 145% | | | 82% | |
| | | | | | | | | | | | | | | | | | | | | | |
| |
* Total return includes adjustments in accordance with generally accepted accounting principles required at the year or period end and are not annualized for periods of less than one full year. ** Annualized for periods of less than one full year. (1) Per share amounts are calculated based on average shares outstanding during the year or period. (2) Net investment income/(loss) per share and Ratio of Net Investment Income/(Loss) to Average Net Assets include foreign withholding tax reclaims received in January 2023 and March 2023. The impact of the foreign withholding tax reclaims received, net of the related professional fees, to Net investment income/(loss) per share and Ratio of Net Investment Income/(Loss) to Average Net Assets is $0.18 and 0.94%, respectively. (3) Ratio of Gross Expenses includes additional professional fees related to foreign withholding tax reclaims received in January 2023 and March 2023. The impact of the additional professional fees to Ratio of Gross Expenses is 0.14%. |
| | |
See Notes to Financial Statements. |
| |
Janus Investment Fund | 19 |
Janus Henderson European Focus Fund
Financial Highlights
| | | | | | | | | | | | | | | | | | | | | | |
Class I Shares | | | | | | | | | | | | | | | | | | |
For a share outstanding during the period ended March 31, 2023 (unaudited) and the year ended September 30 | 2023 | | | 2022 | | | 2021 | | | 2020 | | | 2019 | | | 2018 | |
| Net Asset Value, Beginning of Period | | $32.36 | | | $44.25 | | | $34.03 | | | $27.07 | | | $31.59 | | | $34.94 | |
| Income/(Loss) from Investment Operations: | | | | | | | | | | | | | | | | | | |
| | Net investment income/(loss)(1) | | 0.43(2) | | | 1.02 | | | 0.26 | | | 0.19 | | | 0.42 | | | 0.54 | |
| | Net realized and unrealized gain/(loss) | | 9.72 | | | (12.75) | | | 10.15 | | | 7.17 | | | (3.82) | | | (3.14) | |
| Total from Investment Operations | | 10.15 | | | (11.73) | | | 10.41 | | | 7.36 | | | (3.40) | | | (2.60) | |
| Less Dividends and Distributions: | | | | | | | | | | | | | | | | | | |
| | Dividends (from net investment income) | | (1.03) | | | (0.16) | | | (0.19) | | | (0.40) | | | (1.12) | | | (0.75) | |
| Total Dividends and Distributions | | (1.03) | | | (0.16) | | | (0.19) | | | (0.40) | | | (1.12) | | | (0.75) | |
| Net Asset Value, End of Period | | $41.48 | | | $32.36 | | | $44.25 | | | $34.03 | | | $27.07 | | | $31.59 | |
| Total Return* | | 31.70% | | | (26.60)% | | | 30.66% | | | 27.35% | | | (10.30)% | | | (7.60)% | |
| Net Assets, End of Period (in thousands) | | $295,549 | | | $196,068 | | | $299,272 | | | $208,159 | | | $220,722 | | | $695,302 | |
| Average Net Assets for the Period (in thousands) | | $245,728 | | | $272,758 | | | $263,587 | | | $204,753 | | | $353,101 | | | $1,025,799 | |
| Ratios to Average Net Assets**: | | | | | | | | | | | | | | | | | | |
| | Ratio of Gross Expenses | | 1.30%(3) | | | 1.16% | | | 1.14% | | | 1.17% | | | 1.16% | | | 1.03% | |
| | Ratio of Net Expenses (After Waivers and Expense Offsets) | | 1.10% | | | 1.04% | | | 1.03% | | | 1.04% | | | 1.03% | | | 1.02% | |
| | Ratio of Net Investment Income/(Loss) | | 2.22%(2) | | | 2.47% | | | 0.62% | | | 0.64% | | | 1.53% | | | 1.60% | |
| Portfolio Turnover Rate | | 67% | | | 145% | | | 184% | | | 160% | | | 145% | | | 82% | |
| | | | | | | | | | | | | | | | | | | | | | |
| |
* Total return includes adjustments in accordance with generally accepted accounting principles required at the year or period end and are not annualized for periods of less than one full year. ** Annualized for periods of less than one full year. (1) Per share amounts are calculated based on average shares outstanding during the year or period. (2) Net investment income/(loss) per share and Ratio of Net Investment Income/(Loss) to Average Net Assets include foreign withholding tax reclaims received in January 2023 and March 2023. The impact of the foreign withholding tax reclaims received, net of the related professional fees, to Net investment income/(loss) per share and Ratio of Net Investment Income/(Loss) to Average Net Assets is $0.18 and 0.94%, respectively. (3) Ratio of Gross Expenses includes additional professional fees related to foreign withholding tax reclaims received in January 2023 and March 2023. The impact of the additional professional fees to Ratio of Gross Expenses is 0.14%. |
| | |
See Notes to Financial Statements. |
| |
20 | MARCH 31, 2023 |
Janus Henderson European Focus Fund
Financial Highlights
| | | | | | | | | | | | | | | | | | | | | | |
Class N Shares | | | | | | | | | | | | | | | | | | |
For a share outstanding during the period ended March 31, 2023 (unaudited) and the year ended September 30 | 2023 | | | 2022 | | | 2021 | | | 2020 | | | 2019 | | | 2018 | |
| Net Asset Value, Beginning of Period | | $32.15 | | | $43.95 | | | $33.80 | | | $26.86 | | | $31.64 | | | $34.89 | |
| Income/(Loss) from Investment Operations: | | | | | | | | | | | | | | | | | | |
| | Net investment income/(loss)(1) | | 0.42(2) | | | 0.95 | | | 0.35 | | | 0.34 | | | 0.49 | | | 0.56 | |
| | Net realized and unrealized gain/(loss) | | 9.68 | | | (12.56) | | | 10.01 | | | 7.01 | | | (3.91) | | | (3.14) | |
| Total from Investment Operations | | 10.10 | | | (11.61) | | | 10.36 | | | 7.35 | | | (3.42) | | | (2.58) | |
| Less Dividends and Distributions: | | | | | | | | | | | | | | | | | | |
| | Dividends (from net investment income) | | (1.05) | | | (0.19) | | | (0.21) | | | (0.41) | | | (1.36) | | | (0.67) | |
| Total Dividends and Distributions | | (1.05) | | | (0.19) | | | (0.21) | | | (0.41) | | | (1.36) | | | (0.67) | |
| Net Asset Value, End of Period | | $41.20 | | | $32.15 | | | $43.95 | | | $33.80 | | | $26.86 | | | $31.64 | |
| Total Return* | | 31.75% | | | (26.54)% | | | 30.72% | | | 27.51% | | | (10.25)% | | | (7.54)% | |
| Net Assets, End of Period (in thousands) | | $21,840 | | | $14,170 | | | $9,763 | | | $4,371 | | | $139 | | | $284 | |
| Average Net Assets for the Period (in thousands) | | $19,343 | | | $13,374 | | | $9,327 | | | $3,114 | | | $207 | | | $332 | |
| Ratios to Average Net Assets**: | | | | | | | | | | | | | | | | | | |
| | Ratio of Gross Expenses | | 1.24%(3) | | | 1.11% | | | 1.11% | | | 1.20% | | | 2.56% | | | 1.43% | |
| | Ratio of Net Expenses (After Waivers and Expense Offsets) | | 1.03% | | | 0.97% | | | 0.96% | | | 0.96% | | | 0.97% | | | 0.97% | |
| | Ratio of Net Investment Income/(Loss) | | 2.20%(2) | | | 2.40% | | | 0.85% | | | 1.17% | | | 1.82% | | | 1.68% | |
| Portfolio Turnover Rate | | 67% | | | 145% | | | 184% | | | 160% | | | 145% | | | 82% | |
| | | | | | | | | | | | | | | | | | | | | | |
| |
* Total return includes adjustments in accordance with generally accepted accounting principles required at the year or period end and are not annualized for periods of less than one full year. ** Annualized for periods of less than one full year. (1) Per share amounts are calculated based on average shares outstanding during the year or period. (2) Net investment income/(loss) per share and Ratio of Net Investment Income/(Loss) to Average Net Assets include foreign withholding tax reclaims received in January 2023 and March 2023. The impact of the foreign withholding tax reclaims received, net of the related professional fees, to Net investment income/(loss) per share and Ratio of Net Investment Income/(Loss) to Average Net Assets is $0.18 and 0.94%, respectively. (3) Ratio of Gross Expenses includes additional professional fees related to foreign withholding tax reclaims received in January 2023 and March 2023. The impact of the additional professional fees to Ratio of Gross Expenses is 0.14%. |
| | |
See Notes to Financial Statements. |
| |
Janus Investment Fund | 21 |
Janus Henderson European Focus Fund
Financial Highlights
| | | | | | | | | | | | | | | | | | | | | | |
Class S Shares | | | | | | | | | | | | | | | | | | |
For a share outstanding during the period ended March 31, 2023 (unaudited) and the year ended September 30 | 2023 | | | 2022 | | | 2021 | | | 2020 | | | 2019 | | | 2018 | |
| Net Asset Value, Beginning of Period | | $31.03 | | | $42.42 | | | $32.57 | | | $25.98 | | | $31.53 | | | $35.01 | |
| Income/(Loss) from Investment Operations: | | | | | | | | | | | | | | | | | | |
| | Net investment income/(loss)(1) | | 0.35(2) | | | 0.88 | | | 0.23 | | | 0.11 | | | 0.45 | | | 0.47 | |
| | Net realized and unrealized gain/(loss) | | 9.31 | | | (12.13) | | | 9.73 | | | 6.85 | | | (3.98) | | | (3.20) | |
| Total from Investment Operations | | 9.66 | | | (11.25) | | | 9.96 | | | 6.96 | | | (3.53) | | | (2.73) | |
| Less Dividends and Distributions: | | | | | | | | | | | | | | | | | | |
| | Dividends (from net investment income) | | (1.02) | | | (0.14) | | | (0.11) | | | (0.37) | | | (2.02) | | | (0.75) | |
| Total Dividends and Distributions | | (1.02) | | | (0.14) | | | (0.11) | | | (0.37) | | | (2.02) | | | (0.75) | |
| Net Asset Value, End of Period | | $39.67 | | | $31.03 | | | $42.42 | | | $32.57 | | | $25.98 | | | $31.53 | |
| Total Return* | | 31.47% | | | (26.61)% | | | 30.63% | | | 26.93% | | | (10.35)% | | | (7.96)% | |
| Net Assets, End of Period (in thousands) | | $267 | | | $101 | | | $85 | | | $54 | | | $43 | | | $48 | |
| Average Net Assets for the Period (in thousands) | | $203 | | | $95 | | | $68 | | | $48 | | | $43 | | | $50 | |
| Ratios to Average Net Assets**: | | | | | | | | | | | | | | | | | | |
| | Ratio of Gross Expenses | | 3.15%(3) | | | 4.51% | | | 5.71% | | | 7.83% | | | 8.50% | | | 4.42% | |
| | Ratio of Net Expenses (After Waivers and Expense Offsets) | | 1.41% | | | 1.10% | | | 1.07% | | | 1.34% | | | 1.17% | | | 1.35% | |
| | Ratio of Net Investment Income/(Loss) | | 1.93%(2) | | | 2.27% | | | 0.58% | | | 0.40% | | | 1.73% | | | 1.42% | |
| Portfolio Turnover Rate | | 67% | | | 145% | | | 184% | | | 160% | | | 145% | | | 82% | |
| | | | | | | | | | | | | | | | | | | | | | |
| |
* Total return includes adjustments in accordance with generally accepted accounting principles required at the year or period end and are not annualized for periods of less than one full year. ** Annualized for periods of less than one full year. (1) Per share amounts are calculated based on average shares outstanding during the year or period. (2) Net investment income/(loss) per share and Ratio of Net Investment Income/(Loss) to Average Net Assets include foreign withholding tax reclaims received in January 2023 and March 2023. The impact of the foreign withholding tax reclaims received, net of the related professional fees, to Net investment income/(loss) per share and Ratio of Net Investment Income/(Loss) to Average Net Assets is $0.17 and 0.94%, respectively. (3) Ratio of Gross Expenses includes additional professional fees related to foreign withholding tax reclaims received in January 2023 and March 2023. The impact of the additional professional fees to Ratio of Gross Expenses is 0.14%. |
| | |
See Notes to Financial Statements. |
| |
22 | MARCH 31, 2023 |
Janus Henderson European Focus Fund
Financial Highlights
| | | | | | | | | | | | | | | | | | | | | | |
Class T Shares | | | | | | | | | | | | | | | | | | |
For a share outstanding during the period ended March 31, 2023 (unaudited) and the year ended September 30 | 2023 | | | 2022 | | | 2021 | | | 2020 | | | 2019 | | | 2018 | |
| Net Asset Value, Beginning of Period | | $32.27 | | | $44.17 | | | $34.02 | | | $27.06 | | | $31.57 | | | $35.03 | |
| Income/(Loss) from Investment Operations: | | | | | | | | | | | | | | | | | | |
| | Net investment income/(loss)(1) | | 0.41(2) | | | 0.93 | | | 0.20 | | | 0.12 | | | 0.47 | | | 0.54 | |
| | Net realized and unrealized gain/(loss) | | 9.68 | | | (12.70) | | | 10.12 | | | 7.20 | | | (3.90) | | | (3.21) | |
| Total from Investment Operations | | 10.09 | | | (11.77) | | | 10.32 | | | 7.32 | | | (3.43) | | | (2.67) | |
| Less Dividends and Distributions: | | | | | | | | | | | | | | | | | | |
| | Dividends (from net investment income) | | (0.95) | | | (0.13) | | | (0.17) | | | (0.36) | | | (1.08) | | | (0.79) | |
| Total Dividends and Distributions | | (0.95) | | | (0.13) | | | (0.17) | | | (0.36) | | | (1.08) | | | (0.79) | |
| Net Asset Value, End of Period | | $41.41 | | | $32.27 | | | $44.17 | | | $34.02 | | | $27.06 | | | $31.57 | |
| Total Return* | | 31.58% | | | (26.73)% | | | 30.41% | | | 27.20% | | | (10.43)% | | | (7.79)% | |
| Net Assets, End of Period (in thousands) | | $14,472 | | | $7,392 | | | $10,590 | | | $1,579 | | | $676 | | | $929 | |
| Average Net Assets for the Period (in thousands) | | $10,196 | | | $10,408 | | | $5,237 | | | $839 | | | $762 | | | $1,598 | |
| Ratios to Average Net Assets**: | | | | | | | | | | | | | | | | | | |
| | Ratio of Gross Expenses | | 1.54%(3) | | | 1.37% | | | 1.38% | | | 1.70% | | | 1.76% | | | 1.31% | |
| | Ratio of Net Expenses (After Waivers and Expense Offsets) | | 1.31% | | | 1.22% | | | 1.21% | | | 1.19% | | | 1.18% | | | 1.20% | |
| | Ratio of Net Investment Income/(Loss) | | 2.17%(2) | | | 2.25% | | | 0.47% | | | 0.41% | | | 1.74% | | | 1.59% | |
| Portfolio Turnover Rate | | 67% | | | 145% | | | 184% | | | 160% | | | 145% | | | 82% | |
| | | | | | | | | | | | | | | | | | | | | | |
| |
* Total return includes adjustments in accordance with generally accepted accounting principles required at the year or period end and are not annualized for periods of less than one full year. ** Annualized for periods of less than one full year. (1) Per share amounts are calculated based on average shares outstanding during the year or period. (2) Net investment income/(loss) per share and Ratio of Net Investment Income/(Loss) to Average Net Assets include foreign withholding tax reclaims received in January 2023 and March 2023. The impact of the foreign withholding tax reclaims received, net of the related professional fees, to Net investment income/(loss) per share and Ratio of Net Investment Income/(Loss) to Average Net Assets is $0.18 and 0.94%, respectively. (3) Ratio of Gross Expenses includes additional professional fees related to foreign withholding tax reclaims received in January 2023 and March 2023. The impact of the additional professional fees to Ratio of Gross Expenses is 0.14%. |
| | |
See Notes to Financial Statements. |
| |
Janus Investment Fund | 23 |
Janus Henderson European Focus Fund
Notes to Financial Statements (unaudited)
1. Organization and Significant Accounting Policies
Janus Henderson European Focus Fund (the “Fund”) is a series of Janus Investment Fund (the “Trust”), which is organized as a Massachusetts business trust and is registered under the Investment Company Act of 1940, as amended (the “1940 Act”), as an open-end management investment company, and therefore has applied the specialized accounting and reporting guidance in Financial Accounting Standards Board (“FASB”) Accounting Standards Codification (“ASC”) Topic 946. The Trust offers 40 funds, each of which offers multiple share classes, with differing investment objectives and policies. The Fund seeks long-term capital appreciation primarily through investment in equities of European companies. The Fund is classified as diversified, as defined in the 1940 Act. Janus Henderson Investors US LLC is the investment adviser (the “Adviser”) to the Fund.
The Fund offers multiple classes of shares in order to meet the needs of various types of investors. Each class represents an interest in the same portfolio of investments. Certain financial intermediaries may not offer all classes of shares.
Shareholders, including individuals, accounts, as well as the Fund’s portfolio manager(s) and/or investment personnel, may from time to time own (beneficially or of record) a significant percentage of the Fund’s Shares and can be considered to “control” the Fund when that ownership exceeds 25% of the Fund’s assets (and which may differ from control as determined in accordance with United States of America generally accepted accounting principles ("US GAAP")).
Class A Shares are offered through financial intermediary platforms including, but not limited to, traditional brokerage platforms, mutual fund wrap fee programs, bank trust platforms, and retirement platforms.
Class C Shares are offered through financial intermediary platforms including, but not limited to, traditional brokerage platforms, mutual fund wrap fee programs, and bank trust platforms.
Class C Shares are closed to investments by new employer-sponsored retirement plans and existing employer-sponsored retirement plans are no longer able to make additional purchases or exchanges into Class C Shares.
The Fund currently implements an automatic conversion feature pursuant to which Class C Shares that have been held for eight years are automatically converted to Class A Shares without the imposition of any sales charge, fee or other charge. The conversion will generally occur no later than ten business days in the month following the month of the eighth anniversary of the date of purchase. Class C Shares purchased through the reinvestment of dividends and other distributions on Class C Shares will convert to Class A Shares at the same time as the original Class C Shares with respect to which they were purchased. For Class C Shares held in omnibus accounts on intermediary platforms, the Fund relies on these intermediaries to implement this conversion feature. Your financial intermediary may have separate policies and procedures as to when and how Class C Shares may be converted to Class A Shares.
Effective July 6, 2020, Class D Shares are available to new investors, subject to any closed fund policies for a Fund, as applicable. Previously, Class D Shares were only available to investors who already had a direct account with the Janus Henderson funds; immediate family members or members of the same household of an eligible individual investor; and existing beneficial owners of sole proprietorships or partnerships that hold accounts directly with the Janus Henderson funds.
Class I Shares are available through certain financial intermediary platforms including, but not limited to, mutual fund wrap fee programs, managed account programs, asset allocation programs, bank trust platforms, as well as certain retirement platforms. Class I Shares are also available to certain direct institutional investors including, but not limited to, corporations, certain retirement plans, public plans, and foundations/endowments, who established Class I Share accounts before August 4, 2017.
Class N Shares are generally available only to financial intermediaries purchasing on behalf of: 1) certain adviser-assisted, employer-sponsored retirement plans, including 401(k) plans, 457 plans, 403(b) plans, Taft-Hartley multi-employer plans, profit-sharing and money purchase pension plans, defined benefit plans and certain welfare benefit plans, such as health savings accounts, and nonqualified deferred compensation plans; and 2) retail investors purchasing in qualified or nonqualified accounts, whose accounts are held through an omnibus account at their financial intermediary, and where the financial intermediary requires no payment or reimbursement from the Fund, the Adviser, or its affiliates. Class N Shares are also available to Janus Henderson proprietary products and to certain direct institutional investors approved by Janus Henderson Distributors US LLC (the “Distributor”) including, but not limited to,
Janus Henderson European Focus Fund
Notes to Financial Statements (unaudited)
corporations, certain retirement plans, public plans, and foundations and endowments, subject to minimum investment requirements.
Class S Shares are offered through financial intermediary platforms including, but not limited to, retirement platforms and asset allocation, mutual fund wrap, or other discretionary or nondiscretionary fee-based investment advisory programs. In addition, Class S Shares may be available through certain financial intermediaries who have an agreement with the Adviser or its affiliates to offer Class S Shares on their supermarket platforms.
Class T Shares are available through certain financial intermediary platforms including, but not limited to, mutual fund wrap fee programs, managed account programs, asset allocation programs, bank trust platforms, as well as certain retirement platforms. In addition, Class T Shares may be available through certain financial intermediaries who have an agreement with the Adviser or its affiliates to offer Class T Shares on their supermarket platforms.
The following accounting policies have been followed by the Fund and are in conformity with US GAAP.
Investment Valuation
Fund holdings are valued in accordance with policies and procedures established by the Adviser pursuant to Rule 2a-5 under the 1940 Act and approved by and subject to the oversight of the Trustees (the “Valuation Procedures”). Equity securities traded on a domestic securities exchange are generally valued at readily available market quotations, which are (i) the official close prices or (ii) last sale prices on the primary market or exchange in which the securities trade. If such price is lacking for the trading period immediately preceding the time of determination, such securities are generally valued at their current bid price. Equity securities that are traded on a foreign exchange are generally valued at the closing prices on such markets. In the event that there is no current trading volume on a particular security in such foreign exchange, the bid price from the primary exchange is generally used to value the security. Foreign securities and currencies are converted to U.S. dollars using the current spot USD dollar exchange rate in effect at the close of the New York Stock Exchange (“NYSE”). The Fund will determine the market value of individual securities held by it by using prices provided by one or more approved professional pricing services or, as needed, by obtaining market quotations from independent broker-dealers. Most debt securities are valued in accordance with the evaluated bid price supplied by the Adviser-approved pricing service that is intended to reflect market value. The evaluated bid price supplied by the pricing service is an evaluation that may consider factors such as security prices, yields, maturities and ratings. Certain short-term securities maturing within 60 days or less may be evaluated and valued on an amortized cost basis provided that the amortized cost determined approximates market value. Securities for which market quotations or evaluated prices are not readily available or deemed unreliable are valued at fair value determined in good faith by the Adviser pursuant to the Valuation Procedures. Circumstances in which fair valuation may be utilized include, but are not limited to: (i) a significant event that may affect the securities of a single issuer, such as a merger, bankruptcy, or significant issuer-specific development; (ii) an event that may affect an entire market, such as a natural disaster or significant governmental action; (iii) a nonsignificant event such as a market closing early or not opening, or a security trading halt; and (iv) pricing of a nonvalued security and a restricted or nonpublic security. Special valuation considerations may apply with respect to “odd-lot” fixed-income transactions which, due to their small size, may receive evaluated prices by pricing services which reflect a large block trade and not what actually could be obtained for the odd-lot position. The valuation policies provide for the use of systematic fair valuation models provided by independent pricing services to value foreign equity securities in order to adjust for stale pricing, which may occur between the close of certain foreign exchanges and the close of the NYSE. The value of the securities of other mutual funds held by a Fund, if any, will be calculated using the NAV of such mutual funds.
Valuation Inputs Summary
FASB ASC 820, Fair Value Measurements and Disclosures (“ASC 820”), defines fair value, establishes a framework for measuring fair value, and expands disclosure requirements regarding fair value measurements. This standard emphasizes that fair value is a market-based measurement that should be determined based on the assumptions that market participants would use in pricing an asset or liability and establishes a hierarchy that prioritizes inputs to valuation techniques used to measure fair value. These inputs are summarized into three broad levels:
Level 1 – Unadjusted quoted prices in active markets the Fund has the ability to access for identical assets or liabilities.
Level 2 – Observable inputs other than unadjusted quoted prices included in Level 1 that are observable for the asset or liability either directly or indirectly. These inputs may include quoted prices for the identical instrument on
Janus Henderson European Focus Fund
Notes to Financial Statements (unaudited)
an inactive market, prices for similar instruments, interest rates, prepayment speeds, credit risk, yield curves, default rates and similar data.
Assets or liabilities categorized as Level 2 in the hierarchy generally include: debt securities fair valued in accordance with the evaluated bid or ask prices supplied by a pricing service; securities traded on OTC markets and listed securities for which no sales are reported that are fair valued at the latest bid price (or yield equivalent thereof) obtained from one or more dealers transacting in a market for such securities or by a pricing service approved by the Fund’s Trustees; certain short-term debt securities with maturities of 60 days or less that are fair valued at amortized cost; and equity securities of foreign issuers whose fair value is determined by using systematic fair valuation models provided by independent third parties in order to adjust for stale pricing which may occur between the close of certain foreign exchanges and the close of the NYSE. Other securities that may be categorized as Level 2 in the hierarchy include, but are not limited to, preferred stocks, bank loans, swaps, investments in unregistered investment companies, options, and forward contracts.
Level 3 – Unobservable inputs for the asset or liability to the extent that relevant observable inputs are not available, representing the Fund’s own assumptions about the assumptions that a market participant would use in valuing the asset or liability, and that would be based on the best information available.
There have been no significant changes in valuation techniques used in valuing any such positions held by the Fund since the beginning of the fiscal period.
The inputs or methodology used for fair valuing securities are not necessarily an indication of the risk associated with investing in those securities. The summary of inputs used as of March 31, 2023 to fair value the Fund’s investments in securities and other financial instruments is included in the “Valuation Inputs Summary” in the Notes to Schedule of Investments and Other Information.
Investment Transactions and Investment Income
Investment transactions are accounted for as of the date purchased or sold (trade date). Dividend income is recorded on the ex-dividend date. Certain dividends from foreign securities will be recorded as soon as the Fund is informed of the dividend, if such information is obtained subsequent to the ex-dividend date. Dividends from foreign securities may be subject to withholding taxes in foreign jurisdictions. Non-cash dividends, if any, are recorded on the ex-dividend date at fair value. Interest income is recorded daily on an accrual basis and includes amortization of premiums and accretion of discounts. The Fund classifies gains and losses on prepayments received as an adjustment to interest income. Debt securities may be placed in non-accrual status and related interest income may be reduced by stopping current accruals and writing off interest receivables when collection of all or a portion of interest has become doubtful. Gains and losses are determined on the identified cost basis, which is the same basis used for federal income tax purposes. Income, as well as gains and losses, both realized and unrealized, are allocated daily to each class of shares based upon the ratio of net assets represented by each class as a percentage of total net assets.
Expenses
The Fund bears expenses incurred specifically on its behalf. Each class of shares bears a portion of general expenses, which are allocated daily to each class of shares based upon the ratio of net assets represented by each class as a percentage of total net assets. Expenses directly attributable to a specific class of shares are charged against the operations of such class.
Estimates
The preparation of financial statements in conformity with US GAAP requires management to make estimates and assumptions that affect the reported amount of assets and liabilities and disclosure of contingent assets and liabilities at the date of the financial statements, and the reported amounts of income and expenses during the reporting period. Actual results could differ from those estimates.
Indemnifications
In the normal course of business, the Fund may enter into contracts that contain provisions for indemnification of other parties against certain potential liabilities. The Fund’s maximum exposure under these arrangements is unknown, and would involve future claims that may be made against the Fund that have not yet occurred. Currently, the risk of material loss from such claims is considered remote.
Janus Henderson European Focus Fund
Notes to Financial Statements (unaudited)
Foreign Currency Translations
The Fund does not isolate that portion of the results of operations resulting from the effect of changes in foreign exchange rates on investments from the fluctuations arising from changes in market prices of securities held at the date of the financial statements. Net unrealized appreciation or depreciation of investments and foreign currency translations arise from changes in the value of assets and liabilities, including investments in securities held at the date of the financial statements, resulting from changes in the exchange rates and changes in market prices of securities held.
Currency gains and losses are also calculated on payables and receivables that are denominated in foreign currencies. The payables and receivables are generally related to foreign security transactions and income translations.
Foreign currency-denominated assets and forward currency contracts may involve more risks than domestic transactions, including currency risk, counterparty risk, political and economic risk, regulatory risk and equity risk. Risks may arise from unanticipated movements in the value of foreign currencies relative to the U.S. dollar.
Dividends and Distributions
The Fund generally declares and distributes dividends of net investment income and realized capital gains (if any) annually. The Fund may treat a portion of the amount paid to redeem shares as a distribution of investment company taxable income and realized capital gains that are reflected in the net asset value. This practice, commonly referred to as “equalization,” has no effect on the redeeming shareholder or a Fund’s total return, but may reduce the amounts that would otherwise be required to be paid as taxable dividends to the remaining shareholders. It is possible that the Internal Revenue Service (IRS) could challenge the Fund's equalization methodology or calculations, and any such challenge could result in additional tax, interest, or penalties to be paid by the Fund.
The Fund may make certain investments in real estate investment trusts (“REITs”) which pay dividends to their shareholders based upon funds available from operations. It is quite common for these dividends to exceed the REITs’ taxable earnings and profits, resulting in the excess portion of such dividends being designated as a return of capital. If the Fund distributes such amounts, such distributions could constitute a return of capital to shareholders for federal income tax purposes.
Federal Income Taxes
The Fund intends to continue to qualify as a regulated investment company and distribute all of its taxable income in accordance with the requirements of Subchapter M of the Internal Revenue Code. Management has analyzed the Fund’s tax positions taken for all open federal income tax years, generally a three-year period, and has concluded that no provision for federal income tax is required in the Fund’s financial statements. The Fund is not aware of any tax positions for which it is reasonably possible that the total amounts of unrecognized tax benefits will significantly change in the next twelve months.
Foreign Taxes
The Fund may file withholding tax reclaims in certain jurisdictions to recover a portion of amounts previously withheld. As a result of rulings from European courts, the Fund filed for additional reclaims related to prior years. These reclaims are recorded when the amount is known and there are no significant uncertainties on collectability. The Statement of Operations reflects $2,469,060 of tax reclaims received as well as $264,238 of professional fees and $277,948 of certain fees assessed by the Internal Revenue Service due to the recovery of foreign withholding taxes after such amounts were previously passed through to Fund shareholders as foreign tax credits.
2. Derivative Instruments
The Fund may invest in various types of derivatives, which may at times result in significant derivative exposure. A derivative is a financial instrument whose performance is derived from the performance of another asset. The Fund may invest in derivative instruments including, but not limited to: futures contracts, put options, call options, options on futures contracts, options on foreign currencies, options on recovery locks, options on security and commodity indices, swaps, forward contracts, structured investments, and other equity-linked derivatives. Each derivative instrument that was held by the Fund during the period ended March 31, 2023 is discussed in further detail below. A summary of derivative activity by the Fund is reflected in the tables at the end of the Schedule of Investments.
The Fund may use derivative instruments for hedging purposes (to offset risks associated with an investment, currency exposure, or market conditions), to adjust currency exposure relative to a benchmark index, or for speculative purposes
Janus Henderson European Focus Fund
Notes to Financial Statements (unaudited)
(to earn income and seek to enhance returns). When the Fund invests in a derivative for speculative purposes, the Fund will be fully exposed to the risks of loss of that derivative, which may sometimes be greater than the derivative’s cost. The Fund may not use any derivative to gain exposure to an asset or class of assets that it would be prohibited by its investment restrictions from purchasing directly. The Fund’s ability to use derivative instruments may also be limited by tax considerations.
Investments in derivatives in general are subject to market risks that may cause their prices to fluctuate over time. Investments in derivatives may not directly correlate with the price movements of the underlying instrument. As a result, the use of derivatives may expose the Fund to additional risks that it would not be subject to if it invested directly in the securities underlying those derivatives. The use of derivatives may result in larger losses or smaller gains than otherwise would be the case. Derivatives can be volatile and may involve significant risks.
In pursuit of its investment objective, the Fund may seek to use derivatives to increase or decrease exposure to the following market risk factors:
· Commodity Risk – the risk related to the change in value of commodities or commodity-linked investments due to changes in the overall market movements, volatility of the underlying benchmark, changes in interest rates, or other factors affecting a particular industry or commodity such as drought, floods, weather, livestock disease, embargoes, tariffs, and international economic, political, and regulatory developments.
· Counterparty Risk – the risk that the counterparty (the party on the other side of the transaction) on a derivative transaction will be unable to honor its financial obligation to the Fund.
· Credit Risk – the risk an issuer will be unable to make principal and interest payments when due, or will default on its obligations.
· Currency Risk – the risk that changes in the exchange rate between currencies will adversely affect the value (in U.S. dollar terms) of an investment.
· Equity Risk – the risk related to the change in value of equity securities as they relate to increases or decreases in the general market.
· Index Risk – if the derivative is linked to the performance of an index, it will be subject to the risks associated with changes in that index. If the index changes, the Fund could receive lower interest payments or experience a reduction in the value of the derivative to below what the Fund paid. Certain indexed securities, including inverse securities (which move in an opposite direction to the index), may create leverage, to the extent that they increase or decrease in value at a rate that is a multiple of the changes in the applicable index.
· Interest Rate Risk – the risk that the value of fixed-income securities will generally decline as prevailing interest rates rise, which may cause the Fund’s NAV to likewise decrease.
· Leverage Risk – the risk associated with certain types of leveraged investments or trading strategies pursuant to which relatively small market movements may result in large changes in the value of an investment. The Fund creates leverage by investing in instruments, including derivatives, where the investment loss can exceed the original amount invested. Certain investments or trading strategies, such as short sales, that involve leverage can result in losses that greatly exceed the amount originally invested.
· Liquidity Risk – the risk that certain securities may be difficult or impossible to sell at the time that the seller would like or at the price that the seller believes the security is currently worth.
Derivatives may generally be traded OTC or on an exchange. Derivatives traded OTC are agreements that are individually negotiated between parties and can be tailored to meet a purchaser’s needs. OTC derivatives are not guaranteed by a clearing agency and may be subject to increased credit risk.
In an effort to mitigate credit risk associated with derivatives traded OTC, the Fund may enter into collateral agreements with certain counterparties whereby, subject to certain minimum exposure requirements, the Fund may require the counterparty to post collateral if the Fund has a net aggregate unrealized gain on all OTC derivative contracts with a particular counterparty. Additionally, the Fund may deposit cash and/or treasuries as collateral with the counterparty and/or custodian daily (based on the daily valuation of the financial asset) if the Fund has a net aggregate unrealized loss on OTC derivative contracts with a particular counterparty. All liquid securities and restricted cash are considered to
Janus Henderson European Focus Fund
Notes to Financial Statements (unaudited)
cover in an amount at all times equal to or greater than the Fund’s commitment with respect to certain exchange-traded derivatives, centrally cleared derivatives, forward foreign currency exchange contracts, short sales, and/or securities with extended settlement dates. There is no guarantee that counterparty exposure is reduced and these arrangements are dependent on the Adviser’s ability to establish and maintain appropriate systems and trading.
Futures Contracts
A futures contract is an exchange-traded agreement to take or make delivery of an underlying asset at a specific time in the future for a specific predetermined negotiated price. The Fund may enter into futures contracts to gain exposure to the stock market or other markets pending investment of cash balances or to meet liquidity needs. The Fund is subject to interest rate risk, equity risk, and currency risk in the normal course of pursuing its investment objective through its investments in futures contracts. The Fund may also use such derivative instruments to hedge or protect from adverse movements in securities prices, currency rates or interest rates. The use of futures contracts may involve risks such as the possibility of illiquid markets or imperfect correlation between the values of the contracts and the underlying securities, or that the counterparty will fail to perform its obligations.
Futures contracts are valued at the settlement price on valuation date on the exchange as reported by an approved vendor. Mini contracts, as defined in the description of the contract, shall be valued using the Actual Settlement Price or “ASET” price type as reported by an approved vendor. In the event that foreign futures trade when the foreign equity markets are closed, the last foreign futures trade price shall be used.
Futures contracts are marked-to-market daily, and the daily variation margin is recorded as a receivable or payable on the Statement of Assets and Liabilities (if applicable). The change in unrealized net appreciation/depreciation is reported on the Statement of Operations (if applicable). When a contract is closed, a realized gain or loss is reported on the Statement of Operations (if applicable), equal to the difference between the opening and closing value of the contract.
Securities held by the Fund that are designated as collateral for market value on futures contracts are noted on the Schedule of Investments (if applicable). Such collateral is in the possession of the Fund’s futures commission merchant.
With futures, there is minimal counterparty credit risk to the Fund since futures are exchange-traded and the exchange’s clearinghouse, as counterparty to all exchange-traded futures, guarantees the futures against default.
During the period, the Fund purchased futures on equity indices to increase exposure to equity risk.
During the period, the Fund sold futures on equity indices to decrease exposure to equity risk.
There were no futures held at March 31, 2023.
Options Contracts
An options contract provides the purchaser with the right, but not the obligation, to buy (call option) or sell (put option) a financial instrument at an agreed upon price on or before a specified date. The purchaser pays a premium to the seller for this right. The seller has the corresponding obligation to sell or buy a financial instrument if the purchaser (owner) "exercises" the option. When an option is exercised, the proceeds on sales for a written call option, the purchase cost for a written put option, or the cost of the security for a purchased put or call option are adjusted by the amount of premium received or paid. Upon expiration, or closing of the option transaction, a realized gain or loss is reported on the Statement of Operations (if applicable). The difference between the premium paid/received and the market value of the option is recorded as unrealized appreciation or depreciation. The net change in unrealized appreciation or depreciation is reported on the Statement of Operations (if applicable). Option contracts are typically valued using an approved vendor’s option valuation model. To the extent reliable market quotations are available, option contracts are valued using market quotations. In cases when an approved vendor cannot provide coverage for an option and there is no reliable market quotation, a broker quotation or an internal valuation using the Black-Scholes model, the Cox-Rubinstein Binomial Option Pricing Model, or other appropriate option pricing model is used. Certain options contracts are marked-to-market daily, and the daily variation margin is recorded as a receivable or payable on the Statement of Assets and Liabilities as “Variation margin receivable” or “Variation margin payable” (if applicable).
The Fund may use options contracts to hedge against changes in interest rates, the values of equities, or foreign currencies. The Fund generally invests in options to hedge against adverse movements in the value of portfolio holdings. The use of such instruments may involve certain additional risks as a result of unanticipated movements in the market. A lack of correlation between the value of an instrument underlying an option and the asset being hedged, or
Janus Henderson European Focus Fund
Notes to Financial Statements (unaudited)
unexpected adverse price movements, could render the Fund’s hedging strategy unsuccessful. In addition, there can be no assurance that a liquid secondary market will exist for any option purchased or sold. The Fund may be subject to counterparty risk, interest rate risk, liquidity risk, equity risk, commodity risk, and currency risk in the normal course of pursuing its investment objective through its investments in options contracts.
Options traded on an exchange are regulated and the terms of the options are standardized. Options traded OTC expose the Fund to counterparty risk in the event that the counterparty does not perform. This risk is mitigated by having a netting arrangement between the Fund and the counterparty and by having the counterparty post collateral to cover the Fund’s exposure to the counterparty.
The Fund may purchase put options to hedge against a decline in the value of its portfolio. By using put options in this way, the Fund will reduce any profit it might otherwise have realized in the underlying security by the amount of the premium paid for the put option and by transaction costs. The Fund may purchase call options to hedge against an increase in the price of securities that it may buy in the future. The premium paid for the call option plus any transaction costs will reduce the benefit, if any, realized by the Fund upon exercise of the option, and, unless the price of the underlying security rises sufficiently, the option may expire worthless to the Fund. The risk in buying options is that the Fund pays a premium whether or not the options are exercised. Options purchased are reported in the Schedule of Investments (if applicable).
During the period, the Fund purchased call options on various equity index securities for the purpose of increasing exposure to broad equity risk.
During the period, the Fund purchased put options on various equity index securities for the purpose of decreasing exposure to broad equity risk.
There were no purchased options held at March 31, 2023.
In writing an option, the Fund bears the risk of an unfavorable change in the price of the security underlying the written option. When an option is written, the Fund receives a premium and becomes obligated to sell or purchase the underlying security at a fixed price, upon exercise of the option. Options written are reported as a liability on the Statement of Assets and Liabilities as “Options written, at value” (if applicable). The risk in writing call options is that the Fund gives up the opportunity for profit if the market price of the security increases and the options are exercised. The risk in writing put options is that the Fund may incur a loss if the market price of the security decreases and the options are exercised. The risk in buying options is that the Fund pays a premium whether or not the options are exercised. Exercise of an option written by the Fund could result in the Fund buying or selling a security at a price different from the current market value.
During the period, the Fund wrote put options on various equity indices for the purpose of increasing exposure to broad equity risk.
During the period, the Fund wrote call options on various equity indices for the purpose of decreasing exposure to broad equity risk.
There were no written options held at March 31, 2023.
3. Other Investments and Strategies
Additional Investment Risk
The U.S. government and the Federal Reserve, as well as certain foreign governments and central banks, have taken extraordinary actions to support local and global economies and the financial markets in response to the COVID-19 pandemic. This and other government intervention into the economy and financial markets to address the COVID-19 pandemic may not work as intended, particularly if the efforts are perceived by investors as being unlikely to achieve the desired results. Government actions to mitigate the economic impact of the pandemic have resulted in a large expansion of government deficits and debt, the long term consequences of which are not known. The COVID-19 pandemic could adversely affect the value and liquidity of a Fund’s investments, impair a Fund’s ability to satisfy redemption requests, and negatively impact a Fund’s performance. In addition, the outbreak of COVID-19, and measures taken to mitigate its effects, could result in disruptions to the services provided to a Fund by its service providers.
Janus Henderson European Focus Fund
Notes to Financial Statements (unaudited)
Widespread disease, including pandemics and epidemics, and natural or environmental disasters, including those which may be attributable to global climate change, such as earthquakes, fires, floods, hurricanes, tsunamis and weather-related phenomena generally, have been and can be highly disruptive to economies and markets, adversely impacting individual companies, sectors, industries, markets, currencies, interest and inflation rates, credit ratings, investor sentiment, and other factors affecting the value of a Fund’s investments. Economies and financial markets throughout the world have become increasingly interconnected, which increases the likelihood that events or conditions in one region or country will adversely affect markets or issuers in other regions or countries, including the United States. These disruptions could prevent a Fund from executing advantageous investment decisions in a timely manner and negatively impact a Fund’s ability to achieve its investment objective(s). Any such event(s) could have a significant adverse impact on the value of a Fund. In addition, these disruptions could also impair the information technology and other operational systems upon which the Fund’s service providers, including the Adviser or the subadviser (as applicable), rely, and could otherwise disrupt the ability of employees of the Fund’s service providers to perform essential tasks on behalf of the Fund. Adverse weather conditions may also have a particularly significant negative effect on issuers in the agricultural sector and on insurance and reinsurance companies that insure or reinsure against the impact of natural disasters.
A number of countries in the European Union (the “EU”) have experienced, and may continue to experience, severe economic and financial difficulties. In particular, many EU nations are susceptible to economic risks associated with high levels of debt. Many non-governmental issuers, and even certain governments, have defaulted on, or been forced to restructure, their debts. Many other issuers have faced difficulties obtaining credit or refinancing existing obligations. Financial institutions have in many cases required government or central bank support, have needed to raise capital, and/or have been impaired in their ability to extend credit. As a result, financial markets in the EU have experienced extreme volatility and declines in asset values and liquidity. These difficulties may continue, worsen, or spread further within the EU. Responses to these financial problems by European governments, central banks, and others, including austerity measures and reforms, may not work, may result in social unrest, and may limit future growth and economic recovery or have other unintended consequences. Among other things, these developments have adversely affected the value and exchange rate of the euro and pound sterling, and may continue to significantly affect the economies of all EU countries, which in turn may have a material adverse effect on the Fund’s investments in such countries, other countries that depend on EU countries for significant amounts of trade or investment, or issuers with exposure to debt issued by certain EU countries.
Counterparties
Fund transactions involving a counterparty are subject to the risk that the counterparty or a third party will not fulfill its obligation to the Fund (“counterparty risk”). Counterparty risk may arise because of the counterparty’s financial condition (i.e., financial difficulties, bankruptcy, or insolvency), market activities and developments, or other reasons, whether foreseen or not. A counterparty’s inability to fulfill its obligation may result in significant financial loss to the Fund. The Fund may be unable to recover its investment from the counterparty or may obtain a limited recovery, and/or recovery may be delayed. The extent of the Fund’s exposure to counterparty risk with respect to financial assets and liabilities approximates its carrying value. See the "Offsetting Assets and Liabilities" section of this Note for further details.
The Fund may be exposed to counterparty risk through participation in various programs, including, but not limited to, lending its securities to third parties, cash sweep arrangements whereby the Fund’s cash balance is invested in one or more types of cash management vehicles, as well as investments in, but not limited to, repurchase agreements, debt securities, and derivatives, including various types of swaps, futures and options. The Fund intends to enter into financial transactions with counterparties that the Adviser believes to be creditworthy at the time of the transaction. There is always the risk that the Adviser’s analysis of a counterparty’s creditworthiness is incorrect or may change due to market conditions. To the extent that the Fund focuses its transactions with a limited number of counterparties, it will have greater exposure to the risks associated with one or more counterparties.
Securities Lending
Under procedures adopted by the Trustees, the Fund may seek to earn additional income by lending securities to certain qualified broker-dealers and institutions. JPMorgan Chase Bank, National Association acts as securities lending agent and a limited purpose custodian or subcustodian to receive and disburse cash balances and cash collateral, hold short-term investments, hold collateral, and perform other custodial functions in accordance with the Non-Custodial Securities Lending Agreement. For financial reporting purposes, the Fund does not offset financial instruments’ payables and receivables and related collateral on the Statement of Assets and Liabilities. The Fund may lend fund
Janus Henderson European Focus Fund
Notes to Financial Statements (unaudited)
securities in an amount equal to up to 1/3 of its total assets as determined at the time of the loan origination. There is the risk of delay in recovering a loaned security or the risk of loss in collateral rights if the borrower fails financially. In addition, the Adviser makes efforts to balance the benefits and risks from granting such loans. All loans will be continuously secured by collateral which may consist of cash, U.S. Government securities, domestic and foreign short-term debt instruments, letters of credit, time deposits, repurchase agreements, money market mutual funds or other money market accounts, or such other collateral as permitted by the SEC. If the Fund is unable to recover a security on loan, the Fund may use the collateral to purchase replacement securities in the market. There is a risk that the value of the collateral could decrease below the cost of the replacement security by the time the replacement investment is made, resulting in a loss to the Fund. In certain circumstances individual loan transactions could yield negative returns.
Upon receipt of cash collateral, the Adviser may invest it in affiliated or non-affiliated cash management vehicles, whether registered or unregistered entities, as permitted by the 1940 Act and rules promulgated thereunder. The Adviser currently intends to primarily invest the cash collateral in a cash management vehicle for which the Adviser serves as investment adviser, Janus Henderson Cash Collateral Fund LLC, or in time deposits. An investment in Janus Henderson Cash Collateral Fund LLC is generally subject to the same risks that shareholders experience when investing in similarly structured vehicles, such as the potential for significant fluctuations in assets as a result of the purchase and redemption activity of the securities lending program, a decline in the value of the collateral, and possible liquidity issues. Such risks may delay the return of the cash collateral and cause the Fund to violate its agreement to return the cash collateral to a borrower in a timely manner. As adviser to the Fund and Janus Henderson Cash Collateral Fund LLC, the Adviser has an inherent conflict of interest as a result of its fiduciary duties to both the Fund and Janus Henderson Cash Collateral Fund LLC. Additionally, the Adviser receives an investment advisory fee of 0.05% for managing Janus Henderson Cash Collateral Fund LLC, but it may not receive a fee for managing certain other affiliated cash management vehicles in which the Fund may invest, and therefore may have an incentive to allocate preferred investment opportunities to investment vehicles for which it is receiving a fee.
The value of the collateral must be at least 102% of the market value of the loaned securities that are denominated in U.S. dollars and 105% of the market value of the loaned securities that are not denominated in U.S. dollars. Loaned securities and related collateral are marked-to-market each business day based upon the market value of the loaned securities at the close of business, employing the most recent available pricing information. Collateral levels are then adjusted based on this mark-to-market evaluation. Additional required collateral, or excess collateral returned, is delivered on the next business day. Therefore, the value of the collateral held may be temporarily less than 102% or 105% value of the securities on loan. The cash collateral invested by the Adviser is disclosed in the Schedule of Investments (if applicable).
Income earned from the investment of the cash collateral, net of rebates paid to, or fees paid by, borrowers and less the fees paid to the lending agent are included as “Affiliated securities lending income, net” on the Statement of Operations. As of March 31, 2023, securities lending transactions accounted for as secured borrowings with an overnight and continuous contractual maturity are $8,222,450. Gross amounts of recognized liabilities for securities lending (collateral received) as of March 31, 2023 is $8,843,750, resulting in the net amount due to the counterparty of $621,300.
Offsetting Assets and Liabilities
The Fund presents gross and net information about transactions that are either offset in the financial statements or subject to an enforceable master netting arrangement or similar agreement with a designated counterparty, regardless of whether the transactions are actually offset in the Statement of Assets and Liabilities.
The Offsetting Assets and Liabilities table located in the Schedule of Investments presents gross amounts of recognized assets and/or liabilities and the net amounts after deducting collateral that has been pledged by counterparties or has been pledged to counterparties (if applicable). For corresponding information grouped by type of instrument, see the Fund's Schedule of Investments.
Janus Henderson European Focus Fund
Notes to Financial Statements (unaudited)
4. Investment Advisory Agreements and Other Transactions with Affiliates
The Fund pays the Adviser an investment advisory fee which is calculated daily and paid monthly. The following table reflects the Fund’s contractual investment advisory fee rate (expressed as an annual rate).
| | |
Average Daily Net Assets of the Fund | Contractual Investment Advisory Fee (%) |
First $500 Million | 1.00 |
Next $1 Billion | 0.90 |
Next $1 Billion | 0.85 |
Over $2.5 Billion | 0.80 |
The Fund’s actual investment advisory fee rate for the reporting period was 1.00% of average annual net assets before any applicable waivers.
The Adviser has entered into a personnel-sharing arrangement with its foreign (non-U.S.) affiliates, Henderson Global Investors Limited, Henderson Global Investors (Japan) Ltd., and Henderson Global Investors (Singapore) Ltd. (collectively, “HGIL”), pursuant to which HGIL and certain employees of HGIL serve as “associated persons” of the Adviser. In this capacity, such employees of HGIL are subject to the oversight and supervision of the Adviser and may provide portfolio management, research, and related services to the Fund on behalf of the Adviser.
The Adviser has contractually agreed to waive the investment advisory fee and/or reimburse operating expenses to the extent that the Fund’s total annual fund operating expenses, excluding the fees payable pursuant to a Rule 12b-1 plan, shareholder servicing fees, such as transfer agency fees (including out-of-pocket costs), administrative services fees and any networking/omnibus payable by any share class, brokerage commissions, interest, dividends, taxes, acquired fund fees and expenses, and extraordinary expenses, exceed the annual rate of 0.96% of the Fund’s average daily net assets. The Adviser has agreed to continue the waivers for at least a one-year period commencing January 27, 2023. If applicable, amounts waived and/or reimbursed to the Fund by the Adviser are disclosed as “Excess Expense Reimbursement and Waivers” on the Statement of Operations.
The Adviser serves as administrator to the Fund pursuant to an administration agreement between the Adviser and the Trust. Under the administration agreement, the Adviser is authorized to perform, or cause others to perform certain administration, compliance, and accounting services to the Fund, including providing office space for the Fund, and is reimbursed by the Fund for certain of its costs in providing these services (to the extent the Adviser seeks reimbursement and such costs are not otherwise waived). In addition, employees of the Adviser and/or its affiliates may serve as officers of the Trust. The Fund pays for some or all of the salaries, fees, and expenses of the Adviser employees and Fund officers, with respect to certain specified administration functions they perform on behalf of the Fund. The Fund pays these costs based on out-of-pocket expenses incurred by the Adviser, and these costs are separate and apart from advisory fees and other expenses paid in connection with the investment advisory services the Adviser (or any subadvisor, as applicable) provides to the Fund. These amounts are disclosed as “Affiliated fund administration fees” on the Statement of Operations. In addition, some expenses related to compensation payable to the Fund’s Chief Compliance Officer and certain compliance staff, all of whom are employees of the Adviser and/or its affiliates, are shared with the Fund. Total compensation of $114,430 was paid to the Chief Compliance Officer and certain compliance staff by the Trust during the period ended March 31, 2023. The Fund's portion is reported as part of “Other expenses” on the Statement of Operations.
Janus Henderson Services US LLC (the “Transfer Agent”), a wholly-owned subsidiary of the Adviser, is the Fund’s transfer agent. The Transfer Agent provides or arranges for the provision of shareholder services including, but not limited to, recordkeeping, subaccounting, answering inquiries regarding accounts, order processing, transaction confirmations, the mailing of prospectuses and shareholder reports, and other shareholder services provided to or on behalf of shareholders. These amounts are disclosed as “Transfer agent administrative fees and expenses” on the Statement of Operations.
Janus Henderson European Focus Fund
Notes to Financial Statements (unaudited)
Class D Shares of the Fund pay the Transfer Agent an annual administrative services fee based on the average daily net assets of Class D Shares as detailed below.
| | |
Average Daily Net Assets of Class D Shares of the Janus Henderson funds | Administrative Services Fee |
Under $40 billion | 0.12% |
$40 billion – $49.9 billion | 0.10% |
Over $49.9 billion | 0.08% |
During the reporting period, the administrative services fee rate was 0.12%.
The Transfer Agent receives an administrative services fee at an annual rate of up to 0.25% of the average daily net assets of the Fund’s Class S Shares and Class T Shares for providing or procuring administrative services to investors in Class S Shares and Class T Shares of the Fund. The Transfer Agent expects to use all or a significant portion of this fee to compensate retirement plan service providers, broker-dealers, bank trust departments, financial advisors, and other financial intermediaries for providing these services. The Transfer Agent may keep certain amounts retained for reimbursement of out-of-pocket costs incurred for servicing clients of Class S Shares and Class T Shares.
Shareholder Services provided by these financial intermediaries may include, but are not limited to, recordkeeping, subaccounting, order processing, providing order confirmations, periodic statements, forwarding prospectuses, shareholder reports, and other materials to existing customers, answering inquiries regarding accounts, and other administrative services. Order processing includes the submission of transactions through the National Securities Clearing Corporation (“NSCC”) or similar systems, or those processed on a manual basis with the Adviser. For all share classes, the Transfer Agent also seeks reimbursement for costs it incurs as transfer agent and for providing servicing.
Certain, but not all, intermediaries may charge administrative fees to investors in Class A Shares, Class C Shares, and Class I Shares for administrative services provided on behalf of such investors. These administrative fees are paid by the Class A Shares, Class C Shares, and Class I Shares of the Fund to the Transfer Agent, which uses such fees to reimburse intermediaries. Consistent with the Transfer Agency Agreement between the Transfer Agent and the Fund, the Transfer Agent may negotiate the level, structure, and/or terms of the administrative fees with intermediaries requiring such fees on behalf of the Fund. The Adviser and its affiliates benefit from an increase in assets that may result from such relationships. The Adviser has agreed to limit these fees up to 0.20% for Class A Shares and Class C Shares, and up to 0.15% for Class I Shares on an annual basis based on the daily net assets of each share class. Such limits are subject to change by the Trustees in the future. These amounts are disclosed as “Transfer agent networking and omnibus fees” on the Statement of Operations.
The Transfer Agent is not compensated for its services related to the shares, except for out-of-pocket costs, although the Transfer Agent is compensated for its services related to Fund’s Class D Shares. These amounts are disclosed as “Other transfer agent fees and expenses” on the Statement of Operations.
Under distribution and shareholder servicing plans (the “Plans”) adopted in accordance with Rule 12b-1 under the 1940 Act, the Fund pays the Trust’s distributor, the Distributor, a wholly-owned subsidiary of the Adviser, a fee for the sale and distribution and/or shareholder servicing of the Shares at an annual rate of up to 0.25% of the Class A Shares’ average daily net assets, of up to 1.00% of the Class C Shares’ average daily net assets and of up to 0.25% of the Class S Shares’ average daily net assets. Under the terms of the Plans, the Trust is authorized to make payments to the Distributor for remittance to retirement plan service providers, broker-dealers, bank trust departments, financial advisors, and other financial intermediaries, as compensation for distribution and/or shareholder services performed by such entities for their customers who are investors in the Fund. These amounts are disclosed as “12b-1 Distribution and shareholder servicing fees” on the Statement of Operations.
Class A Shares include a 5.75% upfront sales charge of the offering price of the Fund. The sales charge is allocated between the Distributor and financial intermediaries. During the period ended March 31, 2023, the Distributor retained upfront sales charges of $3,421.
A contingent deferred sales charge (“CDSC”) of 1.00% will be deducted with respect to Class A Shares purchased without a sales load and redeemed within 12 months of purchase, unless waived. Any applicable CDSC will be 1.00% of the lesser of the original purchase price or the value of the redemption of the Class A Shares redeemed. There were no CDSCs paid by redeeming shareholders of Class A Shares to the Distributor during the period ended March 31, 2023.
Janus Henderson European Focus Fund
Notes to Financial Statements (unaudited)
A CDSC of 1.00% will be deducted with respect to Class C Shares redeemed within 12 months of purchase, unless waived. Any applicable CDSC will be 1.00% of the lesser of the original purchase price or the value of the redemption of the Class C Shares redeemed. During the period ended March 31, 2023, redeeming shareholders of Class C Shares paid CDSCs of $50.
The Board of Trustees has adopted a deferred compensation plan (the “Deferred Plan”) for independent Trustees to elect to defer receipt of all or a portion of the annual compensation they are entitled to receive from the Fund. All deferred fees are credited to an account established in the name of the Trustees. The amounts credited to the account then increase or decrease, as the case may be, in accordance with the performance of one or more of the Janus Henderson funds that are selected by the Trustees. The account balance continues to fluctuate in accordance with the performance of the selected fund or funds until final payment of all amounts are credited to the account. The fluctuation of the account balance is recorded by the Fund as unrealized appreciation/(depreciation) and is included as of March 31, 2023 on the Statement of Assets and Liabilities in the asset, “Trustees’ deferred compensation,” and liability, “Trustees’ deferred compensation fees.” Additionally, the recorded unrealized appreciation/(depreciation) is included in “Total distributable earnings (loss)” on the Statement of Assets and Liabilities. Deferred compensation expenses for the period ended March 31, 2023 are included in “Trustees’ fees and expenses” on the Statement of Operations. Trustees are allowed to change their designation of mutual funds from time to time. Amounts will be deferred until distributed in accordance with the Deferred Plan. Deferred fees of $205,688 were paid by the Trust to the Trustees under the Deferred Plan during the period ended March 31, 2023.
Pursuant to the provisions of the 1940 Act and related rules, the Fund may participate in an affiliated or non-affiliated cash sweep program. In the cash sweep program, uninvested cash balances of the Fund may be used to purchase shares of affiliated or non-affiliated money market funds or cash management pooled investment vehicles that operate as money market funds. The Fund is eligible to participate in the cash sweep program (the “Investing Funds”). The Adviser has an inherent conflict of interest because of its fiduciary duties to the affiliated money market funds or cash management pooled investment vehicles and the Investing Funds. Janus Henderson Cash Liquidity Fund LLC (the “Sweep Vehicle”) is an affiliated unregistered cash management pooled investment vehicle that invests primarily in highly-rated short-term fixed-income securities. The Sweep Vehicle operates pursuant to the provisions of the 1940 Act that govern the operation of money market funds and prices its shares at NAV reflecting market-based values of its portfolio securities (i.e., a “floating” NAV) rounded to the fourth decimal place (e.g., $1.0000). The Sweep Vehicle is permitted to impose a liquidity fee (of up to 2%) on redemptions from the Sweep Vehicle or a redemption gate that temporarily suspends redemptions from the Sweep Vehicle for up to 10 business days during a 90 day period. There are no restrictions on the Fund's ability to withdraw investments from the Sweep Vehicle at will, and there are no unfunded capital commitments due from the Fund to the Sweep Vehicle. The Sweep Vehicle does not charge any management fee, sales charge or service fee.
Any purchases and sales, realized gains/losses and recorded dividends from affiliated investments during the period ended March 31, 2023 can be found in the “Schedules of Affiliated Investments” located in the Schedule of Investments.
As of March 31, 2023, shares of the Fund were owned by affiliates of the Adviser, and/or other funds advised by the Adviser, as indicated in the table below:
| | | | | | | |
Class | % of Class Owned | | % of Fund Owned | | |
Class A Shares | - | % | - | % | |
Class C Shares | - | | - | | |
Class D Shares | - | | - | | |
Class I Shares | - | | - | | |
Class N Shares | 92 | | 4 | | |
Class S Shares | 26 | | -* | | |
Class T Shares | - | | - | | |
| | | | | | |
* | Less than 0.50% | | | | | |
Janus Henderson European Focus Fund
Notes to Financial Statements (unaudited)
5. Federal Income Tax
Income and capital gains distributions are determined in accordance with income tax regulations that may differ from US GAAP. These differences are due to differing treatments for items such as net short-term gains, deferral of wash sale losses, foreign currency transactions, net investment losses, and capital loss carryovers.
The Fund has elected to treat gains and losses on forward foreign currency contracts as capital gains and losses, if applicable. Other foreign currency gains and losses on debt instruments are treated as ordinary income for federal income tax purposes pursuant to Section 988 of the Internal Revenue Code.
Accumulated capital losses noted below represent net capital loss carryovers, as of September 30, 2022, that may be available to offset future realized capital gains and thereby reduce future taxable gains distributions. The following table shows these capital loss carryovers.
| | | | | | |
| | | | | |
Capital Loss Carryover Schedule | | |
For the year ended September 30, 2022 | | |
| No Expiration | | | |
| Short-Term | Long-Term | Accumulated
Capital Losses | | |
| $(233,795,597) | $(213,729,522) | $ (447,525,119) | | |
The aggregate cost of investments and the composition of unrealized appreciation and depreciation of investment securities for federal income tax purposes as of March 31, 2023 are noted below. The primary differences between book and tax appreciation or depreciation of investments are wash sale loss deferrals and investments in partnerships.
| | | | |
Federal Tax Cost | Unrealized
Appreciation | Unrealized
(Depreciation) | Net Tax Appreciation/
(Depreciation) |
$ 427,396,182 | $59,332,088 | $ (8,093,254) | $ 51,238,834 |
Janus Henderson European Focus Fund
Notes to Financial Statements (unaudited)
6. Capital Share Transactions
| | | | | | | |
| | | | | | |
| | Period ended March 31, 2023 | | Year ended September 30, 2022 |
| | Shares | Amount | | Shares | Amount |
| | | | | | | |
Class A Shares: | | | | | |
Shares sold | 206,258 | $ 7,793,911 | | 331,159 | $ 13,680,666 |
Reinvested dividends and distributions | 62,865 | 2,387,003 | | 3,908 | 175,228 |
Shares repurchased | (238,447) | (9,160,539) | | (546,754) | (22,231,611) |
Net Increase/(Decrease) | 30,676 | $ 1,020,375 | | (211,687) | $ (8,375,717) |
Class C Shares: | | | | | |
Shares sold | 8,752 | $ 329,830 | | 30,784 | $ 1,227,701 |
Reinvested dividends and distributions | 3,048 | 109,477 | | - | - |
Shares repurchased | (90,249) | (3,295,653) | | (263,979) | (10,272,046) |
Net Increase/(Decrease) | (78,449) | $ (2,856,346) | | (233,195) | $ (9,044,345) |
Class D Shares: | | | | | |
Shares sold | 33,259 | $ 1,323,524 | | 66,649 | $ 2,930,962 |
Reinvested dividends and distributions | 5,309 | 199,943 | | 731 | 32,517 |
Shares repurchased | (30,091) | (1,174,363) | | (82,413) | (3,430,580) |
Net Increase/(Decrease) | 8,477 | $ 349,104 | | (15,033) | $ (467,101) |
Class I Shares: | | | | | |
Shares sold | 2,098,525 | $84,406,096 | | 1,838,037 | $ 73,103,509 |
Reinvested dividends and distributions | 157,404 | 5,930,996 | | 22,853 | 1,017,664 |
Shares repurchased | (1,189,904) | (46,168,738) | | (2,565,510) | (100,304,392) |
Net Increase/(Decrease) | 1,066,025 | $44,168,354 | | (704,620) | $(26,183,219) |
Class N Shares: | | | | | |
Shares sold | 150,180 | $ 5,746,723 | | 280,620 | $ 11,023,913 |
Reinvested dividends and distributions | 14,988 | 560,866 | | 1,020 | 45,092 |
Shares repurchased | (75,860) | (2,905,784) | | (63,038) | (2,496,505) |
Net Increase/(Decrease) | 89,308 | $ 3,401,805 | | 218,602 | $ 8,572,500 |
Class S Shares: | | | | | |
Shares sold | 3,311 | $ 115,916 | | 1,249 | $ 46,126 |
Reinvested dividends and distributions | 160 | 5,786 | | 7 | 279 |
Shares repurchased | - | - | | - | - |
Net Increase/(Decrease) | 3,471 | $ 121,702 | | 1,256 | $ 46,405 |
Class T Shares: | | | | | |
Shares sold | 153,204 | $ 6,099,256 | | 217,630 | $ 9,367,473 |
Reinvested dividends and distributions | 5,981 | 225,143 | | 773 | 34,381 |
Shares repurchased | (38,774) | (1,511,589) | | (229,049) | (9,478,926) |
Net Increase/(Decrease) | 120,411 | $ 4,812,810 | | (10,646) | $ (77,072) |
7. Purchases and Sales of Investment Securities
For the period ended March 31, 2023, the aggregate cost of purchases and proceeds from sales of investment securities (excluding any short-term securities, short-term options contracts, TBAs, and in-kind transactions, as applicable) was as follows:
| | | | |
Purchases of
Securities | Proceeds from Sales
of Securities | Purchases of Long-
Term U.S. Government
Obligations | Proceeds from Sales
of Long-Term U.S.
Government Obligations |
$312,402,089 | $267,079,436 | $ - | $ - |
Janus Henderson European Focus Fund
Notes to Financial Statements (unaudited)
8. Subsequent Event
Management has evaluated whether any events or transactions occurred subsequent to March 31, 2023 and through the date of issuance of the Fund’s financial statements and determined that there were no material events or transactions that would require recognition or disclosure in the Fund’s financial statements.
Janus Henderson European Focus Fund
Additional Information (unaudited)
Proxy Voting Policies and Voting Record
A description of the policies and procedures that the Fund uses to determine how to vote proxies relating to its portfolio securities is available without charge: (i) upon request, by calling 1-800-525-1093; (ii) on the Fund’s website at janushenderson.com/proxyvoting; and (iii) on the SEC’s website at http://www.sec.gov. Additionally, information regarding the Fund’s proxy voting record for the most recent twelve-month period ended June 30 is also available, free of charge, through janushenderson.com/proxyvoting and from the SEC’s website at http://www.sec.gov.
Full Holdings
The Fund files its complete portfolio holdings (schedule of investments) with the SEC as an exhibit to Form N-PORT within 60 days of the end of the first and third fiscal quarters, and in the annual report and semiannual report to shareholders. The Fund’s Form N-PORT filings and annual and semiannual reports: (i) are available on the SEC’s website at http://www.sec.gov; and (ii) are available without charge, upon request, by calling a Janus Henderson representative at 1-877-335-2687 (toll free) (or 1-800-525-3713 if you hold Class D Shares). Portfolio holdings consisting of at least the names of the holdings are generally available on a monthly basis with a 30-day lag under Full Holdings for the Fund at janushenderson.com/info (or janushenderson.com/reports if you hold Class D Shares).
APPROVAL OF ADVISORY AGREEMENTS DURING THE PERIOD
The Trustees of Janus Aspen Series, each of whom serves as an “independent” Trustee (the “Trustees”), oversee the management of each portfolio of Janus Aspen Series (each, a “VIT Portfolio,” and collectively, the “VIT Portfolios”), as well as each fund of Janus Investment Fund (each, a “Fund,” and collectively, the “Funds” and together with the VIT Portfolios, the “Janus Henderson Funds,” and each, a “Janus Henderson Fund”). As required by law, the Trustees determine annually whether to continue the investment advisory agreement for each Janus Henderson Fund.
In connection with their most recent consideration of those agreements for each Janus Henderson Fund, the Trustees received and reviewed information provided by Janus Henderson Investors US LLC (the “Adviser”) in response to requests of the Trustees and their independent legal counsel. They also received and reviewed information and analysis provided by, and in response to requests of, their independent fee consultant. Throughout their consideration of the agreements, the Trustees were advised by their independent legal counsel. The Trustees met with management to consider the agreements, and also met separately in executive session with their independent legal counsel and their independent fee consultant.
At meetings held on November 9-10, 2022 and December 13-14, 2022, the Trustees evaluated the information provided by the Adviser and the independent fee consultant, as well as other information provided by the Adviser and the independent fee consultant during the year. Following such evaluation, the Trustees determined that the overall arrangements between each Janus Henderson Fund and the Adviser were fair and reasonable in light of the nature, extent, and quality of the services provided by the Adviser and its affiliates, the fees charged for those services, and other matters that the Trustees considered relevant in the exercise of their business judgment, and unanimously approved the continuation of the investment advisory agreement for each Janus Henderson Fund for the period from February 1, 2023 through February 1, 2024, subject to earlier termination as provided for in each agreement.
In considering the continuation of those agreements, the Trustees reviewed and analyzed various factors that they determined were relevant, including the factors described below, none of which by itself was considered dispositive. However, the material factors and conclusions that formed the basis for the Trustees’ determination to approve the continuation of the agreements are discussed separately below. Also included is a summary of the independent fee consultant’s conclusions and opinions that arose during, and were included as part of, the Trustees’ consideration of the agreements. “Management fees,” as used herein, reflect actual annual advisory fees and, for the purpose of peer comparisons any administration fees (excluding out of pocket costs), net of any waivers, paid by a fund as a percentage of average net assets.
Nature, Extent and Quality of Services
The Trustees reviewed the nature, extent, and quality of the services provided by the Adviser to the Janus Henderson Funds, taking into account the investment objective, strategies, and policies of each Janus Henderson Fund, and the knowledge the Trustees gained from their regular meetings with management on at least a quarterly basis and their ongoing review of information related to the Janus Henderson Funds. In addition, the Trustees reviewed the resources and key personnel of the Adviser, particularly noting those employees who provide investment and risk management services to the Janus Henderson Funds. The Trustees also considered other services provided to the Janus Henderson
Janus Henderson European Focus Fund
Additional Information (unaudited)
Funds by the Adviser, such as managing the execution of portfolio transactions and the selection of broker-dealers for those transactions. The Trustees considered the Adviser’s role as administrator to the Janus Henderson Funds, noting that the Adviser generally does not receive a fee for its services as administrator, but is reimbursed for its out-of-pocket costs. The Trustees considered the role of the Adviser in monitoring adherence to the Janus Henderson Funds’ investment restrictions, providing support services for the Trustees and Trustee committees, and overseeing communications with Janus Henderson Fund shareholders and the activities of other service providers, including monitoring compliance with various policies and procedures of the Janus Henderson Funds and with applicable securities laws and regulations.
In this regard, the independent fee consultant noted that the Adviser provides a number of different services for the Janus Henderson Funds and their shareholders, ranging from investment management services to various other servicing functions, and that, in its view, the Adviser is a capable provider of those services. The independent fee consultant also provided its belief that the Adviser has developed a number of institutional competitive advantages that should enable it to provide superior investment and service performance over the long term.
The Trustees concluded that the nature, extent, and quality of the services provided by the Adviser to each Janus Henderson Fund were appropriate and consistent with the terms of the respective advisory agreements, and that, taking into account steps taken to address those Janus Henderson Funds whose performance lagged that of their peers for certain periods, the Janus Henderson Funds were likely to benefit from the continued provision of those services. They also concluded that the Adviser had sufficient personnel, with the appropriate education and experience, to serve the Janus Henderson Funds effectively and had demonstrated its ability to attract well-qualified personnel.
Performance of the Funds
The Trustees considered the performance results of each Janus Henderson Fund over various time periods. They noted that they considered Janus Henderson Fund performance data throughout the year, including periodic meetings with each Janus Henderson Fund’s portfolio manager(s), and also reviewed information comparing each Janus Henderson Fund’s performance with the performance of comparable fund peer groups identified by Broadridge Financial Solutions, Inc. (“Broadridge”), an independent data provider, and with the Janus Henderson Fund’s benchmark index. In this regard, the independent fee consultant found that the overall Janus Henderson Funds’ performance has been reasonable, noting that: (i) for the 36 months ended May 31, 2022, approximately 38% of the Janus Henderson Funds were in the top two quartiles of their Broadridge peer groups; (ii) for the 36 months ended September 30, 2022, approximately 45% of the Janus Henderson Funds were in the top two quartiles of performance as reported by Morningstar, and (iii) for the 12 months ended September 30, 2022, approximately 55% of the Janus Henderson Funds were in the top two quartiles of performance as reported by Morningstar.
The Trustees considered the performance of each Janus Henderson Fund, noting that performance may vary by share class, and noted the following with respect to the Funds:
Asset Allocation Funds
· For Janus Henderson Global Allocation Fund – Conservative, the Trustees noted that the Fund’s performance was in the third Broadridge quartile for the 36 months ended May 31, 2022 and the bottom Broadridge quartile for the 12 months ended May 31, 2022. The Trustees noted the reasons for the Fund’s underperformance and the steps the Adviser had taken or was taking to improve performance.
· For Janus Henderson Global Allocation Fund – Growth, the Trustees noted that the Fund’s performance was in the bottom Broadridge quartile for the 36 months ended May 31, 2022 and the bottom Broadridge quartile for the 12 months ended May 31, 2022. The Trustees noted the reasons for the Fund’s underperformance and the steps the Adviser had taken or was taking to improve performance.
· For Janus Henderson Global Allocation Fund – Moderate, the Trustees noted that the Fund’s performance was in the bottom Broadridge quartile for the 36 months ended May 31, 2022 and the bottom Broadridge quartile for the 12 months ended May 31, 2022. The Trustees noted the reasons for the Fund’s underperformance and the steps the Adviser had taken or was taking to improve performance.
Fixed-Income Funds
· For Janus Henderson Absolute Return Income Opportunities Fund, the Trustees noted that the Fund’s performance was in the third Broadridge quartile for the 36 months ended May 31, 2022 and the first Broadridge quartile for the 12 months ended May 31, 2022. The Trustees noted the reasons for the Fund’s underperformance,
Janus Henderson European Focus Fund
Additional Information (unaudited)
the steps the Adviser had taken or was taking to improve performance, and that the performance trend was improving.
· For Janus Developed World Bond Fund, the Trustees noted that the Fund’s performance was in the bottom Broadridge quartile for the 36 months ended May 31, 2022 and the bottom Broadridge quartile for the 12 months ended May 31, 2022. The Trustees noted the reasons for the Fund’s underperformance and the steps the Adviser had taken or was taking to improve performance.
· For Janus Henderson Flexible Bond Fund, the Trustees noted that the Fund’s performance was in the first Broadridge quartile for the 36 months ended May 31, 2022 and the second Broadridge quartile for the 12 months ended May 31, 2022.
· For Janus Henderson Global Bond Fund, the Trustees noted that the Fund’s performance was in the third Broadridge quartile for the 36 months ended May 31, 2022 and the bottom Broadridge quartile for the 12 months ended May 31, 2022. The Trustees noted the reasons for the Fund’s underperformance and the steps the Adviser had taken or was taking to improve performance.
· For Janus Henderson High-Yield Fund, the Trustees noted that the Fund’s performance was in the third Broadridge quartile for the 36 months ended May 31, 2022 and the bottom Broadridge quartile for the 12 months ended May 31, 2022. The Trustees noted the reasons for the Fund’s underperformance and the steps the Adviser had taken or was taking to improve performance.
· For Janus Henderson Multi-Sector Income Fund, the Trustees noted that the Fund’s performance was in the second Broadridge quartile for the 36 months ended May 31, 2022 and the third Broadridge quartile for the 12 months ended May 31, 2022.
· For Janus Henderson Short Duration Flexible Bond Fund, the Trustees noted that the Fund’s performance was in the third Broadridge quartile for the 36 months ended May 31, 2022 and the bottom Broadridge quartile for the 12 months ended May 31, 2022. The Trustees noted the reasons for the Fund’s underperformance and the steps the Adviser had taken or was taking to improve performance.
Global and International Equity Funds
· For Janus Henderson Asia Equity Fund, the Trustees noted that the Fund’s performance was in the third Broadridge quartile for the 36 months ended May 31, 2022 and the third Broadridge quartile for the 12 months ended May 31, 2022. The Trustees noted the reasons for the Fund’s underperformance, while also noting that the Fund has a performance fee structure that results in lower management fees during periods of underperformance, and the steps the Adviser had taken or was taking to improve performance.
· For Janus Henderson Emerging Markets Fund, the Trustees noted that the Fund’s performance was in the third Broadridge quartile for the 36 months ended May 31, 2022 and the third Broadridge quartile for the 12 months ended May 31, 2022. The Trustees noted the reasons for the Fund’s underperformance and the steps the Adviser had taken or was taking to improve performance.
· For Janus Henderson European Focus Fund, the Trustees noted that the Fund’s performance was in the first Broadridge quartile for the 36 months ended May 31, 2022 and the second Broadridge quartile for the 12 months ended May 31, 2022.
· For Janus Henderson Global Equity Income Fund, the Trustees noted that the Fund’s performance was in the third Broadridge quartile for the 36 months ended May 31, 2022 and the first Broadridge quartile for the 12 months ended May 31, 2022. The Trustees noted the reasons for the Fund’s underperformance, the steps the Adviser had taken or was taking to improve performance, and that the performance trend was improving.
· For Janus Henderson Global Life Sciences Fund, the Trustees noted that the Fund’s performance was in the third Broadridge quartile for the 36 months ended May 31, 2022 and the second Broadridge quartile for the 12 months ended May 31, 2022. The Trustees noted the reasons for the Fund’s underperformance, the steps the Adviser had taken or was taking to improve performance, and that the performance trend was improving.
· For Janus Henderson Global Sustainable Equity Fund, the Trustees noted that the Fund’s performance was in the second Broadridge quartile for the 12 months ended May 31, 2022. The Trustees noted that 36 month-end performance was not yet available.
Janus Henderson European Focus Fund
Additional Information (unaudited)
· For Janus Henderson Global Real Estate Fund, the Trustees noted that the Fund’s performance was in the second Broadridge quartile for the 36 months ended May 31, 2022 and the bottom Broadridge quartile for the 12 months ended May 31, 2022.
· For Janus Henderson Global Research Fund, the Trustees noted that the Fund’s performance was in the second Broadridge quartile for the 36 months ended May 31, 2022 and the first Broadridge quartile for the 12 months ended May 31, 2022.
· For Janus Henderson Global Select Fund, the Trustees noted that the Fund’s performance was in the first Broadridge quartile for the 36 months ended May 31, 2022 and the first Broadridge quartile for the 12 months ended May 31, 2022.
· For Janus Henderson Global Technology and Innovation Fund, the Trustees noted that the Fund’s performance was in the second Broadridge quartile for the 36 months ended May 31, 2022 and the second Broadridge quartile for the 12 months ended May 31, 2022.
· For Janus Henderson International Opportunities Fund, the Trustees noted that the Fund’s performance was in the bottom Broadridge quartile for the 36 months ended May 31, 2022 and the third Broadridge quartile for the 12 months ended May 31, 2022. The Trustees noted the reasons for the Fund’s underperformance and the steps the Adviser had taken or was taking to improve performance.
· For Janus Henderson Overseas Fund, the Trustees noted that the Fund’s performance was in the first Broadridge quartile for the 36 months ended May 31, 2022 and the first Broadridge quartile for the 12 months ended May 31, 2022.
· For Janus Henderson Responsible International Dividend Fund (formerly the Janus Henderson Dividend & Income Builder Fund), the Trustees noted that the Fund’s performance was in the bottom Broadridge quartile for the 36 months ended May 31, 2022 and the bottom Broadridge quartile for the 12 months ended May 31, 2022. The Trustees noted the reasons for the Fund’s underperformance and the steps the Adviser had taken or was taking to improve performance.
Money Market Funds
· For Janus Henderson Government Money Market Fund, the Trustees noted that the Fund’s performance was in the third Broadridge quartile for the 36 months ended May 31, 2022 and the bottom Broadridge quartile for the 12 months ended May 31, 2022. The Trustees noted the reasons for the Fund’s underperformance and the steps the Adviser had taken or was taking to improve performance.
· For Janus Henderson Money Market Fund, the Trustees noted that the Fund’s performance was in the third Broadridge quartile for the 36 months ended May 31, 2022 and the bottom Broadridge quartile for the 12 months ended May 31, 2022. The Trustees noted the reasons for the Fund’s underperformance and the steps the Adviser had taken or was taking to improve performance.
Multi-Asset Funds
· For Janus Henderson Adaptive Global Allocation Fund, the Trustees noted that the Fund’s performance was in bottom Broadridge quartile for the 36 months ended May 31, 2022 and the second Broadridge quartile for the 12 months ended May 31, 2022. The Trustees noted the reasons for the Fund’s underperformance, the steps the Adviser had taken or was taking to improve performance, and that the performance trend was improving.
· For Janus Henderson Balanced Fund, the Trustees noted that the Fund’s performance was in the first Broadridge quartile for the 36 months ended May 31, 2022 and the first Broadridge quartile for the 12 months ended May 31, 2022.
U.S. Equity Funds
· For Janus Henderson Adaptive Risk Managed U.S. Equity Fund, the Trustees noted that the Fund’s performance was in the bottom Broadridge quartile for the 36 months ended May 31, 2022 and the second Broadridge quartile for the 12 months ended May 31, 2022. The Trustees noted the reasons for the Fund’s underperformance, the steps the Adviser had taken or were taking to improve performance, and that the performance trend was improving.
Janus Henderson European Focus Fund
Additional Information (unaudited)
· For Janus Henderson Contrarian Fund, the Trustees noted that the Fund’s performance was in the first Broadridge quartile for the 36 months ended May 31, 2022 and the bottom Broadridge quartile for the 12 months ended May 31, 2022.
· For Janus Henderson Enterprise Fund, the Trustees noted that the Fund’s performance was in the second Broadridge quartile for the 36 months ended May 31, 2022 and the first Broadridge quartile for the 12 months ended May 31, 2022.
· For Janus Henderson Forty Fund, the Trustees noted that the Fund’s performance was in the third Broadridge quartile for the 36 months ended May 31, 2022 and the bottom Broadridge quartile for the 12 months ended May 31, 2022. The Trustees noted the reasons for the Fund’s underperformance and the steps the Adviser had taken or was taking to improve performance.
· For Janus Henderson Growth and Income Fund, the Trustees noted that the Fund’s performance was in the bottom Broadridge quartile for the 36 months ended May 31, 2022 and the first Broadridge quartile for the 12 months ended May 31, 2022. The Trustees noted the reasons for the Fund’s underperformance, the steps the Adviser had taken or was taking to improve performance, and that the performance trend was improving.
· For Janus Henderson Mid Cap Value Fund, the Trustees noted that the Fund’s performance was in the bottom Broadridge quartile for the 36 months ended May 31, 2022 and the second Broadridge quartile for the 12 months ended May 31, 2022. The Trustees noted the reasons for the Fund’s underperformance, while also noting that the Fund has a performance fee structure that results in lower management fees during periods of underperformance, the steps the Adviser had taken or was taking to improve performance, and that the performance trend was improving.
· For Janus Henderson Research Fund, the Trustees noted that the Fund’s performance was in the third Broadridge quartile for the 36 months ended May 31, 2022 and the third Broadridge quartile for the 12 months ended May 31, 2022. The Trustees noted the reasons for the Fund’s underperformance, while also noting that the Fund has a performance fee structure that results in lower management fees during periods of underperformance and the steps the Adviser had taken or was taking to improve performance.
· For Janus Henderson Small Cap Value Fund, the Trustees noted that the Fund’s performance was in the bottom Broadridge quartile for the 36 months ended May 31, 2022 and the second Broadridge quartile for the 12 months ended May 31, 2022. The Trustees noted the reasons for the Fund’s underperformance, while also noting that the Fund has a performance fee structure that results in lower management fees during periods of underperformance, the steps the Adviser had taken or was taking to improve performance, and that the performance trend was improving.
· For Janus Henderson Small-Mid Cap Value Fund, the Trustees noted that the Fund’s performance was in the bottom Broadridge quartile for the 36 months ended May 31, 2022 and the second Broadridge quartile for the 12 months ended May 31, 2022. The Trustees noted the reasons for the Fund’s underperformance, while also noting that the Fund has a performance fee structure that results in lower management fees during periods of underperformance, the steps the Adviser had taken or was taking to improve performance, and that the performance trend is improving.
· For Janus Henderson Triton Fund, the Trustees noted that the Fund’s performance was in the bottom Broadridge quartile for the 36 months ended May 31, 2022 and the second Broadridge quartile for the 12 months ended May 31, 2022. The Trustees noted the reasons for the Fund’s underperformance, the steps the Adviser had taken or was taking to improve performance, and that the performance trend was improving.
· For Janus Henderson Venture Fund, the Trustees noted that the Fund’s performance was in the bottom Broadridge quartile for the 36 months ended May 31, 2022 and the second Broadridge quartile for the 12 months ended May 31, 2022. The Trustees noted the reasons for the Fund’s underperformance, the steps the Adviser had taken or was taking to improve performance, and that the performance trend was improving.
In consideration of each Janus Henderson Fund’s performance, the Trustees concluded that, taking into account the factors relevant to performance, as well as other considerations, including steps taken to improve performance, as applicable, the Janus Henderson Fund’s performance warranted continuation of such Janus Henderson Fund’s investment advisory agreement.
Janus Henderson European Focus Fund
Additional Information (unaudited)
Costs of Services Provided
The Trustees examined information regarding the fees and expenses of each Janus Henderson Fund in comparison to similar information for other comparable funds as provided by Broadridge, an independent data provider. They also reviewed an analysis of that information provided by their independent fee consultant. The independent fee consultant provided its belief that the management fees charged by the Adviser to each of the Janus Henderson Funds under the current investment advisory and administration agreements are reasonable in relation to the services provided by the Adviser. The independent fee consultant found: (1) the total expenses and management fees of the Janus Henderson Funds to be reasonable relative to other comparable mutual funds; (2) the total expenses, on average, were 6% under the average total expenses of the respective Broadridge peer group; and (3) the management fees for the Janus Henderson Funds, on average, were 5% under the average management fees for the respective Broadridge peer group. The Trustees also considered the total expenses for each share class of each Janus Henderson Fund compared to the average total expenses for its Broadridge Expense Group and to average total expenses for its Broadridge Expense Universe.
For Janus Henderson Funds with three or more years of performance history, the independent fee consultant also performed a systematic “focus list” analysis of expenses which assessed fund fees in the context of fund performance being delivered. Based on this analysis, the independent fee consultant found that the combination of service quality/performance and expenses on these individual Janus Henderson Funds was reasonable in light of performance trends, performance histories, changes in portfolio management, relative average net asset levels, and the existence of performance fees, breakpoints, and/or expense waivers on such Janus Henderson Funds.
The Trustees considered the methodology used by the Adviser in determining compensation payable to portfolio managers, the competitive environment for investment management talent, and the competitive market for mutual funds in different distribution channels.
The Trustees also reviewed management fees charged by the Adviser to comparable separate account clients and to comparable non-affiliated funds subadvised by the Adviser (for which the Adviser provides only or primarily portfolio management services). Although in most instances subadvisory and separate account fee rates for various investment strategies were lower than management fee rates for Janus Henderson Funds having a similar strategy, the Trustees considered that the Adviser noted that, under the terms of the management agreements with the Janus Henderson Funds, the Adviser performs significant additional services for the Janus Henderson Funds that it does not provide to those other clients, including administration services, oversight of the Janus Henderson Funds’ other service providers, Trustee support, regulatory compliance and numerous other services, and that, in serving the Janus Henderson Funds, the Adviser assumes many legal risks and other costs that it does not assume in servicing its other clients. Moreover, the Trustees noted that the independent fee consultant found that: (1) the management fees the Adviser charges to the Janus Henderson Funds are reasonable in relation to the management fees the Adviser charges to funds subadvised by the Adviser and to the fees the Adviser charges to its institutional separate account clients; (2) these subadvised and institutional separate accounts have different service and infrastructure needs and operate in markets very different from the retail fund market; (3) Janus Henderson mutual fund investors enjoy reasonable fees relative to the fees charged in these other markets; and (4) as part of its 2022 review, 9 of 11 Janus Henderson Funds have lower management fees than similar funds subadvised by the Adviser. The Trustees noted that for the two Janus Henderson Funds that did not, management fees for each were under the average of its 15(c) peer group.
The Trustees considered the fees for each Janus Henderson Fund for its fiscal year ended in 2021 and noted the following with regard to each Janus Henderson Fund’s total expenses, net of applicable fee waivers (the Fund’s “total expenses”) as reflected in the comparative information provided by Broadridge:
Asset Allocation Funds
· For Janus Henderson Global Allocation Fund – Conservative, the Trustees noted that, although the Fund’s total expenses exceeded the peer group average for certain share classes, overall the Fund’s total expenses were reasonable. The Trustees also noted that the Adviser has contractually agreed to limit the Fund’s expenses.
· For Janus Henderson Global Allocation Fund – Growth, the Trustees noted that, although the Fund’s total expenses exceeded the peer group average for certain share classes, overall the Fund’s total expenses were reasonable. The Trustees also noted that the Adviser has contractually agreed to limit the Fund’s expenses, although this limit did not apply because the Fund’s total expenses as shown were below the applicable fee limit.
Janus Henderson European Focus Fund
Additional Information (unaudited)
· For Janus Henderson Global Allocation Fund – Moderate, the Trustees noted that, although the Fund’s total expenses exceeded the peer group average for one share class, overall the Fund’s total expenses were reasonable. The Trustees also noted that the Adviser has contractually agreed to limit the Fund’s expenses.
Fixed-Income Funds
· For Janus Henderson Absolute Return Income Opportunities Fund, the Trustees noted that, although the Fund’s total expenses exceeded the peer group average for certain share classes, overall the Fund’s total expenses were reasonable. The Trustees also noted that the Adviser has contractually agreed to limit the Fund’s expenses.
· For Janus Henderson Developed World Bond Fund, the Trustees noted that, although the Fund’s total expenses exceeded the peer group average for one share class, overall the Fund’s total expenses were reasonable. The Trustees also noted that the Adviser has contractually agreed to limit the Fund’s expenses.
· For Janus Henderson Flexible Bond Fund, the Trustees noted that, although the Fund’s total expenses exceeded the peer group average for certain share classes, overall the Fund’s total expenses were reasonable. The Trustees also noted that the Adviser has contractually agreed to limit the Fund’s expenses, although this limit did not apply because the Fund’s total expenses as shown were below the applicable fee limit.
· For Janus Henderson Global Bond Fund, the Trustees noted that, although the Fund’s total expenses exceeded the peer group average for certain share classes, overall the Fund’s total expenses were reasonable. The Trustees also noted that the Adviser has contractually agreed to limit the Fund’s expenses.
· For Janus Henderson High-Yield Fund, the Trustees noted that, although the Fund’s total expenses exceeded the peer group average for certain share classes, overall the Fund’s total expenses were reasonable. The Trustees also noted that the Adviser has contractually agreed to limit the Fund’s expenses.
· For Janus Henderson Multi-Sector Income Fund, the Trustees noted that, although the Fund’s total expenses exceeded the peer group average for certain share classes, overall the Fund’s total expenses were reasonable. The Trustees also noted that the Adviser has contractually agreed to limit the Fund’s expenses.
· For Janus Henderson Short Duration Flexible Bond Fund, the Trustees noted that, although the Fund’s total expenses exceeded the peer group average for certain share classes, overall the Fund’s total expenses were reasonable. The Trustees also noted that the Adviser has contractually agreed to limit the Fund’s expenses.
Global and International Equity Funds
· For Janus Henderson Asia Equity Fund, the Trustees noted that, although the Fund’s total expenses exceeded the peer group average for certain share classes, overall the Fund’s total expenses were reasonable. The Trustees also noted that the Adviser has contractually agreed to limit the Fund’s expenses.
· For Janus Henderson Emerging Markets Fund, the Trustees noted that, although the Fund’s total expenses exceeded the peer group average for certain share classes, overall the Fund’s total expenses were reasonable. The Trustees also noted that the Adviser has contractually agreed to limit the Fund’s expenses.
· For Janus Henderson European Focus Fund, the Trustees noted that, although the Fund’s total expenses exceeded the peer group average for one share class, overall the Fund’s expenses were reasonable. The Trustees also noted that the Adviser has contractually agreed to limit the Fund’s expenses.
· For Janus Henderson Global Equity Income Fund, the Trustees noted that, although the Fund’s total expenses exceeded the peer group average for one share class, overall the Fund’s total expenses were reasonable. The Trustees also noted that the Adviser has contractually agreed to limit the Fund’s expenses, although this limit did not apply because the Fund’s total expenses as shown were below the applicable fee limit.
· For Janus Henderson Global Life Sciences Fund, the Trustees noted that the Fund’s total expenses were below the peer group average for all share classes.
· For Janus Henderson Global Real Estate Fund, the Trustees noted that, although the Fund’s total expenses exceeded the peer group average for certain share classes, overall the Fund’s total expenses were reasonable. The Trustees also noted that the Adviser has contractually agreed to limit the Fund’s expenses, although this limit did not apply because the Fund’s total expenses as shown were below the applicable fee limit.
Janus Henderson European Focus Fund
Additional Information (unaudited)
· For Janus Henderson Global Research Fund, the Trustees noted that, although the Fund’s total expenses exceeded the peer group average for one share class, overall the Fund’s total expenses were reasonable. The Trustees also noted that the Adviser has contractually agreed to limit the Fund’s expenses, although this limit did not apply because the Fund’s total expenses as shown were below the applicable fee limit.
· For Janus Henderson Global Select Fund, the Trustees noted that, although the Fund’s total expenses exceeded the peer group average for certain share classes, overall the Fund’s total expenses were reasonable. The Trustees also noted that the Adviser has contractually agreed to limit the Fund’s expenses.
· For Janus Henderson Global Sustainable Equity Fund, the Trustees noted that, although the Fund’s total expenses exceeded the peer group average for certain share classes, overall the Fund’s expenses were reasonable. The Trustees also noted that the Adviser has contractually agreed to limit the Fund’s expenses.
· For Janus Henderson Global Technology and Innovation Fund, the Trustees noted that the Fund’s total expenses were below the peer group average for all share classes.
· For Janus Henderson International Opportunities Fund, the Trustees noted that, although the Fund’s total expenses exceeded the peer group average for certain share classes, overall the Fund’s expenses were reasonable. The Trustees also noted that the Adviser has contractually agreed to limit the Fund’s expenses.
· For Janus Henderson Overseas Fund, the Trustees noted that although the Fund’s total expenses exceeded the peer group average for certain share classes, overall the Fund’s total expenses were reasonable. The Trustees also noted that the Adviser has contractually agreed to limit the Fund’s expenses, although this limit did not apply because the Fund’s total expenses as shown were below the applicable fee limit.
· For Janus Henderson Responsible International Dividend Fund (formerly the Janus Henderson Dividend & Income Builder Fund), the Trustees noted that, although the Fund’s total expenses exceeded the peer group for one share class, overall the Fund’s total expenses were reasonable. The Trustees also noted that the Adviser has contractually agreed to limit the Fund’s expenses.
Money Market Funds
· For Janus Henderson Government Money Market Fund, the Trustees noted that the Fund’s total expenses were below the peer group average for all share classes.
· For Janus Henderson Money Market Fund, the Trustees noted that the Fund’s total expenses were below the peer group average for all share classes.
Multi-Asset Funds
· For Janus Henderson Adaptive Global Allocation Fund, the Trustees noted that, that the Fund’s total expenses were below the peer group average for all share classes.
· For Janus Henderson Balanced Fund, the Trustees noted that, although the Fund’s total expenses exceeded the peer group average for certain share classes, overall the Fund’s total expenses were reasonable. The Trustees also noted that the Adviser has contractually agreed to limit the Fund’s expenses, although this limit did not apply because the Fund’s total expenses as shown were below the applicable fee limit.
U.S. Equity Funds
· For Janus Henderson Adaptive Risk Managed U.S. Equity Fund, the Trustees noted that, although the Fund’s total expenses exceeded the peer group average for certain share classes, overall the Fund’s total expenses were reasonable. The Trustees also noted that the Adviser has contractually agreed to limit the Fund’s expenses, although this limit did not apply because the Fund’s total expenses as shown were below the applicable fee limit.
· For Janus Henderson Contrarian Fund, the Trustees noted that, although the Fund’s total expenses exceeded the peer group average for all share classes, overall the Fund’s total expenses were reasonable. The Trustees also noted that the Adviser had contractually agreed to limit the Fund’s expenses.
· For Janus Henderson Enterprise Fund, the Trustees noted that, although the Fund’s total expenses exceeded the peer group average for certain share classes, overall the Fund’s total expenses were reasonable. The Trustees also noted that the Adviser has contractually agreed to limit the Fund’s expenses, although this limit did not apply because the Fund’s total expenses as shown were below the applicable fee limit.
Janus Henderson European Focus Fund
Additional Information (unaudited)
· For Janus Henderson Forty Fund, the Trustees noted that, although the Fund’s total expenses exceeded the peer group average for certain share classes, overall the Fund’s total expenses were reasonable. The Trustees also noted that the Adviser has contractually agreed to limit the Fund’s expenses, although this limit did not apply because the Fund’s total expenses as shown were below the applicable fee limit.
· For Janus Henderson Growth and Income Fund, the Trustees noted that, although the Fund’s total expenses exceeded the peer group average for certain share classes, overall the Fund’s total expenses were reasonable. The Trustees also noted that the Adviser has contractually agreed to limit the Fund’s expenses, although this limit did not apply because the Fund’s total expenses as shown were below the applicable fee limit.
· For Janus Henderson Mid Cap Value Fund, the Trustees noted that the Fund’s total expenses were below the peer group average for all share classes.
· For Janus Henderson Research Fund, the Trustees noted that, although the Fund’s total expenses exceeded the peer group average for certain share classes, overall the Fund’s total expenses were reasonable. The Trustees also noted that the Adviser has contractually agreed to limit the Fund’s expenses.
· For Janus Henderson Small Cap Value Fund, the Trustees noted that, although the Fund’s total expenses exceeded the peer group average for one share class, overall the Fund’s total expenses were reasonable. The Trustees also noted that the Adviser has contractually agreed to limit the Fund’s expenses, although this limit did not apply because the Fund’s total expenses as shown were below the applicable fee limit.
· For Janus Henderson Small-Mid Cap Value Fund, the Trustees noted that the Fund’s total expenses were below the peer group average for all share classes.
· For Janus Henderson Triton Fund, the Trustees noted that, although the Fund’s total expenses exceeded the peer group average for one share class, overall the Fund’s total expenses were reasonable. The Trustees also noted that the Adviser has contractually agreed to limit the Fund’s expenses, although this limit did not apply because the Fund’s total expenses as shown were below the applicable fee limit.
· For Janus Henderson Venture Fund, the Trustees noted that although the Fund’s total expenses exceeded the peer group average for one share class, overall the Fund’s total expenses were reasonable. The Trustees also noted that the Adviser has contractually agreed to limit the Fund’s expenses, although this limit did not apply because the Fund’s total expenses as shown were below the applicable fee limit.
The Trustees reviewed information on the overall profitability to the Adviser and its affiliates from their relationships with the Janus Henderson Funds, and considered profitability data of other publicly traded mutual fund advisers. The Trustees recognized that profitability comparisons among fund managers are difficult because of the variation in the type of comparative information that is publicly available, and the profitability of any fund manager is affected by numerous factors, including the organizational structure of the particular fund manager, differences in complex size, difference in product mix, difference in types of business (mutual fund, institutional and other), differences in the types of funds and other accounts it manages, possible other lines of business, the methodology for allocating expenses and the fund manager’s capital structure and cost of capital.
Additionally, the Trustees considered the estimated profitability to the Adviser from the investment management services it provided to each Janus Henderson Fund. In their review, the Trustees considered whether the Adviser receive adequate incentives and resources to manage the Janus Henderson Funds effectively. In reviewing profitability, the Trustees noted that the estimated profitability for an individual Janus Henderson Fund is necessarily a product of the allocation methodology utilized by the Adviser to allocate its expenses as part of the estimated profitability calculation. In this regard, the Trustees noted that the independent fee consultant found as part of its 2022 review that (1) the expense allocation methodology and rationales utilized by the Adviser were reasonable and (2) no clear correlation exists between expense allocations and operating margins. The Trustees also considered that the estimated profitability for an individual Janus Henderson Fund was influenced by a number of factors, including not only the allocation methodology selected, but also the presence of fee waivers and expense caps, and whether the Janus Henderson Fund’s investment management agreement contained breakpoints or a performance fee component. The Trustees determined, after taking into account these factors, among others, that the Adviser’s estimated profitability with respect to each Janus Henderson Fund was not unreasonable in relation to the services provided, and that the variation in the range of such estimated profitability among the Janus Henderson Funds was not a material factor in the Board’s approval of the reasonableness of any Janus Henderson Fund’s investment management fees.
Janus Henderson European Focus Fund
Additional Information (unaudited)
The Trustees concluded that the management fees payable by each Janus Henderson Fund to the Adviser were reasonable in relation to the nature, extent, and quality of the services provided, taking into account the fees charged by other advisers for managing comparable mutual funds with similar strategies, the fees the Adviser charges to other clients, and, as applicable, the impact of fund performance on management fees payable by the Janus Henderson Funds. The Trustees also concluded that each Janus Henderson Fund’s total expenses were reasonable, taking into account the size of the Janus Henderson Fund, the quality of services provided by the Adviser, the investment performance of the Janus Henderson Fund, and any expense limitations agreed to or provided by the Adviser.
Economies of Scale
The Trustees considered information about the potential for the Adviser to realize economies of scale as the assets of the Janus Henderson Funds increase. They noted that their independent fee consultant published a report to the Trustees in June 2022 which provided its research and analysis into economies of scale. They also noted that, although many Janus Henderson Funds pay advisory fees at a fixed base rate as a percentage of net assets, without any breakpoints or performance fees, their independent fee consultant concluded that 75% of these Janus Henderson Funds’ have contractual management fees (gross of waivers) below their Broadridge Expense Group averages. The Trustees also noted the following from the independent fee consultant’s report: (1) that 31% of Janus Henderson Funds had management fee breakpoints in place whereby investors pay lower management fees as fund AUM increases; (2) that 29% of Janus Henderson Funds have low flat-rate fees and performance fees where the Adviser is incentivized to invest in resources which drive Janus Henderson Fund performance; and (3) that 39% of Janus Henderson Funds have low flat-rate fees versus peers where investors pay low fixed fees when the Janus Henderson Fund is small/midsized and higher fees when the Janus Henderson Fund grows in assets. The Trustees also noted that the Janus Henderson Funds share directly in economies of scale through the significant investments made by the Adviser and its affiliates related to services provided to the Funds and the lower charges of third-party service providers that are based in part on the combined scale of all of the Janus Henderson Funds.
The Trustees also considered the independent fee consultant’s conclusion that, given the limitations of various analytical approaches to economies of scale and their conflicting results, it is difficult to analytically confirm or deny the existence of economies of scale in the Janus Henderson complex. In this regard, the independent consultant concluded that (1) to the extent there were economies of scale at the Adviser, the Adviser’s general strategy of setting fixed management fees below peers appeared to share any such economies with investors even on smaller Janus Henderson Funds which have not yet achieved those economies and (2) by setting lower fixed fees from the start on these Janus Henderson Funds, the Adviser appeared to be investing to increase the likelihood that these Janus Henderson Funds will grow to a level to achieve any economies of scale that may exist. Further, the independent fee consultant provided its belief that Janus Henderson Fund investors are well-served by the fee levels and performance fee structures in place on the Janus Henderson Funds in light of any economies of scale that may be present at the Adviser.
Based on all of the information reviewed, including the recent and past research and analysis conducted by the Trustees’ independent fee consultant, the Trustees concluded that the current fee structure of each Janus Henderson Fund was reasonable and that the current rates of fees do reflect a sharing between the Adviser and the Janus Henderson Fund of any economies of scale that may be present at the current asset level of the Janus Henderson Fund.
Other Benefits to the Adviser
The Trustees also considered benefits that accrue to the Adviser and its affiliates from their relationships with the Janus Henderson Funds. They recognized that two affiliates of the Adviser separately serve the Janus Henderson Funds as transfer agent and distributor, respectively, and the transfer agent receives compensation directly from the non-money market Janus Henderson Funds for services provided, and that such compensation contributes to the overall profitability of the Adviser and its affiliates that results from their relationship with the Janus Henderson Funds. The Trustees also considered the Adviser’s past and proposed use of commissions paid by the Janus Henderson Funds on portfolio brokerage transactions to obtain proprietary and third-party research products and services benefiting the Janus Henderson Fund and/or other clients of the Adviser and/or the Adviser. The Trustees concluded that the Adviser’s use of these types of client commission arrangements to obtain proprietary and third-party research products and services was consistent with regulatory requirements and guidelines and was likely to benefit each Janus Henderson Fund. The Trustees also concluded that, other than the services provided by the Adviser and its affiliates pursuant to the agreements and the fees to be paid by each Janus Henderson Fund therefor, the Janus Henderson
Janus Henderson European Focus Fund
Additional Information (unaudited)
Funds and the Adviser may potentially benefit from their relationship with each other in other ways. They concluded that the Adviser and its affiliates share directly in economies of scale through the lower charges of third-party service providers that are based in part on the combined scale of the Janus Henderson Funds and other clients serviced by the Adviser and its affiliates. They also concluded that the Adviser benefits from the receipt of research products and services acquired through commissions paid on portfolio transactions of the Janus Henderson Funds and that the Janus Henderson Funds benefit from the Adviser’s receipt of those products and services as well as research products and services acquired through commissions paid by other clients of the Adviser. They further concluded that the success of any Janus Henderson Fund could attract other business to the Adviser or other Janus Henderson Funds, and that the success of the Adviser could enhance the Adviser’s ability to serve the Janus Henderson Funds.
Janus Henderson European Focus Fund
Liquidity Risk Management Program (unaudited)
Liquidity Risk Management Program
Rule 22e-4 under the Investment Company Act of 1940, as amended (the “Liquidity Rule”), requires open-end funds (but not money market funds) to adopt and implement a written liquidity risk management program (the “LRMP”) that is reasonably designed to assess and manage liquidity risk, which is the risk that a fund could not meet redemption requests without significant dilution of remaining investors’ interest in the fund. The Fund has implemented a LRMP, which incorporates the following elements: (i) assessment, management, and periodic review of liquidity risk; (ii) classification of portfolio holdings; (iii) the establishment and monitoring of a highly liquid investment minimum, as applicable; (iv) a 15% limitation on a Fund’s illiquid investments; (v) redemptions in-kind; and (vi) board oversight.
The Trustees of the Fund (the “Trustees”) have designated Janus Henderson Investors US LLC, the Fund’s investment adviser (the “Adviser”), as the Program Administrator for the LRMP responsible for administering the LRMP and carrying out the specific responsibilities of the LRMP. A working group comprised of various teams within the Adviser’s business is responsible for administering the LRMP and carrying out the specific responsibilities of different aspects of the LRMP (the “Liquidity Risk Working Group”). In assessing each Fund’s liquidity risk, the Liquidity Risk Working Group periodically considers, as relevant, factors including (i) the liquidity of a Fund’s portfolio investments during normal and reasonably foreseeable stressed conditions; (ii) whether a Fund’s investment strategy is appropriate for an open-end fund; (iii) the extent to which a Fund’s strategy involves a relatively concentrated portfolio or large positions in any issuer; (iv) a Fund’s use of borrowing for investment purposes; and (v) a Fund’s use of derivatives.
The Liquidity Rule requires the Trustees to review at least annually a written report provided by the Program Administrator that addresses the operation of the LRMP and assesses its adequacy and the effectiveness of its implementation, including, if applicable, the operation of the highly liquid investment minimum, and any material changes to the LRMP (the “Program Administrator Report”). At a meeting held on March 15, 2023, the Adviser provided the Program Administrator Report to the Trustees which covered the operation of the LRMP from January 1, 2022 through December 31, 2022 (the “Reporting Period”).
The Program Administrator Report discussed the operation and effectiveness of the LRMP during the Reporting Period. Among other things, the Program Administrator Report indicated that there were no material changes to the LRMP during the Reporting Period, although there were certain methodology adjustments implemented relating to a change in data provider. Additionally, the findings presented in the Program Administrator Report indicated that the LRMP operated adequately during the Reporting Period. These findings included that the Fund was able to meet redemptions during the normal course of business during the Reporting Period. The Program Administrator Report also stated that the Fund did not exceed the 15% limit on illiquid assets during the Reporting Period, that the Fund held primarily highly liquid assets, and was considered to be a primarily highly liquid fund during the Reporting Period. Also included among the Program Administrator Report’s findings was the determination that the Fund’s investment strategy remains appropriate for an open-end fund. In addition, the Adviser expressed its belief in the Program Administrator Report that the LRMP is reasonably designed and adequate to assess and manage the Fund’s liquidity risk, considering the Fund’s particular risks and circumstances, and includes policies and procedures reasonably designed to implement each required component of the Liquidity Rule.
There can be no assurance that the LRMP will achieve its objectives in the future. Please refer to your Fund’s prospectus for more information regarding the risks to which an investment in the Fund may be subject.
Janus Henderson European Focus Fund
Useful Information About Your Fund Report (unaudited)
Performance Overviews
Performance overview graphs compare the performance of a hypothetical $10,000 investment in the Fund with one or more widely used market indices. When comparing the performance of the Fund with an index, keep in mind that market indices are not available for investment and do not reflect deduction of expenses.
Average annual total returns are quoted for a Fund with more than one year of performance history. Average annual total return is calculated by taking the growth or decline in value of an investment over a period of time, including reinvestment of dividends and distributions, then calculating the annual compounded percentage rate that would have produced the same result had the rate of growth been constant throughout the period. Average annual total return does not reflect the deduction of taxes that a shareholder would pay on Fund distributions or redemptions of Fund shares.
Cumulative total returns are quoted for a Fund with less than one year of performance history. Cumulative total return is the growth or decline in value of an investment over time, independent of the period of time involved. Cumulative total return does not reflect the deduction of taxes that a shareholder would pay on Fund distributions or redemptions of Fund shares.
Pursuant to federal securities rules, expense ratios shown in the performance chart reflect subsidized (if applicable) and unsubsidized ratios. The total annual fund operating expenses ratio is gross of any fee waivers, reflecting the Fund’s unsubsidized expense ratio. The net annual fund operating expenses ratio (if applicable) includes contractual waivers of the Adviser and reflects the Fund’s subsidized expense ratio. Ratios may be higher or lower than those shown in the “Financial Highlights” in this report.
Schedule of Investments
Following the performance overview section is the Fund’s Schedule of Investments. This schedule reports the types of securities held in the Fund on the last day of the reporting period. Securities are usually listed by type (common stock, corporate bonds, U.S. Government obligations, etc.) and by industry classification (banking, communications, insurance, etc.). Holdings are subject to change without notice.
The value of each security is quoted as of the last day of the reporting period. The value of securities denominated in foreign currencies is converted into U.S. dollars.
If the Fund invests in foreign securities, it will also provide a summary of investments by country. This summary reports the Fund exposure to different countries by providing the percentage of securities invested in each country. The country of each security represents the country of risk. A company may be allocated to a country based on other factors such as location of the company’s principal office, the location of the principal trading market for the company’s securities, or the country where a majority of the company’s revenues are derived. The Fund’s Schedule of Investments relies upon the industry group and country classifications published by Bloomberg and/or MSCI Inc.
Tables listing details of individual forward currency contracts, futures, written options, swaptions, and swaps follow the Fund’s Schedule of Investments (if applicable).
Statement of Assets and Liabilities
This statement is often referred to as the “balance sheet.” It lists the assets and liabilities of the Fund on the last day of the reporting period.
The Fund’s assets are calculated by adding the value of the securities owned, the receivable for securities sold but not yet settled, the receivable for dividends declared but not yet received on securities owned, and the receivable for Fund shares sold to investors but not yet settled. The Fund’s liabilities include payables for securities purchased but not yet settled, Fund shares redeemed but not yet paid, and expenses owed but not yet paid. Additionally, there may be other assets and liabilities such as unrealized gain or loss on forward currency contracts.
The section entitled “Net Assets Consist of” breaks down the components of the Fund’s net assets. Because the Fund must distribute substantially all earnings, you will notice that a significant portion of net assets is shareholder capital.
The last section of this statement reports the net asset value (“NAV”) per share on the last day of the reporting period. The NAV is calculated by dividing the Fund’s net assets for each share class (assets minus liabilities) by the number of shares outstanding.
Janus Henderson European Focus Fund
Useful Information About Your Fund Report (unaudited)
Statement of Operations
This statement details the Fund’s income, expenses, realized gains and losses on securities and currency transactions, and changes in unrealized appreciation or depreciation of Fund holdings.
The first section in this statement, entitled “Investment Income,” reports the dividends earned from securities and interest earned from interest-bearing securities in the Fund.
The next section reports the expenses incurred by the Fund, including the advisory fee paid to the investment adviser, transfer agent fees and expenses, and printing and postage for mailing statements, financial reports and prospectuses. Expense offsets and expense reimbursements, if any, are also shown.
The last section lists the amounts of realized gains or losses from investment and foreign currency transactions, and changes in unrealized appreciation or depreciation of investments and foreign currency-denominated assets and liabilities. The Fund will realize a gain (or loss) when it sells its position in a particular security. A change in unrealized gain (or loss) refers to the change in net appreciation or depreciation of the Fund during the reporting period. “Net Realized and Unrealized Gain/(Loss) on Investments” is affected both by changes in the market value of Fund holdings and by gains (or losses) realized during the reporting period.
Statements of Changes in Net Assets
These statements report the increase or decrease in the Fund’s net assets during the reporting period. Changes in the Fund’s net assets are attributable to investment operations, dividends and distributions to investors, and capital share transactions. This is important to investors because it shows exactly what caused the Fund’s net asset size to change during the period.
The first section summarizes the information from the Statement of Operations regarding changes in net assets due to the Fund’s investment operations. The Fund’s net assets may also change as a result of dividend and capital gains distributions to investors. If investors receive their dividends and/or distributions in cash, money is taken out of the Fund to pay the dividend and/or distribution. If investors reinvest their dividends and/or distributions, the Fund’s net assets will not be affected.
The reinvestment of dividends and distributions is included under “Capital Share Transactions.” “Capital Shares” refers to the money investors contribute to the Fund through purchases or withdrawals via redemptions. The Fund’s net assets will increase and decrease in value as investors purchase and redeem shares from the Fund.
Financial Highlights
This schedule provides a per-share breakdown of the components that affect the Fund’s NAV for current and past reporting periods as well as total return, asset size, ratios, and portfolio turnover rate.
The first line in the table reflects the NAV per share at the beginning of the reporting period. The next line reports the net investment income/(loss) per share. Following is the per share total of net gains/(losses), realized and unrealized. Per share dividends and distributions to investors are then subtracted to arrive at the NAV per share at the end of the period. The next line reflects the total return for the period. The total return may include adjustments in accordance with generally accepted accounting principles required at the period end for financial reporting purposes. As a result, the total return may differ from the total return reflected for individual shareholder transactions. Also included are ratios of expenses and net investment income to average net assets.
The Fund’s expenses may be reduced through expense offsets and expense reimbursements. The ratios shown reflect expenses before and after any such offsets and reimbursements.
The ratio of net investment income/(loss) summarizes the income earned less expenses, divided by the average net assets of the Fund during the reporting period. Do not confuse this ratio with the Fund’s yield. The net investment income ratio is not a true measure of the Fund’s yield because it does not take into account the dividends distributed to the Fund’s investors.
The next figure is the portfolio turnover rate, which measures the buying and selling activity in the Fund. Portfolio turnover is affected by market conditions, changes in the asset size of the Fund, fluctuating volume of shareholder purchase and redemption orders, the nature of the Fund’s investments, and the investment style and/or outlook of the portfolio manager(s) and/or investment personnel. A 100% rate implies that an amount equal to the value of the entire portfolio was replaced once during the fiscal year; a 50% rate means that an amount equal to the value of half the
Janus Henderson European Focus Fund
Useful Information About Your Fund Report (unaudited)
portfolio is traded in a year; and a 200% rate means that an amount equal to the value of the entire portfolio is traded every six months.
| | | | | | | | |
| | | | | |

| | | | |
This report is submitted for the general information of shareholders of the Fund. It is not an offer or solicitation for the Fund and is not authorized for distribution to prospective investors unless preceded or accompanied by an effective prospectus. |
Janus Henderson is a trademark of Janus Henderson Group plc or one of its subsidiaries. © Janus Henderson Group plc. Janus Henderson Group is the ultimate parent of Janus Henderson Distributors US LLC. Janus Henderson Distributors US LLC |
| | | | 125-24-93080 05-23 |
| | | | |
| | | |
| | | SEMIANNUAL REPORT March 31, 2023 |
| | |
| | Janus Henderson Forty Fund |
| | |
| | Janus Investment Fund |
| |
| | | HIGHLIGHTS · Investment strategy behind your fund · Fund performance, characteristics
and holdings |
Table of Contents
Janus Henderson Forty Fund
| | | | | | |
| | | | 
Brian Recht co-portfolio manager | 
Doug Rao co-portfolio manager | 
Nick Schommer co-portfolio manager |
| | | |
Janus Henderson Forty Fund (unaudited)
Fund At A Glance
March 31, 2023
| | | | | | | | | | |
| | | | | | | | | |
| | | | | | | | | |
| | | | | | | | | |
| 5 Top Contributors - Holdings | 5 Top Detractors - Holdings |
| | Average
Weight | | Relative
Contribution | | | Average
Weight | | Relative
Contribution |
| Meta Platforms Inc - Class A | 2.35% | | 1.66% | | Atlassian Corp - Class A | 1.97% | | -0.81% |
| ASML Holding NV | 3.25% | | 1.26% | | Charles Schwab Corp | 1.97% | | -0.67% |
| Advanced Micro Devices Inc | 3.09% | | 1.04% | | CoStar Group Inc | 3.21% | | -0.59% |
| Booking Holdings Inc | 2.46% | | 0.79% | | American Tower Corp | 2.88% | | -0.52% |
| Workday Inc - Class A | 4.46% | | 0.77% | | Rivian Automotive Inc - Class A | 0.45% | | -0.50% |
| | | | | | | |
| 5 Top Contributors - Sectors* | | | | | |
| | | Relative | | Fund | Russell 1000 Growth Index |
| | | Contribution | | Average Weight | Average Weight |
| Consumer Discretionary | | 2.85% | | 15.46% | 15.06% |
| Information Technology | | 1.90% | | 41.99% | 43.53% |
| Communication Services | | 1.36% | | 5.97% | 7.07% |
| Consumer Staples | | 0.31% | | 1.14% | 5.80% |
| Energy | | 0.22% | | 0.00% | 1.62% |
| | | | | | |
| | | | | | |
| 5 Top Detractors - Sectors* | | | | | |
| | | Relative | | Fund | Russell 1000 Growth Index |
| | | Contribution | | Average Weight | Average Weight |
| Financials | | -1.04% | | 6.27% | 3.48% |
| Real Estate | | -0.43% | | 2.88% | 1.57% |
| Other** | | -0.43% | | 3.10% | 0.00% |
| Industrials | | -0.29% | | 8.48% | 7.85% |
| Health Care | | -0.24% | | 11.39% | 12.55% |
| | | | | | | |
| Relative contribution reflects how the portolio's holdings impacted return relative to the benchmark. Cash and securities not held in the portfolio are not shown. For equity portfolios, relative contribution compares the performance of a security in the portfolio to the benchmark's total return, factoring in the difference in weight of that security in the benchmark. Returns are calculated using daily returns and previous day ending weights rolled up by ticker, excluding fixed income securities, gross of advisory fees, may exclude certain derivatives and will differ from actual performance.
Performance attribution reflects returns gross of advisory fees and may differ from actual returns as they are based on end of day holdings. Attribution is calculated by geometrically linking daily returns for the portfolio and index. |
* | Based on sector classification according to the Global Industry Classification Standard (“GICS”) codes, which are the exclusive property and a service mark of MSCI Inc. and Standard & Poor’s. |
** | Not a GICS classified sector. |
Janus Henderson Forty Fund (unaudited)
Fund At A Glance
March 31, 2023
| | |
5 Largest Equity Holdings - (% of Net Assets) |
Microsoft Corp | |
Software | 11.8% |
Apple Inc | |
Technology Hardware, Storage & Peripherals | 8.5% |
Mastercard Inc | |
Diversified Financial Services | 6.2% |
Amazon.com Inc | |
Multiline Retail | 5.5% |
Workday Inc - Class A | |
Software | 4.7% |
| | 36.7% |
| | | | | | |
Asset Allocation - (% of Net Assets) | |
Common Stocks | | 96.9% | |
Investment Companies | | 3.2% | |
Other | | (0.1)% |
| | | 100.0% |
| | |
Top Country Allocations - Long Positions - (% of Investment Securities) |
As of March 31, 2023 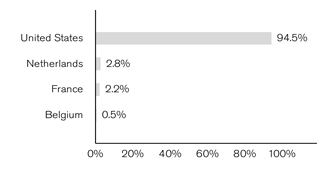
| As of September 30, 2022 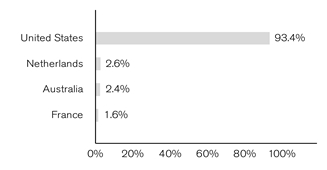
|
Janus Henderson Forty Fund (unaudited)
Performance
| |
See important disclosures on the next page. |
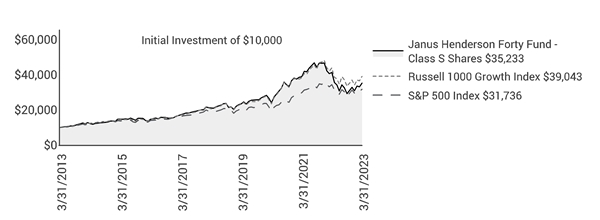
| | | | | | | | | | | |
| | | | | | | | | |
| | | | | | | | | | |
Average Annual Total Return - for the periods ended March 31, 2023 | | | Prospectus Expense Ratios |
| | Fiscal
Year-to-Date | One
Year | Five
Year | Ten
Year | Since
Inception* | | | Total Annual Fund
Operating Expenses‡ |
Class A Shares at NAV | | 20.70% | -14.55% | 11.15% | 13.55% | 11.33% | | | 0.89% |
Class A Shares at MOP | | 13.75% | -19.46% | 9.84% | 12.88% | 11.08% | | | |
Class C Shares at NAV | | 20.29% | -15.16% | 10.43% | 12.83% | 10.64% | | | 1.64% |
Class C Shares at CDSC | | 19.29% | -16.01% | 10.43% | 12.83% | 10.64% | | | |
Class D Shares | | 20.80% | -14.40% | 11.39% | 13.68% | 11.30% | | | 0.69% |
Class I Shares | | 20.86% | -14.35% | 11.46% | 13.88% | 11.53% | | | 0.64% |
Class N Shares | | 20.90% | -14.29% | 11.53% | 13.97% | 11.43% | | | 0.57% |
Class R Shares | | 20.45% | -14.90% | 10.71% | 13.12% | 10.94% | | | 1.32% |
Class S Shares | | 20.62% | -14.70% | 10.99% | 13.42% | 11.21% | | | 1.07% |
Class T Shares | | 20.76% | -14.49% | 11.27% | 13.70% | 11.35% | | | 0.81% |
Russell 1000 Growth Index | | 16.88% | -10.90% | 13.66% | 14.59% | 8.78% | | | |
S&P 500 Index | | 15.62% | -7.73% | 11.19% | 12.24% | 8.52% | | | |
Morningstar Quartile - Class S Shares | | - | 3rd | 2nd | 1st | 1st | | | |
Morningstar Ranking - based on total returns for Large Growth Funds | | - | 897/1,256 | 421/1,129 | 242/1,037 | 20/512 | | | |
Returns quoted are past performance and do not guarantee future results; current performance may be lower or higher. Investment returns and principal value will vary; there may be a gain or loss when shares are sold. For the most recent month-end performance call 800.668.0434 (or 800.525.3713 if you hold shares directly with Janus Henderson) or visit janushenderson.com/performance (or janushenderson.com/allfunds if you hold shares directly with Janus Henderson).
Maximum Offering Price (MOP) returns include the maximum sales charge of 5.75%. Net Asset Value (NAV) returns exclude this charge, which would have reduced returns.
CDSC returns include a 1% contingent deferred sales charge (CDSC) on Shares redeemed within 12 months of purchase. Net Asset Value (NAV) returns exclude this charge, which would have reduced returns.
This Fund has a performance-based management fee that may adjust up or down based on the Fund’s performance.
Performance may be affected by risks that include those associated with foreign and emerging markets, fixed income securities, high-yield and high-risk securities, undervalued, overlooked and smaller capitalization companies, real estate related securities including Real Estate Investment Trusts (REITs),
Janus Henderson Forty Fund (unaudited)
Performance
Environmental, Social and Governance (ESG) factors, non-diversification, portfolio turnover, derivatives, short sales, initial public offerings (IPOs) and potential conflicts of interest. Each product has different risks. Please see the prospectus for more information about risks, holdings and other details.
Returns include reinvestment of all dividends and distributions and do not reflect the deduction of taxes that a shareholder would pay on Fund distributions or redemptions of Fund shares. The returns do not include adjustments in accordance with generally accepted accounting principles required at the period end for financial reporting purposes.
Class A Shares, Class C Shares, Class I Shares, Class R Shares, and Class S Shares commenced operations on July 6, 2009 after the reorganization of each class of Janus Adviser Forty Fund (the “JAD predecessor fund”) into corresponding shares of the Fund.
Performance shown for Class S Shares reflects the historical performance of the JAD predecessor fund’s Class S Shares (formerly named Class I Shares) from August 1, 2000 to July 6, 2009, calculated using the fees and expenses of the JAD predecessor fund’s Class S Shares, net of any applicable fee and expense limitations or waivers. For the periods prior to August 1, 2000, the performance shown for Class S Shares reflects the historical performance of the Retirement Shares of Janus Aspen Series – Forty Portfolio (as a result of a separate prior reorganization of the Retirement Shares into the JAD predecessor fund). Performance shown for certain periods prior to August 1, 2000 was calculated using the fees and expenses of Class S Shares of the JAD predecessor fund, without the effect of any fee and expense limitations or waivers.
Performance shown for Class C Shares reflects the historical performance of the JAD predecessor fund’s Class C Shares from September 30, 2002 to July 6, 2009, calculated using the fees and expenses of the JAD predecessor fund’s Class C Shares, net of any applicable fee and expense limitations or waivers. For the periods August 1, 2000 to September 30, 2002, the performance shown for Class C Shares reflects the historical performance of the JAD predecessor fund’s Class S Shares (formerly named Class I Shares). For the periods prior to August 1, 2000, the performance shown for Class C Shares reflects the historical performance of the Retirement Shares of Janus Aspen Series – Forty Portfolio (as a result of a separate prior reorganization). Performance shown for certain periods prior to September 30, 2002 was calculated using the fees and expenses of Class S Shares of the JAD predecessor fund, without the effect of any fee and expense limitation or waivers.
Performance shown for Class A Shares and Class R Shares reflects the historical performance of each corresponding class of the JAD predecessor fund from September 30, 2004 to July 6, 2009, calculated using the fees and expenses of the corresponding class of the JAD predecessor fund respectively, net of any applicable fee and expense limitations or waivers. Performance shown for each class for the periods August 1, 2000 to September 30, 2004 reflects the historical performance of the JAD predecessor fund’s Class S Shares (formerly named Class I Shares). Performance shown for each class for the periods prior to August 1, 2000 reflects the historical performance of the Retirement Shares of Janus Aspen Series – Forty Portfolio (as a result of a separate prior reorganization). Performance shown for Class A Shares for certain periods prior to September 30, 2004 was calculated using the fees and expenses of Class S Shares of the JAD predecessor fund, without the effect of any fee and expense limitations or waivers. Performance shown for Class R Shares for certain periods prior to September 30, 2004 was calculated using the fees and expenses of Class R Shares of the JAD predecessor fund, without the effect of any fee and expense limitations or waivers.
Performance shown for Class I Shares reflects the historical performance of the JAD predecessor fund’s Class I Shares from November 28, 2005 to July 6, 2009, calculated using the fees and expenses of the JAD predecessor fund’s Class I Shares, net of any applicable fee and expense limitations or waivers. For the periods August 1, 2000 to November 28, 2005, the performance shown for Class I Shares reflects the historical performance of the JAD predecessor fund’s Class S Shares (formerly named Class I Shares). For the periods prior to August 1, 2000, the performance shown for Class I Shares reflects the historical performance of the Retirement Shares of Janus Aspen Series – Forty Portfolio (as a result of a separate prior reorganization). Performance shown for certain periods prior to November 28, 2005 was calculated using the fees and expenses of Class S Shares of the JAD predecessor fund, without the effect of any fee and expense limitations or waivers.
Class D Shares commenced operations on January 27, 2017. Performance shown for Class D Shares reflects the performance of the Fund's Class S Shares from July 6, 2009 to January 27, 2017, calculated using the fees and expenses of Class S Shares, net of any applicable fee and expense limitations or waivers. For the periods August 1, 2000 to July 6, 2009, the performance shown for Class D Shares reflects the performance of Class S Shares (formerly named Class I Shares) of the JAD predecessor fund (prior to the reorganization), calculated using the fees and expenses of the JAD predecessor fund's Class S Shares, net of any applicable fee and expense limitations or waivers. For the periods prior to August 1, 2000, the performance shown for Class D Shares reflects the historical performance of the Retirement Shares of Janus Aspen Series - Forty Portfolio (as a result of a separate prior reorganization). Performance shown for certain periods prior to August 1, 2000 was calculated using the fees and expenses of Class S Shares of the JAD predecessor fund, without the effect of any fee and expense limitations or waivers.
Class T Shares commenced operations on July 6, 2009. Performance shown for Class T Shares reflects the historical performance of the JAD predecessor fund’s Class S Shares (formerly named Class I Shares) from August 1, 2000 to July 6, 2009, calculated using the fees and expenses of the JAD predecessor fund’s Class S Shares, net of any applicable fee and expense limitations or waivers. For the periods prior to August 1, 2000, the performance shown for Class T Shares reflects the historical performance of the Retirement Shares of Janus Aspen Series – Forty Portfolio (as a result of a separate prior reorganization). Performance shown for certain periods prior to August 1, 2000 was calculated using the fees and expenses of Class S Shares of the JAD predecessor fund, without the effect of any fee and expense limitations or waivers.
Class N Shares commenced operations on May 31, 2012. Performance shown for Class N Shares reflects the performance of the Fund’s Class S Shares from July 6, 2009 to May 31, 2012, calculated using the fees and expenses of Class S Shares, net of any applicable fee and expense limitations or waivers. For the periods August 1, 2000 to July 6, 2009, the performance shown for Class N Shares reflects the performance of Class
See important disclosures on the next page.
Janus Henderson Forty Fund (unaudited)
Performance
S Shares (formerly named Class I Shares) of the JAD predecessor fund (prior to the reorganization), calculated using the fees and expenses of the JAD predecessor fund’s Class S Shares, net of any applicable fee and expense limitations or waivers. For the periods prior to August 1, 2000, the performance shown for Class N Shares reflects the historical performance of the Retirement Shares of Janus Aspen Series – Forty Portfolio (as a result of a separate prior reorganization). Performance shown for certain periods prior to August 1, 2000 was calculated using the fees and expenses of Class S Shares of the JAD predecessor fund, without the effect of any fee and expense limitations or waivers.
If each share class of the Fund had been available during periods prior to its commencement, the performance shown may have been different. The performance shown for periods following the Fund’s commencement of each share class reflects the fees and expenses of each respective share class, net of any applicable fee and expense limitations or waivers. Please refer to the Fund’s prospectuses for further details concerning historical performance.
Ranking is for the share class shown only; other classes may have different performance characteristics. When an expense waiver is in effect, it may have a material effect on the total return, and therefore the ranking for the period.
© 2023 Morningstar, Inc. All Rights Reserved.
There is no assurance that the investment process will consistently lead to successful investing.
See Notes to Schedule of Investments and Other Information for index definitions.
Index performance does not reflect the expenses of managing a portfolio as an index is unmanaged and not available for direct investment.
See “Useful Information About Your Fund Report.”
*The Predecessor Fund’s inception date – May 1, 1997
‡ As stated in the prospectus. See Financial Highlights for actual expense ratios during the reporting period.
Janus Henderson Forty Fund (unaudited)
Expense Examples
As a shareholder of the Fund, you incur two types of costs: (1) transaction costs, such as sales charges (loads) on purchase payments (applicable to Class A Shares only); and (2) ongoing costs, including management fees; 12b-1 distribution and shareholder servicing fees; transfer agent fees and expenses payable pursuant to the Transfer Agency Agreement; and other Fund expenses. This example is intended to help you understand your ongoing costs (in dollars) of investing in the Fund and to compare these costs with the ongoing costs of investing in other mutual funds. To do so, compare this 5% hypothetical example with the 5% hypothetical examples that appear in the shareholder reports of the other funds. The example is based upon an investment of $1,000 invested at the beginning of the period and held for the six-months indicated, unless noted otherwise in the table and footnotes below.
Actual Expenses
The information in the table under the heading “Actual” provides information about actual account values and actual expenses. You may use the information in these columns, together with the amount you invested, to estimate the expenses that you paid over the period. Simply divide your account value by $1,000 (for example, an $8,600 account value divided by $1,000 = 8.6), then multiply the result by the number in the appropriate column for your share class under the heading entitled “Expenses Paid During Period” to estimate the expenses you paid on your account during the period.
Hypothetical Example for Comparison Purposes
The information in the table under the heading “Hypothetical (5% return before expenses)” provides information about hypothetical account values and hypothetical expenses based upon the Fund’s actual expense ratio and an assumed rate of return of 5% per year before expenses, which is not the Fund’s actual return. The hypothetical account values and expenses may not be used to estimate the actual ending account balance or expenses you paid for the period. You may use this information to compare the ongoing costs of investing in the Fund and other funds. To do so, compare this 5% hypothetical example with the 5% hypothetical examples that appear in the shareholder reports of the other funds. Additionally, for an analysis of the fees associated with an investment in any share class or other similar funds, please visit www.finra.org/fundanalyzer.
Please note that the expenses shown in the table are meant to highlight your ongoing costs only and do not reflect any transaction costs. These fees are fully described in the Fund’s prospectus. Therefore, the hypothetical examples are useful in comparing ongoing costs only, and will not help you determine the relative total costs of owning different funds. In addition, if these transaction costs were included, your costs would have been higher.
| | | | | | | | | | | |
| | | | | | | | |
| | | Actual | | Hypothetical
(5% return before expenses) | |
| Beginning
Account
Value
(10/1/22) | Ending
Account
Value
(3/31/23) | Expenses
Paid During
Period
(10/1/22 - 3/31/23)† | | Beginning
Account
Value
(10/1/22) | Ending
Account
Value
(3/31/23) | Expenses
Paid During
Period
(10/1/22 - 3/31/23)† | Net Annualized
Expense Ratio
(10/1/22 - 3/31/23) |
Class A Shares | $1,000.00 | $1,207.00 | $4.46 | | $1,000.00 | $1,020.89 | $4.08 | 0.81% |
Class C Shares | $1,000.00 | $1,202.90 | $8.18 | | $1,000.00 | $1,017.50 | $7.49 | 1.49% |
Class D Shares | $1,000.00 | $1,208.00 | $3.36 | | $1,000.00 | $1,021.89 | $3.07 | 0.61% |
Class I Shares | $1,000.00 | $1,208.60 | $3.08 | | $1,000.00 | $1,022.14 | $2.82 | 0.56% |
Class N Shares | $1,000.00 | $1,209.00 | $2.64 | | $1,000.00 | $1,022.54 | $2.42 | 0.48% |
Class R Shares | $1,000.00 | $1,204.50 | $6.71 | | $1,000.00 | $1,018.85 | $6.14 | 1.22% |
Class S Shares | $1,000.00 | $1,206.20 | $5.28 | | $1,000.00 | $1,020.14 | $4.84 | 0.96% |
Class T Shares | $1,000.00 | $1,207.60 | $3.85 | | $1,000.00 | $1,021.44 | $3.53 | 0.70% |
† | Expenses Paid During Period are equal to the Net Annualized Expense Ratio multiplied by the average account value over the period, multiplied by 182/365 (to reflect the one-half year period). Expenses in the examples include the effect of applicable fee waivers and/or expense reimbursements, if any. Had such waivers and/or reimbursements not been in effect, your expenses would have been higher. Please refer to the Notes to Financial Statements or the Fund’s prospectuses for more information regarding waivers and/or reimbursements. |
Janus Henderson Forty Fund
Schedule of Investments (unaudited)
March 31, 2023
| | | | | | | | |
Shares
| | | Value | |
Common Stocks– 96.9% | | | |
Aerospace & Defense – 1.7% | | | |
| | Howmet Aerospace Inc | | 6,221,261 | | | $263,594,829 | |
Automobiles – 0.3% | | | |
| | Rivian Automotive Inc - Class A* | | 2,941,451 | | | 45,533,662 | |
Banks – 1.5% | | | |
| | JPMorgan Chase & Co | | 1,870,525 | | | 243,748,113 | |
Biotechnology – 3.7% | | | |
| | AbbVie Inc | | 3,131,827 | | | 499,119,269 | |
| | Argenx SE (ADR)* | | 225,963 | | | 84,189,295 | |
| | | 583,308,564 | |
Capital Markets – 3.6% | | | |
| | Blackstone Group Inc | | 4,808,660 | | | 422,392,694 | |
| | Charles Schwab Corp | | 2,612,285 | | | 136,831,488 | |
| | | 559,224,182 | |
Chemicals – 2.8% | | | |
| | Linde PLC | | 786,164 | | | 279,434,132 | |
| | Sherwin-Williams Co | | 725,720 | | | 163,120,084 | |
| | | 442,554,216 | |
Diversified Financial Services – 6.2% | | | |
| | Mastercard Inc | | 2,697,269 | | | 980,214,527 | |
Health Care Providers & Services – 2.7% | | | |
| | UnitedHealth Group Inc | | 899,108 | | | 424,909,450 | |
Hotels, Restaurants & Leisure – 3.5% | | | |
| | Booking Holdings Inc* | | 148,278 | | | 393,294,050 | |
| | Caesars Entertainment Inc* | | 3,308,675 | | | 161,496,427 | |
| | | 554,790,477 | |
Household Products – 1.1% | | | |
| | Procter & Gamble Co | | 1,184,856 | | | 176,176,239 | |
Interactive Media & Services – 4.1% | | | |
| | Alphabet Inc - Class C* | | 3,211,851 | | | 334,032,504 | |
| | Meta Platforms Inc - Class A* | | 1,463,378 | | | 310,148,333 | |
| | | 644,180,837 | |
Life Sciences Tools & Services – 3.8% | | | |
| | Danaher Corp | | 1,222,533 | | | 308,127,217 | |
| | Illumina Inc* | | 1,220,900 | | | 283,920,295 | |
| | | 592,047,512 | |
Machinery – 3.3% | | | |
| | Deere & Co | | 1,239,451 | | | 511,744,529 | |
Metals & Mining – 1.1% | | | |
| | Freeport-McMoRan Inc | | 4,296,175 | | | 175,756,519 | |
Multiline Retail – 5.5% | | | |
| | Amazon.com Inc* | | 8,404,229 | | | 868,072,813 | |
Professional Services – 2.7% | | | |
| | CoStar Group Inc* | | 6,149,386 | | | 423,385,226 | |
Semiconductor & Semiconductor Equipment – 14.8% | | | |
| | Advanced Micro Devices Inc* | | 6,599,801 | | | 646,846,496 | |
| | Analog Devices Inc | | 870,365 | | | 171,653,385 | |
| | ASML Holding NV | | 658,154 | | | 448,012,009 | |
| | Marvell Technology Inc | | 3,556,413 | | | 153,992,683 | |
| | NVIDIA Corp | | 1,877,208 | | | 521,432,066 | |
| | Texas Instruments Inc | | 2,032,535 | | | 378,071,835 | |
| | | 2,320,008,474 | |
Software – 17.8% | | | |
| | Atlassian Corp - Class A* | | 1,220,089 | | | 208,842,634 | |
| | Microsoft Corp | | 6,432,481 | | | 1,854,484,272 | |
| | Workday Inc - Class A* | | 3,541,464 | | | 731,453,975 | |
| | | 2,794,780,881 | |
Specialized Real Estate Investment Trusts (REITs) – 2.5% | | | |
| | American Tower Corp | | 1,912,623 | | | 390,825,384 | |
| | |
See Notes to Schedule of Investments and Other Information and Notes to Financial Statements. |
| |
Janus Investment Fund | 7 |
Janus Henderson Forty Fund
Schedule of Investments (unaudited)
March 31, 2023
| | | | | | | | |
Shares
| | | Value | |
Common Stocks– (continued) | | | |
Specialty Retail – 2.3% | | | |
| | TJX Cos Inc | | 4,519,495 | | | $354,147,628 | |
Technology Hardware, Storage & Peripherals – 8.5% | | | |
| | Apple Inc | | 8,143,995 | | | 1,342,944,776 | |
Textiles, Apparel & Luxury Goods – 3.4% | | | |
| | LVMH Moet Hennessy Louis Vuitton SE | | 370,226 | | | 339,264,847 | |
| | NIKE Inc - Class B | | 1,579,209 | | | 193,674,192 | |
| | | 532,939,039 | |
Total Common Stocks (cost $9,422,094,082) | | 15,224,887,877 | |
Investment Companies– 3.2% | | | |
Money Markets – 3.2% | | | |
| | Janus Henderson Cash Liquidity Fund LLC, 4.7988%ºº,£((cost $504,404,470) | | 504,324,791 | | | 504,425,656 | |
Total Investments (total cost $9,926,498,552) – 100.1% | | 15,729,313,533 | |
Liabilities, net of Cash, Receivables and Other Assets – (0.1)% | | (8,227,896) | |
Net Assets – 100% | | $15,721,085,637 | |
| | | | | | |
Summary of Investments by Country - (Long Positions) (unaudited) |
| |
| | | | | % of | |
| | | | | Investment | |
Country | | Value | | Securities | |
United States | | $14,857,847,382 | | 94.5 | % |
Netherlands | | 448,012,009 | | 2.8 | |
France | | 339,264,847 | | 2.2 | |
Belgium | | 84,189,295 | | 0.5 | |
| | | | | | |
| | | | | | |
Total | | $15,729,313,533 | | 100.0 | % |
| | |
See Notes to Schedule of Investments and Other Information and Notes to Financial Statements. |
| |
8 | MARCH 31, 2023 |
Janus Henderson Forty Fund
Schedule of Investments (unaudited)
March 31, 2023
Schedules of Affiliated Investments – (% of Net Assets)
| | | | | | | | | | | |
| | Dividend Income | Realized Gain/(Loss) | Change in Unrealized Appreciation/ Depreciation | Value at 3/31/23 |
Investment Companies - 3.2% |
Money Markets - 3.2% | |
| | Janus Henderson Cash Liquidity Fund LLC, 4.7988%ºº | $ | 8,803,737 | $ | 7,314 | $ | 12,577 | $ | 504,425,656 |
Investments Purchased with Cash Collateral from Securities Lending - N/A |
Investment Companies - N/A | |
| | Janus Henderson Cash Collateral Fund LLC, 4.8170%ºº | | 9,343∆ | | - | | - | | - |
Total Affiliated Investments - 3.2% | $ | 8,813,080 | $ | 7,314 | $ | 12,577 | $ | 504,425,656 |
| | | | | | | | | | | |
| | Value at 9/30/22 | Purchases | Sales Proceeds | Value at 3/31/23 |
Investment Companies - 3.2% |
Money Markets - 3.2% | |
| | Janus Henderson Cash Liquidity Fund LLC, 4.7988%ºº | | 572,169,354 | | 2,017,804,637 | | (2,085,568,226) | | 504,425,656 |
Investments Purchased with Cash Collateral from Securities Lending - N/A |
Investment Companies - N/A | |
| | Janus Henderson Cash Collateral Fund LLC, 4.8170%ºº | | 46,190,522 | | 75,585,235 | | (121,775,757) | | - |
| | |
See Notes to Schedule of Investments and Other Information and Notes to Financial Statements. |
| |
Janus Investment Fund | 9 |
Janus Henderson Forty Fund
Notes to Schedule of Investments and Other Information (unaudited)
| | |
Russell 1000® Growth Index | Russell 1000® Growth Index reflects the performance of U.S. large-cap equities with higher price-to-book ratios and higher forecasted growth values. |
S&P 500® Index | S&P 500® Index reflects U.S. large-cap equity performance and represents broad U.S. equity market performance. |
| | |
ADR | American Depositary Receipt |
LLC | Limited Liability Company |
PLC | Public Limited Company |
| | |
* | Non-income producing security. |
| | |
ºº | Rate shown is the 7-day yield as of March 31, 2023. |
| | |
£ | The Fund may invest in certain securities that are considered affiliated companies. As defined by the Investment Company Act of 1940, as amended, an affiliated company is one in which the Fund owns 5% or more of the outstanding voting securities, or a company which is under common ownership or control. |
| | |
∆ | Net of income paid to the securities lending agent and rebates paid to the borrowing counterparties. |
| | | | | | | | | | | | | |
The following is a summary of the inputs that were used to value the Fund’s investments in securities and other financial instruments as of March 31, 2023. See Notes to Financial Statements for more information. |
| |
Valuation Inputs Summary |
| | | | | | | |
| | | | | Level 2 - | | Level 3 - |
| | | Level 1 - | | Other Significant | | Significant |
| | | Quoted Prices | | Observable Inputs | | Unobservable Inputs |
| | | | | | | |
Assets | | | | | | |
Investments In Securities: | | | | | | |
Common Stocks | | | | | | |
Textiles, Apparel & Luxury Goods | $ | 193,674,192 | $ | 339,264,847 | $ | - |
All Other | | 14,691,948,838 | | - | | - |
Investment Companies | | - | | 504,425,656 | | - |
Total Assets | $ | 14,885,623,030 | $ | 843,690,503 | $ | - |
| | | | | | | |
Janus Henderson Forty Fund
Statement of Assets and Liabilities (unaudited)
March 31, 2023
| |
See footnotes at the end of the Statement |
| | | | | | | |
| | | | | | |
Assets: | | | | |
| Unaffiliated investments, at value (cost $9,422,094,082) | | $ | 15,224,887,877 | |
| Affiliated investments, at value (cost $504,404,470) | | | 504,425,656 | |
| Trustees' deferred compensation | | | 389,013 | |
| Receivables: | | | | |
| | Fund shares sold | | | 3,504,354 | |
| | Dividends | | | 2,416,329 | |
| | Dividends from affiliates | | | 1,501,871 | |
| | Foreign tax reclaims | | | 374,177 | |
| Other assets | | | 119,206 | |
Total Assets | | | 15,737,618,483 | |
Liabilities: | | | | |
| Due to custodian | | | 3,122 | |
| Payables: | | | — | |
| | Advisory fees | | | 6,487,908 | |
| | Fund shares repurchased | | | 6,396,503 | |
| | Transfer agent fees and expenses | | | 2,104,311 | |
| | Trustees' deferred compensation fees | | | 389,013 | |
| | 12b-1 Distribution and shareholder servicing fees | | | 272,406 | |
| | Trustees' fees and expenses | | | 97,107 | |
| | Affiliated fund administration fees payable | | | 33,996 | |
| | Professional fees | | | 33,416 | |
| | Custodian fees | | | 19,281 | |
| | Accrued expenses and other payables | | | 695,783 | |
Total Liabilities | | | 16,532,846 | |
Net Assets | | $ | 15,721,085,637 | |
| | |
See Notes to Financial Statements. |
| |
Janus Investment Fund | 11 |
Janus Henderson Forty Fund
Statement of Assets and Liabilities (unaudited)
March 31, 2023
| | | | | | | |
| | | | | | |
| | | | | | | |
Net Assets Consist of: | | | | |
| Capital (par value and paid-in surplus) | | $ | 9,528,688,658 | |
| Total distributable earnings (loss) | | | 6,192,396,979 | |
Total Net Assets | | $ | 15,721,085,637 | |
Net Assets - Class A Shares | | $ | 361,956,687 | |
| Shares Outstanding, $0.01 Par Value (unlimited shares authorized) | | | 8,906,737 | |
Net Asset Value Per Share(1) | | $ | 40.64 | |
Maximum Offering Price Per Share(2) | | $ | 43.12 | |
Net Assets - Class C Shares | | $ | 96,494,543 | |
| Shares Outstanding, $0.01 Par Value (unlimited shares authorized) | | | 3,203,183 | |
Net Asset Value Per Share(1) | | $ | 30.12 | |
Net Assets - Class D Shares | | $ | 9,462,922,558 | |
| Shares Outstanding, $0.01 Par Value (unlimited shares authorized) | | | 241,377,612 | |
Net Asset Value Per Share | | $ | 39.20 | |
Net Assets - Class I Shares | | $ | 1,735,091,379 | |
| Shares Outstanding, $0.01 Par Value (unlimited shares authorized) | | | 40,315,385 | |
Net Asset Value Per Share | | $ | 43.04 | |
Net Assets - Class N Shares | | $ | 452,727,873 | |
| Shares Outstanding, $0.01 Par Value (unlimited shares authorized) | | | 10,448,954 | |
Net Asset Value Per Share | | $ | 43.33 | |
Net Assets - Class R Shares | | $ | 67,154,073 | |
| Shares Outstanding, $0.01 Par Value (unlimited shares authorized) | | | 1,959,176 | |
Net Asset Value Per Share | | $ | 34.28 | |
Net Assets - Class S Shares | | $ | 376,680,514 | |
| Shares Outstanding, $0.01 Par Value (unlimited shares authorized) | | | 9,844,726 | |
Net Asset Value Per Share | | $ | 38.26 | |
Net Assets - Class T Shares | | $ | 3,168,058,010 | |
| Shares Outstanding, $0.01 Par Value (unlimited shares authorized) | | | 79,730,733 | |
Net Asset Value Per Share | | $ | 39.73 | |
| |
(1) Redemption price per share may be reduced for any applicable contingent deferred sales charge. (2) Maximum offering price is computed at 100/94.25 of net asset value. |
| | |
See Notes to Financial Statements. |
| |
12 | MARCH 31, 2023 |
Janus Henderson Forty Fund
Statement of Operations (unaudited)
For the period ended March 31, 2023
| | | | | | |
| | | | | |
Investment Income: | | | |
| Dividends | $ | 70,680,591 | |
| Dividends from affiliates | | 8,803,737 | |
| Affiliated securities lending income, net | | 9,343 | |
| Unaffiliated securities lending income, net | | 2,716 | |
| Other income | | 40 | |
| Foreign tax withheld | | (648,153) | |
Total Investment Income | | 78,848,274 | |
Expenses: | | | |
| Advisory fees | | 33,299,930 | |
| 12b-1 Distribution and shareholder servicing fees: | | | |
| | Class A Shares | | 426,820 | |
| | Class C Shares | | 421,949 | |
| | Class R Shares | | 156,786 | |
| | Class S Shares | | 440,355 | |
| Transfer agent administrative fees and expenses: | | | |
| | Class D Shares | | 5,145,893 | |
| | Class R Shares | | 79,694 | |
| | Class S Shares | | 440,967 | |
| | Class T Shares | | 3,686,727 | |
| Transfer agent networking and omnibus fees: | | | |
| | Class A Shares | | 132,479 | |
| | Class C Shares | | 40,852 | |
| | Class I Shares | | 636,894 | |
| Other transfer agent fees and expenses: | | | |
| | Class A Shares | | 11,860 | |
| | Class C Shares | | 2,054 | |
| | Class D Shares | | 333,165 | |
| | Class I Shares | | 45,457 | |
| | Class N Shares | | 8,817 | |
| | Class R Shares | | 400 | |
| | Class S Shares | | 2,074 | |
| | Class T Shares | | 11,264 | |
| Shareholder reports expense | | 328,734 | |
| Trustees’ fees and expenses | | 213,368 | |
| Affiliated fund administration fees | | 181,954 | |
| Registration fees | | 106,724 | |
| Professional fees | | 88,641 | |
| Custodian fees | | 29,503 | |
| Other expenses | | 435,562 | |
Total Expenses | | 46,708,923 | |
Less: Excess Expense Reimbursement and Waivers | | (319,294) | |
Net Expenses | | 46,389,629 | |
Net Investment Income/(Loss) | | 32,458,645 | |
| | | | | |
| | |
See Notes to Financial Statements. |
| |
Janus Investment Fund | 13 |
Janus Henderson Forty Fund
Statement of Operations (unaudited)
For the period ended March 31, 2023
| | | | | | |
| | | | | |
Net Realized Gain/(Loss) on Investments: | | | |
| Investments and foreign currency transactions | $ | 448,797,060 | |
| Investments in affiliates | | 7,314 | |
Total Net Realized Gain/(Loss) on Investments | | 448,804,374 | |
Change in Unrealized Net Appreciation/Depreciation: | | | |
| Investments, foreign currency translations and Trustees’ deferred compensation | | 2,276,783,687 | |
| Investments in affiliates | | 12,577 | |
Total Change in Unrealized Net Appreciation/Depreciation | | 2,276,796,264 | |
Net Increase/(Decrease) in Net Assets Resulting from Operations | $ | 2,758,059,283 | |
| | | | | |
| | |
See Notes to Financial Statements. |
| |
14 | MARCH 31, 2023 |
Janus Henderson Forty Fund
Statements of Changes in Net Assets
| | | | | | | | | |
| | | | | | | | |
| | | Period ended
March 31, 2023 (unaudited) | | Year ended
September 30, 2022 | |
| | | | | | | | | |
Operations: | | | | | | |
| Net investment income/(loss) | $ | 32,458,645 | | $ | (1,008,711) | |
| Net realized gain/(loss) on investments | | 448,804,374 | | | 140,237,182 | |
| Change in unrealized net appreciation/depreciation | | 2,276,796,264 | | | (7,259,946,829) | |
Net Increase/(Decrease) in Net Assets Resulting from Operations | | 2,758,059,283 | | | (7,120,718,358) | |
Dividends and Distributions to Shareholders: | | | | | | |
| | Class A Shares | | (196,773) | | | (48,616,877) | |
| | Class C Shares | | (71,294) | | | (18,893,463) | |
| | Class D Shares | | (5,170,450) | | | (1,230,067,488) | |
| | Class I Shares | | (868,455) | | | (212,301,037) | |
| | Class N Shares | | (222,907) | | | (53,508,841) | |
| | Class R Shares | | (43,018) | | | (10,782,896) | |
| | Class S Shares | | (214,505) | | | (54,847,467) | |
| | Class T Shares | | (1,723,379) | | | (420,959,121) | |
Net Decrease from Dividends and Distributions to Shareholders | | (8,510,781) | | | (2,049,977,190) | |
Capital Share Transactions: | | | | | | |
| | Class A Shares | | (28,809,507) | | | 23,871,855 | |
| | Class C Shares | | (9,607,142) | | | (2,036,149) | |
| | Class D Shares | | (254,408,373) | | | 668,279,371 | |
| | Class I Shares | | (120,943,365) | | | 207,944,828 | |
| | Class N Shares | | 3,190,560 | | | 44,485,275 | |
| | Class R Shares | | (4,689,773) | | | (392,706) | |
| | Class S Shares | | (21,214,293) | | | (18,253,964) | |
| | Class T Shares | | (148,249,735) | | | 174,769,965 | |
Net Increase/(Decrease) from Capital Share Transactions | | (584,731,628) | | | 1,098,668,475 | |
Net Increase/(Decrease) in Net Assets | | 2,164,816,874 | | | (8,072,027,073) | |
Net Assets: | | | | | | |
| Beginning of period | | 13,556,268,763 | | | 21,628,295,836 | |
| End of period | $ | 15,721,085,637 | | $ | 13,556,268,763 | |
| | | | | | | | |
| | |
See Notes to Financial Statements. |
| |
Janus Investment Fund | 15 |
Janus Henderson Forty Fund
Financial Highlights
| | | | | | | | | | | | | | | | | | | | | | |
Class A Shares | | | | | | | | | | | | | | | | | | |
For a share outstanding during the period ended March 31, 2023 (unaudited) and the year ended September 30 | 2023 | | | 2022 | | | 2021 | | | 2020 | | | 2019 | | | 2018 | |
| Net Asset Value, Beginning of Period | | $33.69 | | | $56.20 | | | $46.81 | | | $37.16 | | | $37.42 | | | $33.03 | |
| Income/(Loss) from Investment Operations: | | | | | | | | | | | | | | | | | | |
| | Net investment income/(loss)(1) | | 0.05 | | | (0.08) | | | (0.26) | | | (0.08) | | | 0.02 | | | (0.04) | |
| | Net realized and unrealized gain/(loss) | | 6.92 | | | (17.22) | | | 13.50 | | | 12.27 | | | 2.25 | | | 7.38 | |
| Total from Investment Operations | | 6.97 | | | (17.30) | | | 13.24 | | | 12.19 | | | 2.27 | | | 7.34 | |
| Less Dividends and Distributions: | | | | | | | | | | | | | | | | | | |
| | Dividends (from net investment income) | | — | | | — | | | — | | | (0.01) | | | — | | | — | |
| | Distributions (from capital gains) | | (0.02) | | | (5.21) | | | (3.85) | | | (2.53) | | | (2.53) | | | (2.95) | |
| Total Dividends and Distributions | | (0.02) | | | (5.21) | | | (3.85) | | | (2.54) | | | (2.53) | | | (2.95) | |
| Net Asset Value, End of Period | | $40.64 | | | $33.69 | | | $56.20 | | | $46.81 | | | $37.16 | | | $37.42 | |
| Total Return* | | 20.70% | | | (34.00)% | | | 29.72% | | | 34.62% | | | 7.77% | | | 23.77% | |
| Net Assets, End of Period (in thousands) | | $361,957 | | | $326,566 | | | $525,208 | | | $411,899 | | | $303,070 | | | $237,547 | |
| Average Net Assets for the Period (in thousands) | | $342,157 | | | $456,270 | | | $483,419 | | | $339,815 | | | $268,921 | | | $220,973 | |
| Ratios to Average Net Assets**: | | | | | | | | | | | | | | | | | | |
| | Ratio of Gross Expenses | | 0.81% | | | 0.89% | | | 1.02% | | | 1.01% | | | 1.01% | | | 1.04% | |
| | Ratio of Net Expenses (After Waivers and Expense Offsets) | | 0.81% | | | 0.89% | | | 1.02% | | | 1.01% | | | 0.98% | | | 0.98% | |
| | Ratio of Net Investment Income/(Loss) | | 0.28% | | | (0.17)% | | | (0.50)% | | | (0.21)% | | | 0.05% | | | (0.13)% | |
| Portfolio Turnover Rate | | 23% | | | 39% | | | 31% | | | 42% | | | 44% | | | 37% | |
| | | | | | | | | | | | | | | | | | | | | | |
| |
* Total return includes adjustments in accordance with generally accepted accounting principles required at the year or period end and are not annualized for periods of less than one full year. ** Annualized for periods of less than one full year. (1) Per share amounts are calculated based on average shares outstanding during the year or period. |
| | |
See Notes to Financial Statements. |
| |
16 | MARCH 31, 2023 |
Janus Henderson Forty Fund
Financial Highlights
| | | | | | | | | | | | | | | | | | | | | | |
Class C Shares | | | | | | | | | | | | | | | | | | |
For a share outstanding during the period ended March 31, 2023 (unaudited) and the year ended September 30 | 2023 | | | 2022 | | | 2021 | | | 2020 | | | 2019 | | | 2018 | |
| Net Asset Value, Beginning of Period | | $25.06 | | | $43.38 | | | $37.15 | | | $30.17 | | | $31.11 | | | $28.08 | |
| Income/(Loss) from Investment Operations: | | | | | | | | | | | | | | | | | | |
| | Net investment income/(loss)(1) | | (0.05) | | | (0.28) | | | (0.47) | | | (0.28) | | | (0.16) | | | (0.21) | |
| | Net realized and unrealized gain/(loss) | | 5.13 | | | (12.83) | | | 10.55 | | | 9.79 | | | 1.75 | | | 6.19 | |
| Total from Investment Operations | | 5.08 | | | (13.11) | | | 10.08 | | | 9.51 | | | 1.59 | | | 5.98 | |
| Less Dividends and Distributions: | | | | | | | | | | | | | | | | | | |
| | Dividends (from net investment income) | | — | | | — | | | — | | | — | | | — | | | — | |
| | Distributions (from capital gains) | | (0.02) | | | (5.21) | | | (3.85) | | | (2.53) | | | (2.53) | | | (2.95) | |
| Total Dividends and Distributions | | (0.02) | | | (5.21) | | | (3.85) | | | (2.53) | | | (2.53) | | | (2.95) | |
| Net Asset Value, End of Period | | $30.12 | | | $25.06 | | | $43.38 | | | $37.15 | | | $30.17 | | | $31.11 | |
| Total Return* | | 20.29% | | | (34.43)% | | | 28.88% | | | 33.67% | | | 7.11% | | | 23.05% | |
| Net Assets, End of Period (in thousands) | | $96,495 | | | $89,166 | | | $160,133 | | | $137,952 | | | $126,726 | | | $227,488 | |
| Average Net Assets for the Period (in thousands) | | $92,306 | | | $129,956 | | | $153,590 | | | $128,357 | | | $154,535 | | | $235,933 | |
| Ratios to Average Net Assets**: | | | | | | | | | | | | | | | | | | |
| | Ratio of Gross Expenses | | 1.49% | | | 1.51% | | | 1.68% | | | 1.68% | | | 1.63% | | | 1.66% | |
| | Ratio of Net Expenses (After Waivers and Expense Offsets) | | 1.49% | | | 1.51% | | | 1.68% | | | 1.68% | | | 1.58% | | | 1.59% | |
| | Ratio of Net Investment Income/(Loss) | | (0.40)% | | | (0.80)% | | | (1.15)% | | | (0.87)% | | | (0.58)% | | | (0.74)% | |
| Portfolio Turnover Rate | | 23% | | | 39% | | | 31% | | | 42% | | | 44% | | | 37% | |
| | | | | | | | | | | | | | | | | | | | | | |
| |
* Total return includes adjustments in accordance with generally accepted accounting principles required at the year or period end and are not annualized for periods of less than one full year. ** Annualized for periods of less than one full year. (1) Per share amounts are calculated based on average shares outstanding during the year or period. |
| | |
See Notes to Financial Statements. |
| |
Janus Investment Fund | 17 |
Janus Henderson Forty Fund
Financial Highlights
| | | | | | | | | | | | | | | | | | | | | | |
Class D Shares | | | | | | | | | | | | | | | | | | |
For a share outstanding during the period ended March 31, 2023 (unaudited) and the year ended September 30 | 2023 | | | 2022 | | | 2021 | | | 2020 | | | 2019 | | | 2018 | |
| Net Asset Value, Beginning of Period | | $32.47 | | | $54.28 | | | $45.24 | | | $35.99 | | | $36.25 | | | $32.02 | |
| Income/(Loss) from Investment Operations: | | | | | | | | | | | | | | | | | | |
| | Net investment income/(loss)(1) | | 0.09 | | | 0.01 | | | (0.15) | | | —(2) | | | 0.09 | | | 0.04 | |
| | Net realized and unrealized gain/(loss) | | 6.66 | | | (16.58) | | | 13.04 | | | 11.86 | | | 2.18 | | | 7.15 | |
| Total from Investment Operations | | 6.75 | | | (16.57) | | | 12.89 | | | 11.86 | | | 2.27 | | | 7.19 | |
| Less Dividends and Distributions: | | | | | | | | | | | | | | | | | | |
| | Dividends (from net investment income) | | — | | | (0.03) | | | — | | | (0.08) | | | — | | | (0.01) | |
| | Distributions (from capital gains) | | (0.02) | | | (5.21) | | | (3.85) | | | (2.53) | | | (2.53) | | | (2.95) | |
| Total Dividends and Distributions | | (0.02) | | | (5.24) | | | (3.85) | | | (2.61) | | | (2.53) | | | (2.96) | |
| Net Asset Value, End of Period | | $39.20 | | | $32.47 | | | $54.28 | | | $45.24 | | | $35.99 | | | $36.25 | |
| Total Return* | | 20.80% | | | (33.86)% | | | 30.00% | | | 34.88% | | | 8.03% | | | 24.06% | |
| Net Assets, End of Period (in thousands) | | $9,462,923 | | | $8,069,316 | | | $12,846,210 | | | $10,287,828 | | | $8,018,389 | | | $7,842,180 | |
| Average Net Assets for the Period (in thousands) | | $8,734,330 | | | $11,038,490 | | | $11,890,281 | | | $8,759,841 | | | $7,517,796 | | | $7,241,280 | |
| Ratios to Average Net Assets**: | | | | | | | | | | | | | | | | | | |
| | Ratio of Gross Expenses | | 0.61% | | | 0.69% | | | 0.82% | | | 0.80% | | | 0.79% | | | 0.79% | |
| | Ratio of Net Expenses (After Waivers and Expense Offsets) | | 0.61% | | | 0.69% | | | 0.82% | | | 0.80% | | | 0.75% | | | 0.73% | |
| | Ratio of Net Investment Income/(Loss) | | 0.48% | | | 0.03% | | | (0.29)% | | | 0.00%(3) | | | 0.27% | | | 0.13% | |
| Portfolio Turnover Rate | | 23% | | | 39% | | | 31% | | | 42% | | | 44% | | | 37% | |
| | | | | | | | | | | | | | | | | | | | | | |
| |
* Total return includes adjustments in accordance with generally accepted accounting principles required at the year or period end and are not annualized for periods of less than one full year. ** Annualized for periods of less than one full year. (1) Per share amounts are calculated based on average shares outstanding during the year or period. (2) Less than $0.005 on a per share basis. (3) Less than 0.005%. |
| | |
See Notes to Financial Statements. |
| |
18 | MARCH 31, 2023 |
Janus Henderson Forty Fund
Financial Highlights
| | | | | | | | | | | | | | | | | | | | | | |
Class I Shares | | | | | | | | | | | | | | | | | | |
For a share outstanding during the period ended March 31, 2023 (unaudited) and the year ended September 30 | 2023 | | | 2022 | | | 2021 | | | 2020 | | | 2019 | | | 2018 | |
| Net Asset Value, Beginning of Period | | $35.63 | | | $59.06 | | | $48.89 | | | $38.69 | | | $38.74 | | | $34.00 | |
| Income/(Loss) from Investment Operations: | | | | | | | | | | | | | | | | | | |
| | Net investment income/(loss)(1) | | 0.10 | | | 0.04 | | | (0.13) | | | 0.03 | | | 0.12 | | | 0.07 | |
| | Net realized and unrealized gain/(loss) | | 7.33 | | | (18.21) | | | 14.15 | | | 12.80 | | | 2.36 | | | 7.63 | |
| Total from Investment Operations | | 7.43 | | | (18.17) | | | 14.02 | | | 12.83 | | | 2.48 | | | 7.70 | |
| Less Dividends and Distributions: | | | | | | | | | | | | | | | | | | |
| | Dividends (from net investment income) | | — | | | (0.05) | | | — | | | (0.10) | | | — | | | (0.01) | |
| | Distributions (from capital gains) | | (0.02) | | | (5.21) | | | (3.85) | | | (2.53) | | | (2.53) | | | (2.95) | |
| Total Dividends and Distributions | | (0.02) | | | (5.26) | | | (3.85) | | | (2.63) | | | (2.53) | | | (2.96) | |
| Net Asset Value, End of Period | | $43.04 | | | $35.63 | | | $59.06 | | | $48.89 | | | $38.69 | | | $38.74 | |
| Total Return* | | 20.86% | | | (33.84)% | | | 30.07% | | | 34.97% | | | 8.06% | | | 24.19% | |
| Net Assets, End of Period (in thousands) | | $1,735,091 | | | $1,547,668 | | | $2,360,269 | | | $1,783,057 | | | $1,178,733 | | | $1,125,445 | |
| Average Net Assets for the Period (in thousands) | | $1,625,161 | | | $2,082,585 | | | $2,119,223 | | | $1,416,287 | | | $1,081,498 | | | $1,024,982 | |
| Ratios to Average Net Assets**: | | | | | | | | | | | | | | | | | | |
| | Ratio of Gross Expenses | | 0.56% | | | 0.64% | | | 0.76% | | | 0.74% | | | 0.72% | | | 0.72% | |
| | Ratio of Net Expenses (After Waivers and Expense Offsets) | | 0.56% | | | 0.64% | | | 0.76% | | | 0.74% | | | 0.68% | | | 0.66% | |
| | Ratio of Net Investment Income/(Loss) | | 0.53% | | | 0.08% | | | (0.24)% | | | 0.06% | | | 0.34% | | | 0.19% | |
| Portfolio Turnover Rate | | 23% | | | 39% | | | 31% | | | 42% | | | 44% | | | 37% | |
| | | | | | | | | | | | | | | | | | | | | | |
| |
* Total return includes adjustments in accordance with generally accepted accounting principles required at the year or period end and are not annualized for periods of less than one full year. ** Annualized for periods of less than one full year. (1) Per share amounts are calculated based on average shares outstanding during the year or period. |
| | |
See Notes to Financial Statements. |
| |
Janus Investment Fund | 19 |
Janus Henderson Forty Fund
Financial Highlights
| | | | | | | | | | | | | | | | | | | | | | |
Class N Shares | | | | | | | | | | | | | | | | | | |
For a share outstanding during the period ended March 31, 2023 (unaudited) and the year ended September 30 | 2023 | | | 2022 | | | 2021 | | | 2020 | | | 2019 | | | 2018 | |
| Net Asset Value, Beginning of Period | | $35.86 | | | $59.38 | | | $49.11 | | | $38.85 | | | $38.86 | | | $34.08 | |
| Income/(Loss) from Investment Operations: | | | | | | | | | | | | | | | | | | |
| | Net investment income/(loss)(1) | | 0.12 | | | 0.07 | | | (0.10) | | | 0.05 | | | 0.15 | | | 0.09 | |
| | Net realized and unrealized gain/(loss) | | 7.37 | | | (18.30) | | | 14.22 | | | 12.86 | | | 2.37 | | | 7.66 | |
| Total from Investment Operations | | 7.49 | | | (18.23) | | | 14.12 | | | 12.91 | | | 2.52 | | | 7.75 | |
| Less Dividends and Distributions: | | | | | | | | | | | | | | | | | | |
| | Dividends (from net investment income) | | — | | | (0.08) | | | — | | | (0.12) | | | — | | | (0.02) | |
| | Distributions (from capital gains) | | (0.02) | | | (5.21) | | | (3.85) | | | (2.53) | | | (2.53) | | | (2.95) | |
| Total Dividends and Distributions | | (0.02) | | | (5.29) | | | (3.85) | | | (2.65) | | | (2.53) | | | (2.97) | |
| Net Asset Value, End of Period | | $43.33 | | | $35.86 | | | $59.38 | | | $49.11 | | | $38.85 | | | $38.86 | |
| Total Return* | | 20.90% | | | (33.78)% | | | 30.15% | | | 35.06% | | | 8.15% | | | 24.27% | |
| Net Assets, End of Period (in thousands) | | $452,728 | | | $371,702 | | | $581,225 | | | $511,465 | | | $273,438 | | | $199,929 | |
| Average Net Assets for the Period (in thousands) | | $412,616 | | | $516,542 | | | $533,647 | | | $384,360 | | | $212,223 | | | $178,576 | |
| Ratios to Average Net Assets**: | | | | | | | | | | | | | | | | | | |
| | Ratio of Gross Expenses | | 0.48% | | | 0.56% | | | 0.70% | | | 0.67% | | | 0.65% | | | 0.66% | |
| | Ratio of Net Expenses (After Waivers and Expense Offsets) | | 0.48% | | | 0.56% | | | 0.70% | | | 0.67% | | | 0.62% | | | 0.60% | |
| | Ratio of Net Investment Income/(Loss) | | 0.60% | | | 0.15% | | | (0.17)% | | | 0.12% | | | 0.40% | | | 0.26% | |
| Portfolio Turnover Rate | | 23% | | | 39% | | | 31% | | | 42% | | | 44% | | | 37% | |
| | | | | | | | | | | | | | | | | | | | | | |
| |
* Total return includes adjustments in accordance with generally accepted accounting principles required at the year or period end and are not annualized for periods of less than one full year. ** Annualized for periods of less than one full year. (1) Per share amounts are calculated based on average shares outstanding during the year or period. |
| | |
See Notes to Financial Statements. |
| |
20 | MARCH 31, 2023 |
Janus Henderson Forty Fund
Financial Highlights
| | | | | | | | | | | | | | | | | | | | | | |
Class R Shares | | | | | | | | | | | | | | | | | | |
For a share outstanding during the period ended March 31, 2023 (unaudited) and the year ended September 30 | 2023 | | | 2022 | | | 2021 | | | 2020 | | | 2019 | | | 2018 | |
| Net Asset Value, Beginning of Period | | $28.48 | | | $48.48 | | | $41.01 | | | $32.97 | | | $33.65 | | | $30.08 | |
| Income/(Loss) from Investment Operations: | | | | | | | | | | | | | | | | | | |
| | Net investment income/(loss)(1) | | (0.02) | | | (0.23) | | | (0.40) | | | (0.21) | | | (0.10) | | | (0.15) | |
| | Net realized and unrealized gain/(loss) | | 5.84 | | | (14.56) | | | 11.72 | | | 10.78 | | | 1.95 | | | 6.67 | |
| Total from Investment Operations | | 5.82 | | | (14.79) | | | 11.32 | | | 10.57 | | | 1.85 | | | 6.52 | |
| Less Dividends and Distributions: | | | | | | | | | | | | | | | | | | |
| | Dividends (from net investment income) | | — | | | — | | | — | | | — | | | — | | | — | |
| | Distributions (from capital gains) | | (0.02) | | | (5.21) | | | (3.85) | | | (2.53) | | | (2.53) | | | (2.95) | |
| Total Dividends and Distributions | | (0.02) | | | (5.21) | | | (3.85) | | | (2.53) | | | (2.53) | | | (2.95) | |
| Net Asset Value, End of Period | | $34.28 | | | $28.48 | | | $48.48 | | | $41.01 | | | $32.97 | | | $33.65 | |
| Total Return* | | 20.45% | | | (34.26)% | | | 29.21% | | | 34.05% | | | 7.36% | | | 23.34% | |
| Net Assets, End of Period (in thousands) | | $67,154 | | | $60,027 | | | $103,653 | | | $101,440 | | | $106,843 | | | $127,954 | |
| Average Net Assets for the Period (in thousands) | | $63,876 | | | $84,882 | | | $106,256 | | | $101,751 | | | $113,204 | | | $123,528 | |
| Ratios to Average Net Assets**: | | | | | | | | | | | | | | | | | | |
| | Ratio of Gross Expenses | | 1.22% | | | 1.31% | | | 1.43% | | | 1.41% | | | 1.40% | | | 1.40% | |
| | Ratio of Net Expenses (After Waivers and Expense Offsets) | | 1.22% | | | 1.30% | | | 1.42% | | | 1.41% | | | 1.36% | | | 1.34% | |
| | Ratio of Net Investment Income/(Loss) | | (0.13)% | | | (0.59)% | | | (0.90)% | | | (0.60)% | | | (0.34)% | | | (0.49)% | |
| Portfolio Turnover Rate | | 23% | | | 39% | | | 31% | | | 42% | | | 44% | | | 37% | |
| | | | | | | | | | | | | | | | | | | | | | |
| |
* Total return includes adjustments in accordance with generally accepted accounting principles required at the year or period end and are not annualized for periods of less than one full year. ** Annualized for periods of less than one full year. (1) Per share amounts are calculated based on average shares outstanding during the year or period. |
| | |
See Notes to Financial Statements. |
| |
Janus Investment Fund | 21 |
Janus Henderson Forty Fund
Financial Highlights
| | | | | | | | | | | | | | | | | | | | | | |
Class S Shares | | | | | | | | | | | | | | | | | | |
For a share outstanding during the period ended March 31, 2023 (unaudited) and the year ended September 30 | 2023 | | | 2022 | | | 2021 | | | 2020 | | | 2019 | | | 2018 | |
| Net Asset Value, Beginning of Period | | $31.75 | | | $53.33 | | | $44.67 | | | $35.61 | | | $36.02 | | | $31.93 | |
| Income/(Loss) from Investment Operations: | | | | | | | | | | | | | | | | | | |
| | Net investment income/(loss)(1) | | 0.02 | | | (0.15) | | | (0.33) | | | (0.13) | | | (0.03) | | | (0.08) | |
| | Net realized and unrealized gain/(loss) | | 6.51 | | | (16.22) | | | 12.84 | | | 11.72 | | | 2.15 | | | 7.12 | |
| Total from Investment Operations | | 6.53 | | | (16.37) | | | 12.51 | | | 11.59 | | | 2.12 | | | 7.04 | |
| Less Dividends and Distributions: | | | | | | | | | | | | | | | | | | |
| | Dividends (from net investment income) | | — | | | — | | | — | | | — | | | — | | | — | |
| | Distributions (from capital gains) | | (0.02) | | | (5.21) | | | (3.85) | | | (2.53) | | | (2.53) | | | (2.95) | |
| Total Dividends and Distributions | | (0.02) | | | (5.21) | | | (3.85) | | | (2.53) | | | (2.53) | | | (2.95) | |
| Net Asset Value, End of Period | | $38.26 | | | $31.75 | | | $53.33 | | | $44.67 | | | $35.61 | | | $36.02 | |
| Total Return* | | 20.58% | | | (34.09)% | | | 29.50% | | | 34.40% | | | 7.65% | | | 23.63% | |
| Net Assets, End of Period (in thousands) | | $376,681 | | | $331,903 | | | $586,481 | | | $546,341 | | | $475,553 | | | $516,748 | |
| Average Net Assets for the Period (in thousands) | | $353,378 | | | $480,481 | | | $571,789 | | | $491,995 | | | $468,610 | | | $525,707 | |
| Ratios to Average Net Assets**: | | | | | | | | | | | | | | | | | | |
| | Ratio of Gross Expenses | | 0.98% | | | 1.07% | | | 1.20% | | | 1.17% | | | 1.15% | | | 1.15% | |
| | Ratio of Net Expenses (After Waivers and Expense Offsets) | | 0.96% | | | 1.05% | | | 1.19% | | | 1.16% | | | 1.10% | | | 1.08% | |
| | Ratio of Net Investment Income/(Loss) | | 0.12% | | | (0.34)% | | | (0.66)% | | | (0.36)% | | | (0.08)% | | | (0.23)% | |
| Portfolio Turnover Rate | | 23% | | | 39% | | | 31% | | | 42% | | | 44% | | | 37% | |
| | | | | | | | | | | | | | | | | | | | | | |
| |
* Total return includes adjustments in accordance with generally accepted accounting principles required at the year or period end and are not annualized for periods of less than one full year. ** Annualized for periods of less than one full year. (1) Per share amounts are calculated based on average shares outstanding during the year or period. |
| | |
See Notes to Financial Statements. |
| |
22 | MARCH 31, 2023 |
Janus Henderson Forty Fund
Financial Highlights
| | | | | | | | | | | | | | | | | | | | | | |
Class T Shares | | | | | | | | | | | | | | | | | | |
For a share outstanding during the period ended March 31, 2023 (unaudited) and the year ended September 30 | 2023 | | | 2022 | | | 2021 | | | 2020 | | | 2019 | | | 2018 | |
| Net Asset Value, Beginning of Period | | $32.92 | | | $54.99 | | | $45.83 | | | $36.44 | | | $36.70 | | | $32.40 | |
| Income/(Loss) from Investment Operations: | | | | | | | | | | | | | | | | | | |
| | Net investment income/(loss)(1) | | 0.07 | | | (0.03) | | | (0.21) | | | (0.04) | | | 0.06 | | | 0.01 | |
| | Net realized and unrealized gain/(loss) | | 6.76 | | | (16.83) | | | 13.22 | | | 12.01 | | | 2.21 | | | 7.24 | |
| Total from Investment Operations | | 6.83 | | | (16.86) | | | 13.01 | | | 11.97 | | | 2.27 | | | 7.25 | |
| Less Dividends and Distributions: | | | | | | | | | | | | | | | | | | |
| | Dividends (from net investment income) | | — | | | — | | | — | | | (0.05) | | | — | | | —(2) | |
| | Distributions (from capital gains) | | (0.02) | | | (5.21) | | | (3.85) | | | (2.53) | | | (2.53) | | | (2.95) | |
| Total Dividends and Distributions | | (0.02) | | | (5.21) | | | (3.85) | | | (2.58) | | | (2.53) | | | (2.95) | |
| Net Asset Value, End of Period | | $39.73 | | | $32.92 | | | $54.99 | | | $45.83 | | | $36.44 | | | $36.70 | |
| Total Return* | | 20.76% | | | (33.94)% | | | 29.86% | | | 34.71% | | | 7.93% | | | 23.96% | |
| Net Assets, End of Period (in thousands) | | $3,168,058 | | | $2,759,921 | | | $4,465,117 | | | $3,621,078 | | | $2,914,481 | | | $2,935,096 | |
| Average Net Assets for the Period (in thousands) | | $2,954,073 | | | $3,817,603 | | | $4,169,739 | | | $3,138,440 | | | $2,750,999 | | | $2,727,557 | |
| Ratios to Average Net Assets**: | | | | | | | | | | | | | | | | | | |
| | Ratio of Gross Expenses | | 0.72% | | | 0.81% | | | 0.95% | | | 0.92% | | | 0.90% | | | 0.91% | |
| | Ratio of Net Expenses (After Waivers and Expense Offsets) | | 0.70% | | | 0.79% | | | 0.93% | | | 0.91% | | | 0.85% | | | 0.83% | |
| | Ratio of Net Investment Income/(Loss) | | 0.38% | | | (0.07)% | | | (0.41)% | | | (0.10)% | | | 0.17% | | | 0.02% | |
| Portfolio Turnover Rate | | 23% | | | 39% | | | 31% | | | 42% | | | 44% | | | 37% | |
| | | | | | | | | | | | | | | | | | | | | | |
| |
* Total return includes adjustments in accordance with generally accepted accounting principles required at the year or period end and are not annualized for periods of less than one full year. ** Annualized for periods of less than one full year. (1) Per share amounts are calculated based on average shares outstanding during the year or period. (2) Less than $0.005 on a per share basis. |
| | |
See Notes to Financial Statements. |
| |
Janus Investment Fund | 23 |
Janus Henderson Forty Fund
Notes to Financial Statements (unaudited)
1. Organization and Significant Accounting Policies
Janus Henderson Forty Fund (the “Fund”) is a series of Janus Investment Fund (the “Trust”), which is organized as a Massachusetts business trust and is registered under the Investment Company Act of 1940, as amended (the “1940 Act”), as an open-end management investment company, and therefore has applied the specialized accounting and reporting guidance in Financial Accounting Standards Board (“FASB”) Accounting Standards Codification (“ASC”) Topic 946. The Trust offers 40 funds, each of which offers multiple share classes, with differing investment objectives and policies. The Fund seeks long-term growth of capital. The Fund is classified as nondiversified, as defined in the 1940 Act. Janus Henderson Investors US LLC is the investment adviser (the “Adviser”) to the Fund.
The Fund offers multiple classes of shares in order to meet the needs of various types of investors. Each class represents an interest in the same portfolio of investments. Certain financial intermediaries may not offer all classes of shares.
Shareholders, including other funds, individuals, accounts, as well as the Fund’s portfolio manager(s) and/or investment personnel, may from time to time own (beneficially or of record) a significant percentage of the Fund’s Shares and can be considered to “control” the Fund when that ownership exceeds 25% of the Fund’s assets (and which may differ from control as determined in accordance with United States of America generally accepted accounting principles ("US GAAP")).
Class A Shares are offered through financial intermediary platforms including, but not limited to, traditional brokerage platforms, mutual fund wrap fee programs, bank trust platforms, and retirement platforms.
Class C Shares are offered through financial intermediary platforms including, but not limited to, traditional brokerage platforms, mutual fund wrap fee programs, and bank trust platforms.
Class C Shares are closed to investments by new employer-sponsored retirement plans and existing employer-sponsored retirement plans are no longer able to make additional purchases or exchanges into Class C Shares.
The Fund currently implements an automatic conversion feature pursuant to which Class C Shares that have been held for eight years are automatically converted to Class A Shares without the imposition of any sales charge, fee or other charge. The conversion will generally occur no later than ten business days in the month following the month of the eighth anniversary of the date of purchase. Class C Shares purchased through the reinvestment of dividends and other distributions on Class C Shares will convert to Class A Shares at the same time as the original Class C Shares with respect to which they were purchased. For Class C Shares held in omnibus accounts on intermediary platforms, the Fund relies on these intermediaries to implement this conversion feature. Your financial intermediary may have separate policies and procedures as to when and how Class C Shares may be converted to Class A Shares.
Effective July 6, 2020, Class D Shares are available to new investors, subject to any closed fund policies for a Fund, as applicable. Previously, Class D Shares were only available to investors who already had a direct account with the Janus Henderson funds; immediate family members or members of the same household of an eligible individual investor; and existing beneficial owners of sole proprietorships or partnerships that hold accounts directly with the Janus Henderson funds.
Class I Shares are available through certain financial intermediary platforms including, but not limited to, mutual fund wrap fee programs, managed account programs, asset allocation programs, bank trust platforms, as well as certain retirement platforms. Class I Shares are also available to certain direct institutional investors including, but not limited to, corporations, certain retirement plans, public plans, and foundations/endowments, who established Class I Share accounts before August 4, 2017.
Class N Shares are generally available only to financial intermediaries purchasing on behalf of: 1) certain adviser-assisted, employer-sponsored retirement plans, including 401(k) plans, 457 plans, 403(b) plans, Taft-Hartley multi-employer plans, profit-sharing and money purchase pension plans, defined benefit plans and certain welfare benefit plans, such as health savings accounts, and nonqualified deferred compensation plans; and 2) retail investors purchasing in qualified or nonqualified accounts, whose accounts are held through an omnibus account at their financial intermediary, and where the financial intermediary requires no payment or reimbursement from the Fund, the Adviser, or its affiliates. Class N Shares are also available to Janus Henderson proprietary products and to certain direct institutional investors approved by Janus Henderson Distributors US LLC (the “Distributor”) including, but not limited to,
Janus Henderson Forty Fund
Notes to Financial Statements (unaudited)
corporations, certain retirement plans, public plans, and foundations and endowments, subject to minimum investment requirements.
Class R Shares are offered through financial intermediary platforms including, but not limited to, retirement platforms.
Class S Shares are offered through financial intermediary platforms including, but not limited to, retirement platforms and asset allocation, mutual fund wrap, or other discretionary or nondiscretionary fee-based investment advisory programs. In addition, Class S Shares may be available through certain financial intermediaries who have an agreement with the Adviser or its affiliates to offer Class S Shares on their supermarket platforms.
Class T Shares are available through certain financial intermediary platforms including, but not limited to, mutual fund wrap fee programs, managed account programs, asset allocation programs, bank trust platforms, as well as certain retirement platforms. In addition, Class T Shares may be available through certain financial intermediaries who have an agreement with the Adviser or its affiliates to offer Class T Shares on their supermarket platforms.
The following accounting policies have been followed by the Fund and are in conformity with US GAAP.
Investment Valuation
Fund holdings are valued in accordance with policies and procedures established by the Adviser pursuant to Rule 2a-5 under the 1940 Act and approved by and subject to the oversight of the Trustees (the “Valuation Procedures”). Equity securities traded on a domestic securities exchange are generally valued at readily available market quotations, which are (i) the official close prices or (ii) last sale prices on the primary market or exchange in which the securities trade. If such price is lacking for the trading period immediately preceding the time of determination, such securities are generally valued at their current bid price. Equity securities that are traded on a foreign exchange are generally valued at the closing prices on such markets. In the event that there is no current trading volume on a particular security in such foreign exchange, the bid price from the primary exchange is generally used to value the security. Foreign securities and currencies are converted to U.S. dollars using the current spot USD dollar exchange rate in effect at the close of the New York Stock Exchange (“NYSE”). The Fund will determine the market value of individual securities held by it by using prices provided by one or more approved professional pricing services or, as needed, by obtaining market quotations from independent broker-dealers. Most debt securities are valued in accordance with the evaluated bid price supplied by the Adviser-approved pricing service that is intended to reflect market value. The evaluated bid price supplied by the pricing service is an evaluation that may consider factors such as security prices, yields, maturities and ratings. Certain short-term securities maturing within 60 days or less may be evaluated and valued on an amortized cost basis provided that the amortized cost determined approximates market value. Securities for which market quotations or evaluated prices are not readily available or deemed unreliable are valued at fair value determined in good faith by the Adviser pursuant to the Valuation Procedures. Circumstances in which fair valuation may be utilized include, but are not limited to: (i) a significant event that may affect the securities of a single issuer, such as a merger, bankruptcy, or significant issuer-specific development; (ii) an event that may affect an entire market, such as a natural disaster or significant governmental action; (iii) a nonsignificant event such as a market closing early or not opening, or a security trading halt; and (iv) pricing of a nonvalued security and a restricted or nonpublic security. Special valuation considerations may apply with respect to “odd-lot” fixed-income transactions which, due to their small size, may receive evaluated prices by pricing services which reflect a large block trade and not what actually could be obtained for the odd-lot position. The valuation policies provide for the use of systematic fair valuation models provided by independent pricing services to value foreign equity securities in order to adjust for stale pricing, which may occur between the close of certain foreign exchanges and the close of the NYSE. The value of the securities of other mutual funds held by a Fund, if any, will be calculated using the NAV of such mutual funds.
Valuation Inputs Summary
FASB ASC 820, Fair Value Measurements and Disclosures (“ASC 820”), defines fair value, establishes a framework for measuring fair value, and expands disclosure requirements regarding fair value measurements. This standard emphasizes that fair value is a market-based measurement that should be determined based on the assumptions that market participants would use in pricing an asset or liability and establishes a hierarchy that prioritizes inputs to valuation techniques used to measure fair value. These inputs are summarized into three broad levels:
Level 1 – Unadjusted quoted prices in active markets the Fund has the ability to access for identical assets or liabilities.
Janus Henderson Forty Fund
Notes to Financial Statements (unaudited)
Level 2 – Observable inputs other than unadjusted quoted prices included in Level 1 that are observable for the asset or liability either directly or indirectly. These inputs may include quoted prices for the identical instrument on an inactive market, prices for similar instruments, interest rates, prepayment speeds, credit risk, yield curves, default rates and similar data.
Assets or liabilities categorized as Level 2 in the hierarchy generally include: debt securities fair valued in accordance with the evaluated bid or ask prices supplied by a pricing service; securities traded on OTC markets and listed securities for which no sales are reported that are fair valued at the latest bid price (or yield equivalent thereof) obtained from one or more dealers transacting in a market for such securities or by a pricing service approved by the Fund’s Trustees; certain short-term debt securities with maturities of 60 days or less that are fair valued at amortized cost; and equity securities of foreign issuers whose fair value is determined by using systematic fair valuation models provided by independent third parties in order to adjust for stale pricing which may occur between the close of certain foreign exchanges and the close of the NYSE. Other securities that may be categorized as Level 2 in the hierarchy include, but are not limited to, preferred stocks, bank loans, swaps, investments in unregistered investment companies, options, and forward contracts.
Level 3 – Unobservable inputs for the asset or liability to the extent that relevant observable inputs are not available, representing the Fund’s own assumptions about the assumptions that a market participant would use in valuing the asset or liability, and that would be based on the best information available.
There have been no significant changes in valuation techniques used in valuing any such positions held by the Fund since the beginning of the fiscal period.
The inputs or methodology used for fair valuing securities are not necessarily an indication of the risk associated with investing in those securities. The summary of inputs used as of March 31, 2023 to fair value the Fund’s investments in securities and other financial instruments is included in the “Valuation Inputs Summary” in the Notes to Schedule of Investments and Other Information.
Investment Transactions and Investment Income
Investment transactions are accounted for as of the date purchased or sold (trade date). Dividend income is recorded on the ex-dividend date. Certain dividends from foreign securities will be recorded as soon as the Fund is informed of the dividend, if such information is obtained subsequent to the ex-dividend date. Dividends from foreign securities may be subject to withholding taxes in foreign jurisdictions. Non-cash dividends, if any, are recorded on the ex-dividend date at fair value. Interest income is recorded daily on an accrual basis and includes amortization of premiums and accretion of discounts. The Fund classifies gains and losses on prepayments received as an adjustment to interest income. Debt securities may be placed in non-accrual status and related interest income may be reduced by stopping current accruals and writing off interest receivables when collection of all or a portion of interest has become doubtful. Gains and losses are determined on the identified cost basis, which is the same basis used for federal income tax purposes. Income, as well as gains and losses, both realized and unrealized, are allocated daily to each class of shares based upon the ratio of net assets represented by each class as a percentage of total net assets.
Expenses
The Fund bears expenses incurred specifically on its behalf. Each class of shares bears a portion of general expenses, which are allocated daily to each class of shares based upon the ratio of net assets represented by each class as a percentage of total net assets. Expenses directly attributable to a specific class of shares are charged against the operations of such class.
Estimates
The preparation of financial statements in conformity with US GAAP requires management to make estimates and assumptions that affect the reported amount of assets and liabilities and disclosure of contingent assets and liabilities at the date of the financial statements, and the reported amounts of income and expenses during the reporting period. Actual results could differ from those estimates.
Indemnifications
In the normal course of business, the Fund may enter into contracts that contain provisions for indemnification of other parties against certain potential liabilities. The Fund’s maximum exposure under these arrangements is unknown, and would involve future claims that may be made against the Fund that have not yet occurred. Currently, the risk of material loss from such claims is considered remote.
Janus Henderson Forty Fund
Notes to Financial Statements (unaudited)
Foreign Currency Translations
The Fund does not isolate that portion of the results of operations resulting from the effect of changes in foreign exchange rates on investments from the fluctuations arising from changes in market prices of securities held at the date of the financial statements. Net unrealized appreciation or depreciation of investments and foreign currency translations arise from changes in the value of assets and liabilities, including investments in securities held at the date of the financial statements, resulting from changes in the exchange rates and changes in market prices of securities held.
Currency gains and losses are also calculated on payables and receivables that are denominated in foreign currencies. The payables and receivables are generally related to foreign security transactions and income translations.
Foreign currency-denominated assets and forward currency contracts may involve more risks than domestic transactions, including currency risk, counterparty risk, political and economic risk, regulatory risk and equity risk. Risks may arise from unanticipated movements in the value of foreign currencies relative to the U.S. dollar.
Dividends and Distributions
The Fund generally declares and distributes dividends of net investment income and realized capital gains (if any) annually. The Fund may treat a portion of the amount paid to redeem shares as a distribution of investment company taxable income and realized capital gains that are reflected in the net asset value. This practice, commonly referred to as “equalization,” has no effect on the redeeming shareholder or a Fund’s total return, but may reduce the amounts that would otherwise be required to be paid as taxable dividends to the remaining shareholders. It is possible that the Internal Revenue Service (IRS) could challenge the Fund's equalization methodology or calculations, and any such challenge could result in additional tax, interest, or penalties to be paid by the Fund.
The Fund may make certain investments in real estate investment trusts (“REITs”) which pay dividends to their shareholders based upon funds available from operations. It is quite common for these dividends to exceed the REITs’ taxable earnings and profits, resulting in the excess portion of such dividends being designated as a return of capital. If the Fund distributes such amounts, such distributions could constitute a return of capital to shareholders for federal income tax purposes.
Federal Income Taxes
The Fund intends to continue to qualify as a regulated investment company and distribute all of its taxable income in accordance with the requirements of Subchapter M of the Internal Revenue Code. Management has analyzed the Fund’s tax positions taken for all open federal income tax years, generally a three-year period, and has concluded that no provision for federal income tax is required in the Fund’s financial statements. The Fund is not aware of any tax positions for which it is reasonably possible that the total amounts of unrecognized tax benefits will significantly change in the next twelve months.
2. Other Investments and Strategies
Additional Investment Risk
The U.S. government and the Federal Reserve, as well as certain foreign governments and central banks, have taken extraordinary actions to support local and global economies and the financial markets in response to the COVID-19 pandemic. This and other government intervention into the economy and financial markets to address the COVID-19 pandemic may not work as intended, particularly if the efforts are perceived by investors as being unlikely to achieve the desired results. Government actions to mitigate the economic impact of the pandemic have resulted in a large expansion of government deficits and debt, the long term consequences of which are not known. The COVID-19 pandemic could adversely affect the value and liquidity of a Fund’s investments, impair a Fund’s ability to satisfy redemption requests, and negatively impact a Fund’s performance. In addition, the outbreak of COVID-19, and measures taken to mitigate its effects, could result in disruptions to the services provided to a Fund by its service providers.
Widespread disease, including pandemics and epidemics, and natural or environmental disasters, including those which may be attributable to global climate change, such as earthquakes, fires, floods, hurricanes, tsunamis and weather-related phenomena generally, have been and can be highly disruptive to economies and markets, adversely impacting individual companies, sectors, industries, markets, currencies, interest and inflation rates, credit ratings, investor sentiment, and other factors affecting the value of a Fund’s investments. Economies and financial markets throughout the world have become increasingly interconnected, which increases the likelihood that events or conditions in one
Janus Henderson Forty Fund
Notes to Financial Statements (unaudited)
region or country will adversely affect markets or issuers in other regions or countries, including the United States. These disruptions could prevent a Fund from executing advantageous investment decisions in a timely manner and negatively impact a Fund’s ability to achieve its investment objective(s). Any such event(s) could have a significant adverse impact on the value of a Fund. In addition, these disruptions could also impair the information technology and other operational systems upon which the Fund’s service providers, including the Adviser or the subadviser (as applicable), rely, and could otherwise disrupt the ability of employees of the Fund’s service providers to perform essential tasks on behalf of the Fund. Adverse weather conditions may also have a particularly significant negative effect on issuers in the agricultural sector and on insurance and reinsurance companies that insure or reinsure against the impact of natural disasters.
A number of countries in the European Union (the “EU”) have experienced, and may continue to experience, severe economic and financial difficulties. In particular, many EU nations are susceptible to economic risks associated with high levels of debt. Many non-governmental issuers, and even certain governments, have defaulted on, or been forced to restructure, their debts. Many other issuers have faced difficulties obtaining credit or refinancing existing obligations. Financial institutions have in many cases required government or central bank support, have needed to raise capital, and/or have been impaired in their ability to extend credit. As a result, financial markets in the EU have experienced extreme volatility and declines in asset values and liquidity. These difficulties may continue, worsen, or spread further within the EU. Responses to these financial problems by European governments, central banks, and others, including austerity measures and reforms, may not work, may result in social unrest, and may limit future growth and economic recovery or have other unintended consequences. Among other things, these developments have adversely affected the value and exchange rate of the euro and pound sterling, and may continue to significantly affect the economies of all EU countries, which in turn may have a material adverse effect on the Fund’s investments in such countries, other countries that depend on EU countries for significant amounts of trade or investment, or issuers with exposure to debt issued by certain EU countries.
Real Estate Investing
The Fund may invest in equity and debt securities of real estate-related companies. Such companies may include those in the real estate industry or real estate-related industries. These securities may include common stocks, corporate bonds, preferred stocks, and other equity securities, including, but not limited to, mortgage-backed securities, real estate-backed securities, securities of REITs and similar REIT-like entities. A REIT is a trust that invests in real estate-related projects, such as properties, mortgage loans, and construction loans. REITs are generally categorized as equity, mortgage, or hybrid REITs. A REIT may be listed on an exchange or traded OTC.
Counterparties
Fund transactions involving a counterparty are subject to the risk that the counterparty or a third party will not fulfill its obligation to the Fund (“counterparty risk”). Counterparty risk may arise because of the counterparty’s financial condition (i.e., financial difficulties, bankruptcy, or insolvency), market activities and developments, or other reasons, whether foreseen or not. A counterparty’s inability to fulfill its obligation may result in significant financial loss to the Fund. The Fund may be unable to recover its investment from the counterparty or may obtain a limited recovery, and/or recovery may be delayed. The extent of the Fund’s exposure to counterparty risk with respect to financial assets and liabilities approximates its carrying value. See the "Offsetting Assets and Liabilities" section of this Note for further details.
The Fund may be exposed to counterparty risk through participation in various programs, including, but not limited to, lending its securities to third parties, cash sweep arrangements whereby the Fund’s cash balance is invested in one or more types of cash management vehicles, as well as investments in, but not limited to, repurchase agreements, debt securities, and derivatives, including various types of swaps, futures and options. The Fund intends to enter into financial transactions with counterparties that the Adviser believes to be creditworthy at the time of the transaction. There is always the risk that the Adviser’s analysis of a counterparty’s creditworthiness is incorrect or may change due to market conditions. To the extent that the Fund focuses its transactions with a limited number of counterparties, it will have greater exposure to the risks associated with one or more counterparties.
Securities Lending
Under procedures adopted by the Trustees, the Fund may seek to earn additional income by lending securities to certain qualified broker-dealers and institutions. JPMorgan Chase Bank, National Association acts as securities lending agent and a limited purpose custodian or subcustodian to receive and disburse cash balances and cash collateral, hold short-term investments, hold collateral, and perform other custodial functions in accordance with the Non-Custodial Securities Lending Agreement. For financial reporting purposes, the Fund does not offset financial instruments’
Janus Henderson Forty Fund
Notes to Financial Statements (unaudited)
payables and receivables and related collateral on the Statement of Assets and Liabilities. The Fund may lend fund securities in an amount equal to up to 1/3 of its total assets as determined at the time of the loan origination. There is the risk of delay in recovering a loaned security or the risk of loss in collateral rights if the borrower fails financially. In addition, the Adviser makes efforts to balance the benefits and risks from granting such loans. All loans will be continuously secured by collateral which may consist of cash, U.S. Government securities, domestic and foreign short-term debt instruments, letters of credit, time deposits, repurchase agreements, money market mutual funds or other money market accounts, or such other collateral as permitted by the Securities and Exchange Commission (the "SEC"). If the Fund is unable to recover a security on loan, the Fund may use the collateral to purchase replacement securities in the market. There is a risk that the value of the collateral could decrease below the cost of the replacement security by the time the replacement investment is made, resulting in a loss to the Fund. In certain circumstances individual loan transactions could yield negative returns.
Upon receipt of cash collateral, the Adviser may invest it in affiliated or non-affiliated cash management vehicles, whether registered or unregistered entities, as permitted by the 1940 Act and rules promulgated thereunder. The Adviser currently intends to primarily invest the cash collateral in a cash management vehicle for which the Adviser serves as investment adviser, Janus Henderson Cash Collateral Fund LLC, or in time deposits. An investment in Janus Henderson Cash Collateral Fund LLC is generally subject to the same risks that shareholders experience when investing in similarly structured vehicles, such as the potential for significant fluctuations in assets as a result of the purchase and redemption activity of the securities lending program, a decline in the value of the collateral, and possible liquidity issues. Such risks may delay the return of the cash collateral and cause the Fund to violate its agreement to return the cash collateral to a borrower in a timely manner. As adviser to the Fund and Janus Henderson Cash Collateral Fund LLC, the Adviser has an inherent conflict of interest as a result of its fiduciary duties to both the Fund and Janus Henderson Cash Collateral Fund LLC. Additionally, the Adviser receives an investment advisory fee of 0.05% for managing Janus Henderson Cash Collateral Fund LLC, but it may not receive a fee for managing certain other affiliated cash management vehicles in which the Fund may invest, and therefore may have an incentive to allocate preferred investment opportunities to investment vehicles for which it is receiving a fee.
The value of the collateral must be at least 102% of the market value of the loaned securities that are denominated in U.S. dollars and 105% of the market value of the loaned securities that are not denominated in U.S. dollars. Loaned securities and related collateral are marked-to-market each business day based upon the market value of the loaned securities at the close of business, employing the most recent available pricing information. Collateral levels are then adjusted based on this mark-to-market evaluation. Additional required collateral, or excess collateral returned, is delivered on the next business day. Therefore, the value of the collateral held may be temporarily less than 102% or 105% value of the securities on loan. The cash collateral invested by the Adviser is disclosed in the Schedule of Investments (if applicable).
Income earned from the investment of the cash collateral, net of rebates paid to, or fees paid by, borrowers and less the fees paid to the lending agent are included as “Affiliated securities lending income, net” on the Statement of Operations.
There were no securities on loan as of March 31, 2023.
3. Investment Advisory Agreements and Other Transactions with Affiliates
The Fund pays the Adviser an investment advisory fee rate that may adjust up or down based on the Fund’s performance relative to its benchmark index.
The investment advisory fee rate paid to the Adviser by the Fund consists of two components: (1) a base fee calculated by applying the contractual fixed rate of the advisory fee to the Fund’s average daily net assets during the previous month (the “Base Fee Rate”), plus or minus (2) a performance-fee adjustment (the “Performance Adjustment”) calculated by applying a variable rate of up to 0.15% (positive or negative) to the Fund’s average daily net assets based on the Fund’s relative performance compared to the cumulative investment record of its benchmark index over a 36-month performance measurement period or shorter time period, as applicable. The investment advisory fee rate is calculated daily and paid monthly.
The investment performance of the Fund’s Class A Shares (waiving the upfront sales load) for the performance measurement period is used to calculate the Performance Adjustment. The Fund’s Base Fee Rate prior to any performance adjustment (expressed as an annual rate) is 0.64%, and the Fund’s benchmark index used in the calculation is the Russell 1000® Growth Index.
Janus Henderson Forty Fund
Notes to Financial Statements (unaudited)
No Performance Adjustment is applied unless the difference between the Fund’s investment performance and the cumulative investment record of the Fund’s benchmark index is 0.50% or greater (positive or negative) during the applicable performance measurement period. The Base Fee Rate is subject to an upward or downward Performance Adjustment for every full 0.50% increment by which the Fund outperforms or underperforms its benchmark index, up to the Fund’s full performance rate of ±8.50%. Because the Performance Adjustment is tied to a Fund’s relative performance compared to its benchmark index (and not its absolute performance), the Performance Adjustment could increase the Adviser’s fee even if the Fund’s Shares lose value during the performance measurement period and could decrease the Adviser’s fee even if the Fund’s Shares increase in value during the performance measurement period. For purposes of computing the Base Fee Rate and the Performance Adjustment, net assets are averaged over different periods (average daily net assets during the previous month for the Base Fee Rate, versus average daily net assets during the performance measurement period for the Performance Adjustment). Performance of the Fund is calculated net of expenses whereas the Fund’s benchmark index does not have any fees or expenses. Reinvestment of dividends and distributions is included in calculating both the performance of a Fund and the Fund’s benchmark index.
The Fund’s prospectus and statement(s) of additional information contain additional information about performance-based fees. The amount shown as advisory fees on the Statement of Operations reflects the Base Fee Rate plus/minus any Performance Adjustment. For the period ended March 31, 2023, the performance adjusted investment advisory fee rate before any waivers and/or reimbursements of expenses is 0.46%.
The Adviser has contractually agreed to waive the investment advisory fee and/or reimburse operating expenses to the extent that the Fund’s total annual fund operating expenses, excluding any performance adjustments to management fees (if applicable), the fees payable pursuant to a Rule 12b-1 plan, shareholder servicing fees, such as transfer agency fees (including out-of-pocket costs), administrative services fees and any networking/omnibus payable by any share class, brokerage commissions, interest, dividends, taxes, acquired fund fees and expenses, and extraordinary expenses, exceed the annual rate of 0.68% of the Fund’s average daily net assets. The Adviser has agreed to continue the waivers for at least a one-year period commencing January 27, 2023. If applicable, amounts waived and/or reimbursed to the Fund by the Adviser are disclosed as “Excess Expense Reimbursement and Waivers” on the Statement of Operations.
The Adviser serves as administrator to the Fund pursuant to an administration agreement between the Adviser and the Trust. Under the administration agreement, the Adviser is authorized to perform, or cause others to perform certain administration, compliance, and accounting services to the Fund, including providing office space for the Fund, and is reimbursed by the Fund for certain of its costs in providing these services (to the extent the Adviser seeks reimbursement and such costs are not otherwise waived). In addition, employees of the Adviser and/or its affiliates may serve as officers of the Trust. The Fund pays for some or all of the salaries, fees, and expenses of the Adviser employees and Fund officers, with respect to certain specified administration functions they perform on behalf of the Fund. The Fund pays these costs based on out-of-pocket expenses incurred by the Adviser, and these costs are separate and apart from advisory fees and other expenses paid in connection with the investment advisory services the Adviser (or any subadvisor, as applicable) provides to the Fund. These amounts are disclosed as “Affiliated fund administration fees” on the Statement of Operations. In addition, some expenses related to compensation payable to the Fund’s Chief Compliance Officer and certain compliance staff, all of whom are employees of the Adviser and/or its affiliates, are shared with the Fund. Total compensation of $114,430 was paid to the Chief Compliance Officer and certain compliance staff by the Trust during the period ended March 31, 2023. The Fund's portion is reported as part of “Other expenses” on the Statement of Operations.
Janus Henderson Services US LLC (the “Transfer Agent”), a wholly-owned subsidiary of the Adviser, is the Fund’s transfer agent. The Transfer Agent provides or arranges for the provision of shareholder services including, but not limited to, recordkeeping, subaccounting, answering inquiries regarding accounts, order processing, transaction confirmations, the mailing of prospectuses and shareholder reports, and other shareholder services provided to or on behalf of shareholders. These amounts are disclosed as “Transfer agent administrative fees and expenses” on the Statement of Operations.
Janus Henderson Forty Fund
Notes to Financial Statements (unaudited)
Class D Shares of the Fund pay the Transfer Agent an annual administrative services fee based on the average daily net assets of Class D Shares as detailed below.
| | |
Average Daily Net Assets of Class D Shares of the Janus Henderson funds | Administrative Services Fee |
Under $40 billion | 0.12% |
$40 billion – $49.9 billion | 0.10% |
Over $49.9 billion | 0.08% |
During the reporting period, the administrative services fee rate was 0.12%.
The Transfer Agent receives an administrative services fee at an annual rate of up to 0.25% of the average daily net assets of the Fund’s Class R Shares, Class S Shares and Class T Shares for providing or procuring administrative services to investors in Class R Shares, Class S Shares and Class T Shares of the Fund. The Transfer Agent expects to use all or a significant portion of this fee to compensate retirement plan service providers, broker-dealers, bank trust departments, financial advisors, and other financial intermediaries for providing these services. The Transfer Agent may keep certain amounts retained for reimbursement of out-of-pocket costs incurred for servicing clients of Class R Shares, Class S Shares and Class T Shares.
Shareholder Services provided by these financial intermediaries may include, but are not limited to, recordkeeping, subaccounting, order processing, providing order confirmations, periodic statements, forwarding prospectuses, shareholder reports, and other materials to existing customers, answering inquiries regarding accounts, and other administrative services. Order processing includes the submission of transactions through the National Securities Clearing Corporation (“NSCC”) or similar systems, or those processed on a manual basis with the Adviser. For all share classes, the Transfer Agent also seeks reimbursement for costs it incurs as transfer agent and for providing servicing.
Certain, but not all, intermediaries may charge administrative fees to investors in Class A Shares, Class C Shares, and Class I Shares for administrative services provided on behalf of such investors. These administrative fees are paid by the Class A Shares, Class C Shares, and Class I Shares of the Fund to the Transfer Agent, which uses such fees to reimburse intermediaries. Consistent with the Transfer Agency Agreement between the Transfer Agent and the Fund, the Transfer Agent may negotiate the level, structure, and/or terms of the administrative fees with intermediaries requiring such fees on behalf of the Fund. The Adviser and its affiliates benefit from an increase in assets that may result from such relationships. The Adviser has agreed to limit these fees up to 0.20% for Class A Shares and Class C Shares, and up to 0.15% for Class I Shares on an annual basis based on the daily net assets of each share class. Such limits are subject to change by the Trustees in the future. These amounts are disclosed as “Transfer agent networking and omnibus fees” on the Statement of Operations.
The Transfer Agent is not compensated for its services related to the shares, except for out-of-pocket costs, although the Transfer Agent is compensated for its services related to Fund’s Class D Shares. These amounts are disclosed as “Other transfer agent fees and expenses” on the Statement of Operations.
Under distribution and shareholder servicing plans (the “Plans”) adopted in accordance with Rule 12b-1 under the 1940 Act, the Fund pays the Trust’s distributor, the Distributor, a wholly-owned subsidiary of the Adviser, a fee for the sale and distribution and/or shareholder servicing of the shares based on the average daily net assets for each share class at an annual rate of up to 0.25% for Class A Shares, up to 1.00% for Class C Shares, of up to 0.50% of the Class R Shares' average daily net assets, and up to 0.25% for Class S Shares. Under the terms of the Plans, the Trust is authorized to make payments to the Distributor for remittance to retirement plan service providers, broker-dealers, bank trust departments, financial advisors, and other financial intermediaries, as compensation for distribution and/or shareholder services performed by such entities for their customers who are investors in the Fund. These amounts are disclosed as “12b-1 Distribution and shareholder servicing fees” on the Statement of Operations.
Class A Shares include a 5.75% upfront sales charge of the offering price of the Fund. The sales charge is allocated between the Distributor and financial intermediaries. During the period ended March 31, 2023, the Distributor retained upfront sales charges of $13,817.
A contingent deferred sales charge (“CDSC”) of 1.00% will be deducted with respect to Class A Shares purchased without a sales load and redeemed within 12 months of purchase, unless waived. Any applicable CDSC will be 1.00% of the lesser of the original purchase price or the value of the redemption of the Class A Shares redeemed. There were
Janus Henderson Forty Fund
Notes to Financial Statements (unaudited)
no CDSCs paid by redeeming shareholders of Class A Shares to the Distributor during the period ended March 31, 2023.
A CDSC of 1.00% will be deducted with respect to Class C Shares redeemed within 12 months of purchase, unless waived. Any applicable CDSC will be 1.00% of the lesser of the original purchase price or the value of the redemption of the Class C Shares redeemed. During the period ended March 31, 2023, redeeming shareholders of Class C Shares paid CDSCs of $7,410.
The Board of Trustees has adopted a deferred compensation plan (the “Deferred Plan”) for independent Trustees to elect to defer receipt of all or a portion of the annual compensation they are entitled to receive from the Fund. All deferred fees are credited to an account established in the name of the Trustees. The amounts credited to the account then increase or decrease, as the case may be, in accordance with the performance of one or more of the Janus Henderson funds that are selected by the Trustees. The account balance continues to fluctuate in accordance with the performance of the selected fund or funds until final payment of all amounts are credited to the account. The fluctuation of the account balance is recorded by the Fund as unrealized appreciation/(depreciation) and is included as of March 31, 2023 on the Statement of Assets and Liabilities in the asset, “Trustees’ deferred compensation,” and liability, “Trustees’ deferred compensation fees.” Additionally, the recorded unrealized appreciation/(depreciation) is included in “Total distributable earnings (loss)” on the Statement of Assets and Liabilities. Deferred compensation expenses for the period ended March 31, 2023 are included in “Trustees’ fees and expenses” on the Statement of Operations. Trustees are allowed to change their designation of mutual funds from time to time. Amounts will be deferred until distributed in accordance with the Deferred Plan. Deferred fees of $205,688 were paid by the Trust to the Trustees under the Deferred Plan during the period ended March 31, 2023.
Pursuant to the provisions of the 1940 Act and related rules, the Fund may participate in an affiliated or non-affiliated cash sweep program. In the cash sweep program, uninvested cash balances of the Fund may be used to purchase shares of affiliated or non-affiliated money market funds or cash management pooled investment vehicles that operate as money market funds. The Fund is eligible to participate in the cash sweep program (the “Investing Funds”). The Adviser has an inherent conflict of interest because of its fiduciary duties to the affiliated money market funds or cash management pooled investment vehicles and the Investing Funds. Janus Henderson Cash Liquidity Fund LLC (the “Sweep Vehicle”) is an affiliated unregistered cash management pooled investment vehicle that invests primarily in highly-rated short-term fixed-income securities. The Sweep Vehicle operates pursuant to the provisions of the 1940 Act that govern the operation of money market funds and prices its shares at NAV reflecting market-based values of its portfolio securities (i.e., a “floating” NAV) rounded to the fourth decimal place (e.g., $1.0000). The Sweep Vehicle is permitted to impose a liquidity fee (of up to 2%) on redemptions from the Sweep Vehicle or a redemption gate that temporarily suspends redemptions from the Sweep Vehicle for up to 10 business days during a 90 day period. There are no restrictions on the Fund's ability to withdraw investments from the Sweep Vehicle at will, and there are no unfunded capital commitments due from the Fund to the Sweep Vehicle. The Sweep Vehicle does not charge any management fee, sales charge or service fee.
Any purchases and sales, realized gains/losses and recorded dividends from affiliated investments during the period ended March 31, 2023 can be found in the “Schedules of Affiliated Investments” located in the Schedule of Investments.
The Fund is permitted to purchase or sell securities (“cross-trade”) between itself and other funds or accounts managed by the Adviser in accordance with Rule 17a-7 under the Investment Company Act of 1940 (“Rule 17a-7”), when the transaction is consistent with the investment objectives and policies of the Fund and in accordance with the Internal Cross Trade Procedures adopted by the Trust’s Board of Trustees. These procedures have been designed to ensure that any cross-trade of securities by the Fund from or to another fund or account that is or could be considered an affiliate of the Fund under certain limited circumstances by virtue of having a common investment adviser, common Officer, or common Trustee complies with Rule 17a-7. Under these procedures, each cross-trade is effected at the current market price to save costs where allowed. During the period ended March 31, 2023, the Fund engaged in cross trades amounting to $2,511,356 in purchases.
Janus Henderson Forty Fund
Notes to Financial Statements (unaudited)
4. Federal Income Tax
Income and capital gains distributions are determined in accordance with income tax regulations that may differ from US GAAP. These differences are due to differing treatments for items such as net short-term gains, deferral of wash sale losses, foreign currency transactions, net investment losses, and capital loss carryovers.
The Fund has elected to treat gains and losses on forward foreign currency contracts as capital gains and losses, if applicable. Other foreign currency gains and losses on debt instruments are treated as ordinary income for federal income tax purposes pursuant to Section 988 of the Internal Revenue Code.
The aggregate cost of investments and the composition of unrealized appreciation and depreciation of investment securities for federal income tax purposes as of March 31, 2023 are noted below. The primary differences between book and tax appreciation or depreciation of investments are wash sale loss deferrals and investments in partnerships.
| | | | |
Federal Tax Cost | Unrealized
Appreciation | Unrealized
(Depreciation) | Net Tax Appreciation/
(Depreciation) |
$9,976,660,402 | $5,992,332,941 | $(239,679,810) | $5,752,653,131 |
Janus Henderson Forty Fund
Notes to Financial Statements (unaudited)
5. Capital Share Transactions
| | | | | | | |
| | | | | | |
| | Period ended March 31, 2023 | | Year ended September 30, 2022 |
| | Shares | Amount | | Shares | Amount |
| | | | | | | |
Class A Shares: | | | | | |
Shares sold | 473,570 | $ 17,669,187 | | 1,824,221 | $ 88,895,333 |
Reinvested dividends and distributions | 4,397 | 156,612 | | 753,582 | 38,854,683 |
Shares repurchased | (1,264,260) | (46,635,306) | | (2,230,354) | (103,878,161) |
Net Increase/(Decrease) | (786,293) | $ (28,809,507) | | 347,449 | $ 23,871,855 |
Class C Shares: | | | | | |
Shares sold | 241,178 | $ 6,663,054 | | 624,052 | $ 22,361,504 |
Reinvested dividends and distributions | 2,409 | 63,735 | | 436,951 | 16,848,831 |
Shares repurchased | (597,915) | (16,333,931) | | (1,195,072) | (41,246,484) |
Net Increase/(Decrease) | (354,328) | $ (9,607,142) | | (134,069) | $ (2,036,149) |
Class D Shares: | | | | | |
Shares sold | 1,840,060 | $ 65,855,532 | | 5,936,260 | $ 273,175,986 |
Reinvested dividends and distributions | 143,905 | 4,941,689 | | 23,777,109 | 1,179,582,360 |
Shares repurchased | (9,130,836) | (325,205,594) | | (17,863,300) | (784,478,975) |
Net Increase/(Decrease) | (7,146,871) | $(254,408,373) | | 11,850,069 | $ 668,279,371 |
Class I Shares: | | | | | |
Shares sold | 4,854,817 | $ 191,038,002 | | 15,427,444 | $ 742,458,563 |
Reinvested dividends and distributions | 19,504 | 735,303 | | 3,292,138 | 179,158,152 |
Shares repurchased | (7,991,015) | (312,716,670) | | (15,253,091) | (713,671,887) |
Net Increase/(Decrease) | (3,116,694) | $(120,943,365) | | 3,466,491 | $ 207,944,828 |
Class N Shares: | | | | | |
Shares sold | 1,106,717 | $ 43,887,825 | | 2,274,992 | $ 118,148,906 |
Reinvested dividends and distributions | 5,460 | 207,142 | | 907,966 | 49,702,045 |
Shares repurchased | (1,028,662) | (40,904,407) | | (2,605,013) | (123,365,676) |
Net Increase/(Decrease) | 83,515 | $ 3,190,560 | | 577,945 | $ 44,485,275 |
Class R Shares: | | | | | |
Shares sold | 126,714 | $ 3,955,274 | | 303,952 | $ 11,770,800 |
Reinvested dividends and distributions | 1,409 | 42,380 | | 242,433 | 10,599,178 |
Shares repurchased | (276,800) | (8,687,427) | | (576,615) | (22,762,684) |
Net Increase/(Decrease) | (148,677) | $ (4,689,773) | | (30,230) | $ (392,706) |
Class S Shares: | | | | | |
Shares sold | 610,219 | $ 21,385,408 | | 1,203,621 | $ 53,277,110 |
Reinvested dividends and distributions | 6,372 | 213,788 | | 1,123,563 | 54,650,126 |
Shares repurchased | (1,226,685) | (42,813,489) | | (2,869,276) | (126,181,200) |
Net Increase/(Decrease) | (610,094) | $ (21,214,293) | | (542,092) | $ (18,253,964) |
Class T Shares: | | | | | |
Shares sold | 2,884,770 | $ 104,767,575 | | 6,709,598 | $ 309,462,841 |
Reinvested dividends and distributions | 48,396 | 1,685,165 | | 8,122,878 | 408,986,887 |
Shares repurchased | (7,028,081) | (254,702,475) | | (12,209,097) | (543,679,763) |
Net Increase/(Decrease) | (4,094,915) | $(148,249,735) | | 2,623,379 | $ 174,769,965 |
6. Purchases and Sales of Investment Securities
For the period ended March 31, 2023, the aggregate cost of purchases and proceeds from sales of investment securities (excluding any short-term securities, short-term options contracts, TBAs, and in-kind transactions, as applicable) was as follows:
| | | | |
Purchases of
Securities | Proceeds from Sales
of Securities | Purchases of Long-
Term U.S. Government
Obligations | Proceeds from Sales
of Long-Term U.S.
Government Obligations |
$3,235,740,539 | $3,689,182,187 | $ - | $ - |
Janus Henderson Forty Fund
Notes to Financial Statements (unaudited)
7. Subsequent Event
Management has evaluated whether any events or transactions occurred subsequent to March 31, 2023 and through the date of issuance of the Fund’s financial statements and determined that there were no material events or transactions that would require recognition or disclosure in the Fund’s financial statements.
Janus Henderson Forty Fund
Additional Information (unaudited)
Proxy Voting Policies and Voting Record
A description of the policies and procedures that the Fund uses to determine how to vote proxies relating to its portfolio securities is available without charge: (i) upon request, by calling 1-800-525-1093; (ii) on the Fund’s website at janushenderson.com/proxyvoting; and (iii) on the SEC’s website at http://www.sec.gov. Additionally, information regarding the Fund’s proxy voting record for the most recent twelve-month period ended June 30 is also available, free of charge, through janushenderson.com/proxyvoting and from the SEC’s website at http://www.sec.gov.
Full Holdings
The Fund files its complete portfolio holdings (schedule of investments) with the SEC as an exhibit to Form N-PORT within 60 days of the end of the first and third fiscal quarters, and in the annual report and semiannual report to shareholders. The Fund’s Form N-PORT filings and annual and semiannual reports: (i) are available on the SEC’s website at http://www.sec.gov; and (ii) are available without charge, upon request, by calling a Janus Henderson representative at 1-877-335-2687 (toll free) (or 1-800-525-3713 if you hold Class D Shares). Portfolio holdings consisting of at least the names of the holdings are generally available on a monthly basis with a 30-day lag under Full Holdings for the Fund at janushenderson.com/info (or janushenderson.com/reports if you hold Class D Shares).
APPROVAL OF ADVISORY AGREEMENTS DURING THE PERIOD
The Trustees of Janus Aspen Series, each of whom serves as an “independent” Trustee (the “Trustees”), oversee the management of each portfolio of Janus Aspen Series (each, a “VIT Portfolio,” and collectively, the “VIT Portfolios”), as well as each fund of Janus Investment Fund (each, a “Fund,” and collectively, the “Funds” and together with the VIT Portfolios, the “Janus Henderson Funds,” and each, a “Janus Henderson Fund”). As required by law, the Trustees determine annually whether to continue the investment advisory agreement for each Janus Henderson Fund.
In connection with their most recent consideration of those agreements for each Janus Henderson Fund, the Trustees received and reviewed information provided by Janus Henderson Investors US LLC (the “Adviser”) in response to requests of the Trustees and their independent legal counsel. They also received and reviewed information and analysis provided by, and in response to requests of, their independent fee consultant. Throughout their consideration of the agreements, the Trustees were advised by their independent legal counsel. The Trustees met with management to consider the agreements, and also met separately in executive session with their independent legal counsel and their independent fee consultant.
At meetings held on November 9-10, 2022 and December 13-14, 2022, the Trustees evaluated the information provided by the Adviser and the independent fee consultant, as well as other information provided by the Adviser and the independent fee consultant during the year. Following such evaluation, the Trustees determined that the overall arrangements between each Janus Henderson Fund and the Adviser were fair and reasonable in light of the nature, extent, and quality of the services provided by the Adviser and its affiliates, the fees charged for those services, and other matters that the Trustees considered relevant in the exercise of their business judgment, and unanimously approved the continuation of the investment advisory agreement for each Janus Henderson Fund for the period from February 1, 2023 through February 1, 2024, subject to earlier termination as provided for in each agreement.
In considering the continuation of those agreements, the Trustees reviewed and analyzed various factors that they determined were relevant, including the factors described below, none of which by itself was considered dispositive. However, the material factors and conclusions that formed the basis for the Trustees’ determination to approve the continuation of the agreements are discussed separately below. Also included is a summary of the independent fee consultant’s conclusions and opinions that arose during, and were included as part of, the Trustees’ consideration of the agreements. “Management fees,” as used herein, reflect actual annual advisory fees and, for the purpose of peer comparisons any administration fees (excluding out of pocket costs), net of any waivers, paid by a fund as a percentage of average net assets.
Nature, Extent and Quality of Services
The Trustees reviewed the nature, extent, and quality of the services provided by the Adviser to the Janus Henderson Funds, taking into account the investment objective, strategies, and policies of each Janus Henderson Fund, and the knowledge the Trustees gained from their regular meetings with management on at least a quarterly basis and their ongoing review of information related to the Janus Henderson Funds. In addition, the Trustees reviewed the resources and key personnel of the Adviser, particularly noting those employees who provide investment and risk management services to the Janus Henderson Funds. The Trustees also considered other services provided to the Janus Henderson
Janus Henderson Forty Fund
Additional Information (unaudited)
Funds by the Adviser, such as managing the execution of portfolio transactions and the selection of broker-dealers for those transactions. The Trustees considered the Adviser’s role as administrator to the Janus Henderson Funds, noting that the Adviser generally does not receive a fee for its services as administrator, but is reimbursed for its out-of-pocket costs. The Trustees considered the role of the Adviser in monitoring adherence to the Janus Henderson Funds’ investment restrictions, providing support services for the Trustees and Trustee committees, and overseeing communications with Janus Henderson Fund shareholders and the activities of other service providers, including monitoring compliance with various policies and procedures of the Janus Henderson Funds and with applicable securities laws and regulations.
In this regard, the independent fee consultant noted that the Adviser provides a number of different services for the Janus Henderson Funds and their shareholders, ranging from investment management services to various other servicing functions, and that, in its view, the Adviser is a capable provider of those services. The independent fee consultant also provided its belief that the Adviser has developed a number of institutional competitive advantages that should enable it to provide superior investment and service performance over the long term.
The Trustees concluded that the nature, extent, and quality of the services provided by the Adviser to each Janus Henderson Fund were appropriate and consistent with the terms of the respective advisory agreements, and that, taking into account steps taken to address those Janus Henderson Funds whose performance lagged that of their peers for certain periods, the Janus Henderson Funds were likely to benefit from the continued provision of those services. They also concluded that the Adviser had sufficient personnel, with the appropriate education and experience, to serve the Janus Henderson Funds effectively and had demonstrated its ability to attract well-qualified personnel.
Performance of the Funds
The Trustees considered the performance results of each Janus Henderson Fund over various time periods. They noted that they considered Janus Henderson Fund performance data throughout the year, including periodic meetings with each Janus Henderson Fund’s portfolio manager(s), and also reviewed information comparing each Janus Henderson Fund’s performance with the performance of comparable fund peer groups identified by Broadridge Financial Solutions, Inc. (“Broadridge”), an independent data provider, and with the Janus Henderson Fund’s benchmark index. In this regard, the independent fee consultant found that the overall Janus Henderson Funds’ performance has been reasonable, noting that: (i) for the 36 months ended May 31, 2022, approximately 38% of the Janus Henderson Funds were in the top two quartiles of their Broadridge peer groups; (ii) for the 36 months ended September 30, 2022, approximately 45% of the Janus Henderson Funds were in the top two quartiles of performance as reported by Morningstar, and (iii) for the 12 months ended September 30, 2022, approximately 55% of the Janus Henderson Funds were in the top two quartiles of performance as reported by Morningstar.
The Trustees considered the performance of each Janus Henderson Fund, noting that performance may vary by share class, and noted the following with respect to the Funds:
Asset Allocation Funds
· For Janus Henderson Global Allocation Fund – Conservative, the Trustees noted that the Fund’s performance was in the third Broadridge quartile for the 36 months ended May 31, 2022 and the bottom Broadridge quartile for the 12 months ended May 31, 2022. The Trustees noted the reasons for the Fund’s underperformance and the steps the Adviser had taken or was taking to improve performance.
· For Janus Henderson Global Allocation Fund – Growth, the Trustees noted that the Fund’s performance was in the bottom Broadridge quartile for the 36 months ended May 31, 2022 and the bottom Broadridge quartile for the 12 months ended May 31, 2022. The Trustees noted the reasons for the Fund’s underperformance and the steps the Adviser had taken or was taking to improve performance.
· For Janus Henderson Global Allocation Fund – Moderate, the Trustees noted that the Fund’s performance was in the bottom Broadridge quartile for the 36 months ended May 31, 2022 and the bottom Broadridge quartile for the 12 months ended May 31, 2022. The Trustees noted the reasons for the Fund’s underperformance and the steps the Adviser had taken or was taking to improve performance.
Fixed-Income Funds
· For Janus Henderson Absolute Return Income Opportunities Fund, the Trustees noted that the Fund’s performance was in the third Broadridge quartile for the 36 months ended May 31, 2022 and the first Broadridge quartile for the 12 months ended May 31, 2022. The Trustees noted the reasons for the Fund’s underperformance,
Janus Henderson Forty Fund
Additional Information (unaudited)
the steps the Adviser had taken or was taking to improve performance, and that the performance trend was improving.
· For Janus Developed World Bond Fund, the Trustees noted that the Fund’s performance was in the bottom Broadridge quartile for the 36 months ended May 31, 2022 and the bottom Broadridge quartile for the 12 months ended May 31, 2022. The Trustees noted the reasons for the Fund’s underperformance and the steps the Adviser had taken or was taking to improve performance.
· For Janus Henderson Flexible Bond Fund, the Trustees noted that the Fund’s performance was in the first Broadridge quartile for the 36 months ended May 31, 2022 and the second Broadridge quartile for the 12 months ended May 31, 2022.
· For Janus Henderson Global Bond Fund, the Trustees noted that the Fund’s performance was in the third Broadridge quartile for the 36 months ended May 31, 2022 and the bottom Broadridge quartile for the 12 months ended May 31, 2022. The Trustees noted the reasons for the Fund’s underperformance and the steps the Adviser had taken or was taking to improve performance.
· For Janus Henderson High-Yield Fund, the Trustees noted that the Fund’s performance was in the third Broadridge quartile for the 36 months ended May 31, 2022 and the bottom Broadridge quartile for the 12 months ended May 31, 2022. The Trustees noted the reasons for the Fund’s underperformance and the steps the Adviser had taken or was taking to improve performance.
· For Janus Henderson Multi-Sector Income Fund, the Trustees noted that the Fund’s performance was in the second Broadridge quartile for the 36 months ended May 31, 2022 and the third Broadridge quartile for the 12 months ended May 31, 2022.
· For Janus Henderson Short Duration Flexible Bond Fund, the Trustees noted that the Fund’s performance was in the third Broadridge quartile for the 36 months ended May 31, 2022 and the bottom Broadridge quartile for the 12 months ended May 31, 2022. The Trustees noted the reasons for the Fund’s underperformance and the steps the Adviser had taken or was taking to improve performance.
Global and International Equity Funds
· For Janus Henderson Asia Equity Fund, the Trustees noted that the Fund’s performance was in the third Broadridge quartile for the 36 months ended May 31, 2022 and the third Broadridge quartile for the 12 months ended May 31, 2022. The Trustees noted the reasons for the Fund’s underperformance, while also noting that the Fund has a performance fee structure that results in lower management fees during periods of underperformance, and the steps the Adviser had taken or was taking to improve performance.
· For Janus Henderson Emerging Markets Fund, the Trustees noted that the Fund’s performance was in the third Broadridge quartile for the 36 months ended May 31, 2022 and the third Broadridge quartile for the 12 months ended May 31, 2022. The Trustees noted the reasons for the Fund’s underperformance and the steps the Adviser had taken or was taking to improve performance.
· For Janus Henderson European Focus Fund, the Trustees noted that the Fund’s performance was in the first Broadridge quartile for the 36 months ended May 31, 2022 and the second Broadridge quartile for the 12 months ended May 31, 2022.
· For Janus Henderson Global Equity Income Fund, the Trustees noted that the Fund’s performance was in the third Broadridge quartile for the 36 months ended May 31, 2022 and the first Broadridge quartile for the 12 months ended May 31, 2022. The Trustees noted the reasons for the Fund’s underperformance, the steps the Adviser had taken or was taking to improve performance, and that the performance trend was improving.
· For Janus Henderson Global Life Sciences Fund, the Trustees noted that the Fund’s performance was in the third Broadridge quartile for the 36 months ended May 31, 2022 and the second Broadridge quartile for the 12 months ended May 31, 2022. The Trustees noted the reasons for the Fund’s underperformance, the steps the Adviser had taken or was taking to improve performance, and that the performance trend was improving.
· For Janus Henderson Global Sustainable Equity Fund, the Trustees noted that the Fund’s performance was in the second Broadridge quartile for the 12 months ended May 31, 2022. The Trustees noted that 36 month-end performance was not yet available.
Janus Henderson Forty Fund
Additional Information (unaudited)
· For Janus Henderson Global Real Estate Fund, the Trustees noted that the Fund’s performance was in the second Broadridge quartile for the 36 months ended May 31, 2022 and the bottom Broadridge quartile for the 12 months ended May 31, 2022.
· For Janus Henderson Global Research Fund, the Trustees noted that the Fund’s performance was in the second Broadridge quartile for the 36 months ended May 31, 2022 and the first Broadridge quartile for the 12 months ended May 31, 2022.
· For Janus Henderson Global Select Fund, the Trustees noted that the Fund’s performance was in the first Broadridge quartile for the 36 months ended May 31, 2022 and the first Broadridge quartile for the 12 months ended May 31, 2022.
· For Janus Henderson Global Technology and Innovation Fund, the Trustees noted that the Fund’s performance was in the second Broadridge quartile for the 36 months ended May 31, 2022 and the second Broadridge quartile for the 12 months ended May 31, 2022.
· For Janus Henderson International Opportunities Fund, the Trustees noted that the Fund’s performance was in the bottom Broadridge quartile for the 36 months ended May 31, 2022 and the third Broadridge quartile for the 12 months ended May 31, 2022. The Trustees noted the reasons for the Fund’s underperformance and the steps the Adviser had taken or was taking to improve performance.
· For Janus Henderson Overseas Fund, the Trustees noted that the Fund’s performance was in the first Broadridge quartile for the 36 months ended May 31, 2022 and the first Broadridge quartile for the 12 months ended May 31, 2022.
· For Janus Henderson Responsible International Dividend Fund (formerly the Janus Henderson Dividend & Income Builder Fund), the Trustees noted that the Fund’s performance was in the bottom Broadridge quartile for the 36 months ended May 31, 2022 and the bottom Broadridge quartile for the 12 months ended May 31, 2022. The Trustees noted the reasons for the Fund’s underperformance and the steps the Adviser had taken or was taking to improve performance.
Money Market Funds
· For Janus Henderson Government Money Market Fund, the Trustees noted that the Fund’s performance was in the third Broadridge quartile for the 36 months ended May 31, 2022 and the bottom Broadridge quartile for the 12 months ended May 31, 2022. The Trustees noted the reasons for the Fund’s underperformance and the steps the Adviser had taken or was taking to improve performance.
· For Janus Henderson Money Market Fund, the Trustees noted that the Fund’s performance was in the third Broadridge quartile for the 36 months ended May 31, 2022 and the bottom Broadridge quartile for the 12 months ended May 31, 2022. The Trustees noted the reasons for the Fund’s underperformance and the steps the Adviser had taken or was taking to improve performance.
Multi-Asset Funds
· For Janus Henderson Adaptive Global Allocation Fund, the Trustees noted that the Fund’s performance was in bottom Broadridge quartile for the 36 months ended May 31, 2022 and the second Broadridge quartile for the 12 months ended May 31, 2022. The Trustees noted the reasons for the Fund’s underperformance, the steps the Adviser had taken or was taking to improve performance, and that the performance trend was improving.
· For Janus Henderson Balanced Fund, the Trustees noted that the Fund’s performance was in the first Broadridge quartile for the 36 months ended May 31, 2022 and the first Broadridge quartile for the 12 months ended May 31, 2022.
U.S. Equity Funds
· For Janus Henderson Adaptive Risk Managed U.S. Equity Fund, the Trustees noted that the Fund’s performance was in the bottom Broadridge quartile for the 36 months ended May 31, 2022 and the second Broadridge quartile for the 12 months ended May 31, 2022. The Trustees noted the reasons for the Fund’s underperformance, the steps the Adviser had taken or were taking to improve performance, and that the performance trend was improving.
Janus Henderson Forty Fund
Additional Information (unaudited)
· For Janus Henderson Contrarian Fund, the Trustees noted that the Fund’s performance was in the first Broadridge quartile for the 36 months ended May 31, 2022 and the bottom Broadridge quartile for the 12 months ended May 31, 2022.
· For Janus Henderson Enterprise Fund, the Trustees noted that the Fund’s performance was in the second Broadridge quartile for the 36 months ended May 31, 2022 and the first Broadridge quartile for the 12 months ended May 31, 2022.
· For Janus Henderson Forty Fund, the Trustees noted that the Fund’s performance was in the third Broadridge quartile for the 36 months ended May 31, 2022 and the bottom Broadridge quartile for the 12 months ended May 31, 2022. The Trustees noted the reasons for the Fund’s underperformance and the steps the Adviser had taken or was taking to improve performance.
· For Janus Henderson Growth and Income Fund, the Trustees noted that the Fund’s performance was in the bottom Broadridge quartile for the 36 months ended May 31, 2022 and the first Broadridge quartile for the 12 months ended May 31, 2022. The Trustees noted the reasons for the Fund’s underperformance, the steps the Adviser had taken or was taking to improve performance, and that the performance trend was improving.
· For Janus Henderson Mid Cap Value Fund, the Trustees noted that the Fund’s performance was in the bottom Broadridge quartile for the 36 months ended May 31, 2022 and the second Broadridge quartile for the 12 months ended May 31, 2022. The Trustees noted the reasons for the Fund’s underperformance, while also noting that the Fund has a performance fee structure that results in lower management fees during periods of underperformance, the steps the Adviser had taken or was taking to improve performance, and that the performance trend was improving.
· For Janus Henderson Research Fund, the Trustees noted that the Fund’s performance was in the third Broadridge quartile for the 36 months ended May 31, 2022 and the third Broadridge quartile for the 12 months ended May 31, 2022. The Trustees noted the reasons for the Fund’s underperformance, while also noting that the Fund has a performance fee structure that results in lower management fees during periods of underperformance and the steps the Adviser had taken or was taking to improve performance.
· For Janus Henderson Small Cap Value Fund, the Trustees noted that the Fund’s performance was in the bottom Broadridge quartile for the 36 months ended May 31, 2022 and the second Broadridge quartile for the 12 months ended May 31, 2022. The Trustees noted the reasons for the Fund’s underperformance, while also noting that the Fund has a performance fee structure that results in lower management fees during periods of underperformance, the steps the Adviser had taken or was taking to improve performance, and that the performance trend was improving.
· For Janus Henderson Small-Mid Cap Value Fund, the Trustees noted that the Fund’s performance was in the bottom Broadridge quartile for the 36 months ended May 31, 2022 and the second Broadridge quartile for the 12 months ended May 31, 2022. The Trustees noted the reasons for the Fund’s underperformance, while also noting that the Fund has a performance fee structure that results in lower management fees during periods of underperformance, the steps the Adviser had taken or was taking to improve performance, and that the performance trend is improving.
· For Janus Henderson Triton Fund, the Trustees noted that the Fund’s performance was in the bottom Broadridge quartile for the 36 months ended May 31, 2022 and the second Broadridge quartile for the 12 months ended May 31, 2022. The Trustees noted the reasons for the Fund’s underperformance, the steps the Adviser had taken or was taking to improve performance, and that the performance trend was improving.
· For Janus Henderson Venture Fund, the Trustees noted that the Fund’s performance was in the bottom Broadridge quartile for the 36 months ended May 31, 2022 and the second Broadridge quartile for the 12 months ended May 31, 2022. The Trustees noted the reasons for the Fund’s underperformance, the steps the Adviser had taken or was taking to improve performance, and that the performance trend was improving.
In consideration of each Janus Henderson Fund’s performance, the Trustees concluded that, taking into account the factors relevant to performance, as well as other considerations, including steps taken to improve performance, as applicable, the Janus Henderson Fund’s performance warranted continuation of such Janus Henderson Fund’s investment advisory agreement.
Janus Henderson Forty Fund
Additional Information (unaudited)
Costs of Services Provided
The Trustees examined information regarding the fees and expenses of each Janus Henderson Fund in comparison to similar information for other comparable funds as provided by Broadridge, an independent data provider. They also reviewed an analysis of that information provided by their independent fee consultant. The independent fee consultant provided its belief that the management fees charged by the Adviser to each of the Janus Henderson Funds under the current investment advisory and administration agreements are reasonable in relation to the services provided by the Adviser. The independent fee consultant found: (1) the total expenses and management fees of the Janus Henderson Funds to be reasonable relative to other comparable mutual funds; (2) the total expenses, on average, were 6% under the average total expenses of the respective Broadridge peer group; and (3) the management fees for the Janus Henderson Funds, on average, were 5% under the average management fees for the respective Broadridge peer group. The Trustees also considered the total expenses for each share class of each Janus Henderson Fund compared to the average total expenses for its Broadridge Expense Group and to average total expenses for its Broadridge Expense Universe.
For Janus Henderson Funds with three or more years of performance history, the independent fee consultant also performed a systematic “focus list” analysis of expenses which assessed fund fees in the context of fund performance being delivered. Based on this analysis, the independent fee consultant found that the combination of service quality/performance and expenses on these individual Janus Henderson Funds was reasonable in light of performance trends, performance histories, changes in portfolio management, relative average net asset levels, and the existence of performance fees, breakpoints, and/or expense waivers on such Janus Henderson Funds.
The Trustees considered the methodology used by the Adviser in determining compensation payable to portfolio managers, the competitive environment for investment management talent, and the competitive market for mutual funds in different distribution channels.
The Trustees also reviewed management fees charged by the Adviser to comparable separate account clients and to comparable non-affiliated funds subadvised by the Adviser (for which the Adviser provides only or primarily portfolio management services). Although in most instances subadvisory and separate account fee rates for various investment strategies were lower than management fee rates for Janus Henderson Funds having a similar strategy, the Trustees considered that the Adviser noted that, under the terms of the management agreements with the Janus Henderson Funds, the Adviser performs significant additional services for the Janus Henderson Funds that it does not provide to those other clients, including administration services, oversight of the Janus Henderson Funds’ other service providers, Trustee support, regulatory compliance and numerous other services, and that, in serving the Janus Henderson Funds, the Adviser assumes many legal risks and other costs that it does not assume in servicing its other clients. Moreover, the Trustees noted that the independent fee consultant found that: (1) the management fees the Adviser charges to the Janus Henderson Funds are reasonable in relation to the management fees the Adviser charges to funds subadvised by the Adviser and to the fees the Adviser charges to its institutional separate account clients; (2) these subadvised and institutional separate accounts have different service and infrastructure needs and operate in markets very different from the retail fund market; (3) Janus Henderson mutual fund investors enjoy reasonable fees relative to the fees charged in these other markets; and (4) as part of its 2022 review, 9 of 11 Janus Henderson Funds have lower management fees than similar funds subadvised by the Adviser. The Trustees noted that for the two Janus Henderson Funds that did not, management fees for each were under the average of its 15(c) peer group.
The Trustees considered the fees for each Janus Henderson Fund for its fiscal year ended in 2021 and noted the following with regard to each Janus Henderson Fund’s total expenses, net of applicable fee waivers (the Fund’s “total expenses”) as reflected in the comparative information provided by Broadridge:
Asset Allocation Funds
· For Janus Henderson Global Allocation Fund – Conservative, the Trustees noted that, although the Fund’s total expenses exceeded the peer group average for certain share classes, overall the Fund’s total expenses were reasonable. The Trustees also noted that the Adviser has contractually agreed to limit the Fund’s expenses.
· For Janus Henderson Global Allocation Fund – Growth, the Trustees noted that, although the Fund’s total expenses exceeded the peer group average for certain share classes, overall the Fund’s total expenses were reasonable. The Trustees also noted that the Adviser has contractually agreed to limit the Fund’s expenses, although this limit did not apply because the Fund’s total expenses as shown were below the applicable fee limit.
Janus Henderson Forty Fund
Additional Information (unaudited)
· For Janus Henderson Global Allocation Fund – Moderate, the Trustees noted that, although the Fund’s total expenses exceeded the peer group average for one share class, overall the Fund’s total expenses were reasonable. The Trustees also noted that the Adviser has contractually agreed to limit the Fund’s expenses.
Fixed-Income Funds
· For Janus Henderson Absolute Return Income Opportunities Fund, the Trustees noted that, although the Fund’s total expenses exceeded the peer group average for certain share classes, overall the Fund’s total expenses were reasonable. The Trustees also noted that the Adviser has contractually agreed to limit the Fund’s expenses.
· For Janus Henderson Developed World Bond Fund, the Trustees noted that, although the Fund’s total expenses exceeded the peer group average for one share class, overall the Fund’s total expenses were reasonable. The Trustees also noted that the Adviser has contractually agreed to limit the Fund’s expenses.
· For Janus Henderson Flexible Bond Fund, the Trustees noted that, although the Fund’s total expenses exceeded the peer group average for certain share classes, overall the Fund’s total expenses were reasonable. The Trustees also noted that the Adviser has contractually agreed to limit the Fund’s expenses, although this limit did not apply because the Fund’s total expenses as shown were below the applicable fee limit.
· For Janus Henderson Global Bond Fund, the Trustees noted that, although the Fund’s total expenses exceeded the peer group average for certain share classes, overall the Fund’s total expenses were reasonable. The Trustees also noted that the Adviser has contractually agreed to limit the Fund’s expenses.
· For Janus Henderson High-Yield Fund, the Trustees noted that, although the Fund’s total expenses exceeded the peer group average for certain share classes, overall the Fund’s total expenses were reasonable. The Trustees also noted that the Adviser has contractually agreed to limit the Fund’s expenses.
· For Janus Henderson Multi-Sector Income Fund, the Trustees noted that, although the Fund’s total expenses exceeded the peer group average for certain share classes, overall the Fund’s total expenses were reasonable. The Trustees also noted that the Adviser has contractually agreed to limit the Fund’s expenses.
· For Janus Henderson Short Duration Flexible Bond Fund, the Trustees noted that, although the Fund’s total expenses exceeded the peer group average for certain share classes, overall the Fund’s total expenses were reasonable. The Trustees also noted that the Adviser has contractually agreed to limit the Fund’s expenses.
Global and International Equity Funds
· For Janus Henderson Asia Equity Fund, the Trustees noted that, although the Fund’s total expenses exceeded the peer group average for certain share classes, overall the Fund’s total expenses were reasonable. The Trustees also noted that the Adviser has contractually agreed to limit the Fund’s expenses.
· For Janus Henderson Emerging Markets Fund, the Trustees noted that, although the Fund’s total expenses exceeded the peer group average for certain share classes, overall the Fund’s total expenses were reasonable. The Trustees also noted that the Adviser has contractually agreed to limit the Fund’s expenses.
· For Janus Henderson European Focus Fund, the Trustees noted that, although the Fund’s total expenses exceeded the peer group average for one share class, overall the Fund’s expenses were reasonable. The Trustees also noted that the Adviser has contractually agreed to limit the Fund’s expenses.
· For Janus Henderson Global Equity Income Fund, the Trustees noted that, although the Fund’s total expenses exceeded the peer group average for one share class, overall the Fund’s total expenses were reasonable. The Trustees also noted that the Adviser has contractually agreed to limit the Fund’s expenses, although this limit did not apply because the Fund’s total expenses as shown were below the applicable fee limit.
· For Janus Henderson Global Life Sciences Fund, the Trustees noted that the Fund’s total expenses were below the peer group average for all share classes.
· For Janus Henderson Global Real Estate Fund, the Trustees noted that, although the Fund’s total expenses exceeded the peer group average for certain share classes, overall the Fund’s total expenses were reasonable. The Trustees also noted that the Adviser has contractually agreed to limit the Fund’s expenses, although this limit did not apply because the Fund’s total expenses as shown were below the applicable fee limit.
Janus Henderson Forty Fund
Additional Information (unaudited)
· For Janus Henderson Global Research Fund, the Trustees noted that, although the Fund’s total expenses exceeded the peer group average for one share class, overall the Fund’s total expenses were reasonable. The Trustees also noted that the Adviser has contractually agreed to limit the Fund’s expenses, although this limit did not apply because the Fund’s total expenses as shown were below the applicable fee limit.
· For Janus Henderson Global Select Fund, the Trustees noted that, although the Fund’s total expenses exceeded the peer group average for certain share classes, overall the Fund’s total expenses were reasonable. The Trustees also noted that the Adviser has contractually agreed to limit the Fund’s expenses.
· For Janus Henderson Global Sustainable Equity Fund, the Trustees noted that, although the Fund’s total expenses exceeded the peer group average for certain share classes, overall the Fund’s expenses were reasonable. The Trustees also noted that the Adviser has contractually agreed to limit the Fund’s expenses.
· For Janus Henderson Global Technology and Innovation Fund, the Trustees noted that the Fund’s total expenses were below the peer group average for all share classes.
· For Janus Henderson International Opportunities Fund, the Trustees noted that, although the Fund’s total expenses exceeded the peer group average for certain share classes, overall the Fund’s expenses were reasonable. The Trustees also noted that the Adviser has contractually agreed to limit the Fund’s expenses.
· For Janus Henderson Overseas Fund, the Trustees noted that although the Fund’s total expenses exceeded the peer group average for certain share classes, overall the Fund’s total expenses were reasonable. The Trustees also noted that the Adviser has contractually agreed to limit the Fund’s expenses, although this limit did not apply because the Fund’s total expenses as shown were below the applicable fee limit.
· For Janus Henderson Responsible International Dividend Fund (formerly the Janus Henderson Dividend & Income Builder Fund), the Trustees noted that, although the Fund’s total expenses exceeded the peer group for one share class, overall the Fund’s total expenses were reasonable. The Trustees also noted that the Adviser has contractually agreed to limit the Fund’s expenses.
Money Market Funds
· For Janus Henderson Government Money Market Fund, the Trustees noted that the Fund’s total expenses were below the peer group average for all share classes.
· For Janus Henderson Money Market Fund, the Trustees noted that the Fund’s total expenses were below the peer group average for all share classes.
Multi-Asset Funds
· For Janus Henderson Adaptive Global Allocation Fund, the Trustees noted that, that the Fund’s total expenses were below the peer group average for all share classes.
· For Janus Henderson Balanced Fund, the Trustees noted that, although the Fund’s total expenses exceeded the peer group average for certain share classes, overall the Fund’s total expenses were reasonable. The Trustees also noted that the Adviser has contractually agreed to limit the Fund’s expenses, although this limit did not apply because the Fund’s total expenses as shown were below the applicable fee limit.
U.S. Equity Funds
· For Janus Henderson Adaptive Risk Managed U.S. Equity Fund, the Trustees noted that, although the Fund’s total expenses exceeded the peer group average for certain share classes, overall the Fund’s total expenses were reasonable. The Trustees also noted that the Adviser has contractually agreed to limit the Fund’s expenses, although this limit did not apply because the Fund’s total expenses as shown were below the applicable fee limit.
· For Janus Henderson Contrarian Fund, the Trustees noted that, although the Fund’s total expenses exceeded the peer group average for all share classes, overall the Fund’s total expenses were reasonable. The Trustees also noted that the Adviser had contractually agreed to limit the Fund’s expenses.
· For Janus Henderson Enterprise Fund, the Trustees noted that, although the Fund’s total expenses exceeded the peer group average for certain share classes, overall the Fund’s total expenses were reasonable. The Trustees also noted that the Adviser has contractually agreed to limit the Fund’s expenses, although this limit did not apply because the Fund’s total expenses as shown were below the applicable fee limit.
Janus Henderson Forty Fund
Additional Information (unaudited)
· For Janus Henderson Forty Fund, the Trustees noted that, although the Fund’s total expenses exceeded the peer group average for certain share classes, overall the Fund’s total expenses were reasonable. The Trustees also noted that the Adviser has contractually agreed to limit the Fund’s expenses, although this limit did not apply because the Fund’s total expenses as shown were below the applicable fee limit.
· For Janus Henderson Growth and Income Fund, the Trustees noted that, although the Fund’s total expenses exceeded the peer group average for certain share classes, overall the Fund’s total expenses were reasonable. The Trustees also noted that the Adviser has contractually agreed to limit the Fund’s expenses, although this limit did not apply because the Fund’s total expenses as shown were below the applicable fee limit.
· For Janus Henderson Mid Cap Value Fund, the Trustees noted that the Fund’s total expenses were below the peer group average for all share classes.
· For Janus Henderson Research Fund, the Trustees noted that, although the Fund’s total expenses exceeded the peer group average for certain share classes, overall the Fund’s total expenses were reasonable. The Trustees also noted that the Adviser has contractually agreed to limit the Fund’s expenses.
· For Janus Henderson Small Cap Value Fund, the Trustees noted that, although the Fund’s total expenses exceeded the peer group average for one share class, overall the Fund’s total expenses were reasonable. The Trustees also noted that the Adviser has contractually agreed to limit the Fund’s expenses, although this limit did not apply because the Fund’s total expenses as shown were below the applicable fee limit.
· For Janus Henderson Small-Mid Cap Value Fund, the Trustees noted that the Fund’s total expenses were below the peer group average for all share classes.
· For Janus Henderson Triton Fund, the Trustees noted that, although the Fund’s total expenses exceeded the peer group average for one share class, overall the Fund’s total expenses were reasonable. The Trustees also noted that the Adviser has contractually agreed to limit the Fund’s expenses, although this limit did not apply because the Fund’s total expenses as shown were below the applicable fee limit.
· For Janus Henderson Venture Fund, the Trustees noted that although the Fund’s total expenses exceeded the peer group average for one share class, overall the Fund’s total expenses were reasonable. The Trustees also noted that the Adviser has contractually agreed to limit the Fund’s expenses, although this limit did not apply because the Fund’s total expenses as shown were below the applicable fee limit.
The Trustees reviewed information on the overall profitability to the Adviser and its affiliates from their relationships with the Janus Henderson Funds, and considered profitability data of other publicly traded mutual fund advisers. The Trustees recognized that profitability comparisons among fund managers are difficult because of the variation in the type of comparative information that is publicly available, and the profitability of any fund manager is affected by numerous factors, including the organizational structure of the particular fund manager, differences in complex size, difference in product mix, difference in types of business (mutual fund, institutional and other), differences in the types of funds and other accounts it manages, possible other lines of business, the methodology for allocating expenses and the fund manager’s capital structure and cost of capital.
Additionally, the Trustees considered the estimated profitability to the Adviser from the investment management services it provided to each Janus Henderson Fund. In their review, the Trustees considered whether the Adviser receive adequate incentives and resources to manage the Janus Henderson Funds effectively. In reviewing profitability, the Trustees noted that the estimated profitability for an individual Janus Henderson Fund is necessarily a product of the allocation methodology utilized by the Adviser to allocate its expenses as part of the estimated profitability calculation. In this regard, the Trustees noted that the independent fee consultant found as part of its 2022 review that (1) the expense allocation methodology and rationales utilized by the Adviser were reasonable and (2) no clear correlation exists between expense allocations and operating margins. The Trustees also considered that the estimated profitability for an individual Janus Henderson Fund was influenced by a number of factors, including not only the allocation methodology selected, but also the presence of fee waivers and expense caps, and whether the Janus Henderson Fund’s investment management agreement contained breakpoints or a performance fee component. The Trustees determined, after taking into account these factors, among others, that the Adviser’s estimated profitability with respect to each Janus Henderson Fund was not unreasonable in relation to the services provided, and that the variation in the range of such estimated profitability among the Janus Henderson Funds was not a material factor in the Board’s approval of the reasonableness of any Janus Henderson Fund’s investment management fees.
Janus Henderson Forty Fund
Additional Information (unaudited)
The Trustees concluded that the management fees payable by each Janus Henderson Fund to the Adviser were reasonable in relation to the nature, extent, and quality of the services provided, taking into account the fees charged by other advisers for managing comparable mutual funds with similar strategies, the fees the Adviser charges to other clients, and, as applicable, the impact of fund performance on management fees payable by the Janus Henderson Funds. The Trustees also concluded that each Janus Henderson Fund’s total expenses were reasonable, taking into account the size of the Janus Henderson Fund, the quality of services provided by the Adviser, the investment performance of the Janus Henderson Fund, and any expense limitations agreed to or provided by the Adviser.
Economies of Scale
The Trustees considered information about the potential for the Adviser to realize economies of scale as the assets of the Janus Henderson Funds increase. They noted that their independent fee consultant published a report to the Trustees in June 2022 which provided its research and analysis into economies of scale. They also noted that, although many Janus Henderson Funds pay advisory fees at a fixed base rate as a percentage of net assets, without any breakpoints or performance fees, their independent fee consultant concluded that 75% of these Janus Henderson Funds’ have contractual management fees (gross of waivers) below their Broadridge Expense Group averages. The Trustees also noted the following from the independent fee consultant’s report: (1) that 31% of Janus Henderson Funds had management fee breakpoints in place whereby investors pay lower management fees as fund AUM increases; (2) that 29% of Janus Henderson Funds have low flat-rate fees and performance fees where the Adviser is incentivized to invest in resources which drive Janus Henderson Fund performance; and (3) that 39% of Janus Henderson Funds have low flat-rate fees versus peers where investors pay low fixed fees when the Janus Henderson Fund is small/midsized and higher fees when the Janus Henderson Fund grows in assets. The Trustees also noted that the Janus Henderson Funds share directly in economies of scale through the significant investments made by the Adviser and its affiliates related to services provided to the Funds and the lower charges of third-party service providers that are based in part on the combined scale of all of the Janus Henderson Funds.
The Trustees also considered the independent fee consultant’s conclusion that, given the limitations of various analytical approaches to economies of scale and their conflicting results, it is difficult to analytically confirm or deny the existence of economies of scale in the Janus Henderson complex. In this regard, the independent consultant concluded that (1) to the extent there were economies of scale at the Adviser, the Adviser’s general strategy of setting fixed management fees below peers appeared to share any such economies with investors even on smaller Janus Henderson Funds which have not yet achieved those economies and (2) by setting lower fixed fees from the start on these Janus Henderson Funds, the Adviser appeared to be investing to increase the likelihood that these Janus Henderson Funds will grow to a level to achieve any economies of scale that may exist. Further, the independent fee consultant provided its belief that Janus Henderson Fund investors are well-served by the fee levels and performance fee structures in place on the Janus Henderson Funds in light of any economies of scale that may be present at the Adviser.
Based on all of the information reviewed, including the recent and past research and analysis conducted by the Trustees’ independent fee consultant, the Trustees concluded that the current fee structure of each Janus Henderson Fund was reasonable and that the current rates of fees do reflect a sharing between the Adviser and the Janus Henderson Fund of any economies of scale that may be present at the current asset level of the Janus Henderson Fund.
Other Benefits to the Adviser
The Trustees also considered benefits that accrue to the Adviser and its affiliates from their relationships with the Janus Henderson Funds. They recognized that two affiliates of the Adviser separately serve the Janus Henderson Funds as transfer agent and distributor, respectively, and the transfer agent receives compensation directly from the non-money market Janus Henderson Funds for services provided, and that such compensation contributes to the overall profitability of the Adviser and its affiliates that results from their relationship with the Janus Henderson Funds. The Trustees also considered the Adviser’s past and proposed use of commissions paid by the Janus Henderson Funds on portfolio brokerage transactions to obtain proprietary and third-party research products and services benefiting the Janus Henderson Fund and/or other clients of the Adviser and/or the Adviser. The Trustees concluded that the Adviser’s use of these types of client commission arrangements to obtain proprietary and third-party research products and services was consistent with regulatory requirements and guidelines and was likely to benefit each Janus Henderson Fund. The Trustees also concluded that, other than the services provided by the Adviser and its affiliates pursuant to the agreements and the fees to be paid by each Janus Henderson Fund therefor, the Janus Henderson
Janus Henderson Forty Fund
Additional Information (unaudited)
Funds and the Adviser may potentially benefit from their relationship with each other in other ways. They concluded that the Adviser and its affiliates share directly in economies of scale through the lower charges of third-party service providers that are based in part on the combined scale of the Janus Henderson Funds and other clients serviced by the Adviser and its affiliates. They also concluded that the Adviser benefits from the receipt of research products and services acquired through commissions paid on portfolio transactions of the Janus Henderson Funds and that the Janus Henderson Funds benefit from the Adviser’s receipt of those products and services as well as research products and services acquired through commissions paid by other clients of the Adviser. They further concluded that the success of any Janus Henderson Fund could attract other business to the Adviser or other Janus Henderson Funds, and that the success of the Adviser could enhance the Adviser’s ability to serve the Janus Henderson Funds.
Janus Henderson Forty Fund
Liquidity Risk Management Program (unaudited)
Liquidity Risk Management Program
Rule 22e-4 under the Investment Company Act of 1940, as amended (the “Liquidity Rule”), requires open-end funds (but not money market funds) to adopt and implement a written liquidity risk management program (the “LRMP”) that is reasonably designed to assess and manage liquidity risk, which is the risk that a fund could not meet redemption requests without significant dilution of remaining investors’ interest in the fund. The Fund has implemented a LRMP, which incorporates the following elements: (i) assessment, management, and periodic review of liquidity risk; (ii) classification of portfolio holdings; (iii) the establishment and monitoring of a highly liquid investment minimum, as applicable; (iv) a 15% limitation on a Fund’s illiquid investments; (v) redemptions in-kind; and (vi) board oversight.
The Trustees of the Fund (the “Trustees”) have designated Janus Henderson Investors US LLC, the Fund’s investment adviser (the “Adviser”), as the Program Administrator for the LRMP responsible for administering the LRMP and carrying out the specific responsibilities of the LRMP. A working group comprised of various teams within the Adviser’s business is responsible for administering the LRMP and carrying out the specific responsibilities of different aspects of the LRMP (the “Liquidity Risk Working Group”). In assessing each Fund’s liquidity risk, the Liquidity Risk Working Group periodically considers, as relevant, factors including (i) the liquidity of a Fund’s portfolio investments during normal and reasonably foreseeable stressed conditions; (ii) whether a Fund’s investment strategy is appropriate for an open-end fund; (iii) the extent to which a Fund’s strategy involves a relatively concentrated portfolio or large positions in any issuer; (iv) a Fund’s use of borrowing for investment purposes; and (v) a Fund’s use of derivatives.
The Liquidity Rule requires the Trustees to review at least annually a written report provided by the Program Administrator that addresses the operation of the LRMP and assesses its adequacy and the effectiveness of its implementation, including, if applicable, the operation of the highly liquid investment minimum, and any material changes to the LRMP (the “Program Administrator Report”). At a meeting held on March 15, 2023, the Adviser provided the Program Administrator Report to the Trustees which covered the operation of the LRMP from January 1, 2022 through December 31, 2022 (the “Reporting Period”).
The Program Administrator Report discussed the operation and effectiveness of the LRMP during the Reporting Period. Among other things, the Program Administrator Report indicated that there were no material changes to the LRMP during the Reporting Period, although there were certain methodology adjustments implemented relating to a change in data provider. Additionally, the findings presented in the Program Administrator Report indicated that the LRMP operated adequately during the Reporting Period. These findings included that the Fund was able to meet redemptions during the normal course of business during the Reporting Period. The Program Administrator Report also stated that the Fund did not exceed the 15% limit on illiquid assets during the Reporting Period, that the Fund held primarily highly liquid assets, and was considered to be a primarily highly liquid fund during the Reporting Period. Also included among the Program Administrator Report’s findings was the determination that the Fund’s investment strategy remains appropriate for an open-end fund. In addition, the Adviser expressed its belief in the Program Administrator Report that the LRMP is reasonably designed and adequate to assess and manage the Fund’s liquidity risk, considering the Fund’s particular risks and circumstances, and includes policies and procedures reasonably designed to implement each required component of the Liquidity Rule.
There can be no assurance that the LRMP will achieve its objectives in the future. Please refer to your Fund’s prospectus for more information regarding the risks to which an investment in the Fund may be subject.
Janus Henderson Forty Fund
Useful Information About Your Fund Report (unaudited)
Performance Overviews
Performance overview graphs compare the performance of a hypothetical $10,000 investment in the Fund with one or more widely used market indices. When comparing the performance of the Fund with an index, keep in mind that market indices are not available for investment and do not reflect deduction of expenses.
Average annual total returns are quoted for a Fund with more than one year of performance history. Average annual total return is calculated by taking the growth or decline in value of an investment over a period of time, including reinvestment of dividends and distributions, then calculating the annual compounded percentage rate that would have produced the same result had the rate of growth been constant throughout the period. Average annual total return does not reflect the deduction of taxes that a shareholder would pay on Fund distributions or redemptions of Fund shares.
Cumulative total returns are quoted for a Fund with less than one year of performance history. Cumulative total return is the growth or decline in value of an investment over time, independent of the period of time involved. Cumulative total return does not reflect the deduction of taxes that a shareholder would pay on Fund distributions or redemptions of Fund shares.
Pursuant to federal securities rules, expense ratios shown in the performance chart reflect subsidized (if applicable) and unsubsidized ratios. The total annual fund operating expenses ratio is gross of any fee waivers, reflecting the Fund’s unsubsidized expense ratio. The net annual fund operating expenses ratio (if applicable) includes contractual waivers of the Adviser and reflects the Fund’s subsidized expense ratio. Ratios may be higher or lower than those shown in the “Financial Highlights” in this report.
Schedule of Investments
Following the performance overview section is the Fund’s Schedule of Investments. This schedule reports the types of securities held in the Fund on the last day of the reporting period. Securities are usually listed by type (common stock, corporate bonds, U.S. Government obligations, etc.) and by industry classification (banking, communications, insurance, etc.). Holdings are subject to change without notice.
The value of each security is quoted as of the last day of the reporting period. The value of securities denominated in foreign currencies is converted into U.S. dollars.
If the Fund invests in foreign securities, it will also provide a summary of investments by country. This summary reports the Fund exposure to different countries by providing the percentage of securities invested in each country. The country of each security represents the country of risk. A company may be allocated to a country based on other factors such as location of the company’s principal office, the location of the principal trading market for the company’s securities, or the country where a majority of the company’s revenues are derived. The Fund’s Schedule of Investments relies upon the industry group and country classifications published by Bloomberg and/or MSCI Inc.
Tables listing details of individual forward currency contracts, futures, written options, swaptions, and swaps follow the Fund’s Schedule of Investments (if applicable).
Statement of Assets and Liabilities
This statement is often referred to as the “balance sheet.” It lists the assets and liabilities of the Fund on the last day of the reporting period.
The Fund’s assets are calculated by adding the value of the securities owned, the receivable for securities sold but not yet settled, the receivable for dividends declared but not yet received on securities owned, and the receivable for Fund shares sold to investors but not yet settled. The Fund’s liabilities include payables for securities purchased but not yet settled, Fund shares redeemed but not yet paid, and expenses owed but not yet paid. Additionally, there may be other assets and liabilities such as unrealized gain or loss on forward currency contracts.
The section entitled “Net Assets Consist of” breaks down the components of the Fund’s net assets. Because the Fund must distribute substantially all earnings, you will notice that a significant portion of net assets is shareholder capital.
The last section of this statement reports the net asset value (“NAV”) per share on the last day of the reporting period. The NAV is calculated by dividing the Fund’s net assets for each share class (assets minus liabilities) by the number of shares outstanding.
Janus Henderson Forty Fund
Useful Information About Your Fund Report (unaudited)
Statement of Operations
This statement details the Fund’s income, expenses, realized gains and losses on securities and currency transactions, and changes in unrealized appreciation or depreciation of Fund holdings.
The first section in this statement, entitled “Investment Income,” reports the dividends earned from securities and interest earned from interest-bearing securities in the Fund.
The next section reports the expenses incurred by the Fund, including the advisory fee paid to the investment adviser, transfer agent fees and expenses, and printing and postage for mailing statements, financial reports and prospectuses. Expense offsets and expense reimbursements, if any, are also shown.
The last section lists the amounts of realized gains or losses from investment and foreign currency transactions, and changes in unrealized appreciation or depreciation of investments and foreign currency-denominated assets and liabilities. The Fund will realize a gain (or loss) when it sells its position in a particular security. A change in unrealized gain (or loss) refers to the change in net appreciation or depreciation of the Fund during the reporting period. “Net Realized and Unrealized Gain/(Loss) on Investments” is affected both by changes in the market value of Fund holdings and by gains (or losses) realized during the reporting period.
Statements of Changes in Net Assets
These statements report the increase or decrease in the Fund’s net assets during the reporting period. Changes in the Fund’s net assets are attributable to investment operations, dividends and distributions to investors, and capital share transactions. This is important to investors because it shows exactly what caused the Fund’s net asset size to change during the period.
The first section summarizes the information from the Statement of Operations regarding changes in net assets due to the Fund’s investment operations. The Fund’s net assets may also change as a result of dividend and capital gains distributions to investors. If investors receive their dividends and/or distributions in cash, money is taken out of the Fund to pay the dividend and/or distribution. If investors reinvest their dividends and/or distributions, the Fund’s net assets will not be affected.
The reinvestment of dividends and distributions is included under “Capital Share Transactions.” “Capital Shares” refers to the money investors contribute to the Fund through purchases or withdrawals via redemptions. The Fund’s net assets will increase and decrease in value as investors purchase and redeem shares from the Fund.
Financial Highlights
This schedule provides a per-share breakdown of the components that affect the Fund’s NAV for current and past reporting periods as well as total return, asset size, ratios, and portfolio turnover rate.
The first line in the table reflects the NAV per share at the beginning of the reporting period. The next line reports the net investment income/(loss) per share. Following is the per share total of net gains/(losses), realized and unrealized. Per share dividends and distributions to investors are then subtracted to arrive at the NAV per share at the end of the period. The next line reflects the total return for the period. The total return may include adjustments in accordance with generally accepted accounting principles required at the period end for financial reporting purposes. As a result, the total return may differ from the total return reflected for individual shareholder transactions. Also included are ratios of expenses and net investment income to average net assets.
The Fund’s expenses may be reduced through expense offsets and expense reimbursements. The ratios shown reflect expenses before and after any such offsets and reimbursements.
The ratio of net investment income/(loss) summarizes the income earned less expenses, divided by the average net assets of the Fund during the reporting period. Do not confuse this ratio with the Fund’s yield. The net investment income ratio is not a true measure of the Fund’s yield because it does not take into account the dividends distributed to the Fund’s investors.
The next figure is the portfolio turnover rate, which measures the buying and selling activity in the Fund. Portfolio turnover is affected by market conditions, changes in the asset size of the Fund, fluctuating volume of shareholder purchase and redemption orders, the nature of the Fund’s investments, and the investment style and/or outlook of the portfolio manager(s) and/or investment personnel. A 100% rate implies that an amount equal to the value of the entire portfolio was replaced once during the fiscal year; a 50% rate means that an amount equal to the value of half the
Janus Henderson Forty Fund
Useful Information About Your Fund Report (unaudited)
portfolio is traded in a year; and a 200% rate means that an amount equal to the value of the entire portfolio is traded every six months.
Janus Henderson Forty Fund
Notes
NotesPage1
Janus Henderson Forty Fund
Notes
NotesPage2
Janus Henderson Forty Fund
Notes
NotesPage3
| | | | | | | | |
| | | | | |

| | | | |
This report is submitted for the general information of shareholders of the Fund. It is not an offer or solicitation for the Fund and is not authorized for distribution to prospective investors unless preceded or accompanied by an effective prospectus. |
Janus Henderson is a trademark of Janus Henderson Group plc or one of its subsidiaries. © Janus Henderson Group plc. Janus Henderson Group is the ultimate parent of Janus Henderson Distributors US LLC. Janus Henderson Distributors US LLC |
| | | | 125-24-93041 05-23 |
| | | | |
| | | |
| | | SEMIANNUAL REPORT March 31, 2023 |
| | |
| | Janus Henderson Global Equity Income Fund |
| | |
| | Janus Investment Fund |
| |
| | | HIGHLIGHTS · Investment strategy behind your fund · Fund performance, characteristics
and holdings |
Table of Contents
Janus Henderson Global Equity Income Fund
| | | | | | |
| | | | 
Ben Lofthouse co-portfolio manager | 
Job Curtis co-portfolio manager | 
Alex Crooke co-portfolio manager |
| | | |
Janus Henderson Global Equity Income Fund (unaudited)
Fund At A Glance
March 31, 2023
| | | | | | | | | | |
| | | | | | | | | |
| | | | | | | | | |
| | | | | | | | | |
| 5 Top Contributors - Holdings | 5 Top Detractors - Holdings |
| | Average
Weight | | Relative
Contribution | | | Average
Weight | | Relative
Contribution |
| TotalEnergies SE | 2.69% | | 0.49% | | Roche Holding AG | 2.61% | | -0.62% |
| Sanofi | 1.92% | | 0.49% | | British American Tobacco PLC | 3.11% | | -0.58% |
| Tokyo Electron Ltd | 1.70% | | 0.44% | | Pioneer Natural Resources Co | 2.51% | | -0.55% |
| Enel SpA | 1.46% | | 0.40% | | Bristol-Myers Squibb Co | 1.79% | | -0.38% |
| 3i Group PLC | 0.66% | | 0.35% | | Nutrien Ltd | 0.91% | | -0.30% |
| | | | | | | |
| 5 Top Contributors - Sectors* | | | | | |
| | | Relative | | Fund | MSCI World Index |
| | | Contribution | | Average Weight | Average Weight |
| Financials | | 1.57% | | 14.60% | 14.20% |
| Utilities | | 1.48% | | 6.96% | 3.04% |
| Consumer Discretionary | | 1.28% | | 5.35% | 10.53% |
| Health Care | | 0.71% | | 15.39% | 13.93% |
| Industrials | | 0.67% | | 5.80% | 10.56% |
| | | | | | |
| | | | | | |
| 5 Top Detractors - Sectors* | | | | | |
| | | Relative | | Fund | MSCI World Index |
| | | Contribution | | Average Weight | Average Weight |
| Materials | | -0.68% | | 7.89% | 4.43% |
| Other** | | -0.48% | | 2.50% | 0.00% |
| Communication Services | | -0.43% | | 6.12% | 6.67% |
| Information Technology | | -0.30% | | 8.14% | 20.83% |
| Energy | | -0.24% | | 9.40% | 5.48% |
| | | | | | | |
| Relative contribution reflects how the portolio's holdings impacted return relative to the benchmark. Cash and securities not held in the portfolio are not shown. For equity portfolios, relative contribution compares the performance of a security in the portfolio to the benchmark's total return, factoring in the difference in weight of that security in the benchmark. Returns are calculated using daily returns and previous day ending weights rolled up by ticker, excluding fixed income securities, gross of advisory fees, may exclude certain derivatives and will differ from actual performance.
Performance attribution reflects returns gross of advisory fees and may differ from actual returns as they are based on end of day holdings. Attribution is calculated by geometrically linking daily returns for the portfolio and index. |
* | Based on sector classification according to the Global Industry Classification Standard (“GICS”) codes, which are the exclusive property and a service mark of MSCI Inc. and Standard & Poor’s. |
** | Not a GICS classified sector. |
Janus Henderson Global Equity Income Fund (unaudited)
Fund At A Glance
March 31, 2023
| | |
5 Largest Equity Holdings - (% of Net Assets) |
Unilever PLC | |
Personal Products | 3.9% |
Nestle SA (REG) | |
Food Products | 3.1% |
British American Tobacco PLC | |
Tobacco | 3.0% |
Roche Holding AG | |
Pharmaceuticals | 2.9% |
Sanofi | |
Pharmaceuticals | 2.8% |
| | 15.7% |
| | | | | | |
Asset Allocation - (% of Net Assets) | |
Common Stocks | | 95.8% | |
Investment Companies | | 1.9% | |
Other | | 2.3% |
| | | 100.0% |
Emerging markets comprised 5.8% of total net assets.
| | |
Top Country Allocations - Long Positions - (% of Investment Securities) |
As of March 31, 2023 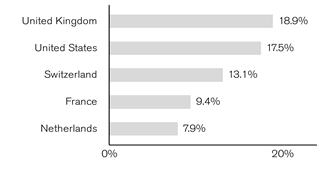
| As of September 30, 2022 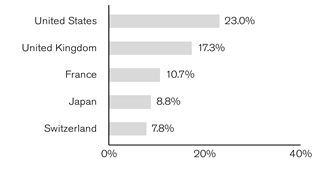
|
Janus Henderson Global Equity Income Fund (unaudited)
Performance
| |
See important disclosures on the next page. |
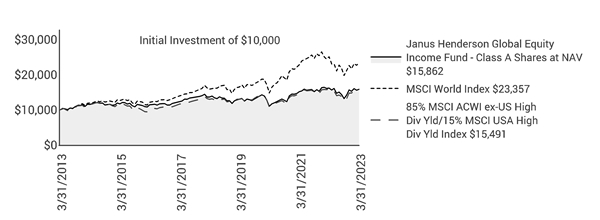
| | | | | | | | | | | |
| | | | | | | | | |
| | | | | | | | | | |
Average Annual Total Return - for the periods ended March 31, 2023 | | | Prospectus Expense Ratios |
| | Fiscal
Year-to-Date | One
Year | Five
Year | Ten
Year | Since
Inception* | | | Total Annual Fund
Operating Expenses‡ |
Class A Shares at NAV | | 20.24% | -2.07% | 3.05% | 4.72% | 4.01% | | | 1.25% |
Class A Shares at MOP | | 13.35% | -7.64% | 1.83% | 4.10% | 3.64% | | | |
Class C Shares at NAV | | 19.86% | -2.70% | 2.37% | 3.99% | 3.26% | | | 1.87% |
Class C Shares at CDSC | | 18.86% | -3.60% | 2.37% | 3.99% | 3.26% | | | |
Class D Shares | | 20.46% | -1.87% | 3.25% | 4.84% | 4.09% | | | 0.95% |
Class I Shares | | 20.58% | -1.78% | 3.41% | 5.03% | 4.27% | | | 0.87% |
Class N Shares | | 20.44% | -1.72% | 3.44% | 5.00% | 4.18% | | | 0.78% |
Class S Shares | | 20.22% | -2.12% | 2.90% | 4.59% | 3.93% | | | 1.30% |
Class T Shares | | 20.24% | -2.06% | 3.22% | 4.81% | 4.06% | | | 1.02% |
MSCI World Index | | 18.25% | -7.02% | 8.01% | 8.85% | 6.12% | | | |
85% MSCI ACWI ex-US High Div Yld/15% MSCI USA High Div Yld Index | | 22.67% | -2.92% | 3.58% | 4.47% | 3.76% | | | |
Morningstar Quartile - Class A Shares | | - | 3rd | 2nd | 2nd | 1st | | | |
Morningstar Ranking - based on total returns for Foreign Large Value Funds | | - | 287/374 | 84/326 | 83/274 | 15/173 | | | |
Returns quoted are past performance and do not guarantee future results; current performance may be lower or higher. Investment returns and principal value will vary; there may be a gain or loss when shares are sold. For the most recent month-end performance call 800.668.0434 (or 800.525.3713 if you hold shares directly with Janus Henderson) or visit janushenderson.com/performance (or janushenderson.com/allfunds if you hold shares directly with Janus Henderson).
Maximum Offering Price (MOP) returns include the maximum sales charge of 5.75%. Net Asset Value (NAV) returns exclude this charge, which would have reduced returns.
CDSC returns include a 1% contingent deferred sales charge (CDSC) on Shares redeemed within 12 months of purchase. Net Asset Value (NAV) returns exclude this charge, which would have reduced returns.
Janus Henderson Global Equity Income Fund (unaudited)
Performance
Performance may be affected by risks that include those associated with foreign and emerging markets, fixed income securities, high-yield and high-risk securities, undervalued, overlooked and smaller capitalization companies, real estate related securities including Real Estate Investment Trusts (REITs), Environmental, Social and Governance (ESG) factors, non-diversification, portfolio turnover, derivatives, short sales, initial public offerings (IPOs) and potential conflicts of interest. Each product has different risks. Please see the prospectus for more information about risks, holdings and other details.
Returns include reinvestment of all dividends and distributions and do not reflect the deduction of taxes that a shareholder would pay on Fund distributions or redemptions of Fund shares. The returns do not include adjustments in accordance with generally accepted accounting principles required at the period end for financial reporting purposes.
Returns of the Fund shown prior to June 5, 2017, are those for Henderson Global Equity Income Fund (the “Predecessor Fund”), which merged into the Fund after the close of business on June 2, 2017. The Predecessor Fund was advised by Henderson Global Investors (North America) Inc. and subadvised by Henderson Investment Management Limited. Class A Shares, Class C Shares, Class I Shares, and Class R6 Shares of the Predecessor Fund were reorganized into Class A Shares, Class C Shares, Class I Shares, and Class N Shares, respectively, of the Fund. In connection with this reorganization, certain shareholders of the Predecessor Fund who held shares directly with the Predecessor Fund and not through an intermediary had the Class A Shares, Class C Shares, Class I Shares, and Class N Shares of the Fund received in the reorganization automatically exchanged for Class D Shares of the Fund following the reorganization. Class A Shares and Class C Shares of the Predecessor Fund commenced operations with the Predecessor Fund’s inception on November 30, 2006. Class I Shares and Class R6 Shares of the Predecessor Fund commenced operations on March 31, 2009 and November 30, 2015, respectively.
Performance of Class A Shares shown for periods prior to June 5, 2017, reflects the performance of Class A Shares of the Predecessor Fund, calculated using the fees and expenses of Class A Shares of the Predecessor Fund, in effect during the periods shown, net of any applicable fee and expense limitations or waivers.
Performance of Class C Shares shown for periods prior to June 5, 2017, reflects the performance of Class C Shares of the Predecessor Fund, calculated using the fees and expenses of Class C Shares of the Predecessor Fund, in effect during the periods shown, net of any applicable fee and expense limitations or waivers.
Performance of Class I Shares shown for periods prior to June 5, 2017, reflects the performance of Class I Shares of the Predecessor Fund, calculated using the fees and expenses of Class I Shares of the Predecessor Fund, in effect during the periods shown, net of any applicable fee and expense limitations or waivers, except that for periods prior to March 31, 2009, performance for Class I Shares reflects the performance of Class A Shares of the Predecessor Fund, calculated using the fees and expenses of Class A Shares of the Predecessor Fund (without sales charges), net of any applicable fee and expense limitations or waivers.
Performance of Class N Shares shown for periods prior to June 5, 2017, reflects the performance of Class R6 Shares of the Predecessor Fund, calculated using the fees and expenses of Class R6 Shares of the Predecessor Fund, in effect during the periods shown, net of any applicable fee and expense limitations or waivers, except that for periods prior to November 30, 2015, performance for Class N Shares reflects the performance of Class A Shares of the Predecessor Fund, calculated using the fees and expenses of Class A Shares of the Predecessor Fund (without sales charges), net of any applicable fee and expense limitations or waivers.
Performance of Class S Shares shown for periods prior to June 5, 2017, reflects the performance of Class A Shares of the Predecessor Fund, calculated using the fees and expenses of Class A Shares of the Predecessor Fund (without sales charges), net of any applicable fee and expense limitations or waivers.
Performance of Class T Shares shown for periods prior to June 5, 2017, reflects the performance of Class A Shares of the Predecessor Fund, calculated using the fees and expenses of Class A Shares of the Predecessor Fund (without sales charges), net of any applicable fee and expense limitations or waivers.
Performance of Class D Shares shown for periods prior to June 5, 2017, reflects the performance of Class A Shares of the Predecessor Fund, calculated using the fees and expenses of Class A Shares of the Predecessor Fund (without sales charges), net of any applicable fee and expense limitations or waivers.
If each share class of the Fund had been available during periods prior to its commencement, the performance shown may have been different. The performance shown for periods following the Fund’s commencement of each share class reflects the fees and expenses of each respective share class, net of any applicable fee and expense limitations or waivers. Please refer to the Fund’s prospectuses for further details concerning historical performance.
© 2023 Morningstar, Inc. All Rights Reserved.
There is no assurance that the investment process will consistently lead to successful investing.
See Notes to Schedule of Investments and Other Information for index definitions.
Index performance does not reflect the expenses of managing a portfolio as an index is unmanaged and not available for direct investment.
See “Useful Information About Your Fund Report.”
*The Predecessor Fund’s inception date – November 30, 2006
‡ As stated in the prospectus. See Financial Highlights for actual expense ratios during the reporting period.
Janus Henderson Global Equity Income Fund (unaudited)
Expense Examples
As a shareholder of the Fund, you incur two types of costs: (1) transaction costs, such as sales charges (loads) on purchase payments (applicable to Class A Shares only); and (2) ongoing costs, including management fees; 12b-1 distribution and shareholder servicing fees; transfer agent fees and expenses payable pursuant to the Transfer Agency Agreement; and other Fund expenses. This example is intended to help you understand your ongoing costs (in dollars) of investing in the Fund and to compare these costs with the ongoing costs of investing in other mutual funds. To do so, compare this 5% hypothetical example with the 5% hypothetical examples that appear in the shareholder reports of the other funds. The example is based upon an investment of $1,000 invested at the beginning of the period and held for the six-months indicated, unless noted otherwise in the table and footnotes below.
Actual Expenses
The information in the table under the heading “Actual” provides information about actual account values and actual expenses. You may use the information in these columns, together with the amount you invested, to estimate the expenses that you paid over the period. Simply divide your account value by $1,000 (for example, an $8,600 account value divided by $1,000 = 8.6), then multiply the result by the number in the appropriate column for your share class under the heading entitled “Expenses Paid During Period” to estimate the expenses you paid on your account during the period.
Hypothetical Example for Comparison Purposes
The information in the table under the heading “Hypothetical (5% return before expenses)” provides information about hypothetical account values and hypothetical expenses based upon the Fund’s actual expense ratio and an assumed rate of return of 5% per year before expenses, which is not the Fund’s actual return. The hypothetical account values and expenses may not be used to estimate the actual ending account balance or expenses you paid for the period. You may use this information to compare the ongoing costs of investing in the Fund and other funds. To do so, compare this 5% hypothetical example with the 5% hypothetical examples that appear in the shareholder reports of the other funds. Additionally, for an analysis of the fees associated with an investment in any share class or other similar funds, please visit www.finra.org/fundanalyzer.
Please note that the expenses shown in the table are meant to highlight your ongoing costs only and do not reflect any transaction costs. These fees are fully described in the Fund’s prospectuses. Therefore, the hypothetical examples are useful in comparing ongoing costs only, and will not help you determine the relative total costs of owning different funds. In addition, if these transaction costs were included, your costs would have been higher.
| | | | | | | | | | | |
| | | | | | | | |
| | | Actual | | Hypothetical
(5% return before expenses) | |
| Beginning
Account
Value
(10/1/22) | Ending
Account
Value
(3/31/23) | Expenses
Paid During
Period
(10/1/22 - 3/31/23)† | | Beginning
Account
Value
(10/1/22) | Ending
Account
Value
(3/31/23) | Expenses
Paid During
Period
(10/1/22 - 3/31/23)† | Net Annualized
Expense Ratio
(10/1/22 - 3/31/23) |
Class A Shares | $1,000.00 | $1,202.40 | $6.48 | | $1,000.00 | $1,019.05 | $5.94 | 1.18% |
Class C Shares | $1,000.00 | $1,198.60 | $9.59 | | $1,000.00 | $1,016.21 | $8.80 | 1.75% |
Class D Shares | $1,000.00 | $1,204.60 | $4.95 | | $1,000.00 | $1,020.44 | $4.53 | 0.90% |
Class I Shares | $1,000.00 | $1,205.80 | $4.51 | | $1,000.00 | $1,020.84 | $4.13 | 0.82% |
Class N Shares | $1,000.00 | $1,204.40 | $4.01 | | $1,000.00 | $1,021.29 | $3.68 | 0.73% |
Class S Shares | $1,000.00 | $1,202.20 | $6.81 | | $1,000.00 | $1,018.75 | $6.24 | 1.24% |
Class T Shares | $1,000.00 | $1,202.40 | $5.33 | | $1,000.00 | $1,020.09 | $4.89 | 0.97% |
† | Expenses Paid During Period are equal to the Net Annualized Expense Ratio multiplied by the average account value over the period, multiplied by 182/365 (to reflect the one-half year period). Expenses in the examples include the effect of applicable fee waivers and/or expense reimbursements, if any. Had such waivers and/or reimbursements not been in effect, your expenses would have been higher. Please refer to the Notes to Financial Statements or the Fund’s prospectuses for more information regarding waivers and/or reimbursements. |
Janus Henderson Global Equity Income Fund
Schedule of Investments (unaudited)
March 31, 2023
| | | | | | | | |
Shares
| | | Value | |
Common Stocks– 95.8% | | | |
Aerospace & Defense – 1.0% | | | |
| | BAE Systems PLC | | 5,220,118 | | | $63,273,074 | |
Automobiles – 3.2% | | | |
| | Daimler AG | | 547,839 | | | 42,079,852 | |
| | Ford Motor Co | | 4,519,625 | | | 56,947,275 | |
| | Stellantis NV | | 5,400,910 | | | 98,265,506 | |
| | | 197,292,633 | |
Banks – 4.6% | | | |
| | Hana Financial Group Inc | | 446,822 | | | 14,052,215 | |
| | HSBC Holdings PLC | | 7,975,224 | | | 54,286,914 | |
| | Intesa Sanpaolo SpA | | 25,378,171 | | | 65,308,149 | |
| | KB Financial Group Inc | | 394,553 | | | 14,493,592 | |
| | Natwest Group PLC | | 24,821,144 | | | 81,086,774 | |
| | Nordea Bank Abp | | 2,694,181 | | | 28,764,124 | |
| | Sumitomo Mitsui Financial Group Inc | | 769,400 | | | 30,854,495 | |
| | | 288,846,263 | |
Beverages – 5.2% | | | |
| | Ambev SA (ADR) | | 41,853,468 | | | 118,026,780 | |
| | Coca-Cola Co | | 1,704,715 | | | 105,743,471 | |
| | Pernod Ricard SA | | 449,356 | | | 101,805,496 | |
| | | 325,575,747 | |
Building Products – 0.9% | | | |
| | Cie de Saint-Gobain | | 973,248 | | | 55,409,334 | |
Capital Markets – 2.9% | | | |
| | CME Group Inc | | 329,120 | | | 63,033,062 | |
| | Macquarie Group Ltd | | 982,009 | | | 115,657,445 | |
| | | 178,690,507 | |
Chemicals – 1.5% | | | |
| | Nutrien Ltd | | 237,022 | | | 17,506,968 | |
| | OCI NV | | 1,830,105 | | | 62,118,727 | |
| | Wacker Chemie AG | | 75,744 | | | 12,273,775 | |
| | | 91,899,470 | |
Communications Equipment – 1.0% | | | |
| | Cisco Systems Inc | | 1,229,317 | | | 64,262,546 | |
Diversified Financial Services – 0.7% | | | |
| | M&G PLC | | 18,818,788 | | | 46,086,521 | |
Diversified Telecommunication Services – 2.7% | | | |
| | Koninklijke KPN NV | | 15,010,784 | | | 53,011,506 | |
| | Telstra Group Ltd | | 25,369,361 | | | 71,649,263 | |
| | TELUS Corp | | 2,373,021 | | | 47,116,224 | |
| | | 171,776,993 | |
Electric Utilities – 4.7% | | | |
| | Enel SpA | | 16,918,534 | | | 103,316,752 | |
| | Iberdrola SA | | 4,982,630 | | | 62,059,177 | |
| | SSE PLC | | 5,849,082 | | | 130,264,180 | |
| | | 295,640,109 | |
Food & Staples Retailing – 1.3% | | | |
| | Koninklijke Ahold Delhaize NV | | 2,459,938 | | | 84,135,416 | |
Food Products – 4.1% | | | |
| | Danone SA | | 1,069,397 | | | 66,476,249 | |
| | Nestle SA (REG) | | 1,567,372 | | | 191,392,070 | |
| | | 257,868,319 | |
Household Durables – 0.5% | | | |
| | Persimmon PLC | | 2,058,193 | | | 32,005,388 | |
Insurance – 7.4% | | | |
| | Allianz SE (REG) | | 269,044 | | | 62,100,874 | |
| | Aviva PLC | | 5,911,399 | | | 29,542,946 | |
| | Direct Line Insurance Group PLC | | 3,601,707 | | | 6,131,181 | |
| | Legal & General Group PLC | | 11,670,478 | | | 34,513,670 | |
| | |
See Notes to Schedule of Investments and Other Information and Notes to Financial Statements. |
| |
6 | MARCH 31, 2023 |
Janus Henderson Global Equity Income Fund
Schedule of Investments (unaudited)
March 31, 2023
| | | | | | | | |
Shares
| | | Value | |
Common Stocks– (continued) | | | |
Insurance– (continued) | | | |
| | Phoenix Group Holdings PLC | | 7,060,684 | | | $47,689,225 | |
| | Swiss Re AG | | 1,200,935 | | | 123,557,136 | |
| | Zurich Insurance Group AG | | 331,350 | | | 158,591,355 | |
| | | 462,126,387 | |
Machinery – 2.7% | | | |
| | Sandvik AB | | 2,392,368 | | | 50,859,772 | |
| | Volvo AB | | 5,621,071 | | | 115,982,943 | |
| | | 166,842,715 | |
Marine – 0.2% | | | |
| | AP Moller - Maersk A/S - Class B | | 5,659 | | | 10,256,491 | |
Metals & Mining – 5.3% | | | |
| | Anglo American PLC | | 4,323,742 | | | 143,081,399 | |
| | BHP Group Ltd | | 4,139,105 | | | 131,254,426 | |
| | Rio Tinto PLC | | 809,205 | | | 54,834,893 | |
| | | 329,170,718 | |
Multi-Utilities – 3.3% | | | |
| | E.ON SE | | 2,559,095 | | | 31,918,552 | |
| | Engie SA | | 4,100,400 | | | 64,840,549 | |
| | National Grid PLC | | 4,652,553 | | | 63,141,628 | |
| | Sempra Energy | | 310,977 | | | 47,007,283 | |
| | | 206,908,012 | |
Office Real Estate Investment Trusts (REITs) – 0.7% | | | |
| | Dexus | | 8,122,695 | | | 41,146,670 | |
Oil, Gas & Consumable Fuels – 8.1% | | | |
| | Keyera Corp | | 1,293,584 | | | 28,326,168 | |
| | Pioneer Natural Resources Co | | 753,873 | | | 153,971,022 | |
| | Repsol SA | | 2,656,759 | | | 40,892,616 | |
| | TotalEnergies SE | | 1,881,070 | | | 110,977,968 | |
| | Williams Cos Inc | | 3,728,075 | | | 111,320,320 | |
| | Woodside Energy Group Ltd | | 2,625,677 | | | 59,149,177 | |
| | | 504,637,271 | |
Paper & Forest Products – 1.2% | | | |
| | UPM-Kymmene Oyj* | | 2,217,780 | | | 74,469,546 | |
Personal Products – 3.9% | | | |
| | Unilever PLC | | 4,690,000 | | | 242,538,147 | |
Pharmaceuticals – 13.6% | | | |
| | GSK PLC | | 7,065,339 | | | 125,992,111 | |
| | Johnson & Johnson | | 293,494 | | | 45,491,570 | |
| | Merck & Co Inc | | 1,618,966 | | | 172,241,793 | |
| | Novartis AG | | 1,584,709 | | | 145,523,779 | |
| | Roche Holding AG | | 634,179 | | | 181,543,633 | |
| | Sanofi | | 1,604,842 | | | 174,754,434 | |
| | | 845,547,320 | |
Professional Services – 1.0% | | | |
| | Hays PLC | | 16,934,448 | | | 23,336,719 | |
| | Randstad NV | | 642,924 | | | 38,164,033 | |
| | | 61,500,752 | |
Real Estate Management & Development – 0.1% | | | |
| | Aroundtown SA | | 3,100,017 | | | 4,413,694 | |
Semiconductor & Semiconductor Equipment – 5.0% | | | |
| | MediaTek Inc | | 2,437,000 | | | 63,619,600 | |
| | SK Square Co Ltd* | | 201,342 | | | 6,194,565 | |
| | Taiwan Semiconductor Manufacturing Co Ltd (ADR) | | 868,023 | | | 80,743,500 | |
| | Tokyo Electron Ltd | | 1,298,700 | | | 158,812,398 | |
| | | 309,370,063 | |
Specialty Retail – 1.0% | | | |
| | Industria de Diseno Textil SA | | 1,925,711 | | | 64,664,854 | |
| | |
See Notes to Schedule of Investments and Other Information and Notes to Financial Statements. |
| |
Janus Investment Fund | 7 |
Janus Henderson Global Equity Income Fund
Schedule of Investments (unaudited)
March 31, 2023
| | | | | | | | |
Shares
| | | Value | |
Common Stocks– (continued) | | | |
Tobacco – 5.5% | | | |
| | British American Tobacco PLC | | 5,383,215 | | | $188,622,153 | |
| | Imperial Brands PLC | | 6,632,303 | | | 152,498,807 | |
| | | 341,120,960 | |
Wireless Telecommunication Services – 2.5% | | | |
| | SK Telecom Co Ltd | | 1,752,223 | | | 65,154,442 | |
| | Tele2 AB | | 8,863,551 | | | 88,334,991 | |
| | | 153,489,433 | |
Total Common Stocks (cost $5,986,075,805) | | 5,970,965,353 | |
Investment Companies– 1.9% | | | |
Money Markets – 1.9% | | | |
| | Janus Henderson Cash Liquidity Fund LLC, 4.7988%ºº,£((cost $117,219,663) | | 117,196,223 | | | 117,219,663 | |
Total Investments (total cost $6,103,295,468) – 97.7% | | 6,088,185,016 | |
Cash, Receivables and Other Assets, net of Liabilities – 2.3% | | 145,717,211 | |
Net Assets – 100% | | $6,233,902,227 | |
| | | | | | |
Summary of Investments by Country - (Long Positions) (unaudited) |
| |
| | | | | % of | |
| | | | | Investment | |
Country | | Value | | Securities | |
United Kingdom | | $1,150,395,472 | | 18.9 | % |
United States | | 1,063,230,116 | | 17.5 | |
Switzerland | | 800,607,973 | | 13.1 | |
France | | 574,264,030 | | 9.4 | |
Netherlands | | 479,967,829 | | 7.9 | |
Australia | | 418,856,981 | | 6.9 | |
Italy | | 266,890,407 | | 4.4 | |
Sweden | | 255,177,706 | | 4.2 | |
Japan | | 189,666,893 | | 3.1 | |
Spain | | 167,616,647 | | 2.8 | |
Germany | | 152,786,747 | | 2.5 | |
Taiwan | | 144,363,100 | | 2.4 | |
Brazil | | 118,026,780 | | 1.9 | |
Finland | | 103,233,670 | | 1.7 | |
South Korea | | 99,894,814 | | 1.6 | |
Canada | | 92,949,360 | | 1.5 | |
Denmark | | 10,256,491 | | 0.2 | |
| | | | | | |
| | | | | | |
Total | | $6,088,185,016 | | 100.0 | % |
| | |
See Notes to Schedule of Investments and Other Information and Notes to Financial Statements. |
| |
8 | MARCH 31, 2023 |
Janus Henderson Global Equity Income Fund
Schedule of Investments (unaudited)
March 31, 2023
Schedules of Affiliated Investments – (% of Net Assets)
| | | | | | | | | | | |
| | Dividend Income | Realized Gain/(Loss) | Change in Unrealized Appreciation/ Depreciation | Value at 3/31/23 |
Investment Companies - 1.9% |
Money Markets - 1.9% | |
| | Janus Henderson Cash Liquidity Fund LLC, 4.7988%ºº | $ | 2,705,722 | $ | (1,339) | $ | - | $ | 117,219,663 |
| |
| | | | | | | | | | | |
| | Value at 9/30/22 | Purchases | Sales Proceeds | Value at 3/31/23 |
Investment Companies - 1.9% |
Money Markets - 1.9% | |
| | Janus Henderson Cash Liquidity Fund LLC, 4.7988%ºº | | - | | 1,726,656,064 | | (1,609,435,062) | | 117,219,663 |
| | | | | | | |
Schedule of Forward Foreign Currency Exchange Contracts | | | | | | |
| | | | | | | | | |
Counterparty/ Foreign Currency | Settlement Date | Foreign Currency Amount (Sold)/ Purchased | | USD Currency Amount (Sold)/ Purchased | | Market Value and Unrealized Appreciation/ (Depreciation) | |
BNP Paribas: | | | | | | | | |
British Pound | 4/19/23 | (249,062,606) | $ | 303,090,450 | $ | (4,197,656) | | |
Euro | 4/19/23 | (457,066,387) | | 491,451,412 | | (4,631,735) | | |
| | | | | | | | | |
| | | | | | | (8,829,391) | | |
Citibank, National Association: | | | | | | | | |
Korean Won | 6/15/23 | (140,000,000,000) | | 107,074,570 | | (1,167,274) | | |
Total | | | | | $ | (9,996,665) | | |
The following table, grouped by derivative type, provides information about the fair value and location of derivatives within the Statement of Assets and Liabilities as of March 31, 2023.
| | | | | | |
Fair Value of Derivative Instruments (not accounted for as hedging instruments) as of March 31, 2023 |
| | | | | |
| | | | | Currency
Contracts |
| | | |
Liability Derivatives: | | | |
Forward foreign currency exchange contracts | | | $9,996,665 |
| | | | |
| | |
See Notes to Schedule of Investments and Other Information and Notes to Financial Statements. |
| |
Janus Investment Fund | 9 |
Janus Henderson Global Equity Income Fund
Schedule of Investments (unaudited)
March 31, 2023
The following tables provide information about the effect of derivatives and hedging activities on the Fund’s Statement of Operations for the period ended March 31, 2023.
| | | | | |
The effect of Derivative Instruments (not accounted for as hedging instruments) on the Statement of Operations for the period ended March 31, 2023 |
| | | | |
Amount of Realized Gain/(Loss) Recognized on Derivatives |
Derivative | | Currency
Contracts |
Forward foreign currency exchange contracts | | $(40,241,595) |
| | | | | |
| | | | | |
| | | | | |
Amount of Change in Unrealized Appreciation/Depreciation Recognized on Derivatives |
Derivative | | Currency
Contracts |
Forward foreign currency exchange contracts | | $(28,611,881) |
| | | | | |
Please see the "Net Realized Gain/(Loss) on Investments" and "Change in Unrealized Net Appreciation/Depreciation" sections of the Fund’s Statement of Operations.
| | |
Average Ending Monthly Value of Derivative Instruments During the Period Ended March 31, 2023 |
| |
| |
Forward foreign currency exchange contracts: | |
Average amounts sold - in USD | $868,036,407 |
| | |
| |
| |
| |
| | |
See Notes to Schedule of Investments and Other Information and Notes to Financial Statements. |
| |
10 | MARCH 31, 2023 |
Janus Henderson Global Equity Income Fund
Schedule of Investments (unaudited)
March 31, 2023
| | | | | | | | | | |
Offsetting of Financial Liabilities and Derivative Liabilities |
| |
| | | Gross Amounts | | | | | | |
| | | of Recognized | | Offsetting Asset | | Collateral | | |
Counterparty | | Liabilities | | or Liability(a) | | Pledged(b) | | Net Amount |
| | | | | | | | | |
BNP Paribas | $ | 8,829,391 | $ | — | $ | — | $ | 8,829,391 |
Citibank, National Association | | 1,167,274 | | — | | (1,167,274) | | — |
| | | | | | | | | |
Total | $ | 9,996,665 | $ | — | $ | (1,167,274) | $ | 8,829,391 |
(a) | Represents the amount of assets or liabilities that could be offset with the same counterparty under master netting or similar agreements that management elects not to offset on the Statement of Assets and Liabilities. |
(b) | Collateral pledged is limited to the net outstanding amount due to/from an individual counterparty. The actual collateral amounts pledged may exceed these amounts and may fluctuate in value. |
| | |
See Notes to Schedule of Investments and Other Information and Notes to Financial Statements. |
| |
Janus Investment Fund | 11 |
Janus Henderson Global Equity Income Fund
Notes to Schedule of Investments and Other Information (unaudited)
| | |
MSCI World IndexSM 85% MSCI ACWI ex-US High Div Yld/15% MSCI USA High Div Yld Index | MSCI World IndexSM reflects the equity market performance of global developed markets. 85% MSCI ACWI ex-US High Div Yld/15% MSCI USA High Div Yld Index is an internally-calculated, hypothetical combination of total returns from the MSCI All Country World ex-USA High Dividend Yield Index (85%) and the MSCI USA High Dividend Yield Index (15%). The underlying indices reflect the performance of higher dividend yield large and mid-cap equity from (i) global developed and emerging markets excluding the U.S. and (ii) the U.S. markets. |
| | |
ADR | American Depositary Receipt |
LLC | Limited Liability Company |
PLC | Public Limited Company |
REG | Registered |
| | |
* | Non-income producing security. |
| | |
ºº | Rate shown is the 7-day yield as of March 31, 2023. |
| | |
£ | The Fund may invest in certain securities that are considered affiliated companies. As defined by the Investment Company Act of 1940, as amended, an affiliated company is one in which the Fund owns 5% or more of the outstanding voting securities, or a company which is under common ownership or control. |
Janus Henderson Global Equity Income Fund
Notes to Schedule of Investments and Other Information (unaudited)
| | | | | | | | | | | | | | |
The following is a summary of the inputs that were used to value the Fund’s investments in securities and other financial instruments as of March 31, 2023. See Notes to Financial Statements for more information. |
| |
Valuation Inputs Summary |
| | | | | | | |
| | | | | Level 2 - | | Level 3 - |
| | | Level 1 - | | Other Significant | | Significant |
| | | Quoted Prices | | Observable Inputs | | Unobservable Inputs |
| | | | | | | |
Assets | | | | | | |
Investments In Securities: | | | | | | |
Common Stocks | | | | | | |
Automobiles | $ | 56,947,275 | $ | 140,345,358 | $ | - |
Beverages | | 223,770,251 | | 101,805,496 | | - |
Capital Markets | | 63,033,062 | | 115,657,445 | | - |
Chemicals | | 17,506,968 | | 74,392,502 | | - |
Communications Equipment | | 64,262,546 | | - | | - |
Diversified Telecommunication Services | | 47,116,224 | | 124,660,769 | | - |
Multi-Utilities | | 47,007,283 | | 159,900,729 | | - |
Oil, Gas & Consumable Fuels | | 293,617,510 | | 211,019,761 | | - |
Pharmaceuticals | | 217,733,363 | | 627,813,957 | | - |
Semiconductor & Semiconductor Equipment | | 80,743,500 | | 228,626,563 | | - |
All Other | | - | | 3,075,004,791 | | - |
Investment Companies | | - | | 117,219,663 | | - |
Total Assets | $ | 1,111,737,982 | $ | 4,976,447,034 | $ | - |
Liabilities | | | | | | |
Other Financial Instruments(a): | | | | | | |
Forward Foreign Currency Exchange Contracts | $ | - | $ | 9,996,665 | $ | - |
| | | | | | | |
(a) | Other financial instruments may include forward foreign currency exchange contracts, futures, written options, written swaptions, and swap contracts. Forward foreign currency exchange contracts, futures contracts, and swap contracts are reported at their unrealized appreciation/(depreciation) at measurement date, which represents the change in the contract's value from trade date. Written options and written swaptions are reported at their market value at measurement date. |
Janus Henderson Global Equity Income Fund
Statement of Assets and Liabilities (unaudited)
March 31, 2023
| |
See footnotes at the end of the Statement. |
| | | | | | | |
| | | | | | |
Assets: | | | | |
| Unaffiliated investments, at value (cost $5,986,075,805) | | $ | 5,970,965,353 | |
| Affiliated investments, at value (cost $117,219,663) | | | 117,219,663 | |
| Deposits with brokers for OTC derivatives | | | 1,258,237 | |
| Cash denominated in foreign currency (cost $10,451,405) | | | 10,451,405 | |
| Trustees' deferred compensation | | | 152,694 | |
| Receivables: | | | | |
| | Investments sold | | | 84,693,514 | |
| | Dividends | | | 60,167,930 | |
| | Foreign tax reclaims | | | 45,685,759 | |
| | Fund shares sold | | | 12,528,663 | |
| | Dividends from affiliates | | | 499,056 | |
| Other assets | | | 226,019 | |
Total Assets | | | 6,303,848,293 | |
Liabilities: | | | | |
| Due to custodian | | | 43,404 | |
| Forward foreign currency exchange contracts | | | 9,996,665 | |
| Payables: | | | — | |
| | Fund shares repurchased | | | 38,201,580 | |
| | Dividends | | | 10,195,826 | |
| | Foreign withholding tax reclaim fee | | | 4,064,011 | |
| | Advisory fees | | | 3,568,010 | |
| | Professional fees | | | 2,255,047 | |
| | Transfer agent fees and expenses | | | 695,432 | |
| | 12b-1 Distribution and shareholder servicing fees | | | 464,654 | |
| | Trustees' deferred compensation fees | | | 152,694 | |
| | Custodian fees | | | 61,564 | |
| | Trustees' fees and expenses | | | 37,095 | |
| | Affiliated fund administration fees payable | | | 13,736 | |
| | Accrued expenses and other payables | | | 196,348 | |
Total Liabilities | | | 69,946,066 | |
Net Assets | | $ | 6,233,902,227 | |
| | |
See Notes to Financial Statements. |
| |
14 | MARCH 31, 2023 |
Janus Henderson Global Equity Income Fund
Statement of Assets and Liabilities (unaudited)
March 31, 2023
| | | | | | | |
| | | | | | |
| | | | | | | |
Net Assets Consist of: | | | | |
| Capital (par value and paid-in surplus) | | $ | 7,716,772,822 | |
| Total distributable earnings (loss) | | | (1,482,870,595) | |
Total Net Assets | | $ | 6,233,902,227 | |
Net Assets - Class A Shares | | $ | 675,167,690 | |
| Shares Outstanding, $0.01 Par Value (unlimited shares authorized) | | | 110,173,677 | |
Net Asset Value Per Share(1) | | $ | 6.13 | |
Maximum Offering Price Per Share(2) | | $ | 6.50 | |
Net Assets - Class C Shares | | $ | 348,017,279 | |
| Shares Outstanding, $0.01 Par Value (unlimited shares authorized) | | | 57,718,417 | |
Net Asset Value Per Share(1) | | $ | 6.03 | |
Net Assets - Class D Shares | | $ | 25,304,996 | |
| Shares Outstanding, $0.01 Par Value (unlimited shares authorized) | | | 4,142,104 | |
Net Asset Value Per Share | | $ | 6.11 | |
Net Assets - Class I Shares | | $ | 4,685,845,249 | |
| Shares Outstanding, $0.01 Par Value (unlimited shares authorized) | | | 762,493,597 | |
Net Asset Value Per Share | | $ | 6.15 | |
Net Assets - Class N Shares | | $ | 339,171,572 | |
| Shares Outstanding, $0.01 Par Value (unlimited shares authorized) | | | 55,201,621 | |
Net Asset Value Per Share | | $ | 6.14 | |
Net Assets - Class S Shares | | $ | 18,050,828 | |
| Shares Outstanding, $0.01 Par Value (unlimited shares authorized) | | | 2,975,093 | |
Net Asset Value Per Share | | $ | 6.07 | |
Net Assets - Class T Shares | | $ | 142,344,613 | |
| Shares Outstanding, $0.01 Par Value (unlimited shares authorized) | | | 23,321,456 | |
Net Asset Value Per Share | | $ | 6.10 | |
| |
(1) Redemption price per share may be reduced for any applicable contingent deferred sales charge. (2) Maximum offering price is computed at 100/94.25 of net asset value. |
| | |
See Notes to Financial Statements. |
| |
Janus Investment Fund | 15 |
Janus Henderson Global Equity Income Fund
Statement of Operations (unaudited)
For the period ended March 31, 2023
| | | | | | |
| | | | | |
Investment Income: | | | |
| Dividends | $ | 217,823,948 | |
| Dividends from affiliates | | 2,705,722 | |
| Other income | | 104,903 | |
| Foreign tax withheld | | (10,529,547) | |
Total Investment Income | | 210,105,026 | |
Expenses: | | | |
| Advisory fees | | 18,783,462 | |
| 12b-1 Distribution and shareholder servicing fees: | | | |
| | Class A Shares | | 800,556 | |
| | Class C Shares | | 1,653,894 | |
| | Class S Shares | | 21,074 | |
| Transfer agent administrative fees and expenses: | | | |
| | Class D Shares | | 14,769 | |
| | Class S Shares | | 21,175 | |
| | Class T Shares | | 171,288 | |
| Transfer agent networking and omnibus fees: | | | |
| | Class A Shares | | 719,825 | |
| | Class C Shares | | 131,206 | |
| | Class I Shares | | 1,987,850 | |
| Other transfer agent fees and expenses: | | | |
| | Class A Shares | | 23,253 | |
| | Class C Shares | | 8,249 | |
| | Class D Shares | | 2,800 | |
| | Class I Shares | | 123,568 | |
| | Class N Shares | | 7,648 | |
| | Class S Shares | | 102 | |
| | Class T Shares | | 890 | |
| Professional fees | | 1,154,357 | |
| Custodian fees | | 178,370 | |
| Shareholder reports expense | | 161,714 | |
| Registration fees | | 147,956 | |
| Trustees’ fees and expenses | | 85,470 | |
| Affiliated fund administration fees | | 72,032 | |
| Other expenses | | 244,901 | |
Total Expenses | | 26,516,409 | |
Less: Excess Expense Reimbursement and Waivers | | (82,463) | |
Net Expenses | | 26,433,946 | |
Net Investment Income/(Loss) | | 183,671,080 | |
| | | | | |
| | |
See Notes to Financial Statements. |
| |
16 | MARCH 31, 2023 |
Janus Henderson Global Equity Income Fund
Statement of Operations (unaudited)
For the period ended March 31, 2023
| | | | | | |
| | | | | |
Net Realized Gain/(Loss) on Investments: | | | |
| Investments and foreign currency transactions | $ | (53,644,939) | |
| Investments in affiliates | | (1,339) | |
| Forward foreign currency exchange contracts | | (40,241,595) | |
Total Net Realized Gain/(Loss) on Investments | | (93,887,873) | |
Change in Unrealized Net Appreciation/Depreciation: | | | |
| Investments, foreign currency translations and Trustees’ deferred compensation | | 973,177,567 | |
| Forward foreign currency exchange contracts | | (28,611,881) | |
Total Change in Unrealized Net Appreciation/Depreciation | | 944,565,686 | |
Net Increase/(Decrease) in Net Assets Resulting from Operations | $ | 1,034,348,893 | |
| | | | | |
| | |
See Notes to Financial Statements. |
| |
Janus Investment Fund | 17 |
Janus Henderson Global Equity Income Fund
Statements of Changes in Net Assets
| | | | | | | | | |
| | | | | | | | |
| | | Period ended
March 31, 2023 (unaudited) | | Year ended
September 30, 2022 | |
| | | | | | | | | |
Operations: | | | | | | |
| Net investment income/(loss) | $ | 183,671,080 | | $ | 391,249,899 | |
| Net realized gain/(loss) on investments | | (93,887,873) | | | (146,325,582) | |
| Change in unrealized net appreciation/depreciation | | 944,565,686 | | | (1,027,941,957) | |
Net Increase/(Decrease) in Net Assets Resulting from Operations | | 1,034,348,893 | | | (783,017,640) | |
Dividends and Distributions to Shareholders: | | | | | | |
| | Class A Shares | | (20,524,292) | | | (49,466,615) | |
| | Class C Shares | | (10,171,335) | | | (28,085,172) | |
| | Class D Shares | | (815,071) | | | (1,719,590) | |
| | Class I Shares | | (146,384,046) | | | (309,759,436) | |
| | Class N Shares | | (10,800,188) | | | (20,170,604) | |
| | Class S Shares | | (549,122) | | | (1,241,114) | |
| | Class T Shares | | (4,492,251) | | | (9,040,877) | |
Net Decrease from Dividends and Distributions to Shareholders | | (193,736,305) | | | (419,483,408) | |
Capital Share Transactions: | | | | | | |
| | Class A Shares | | 19,896,459 | | | 35,171,613 | |
| | Class C Shares | | (20,462,704) | | | (43,202,804) | |
| | Class D Shares | | (88,555) | | | 14,558,070 | |
| | Class I Shares | | 512,998,073 | | | 714,146,923 | |
| | Class N Shares | | 40,343,700 | | | 184,097,489 | |
| | Class S Shares | | 967,114 | | | 1,593,179 | |
| | Class T Shares | | (1,007,213) | | | 81,086,096 | |
Net Increase/(Decrease) from Capital Share Transactions | | 552,646,874 | | | 987,450,566 | |
Net Increase/(Decrease) in Net Assets | | 1,393,259,462 | | | (215,050,482) | |
Net Assets: | | | | | | |
| Beginning of period | | 4,840,642,765 | | | 5,055,693,247 | |
| End of period | $ | 6,233,902,227 | | $ | 4,840,642,765 | |
| | | | | | | | |
| | |
See Notes to Financial Statements. |
| |
18 | MARCH 31, 2023 |
Janus Henderson Global Equity Income Fund
Financial Highlights
| | | | | | | | | | | | | | | | | | | | | | |
Class A Shares | | | | | | | | | | | | | | | | | | |
For a share outstanding during the period ended March 31, 2023 (unaudited) and the year ended September 30 | 2023 | | | 2022 | | | 2021 | | | 2020 | | | 2019 | | | 2018 | |
| Net Asset Value, Beginning of Period | | $5.22 | | | $6.54 | | | $5.90 | | | $6.58 | | | $7.16 | | | $7.80 | |
| Income/(Loss) from Investment Operations: | | | | | | | | | | | | | | | | | | |
| | Net investment income/(loss)(1) | | 0.18 | | | 0.45(2) | | | 0.49 | | | 0.51 | | | 0.46 | | | 0.49 | |
| | Net realized and unrealized gain/(loss) | | 0.92 | | | (1.29) | | | 0.64 | | | (0.72) | | | (0.56) | | | (0.65) | |
| Total from Investment Operations | | 1.10 | | | (0.84) | | | 1.13 | | | (0.21) | | | (0.10) | | | (0.16) | |
| Less Dividends and Distributions: | | | | | | | | | | | | | | | | | | |
| | Dividends (from net investment income) | | (0.19) | | | (0.48) | | | (0.49) | | | (0.47) | | | (0.48) | | | (0.48) | |
| Total Dividends and Distributions | | (0.19) | | | (0.48) | | | (0.49) | | | (0.47) | | | (0.48) | | | (0.48) | |
| Net Asset Value, End of Period | | $6.13 | | | $5.22 | | | $6.54 | | | $5.90 | | | $6.58 | | | $7.16 | |
| Total Return* | | 21.16% | | | (13.71)% | | | 19.08% | | | (2.98)% | | | (1.22)% | | | (2.13)% | |
| Net Assets, End of Period (in thousands) | | $675,168 | | | $558,995 | | | $662,514 | | | $610,106 | | | $684,235 | | | $818,548 | |
| Average Net Assets for the Period (in thousands) | | $641,036 | | | $671,651 | | | $666,761 | | | $639,082 | | | $695,276 | | | $878,570 | |
| Ratios to Average Net Assets**: | | | | | | | | | | | | | | | | | | |
| | Ratio of Gross Expenses | | 1.21% | | | 1.25%(3) | | | 1.14% | | | 1.14% | | | 1.12% | | | 1.09% | |
| | Ratio of Net Expenses (After Waivers and Expense Offsets) | | 1.18% | | | 1.24% | | | 1.14% | | | 1.14% | | | 1.12% | | | 1.09% | |
| | Ratio of Net Investment Income/(Loss) | | 6.18% | | | 6.86%(2) | | | 7.28% | | | 8.15% | | | 6.91% | | | 6.43% | |
| Portfolio Turnover Rate | | 76% | | | 86% | | | 123% | | | 227% | | | 142% | | | 137% | |
| | | | | | | | | | | | | | | | | | | | | | |
| |
* Total return includes adjustments in accordance with generally accepted accounting principles required at the year or period end and are not annualized for periods of less than one full year. ** Annualized for periods of less than one full year. (1) Per share amounts are calculated based on average shares outstanding during the year or period. (2) Net investment income/(loss) per share and Ratio of Net Investment Income/(Loss) to Average Net Assets include foreign withholding tax reclaims received in November 2021 and March 2022. The impact of the foreign withholding tax reclaims received, net of the related professional fees, to Net investment income/(loss) per share and Ratio of Net Investment Income/(Loss) to Average Net Assets is $0.05 and 0.69%, respectively. (3) Ratio of Gross Expenses includes additional professional fees related to foreign withholding tax reclaims received in November 2021 and March 2022. The impact of the additional professional fees to Ratio of Gross Expenses is 0.09%. |
| | |
See Notes to Financial Statements. |
| |
Janus Investment Fund | 19 |
Janus Henderson Global Equity Income Fund
Financial Highlights
| | | | | | | | | | | | | | | | | | | | | | |
Class C Shares | | | | | | | | | | | | | | | | | | |
For a share outstanding during the period ended March 31, 2023 (unaudited) and the year ended September 30 | 2023 | | | 2022 | | | 2021 | | | 2020 | | | 2019 | | | 2018 | |
| Net Asset Value, Beginning of Period | | $5.14 | | | $6.46 | | | $5.83 | | | $6.53 | | | $7.11 | | | $7.75 | |
| Income/(Loss) from Investment Operations: | | | | | | | | | | | | | | | | | | |
| | Net investment income/(loss)(1) | | 0.17 | | | 0.40(2) | | | 0.44 | | | 0.47 | | | 0.42 | | | 0.44 | |
| | Net realized and unrealized gain/(loss) | | 0.90 | | | (1.27) | | | 0.64 | | | (0.73) | | | (0.56) | | | (0.65) | |
| Total from Investment Operations | | 1.07 | | | (0.87) | | | 1.08 | | | (0.26) | | | (0.14) | | | (0.21) | |
| Less Dividends and Distributions: | | | | | | | | | | | | | | | | | | |
| | Dividends (from net investment income) | | (0.18) | | | (0.45) | | | (0.45) | | | (0.44) | | | (0.44) | | | (0.43) | |
| Total Dividends and Distributions | | (0.18) | | | (0.45) | | | (0.45) | | | (0.44) | | | (0.44) | | | (0.43) | |
| Net Asset Value, End of Period | | $6.03 | | | $5.14 | | | $6.46 | | | $5.83 | | | $6.53 | | | $7.11 | |
| Total Return* | | 20.79% | | | (14.29)% | | | 18.54% | | | (3.92)% | | | (1.88)% | | | (2.76)% | |
| Net Assets, End of Period (in thousands) | | $348,017 | | | $314,778 | | | $437,512 | | | $469,891 | | | $677,303 | | | $1,037,471 | |
| Average Net Assets for the Period (in thousands) | | $348,653 | | | $410,449 | | | $478,215 | | | $579,718 | | | $804,713 | | | $1,127,161 | |
| Ratios to Average Net Assets**: | | | | | | | | | | | | | | | | | | |
| | Ratio of Gross Expenses | | 1.75% | | | 1.80%(3) | | | 1.72% | | | 1.75% | | | 1.76% | | | 1.75% | |
| | Ratio of Net Expenses (After Waivers and Expense Offsets) | | 1.75% | | | 1.80% | | | 1.72% | | | 1.75% | | | 1.76% | | | 1.75% | |
| | Ratio of Net Investment Income/(Loss) | | 5.65% | | | 6.22%(2) | | | 6.66% | | | 7.49% | | | 6.24% | | | 5.82% | |
| Portfolio Turnover Rate | | 76% | | | 86% | | | 123% | | | 227% | | | 142% | | | 137% | |
| | | | | | | | | | | | | | | | | | | | | | |
| |
* Total return includes adjustments in accordance with generally accepted accounting principles required at the year or period end and are not annualized for periods of less than one full year. ** Annualized for periods of less than one full year. (1) Per share amounts are calculated based on average shares outstanding during the year or period. (2) Net investment income/(loss) per share and Ratio of Net Investment Income/(Loss) to Average Net Assets include foreign withholding tax reclaims received in November 2021 and March 2022. The impact of the foreign withholding tax reclaims received, net of the related professional fees, to Net investment income/(loss) per share and Ratio of Net Investment Income/(Loss) to Average Net Assets is $0.05 and 0.69%, respectively. (3) Ratio of Gross Expenses includes additional professional fees related to foreign withholding tax reclaims received in November 2021 and March 2022. The impact of the additional professional fees to Ratio of Gross Expenses is 0.09%. |
| | |
See Notes to Financial Statements. |
| |
20 | MARCH 31, 2023 |
Janus Henderson Global Equity Income Fund
Financial Highlights
| | | | | | | | | | | | | | | | | | | | | | |
Class D Shares | | | | | | | | | | | | | | | | | | |
For a share outstanding during the period ended March 31, 2023 (unaudited) and the year ended September 30 | 2023 | | | 2022 | | | 2021 | | | 2020 | | | 2019 | | | 2018 | |
| Net Asset Value, Beginning of Period | | $5.21 | | | $6.52 | | | $5.88 | | | $6.57 | | | $7.15 | | | $7.79 | |
| Income/(Loss) from Investment Operations: | | | | | | | | | | | | | | | | | | |
| | Net investment income/(loss)(1) | | 0.18 | | | 0.50(2) | | | 0.51 | | | 0.54 | | | 0.48 | | | 0.53 | |
| | Net realized and unrealized gain/(loss) | | 0.92 | | | (1.31) | | | 0.63 | | | (0.74) | | | (0.57) | | | (0.67) | |
| Total from Investment Operations | | 1.10 | | | (0.81) | | | 1.14 | | | (0.20) | | | (0.09) | | | (0.14) | |
| Less Dividends and Distributions: | | | | | | | | | | | | | | | | | | |
| | Dividends (from net investment income) | | (0.20) | | | (0.50) | | | (0.50) | | | (0.49) | | | (0.49) | | | (0.50) | |
| Total Dividends and Distributions | | (0.20) | | | (0.50) | | | (0.50) | | | (0.49) | | | (0.49) | | | (0.50) | |
| Net Asset Value, End of Period | | $6.11 | | | $5.21 | | | $6.52 | | | $5.88 | | | $6.57 | | | $7.15 | |
| Total Return* | | 21.16% | | | (13.38)% | | | 19.43% | | | (2.92)% | | | (1.06)% | | | (1.91)% | |
| Net Assets, End of Period (in thousands) | | $25,305 | | | $21,653 | | | $13,132 | | | $8,277 | | | $8,028 | | | $8,359 | |
| Average Net Assets for the Period (in thousands) | | $25,067 | | | $20,449 | | | $11,156 | | | $8,001 | | | $7,928 | | | $7,765 | |
| Ratios to Average Net Assets**: | | | | | | | | | | | | | | | | | | |
| | Ratio of Gross Expenses | | 0.90% | | | 0.95%(3) | | | 0.89% | | | 0.92% | | | 0.99% | | | 0.88% | |
| | Ratio of Net Expenses (After Waivers and Expense Offsets) | | 0.90% | | | 0.95% | | | 0.89% | | | 0.92% | | | 0.99% | | | 0.88% | |
| | Ratio of Net Investment Income/(Loss) | | 6.15% | | | 7.72%(2) | | | 7.60% | | | 8.59% | | | 7.17% | | | 7.02% | |
| Portfolio Turnover Rate | | 76% | | | 86% | | | 123% | | | 227% | | | 142% | | | 137% | |
| | | | | | | | | | | | | | | | | | | | | | |
| |
* Total return includes adjustments in accordance with generally accepted accounting principles required at the year or period end and are not annualized for periods of less than one full year. ** Annualized for periods of less than one full year. (1) Per share amounts are calculated based on average shares outstanding during the year or period. (2) Net investment income/(loss) per share and Ratio of Net Investment Income/(Loss) to Average Net Assets include foreign withholding tax reclaims received in November 2021 and March 2022. The impact of the foreign withholding tax reclaims received, net of the related professional fees, to Net investment income/(loss) per share and Ratio of Net Investment Income/(Loss) to Average Net Assets is $0.04 and 0.69%, respectively. (3) Ratio of Gross Expenses includes additional professional fees related to foreign withholding tax reclaims received in November 2021 and March 2022. The impact of the additional professional fees to Ratio of Gross Expenses is 0.09%. |
| | |
See Notes to Financial Statements. |
| |
Janus Investment Fund | 21 |
Janus Henderson Global Equity Income Fund
Financial Highlights
| | | | | | | | | | | | | | | | | | | | | | |
Class I Shares | | | | | | | | | | | | | | | | | | |
For a share outstanding during the period ended March 31, 2023 (unaudited) and the year ended September 30 | 2023 | | | 2022 | | | 2021 | | | 2020 | | | 2019 | | | 2018 | |
| Net Asset Value, Beginning of Period | | $5.24 | | | $6.55 | | | $5.91 | | | $6.60 | | | $7.18 | | | $7.81 | |
| Income/(Loss) from Investment Operations: | | | | | | | | | | | | | | | | | | |
| | Net investment income/(loss)(1) | | 0.19 | | | 0.48(2) | | | 0.52 | | | 0.54 | | | 0.49 | | | 0.53 | |
| | Net realized and unrealized gain/(loss) | | 0.92 | | | (1.29) | | | 0.63 | | | (0.73) | | | (0.57) | | | (0.66) | |
| Total from Investment Operations | | 1.11 | | | (0.81) | | | 1.15 | | | (0.19) | | | (0.08) | | | (0.13) | |
| Less Dividends and Distributions: | | | | | | | | | | | | | | | | | | |
| | Dividends (from net investment income) | | (0.20) | | | (0.50) | | | (0.51) | | | (0.50) | | | (0.50) | | | (0.50) | |
| Total Dividends and Distributions | | (0.20) | | | (0.50) | | | (0.51) | | | (0.50) | | | (0.50) | | | (0.50) | |
| Net Asset Value, End of Period | | $6.15 | | | $5.24 | | | $6.55 | | | $5.91 | | | $6.60 | | | $7.18 | |
| Total Return* | | 21.27% | | | (13.27)% | | | 19.43% | | | (2.78)% | | | (0.89)% | | | (1.68)% | |
| Net Assets, End of Period (in thousands) | | $4,685,845 | | | $3,552,771 | | | $3,719,987 | | | $2,830,699 | | | $3,008,858 | | | $3,509,735 | |
| Average Net Assets for the Period (in thousands) | | $4,284,659 | | | $3,964,612 | | | $3,469,535 | | | $2,946,792 | | | $2,998,950 | | | $3,534,302 | |
| Ratios to Average Net Assets**: | | | | | | | | | | | | | | | | | | |
| | Ratio of Gross Expenses | | 0.82% | | | 0.87%(3) | | | 0.78% | | | 0.78% | | | 0.79% | | | 0.76% | |
| | Ratio of Net Expenses (After Waivers and Expense Offsets) | | 0.82% | | | 0.87% | | | 0.78% | | | 0.78% | | | 0.79% | | | 0.76% | |
| | Ratio of Net Investment Income/(Loss) | | 6.49% | | | 7.33%(2) | | | 7.70% | | | 8.62% | | | 7.30% | | | 6.88% | |
| Portfolio Turnover Rate | | 76% | | | 86% | | | 123% | | | 227% | | | 142% | | | 137% | |
| | | | | | | | | | | | | | | | | | | | | | |
| |
* Total return includes adjustments in accordance with generally accepted accounting principles required at the year or period end and are not annualized for periods of less than one full year. ** Annualized for periods of less than one full year. (1) Per share amounts are calculated based on average shares outstanding during the year or period. (2) Net investment income/(loss) per share and Ratio of Net Investment Income/(Loss) to Average Net Assets include foreign withholding tax reclaims received in November 2021 and March 2022. The impact of the foreign withholding tax reclaims received, net of the related professional fees, to Net investment income/(loss) per share and Ratio of Net Investment Income/(Loss) to Average Net Assets is $0.05 and 0.69%, respectively. (3) Ratio of Gross Expenses includes additional professional fees related to foreign withholding tax reclaims received in November 2021 and March 2022. The impact of the additional professional fees to Ratio of Gross Expenses is 0.09%. |
| | |
See Notes to Financial Statements. |
| |
22 | MARCH 31, 2023 |
Janus Henderson Global Equity Income Fund
Financial Highlights
| | | | | | | | | | | | | | | | | | | | | | |
Class N Shares | | | | | | | | | | | | | | | | | | |
For a share outstanding during the period ended March 31, 2023 (unaudited) and the year ended September 30 | 2023 | | | 2022 | | | 2021 | | | 2020 | | | 2019 | | | 2018 | |
| Net Asset Value, Beginning of Period | | $5.24 | | | $6.55 | | | $5.91 | | | $6.60 | | | $7.18 | | | $7.81 | |
| Income/(Loss) from Investment Operations: | | | | | | | | | | | | | | | | | | |
| | Net investment income/(loss)(1) | | 0.19 | | | 0.50(2) | | | 0.53 | | | 0.51 | | | 0.50 | | | 0.52 | |
| | Net realized and unrealized gain/(loss) | | 0.91 | | | (1.31) | | | 0.62 | | | (0.70) | | | (0.57) | | | (0.64) | |
| Total from Investment Operations | | 1.10 | | | (0.81) | | | 1.15 | | | (0.19) | | | (0.07) | | | (0.12) | |
| Less Dividends and Distributions: | | | | | | | | | | | | | | | | | | |
| | Dividends (from net investment income) | | (0.20) | | | (0.50) | | | (0.51) | | | (0.50) | | | (0.51) | | | (0.51) | |
| Total Dividends and Distributions | | (0.20) | | | (0.50) | | | (0.51) | | | (0.50) | | | (0.51) | | | (0.51) | |
| Net Asset Value, End of Period | | $6.14 | | | $5.24 | | | $6.55 | | | $5.91 | | | $6.60 | | | $7.18 | |
| Total Return* | | 21.13% | | | (13.20)% | | | 19.51% | | | (2.71)% | | | (0.82)% | | | (1.64)% | |
| Net Assets, End of Period (in thousands) | | $339,172 | | | $255,001 | | | $134,486 | | | $68,993 | | | $12,886 | | | $6,841 | |
| Average Net Assets for the Period (in thousands) | | $310,353 | | | $239,690 | | | $106,437 | | | $27,720 | | | $10,817 | | | $5,880 | |
| Ratios to Average Net Assets**: | | | | | | | | | | | | | | | | | | |
| | Ratio of Gross Expenses | | 0.73% | | | 0.78%(3) | | | 0.70% | | | 0.72% | | | 0.75% | | | 0.72% | |
| | Ratio of Net Expenses (After Waivers and Expense Offsets) | | 0.73% | | | 0.78% | | | 0.70% | | | 0.72% | | | 0.75% | | | 0.72% | |
| | Ratio of Net Investment Income/(Loss) | | 6.47% | | | 7.69%(2) | | | 7.85% | | | 8.37% | | | 7.53% | | | 6.83% | |
| Portfolio Turnover Rate | | 76% | | | 86% | | | 123% | | | 227% | | | 142% | | | 137% | |
| | | | | | | | | | | | | | | | | | | | | | |
| |
* Total return includes adjustments in accordance with generally accepted accounting principles required at the year or period end and are not annualized for periods of less than one full year. ** Annualized for periods of less than one full year. (1) Per share amounts are calculated based on average shares outstanding during the year or period. (2) Net investment income/(loss) per share and Ratio of Net Investment Income/(Loss) to Average Net Assets include foreign withholding tax reclaims received in November 2021 and March 2022. The impact of the foreign withholding tax reclaims received, net of the related professional fees, to Net investment income/(loss) per share and Ratio of Net Investment Income/(Loss) to Average Net Assets is $0.05 and 0.69%, respectively. (3) Ratio of Gross Expenses includes additional professional fees related to foreign withholding tax reclaims received in November 2021 and March 2022. The impact of the additional professional fees to Ratio of Gross Expenses is 0.09%. |
| | |
See Notes to Financial Statements. |
| |
Janus Investment Fund | 23 |
Janus Henderson Global Equity Income Fund
Financial Highlights
| | | | | | | | | | | | | | | | | | | | | | |
Class S Shares | | | | | | | | | | | | | | | | | | |
For a share outstanding during the period ended March 31, 2023 (unaudited) and the year ended September 30 | 2023 | | | 2022 | | | 2021 | | | 2020 | | | 2019 | | | 2018 | |
| Net Asset Value, Beginning of Period | | $5.17 | | | $6.49 | | | $5.86 | | | $6.56 | | | $7.15 | | | $7.79 | |
| Income/(Loss) from Investment Operations: | | | | | | | | | | | | | | | | | | |
| | Net investment income/(loss)(1) | | 0.18 | | | 0.44(2) | | | 0.49 | | | 0.59 | | | 0.49 | | | 0.54 | |
| | Net realized and unrealized gain/(loss) | | 0.91 | | | (1.28) | | | 0.62 | | | (0.82) | | | (0.60) | | | (0.70) | |
| Total from Investment Operations | | 1.09 | | | (0.84) | | | 1.11 | | | (0.23) | | | (0.11) | | | (0.16) | |
| Less Dividends and Distributions: | | | | | | | | | | | | | | | | | | |
| | Dividends (from net investment income) | | (0.19) | | | (0.48) | | | (0.48) | | | (0.47) | | | (0.48) | | | (0.48) | |
| Total Dividends and Distributions | | (0.19) | | | (0.48) | | | (0.48) | | | (0.47) | | | (0.48) | | | (0.48) | |
| Net Asset Value, End of Period | | $6.07 | | | $5.17 | | | $6.49 | | | $5.86 | | | $6.56 | | | $7.15 | |
| Total Return* | | 21.15% | | | (13.85)% | | | 19.01% | | | (3.30)% | | | (1.31)% | | | (2.16)% | |
| Net Assets, End of Period (in thousands) | | $18,051 | | | $14,587 | | | $16,510 | | | $10,825 | | | $2,470 | | | $232 | |
| Average Net Assets for the Period (in thousands) | | $16,950 | | | $16,811 | | | $14,755 | | | $6,983 | | | $1,805 | | | $127 | |
| Ratios to Average Net Assets**: | | | | | | | | | | | | | | | | | | |
| | Ratio of Gross Expenses | | 1.24% | | | 1.30%(3) | | | 1.21% | | | 1.25% | | | 1.38% | | | 2.37% | |
| | Ratio of Net Expenses (After Waivers and Expense Offsets) | | 1.24% | | | 1.30% | | | 1.21% | | | 1.25% | | | 1.34% | | | 1.27% | |
| | Ratio of Net Investment Income/(Loss) | | 6.10% | | | 6.81%(2) | | | 7.31% | | | 9.83% | | | 7.35% | | | 7.23% | |
| Portfolio Turnover Rate | | 76% | | | 86% | | | 123% | | | 227% | | | 142% | | | 137% | |
| | | | | | | | | | | | | | | | | | | | | | |
| |
* Total return includes adjustments in accordance with generally accepted accounting principles required at the year or period end and are not annualized for periods of less than one full year. ** Annualized for periods of less than one full year. (1) Per share amounts are calculated based on average shares outstanding during the year or period. (2) Net investment income/(loss) per share and Ratio of Net Investment Income/(Loss) to Average Net Assets include foreign withholding tax reclaims received in November 2021 and March 2022. The impact of the foreign withholding tax reclaims received, net of the related professional fees, to Net investment income/(loss) per share and Ratio of Net Investment Income/(Loss) to Average Net Assets is $0.05 and 0.69%, respectively. (3) Ratio of Gross Expenses includes additional professional fees related to foreign withholding tax reclaims received in November 2021 and March 2022. The impact of the additional professional fees to Ratio of Gross Expenses is 0.09%. |
| | |
See Notes to Financial Statements. |
| |
24 | MARCH 31, 2023 |
Janus Henderson Global Equity Income Fund
Financial Highlights
| | | | | | | | | | | | | | | | | | | | | | |
Class T Shares | | | | | | | | | | | | | | | | | | |
For a share outstanding during the period ended March 31, 2023 (unaudited) and the year ended September 30 | 2023 | | | 2022 | | | 2021 | | | 2020 | | | 2019 | | | 2018 | |
| Net Asset Value, Beginning of Period | | $5.21 | | | $6.52 | | | $5.88 | | | $6.57 | | | $7.15 | | | $7.78 | |
| Income/(Loss) from Investment Operations: | | | | | | | | | | | | | | | | | | |
| | Net investment income/(loss)(1) | | 0.18 | | | 0.50(2) | | | 0.52 | | | 0.52 | | | 0.49 | | | 0.54 | |
| | Net realized and unrealized gain/(loss) | | 0.91 | | | (1.32) | | | 0.62 | | | (0.72) | | | (0.58) | | | (0.68) | |
| Total from Investment Operations | | 1.09 | | | (0.82) | | | 1.14 | | | (0.20) | | | (0.09) | | | (0.14) | |
| Less Dividends and Distributions: | | | | | | | | | | | | | | | | | | |
| | Dividends (from net investment income) | | (0.20) | | | (0.49) | | | (0.50) | | | (0.49) | | | (0.49) | | | (0.49) | |
| Total Dividends and Distributions | | (0.20) | | | (0.49) | | | (0.50) | | | (0.49) | | | (0.49) | | | (0.49) | |
| Net Asset Value, End of Period | | $6.10 | | | $5.21 | | | $6.52 | | | $5.88 | | | $6.57 | | | $7.15 | |
| Total Return* | | 20.93% | | | (13.41)% | | | 19.35% | | | (2.94)% | | | (1.04)% | | | (1.84)% | |
| Net Assets, End of Period (in thousands) | | $142,345 | | | $122,858 | | | $71,551 | | | $70,408 | | | $70,735 | | | $53,548 | |
| Average Net Assets for the Period (in thousands) | | $137,213 | | | $103,061 | | | $85,441 | | | $71,828 | | | $65,061 | | | $55,040 | |
| Ratios to Average Net Assets**: | | | | | | | | | | | | | | | | | | |
| | Ratio of Gross Expenses | | 0.98% | | | 1.02%(3) | | | 0.94% | | | 0.95% | | | 0.97% | | | 0.94% | |
| | Ratio of Net Expenses (After Waivers and Expense Offsets) | | 0.97% | | | 1.01% | | | 0.94% | | | 0.94% | | | 0.95% | | | 0.93% | |
| | Ratio of Net Investment Income/(Loss) | | 6.04% | | | 7.76%(2) | | | 7.70% | | | 8.29% | | | 7.41% | | | 7.12% | |
| Portfolio Turnover Rate | | 76% | | | 86% | | | 123% | | | 227% | | | 142% | | | 137% | |
| | | | | | | | | | | | | | | | | | | | | | |
| |
* Total return includes adjustments in accordance with generally accepted accounting principles required at the year or period end and are not annualized for periods of less than one full year. ** Annualized for periods of less than one full year. (1) Per share amounts are calculated based on average shares outstanding during the year or period. (2) Net investment income/(loss) per share and Ratio of Net Investment Income/(Loss) to Average Net Assets include foreign withholding tax reclaims received in November 2021 and March 2022. The impact of the foreign withholding tax reclaims received, net of the related professional fees, to Net investment income/(loss) per share and Ratio of Net Investment Income/(Loss) to Average Net Assets is $0.04 and 0.69%, respectively. (3) Ratio of Gross Expenses includes additional professional fees related to foreign withholding tax reclaims received in November 2021 and March 2022. The impact of the additional professional fees to Ratio of Gross Expenses is 0.09%. |
| | |
See Notes to Financial Statements. |
| |
Janus Investment Fund | 25 |
Janus Henderson Global Equity Income Fund
Notes to Financial Statements (unaudited)
1. Organization and Significant Accounting Policies
Janus Henderson Global Equity Income Fund (the “Fund”) is a series of Janus Investment Fund (the “Trust”), which is organized as a Massachusetts business trust and is registered under the Investment Company Act of 1940, as amended (the “1940 Act”), as an open-end management investment company, and therefore has applied the specialized accounting and reporting guidance in Financial Accounting Standards Board (“FASB”) Accounting Standards Codification (“ASC”) Topic 946. The Trust offers 40 funds, each of which offers multiple share classes, with differing investment objectives and policies. The Fund seeks to achieve a high level of current income and, as a secondary objective, steady growth of capital. The Fund is classified as diversified, as defined in the 1940 Act. Janus Henderson Investors US LLC is the investment adviser (the “Adviser”) to the Fund.
The Fund offers multiple classes of shares in order to meet the needs of various types of investors. Each class represents an interest in the same portfolio of investments. Certain financial intermediaries may not offer all classes of shares.
Shareholders, including other funds, individuals, accounts, as well as the Fund’s portfolio manager(s) and/or investment personnel, may from time to time own (beneficially or of record) a significant percentage of the Fund’s Shares and can be considered to “control” the Fund when that ownership exceeds 25% of the Fund’s assets (and which may differ from control as determined in accordance with United States of America generally accepted accounting principles ("US GAAP")).
Class A Shares are offered through financial intermediary platforms including, but not limited to, traditional brokerage platforms, mutual fund wrap fee programs, bank trust platforms, and retirement platforms.
Class C Shares are offered through financial intermediary platforms including, but not limited to, traditional brokerage platforms, mutual fund wrap fee programs, and bank trust platforms.
Class C Shares are closed to investments by new employer-sponsored retirement plans and existing employer-sponsored retirement plans are no longer able to make additional purchases or exchanges into Class C Shares.
The Fund currently implements an automatic conversion feature pursuant to which Class C Shares that have been held for eight years are automatically converted to Class A Shares without the imposition of any sales charge, fee or other charge. The conversion will generally occur no later than ten business days in the month following the month of the eighth anniversary of the date of purchase. Class C Shares purchased through the reinvestment of dividends and other distributions on Class C Shares will convert to Class A Shares at the same time as the original Class C Shares with respect to which they were purchased. For Class C Shares held in omnibus accounts on intermediary platforms, the Fund relies on these intermediaries to implement this conversion feature. Your financial intermediary may have separate policies and procedures as to when and how Class C Shares may be converted to Class A Shares.
Effective July 6, 2020, Class D Shares are available to new investors, subject to any closed fund policies for a Fund, as applicable. Previously, Class D Shares were only available to investors who already had a direct account with the Janus Henderson funds; immediate family members or members of the same household of an eligible individual investor; and existing beneficial owners of sole proprietorships or partnerships that hold accounts directly with the Janus Henderson funds.
Class I Shares are available through certain financial intermediary platforms including, but not limited to, mutual fund wrap fee programs, managed account programs, asset allocation programs, bank trust platforms, as well as certain retirement platforms. Class I Shares are also available to certain direct institutional investors including, but not limited to, corporations, certain retirement plans, public plans, and foundations/endowments, who established Class I Share accounts before August 4, 2017.
Class N Shares are generally available only to financial intermediaries purchasing on behalf of: 1) certain adviser-assisted, employer-sponsored retirement plans, including 401(k) plans, 457 plans, 403(b) plans, Taft-Hartley multi-employer plans, profit-sharing and money purchase pension plans, defined benefit plans and certain welfare benefit plans, such as health savings accounts, and nonqualified deferred compensation plans; and 2) retail investors purchasing in qualified or nonqualified accounts, whose accounts are held through an omnibus account at their financial intermediary, and where the financial intermediary requires no payment or reimbursement from the Fund, the Adviser, or its affiliates. Class N Shares are also available to Janus Henderson proprietary products and to certain direct institutional investors approved by Janus Henderson Distributors US LLC (the “Distributor”) including, but not limited to,
Janus Henderson Global Equity Income Fund
Notes to Financial Statements (unaudited)
corporations, certain retirement plans, public plans, and foundations and endowments, subject to minimum investment requirements.
Class S Shares are offered through financial intermediary platforms including, but not limited to, retirement platforms and asset allocation, mutual fund wrap, or other discretionary or nondiscretionary fee-based investment advisory programs. In addition, Class S Shares may be available through certain financial intermediaries who have an agreement with the Adviser or its affiliates to offer Class S Shares on their supermarket platforms.
Class T Shares are available through certain financial intermediary platforms including, but not limited to, mutual fund wrap fee programs, managed account programs, asset allocation programs, bank trust platforms, as well as certain retirement platforms. In addition, Class T Shares may be available through certain financial intermediaries who have an agreement with the Adviser or its affiliates to offer Class T Shares on their supermarket platforms.
The following accounting policies have been followed by the Fund and are in conformity with US GAAP.
Investment Valuation
Fund holdings are valued in accordance with policies and procedures established by the Adviser pursuant to Rule 2a-5 under the 1940 Act and approved by and subject to the oversight of the Trustees (the “Valuation Procedures”). Equity securities traded on a domestic securities exchange are generally valued at readily available market quotations, which are (i) the official close prices or (ii) last sale prices on the primary market or exchange in which the securities trade. If such price is lacking for the trading period immediately preceding the time of determination, such securities are generally valued at their current bid price. Equity securities that are traded on a foreign exchange are generally valued at the closing prices on such markets. In the event that there is no current trading volume on a particular security in such foreign exchange, the bid price from the primary exchange is generally used to value the security. Foreign securities and currencies are converted to U.S. dollars using the current spot USD dollar exchange rate in effect at the close of the New York Stock Exchange (“NYSE”). The Fund will determine the market value of individual securities held by it by using prices provided by one or more approved professional pricing services or, as needed, by obtaining market quotations from independent broker-dealers. Most debt securities are valued in accordance with the evaluated bid price supplied by the Adviser-approved pricing service that is intended to reflect market value. The evaluated bid price supplied by the pricing service is an evaluation that may consider factors such as security prices, yields, maturities and ratings. Certain short-term securities maturing within 60 days or less may be evaluated and valued on an amortized cost basis provided that the amortized cost determined approximates market value. Securities for which market quotations or evaluated prices are not readily available or deemed unreliable are valued at fair value determined in good faith by the Adviser pursuant to the Valuation Procedures. Circumstances in which fair valuation may be utilized include, but are not limited to: (i) a significant event that may affect the securities of a single issuer, such as a merger, bankruptcy, or significant issuer-specific development; (ii) an event that may affect an entire market, such as a natural disaster or significant governmental action; (iii) a nonsignificant event such as a market closing early or not opening, or a security trading halt; and (iv) pricing of a nonvalued security and a restricted or nonpublic security. Special valuation considerations may apply with respect to “odd-lot” fixed-income transactions which, due to their small size, may receive evaluated prices by pricing services which reflect a large block trade and not what actually could be obtained for the odd-lot position. The valuation policies provide for the use of systematic fair valuation models provided by independent pricing services to value foreign equity securities in order to adjust for stale pricing, which may occur between the close of certain foreign exchanges and the close of the NYSE. The value of the securities of other mutual funds held by a Fund, if any, will be calculated using the NAV of such mutual funds.
Valuation Inputs Summary
FASB ASC 820, Fair Value Measurements and Disclosures (“ASC 820”), defines fair value, establishes a framework for measuring fair value, and expands disclosure requirements regarding fair value measurements. This standard emphasizes that fair value is a market-based measurement that should be determined based on the assumptions that market participants would use in pricing an asset or liability and establishes a hierarchy that prioritizes inputs to valuation techniques used to measure fair value. These inputs are summarized into three broad levels:
Level 1 – Unadjusted quoted prices in active markets the Fund has the ability to access for identical assets or liabilities.
Level 2 – Observable inputs other than unadjusted quoted prices included in Level 1 that are observable for the asset or liability either directly or indirectly. These inputs may include quoted prices for the identical instrument on
Janus Henderson Global Equity Income Fund
Notes to Financial Statements (unaudited)
an inactive market, prices for similar instruments, interest rates, prepayment speeds, credit risk, yield curves, default rates and similar data.
Assets or liabilities categorized as Level 2 in the hierarchy generally include: debt securities fair valued in accordance with the evaluated bid or ask prices supplied by a pricing service; securities traded on OTC markets and listed securities for which no sales are reported that are fair valued at the latest bid price (or yield equivalent thereof) obtained from one or more dealers transacting in a market for such securities or by a pricing service approved by the Fund’s Trustees; certain short-term debt securities with maturities of 60 days or less that are fair valued at amortized cost; and equity securities of foreign issuers whose fair value is determined by using systematic fair valuation models provided by independent third parties in order to adjust for stale pricing which may occur between the close of certain foreign exchanges and the close of the NYSE. Other securities that may be categorized as Level 2 in the hierarchy include, but are not limited to, preferred stocks, bank loans, swaps, investments in unregistered investment companies, options, and forward contracts.
Level 3 – Unobservable inputs for the asset or liability to the extent that relevant observable inputs are not available, representing the Fund’s own assumptions about the assumptions that a market participant would use in valuing the asset or liability, and that would be based on the best information available.
There have been no significant changes in valuation techniques used in valuing any such positions held by the Fund since the beginning of the fiscal period.
The inputs or methodology used for fair valuing securities are not necessarily an indication of the risk associated with investing in those securities. The summary of inputs used as of March 31, 2023 to fair value the Fund’s investments in securities and other financial instruments is included in the “Valuation Inputs Summary” in the Notes to Schedule of Investments and Other Information.
Investment Transactions and Investment Income
Investment transactions are accounted for as of the date purchased or sold (trade date). Dividend income is recorded on the ex-dividend date. Certain dividends from foreign securities will be recorded as soon as the Fund is informed of the dividend, if such information is obtained subsequent to the ex-dividend date. Dividends from foreign securities may be subject to withholding taxes in foreign jurisdictions. Non-cash dividends, if any, are recorded on the ex-dividend date at fair value. Interest income is recorded daily on an accrual basis and includes amortization of premiums and accretion of discounts. The Fund classifies gains and losses on prepayments received as an adjustment to interest income. Debt securities may be placed in non-accrual status and related interest income may be reduced by stopping current accruals and writing off interest receivables when collection of all or a portion of interest has become doubtful. Gains and losses are determined on the identified cost basis, which is the same basis used for federal income tax purposes. Income, as well as gains and losses, both realized and unrealized, are allocated daily to each class of shares based upon the ratio of net assets represented by each class as a percentage of total net assets.
Expenses
The Fund bears expenses incurred specifically on its behalf. Each class of shares bears a portion of general expenses, which are allocated daily to each class of shares based upon the ratio of net assets represented by each class as a percentage of total net assets. Expenses directly attributable to a specific class of shares are charged against the operations of such class.
Estimates
The preparation of financial statements in conformity with US GAAP requires management to make estimates and assumptions that affect the reported amount of assets and liabilities and disclosure of contingent assets and liabilities at the date of the financial statements, and the reported amounts of income and expenses during the reporting period. Actual results could differ from those estimates.
Indemnifications
In the normal course of business, the Fund may enter into contracts that contain provisions for indemnification of other parties against certain potential liabilities. The Fund’s maximum exposure under these arrangements is unknown, and would involve future claims that may be made against the Fund that have not yet occurred. Currently, the risk of material loss from such claims is considered remote.
Janus Henderson Global Equity Income Fund
Notes to Financial Statements (unaudited)
Foreign Currency Translations
The Fund does not isolate that portion of the results of operations resulting from the effect of changes in foreign exchange rates on investments from the fluctuations arising from changes in market prices of securities held at the date of the financial statements. Net unrealized appreciation or depreciation of investments and foreign currency translations arise from changes in the value of assets and liabilities, including investments in securities held at the date of the financial statements, resulting from changes in the exchange rates and changes in market prices of securities held.
Currency gains and losses are also calculated on payables and receivables that are denominated in foreign currencies. The payables and receivables are generally related to foreign security transactions and income translations.
Foreign currency-denominated assets and forward currency contracts may involve more risks than domestic transactions, including currency risk, counterparty risk, political and economic risk, regulatory risk and equity risk. Risks may arise from unanticipated movements in the value of foreign currencies relative to the U.S. dollar.
Dividends and Distributions
Dividends of net investment income are generally declared and distributed quarterly, and realized capital gains (if any) are distributed annually. The Fund may treat a portion of the amount paid to redeem shares as a distribution of investment company taxable income and realized capital gains that are reflected in the net asset value. This practice, commonly referred to as “equalization,” has no effect on the redeeming shareholder or a Fund’s total return, but may reduce the amounts that would otherwise be required to be paid as taxable dividends to the remaining shareholders. It is possible that the Internal Revenue Service (IRS) could challenge the Fund's equalization methodology or calculations, and any such challenge could result in additional tax, interest, or penalties to be paid by the Fund.
The Fund may make certain investments in real estate investment trusts (“REITs”) which pay dividends to their shareholders based upon funds available from operations. It is quite common for these dividends to exceed the REITs’ taxable earnings and profits, resulting in the excess portion of such dividends being designated as a return of capital. If the Fund distributes such amounts, such distributions could constitute a return of capital to shareholders for federal income tax purposes.
Federal Income Taxes
The Fund intends to continue to qualify as a regulated investment company and distribute all of its taxable income in accordance with the requirements of Subchapter M of the Internal Revenue Code. Management has analyzed the Fund’s tax positions taken for all open federal income tax years, generally a three-year period, and has concluded that no provision for federal income tax is required in the Fund’s financial statements. The Fund is not aware of any tax positions for which it is reasonably possible that the total amounts of unrecognized tax benefits will significantly change in the next twelve months.
2. Derivative Instruments
The Fund may invest in various types of derivatives, which may at times result in significant derivative exposure. A derivative is a financial instrument whose performance is derived from the performance of another asset. The Fund may invest in derivative instruments including, but not limited to: futures contracts, put options, call options, options on futures contracts, options on foreign currencies, options on recovery locks, options on security and commodity indices, swaps, forward contracts, structured investments, and other equity-linked derivatives. Each derivative instrument that was held by the Fund during the period ended March 31, 2023 is discussed in further detail below. A summary of derivative activity by the Fund is reflected in the tables at the end of the Schedule of Investments.
The Fund may use derivative instruments for hedging purposes (to offset risks associated with an investment, currency exposure, or market conditions), to adjust currency exposure relative to a benchmark index, or for speculative purposes (to earn income and seek to enhance returns). When the Fund invests in a derivative for speculative purposes, the Fund will be fully exposed to the risks of loss of that derivative, which may sometimes be greater than the derivative’s cost. The Fund may not use any derivative to gain exposure to an asset or class of assets that it would be prohibited by its investment restrictions from purchasing directly. The Fund’s ability to use derivative instruments may also be limited by tax considerations.
Investments in derivatives in general are subject to market risks that may cause their prices to fluctuate over time. Investments in derivatives may not directly correlate with the price movements of the underlying instrument. As a result, the use of derivatives may expose the Fund to additional risks that it would not be subject to if it invested directly in the
Janus Henderson Global Equity Income Fund
Notes to Financial Statements (unaudited)
securities underlying those derivatives. The use of derivatives may result in larger losses or smaller gains than otherwise would be the case. Derivatives can be volatile and may involve significant risks.
In pursuit of its investment objective, the Fund may seek to use derivatives to increase or decrease exposure to the following market risk factors:
· Commodity Risk – the risk related to the change in value of commodities or commodity-linked investments due to changes in the overall market movements, volatility of the underlying benchmark, changes in interest rates, or other factors affecting a particular industry or commodity such as drought, floods, weather, livestock disease, embargoes, tariffs, and international economic, political, and regulatory developments.
· Counterparty Risk – the risk that the counterparty (the party on the other side of the transaction) on a derivative transaction will be unable to honor its financial obligation to the Fund.
· Credit Risk – the risk an issuer will be unable to make principal and interest payments when due, or will default on its obligations.
· Currency Risk – the risk that changes in the exchange rate between currencies will adversely affect the value (in U.S. dollar terms) of an investment.
· Equity Risk – the risk related to the change in value of equity securities as they relate to increases or decreases in the general market.
· Index Risk – if the derivative is linked to the performance of an index, it will be subject to the risks associated with changes in that index. If the index changes, the Fund could receive lower interest payments or experience a reduction in the value of the derivative to below what the Fund paid. Certain indexed securities, including inverse securities (which move in an opposite direction to the index), may create leverage, to the extent that they increase or decrease in value at a rate that is a multiple of the changes in the applicable index.
· Interest Rate Risk – the risk that the value of fixed-income securities will generally decline as prevailing interest rates rise, which may cause the Fund’s NAV to likewise decrease.
· Leverage Risk – the risk associated with certain types of leveraged investments or trading strategies pursuant to which relatively small market movements may result in large changes in the value of an investment. The Fund creates leverage by investing in instruments, including derivatives, where the investment loss can exceed the original amount invested. Certain investments or trading strategies, such as short sales, that involve leverage can result in losses that greatly exceed the amount originally invested.
· Liquidity Risk – the risk that certain securities may be difficult or impossible to sell at the time that the seller would like or at the price that the seller believes the security is currently worth.
Derivatives may generally be traded OTC or on an exchange. Derivatives traded OTC are agreements that are individually negotiated between parties and can be tailored to meet a purchaser’s needs. OTC derivatives are not guaranteed by a clearing agency and may be subject to increased credit risk.
In an effort to mitigate credit risk associated with derivatives traded OTC, the Fund may enter into collateral agreements with certain counterparties whereby, subject to certain minimum exposure requirements, the Fund may require the counterparty to post collateral if the Fund has a net aggregate unrealized gain on all OTC derivative contracts with a particular counterparty. Additionally, the Fund may deposit cash and/or treasuries as collateral with the counterparty and/or custodian daily (based on the daily valuation of the financial asset) if the Fund has a net aggregate unrealized loss on OTC derivative contracts with a particular counterparty. All liquid securities and restricted cash are considered to cover in an amount at all times equal to or greater than the Fund’s commitment with respect to certain exchange-traded derivatives, centrally cleared derivatives, forward foreign currency exchange contracts, short sales, and/or securities with extended settlement dates. There is no guarantee that counterparty exposure is reduced and these arrangements are dependent on the Adviser’s ability to establish and maintain appropriate systems and trading.
Forward Foreign Currency Exchange Contracts
A forward foreign currency exchange contract (“forward currency contract”) is an obligation to buy or sell a specified currency at a future date at a negotiated rate (which may be U.S. dollars or a foreign currency). The Fund may enter into forward currency contracts for hedging purposes, including, but not limited to, reducing exposure to changes in foreign
Janus Henderson Global Equity Income Fund
Notes to Financial Statements (unaudited)
currency exchange rates on foreign portfolio holdings and locking in the U.S. dollar cost of firm purchase and sale commitments for securities denominated in or exposed to foreign currencies. The Fund may also invest in forward currency contracts for non-hedging purposes such as seeking to enhance returns. The Fund is subject to currency risk and counterparty risk in the normal course of pursuing its investment objective through its investments in forward currency contracts.
Forward currency contracts are valued by converting the foreign value to U.S. dollars by using the current spot U.S. dollar exchange rate and/or forward rate for that currency. Exchange and forward rates as of the close of the NYSE are used to value the forward currency contracts. The unrealized appreciation/(depreciation) for forward currency contracts is reported in the Statement of Assets and Liabilities as a receivable or payable and in the Statement of Operations for the change in unrealized net appreciation/depreciation (if applicable). The realized gain or loss arising from the difference between the U.S. dollar cost of the original contract and the value of the foreign currency in U.S. dollars upon closing a forward currency contract is reported on the Statement of Operations (if applicable).
During the period, the Fund entered into forward currency contracts with the obligation to sell foreign currencies in the future at an agreed upon rate in order to decrease exposure to currency risk associated with foreign currency denominated securities held by the Fund.
3. Other Investments and Strategies
Additional Investment Risk
The U.S. government and the Federal Reserve, as well as certain foreign governments and central banks, have taken extraordinary actions to support local and global economies and the financial markets in response to the COVID-19 pandemic. This and other government intervention into the economy and financial markets to address the COVID-19 pandemic may not work as intended, particularly if the efforts are perceived by investors as being unlikely to achieve the desired results. Government actions to mitigate the economic impact of the pandemic have resulted in a large expansion of government deficits and debt, the long term consequences of which are not known. The COVID-19 pandemic could adversely affect the value and liquidity of a Fund’s investments, impair a Fund’s ability to satisfy redemption requests, and negatively impact a Fund’s performance. In addition, the outbreak of COVID-19, and measures taken to mitigate its effects, could result in disruptions to the services provided to a Fund by its service providers.
Widespread disease, including pandemics and epidemics, and natural or environmental disasters, including those which may be attributable to global climate change, such as earthquakes, fires, floods, hurricanes, tsunamis and weather-related phenomena generally, have been and can be highly disruptive to economies and markets, adversely impacting individual companies, sectors, industries, markets, currencies, interest and inflation rates, credit ratings, investor sentiment, and other factors affecting the value of a Fund’s investments. Economies and financial markets throughout the world have become increasingly interconnected, which increases the likelihood that events or conditions in one region or country will adversely affect markets or issuers in other regions or countries, including the United States. These disruptions could prevent a Fund from executing advantageous investment decisions in a timely manner and negatively impact a Fund’s ability to achieve its investment objective(s). Any such event(s) could have a significant adverse impact on the value of a Fund. In addition, these disruptions could also impair the information technology and other operational systems upon which the Fund’s service providers, including the Adviser or the subadviser (as applicable), rely, and could otherwise disrupt the ability of employees of the Fund’s service providers to perform essential tasks on behalf of the Fund. Adverse weather conditions may also have a particularly significant negative effect on issuers in the agricultural sector and on insurance and reinsurance companies that insure or reinsure against the impact of natural disasters.
A number of countries in the European Union (the “EU”) have experienced, and may continue to experience, severe economic and financial difficulties. In particular, many EU nations are susceptible to economic risks associated with high levels of debt. Many non-governmental issuers, and even certain governments, have defaulted on, or been forced to restructure, their debts. Many other issuers have faced difficulties obtaining credit or refinancing existing obligations. Financial institutions have in many cases required government or central bank support, have needed to raise capital, and/or have been impaired in their ability to extend credit. As a result, financial markets in the EU have experienced extreme volatility and declines in asset values and liquidity. These difficulties may continue, worsen, or spread further within the EU. Responses to these financial problems by European governments, central banks, and others, including austerity measures and reforms, may not work, may result in social unrest, and may limit future growth and economic
Janus Henderson Global Equity Income Fund
Notes to Financial Statements (unaudited)
recovery or have other unintended consequences. Among other things, these developments have adversely affected the value and exchange rate of the euro and pound sterling, and may continue to significantly affect the economies of all EU countries, which in turn may have a material adverse effect on the Fund’s investments in such countries, other countries that depend on EU countries for significant amounts of trade or investment, or issuers with exposure to debt issued by certain EU countries.
Emerging Market Investing
Within the parameters of its specific investment policies, the Fund may invest in securities of issuers or companies from or with exposure to one or more “developing countries” or “emerging market countries.” Such countries include but are not limited to countries included in the MSCI Emerging Markets IndexSM. Emerging market countries in which the Fund may invest include frontier market countries, the economies of which are less developed than other emerging market countries. To the extent that the Fund invests a significant amount of its assets in one or more of these countries, its returns and net asset value may be affected to a large degree by events and economic conditions in such countries. The risks of foreign investing are heightened when investing in emerging markets, which may result in the price of investments in emerging markets experiencing sudden and sharp price swings. In many developing markets, there is less government supervision and regulation of stock exchanges, brokers, and listed companies, making these investments potentially more volatile in price and less liquid than investments in developed securities markets, resulting in greater risk to investors. Similarly, issuers in such markets may not be subject to regulatory, accounting, auditing, and financial reporting and recordkeeping standards comparable to those to which U.S. companies are subject. There is a risk in developing countries that a current or future economic or political crisis could lead to price controls, forced mergers of companies, expropriation or confiscatory taxation, imposition or enforcement of foreign ownership limits, seizure, nationalization, sanctions or imposition of restrictions by various governmental entities on investment and trading, or creation of government monopolies, any of which may have a detrimental effect on the Fund’s investments. In addition, the Fund’s investments may be denominated in foreign currencies and therefore, changes in the value of a country’s currency compared to the U.S. dollar may affect the value of the Fund’s investments. To the extent that the Fund invests a significant portion of its assets in the securities of issuers in or companies of a single country or region, it is more likely to be impacted by events or conditions affecting that country or region, which could have a negative impact on the Fund’s performance. Developing countries may also experience a higher level of exposure and vulnerability to the adverse effects of climate change. This can be attributed to both the geographic location of emerging market countries and/or a country’s lack of access to technology or resources to adjust and adapt to its effects. An increased occurrence and severity of natural disasters and extreme weather events such as droughts and decreased crop yields, heat waves, flooding and rising sea levels, and increased spread of disease, could cause harmful effects to the performance of affected economies. Additionally, foreign and emerging market risks, including, but not limited to, price controls, expropriation or confiscatory taxation, imposition or enforcement of foreign ownership limits, nationalization, and restrictions on repatriation of assets may be heightened to the extent the Fund invests in Chinese local market securities.
Real Estate Investing
The Fund may invest in equity and debt securities of real estate-related companies. Such companies may include those in the real estate industry or real estate-related industries. These securities may include common stocks, corporate bonds, preferred stocks, and other equity securities, including, but not limited to, mortgage-backed securities, real estate-backed securities, securities of REITs and similar REIT-like entities. A REIT is a trust that invests in real estate-related projects, such as properties, mortgage loans, and construction loans. REITs are generally categorized as equity, mortgage, or hybrid REITs. A REIT may be listed on an exchange or traded OTC.
Counterparties
Fund transactions involving a counterparty are subject to the risk that the counterparty or a third party will not fulfill its obligation to the Fund (“counterparty risk”). Counterparty risk may arise because of the counterparty’s financial condition (i.e., financial difficulties, bankruptcy, or insolvency), market activities and developments, or other reasons, whether foreseen or not. A counterparty’s inability to fulfill its obligation may result in significant financial loss to the Fund. The Fund may be unable to recover its investment from the counterparty or may obtain a limited recovery, and/or recovery may be delayed. The extent of the Fund’s exposure to counterparty risk with respect to financial assets and liabilities approximates its carrying value. See the "Offsetting Assets and Liabilities" section of this Note for further details.
The Fund may be exposed to counterparty risk through participation in various programs, including, but not limited to, lending its securities to third parties, cash sweep arrangements whereby the Fund’s cash balance is invested in one or
Janus Henderson Global Equity Income Fund
Notes to Financial Statements (unaudited)
more types of cash management vehicles, as well as investments in, but not limited to, repurchase agreements, debt securities, and derivatives, including various types of swaps, futures and options. The Fund intends to enter into financial transactions with counterparties that the Adviser believes to be creditworthy at the time of the transaction. There is always the risk that the Adviser’s analysis of a counterparty’s creditworthiness is incorrect or may change due to market conditions. To the extent that the Fund focuses its transactions with a limited number of counterparties, it will have greater exposure to the risks associated with one or more counterparties.
Offsetting Assets and Liabilities
The Fund presents gross and net information about transactions that are either offset in the financial statements or subject to an enforceable master netting arrangement or similar agreement with a designated counterparty, regardless of whether the transactions are actually offset in the Statement of Assets and Liabilities.
In order to better define its contractual rights and to secure rights that will help the Fund mitigate its counterparty risk, the Fund has entered into an International Swaps and Derivatives Association, Inc. Master Agreement (“ISDA Master Agreement”) or similar agreement with its derivative contract counterparties. An ISDA Master Agreement is a bilateral agreement between the Fund and a counterparty that governs OTC derivatives and forward foreign currency exchange contracts and typically contains, among other things, collateral posting terms and netting provisions in the event of a default and/or termination event. Under an ISDA Master Agreement, in the event of a default and/or termination event, the Fund may offset with each counterparty certain derivative financial instruments’ payables and/or receivables with collateral held and/or posted and create one single net payment.
The Offsetting Assets and Liabilities table located in the Schedule of Investments presents gross amounts of recognized assets and/or liabilities and the net amounts after deducting collateral that has been pledged by counterparties or has been pledged to counterparties (if applicable). For corresponding information grouped by type of instrument, see the “Fair Value of Derivative Instruments (not accounted for as hedging instruments) as of March 31, 2023” table located in the Fund’s Schedule of Investments.The Fund generally does not exchange collateral on its forward foreign currency contracts with its counterparties; however, all liquid securities and restricted cash are considered to cover in an amount at all times equal to or greater than the Fund’s commitment with respect to these contracts. Certain securities may be segregated at the Fund’s custodian. These segregated securities are denoted on the accompanying Schedule of Investments and are evaluated daily to ensure their cover and/or market value equals or exceeds the Fund’s corresponding forward foreign currency exchange contract's obligation value.
4. Investment Advisory Agreements and Other Transactions with Affiliates
The Fund pays the Adviser an investment advisory fee which is calculated daily and paid monthly. The following table reflects the Fund’s contractual investment advisory fee rate (expressed as an annual rate).
| | |
Average Daily Net Assets of the Fund | Contractual Investment Advisory Fee (%) |
First $1 Billion | 0.85 |
Next $1 Billion | 0.65 |
Over $2 Billion | 0.60 |
The Fund’s actual investment advisory fee rate for the reporting period was 0.65% of average annual net assets before any applicable waivers.
The Adviser has entered into a personnel-sharing arrangement with its foreign (non-U.S.) affiliates, Henderson Global Investors Limited, Henderson Global Investors (Japan) Ltd., and Henderson Global Investors (Singapore) Ltd. (collectively, “HGIL”), pursuant to which HGIL and certain employees of HGIL serve as “associated persons” of the Adviser. In this capacity, such employees of HGIL are subject to the oversight and supervision of the Adviser and may provide portfolio management, research, and related services to the Fund on behalf of the Adviser.
The Adviser has contractually agreed to waive the investment advisory fee and/or reimburse operating expenses to the extent that the Fund’s total annual fund operating expenses, excluding the fees payable pursuant to a Rule 12b-1 plan, shareholder servicing fees, such as transfer agency fees (including out-of-pocket costs), administrative services fees and any networking/omnibus payable by any share class, brokerage commissions, interest, dividends, taxes, acquired fund fees and expenses, and extraordinary expenses, exceed the annual rate of 0.84% of the Fund’s average daily net assets. The Adviser has agreed to continue the waivers for at least a one-year period commencing on January 27,
Janus Henderson Global Equity Income Fund
Notes to Financial Statements (unaudited)
2023. If applicable, amounts waived and/or reimbursed to the Fund by the Adviser are disclosed as “Excess Expense Reimbursement and Waivers” on the Statement of Operations.
The Adviser serves as administrator to the Fund pursuant to an administration agreement between the Adviser and the Trust. Under the administration agreement, the Adviser is authorized to perform, or cause others to perform certain administration, compliance, and accounting services to the Fund, including providing office space for the Fund, and is reimbursed by the Fund for certain of its costs in providing these services (to the extent the Adviser seeks reimbursement and such costs are not otherwise waived). In addition, employees of the Adviser and/or its affiliates may serve as officers of the Trust. The Fund pays for some or all of the salaries, fees, and expenses of the Adviser employees and Fund officers, with respect to certain specified administration functions they perform on behalf of the Fund. The Fund pays these costs based on out-of-pocket expenses incurred by the Adviser, and these costs are separate and apart from advisory fees and other expenses paid in connection with the investment advisory services the Adviser (or any subadvisor, as applicable) provides to the Fund. These amounts are disclosed as “Affiliated fund administration fees” on the Statement of Operations. In addition, some expenses related to compensation payable to the Fund’s Chief Compliance Officer and certain compliance staff, all of whom are employees of the Adviser and/or its affiliates, are shared with the Fund. Total compensation of $114,430 was paid to the Chief Compliance Officer and certain compliance staff by the Trust during the period ended March 31, 2023. The Fund's portion is reported as part of “Other expenses” on the Statement of Operations.
Janus Henderson Services US LLC (the “Transfer Agent”), a wholly-owned subsidiary of the Adviser, is the Fund’s transfer agent. The Transfer Agent provides or arranges for the provision of shareholder services including, but not limited to, recordkeeping, subaccounting, answering inquiries regarding accounts, order processing, transaction confirmations, the mailing of prospectuses and shareholder reports, and other shareholder services provided to or on behalf of shareholders. These amounts are disclosed as “Transfer agent administrative fees and expenses” on the Statement of Operations.
Class D Shares of the Fund pay the Transfer Agent an annual administrative services fee based on the average daily net assets of Class D Shares as detailed below.
| | |
Average Daily Net Assets of Class D Shares of the Janus Henderson funds | Administrative Services Fee |
Under $40 billion | 0.12% |
$40 billion – $49.9 billion | 0.10% |
Over $49.9 billion | 0.08% |
During the reporting period, the administrative services fee rate was 0.12%.
The Transfer Agent receives an administrative services fee at an annual rate of up to 0.25% of the average daily net assets of the Fund’s Class S Shares and Class T Shares for providing or procuring administrative services to investors in Class S Shares and Class T Shares of the Fund. The Transfer Agent expects to use all or a significant portion of this fee to compensate retirement plan service providers, broker-dealers, bank trust departments, financial advisors, and other financial intermediaries for providing these services. The Transfer Agent may keep certain amounts retained for reimbursement of out-of-pocket costs incurred for servicing clients of Class S Shares and Class T Shares.
Shareholder Services provided by these financial intermediaries may include, but are not limited to, recordkeeping, subaccounting, order processing, providing order confirmations, periodic statements, forwarding prospectuses, shareholder reports, and other materials to existing customers, answering inquiries regarding accounts, and other administrative services. Order processing includes the submission of transactions through the National Securities Clearing Corporation (“NSCC”) or similar systems, or those processed on a manual basis with the Adviser. For all share classes, the Transfer Agent also seeks reimbursement for costs it incurs as transfer agent and for providing servicing.
Certain, but not all, intermediaries may charge administrative fees to investors in Class A Shares, Class C Shares, and Class I Shares for administrative services provided on behalf of such investors. These administrative fees are paid by the Class A Shares, Class C Shares, and Class I Shares of the Fund to the Transfer Agent, which uses such fees to reimburse intermediaries. Consistent with the Transfer Agency Agreement between the Transfer Agent and the Fund, the Transfer Agent may negotiate the level, structure, and/or terms of the administrative fees with intermediaries requiring such fees on behalf of the Fund. The Adviser and its affiliates benefit from an increase in assets that may result from such relationships. The Adviser has agreed to limit these fees up to 0.20% for Class A Shares and Class C Shares, and up to 0.15% for Class I Shares on an annual basis based on the daily net assets of each share class. Such
Janus Henderson Global Equity Income Fund
Notes to Financial Statements (unaudited)
limits are subject to change by the Trustees in the future. These amounts are disclosed as “Transfer agent networking and omnibus fees” on the Statement of Operations.
The Transfer Agent is not compensated for its services related to the shares, except for out-of-pocket costs, although the Transfer Agent is compensated for its services related to Fund’s Class D Shares. These amounts are disclosed as “Other transfer agent fees and expenses” on the Statement of Operations.
Under distribution and shareholder servicing plans (the “Plans”) adopted in accordance with Rule 12b-1 under the 1940 Act, the Fund pays the Trust’s distributor, the Distributor, a wholly-owned subsidiary of the Adviser, a fee for the sale and distribution and/or shareholder servicing of the shares based on the average daily net assets for each share class at an annual rate of up to 0.25% for Class A Shares, up to 1.00% for Class C Shares, and up to 0.25% for Class S Shares. Under the terms of the Plans, the Trust is authorized to make payments to the Distributor for remittance to retirement plan service providers, broker-dealers, bank trust departments, financial advisors, and other financial intermediaries, as compensation for distribution and/or shareholder services performed by such entities for their customers who are investors in the Fund. These amounts are disclosed as “12b-1 Distribution and shareholder servicing fees” on the Statement of Operations.
Class A Shares include a 5.75% upfront sales charge of the offering price of the Fund. The sales charge is allocated between the Distributor and financial intermediaries. During the period ended March 31, 2023, the Distributor retained upfront sales charges of $101,366.
A contingent deferred sales charge (“CDSC”) of 1.00% will be deducted with respect to Class A Shares purchased without a sales load and redeemed within 12 months of purchase, unless waived. Any applicable CDSC will be 1.00% of the lesser of the original purchase price or the value of the redemption of the Class A Shares redeemed. During the period ended March 31, 2023, redeeming shareholders of Class A Shares paid CDSCs of $1,825 to Janus Henderson Distributors.
A CDSC of 1.00% will be deducted with respect to Class C Shares redeemed within 12 months of purchase, unless waived. Any applicable CDSC will be 1.00% of the lesser of the original purchase price or the value of the redemption of the Class C Shares redeemed. During the period ended March 31, 2023, redeeming shareholders of Class C Shares paid CDSCs of $8,651.
The Board of Trustees has adopted a deferred compensation plan (the “Deferred Plan”) for independent Trustees to elect to defer receipt of all or a portion of the annual compensation they are entitled to receive from the Fund. All deferred fees are credited to an account established in the name of the Trustees. The amounts credited to the account then increase or decrease, as the case may be, in accordance with the performance of one or more of the Janus Henderson funds that are selected by the Trustees. The account balance continues to fluctuate in accordance with the performance of the selected fund or funds until final payment of all amounts are credited to the account. The fluctuation of the account balance is recorded by the Fund as unrealized appreciation/(depreciation) and is included as of March 31, 2023 on the Statement of Assets and Liabilities in the asset, “Trustees’ deferred compensation,” and liability, “Trustees’ deferred compensation fees.” Additionally, the recorded unrealized appreciation/(depreciation) is included in “Total distributable earnings (loss)” on the Statement of Assets and Liabilities. Deferred compensation expenses for the period ended March 31, 2023 are included in “Trustees’ fees and expenses” on the Statement of Operations. Trustees are allowed to change their designation of mutual funds from time to time. Amounts will be deferred until distributed in accordance with the Deferred Plan. Deferred fees of $205,688 were paid by the Trust to the Trustees under the Deferred Plan during the period ended March 31, 2023.
Pursuant to the provisions of the 1940 Act and related rules, the Fund may participate in an affiliated or non-affiliated cash sweep program. In the cash sweep program, uninvested cash balances of the Fund may be used to purchase shares of affiliated or non-affiliated money market funds or cash management pooled investment vehicles that operate as money market funds. The Fund is eligible to participate in the cash sweep program (the “Investing Funds”). The Adviser has an inherent conflict of interest because of its fiduciary duties to the affiliated money market funds or cash management pooled investment vehicles and the Investing Funds. Janus Henderson Cash Liquidity Fund LLC (the “Sweep Vehicle”) is an affiliated unregistered cash management pooled investment vehicle that invests primarily in highly-rated short-term fixed-income securities. The Sweep Vehicle operates pursuant to the provisions of the 1940 Act that govern the operation of money market funds and prices its shares at NAV reflecting market-based values of its portfolio securities (i.e., a “floating” NAV) rounded to the fourth decimal place (e.g., $1.0000). The Sweep Vehicle is permitted to impose a liquidity fee (of up to 2%) on redemptions from the Sweep Vehicle or a redemption gate that
Janus Henderson Global Equity Income Fund
Notes to Financial Statements (unaudited)
temporarily suspends redemptions from the Sweep Vehicle for up to 10 business days during a 90 day period. There are no restrictions on the Fund's ability to withdraw investments from the Sweep Vehicle at will, and there are no unfunded capital commitments due from the Fund to the Sweep Vehicle. The Sweep Vehicle does not charge any management fee, sales charge or service fee.
Any purchases and sales, realized gains/losses and recorded dividends from affiliated investments during the period ended March 31, 2023 can be found in the “Schedules of Affiliated Investments” located in the Schedule of Investments.
5. Federal Income Tax
Income and capital gains distributions are determined in accordance with income tax regulations that may differ from US GAAP. These differences are due to differing treatments for items such as net short-term gains, deferral of wash sale losses, foreign currency transactions, net investment losses, and capital loss carryovers.
The Fund has elected to treat gains and losses on forward foreign currency contracts as capital gains and losses, if applicable. Other foreign currency gains and losses on debt instruments are treated as ordinary income for federal income tax purposes pursuant to Section 988 of the Internal Revenue Code.
Accumulated capital losses noted below represent net capital loss carryovers, as of September 30, 2022, that may be available to offset future realized capital gains and thereby reduce future taxable gains distributions. The following table shows these capital loss carryovers.
| | | | | | |
| | | | | |
Capital Loss Carryover Schedule | | |
For the year ended September 30, 2022 | | |
| No Expiration | | | |
| Short-Term | Long-Term | Accumulated
Capital Losses | | |
| $(1,067,550,413) | $(171,320,353) | $(1,238,870,766) | | |
The aggregate cost of investments and the composition of unrealized appreciation and depreciation of investment securities for federal income tax purposes as of March 31, 2023 are noted below. The primary differences between book and tax appreciation or depreciation of investments are wash sale loss deferrals, investments in partnerships, and investments in passive foreign investment companies.
| | | | |
Federal Tax Cost | Unrealized
Appreciation | Unrealized
(Depreciation) | Net Tax Appreciation/
(Depreciation) |
$ 6,259,844,495 | $285,582,081 | $(457,241,560) | $ (171,659,479) |
Janus Henderson Global Equity Income Fund
Notes to Financial Statements (unaudited)
6. Capital Share Transactions
| | | | | | | |
| | | | | | |
| | Period ended March 31, 2023 | | Year ended September 30, 2022 |
| | Shares | Amount | | Shares | Amount |
| | | | | | | |
Class A Shares: | | | | | |
Shares sold | 15,957,717 | $ 96,813,916 | | 26,042,246 | $ 170,106,039 |
Reinvested dividends and distributions | 2,662,208 | 16,158,886 | | 6,460,032 | 39,274,744 |
Shares repurchased | (15,480,175) | (93,076,343) | | (26,724,082) | (174,209,170) |
Net Increase/(Decrease) | 3,139,750 | $ 19,896,459 | | 5,778,196 | $ 35,171,613 |
Class C Shares: | | | | | |
Shares sold | 6,176,337 | $ 36,947,290 | | 9,693,945 | $ 62,699,198 |
Reinvested dividends and distributions | 1,633,963 | 9,761,906 | | 4,414,963 | 26,529,716 |
Shares repurchased | (11,336,516) | (67,171,900) | | (20,632,456) | (132,431,718) |
Net Increase/(Decrease) | (3,526,216) | $ (20,462,704) | | (6,523,548) | $ (43,202,804) |
Class D Shares: | | | | | |
Shares sold | 706,783 | $ 4,292,726 | | 3,469,211 | $ 23,220,470 |
Reinvested dividends and distributions | 127,926 | 773,645 | | 274,746 | 1,638,772 |
Shares repurchased | (845,664) | (5,154,926) | | (1,604,948) | (10,301,172) |
Net Increase/(Decrease) | (10,955) | $ (88,555) | | 2,139,009 | $ 14,558,070 |
Class I Shares: | | | | | |
Shares sold | 179,726,287 | $1,083,845,239 | | 263,428,202 | $1,716,422,281 |
Reinvested dividends and distributions | 22,223,640 | 135,350,752 | | 46,766,003 | 284,016,160 |
Shares repurchased | (117,690,033) | (706,197,918) | | (199,588,995) | (1,286,291,518) |
Net Increase/(Decrease) | 84,259,894 | $ 512,998,073 | | 110,605,210 | $ 714,146,923 |
Class N Shares: | | | | | |
Shares sold | 16,298,833 | $ 99,419,276 | | 37,175,265 | $ 243,821,876 |
Reinvested dividends and distributions | 1,086,572 | 6,611,688 | | 1,766,310 | 10,605,934 |
Shares repurchased | (10,829,759) | (65,687,264) | | (10,822,569) | (70,330,321) |
Net Increase/(Decrease) | 6,555,646 | $ 40,343,700 | | 28,119,006 | $ 184,097,489 |
Class S Shares: | | | | | |
Shares sold | 357,251 | $ 2,136,130 | | 640,634 | $ 4,058,722 |
Reinvested dividends and distributions | 91,297 | 549,122 | | 206,259 | 1,241,114 |
Shares repurchased | (292,595) | (1,718,138) | | (572,985) | (3,706,657) |
Net Increase/(Decrease) | 155,953 | $ 967,114 | | 273,908 | $ 1,593,179 |
Class T Shares: | | | | | |
Shares sold | 5,624,335 | $ 33,837,322 | | 17,541,703 | $ 113,127,786 |
Reinvested dividends and distributions | 735,341 | 4,444,788 | | 1,497,548 | 8,905,613 |
Shares repurchased | (6,608,095) | (39,289,323) | | (6,446,732) | (40,947,303) |
Net Increase/(Decrease) | (248,419) | $ (1,007,213) | | 12,592,519 | $ 81,086,096 |
7. Purchases and Sales of Investment Securities
For the period ended March 31, 2023, the aggregate cost of purchases and proceeds from sales of investment securities (excluding any short-term securities, short-term options contracts, TBAs, and in-kind transactions, as applicable) was as follows:
| | | | |
Purchases of
Securities | Proceeds from Sales
of Securities | Purchases of Long-
Term U.S. Government
Obligations | Proceeds from Sales
of Long-Term U.S.
Government Obligations |
$4,521,542,225 | $4,226,543,119 | $ - | $ - |
Janus Henderson Global Equity Income Fund
Notes to Financial Statements (unaudited)
8. Subsequent Event
Management has evaluated whether any events or transactions occurred subsequent to March 31, 2023 and through the date of issuance of the Fund’s financial statements and determined that there were no material events or transactions that would require recognition or disclosure in the Fund’s financial statements.
Janus Henderson Global Equity Income Fund
Additional Information (unaudited)
Proxy Voting Policies and Voting Record
A description of the policies and procedures that the Fund uses to determine how to vote proxies relating to its portfolio securities is available without charge: (i) upon request, by calling 1-800-525-1093; (ii) on the Fund’s website at janushenderson.com/proxyvoting; and (iii) on the SEC’s website at http://www.sec.gov. Additionally, information regarding the Fund’s proxy voting record for the most recent twelve-month period ended June 30 is also available, free of charge, through janushenderson.com/proxyvoting and from the SEC’s website at http://www.sec.gov.
Full Holdings
The Fund files its complete portfolio holdings (schedule of investments) with the SEC as an exhibit to Form N-PORT within 60 days of the end of the first and third fiscal quarters, and in the annual report and semiannual report to shareholders. The Fund’s Form N-PORT filings and annual and semiannual reports: (i) are available on the SEC’s website at http://www.sec.gov; and (ii) are available without charge, upon request, by calling a Janus Henderson representative at 1-877-335-2687 (toll free) (or 1-800-525-3713 if you hold Class D Shares). Portfolio holdings consisting of at least the names of the holdings are generally available on a monthly basis with a 30-day lag under Full Holdings for the Fund at janushenderson.com/info (or janushenderson.com/reports if you hold Class D Shares).
APPROVAL OF ADVISORY AGREEMENTS DURING THE PERIOD
The Trustees of Janus Aspen Series, each of whom serves as an “independent” Trustee (the “Trustees”), oversee the management of each portfolio of Janus Aspen Series (each, a “VIT Portfolio,” and collectively, the “VIT Portfolios”), as well as each fund of Janus Investment Fund (each, a “Fund,” and collectively, the “Funds” and together with the VIT Portfolios, the “Janus Henderson Funds,” and each, a “Janus Henderson Fund”). As required by law, the Trustees determine annually whether to continue the investment advisory agreement for each Janus Henderson Fund.
In connection with their most recent consideration of those agreements for each Janus Henderson Fund, the Trustees received and reviewed information provided by Janus Henderson Investors US LLC (the “Adviser”) in response to requests of the Trustees and their independent legal counsel. They also received and reviewed information and analysis provided by, and in response to requests of, their independent fee consultant. Throughout their consideration of the agreements, the Trustees were advised by their independent legal counsel. The Trustees met with management to consider the agreements, and also met separately in executive session with their independent legal counsel and their independent fee consultant.
At meetings held on November 9-10, 2022 and December 13-14, 2022, the Trustees evaluated the information provided by the Adviser and the independent fee consultant, as well as other information provided by the Adviser and the independent fee consultant during the year. Following such evaluation, the Trustees determined that the overall arrangements between each Janus Henderson Fund and the Adviser were fair and reasonable in light of the nature, extent, and quality of the services provided by the Adviser and its affiliates, the fees charged for those services, and other matters that the Trustees considered relevant in the exercise of their business judgment, and unanimously approved the continuation of the investment advisory agreement for each Janus Henderson Fund for the period from February 1, 2023 through February 1, 2024, subject to earlier termination as provided for in each agreement.
In considering the continuation of those agreements, the Trustees reviewed and analyzed various factors that they determined were relevant, including the factors described below, none of which by itself was considered dispositive. However, the material factors and conclusions that formed the basis for the Trustees’ determination to approve the continuation of the agreements are discussed separately below. Also included is a summary of the independent fee consultant’s conclusions and opinions that arose during, and were included as part of, the Trustees’ consideration of the agreements. “Management fees,” as used herein, reflect actual annual advisory fees and, for the purpose of peer comparisons any administration fees (excluding out of pocket costs), net of any waivers, paid by a fund as a percentage of average net assets.
Nature, Extent and Quality of Services
The Trustees reviewed the nature, extent, and quality of the services provided by the Adviser to the Janus Henderson Funds, taking into account the investment objective, strategies, and policies of each Janus Henderson Fund, and the knowledge the Trustees gained from their regular meetings with management on at least a quarterly basis and their ongoing review of information related to the Janus Henderson Funds. In addition, the Trustees reviewed the resources and key personnel of the Adviser, particularly noting those employees who provide investment and risk management services to the Janus Henderson Funds. The Trustees also considered other services provided to the Janus Henderson
Janus Henderson Global Equity Income Fund
Additional Information (unaudited)
Funds by the Adviser, such as managing the execution of portfolio transactions and the selection of broker-dealers for those transactions. The Trustees considered the Adviser’s role as administrator to the Janus Henderson Funds, noting that the Adviser generally does not receive a fee for its services as administrator, but is reimbursed for its out-of-pocket costs. The Trustees considered the role of the Adviser in monitoring adherence to the Janus Henderson Funds’ investment restrictions, providing support services for the Trustees and Trustee committees, and overseeing communications with Janus Henderson Fund shareholders and the activities of other service providers, including monitoring compliance with various policies and procedures of the Janus Henderson Funds and with applicable securities laws and regulations.
In this regard, the independent fee consultant noted that the Adviser provides a number of different services for the Janus Henderson Funds and their shareholders, ranging from investment management services to various other servicing functions, and that, in its view, the Adviser is a capable provider of those services. The independent fee consultant also provided its belief that the Adviser has developed a number of institutional competitive advantages that should enable it to provide superior investment and service performance over the long term.
The Trustees concluded that the nature, extent, and quality of the services provided by the Adviser to each Janus Henderson Fund were appropriate and consistent with the terms of the respective advisory agreements, and that, taking into account steps taken to address those Janus Henderson Funds whose performance lagged that of their peers for certain periods, the Janus Henderson Funds were likely to benefit from the continued provision of those services. They also concluded that the Adviser had sufficient personnel, with the appropriate education and experience, to serve the Janus Henderson Funds effectively and had demonstrated its ability to attract well-qualified personnel.
Performance of the Funds
The Trustees considered the performance results of each Janus Henderson Fund over various time periods. They noted that they considered Janus Henderson Fund performance data throughout the year, including periodic meetings with each Janus Henderson Fund’s portfolio manager(s), and also reviewed information comparing each Janus Henderson Fund’s performance with the performance of comparable fund peer groups identified by Broadridge Financial Solutions, Inc. (“Broadridge”), an independent data provider, and with the Janus Henderson Fund’s benchmark index. In this regard, the independent fee consultant found that the overall Janus Henderson Funds’ performance has been reasonable, noting that: (i) for the 36 months ended May 31, 2022, approximately 38% of the Janus Henderson Funds were in the top two quartiles of their Broadridge peer groups; (ii) for the 36 months ended September 30, 2022, approximately 45% of the Janus Henderson Funds were in the top two quartiles of performance as reported by Morningstar, and (iii) for the 12 months ended September 30, 2022, approximately 55% of the Janus Henderson Funds were in the top two quartiles of performance as reported by Morningstar.
The Trustees considered the performance of each Janus Henderson Fund, noting that performance may vary by share class, and noted the following with respect to the Funds:
Asset Allocation Funds
· For Janus Henderson Global Allocation Fund – Conservative, the Trustees noted that the Fund’s performance was in the third Broadridge quartile for the 36 months ended May 31, 2022 and the bottom Broadridge quartile for the 12 months ended May 31, 2022. The Trustees noted the reasons for the Fund’s underperformance and the steps the Adviser had taken or was taking to improve performance.
· For Janus Henderson Global Allocation Fund – Growth, the Trustees noted that the Fund’s performance was in the bottom Broadridge quartile for the 36 months ended May 31, 2022 and the bottom Broadridge quartile for the 12 months ended May 31, 2022. The Trustees noted the reasons for the Fund’s underperformance and the steps the Adviser had taken or was taking to improve performance.
· For Janus Henderson Global Allocation Fund – Moderate, the Trustees noted that the Fund’s performance was in the bottom Broadridge quartile for the 36 months ended May 31, 2022 and the bottom Broadridge quartile for the 12 months ended May 31, 2022. The Trustees noted the reasons for the Fund’s underperformance and the steps the Adviser had taken or was taking to improve performance.
Fixed-Income Funds
· For Janus Henderson Absolute Return Income Opportunities Fund, the Trustees noted that the Fund’s performance was in the third Broadridge quartile for the 36 months ended May 31, 2022 and the first Broadridge quartile for the 12 months ended May 31, 2022. The Trustees noted the reasons for the Fund’s underperformance,
Janus Henderson Global Equity Income Fund
Additional Information (unaudited)
the steps the Adviser had taken or was taking to improve performance, and that the performance trend was improving.
· For Janus Developed World Bond Fund, the Trustees noted that the Fund’s performance was in the bottom Broadridge quartile for the 36 months ended May 31, 2022 and the bottom Broadridge quartile for the 12 months ended May 31, 2022. The Trustees noted the reasons for the Fund’s underperformance and the steps the Adviser had taken or was taking to improve performance.
· For Janus Henderson Flexible Bond Fund, the Trustees noted that the Fund’s performance was in the first Broadridge quartile for the 36 months ended May 31, 2022 and the second Broadridge quartile for the 12 months ended May 31, 2022.
· For Janus Henderson Global Bond Fund, the Trustees noted that the Fund’s performance was in the third Broadridge quartile for the 36 months ended May 31, 2022 and the bottom Broadridge quartile for the 12 months ended May 31, 2022. The Trustees noted the reasons for the Fund’s underperformance and the steps the Adviser had taken or was taking to improve performance.
· For Janus Henderson High-Yield Fund, the Trustees noted that the Fund’s performance was in the third Broadridge quartile for the 36 months ended May 31, 2022 and the bottom Broadridge quartile for the 12 months ended May 31, 2022. The Trustees noted the reasons for the Fund’s underperformance and the steps the Adviser had taken or was taking to improve performance.
· For Janus Henderson Multi-Sector Income Fund, the Trustees noted that the Fund’s performance was in the second Broadridge quartile for the 36 months ended May 31, 2022 and the third Broadridge quartile for the 12 months ended May 31, 2022.
· For Janus Henderson Short Duration Flexible Bond Fund, the Trustees noted that the Fund’s performance was in the third Broadridge quartile for the 36 months ended May 31, 2022 and the bottom Broadridge quartile for the 12 months ended May 31, 2022. The Trustees noted the reasons for the Fund’s underperformance and the steps the Adviser had taken or was taking to improve performance.
Global and International Equity Funds
· For Janus Henderson Asia Equity Fund, the Trustees noted that the Fund’s performance was in the third Broadridge quartile for the 36 months ended May 31, 2022 and the third Broadridge quartile for the 12 months ended May 31, 2022. The Trustees noted the reasons for the Fund’s underperformance, while also noting that the Fund has a performance fee structure that results in lower management fees during periods of underperformance, and the steps the Adviser had taken or was taking to improve performance.
· For Janus Henderson Emerging Markets Fund, the Trustees noted that the Fund’s performance was in the third Broadridge quartile for the 36 months ended May 31, 2022 and the third Broadridge quartile for the 12 months ended May 31, 2022. The Trustees noted the reasons for the Fund’s underperformance and the steps the Adviser had taken or was taking to improve performance.
· For Janus Henderson European Focus Fund, the Trustees noted that the Fund’s performance was in the first Broadridge quartile for the 36 months ended May 31, 2022 and the second Broadridge quartile for the 12 months ended May 31, 2022.
· For Janus Henderson Global Equity Income Fund, the Trustees noted that the Fund’s performance was in the third Broadridge quartile for the 36 months ended May 31, 2022 and the first Broadridge quartile for the 12 months ended May 31, 2022. The Trustees noted the reasons for the Fund’s underperformance, the steps the Adviser had taken or was taking to improve performance, and that the performance trend was improving.
· For Janus Henderson Global Life Sciences Fund, the Trustees noted that the Fund’s performance was in the third Broadridge quartile for the 36 months ended May 31, 2022 and the second Broadridge quartile for the 12 months ended May 31, 2022. The Trustees noted the reasons for the Fund’s underperformance, the steps the Adviser had taken or was taking to improve performance, and that the performance trend was improving.
· For Janus Henderson Global Sustainable Equity Fund, the Trustees noted that the Fund’s performance was in the second Broadridge quartile for the 12 months ended May 31, 2022. The Trustees noted that 36 month-end performance was not yet available.
Janus Henderson Global Equity Income Fund
Additional Information (unaudited)
· For Janus Henderson Global Real Estate Fund, the Trustees noted that the Fund’s performance was in the second Broadridge quartile for the 36 months ended May 31, 2022 and the bottom Broadridge quartile for the 12 months ended May 31, 2022.
· For Janus Henderson Global Research Fund, the Trustees noted that the Fund’s performance was in the second Broadridge quartile for the 36 months ended May 31, 2022 and the first Broadridge quartile for the 12 months ended May 31, 2022.
· For Janus Henderson Global Select Fund, the Trustees noted that the Fund’s performance was in the first Broadridge quartile for the 36 months ended May 31, 2022 and the first Broadridge quartile for the 12 months ended May 31, 2022.
· For Janus Henderson Global Technology and Innovation Fund, the Trustees noted that the Fund’s performance was in the second Broadridge quartile for the 36 months ended May 31, 2022 and the second Broadridge quartile for the 12 months ended May 31, 2022.
· For Janus Henderson International Opportunities Fund, the Trustees noted that the Fund’s performance was in the bottom Broadridge quartile for the 36 months ended May 31, 2022 and the third Broadridge quartile for the 12 months ended May 31, 2022. The Trustees noted the reasons for the Fund’s underperformance and the steps the Adviser had taken or was taking to improve performance.
· For Janus Henderson Overseas Fund, the Trustees noted that the Fund’s performance was in the first Broadridge quartile for the 36 months ended May 31, 2022 and the first Broadridge quartile for the 12 months ended May 31, 2022.
· For Janus Henderson Responsible International Dividend Fund (formerly the Janus Henderson Dividend & Income Builder Fund), the Trustees noted that the Fund’s performance was in the bottom Broadridge quartile for the 36 months ended May 31, 2022 and the bottom Broadridge quartile for the 12 months ended May 31, 2022. The Trustees noted the reasons for the Fund’s underperformance and the steps the Adviser had taken or was taking to improve performance.
Money Market Funds
· For Janus Henderson Government Money Market Fund, the Trustees noted that the Fund’s performance was in the third Broadridge quartile for the 36 months ended May 31, 2022 and the bottom Broadridge quartile for the 12 months ended May 31, 2022. The Trustees noted the reasons for the Fund’s underperformance and the steps the Adviser had taken or was taking to improve performance.
· For Janus Henderson Money Market Fund, the Trustees noted that the Fund’s performance was in the third Broadridge quartile for the 36 months ended May 31, 2022 and the bottom Broadridge quartile for the 12 months ended May 31, 2022. The Trustees noted the reasons for the Fund’s underperformance and the steps the Adviser had taken or was taking to improve performance.
Multi-Asset Funds
· For Janus Henderson Adaptive Global Allocation Fund, the Trustees noted that the Fund’s performance was in bottom Broadridge quartile for the 36 months ended May 31, 2022 and the second Broadridge quartile for the 12 months ended May 31, 2022. The Trustees noted the reasons for the Fund’s underperformance, the steps the Adviser had taken or was taking to improve performance, and that the performance trend was improving.
· For Janus Henderson Balanced Fund, the Trustees noted that the Fund’s performance was in the first Broadridge quartile for the 36 months ended May 31, 2022 and the first Broadridge quartile for the 12 months ended May 31, 2022.
U.S. Equity Funds
· For Janus Henderson Adaptive Risk Managed U.S. Equity Fund, the Trustees noted that the Fund’s performance was in the bottom Broadridge quartile for the 36 months ended May 31, 2022 and the second Broadridge quartile for the 12 months ended May 31, 2022. The Trustees noted the reasons for the Fund’s underperformance, the steps the Adviser had taken or were taking to improve performance, and that the performance trend was improving.
Janus Henderson Global Equity Income Fund
Additional Information (unaudited)
· For Janus Henderson Contrarian Fund, the Trustees noted that the Fund’s performance was in the first Broadridge quartile for the 36 months ended May 31, 2022 and the bottom Broadridge quartile for the 12 months ended May 31, 2022.
· For Janus Henderson Enterprise Fund, the Trustees noted that the Fund’s performance was in the second Broadridge quartile for the 36 months ended May 31, 2022 and the first Broadridge quartile for the 12 months ended May 31, 2022.
· For Janus Henderson Forty Fund, the Trustees noted that the Fund’s performance was in the third Broadridge quartile for the 36 months ended May 31, 2022 and the bottom Broadridge quartile for the 12 months ended May 31, 2022. The Trustees noted the reasons for the Fund’s underperformance and the steps the Adviser had taken or was taking to improve performance.
· For Janus Henderson Growth and Income Fund, the Trustees noted that the Fund’s performance was in the bottom Broadridge quartile for the 36 months ended May 31, 2022 and the first Broadridge quartile for the 12 months ended May 31, 2022. The Trustees noted the reasons for the Fund’s underperformance, the steps the Adviser had taken or was taking to improve performance, and that the performance trend was improving.
· For Janus Henderson Mid Cap Value Fund, the Trustees noted that the Fund’s performance was in the bottom Broadridge quartile for the 36 months ended May 31, 2022 and the second Broadridge quartile for the 12 months ended May 31, 2022. The Trustees noted the reasons for the Fund’s underperformance, while also noting that the Fund has a performance fee structure that results in lower management fees during periods of underperformance, the steps the Adviser had taken or was taking to improve performance, and that the performance trend was improving.
· For Janus Henderson Research Fund, the Trustees noted that the Fund’s performance was in the third Broadridge quartile for the 36 months ended May 31, 2022 and the third Broadridge quartile for the 12 months ended May 31, 2022. The Trustees noted the reasons for the Fund’s underperformance, while also noting that the Fund has a performance fee structure that results in lower management fees during periods of underperformance and the steps the Adviser had taken or was taking to improve performance.
· For Janus Henderson Small Cap Value Fund, the Trustees noted that the Fund’s performance was in the bottom Broadridge quartile for the 36 months ended May 31, 2022 and the second Broadridge quartile for the 12 months ended May 31, 2022. The Trustees noted the reasons for the Fund’s underperformance, while also noting that the Fund has a performance fee structure that results in lower management fees during periods of underperformance, the steps the Adviser had taken or was taking to improve performance, and that the performance trend was improving.
· For Janus Henderson Small-Mid Cap Value Fund, the Trustees noted that the Fund’s performance was in the bottom Broadridge quartile for the 36 months ended May 31, 2022 and the second Broadridge quartile for the 12 months ended May 31, 2022. The Trustees noted the reasons for the Fund’s underperformance, while also noting that the Fund has a performance fee structure that results in lower management fees during periods of underperformance, the steps the Adviser had taken or was taking to improve performance, and that the performance trend is improving.
· For Janus Henderson Triton Fund, the Trustees noted that the Fund’s performance was in the bottom Broadridge quartile for the 36 months ended May 31, 2022 and the second Broadridge quartile for the 12 months ended May 31, 2022. The Trustees noted the reasons for the Fund’s underperformance, the steps the Adviser had taken or was taking to improve performance, and that the performance trend was improving.
· For Janus Henderson Venture Fund, the Trustees noted that the Fund’s performance was in the bottom Broadridge quartile for the 36 months ended May 31, 2022 and the second Broadridge quartile for the 12 months ended May 31, 2022. The Trustees noted the reasons for the Fund’s underperformance, the steps the Adviser had taken or was taking to improve performance, and that the performance trend was improving.
In consideration of each Janus Henderson Fund’s performance, the Trustees concluded that, taking into account the factors relevant to performance, as well as other considerations, including steps taken to improve performance, as applicable, the Janus Henderson Fund’s performance warranted continuation of such Janus Henderson Fund’s investment advisory agreement.
Janus Henderson Global Equity Income Fund
Additional Information (unaudited)
Costs of Services Provided
The Trustees examined information regarding the fees and expenses of each Janus Henderson Fund in comparison to similar information for other comparable funds as provided by Broadridge, an independent data provider. They also reviewed an analysis of that information provided by their independent fee consultant. The independent fee consultant provided its belief that the management fees charged by the Adviser to each of the Janus Henderson Funds under the current investment advisory and administration agreements are reasonable in relation to the services provided by the Adviser. The independent fee consultant found: (1) the total expenses and management fees of the Janus Henderson Funds to be reasonable relative to other comparable mutual funds; (2) the total expenses, on average, were 6% under the average total expenses of the respective Broadridge peer group; and (3) the management fees for the Janus Henderson Funds, on average, were 5% under the average management fees for the respective Broadridge peer group. The Trustees also considered the total expenses for each share class of each Janus Henderson Fund compared to the average total expenses for its Broadridge Expense Group and to average total expenses for its Broadridge Expense Universe.
For Janus Henderson Funds with three or more years of performance history, the independent fee consultant also performed a systematic “focus list” analysis of expenses which assessed fund fees in the context of fund performance being delivered. Based on this analysis, the independent fee consultant found that the combination of service quality/performance and expenses on these individual Janus Henderson Funds was reasonable in light of performance trends, performance histories, changes in portfolio management, relative average net asset levels, and the existence of performance fees, breakpoints, and/or expense waivers on such Janus Henderson Funds.
The Trustees considered the methodology used by the Adviser in determining compensation payable to portfolio managers, the competitive environment for investment management talent, and the competitive market for mutual funds in different distribution channels.
The Trustees also reviewed management fees charged by the Adviser to comparable separate account clients and to comparable non-affiliated funds subadvised by the Adviser (for which the Adviser provides only or primarily portfolio management services). Although in most instances subadvisory and separate account fee rates for various investment strategies were lower than management fee rates for Janus Henderson Funds having a similar strategy, the Trustees considered that the Adviser noted that, under the terms of the management agreements with the Janus Henderson Funds, the Adviser performs significant additional services for the Janus Henderson Funds that it does not provide to those other clients, including administration services, oversight of the Janus Henderson Funds’ other service providers, Trustee support, regulatory compliance and numerous other services, and that, in serving the Janus Henderson Funds, the Adviser assumes many legal risks and other costs that it does not assume in servicing its other clients. Moreover, the Trustees noted that the independent fee consultant found that: (1) the management fees the Adviser charges to the Janus Henderson Funds are reasonable in relation to the management fees the Adviser charges to funds subadvised by the Adviser and to the fees the Adviser charges to its institutional separate account clients; (2) these subadvised and institutional separate accounts have different service and infrastructure needs and operate in markets very different from the retail fund market; (3) Janus Henderson mutual fund investors enjoy reasonable fees relative to the fees charged in these other markets; and (4) as part of its 2022 review, 9 of 11 Janus Henderson Funds have lower management fees than similar funds subadvised by the Adviser. The Trustees noted that for the two Janus Henderson Funds that did not, management fees for each were under the average of its 15(c) peer group.
The Trustees considered the fees for each Janus Henderson Fund for its fiscal year ended in 2021 and noted the following with regard to each Janus Henderson Fund’s total expenses, net of applicable fee waivers (the Fund’s “total expenses”) as reflected in the comparative information provided by Broadridge:
Asset Allocation Funds
· For Janus Henderson Global Allocation Fund – Conservative, the Trustees noted that, although the Fund’s total expenses exceeded the peer group average for certain share classes, overall the Fund’s total expenses were reasonable. The Trustees also noted that the Adviser has contractually agreed to limit the Fund’s expenses.
· For Janus Henderson Global Allocation Fund – Growth, the Trustees noted that, although the Fund’s total expenses exceeded the peer group average for certain share classes, overall the Fund’s total expenses were reasonable. The Trustees also noted that the Adviser has contractually agreed to limit the Fund’s expenses, although this limit did not apply because the Fund’s total expenses as shown were below the applicable fee limit.
Janus Henderson Global Equity Income Fund
Additional Information (unaudited)
· For Janus Henderson Global Allocation Fund – Moderate, the Trustees noted that, although the Fund’s total expenses exceeded the peer group average for one share class, overall the Fund’s total expenses were reasonable. The Trustees also noted that the Adviser has contractually agreed to limit the Fund’s expenses.
Fixed-Income Funds
· For Janus Henderson Absolute Return Income Opportunities Fund, the Trustees noted that, although the Fund’s total expenses exceeded the peer group average for certain share classes, overall the Fund’s total expenses were reasonable. The Trustees also noted that the Adviser has contractually agreed to limit the Fund’s expenses.
· For Janus Henderson Developed World Bond Fund, the Trustees noted that, although the Fund’s total expenses exceeded the peer group average for one share class, overall the Fund’s total expenses were reasonable. The Trustees also noted that the Adviser has contractually agreed to limit the Fund’s expenses.
· For Janus Henderson Flexible Bond Fund, the Trustees noted that, although the Fund’s total expenses exceeded the peer group average for certain share classes, overall the Fund’s total expenses were reasonable. The Trustees also noted that the Adviser has contractually agreed to limit the Fund’s expenses, although this limit did not apply because the Fund’s total expenses as shown were below the applicable fee limit.
· For Janus Henderson Global Bond Fund, the Trustees noted that, although the Fund’s total expenses exceeded the peer group average for certain share classes, overall the Fund’s total expenses were reasonable. The Trustees also noted that the Adviser has contractually agreed to limit the Fund’s expenses.
· For Janus Henderson High-Yield Fund, the Trustees noted that, although the Fund’s total expenses exceeded the peer group average for certain share classes, overall the Fund’s total expenses were reasonable. The Trustees also noted that the Adviser has contractually agreed to limit the Fund’s expenses.
· For Janus Henderson Multi-Sector Income Fund, the Trustees noted that, although the Fund’s total expenses exceeded the peer group average for certain share classes, overall the Fund’s total expenses were reasonable. The Trustees also noted that the Adviser has contractually agreed to limit the Fund’s expenses.
· For Janus Henderson Short Duration Flexible Bond Fund, the Trustees noted that, although the Fund’s total expenses exceeded the peer group average for certain share classes, overall the Fund’s total expenses were reasonable. The Trustees also noted that the Adviser has contractually agreed to limit the Fund’s expenses.
Global and International Equity Funds
· For Janus Henderson Asia Equity Fund, the Trustees noted that, although the Fund’s total expenses exceeded the peer group average for certain share classes, overall the Fund’s total expenses were reasonable. The Trustees also noted that the Adviser has contractually agreed to limit the Fund’s expenses.
· For Janus Henderson Emerging Markets Fund, the Trustees noted that, although the Fund’s total expenses exceeded the peer group average for certain share classes, overall the Fund’s total expenses were reasonable. The Trustees also noted that the Adviser has contractually agreed to limit the Fund’s expenses.
· For Janus Henderson European Focus Fund, the Trustees noted that, although the Fund’s total expenses exceeded the peer group average for one share class, overall the Fund’s expenses were reasonable. The Trustees also noted that the Adviser has contractually agreed to limit the Fund’s expenses.
· For Janus Henderson Global Equity Income Fund, the Trustees noted that, although the Fund’s total expenses exceeded the peer group average for one share class, overall the Fund’s total expenses were reasonable. The Trustees also noted that the Adviser has contractually agreed to limit the Fund’s expenses, although this limit did not apply because the Fund’s total expenses as shown were below the applicable fee limit.
· For Janus Henderson Global Life Sciences Fund, the Trustees noted that the Fund’s total expenses were below the peer group average for all share classes.
· For Janus Henderson Global Real Estate Fund, the Trustees noted that, although the Fund’s total expenses exceeded the peer group average for certain share classes, overall the Fund’s total expenses were reasonable. The Trustees also noted that the Adviser has contractually agreed to limit the Fund’s expenses, although this limit did not apply because the Fund’s total expenses as shown were below the applicable fee limit.
Janus Henderson Global Equity Income Fund
Additional Information (unaudited)
· For Janus Henderson Global Research Fund, the Trustees noted that, although the Fund’s total expenses exceeded the peer group average for one share class, overall the Fund’s total expenses were reasonable. The Trustees also noted that the Adviser has contractually agreed to limit the Fund’s expenses, although this limit did not apply because the Fund’s total expenses as shown were below the applicable fee limit.
· For Janus Henderson Global Select Fund, the Trustees noted that, although the Fund’s total expenses exceeded the peer group average for certain share classes, overall the Fund’s total expenses were reasonable. The Trustees also noted that the Adviser has contractually agreed to limit the Fund’s expenses.
· For Janus Henderson Global Sustainable Equity Fund, the Trustees noted that, although the Fund’s total expenses exceeded the peer group average for certain share classes, overall the Fund’s expenses were reasonable. The Trustees also noted that the Adviser has contractually agreed to limit the Fund’s expenses.
· For Janus Henderson Global Technology and Innovation Fund, the Trustees noted that the Fund’s total expenses were below the peer group average for all share classes.
· For Janus Henderson International Opportunities Fund, the Trustees noted that, although the Fund’s total expenses exceeded the peer group average for certain share classes, overall the Fund’s expenses were reasonable. The Trustees also noted that the Adviser has contractually agreed to limit the Fund’s expenses.
· For Janus Henderson Overseas Fund, the Trustees noted that although the Fund’s total expenses exceeded the peer group average for certain share classes, overall the Fund’s total expenses were reasonable. The Trustees also noted that the Adviser has contractually agreed to limit the Fund’s expenses, although this limit did not apply because the Fund’s total expenses as shown were below the applicable fee limit.
· For Janus Henderson Responsible International Dividend Fund (formerly the Janus Henderson Dividend & Income Builder Fund), the Trustees noted that, although the Fund’s total expenses exceeded the peer group for one share class, overall the Fund’s total expenses were reasonable. The Trustees also noted that the Adviser has contractually agreed to limit the Fund’s expenses.
Money Market Funds
· For Janus Henderson Government Money Market Fund, the Trustees noted that the Fund’s total expenses were below the peer group average for all share classes.
· For Janus Henderson Money Market Fund, the Trustees noted that the Fund’s total expenses were below the peer group average for all share classes.
Multi-Asset Funds
· For Janus Henderson Adaptive Global Allocation Fund, the Trustees noted that, that the Fund’s total expenses were below the peer group average for all share classes.
· For Janus Henderson Balanced Fund, the Trustees noted that, although the Fund’s total expenses exceeded the peer group average for certain share classes, overall the Fund’s total expenses were reasonable. The Trustees also noted that the Adviser has contractually agreed to limit the Fund’s expenses, although this limit did not apply because the Fund’s total expenses as shown were below the applicable fee limit.
U.S. Equity Funds
· For Janus Henderson Adaptive Risk Managed U.S. Equity Fund, the Trustees noted that, although the Fund’s total expenses exceeded the peer group average for certain share classes, overall the Fund’s total expenses were reasonable. The Trustees also noted that the Adviser has contractually agreed to limit the Fund’s expenses, although this limit did not apply because the Fund’s total expenses as shown were below the applicable fee limit.
· For Janus Henderson Contrarian Fund, the Trustees noted that, although the Fund’s total expenses exceeded the peer group average for all share classes, overall the Fund’s total expenses were reasonable. The Trustees also noted that the Adviser had contractually agreed to limit the Fund’s expenses.
· For Janus Henderson Enterprise Fund, the Trustees noted that, although the Fund’s total expenses exceeded the peer group average for certain share classes, overall the Fund’s total expenses were reasonable. The Trustees also noted that the Adviser has contractually agreed to limit the Fund’s expenses, although this limit did not apply because the Fund’s total expenses as shown were below the applicable fee limit.
Janus Henderson Global Equity Income Fund
Additional Information (unaudited)
· For Janus Henderson Forty Fund, the Trustees noted that, although the Fund’s total expenses exceeded the peer group average for certain share classes, overall the Fund’s total expenses were reasonable. The Trustees also noted that the Adviser has contractually agreed to limit the Fund’s expenses, although this limit did not apply because the Fund’s total expenses as shown were below the applicable fee limit.
· For Janus Henderson Growth and Income Fund, the Trustees noted that, although the Fund’s total expenses exceeded the peer group average for certain share classes, overall the Fund’s total expenses were reasonable. The Trustees also noted that the Adviser has contractually agreed to limit the Fund’s expenses, although this limit did not apply because the Fund’s total expenses as shown were below the applicable fee limit.
· For Janus Henderson Mid Cap Value Fund, the Trustees noted that the Fund’s total expenses were below the peer group average for all share classes.
· For Janus Henderson Research Fund, the Trustees noted that, although the Fund’s total expenses exceeded the peer group average for certain share classes, overall the Fund’s total expenses were reasonable. The Trustees also noted that the Adviser has contractually agreed to limit the Fund’s expenses.
· For Janus Henderson Small Cap Value Fund, the Trustees noted that, although the Fund’s total expenses exceeded the peer group average for one share class, overall the Fund’s total expenses were reasonable. The Trustees also noted that the Adviser has contractually agreed to limit the Fund’s expenses, although this limit did not apply because the Fund’s total expenses as shown were below the applicable fee limit.
· For Janus Henderson Small-Mid Cap Value Fund, the Trustees noted that the Fund’s total expenses were below the peer group average for all share classes.
· For Janus Henderson Triton Fund, the Trustees noted that, although the Fund’s total expenses exceeded the peer group average for one share class, overall the Fund’s total expenses were reasonable. The Trustees also noted that the Adviser has contractually agreed to limit the Fund’s expenses, although this limit did not apply because the Fund’s total expenses as shown were below the applicable fee limit.
· For Janus Henderson Venture Fund, the Trustees noted that although the Fund’s total expenses exceeded the peer group average for one share class, overall the Fund’s total expenses were reasonable. The Trustees also noted that the Adviser has contractually agreed to limit the Fund’s expenses, although this limit did not apply because the Fund’s total expenses as shown were below the applicable fee limit.
The Trustees reviewed information on the overall profitability to the Adviser and its affiliates from their relationships with the Janus Henderson Funds, and considered profitability data of other publicly traded mutual fund advisers. The Trustees recognized that profitability comparisons among fund managers are difficult because of the variation in the type of comparative information that is publicly available, and the profitability of any fund manager is affected by numerous factors, including the organizational structure of the particular fund manager, differences in complex size, difference in product mix, difference in types of business (mutual fund, institutional and other), differences in the types of funds and other accounts it manages, possible other lines of business, the methodology for allocating expenses and the fund manager’s capital structure and cost of capital.
Additionally, the Trustees considered the estimated profitability to the Adviser from the investment management services it provided to each Janus Henderson Fund. In their review, the Trustees considered whether the Adviser receive adequate incentives and resources to manage the Janus Henderson Funds effectively. In reviewing profitability, the Trustees noted that the estimated profitability for an individual Janus Henderson Fund is necessarily a product of the allocation methodology utilized by the Adviser to allocate its expenses as part of the estimated profitability calculation. In this regard, the Trustees noted that the independent fee consultant found as part of its 2022 review that (1) the expense allocation methodology and rationales utilized by the Adviser were reasonable and (2) no clear correlation exists between expense allocations and operating margins. The Trustees also considered that the estimated profitability for an individual Janus Henderson Fund was influenced by a number of factors, including not only the allocation methodology selected, but also the presence of fee waivers and expense caps, and whether the Janus Henderson Fund’s investment management agreement contained breakpoints or a performance fee component. The Trustees determined, after taking into account these factors, among others, that the Adviser’s estimated profitability with respect to each Janus Henderson Fund was not unreasonable in relation to the services provided, and that the variation in the range of such estimated profitability among the Janus Henderson Funds was not a material factor in the Board’s approval of the reasonableness of any Janus Henderson Fund’s investment management fees.
Janus Henderson Global Equity Income Fund
Additional Information (unaudited)
The Trustees concluded that the management fees payable by each Janus Henderson Fund to the Adviser were reasonable in relation to the nature, extent, and quality of the services provided, taking into account the fees charged by other advisers for managing comparable mutual funds with similar strategies, the fees the Adviser charges to other clients, and, as applicable, the impact of fund performance on management fees payable by the Janus Henderson Funds. The Trustees also concluded that each Janus Henderson Fund’s total expenses were reasonable, taking into account the size of the Janus Henderson Fund, the quality of services provided by the Adviser, the investment performance of the Janus Henderson Fund, and any expense limitations agreed to or provided by the Adviser.
Economies of Scale
The Trustees considered information about the potential for the Adviser to realize economies of scale as the assets of the Janus Henderson Funds increase. They noted that their independent fee consultant published a report to the Trustees in June 2022 which provided its research and analysis into economies of scale. They also noted that, although many Janus Henderson Funds pay advisory fees at a fixed base rate as a percentage of net assets, without any breakpoints or performance fees, their independent fee consultant concluded that 75% of these Janus Henderson Funds’ have contractual management fees (gross of waivers) below their Broadridge Expense Group averages. The Trustees also noted the following from the independent fee consultant’s report: (1) that 31% of Janus Henderson Funds had management fee breakpoints in place whereby investors pay lower management fees as fund AUM increases; (2) that 29% of Janus Henderson Funds have low flat-rate fees and performance fees where the Adviser is incentivized to invest in resources which drive Janus Henderson Fund performance; and (3) that 39% of Janus Henderson Funds have low flat-rate fees versus peers where investors pay low fixed fees when the Janus Henderson Fund is small/midsized and higher fees when the Janus Henderson Fund grows in assets. The Trustees also noted that the Janus Henderson Funds share directly in economies of scale through the significant investments made by the Adviser and its affiliates related to services provided to the Funds and the lower charges of third-party service providers that are based in part on the combined scale of all of the Janus Henderson Funds.
The Trustees also considered the independent fee consultant’s conclusion that, given the limitations of various analytical approaches to economies of scale and their conflicting results, it is difficult to analytically confirm or deny the existence of economies of scale in the Janus Henderson complex. In this regard, the independent consultant concluded that (1) to the extent there were economies of scale at the Adviser, the Adviser’s general strategy of setting fixed management fees below peers appeared to share any such economies with investors even on smaller Janus Henderson Funds which have not yet achieved those economies and (2) by setting lower fixed fees from the start on these Janus Henderson Funds, the Adviser appeared to be investing to increase the likelihood that these Janus Henderson Funds will grow to a level to achieve any economies of scale that may exist. Further, the independent fee consultant provided its belief that Janus Henderson Fund investors are well-served by the fee levels and performance fee structures in place on the Janus Henderson Funds in light of any economies of scale that may be present at the Adviser.
Based on all of the information reviewed, including the recent and past research and analysis conducted by the Trustees’ independent fee consultant, the Trustees concluded that the current fee structure of each Janus Henderson Fund was reasonable and that the current rates of fees do reflect a sharing between the Adviser and the Janus Henderson Fund of any economies of scale that may be present at the current asset level of the Janus Henderson Fund.
Other Benefits to the Adviser
The Trustees also considered benefits that accrue to the Adviser and its affiliates from their relationships with the Janus Henderson Funds. They recognized that two affiliates of the Adviser separately serve the Janus Henderson Funds as transfer agent and distributor, respectively, and the transfer agent receives compensation directly from the non-money market Janus Henderson Funds for services provided, and that such compensation contributes to the overall profitability of the Adviser and its affiliates that results from their relationship with the Janus Henderson Funds. The Trustees also considered the Adviser’s past and proposed use of commissions paid by the Janus Henderson Funds on portfolio brokerage transactions to obtain proprietary and third-party research products and services benefiting the Janus Henderson Fund and/or other clients of the Adviser and/or the Adviser. The Trustees concluded that the Adviser’s use of these types of client commission arrangements to obtain proprietary and third-party research products and services was consistent with regulatory requirements and guidelines and was likely to benefit each Janus Henderson Fund. The Trustees also concluded that, other than the services provided by the Adviser and its affiliates pursuant to the agreements and the fees to be paid by each Janus Henderson Fund therefor, the Janus Henderson
Janus Henderson Global Equity Income Fund
Additional Information (unaudited)
Funds and the Adviser may potentially benefit from their relationship with each other in other ways. They concluded that the Adviser and its affiliates share directly in economies of scale through the lower charges of third-party service providers that are based in part on the combined scale of the Janus Henderson Funds and other clients serviced by the Adviser and its affiliates. They also concluded that the Adviser benefits from the receipt of research products and services acquired through commissions paid on portfolio transactions of the Janus Henderson Funds and that the Janus Henderson Funds benefit from the Adviser’s receipt of those products and services as well as research products and services acquired through commissions paid by other clients of the Adviser. They further concluded that the success of any Janus Henderson Fund could attract other business to the Adviser or other Janus Henderson Funds, and that the success of the Adviser could enhance the Adviser’s ability to serve the Janus Henderson Funds.
Janus Henderson Global Equity Income Fund
Liquidity Risk Management Program (unaudited)
Liquidity Risk Management Program
Rule 22e-4 under the Investment Company Act of 1940, as amended (the “Liquidity Rule”), requires open-end funds (but not money market funds) to adopt and implement a written liquidity risk management program (the “LRMP”) that is reasonably designed to assess and manage liquidity risk, which is the risk that a fund could not meet redemption requests without significant dilution of remaining investors’ interest in the fund. The Fund has implemented a LRMP, which incorporates the following elements: (i) assessment, management, and periodic review of liquidity risk; (ii) classification of portfolio holdings; (iii) the establishment and monitoring of a highly liquid investment minimum, as applicable; (iv) a 15% limitation on a Fund’s illiquid investments; (v) redemptions in-kind; and (vi) board oversight.
The Trustees of the Fund (the “Trustees”) have designated Janus Henderson Investors US LLC, the Fund’s investment adviser (the “Adviser”), as the Program Administrator for the LRMP responsible for administering the LRMP and carrying out the specific responsibilities of the LRMP. A working group comprised of various teams within the Adviser’s business is responsible for administering the LRMP and carrying out the specific responsibilities of different aspects of the LRMP (the “Liquidity Risk Working Group”). In assessing each Fund’s liquidity risk, the Liquidity Risk Working Group periodically considers, as relevant, factors including (i) the liquidity of a Fund’s portfolio investments during normal and reasonably foreseeable stressed conditions; (ii) whether a Fund’s investment strategy is appropriate for an open-end fund; (iii) the extent to which a Fund’s strategy involves a relatively concentrated portfolio or large positions in any issuer; (iv) a Fund’s use of borrowing for investment purposes; and (v) a Fund’s use of derivatives.
The Liquidity Rule requires the Trustees to review at least annually a written report provided by the Program Administrator that addresses the operation of the LRMP and assesses its adequacy and the effectiveness of its implementation, including, if applicable, the operation of the highly liquid investment minimum, and any material changes to the LRMP (the “Program Administrator Report”). At a meeting held on March 15, 2023, the Adviser provided the Program Administrator Report to the Trustees which covered the operation of the LRMP from January 1, 2022 through December 31, 2022 (the “Reporting Period”).
The Program Administrator Report discussed the operation and effectiveness of the LRMP during the Reporting Period. Among other things, the Program Administrator Report indicated that there were no material changes to the LRMP during the Reporting Period, although there were certain methodology adjustments implemented relating to a change in data provider. Additionally, the findings presented in the Program Administrator Report indicated that the LRMP operated adequately during the Reporting Period. These findings included that the Fund was able to meet redemptions during the normal course of business during the Reporting Period. The Program Administrator Report also stated that the Fund did not exceed the 15% limit on illiquid assets during the Reporting Period, that the Fund held primarily highly liquid assets, and was considered to be a primarily highly liquid fund during the Reporting Period. Also included among the Program Administrator Report’s findings was the determination that the Fund’s investment strategy remains appropriate for an open-end fund. In addition, the Adviser expressed its belief in the Program Administrator Report that the LRMP is reasonably designed and adequate to assess and manage the Fund’s liquidity risk, considering the Fund’s particular risks and circumstances, and includes policies and procedures reasonably designed to implement each required component of the Liquidity Rule.
There can be no assurance that the LRMP will achieve its objectives in the future. Please refer to your Fund’s prospectus for more information regarding the risks to which an investment in the Fund may be subject.
Janus Henderson Global Equity Income Fund
Useful Information About Your Fund Report (unaudited)
Performance Overviews
Performance overview graphs compare the performance of a hypothetical $10,000 investment in the Fund with one or more widely used market indices. When comparing the performance of the Fund with an index, keep in mind that market indices are not available for investment and do not reflect deduction of expenses.
Average annual total returns are quoted for a Fund with more than one year of performance history. Average annual total return is calculated by taking the growth or decline in value of an investment over a period of time, including reinvestment of dividends and distributions, then calculating the annual compounded percentage rate that would have produced the same result had the rate of growth been constant throughout the period. Average annual total return does not reflect the deduction of taxes that a shareholder would pay on Fund distributions or redemptions of Fund shares.
Cumulative total returns are quoted for a Fund with less than one year of performance history. Cumulative total return is the growth or decline in value of an investment over time, independent of the period of time involved. Cumulative total return does not reflect the deduction of taxes that a shareholder would pay on Fund distributions or redemptions of Fund shares.
Pursuant to federal securities rules, expense ratios shown in the performance chart reflect subsidized (if applicable) and unsubsidized ratios. The total annual fund operating expenses ratio is gross of any fee waivers, reflecting the Fund’s unsubsidized expense ratio. The net annual fund operating expenses ratio (if applicable) includes contractual waivers of the Adviser and reflects the Fund’s subsidized expense ratio. Ratios may be higher or lower than those shown in the “Financial Highlights” in this report.
Schedule of Investments
Following the performance overview section is the Fund’s Schedule of Investments. This schedule reports the types of securities held in the Fund on the last day of the reporting period. Securities are usually listed by type (common stock, corporate bonds, U.S. Government obligations, etc.) and by industry classification (banking, communications, insurance, etc.). Holdings are subject to change without notice.
The value of each security is quoted as of the last day of the reporting period. The value of securities denominated in foreign currencies is converted into U.S. dollars.
If the Fund invests in foreign securities, it will also provide a summary of investments by country. This summary reports the Fund exposure to different countries by providing the percentage of securities invested in each country. The country of each security represents the country of risk. A company may be allocated to a country based on other factors such as location of the company’s principal office, the location of the principal trading market for the company’s securities, or the country where a majority of the company’s revenues are derived. The Fund’s Schedule of Investments relies upon the industry group and country classifications published by Bloomberg and/or MSCI Inc.
Tables listing details of individual forward currency contracts, futures, written options, swaptions, and swaps follow the Fund’s Schedule of Investments (if applicable).
Statement of Assets and Liabilities
This statement is often referred to as the “balance sheet.” It lists the assets and liabilities of the Fund on the last day of the reporting period.
The Fund’s assets are calculated by adding the value of the securities owned, the receivable for securities sold but not yet settled, the receivable for dividends declared but not yet received on securities owned, and the receivable for Fund shares sold to investors but not yet settled. The Fund’s liabilities include payables for securities purchased but not yet settled, Fund shares redeemed but not yet paid, and expenses owed but not yet paid. Additionally, there may be other assets and liabilities such as unrealized gain or loss on forward currency contracts.
The section entitled “Net Assets Consist of” breaks down the components of the Fund’s net assets. Because the Fund must distribute substantially all earnings, you will notice that a significant portion of net assets is shareholder capital.
The last section of this statement reports the net asset value (“NAV”) per share on the last day of the reporting period. The NAV is calculated by dividing the Fund’s net assets for each share class (assets minus liabilities) by the number of shares outstanding.
Janus Henderson Global Equity Income Fund
Useful Information About Your Fund Report (unaudited)
Statement of Operations
This statement details the Fund’s income, expenses, realized gains and losses on securities and currency transactions, and changes in unrealized appreciation or depreciation of Fund holdings.
The first section in this statement, entitled “Investment Income,” reports the dividends earned from securities and interest earned from interest-bearing securities in the Fund.
The next section reports the expenses incurred by the Fund, including the advisory fee paid to the investment adviser, transfer agent fees and expenses, and printing and postage for mailing statements, financial reports and prospectuses. Expense offsets and expense reimbursements, if any, are also shown.
The last section lists the amounts of realized gains or losses from investment and foreign currency transactions, and changes in unrealized appreciation or depreciation of investments and foreign currency-denominated assets and liabilities. The Fund will realize a gain (or loss) when it sells its position in a particular security. A change in unrealized gain (or loss) refers to the change in net appreciation or depreciation of the Fund during the reporting period. “Net Realized and Unrealized Gain/(Loss) on Investments” is affected both by changes in the market value of Fund holdings and by gains (or losses) realized during the reporting period.
Statements of Changes in Net Assets
These statements report the increase or decrease in the Fund’s net assets during the reporting period. Changes in the Fund’s net assets are attributable to investment operations, dividends and distributions to investors, and capital share transactions. This is important to investors because it shows exactly what caused the Fund’s net asset size to change during the period.
The first section summarizes the information from the Statement of Operations regarding changes in net assets due to the Fund’s investment operations. The Fund’s net assets may also change as a result of dividend and capital gains distributions to investors. If investors receive their dividends and/or distributions in cash, money is taken out of the Fund to pay the dividend and/or distribution. If investors reinvest their dividends and/or distributions, the Fund’s net assets will not be affected.
The reinvestment of dividends and distributions is included under “Capital Share Transactions.” “Capital Shares” refers to the money investors contribute to the Fund through purchases or withdrawals via redemptions. The Fund’s net assets will increase and decrease in value as investors purchase and redeem shares from the Fund.
Financial Highlights
This schedule provides a per-share breakdown of the components that affect the Fund’s NAV for current and past reporting periods as well as total return, asset size, ratios, and portfolio turnover rate.
The first line in the table reflects the NAV per share at the beginning of the reporting period. The next line reports the net investment income/(loss) per share. Following is the per share total of net gains/(losses), realized and unrealized. Per share dividends and distributions to investors are then subtracted to arrive at the NAV per share at the end of the period. The next line reflects the total return for the period. The total return may include adjustments in accordance with generally accepted accounting principles required at the period end for financial reporting purposes. As a result, the total return may differ from the total return reflected for individual shareholder transactions. Also included are ratios of expenses and net investment income to average net assets.
The Fund’s expenses may be reduced through expense offsets and expense reimbursements. The ratios shown reflect expenses before and after any such offsets and reimbursements.
The ratio of net investment income/(loss) summarizes the income earned less expenses, divided by the average net assets of the Fund during the reporting period. Do not confuse this ratio with the Fund’s yield. The net investment income ratio is not a true measure of the Fund’s yield because it does not take into account the dividends distributed to the Fund’s investors.
The next figure is the portfolio turnover rate, which measures the buying and selling activity in the Fund. Portfolio turnover is affected by market conditions, changes in the asset size of the Fund, fluctuating volume of shareholder purchase and redemption orders, the nature of the Fund’s investments, and the investment style and/or outlook of the portfolio manager(s) and/or investment personnel. A 100% rate implies that an amount equal to the value of the entire portfolio was replaced once during the fiscal year; a 50% rate means that an amount equal to the value of half the
Janus Henderson Global Equity Income Fund
Useful Information About Your Fund Report (unaudited)
portfolio is traded in a year; and a 200% rate means that an amount equal to the value of the entire portfolio is traded every six months.
| | | | | | | | |
| | | | | |

| | | | |
This report is submitted for the general information of shareholders of the Fund. It is not an offer or solicitation for the Fund and is not authorized for distribution to prospective investors unless preceded or accompanied by an effective prospectus. |
Janus Henderson is a trademark of Janus Henderson Group plc or one of its subsidiaries. © Janus Henderson Group plc. Janus Henderson Group is the ultimate parent of Janus Henderson Distributors US LLC. Janus Henderson Distributors US LLC |
| | | | 125-24-93081 05-23 |
| | | | |
| | | |
| | | SEMIANNUAL REPORT March 31, 2023 |
| | |
| | Janus Henderson Global Life Sciences Fund |
| | |
| | Janus Investment Fund |
| |
| | | HIGHLIGHTS · Investment strategy behind your fund · Fund performance, characteristics
and holdings |
Table of Contents
Janus Henderson Global Life Sciences Fund
| | | | | | |
| | | | | 
Daniel Lyons co-portfolio manager | 
Andy Acker co-portfolio manager |
| | | |
Janus Henderson Global Life Sciences Fund (unaudited)
Fund At A Glance
March 31, 2023
| | | | | | | | | | |
| | | | | | | | | |
| | | | | | | | | |
| | | | | | | | | |
| 5 Top Contributors - Holdings | 5 Top Detractors - Holdings |
| | Average
Weight | | Relative
Contribution | | | Average
Weight | | Relative
Contribution |
| Johnson & Johnson | 1.08% | | 0.85% | | Novo Nordisk A/S | 1.78% | | -0.51% |
| Horizon Therapeutics PLC | 0.76% | | 0.58% | | Centene Corp | 1.66% | | -0.36% |
| Pfizer Inc | 1.25% | | 0.42% | | Altimmune Inc | 0.26% | | -0.26% |
| Sarepta Therapeutics Inc | 2.54% | | 0.40% | | Harmony Biosciences Holdings Inc | 0.43% | | -0.20% |
| Biomea Fusion Inc | 0.17% | | 0.37% | | Neurocrine Biosciences Inc | 1.19% | | -0.16% |
| | | | | | | |
| 1 Top Contributors - Sectors* | | | | | |
| | | Relative | | Fund | MSCI World Health Care Index |
| | | Contribution | | Average Weight | Average Weight |
| Health Care | | 1.27% | | 99.30% | 100.00% |
| | | | | | |
| | | | | | |
| 1 Top Detractors - Sectors* | | | | | |
| | | Relative | | Fund | MSCI World Health Care Index |
| | | Contribution | | Average Weight | Average Weight |
| Other** | | -0.10% | | 0.70% | 0.00% |
| | | | | | | |
| Relative contribution reflects how the portolio's holdings impacted return relative to the benchmark. Cash and securities not held in the portfolio are not shown. For equity portfolios, relative contribution compares the performance of a security in the portfolio to the benchmark's total return, factoring in the difference in weight of that security in the benchmark. Returns are calculated using daily returns and previous day ending weights rolled up by ticker, excluding fixed income securities, gross of advisory fees, may exclude certain derivatives and will differ from actual performance.
Performance attribution reflects returns gross of advisory fees and may differ from actual returns as they are based on end of day holdings. Attribution is calculated by geometrically linking daily returns for the portfolio and index. |
* | Based on sector classification according to the Global Industry Classification Standard (“GICS”) codes, which are the exclusive property and a service mark of MSCI Inc. and Standard & Poor’s. |
** | Not a GICS classified sector. |
Janus Henderson Global Life Sciences Fund (unaudited)
Fund At A Glance
March 31, 2023
| | |
5 Largest Equity Holdings - (% of Net Assets) |
UnitedHealth Group Inc | |
Health Care Providers & Services | 6.1% |
AstraZeneca PLC | |
Pharmaceuticals | 4.4% |
AbbVie Inc | |
Biotechnology | 3.4% |
Sanofi | |
Pharmaceuticals | 3.1% |
Eli Lilly & Co | |
Pharmaceuticals | 2.9% |
| | 19.9% |
| | | | | | |
Asset Allocation - (% of Net Assets) | |
Common Stocks | | 97.6% | |
Private Placements | | 1.9% | |
Investment Companies | | 0.4% | |
Investments Purchased with Cash Collateral from Securities Lending | | 0.3% | |
Warrants | | 0.0% | |
Rights | | 0.0% | |
Other | | (0.2)% |
| | | 100.0% |
| | |
Top Country Allocations - Long Positions - (% of Investment Securities) |
As of March 31, 2023 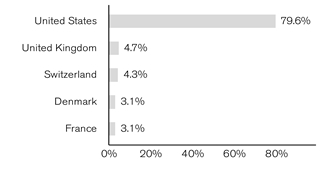
| As of September 30, 2022 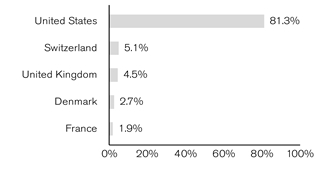
|
Janus Henderson Global Life Sciences Fund (unaudited)
Performance
| |
See important disclosures on the next page. |
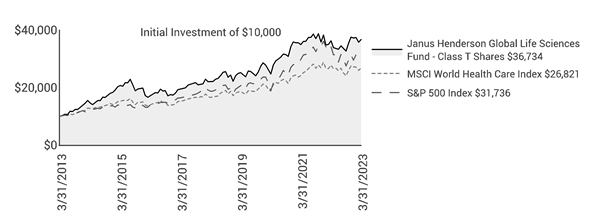
| | | | | | | | | | | |
| | | | | | | | | |
| | | | | | | | | | |
Average Annual Total Return - for the periods ended March 31, 2023 | | | Prospectus Expense Ratios |
| | Fiscal
Year-to-Date | One
Year | Five
Year | Ten
Year | Since
Inception* | | | Total Annual Fund
Operating Expenses‡ |
Class A Shares at NAV | | 12.51% | 1.18% | 10.66% | 13.80% | 11.11% | | | 0.98% |
Class A Shares at MOP | | 6.04% | -4.63% | 9.36% | 13.13% | 10.83% | | | |
Class C Shares at NAV | | 12.13% | 0.49% | 9.88% | 12.96% | 10.29% | | | 1.76% |
Class C Shares at CDSC | | 11.13% | -0.51% | 9.88% | 12.96% | 10.29% | | | |
Class D Shares | | 12.60% | 1.36% | 10.85% | 14.00% | 11.28% | | | 0.80% |
Class I Shares | | 12.62% | 1.40% | 10.91% | 14.06% | 11.32% | | | 0.76% |
Class N Shares | | 12.67% | 1.49% | 11.00% | 14.03% | 11.28% | | | 0.67% |
Class S Shares | | 12.38% | 0.97% | 10.44% | 13.60% | 10.93% | | | 1.18% |
Class T Shares | | 12.54% | 1.26% | 10.74% | 13.90% | 11.23% | | | 0.92% |
MSCI World Health Care Index | | 11.33% | -3.69% | 10.12% | 10.37% | 6.71% | | | |
S&P 500 Index | | 15.62% | -7.73% | 11.19% | 12.24% | 7.09% | | | |
Morningstar Quartile - Class T Shares | | - | 1st | 1st | 1st | 1st | | | |
Morningstar Ranking - based on total returns for Health Funds | | - | 16/176 | 24/134 | 10/125 | 8/57 | | | |
Returns quoted are past performance and do not guarantee future results; current performance may be lower or higher. Investment returns and principal value will vary; there may be a gain or loss when shares are sold. For the most recent month-end performance call 800.668.0434 (or 800.525.3713 if you hold shares directly with Janus Henderson) or visit janushenderson.com/performance (or janushenderson.com/allfunds if you hold shares directly with Janus Henderson).
Maximum Offering Price (MOP) returns include the maximum sales charge of 5.75%. Net Asset Value (NAV) returns exclude this charge, which would have reduced returns.
CDSC returns include a 1% contingent deferred sales charge (CDSC) on Shares redeemed within 12 months of purchase. Net Asset Value (NAV) returns exclude this charge, which would have reduced returns.
Performance may be affected by risks that include those associated with foreign and emerging markets, fixed income securities, high-yield and high-risk securities, undervalued, overlooked and smaller capitalization companies, real estate related securities including Real Estate Investment Trusts (REITs), Environmental, Social and Governance (ESG) factors, non-diversification, portfolio turnover, derivatives, short sales, initial public offerings (IPOs) and potential conflicts of interest. Each product has different risks. Please see the prospectus for more information about risks, holdings and other details.
Janus Henderson Global Life Sciences Fund (unaudited)
Performance
Returns include reinvestment of all dividends and distributions and do not reflect the deduction of taxes that a shareholder would pay on Fund distributions or redemptions of Fund shares. The returns do not include adjustments in accordance with generally accepted accounting principles required at the period end for financial reporting purposes.
Class A Shares, Class C Shares, and Class S Shares commenced operations on July 6, 2009. Performance shown for each class for periods prior to July 6, 2009, reflects the performance of the Fund’s Class J Shares, the initial share class (renamed Class T Shares effective February 16, 2010), calculated using the fees and expenses of each respective class, without the effect of any fee and expense limitations or waivers.
Class D Shares commenced operations on February 16, 2010. Performance shown for periods prior to February 16, 2010, reflects the performance of the Fund’s former Class J Shares, calculated using the fees and expenses in effect during the periods shown, net of any applicable fee and expense limitations or waivers.
Class I Shares commenced operations on July 6, 2009. Performance shown for periods prior to July 6, 2009, reflects the performance of the Fund’s former Class J Shares, calculated using the fees and expenses of Class J Shares, net of any applicable fee and expense limitations or waivers.
Class N Shares of the Fund commenced operations on January 26, 2018. Performance shown for Class N Shares for periods prior to January 26, 2018, reflects the historical performance of the Fund's Class T Shares, calculated using the fees and expenses of Class T Shares, net of any applicable fee and expense limitations or waivers.
If each share class of the Fund had been available during periods prior to its commencement, the performance shown may have been different. The performance shown for periods following the Fund’s commencement of each share class reflects the fees and expenses of each respective share class, net of any applicable fee and expense limitations or waivers. Please refer to the Fund’s prospectuses for further details concerning historical performance.
Ranking is for the share class shown only; other classes may have different performance characteristics.
© 2023 Morningstar, Inc. All Rights Reserved.
There is no assurance that the investment process will consistently lead to successful investing.
See Notes to Schedule of Investments and Other Information for index definitions.
Index performance does not reflect the expenses of managing a portfolio as an index is unmanaged and not available for direct investment.
See “Useful Information About Your Fund Report.”
*The Fund’s inception date – December 31, 1998
‡ As stated in the prospectus. See Financial Highlights for actual expense ratios during the reporting period.
Janus Henderson Global Life Sciences Fund (unaudited)
Expense Examples
As a shareholder of the Fund, you incur two types of costs: (1) transaction costs, such as sales charges (loads) on purchase payments (applicable to Class A Shares only); and (2) ongoing costs, including management fees; 12b-1 distribution and shareholder servicing fees; transfer agent fees and expenses payable pursuant to the Transfer Agency Agreement; and other Fund expenses. This example is intended to help you understand your ongoing costs (in dollars) of investing in the Fund and to compare these costs with the ongoing costs of investing in other mutual funds. To do so, compare this 5% hypothetical example with the 5% hypothetical examples that appear in the shareholder reports of the other funds. The example is based upon an investment of $1,000 invested at the beginning of the period and held for the six-months indicated, unless noted otherwise in the table and footnotes below.
Actual Expenses
The information in the table under the heading “Actual” provides information about actual account values and actual expenses. You may use the information in these columns, together with the amount you invested, to estimate the expenses that you paid over the period. Simply divide your account value by $1,000 (for example, an $8,600 account value divided by $1,000 = 8.6), then multiply the result by the number in the appropriate column for your share class under the heading entitled “Expenses Paid During Period” to estimate the expenses you paid on your account during the period.
Hypothetical Example for Comparison Purposes
The information in the table under the heading “Hypothetical (5% return before expenses)” provides information about hypothetical account values and hypothetical expenses based upon the Fund’s actual expense ratio and an assumed rate of return of 5% per year before expenses, which is not the Fund’s actual return. The hypothetical account values and expenses may not be used to estimate the actual ending account balance or expenses you paid for the period. You may use this information to compare the ongoing costs of investing in the Fund and other funds. To do so, compare this 5% hypothetical example with the 5% hypothetical examples that appear in the shareholder reports of the other funds. Additionally, for an analysis of the fees associated with an investment in any share class or other similar funds, please visit www.finra.org/fundanalyzer.
Please note that the expenses shown in the table are meant to highlight your ongoing costs only and do not reflect any transaction costs. These fees are fully described in the Fund’s prospectuses. Therefore, the hypothetical examples are useful in comparing ongoing costs only, and will not help you determine the relative total costs of owning different funds. In addition, if these transaction costs were included, your costs would have been higher.
| | | | | | | | | | | |
| | | | | | | | |
| | | Actual | | Hypothetical
(5% return before expenses) | |
| Beginning
Account
Value
(10/1/22) | Ending
Account
Value
(3/31/23) | Expenses
Paid During
Period
(10/1/22 - 3/31/23)† | | Beginning
Account
Value
(10/1/22) | Ending
Account
Value
(3/31/23) | Expenses
Paid During
Period
(10/1/22 - 3/31/23)† | Net Annualized
Expense Ratio
(10/1/22 - 3/31/23) |
Class A Shares | $1,000.00 | $1,125.10 | $5.19 | | $1,000.00 | $1,020.04 | $4.94 | 0.98% |
Class C Shares | $1,000.00 | $1,121.30 | $8.73 | | $1,000.00 | $1,016.70 | $8.30 | 1.65% |
Class D Shares | $1,000.00 | $1,126.00 | $4.24 | | $1,000.00 | $1,020.94 | $4.03 | 0.80% |
Class I Shares | $1,000.00 | $1,126.20 | $4.08 | | $1,000.00 | $1,021.09 | $3.88 | 0.77% |
Class N Shares | $1,000.00 | $1,126.70 | $3.61 | | $1,000.00 | $1,021.54 | $3.43 | 0.68% |
Class S Shares | $1,000.00 | $1,123.80 | $6.25 | | $1,000.00 | $1,019.05 | $5.94 | 1.18% |
Class T Shares | $1,000.00 | $1,125.40 | $4.77 | | $1,000.00 | $1,020.44 | $4.53 | 0.90% |
† | Expenses Paid During Period are equal to the Net Annualized Expense Ratio multiplied by the average account value over the period, multiplied by 182/365 (to reflect the one-half year period). Expenses in the examples include the effect of applicable fee waivers and/or expense reimbursements, if any. Had such waivers and/or reimbursements not been in effect, your expenses would have been higher. Please refer to the Notes to Financial Statements or the Fund’s prospectuses for more information regarding waivers and/or reimbursements. |
Janus Henderson Global Life Sciences Fund
Schedule of Investments (unaudited)
March 31, 2023
| | | | | | | | |
Shares or
Principal Amounts | | | Value | |
Common Stocks– 97.6% | | | |
Biotechnology – 30.1% | | | |
| | 4D Molecular Therapeutics Inc* | | 549,928 | | | $9,453,262 | |
| | 89bio Inc*,# | | 1,164,949 | | | 17,742,173 | |
| | AbbVie Inc | | 992,569 | | | 158,185,722 | |
| | Akero Therapeutics Inc* | | 1,150,365 | | | 44,012,965 | |
| | Alnylam Pharmaceuticals Inc* | | 115,338 | | | 23,104,508 | |
| | Amgen Inc | | 209,039 | | | 50,535,178 | |
| | Amicus Therapeutics Inc* | | 2,483,178 | | | 27,538,444 | |
| | Apellis Pharmaceuticals Inc* | | 883,429 | | | 58,270,977 | |
| | Arcellx Inc* | | 449,108 | | | 13,837,017 | |
| | Ardelyx, Inc.* | | 4,865,807 | | | 23,307,216 | |
| | Argenx SE (ADR)* | | 230,441 | | | 85,857,708 | |
| | Ascendis Pharma A/S (ADR)* | | 454,846 | | | 48,768,588 | |
| | Bicycle Therapeutics Ltd (ADR)*,# | | 520,993 | | | 11,081,521 | |
| | Biohaven Ltd* | | 1,309,985 | | | 17,894,395 | |
| | BioMarin Pharmaceutical Inc* | | 590,697 | | | 57,439,376 | |
| | Biomea Fusion Inc*,# | | 879,566 | | | 27,275,342 | |
| | CANbridge Pharmaceuticals Inc* | | 3,475,000 | | | 899,157 | |
| | Cerevel Therapeutics Holdings Inc* | | 418,459 | | | 10,206,215 | |
| | Cytokinetics Inc* | | 515,314 | | | 18,133,900 | |
| | Design Therapeutics Inc* | | 393,404 | | | 2,269,941 | |
| | Disc Medicine Inc*,§ | | 118,870 | | | 2,392,913 | |
| | Gilead Sciences Inc | | 341,929 | | | 28,369,849 | |
| | Immunogen Inc* | | 4,825,450 | | | 18,529,728 | |
| | Insmed Inc* | | 806,174 | | | 13,745,267 | |
| | IVERIC bio Inc* | | 975,712 | | | 23,739,073 | |
| | Janux Therapeutics Inc* | | 576,349 | | | 6,973,823 | |
| | Leap Therapeutics Inc* | | 599,269 | | | 203,751 | |
| | Legend Biotech Corp (ADR)* | | 558,327 | | | 26,922,528 | |
| | Madrigal Pharmaceuticals Inc* | | 29,858 | | | 7,233,399 | |
| | Neurocrine Biosciences Inc* | | 446,607 | | | 45,205,561 | |
| | Olema Pharmaceuticals Inc* | | 412,827 | | | 1,432,510 | |
| | Prothena Corp PLC* | | 450,767 | | | 21,848,676 | |
| | PTC Therapeutics Inc* | | 995,854 | | | 48,239,168 | |
| | Regeneron Pharmaceuticals Inc* | | 43,553 | | | 35,786,194 | |
| | Rhythm Pharmaceuticals Inc* | | 505,324 | | | 9,014,980 | |
| | Roivant Sciences Ltd* | | 1,375,950 | | | 10,154,511 | |
| | Sage Therapeutics Inc* | | 157,158 | | | 6,594,350 | |
| | Sarepta Therapeutics Inc* | | 800,017 | | | 110,266,343 | |
| | Seres Therapeutics Inc* | | 3,030,234 | | | 17,181,427 | |
| | Travere Therapeutics Inc* | | 1,481,864 | | | 33,327,121 | |
| | United Therapeutics Corp* | | 195,922 | | | 43,878,691 | |
| | Vaxcyte Inc* | | 1,247,206 | | | 46,745,281 | |
| | Vertex Pharmaceuticals Inc* | | 335,349 | | | 105,658,409 | |
| | Zai Lab Ltd (ADR)* | | 780,326 | | | 25,953,643 | |
| | | 1,395,210,801 | |
Health Care Equipment & Supplies – 16.1% | | | |
| | Abbott Laboratories | | 1,191,636 | | | 120,665,061 | |
| | Align Technology Inc* | | 118,317 | | | 39,534,442 | |
| | Boston Scientific Corp* | | 2,121,276 | | | 106,127,438 | |
| | Cooper Cos Inc | | 126,348 | | | 47,173,289 | |
| | Dentsply Sirona Inc | | 594,205 | | | 23,340,372 | |
| | DexCom Inc* | | 300,367 | | | 34,896,638 | |
| | Edwards Lifesciences Corp* | | 561,826 | | | 46,479,865 | |
| | Globus Medical Inc* | | 655,881 | | | 37,149,100 | |
| | ICU Medical Inc* | | 76,221 | | | 12,573,416 | |
| | Insulet Corp* | | 28,989 | | | 9,246,331 | |
| | Intuitive Surgical Inc* | | 144,067 | | | 36,804,797 | |
| | Medtronic PLC | | 563,532 | | | 45,431,950 | |
| | Penumbra Inc* | | 147,165 | | | 41,013,414 | |
| | |
See Notes to Schedule of Investments and Other Information and Notes to Financial Statements. |
| |
6 | MARCH 31, 2023 |
Janus Henderson Global Life Sciences Fund
Schedule of Investments (unaudited)
March 31, 2023
| | | | | | | | |
Shares or
Principal Amounts | | | Value | |
Common Stocks– (continued) | | | |
Health Care Equipment & Supplies– (continued) | | | |
| | STERIS PLC | | 178,264 | | | $34,098,338 | |
| | Stryker Corp | | 243,674 | | | 69,561,617 | |
| | Tandem Diabetes Care Inc* | | 240,120 | | | 9,751,273 | |
| | Teleflex Inc | | 138,183 | | | 35,003,136 | |
| | | 748,850,477 | |
Health Care Providers & Services – 13.1% | | | |
| | AmerisourceBergen Corp | | 351,884 | | | 56,340,147 | |
| | Anthem Inc | | 174,520 | | | 80,246,041 | |
| | Centene Corp* | | 1,008,515 | | | 63,748,233 | |
| | Humana Inc | | 179,012 | | | 86,903,166 | |
| | NeoGenomics Inc* | | 1,548,121 | | | 26,952,787 | |
| | Privia Health Group Inc* | | 397,908 | | | 10,986,240 | |
| | UnitedHealth Group Inc | | 601,660 | | | 284,338,499 | |
| | | 609,515,113 | |
Life Sciences Tools & Services – 6.9% | | | |
| | Danaher Corp | | 397,295 | | | 100,134,232 | |
| | ICON PLC* | | 78,487 | | | 16,764,038 | |
| | Illumina Inc* | | 247,509 | | | 57,558,218 | |
| | IQVIA Holdings Inc* | | 155,750 | | | 30,977,118 | |
| | SomaLogic Inc* | | 742,445 | | | 1,893,235 | |
| | Thermo Fisher Scientific Inc | | 195,416 | | | 112,631,920 | |
| | | 319,958,761 | |
Pharmaceuticals – 31.4% | | | |
| | Astellas Pharma Inc | | 2,912,900 | | | 41,438,906 | |
| | AstraZeneca PLC | | 1,484,728 | | | 206,046,294 | |
| | Avadel Pharmaceuticals PLC (ADR)* | | 1,672,778 | | | 15,322,646 | |
| | Bayer AG | | 725,102 | | | 46,181,815 | |
| | Bristol-Myers Squibb Co | | 1,207,977 | | | 83,724,886 | |
| | Catalent Inc* | | 637,882 | | | 41,915,226 | |
| | Collegium Pharmaceutical Inc* | | 528,688 | | | 12,683,225 | |
| | CymaBay Therapeutics Inc* | | 1,617,273 | | | 14,102,621 | |
| | DICE Therapeutics Inc* | | 368,500 | | | 10,557,525 | |
| | Edgewise Therapeutics Inc* | | 86,981 | | | 580,163 | |
| | Eli Lilly & Co | | 390,058 | | | 133,953,718 | |
| | Intra-Cellular Therapies Inc* | | 201,165 | | | 10,893,085 | |
| | Jazz Pharmaceuticals PLC* | | 284,369 | | | 41,611,716 | |
| | Johnson & Johnson | | 281,731 | | | 43,668,305 | |
| | Merck & Co Inc | | 1,213,487 | | | 129,102,882 | |
| | Novartis AG (ADR) | | 1,213,663 | | | 111,656,996 | |
| | Novo Nordisk A/S | | 604,552 | | | 95,948,401 | |
| | Organon & Co | | 1,572,845 | | | 36,993,314 | |
| | Pfizer Inc | | 1,247,771 | | | 50,909,057 | |
| | Roche Holding AG | | 315,363 | | | 90,277,579 | |
| | Royalty Pharma PLC - Class A | | 968,295 | | | 34,887,669 | |
| | Sanofi | | 1,303,831 | | | 141,976,748 | |
| | Takeda Pharmaceutical Co Ltd | | 748,736 | | | 24,595,489 | |
| | Ventyx Biosciences Inc* | | 522,757 | | | 17,512,360 | |
| | Zoetis Inc | | 114,080 | | | 18,987,475 | |
| | | 1,455,528,101 | |
Total Common Stocks (cost $3,089,082,759) | | 4,529,063,253 | |
Private Placements– 1.9% | | | |
Biotechnology – 1.2% | | | |
| | ACELYRIN Inc*,¢,§ | | 988,781 | | | 6,150,317 | |
| | ACELYRIN Inc (Indemnity Holdback Shares)*,¢,§ | | 120,152 | | | 373,679 | |
| | Arbor Biotechnologies Inc*,¢,§ | | 156,426 | | | 2,591,979 | |
| | Asher Biotherapeutics Inc*,¢,§ | | 1,214,301 | | | 1,951,139 | |
| | Attralus Inc*,¢,§ | | 669,935 | | | 3,483,662 | |
| | Curevo Inc*,¢,§ | | 2,031,087 | | | 5,330,344 | |
| | |
See Notes to Schedule of Investments and Other Information and Notes to Financial Statements. |
| |
Janus Investment Fund | 7 |
Janus Henderson Global Life Sciences Fund
Schedule of Investments (unaudited)
March 31, 2023
| | | | | | | | |
Shares or
Principal Amounts | | | Value | |
Private Placements– (continued) | | | |
Biotechnology– (continued) | | | |
| | Element Biosciences Inc*,¢,§ | | 425,023 | | | $6,991,628 | |
| | HemoShear Therapeutics LLC*,¢,§ | | 289,280 | | | 2,109,430 | |
| | Leap Therapeutics Inc*,§ | | 3,666 | | | 1,246,440 | |
| | Leap Therapeutics Inc (Indemnity Holdback Shares)*,¢,§ | | 475 | | | 80,750 | |
| | LEXEO Therapeutics Inc - Series A*,¢,§ | | 3,643,715 | | | 6,268,975 | |
| | LEXEO Therapeutics Inc - Series B*,¢,§ | | 883,469 | | | 1,520,000 | |
| | Shoreline Biosciences Inc*,¢,§ | | 747,187 | | | 6,017,769 | |
| | Sonoma Biotherapeutics Inc - Series B*,¢,§ | | 1,924,628 | | | 5,705,560 | |
| | Synthekine Inc*,¢,§ | | 2,192,937 | | | 5,661,001 | |
| | TwinStrand Biosciences Inc*,¢,§ | | 344,314 | | | 749,606 | |
| | | 56,232,279 | |
Health Care Providers & Services – 0.3% | | | |
| | Bigfoot Biomedical Inc - Series B*,¢,§ | | 1,035,873 | | | 6,742,290 | |
| | Bigfoot Biomedical Inc - Series C-1*,¢,§ | | 168,418 | | | 1,096,199 | |
| | Freenome Holdings Inc - Series C*,¢,§ | | 337,474 | | | 3,938,322 | |
| | Freenome Holdings Inc - Series D*,¢,§ | | 342,803 | | | 4,000,511 | |
| | | 15,777,322 | |
Health Care Technology – 0.1% | | | |
| | Magnolia Medical Technologies Inc - Series D*,¢,§ | | 1,821,717 | | | 3,092,693 | |
Pharmaceuticals – 0.2% | | | |
| | Neurogene Inc*,¢,§ | | 1,336,317 | | | 3,260,613 | |
| | Neurogene Inc - Series B*,¢,§ | | 1,486,727 | | | 3,627,614 | |
| | | 6,888,227 | |
Software – 0.1% | | | |
| | HeartFlow Inc - Series F*,¢,§ | | 1,934,015 | | | 5,512,910 | |
Total Private Placements (cost $97,258,815) | | 87,503,431 | |
Rights– 0% | | | |
Pharmaceuticals – 0% | | | |
| | Clementia Pharmaceuticals Inc CVR*,¢((cost $1,180,320) | | 874,311 | | | 0 | |
Warrants– 0% | | | |
Health Care Technology – 0% | | | |
| | Magnolia Medical Technologies Inc - Series D, expires 12/31/32*,¢,§((cost $0) | | 1 | | | 0 | |
Investment Companies– 0.4% | | | |
Money Markets – 0.4% | | | |
| | Janus Henderson Cash Liquidity Fund LLC, 4.7988%ºº,£((cost $18,366,254) | | 18,363,156 | | | 18,366,828 | |
Investments Purchased with Cash Collateral from Securities Lending– 0.3% | | | |
Investment Companies – 0.2% | | | |
| | Janus Henderson Cash Collateral Fund LLC, 4.8170%ºº,£ | | 11,562,080 | | | 11,562,080 | |
Time Deposits – 0.1% | | | |
| | Royal Bank of Canada, 4.8000%, 4/3/23 | | $2,890,520 | | | 2,890,520 | |
Total Investments Purchased with Cash Collateral from Securities Lending (cost $14,452,600) | | 14,452,600 | |
Total Investments (total cost $3,220,340,748) – 100.2% | | 4,649,386,112 | |
Liabilities, net of Cash, Receivables and Other Assets – (0.2)% | | (10,023,737) | |
Net Assets – 100% | | $4,639,362,375 | |
| | |
See Notes to Schedule of Investments and Other Information and Notes to Financial Statements. |
| |
8 | MARCH 31, 2023 |
Janus Henderson Global Life Sciences Fund
Schedule of Investments (unaudited)
March 31, 2023
| | | | | | |
Summary of Investments by Country - (Long Positions) (unaudited) |
| |
| | | | | % of | |
| | | | | Investment | |
Country | | Value | | Securities | |
United States | | $3,701,939,229 | | 79.6 | % |
United Kingdom | | 217,127,815 | | 4.7 | |
Switzerland | | 201,934,575 | | 4.3 | |
Denmark | | 144,716,989 | | 3.1 | |
France | | 141,976,748 | | 3.1 | |
Belgium | | 85,857,708 | | 1.8 | |
Japan | | 66,034,395 | | 1.4 | |
Germany | | 46,181,815 | | 1.0 | |
China | | 26,852,800 | | 0.6 | |
Ireland | | 16,764,038 | | 0.4 | |
| | | | | | |
| | | | | | |
Total | | $4,649,386,112 | | 100.0 | % |
Schedules of Affiliated Investments – (% of Net Assets)
| | | | | | | | | | | |
| | Dividend Income | Realized Gain/(Loss) | Change in Unrealized Appreciation/ Depreciation | Value at 3/31/23 |
Investment Companies - 0.4% |
Money Markets - 0.4% | |
| | Janus Henderson Cash Liquidity Fund LLC, 4.7988%ºº | $ | 410,746 | $ | 2,511 | $ | 339 | $ | 18,366,828 |
Investments Purchased with Cash Collateral from Securities Lending - 0.2% |
Investment Companies - 0.2% | |
| | Janus Henderson Cash Collateral Fund LLC, 4.8170%ºº | | 63,214∆ | | - | | - | | 11,562,080 |
Total Affiliated Investments - 0.6% | $ | 473,960 | $ | 2,511 | $ | 339 | $ | 29,928,908 |
| | | | | | | | | | | |
| | Value at 9/30/22 | Purchases | Sales Proceeds | Value at 3/31/23 |
Investment Companies - 0.4% |
Money Markets - 0.4% | |
| | Janus Henderson Cash Liquidity Fund LLC, 4.7988%ºº | | 5,298,938 | | 395,916,965 | | (382,851,925) | | 18,366,828 |
Investments Purchased with Cash Collateral from Securities Lending - 0.2% |
Investment Companies - 0.2% | |
| | Janus Henderson Cash Collateral Fund LLC, 4.8170%ºº | | 21,402,690 | | 123,418,575 | | (133,259,185) | | 11,562,080 |
| | |
See Notes to Schedule of Investments and Other Information and Notes to Financial Statements. |
| |
Janus Investment Fund | 9 |
Janus Henderson Global Life Sciences Fund
Schedule of Investments (unaudited)
March 31, 2023
| | | | | | | | | | |
Offsetting of Financial Assets and Derivative Assets |
| |
| | | Gross Amounts | | | | | | |
| | | of Recognized | | Offsetting Asset | | Collateral | | |
Counterparty | | Assets | | or Liability(a) | | Pledged(b) | | Net Amount |
| | | | | | | | | |
JPMorgan Chase Bank, National Association | $ | 14,185,664 | $ | — | $ | (14,185,664) | $ | — |
| | | | | | | | | |
(a) | Represents the amount of assets or liabilities that could be offset with the same counterparty under master netting or similar agreements that management elects not to offset on the Statement of Assets and Liabilities. |
(b) | Collateral pledged is limited to the net outstanding amount due to/from an individual counterparty. The actual collateral amounts pledged may exceed these amounts and may fluctuate in value. |
| | |
See Notes to Schedule of Investments and Other Information and Notes to Financial Statements. |
| |
10 | MARCH 31, 2023 |
Janus Henderson Global Life Sciences Fund
Notes to Schedule of Investments and Other Information (unaudited)
| | |
MSCI World Health Care IndexSM | MSCI World Health Care IndexSM reflects the performance of health care stocks from global developed markets. |
| | |
S&P 500® Index | S&P 500® Index reflects U.S. large-cap equity performance and represents broad U.S. equity market performance. |
| | |
ADR | American Depositary Receipt |
CVR | Contingent Value Right |
LLC | Limited Liability Company |
PLC | Public Limited Company |
| | |
* | Non-income producing security. |
| | |
ºº | Rate shown is the 7-day yield as of March 31, 2023. |
| | |
# | Loaned security; a portion of the security is on loan at March 31, 2023. |
| | |
¢ | Security is valued using significant unobservable inputs. The total value of Level 3 securities as of the period ended March 31, 2023 is $86,256,991, which represents 1.9% of net assets. |
| | |
£ | The Fund may invest in certain securities that are considered affiliated companies. As defined by the Investment Company Act of 1940, as amended, an affiliated company is one in which the Fund owns 5% or more of the outstanding voting securities, or a company which is under common ownership or control. |
| | |
∆ | Net of income paid to the securities lending agent and rebates paid to the borrowing counterparties. |
Janus Henderson Global Life Sciences Fund
Notes to Schedule of Investments and Other Information (unaudited)
| | | | | | | | | | | |
§ | Schedule of Restricted Securities (as of March 31, 2023) |
| | | | | | | | Value as a | |
| | Acquisition | | | | | | % of Net | |
| | Date | | Cost | | Value | | Assets | |
ACELYRIN Inc | 1/12/23 | $ | 5,878,086 | $ | 6,150,317 | | 0.1 | % |
ACELYRIN Inc (Indemnity Holdback Shares) | 1/12/23 | | 357,190 | | 373,679 | | 0.0 | |
Arbor Biotechnologies Inc | 10/29/21 | | 2,591,979 | | 2,591,979 | | 0.1 | |
Asher Biotherapeutics Inc | 8/23/21 | | 2,438,924 | | 1,951,139 | | 0.1 | |
Attralus Inc | 8/31/21 | | 5,198,696 | | 3,483,662 | | 0.1 | |
Bigfoot Biomedical Inc - Series B | 11/21/17 | | 9,808,940 | | 6,742,290 | | 0.1 | |
Bigfoot Biomedical Inc - Series C-1 | 12/27/19 | | 1,355,580 | | 1,096,199 | | 0.0 | |
Curevo Inc | 11/10/22 | | 5,330,344 | | 5,330,344 | | 0.1 | |
Disc Medicine Inc | 8/23/21 | | 2,603,002 | | 2,392,913 | | 0.0 | |
Element Biosciences Inc | 6/21/21 | | 8,737,070 | | 6,991,628 | | 0.2 | |
Freenome Holdings Inc - Series C | 8/14/20 | | 2,231,817 | | 3,938,322 | | 0.1 | |
Freenome Holdings Inc - Series D | 11/22/21 | | 2,585,523 | | 4,000,511 | | 0.1 | |
HeartFlow Inc - Series F | 3/24/23 | | 5,512,910 | | 5,512,910 | | 0.1 | |
HemoShear Therapeutics LLC | 2/5/21 | | 3,839,496 | | 2,109,430 | | 0.1 | |
Leap Therapeutics Inc | 1/30/23 | | 4,902,609 | | 1,246,440 | | 0.0 | |
Leap Therapeutics Inc (Indemnity Holdback Shares) | 1/30/23 | | 317,613 | | 80,750 | | 0.0 | |
LEXEO Therapeutics Inc - Series A | 11/20/20-7/30/21 | | 3,643,715 | | 6,268,975 | | 0.1 | |
LEXEO Therapeutics Inc - Series B | 8/10/21 | | 1,520,000 | | 1,520,000 | | 0.0 | |
Magnolia Medical Technologies Inc - Series D, expires 12/31/32 | 1/10/22 | | 0 | | 0 | | 0.0 | |
Magnolia Medical Technologies Inc - Series D | 1/10/22 | | 3,092,693 | | 3,092,693 | | 0.1 | |
Neurogene Inc | 12/15/20-9/22/21 | | 3,260,613 | | 3,260,613 | | 0.1 | |
Neurogene Inc - Series B | 3/4/22 | | 3,627,614 | | 3,627,614 | | 0.1 | |
Shoreline Biosciences Inc | 10/28/21 | | 7,522,230 | | 6,017,769 | | 0.1 | |
Sonoma Biotherapeutics Inc - Series B | 7/23/21-12/14/22 | | 4,465,171 | | 5,705,560 | | 0.1 | |
Synthekine Inc | 6/3/21 | | 6,290,001 | | 5,661,001 | | 0.1 | |
TwinStrand Biosciences Inc | 4/30/21 | | 2,750,001 | | 749,606 | | 0.0 | |
Total | | $ | 99,861,817 | $ | 89,896,344 | | 1.9 | % |
| | | | | | | | | |
The Fund has registration rights for certain restricted securities held as of March 31, 2023. The issuer incurs all registration costs. | |
Janus Henderson Global Life Sciences Fund
Notes to Schedule of Investments and Other Information (unaudited)
| | | | | | | | | | | | | |
The following is a summary of the inputs that were used to value the Fund’s investments in securities and other financial instruments as of March 31, 2023. See Notes to Financial Statements for more information. |
| |
Valuation Inputs Summary |
| | | | | | | |
| | | | | Level 2 - | | Level 3 - |
| | | Level 1 - | | Other Significant | | Significant |
| | | Quoted Prices | | Observable Inputs | | Unobservable Inputs |
| | | | | | | |
Assets | | | | | | |
Investments In Securities: | | | | | | |
Common Stocks | | | | | | |
Biotechnology | $ | 1,391,918,731 | $ | 3,292,070 | $ | - |
Pharmaceuticals | | 809,062,869 | | 646,465,232 | | - |
All Other | | 1,678,324,351 | | - | | - |
Private Placements | | - | | 1,246,440 | | 86,256,991 |
Rights | | - | | - | | 0 |
Warrants | | - | | - | | 0 |
Investment Companies | | - | | 18,366,828 | | - |
Investments Purchased with Cash Collateral from Securities Lending | | - | | 14,452,600 | | - |
Total Assets | $ | 3,879,305,951 | $ | 683,823,170 | $ | 86,256,991 |
| | | | | | | |
| | | | | | | | |
Level 3 Valuation Reconciliation of Assets (for the period ended March 31, 2023) |
| | | | | | | |
| Balance
as of
September 30, 2022 | Realized
Gain/(Loss) | Change in
Unrealized
Appreciation/
Depreciation(a) | Gross
Purchases | Gross
Sales | Transfers In
and/or
Out of Level 3 | Balance
as of
March 31, 2023 |
Investment in Securities: | | | | | | | |
Private Placement | | | | | | | |
Biotechnology | $ 48,792,119 | $ - | $ 115,983 | $13,867,752(b) | $(6,020,760)(b) | $(1,769,255) | $54,985,839 |
Health Care Providers & Services | 17,751,998 | - | (1,974,676) | - | - | - | 15,777,322 |
Health Care Technology | 3,092,693 | - | - | - | - | - | 3,092,693 |
Pharmaceuticals | 13,123,503 | - | - | - | (6,235,276)(b) | - | 6,888,227 |
Software | - | - | - | 5,512,910 | - | - | 5,512,910 |
Rights | | | | | | | |
Pharmaceuticals | 0 | - | - | - | - | - | 0 |
Warrants | | | | | | | |
Health Care Technology | 0 | - | - | - | - | - | 0 |
Total | $ 82,760,313 | $ - | $ (1,858,693) | $19,380,662 | $ (12,256,036) | $(1,769,255) | $86,256,991 |
(a) Included in "Change in unrealized net appreciation/depreciation of investments, foreign currency translations and non-interested Trustees' deferred compensation" on the Statement of Operations. |
(b) All or a portion is the result of a corporate action. |
| | | | | | | |
Janus Henderson Global Life Sciences Fund
Statement of Assets and Liabilities (unaudited)
March 31, 2023
| | | | | | | |
| | | | | | |
Assets: | | | | |
| Unaffiliated investments, at value (cost $3,190,412,414)(1) | | $ | 4,619,457,204 | |
| Affiliated investments, at value (cost $29,928,334) | | | 29,928,908 | |
| Trustees' deferred compensation | | | 114,785 | |
| Receivables: | | | | |
| | Investments sold | | | 34,949,954 | |
| | Foreign tax reclaims | | | 6,603,522 | |
| | Fund shares sold | | | 2,828,437 | |
| | Dividends | | | 2,817,910 | |
| | Dividends from affiliates | | | 53,068 | |
| Other assets | | | 37,508 | |
Total Assets | | | 4,696,791,296 | |
Liabilities: | | | | |
| Due to custodian | | | 86,296 | |
| Collateral for securities loaned (Note 2) | | | 14,452,600 | |
| Payables: | | | — | |
| | Investments purchased | | | 35,340,929 | |
| | Fund shares repurchased | | | 3,667,436 | |
| | Advisory fees | | | 2,616,989 | |
| | Transfer agent fees and expenses | | | 644,863 | |
| | 12b-1 Distribution and shareholder servicing fees | | | 155,898 | |
| | Trustees' deferred compensation fees | | | 114,785 | |
| | Professional fees | | | 37,534 | |
| | Trustees' fees and expenses | | | 30,395 | |
| | Affiliated fund administration fees payable | | | 10,222 | |
| | Custodian fees | | | 657 | |
| | Accrued expenses and other payables | | | 270,317 | |
Total Liabilities | | | 57,428,921 | |
Net Assets | | $ | 4,639,362,375 | |
| | |
See Notes to Financial Statements. |
| |
14 | MARCH 31, 2023 |
Janus Henderson Global Life Sciences Fund
Statement of Assets and Liabilities (unaudited)
March 31, 2023
| | | | | | | |
| | | | | | |
| | | | | | | |
Net Assets Consist of: | | | | |
| Capital (par value and paid-in surplus) | | $ | 3,175,444,647 | |
| Total distributable earnings (loss) | | | 1,463,917,728 | |
Total Net Assets | | $ | 4,639,362,375 | |
Net Assets - Class A Shares | | $ | 269,945,842 | |
| Shares Outstanding, $0.01 Par Value (unlimited shares authorized) | | | 4,160,317 | |
Net Asset Value Per Share(2) | | $ | 64.89 | |
Maximum Offering Price Per Share(3) | | $ | 68.85 | |
Net Assets - Class C Shares | | $ | 100,133,188 | |
| Shares Outstanding, $0.01 Par Value (unlimited shares authorized) | | | 1,744,041 | |
Net Asset Value Per Share(2) | | $ | 57.41 | |
Net Assets - Class D Shares | | $ | 1,697,432,025 | |
| Shares Outstanding, $0.01 Par Value (unlimited shares authorized) | | | 25,582,752 | |
Net Asset Value Per Share | | $ | 66.35 | |
Net Assets - Class I Shares | | $ | 993,561,805 | |
| Shares Outstanding, $0.01 Par Value (unlimited shares authorized) | | | 14,945,377 | |
Net Asset Value Per Share | | $ | 66.48 | |
Net Assets - Class N Shares | | $ | 330,256,568 | |
| Shares Outstanding, $0.01 Par Value (unlimited shares authorized) | | | 4,987,850 | |
Net Asset Value Per Share | | $ | 66.21 | |
Net Assets - Class S Shares | | $ | 28,689,700 | |
| Shares Outstanding, $0.01 Par Value (unlimited shares authorized) | | | 452,716 | |
Net Asset Value Per Share | | $ | 63.37 | |
Net Assets - Class T Shares | | $ | 1,219,343,247 | |
| Shares Outstanding, $0.01 Par Value (unlimited shares authorized) | | | 18,481,568 | |
Net Asset Value Per Share | | $ | 65.98 | |
| |
(1) Includes $14,185,664 of securities on loan. See Note 2 in Notes to Financial Statements. (2) Redemption price per share may be reduced for any applicable contingent deferred sales charge. (3) Maximum offering price is computed at 100/94.25 of net asset value. |
| | |
See Notes to Financial Statements. |
| |
Janus Investment Fund | 15 |
Janus Henderson Global Life Sciences Fund
Statement of Operations (unaudited)
For the period ended March 31, 2023
| | | | | | |
| | | | | |
Investment Income: | | | |
| Dividends | $ | 30,683,261 | |
| Dividends from affiliates | | 410,746 | |
| Affiliated securities lending income, net | | 63,214 | |
| Unaffiliated securities lending income, net | | 17,988 | |
| Other income | | 88,914 | |
| Foreign tax withheld | | (1,545,150) | |
Total Investment Income | | 29,718,973 | |
Expenses: | | | |
| Advisory fees | | 14,503,103 | |
| 12b-1 Distribution and shareholder servicing fees: | | | |
| | Class A Shares | | 329,962 | |
| | Class C Shares | | 482,973 | |
| | Class S Shares | | 34,455 | |
| Transfer agent administrative fees and expenses: | | | |
| | Class D Shares | | 992,641 | |
| | Class S Shares | | 34,427 | |
| | Class T Shares | | 1,506,246 | |
| Transfer agent networking and omnibus fees: | | | |
| | Class A Shares | | 75,621 | |
| | Class C Shares | | 50,287 | |
| | Class I Shares | | 445,648 | |
| Other transfer agent fees and expenses: | | | |
| | Class A Shares | | 9,734 | |
| | Class C Shares | | 2,606 | |
| | Class D Shares | | 103,031 | |
| | Class I Shares | | 27,814 | |
| | Class N Shares | | 6,533 | |
| | Class S Shares | | 184 | |
| | Class T Shares | | 6,023 | |
| Shareholder reports expense | | 142,433 | |
| Registration fees | | 94,952 | |
| Trustees’ fees and expenses | | 70,494 | |
| Affiliated fund administration fees | | 56,652 | |
| Professional fees | | 51,514 | |
| Custodian fees | | 48,153 | |
| Other expenses | | 174,669 | |
Total Expenses | | 19,250,155 | |
Less: Excess Expense Reimbursement and Waivers | | (100,183) | |
Net Expenses | | 19,149,972 | |
Net Investment Income/(Loss) | | 10,569,001 | |
| | | | | |
| | |
See Notes to Financial Statements. |
| |
16 | MARCH 31, 2023 |
Janus Henderson Global Life Sciences Fund
Statement of Operations (unaudited)
For the period ended March 31, 2023
| | | | | | |
| | | | | |
Net Realized Gain/(Loss) on Investments: | | | |
| Investments and foreign currency transactions | $ | 98,732,396 | |
| Investments in affiliates | | 2,511 | |
Total Net Realized Gain/(Loss) on Investments | | 98,734,907 | |
Change in Unrealized Net Appreciation/Depreciation: | | | |
| Investments, foreign currency translations and Trustees’ deferred compensation | | 396,294,929 | |
| Investments in affiliates | | 339 | |
Total Change in Unrealized Net Appreciation/Depreciation | | 396,295,268 | |
Net Increase/(Decrease) in Net Assets Resulting from Operations | $ | 505,599,176 | |
| | | | | |
| | |
See Notes to Financial Statements. |
| |
Janus Investment Fund | 17 |
Janus Henderson Global Life Sciences Fund
Statements of Changes in Net Assets
| | | | | | | | | |
| | | | | | | | |
| | | Period ended
March 31, 2023 (unaudited) | | Year ended
September 30, 2022 | |
| | | | | | | | | |
Operations: | | | | | | |
| Net investment income/(loss) | $ | 10,569,001 | | $ | 8,506,078 | |
| Net realized gain/(loss) on investments | | 98,734,907 | | | (1,926,607) | |
| Change in unrealized net appreciation/depreciation | | 396,295,268 | | | (563,450,193) | |
Net Increase/(Decrease) in Net Assets Resulting from Operations | | 505,599,176 | | | (556,870,722) | |
Dividends and Distributions to Shareholders: | | | | | | |
| | Class A Shares | | (204,832) | | | (26,218,234) | |
| | Class C Shares | | — | | | (14,503,583) | |
| | Class D Shares | | (4,425,702) | | | (168,341,359) | |
| | Class I Shares | | (2,945,592) | | | (98,682,706) | |
| | Class N Shares | | (1,369,727) | | | (17,490,827) | |
| | Class S Shares | | — | | | (2,696,808) | |
| | Class T Shares | | (1,747,688) | | | (124,306,069) | |
Net Decrease from Dividends and Distributions to Shareholders | | (10,693,541) | | | (452,239,586) | |
Capital Share Transactions: | | | | | | |
| | Class A Shares | | 1,573,313 | | | 12,473,104 | |
| | Class C Shares | | (19,260,208) | | | (18,489,015) | |
| | Class D Shares | | (29,717,980) | | | 67,853,188 | |
| | Class I Shares | | 50,680,525 | | | (21,496,544) | |
| | Class N Shares | | 169,621,253 | | | (128,226) | |
| | Class S Shares | | 1,547,139 | | | 2,804,530 | |
| | Class T Shares | | (20,693,466) | | | 3,892,712 | |
Net Increase/(Decrease) from Capital Share Transactions | | 153,750,576 | | | 46,909,749 | |
Net Increase/(Decrease) in Net Assets | | 648,656,211 | | | (962,200,559) | |
Net Assets: | | | | | | |
| Beginning of period | | 3,990,706,164 | | | 4,952,906,723 | |
| End of period | $ | 4,639,362,375 | | $ | 3,990,706,164 | |
| | | | | | | | |
| | |
See Notes to Financial Statements. |
| |
18 | MARCH 31, 2023 |
Janus Henderson Global Life Sciences Fund
Financial Highlights
| | | | | | | | | | | | | | | | | | | | | | |
Class A Shares | | | | | | | | | | | | | | | | | | |
For a share outstanding during the period ended March 31, 2023 (unaudited) and the year ended September 30 | | 2023 | | | 2022 | | | 2021 | | | 2020 | | | 2019 | | | 2018 | |
| Net Asset Value, Beginning of Period | | $57.73 | | | $72.24 | | | $66.20 | | | $53.89 | | | $64.96 | | | $55.76 | |
| Income/(Loss) from Investment Operations: | | | | | | | | | | | | | | | | | | |
| | Net investment income/(loss)(1) | | 0.11 | | | 0.04 | | | 0.07 | | | 0.41(2) | | | 0.17 | | | 0.01 | |
| | Net realized and unrealized gain/(loss) | | 7.10 | | | (7.84) | | | 11.44 | | | 15.62 | | | (4.52) | | | 9.74 | |
| Total from Investment Operations | | 7.21 | | | (7.80) | | | 11.51 | | | 16.03 | | | (4.35) | | | 9.75 | |
| Less Dividends and Distributions: | | | | | | | | | | | | | | | | | | |
| | Dividends (from net investment income) | | (0.05) | | | (0.76) | | | (0.66) | | | (0.40) | | | — | | | (0.07) | |
| | Distributions (from capital gains) | | — | | | (5.95) | | | (4.81) | | | (3.32) | | | (6.72) | | | (0.48) | |
| Total Dividends and Distributions | | (0.05) | | | (6.71) | | | (5.47) | | | (3.72) | | | (6.72) | | | (0.55) | |
| Net Asset Value, End of Period | | $64.89 | | | $57.73 | | | $72.24 | | | $66.20 | | | $53.89 | | | $64.96 | |
| Total Return* | | 12.49% | | | (11.96)% | | | 17.70% | | | 30.58% | | | (5.85)% | | | 17.70% | |
| Net Assets, End of Period (in thousands) | | $269,946 | | | $238,774 | | | $285,239 | | | $228,005 | | | $177,862 | | | $195,674 | |
| Average Net Assets for the Period (in thousands) | | $264,399 | | | $260,738 | | | $264,335 | | | $198,807 | | | $182,919 | | | $181,464 | |
| Ratios to Average Net Assets**: | | | | | | | | | | | | | | | | | | |
| | Ratio of Gross Expenses | | 0.98% | | | 0.98% | | | 0.97% | | | 0.98% | | | 1.00% | | | 0.99% | |
| | Ratio of Net Expenses (After Waivers and Expense Offsets) | | 0.98% | | | 0.98% | | | 0.97% | | | 0.98% | | | 1.00% | | | 0.99% | |
| | Ratio of Net Investment Income/(Loss) | | 0.33% | | | 0.07% | | | 0.10% | | | 0.69%(2) | | | 0.30% | | | 0.02% | |
| Portfolio Turnover Rate | | 16% | | | 21% | | | 32% | | | 43% | | | 36% | | | 46% | |
| | | | | | | | | | | | | | | | | | | | | | |
| |
* Total return includes adjustments in accordance with generally accepted accounting principles required at the year or period end and are not annualized for periods of less than one full year. ** Annualized for periods of less than one full year. (1) Per share amounts are calculated based on average shares outstanding during the year or period. (2) Net investment income/(loss) per share and Ratio of Net Investment Income/(Loss) to Average Net Assets include a special dividend from Allergan PLC in May 2020. The impact of the special dividend to Net investment income/(loss) per share and Ratio of Net Investment Income/(Loss) to Average Net Assets is $0.29 and 0.49%, respectively. |
| | |
See Notes to Financial Statements. |
| |
Janus Investment Fund | 19 |
Janus Henderson Global Life Sciences Fund
Financial Highlights
| | | | | | | | | | | | | | | | | | | | | | |
Class C Shares | | | | | | | | | | | | | | | | | | |
For a share outstanding during the period ended March 31, 2023 (unaudited) and the year ended September 30 | | 2023 | | | 2022 | | | 2021 | | | 2020 | | | 2019 | | | 2018 | |
| Net Asset Value, Beginning of Period | | $51.22 | | | $64.73 | | | $59.83 | | | $49.00 | | | $60.16 | | | $52.00 | |
| Income/(Loss) from Investment Operations: | | | | | | | | | | | | | | | | | | |
| | Net investment income/(loss)(1) | | (0.11) | | | (0.35) | | | (0.39) | | | —(2)(3) | | | (0.21) | | | (0.40) | |
| | Net realized and unrealized gain/(loss) | | 6.30 | | | (6.96) | | | 10.32 | | | 14.15 | | | (4.23) | | | 9.04 | |
| Total from Investment Operations | | 6.19 | | | (7.31) | | | 9.93 | | | 14.15 | | | (4.44) | | | 8.64 | |
| Less Dividends and Distributions: | | | | | | | | | | | | | | | | | | |
| | Dividends (from net investment income) | | — | | | (0.25) | | | (0.22) | | | —(3) | | | — | | | — | |
| | Distributions (from capital gains) | | — | | | (5.95) | | | (4.81) | | | (3.32) | | | (6.72) | | | (0.48) | |
| Total Dividends and Distributions | | — | | | (6.20) | | | (5.03) | | | (3.32) | | | (6.72) | | | (0.48) | |
| Net Asset Value, End of Period | | $57.41 | | | $51.22 | | | $64.73 | | | $59.83 | | | $49.00 | | | $60.16 | |
| Total Return* | | 12.09% | | | (12.55)% | | | 16.86% | | | 29.66% | | | (6.53)% | | | 16.81% | |
| Net Assets, End of Period (in thousands) | | $100,133 | | | $106,819 | | | $157,110 | | | $155,599 | | | $148,147 | | | $182,894 | |
| Average Net Assets for the Period (in thousands) | | $109,046 | | | $134,801 | | | $165,379 | | | $156,935 | | | $163,407 | | | $173,167 | |
| Ratios to Average Net Assets**: | | | | | | | | | | | | | | | | | | |
| | Ratio of Gross Expenses | | 1.65% | | | 1.65% | | | 1.69% | | | 1.69% | | | 1.71% | | | 1.75% | |
| | Ratio of Net Expenses (After Waivers and Expense Offsets) | | 1.65% | | | 1.65% | | | 1.69% | | | 1.69% | | | 1.71% | | | 1.75% | |
| | Ratio of Net Investment Income/(Loss) | | (0.39)% | | | (0.61)% | | | (0.61)% | | | (0.01)%(2) | | | (0.42)% | | | (0.74)% | |
| Portfolio Turnover Rate | | 16% | | | 21% | | | 32% | | | 43% | | | 36% | | | 46% | |
| | | | | | | | | | | | | | | | | | | | | | |
| |
* Total return includes adjustments in accordance with generally accepted accounting principles required at the year or period end and are not annualized for periods of less than one full year. ** Annualized for periods of less than one full year. (1) Per share amounts are calculated based on average shares outstanding during the year or period. (2) Net investment income/(loss) per share and Ratio of Net Investment Income/(Loss) to Average Net Assets include a special dividend from Allergan PLC in May 2020. The impact of the special dividend to Net investment income/(loss) per share and Ratio of Net Investment Income/(Loss) to Average Net Assets is $0.27 and 0.49%, respectively. (3) Less than $0.005 on a per share basis. |
| | |
See Notes to Financial Statements. |
| |
20 | MARCH 31, 2023 |
Janus Henderson Global Life Sciences Fund
Financial Highlights
| | | | | | | | | | | | | | | | | | | | | | |
Class D Shares | | | | | | | | | | | | | | | | | | |
For a share outstanding during the period ended March 31, 2023 (unaudited) and the year ended September 30 | 2023 | | | 2022 | | | 2021 | | | 2020 | | | 2019 | | | 2018 | |
| Net Asset Value, Beginning of Period | | $59.09 | | | $73.77 | | | $67.47 | | | $54.86 | | | $65.89 | | | $56.59 | |
| Income/(Loss) from Investment Operations: | | | | | | | | | | | | | | | | | | |
| | Net investment income/(loss)(1) | | 0.16 | | | 0.16 | | | 0.20 | | | 0.53(2) | | | 0.27 | | | 0.12 | |
| | Net realized and unrealized gain/(loss) | | 7.27 | | | (8.02) | | | 11.66 | | | 15.90 | | | (4.58) | | | 9.86 | |
| Total from Investment Operations | | 7.43 | | | (7.86) | | | 11.86 | | | 16.43 | | | (4.31) | | | 9.98 | |
| Less Dividends and Distributions: | | | | | | | | | | | | | | | | | | |
| | Dividends (from net investment income) | | (0.17) | | | (0.87) | | | (0.75) | | | (0.50) | | | — | | | (0.20) | |
| | Distributions (from capital gains) | | — | | | (5.95) | | | (4.81) | | | (3.32) | | | (6.72) | | | (0.48) | |
| Total Dividends and Distributions | | (0.17) | | | (6.82) | | | (5.56) | | | (3.82) | | | (6.72) | | | (0.68) | |
| Net Asset Value, End of Period | | $66.35 | | | $59.09 | | | $73.77 | | | $67.47 | | | $54.86 | | | $65.89 | |
| Total Return* | | 12.58% | | | (11.81)% | | | 17.91% | | | 30.80% | | | (5.69)% | | | 17.91% | |
| Net Assets, End of Period (in thousands) | | $1,697,432 | | | $1,538,660 | | | $1,848,983 | | | $1,653,849 | | | $1,372,808 | | | $1,549,599 | |
| Average Net Assets for the Period (in thousands) | | $1,685,518 | | | $1,704,598 | | | $1,837,079 | | | $1,526,148 | | | $1,449,521 | | | $1,404,624 | |
| Ratios to Average Net Assets**: | | | | | | | | | | | | | | | | | | |
| | Ratio of Gross Expenses | | 0.80% | | | 0.80% | | | 0.80% | | | 0.81% | | | 0.82% | | | 0.82% | |
| | Ratio of Net Expenses (After Waivers and Expense Offsets) | | 0.80% | | | 0.80% | | | 0.80% | | | 0.81% | | | 0.82% | | | 0.82% | |
| | Ratio of Net Investment Income/(Loss) | | 0.50% | | | 0.24% | | | 0.28% | | | 0.87%(2) | | | 0.48% | | | 0.20% | |
| Portfolio Turnover Rate | | 16% | | | 21% | | | 32% | | | 43% | | | 36% | | | 46% | |
| | | | | | | | | | | | | | | | | | | | | | |
| |
* Total return includes adjustments in accordance with generally accepted accounting principles required at the year or period end and are not annualized for periods of less than one full year. ** Annualized for periods of less than one full year. (1) Per share amounts are calculated based on average shares outstanding during the year or period. (2) Net investment income/(loss) per share and Ratio of Net Investment Income/(Loss) to Average Net Assets include a special dividend from Allergan PLC in May 2020. The impact of the special dividend to Net investment income/(loss) per share and Ratio of Net Investment Income/(Loss) to Average Net Assets is $0.30 and 0.49%, respectively. |
| | |
See Notes to Financial Statements. |
| |
Janus Investment Fund | 21 |
Janus Henderson Global Life Sciences Fund
Financial Highlights
| | | | | | | | | | | | | | | | | | | | | | |
Class I Shares | | | | | | | | | | | | | | | | | | |
For a share outstanding during the period ended March 31, 2023 (unaudited) and the year ended September 30 | 2023 | | | 2022 | | | 2021 | | | 2020 | | | 2019 | | | 2018 | |
| Net Asset Value, Beginning of Period | | $59.22 | | | $73.93 | | | $67.61 | | | $54.96 | | | $65.96 | | | $56.66 | |
| Income/(Loss) from Investment Operations: | | | | | | | | | | | | | | | | | | |
| | Net investment income/(loss)(1) | | 0.18 | | | 0.18 | | | 0.23 | | | 0.57(2) | | | 0.30 | | | 0.15 | |
| | Net realized and unrealized gain/(loss) | | 7.28 | | | (8.03) | | | 11.69 | | | 15.93 | | | (4.58) | | | 9.87 | |
| Total from Investment Operations | | 7.46 | | | (7.85) | | | 11.92 | | | 16.50 | | | (4.28) | | | 10.02 | |
| Less Dividends and Distributions: | | | | | | | | | | | | | | | | | | |
| | Dividends (from net investment income) | | (0.20) | | | (0.91) | | | (0.79) | | | (0.53) | | | — | | | (0.24) | |
| | Distributions (from capital gains) | | — | | | (5.95) | | | (4.81) | | | (3.32) | | | (6.72) | | | (0.48) | |
| Total Dividends and Distributions | | (0.20) | | | (6.86) | | | (5.60) | | | (3.85) | | | (6.72) | | | (0.72) | |
| Net Asset Value, End of Period | | $66.48 | | | $59.22 | | | $73.93 | | | $67.61 | | | $54.96 | | | $65.96 | |
| Total Return* | | 12.60% | | | (11.77)% | | | 17.96% | | | 30.89% | | | (5.63)% | | | 17.97% | |
| Net Assets, End of Period (in thousands) | | $993,562 | | | $839,582 | | | $1,079,081 | | | $911,963 | | | $692,575 | | | $762,127 | |
| Average Net Assets for the Period (in thousands) | | $950,341 | | | $963,599 | | | $1,033,591 | | | $790,645 | | | $719,800 | | | $688,302 | |
| Ratios to Average Net Assets**: | | | | | | | | | | | | | | | | | | |
| | Ratio of Gross Expenses | | 0.77% | | | 0.76% | | | 0.75% | | | 0.75% | | | 0.77% | | | 0.76% | |
| | Ratio of Net Expenses (After Waivers and Expense Offsets) | | 0.77% | | | 0.76% | | | 0.75% | | | 0.75% | | | 0.77% | | | 0.76% | |
| | Ratio of Net Investment Income/(Loss) | | 0.55% | | | 0.28% | | | 0.32% | | | 0.93%(2) | | | 0.53% | | | 0.26% | |
| Portfolio Turnover Rate | | 16% | | | 21% | | | 32% | | | 43% | | | 36% | | | 46% | |
| | | | | | | | | | | | | | | | | | | | | | |
| |
* Total return includes adjustments in accordance with generally accepted accounting principles required at the year or period end and are not annualized for periods of less than one full year. ** Annualized for periods of less than one full year. (1) Per share amounts are calculated based on average shares outstanding during the year or period. (2) Net investment income/(loss) per share and Ratio of Net Investment Income/(Loss) to Average Net Assets include a special dividend from Allergan PLC in May 2020. The impact of the special dividend to Net investment income/(loss) per share and Ratio of Net Investment Income/(Loss) to Average Net Assets is $0.30 and 0.49%, respectively. |
| | |
See Notes to Financial Statements. |
| |
22 | MARCH 31, 2023 |
Janus Henderson Global Life Sciences Fund
Financial Highlights
| | | | | | | | | | | | | | | | | | | | | | |
Class N Shares | | | | | | | | | | | | | | | | | | |
For a share outstanding during the period ended March 31, 2023 (unaudited) and the year or period ended September 30 | 2023 | | | 2022 | | | 2021 | | | 2020 | | | 2019 | | | 2018(1) | |
| Net Asset Value, Beginning of Period | | $59.02 | | | $73.69 | | | $67.41 | | | $54.81 | | | $65.76 | | | $59.59 | |
| Income/(Loss) from Investment Operations: | | | | | | | | | | | | | | | | | | |
| | Net investment income/(loss)(2) | | 0.23 | | | 0.24 | | | 0.31 | | | 0.66(3) | | | 0.36 | | | 0.16 | |
| | Net realized and unrealized gain/(loss) | | 7.23 | | | (7.99) | | | 11.62 | | | 15.85 | | | (4.59) | | | 6.01 | |
| Total from Investment Operations | | 7.46 | | | (7.75) | | | 11.93 | | | 16.51 | | | (4.23) | | | 6.17 | |
| Less Dividends and Distributions: | | | | | | | | | | | | | | | | | | |
| | Dividends (from net investment income) | | (0.27) | | | (0.97) | | | (0.84) | | | (0.59) | | | — | | | — | |
| | Distributions (from capital gains) | | — | | | (5.95) | | | (4.81) | | | (3.32) | | | (6.72) | | | — | |
| Total Dividends and Distributions | | (0.27) | | | (6.92) | | | (5.65) | | | (3.91) | | | (6.72) | | | — | |
| Net Asset Value, End of Period | | $66.21 | | | $59.02 | | | $73.69 | | | $67.41 | | | $54.81 | | | $65.76 | |
| Total Return* | | 12.65% | | | (11.68)% | | | 18.04% | | | 30.99% | | | (5.57)% | | | 10.35% | |
| Net Assets, End of Period (in thousands) | | $330,257 | | | $138,495 | | | $176,576 | | | $144,543 | | | $90,958 | | | $104,903 | |
| Average Net Assets for the Period (in thousands) | | $294,205 | | | $165,129 | | | $176,137 | | | $110,308 | | | $99,924 | | | $24,212 | |
| Ratios to Average Net Assets**: | | | | | | | | | | | | | | | | | | |
| | Ratio of Gross Expenses | | 0.68% | | | 0.67% | | | 0.67% | | | 0.67% | | | 0.68% | | | 0.70% | |
| | Ratio of Net Expenses (After Waivers and Expense Offsets) | | 0.68% | | | 0.67% | | | 0.67% | | | 0.67% | | | 0.68% | | | 0.70% | |
| | Ratio of Net Investment Income/(Loss) | | 0.71% | | | 0.37% | | | 0.43% | | | 1.08%(3) | | | 0.63% | | | 0.39% | |
| Portfolio Turnover Rate | | 16% | | | 21% | | | 32% | | | 43% | | | 36% | | | 46% | |
| | | | | | | | | | | | | | | | | | | | | | |
| |
* Total return includes adjustments in accordance with generally accepted accounting principles required at the year or period end and are not annualized for periods of less than one full year. ** Annualized for periods of less than one full year. (1) Period from January 26, 2018 (inception date) through September 30, 2018. (2) Per share amounts are calculated based on average shares outstanding during the year or period. (3) Net investment income/(loss) per share and Ratio of Net Investment Income/(Loss) to Average Net Assets include a special dividend from Allergan PLC in May 2020. The impact of the special dividend to Net investment income/(loss) per share and Ratio of Net Investment Income/(Loss) to Average Net Assets is $0.30 and 0.49%, respectively. |
| | |
See Notes to Financial Statements. |
| |
Janus Investment Fund | 23 |
Janus Henderson Global Life Sciences Fund
Financial Highlights
| | | | | | | | | | | | | | | | | | | | | | |
Class S Shares | | | | | | | | | | | | | | | | | | |
For a share outstanding during the period ended March 31, 2023 (unaudited) and the year ended September 30 | | 2023 | | | 2022 | | | 2021 | | | 2020 | | | 2019 | | | 2018 | |
| Net Asset Value, Beginning of Period | | $56.40 | | | $70.72 | | | $64.93 | | | $52.94 | | | $64.07 | | | $55.09 | |
| Income/(Loss) from Investment Operations: | | | | | | | | | | | | | | | | | | |
| | Net investment income/(loss)(1) | | 0.04 | | | (0.08) | | | (0.07) | | | 0.31(2) | | | 0.07 | | | (0.08) | |
| | Net realized and unrealized gain/(loss) | | 6.93 | | | (7.66) | | | 11.21 | | | 15.31 | | | (4.48) | | | 9.60 | |
| Total from Investment Operations | | 6.97 | | | (7.74) | | | 11.14 | | | 15.62 | | | (4.41) | | | 9.52 | |
| Less Dividends and Distributions: | | | | | | | | | | | | | | | | | | |
| | Dividends (from net investment income) | | — | | | (0.63) | | | (0.54) | | | (0.31) | | | — | | | (0.06) | |
| | Distributions (from capital gains) | | — | | | (5.95) | | | (4.81) | | | (3.32) | | | (6.72) | | | (0.48) | |
| Total Dividends and Distributions | | — | | | (6.58) | | | (5.35) | | | (3.63) | | | (6.72) | | | (0.54) | |
| Net Asset Value, End of Period | | $63.37 | | | $56.40 | | | $70.72 | | | $64.93 | | | $52.94 | | | $64.07 | |
| Total Return* | | 12.36% | | | (12.13)% | | | 17.46% | | | 30.33% | | | (6.04)% | | | 17.49% | |
| Net Assets, End of Period (in thousands) | | $28,690 | | | $24,128 | | | $27,575 | | | $24,287 | | | $18,981 | | | $20,113 | |
| Average Net Assets for the Period (in thousands) | | $27,573 | | | $26,974 | | | $27,694 | | | $22,312 | | | $19,870 | | | $18,269 | |
| Ratios to Average Net Assets**: | | | | | | | | | | | | | | | | | | |
| | Ratio of Gross Expenses | | 1.18% | | | 1.18% | | | 1.17% | | | 1.18% | | | 1.19% | | | 1.18% | |
| | Ratio of Net Expenses (After Waivers and Expense Offsets) | | 1.18% | | | 1.18% | | | 1.17% | | | 1.18% | | | 1.18% | | | 1.17% | |
| | Ratio of Net Investment Income/(Loss) | | 0.14% | | | (0.13)% | | | (0.09)% | | | 0.52%(2) | | | 0.14% | | | (0.14)% | |
| Portfolio Turnover Rate | | 16% | | | 21% | | | 32% | | | 43% | | | 36% | | | 46% | |
| | | | | | | | | | | | | | | | | | | | | | |
| |
* Total return includes adjustments in accordance with generally accepted accounting principles required at the year or period end and are not annualized for periods of less than one full year. ** Annualized for periods of less than one full year. (1) Per share amounts are calculated based on average shares outstanding during the year or period. (2) Net investment income/(loss) per share and Ratio of Net Investment Income/(Loss) to Average Net Assets include a special dividend from Allergan PLC in May 2020. The impact of the special dividend to Net investment income/(loss) per share and Ratio of Net Investment Income/(Loss) to Average Net Assets is $0.29 and 0.49%, respectively. |
| | |
See Notes to Financial Statements. |
| |
24 | MARCH 31, 2023 |
Janus Henderson Global Life Sciences Fund
Financial Highlights
| | | | | | | | | | | | | | | | | | | | | | |
Class T Shares | | | | | | | | | | | | | | | | | | |
For a share outstanding during the period ended March 31, 2023 (unaudited) and the year ended September 30 | | 2023 | | | 2022 | | | 2021 | | | 2020 | | | 2019 | | | 2018 | |
| Net Asset Value, Beginning of Period | | $58.72 | | | $73.33 | | | $67.11 | | | $54.59 | | | $65.66 | | | $56.39 | |
| Income/(Loss) from Investment Operations: | | | | | | | | | | | | | | | | | | |
| | Net investment income/(loss)(1) | | 0.13 | | | 0.09 | | | 0.12 | | | 0.46(2) | | | 0.22 | | | 0.06 | |
| | Net realized and unrealized gain/(loss) | | 7.22 | | | (7.96) | | | 11.60 | | | 15.82 | | | (4.57) | | | 9.84 | |
| Total from Investment Operations | | 7.35 | | | (7.87) | | | 11.72 | | | 16.28 | | | (4.35) | | | 9.90 | |
| Less Dividends and Distributions: | | | | | | | | | | | | | | | | | | |
| | Dividends (from net investment income) | | (0.09) | | | (0.79) | | | (0.69) | | | (0.44) | | | — | | | (0.15) | |
| | Distributions (from capital gains) | | — | | | (5.95) | | | (4.81) | | | (3.32) | | | (6.72) | | | (0.48) | |
| Total Dividends and Distributions | | (0.09) | | | (6.74) | | | (5.50) | | | (3.76) | | | (6.72) | | | (0.63) | |
| Net Asset Value, End of Period | | $65.98 | | | $58.72 | | | $73.33 | | | $67.11 | | | $54.59 | | | $65.66 | |
| Total Return* | | 12.52% | | | (11.89)% | | | 17.78% | | | 30.66% | | | (5.78)% | | | 17.80% | |
| Net Assets, End of Period (in thousands) | | $1,219,343 | | | $1,104,248 | | | $1,378,342 | | | $1,268,796 | | | $1,102,667 | | | $1,293,953 | |
| Average Net Assets for the Period (in thousands) | | $1,207,239 | | | $1,244,923 | | | $1,394,446 | | | $1,191,342 | | | $1,180,068 | | | $1,230,729 | |
| Ratios to Average Net Assets**: | | | | | | | | | | | | | | | | | | |
| | Ratio of Gross Expenses | | 0.92% | | | 0.92% | | | 0.91% | | | 0.92% | | | 0.92% | | | 0.92% | |
| | Ratio of Net Expenses (After Waivers and Expense Offsets) | | 0.90% | | | 0.91% | | | 0.90% | | | 0.91% | | | 0.91% | | | 0.91% | |
| | Ratio of Net Investment Income/(Loss) | | 0.41% | | | 0.14% | | | 0.17% | | | 0.76%(2) | | | 0.38% | | | 0.10% | |
| Portfolio Turnover Rate | | 16% | | | 21% | | | 32% | | | 43% | | | 36% | | | 46% | |
| | | | | | | | | | | | | | | | | | | | | | |
| |
* Total return includes adjustments in accordance with generally accepted accounting principles required at the year or period end and are not annualized for periods of less than one full year. ** Annualized for periods of less than one full year. (1) Per share amounts are calculated based on average shares outstanding during the year or period. (2) Net investment income/(loss) per share and Ratio of Net Investment Income/(Loss) to Average Net Assets include a special dividend from Allergan PLC in May 2020. The impact of the special dividend to Net investment income/(loss) per share and Ratio of Net Investment Income/(Loss) to Average Net Assets is $0.30 and 0.49%, respectively. |
| | |
See Notes to Financial Statements. |
| |
Janus Investment Fund | 25 |
Janus Henderson Global Life Sciences Fund
Notes to Financial Statements (unaudited)
1. Organization and Significant Accounting Policies
Janus Henderson Global Life Sciences Fund (the “Fund”) is a series of Janus Investment Fund (the “Trust”), which is organized as a Massachusetts business trust and is registered under the Investment Company Act of 1940, as amended (the “1940 Act”), as an open-end management investment company, and therefore has applied the specialized accounting and reporting guidance in Financial Accounting Standards Board (“FASB”) Accounting Standards Codification (“ASC”) Topic 946. The Trust offers 40 funds, each of which offers multiple share classes, with differing investment objectives and policies. The Fund seeks long-term growth of capital. The Fund is classified as diversified, as defined in the 1940 Act. Janus Henderson Investors US LLC is the investment adviser (the “Adviser”) to the Fund.
The Fund offers multiple classes of shares in order to meet the needs of various types of investors. Each class represents an interest in the same portfolio of investments. Certain financial intermediaries may not offer all classes of shares.
Shareholders, including other funds, individuals, accounts, as well as the Fund’s portfolio manager(s) and/or investment personnel, may from time to time own (beneficially or of record) a significant percentage of the Fund’s Shares and can be considered to “control” the Fund when that ownership exceeds 25% of the Fund’s assets (and which may differ from control as determined in accordance with United States of America generally accepted accounting principles ("US GAAP")).
Class A Shares are offered through financial intermediary platforms including, but not limited to, traditional brokerage platforms, mutual fund wrap fee programs, bank trust platforms, and retirement platforms.
Class C Shares are offered through financial intermediary platforms including, but not limited to, traditional brokerage platforms, mutual fund wrap fee programs, and bank trust platforms.
Class C Shares are closed to investments by new employer-sponsored retirement plans and existing employer-sponsored retirement plans are no longer able to make additional purchases or exchanges into Class C Shares.
The Fund currently implements an automatic conversion feature pursuant to which Class C Shares that have been held for eight years are automatically converted to Class A Shares without the imposition of any sales charge, fee or other charge. The conversion will generally occur no later than ten business days in the month following the month of the eighth anniversary of the date of purchase. Class C Shares purchased through the reinvestment of dividends and other distributions on Class C Shares will convert to Class A Shares at the same time as the original Class C Shares with respect to which they were purchased. For Class C Shares held in omnibus accounts on intermediary platforms, the Fund relies on these intermediaries to implement this conversion feature. Your financial intermediary may have separate policies and procedures as to when and how Class C Shares may be converted to Class A Shares.
Effective July 6, 2020, Class D Shares are available to new investors, subject to any closed fund policies for a Fund, as applicable. Previously, Class D Shares were only available to investors who already had a direct account with the Janus Henderson funds; immediate family members or members of the same household of an eligible individual investor; and existing beneficial owners of sole proprietorships or partnerships that hold accounts directly with the Janus Henderson funds.
Class I Shares are available through certain financial intermediary platforms including, but not limited to, mutual fund wrap fee programs, managed account programs, asset allocation programs, bank trust platforms, as well as certain retirement platforms. Class I Shares are also available to certain direct institutional investors including, but not limited to, corporations, certain retirement plans, public plans, and foundations/endowments, who established Class I Share accounts before August 4, 2017.
Class N Shares are generally available only to financial intermediaries purchasing on behalf of: 1) certain adviser-assisted, employer-sponsored retirement plans, including 401(k) plans, 457 plans, 403(b) plans, Taft-Hartley multi-employer plans, profit-sharing and money purchase pension plans, defined benefit plans and certain welfare benefit plans, such as health savings accounts, and nonqualified deferred compensation plans; and 2) retail investors purchasing in qualified or nonqualified accounts, whose accounts are held through an omnibus account at their financial intermediary, and where the financial intermediary requires no payment or reimbursement from the Fund, the Adviser, or its affiliates. Class N Shares are also available to Janus Henderson proprietary products and to certain direct institutional investors approved by Janus Henderson Distributors US LLC (the “Distributor”) including, but not limited to,
Janus Henderson Global Life Sciences Fund
Notes to Financial Statements (unaudited)
corporations, certain retirement plans, public plans, and foundations and endowments, subject to minimum investment requirements.
Class S Shares are offered through financial intermediary platforms including, but not limited to, retirement platforms and asset allocation, mutual fund wrap, or other discretionary or nondiscretionary fee-based investment advisory programs. In addition, Class S Shares may be available through certain financial intermediaries who have an agreement with the Adviser or its affiliates to offer Class S Shares on their supermarket platforms.
Class T Shares are available through certain financial intermediary platforms including, but not limited to, mutual fund wrap fee programs, managed account programs, asset allocation programs, bank trust platforms, as well as certain retirement platforms. In addition, Class T Shares may be available through certain financial intermediaries who have an agreement with the Adviser or its affiliates to offer Class T Shares on their supermarket platforms.
The following accounting policies have been followed by the Fund and are in conformity with US GAAP.
Investment Valuation
Fund holdings are valued in accordance with policies and procedures established by the Adviser pursuant to Rule 2a-5 under the 1940 Act and approved by and subject to the oversight of the Trustees (the “Valuation Procedures”). Equity securities traded on a domestic securities exchange are generally valued at readily available market quotations, which are (i) the official close prices or (ii) last sale prices on the primary market or exchange in which the securities trade. If such price is lacking for the trading period immediately preceding the time of determination, such securities are generally valued at their current bid price. Equity securities that are traded on a foreign exchange are generally valued at the closing prices on such markets. In the event that there is no current trading volume on a particular security in such foreign exchange, the bid price from the primary exchange is generally used to value the security. Foreign securities and currencies are converted to U.S. dollars using the current spot USD dollar exchange rate in effect at the close of the New York Stock Exchange (“NYSE”). The Fund will determine the market value of individual securities held by it by using prices provided by one or more approved professional pricing services or, as needed, by obtaining market quotations from independent broker-dealers. Most debt securities are valued in accordance with the evaluated bid price supplied by the Adviser-approved pricing service that is intended to reflect market value. The evaluated bid price supplied by the pricing service is an evaluation that may consider factors such as security prices, yields, maturities and ratings. Certain short-term securities maturing within 60 days or less may be evaluated and valued on an amortized cost basis provided that the amortized cost determined approximates market value. Securities for which market quotations or evaluated prices are not readily available or deemed unreliable are valued at fair value determined in good faith by the Adviser pursuant to the Valuation Procedures. Circumstances in which fair valuation may be utilized include, but are not limited to: (i) a significant event that may affect the securities of a single issuer, such as a merger, bankruptcy, or significant issuer-specific development; (ii) an event that may affect an entire market, such as a natural disaster or significant governmental action; (iii) a nonsignificant event such as a market closing early or not opening, or a security trading halt; and (iv) pricing of a nonvalued security and a restricted or nonpublic security. Special valuation considerations may apply with respect to “odd-lot” fixed-income transactions which, due to their small size, may receive evaluated prices by pricing services which reflect a large block trade and not what actually could be obtained for the odd-lot position. The valuation policies provide for the use of systematic fair valuation models provided by independent pricing services to value foreign equity securities in order to adjust for stale pricing, which may occur between the close of certain foreign exchanges and the close of the NYSE. The value of the securities of other mutual funds held by a Fund, if any, will be calculated using the NAV of such mutual funds.
Valuation Inputs Summary
FASB ASC 820, Fair Value Measurements and Disclosures (“ASC 820”), defines fair value, establishes a framework for measuring fair value, and expands disclosure requirements regarding fair value measurements. This standard emphasizes that fair value is a market-based measurement that should be determined based on the assumptions that market participants would use in pricing an asset or liability and establishes a hierarchy that prioritizes inputs to valuation techniques used to measure fair value. These inputs are summarized into three broad levels:
Level 1 – Unadjusted quoted prices in active markets the Fund has the ability to access for identical assets or liabilities.
Level 2 – Observable inputs other than unadjusted quoted prices included in Level 1 that are observable for the asset or liability either directly or indirectly. These inputs may include quoted prices for the identical instrument on
Janus Henderson Global Life Sciences Fund
Notes to Financial Statements (unaudited)
an inactive market, prices for similar instruments, interest rates, prepayment speeds, credit risk, yield curves, default rates and similar data.
Assets or liabilities categorized as Level 2 in the hierarchy generally include: debt securities fair valued in accordance with the evaluated bid or ask prices supplied by a pricing service; securities traded on OTC markets and listed securities for which no sales are reported that are fair valued at the latest bid price (or yield equivalent thereof) obtained from one or more dealers transacting in a market for such securities or by a pricing service approved by the Fund’s Trustees; certain short-term debt securities with maturities of 60 days or less that are fair valued at amortized cost; and equity securities of foreign issuers whose fair value is determined by using systematic fair valuation models provided by independent third parties in order to adjust for stale pricing which may occur between the close of certain foreign exchanges and the close of the NYSE. Other securities that may be categorized as Level 2 in the hierarchy include, but are not limited to, preferred stocks, bank loans, swaps, investments in unregistered investment companies, options, and forward contracts.
Level 3 – Unobservable inputs for the asset or liability to the extent that relevant observable inputs are not available, representing the Fund’s own assumptions about the assumptions that a market participant would use in valuing the asset or liability, and that would be based on the best information available. For private placements where observable inputs are limited, assumptions about market activity and risk are used in employing valuation techniques such as the market approach, the income approach, or the cost approach, as defined under ASC 820. These are categorized as Level 3 in the hierarchy.
For significant fair value measurements categorized within Level 3 of the fair value hierarchy, the table below summarizes the valuation techniques and provides quantitative information about the significant unobservable inputs. In addition, the table provides a narrative description of the uncertainty of the fair value measurement based on the use of significant unobservable inputs that have been different, or that reasonable could have been different, at the reporting date.
| | | | | | | |
Asset | Fair Value at March 31, 2023 | Valuation Technique | Unobservable Input | Input Amount or Range | Weighted Average(1) | Impact to Valuation from an Increase in Input |
Private Placements | | | | | | |
Biotechnology | $80,750 | Market Approach | Discount | 50% | 50% | Decrease |
| | $33,228,176 | Market Approach | Transaction Price | $1.72 - $16.57 | $4.22 | Increase |
| | $18,817,877 | Market Approach | Transaction Price | $2.01 - $20.56 | $12.63 | Increase |
| | | | Discount | 20% - 50% | 23% | Decrease |
| | $749,606 | Market Approach | Transaction Price | $7.47 | $7.47 | Increase |
| | | | Adjustment based on Market Comparables | (51%) – (91%) | (71%) | Decrease |
| | $2,109,430 | Market Approach | Transaction Price | $13.27 | $13.27 | Increase |
| | | | Adjustment based on Market Comparables | (90%) – 20% | (45%) | Decrease |
Health Care Providers & Services | $7,838,489 | Market Approach | Adjustment based on market comparables | (62%) – 3% | (45%) | Decrease |
| | $7,938,833 | Market Approach | Transaction Price | $11.67 | $11.67 | Increase |
Health Care Technology | $3,092,693 | Market Approach | Transaction Price | $1.70 | $1.70 | Increase |
Pharmaceuticals | $6,888,227 | Market Approach | Transaction Price | $2.44 | $2.44 | Increase |
Software | $5,512,910 | Market Approach | Transaction Price | $2.85 | $2.85 | Increase |
(1) Unobservable inputs were weighted by the relative fair value of securities.
There have been no significant changes in valuation techniques used in valuing any such positions held by the Fund since the beginning of the fiscal period.
Janus Henderson Global Life Sciences Fund
Notes to Financial Statements (unaudited)
The inputs or methodology used for fair valuing securities are not necessarily an indication of the risk associated with investing in those securities. The summary of inputs used as of March 31, 2023 to fair value the Fund’s investments in securities and other financial instruments is included in the “Valuation Inputs Summary” and "Level 3 Valuation Reconciliation of Assets" in the Notes to Schedule of Investments and Other Information.
The following describes the amounts of transfers into or out of Level 3 of the fair value hierarchy during the period.
Financial assets of $1,769,255 were transferred out of Level 3 to Level 2 since certain securities prices were determined using other significant observable inputs at the end of the current fiscal year and significant unobservable inputs at the end of the prior fiscal year.
Investment Transactions and Investment Income
Investment transactions are accounted for as of the date purchased or sold (trade date). Dividend income is recorded on the ex-dividend date. Certain dividends from foreign securities will be recorded as soon as the Fund is informed of the dividend, if such information is obtained subsequent to the ex-dividend date. Dividends from foreign securities may be subject to withholding taxes in foreign jurisdictions. Non-cash dividends, if any, are recorded on the ex-dividend date at fair value. Interest income is recorded daily on an accrual basis and includes amortization of premiums and accretion of discounts. The Fund classifies gains and losses on prepayments received as an adjustment to interest income. Debt securities may be placed in non-accrual status and related interest income may be reduced by stopping current accruals and writing off interest receivables when collection of all or a portion of interest has become doubtful. Gains and losses are determined on the identified cost basis, which is the same basis used for federal income tax purposes. Income, as well as gains and losses, both realized and unrealized, are allocated daily to each class of shares based upon the ratio of net assets represented by each class as a percentage of total net assets.
Expenses
The Fund bears expenses incurred specifically on its behalf. Each class of shares bears a portion of general expenses, which are allocated daily to each class of shares based upon the ratio of net assets represented by each class as a percentage of total net assets. Expenses directly attributable to a specific class of shares are charged against the operations of such class.
Estimates
The preparation of financial statements in conformity with US GAAP requires management to make estimates and assumptions that affect the reported amount of assets and liabilities and disclosure of contingent assets and liabilities at the date of the financial statements, and the reported amounts of income and expenses during the reporting period. Actual results could differ from those estimates.
Indemnifications
In the normal course of business, the Fund may enter into contracts that contain provisions for indemnification of other parties against certain potential liabilities. The Fund’s maximum exposure under these arrangements is unknown, and would involve future claims that may be made against the Fund that have not yet occurred. Currently, the risk of material loss from such claims is considered remote.
Foreign Currency Translations
The Fund does not isolate that portion of the results of operations resulting from the effect of changes in foreign exchange rates on investments from the fluctuations arising from changes in market prices of securities held at the date of the financial statements. Net unrealized appreciation or depreciation of investments and foreign currency translations arise from changes in the value of assets and liabilities, including investments in securities held at the date of the financial statements, resulting from changes in the exchange rates and changes in market prices of securities held.
Currency gains and losses are also calculated on payables and receivables that are denominated in foreign currencies. The payables and receivables are generally related to foreign security transactions and income translations.
Foreign currency-denominated assets and forward currency contracts may involve more risks than domestic transactions, including currency risk, counterparty risk, political and economic risk, regulatory risk and equity risk. Risks may arise from unanticipated movements in the value of foreign currencies relative to the U.S. dollar.
Janus Henderson Global Life Sciences Fund
Notes to Financial Statements (unaudited)
Dividends and Distributions
The Fund generally declares and distributes dividends of net investment income and realized capital gains (if any) annually. The Fund may treat a portion of the amount paid to redeem shares as a distribution of investment company taxable income and realized capital gains that are reflected in the net asset value. This practice, commonly referred to as “equalization,” has no effect on the redeeming shareholder or a Fund’s total return, but may reduce the amounts that would otherwise be required to be paid as taxable dividends to the remaining shareholders. It is possible that the Internal Revenue Service (IRS) could challenge the Fund's equalization methodology or calculations, and any such challenge could result in additional tax, interest, or penalties to be paid by the Fund.
The Fund may make certain investments in real estate investment trusts (“REITs”) which pay dividends to their shareholders based upon funds available from operations. It is quite common for these dividends to exceed the REITs’ taxable earnings and profits, resulting in the excess portion of such dividends being designated as a return of capital. If the Fund distributes such amounts, such distributions could constitute a return of capital to shareholders for federal income tax purposes.
Federal Income Taxes
The Fund intends to continue to qualify as a regulated investment company and distribute all of its taxable income in accordance with the requirements of Subchapter M of the Internal Revenue Code. Management has analyzed the Fund’s tax positions taken for all open federal income tax years, generally a three-year period, and has concluded that no provision for federal income tax is required in the Fund’s financial statements. The Fund is not aware of any tax positions for which it is reasonably possible that the total amounts of unrecognized tax benefits will significantly change in the next twelve months.
2. Other Investments and Strategies
Additional Investment Risk
The U.S. government and the Federal Reserve, as well as certain foreign governments and central banks, have taken extraordinary actions to support local and global economies and the financial markets in response to the COVID-19 pandemic. This and other government intervention into the economy and financial markets to address the COVID-19 pandemic may not work as intended, particularly if the efforts are perceived by investors as being unlikely to achieve the desired results. Government actions to mitigate the economic impact of the pandemic have resulted in a large expansion of government deficits and debt, the long term consequences of which are not known. The COVID-19 pandemic could adversely affect the value and liquidity of a Fund’s investments, impair a Fund’s ability to satisfy redemption requests, and negatively impact a Fund’s performance. In addition, the outbreak of COVID-19, and measures taken to mitigate its effects, could result in disruptions to the services provided to a Fund by its service providers.
Widespread disease, including pandemics and epidemics, and natural or environmental disasters, including those which may be attributable to global climate change, such as earthquakes, fires, floods, hurricanes, tsunamis and weather-related phenomena generally, have been and can be highly disruptive to economies and markets, adversely impacting individual companies, sectors, industries, markets, currencies, interest and inflation rates, credit ratings, investor sentiment, and other factors affecting the value of a Fund’s investments. Economies and financial markets throughout the world have become increasingly interconnected, which increases the likelihood that events or conditions in one region or country will adversely affect markets or issuers in other regions or countries, including the United States. These disruptions could prevent a Fund from executing advantageous investment decisions in a timely manner and negatively impact a Fund’s ability to achieve its investment objective(s). Any such event(s) could have a significant adverse impact on the value of a Fund. In addition, these disruptions could also impair the information technology and other operational systems upon which the Fund’s service providers, including the Adviser or the subadviser (as applicable), rely, and could otherwise disrupt the ability of employees of the Fund’s service providers to perform essential tasks on behalf of the Fund. Adverse weather conditions may also have a particularly significant negative effect on issuers in the agricultural sector and on insurance and reinsurance companies that insure or reinsure against the impact of natural disasters.
A number of countries in the European Union (the “EU”) have experienced, and may continue to experience, severe economic and financial difficulties. In particular, many EU nations are susceptible to economic risks associated with high levels of debt. Many non-governmental issuers, and even certain governments, have defaulted on, or been forced to restructure, their debts. Many other issuers have faced difficulties obtaining credit or refinancing existing obligations.
Janus Henderson Global Life Sciences Fund
Notes to Financial Statements (unaudited)
Financial institutions have in many cases required government or central bank support, have needed to raise capital, and/or have been impaired in their ability to extend credit. As a result, financial markets in the EU have experienced extreme volatility and declines in asset values and liquidity. These difficulties may continue, worsen, or spread further within the EU. Responses to these financial problems by European governments, central banks, and others, including austerity measures and reforms, may not work, may result in social unrest, and may limit future growth and economic recovery or have other unintended consequences. Among other things, these developments have adversely affected the value and exchange rate of the euro and pound sterling, and may continue to significantly affect the economies of all EU countries, which in turn may have a material adverse effect on the Fund’s investments in such countries, other countries that depend on EU countries for significant amounts of trade or investment, or issuers with exposure to debt issued by certain EU countries.
Restricted Security Transactions
Restricted securities held by the Fund may not be sold except in exempt transactions or in a public offering registered under the Securities Act of 1933, as amended. The risk of investing in such securities is generally greater than the risk of investing in the securities of widely held, publicly traded companies. Lack of a secondary market and resale restrictions may result in the inability of the Fund to sell a security at a fair price and may substantially delay the sale of the security. In addition, these securities may exhibit greater price volatility than securities for which secondary markets exist.
Counterparties
Fund transactions involving a counterparty are subject to the risk that the counterparty or a third party will not fulfill its obligation to the Fund (“counterparty risk”). Counterparty risk may arise because of the counterparty’s financial condition (i.e., financial difficulties, bankruptcy, or insolvency), market activities and developments, or other reasons, whether foreseen or not. A counterparty’s inability to fulfill its obligation may result in significant financial loss to the Fund. The Fund may be unable to recover its investment from the counterparty or may obtain a limited recovery, and/or recovery may be delayed. The extent of the Fund’s exposure to counterparty risk with respect to financial assets and liabilities approximates its carrying value. See the "Offsetting Assets and Liabilities" section of this Note for further details.
The Fund may be exposed to counterparty risk through participation in various programs, including, but not limited to, lending its securities to third parties, cash sweep arrangements whereby the Fund’s cash balance is invested in one or more types of cash management vehicles, as well as investments in, but not limited to, repurchase agreements, debt securities, and derivatives, including various types of swaps, futures and options. The Fund intends to enter into financial transactions with counterparties that the Adviser believes to be creditworthy at the time of the transaction. There is always the risk that the Adviser’s analysis of a counterparty’s creditworthiness is incorrect or may change due to market conditions. To the extent that the Fund focuses its transactions with a limited number of counterparties, it will have greater exposure to the risks associated with one or more counterparties.
Securities Lending
Under procedures adopted by the Trustees, the Fund may seek to earn additional income by lending securities to certain qualified broker-dealers and institutions. JPMorgan Chase Bank, National Association acts as securities lending agent and a limited purpose custodian or subcustodian to receive and disburse cash balances and cash collateral, hold short-term investments, hold collateral, and perform other custodial functions in accordance with the Non-Custodial Securities Lending Agreement. For financial reporting purposes, the Fund does not offset financial instruments’ payables and receivables and related collateral on the Statement of Assets and Liabilities. The Fund may lend fund securities in an amount equal to up to 1/3 of its total assets as determined at the time of the loan origination. There is the risk of delay in recovering a loaned security or the risk of loss in collateral rights if the borrower fails financially. In addition, the Adviser makes efforts to balance the benefits and risks from granting such loans. All loans will be continuously secured by collateral which may consist of cash, U.S. Government securities, domestic and foreign short-term debt instruments, letters of credit, time deposits, repurchase agreements, money market mutual funds or other money market accounts, or such other collateral as permitted by the SEC. If the Fund is unable to recover a security on loan, the Fund may use the collateral to purchase replacement securities in the market. There is a risk that the value of the collateral could decrease below the cost of the replacement security by the time the replacement investment is made, resulting in a loss to the Fund. In certain circumstances individual loan transactions could yield negative returns.
Upon receipt of cash collateral, the Adviser may invest it in affiliated or non-affiliated cash management vehicles, whether registered or unregistered entities, as permitted by the 1940 Act and rules promulgated thereunder. The Adviser currently intends to primarily invest the cash collateral in a cash management vehicle for which the Adviser
Janus Henderson Global Life Sciences Fund
Notes to Financial Statements (unaudited)
serves as investment adviser, Janus Henderson Cash Collateral Fund LLC, or in time deposits. An investment in Janus Henderson Cash Collateral Fund LLC is generally subject to the same risks that shareholders experience when investing in similarly structured vehicles, such as the potential for significant fluctuations in assets as a result of the purchase and redemption activity of the securities lending program, a decline in the value of the collateral, and possible liquidity issues. Such risks may delay the return of the cash collateral and cause the Fund to violate its agreement to return the cash collateral to a borrower in a timely manner. As adviser to the Fund and Janus Henderson Cash Collateral Fund LLC, the Adviser has an inherent conflict of interest as a result of its fiduciary duties to both the Fund and Janus Henderson Cash Collateral Fund LLC. Additionally, the Adviser receives an investment advisory fee of 0.05% for managing Janus Henderson Cash Collateral Fund LLC, but it may not receive a fee for managing certain other affiliated cash management vehicles in which the Fund may invest, and therefore may have an incentive to allocate preferred investment opportunities to investment vehicles for which it is receiving a fee.
The value of the collateral must be at least 102% of the market value of the loaned securities that are denominated in U.S. dollars and 105% of the market value of the loaned securities that are not denominated in U.S. dollars. Loaned securities and related collateral are marked-to-market each business day based upon the market value of the loaned securities at the close of business, employing the most recent available pricing information. Collateral levels are then adjusted based on this mark-to-market evaluation. Additional required collateral, or excess collateral returned, is delivered on the next business day. Therefore, the value of the collateral held may be temporarily less than 102% or 105% value of the securities on loan. The cash collateral invested by the Adviser is disclosed in the Schedule of Investments (if applicable).
Income earned from the investment of the cash collateral, net of rebates paid to, or fees paid by, borrowers and less the fees paid to the lending agent are included as “Affiliated securities lending income, net” on the Statement of Operations. As of March 31, 2023, securities lending transactions accounted for as secured borrowings with an overnight and continuous contractual maturity are $14,185,664. Gross amounts of recognized liabilities for securities lending (collateral received) as of March 31, 2023 is $14,452,600, resulting in the net amount due to the counterparty of $266,936.
Offsetting Assets and Liabilities
The Fund presents gross and net information about transactions that are either offset in the financial statements or subject to an enforceable master netting arrangement or similar agreement with a designated counterparty, regardless of whether the transactions are actually offset in the Statement of Assets and Liabilities.
The Offsetting Assets and Liabilities table located in the Schedule of Investments presents gross amounts of recognized assets and/or liabilities and the net amounts after deducting collateral that has been pledged by counterparties or has been pledged to counterparties (if applicable). For corresponding information grouped by type of instrument, see the Fund's Schedule of Investments.
3. Investment Advisory Agreements and Other Transactions with Affiliates
The Fund pays the Adviser an investment advisory fee which is calculated daily and paid monthly. The Fund’s contractual investment advisory fee rate (expressed as an annual rate) is 0.64% of its average daily net assets.
The Adviser serves as administrator to the Fund pursuant to an administration agreement between the Adviser and the Trust. Under the administration agreement, the Adviser is authorized to perform, or cause others to perform certain administration, compliance, and accounting services to the Fund, including providing office space for the Fund, and is reimbursed by the Fund for certain of its costs in providing these services (to the extent the Adviser seeks reimbursement and such costs are not otherwise waived). In addition, employees of the Adviser and/or its affiliates may serve as officers of the Trust. The Fund pays for some or all of the salaries, fees, and expenses of the Adviser employees and Fund officers, with respect to certain specified administration functions they perform on behalf of the Fund. The Fund pays these costs based on out-of-pocket expenses incurred by the Adviser, and these costs are separate and apart from advisory fees and other expenses paid in connection with the investment advisory services the Adviser (or any subadvisor, as applicable) provides to the Fund. These amounts are disclosed as “Affiliated fund administration fees” on the Statement of Operations. In addition, some expenses related to compensation payable to the Fund’s Chief Compliance Officer and certain compliance staff, all of whom are employees of the Adviser and/or its affiliates, are shared with the Fund. Total compensation of $114,430 was paid to the Chief Compliance Officer and certain compliance staff by the Trust during the period ended March 31, 2023. The Fund's portion is reported as part of “Other expenses” on the Statement of Operations.
Janus Henderson Global Life Sciences Fund
Notes to Financial Statements (unaudited)
Janus Henderson Services US LLC (the “Transfer Agent”), a wholly-owned subsidiary of the Adviser, is the Fund’s transfer agent. The Transfer Agent provides or arranges for the provision of shareholder services including, but not limited to, recordkeeping, subaccounting, answering inquiries regarding accounts, order processing, transaction confirmations, the mailing of prospectuses and shareholder reports, and other shareholder services provided to or on behalf of shareholders. These amounts are disclosed as “Transfer agent administrative fees and expenses” on the Statement of Operations.
Class D Shares of the Fund pay the Transfer Agent an annual administrative services fee based on the average daily net assets of Class D Shares as detailed below.
| | |
Average Daily Net Assets of Class D Shares of the Janus Henderson funds | Administrative Services Fee |
Under $40 billion | 0.12% |
$40 billion – $49.9 billion | 0.10% |
Over $49.9 billion | 0.08% |
During the reporting period, the administrative services fee rate was 0.12%.
The Transfer Agent receives an administrative services fee at an annual rate of up to 0.25% of the average daily net assets of the Fund’s Class S Shares and Class T Shares for providing or procuring administrative services to investors in Class S Shares and Class T Shares of the Fund. The Transfer Agent expects to use all or a significant portion of this fee to compensate retirement plan service providers, broker-dealers, bank trust departments, financial advisors, and other financial intermediaries for providing these services. The Transfer Agent may keep certain amounts retained for reimbursement of out-of-pocket costs incurred for servicing clients of Class S Shares and Class T Shares.
Shareholder Services provided by these financial intermediaries may include, but are not limited to, recordkeeping, subaccounting, order processing, providing order confirmations, periodic statements, forwarding prospectuses, shareholder reports, and other materials to existing customers, answering inquiries regarding accounts, and other administrative services. Order processing includes the submission of transactions through the National Securities Clearing Corporation (“NSCC”) or similar systems, or those processed on a manual basis with the Adviser. For all share classes, the Transfer Agent also seeks reimbursement for costs it incurs as transfer agent and for providing servicing.
Certain, but not all, intermediaries may charge administrative fees to investors in Class A Shares, Class C Shares, and Class I Shares for administrative services provided on behalf of such investors. These administrative fees are paid by the Class A Shares, Class C Shares, and Class I Shares of the Fund to the Transfer Agent, which uses such fees to reimburse intermediaries. Consistent with the Transfer Agency Agreement between the Transfer Agent and the Fund, the Transfer Agent may negotiate the level, structure, and/or terms of the administrative fees with intermediaries requiring such fees on behalf of the Fund. The Adviser and its affiliates benefit from an increase in assets that may result from such relationships. The Adviser has agreed to limit these fees up to 0.20% for Class A Shares and Class C Shares, and up to 0.15% for Class I Shares on an annual basis based on the daily net assets of each share class. Such limits are subject to change by the Trustees in the future. These amounts are disclosed as “Transfer agent networking and omnibus fees” on the Statement of Operations.
The Transfer Agent is not compensated for its services related to the shares, except for out-of-pocket costs, although the Transfer Agent is compensated for its services related to Fund’s Class D Shares. These amounts are disclosed as “Other transfer agent fees and expenses” on the Statement of Operations.
Under distribution and shareholder servicing plans (the “Plans”) adopted in accordance with Rule 12b-1 under the 1940 Act, the Fund pays the Trust’s distributor, the Distributor, a wholly-owned subsidiary of the Adviser, a fee for the sale and distribution and/or shareholder servicing of the shares based on the average daily net assets for each share class at an annual rate of up to 0.25% for Class A Shares, up to 1.00% for Class C Shares, and up to 0.25% for Class S Shares. Under the terms of the Plans, the Trust is authorized to make payments to the Distributor for remittance to retirement plan service providers, broker-dealers, bank trust departments, financial advisors, and other financial intermediaries, as compensation for distribution and/or shareholder services performed by such entities for their customers who are investors in the Fund. These amounts are disclosed as “12b-1 Distribution and shareholder servicing fees” on the Statement of Operations.
Janus Henderson Global Life Sciences Fund
Notes to Financial Statements (unaudited)
Class A Shares include a 5.75% upfront sales charge of the offering price of the Fund. The sales charge is allocated between the Distributor and financial intermediaries. During the period ended March 31, 2023, the Distributor retained upfront sales charges of $27,516.
A contingent deferred sales charge (“CDSC”) of 1.00% will be deducted with respect to Class A Shares purchased without a sales load and redeemed within 12 months of purchase, unless waived. Any applicable CDSC will be 1.00% of the lesser of the original purchase price or the value of the redemption of the Class A Shares redeemed. There were no CDSCs paid by redeeming shareholders of Class A Shares to the Distributor during the period ended March 31, 2023.
A CDSC of 1.00% will be deducted with respect to Class C Shares redeemed within 12 months of purchase, unless waived. Any applicable CDSC will be 1.00% of the lesser of the original purchase price or the value of the redemption of the Class C Shares redeemed. During the period ended March 31, 2023, redeeming shareholders of Class C Shares paid CDSCs of $839.
The Board of Trustees has adopted a deferred compensation plan (the “Deferred Plan”) for independent Trustees to elect to defer receipt of all or a portion of the annual compensation they are entitled to receive from the Fund. All deferred fees are credited to an account established in the name of the Trustees. The amounts credited to the account then increase or decrease, as the case may be, in accordance with the performance of one or more of the Janus Henderson funds that are selected by the Trustees. The account balance continues to fluctuate in accordance with the performance of the selected fund or funds until final payment of all amounts are credited to the account. The fluctuation of the account balance is recorded by the Fund as unrealized appreciation/(depreciation) and is included as of March 31, 2023 on the Statement of Assets and Liabilities in the asset, “Trustees’ deferred compensation,” and liability, “Trustees’ deferred compensation fees.” Additionally, the recorded unrealized appreciation/(depreciation) is included in “Total distributable earnings (loss)” on the Statement of Assets and Liabilities. Deferred compensation expenses for the period ended March 31, 2023 are included in “Trustees’ fees and expenses” on the Statement of Operations. Trustees are allowed to change their designation of mutual funds from time to time. Amounts will be deferred until distributed in accordance with the Deferred Plan. Deferred fees of $205,688 were paid by the Trust to the Trustees under the Deferred Plan during the period ended March 31, 2023.
Pursuant to the provisions of the 1940 Act and related rules, the Fund may participate in an affiliated or non-affiliated cash sweep program. In the cash sweep program, uninvested cash balances of the Fund may be used to purchase shares of affiliated or non-affiliated money market funds or cash management pooled investment vehicles that operate as money market funds. The Fund is eligible to participate in the cash sweep program (the “Investing Funds”). The Adviser has an inherent conflict of interest because of its fiduciary duties to the affiliated money market funds or cash management pooled investment vehicles and the Investing Funds. Janus Henderson Cash Liquidity Fund LLC (the “Sweep Vehicle”) is an affiliated unregistered cash management pooled investment vehicle that invests primarily in highly-rated short-term fixed-income securities. The Sweep Vehicle operates pursuant to the provisions of the 1940 Act that govern the operation of money market funds and prices its shares at NAV reflecting market-based values of its portfolio securities (i.e., a “floating” NAV) rounded to the fourth decimal place (e.g., $1.0000). The Sweep Vehicle is permitted to impose a liquidity fee (of up to 2%) on redemptions from the Sweep Vehicle or a redemption gate that temporarily suspends redemptions from the Sweep Vehicle for up to 10 business days during a 90 day period. There are no restrictions on the Fund's ability to withdraw investments from the Sweep Vehicle at will, and there are no unfunded capital commitments due from the Fund to the Sweep Vehicle. The Sweep Vehicle does not charge any management fee, sales charge or service fee.
Any purchases and sales, realized gains/losses and recorded dividends from affiliated investments during the period ended March 31, 2023 can be found in the “Schedules of Affiliated Investments” located in the Schedule of Investments.
The Fund is permitted to purchase or sell securities (“cross-trade”) between itself and other funds or accounts managed by the Adviser in accordance with Rule 17a-7 under the Investment Company Act of 1940 (“Rule 17a-7”), when the transaction is consistent with the investment objectives and policies of the Fund and in accordance with the Internal Cross Trade Procedures adopted by the Trust’s Board of Trustees. These procedures have been designed to ensure that any cross-trade of securities by the Fund from or to another fund or account that is or could be considered an affiliate of the Fund under certain limited circumstances by virtue of having a common investment adviser, common Officer, or common Trustee complies with Rule 17a-7. Under these procedures, each cross-trade is effected at the
Janus Henderson Global Life Sciences Fund
Notes to Financial Statements (unaudited)
current market price to save costs where allowed. During the period ended March 31, 2023, the Fund engaged in cross trades amounting to $1,538,435 in purchases.
4. Federal Income Tax
Income and capital gains distributions are determined in accordance with income tax regulations that may differ from US GAAP. These differences are due to differing treatments for items such as net short-term gains, deferral of wash sale losses, foreign currency transactions, net investment losses, and capital loss carryovers.
The Fund has elected to treat gains and losses on forward foreign currency contracts as capital gains and losses, if applicable. Other foreign currency gains and losses on debt instruments are treated as ordinary income for federal income tax purposes pursuant to Section 988 of the Internal Revenue Code.
The aggregate cost of investments and the composition of unrealized appreciation and depreciation of investment securities for federal income tax purposes as of March 31, 2023 are noted below. The primary differences between book and tax appreciation or depreciation of investments are wash sale loss deferrals, investments in partnerships, and investments in passive foreign investment companies.
| | | | |
Federal Tax Cost | Unrealized
Appreciation | Unrealized
(Depreciation) | Net Tax Appreciation/
(Depreciation) |
$ 3,282,618,394 | $1,490,244,396 | $(123,476,678) | $ 1,366,767,718 |
Janus Henderson Global Life Sciences Fund
Notes to Financial Statements (unaudited)
5. Capital Share Transactions
| | | | | | | |
| | | | | | |
| | Period ended March 31, 2023 | | Year ended September 30, 2022 |
| | Shares | Amount | | Shares | Amount |
| | | | | | | |
Class A Shares: | | | | | |
Shares sold | 392,711 | $ 25,144,070 | | 735,975 | $ 46,852,292 |
Reinvested dividends and distributions | 2,213 | 143,406 | | 283,164 | 18,688,820 |
Shares repurchased | (370,478) | (23,714,163) | | (831,936) | (53,068,008) |
Net Increase/(Decrease) | 24,446 | $ 1,573,313 | | 187,203 | $ 12,473,104 |
Class C Shares: | | | | | |
Shares sold | 66,603 | $ 3,798,305 | | 145,429 | $ 8,363,484 |
Reinvested dividends and distributions | - | - | | 229,759 | 13,525,931 |
Shares repurchased | (408,048) | (23,058,513) | | (716,737) | (40,378,430) |
Net Increase/(Decrease) | (341,445) | $ (19,260,208) | | (341,549) | $ (18,489,015) |
Class D Shares: | | | | | |
Shares sold | 523,362 | $ 34,424,024 | | 824,955 | $ 53,865,569 |
Reinvested dividends and distributions | 64,477 | 4,270,307 | | 2,417,153 | 163,061,184 |
Shares repurchased | (1,043,776) | (68,412,311) | | (2,268,686) | (149,073,565) |
Net Increase/(Decrease) | (455,937) | $ (29,717,980) | | 973,422 | $ 67,853,188 |
Class I Shares: | | | | | |
Shares sold | 2,487,916 | $163,710,219 | | 3,435,132 | $224,972,692 |
Reinvested dividends and distributions | 36,192 | 2,401,366 | | 1,185,696 | 80,141,190 |
Shares repurchased | (1,755,413) | (115,431,060) | | (5,041,043) | (326,610,426) |
Net Increase/(Decrease) | 768,695 | $ 50,680,525 | | (420,215) | $ (21,496,544) |
Class N Shares: | | | | | |
Shares sold | 3,232,686 | $208,282,250 | | 756,520 | $ 50,543,407 |
Reinvested dividends and distributions | 20,622 | 1,362,480 | | 259,287 | 17,452,575 |
Shares repurchased | (611,943) | (40,023,477) | | (1,065,372) | (68,124,208) |
Net Increase/(Decrease) | 2,641,365 | $169,621,253 | | (49,565) | $ (128,226) |
Class S Shares: | | | | | |
Shares sold | 52,358 | $ 3,280,181 | | 106,733 | $ 6,976,861 |
Reinvested dividends and distributions | - | - | | 41,766 | 2,696,808 |
Shares repurchased | (27,464) | (1,733,042) | | (110,603) | (6,869,139) |
Net Increase/(Decrease) | 24,894 | $ 1,547,139 | | 37,896 | $ 2,804,530 |
Class T Shares: | | | | | |
Shares sold | 772,451 | $ 50,527,301 | | 1,010,460 | $ 65,704,756 |
Reinvested dividends and distributions | 26,018 | 1,713,815 | | 1,809,837 | 121,421,995 |
Shares repurchased | (1,122,834) | (72,934,582) | | (2,810,104) | (183,234,039) |
Net Increase/(Decrease) | (324,365) | $ (20,693,466) | | 10,193 | $ 3,892,712 |
6. Purchases and Sales of Investment Securities
For the period ended March 31, 2023, the aggregate cost of purchases and proceeds from sales of investment securities (excluding any short-term securities, short-term options contracts, TBAs, and in-kind transactions, as applicable) was as follows:
| | | | |
Purchases of
Securities | Proceeds from Sales
of Securities | Purchases of Long-
Term U.S. Government
Obligations | Proceeds from Sales
of Long-Term U.S.
Government Obligations |
$ 913,473,926 | $ 720,195,840 | $ - | $ - |
7.Recent Accounting Pronouncements
The FASB issued Accounting Standards Update 2022-03: Fair Value Measurement of Equity Securities Subject to Contractual Sale Restrictions (“ASU 2022-03”) in June 2022. The new guidance in the ASU clarifies existing guidance
Janus Henderson Global Life Sciences Fund
Notes to Financial Statements (unaudited)
in ASC 820 related to the fair value measurement of an equity security subject to contractual sale restrictions with the intent to reduce diversity in interpretation. Under the guidance, a contractual restriction on the sale of an equity security would not be considered when measuring fair value as such restriction is not treated as part of the equity security’s unit of account. The amendments would be applied prospectively on or after adoption date to equity securities with a contract containing a sale restriction that is executed or modified after such date. The effective date set by the FASB is December 15, 2023, with early adoption permitted. The Adviser is currently evaluating whether to early adopt and does not anticipate it to have a material impact on the Fund.
8. Subsequent Event
Management has evaluated whether any events or transactions occurred subsequent to March 31, 2023 and through the date of issuance of the Fund’s financial statements and determined that there were no material events or transactions that would require recognition or disclosure in the Fund’s financial statements.
Janus Henderson Global Life Sciences Fund
Additional Information (unaudited)
Proxy Voting Policies and Voting Record
A description of the policies and procedures that the Fund uses to determine how to vote proxies relating to its portfolio securities is available without charge: (i) upon request, by calling 1-800-525-1093; (ii) on the Fund’s website at janushenderson.com/proxyvoting; and (iii) on the SEC’s website at http://www.sec.gov. Additionally, information regarding the Fund’s proxy voting record for the most recent twelve-month period ended June 30 is also available, free of charge, through janushenderson.com/proxyvoting and from the SEC’s website at http://www.sec.gov.
Full Holdings
The Fund files its complete portfolio holdings (schedule of investments) with the SEC as an exhibit to Form N-PORT within 60 days of the end of the first and third fiscal quarters, and in the annual report and semiannual report to shareholders. The Fund’s Form N-PORT filings and annual and semiannual reports: (i) are available on the SEC’s website at http://www.sec.gov; and (ii) are available without charge, upon request, by calling a Janus Henderson representative at 1-877-335-2687 (toll free) (or 1-800-525-3713 if you hold Class D Shares). Portfolio holdings consisting of at least the names of the holdings are generally available on a monthly basis with a 30-day lag under Full Holdings for the Fund at janushenderson.com/info (or janushenderson.com/reports if you hold Class D Shares).
APPROVAL OF ADVISORY AGREEMENTS DURING THE PERIOD
The Trustees of Janus Aspen Series, each of whom serves as an “independent” Trustee (the “Trustees”), oversee the management of each portfolio of Janus Aspen Series (each, a “VIT Portfolio,” and collectively, the “VIT Portfolios”), as well as each fund of Janus Investment Fund (each, a “Fund,” and collectively, the “Funds” and together with the VIT Portfolios, the “Janus Henderson Funds,” and each, a “Janus Henderson Fund”). As required by law, the Trustees determine annually whether to continue the investment advisory agreement for each Janus Henderson Fund.
In connection with their most recent consideration of those agreements for each Janus Henderson Fund, the Trustees received and reviewed information provided by Janus Henderson Investors US LLC (the “Adviser”) in response to requests of the Trustees and their independent legal counsel. They also received and reviewed information and analysis provided by, and in response to requests of, their independent fee consultant. Throughout their consideration of the agreements, the Trustees were advised by their independent legal counsel. The Trustees met with management to consider the agreements, and also met separately in executive session with their independent legal counsel and their independent fee consultant.
At meetings held on November 9-10, 2022 and December 13-14, 2022, the Trustees evaluated the information provided by the Adviser and the independent fee consultant, as well as other information provided by the Adviser and the independent fee consultant during the year. Following such evaluation, the Trustees determined that the overall arrangements between each Janus Henderson Fund and the Adviser were fair and reasonable in light of the nature, extent, and quality of the services provided by the Adviser and its affiliates, the fees charged for those services, and other matters that the Trustees considered relevant in the exercise of their business judgment, and unanimously approved the continuation of the investment advisory agreement for each Janus Henderson Fund for the period from February 1, 2023 through February 1, 2024, subject to earlier termination as provided for in each agreement.
In considering the continuation of those agreements, the Trustees reviewed and analyzed various factors that they determined were relevant, including the factors described below, none of which by itself was considered dispositive. However, the material factors and conclusions that formed the basis for the Trustees’ determination to approve the continuation of the agreements are discussed separately below. Also included is a summary of the independent fee consultant’s conclusions and opinions that arose during, and were included as part of, the Trustees’ consideration of the agreements. “Management fees,” as used herein, reflect actual annual advisory fees and, for the purpose of peer comparisons any administration fees (excluding out of pocket costs), net of any waivers, paid by a fund as a percentage of average net assets.
Nature, Extent and Quality of Services
The Trustees reviewed the nature, extent, and quality of the services provided by the Adviser to the Janus Henderson Funds, taking into account the investment objective, strategies, and policies of each Janus Henderson Fund, and the knowledge the Trustees gained from their regular meetings with management on at least a quarterly basis and their ongoing review of information related to the Janus Henderson Funds. In addition, the Trustees reviewed the resources and key personnel of the Adviser, particularly noting those employees who provide investment and risk management services to the Janus Henderson Funds. The Trustees also considered other services provided to the Janus Henderson
Janus Henderson Global Life Sciences Fund
Additional Information (unaudited)
Funds by the Adviser, such as managing the execution of portfolio transactions and the selection of broker-dealers for those transactions. The Trustees considered the Adviser’s role as administrator to the Janus Henderson Funds, noting that the Adviser generally does not receive a fee for its services as administrator, but is reimbursed for its out-of-pocket costs. The Trustees considered the role of the Adviser in monitoring adherence to the Janus Henderson Funds’ investment restrictions, providing support services for the Trustees and Trustee committees, and overseeing communications with Janus Henderson Fund shareholders and the activities of other service providers, including monitoring compliance with various policies and procedures of the Janus Henderson Funds and with applicable securities laws and regulations.
In this regard, the independent fee consultant noted that the Adviser provides a number of different services for the Janus Henderson Funds and their shareholders, ranging from investment management services to various other servicing functions, and that, in its view, the Adviser is a capable provider of those services. The independent fee consultant also provided its belief that the Adviser has developed a number of institutional competitive advantages that should enable it to provide superior investment and service performance over the long term.
The Trustees concluded that the nature, extent, and quality of the services provided by the Adviser to each Janus Henderson Fund were appropriate and consistent with the terms of the respective advisory agreements, and that, taking into account steps taken to address those Janus Henderson Funds whose performance lagged that of their peers for certain periods, the Janus Henderson Funds were likely to benefit from the continued provision of those services. They also concluded that the Adviser had sufficient personnel, with the appropriate education and experience, to serve the Janus Henderson Funds effectively and had demonstrated its ability to attract well-qualified personnel.
Performance of the Funds
The Trustees considered the performance results of each Janus Henderson Fund over various time periods. They noted that they considered Janus Henderson Fund performance data throughout the year, including periodic meetings with each Janus Henderson Fund’s portfolio manager(s), and also reviewed information comparing each Janus Henderson Fund’s performance with the performance of comparable fund peer groups identified by Broadridge Financial Solutions, Inc. (“Broadridge”), an independent data provider, and with the Janus Henderson Fund’s benchmark index. In this regard, the independent fee consultant found that the overall Janus Henderson Funds’ performance has been reasonable, noting that: (i) for the 36 months ended May 31, 2022, approximately 38% of the Janus Henderson Funds were in the top two quartiles of their Broadridge peer groups; (ii) for the 36 months ended September 30, 2022, approximately 45% of the Janus Henderson Funds were in the top two quartiles of performance as reported by Morningstar, and (iii) for the 12 months ended September 30, 2022, approximately 55% of the Janus Henderson Funds were in the top two quartiles of performance as reported by Morningstar.
The Trustees considered the performance of each Janus Henderson Fund, noting that performance may vary by share class, and noted the following with respect to the Funds:
Asset Allocation Funds
· For Janus Henderson Global Allocation Fund – Conservative, the Trustees noted that the Fund’s performance was in the third Broadridge quartile for the 36 months ended May 31, 2022 and the bottom Broadridge quartile for the 12 months ended May 31, 2022. The Trustees noted the reasons for the Fund’s underperformance and the steps the Adviser had taken or was taking to improve performance.
· For Janus Henderson Global Allocation Fund – Growth, the Trustees noted that the Fund’s performance was in the bottom Broadridge quartile for the 36 months ended May 31, 2022 and the bottom Broadridge quartile for the 12 months ended May 31, 2022. The Trustees noted the reasons for the Fund’s underperformance and the steps the Adviser had taken or was taking to improve performance.
· For Janus Henderson Global Allocation Fund – Moderate, the Trustees noted that the Fund’s performance was in the bottom Broadridge quartile for the 36 months ended May 31, 2022 and the bottom Broadridge quartile for the 12 months ended May 31, 2022. The Trustees noted the reasons for the Fund’s underperformance and the steps the Adviser had taken or was taking to improve performance.
Fixed-Income Funds
· For Janus Henderson Absolute Return Income Opportunities Fund, the Trustees noted that the Fund’s performance was in the third Broadridge quartile for the 36 months ended May 31, 2022 and the first Broadridge quartile for the 12 months ended May 31, 2022. The Trustees noted the reasons for the Fund’s underperformance,
Janus Henderson Global Life Sciences Fund
Additional Information (unaudited)
the steps the Adviser had taken or was taking to improve performance, and that the performance trend was improving.
· For Janus Developed World Bond Fund, the Trustees noted that the Fund’s performance was in the bottom Broadridge quartile for the 36 months ended May 31, 2022 and the bottom Broadridge quartile for the 12 months ended May 31, 2022. The Trustees noted the reasons for the Fund’s underperformance and the steps the Adviser had taken or was taking to improve performance.
· For Janus Henderson Flexible Bond Fund, the Trustees noted that the Fund’s performance was in the first Broadridge quartile for the 36 months ended May 31, 2022 and the second Broadridge quartile for the 12 months ended May 31, 2022.
· For Janus Henderson Global Bond Fund, the Trustees noted that the Fund’s performance was in the third Broadridge quartile for the 36 months ended May 31, 2022 and the bottom Broadridge quartile for the 12 months ended May 31, 2022. The Trustees noted the reasons for the Fund’s underperformance and the steps the Adviser had taken or was taking to improve performance.
· For Janus Henderson High-Yield Fund, the Trustees noted that the Fund’s performance was in the third Broadridge quartile for the 36 months ended May 31, 2022 and the bottom Broadridge quartile for the 12 months ended May 31, 2022. The Trustees noted the reasons for the Fund’s underperformance and the steps the Adviser had taken or was taking to improve performance.
· For Janus Henderson Multi-Sector Income Fund, the Trustees noted that the Fund’s performance was in the second Broadridge quartile for the 36 months ended May 31, 2022 and the third Broadridge quartile for the 12 months ended May 31, 2022.
· For Janus Henderson Short Duration Flexible Bond Fund, the Trustees noted that the Fund’s performance was in the third Broadridge quartile for the 36 months ended May 31, 2022 and the bottom Broadridge quartile for the 12 months ended May 31, 2022. The Trustees noted the reasons for the Fund’s underperformance and the steps the Adviser had taken or was taking to improve performance.
Global and International Equity Funds
· For Janus Henderson Asia Equity Fund, the Trustees noted that the Fund’s performance was in the third Broadridge quartile for the 36 months ended May 31, 2022 and the third Broadridge quartile for the 12 months ended May 31, 2022. The Trustees noted the reasons for the Fund’s underperformance, while also noting that the Fund has a performance fee structure that results in lower management fees during periods of underperformance, and the steps the Adviser had taken or was taking to improve performance.
· For Janus Henderson Emerging Markets Fund, the Trustees noted that the Fund’s performance was in the third Broadridge quartile for the 36 months ended May 31, 2022 and the third Broadridge quartile for the 12 months ended May 31, 2022. The Trustees noted the reasons for the Fund’s underperformance and the steps the Adviser had taken or was taking to improve performance.
· For Janus Henderson European Focus Fund, the Trustees noted that the Fund’s performance was in the first Broadridge quartile for the 36 months ended May 31, 2022 and the second Broadridge quartile for the 12 months ended May 31, 2022.
· For Janus Henderson Global Equity Income Fund, the Trustees noted that the Fund’s performance was in the third Broadridge quartile for the 36 months ended May 31, 2022 and the first Broadridge quartile for the 12 months ended May 31, 2022. The Trustees noted the reasons for the Fund’s underperformance, the steps the Adviser had taken or was taking to improve performance, and that the performance trend was improving.
· For Janus Henderson Global Life Sciences Fund, the Trustees noted that the Fund’s performance was in the third Broadridge quartile for the 36 months ended May 31, 2022 and the second Broadridge quartile for the 12 months ended May 31, 2022. The Trustees noted the reasons for the Fund’s underperformance, the steps the Adviser had taken or was taking to improve performance, and that the performance trend was improving.
· For Janus Henderson Global Sustainable Equity Fund, the Trustees noted that the Fund’s performance was in the second Broadridge quartile for the 12 months ended May 31, 2022. The Trustees noted that 36 month-end performance was not yet available.
Janus Henderson Global Life Sciences Fund
Additional Information (unaudited)
· For Janus Henderson Global Real Estate Fund, the Trustees noted that the Fund’s performance was in the second Broadridge quartile for the 36 months ended May 31, 2022 and the bottom Broadridge quartile for the 12 months ended May 31, 2022.
· For Janus Henderson Global Research Fund, the Trustees noted that the Fund’s performance was in the second Broadridge quartile for the 36 months ended May 31, 2022 and the first Broadridge quartile for the 12 months ended May 31, 2022.
· For Janus Henderson Global Select Fund, the Trustees noted that the Fund’s performance was in the first Broadridge quartile for the 36 months ended May 31, 2022 and the first Broadridge quartile for the 12 months ended May 31, 2022.
· For Janus Henderson Global Technology and Innovation Fund, the Trustees noted that the Fund’s performance was in the second Broadridge quartile for the 36 months ended May 31, 2022 and the second Broadridge quartile for the 12 months ended May 31, 2022.
· For Janus Henderson International Opportunities Fund, the Trustees noted that the Fund’s performance was in the bottom Broadridge quartile for the 36 months ended May 31, 2022 and the third Broadridge quartile for the 12 months ended May 31, 2022. The Trustees noted the reasons for the Fund’s underperformance and the steps the Adviser had taken or was taking to improve performance.
· For Janus Henderson Overseas Fund, the Trustees noted that the Fund’s performance was in the first Broadridge quartile for the 36 months ended May 31, 2022 and the first Broadridge quartile for the 12 months ended May 31, 2022.
· For Janus Henderson Responsible International Dividend Fund (formerly the Janus Henderson Dividend & Income Builder Fund), the Trustees noted that the Fund’s performance was in the bottom Broadridge quartile for the 36 months ended May 31, 2022 and the bottom Broadridge quartile for the 12 months ended May 31, 2022. The Trustees noted the reasons for the Fund’s underperformance and the steps the Adviser had taken or was taking to improve performance.
Money Market Funds
· For Janus Henderson Government Money Market Fund, the Trustees noted that the Fund’s performance was in the third Broadridge quartile for the 36 months ended May 31, 2022 and the bottom Broadridge quartile for the 12 months ended May 31, 2022. The Trustees noted the reasons for the Fund’s underperformance and the steps the Adviser had taken or was taking to improve performance.
· For Janus Henderson Money Market Fund, the Trustees noted that the Fund’s performance was in the third Broadridge quartile for the 36 months ended May 31, 2022 and the bottom Broadridge quartile for the 12 months ended May 31, 2022. The Trustees noted the reasons for the Fund’s underperformance and the steps the Adviser had taken or was taking to improve performance.
Multi-Asset Funds
· For Janus Henderson Adaptive Global Allocation Fund, the Trustees noted that the Fund’s performance was in bottom Broadridge quartile for the 36 months ended May 31, 2022 and the second Broadridge quartile for the 12 months ended May 31, 2022. The Trustees noted the reasons for the Fund’s underperformance, the steps the Adviser had taken or was taking to improve performance, and that the performance trend was improving.
· For Janus Henderson Balanced Fund, the Trustees noted that the Fund’s performance was in the first Broadridge quartile for the 36 months ended May 31, 2022 and the first Broadridge quartile for the 12 months ended May 31, 2022.
U.S. Equity Funds
· For Janus Henderson Adaptive Risk Managed U.S. Equity Fund, the Trustees noted that the Fund’s performance was in the bottom Broadridge quartile for the 36 months ended May 31, 2022 and the second Broadridge quartile for the 12 months ended May 31, 2022. The Trustees noted the reasons for the Fund’s underperformance, the steps the Adviser had taken or were taking to improve performance, and that the performance trend was improving.
Janus Henderson Global Life Sciences Fund
Additional Information (unaudited)
· For Janus Henderson Contrarian Fund, the Trustees noted that the Fund’s performance was in the first Broadridge quartile for the 36 months ended May 31, 2022 and the bottom Broadridge quartile for the 12 months ended May 31, 2022.
· For Janus Henderson Enterprise Fund, the Trustees noted that the Fund’s performance was in the second Broadridge quartile for the 36 months ended May 31, 2022 and the first Broadridge quartile for the 12 months ended May 31, 2022.
· For Janus Henderson Forty Fund, the Trustees noted that the Fund’s performance was in the third Broadridge quartile for the 36 months ended May 31, 2022 and the bottom Broadridge quartile for the 12 months ended May 31, 2022. The Trustees noted the reasons for the Fund’s underperformance and the steps the Adviser had taken or was taking to improve performance.
· For Janus Henderson Growth and Income Fund, the Trustees noted that the Fund’s performance was in the bottom Broadridge quartile for the 36 months ended May 31, 2022 and the first Broadridge quartile for the 12 months ended May 31, 2022. The Trustees noted the reasons for the Fund’s underperformance, the steps the Adviser had taken or was taking to improve performance, and that the performance trend was improving.
· For Janus Henderson Mid Cap Value Fund, the Trustees noted that the Fund’s performance was in the bottom Broadridge quartile for the 36 months ended May 31, 2022 and the second Broadridge quartile for the 12 months ended May 31, 2022. The Trustees noted the reasons for the Fund’s underperformance, while also noting that the Fund has a performance fee structure that results in lower management fees during periods of underperformance, the steps the Adviser had taken or was taking to improve performance, and that the performance trend was improving.
· For Janus Henderson Research Fund, the Trustees noted that the Fund’s performance was in the third Broadridge quartile for the 36 months ended May 31, 2022 and the third Broadridge quartile for the 12 months ended May 31, 2022. The Trustees noted the reasons for the Fund’s underperformance, while also noting that the Fund has a performance fee structure that results in lower management fees during periods of underperformance and the steps the Adviser had taken or was taking to improve performance.
· For Janus Henderson Small Cap Value Fund, the Trustees noted that the Fund’s performance was in the bottom Broadridge quartile for the 36 months ended May 31, 2022 and the second Broadridge quartile for the 12 months ended May 31, 2022. The Trustees noted the reasons for the Fund’s underperformance, while also noting that the Fund has a performance fee structure that results in lower management fees during periods of underperformance, the steps the Adviser had taken or was taking to improve performance, and that the performance trend was improving.
· For Janus Henderson Small-Mid Cap Value Fund, the Trustees noted that the Fund’s performance was in the bottom Broadridge quartile for the 36 months ended May 31, 2022 and the second Broadridge quartile for the 12 months ended May 31, 2022. The Trustees noted the reasons for the Fund’s underperformance, while also noting that the Fund has a performance fee structure that results in lower management fees during periods of underperformance, the steps the Adviser had taken or was taking to improve performance, and that the performance trend is improving.
· For Janus Henderson Triton Fund, the Trustees noted that the Fund’s performance was in the bottom Broadridge quartile for the 36 months ended May 31, 2022 and the second Broadridge quartile for the 12 months ended May 31, 2022. The Trustees noted the reasons for the Fund’s underperformance, the steps the Adviser had taken or was taking to improve performance, and that the performance trend was improving.
· For Janus Henderson Venture Fund, the Trustees noted that the Fund’s performance was in the bottom Broadridge quartile for the 36 months ended May 31, 2022 and the second Broadridge quartile for the 12 months ended May 31, 2022. The Trustees noted the reasons for the Fund’s underperformance, the steps the Adviser had taken or was taking to improve performance, and that the performance trend was improving.
In consideration of each Janus Henderson Fund’s performance, the Trustees concluded that, taking into account the factors relevant to performance, as well as other considerations, including steps taken to improve performance, as applicable, the Janus Henderson Fund’s performance warranted continuation of such Janus Henderson Fund’s investment advisory agreement.
Janus Henderson Global Life Sciences Fund
Additional Information (unaudited)
Costs of Services Provided
The Trustees examined information regarding the fees and expenses of each Janus Henderson Fund in comparison to similar information for other comparable funds as provided by Broadridge, an independent data provider. They also reviewed an analysis of that information provided by their independent fee consultant. The independent fee consultant provided its belief that the management fees charged by the Adviser to each of the Janus Henderson Funds under the current investment advisory and administration agreements are reasonable in relation to the services provided by the Adviser. The independent fee consultant found: (1) the total expenses and management fees of the Janus Henderson Funds to be reasonable relative to other comparable mutual funds; (2) the total expenses, on average, were 6% under the average total expenses of the respective Broadridge peer group; and (3) the management fees for the Janus Henderson Funds, on average, were 5% under the average management fees for the respective Broadridge peer group. The Trustees also considered the total expenses for each share class of each Janus Henderson Fund compared to the average total expenses for its Broadridge Expense Group and to average total expenses for its Broadridge Expense Universe.
For Janus Henderson Funds with three or more years of performance history, the independent fee consultant also performed a systematic “focus list” analysis of expenses which assessed fund fees in the context of fund performance being delivered. Based on this analysis, the independent fee consultant found that the combination of service quality/performance and expenses on these individual Janus Henderson Funds was reasonable in light of performance trends, performance histories, changes in portfolio management, relative average net asset levels, and the existence of performance fees, breakpoints, and/or expense waivers on such Janus Henderson Funds.
The Trustees considered the methodology used by the Adviser in determining compensation payable to portfolio managers, the competitive environment for investment management talent, and the competitive market for mutual funds in different distribution channels.
The Trustees also reviewed management fees charged by the Adviser to comparable separate account clients and to comparable non-affiliated funds subadvised by the Adviser (for which the Adviser provides only or primarily portfolio management services). Although in most instances subadvisory and separate account fee rates for various investment strategies were lower than management fee rates for Janus Henderson Funds having a similar strategy, the Trustees considered that the Adviser noted that, under the terms of the management agreements with the Janus Henderson Funds, the Adviser performs significant additional services for the Janus Henderson Funds that it does not provide to those other clients, including administration services, oversight of the Janus Henderson Funds’ other service providers, Trustee support, regulatory compliance and numerous other services, and that, in serving the Janus Henderson Funds, the Adviser assumes many legal risks and other costs that it does not assume in servicing its other clients. Moreover, the Trustees noted that the independent fee consultant found that: (1) the management fees the Adviser charges to the Janus Henderson Funds are reasonable in relation to the management fees the Adviser charges to funds subadvised by the Adviser and to the fees the Adviser charges to its institutional separate account clients; (2) these subadvised and institutional separate accounts have different service and infrastructure needs and operate in markets very different from the retail fund market; (3) Janus Henderson mutual fund investors enjoy reasonable fees relative to the fees charged in these other markets; and (4) as part of its 2022 review, 9 of 11 Janus Henderson Funds have lower management fees than similar funds subadvised by the Adviser. The Trustees noted that for the two Janus Henderson Funds that did not, management fees for each were under the average of its 15(c) peer group.
The Trustees considered the fees for each Janus Henderson Fund for its fiscal year ended in 2021 and noted the following with regard to each Janus Henderson Fund’s total expenses, net of applicable fee waivers (the Fund’s “total expenses”) as reflected in the comparative information provided by Broadridge:
Asset Allocation Funds
· For Janus Henderson Global Allocation Fund – Conservative, the Trustees noted that, although the Fund’s total expenses exceeded the peer group average for certain share classes, overall the Fund’s total expenses were reasonable. The Trustees also noted that the Adviser has contractually agreed to limit the Fund’s expenses.
· For Janus Henderson Global Allocation Fund – Growth, the Trustees noted that, although the Fund’s total expenses exceeded the peer group average for certain share classes, overall the Fund’s total expenses were reasonable. The Trustees also noted that the Adviser has contractually agreed to limit the Fund’s expenses, although this limit did not apply because the Fund’s total expenses as shown were below the applicable fee limit.
Janus Henderson Global Life Sciences Fund
Additional Information (unaudited)
· For Janus Henderson Global Allocation Fund – Moderate, the Trustees noted that, although the Fund’s total expenses exceeded the peer group average for one share class, overall the Fund’s total expenses were reasonable. The Trustees also noted that the Adviser has contractually agreed to limit the Fund’s expenses.
Fixed-Income Funds
· For Janus Henderson Absolute Return Income Opportunities Fund, the Trustees noted that, although the Fund’s total expenses exceeded the peer group average for certain share classes, overall the Fund’s total expenses were reasonable. The Trustees also noted that the Adviser has contractually agreed to limit the Fund’s expenses.
· For Janus Henderson Developed World Bond Fund, the Trustees noted that, although the Fund’s total expenses exceeded the peer group average for one share class, overall the Fund’s total expenses were reasonable. The Trustees also noted that the Adviser has contractually agreed to limit the Fund’s expenses.
· For Janus Henderson Flexible Bond Fund, the Trustees noted that, although the Fund’s total expenses exceeded the peer group average for certain share classes, overall the Fund’s total expenses were reasonable. The Trustees also noted that the Adviser has contractually agreed to limit the Fund’s expenses, although this limit did not apply because the Fund’s total expenses as shown were below the applicable fee limit.
· For Janus Henderson Global Bond Fund, the Trustees noted that, although the Fund’s total expenses exceeded the peer group average for certain share classes, overall the Fund’s total expenses were reasonable. The Trustees also noted that the Adviser has contractually agreed to limit the Fund’s expenses.
· For Janus Henderson High-Yield Fund, the Trustees noted that, although the Fund’s total expenses exceeded the peer group average for certain share classes, overall the Fund’s total expenses were reasonable. The Trustees also noted that the Adviser has contractually agreed to limit the Fund’s expenses.
· For Janus Henderson Multi-Sector Income Fund, the Trustees noted that, although the Fund’s total expenses exceeded the peer group average for certain share classes, overall the Fund’s total expenses were reasonable. The Trustees also noted that the Adviser has contractually agreed to limit the Fund’s expenses.
· For Janus Henderson Short Duration Flexible Bond Fund, the Trustees noted that, although the Fund’s total expenses exceeded the peer group average for certain share classes, overall the Fund’s total expenses were reasonable. The Trustees also noted that the Adviser has contractually agreed to limit the Fund’s expenses.
Global and International Equity Funds
· For Janus Henderson Asia Equity Fund, the Trustees noted that, although the Fund’s total expenses exceeded the peer group average for certain share classes, overall the Fund’s total expenses were reasonable. The Trustees also noted that the Adviser has contractually agreed to limit the Fund’s expenses.
· For Janus Henderson Emerging Markets Fund, the Trustees noted that, although the Fund’s total expenses exceeded the peer group average for certain share classes, overall the Fund’s total expenses were reasonable. The Trustees also noted that the Adviser has contractually agreed to limit the Fund’s expenses.
· For Janus Henderson European Focus Fund, the Trustees noted that, although the Fund’s total expenses exceeded the peer group average for one share class, overall the Fund’s expenses were reasonable. The Trustees also noted that the Adviser has contractually agreed to limit the Fund’s expenses.
· For Janus Henderson Global Equity Income Fund, the Trustees noted that, although the Fund’s total expenses exceeded the peer group average for one share class, overall the Fund’s total expenses were reasonable. The Trustees also noted that the Adviser has contractually agreed to limit the Fund’s expenses, although this limit did not apply because the Fund’s total expenses as shown were below the applicable fee limit.
· For Janus Henderson Global Life Sciences Fund, the Trustees noted that the Fund’s total expenses were below the peer group average for all share classes.
· For Janus Henderson Global Real Estate Fund, the Trustees noted that, although the Fund’s total expenses exceeded the peer group average for certain share classes, overall the Fund’s total expenses were reasonable. The Trustees also noted that the Adviser has contractually agreed to limit the Fund’s expenses, although this limit did not apply because the Fund’s total expenses as shown were below the applicable fee limit.
Janus Henderson Global Life Sciences Fund
Additional Information (unaudited)
· For Janus Henderson Global Research Fund, the Trustees noted that, although the Fund’s total expenses exceeded the peer group average for one share class, overall the Fund’s total expenses were reasonable. The Trustees also noted that the Adviser has contractually agreed to limit the Fund’s expenses, although this limit did not apply because the Fund’s total expenses as shown were below the applicable fee limit.
· For Janus Henderson Global Select Fund, the Trustees noted that, although the Fund’s total expenses exceeded the peer group average for certain share classes, overall the Fund’s total expenses were reasonable. The Trustees also noted that the Adviser has contractually agreed to limit the Fund’s expenses.
· For Janus Henderson Global Sustainable Equity Fund, the Trustees noted that, although the Fund’s total expenses exceeded the peer group average for certain share classes, overall the Fund’s expenses were reasonable. The Trustees also noted that the Adviser has contractually agreed to limit the Fund’s expenses.
· For Janus Henderson Global Technology and Innovation Fund, the Trustees noted that the Fund’s total expenses were below the peer group average for all share classes.
· For Janus Henderson International Opportunities Fund, the Trustees noted that, although the Fund’s total expenses exceeded the peer group average for certain share classes, overall the Fund’s expenses were reasonable. The Trustees also noted that the Adviser has contractually agreed to limit the Fund’s expenses.
· For Janus Henderson Overseas Fund, the Trustees noted that although the Fund’s total expenses exceeded the peer group average for certain share classes, overall the Fund’s total expenses were reasonable. The Trustees also noted that the Adviser has contractually agreed to limit the Fund’s expenses, although this limit did not apply because the Fund’s total expenses as shown were below the applicable fee limit.
· For Janus Henderson Responsible International Dividend Fund (formerly the Janus Henderson Dividend & Income Builder Fund), the Trustees noted that, although the Fund’s total expenses exceeded the peer group for one share class, overall the Fund’s total expenses were reasonable. The Trustees also noted that the Adviser has contractually agreed to limit the Fund’s expenses.
Money Market Funds
· For Janus Henderson Government Money Market Fund, the Trustees noted that the Fund’s total expenses were below the peer group average for all share classes.
· For Janus Henderson Money Market Fund, the Trustees noted that the Fund’s total expenses were below the peer group average for all share classes.
Multi-Asset Funds
· For Janus Henderson Adaptive Global Allocation Fund, the Trustees noted that, that the Fund’s total expenses were below the peer group average for all share classes.
· For Janus Henderson Balanced Fund, the Trustees noted that, although the Fund’s total expenses exceeded the peer group average for certain share classes, overall the Fund’s total expenses were reasonable. The Trustees also noted that the Adviser has contractually agreed to limit the Fund’s expenses, although this limit did not apply because the Fund’s total expenses as shown were below the applicable fee limit.
U.S. Equity Funds
· For Janus Henderson Adaptive Risk Managed U.S. Equity Fund, the Trustees noted that, although the Fund’s total expenses exceeded the peer group average for certain share classes, overall the Fund’s total expenses were reasonable. The Trustees also noted that the Adviser has contractually agreed to limit the Fund’s expenses, although this limit did not apply because the Fund’s total expenses as shown were below the applicable fee limit.
· For Janus Henderson Contrarian Fund, the Trustees noted that, although the Fund’s total expenses exceeded the peer group average for all share classes, overall the Fund’s total expenses were reasonable. The Trustees also noted that the Adviser had contractually agreed to limit the Fund’s expenses.
· For Janus Henderson Enterprise Fund, the Trustees noted that, although the Fund’s total expenses exceeded the peer group average for certain share classes, overall the Fund’s total expenses were reasonable. The Trustees also noted that the Adviser has contractually agreed to limit the Fund’s expenses, although this limit did not apply because the Fund’s total expenses as shown were below the applicable fee limit.
Janus Henderson Global Life Sciences Fund
Additional Information (unaudited)
· For Janus Henderson Forty Fund, the Trustees noted that, although the Fund’s total expenses exceeded the peer group average for certain share classes, overall the Fund’s total expenses were reasonable. The Trustees also noted that the Adviser has contractually agreed to limit the Fund’s expenses, although this limit did not apply because the Fund’s total expenses as shown were below the applicable fee limit.
· For Janus Henderson Growth and Income Fund, the Trustees noted that, although the Fund’s total expenses exceeded the peer group average for certain share classes, overall the Fund’s total expenses were reasonable. The Trustees also noted that the Adviser has contractually agreed to limit the Fund’s expenses, although this limit did not apply because the Fund’s total expenses as shown were below the applicable fee limit.
· For Janus Henderson Mid Cap Value Fund, the Trustees noted that the Fund’s total expenses were below the peer group average for all share classes.
· For Janus Henderson Research Fund, the Trustees noted that, although the Fund’s total expenses exceeded the peer group average for certain share classes, overall the Fund’s total expenses were reasonable. The Trustees also noted that the Adviser has contractually agreed to limit the Fund’s expenses.
· For Janus Henderson Small Cap Value Fund, the Trustees noted that, although the Fund’s total expenses exceeded the peer group average for one share class, overall the Fund’s total expenses were reasonable. The Trustees also noted that the Adviser has contractually agreed to limit the Fund’s expenses, although this limit did not apply because the Fund’s total expenses as shown were below the applicable fee limit.
· For Janus Henderson Small-Mid Cap Value Fund, the Trustees noted that the Fund’s total expenses were below the peer group average for all share classes.
· For Janus Henderson Triton Fund, the Trustees noted that, although the Fund’s total expenses exceeded the peer group average for one share class, overall the Fund’s total expenses were reasonable. The Trustees also noted that the Adviser has contractually agreed to limit the Fund’s expenses, although this limit did not apply because the Fund’s total expenses as shown were below the applicable fee limit.
· For Janus Henderson Venture Fund, the Trustees noted that although the Fund’s total expenses exceeded the peer group average for one share class, overall the Fund’s total expenses were reasonable. The Trustees also noted that the Adviser has contractually agreed to limit the Fund’s expenses, although this limit did not apply because the Fund’s total expenses as shown were below the applicable fee limit.
The Trustees reviewed information on the overall profitability to the Adviser and its affiliates from their relationships with the Janus Henderson Funds, and considered profitability data of other publicly traded mutual fund advisers. The Trustees recognized that profitability comparisons among fund managers are difficult because of the variation in the type of comparative information that is publicly available, and the profitability of any fund manager is affected by numerous factors, including the organizational structure of the particular fund manager, differences in complex size, difference in product mix, difference in types of business (mutual fund, institutional and other), differences in the types of funds and other accounts it manages, possible other lines of business, the methodology for allocating expenses and the fund manager’s capital structure and cost of capital.
Additionally, the Trustees considered the estimated profitability to the Adviser from the investment management services it provided to each Janus Henderson Fund. In their review, the Trustees considered whether the Adviser receive adequate incentives and resources to manage the Janus Henderson Funds effectively. In reviewing profitability, the Trustees noted that the estimated profitability for an individual Janus Henderson Fund is necessarily a product of the allocation methodology utilized by the Adviser to allocate its expenses as part of the estimated profitability calculation. In this regard, the Trustees noted that the independent fee consultant found as part of its 2022 review that (1) the expense allocation methodology and rationales utilized by the Adviser were reasonable and (2) no clear correlation exists between expense allocations and operating margins. The Trustees also considered that the estimated profitability for an individual Janus Henderson Fund was influenced by a number of factors, including not only the allocation methodology selected, but also the presence of fee waivers and expense caps, and whether the Janus Henderson Fund’s investment management agreement contained breakpoints or a performance fee component. The Trustees determined, after taking into account these factors, among others, that the Adviser’s estimated profitability with respect to each Janus Henderson Fund was not unreasonable in relation to the services provided, and that the variation in the range of such estimated profitability among the Janus Henderson Funds was not a material factor in the Board’s approval of the reasonableness of any Janus Henderson Fund’s investment management fees.
Janus Henderson Global Life Sciences Fund
Additional Information (unaudited)
The Trustees concluded that the management fees payable by each Janus Henderson Fund to the Adviser were reasonable in relation to the nature, extent, and quality of the services provided, taking into account the fees charged by other advisers for managing comparable mutual funds with similar strategies, the fees the Adviser charges to other clients, and, as applicable, the impact of fund performance on management fees payable by the Janus Henderson Funds. The Trustees also concluded that each Janus Henderson Fund’s total expenses were reasonable, taking into account the size of the Janus Henderson Fund, the quality of services provided by the Adviser, the investment performance of the Janus Henderson Fund, and any expense limitations agreed to or provided by the Adviser.
Economies of Scale
The Trustees considered information about the potential for the Adviser to realize economies of scale as the assets of the Janus Henderson Funds increase. They noted that their independent fee consultant published a report to the Trustees in June 2022 which provided its research and analysis into economies of scale. They also noted that, although many Janus Henderson Funds pay advisory fees at a fixed base rate as a percentage of net assets, without any breakpoints or performance fees, their independent fee consultant concluded that 75% of these Janus Henderson Funds’ have contractual management fees (gross of waivers) below their Broadridge Expense Group averages. The Trustees also noted the following from the independent fee consultant’s report: (1) that 31% of Janus Henderson Funds had management fee breakpoints in place whereby investors pay lower management fees as fund AUM increases; (2) that 29% of Janus Henderson Funds have low flat-rate fees and performance fees where the Adviser is incentivized to invest in resources which drive Janus Henderson Fund performance; and (3) that 39% of Janus Henderson Funds have low flat-rate fees versus peers where investors pay low fixed fees when the Janus Henderson Fund is small/midsized and higher fees when the Janus Henderson Fund grows in assets. The Trustees also noted that the Janus Henderson Funds share directly in economies of scale through the significant investments made by the Adviser and its affiliates related to services provided to the Funds and the lower charges of third-party service providers that are based in part on the combined scale of all of the Janus Henderson Funds.
The Trustees also considered the independent fee consultant’s conclusion that, given the limitations of various analytical approaches to economies of scale and their conflicting results, it is difficult to analytically confirm or deny the existence of economies of scale in the Janus Henderson complex. In this regard, the independent consultant concluded that (1) to the extent there were economies of scale at the Adviser, the Adviser’s general strategy of setting fixed management fees below peers appeared to share any such economies with investors even on smaller Janus Henderson Funds which have not yet achieved those economies and (2) by setting lower fixed fees from the start on these Janus Henderson Funds, the Adviser appeared to be investing to increase the likelihood that these Janus Henderson Funds will grow to a level to achieve any economies of scale that may exist. Further, the independent fee consultant provided its belief that Janus Henderson Fund investors are well-served by the fee levels and performance fee structures in place on the Janus Henderson Funds in light of any economies of scale that may be present at the Adviser.
Based on all of the information reviewed, including the recent and past research and analysis conducted by the Trustees’ independent fee consultant, the Trustees concluded that the current fee structure of each Janus Henderson Fund was reasonable and that the current rates of fees do reflect a sharing between the Adviser and the Janus Henderson Fund of any economies of scale that may be present at the current asset level of the Janus Henderson Fund.
Other Benefits to the Adviser
The Trustees also considered benefits that accrue to the Adviser and its affiliates from their relationships with the Janus Henderson Funds. They recognized that two affiliates of the Adviser separately serve the Janus Henderson Funds as transfer agent and distributor, respectively, and the transfer agent receives compensation directly from the non-money market Janus Henderson Funds for services provided, and that such compensation contributes to the overall profitability of the Adviser and its affiliates that results from their relationship with the Janus Henderson Funds. The Trustees also considered the Adviser’s past and proposed use of commissions paid by the Janus Henderson Funds on portfolio brokerage transactions to obtain proprietary and third-party research products and services benefiting the Janus Henderson Fund and/or other clients of the Adviser and/or the Adviser. The Trustees concluded that the Adviser’s use of these types of client commission arrangements to obtain proprietary and third-party research products and services was consistent with regulatory requirements and guidelines and was likely to benefit each Janus Henderson Fund. The Trustees also concluded that, other than the services provided by the Adviser and its affiliates pursuant to the agreements and the fees to be paid by each Janus Henderson Fund therefor, the Janus Henderson
Janus Henderson Global Life Sciences Fund
Additional Information (unaudited)
Funds and the Adviser may potentially benefit from their relationship with each other in other ways. They concluded that the Adviser and its affiliates share directly in economies of scale through the lower charges of third-party service providers that are based in part on the combined scale of the Janus Henderson Funds and other clients serviced by the Adviser and its affiliates. They also concluded that the Adviser benefits from the receipt of research products and services acquired through commissions paid on portfolio transactions of the Janus Henderson Funds and that the Janus Henderson Funds benefit from the Adviser’s receipt of those products and services as well as research products and services acquired through commissions paid by other clients of the Adviser. They further concluded that the success of any Janus Henderson Fund could attract other business to the Adviser or other Janus Henderson Funds, and that the success of the Adviser could enhance the Adviser’s ability to serve the Janus Henderson Funds.
Janus Henderson Global Life Sciences Fund
Liquidity Risk Management Program (unaudited)
Liquidity Risk Management Program
Rule 22e-4 under the Investment Company Act of 1940, as amended (the “Liquidity Rule”), requires open-end funds (but not money market funds) to adopt and implement a written liquidity risk management program (the “LRMP”) that is reasonably designed to assess and manage liquidity risk, which is the risk that a fund could not meet redemption requests without significant dilution of remaining investors’ interest in the fund. The Fund has implemented a LRMP, which incorporates the following elements: (i) assessment, management, and periodic review of liquidity risk; (ii) classification of portfolio holdings; (iii) the establishment and monitoring of a highly liquid investment minimum, as applicable; (iv) a 15% limitation on a Fund’s illiquid investments; (v) redemptions in-kind; and (vi) board oversight.
The Trustees of the Fund (the “Trustees”) have designated Janus Henderson Investors US LLC, the Fund’s investment adviser (the “Adviser”), as the Program Administrator for the LRMP responsible for administering the LRMP and carrying out the specific responsibilities of the LRMP. A working group comprised of various teams within the Adviser’s business is responsible for administering the LRMP and carrying out the specific responsibilities of different aspects of the LRMP (the “Liquidity Risk Working Group”). In assessing each Fund’s liquidity risk, the Liquidity Risk Working Group periodically considers, as relevant, factors including (i) the liquidity of a Fund’s portfolio investments during normal and reasonably foreseeable stressed conditions; (ii) whether a Fund’s investment strategy is appropriate for an open-end fund; (iii) the extent to which a Fund’s strategy involves a relatively concentrated portfolio or large positions in any issuer; (iv) a Fund’s use of borrowing for investment purposes; and (v) a Fund’s use of derivatives.
The Liquidity Rule requires the Trustees to review at least annually a written report provided by the Program Administrator that addresses the operation of the LRMP and assesses its adequacy and the effectiveness of its implementation, including, if applicable, the operation of the highly liquid investment minimum, and any material changes to the LRMP (the “Program Administrator Report”). At a meeting held on March 15, 2023, the Adviser provided the Program Administrator Report to the Trustees which covered the operation of the LRMP from January 1, 2022 through December 31, 2022 (the “Reporting Period”).
The Program Administrator Report discussed the operation and effectiveness of the LRMP during the Reporting Period. Among other things, the Program Administrator Report indicated that there were no material changes to the LRMP during the Reporting Period, although there were certain methodology adjustments implemented relating to a change in data provider. Additionally, the findings presented in the Program Administrator Report indicated that the LRMP operated adequately during the Reporting Period. These findings included that the Fund was able to meet redemptions during the normal course of business during the Reporting Period. The Program Administrator Report also stated that the Fund did not exceed the 15% limit on illiquid assets during the Reporting Period, that the Fund held primarily highly liquid assets, and was considered to be a primarily highly liquid fund during the Reporting Period. Also included among the Program Administrator Report’s findings was the determination that the Fund’s investment strategy remains appropriate for an open-end fund. In addition, the Adviser expressed its belief in the Program Administrator Report that the LRMP is reasonably designed and adequate to assess and manage the Fund’s liquidity risk, considering the Fund’s particular risks and circumstances, and includes policies and procedures reasonably designed to implement each required component of the Liquidity Rule.
There can be no assurance that the LRMP will achieve its objectives in the future. Please refer to your Fund’s prospectus for more information regarding the risks to which an investment in the Fund may be subject.
Janus Henderson Global Life Sciences Fund
Useful Information About Your Fund Report (unaudited)
Performance Overviews
Performance overview graphs compare the performance of a hypothetical $10,000 investment in the Fund with one or more widely used market indices. When comparing the performance of the Fund with an index, keep in mind that market indices are not available for investment and do not reflect deduction of expenses.
Average annual total returns are quoted for a Fund with more than one year of performance history. Average annual total return is calculated by taking the growth or decline in value of an investment over a period of time, including reinvestment of dividends and distributions, then calculating the annual compounded percentage rate that would have produced the same result had the rate of growth been constant throughout the period. Average annual total return does not reflect the deduction of taxes that a shareholder would pay on Fund distributions or redemptions of Fund shares.
Cumulative total returns are quoted for a Fund with less than one year of performance history. Cumulative total return is the growth or decline in value of an investment over time, independent of the period of time involved. Cumulative total return does not reflect the deduction of taxes that a shareholder would pay on Fund distributions or redemptions of Fund shares.
Pursuant to federal securities rules, expense ratios shown in the performance chart reflect subsidized (if applicable) and unsubsidized ratios. The total annual fund operating expenses ratio is gross of any fee waivers, reflecting the Fund’s unsubsidized expense ratio. The net annual fund operating expenses ratio (if applicable) includes contractual waivers of the Adviser and reflects the Fund’s subsidized expense ratio. Ratios may be higher or lower than those shown in the “Financial Highlights” in this report.
Schedule of Investments
Following the performance overview section is the Fund’s Schedule of Investments. This schedule reports the types of securities held in the Fund on the last day of the reporting period. Securities are usually listed by type (common stock, corporate bonds, U.S. Government obligations, etc.) and by industry classification (banking, communications, insurance, etc.). Holdings are subject to change without notice.
The value of each security is quoted as of the last day of the reporting period. The value of securities denominated in foreign currencies is converted into U.S. dollars.
If the Fund invests in foreign securities, it will also provide a summary of investments by country. This summary reports the Fund exposure to different countries by providing the percentage of securities invested in each country. The country of each security represents the country of risk. A company may be allocated to a country based on other factors such as location of the company’s principal office, the location of the principal trading market for the company’s securities, or the country where a majority of the company’s revenues are derived. The Fund’s Schedule of Investments relies upon the industry group and country classifications published by Bloomberg and/or MSCI Inc.
Tables listing details of individual forward currency contracts, futures, written options, swaptions, and swaps follow the Fund’s Schedule of Investments (if applicable).
Statement of Assets and Liabilities
This statement is often referred to as the “balance sheet.” It lists the assets and liabilities of the Fund on the last day of the reporting period.
The Fund’s assets are calculated by adding the value of the securities owned, the receivable for securities sold but not yet settled, the receivable for dividends declared but not yet received on securities owned, and the receivable for Fund shares sold to investors but not yet settled. The Fund’s liabilities include payables for securities purchased but not yet settled, Fund shares redeemed but not yet paid, and expenses owed but not yet paid. Additionally, there may be other assets and liabilities such as unrealized gain or loss on forward currency contracts.
The section entitled “Net Assets Consist of” breaks down the components of the Fund’s net assets. Because the Fund must distribute substantially all earnings, you will notice that a significant portion of net assets is shareholder capital.
The last section of this statement reports the net asset value (“NAV”) per share on the last day of the reporting period. The NAV is calculated by dividing the Fund’s net assets for each share class (assets minus liabilities) by the number of shares outstanding.
Janus Henderson Global Life Sciences Fund
Useful Information About Your Fund Report (unaudited)
Statement of Operations
This statement details the Fund’s income, expenses, realized gains and losses on securities and currency transactions, and changes in unrealized appreciation or depreciation of Fund holdings.
The first section in this statement, entitled “Investment Income,” reports the dividends earned from securities and interest earned from interest-bearing securities in the Fund.
The next section reports the expenses incurred by the Fund, including the advisory fee paid to the investment adviser, transfer agent fees and expenses, and printing and postage for mailing statements, financial reports and prospectuses. Expense offsets and expense reimbursements, if any, are also shown.
The last section lists the amounts of realized gains or losses from investment and foreign currency transactions, and changes in unrealized appreciation or depreciation of investments and foreign currency-denominated assets and liabilities. The Fund will realize a gain (or loss) when it sells its position in a particular security. A change in unrealized gain (or loss) refers to the change in net appreciation or depreciation of the Fund during the reporting period. “Net Realized and Unrealized Gain/(Loss) on Investments” is affected both by changes in the market value of Fund holdings and by gains (or losses) realized during the reporting period.
Statements of Changes in Net Assets
These statements report the increase or decrease in the Fund’s net assets during the reporting period. Changes in the Fund’s net assets are attributable to investment operations, dividends and distributions to investors, and capital share transactions. This is important to investors because it shows exactly what caused the Fund’s net asset size to change during the period.
The first section summarizes the information from the Statement of Operations regarding changes in net assets due to the Fund’s investment operations. The Fund’s net assets may also change as a result of dividend and capital gains distributions to investors. If investors receive their dividends and/or distributions in cash, money is taken out of the Fund to pay the dividend and/or distribution. If investors reinvest their dividends and/or distributions, the Fund’s net assets will not be affected.
The reinvestment of dividends and distributions is included under “Capital Share Transactions.” “Capital Shares” refers to the money investors contribute to the Fund through purchases or withdrawals via redemptions. The Fund’s net assets will increase and decrease in value as investors purchase and redeem shares from the Fund.
Financial Highlights
This schedule provides a per-share breakdown of the components that affect the Fund’s NAV for current and past reporting periods as well as total return, asset size, ratios, and portfolio turnover rate.
The first line in the table reflects the NAV per share at the beginning of the reporting period. The next line reports the net investment income/(loss) per share. Following is the per share total of net gains/(losses), realized and unrealized. Per share dividends and distributions to investors are then subtracted to arrive at the NAV per share at the end of the period. The next line reflects the total return for the period. The total return may include adjustments in accordance with generally accepted accounting principles required at the period end for financial reporting purposes. As a result, the total return may differ from the total return reflected for individual shareholder transactions. Also included are ratios of expenses and net investment income to average net assets.
The Fund’s expenses may be reduced through expense offsets and expense reimbursements. The ratios shown reflect expenses before and after any such offsets and reimbursements.
The ratio of net investment income/(loss) summarizes the income earned less expenses, divided by the average net assets of the Fund during the reporting period. Do not confuse this ratio with the Fund’s yield. The net investment income ratio is not a true measure of the Fund’s yield because it does not take into account the dividends distributed to the Fund’s investors.
The next figure is the portfolio turnover rate, which measures the buying and selling activity in the Fund. Portfolio turnover is affected by market conditions, changes in the asset size of the Fund, fluctuating volume of shareholder purchase and redemption orders, the nature of the Fund’s investments, and the investment style and/or outlook of the portfolio manager(s) and/or investment personnel. A 100% rate implies that an amount equal to the value of the entire portfolio was replaced once during the fiscal year; a 50% rate means that an amount equal to the value of half the
Janus Henderson Global Life Sciences Fund
Useful Information About Your Fund Report (unaudited)
portfolio is traded in a year; and a 200% rate means that an amount equal to the value of the entire portfolio is traded every six months.
Janus Henderson Global Life Sciences Fund
Notes
NotesPage1
| | | | | | | | |
| | | | | |

| | | | |
This report is submitted for the general information of shareholders of the Fund. It is not an offer or solicitation for the Fund and is not authorized for distribution to prospective investors unless preceded or accompanied by an effective prospectus. |
Janus Henderson is a trademark of Janus Henderson Group plc or one of its subsidiaries. © Janus Henderson Group plc. Janus Henderson Group is the ultimate parent of Janus Henderson Distributors US LLC. Janus Henderson Distributors US LLC |
| | | | 125-24-93043 05-23 |
| | | | |
| | | |
| | | SEMIANNUAL REPORT March 31, 2023 |
| | |
| | Janus Henderson Global Real Estate Fund |
| | |
| | Janus Investment Fund |
| |
| | | HIGHLIGHTS · Investment strategy behind your fund · Fund performance, characteristics
and holdings |
Table of Contents
Janus Henderson Global Real Estate Fund
| | | | | | |
| | | | 
Greg Kuhl co-portfolio manager | 
Tim Gibson co-portfolio manager | 
Guy Barnard co-portfolio manager |
| | | |
Janus Henderson Global Real Estate Fund (unaudited)
Fund At A Glance
March 31, 2023
| | | | | | | | | | |
| | | | | | | | | |
| | | | | | | | | |
| | | | | | | | | |
| 5 Top Contributors - Holdings | 5 Top Detractors - Holdings |
| | Average
Weight | | Relative
Contribution | | | Average
Weight | | Relative
Contribution |
| Prologis Inc | 8.57% | | 0.35% | | Essex Property Trust Inc | 0.79% | | -0.51% |
| PulteGroup Inc | 0.40% | | 0.27% | | Tricon Residential Inc | 2.21% | | -0.40% |
| Life Storage Inc | 2.52% | | 0.24% | | Alexandria Real Estate Equities Inc | 3.82% | | -0.38% |
| STAG Industrial Inc | 2.53% | | 0.24% | | Invitation Homes Inc | 1.33% | | -0.38% |
| CubeSmart | 3.07% | | 0.23% | | UDR Inc | 1.50% | | -0.32% |
| | | | | | | |
| 2 Top Contributors - Sectors* | | | | | |
| | | Relative | | Fund | FTSE EPRA Nareit Global Index |
| | | Contribution | | Average Weight | Average Weight |
| Consumer Discretionary | | 0.18% | | 0.47% | 0.72% |
| Communication Services | | 0.16% | | 0.95% | 0.00% |
| | | | | | |
| | | | | | |
| 4 Top Detractors - Sectors* | | | | | |
| | | Relative | | Fund | FTSE EPRA Nareit Global Index |
| | | Contribution | | Average Weight | Average Weight |
| Real Estate | | -0.18% | | 96.92% | 99.07% |
| Health Care | | -0.07% | | 0.47% | 0.09% |
| Information Technology | | -0.00% | | 0.00% | 0.08% |
| Other** | | -0.00% | | 1.19% | 0.04% |
| | | | | | | |
| Relative contribution reflects how the portolio's holdings impacted return relative to the benchmark. Cash and securities not held in the portfolio are not shown. For equity portfolios, relative contribution compares the performance of a security in the portfolio to the benchmark's total return, factoring in the difference in weight of that security in the benchmark. Returns are calculated using daily returns and previous day ending weights rolled up by ticker, excluding fixed income securities, gross of advisory fees, may exclude certain derivatives and will differ from actual performance.
Performance attribution reflects returns gross of advisory fees and may differ from actual returns as they are based on end of day holdings. Attribution is calculated by geometrically linking daily returns for the portfolio and index. |
* | Based on sector classification according to the Global Industry Classification Standard (“GICS”) codes, which are the exclusive property and a service mark of MSCI Inc. and Standard & Poor’s. |
** | Not a GICS classified sector. |
Janus Henderson Global Real Estate Fund (unaudited)
Fund At A Glance
March 31, 2023
| | |
5 Largest Equity Holdings - (% of Net Assets) |
Prologis Inc | |
Industrial Real Estate Investment Trusts (REITs) | 9.3% |
VICI Properties Inc | |
Specialized Real Estate Investment Trusts (REITs) | 4.9% |
Welltower Inc | |
Health Care Real Estate Investment Trusts (REITs) | 4.3% |
Alexandria Real Estate Equities Inc | |
Office Real Estate Investment Trusts (REITs) | 3.6% |
Camden Property Trust | |
Residential Real Estate Investment Trusts (REITs) | 3.4% |
| | 25.5% |
| | | | | | |
Asset Allocation - (% of Net Assets) | |
Common Stocks | | 98.9% | |
Investment Companies | | 0.8% | |
Other | | 0.3% |
| | | 100.0% |
| | |
Top Country Allocations - Long Positions - (% of Investment Securities) |
As of March 31, 2023 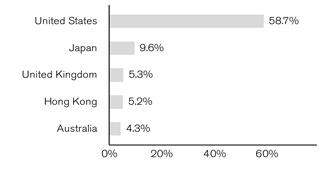
| As of September 30, 2022 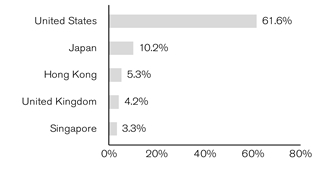
|
Janus Henderson Global Real Estate Fund (unaudited)
Performance
| |
See important disclosures on the next page. |
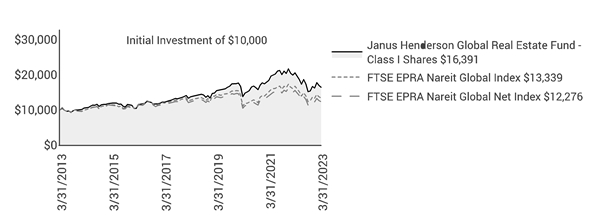
| | | | | | | | | | | |
| | | | | | | | | |
| | | | | | | | | | |
Average Annual Total Return - for the periods ended March 31, 2023 | | | Prospectus Expense Ratios |
| | Fiscal
Year-to-Date | One
Year | Five
Year | Ten
Year | Since
Inception* | | | Total Annual Fund
Operating Expenses‡ |
Class A Shares at NAV | | 7.67% | -20.40% | 3.34% | 4.79% | 4.53% | | | 1.27% |
Class A Shares at MOP | | 1.50% | -24.96% | 2.13% | 4.17% | 4.12% | | | |
Class C Shares at NAV | | 7.33% | -20.98% | 2.54% | 3.99% | 3.78% | | | 2.06% |
Class C Shares at CDSC | | 6.33% | -21.77% | 2.54% | 3.99% | 3.78% | | | |
Class D Shares | | 7.70% | -20.29% | 3.52% | 4.97% | 4.08% | | | 1.08% |
Class I Shares | | 7.84% | -20.20% | 3.59% | 5.07% | 4.80% | | | 1.03% |
Class N Shares | | 7.80% | -20.15% | 3.68% | 5.11% | 4.83% | | | 0.93% |
Class S Shares | | 7.61% | -20.57% | 3.12% | 4.60% | 4.36% | | | 1.46% |
Class T Shares | | 7.67% | -20.32% | 3.44% | 4.89% | 4.28% | | | 1.17% |
FTSE EPRA Nareit Global Index | | 8.30% | -20.33% | 0.77% | 2.92% | 2.35% | | | |
FTSE EPRA Nareit Global Net Index | | 7.79% | -21.07% | -0.10% | 2.07% | N/A** | | | |
Morningstar Quartile - Class I Shares | | - | 2nd | 1st | 1st | 1st | | | |
Morningstar Ranking - based on total returns for Global Real Estate Funds | | - | 60/193 | 30/186 | 10/145 | 4/106 | | | |
Returns quoted are past performance and do not guarantee future results; current performance may be lower or higher. Investment returns and principal value will vary; there may be a gain or loss when shares are sold. For the most recent month-end performance call 800.668.0434 (or 800.525.3713 if you hold shares directly with Janus Henderson) or visit janushenderson.com/performance (or janushenderson.com/allfunds if you hold shares directly with Janus Henderson).
Maximum Offering Price (MOP) returns include the maximum sales charge of 5.75%. Net Asset Value (NAV) returns exclude this charge, which would have reduced returns.
CDSC returns include a 1% contingent deferred sales charge (CDSC) on Shares redeemed within 12 months of purchase. Net Asset Value (NAV) returns exclude this charge, which would have reduced returns.
This Fund has a performance-based management fee that may adjust up or down based on the Fund’s performance.
Performance may be affected by risks that include those associated with foreign and emerging markets, fixed income securities, high-yield and high-risk securities, undervalued, overlooked and smaller capitalization companies, real estate related securities including Real Estate Investment Trusts (REITs),
Janus Henderson Global Real Estate Fund (unaudited)
Performance
Environmental, Social and Governance (ESG) factors, non-diversification, portfolio turnover, derivatives, short sales, initial public offerings (IPOs) and potential conflicts of interest. Each product has different risks. Please see the prospectus for more information about risks, holdings and other details.
Returns include reinvestment of all dividends and distributions and do not reflect the deduction of taxes that a shareholder would pay on Fund distributions or redemptions of Fund shares. The returns do not include adjustments in accordance with generally accepted accounting principles required at the period end for financial reporting purposes.
Class A Shares, Class C Shares, Class I Shares, and Class S Shares commenced operations on July 6, 2009, after the reorganization of each class of Janus Adviser Global Real Estate Fund (“the predecessor fund”) into corresponding shares of the Fund. Performance shown for each class for periods prior to July 6, 2009, reflects the historical performance of each corresponding class of the predecessor fund prior to the reorganization, calculated using the fees and expenses of the corresponding class of the predecessor fund respectively, net of any applicable fee and expense limitations or waivers.
Class D Shares commenced operations on February 16, 2010. Performance shown for periods prior to February 16, 2010, reflects the historical performance of the Fund’s Class I Shares, calculated using the fees and expenses of Class D Shares, without the effect of any fee and expense limitations or waivers.
Class N Shares of the Fund commenced operations on January 26, 2018. Performance shown for Class N Shares reflects the historical performance of the Fund's Class I Shares from July 6, 2009 to January 26, 2018, calculated using the fees and expenses of Class I Shares, net of any applicable fee and expense limitations or waivers. Performance shown for Class N Shares for periods prior to July 6, 2009, reflects the historical performance of the predecessor fund's Class I Shares, calculated using the fees and expenses of Class I Shares of the predecessor fund, net of any applicable fee and expense limitations or waivers.
Class T Shares commenced operations on July 6, 2009. Performance shown for Class T Shares for periods prior to July 6, 2009, reflects the historical performance of the predecessor fund’s Class I Shares, calculated using the fees and expenses of Class T Shares, without the effect of any fee and expense limitations or waivers.
If each share class of the Fund had been available during periods prior to its commencement, the performance shown may have been different. The performance shown for periods following the Fund’s commencement of each share class reflects the fees and expenses of each respective share class, net of any applicable fee and expense limitations or waivers. Please refer to the Fund’s prospectuses for further details concerning historical performance.
© 2023 Morningstar, Inc. All Rights Reserved.
There is no assurance that the investment process will consistently lead to successful investing.
See Notes to Schedule of Investments and Other Information for index definitions.
Index performance does not reflect the expenses of managing a portfolio as an index is unmanaged and not available for direct investment.
See “Useful Information About Your Fund Report.”
*The Predecessor Fund’s inception date – November 28, 2007
**Since inception index return is not available for indices created subsequent to fund inception.
‡ As stated in the prospectus. See Financial Highlights for actual expense ratios during the reporting period.
Janus Henderson Global Real Estate Fund (unaudited)
Expense Examples
As a shareholder of the Fund, you incur two types of costs: (1) transaction costs, such as sales charges (loads) on purchase payments (applicable to Class A Shares only); and (2) ongoing costs, including management fees; 12b-1 distribution and shareholder servicing fees; transfer agent fees and expenses payable pursuant to the Transfer Agency Agreement; and other Fund expenses. This example is intended to help you understand your ongoing costs (in dollars) of investing in the Fund and to compare these costs with the ongoing costs of investing in other mutual funds. To do so, compare this 5% hypothetical example with the 5% hypothetical examples that appear in the shareholder reports of the other funds. The example is based upon an investment of $1,000 invested at the beginning of the period and held for the six-months indicated, unless noted otherwise in the table and footnotes below.
Actual Expenses
The information in the table under the heading “Actual” provides information about actual account values and actual expenses. You may use the information in these columns, together with the amount you invested, to estimate the expenses that you paid over the period. Simply divide your account value by $1,000 (for example, an $8,600 account value divided by $1,000 = 8.6), then multiply the result by the number in the appropriate column for your share class under the heading entitled “Expenses Paid During Period” to estimate the expenses you paid on your account during the period.
Hypothetical Example for Comparison Purposes
The information in the table under the heading “Hypothetical (5% return before expenses)” provides information about hypothetical account values and hypothetical expenses based upon the Fund’s actual expense ratio and an assumed rate of return of 5% per year before expenses, which is not the Fund’s actual return. The hypothetical account values and expenses may not be used to estimate the actual ending account balance or expenses you paid for the period. You may use this information to compare the ongoing costs of investing in the Fund and other funds. To do so, compare this 5% hypothetical example with the 5% hypothetical examples that appear in the shareholder reports of the other funds. Additionally, for an analysis of the fees associated with an investment in any share class or other similar funds, please visit www.finra.org/fundanalyzer.
Please note that the expenses shown in the table are meant to highlight your ongoing costs only and do not reflect any transaction costs. These fees are fully described in the Fund’s prospectuses. Therefore, the hypothetical examples are useful in comparing ongoing costs only, and will not help you determine the relative total costs of owning different funds. In addition, if these transaction costs were included, your costs would have been higher.
| | | | | | | | | | | |
| | | | | | | | |
| | | Actual | | Hypothetical
(5% return before expenses) | |
| Beginning
Account
Value
(10/1/22) | Ending
Account
Value
(3/31/23) | Expenses
Paid During
Period
(10/1/22 - 3/31/23)† | | Beginning
Account
Value
(10/1/22) | Ending
Account
Value
(3/31/23) | Expenses
Paid During
Period
(10/1/22 - 3/31/23)† | Net Annualized
Expense Ratio
(10/1/22 - 3/31/23) |
Class A Shares | $1,000.00 | $1,076.70 | $7.09 | | $1,000.00 | $1,018.10 | $6.89 | 1.37% |
Class C Shares | $1,000.00 | $1,073.30 | $11.01 | | $1,000.00 | $1,014.31 | $10.70 | 2.13% |
Class D Shares | $1,000.00 | $1,077.00 | $6.16 | | $1,000.00 | $1,019.00 | $5.99 | 1.19% |
Class I Shares | $1,000.00 | $1,078.40 | $5.80 | | $1,000.00 | $1,019.35 | $5.64 | 1.12% |
Class N Shares | $1,000.00 | $1,078.00 | $5.23 | | $1,000.00 | $1,019.90 | $5.09 | 1.01% |
Class S Shares | $1,000.00 | $1,076.10 | $7.97 | | $1,000.00 | $1,017.25 | $7.75 | 1.54% |
Class T Shares | $1,000.00 | $1,076.70 | $6.47 | | $1,000.00 | $1,018.70 | $6.29 | 1.25% |
† | Expenses Paid During Period are equal to the Net Annualized Expense Ratio multiplied by the average account value over the period, multiplied by 182/365 (to reflect the one-half year period). Expenses in the examples include the effect of applicable fee waivers and/or expense reimbursements, if any. Had such waivers and/or reimbursements not been in effect, your expenses would have been higher. Please refer to the Notes to Financial Statements or the Fund’s prospectuses for more information regarding waivers and/or reimbursements. |
Janus Henderson Global Real Estate Fund
Schedule of Investments (unaudited)
March 31, 2023
| | | | | | | | |
Shares
| | | Value | |
Common Stocks– 98.9% | | | |
Diversified Telecommunication Services – 1.2% | | | |
| | Cellnex Telecom SA (144A)* | | 170,322 | | | $6,629,300 | |
Equity Real Estate Investment Trusts (REITs) – 5.3% | | | |
| | Land Securities Group PLC | | 682,528 | | | 5,245,143 | |
| | Merlin Properties Socimi SA | | 690,000 | | | 6,047,607 | |
| | Nomura Real Estate Master Fund Inc | | 4,869 | | | 5,460,499 | |
| | Stockland | | 3,380,657 | | | 9,054,721 | |
| | United Urban Investment Corp | | 4,114 | | | 4,439,110 | |
| | | 30,247,080 | |
Health Care Providers & Services – 1.3% | | | |
| | Chartwell Retirement Residences | | 1,142,976 | | | 7,231,884 | |
Health Care Real Estate Investment Trusts (REITs) – 6.9% | | | |
| | Healthpeak Properties Inc | | 678,661 | | | 14,910,182 | |
| | Welltower Inc | | 336,393 | | | 24,116,014 | |
| | | 39,026,196 | |
Household Durables – 1.2% | | | |
| | NVR Inc* | | 1,238 | | | 6,898,371 | |
Industrial Real Estate Investment Trusts (REITs) – 20.1% | | | |
| | Ascendas | | 3,236,400 | | | 6,989,252 | |
| | Goodman Group | | 636,387 | | | 8,091,851 | |
| | Industrial & Infrastructure Fund Investment Corp | | 5,406 | | | 5,886,547 | |
| | LaSalle Logiport | | 2,498 | | | 2,901,184 | |
| | Prologis Inc | | 422,193 | | | 52,611,539 | |
| | Rexford Industrial Realty Inc | | 241,287 | | | 14,392,770 | |
| | Segro PLC | | 844,786 | | | 8,039,470 | |
| | STAG Industrial Inc | | 427,946 | | | 14,473,134 | |
| | | 113,385,747 | |
Office Real Estate Investment Trusts (REITs) – 6.1% | | | |
| | Alexandria Real Estate Equities Inc | | 160,793 | | | 20,193,993 | |
| | Gecina SA | | 38,000 | | | 3,949,403 | |
| | Orix JREIT Inc | | 5,597 | | | 7,100,673 | |
| | Workspace Group PLC | | 610,000 | | | 3,291,556 | |
| | | 34,535,625 | |
Real Estate Management & Development – 19.6% | | | |
| | Ayala Land Inc | | 10,516,500 | | | 5,135,773 | |
| | Capitaland Investment Ltd/Singapore | | 2,445,900 | | | 6,800,502 | |
| | CBRE Group Inc* | | 94,086 | | | 6,850,402 | |
| | China Resources Land Ltd | | 2,482,000 | | | 11,373,816 | |
| | China Vanke Co Ltd | | 2,408,300 | | | 3,804,421 | |
| | CK Asset Holdings Ltd | | 1,001,000 | | | 6,064,547 | |
| | CTP NV (144A) | | 249,081 | | | 3,226,394 | |
| | Fastighets AB Balder - Class B* | | 907,962 | | | 3,738,573 | |
| | Helical PLC | | 880,450 | | | 3,258,448 | |
| | LEG Immobilien AG | | 50,387 | | | 2,758,646 | |
| | Mitsui Fudosan Co Ltd | | 985,800 | | | 18,527,823 | |
| | Sun Hung Kai Properties Ltd | | 524,000 | | | 7,370,213 | |
| | Swire Properties Ltd | | 2,212,800 | | | 5,715,838 | |
| | Tokyu Fudosan Holdings Corp | | 631,800 | | | 3,033,570 | |
| | Tricon Residential Inc | | 1,637,255 | | | 12,697,722 | |
| | VGP NV | | 55,804 | | | 4,997,354 | |
| | Vonovia SE | | 272,739 | | | 5,128,497 | |
| | | 110,482,539 | |
Residential Real Estate Investment Trusts (REITs) – 7.2% | | | |
| | Camden Property Trust | | 181,081 | | | 18,984,532 | |
| | Sun Communities Inc | | 118,359 | | | 16,674,416 | |
| | UNITE Group PLC | | 411,000 | | | 4,876,324 | |
| | | 40,535,272 | |
Retail Real Estate Investment Trusts (REITs) – 19.4% | | | |
| | Agree Realty Corp | | 246,814 | | | 16,933,909 | |
| | Brixmor Property Group Inc | | 733,193 | | | 15,778,313 | |
| | |
See Notes to Schedule of Investments and Other Information and Notes to Financial Statements. |
| |
6 | MARCH 31, 2023 |
Janus Henderson Global Real Estate Fund
Schedule of Investments (unaudited)
March 31, 2023
| | | | | | | | |
Shares
| | | Value | |
Common Stocks– (continued) | | | |
Retail Real Estate Investment Trusts (REITs)– (continued) | | | |
| | CapitaLand Mall Trust | | 2,799,326 | | | $4,180,815 | |
| | Japan Retail Fund Investment Corp | | 9,516 | | | 6,945,049 | |
| | Link | | 1,555,800 | | | 9,977,714 | |
| | National Retail Properties Inc | | 398,822 | | | 17,607,991 | |
| | SITE Centers Corp | | 1,202,423 | | | 14,765,754 | |
| | Spirit Realty Capital Inc | | 399,309 | | | 15,908,471 | |
| | Vicinity Centres | | 5,510,420 | | | 7,215,621 | |
| | | 109,313,637 | |
Specialized Real Estate Investment Trusts (REITs) – 10.6% | | | |
| | CubeSmart | | 348,973 | | | 16,129,532 | |
| | Safestore Holdings PLC | | 450,000 | | | 5,275,766 | |
| | SBA Communications Corp | | 40,035 | | | 10,451,937 | |
| | VICI Properties Inc | | 854,003 | | | 27,857,578 | |
| | | 59,714,813 | |
Total Common Stocks (cost $570,242,955) | | 558,000,464 | |
Investment Companies– 0.8% | | | |
Money Markets – 0.8% | | | |
| | Janus Henderson Cash Liquidity Fund LLC, 4.7988%ºº,£((cost $4,631,260) | | 4,630,334 | | | 4,631,260 | |
Total Investments (total cost $574,874,215) – 99.7% | | 562,631,724 | |
Cash, Receivables and Other Assets, net of Liabilities – 0.3% | | 1,792,584 | |
Net Assets – 100% | | $564,424,308 | |
| | | | | | |
Summary of Investments by Country - (Long Positions) (unaudited) |
| |
| | | | | % of | |
| | | | | Investment | |
Country | | Value | | Securities | |
United States | | $330,170,098 | | 58.7 | % |
Japan | | 54,294,455 | | 9.6 | |
United Kingdom | | 29,986,707 | | 5.3 | |
Hong Kong | | 29,128,312 | | 5.2 | |
Australia | | 24,362,193 | | 4.3 | |
Canada | | 19,929,606 | | 3.5 | |
Singapore | | 17,970,569 | | 3.2 | |
China | | 15,178,237 | | 2.7 | |
Spain | | 12,676,907 | | 2.3 | |
Germany | | 7,887,143 | | 1.4 | |
Philippines | | 5,135,773 | | 0.9 | |
Belgium | | 4,997,354 | | 0.9 | |
France | | 3,949,403 | | 0.7 | |
Sweden | | 3,738,573 | | 0.7 | |
Netherlands | | 3,226,394 | | 0.6 | |
| | | | | | |
| | | | | | |
Total | | $562,631,724 | | 100.0 | % |
| | |
See Notes to Schedule of Investments and Other Information and Notes to Financial Statements. |
| |
Janus Investment Fund | 7 |
Janus Henderson Global Real Estate Fund
Schedule of Investments (unaudited)
March 31, 2023
Schedules of Affiliated Investments – (% of Net Assets)
| | | | | | | | | | | |
| | Dividend Income | Realized Gain/(Loss) | Change in Unrealized Appreciation/ Depreciation | Value at 3/31/23 |
Investment Companies - 0.8% |
Money Markets - 0.8% | |
| | Janus Henderson Cash Liquidity Fund LLC, 4.7988%ºº | $ | 107,676 | $ | (440) | $ | - | $ | 4,631,260 |
Investments Purchased with Cash Collateral from Securities Lending - N/A |
Investment Companies - N/A | |
| | Janus Henderson Cash Collateral Fund LLC, 4.8170%ºº | | 4,364∆ | | - | | - | | - |
Total Affiliated Investments - 0.8% | $ | 112,040 | $ | (440) | $ | - | $ | 4,631,260 |
| | | | | | | | | | | |
| | Value at 9/30/22 | Purchases | Sales Proceeds | Value at 3/31/23 |
Investment Companies - 0.8% |
Money Markets - 0.8% | |
| | Janus Henderson Cash Liquidity Fund LLC, 4.7988%ºº | | 8,309,444 | | 83,099,490 | | (86,777,234) | | 4,631,260 |
Investments Purchased with Cash Collateral from Securities Lending - N/A |
Investment Companies - N/A | |
| | Janus Henderson Cash Collateral Fund LLC, 4.8170%ºº | | 55,187 | | 12,509,252 | | (12,564,439) | | - |
| | |
See Notes to Schedule of Investments and Other Information and Notes to Financial Statements. |
| |
8 | MARCH 31, 2023 |
Janus Henderson Global Real Estate Fund
Notes to Schedule of Investments and Other Information (unaudited)
| | |
FTSE EPRA Nareit Global Index | FTSE EPRA Nareit Global Index tracks the performance of real estate companies and real estate investment trusts (REITs) from developed and emerging markets, and is shown gross or net of foreign withholding taxes. |
| | |
LLC | Limited Liability Company |
PLC | Public Limited Company |
| | |
144A | Securities sold under Rule 144A of the Securities Act of 1933, as amended, are subject to legal and/or contractual restrictions on resale and may not be publicly sold without registration under the 1933 Act. Unless otherwise noted, these securities have been determined to be liquid under guidelines established by the Board of Trustees. The total value of 144A securities as of the period ended March 31, 2023 is $9,855,694, which represents 1.7% of net assets. |
| | |
* | Non-income producing security. |
| | |
ºº | Rate shown is the 7-day yield as of March 31, 2023. |
| | |
£ | The Fund may invest in certain securities that are considered affiliated companies. As defined by the Investment Company Act of 1940, as amended, an affiliated company is one in which the Fund owns 5% or more of the outstanding voting securities, or a company which is under common ownership or control. |
| | |
∆ | Net of income paid to the securities lending agent and rebates paid to the borrowing counterparties. |
| | | | | | | | | | | | | |
The following is a summary of the inputs that were used to value the Fund’s investments in securities and other financial instruments as of March 31, 2023. See Notes to Financial Statements for more information. |
| |
Valuation Inputs Summary |
| | | | | | | |
| | | | | Level 2 - | | Level 3 - |
| | | Level 1 - | | Other Significant | | Significant |
| | | Quoted Prices | | Observable Inputs | | Unobservable Inputs |
| | | | | | | |
Assets | | | | | | |
Investments In Securities: | | | | | | |
Common Stocks | | | | | | |
Diversified Telecommunication Services | $ | - | $ | 6,629,300 | $ | - |
Equity Real Estate Investment Trusts (REITs) | | - | | 30,247,080 | | - |
Industrial Real Estate Investment Trusts (REITs) | | 81,477,443 | | 31,908,304 | | - |
Office Real Estate Investment Trusts (REITs) | | 20,193,993 | | 14,341,632 | | - |
Real Estate Management & Development | | 19,548,124 | | 90,934,415 | | - |
Residential Real Estate Investment Trusts (REITs) | | 35,658,948 | | 4,876,324 | | - |
Retail Real Estate Investment Trusts (REITs) | | 80,994,438 | | 28,319,199 | | - |
Specialized Real Estate Investment Trusts (REITs) | | 54,439,047 | | 5,275,766 | | - |
All Other | | 53,156,451 | | - | | - |
Investment Companies | | - | | 4,631,260 | | - |
Total Assets | $ | 345,468,444 | $ | 217,163,280 | $ | - |
| | | | | | | |
Janus Henderson Global Real Estate Fund
Statement of Assets and Liabilities (unaudited)
March 31, 2023
| |
See footnotes at the end of the Statement. |
| | | | | | | |
| | | | | | |
Assets: | | | | |
| Unaffiliated investments, at value (cost $570,242,955) | | $ | 558,000,464 | |
| Affiliated investments, at value (cost $4,631,260) | | | 4,631,260 | |
| Cash denominated in foreign currency (cost $57,752) | | | 57,752 | |
| Trustees' deferred compensation | | | 13,949 | |
| Receivables: | | | | |
| | Dividends | | | 2,868,564 | |
| | Fund shares sold | | | 492,558 | |
| | Foreign tax reclaims | | | 277,466 | |
| | Dividends from affiliates | | | 25,043 | |
| Other assets | | | 10,228 | |
Total Assets | | | 566,377,284 | |
Liabilities: | | | | |
| Due to custodian | | | 29 | |
| Payables: | | | — | |
| | Fund shares repurchased | | | 1,092,438 | |
| | Advisory fees | | | 480,295 | |
| | Dividends | | | 157,191 | |
| | Transfer agent fees and expenses | | | 80,440 | |
| | Professional fees | | | 38,977 | |
| | Trustees' deferred compensation fees | | | 13,949 | |
| | Custodian fees | | | 10,832 | |
| | 12b-1 Distribution and shareholder servicing fees | | | 8,120 | |
| | Trustees' fees and expenses | | | 4,266 | |
| | Affiliated fund administration fees payable | | | 1,298 | |
| | Investments purchased | | | 600 | |
| | Accrued expenses and other payables | | | 64,541 | |
Total Liabilities | | | 1,952,976 | |
Net Assets | | $ | 564,424,308 | |
| | |
See Notes to Financial Statements. |
| |
10 | MARCH 31, 2023 |
Janus Henderson Global Real Estate Fund
Statement of Assets and Liabilities (unaudited)
March 31, 2023
| | | | | | | |
| | | | | | |
| | | | | | | |
Net Assets Consist of: | | | | |
| Capital (par value and paid-in surplus) | | $ | 629,229,263 | |
| Total distributable earnings (loss) | | | (64,804,955) | |
Total Net Assets | | $ | 564,424,308 | |
Net Assets - Class A Shares | | $ | 12,006,255 | |
| Shares Outstanding, $0.01 Par Value (unlimited shares authorized) | | | 1,069,220 | |
Net Asset Value Per Share(1) | | $ | 11.23 | |
Maximum Offering Price Per Share(2) | | $ | 11.92 | |
Net Assets - Class C Shares | | $ | 4,109,432 | |
| Shares Outstanding, $0.01 Par Value (unlimited shares authorized) | | | 374,731 | |
Net Asset Value Per Share(1) | | $ | 10.97 | |
Net Assets - Class D Shares | | $ | 46,070,755 | |
| Shares Outstanding, $0.01 Par Value (unlimited shares authorized) | | | 4,068,190 | |
Net Asset Value Per Share | | $ | 11.32 | |
Net Assets - Class I Shares | | $ | 320,175,322 | |
| Shares Outstanding, $0.01 Par Value (unlimited shares authorized) | | | 28,309,794 | |
Net Asset Value Per Share | | $ | 11.31 | |
Net Assets - Class N Shares | | $ | 89,658,299 | |
| Shares Outstanding, $0.01 Par Value (unlimited shares authorized) | | | 7,925,254 | |
Net Asset Value Per Share | | $ | 11.31 | |
Net Assets - Class S Shares | | $ | 7,834,033 | |
| Shares Outstanding, $0.01 Par Value (unlimited shares authorized) | | | 700,585 | |
Net Asset Value Per Share | | $ | 11.18 | |
Net Assets - Class T Shares | | $ | 84,570,212 | |
| Shares Outstanding, $0.01 Par Value (unlimited shares authorized) | | | 7,480,965 | |
Net Asset Value Per Share | | $ | 11.30 | |
| |
(1) Redemption price per share may be reduced for any applicable contingent deferred sales charge. (2) Maximum offering price is computed at 100/94.25 of net asset value. |
| | |
See Notes to Financial Statements. |
| |
Janus Investment Fund | 11 |
Janus Henderson Global Real Estate Fund
Statement of Operations (unaudited)
For the period ended March 31, 2023
| | | | | | |
| | | | | |
Investment Income: | | | |
| Dividends | $ | 10,303,013 | |
| Dividends from affiliates | | 107,676 | |
| Affiliated securities lending income, net | | 4,364 | |
| Unaffiliated securities lending income, net | | 1,133 | |
| Other income | | 8,849 | |
| Foreign tax withheld | | (296,580) | |
Total Investment Income | | 10,128,455 | |
Expenses: | | | |
| Advisory fees | | 2,835,729 | |
| 12b-1 Distribution and shareholder servicing fees: | | | |
| | Class A Shares | | 14,894 | |
| | Class C Shares | | 20,817 | |
| | Class S Shares | | 9,544 | |
| Transfer agent administrative fees and expenses: | | | |
| | Class D Shares | | 27,574 | |
| | Class S Shares | | 9,560 | |
| | Class T Shares | | 110,022 | |
| Transfer agent networking and omnibus fees: | | | |
| | Class A Shares | | 4,647 | |
| | Class C Shares | | 2,261 | |
| | Class I Shares | | 204,345 | |
| Other transfer agent fees and expenses: | | | |
| | Class A Shares | | 510 | |
| | Class C Shares | | 123 | |
| | Class D Shares | | 7,470 | |
| | Class I Shares | | 11,813 | |
| | Class N Shares | | 2,307 | |
| | Class S Shares | | 143 | |
| | Class T Shares | | 725 | |
| Registration fees | | 88,547 | |
| Professional fees | | 36,854 | |
| Shareholder reports expense | | 30,702 | |
| Custodian fees | | 27,939 | |
| Trustees’ fees and expenses | | 9,091 | |
| Affiliated fund administration fees | | 7,652 | |
| Other expenses | | 55,595 | |
Total Expenses | | 3,518,864 | |
Less: Excess Expense Reimbursement and Waivers | | (2,171) | |
Net Expenses | | 3,516,693 | |
Net Investment Income/(Loss) | | 6,611,762 | |
| | | | | |
| | |
See Notes to Financial Statements. |
| |
12 | MARCH 31, 2023 |
Janus Henderson Global Real Estate Fund
Statement of Operations (unaudited)
For the period ended March 31, 2023
| | | | | | |
| | | | | |
Net Realized Gain/(Loss) on Investments: | | | |
| Investments and foreign currency transactions | $ | (29,700,743) | |
| Investments in affiliates | | (440) | |
Total Net Realized Gain/(Loss) on Investments | | (29,701,183) | |
Change in Unrealized Net Appreciation/Depreciation: | | | |
| Investments, foreign currency translations and Trustees’ deferred compensation | | 70,132,734 | |
Total Change in Unrealized Net Appreciation/Depreciation | | 70,132,734 | |
Net Increase/(Decrease) in Net Assets Resulting from Operations | $ | 47,043,313 | |
| | | | | |
| | |
See Notes to Financial Statements. |
| |
Janus Investment Fund | 13 |
Janus Henderson Global Real Estate Fund
Statements of Changes in Net Assets
| | | | | | | | | |
| | | | | | | | |
| | | Period ended
March 31, 2023 (unaudited) | | Year ended
September 30, 2022 | |
| | | | | | | | | |
Operations: | | | | | | |
| Net investment income/(loss) | $ | 6,611,762 | | $ | 14,731,330 | |
| Net realized gain/(loss) on investments | | (29,701,183) | | | (13,010,038) | |
| Change in unrealized net appreciation/depreciation | | 70,132,734 | | | (205,235,857) | |
Net Increase/(Decrease) in Net Assets Resulting from Operations | | 47,043,313 | | | (203,514,565) | |
Dividends and Distributions to Shareholders: | | | | | | |
| | Class A Shares | | (111,188) | | | (839,084) | |
| | Class C Shares | | (24,860) | | | (330,381) | |
| | Class D Shares | | (477,082) | | | (3,281,953) | |
| | Class I Shares | | (3,727,702) | | | (30,872,396) | |
| | Class N Shares | | (1,021,338) | | | (6,399,486) | |
| | Class S Shares | | (65,428) | | | (485,221) | |
| | Class T Shares | | (860,043) | | | (6,552,609) | |
Net Decrease from Dividends and Distributions to Shareholders | | (6,287,641) | | | (48,761,130) | |
Capital Share Transactions: | | | | | | |
| | Class A Shares | | (301,335) | | | 904,085 | |
| | Class C Shares | | (736,793) | | | (306,068) | |
| | Class D Shares | | (1,544,671) | | | 3,842,929 | |
| | Class I Shares | | (87,789,629) | | | (9,479,268) | |
| | Class N Shares | | 1,530,785 | | | (434,386) | |
| | Class S Shares | | 111,413 | | | 971,554 | |
| | Class T Shares | | (9,142,833) | | | 414,322 | |
Net Increase/(Decrease) from Capital Share Transactions | | (97,873,063) | | | (4,086,832) | |
Net Increase/(Decrease) in Net Assets | | (57,117,391) | | | (256,362,527) | |
Net Assets: | | | | | | |
| Beginning of period | | 621,541,699 | | | 877,904,226 | |
| End of period | $ | 564,424,308 | | $ | 621,541,699 | |
| | | | | | | | |
| | |
See Notes to Financial Statements. |
| |
14 | MARCH 31, 2023 |
Janus Henderson Global Real Estate Fund
Financial Highlights
| | | | | | | | | | | | | | | | | | | | | | |
Class A Shares | | | | | | | | | | | | | | | | | | |
For a share outstanding during the period ended March 31, 2023 (unaudited) and the year ended September 30 | 2023 | | | 2022 | | | 2021 | | | 2020 | | | 2019 | | | 2018 | |
| Net Asset Value, Beginning of Period | | $10.53 | | | $14.65 | | | $12.18 | | | $13.00 | | | $11.68 | | | $11.28 | |
| Income/(Loss) from Investment Operations: | | | | | | | | | | | | | | | | | | |
| | Net investment income/(loss)(1) | | 0.11 | | | 0.21 | | | 0.32 | | | 0.18 | | | 0.18 | | | 0.18 | |
| | Net realized and unrealized gain/(loss) | | 0.70 | | | (3.55) | | | 2.38 | | | (0.49) | | | 1.72 | | | 0.68 | |
| Total from Investment Operations | | 0.81 | | | (3.34) | | | 2.70 | | | (0.31) | | | 1.90 | | | 0.86 | |
| Less Dividends and Distributions: | | | | | | | | | | | | | | | | | | |
| | Dividends (from net investment income) | | (0.11) | | | (0.38) | | | (0.23) | | | (0.37) | | | (0.36) | | | (0.46) | |
| | Distributions (from capital gains) | | — | | | (0.40) | | | — | | | (0.14) | | | (0.22) | | | — | |
| Total Dividends and Distributions | | (0.11) | | | (0.78) | | | (0.23) | | | (0.51) | | | (0.58) | | | (0.46) | |
| Net Asset Value, End of Period | | $11.23 | | | $10.53 | | | $14.65 | | | $12.18 | | | $13.00 | | | $11.68 | |
| Total Return* | | 7.67% | | | (24.19)% | | | 22.32% | | | (2.53)% | | | 17.12% | | | 7.76% | |
| Net Assets, End of Period (in thousands) | | $12,006 | | | $11,566 | | | $15,294 | | | $9,857 | | | $9,167 | | | $5,828 | |
| Average Net Assets for the Period (in thousands) | | $11,943 | | | $15,160 | | | $12,864 | | | $11,509 | | | $7,245 | | | $5,093 | |
| Ratios to Average Net Assets**: | | | | | | | | | | | | | | | | | | |
| | Ratio of Gross Expenses | | 1.37% | | | 1.27% | | | 1.23% | | | 1.25% | | | 1.36% | | | 1.26% | |
| | Ratio of Net Expenses (After Waivers and Expense Offsets) | | 1.37% | | | 1.27% | | | 1.23% | | | 1.25% | | | 1.35% | | | 1.26% | |
| | Ratio of Net Investment Income/(Loss) | | 2.00% | | | 1.56% | | | 2.25% | | | 1.42% | | | 1.46% | | | 1.60% | |
| Portfolio Turnover Rate | | 39% | | | 68% | | | 77% | | | 69% | | | 61% | | | 78% | |
| | | | | | | | | | | | | | | | | | | | | | |
| |
* Total return includes adjustments in accordance with generally accepted accounting principles required at the year or period end and are not annualized for periods of less than one full year. ** Annualized for periods of less than one full year. (1) Per share amounts are calculated based on average shares outstanding during the year or period. |
| | |
See Notes to Financial Statements. |
| |
Janus Investment Fund | 15 |
Janus Henderson Global Real Estate Fund
Financial Highlights
| | | | | | | | | | | | | | | | | | | | | | |
Class C Shares | | | | | | | | | | | | | | | | | | |
For a share outstanding during the period ended March 31, 2023 (unaudited) and the year ended September 30 | 2023 | | | 2022 | | | 2021 | | | 2020 | | | 2019 | | | 2018 | |
| Net Asset Value, Beginning of Period | | $10.28 | | | $14.34 | | | $11.98 | | | $12.81 | | | $11.53 | | | $11.14 | |
| Income/(Loss) from Investment Operations: | | | | | | | | | | | | | | | | | | |
| | Net investment income/(loss)(1) | | 0.07 | | | 0.10 | | | 0.18 | | | 0.08 | | | 0.09 | | | 0.10 | |
| | Net realized and unrealized gain/(loss) | | 0.68 | | | (3.46) | | | 2.37 | | | (0.49) | | | 1.69 | | | 0.67 | |
| Total from Investment Operations | | 0.75 | | | (3.36) | | | 2.55 | | | (0.41) | | | 1.78 | | | 0.77 | |
| Less Dividends and Distributions: | | | | | | | | | | | | | | | | | | |
| | Dividends (from net investment income) | | (0.06) | | | (0.30) | | | (0.19) | | | (0.28) | | | (0.28) | | | (0.38) | |
| | Distributions (from capital gains) | | — | | | (0.40) | | | — | | | (0.14) | | | (0.22) | | | — | |
| Total Dividends and Distributions | | (0.06) | | | (0.70) | | | (0.19) | | | (0.42) | | | (0.50) | | | (0.38) | |
| Net Asset Value, End of Period | | $10.97 | | | $10.28 | | | $14.34 | | | $11.98 | | | $12.81 | | | $11.53 | |
| Total Return* | | 7.33% | | | (24.81)% | | | 21.34% | | | (3.33)% | | | 16.19% | | | 7.01% | |
| Net Assets, End of Period (in thousands) | | $4,109 | | | $4,548 | | | $6,766 | | | $5,908 | | | $8,020 | | | $6,970 | |
| Average Net Assets for the Period (in thousands) | | $4,414 | | | $6,321 | | | $6,420 | | | $7,522 | | | $7,211 | | | $6,717 | |
| Ratios to Average Net Assets**: | | | | | | | | | | | | | | | | | | |
| | Ratio of Gross Expenses | | 2.13% | | | 2.00% | | | 2.03% | | | 2.03% | | | 2.09% | | | 2.00% | |
| | Ratio of Net Expenses (After Waivers and Expense Offsets) | | 2.13% | | | 2.00% | | | 2.03% | | | 2.03% | | | 2.09% | | | 2.00% | |
| | Ratio of Net Investment Income/(Loss) | | 1.19% | | | 0.75% | | | 1.31% | | | 0.65% | | | 0.73% | | | 0.84% | |
| Portfolio Turnover Rate | | 39% | | | 68% | | | 77% | | | 69% | | | 61% | | | 78% | |
| | | | | | | | | | | | | | | | | | | | | | |
| |
* Total return includes adjustments in accordance with generally accepted accounting principles required at the year or period end and are not annualized for periods of less than one full year. ** Annualized for periods of less than one full year. (1) Per share amounts are calculated based on average shares outstanding during the year or period. |
| | |
See Notes to Financial Statements. |
| |
16 | MARCH 31, 2023 |
Janus Henderson Global Real Estate Fund
Financial Highlights
| | | | | | | | | | | | | | | | | | | | | | |
Class D Shares | | | | | | | | | | | | | | | | | | |
For a share outstanding during the period ended March 31, 2023 (unaudited) and the year ended September 30 | 2023 | | | 2022 | | | 2021 | | | 2020 | | | 2019 | | | 2018 | |
| Net Asset Value, Beginning of Period | | $10.62 | | | $14.77 | | | $12.26 | | | $13.09 | | | $11.76 | | | $11.35 | |
| Income/(Loss) from Investment Operations: | | | | | | | | | | | | | | | | | | |
| | Net investment income/(loss)(1) | | 0.12 | | | 0.24 | | | 0.34 | | | 0.20 | | | 0.20 | | | 0.20 | |
| | Net realized and unrealized gain/(loss) | | 0.70 | | | (3.58) | | | 2.41 | | | (0.50) | | | 1.73 | | | 0.69 | |
| Total from Investment Operations | | 0.82 | | | (3.34) | | | 2.75 | | | (0.30) | | | 1.93 | | | 0.89 | |
| Less Dividends and Distributions: | | | | | | | | | | | | | | | | | | |
| | Dividends (from net investment income) | | (0.12) | | | (0.41) | | | (0.24) | | | (0.39) | | | (0.38) | | | (0.48) | |
| | Distributions (from capital gains) | | — | | | (0.40) | | | — | | | (0.14) | | | (0.22) | | | — | |
| Total Dividends and Distributions | | (0.12) | | | (0.81) | | | (0.24) | | | (0.53) | | | (0.60) | | | (0.48) | |
| Net Asset Value, End of Period | | $11.32 | | | $10.62 | | | $14.77 | | | $12.26 | | | $13.09 | | | $11.76 | |
| Total Return* | | 7.70% | | | (24.05)% | | | 22.59% | | | (2.39)% | | | 17.31% | | | 7.98% | |
| Net Assets, End of Period (in thousands) | | $46,071 | | | $44,666 | | | $58,872 | | | $42,584 | | | $46,239 | | | $36,579 | |
| Average Net Assets for the Period (in thousands) | | $46,849 | | | $58,433 | | | $49,730 | | | $47,764 | | | $39,590 | | | $35,963 | |
| Ratios to Average Net Assets**: | | | | | | | | | | | | | | | | | | |
| | Ratio of Gross Expenses | | 1.19% | | | 1.08% | | | 1.06% | | | 1.08% | | | 1.16% | | | 1.08% | |
| | Ratio of Net Expenses (After Waivers and Expense Offsets) | | 1.19% | | | 1.08% | | | 1.06% | | | 1.08% | | | 1.16% | | | 1.08% | |
| | Ratio of Net Investment Income/(Loss) | | 2.18% | | | 1.74% | | | 2.41% | | | 1.62% | | | 1.65% | | | 1.75% | |
| Portfolio Turnover Rate | | 39% | | | 68% | | | 77% | | | 69% | | | 61% | | | 78% | |
| | | | | | | | | | | | | | | | | | | | | | |
| |
* Total return includes adjustments in accordance with generally accepted accounting principles required at the year or period end and are not annualized for periods of less than one full year. ** Annualized for periods of less than one full year. (1) Per share amounts are calculated based on average shares outstanding during the year or period. |
| | |
See Notes to Financial Statements. |
| |
Janus Investment Fund | 17 |
Janus Henderson Global Real Estate Fund
Financial Highlights
| | | | | | | | | | | | | | | | | | | | | | |
Class I Shares | | | | | | | | | | | | | | | | | | |
For a share outstanding during the period ended March 31, 2023 (unaudited) and the year ended September 30 | 2023 | | | 2022 | | | 2021 | | | 2020 | | | 2019 | | | 2018 | |
| Net Asset Value, Beginning of Period | | $10.60 | | | $14.75 | | | $12.25 | | | $13.08 | | | $11.75 | | | $11.33 | |
| Income/(Loss) from Investment Operations: | | | | | | | | | | | | | | | | | | |
| | Net investment income/(loss)(1) | | 0.12 | | | 0.24 | | | 0.34 | | | 0.22 | | | 0.20 | | | 0.22 | |
| | Net realized and unrealized gain/(loss) | | 0.71 | | | (3.58) | | | 2.41 | | | (0.51) | | | 1.74 | | | 0.69 | |
| Total from Investment Operations | | 0.83 | | | (3.34) | | | 2.75 | | | (0.29) | | | 1.94 | | | 0.91 | |
| Less Dividends and Distributions: | | | | | | | | | | | | | | | | | | |
| | Dividends (from net investment income) | | (0.12) | | | (0.41) | | | (0.25) | | | (0.40) | | | (0.39) | | | (0.49) | |
| | Distributions (from capital gains) | | — | | | (0.40) | | | — | | | (0.14) | | | (0.22) | | | — | |
| Total Dividends and Distributions | | (0.12) | | | (0.81) | | | (0.25) | | | (0.54) | | | (0.61) | | | (0.49) | |
| Net Asset Value, End of Period | | $11.31 | | | $10.60 | | | $14.75 | | | $12.25 | | | $13.08 | | | $11.75 | |
| Total Return* | | 7.84% | | | (24.04)% | | | 22.56% | | | (2.31)% | | | 17.41% | | | 8.21% | |
| Net Assets, End of Period (in thousands) | | $320,175 | | | $383,144 | | | $551,129 | | | $408,928 | | | $211,998 | | | $147,863 | |
| Average Net Assets for the Period (in thousands) | | $364,541 | | | $531,316 | | | $484,077 | | | $291,765 | | | $186,262 | | | $120,270 | |
| Ratios to Average Net Assets**: | | | | | | | | | | | | | | | | | | |
| | Ratio of Gross Expenses | | 1.12% | | | 1.03% | | | 1.00% | | | 1.02% | | | 1.09% | | | 0.96% | |
| | Ratio of Net Expenses (After Waivers and Expense Offsets) | | 1.12% | | | 1.03% | | | 1.00% | | | 1.02% | | | 1.09% | | | 0.96% | |
| | Ratio of Net Investment Income/(Loss) | | 2.14% | | | 1.77% | | | 2.44% | | | 1.83% | | | 1.68% | | | 1.91% | |
| Portfolio Turnover Rate | | 39% | | | 68% | | | 77% | | | 69% | | | 61% | | | 78% | |
| | | | | | | | | | | | | | | | | | | | | | |
| |
* Total return includes adjustments in accordance with generally accepted accounting principles required at the year or period end and are not annualized for periods of less than one full year. ** Annualized for periods of less than one full year. (1) Per share amounts are calculated based on average shares outstanding during the year or period. |
| | |
See Notes to Financial Statements. |
| |
18 | MARCH 31, 2023 |
Janus Henderson Global Real Estate Fund
Financial Highlights
| | | | | | | | | | | | | | | | | | | | | | |
Class N Shares | | | | | | | | | | | | | | | | | | |
For a share outstanding during the period ended March 31, 2023 (unaudited) and the year or period ended September 30 | 2023 | | | 2022 | | | 2021 | | | 2020 | | | 2019 | | | 2018(1) | |
| Net Asset Value, Beginning of Period | | $10.61 | | | $14.76 | | | $12.24 | | | $13.07 | | | $11.75 | | | $11.81 | |
| Income/(Loss) from Investment Operations: | | | | | | | | | | | | | | | | | | |
| | Net investment income/(loss)(2) | | 0.13 | | | 0.26 | | | 0.35 | | | 0.23 | | | 0.27 | | | 0.17 | |
| | Net realized and unrealized gain/(loss) | | 0.70 | | | (3.58) | | | 2.42 | | | (0.51) | | | 1.67 | | | (0.10) | |
| Total from Investment Operations | | 0.83 | | | (3.32) | | | 2.77 | | | (0.28) | | | 1.94 | | | 0.07 | |
| Less Dividends and Distributions: | | | | | | | | | | | | | | | | | | |
| | Dividends (from net investment income) | | (0.13) | | | (0.43) | | | (0.25) | | | (0.41) | | | (0.40) | | | (0.13) | |
| | Distributions (from capital gains) | | — | | | (0.40) | | | — | | | (0.14) | | | (0.22) | | | — | |
| Total Dividends and Distributions | | (0.13) | | | (0.83) | | | (0.25) | | | (0.55) | | | (0.62) | | | (0.13) | |
| Net Asset Value, End of Period | | $11.31 | | | $10.61 | | | $14.76 | | | $12.24 | | | $13.07 | | | $11.75 | |
| Total Return* | | 7.80% | | | (23.94)% | | | 22.80% | | | (2.22)% | | | 17.43% | | | 0.59% | |
| Net Assets, End of Period (in thousands) | | $89,658 | | | $82,484 | | | $114,928 | | | $88,550 | | | $71,472 | | | $35,316 | |
| Average Net Assets for the Period (in thousands) | | $90,609 | | | $106,338 | | | $104,011 | | | $80,627 | | | $34,671 | | | $28,132 | |
| Ratios to Average Net Assets**: | | | | | | | | | | | | | | | | | | |
| | Ratio of Gross Expenses | | 1.01% | | | 0.92% | | | 0.90% | | | 0.92% | | | 0.99% | | | 0.93% | |
| | Ratio of Net Expenses (After Waivers and Expense Offsets) | | 1.01% | | | 0.92% | | | 0.90% | | | 0.92% | | | 0.99% | | | 0.93% | |
| | Ratio of Net Investment Income/(Loss) | | 2.38% | | | 1.88% | | | 2.49% | | | 1.84% | | | 2.28% | | | 2.14% | |
| Portfolio Turnover Rate | | 39% | | | 68% | | | 77% | | | 69% | | | 61% | | | 78% | |
| | | | | | | | | | | | | | | | | | | | | | |
| |
* Total return includes adjustments in accordance with generally accepted accounting principles required at the year or period end and are not annualized for periods of less than one full year. ** Annualized for periods of less than one full year. (1) Period from January 26, 2018 (inception date) through September 30, 2018. (2) Per share amounts are calculated based on average shares outstanding during the year or period. |
| | |
See Notes to Financial Statements. |
| |
Janus Investment Fund | 19 |
Janus Henderson Global Real Estate Fund
Financial Highlights
| | | | | | | | | | | | | | | | | | | | | | |
Class S Shares | | | | | | | | | | | | | | | | | | |
For a share outstanding during the period ended March 31, 2023 (unaudited) and the year ended September 30 | 2023 | | | 2022 | | | 2021 | | | 2020 | | | 2019 | | | 2018 | |
| Net Asset Value, Beginning of Period | | $10.48 | | | $14.59 | | | $12.15 | | | $12.97 | | | $11.66 | | | $11.26 | |
| Income/(Loss) from Investment Operations: | | | | | | | | | | | | | | | | | | |
| | Net investment income/(loss)(1) | | 0.10 | | | 0.19 | | | 0.29 | | | 0.16 | | | 0.15 | | | 0.16 | |
| | Net realized and unrealized gain/(loss) | | 0.70 | | | (3.54) | | | 2.37 | | | (0.49) | | | 1.72 | | | 0.67 | |
| Total from Investment Operations | | 0.80 | | | (3.35) | | | 2.66 | | | (0.33) | | | 1.87 | | | 0.83 | |
| Less Dividends and Distributions: | | | | | | | | | | | | | | | | | | |
| | Dividends (from net investment income) | | (0.10) | | | (0.36) | | | (0.22) | | | (0.35) | | | (0.34) | | | (0.43) | |
| | Distributions (from capital gains) | | — | | | (0.40) | | | — | | | (0.14) | | | (0.22) | | | — | |
| Total Dividends and Distributions | | (0.10) | | | (0.76) | | | (0.22) | | | (0.49) | | | (0.56) | | | (0.43) | |
| Net Asset Value, End of Period | | $11.18 | | | $10.48 | | | $14.59 | | | $12.15 | | | $12.97 | | | $11.66 | |
| Total Return* | | 7.61% | | | (24.37)% | | | 22.03% | | | (2.69)% | | | 16.86% | | | 7.56% | |
| Net Assets, End of Period (in thousands) | | $7,834 | | | $7,238 | | | $9,178 | | | $6,692 | | | $5,177 | | | $2,464 | |
| Average Net Assets for the Period (in thousands) | | $7,663 | | | $9,305 | | | $7,647 | | | $6,265 | | | $3,433 | | | $2,615 | |
| Ratios to Average Net Assets**: | | | | | | | | | | | | | | | | | | |
| | Ratio of Gross Expenses | | 1.55% | | | 1.46% | | | 1.43% | | | 1.46% | | | 1.57% | | | 1.45% | |
| | Ratio of Net Expenses (After Waivers and Expense Offsets) | | 1.54% | | | 1.45% | | | 1.43% | | | 1.46% | | | 1.53% | | | 1.45% | |
| | Ratio of Net Investment Income/(Loss) | | 1.84% | | | 1.38% | | | 2.06% | | | 1.30% | | | 1.28% | | | 1.35% | |
| Portfolio Turnover Rate | | 39% | | | 68% | | | 77% | | | 69% | | | 61% | | | 78% | |
| | | | | | | | | | | | | | | | | | | | | | |
| |
* Total return includes adjustments in accordance with generally accepted accounting principles required at the year or period end and are not annualized for periods of less than one full year. ** Annualized for periods of less than one full year. (1) Per share amounts are calculated based on average shares outstanding during the year or period. |
| | |
See Notes to Financial Statements. |
| |
20 | MARCH 31, 2023 |
Janus Henderson Global Real Estate Fund
Financial Highlights
| | | | | | | | | | | | | | | | | | | | | | |
Class T Shares | | | | | | | | | | | | | | | | | | |
For a share outstanding during the period ended March 31, 2023 (unaudited) and the year ended September 30 | 2023 | | | 2022 | | | 2021 | | | 2020 | | | 2019 | | | 2018 | |
| Net Asset Value, Beginning of Period | | $10.60 | | | $14.75 | | | $12.25 | | | $13.08 | | | $11.75 | | | $11.34 | |
| Income/(Loss) from Investment Operations: | | | | | | | | | | | | | | | | | | |
| | Net investment income/(loss)(1) | | 0.12 | | | 0.23 | | | 0.32 | | | 0.19 | | | 0.19 | | | 0.19 | |
| | Net realized and unrealized gain/(loss) | | 0.69 | | | (3.59) | | | 2.42 | | | (0.50) | | | 1.74 | | | 0.69 | |
| Total from Investment Operations | | 0.81 | | | (3.36) | | | 2.74 | | | (0.31) | | | 1.93 | | | 0.88 | |
| Less Dividends and Distributions: | | | | | | | | | | | | | | | | | | |
| | Dividends (from net investment income) | | (0.11) | | | (0.39) | | | (0.24) | | | (0.38) | | | (0.38) | | | (0.47) | |
| | Distributions (from capital gains) | | — | | | (0.40) | | | — | | | (0.14) | | | (0.22) | | | — | |
| Total Dividends and Distributions | | (0.11) | | | (0.79) | | | (0.24) | | | (0.52) | | | (0.60) | | | (0.47) | |
| Net Asset Value, End of Period | | $11.30 | | | $10.60 | | | $14.75 | | | $12.25 | | | $13.08 | | | $11.75 | |
| Total Return* | | 7.67% | | | (24.15)% | | | 22.49% | | | (2.47)% | | | 17.27% | | | 7.90% | |
| Net Assets, End of Period (in thousands) | | $84,570 | | | $87,895 | | | $121,737 | | | $91,313 | | | $80,573 | | | $43,490 | |
| Average Net Assets for the Period (in thousands) | | $88,294 | | | $114,716 | | | $107,523 | | | $95,019 | | | $54,353 | | | $51,128 | |
| Ratios to Average Net Assets**: | | | | | | | | | | | | | | | | | | |
| | Ratio of Gross Expenses | | 1.26% | | | 1.17% | | | 1.14% | | | 1.16% | | | 1.23% | | | 1.14% | |
| | Ratio of Net Expenses (After Waivers and Expense Offsets) | | 1.25% | | | 1.17% | | | 1.14% | | | 1.16% | | | 1.23% | | | 1.14% | |
| | Ratio of Net Investment Income/(Loss) | | 2.08% | | | 1.65% | | | 2.30% | | | 1.57% | | | 1.59% | | | 1.64% | |
| Portfolio Turnover Rate | | 39% | | | 68% | | | 77% | | | 69% | | | 61% | | | 78% | |
| | | | | | | | | | | | | | | | | | | | | | |
| |
* Total return includes adjustments in accordance with generally accepted accounting principles required at the year or period end and are not annualized for periods of less than one full year. ** Annualized for periods of less than one full year. (1) Per share amounts are calculated based on average shares outstanding during the year or period. |
| | |
See Notes to Financial Statements. |
| |
Janus Investment Fund | 21 |
Janus Henderson Global Real Estate Fund
Notes to Financial Statements (unaudited)
1. Organization and Significant Accounting Policies
Janus Henderson Global Real Estate Fund (the “Fund”) is a series of Janus Investment Fund (the “Trust”), which is organized as a Massachusetts business trust and is registered under the Investment Company Act of 1940, as amended (the “1940 Act”), as an open-end management investment company, and therefore has applied the specialized accounting and reporting guidance in Financial Accounting Standards Board (“FASB”) Accounting Standards Codification (“ASC”) Topic 946. The Trust offers 40 funds, each of which offers multiple share classes, with differing investment objectives and policies. The Fund seeks total return through a combination of capital appreciation and current income. The Fund is classified as diversified, as defined in the 1940 Act. Janus Henderson Investors US LLC is the investment adviser (the “Adviser”) to the Fund.
The Fund offers multiple classes of shares in order to meet the needs of various types of investors. Each class represents an interest in the same portfolio of investments. Certain financial intermediaries may not offer all classes of shares.
Shareholders, including other funds, individuals, accounts, as well as the Fund’s portfolio manager(s) and/or investment personnel, may from time to time own (beneficially or of record) a significant percentage of the Fund’s Shares and can be considered to “control” the Fund when that ownership exceeds 25% of the Fund’s assets (and which may differ from control as determined in accordance with United States of America generally accepted accounting principles ("US GAAP")).
Class A Shares are offered through financial intermediary platforms including, but not limited to, traditional brokerage platforms, mutual fund wrap fee programs, bank trust platforms, and retirement platforms.
Class C Shares are offered through financial intermediary platforms including, but not limited to, traditional brokerage platforms, mutual fund wrap fee programs, and bank trust platforms.
Class C Shares are closed to investments by new employer-sponsored retirement plans and existing employer-sponsored retirement plans are no longer able to make additional purchases or exchanges into Class C Shares.
The Fund currently implements an automatic conversion feature pursuant to which Class C Shares that have been held for eight years are automatically converted to Class A Shares without the imposition of any sales charge, fee or other charge. The conversion will generally occur no later than ten business days in the month following the month of the eighth anniversary of the date of purchase. Class C Shares purchased through the reinvestment of dividends and other distributions on Class C Shares will convert to Class A Shares at the same time as the original Class C Shares with respect to which they were purchased. For Class C Shares held in omnibus accounts on intermediary platforms, the Fund relies on these intermediaries to implement this conversion feature. Your financial intermediary may have separate policies and procedures as to when and how Class C Shares may be converted to Class A Shares.
Effective July 6, 2020, Class D Shares are available to new investors, subject to any closed fund policies for a Fund, as applicable. Previously, Class D Shares were only available to investors who already had a direct account with the Janus Henderson funds; immediate family members or members of the same household of an eligible individual investor; and existing beneficial owners of sole proprietorships or partnerships that hold accounts directly with the Janus Henderson funds.
Class I Shares are available through certain financial intermediary platforms including, but not limited to, mutual fund wrap fee programs, managed account programs, asset allocation programs, bank trust platforms, as well as certain retirement platforms. Class I Shares are also available to certain direct institutional investors including, but not limited to, corporations, certain retirement plans, public plans, and foundations/endowments, who established Class I Share accounts before August 4, 2017.
Class N Shares are generally available only to financial intermediaries purchasing on behalf of: 1) certain adviser-assisted, employer-sponsored retirement plans, including 401(k) plans, 457 plans, 403(b) plans, Taft-Hartley multi-employer plans, profit-sharing and money purchase pension plans, defined benefit plans and certain welfare benefit plans, such as health savings accounts, and nonqualified deferred compensation plans; and 2) retail investors purchasing in qualified or nonqualified accounts, whose accounts are held through an omnibus account at their financial intermediary, and where the financial intermediary requires no payment or reimbursement from the Fund, the Adviser, or its affiliates. Class N Shares are also available to Janus Henderson proprietary products and to certain direct institutional investors approved by Janus Henderson Distributors US LLC (the “Distributor”) including, but not limited to,
Janus Henderson Global Real Estate Fund
Notes to Financial Statements (unaudited)
corporations, certain retirement plans, public plans, and foundations and endowments, subject to minimum investment requirements.
Class S Shares are offered through financial intermediary platforms including, but not limited to, retirement platforms and asset allocation, mutual fund wrap, or other discretionary or nondiscretionary fee-based investment advisory programs. In addition, Class S Shares may be available through certain financial intermediaries who have an agreement with the Adviser or its affiliates to offer Class S Shares on their supermarket platforms.
Class T Shares are available through certain financial intermediary platforms including, but not limited to, mutual fund wrap fee programs, managed account programs, asset allocation programs, bank trust platforms, as well as certain retirement platforms. In addition, Class T Shares may be available through certain financial intermediaries who have an agreement with the Adviser or its affiliates to offer Class T Shares on their supermarket platforms.
The following accounting policies have been followed by the Fund and are in conformity with US GAAP.
Investment Valuation
Fund holdings are valued in accordance with policies and procedures established by the Adviser pursuant to Rule 2a-5 under the 1940 Act and approved by and subject to the oversight of the Trustees (the “Valuation Procedures”). Equity securities traded on a domestic securities exchange are generally valued at readily available market quotations, which are (i) the official close prices or (ii) last sale prices on the primary market or exchange in which the securities trade. If such price is lacking for the trading period immediately preceding the time of determination, such securities are generally valued at their current bid price. Equity securities that are traded on a foreign exchange are generally valued at the closing prices on such markets. In the event that there is no current trading volume on a particular security in such foreign exchange, the bid price from the primary exchange is generally used to value the security. Foreign securities and currencies are converted to U.S. dollars using the current spot USD dollar exchange rate in effect at the close of the New York Stock Exchange (“NYSE”). The Fund will determine the market value of individual securities held by it by using prices provided by one or more approved professional pricing services or, as needed, by obtaining market quotations from independent broker-dealers. Most debt securities are valued in accordance with the evaluated bid price supplied by the Adviser-approved pricing service that is intended to reflect market value. The evaluated bid price supplied by the pricing service is an evaluation that may consider factors such as security prices, yields, maturities and ratings. Certain short-term securities maturing within 60 days or less may be evaluated and valued on an amortized cost basis provided that the amortized cost determined approximates market value. Securities for which market quotations or evaluated prices are not readily available or deemed unreliable are valued at fair value determined in good faith by the Adviser pursuant to the Valuation Procedures. Circumstances in which fair valuation may be utilized include, but are not limited to: (i) a significant event that may affect the securities of a single issuer, such as a merger, bankruptcy, or significant issuer-specific development; (ii) an event that may affect an entire market, such as a natural disaster or significant governmental action; (iii) a nonsignificant event such as a market closing early or not opening, or a security trading halt; and (iv) pricing of a nonvalued security and a restricted or nonpublic security. Special valuation considerations may apply with respect to “odd-lot” fixed-income transactions which, due to their small size, may receive evaluated prices by pricing services which reflect a large block trade and not what actually could be obtained for the odd-lot position. The valuation policies provide for the use of systematic fair valuation models provided by independent pricing services to value foreign equity securities in order to adjust for stale pricing, which may occur between the close of certain foreign exchanges and the close of the NYSE. The value of the securities of other mutual funds held by a Fund, if any, will be calculated using the NAV of such mutual funds.
Valuation Inputs Summary
FASB ASC 820, Fair Value Measurements and Disclosures (“ASC 820”), defines fair value, establishes a framework for measuring fair value, and expands disclosure requirements regarding fair value measurements. This standard emphasizes that fair value is a market-based measurement that should be determined based on the assumptions that market participants would use in pricing an asset or liability and establishes a hierarchy that prioritizes inputs to valuation techniques used to measure fair value. These inputs are summarized into three broad levels:
Level 1 – Unadjusted quoted prices in active markets the Fund has the ability to access for identical assets or liabilities.
Level 2 – Observable inputs other than unadjusted quoted prices included in Level 1 that are observable for the asset or liability either directly or indirectly. These inputs may include quoted prices for the identical instrument on
Janus Henderson Global Real Estate Fund
Notes to Financial Statements (unaudited)
an inactive market, prices for similar instruments, interest rates, prepayment speeds, credit risk, yield curves, default rates and similar data.
Assets or liabilities categorized as Level 2 in the hierarchy generally include: debt securities fair valued in accordance with the evaluated bid or ask prices supplied by a pricing service; securities traded on OTC markets and listed securities for which no sales are reported that are fair valued at the latest bid price (or yield equivalent thereof) obtained from one or more dealers transacting in a market for such securities or by a pricing service approved by the Fund’s Trustees; certain short-term debt securities with maturities of 60 days or less that are fair valued at amortized cost; and equity securities of foreign issuers whose fair value is determined by using systematic fair valuation models provided by independent third parties in order to adjust for stale pricing which may occur between the close of certain foreign exchanges and the close of the NYSE. Other securities that may be categorized as Level 2 in the hierarchy include, but are not limited to, preferred stocks, bank loans, swaps, investments in unregistered investment companies, options, and forward contracts.
Level 3 – Unobservable inputs for the asset or liability to the extent that relevant observable inputs are not available, representing the Fund’s own assumptions about the assumptions that a market participant would use in valuing the asset or liability, and that would be based on the best information available.
There have been no significant changes in valuation techniques used in valuing any such positions held by the Fund since the beginning of the fiscal period.
The inputs or methodology used for fair valuing securities are not necessarily an indication of the risk associated with investing in those securities. The summary of inputs used as of March 31, 2023 to fair value the Fund’s investments in securities and other financial instruments is included in the “Valuation Inputs Summary” in the Notes to Schedule of Investments and Other Information.
Investment Transactions and Investment Income
Investment transactions are accounted for as of the date purchased or sold (trade date). Dividend income is recorded on the ex-dividend date. Certain dividends from foreign securities will be recorded as soon as the Fund is informed of the dividend, if such information is obtained subsequent to the ex-dividend date. Dividends from foreign securities may be subject to withholding taxes in foreign jurisdictions. Non-cash dividends, if any, are recorded on the ex-dividend date at fair value. Interest income is recorded daily on an accrual basis and includes amortization of premiums and accretion of discounts. The Fund classifies gains and losses on prepayments received as an adjustment to interest income. Debt securities may be placed in non-accrual status and related interest income may be reduced by stopping current accruals and writing off interest receivables when collection of all or a portion of interest has become doubtful. Gains and losses are determined on the identified cost basis, which is the same basis used for federal income tax purposes. Income, as well as gains and losses, both realized and unrealized, are allocated daily to each class of shares based upon the ratio of net assets represented by each class as a percentage of total net assets.
Expenses
The Fund bears expenses incurred specifically on its behalf. Each class of shares bears a portion of general expenses, which are allocated daily to each class of shares based upon the ratio of net assets represented by each class as a percentage of total net assets. Expenses directly attributable to a specific class of shares are charged against the operations of such class.
Estimates
The preparation of financial statements in conformity with US GAAP requires management to make estimates and assumptions that affect the reported amount of assets and liabilities and disclosure of contingent assets and liabilities at the date of the financial statements, and the reported amounts of income and expenses during the reporting period. Actual results could differ from those estimates.
Indemnifications
In the normal course of business, the Fund may enter into contracts that contain provisions for indemnification of other parties against certain potential liabilities. The Fund’s maximum exposure under these arrangements is unknown, and would involve future claims that may be made against the Fund that have not yet occurred. Currently, the risk of material loss from such claims is considered remote.
Janus Henderson Global Real Estate Fund
Notes to Financial Statements (unaudited)
Foreign Currency Translations
The Fund does not isolate that portion of the results of operations resulting from the effect of changes in foreign exchange rates on investments from the fluctuations arising from changes in market prices of securities held at the date of the financial statements. Net unrealized appreciation or depreciation of investments and foreign currency translations arise from changes in the value of assets and liabilities, including investments in securities held at the date of the financial statements, resulting from changes in the exchange rates and changes in market prices of securities held.
Currency gains and losses are also calculated on payables and receivables that are denominated in foreign currencies. The payables and receivables are generally related to foreign security transactions and income translations.
Foreign currency-denominated assets and forward currency contracts may involve more risks than domestic transactions, including currency risk, counterparty risk, political and economic risk, regulatory risk and equity risk. Risks may arise from unanticipated movements in the value of foreign currencies relative to the U.S. dollar.
Dividends and Distributions
Dividends of net investment income are generally declared and distributed quarterly, and realized capital gains (if any) are distributed annually. The Fund may treat a portion of the amount paid to redeem shares as a distribution of investment company taxable income and realized capital gains that are reflected in the net asset value. This practice, commonly referred to as “equalization,” has no effect on the redeeming shareholder or a Fund’s total return, but may reduce the amounts that would otherwise be required to be paid as taxable dividends to the remaining shareholders. It is possible that the Internal Revenue Service (IRS) could challenge the Fund's equalization methodology or calculations, and any such challenge could result in additional tax, interest, or penalties to be paid by the Fund.
The Fund may make certain investments in real estate investment trusts (“REITs”) which pay dividends to their shareholders based upon funds available from operations. It is quite common for these dividends to exceed the REITs’ taxable earnings and profits, resulting in the excess portion of such dividends being designated as a return of capital. If the Fund distributes such amounts, such distributions could constitute a return of capital to shareholders for federal income tax purposes.
Federal Income Taxes
The Fund intends to continue to qualify as a regulated investment company and distribute all of its taxable income in accordance with the requirements of Subchapter M of the Internal Revenue Code. Management has analyzed the Fund’s tax positions taken for all open federal income tax years, generally a three-year period, and has concluded that no provision for federal income tax is required in the Fund’s financial statements. The Fund is not aware of any tax positions for which it is reasonably possible that the total amounts of unrecognized tax benefits will significantly change in the next twelve months.
2. Other Investments and Strategies
Additional Investment Risk
The U.S. government and the Federal Reserve, as well as certain foreign governments and central banks, have taken extraordinary actions to support local and global economies and the financial markets in response to the COVID-19 pandemic. This and other government intervention into the economy and financial markets to address the COVID-19 pandemic may not work as intended, particularly if the efforts are perceived by investors as being unlikely to achieve the desired results. Government actions to mitigate the economic impact of the pandemic have resulted in a large expansion of government deficits and debt, the long term consequences of which are not known. The COVID-19 pandemic could adversely affect the value and liquidity of a Fund’s investments, impair a Fund’s ability to satisfy redemption requests, and negatively impact a Fund’s performance. In addition, the outbreak of COVID-19, and measures taken to mitigate its effects, could result in disruptions to the services provided to a Fund by its service providers.
Widespread disease, including pandemics and epidemics, and natural or environmental disasters, including those which may be attributable to global climate change, such as earthquakes, fires, floods, hurricanes, tsunamis and weather-related phenomena generally, have been and can be highly disruptive to economies and markets, adversely impacting individual companies, sectors, industries, markets, currencies, interest and inflation rates, credit ratings, investor sentiment, and other factors affecting the value of a Fund’s investments. Economies and financial markets throughout the world have become increasingly interconnected, which increases the likelihood that events or conditions in one
Janus Henderson Global Real Estate Fund
Notes to Financial Statements (unaudited)
region or country will adversely affect markets or issuers in other regions or countries, including the United States. These disruptions could prevent a Fund from executing advantageous investment decisions in a timely manner and negatively impact a Fund’s ability to achieve its investment objective(s). Any such event(s) could have a significant adverse impact on the value of a Fund. In addition, these disruptions could also impair the information technology and other operational systems upon which the Fund’s service providers, including the Adviser or the subadviser (as applicable), rely, and could otherwise disrupt the ability of employees of the Fund’s service providers to perform essential tasks on behalf of the Fund. Adverse weather conditions may also have a particularly significant negative effect on issuers in the agricultural sector and on insurance and reinsurance companies that insure or reinsure against the impact of natural disasters.
A number of countries in the European Union (the “EU”) have experienced, and may continue to experience, severe economic and financial difficulties. In particular, many EU nations are susceptible to economic risks associated with high levels of debt. Many non-governmental issuers, and even certain governments, have defaulted on, or been forced to restructure, their debts. Many other issuers have faced difficulties obtaining credit or refinancing existing obligations. Financial institutions have in many cases required government or central bank support, have needed to raise capital, and/or have been impaired in their ability to extend credit. As a result, financial markets in the EU have experienced extreme volatility and declines in asset values and liquidity. These difficulties may continue, worsen, or spread further within the EU. Responses to these financial problems by European governments, central banks, and others, including austerity measures and reforms, may not work, may result in social unrest, and may limit future growth and economic recovery or have other unintended consequences. Among other things, these developments have adversely affected the value and exchange rate of the euro and pound sterling, and may continue to significantly affect the economies of all EU countries, which in turn may have a material adverse effect on the Fund’s investments in such countries, other countries that depend on EU countries for significant amounts of trade or investment, or issuers with exposure to debt issued by certain EU countries.
Real Estate Investing
The Fund may invest in equity and debt securities of real estate-related companies. Such companies may include those in the real estate industry or real estate-related industries. These securities may include common stocks, corporate bonds, preferred stocks, and other equity securities, including, but not limited to, mortgage-backed securities, real estate-backed securities, securities of REITs and similar REIT-like entities. A REIT is a trust that invests in real estate-related projects, such as properties, mortgage loans, and construction loans. REITs are generally categorized as equity, mortgage, or hybrid REITs. A REIT may be listed on an exchange or traded OTC.
Counterparties
Fund transactions involving a counterparty are subject to the risk that the counterparty or a third party will not fulfill its obligation to the Fund (“counterparty risk”). Counterparty risk may arise because of the counterparty’s financial condition (i.e., financial difficulties, bankruptcy, or insolvency), market activities and developments, or other reasons, whether foreseen or not. A counterparty’s inability to fulfill its obligation may result in significant financial loss to the Fund. The Fund may be unable to recover its investment from the counterparty or may obtain a limited recovery, and/or recovery may be delayed. The extent of the Fund’s exposure to counterparty risk with respect to financial assets and liabilities approximates its carrying value.
The Fund may be exposed to counterparty risk through participation in various programs, including, but not limited to, lending its securities to third parties, cash sweep arrangements whereby the Fund’s cash balance is invested in one or more types of cash management vehicles, as well as investments in, but not limited to, repurchase agreements, debt securities, and derivatives, including various types of swaps, futures and options. The Fund intends to enter into financial transactions with counterparties that the Adviser believes to be creditworthy at the time of the transaction. There is always the risk that the Adviser’s analysis of a counterparty’s creditworthiness is incorrect or may change due to market conditions. To the extent that the Fund focuses its transactions with a limited number of counterparties, it will have greater exposure to the risks associated with one or more counterparties.
Securities Lending
Under procedures adopted by the Trustees, the Fund may seek to earn additional income by lending securities to certain qualified broker-dealers and institutions. JPMorgan Chase Bank, National Association acts as securities lending agent and a limited purpose custodian or subcustodian to receive and disburse cash balances and cash collateral, hold short-term investments, hold collateral, and perform other custodial functions in accordance with the Non-Custodial Securities Lending Agreement. For financial reporting purposes, the Fund does not offset financial instruments’
Janus Henderson Global Real Estate Fund
Notes to Financial Statements (unaudited)
payables and receivables and related collateral on the Statement of Assets and Liabilities. The Fund may lend fund securities in an amount equal to up to 1/3 of its total assets as determined at the time of the loan origination. There is the risk of delay in recovering a loaned security or the risk of loss in collateral rights if the borrower fails financially. In addition, the Adviser makes efforts to balance the benefits and risks from granting such loans. All loans will be continuously secured by collateral which may consist of cash, U.S. Government securities, domestic and foreign short-term debt instruments, letters of credit, time deposits, repurchase agreements, money market mutual funds or other money market accounts, or such other collateral as permitted by the Securities and Exchange Commission (the "SEC"). If the Fund is unable to recover a security on loan, the Fund may use the collateral to purchase replacement securities in the market. There is a risk that the value of the collateral could decrease below the cost of the replacement security by the time the replacement investment is made, resulting in a loss to the Fund. In certain circumstances individual loan transactions could yield negative returns.
Upon receipt of cash collateral, the Adviser may invest it in affiliated or non-affiliated cash management vehicles, whether registered or unregistered entities, as permitted by the 1940 Act and rules promulgated thereunder. The Adviser currently intends to primarily invest the cash collateral in a cash management vehicle for which the Adviser serves as investment adviser, Janus Henderson Cash Collateral Fund LLC, or in time deposits. An investment in Janus Henderson Cash Collateral Fund LLC is generally subject to the same risks that shareholders experience when investing in similarly structured vehicles, such as the potential for significant fluctuations in assets as a result of the purchase and redemption activity of the securities lending program, a decline in the value of the collateral, and possible liquidity issues. Such risks may delay the return of the cash collateral and cause the Fund to violate its agreement to return the cash collateral to a borrower in a timely manner. As adviser to the Fund and Janus Henderson Cash Collateral Fund LLC, the Adviser has an inherent conflict of interest as a result of its fiduciary duties to both the Fund and Janus Henderson Cash Collateral Fund LLC. Additionally, the Adviser receives an investment advisory fee of 0.05% for managing Janus Henderson Cash Collateral Fund LLC, but it may not receive a fee for managing certain other affiliated cash management vehicles in which the Fund may invest, and therefore may have an incentive to allocate preferred investment opportunities to investment vehicles for which it is receiving a fee.
The value of the collateral must be at least 102% of the market value of the loaned securities that are denominated in U.S. dollars and 105% of the market value of the loaned securities that are not denominated in U.S. dollars. Loaned securities and related collateral are marked-to-market each business day based upon the market value of the loaned securities at the close of business, employing the most recent available pricing information. Collateral levels are then adjusted based on this mark-to-market evaluation. Additional required collateral, or excess collateral returned, is delivered on the next business day. Therefore, the value of the collateral held may be temporarily less than 102% or 105% value of the securities on loan. The cash collateral invested by the Adviser is disclosed in the Schedule of Investments (if applicable).
Income earned from the investment of the cash collateral, net of rebates paid to, or fees paid by, borrowers and less the fees paid to the lending agent are included as “Affiliated securities lending income, net” on the Statement of Operations.
There were no securities on loan as of March 31, 2023.
3. Investment Advisory Agreements and Other Transactions with Affiliates
The Fund pays the Adviser an investment advisory fee rate that may adjust up or down based on the Fund’s performance relative to its benchmark index.
The investment advisory fee rate paid to the Adviser by the Fund consists of two components: (1) a base fee calculated by applying the contractual fixed rate of the advisory fee to the Fund’s average daily net assets during the previous month (the “Base Fee Rate”), plus or minus (2) a performance-fee adjustment (the “Performance Adjustment”) calculated by applying a variable rate of up to 0.15% (positive or negative) to the Fund’s average daily net assets based on the Fund’s relative performance compared to the cumulative investment record of its benchmark index over a 36-month performance measurement period or shorter time period, as applicable. The investment advisory fee rate is calculated daily and paid monthly.
The investment performance of the Fund’s Class A Shares (waiving the upfront sales load) for the performance measurement period is used to calculate the Performance Adjustment. The Fund’s Base Fee Rate prior to any performance adjustment (expressed as an annual rate) is 0.75%, and the Fund’s benchmark index used in the calculation is the FTSE EPRA Nareit Global Index.
Janus Henderson Global Real Estate Fund
Notes to Financial Statements (unaudited)
No Performance Adjustment is applied unless the difference between the Fund’s investment performance and the cumulative investment record of the Fund’s benchmark index is 0.50% or greater (positive or negative) during the applicable performance measurement period. The Base Fee Rate is subject to an upward or downward Performance Adjustment for every full 0.50% increment by which the Fund outperforms or underperforms its benchmark index, up to the Fund’s full performance rate of ±4.00%. Because the Performance Adjustment is tied to a Fund’s relative performance compared to its benchmark index (and not its absolute performance), the Performance Adjustment could increase the Adviser’s fee even if the Fund’s Shares lose value during the performance measurement period and could decrease the Adviser’s fee even if the Fund’s Shares increase in value during the performance measurement period. For purposes of computing the Base Fee Rate and the Performance Adjustment, net assets are averaged over different periods (average daily net assets during the previous month for the Base Fee Rate, versus average daily net assets during the performance measurement period for the Performance Adjustment). Performance of the Fund is calculated net of expenses whereas the Fund’s benchmark index does not have any fees or expenses. Reinvestment of dividends and distributions is included in calculating both the performance of a Fund and the Fund’s benchmark index.
The Fund’s prospectuses and statement(s) of additional information contain additional information about performance-based fees. The amount shown as advisory fees on the Statement of Operations reflects the Base Fee Rate plus/minus any Performance Adjustment. For the period ended March 31, 2023, the performance adjusted investment advisory fee rate before any waivers and/or reimbursements of expenses is 0.93%.
The Adviser has entered into a personnel-sharing arrangement with its foreign (non-U.S.) affiliates, Henderson Global Investors Limited, Henderson Global Investors (Japan) Ltd., and Henderson Global Investors (Singapore) Ltd. (collectively, “HGIL”), pursuant to which HGIL and certain employees of HGIL serve as “associated persons” of the Adviser. In this capacity, such employees of HGIL are subject to the oversight and supervision of the Adviser and may provide portfolio management, research, and related services to the Fund on behalf of the Adviser.
The Adviser has contractually agreed to waive the investment advisory fee and/or reimburse operating expenses to the extent that the Fund’s total annual fund operating expenses, excluding any performance adjustments to management fees (if applicable), the fees payable pursuant to a Rule 12b-1 plan, shareholder servicing fees, such as transfer agency fees (including out-of-pocket costs), administrative services fees and any networking/omnibus payable by any share class, brokerage commissions, interest, dividends, taxes, acquired fund fees and expenses, and extraordinary expenses, exceed the annual rate of 0.91% of the Fund’s average daily net assets. The Adviser has agreed to continue the waivers for at least a one-year period commencing January 28, 2022. If applicable, amounts waived and/or reimbursed to the Fund by the Adviser are disclosed as “Excess Expense Reimbursement and Waivers” on the Statement of Operations.
The Adviser serves as administrator to the Fund pursuant to an administration agreement between the Adviser and the Trust. Under the administration agreement, the Adviser is authorized to perform, or cause others to perform certain administration, compliance, and accounting services to the Fund, including providing office space for the Fund, and is reimbursed by the Fund for certain of its costs in providing these services (to the extent the Adviser seeks reimbursement and such costs are not otherwise waived). In addition, employees of the Adviser and/or its affiliates may serve as officers of the Trust. The Fund pays for some or all of the salaries, fees, and expenses of the Adviser employees and Fund officers, with respect to certain specified administration functions they perform on behalf of the Fund. The Fund pays these costs based on out-of-pocket expenses incurred by the Adviser, and these costs are separate and apart from advisory fees and other expenses paid in connection with the investment advisory services the Adviser (or any subadvisor, as applicable) provides to the Fund. These amounts are disclosed as “Affiliated fund administration fees” on the Statement of Operations. In addition, some expenses related to compensation payable to the Fund’s Chief Compliance Officer and certain compliance staff, all of whom are employees of the Adviser and/or its affiliates, are shared with the Fund. Total compensation of $114,430 was paid to the Chief Compliance Officer and certain compliance staff by the Trust during the period ended March 31, 2023. The Fund's portion is reported as part of “Other expenses” on the Statement of Operations.
Janus Henderson Services US LLC (the “Transfer Agent”), a wholly-owned subsidiary of the Adviser, is the Fund’s transfer agent. The Transfer Agent provides or arranges for the provision of shareholder services including, but not limited to, recordkeeping, subaccounting, answering inquiries regarding accounts, order processing, transaction confirmations, the mailing of prospectuses and shareholder reports, and other shareholder services provided to or on behalf of shareholders. These amounts are disclosed as “Transfer agent administrative fees and expenses” on the Statement of Operations.
Janus Henderson Global Real Estate Fund
Notes to Financial Statements (unaudited)
Class D Shares of the Fund pay the Transfer Agent an annual administrative services fee based on the average daily net assets of Class D Shares as detailed below.
| | |
Average Daily Net Assets of Class D Shares of the Janus Henderson funds | Administrative Services Fee |
Under $40 billion | 0.12% |
$40 billion – $49.9 billion | 0.10% |
Over $49.9 billion | 0.08% |
During the reporting period, the administrative services fee rate was 0.12%.
The Transfer Agent receives an administrative services fee at an annual rate of up to 0.25% of the average daily net assets of the Fund’s Class S Shares and Class T Shares for providing or procuring administrative services to investors in Class S Shares and Class T Shares of the Fund. The Transfer Agent expects to use all or a significant portion of this fee to compensate retirement plan service providers, broker-dealers, bank trust departments, financial advisors, and other financial intermediaries for providing these services. The Transfer Agent may keep certain amounts retained for reimbursement of out-of-pocket costs incurred for servicing clients of Class S Shares and Class T Shares.
Shareholder Services provided by these financial intermediaries may include, but are not limited to, recordkeeping, subaccounting, order processing, providing order confirmations, periodic statements, forwarding prospectuses, shareholder reports, and other materials to existing customers, answering inquiries regarding accounts, and other administrative services. Order processing includes the submission of transactions through the National Securities Clearing Corporation (“NSCC”) or similar systems, or those processed on a manual basis with the Adviser. For all share classes, the Transfer Agent also seeks reimbursement for costs it incurs as transfer agent and for providing servicing.
Certain, but not all, intermediaries may charge administrative fees to investors in Class A Shares, Class C Shares, and Class I Shares for administrative services provided on behalf of such investors. These administrative fees are paid by the Class A Shares, Class C Shares, and Class I Shares of the Fund to the Transfer Agent, which uses such fees to reimburse intermediaries. Consistent with the Transfer Agency Agreement between the Transfer Agent and the Fund, the Transfer Agent may negotiate the level, structure, and/or terms of the administrative fees with intermediaries requiring such fees on behalf of the Fund. The Adviser and its affiliates benefit from an increase in assets that may result from such relationships. The Adviser has agreed to limit these fees up to 0.20% for Class A Shares and Class C Shares, and up to 0.15% for Class I Shares on an annual basis based on the daily net assets of each share class. Such limits are subject to change by the Trustees in the future. These amounts are disclosed as “Transfer agent networking and omnibus fees” on the Statement of Operations.
The Transfer Agent is not compensated for its services related to the shares, except for out-of-pocket costs, although the Transfer Agent is compensated for its services related to Fund’s Class D Shares. These amounts are disclosed as “Other transfer agent fees and expenses” on the Statement of Operations.
Under distribution and shareholder servicing plans (the “Plans”) adopted in accordance with Rule 12b-1 under the 1940 Act, the Fund pays the Trust’s distributor, the Distributor, a wholly-owned subsidiary of the Adviser, a fee for the sale and distribution and/or shareholder servicing of the shares based on the average daily net assets for each share class at an annual rate of up to 0.25% for Class A Shares, up to 1.00% for Class C Shares, and up to 0.25% for Class S Shares. Under the terms of the Plans, the Trust is authorized to make payments to the Distributor for remittance to retirement plan service providers, broker-dealers, bank trust departments, financial advisors, and other financial intermediaries, as compensation for distribution and/or shareholder services performed by such entities for their customers who are investors in the Fund. These amounts are disclosed as “12b-1 Distribution and shareholder servicing fees” on the Statement of Operations.
Class A Shares include a 5.75% upfront sales charge of the offering price of the Fund. The sales charge is allocated between the Distributor and financial intermediaries. During the period ended March 31, 2023, the Distributor retained upfront sales charges of $2,086.
A contingent deferred sales charge (“CDSC”) of 1.00% will be deducted with respect to Class A Shares purchased without a sales load and redeemed within 12 months of purchase, unless waived. Any applicable CDSC will be 1.00% of the lesser of the original purchase price or the value of the redemption of the Class A Shares redeemed. There were no CDSCs paid by redeeming shareholders of Class A Shares to the Distributor during the period ended March 31, 2023.
Janus Henderson Global Real Estate Fund
Notes to Financial Statements (unaudited)
A CDSC of 1.00% will be deducted with respect to Class C Shares redeemed within 12 months of purchase, unless waived. Any applicable CDSC will be 1.00% of the lesser of the original purchase price or the value of the redemption of the Class C Shares redeemed. During the period ended March 31, 2023, redeeming shareholders of Class C Shares paid CDSCs of $175.
The Board of Trustees has adopted a deferred compensation plan (the “Deferred Plan”) for independent Trustees to elect to defer receipt of all or a portion of the annual compensation they are entitled to receive from the Fund. All deferred fees are credited to an account established in the name of the Trustees. The amounts credited to the account then increase or decrease, as the case may be, in accordance with the performance of one or more of the Janus Henderson funds that are selected by the Trustees. The account balance continues to fluctuate in accordance with the performance of the selected fund or funds until final payment of all amounts are credited to the account. The fluctuation of the account balance is recorded by the Fund as unrealized appreciation/(depreciation) and is included as of March 31, 2023 on the Statement of Assets and Liabilities in the asset, “Trustees’ deferred compensation,” and liability, “Trustees’ deferred compensation fees.” Additionally, the recorded unrealized appreciation/(depreciation) is included in “Total distributable earnings (loss)” on the Statement of Assets and Liabilities. Deferred compensation expenses for the period ended March 31, 2023 are included in “Trustees’ fees and expenses” on the Statement of Operations. Trustees are allowed to change their designation of mutual funds from time to time. Amounts will be deferred until distributed in accordance with the Deferred Plan. Deferred fees of $205,688 were paid by the Trust to the Trustees under the Deferred Plan during the period ended March 31, 2023.
Pursuant to the provisions of the 1940 Act and related rules, the Fund may participate in an affiliated or non-affiliated cash sweep program. In the cash sweep program, uninvested cash balances of the Fund may be used to purchase shares of affiliated or non-affiliated money market funds or cash management pooled investment vehicles that operate as money market funds. The Fund is eligible to participate in the cash sweep program (the “Investing Funds”). The Adviser has an inherent conflict of interest because of its fiduciary duties to the affiliated money market funds or cash management pooled investment vehicles and the Investing Funds. Janus Henderson Cash Liquidity Fund LLC (the “Sweep Vehicle”) is an affiliated unregistered cash management pooled investment vehicle that invests primarily in highly-rated short-term fixed-income securities. The Sweep Vehicle operates pursuant to the provisions of the 1940 Act that govern the operation of money market funds and prices its shares at NAV reflecting market-based values of its portfolio securities (i.e., a “floating” NAV) rounded to the fourth decimal place (e.g., $1.0000). The Sweep Vehicle is permitted to impose a liquidity fee (of up to 2%) on redemptions from the Sweep Vehicle or a redemption gate that temporarily suspends redemptions from the Sweep Vehicle for up to 10 business days during a 90 day period. There are no restrictions on the Fund's ability to withdraw investments from the Sweep Vehicle at will, and there are no unfunded capital commitments due from the Fund to the Sweep Vehicle. The Sweep Vehicle does not charge any management fee, sales charge or service fee.
Any purchases and sales, realized gains/losses and recorded dividends from affiliated investments during the period ended March 31, 2023 can be found in the “Schedules of Affiliated Investments” located in the Schedule of Investments.
As of March 31, 2023, shares of the Fund were owned by affiliates of the Adviser, and/or other funds advised by the Adviser, as indicated in the table below:
| | | | | | |
Class | % of Class Owned | | % of Fund Owned | | |
Class A Shares | - | % | - | % | |
Class C Shares | - | | - | | |
Class D Shares | - | | - | | |
Class I Shares | - | | - | | |
Class N Shares | 15 | | 2 | | |
Class S Shares | - | | - | | |
Class T Shares | - | | - | | |
| | | | | | |
Janus Henderson Global Real Estate Fund
Notes to Financial Statements (unaudited)
4. Federal Income Tax
Income and capital gains distributions are determined in accordance with income tax regulations that may differ from US GAAP. These differences are due to differing treatments for items such as net short-term gains, deferral of wash sale losses, foreign currency transactions, net investment losses, and capital loss carryovers.
The Fund has elected to treat gains and losses on forward foreign currency contracts as capital gains and losses, if applicable. Other foreign currency gains and losses on debt instruments are treated as ordinary income for federal income tax purposes pursuant to Section 988 of the Internal Revenue Code.
The aggregate cost of investments and the composition of unrealized appreciation and depreciation of investment securities for federal income tax purposes as of March 31, 2023 are noted below. The primary differences between book and tax appreciation or depreciation of investments are wash sale loss deferrals, investments in partnerships, and investments in passive foreign investment companies.
| | | | |
Federal Tax Cost | Unrealized
Appreciation | Unrealized
(Depreciation) | Net Tax Appreciation/
(Depreciation) |
$ 585,605,836 | $40,148,222 | $(63,122,334) | $ (22,974,112) |
Janus Henderson Global Real Estate Fund
Notes to Financial Statements (unaudited)
5. Capital Share Transactions
| | | | | | | |
| | | | | | |
| | Period ended March 31, 2023 | | Year ended September 30, 2022 |
| | Shares | Amount | | Shares | Amount |
| | | | | | | |
Class A Shares: | | | | | |
Shares sold | 99,227 | $ 1,120,249 | | 222,130 | $ 3,085,637 |
Reinvested dividends and distributions | 8,505 | 94,242 | | 49,083 | 705,517 |
Shares repurchased | (137,243) | (1,515,826) | | (216,286) | (2,887,069) |
Net Increase/(Decrease) | (29,511) | $ (301,335) | | 54,927 | $ 904,085 |
Class C Shares: | | | | | |
Shares sold | 19,097 | $ 215,860 | | 59,826 | $ 815,647 |
Reinvested dividends and distributions | 2,065 | 22,292 | | 20,592 | 294,979 |
Shares repurchased | (88,807) | (974,945) | | (109,948) | (1,416,694) |
Net Increase/(Decrease) | (67,645) | $ (736,793) | | (29,530) | $ (306,068) |
Class D Shares: | | | | | |
Shares sold | 178,117 | $ 2,053,843 | | 870,256 | $ 12,510,701 |
Reinvested dividends and distributions | 41,294 | 461,353 | | 222,584 | 3,212,973 |
Shares repurchased | (358,789) | (4,059,867) | | (870,874) | (11,880,745) |
Net Increase/(Decrease) | (139,378) | $ (1,544,671) | | 221,966 | $ 3,842,929 |
Class I Shares: | | | | | |
Shares sold | 5,487,926 | $ 62,541,480 | | 10,806,963 | $149,882,756 |
Reinvested dividends and distributions | 301,059 | 3,360,059 | | 1,919,517 | 27,671,302 |
Shares repurchased | (13,619,673) | (153,691,168) | | (13,943,994) | (187,033,326) |
Net Increase/(Decrease) | (7,830,688) | $(87,789,629) | | (1,217,514) | $ (9,479,268) |
Class N Shares: | | | | | |
Shares sold | 1,145,686 | $ 13,003,365 | | 1,590,545 | $ 21,781,419 |
Reinvested dividends and distributions | 62,580 | 698,799 | | 294,697 | 4,241,519 |
Shares repurchased | (1,060,857) | (12,171,379) | | (1,894,627) | (26,457,324) |
Net Increase/(Decrease) | 147,409 | $ 1,530,785 | | (9,385) | $ (434,386) |
Class S Shares: | | | | | |
Shares sold | 62,060 | $ 682,752 | | 198,787 | $ 2,799,261 |
Reinvested dividends and distributions | 5,934 | 65,428 | | 33,774 | 485,221 |
Shares repurchased | (57,792) | (636,767) | | (171,061) | (2,312,928) |
Net Increase/(Decrease) | 10,202 | $ 111,413 | | 61,500 | $ 971,554 |
Class T Shares: | | | | | |
Shares sold | 420,292 | $ 4,786,159 | | 1,502,556 | $ 20,495,414 |
Reinvested dividends and distributions | 76,372 | 851,597 | | 448,196 | 6,474,103 |
Shares repurchased | (1,310,216) | (14,780,589) | | (1,912,303) | (26,555,195) |
Net Increase/(Decrease) | (813,552) | $ (9,142,833) | | 38,449 | $ 414,322 |
Janus Henderson Global Real Estate Fund
Notes to Financial Statements (unaudited)
6. Purchases and Sales of Investment Securities
For the period ended March 31, 2023, the aggregate cost of purchases and proceeds from sales of investment securities (excluding any short-term securities, short-term options contracts, TBAs, and in-kind transactions, as applicable) was as follows:
| | | | |
Purchases of
Securities | Proceeds from Sales
of Securities | Purchases of Long-
Term U.S. Government
Obligations | Proceeds from Sales
of Long-Term U.S.
Government Obligations |
$235,625,366 | $328,271,778 | $ - | $ - |
7. Subsequent Event
Management has evaluated whether any events or transactions occurred subsequent to March 31, 2023 and through the date of issuance of the Fund’s financial statements and determined that there were no material events or transactions that would require recognition or disclosure in the Fund’s financial statements.
Janus Henderson Global Real Estate Fund
Additional Information (unaudited)
Proxy Voting Policies and Voting Record
A description of the policies and procedures that the Fund uses to determine how to vote proxies relating to its portfolio securities is available without charge: (i) upon request, by calling 1-800-525-1093; (ii) on the Fund’s website at janushenderson.com/proxyvoting; and (iii) on the SEC’s website at http://www.sec.gov. Additionally, information regarding the Fund’s proxy voting record for the most recent twelve-month period ended June 30 is also available, free of charge, through janushenderson.com/proxyvoting and from the SEC’s website at http://www.sec.gov.
Full Holdings
The Fund files its complete portfolio holdings (schedule of investments) with the SEC as an exhibit to Form N-PORT within 60 days of the end of the first and third fiscal quarters, and in the annual report and semiannual report to shareholders. The Fund’s Form N-PORT filings and annual and semiannual reports: (i) are available on the SEC’s website at http://www.sec.gov; and (ii) are available without charge, upon request, by calling a Janus Henderson representative at 1-877-335-2687 (toll free) (or 1-800-525-3713 if you hold Class D Shares). Portfolio holdings consisting of at least the names of the holdings are generally available on a monthly basis with a 30-day lag under Full Holdings for the Fund at janushenderson.com/info (or janushenderson.com/reports if you hold Class D Shares).
APPROVAL OF ADVISORY AGREEMENTS DURING THE PERIOD
The Trustees of Janus Aspen Series, each of whom serves as an “independent” Trustee (the “Trustees”), oversee the management of each portfolio of Janus Aspen Series (each, a “VIT Portfolio,” and collectively, the “VIT Portfolios”), as well as each fund of Janus Investment Fund (each, a “Fund,” and collectively, the “Funds” and together with the VIT Portfolios, the “Janus Henderson Funds,” and each, a “Janus Henderson Fund”). As required by law, the Trustees determine annually whether to continue the investment advisory agreement for each Janus Henderson Fund.
In connection with their most recent consideration of those agreements for each Janus Henderson Fund, the Trustees received and reviewed information provided by Janus Henderson Investors US LLC (the “Adviser”) in response to requests of the Trustees and their independent legal counsel. They also received and reviewed information and analysis provided by, and in response to requests of, their independent fee consultant. Throughout their consideration of the agreements, the Trustees were advised by their independent legal counsel. The Trustees met with management to consider the agreements, and also met separately in executive session with their independent legal counsel and their independent fee consultant.
At meetings held on November 9-10, 2022 and December 13-14, 2022, the Trustees evaluated the information provided by the Adviser and the independent fee consultant, as well as other information provided by the Adviser and the independent fee consultant during the year. Following such evaluation, the Trustees determined that the overall arrangements between each Janus Henderson Fund and the Adviser were fair and reasonable in light of the nature, extent, and quality of the services provided by the Adviser and its affiliates, the fees charged for those services, and other matters that the Trustees considered relevant in the exercise of their business judgment, and unanimously approved the continuation of the investment advisory agreement for each Janus Henderson Fund for the period from February 1, 2023 through February 1, 2024, subject to earlier termination as provided for in each agreement.
In considering the continuation of those agreements, the Trustees reviewed and analyzed various factors that they determined were relevant, including the factors described below, none of which by itself was considered dispositive. However, the material factors and conclusions that formed the basis for the Trustees’ determination to approve the continuation of the agreements are discussed separately below. Also included is a summary of the independent fee consultant’s conclusions and opinions that arose during, and were included as part of, the Trustees’ consideration of the agreements. “Management fees,” as used herein, reflect actual annual advisory fees and, for the purpose of peer comparisons any administration fees (excluding out of pocket costs), net of any waivers, paid by a fund as a percentage of average net assets.
Nature, Extent and Quality of Services
The Trustees reviewed the nature, extent, and quality of the services provided by the Adviser to the Janus Henderson Funds, taking into account the investment objective, strategies, and policies of each Janus Henderson Fund, and the knowledge the Trustees gained from their regular meetings with management on at least a quarterly basis and their ongoing review of information related to the Janus Henderson Funds. In addition, the Trustees reviewed the resources and key personnel of the Adviser, particularly noting those employees who provide investment and risk management services to the Janus Henderson Funds. The Trustees also considered other services provided to the Janus Henderson
Janus Henderson Global Real Estate Fund
Additional Information (unaudited)
Funds by the Adviser, such as managing the execution of portfolio transactions and the selection of broker-dealers for those transactions. The Trustees considered the Adviser’s role as administrator to the Janus Henderson Funds, noting that the Adviser generally does not receive a fee for its services as administrator, but is reimbursed for its out-of-pocket costs. The Trustees considered the role of the Adviser in monitoring adherence to the Janus Henderson Funds’ investment restrictions, providing support services for the Trustees and Trustee committees, and overseeing communications with Janus Henderson Fund shareholders and the activities of other service providers, including monitoring compliance with various policies and procedures of the Janus Henderson Funds and with applicable securities laws and regulations.
In this regard, the independent fee consultant noted that the Adviser provides a number of different services for the Janus Henderson Funds and their shareholders, ranging from investment management services to various other servicing functions, and that, in its view, the Adviser is a capable provider of those services. The independent fee consultant also provided its belief that the Adviser has developed a number of institutional competitive advantages that should enable it to provide superior investment and service performance over the long term.
The Trustees concluded that the nature, extent, and quality of the services provided by the Adviser to each Janus Henderson Fund were appropriate and consistent with the terms of the respective advisory agreements, and that, taking into account steps taken to address those Janus Henderson Funds whose performance lagged that of their peers for certain periods, the Janus Henderson Funds were likely to benefit from the continued provision of those services. They also concluded that the Adviser had sufficient personnel, with the appropriate education and experience, to serve the Janus Henderson Funds effectively and had demonstrated its ability to attract well-qualified personnel.
Performance of the Funds
The Trustees considered the performance results of each Janus Henderson Fund over various time periods. They noted that they considered Janus Henderson Fund performance data throughout the year, including periodic meetings with each Janus Henderson Fund’s portfolio manager(s), and also reviewed information comparing each Janus Henderson Fund’s performance with the performance of comparable fund peer groups identified by Broadridge Financial Solutions, Inc. (“Broadridge”), an independent data provider, and with the Janus Henderson Fund’s benchmark index. In this regard, the independent fee consultant found that the overall Janus Henderson Funds’ performance has been reasonable, noting that: (i) for the 36 months ended May 31, 2022, approximately 38% of the Janus Henderson Funds were in the top two quartiles of their Broadridge peer groups; (ii) for the 36 months ended September 30, 2022, approximately 45% of the Janus Henderson Funds were in the top two quartiles of performance as reported by Morningstar, and (iii) for the 12 months ended September 30, 2022, approximately 55% of the Janus Henderson Funds were in the top two quartiles of performance as reported by Morningstar.
The Trustees considered the performance of each Janus Henderson Fund, noting that performance may vary by share class, and noted the following with respect to the Funds:
Asset Allocation Funds
· For Janus Henderson Global Allocation Fund – Conservative, the Trustees noted that the Fund’s performance was in the third Broadridge quartile for the 36 months ended May 31, 2022 and the bottom Broadridge quartile for the 12 months ended May 31, 2022. The Trustees noted the reasons for the Fund’s underperformance and the steps the Adviser had taken or was taking to improve performance.
· For Janus Henderson Global Allocation Fund – Growth, the Trustees noted that the Fund’s performance was in the bottom Broadridge quartile for the 36 months ended May 31, 2022 and the bottom Broadridge quartile for the 12 months ended May 31, 2022. The Trustees noted the reasons for the Fund’s underperformance and the steps the Adviser had taken or was taking to improve performance.
· For Janus Henderson Global Allocation Fund – Moderate, the Trustees noted that the Fund’s performance was in the bottom Broadridge quartile for the 36 months ended May 31, 2022 and the bottom Broadridge quartile for the 12 months ended May 31, 2022. The Trustees noted the reasons for the Fund’s underperformance and the steps the Adviser had taken or was taking to improve performance.
Fixed-Income Funds
· For Janus Henderson Absolute Return Income Opportunities Fund, the Trustees noted that the Fund’s performance was in the third Broadridge quartile for the 36 months ended May 31, 2022 and the first Broadridge quartile for the 12 months ended May 31, 2022. The Trustees noted the reasons for the Fund’s underperformance,
Janus Henderson Global Real Estate Fund
Additional Information (unaudited)
the steps the Adviser had taken or was taking to improve performance, and that the performance trend was improving.
· For Janus Developed World Bond Fund, the Trustees noted that the Fund’s performance was in the bottom Broadridge quartile for the 36 months ended May 31, 2022 and the bottom Broadridge quartile for the 12 months ended May 31, 2022. The Trustees noted the reasons for the Fund’s underperformance and the steps the Adviser had taken or was taking to improve performance.
· For Janus Henderson Flexible Bond Fund, the Trustees noted that the Fund’s performance was in the first Broadridge quartile for the 36 months ended May 31, 2022 and the second Broadridge quartile for the 12 months ended May 31, 2022.
· For Janus Henderson Global Bond Fund, the Trustees noted that the Fund’s performance was in the third Broadridge quartile for the 36 months ended May 31, 2022 and the bottom Broadridge quartile for the 12 months ended May 31, 2022. The Trustees noted the reasons for the Fund’s underperformance and the steps the Adviser had taken or was taking to improve performance.
· For Janus Henderson High-Yield Fund, the Trustees noted that the Fund’s performance was in the third Broadridge quartile for the 36 months ended May 31, 2022 and the bottom Broadridge quartile for the 12 months ended May 31, 2022. The Trustees noted the reasons for the Fund’s underperformance and the steps the Adviser had taken or was taking to improve performance.
· For Janus Henderson Multi-Sector Income Fund, the Trustees noted that the Fund’s performance was in the second Broadridge quartile for the 36 months ended May 31, 2022 and the third Broadridge quartile for the 12 months ended May 31, 2022.
· For Janus Henderson Short Duration Flexible Bond Fund, the Trustees noted that the Fund’s performance was in the third Broadridge quartile for the 36 months ended May 31, 2022 and the bottom Broadridge quartile for the 12 months ended May 31, 2022. The Trustees noted the reasons for the Fund’s underperformance and the steps the Adviser had taken or was taking to improve performance.
Global and International Equity Funds
· For Janus Henderson Asia Equity Fund, the Trustees noted that the Fund’s performance was in the third Broadridge quartile for the 36 months ended May 31, 2022 and the third Broadridge quartile for the 12 months ended May 31, 2022. The Trustees noted the reasons for the Fund’s underperformance, while also noting that the Fund has a performance fee structure that results in lower management fees during periods of underperformance, and the steps the Adviser had taken or was taking to improve performance.
· For Janus Henderson Emerging Markets Fund, the Trustees noted that the Fund’s performance was in the third Broadridge quartile for the 36 months ended May 31, 2022 and the third Broadridge quartile for the 12 months ended May 31, 2022. The Trustees noted the reasons for the Fund’s underperformance and the steps the Adviser had taken or was taking to improve performance.
· For Janus Henderson European Focus Fund, the Trustees noted that the Fund’s performance was in the first Broadridge quartile for the 36 months ended May 31, 2022 and the second Broadridge quartile for the 12 months ended May 31, 2022.
· For Janus Henderson Global Equity Income Fund, the Trustees noted that the Fund’s performance was in the third Broadridge quartile for the 36 months ended May 31, 2022 and the first Broadridge quartile for the 12 months ended May 31, 2022. The Trustees noted the reasons for the Fund’s underperformance, the steps the Adviser had taken or was taking to improve performance, and that the performance trend was improving.
· For Janus Henderson Global Life Sciences Fund, the Trustees noted that the Fund’s performance was in the third Broadridge quartile for the 36 months ended May 31, 2022 and the second Broadridge quartile for the 12 months ended May 31, 2022. The Trustees noted the reasons for the Fund’s underperformance, the steps the Adviser had taken or was taking to improve performance, and that the performance trend was improving.
· For Janus Henderson Global Sustainable Equity Fund, the Trustees noted that the Fund’s performance was in the second Broadridge quartile for the 12 months ended May 31, 2022. The Trustees noted that 36 month-end performance was not yet available.
Janus Henderson Global Real Estate Fund
Additional Information (unaudited)
· For Janus Henderson Global Real Estate Fund, the Trustees noted that the Fund’s performance was in the second Broadridge quartile for the 36 months ended May 31, 2022 and the bottom Broadridge quartile for the 12 months ended May 31, 2022.
· For Janus Henderson Global Research Fund, the Trustees noted that the Fund’s performance was in the second Broadridge quartile for the 36 months ended May 31, 2022 and the first Broadridge quartile for the 12 months ended May 31, 2022.
· For Janus Henderson Global Select Fund, the Trustees noted that the Fund’s performance was in the first Broadridge quartile for the 36 months ended May 31, 2022 and the first Broadridge quartile for the 12 months ended May 31, 2022.
· For Janus Henderson Global Technology and Innovation Fund, the Trustees noted that the Fund’s performance was in the second Broadridge quartile for the 36 months ended May 31, 2022 and the second Broadridge quartile for the 12 months ended May 31, 2022.
· For Janus Henderson International Opportunities Fund, the Trustees noted that the Fund’s performance was in the bottom Broadridge quartile for the 36 months ended May 31, 2022 and the third Broadridge quartile for the 12 months ended May 31, 2022. The Trustees noted the reasons for the Fund’s underperformance and the steps the Adviser had taken or was taking to improve performance.
· For Janus Henderson Overseas Fund, the Trustees noted that the Fund’s performance was in the first Broadridge quartile for the 36 months ended May 31, 2022 and the first Broadridge quartile for the 12 months ended May 31, 2022.
· For Janus Henderson Responsible International Dividend Fund (formerly the Janus Henderson Dividend & Income Builder Fund), the Trustees noted that the Fund’s performance was in the bottom Broadridge quartile for the 36 months ended May 31, 2022 and the bottom Broadridge quartile for the 12 months ended May 31, 2022. The Trustees noted the reasons for the Fund’s underperformance and the steps the Adviser had taken or was taking to improve performance.
Money Market Funds
· For Janus Henderson Government Money Market Fund, the Trustees noted that the Fund’s performance was in the third Broadridge quartile for the 36 months ended May 31, 2022 and the bottom Broadridge quartile for the 12 months ended May 31, 2022. The Trustees noted the reasons for the Fund’s underperformance and the steps the Adviser had taken or was taking to improve performance.
· For Janus Henderson Money Market Fund, the Trustees noted that the Fund’s performance was in the third Broadridge quartile for the 36 months ended May 31, 2022 and the bottom Broadridge quartile for the 12 months ended May 31, 2022. The Trustees noted the reasons for the Fund’s underperformance and the steps the Adviser had taken or was taking to improve performance.
Multi-Asset Funds
· For Janus Henderson Adaptive Global Allocation Fund, the Trustees noted that the Fund’s performance was in bottom Broadridge quartile for the 36 months ended May 31, 2022 and the second Broadridge quartile for the 12 months ended May 31, 2022. The Trustees noted the reasons for the Fund’s underperformance, the steps the Adviser had taken or was taking to improve performance, and that the performance trend was improving.
· For Janus Henderson Balanced Fund, the Trustees noted that the Fund’s performance was in the first Broadridge quartile for the 36 months ended May 31, 2022 and the first Broadridge quartile for the 12 months ended May 31, 2022.
U.S. Equity Funds
· For Janus Henderson Adaptive Risk Managed U.S. Equity Fund, the Trustees noted that the Fund’s performance was in the bottom Broadridge quartile for the 36 months ended May 31, 2022 and the second Broadridge quartile for the 12 months ended May 31, 2022. The Trustees noted the reasons for the Fund’s underperformance, the steps the Adviser had taken or were taking to improve performance, and that the performance trend was improving.
Janus Henderson Global Real Estate Fund
Additional Information (unaudited)
· For Janus Henderson Contrarian Fund, the Trustees noted that the Fund’s performance was in the first Broadridge quartile for the 36 months ended May 31, 2022 and the bottom Broadridge quartile for the 12 months ended May 31, 2022.
· For Janus Henderson Enterprise Fund, the Trustees noted that the Fund’s performance was in the second Broadridge quartile for the 36 months ended May 31, 2022 and the first Broadridge quartile for the 12 months ended May 31, 2022.
· For Janus Henderson Forty Fund, the Trustees noted that the Fund’s performance was in the third Broadridge quartile for the 36 months ended May 31, 2022 and the bottom Broadridge quartile for the 12 months ended May 31, 2022. The Trustees noted the reasons for the Fund’s underperformance and the steps the Adviser had taken or was taking to improve performance.
· For Janus Henderson Growth and Income Fund, the Trustees noted that the Fund’s performance was in the bottom Broadridge quartile for the 36 months ended May 31, 2022 and the first Broadridge quartile for the 12 months ended May 31, 2022. The Trustees noted the reasons for the Fund’s underperformance, the steps the Adviser had taken or was taking to improve performance, and that the performance trend was improving.
· For Janus Henderson Mid Cap Value Fund, the Trustees noted that the Fund’s performance was in the bottom Broadridge quartile for the 36 months ended May 31, 2022 and the second Broadridge quartile for the 12 months ended May 31, 2022. The Trustees noted the reasons for the Fund’s underperformance, while also noting that the Fund has a performance fee structure that results in lower management fees during periods of underperformance, the steps the Adviser had taken or was taking to improve performance, and that the performance trend was improving.
· For Janus Henderson Research Fund, the Trustees noted that the Fund’s performance was in the third Broadridge quartile for the 36 months ended May 31, 2022 and the third Broadridge quartile for the 12 months ended May 31, 2022. The Trustees noted the reasons for the Fund’s underperformance, while also noting that the Fund has a performance fee structure that results in lower management fees during periods of underperformance and the steps the Adviser had taken or was taking to improve performance.
· For Janus Henderson Small Cap Value Fund, the Trustees noted that the Fund’s performance was in the bottom Broadridge quartile for the 36 months ended May 31, 2022 and the second Broadridge quartile for the 12 months ended May 31, 2022. The Trustees noted the reasons for the Fund’s underperformance, while also noting that the Fund has a performance fee structure that results in lower management fees during periods of underperformance, the steps the Adviser had taken or was taking to improve performance, and that the performance trend was improving.
· For Janus Henderson Small-Mid Cap Value Fund, the Trustees noted that the Fund’s performance was in the bottom Broadridge quartile for the 36 months ended May 31, 2022 and the second Broadridge quartile for the 12 months ended May 31, 2022. The Trustees noted the reasons for the Fund’s underperformance, while also noting that the Fund has a performance fee structure that results in lower management fees during periods of underperformance, the steps the Adviser had taken or was taking to improve performance, and that the performance trend is improving.
· For Janus Henderson Triton Fund, the Trustees noted that the Fund’s performance was in the bottom Broadridge quartile for the 36 months ended May 31, 2022 and the second Broadridge quartile for the 12 months ended May 31, 2022. The Trustees noted the reasons for the Fund’s underperformance, the steps the Adviser had taken or was taking to improve performance, and that the performance trend was improving.
· For Janus Henderson Venture Fund, the Trustees noted that the Fund’s performance was in the bottom Broadridge quartile for the 36 months ended May 31, 2022 and the second Broadridge quartile for the 12 months ended May 31, 2022. The Trustees noted the reasons for the Fund’s underperformance, the steps the Adviser had taken or was taking to improve performance, and that the performance trend was improving.
In consideration of each Janus Henderson Fund’s performance, the Trustees concluded that, taking into account the factors relevant to performance, as well as other considerations, including steps taken to improve performance, as applicable, the Janus Henderson Fund’s performance warranted continuation of such Janus Henderson Fund’s investment advisory agreement.
Janus Henderson Global Real Estate Fund
Additional Information (unaudited)
Costs of Services Provided
The Trustees examined information regarding the fees and expenses of each Janus Henderson Fund in comparison to similar information for other comparable funds as provided by Broadridge, an independent data provider. They also reviewed an analysis of that information provided by their independent fee consultant. The independent fee consultant provided its belief that the management fees charged by the Adviser to each of the Janus Henderson Funds under the current investment advisory and administration agreements are reasonable in relation to the services provided by the Adviser. The independent fee consultant found: (1) the total expenses and management fees of the Janus Henderson Funds to be reasonable relative to other comparable mutual funds; (2) the total expenses, on average, were 6% under the average total expenses of the respective Broadridge peer group; and (3) the management fees for the Janus Henderson Funds, on average, were 5% under the average management fees for the respective Broadridge peer group. The Trustees also considered the total expenses for each share class of each Janus Henderson Fund compared to the average total expenses for its Broadridge Expense Group and to average total expenses for its Broadridge Expense Universe.
For Janus Henderson Funds with three or more years of performance history, the independent fee consultant also performed a systematic “focus list” analysis of expenses which assessed fund fees in the context of fund performance being delivered. Based on this analysis, the independent fee consultant found that the combination of service quality/performance and expenses on these individual Janus Henderson Funds was reasonable in light of performance trends, performance histories, changes in portfolio management, relative average net asset levels, and the existence of performance fees, breakpoints, and/or expense waivers on such Janus Henderson Funds.
The Trustees considered the methodology used by the Adviser in determining compensation payable to portfolio managers, the competitive environment for investment management talent, and the competitive market for mutual funds in different distribution channels.
The Trustees also reviewed management fees charged by the Adviser to comparable separate account clients and to comparable non-affiliated funds subadvised by the Adviser (for which the Adviser provides only or primarily portfolio management services). Although in most instances subadvisory and separate account fee rates for various investment strategies were lower than management fee rates for Janus Henderson Funds having a similar strategy, the Trustees considered that the Adviser noted that, under the terms of the management agreements with the Janus Henderson Funds, the Adviser performs significant additional services for the Janus Henderson Funds that it does not provide to those other clients, including administration services, oversight of the Janus Henderson Funds’ other service providers, Trustee support, regulatory compliance and numerous other services, and that, in serving the Janus Henderson Funds, the Adviser assumes many legal risks and other costs that it does not assume in servicing its other clients. Moreover, the Trustees noted that the independent fee consultant found that: (1) the management fees the Adviser charges to the Janus Henderson Funds are reasonable in relation to the management fees the Adviser charges to funds subadvised by the Adviser and to the fees the Adviser charges to its institutional separate account clients; (2) these subadvised and institutional separate accounts have different service and infrastructure needs and operate in markets very different from the retail fund market; (3) Janus Henderson mutual fund investors enjoy reasonable fees relative to the fees charged in these other markets; and (4) as part of its 2022 review, 9 of 11 Janus Henderson Funds have lower management fees than similar funds subadvised by the Adviser. The Trustees noted that for the two Janus Henderson Funds that did not, management fees for each were under the average of its 15(c) peer group.
The Trustees considered the fees for each Janus Henderson Fund for its fiscal year ended in 2021 and noted the following with regard to each Janus Henderson Fund’s total expenses, net of applicable fee waivers (the Fund’s “total expenses”) as reflected in the comparative information provided by Broadridge:
Asset Allocation Funds
· For Janus Henderson Global Allocation Fund – Conservative, the Trustees noted that, although the Fund’s total expenses exceeded the peer group average for certain share classes, overall the Fund’s total expenses were reasonable. The Trustees also noted that the Adviser has contractually agreed to limit the Fund’s expenses.
· For Janus Henderson Global Allocation Fund – Growth, the Trustees noted that, although the Fund’s total expenses exceeded the peer group average for certain share classes, overall the Fund’s total expenses were reasonable. The Trustees also noted that the Adviser has contractually agreed to limit the Fund’s expenses, although this limit did not apply because the Fund’s total expenses as shown were below the applicable fee limit.
Janus Henderson Global Real Estate Fund
Additional Information (unaudited)
· For Janus Henderson Global Allocation Fund – Moderate, the Trustees noted that, although the Fund’s total expenses exceeded the peer group average for one share class, overall the Fund’s total expenses were reasonable. The Trustees also noted that the Adviser has contractually agreed to limit the Fund’s expenses.
Fixed-Income Funds
· For Janus Henderson Absolute Return Income Opportunities Fund, the Trustees noted that, although the Fund’s total expenses exceeded the peer group average for certain share classes, overall the Fund’s total expenses were reasonable. The Trustees also noted that the Adviser has contractually agreed to limit the Fund’s expenses.
· For Janus Henderson Developed World Bond Fund, the Trustees noted that, although the Fund’s total expenses exceeded the peer group average for one share class, overall the Fund’s total expenses were reasonable. The Trustees also noted that the Adviser has contractually agreed to limit the Fund’s expenses.
· For Janus Henderson Flexible Bond Fund, the Trustees noted that, although the Fund’s total expenses exceeded the peer group average for certain share classes, overall the Fund’s total expenses were reasonable. The Trustees also noted that the Adviser has contractually agreed to limit the Fund’s expenses, although this limit did not apply because the Fund’s total expenses as shown were below the applicable fee limit.
· For Janus Henderson Global Bond Fund, the Trustees noted that, although the Fund’s total expenses exceeded the peer group average for certain share classes, overall the Fund’s total expenses were reasonable. The Trustees also noted that the Adviser has contractually agreed to limit the Fund’s expenses.
· For Janus Henderson High-Yield Fund, the Trustees noted that, although the Fund’s total expenses exceeded the peer group average for certain share classes, overall the Fund’s total expenses were reasonable. The Trustees also noted that the Adviser has contractually agreed to limit the Fund’s expenses.
· For Janus Henderson Multi-Sector Income Fund, the Trustees noted that, although the Fund’s total expenses exceeded the peer group average for certain share classes, overall the Fund’s total expenses were reasonable. The Trustees also noted that the Adviser has contractually agreed to limit the Fund’s expenses.
· For Janus Henderson Short Duration Flexible Bond Fund, the Trustees noted that, although the Fund’s total expenses exceeded the peer group average for certain share classes, overall the Fund’s total expenses were reasonable. The Trustees also noted that the Adviser has contractually agreed to limit the Fund’s expenses.
Global and International Equity Funds
· For Janus Henderson Asia Equity Fund, the Trustees noted that, although the Fund’s total expenses exceeded the peer group average for certain share classes, overall the Fund’s total expenses were reasonable. The Trustees also noted that the Adviser has contractually agreed to limit the Fund’s expenses.
· For Janus Henderson Emerging Markets Fund, the Trustees noted that, although the Fund’s total expenses exceeded the peer group average for certain share classes, overall the Fund’s total expenses were reasonable. The Trustees also noted that the Adviser has contractually agreed to limit the Fund’s expenses.
· For Janus Henderson European Focus Fund, the Trustees noted that, although the Fund’s total expenses exceeded the peer group average for one share class, overall the Fund’s expenses were reasonable. The Trustees also noted that the Adviser has contractually agreed to limit the Fund’s expenses.
· For Janus Henderson Global Equity Income Fund, the Trustees noted that, although the Fund’s total expenses exceeded the peer group average for one share class, overall the Fund’s total expenses were reasonable. The Trustees also noted that the Adviser has contractually agreed to limit the Fund’s expenses, although this limit did not apply because the Fund’s total expenses as shown were below the applicable fee limit.
· For Janus Henderson Global Life Sciences Fund, the Trustees noted that the Fund’s total expenses were below the peer group average for all share classes.
· For Janus Henderson Global Real Estate Fund, the Trustees noted that, although the Fund’s total expenses exceeded the peer group average for certain share classes, overall the Fund’s total expenses were reasonable. The Trustees also noted that the Adviser has contractually agreed to limit the Fund’s expenses, although this limit did not apply because the Fund’s total expenses as shown were below the applicable fee limit.
Janus Henderson Global Real Estate Fund
Additional Information (unaudited)
· For Janus Henderson Global Research Fund, the Trustees noted that, although the Fund’s total expenses exceeded the peer group average for one share class, overall the Fund’s total expenses were reasonable. The Trustees also noted that the Adviser has contractually agreed to limit the Fund’s expenses, although this limit did not apply because the Fund’s total expenses as shown were below the applicable fee limit.
· For Janus Henderson Global Select Fund, the Trustees noted that, although the Fund’s total expenses exceeded the peer group average for certain share classes, overall the Fund’s total expenses were reasonable. The Trustees also noted that the Adviser has contractually agreed to limit the Fund’s expenses.
· For Janus Henderson Global Sustainable Equity Fund, the Trustees noted that, although the Fund’s total expenses exceeded the peer group average for certain share classes, overall the Fund’s expenses were reasonable. The Trustees also noted that the Adviser has contractually agreed to limit the Fund’s expenses.
· For Janus Henderson Global Technology and Innovation Fund, the Trustees noted that the Fund’s total expenses were below the peer group average for all share classes.
· For Janus Henderson International Opportunities Fund, the Trustees noted that, although the Fund’s total expenses exceeded the peer group average for certain share classes, overall the Fund’s expenses were reasonable. The Trustees also noted that the Adviser has contractually agreed to limit the Fund’s expenses.
· For Janus Henderson Overseas Fund, the Trustees noted that although the Fund’s total expenses exceeded the peer group average for certain share classes, overall the Fund’s total expenses were reasonable. The Trustees also noted that the Adviser has contractually agreed to limit the Fund’s expenses, although this limit did not apply because the Fund’s total expenses as shown were below the applicable fee limit.
· For Janus Henderson Responsible International Dividend Fund (formerly the Janus Henderson Dividend & Income Builder Fund), the Trustees noted that, although the Fund’s total expenses exceeded the peer group for one share class, overall the Fund’s total expenses were reasonable. The Trustees also noted that the Adviser has contractually agreed to limit the Fund’s expenses.
Money Market Funds
· For Janus Henderson Government Money Market Fund, the Trustees noted that the Fund’s total expenses were below the peer group average for all share classes.
· For Janus Henderson Money Market Fund, the Trustees noted that the Fund’s total expenses were below the peer group average for all share classes.
Multi-Asset Funds
· For Janus Henderson Adaptive Global Allocation Fund, the Trustees noted that, that the Fund’s total expenses were below the peer group average for all share classes.
· For Janus Henderson Balanced Fund, the Trustees noted that, although the Fund’s total expenses exceeded the peer group average for certain share classes, overall the Fund’s total expenses were reasonable. The Trustees also noted that the Adviser has contractually agreed to limit the Fund’s expenses, although this limit did not apply because the Fund’s total expenses as shown were below the applicable fee limit.
U.S. Equity Funds
· For Janus Henderson Adaptive Risk Managed U.S. Equity Fund, the Trustees noted that, although the Fund’s total expenses exceeded the peer group average for certain share classes, overall the Fund’s total expenses were reasonable. The Trustees also noted that the Adviser has contractually agreed to limit the Fund’s expenses, although this limit did not apply because the Fund’s total expenses as shown were below the applicable fee limit.
· For Janus Henderson Contrarian Fund, the Trustees noted that, although the Fund’s total expenses exceeded the peer group average for all share classes, overall the Fund’s total expenses were reasonable. The Trustees also noted that the Adviser had contractually agreed to limit the Fund’s expenses.
· For Janus Henderson Enterprise Fund, the Trustees noted that, although the Fund’s total expenses exceeded the peer group average for certain share classes, overall the Fund’s total expenses were reasonable. The Trustees also noted that the Adviser has contractually agreed to limit the Fund’s expenses, although this limit did not apply because the Fund’s total expenses as shown were below the applicable fee limit.
Janus Henderson Global Real Estate Fund
Additional Information (unaudited)
· For Janus Henderson Forty Fund, the Trustees noted that, although the Fund’s total expenses exceeded the peer group average for certain share classes, overall the Fund’s total expenses were reasonable. The Trustees also noted that the Adviser has contractually agreed to limit the Fund’s expenses, although this limit did not apply because the Fund’s total expenses as shown were below the applicable fee limit.
· For Janus Henderson Growth and Income Fund, the Trustees noted that, although the Fund’s total expenses exceeded the peer group average for certain share classes, overall the Fund’s total expenses were reasonable. The Trustees also noted that the Adviser has contractually agreed to limit the Fund’s expenses, although this limit did not apply because the Fund’s total expenses as shown were below the applicable fee limit.
· For Janus Henderson Mid Cap Value Fund, the Trustees noted that the Fund’s total expenses were below the peer group average for all share classes.
· For Janus Henderson Research Fund, the Trustees noted that, although the Fund’s total expenses exceeded the peer group average for certain share classes, overall the Fund’s total expenses were reasonable. The Trustees also noted that the Adviser has contractually agreed to limit the Fund’s expenses.
· For Janus Henderson Small Cap Value Fund, the Trustees noted that, although the Fund’s total expenses exceeded the peer group average for one share class, overall the Fund’s total expenses were reasonable. The Trustees also noted that the Adviser has contractually agreed to limit the Fund’s expenses, although this limit did not apply because the Fund’s total expenses as shown were below the applicable fee limit.
· For Janus Henderson Small-Mid Cap Value Fund, the Trustees noted that the Fund’s total expenses were below the peer group average for all share classes.
· For Janus Henderson Triton Fund, the Trustees noted that, although the Fund’s total expenses exceeded the peer group average for one share class, overall the Fund’s total expenses were reasonable. The Trustees also noted that the Adviser has contractually agreed to limit the Fund’s expenses, although this limit did not apply because the Fund’s total expenses as shown were below the applicable fee limit.
· For Janus Henderson Venture Fund, the Trustees noted that although the Fund’s total expenses exceeded the peer group average for one share class, overall the Fund’s total expenses were reasonable. The Trustees also noted that the Adviser has contractually agreed to limit the Fund’s expenses, although this limit did not apply because the Fund’s total expenses as shown were below the applicable fee limit.
The Trustees reviewed information on the overall profitability to the Adviser and its affiliates from their relationships with the Janus Henderson Funds, and considered profitability data of other publicly traded mutual fund advisers. The Trustees recognized that profitability comparisons among fund managers are difficult because of the variation in the type of comparative information that is publicly available, and the profitability of any fund manager is affected by numerous factors, including the organizational structure of the particular fund manager, differences in complex size, difference in product mix, difference in types of business (mutual fund, institutional and other), differences in the types of funds and other accounts it manages, possible other lines of business, the methodology for allocating expenses and the fund manager’s capital structure and cost of capital.
Additionally, the Trustees considered the estimated profitability to the Adviser from the investment management services it provided to each Janus Henderson Fund. In their review, the Trustees considered whether the Adviser receive adequate incentives and resources to manage the Janus Henderson Funds effectively. In reviewing profitability, the Trustees noted that the estimated profitability for an individual Janus Henderson Fund is necessarily a product of the allocation methodology utilized by the Adviser to allocate its expenses as part of the estimated profitability calculation. In this regard, the Trustees noted that the independent fee consultant found as part of its 2022 review that (1) the expense allocation methodology and rationales utilized by the Adviser were reasonable and (2) no clear correlation exists between expense allocations and operating margins. The Trustees also considered that the estimated profitability for an individual Janus Henderson Fund was influenced by a number of factors, including not only the allocation methodology selected, but also the presence of fee waivers and expense caps, and whether the Janus Henderson Fund’s investment management agreement contained breakpoints or a performance fee component. The Trustees determined, after taking into account these factors, among others, that the Adviser’s estimated profitability with respect to each Janus Henderson Fund was not unreasonable in relation to the services provided, and that the variation in the range of such estimated profitability among the Janus Henderson Funds was not a material factor in the Board’s approval of the reasonableness of any Janus Henderson Fund’s investment management fees.
Janus Henderson Global Real Estate Fund
Additional Information (unaudited)
The Trustees concluded that the management fees payable by each Janus Henderson Fund to the Adviser were reasonable in relation to the nature, extent, and quality of the services provided, taking into account the fees charged by other advisers for managing comparable mutual funds with similar strategies, the fees the Adviser charges to other clients, and, as applicable, the impact of fund performance on management fees payable by the Janus Henderson Funds. The Trustees also concluded that each Janus Henderson Fund’s total expenses were reasonable, taking into account the size of the Janus Henderson Fund, the quality of services provided by the Adviser, the investment performance of the Janus Henderson Fund, and any expense limitations agreed to or provided by the Adviser.
Economies of Scale
The Trustees considered information about the potential for the Adviser to realize economies of scale as the assets of the Janus Henderson Funds increase. They noted that their independent fee consultant published a report to the Trustees in June 2022 which provided its research and analysis into economies of scale. They also noted that, although many Janus Henderson Funds pay advisory fees at a fixed base rate as a percentage of net assets, without any breakpoints or performance fees, their independent fee consultant concluded that 75% of these Janus Henderson Funds’ have contractual management fees (gross of waivers) below their Broadridge Expense Group averages. The Trustees also noted the following from the independent fee consultant’s report: (1) that 31% of Janus Henderson Funds had management fee breakpoints in place whereby investors pay lower management fees as fund AUM increases; (2) that 29% of Janus Henderson Funds have low flat-rate fees and performance fees where the Adviser is incentivized to invest in resources which drive Janus Henderson Fund performance; and (3) that 39% of Janus Henderson Funds have low flat-rate fees versus peers where investors pay low fixed fees when the Janus Henderson Fund is small/midsized and higher fees when the Janus Henderson Fund grows in assets. The Trustees also noted that the Janus Henderson Funds share directly in economies of scale through the significant investments made by the Adviser and its affiliates related to services provided to the Funds and the lower charges of third-party service providers that are based in part on the combined scale of all of the Janus Henderson Funds.
The Trustees also considered the independent fee consultant’s conclusion that, given the limitations of various analytical approaches to economies of scale and their conflicting results, it is difficult to analytically confirm or deny the existence of economies of scale in the Janus Henderson complex. In this regard, the independent consultant concluded that (1) to the extent there were economies of scale at the Adviser, the Adviser’s general strategy of setting fixed management fees below peers appeared to share any such economies with investors even on smaller Janus Henderson Funds which have not yet achieved those economies and (2) by setting lower fixed fees from the start on these Janus Henderson Funds, the Adviser appeared to be investing to increase the likelihood that these Janus Henderson Funds will grow to a level to achieve any economies of scale that may exist. Further, the independent fee consultant provided its belief that Janus Henderson Fund investors are well-served by the fee levels and performance fee structures in place on the Janus Henderson Funds in light of any economies of scale that may be present at the Adviser.
Based on all of the information reviewed, including the recent and past research and analysis conducted by the Trustees’ independent fee consultant, the Trustees concluded that the current fee structure of each Janus Henderson Fund was reasonable and that the current rates of fees do reflect a sharing between the Adviser and the Janus Henderson Fund of any economies of scale that may be present at the current asset level of the Janus Henderson Fund.
Other Benefits to the Adviser
The Trustees also considered benefits that accrue to the Adviser and its affiliates from their relationships with the Janus Henderson Funds. They recognized that two affiliates of the Adviser separately serve the Janus Henderson Funds as transfer agent and distributor, respectively, and the transfer agent receives compensation directly from the non-money market Janus Henderson Funds for services provided, and that such compensation contributes to the overall profitability of the Adviser and its affiliates that results from their relationship with the Janus Henderson Funds. The Trustees also considered the Adviser’s past and proposed use of commissions paid by the Janus Henderson Funds on portfolio brokerage transactions to obtain proprietary and third-party research products and services benefiting the Janus Henderson Fund and/or other clients of the Adviser and/or the Adviser. The Trustees concluded that the Adviser’s use of these types of client commission arrangements to obtain proprietary and third-party research products and services was consistent with regulatory requirements and guidelines and was likely to benefit each Janus Henderson Fund. The Trustees also concluded that, other than the services provided by the Adviser and its affiliates pursuant to the agreements and the fees to be paid by each Janus Henderson Fund therefor, the Janus Henderson
Janus Henderson Global Real Estate Fund
Additional Information (unaudited)
Funds and the Adviser may potentially benefit from their relationship with each other in other ways. They concluded that the Adviser and its affiliates share directly in economies of scale through the lower charges of third-party service providers that are based in part on the combined scale of the Janus Henderson Funds and other clients serviced by the Adviser and its affiliates. They also concluded that the Adviser benefits from the receipt of research products and services acquired through commissions paid on portfolio transactions of the Janus Henderson Funds and that the Janus Henderson Funds benefit from the Adviser’s receipt of those products and services as well as research products and services acquired through commissions paid by other clients of the Adviser. They further concluded that the success of any Janus Henderson Fund could attract other business to the Adviser or other Janus Henderson Funds, and that the success of the Adviser could enhance the Adviser’s ability to serve the Janus Henderson Funds.
Janus Henderson Global Real Estate Fund
Liquidity Risk Management Program (unaudited)
Liquidity Risk Management Program
Rule 22e-4 under the Investment Company Act of 1940, as amended (the “Liquidity Rule”), requires open-end funds (but not money market funds) to adopt and implement a written liquidity risk management program (the “LRMP”) that is reasonably designed to assess and manage liquidity risk, which is the risk that a fund could not meet redemption requests without significant dilution of remaining investors’ interest in the fund. The Fund has implemented a LRMP, which incorporates the following elements: (i) assessment, management, and periodic review of liquidity risk; (ii) classification of portfolio holdings; (iii) the establishment and monitoring of a highly liquid investment minimum, as applicable; (iv) a 15% limitation on a Fund’s illiquid investments; (v) redemptions in-kind; and (vi) board oversight.
The Trustees of the Fund (the “Trustees”) have designated Janus Henderson Investors US LLC, the Fund’s investment adviser (the “Adviser”), as the Program Administrator for the LRMP responsible for administering the LRMP and carrying out the specific responsibilities of the LRMP. A working group comprised of various teams within the Adviser’s business is responsible for administering the LRMP and carrying out the specific responsibilities of different aspects of the LRMP (the “Liquidity Risk Working Group”). In assessing each Fund’s liquidity risk, the Liquidity Risk Working Group periodically considers, as relevant, factors including (i) the liquidity of a Fund’s portfolio investments during normal and reasonably foreseeable stressed conditions; (ii) whether a Fund’s investment strategy is appropriate for an open-end fund; (iii) the extent to which a Fund’s strategy involves a relatively concentrated portfolio or large positions in any issuer; (iv) a Fund’s use of borrowing for investment purposes; and (v) a Fund’s use of derivatives.
The Liquidity Rule requires the Trustees to review at least annually a written report provided by the Program Administrator that addresses the operation of the LRMP and assesses its adequacy and the effectiveness of its implementation, including, if applicable, the operation of the highly liquid investment minimum, and any material changes to the LRMP (the “Program Administrator Report”). At a meeting held on March 15, 2023, the Adviser provided the Program Administrator Report to the Trustees which covered the operation of the LRMP from January 1, 2022 through December 31, 2022 (the “Reporting Period”).
The Program Administrator Report discussed the operation and effectiveness of the LRMP during the Reporting Period. Among other things, the Program Administrator Report indicated that there were no material changes to the LRMP during the Reporting Period, although there were certain methodology adjustments implemented relating to a change in data provider. Additionally, the findings presented in the Program Administrator Report indicated that the LRMP operated adequately during the Reporting Period. These findings included that the Fund was able to meet redemptions during the normal course of business during the Reporting Period. The Program Administrator Report also stated that the Fund did not exceed the 15% limit on illiquid assets during the Reporting Period, that the Fund held primarily highly liquid assets, and was considered to be a primarily highly liquid fund during the Reporting Period. Also included among the Program Administrator Report’s findings was the determination that the Fund’s investment strategy remains appropriate for an open-end fund. In addition, the Adviser expressed its belief in the Program Administrator Report that the LRMP is reasonably designed and adequate to assess and manage the Fund’s liquidity risk, considering the Fund’s particular risks and circumstances, and includes policies and procedures reasonably designed to implement each required component of the Liquidity Rule.
There can be no assurance that the LRMP will achieve its objectives in the future. Please refer to your Fund’s prospectus for more information regarding the risks to which an investment in the Fund may be subject.
Janus Henderson Global Real Estate Fund
Useful Information About Your Fund Report (unaudited)
Performance Overviews
Performance overview graphs compare the performance of a hypothetical $10,000 investment in the Fund with one or more widely used market indices. When comparing the performance of the Fund with an index, keep in mind that market indices are not available for investment and do not reflect deduction of expenses.
Average annual total returns are quoted for a Fund with more than one year of performance history. Average annual total return is calculated by taking the growth or decline in value of an investment over a period of time, including reinvestment of dividends and distributions, then calculating the annual compounded percentage rate that would have produced the same result had the rate of growth been constant throughout the period. Average annual total return does not reflect the deduction of taxes that a shareholder would pay on Fund distributions or redemptions of Fund shares.
Cumulative total returns are quoted for a Fund with less than one year of performance history. Cumulative total return is the growth or decline in value of an investment over time, independent of the period of time involved. Cumulative total return does not reflect the deduction of taxes that a shareholder would pay on Fund distributions or redemptions of Fund shares.
Pursuant to federal securities rules, expense ratios shown in the performance chart reflect subsidized (if applicable) and unsubsidized ratios. The total annual fund operating expenses ratio is gross of any fee waivers, reflecting the Fund’s unsubsidized expense ratio. The net annual fund operating expenses ratio (if applicable) includes contractual waivers of the Adviser and reflects the Fund’s subsidized expense ratio. Ratios may be higher or lower than those shown in the “Financial Highlights” in this report.
Schedule of Investments
Following the performance overview section is the Fund’s Schedule of Investments. This schedule reports the types of securities held in the Fund on the last day of the reporting period. Securities are usually listed by type (common stock, corporate bonds, U.S. Government obligations, etc.) and by industry classification (banking, communications, insurance, etc.). Holdings are subject to change without notice.
The value of each security is quoted as of the last day of the reporting period. The value of securities denominated in foreign currencies is converted into U.S. dollars.
If the Fund invests in foreign securities, it will also provide a summary of investments by country. This summary reports the Fund exposure to different countries by providing the percentage of securities invested in each country. The country of each security represents the country of risk. A company may be allocated to a country based on other factors such as location of the company’s principal office, the location of the principal trading market for the company’s securities, or the country where a majority of the company’s revenues are derived. The Fund’s Schedule of Investments relies upon the industry group and country classifications published by Bloomberg and/or MSCI Inc.
Tables listing details of individual forward currency contracts, futures, written options, swaptions, and swaps follow the Fund’s Schedule of Investments (if applicable).
Statement of Assets and Liabilities
This statement is often referred to as the “balance sheet.” It lists the assets and liabilities of the Fund on the last day of the reporting period.
The Fund’s assets are calculated by adding the value of the securities owned, the receivable for securities sold but not yet settled, the receivable for dividends declared but not yet received on securities owned, and the receivable for Fund shares sold to investors but not yet settled. The Fund’s liabilities include payables for securities purchased but not yet settled, Fund shares redeemed but not yet paid, and expenses owed but not yet paid. Additionally, there may be other assets and liabilities such as unrealized gain or loss on forward currency contracts.
The section entitled “Net Assets Consist of” breaks down the components of the Fund’s net assets. Because the Fund must distribute substantially all earnings, you will notice that a significant portion of net assets is shareholder capital.
The last section of this statement reports the net asset value (“NAV”) per share on the last day of the reporting period. The NAV is calculated by dividing the Fund’s net assets for each share class (assets minus liabilities) by the number of shares outstanding.
Janus Henderson Global Real Estate Fund
Useful Information About Your Fund Report (unaudited)
Statement of Operations
This statement details the Fund’s income, expenses, realized gains and losses on securities and currency transactions, and changes in unrealized appreciation or depreciation of Fund holdings.
The first section in this statement, entitled “Investment Income,” reports the dividends earned from securities and interest earned from interest-bearing securities in the Fund.
The next section reports the expenses incurred by the Fund, including the advisory fee paid to the investment adviser, transfer agent fees and expenses, and printing and postage for mailing statements, financial reports and prospectuses. Expense offsets and expense reimbursements, if any, are also shown.
The last section lists the amounts of realized gains or losses from investment and foreign currency transactions, and changes in unrealized appreciation or depreciation of investments and foreign currency-denominated assets and liabilities. The Fund will realize a gain (or loss) when it sells its position in a particular security. A change in unrealized gain (or loss) refers to the change in net appreciation or depreciation of the Fund during the reporting period. “Net Realized and Unrealized Gain/(Loss) on Investments” is affected both by changes in the market value of Fund holdings and by gains (or losses) realized during the reporting period.
Statements of Changes in Net Assets
These statements report the increase or decrease in the Fund’s net assets during the reporting period. Changes in the Fund’s net assets are attributable to investment operations, dividends and distributions to investors, and capital share transactions. This is important to investors because it shows exactly what caused the Fund’s net asset size to change during the period.
The first section summarizes the information from the Statement of Operations regarding changes in net assets due to the Fund’s investment operations. The Fund’s net assets may also change as a result of dividend and capital gains distributions to investors. If investors receive their dividends and/or distributions in cash, money is taken out of the Fund to pay the dividend and/or distribution. If investors reinvest their dividends and/or distributions, the Fund’s net assets will not be affected.
The reinvestment of dividends and distributions is included under “Capital Share Transactions.” “Capital Shares” refers to the money investors contribute to the Fund through purchases or withdrawals via redemptions. The Fund’s net assets will increase and decrease in value as investors purchase and redeem shares from the Fund.
Financial Highlights
This schedule provides a per-share breakdown of the components that affect the Fund’s NAV for current and past reporting periods as well as total return, asset size, ratios, and portfolio turnover rate.
The first line in the table reflects the NAV per share at the beginning of the reporting period. The next line reports the net investment income/(loss) per share. Following is the per share total of net gains/(losses), realized and unrealized. Per share dividends and distributions to investors are then subtracted to arrive at the NAV per share at the end of the period. The next line reflects the total return for the period. The total return may include adjustments in accordance with generally accepted accounting principles required at the period end for financial reporting purposes. As a result, the total return may differ from the total return reflected for individual shareholder transactions. Also included are ratios of expenses and net investment income to average net assets.
The Fund’s expenses may be reduced through expense offsets and expense reimbursements. The ratios shown reflect expenses before and after any such offsets and reimbursements.
The ratio of net investment income/(loss) summarizes the income earned less expenses, divided by the average net assets of the Fund during the reporting period. Do not confuse this ratio with the Fund’s yield. The net investment income ratio is not a true measure of the Fund’s yield because it does not take into account the dividends distributed to the Fund’s investors.
The next figure is the portfolio turnover rate, which measures the buying and selling activity in the Fund. Portfolio turnover is affected by market conditions, changes in the asset size of the Fund, fluctuating volume of shareholder purchase and redemption orders, the nature of the Fund’s investments, and the investment style and/or outlook of the portfolio manager(s) and/or investment personnel. A 100% rate implies that an amount equal to the value of the entire portfolio was replaced once during the fiscal year; a 50% rate means that an amount equal to the value of half the
Janus Henderson Global Real Estate Fund
Useful Information About Your Fund Report (unaudited)
portfolio is traded in a year; and a 200% rate means that an amount equal to the value of the entire portfolio is traded every six months.
Janus Henderson Global Real Estate Fund
Notes
NotesPage1
| | | | | | | | |
| | | | | |

| | | | |
This report is submitted for the general information of shareholders of the Fund. It is not an offer or solicitation for the Fund and is not authorized for distribution to prospective investors unless preceded or accompanied by an effective prospectus. |
Janus Henderson is a trademark of Janus Henderson Group plc or one of its subsidiaries. © Janus Henderson Group plc. Janus Henderson Group is the ultimate parent of Janus Henderson Distributors US LLC. Janus Henderson Distributors US LLC |
| | | | 125-24-93044 05-23 |
| | | | |
| | | |
| | | SEMIANNUAL REPORT March 31, 2023 |
| | |
| | Janus Henderson Global Research Fund |
| | |
| | Janus Investment Fund |
| |
| | | HIGHLIGHTS · Investment strategy behind your fund · Fund performance, characteristics
and holdings |
Table of Contents
Janus Henderson Global Research Fund
| | | | | | |
| | | | | | Team-Based Approach Led by Matthew Peron, Director of Centralized Equity Research |
| | | |
Janus Henderson Global Research Fund (unaudited)
Fund At A Glance
March 31, 2023
| | | | | | | | | | |
| | | | | | | | | |
| | | | | | | | | |
| | | | | | | | | |
| 5 Top Contributors - Holdings | 5 Top Detractors - Holdings |
| | Average
Weight | | Relative
Contribution | | | Average
Weight | | Relative
Contribution |
| ASML Holding NV | 2.29% | | 0.70% | | Constellation Brands Inc - Class A | 1.92% | | -0.41% |
| Booking Holdings Inc | 1.14% | | 0.36% | | Charles Schwab Corp | 0.94% | | -0.34% |
| Airbus SE | 1.22% | | 0.34% | | JD.Com Inc - Class A | 0.46% | | -0.25% |
| Alstom SA | 0.87% | | 0.32% | | NRG Energy Inc | 0.35% | | -0.25% |
| Dr Ing hc Porsche AG | 0.87% | | 0.29% | | Centene Corp | 0.62% | | -0.23% |
| | | | | | | |
| 5 Top Contributors - Sectors* | | | | | |
| | | Relative | | Fund | MSCI World Index |
| | | Contribution | | Average Weight | Average Weight |
| Industrials | | 1.58% | | 17.57% | 17.15% |
| Technology | | 0.77% | | 17.88% | 18.09% |
| Consumer | | 0.43% | | 15.73% | 15.69% |
| Healthcare | | 0.29% | | 13.99% | 13.99% |
| Financials | | 0.26% | | 18.51% | 18.42% |
| | | | | | |
| | | | | | |
| 3 Top Detractors - Sectors* | | | | | |
| | | Relative | | Fund | MSCI World Index |
| | | Contribution | | Average Weight | Average Weight |
| Communications | | -1.07% | | 7.76% | 8.05% |
| Energy | | -0.24% | | 8.41% | 8.51% |
| Other** | | -0.04% | | 0.15% | 0.10% |
| | | | | | | |
| Relative contribution reflects how the portolio's holdings impacted return relative to the benchmark. Cash and securities not held in the portfolio are not shown. For equity portfolios, relative contribution compares the performance of a security in the portfolio to the benchmark's total return, factoring in the difference in weight of that security in the benchmark. Returns are calculated using daily returns and previous day ending weights rolled up by ticker, excluding fixed income securities, gross of advisory fees, may exclude certain derivatives and will differ from actual performance.
Performance attribution reflects returns gross of advisory fees and may differ from actual returns as they are based on end of day holdings. Attribution is calculated by geometrically linking daily returns for the portfolio and index. |
* | The sectors listed above reflect those covered by the six analyst teams who comprise the Janus Henderson Research Team. |
** | Not a GICS classified sector. |
Janus Henderson Global Research Fund (unaudited)
Fund At A Glance
March 31, 2023
| | |
5 Largest Equity Holdings - (% of Net Assets) |
Microsoft Corp | |
Software | 5.2% |
Apple Inc | |
Technology Hardware, Storage & Peripherals | 4.6% |
Alphabet Inc - Class C | |
Interactive Media & Services | 3.2% |
ASML Holding NV | |
Semiconductor & Semiconductor Equipment | 2.2% |
Amazon.com Inc | |
Multiline Retail | 2.1% |
| | 17.3% |
| | | | | | |
Asset Allocation - (% of Net Assets) | |
Common Stocks | | 98.7% | |
Preferred Stocks | | 0.9% | |
Investments Purchased with Cash Collateral from Securities Lending | | 0.5% | |
Private Placements | | 0.2% | |
Investment Companies | | 0.0% | |
Other | | (0.3)% |
| | | 100.0% |
| | |
Top Country Allocations - Long Positions - (% of Investment Securities) |
As of March 31, 2023 
| As of September 30, 2022 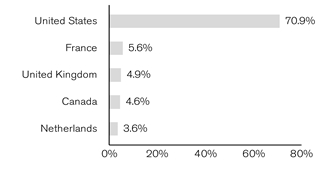
|
Janus Henderson Global Research Fund (unaudited)
Performance
| |
See important disclosures on the next page. |
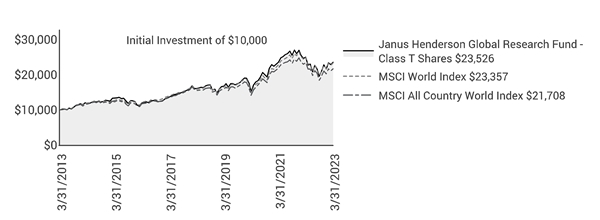
| | | | | | | | | | | |
| | | | | | | | | |
| | | | | | | | | | |
Average Annual Total Return - for the periods ended March 31, 2023 | | | Prospectus Expense Ratios |
| | Fiscal
Year-to-Date | One
Year | Five
Year | Ten
Year | Since
Inception* | | | Total Annual Fund
Operating Expenses‡ |
Class A Shares at NAV | | 20.26% | -6.14% | 7.69% | 8.73% | 8.62% | | | 1.03% |
Class A Shares at MOP | | 13.35% | -11.53% | 6.42% | 8.09% | 8.27% | | | |
Class C Shares at NAV | | 19.81% | -6.79% | 6.98% | 7.98% | 7.83% | | | 1.76% |
Class C Shares at CDSC | | 18.81% | -7.69% | 6.98% | 7.98% | 7.83% | | | |
Class D Shares | | 20.40% | -5.90% | 8.01% | 9.02% | 8.81% | | | 0.75% |
Class I Shares | | 20.45% | -5.82% | 8.10% | 9.11% | 8.89% | | | 0.68% |
Class N Shares | | 20.49% | -5.76% | 8.16% | 9.07% | 8.83% | | | 0.62% |
Class R Shares | | 20.03% | -6.49% | 7.32% | 8.36% | 8.24% | | | 1.39% |
Class S Shares | | 20.18% | -6.24% | 7.63% | 8.65% | 8.46% | | | 1.13% |
Class T Shares | | 20.35% | -5.98% | 7.91% | 8.93% | 8.75% | | | 0.86% |
MSCI World Index | | 18.25% | -7.02% | 8.01% | 8.85% | 6.94% | | | |
MSCI All Country World Index | | 17.78% | -7.44% | 6.93% | 8.06% | 6.69% | | | |
Morningstar Quartile - Class T Shares | | - | 2nd | 2nd | 3rd | 1st | | | |
Morningstar Ranking - based on total returns for World Large Stock Funds | | - | 93/368 | 120/295 | 136/241 | 39/148 | | | |
Returns quoted are past performance and do not guarantee future results; current performance may be lower or higher. Investment returns and principal value will vary; there may be a gain or loss when shares are sold. For the most recent month-end performance call 800.668.0434 (or 800.525.3713 if you hold shares directly with Janus Henderson) or visit janushenderson.com/performance (or janushenderson.com/allfunds if you hold shares directly with Janus Henderson).
Maximum Offering Price (MOP) returns include the maximum sales charge of 5.75%. Net Asset Value (NAV) returns exclude this charge, which would have reduced returns.
CDSC returns include a 1% contingent deferred sales charge (CDSC) on Shares redeemed within 12 months of purchase. Net Asset Value (NAV) returns exclude this charge, which would have reduced returns.
Janus Henderson Global Research Fund (unaudited)
Performance
This Fund has a performance-based management fee that may adjust up or down based on the Fund’s performance.
Performance may be affected by risks that include those associated with foreign and emerging markets, fixed income securities, high-yield and high-risk securities, undervalued, overlooked and smaller capitalization companies, real estate related securities including Real Estate Investment Trusts (REITs), Environmental, Social and Governance (ESG) factors, non-diversification, portfolio turnover, derivatives, short sales, initial public offerings (IPOs) and potential conflicts of interest. Each product has different risks. Please see the prospectus for more information about risks, holdings and other details.
Returns include reinvestment of all dividends and distributions and do not reflect the deduction of taxes that a shareholder would pay on Fund distributions or redemptions of Fund shares. The returns do not include adjustments in accordance with generally accepted accounting principles required at the period end for financial reporting purposes.
Class A Shares, Class C Shares, and Class S Shares commenced operations on July 6, 2009. Performance shown for each class for periods prior to July 6, 2009, reflects the performance of the Fund’s Class J Shares, the initial share class (renamed Class T Shares effective February 16, 2010), calculated using the fees and expenses of each respective class, without the effect of any fee and expense limitations or waivers.
Class D Shares commenced operations on February 16, 2010. Performance shown for periods prior to February 16, 2010, reflects the performance of the Fund’s former Class J Shares, calculated using the fees and expenses in effect during the periods shown, net of any applicable fee and expense limitations or waivers.
Class I Shares commenced operations on July 6, 2009. Performance shown for periods prior to July 6, 2009, reflects the performance of the Fund’s former Class J Shares, calculated using the fees and expenses of Class J Shares, net of any applicable fee and expense limitations or waivers.
Class N Shares commenced operations on August 4, 2017. Performance shown for periods prior to August 4, 2017, reflects the performance for the Fund’s Class T Shares, calculated using the fees and expenses of Class T Shares, net of any applicable fee and expense limitations or waivers.
Class R Shares commenced operations on March 15, 2013. Performance shown for periods prior to March 15, 2013 reflects the historical performance of the Fund’s Class T Shares, calculated using the fees and expenses of Class R Shares, without the effect of any fee and expense limitations or waivers.
If each share class of the Fund had been available during periods prior to its commencement, the performance shown may have been different. The performance shown for periods following the Fund’s commencement of each share class reflects the fees and expenses of each respective share class, net of any applicable fee and expense limitations or waivers. Please refer to the Fund’s prospectuses for further details concerning historical performance.
Ranking is for the share class shown only; other classes may have different performance characteristics. When an expense waiver is in effect, it may have a material effect on the total return, and therefore the ranking for the period.
© 2023 Morningstar, Inc. All Rights Reserved.
There is no assurance that the investment process will consistently lead to successful investing.
See Notes to Schedule of Investments and Other Information for index definitions.
Index performance does not reflect the expenses of managing a portfolio as an index is unmanaged and not available for direct investment.
See “Useful Information About Your Fund Report.”
*The Fund’s inception date – February 25, 2005
‡ As stated in the prospectus. See Financial Highlights for actual expense ratios during the reporting period.
Janus Henderson Global Research Fund (unaudited)
Expense Examples
As a shareholder of the Fund, you incur two types of costs: (1) transaction costs, such as sales charges (loads) on purchase payments (applicable to Class A Shares only); and (2) ongoing costs, including management fees; 12b-1 distribution and shareholder servicing fees; transfer agent fees and expenses payable pursuant to the Transfer Agency Agreement; and other Fund expenses. This example is intended to help you understand your ongoing costs (in dollars) of investing in the Fund and to compare these costs with the ongoing costs of investing in other mutual funds. To do so, compare this 5% hypothetical example with the 5% hypothetical examples that appear in the shareholder reports of the other funds. The example is based upon an investment of $1,000 invested at the beginning of the period and held for the six-months indicated, unless noted otherwise in the table and footnotes below.
Actual Expenses
The information in the table under the heading “Actual” provides information about actual account values and actual expenses. You may use the information in these columns, together with the amount you invested, to estimate the expenses that you paid over the period. Simply divide your account value by $1,000 (for example, an $8,600 account value divided by $1,000 = 8.6), then multiply the result by the number in the appropriate column for your share class under the heading entitled “Expenses Paid During Period” to estimate the expenses you paid on your account during the period.
Hypothetical Example for Comparison Purposes
The information in the table under the heading “Hypothetical (5% return before expenses)” provides information about hypothetical account values and hypothetical expenses based upon the Fund’s actual expense ratio and an assumed rate of return of 5% per year before expenses, which is not the Fund’s actual return. The hypothetical account values and expenses may not be used to estimate the actual ending account balance or expenses you paid for the period. You may use this information to compare the ongoing costs of investing in the Fund and other funds. To do so, compare this 5% hypothetical example with the 5% hypothetical examples that appear in the shareholder reports of the other funds. Additionally, for an analysis of the fees associated with an investment in any share class or other similar funds, please visit www.finra.org/fundanalyzer.
Please note that the expenses shown in the table are meant to highlight your ongoing costs only and do not reflect any transaction costs. These fees are fully described in the Fund’s prospectuses. Therefore, the hypothetical examples are useful in comparing ongoing costs only, and will not help you determine the relative total costs of owning different funds. In addition, if these transaction costs were included, your costs would have been higher.
| | | | | | | | | | | |
| | | | | | | | |
| | | Actual | | Hypothetical
(5% return before expenses) | |
| Beginning
Account
Value
(10/1/22) | Ending
Account
Value
(3/31/23) | Expenses
Paid During
Period
(10/1/22 - 3/31/23)† | | Beginning
Account
Value
(10/1/22) | Ending
Account
Value
(3/31/23) | Expenses
Paid During
Period
(10/1/22 - 3/31/23)† | Net Annualized
Expense Ratio
(10/1/22 - 3/31/23) |
Class A Shares | $1,000.00 | $1,202.60 | $5.27 | | $1,000.00 | $1,020.14 | $4.84 | 0.96% |
Class C Shares | $1,000.00 | $1,198.10 | $9.21 | | $1,000.00 | $1,016.55 | $8.45 | 1.68% |
Class D Shares | $1,000.00 | $1,204.00 | $3.96 | | $1,000.00 | $1,021.34 | $3.63 | 0.72% |
Class I Shares | $1,000.00 | $1,204.50 | $3.57 | | $1,000.00 | $1,021.69 | $3.28 | 0.65% |
Class N Shares | $1,000.00 | $1,204.90 | $3.24 | | $1,000.00 | $1,021.99 | $2.97 | 0.59% |
Class R Shares | $1,000.00 | $1,200.30 | $7.46 | | $1,000.00 | $1,018.15 | $6.84 | 1.36% |
Class S Shares | $1,000.00 | $1,201.80 | $5.98 | | $1,000.00 | $1,019.50 | $5.49 | 1.09% |
Class T Shares | $1,000.00 | $1,203.50 | $4.45 | | $1,000.00 | $1,020.89 | $4.08 | 0.81% |
† | Expenses Paid During Period are equal to the Net Annualized Expense Ratio multiplied by the average account value over the period, multiplied by 182/365 (to reflect the one-half year period). Expenses in the examples include the effect of applicable fee waivers and/or expense reimbursements, if any. Had such waivers and/or reimbursements not been in effect, your expenses would have been higher. Please refer to the Notes to Financial Statements or the Fund’s prospectuses for more information regarding waivers and/or reimbursements. |
Janus Henderson Global Research Fund
Schedule of Investments (unaudited)
March 31, 2023
| | | | | | | | |
Shares or
Principal Amounts | | | Value | |
Common Stocks– 98.7% | | | |
Aerospace & Defense – 3.0% | | | |
| | Airbus SE | | 242,840 | | | $32,529,337 | |
| | BAE Systems PLC | | 3,063,968 | | | 37,138,367 | |
| | General Dynamics Corp | | 76,199 | | | 17,389,374 | |
| | | 87,057,078 | |
Air Freight & Logistics – 1.7% | | | |
| | United Parcel Service Inc | | 252,609 | | | 49,003,620 | |
Airlines – 0.4% | | | |
| | Ryanair Holdings PLC (ADR)* | | 131,822 | | | 12,429,496 | |
Automobiles – 0.6% | | | |
| | Tesla Inc* | | 80,619 | | | 16,725,218 | |
Banks – 5.9% | | | |
| | Bank of America Corp | | 806,005 | | | 23,051,743 | |
| | BNP Paribas SA | | 427,857 | | | 25,587,628 | |
| | HDFC Bank Ltd | | 726,502 | | | 14,283,914 | |
| | JPMorgan Chase & Co | | 403,240 | | | 52,546,204 | |
| | Natwest Group PLC | | 6,430,590 | | | 21,007,726 | |
| | Toronto-Dominion Bank/The# | | 327,415 | | | 19,613,886 | |
| | UniCredit SpA | | 902,188 | | | 17,086,286 | |
| | | 173,177,387 | |
Beverages – 4.1% | | | |
| | Constellation Brands Inc - Class A | | 200,523 | | | 45,296,140 | |
| | Monster Beverage Corp | | 346,054 | | | 18,690,377 | |
| | Pernod Ricard SA | | 243,509 | | | 55,169,074 | |
| | | 119,155,591 | |
Biotechnology – 3.2% | | | |
| | AbbVie Inc | | 148,590 | | | 23,680,788 | |
| | Amgen Inc | | 51,095 | | | 12,352,216 | |
| | Argenx SE (ADR)* | | 26,838 | | | 9,999,302 | |
| | Ascendis Pharma A/S (ADR)* | | 61,740 | | | 6,619,763 | |
| | Sarepta Therapeutics Inc* | | 114,751 | | | 15,816,130 | |
| | Vertex Pharmaceuticals Inc* | | 76,765 | | | 24,186,349 | |
| | | 92,654,548 | |
Capital Markets – 2.9% | | | |
| | Blackstone Group Inc | | 211,568 | | | 18,584,133 | |
| | Charles Schwab Corp | | 334,237 | | | 17,507,334 | |
| | LPL Financial Holdings Inc | | 82,656 | | | 16,729,574 | |
| | Morgan Stanley | | 245,631 | | | 21,566,402 | |
| | State Street Corp | | 137,995 | | | 10,444,842 | |
| | | 84,832,285 | |
Chemicals – 1.8% | | | |
| | Linde PLC | | 147,979 | | | 52,597,656 | |
Consumer Finance – 0.9% | | | |
| | Capital One Financial Corp | | 172,165 | | | 16,555,386 | |
| | OneMain Holdings Inc | | 235,056 | | | 8,715,876 | |
| | | 25,271,262 | |
Diversified Financial Services – 4.6% | | | |
| | Apollo Global Management Inc | | 311,565 | | | 19,678,445 | |
| | Fidelity National Information Services Inc | | 156,364 | | | 8,495,256 | |
| | Global Payments Inc | | 110,897 | | | 11,670,800 | |
| | Mastercard Inc | | 131,874 | | | 47,924,330 | |
| | Visa Inc | | 201,154 | | | 45,352,181 | |
| | | 133,121,012 | |
Electric Utilities – 0.4% | | | |
| | NextEra Energy Inc | | 165,242 | | | 12,736,853 | |
Electronic Equipment, Instruments & Components – 1.4% | | | |
| | Hexagon AB - Class B | | 2,581,507 | | | 29,717,026 | |
| | Keysight Technologies Inc* | | 64,007 | | | 10,335,850 | |
| | | 40,052,876 | |
| | |
See Notes to Schedule of Investments and Other Information and Notes to Financial Statements. |
| |
6 | MARCH 31, 2023 |
Janus Henderson Global Research Fund
Schedule of Investments (unaudited)
March 31, 2023
| | | | | | | | |
Shares or
Principal Amounts | | | Value | |
Common Stocks– (continued) | | | |
Entertainment – 1.5% | | | |
| | Liberty Media Corp-Liberty Formula One* | | 432,893 | | | $32,393,383 | |
| | Nexon Co Ltd | | 497,700 | | | 11,884,245 | |
| | | 44,277,628 | |
Health Care Equipment & Supplies – 1.6% | | | |
| | Abbott Laboratories | | 122,255 | | | 12,379,541 | |
| | Boston Scientific Corp* | | 365,961 | | | 18,309,029 | |
| | Dentsply Sirona Inc | | 197,822 | | | 7,770,448 | |
| | Edwards Lifesciences Corp* | | 102,490 | | | 8,478,998 | |
| | | 46,938,016 | |
Health Care Providers & Services – 1.5% | | | |
| | Centene Corp* | | 225,420 | | | 14,248,798 | |
| | Humana Inc | | 41,808 | | | 20,296,112 | |
| | UnitedHealth Group Inc | | 19,534 | | | 9,231,573 | |
| | | 43,776,483 | |
Hotels, Restaurants & Leisure – 3.6% | | | |
| | Booking Holdings Inc* | | 13,350 | | | 35,409,674 | |
| | Entain PLC | | 1,685,189 | | | 26,222,205 | |
| | McDonald's Corp | | 156,054 | | | 43,634,259 | |
| | Meituan Dianping (144A)* | | 14,180 | | | 257,567 | |
| | | 105,523,705 | |
Independent Power and Renewable Electricity Producers – 1.6% | | | |
| | RWE AG | | 276,190 | | | 11,871,934 | |
| | Vistra Energy Corp | | 1,447,152 | | | 34,731,648 | |
| | | 46,603,582 | |
Insurance – 2.8% | | | |
| | AIA Group Ltd | | 1,851,300 | | | 19,452,810 | |
| | Aon PLC - Class A | | 55,252 | | | 17,420,403 | |
| | Beazley PLC | | 1,056,090 | | | 7,785,432 | |
| | Intact Financial Corp | | 59,151 | | | 8,466,652 | |
| | Progressive Corp/The | | 200,900 | | | 28,740,754 | |
| | | 81,866,051 | |
Interactive Media & Services – 3.5% | | | |
| | Alphabet Inc - Class C* | | 908,598 | | | 94,494,192 | |
| | Tencent Holdings Ltd | | 141,800 | | | 6,928,999 | |
| | | 101,423,191 | |
Life Sciences Tools & Services – 1.3% | | | |
| | Danaher Corp | | 59,319 | | | 14,950,761 | |
| | Thermo Fisher Scientific Inc | | 41,045 | | | 23,657,107 | |
| | | 38,607,868 | |
Machinery – 3.9% | | | |
| | Alstom SA | | 443,393 | | | 12,113,390 | |
| | Atlas Copco AB - Class A | | 2,699,699 | | | 34,240,695 | |
| | Deere & Co | | 84,929 | | | 35,065,486 | |
| | Parker-Hannifin Corp | | 93,887 | | | 31,556,360 | |
| | | 112,975,931 | |
Metals & Mining – 2.4% | | | |
| | Freeport-McMoRan Inc | | 487,068 | | | 19,925,952 | |
| | Rio Tinto PLC | | 236,030 | | | 15,994,315 | |
| | Teck Resources Ltd | | 889,250 | | | 32,475,755 | |
| | | 68,396,022 | |
Multiline Retail – 2.4% | | | |
| | Amazon.com Inc* | | 583,702 | | | 60,290,580 | |
| | JD.Com Inc - Class A | | 464,128 | | | 10,172,401 | |
| | | 70,462,981 | |
Oil, Gas & Consumable Fuels – 5.8% | | | |
| | Canadian Natural Resources Ltd | | 555,894 | | | 30,766,900 | |
| | Cheniere Energy Inc | | 74,560 | | | 11,750,656 | |
| | ConocoPhillips | | 284,192 | | | 28,194,688 | |
| | |
See Notes to Schedule of Investments and Other Information and Notes to Financial Statements. |
| |
Janus Investment Fund | 7 |
Janus Henderson Global Research Fund
Schedule of Investments (unaudited)
March 31, 2023
| | | | | | | | |
Shares or
Principal Amounts | | | Value | |
Common Stocks– (continued) | | | |
Oil, Gas & Consumable Fuels– (continued) | | | |
| | EOG Resources Inc | | 205,646 | | | $23,573,201 | |
| | Marathon Petroleum Corp | | 288,737 | | | 38,930,410 | |
| | Suncor Energy Inc | | 686,018 | | | 21,301,943 | |
| | TotalEnergies SE | | 228,949 | | | 13,507,363 | |
| | | 168,025,161 | |
Personal Products – 1.8% | | | |
| | Unilever PLC | | 988,559 | | | 51,122,232 | |
Pharmaceuticals – 5.8% | | | |
| | AstraZeneca PLC | | 319,453 | | | 44,332,771 | |
| | Catalent Inc* | | 121,604 | | | 7,990,599 | |
| | Eli Lilly & Co | | 30,654 | | | 10,527,197 | |
| | Merck & Co Inc | | 318,485 | | | 33,883,619 | |
| | Novartis AG | | 293,754 | | | 26,975,421 | |
| | Organon & Co | | 237,195 | | | 5,578,826 | |
| | Roche Holding AG | | 68,872 | | | 19,715,685 | |
| | Sanofi | | 182,321 | | | 19,853,296 | |
| | | 168,857,414 | |
Road & Rail – 0.8% | | | |
| | Uber Technologies Inc* | | 771,365 | | | 24,452,271 | |
Semiconductor & Semiconductor Equipment – 7.5% | | | |
| | Advanced Micro Devices Inc* | | 203,414 | | | 19,936,606 | |
| | ASML Holding NV | | 93,388 | | | 63,805,594 | |
| | Lam Research Corp | | 28,434 | | | 15,073,432 | |
| | Marvell Technology Inc | | 291,301 | | | 12,613,333 | |
| | NVIDIA Corp | | 181,536 | | | 50,425,255 | |
| | Taiwan Semiconductor Manufacturing Co Ltd | | 2,131,000 | | | 37,755,622 | |
| | Texas Instruments Inc | | 94,218 | | | 17,525,490 | |
| | | 217,135,332 | |
Software – 8.0% | | | |
| | Atlassian Corp - Class A* | | 28,215 | | | 4,829,562 | |
| | Autodesk Inc* | | 47,428 | | | 9,872,612 | |
| | Constellation Software Inc/Canada | | 5,441 | | | 10,230,956 | |
| | Lumine Group Inc* | | 11,386 | | | 123,946 | |
| | Microsoft Corp | | 522,646 | | | 150,678,842 | |
| | ServiceNow Inc* | | 16,655 | | | 7,739,912 | |
| | Synopsys Inc* | | 69,492 | | | 26,841,285 | |
| | Workday Inc - Class A* | | 114,860 | | | 23,723,184 | |
| | | 234,040,299 | |
Specialized Real Estate Investment Trusts (REITs) – 0.4% | | | |
| | American Tower Corp | | 59,808 | | | 12,221,167 | |
Specialty Retail – 1.1% | | | |
| | O'Reilly Automotive Inc* | | 39,016 | | | 33,123,804 | |
Technology Hardware, Storage & Peripherals – 4.6% | | | |
| | Apple Inc | | 815,460 | | | 134,469,354 | |
Textiles, Apparel & Luxury Goods – 2.2% | | | |
| | LVMH Moet Hennessy Louis Vuitton SE | | 27,629 | | | 25,318,450 | |
| | Moncler SpA | | 164,816 | | | 11,390,904 | |
| | NIKE Inc - Class B | | 214,830 | | | 26,346,751 | |
| | | 63,056,105 | |
Trading Companies & Distributors – 1.8% | | | |
| | Ferguson PLC | | 402,253 | | | 53,074,621 | |
Wireless Telecommunication Services – 1.9% | | | |
| | T-Mobile US Inc* | | 376,545 | | | 54,538,778 | |
Total Common Stocks (cost $2,025,660,338) | | 2,873,782,878 | |
Preferred Stocks– 0.9% | | | |
Automobiles – 0.9% | | | |
| | Dr Ing hc F Porsche AG((cost $17,341,963) | | 215,862 | | | 27,624,425 | |
| | |
See Notes to Schedule of Investments and Other Information and Notes to Financial Statements. |
| |
8 | MARCH 31, 2023 |
Janus Henderson Global Research Fund
Schedule of Investments (unaudited)
March 31, 2023
| | | | | | | | |
Shares or
Principal Amounts | | | Value | |
Private Placements– 0.2% | | | |
Health Care Providers & Services – 0.2% | | | |
| | API Holdings Private Ltd*,¢,§((cost $9,401,252) | | 12,941,830 | | | $4,596,080 | |
Investment Companies– 0% | | | |
Money Markets – 0% | | | |
| | Janus Henderson Cash Liquidity Fund LLC, 4.7988%ºº,£((cost $110,815) | | 110,793 | | | 110,815 | |
Investments Purchased with Cash Collateral from Securities Lending– 0.5% | | | |
Investment Companies – 0.4% | | | |
| | Janus Henderson Cash Collateral Fund LLC, 4.8170%ºº,£ | | 12,230,400 | | | 12,230,400 | |
Time Deposits – 0.1% | | | |
| | Royal Bank of Canada, 4.8000%, 4/3/23 | | $3,057,600 | | | 3,057,600 | |
Total Investments Purchased with Cash Collateral from Securities Lending (cost $15,288,000) | | 15,288,000 | |
Total Investments (total cost $2,067,802,368) – 100.3% | | 2,921,402,198 | |
Liabilities, net of Cash, Receivables and Other Assets – (0.3)% | | (9,924,954) | |
Net Assets – 100% | | $2,911,477,244 | |
| | | | | | |
Summary of Investments by Country - (Long Positions) (unaudited) |
| |
| | | | | % of | |
| | | | | Investment | |
Country | | Value | | Securities | |
United States | | $2,033,932,405 | | 69.6 | % |
France | | 184,078,538 | | 6.3 | |
United Kingdom | | 152,480,816 | | 5.2 | |
Canada | | 122,980,038 | | 4.2 | |
Netherlands | | 114,927,826 | | 3.9 | |
Sweden | | 63,957,721 | | 2.2 | |
Switzerland | | 46,691,106 | | 1.6 | |
Germany | | 39,496,359 | | 1.4 | |
Taiwan | | 37,755,622 | | 1.3 | |
Italy | | 28,477,190 | | 1.0 | |
Hong Kong | | 19,452,810 | | 0.7 | |
India | | 18,879,994 | | 0.7 | |
China | | 17,358,967 | | 0.6 | |
Ireland | | 12,429,496 | | 0.4 | |
Japan | | 11,884,245 | | 0.4 | |
Belgium | | 9,999,302 | | 0.3 | |
Denmark | | 6,619,763 | | 0.2 | |
| | | | | | |
| | | | | | |
Total | | $2,921,402,198 | | 100.0 | % |
| | |
See Notes to Schedule of Investments and Other Information and Notes to Financial Statements. |
| |
Janus Investment Fund | 9 |
Janus Henderson Global Research Fund
Schedule of Investments (unaudited)
March 31, 2023
Schedules of Affiliated Investments – (% of Net Assets)
| | | | | | | | | | | |
| | Dividend Income | Realized Gain/(Loss) | Change in Unrealized Appreciation/ Depreciation | Value at 3/31/23 |
Investment Companies - 0.0% |
Money Markets - 0.0% | |
| | Janus Henderson Cash Liquidity Fund LLC, 4.7988%ºº | $ | 32,378 | $ | 248 | $ | - | $ | 110,815 |
Investments Purchased with Cash Collateral from Securities Lending - 0.4% |
Investment Companies - 0.4% | |
| | Janus Henderson Cash Collateral Fund LLC, 4.8170%ºº | | 8,972∆ | | - | | - | | 12,230,400 |
Total Affiliated Investments - 0.4% | $ | 41,350 | $ | 248 | $ | - | $ | 12,341,215 |
| | | | | | | | | | | |
| | Value at 9/30/22 | Purchases | Sales Proceeds | Value at 3/31/23 |
Investment Companies - 0.0% |
Money Markets - 0.0% | |
| | Janus Henderson Cash Liquidity Fund LLC, 4.7988%ºº | | 8,553,298 | | 69,069,836 | | (77,512,567) | | 110,815 |
Investments Purchased with Cash Collateral from Securities Lending - 0.4% |
Investment Companies - 0.4% | |
| | Janus Henderson Cash Collateral Fund LLC, 4.8170%ºº | | 977,540 | | 91,926,744 | | (80,673,884) | | 12,230,400 |
| | | | | | | | | | |
Offsetting of Financial Assets and Derivative Assets |
| |
| | | Gross Amounts | | | | | | |
| | | of Recognized | | Offsetting Asset | | Collateral | | |
Counterparty | | Assets | | or Liability(a) | | Pledged(b) | | Net Amount |
| | | | | | | | | |
JPMorgan Chase Bank, National Association | $ | 14,676,793 | $ | — | $ | (14,676,793) | $ | — |
| | | | | | | | | |
(a) | Represents the amount of assets or liabilities that could be offset with the same counterparty under master netting or similar agreements that management elects not to offset on the Statement of Assets and Liabilities. |
(b) | Collateral pledged is limited to the net outstanding amount due to/from an individual counterparty. The actual collateral amounts pledged may exceed these amounts and may fluctuate in value. |
| | |
See Notes to Schedule of Investments and Other Information and Notes to Financial Statements. |
| |
10 | MARCH 31, 2023 |
Janus Henderson Global Research Fund
Notes to Schedule of Investments and Other Information (unaudited)
| | |
MSCI All Country World IndexSM | MSCI All Country World IndexSM reflects the equity market performance of global developed and emerging markets. |
MSCI World IndexSM | MSCI World IndexSM reflects the equity market performance of global developed markets. |
| | |
ADR | American Depositary Receipt |
LLC | Limited Liability Company |
PLC | Public Limited Company |
| | |
144A | Securities sold under Rule 144A of the Securities Act of 1933, as amended, are subject to legal and/or contractual restrictions on resale and may not be publicly sold without registration under the 1933 Act. Unless otherwise noted, these securities have been determined to be liquid under guidelines established by the Board of Trustees. The total value of 144A securities as of the period ended March 31, 2023 is $257,567, which represents 0.0% of net assets. |
| | |
* | Non-income producing security. |
| | |
ºº | Rate shown is the 7-day yield as of March 31, 2023. |
| | |
# | Loaned security; a portion of the security is on loan at March 31, 2023. |
| | |
¢ | Security is valued using significant unobservable inputs. The total value of Level 3 securities as of the period ended March 31, 2023 is $4,596,080, which represents 0.2% of net assets. |
| | |
£ | The Fund may invest in certain securities that are considered affiliated companies. As defined by the Investment Company Act of 1940, as amended, an affiliated company is one in which the Fund owns 5% or more of the outstanding voting securities, or a company which is under common ownership or control. |
| | |
∆ | Net of income paid to the securities lending agent and rebates paid to the borrowing counterparties. |
| | | | | | | | | | | |
§ | Schedule of Restricted Securities (as of March 31, 2023) |
| | | | | | | | Value as a | |
| | Acquisition | | | | | | % of Net | |
| | Date | | Cost | | Value | | Assets | |
API Holdings Private Ltd | 9/27/21 | $ | 9,401,252 | $ | 4,596,080 | | 0.2 | % |
| | | | | | | | | |
| | | | | | | | | |
The Fund has registration rights for certain restricted securities held as of March 31, 2023. The issuer incurs all registration costs. | |
Janus Henderson Global Research Fund
Notes to Schedule of Investments and Other Information (unaudited)
| | | | | | | | | | | | | |
The following is a summary of the inputs that were used to value the Fund’s investments in securities and other financial instruments as of March 31, 2023. See Notes to Financial Statements for more information. |
| |
Valuation Inputs Summary |
| | | | | | | |
| | | | | Level 2 - | | Level 3 - |
| | | Level 1 - | | Other Significant | | Significant |
| | | Quoted Prices | | Observable Inputs | | Unobservable Inputs |
| | | | | | | |
Assets | | | | | | |
Investments In Securities: | | | | | | |
Common Stocks | | | | | | |
Aerospace & Defense | $ | 17,389,374 | $ | 69,667,704 | $ | - |
Banks | | 95,211,833 | | 77,965,554 | | - |
Beverages | | 63,986,517 | | 55,169,074 | | - |
Electronic Equipment, Instruments & Components | | 10,335,850 | | 29,717,026 | | - |
Entertainment | | 32,393,383 | | 11,884,245 | | - |
Hotels, Restaurants & Leisure | | 79,043,933 | | 26,479,772 | | - |
Independent Power and Renewable Electricity Producers | | 34,731,648 | | 11,871,934 | | - |
Insurance | | 54,627,809 | | 27,238,242 | | - |
Interactive Media & Services | | 94,494,192 | | 6,928,999 | | - |
Machinery | | 66,621,846 | | 46,354,085 | | - |
Metals & Mining | | 52,401,707 | | 15,994,315 | | - |
Multiline Retail | | 60,290,580 | | 10,172,401 | | - |
Oil, Gas & Consumable Fuels | | 154,517,798 | | 13,507,363 | | - |
Personal Products | | - | | 51,122,232 | | - |
Pharmaceuticals | | 57,980,241 | | 110,877,173 | | - |
Semiconductor & Semiconductor Equipment | | 115,574,116 | | 101,561,216 | | - |
Textiles, Apparel & Luxury Goods | | 26,346,751 | | 36,709,354 | | - |
Trading Companies & Distributors | | - | | 53,074,621 | | - |
All Other | | 1,101,539,990 | | - | | - |
Preferred Stocks | | - | | 27,624,425 | | - |
Private Placements | | - | | - | | 4,596,080 |
Investment Companies | | - | | 110,815 | | - |
Investments Purchased with Cash Collateral from Securities Lending | | - | | 15,288,000 | | - |
Total Assets | $ | 2,117,487,568 | $ | 799,318,550 | $ | 4,596,080 |
| | | | | | | |
Janus Henderson Global Research Fund
Statement of Assets and Liabilities (unaudited)
March 31, 2023
| |
See footnotes at the end of the Statement. |
| | | | | | | |
| | | | | | |
Assets: | | | | |
| Unaffiliated investments, at value (cost $2,055,461,153)(1) | | $ | 2,909,060,983 | |
| Affiliated investments, at value (cost $12,341,215) | | | 12,341,215 | �� |
| Cash denominated in foreign currency (cost $1,544,763) | | | 1,544,763 | |
| Trustees' deferred compensation | | | 72,054 | |
| Receivables: | | | | |
| | Dividends | | | 3,625,595 | |
| | Investments sold | | | 3,063,417 | |
| | Foreign tax reclaims | | | 1,597,780 | |
| | Fund shares sold | | | 179,709 | |
| | Dividends from affiliates | | | 7,030 | |
| Other assets | | | 83,646 | |
Total Assets | | | 2,931,576,192 | |
Liabilities: | | | | |
| Due to custodian | | | 1,570 | |
| Collateral for securities loaned (Note 2) | | | 15,288,000 | |
| Payables: | | | — | |
| | Investments purchased | | | 1,507,794 | |
| | Advisory fees | | | 1,309,555 | |
| | Fund shares repurchased | | | 1,150,280 | |
| | Transfer agent fees and expenses | | | 474,912 | |
| | Trustees' deferred compensation fees | | | 72,054 | |
| | Professional fees | | | 29,847 | |
| | Trustees' fees and expenses | | | 18,375 | |
| | Custodian fees | | | 15,471 | |
| | 12b-1 Distribution and shareholder servicing fees | | | 13,744 | |
| | Affiliated fund administration fees payable | | | 6,397 | |
| | Foreign tax liability | | | 2,934 | |
| | Accrued expenses and other payables | | | 208,015 | |
Total Liabilities | | | 20,098,948 | |
Net Assets | | $ | 2,911,477,244 | |
| | |
See Notes to Financial Statements. |
| |
Janus Investment Fund | 13 |
Janus Henderson Global Research Fund
Statement of Assets and Liabilities (unaudited)
March 31, 2023
| | | | | | | |
| | | | | | |
| | | | | | | |
Net Assets Consist of: | | | | |
| Capital (par value and paid-in surplus) | | $ | 1,991,835,312 | |
| Total distributable earnings (loss) (includes $2,934 of foreign capital gains tax) | | | 919,641,932 | |
Total Net Assets | | $ | 2,911,477,244 | |
Net Assets - Class A Shares | | $ | 17,890,922 | |
| Shares Outstanding, $0.01 Par Value (unlimited shares authorized) | | | 205,480 | |
Net Asset Value Per Share(2) | | $ | 87.07 | |
Maximum Offering Price Per Share(3) | | $ | 92.38 | |
Net Assets - Class C Shares | | $ | 3,141,899 | |
| Shares Outstanding, $0.01 Par Value (unlimited shares authorized) | | | 37,594 | |
Net Asset Value Per Share(2) | | $ | 83.57 | |
Net Assets - Class D Shares | | $ | 1,663,183,017 | |
| Shares Outstanding, $0.01 Par Value (unlimited shares authorized) | | | 19,388,605 | |
Net Asset Value Per Share | | $ | 85.78 | |
Net Assets - Class I Shares | | $ | 115,498,174 | |
| Shares Outstanding, $0.01 Par Value (unlimited shares authorized) | | | 1,320,593 | |
Net Asset Value Per Share | | $ | 87.46 | |
Net Assets - Class N Shares | | $ | 37,063,409 | |
| Shares Outstanding, $0.01 Par Value (unlimited shares authorized) | | | 432,979 | |
Net Asset Value Per Share | | $ | 85.60 | |
Net Assets - Class R Shares | | $ | 7,173,856 | |
| Shares Outstanding, $0.01 Par Value (unlimited shares authorized) | | | 83,779 | |
Net Asset Value Per Share | | $ | 85.63 | |
Net Assets - Class S Shares | | $ | 16,269,345 | |
| Shares Outstanding, $0.01 Par Value (unlimited shares authorized) | | | 186,276 | |
Net Asset Value Per Share | | $ | 87.34 | |
Net Assets - Class T Shares | | $ | 1,051,256,622 | |
| Shares Outstanding, $0.01 Par Value (unlimited shares authorized) | | | 12,272,641 | |
Net Asset Value Per Share | | $ | 85.66 | |
| |
(1) Includes $14,676,793 of securities on loan. See Note 2 in Notes to Financial Statements. (2) Redemption price per share may be reduced for any applicable contingent deferred sales charge. (3) Maximum offering price is computed at 100/94.25 of net asset value. |
| | |
See Notes to Financial Statements. |
| |
14 | MARCH 31, 2023 |
Janus Henderson Global Research Fund
Statement of Operations (unaudited)
For the period ended March 31, 2023
| | | | | | |
| | | | | |
Investment Income: | | | |
| Dividends | $ | 25,111,634 | |
| Dividends from affiliates | | 32,378 | |
| Affiliated securities lending income, net | | 8,972 | |
| Unaffiliated securities lending income, net | | 2,077 | |
| Other income | | 299,648 | |
| Foreign tax withheld | | (965,578) | |
Total Investment Income | | 24,489,131 | |
Expenses: | | | |
| Advisory fees | | 7,536,333 | |
| 12b-1 Distribution and shareholder servicing fees: | | | |
| | Class A Shares | | 22,791 | |
| | Class C Shares | | 14,510 | |
| | Class R Shares | | 21,177 | |
| | Class S Shares | | 19,404 | |
| Transfer agent administrative fees and expenses: | | | |
| | Class D Shares | | 934,858 | |
| | Class R Shares | | 10,599 | |
| | Class S Shares | | 19,406 | |
| | Class T Shares | | 1,256,153 | |
| Transfer agent networking and omnibus fees: | | | |
| | Class A Shares | | 10,496 | |
| | Class C Shares | | 1,375 | |
| | Class I Shares | | 38,804 | |
| Other transfer agent fees and expenses: | | | |
| | Class A Shares | | 693 | |
| | Class C Shares | | 83 | |
| | Class D Shares | | 131,272 | |
| | Class I Shares | | 3,325 | |
| | Class N Shares | | 798 | |
| | Class R Shares | | 66 | |
| | Class S Shares | | 158 | |
| | Class T Shares | | 5,559 | |
| Shareholder reports expense | | 133,371 | |
| Registration fees | | 87,359 | |
| Professional fees | | 79,431 | |
| Custodian fees | | 60,180 | |
| Trustees’ fees and expenses | | 41,207 | |
| Affiliated fund administration fees | | 34,771 | |
| Other expenses | | 116,211 | |
Total Expenses | | 10,580,390 | |
Less: Excess Expense Reimbursement and Waivers | | (67,734) | |
Net Expenses | | 10,512,656 | |
Net Investment Income/(Loss) | | 13,976,475 | |
| | | | | |
| | |
See Notes to Financial Statements. |
| |
Janus Investment Fund | 15 |
Janus Henderson Global Research Fund
Statement of Operations (unaudited)
For the period ended March 31, 2023
| | | | | | |
| | | | | |
Net Realized Gain/(Loss) on Investments: | | | |
| Investments and foreign currency transactions | $ | 55,039,144 | |
| Investments in affiliates | | 248 | |
Total Net Realized Gain/(Loss) on Investments | | 55,039,392 | |
Change in Unrealized Net Appreciation/Depreciation: | | | |
| Investments, foreign currency translations and Trustees’ deferred compensation | | 435,768,450 | |
Total Change in Unrealized Net Appreciation/Depreciation | | 435,768,450 | |
Net Increase/(Decrease) in Net Assets Resulting from Operations | $ | 504,784,317 | |
| | | | | |
| | |
See Notes to Financial Statements. |
| |
16 | MARCH 31, 2023 |
Janus Henderson Global Research Fund
Statements of Changes in Net Assets
| | | | | | | | | |
| | | | | | | | |
| | | Period ended
March 31, 2023 (unaudited) | | Year ended
September 30, 2022 | |
| | | | | | | | | |
Operations: | | | | | | |
| Net investment income/(loss) | $ | 13,976,475 | | $ | 21,631,736 | |
| Net realized gain/(loss) on investments | | 55,039,392 | | | 109,215,158 | |
| Change in unrealized net appreciation/depreciation | | 435,768,450 | | | (907,116,204) | |
Net Increase/(Decrease) in Net Assets Resulting from Operations | | 504,784,317 | | | (776,269,310) | |
Dividends and Distributions to Shareholders: | | | | | | |
| | Class A Shares | | (728,299) | | | (2,432,950) | |
| | Class C Shares | | (112,458) | | | (478,940) | |
| | Class D Shares | | (67,926,045) | | | (212,599,273) | |
| | Class I Shares | | (4,815,704) | | | (15,452,023) | |
| | Class N Shares | | (1,543,781) | | | (4,330,870) | |
| | Class R Shares | | (332,948) | | | (1,035,016) | |
| | Class S Shares | | (583,254) | | | (2,106,969) | |
| | Class T Shares | | (42,103,203) | | | (139,551,040) | |
Net Decrease from Dividends and Distributions to Shareholders | | (118,145,692) | | | (377,987,081) | |
Capital Share Transactions: | | | | | | |
| | Class A Shares | | (1,843,440) | | | 678,202 | |
| | Class C Shares | | (279,266) | | | (32,373) | |
| | Class D Shares | | 19,352,133 | | | 116,945,555 | |
| | Class I Shares | | (314,970) | | | 770,181 | |
| | Class N Shares | | 1,526,963 | | | 348,344 | |
| | Class R Shares | | (2,164,983) | | | 1,920,902 | |
| | Class S Shares | | 28,157 | | | (3,708,048) | |
| | Class T Shares | | (6,100,573) | | | 33,302,471 | |
Net Increase/(Decrease) from Capital Share Transactions | | 10,204,021 | | | 150,225,234 | |
Net Increase/(Decrease) in Net Assets | | 396,842,646 | | | (1,004,031,157) | |
Net Assets: | | | | | | |
| Beginning of period | | 2,514,634,598 | | | 3,518,665,755 | |
| End of period | $ | 2,911,477,244 | | $ | 2,514,634,598 | |
| | | | | | | | |
| | |
See Notes to Financial Statements. |
| |
Janus Investment Fund | 17 |
Janus Henderson Global Research Fund
Financial Highlights
| | | | | | | | | | | | | | | | | | | | | | |
Class A Shares | | | | | | | | | | | | | | | | | | |
For a share outstanding during the period ended March 31, 2023 (unaudited) and the year ended September 30 | 2023 | | | 2022 | | | 2021 | | | 2020 | | | 2019 | | | 2018 | |
| Net Asset Value, Beginning of Period | | $75.40 | | | $110.18 | | | $89.60 | | | $81.67 | | | $85.80 | | | $76.26 | |
| Income/(Loss) from Investment Operations: | | | | | | | | | | | | | | | | | | |
| | Net investment income/(loss)(1) | | 0.33 | | | 0.41 | | | 0.23 | | | 0.31 | | | 0.65 | | | 0.57 | |
| | Net realized and unrealized gain/(loss) | | 14.64 | | | (23.60) | | | 23.77 | | | 11.47 | | | (0.20) | | | 9.25 | |
| Total from Investment Operations | | 14.97 | | | (23.19) | | | 24.00 | | | 11.78 | | | 0.45 | | | 9.82 | |
| Less Dividends and Distributions: | | | | | | | | | | | | | | | | | | |
| | Dividends (from net investment income) | | (0.52) | | | (0.16) | | | (0.16) | | | (0.61) | | | (0.46) | | | (0.28) | |
| | Distributions (from capital gains) | | (2.78) | | | (11.43) | | | (3.26) | | | (3.24) | | | (4.12) | | | — | |
| Total Dividends and Distributions | | (3.30) | | | (11.59) | | | (3.42) | | | (3.85) | | | (4.58) | | | (0.28) | |
| Net Asset Value, End of Period | | $87.07 | | | $75.40 | | | $110.18 | | | $89.60 | | | $81.67 | | | $85.80 | |
| Total Return* | | 20.26% | | | (23.60)% | | | 27.28% | | | 14.71% | | | 1.43% | | | 12.90% | |
| Net Assets, End of Period (in thousands) | | $17,891 | | | $17,175 | | | $24,310 | | | $23,470 | | | $18,247 | | | $16,478 | |
| Average Net Assets for the Period (in thousands) | | $18,319 | | | $21,901 | | | $24,438 | | | $19,926 | | | $17,274 | | | $15,685 | |
| Ratios to Average Net Assets**: | | | | | | | | | | | | | | | | | | |
| | Ratio of Gross Expenses | | 0.96% | | | 1.03% | | | 1.17% | | | 1.21% | | | 1.32% | | | 1.14% | |
| | Ratio of Net Expenses (After Waivers and Expense Offsets) | | 0.96% | | | 1.03% | | | 1.17% | | | 1.20% | | | 1.16% | | | 1.00% | |
| | Ratio of Net Investment Income/(Loss) | | 0.80% | | | 0.43% | | | 0.23% | | | 0.37% | | | 0.83% | | | 0.70% | |
| Portfolio Turnover Rate | | 10% | | | 33% | | | 25% | | | 34% | | | 35% | | | 32% | |
| | | | | | | | | | | | | | | | | | | | | | |
| |
* Total return includes adjustments in accordance with generally accepted accounting principles required at the year or period end and are not annualized for periods of less than one full year. ** Annualized for periods of less than one full year. (1) Per share amounts are calculated based on average shares outstanding during the year or period. |
| | |
See Notes to Financial Statements. |
| |
18 | MARCH 31, 2023 |
Janus Henderson Global Research Fund
Financial Highlights
| | | | | | | | | | | | | | | | | | | | | | |
Class C Shares | | | | | | | | | | | | | | | | | | |
For a share outstanding during the period ended March 31, 2023 (unaudited) and the year ended September 30 | 2023 | | | 2022 | | | 2021 | | | 2020 | | | 2019 | | | 2018 | |
| Net Asset Value, Beginning of Period | | $72.28 | | | $106.56 | | | $87.19 | | | $79.50 | | | $83.65 | | | $74.57 | |
| Income/(Loss) from Investment Operations: | | | | | | | | | | | | | | | | | | |
| | Net investment income/(loss)(1) | | 0.03 | | | (0.21) | | | (0.45) | | | (0.22) | | | 0.13 | | | 0.04 | |
| | Net realized and unrealized gain/(loss) | | 14.04 | | | (22.64) | | | 23.08 | | | 11.15 | | | (0.16) | | | 9.04 | |
| Total from Investment Operations | | 14.07 | | | (22.85) | | | 22.63 | | | 10.93 | | | (0.03) | | | 9.08 | |
| Less Dividends and Distributions: | | | | | | | | | | | | | | | | | | |
| | Dividends (from net investment income) | | — | | | — | | | — | | | — | | | — | | | — | |
| | Distributions (from capital gains) | | (2.78) | | | (11.43) | | | (3.26) | | | (3.24) | | | (4.12) | | | — | |
| Total Dividends and Distributions | | (2.78) | | | (11.43) | | | (3.26) | | | (3.24) | | | (4.12) | | | — | |
| Net Asset Value, End of Period | | $83.57 | | | $72.28 | | | $106.56 | | | $87.19 | | | $79.50 | | | $83.65 | |
| Total Return* | | 19.81% | | | (24.09)% | | | 26.42% | | | 13.98% | | | 0.78% | | | 12.18% | |
| Net Assets, End of Period (in thousands) | | $3,142 | | | $2,971 | | | $4,491 | | | $5,005 | | | $5,564 | | | $7,746 | |
| Average Net Assets for the Period (in thousands) | | $3,169 | | | $4,022 | | | $4,880 | | | $5,323 | | | $6,303 | | | $8,343 | |
| Ratios to Average Net Assets**: | | | | | | | | | | | | | | | | | | |
| | Ratio of Gross Expenses | | 1.68% | | | 1.68% | | | 1.85% | | | 1.84% | | | 1.80% | | | 1.64% | |
| | Ratio of Net Expenses (After Waivers and Expense Offsets) | | 1.68% | | | 1.68% | | | 1.85% | | | 1.84% | | | 1.80% | | | 1.64% | |
| | Ratio of Net Investment Income/(Loss) | | 0.07% | | | (0.23)% | | | (0.45)% | | | (0.27)% | | | 0.17% | | | 0.05% | |
| Portfolio Turnover Rate | | 10% | | | 33% | | | 25% | | | 34% | | | 35% | | | 32% | |
| | | | | | | | | | | | | | | | | | | | | | |
| |
* Total return includes adjustments in accordance with generally accepted accounting principles required at the year or period end and are not annualized for periods of less than one full year. ** Annualized for periods of less than one full year. (1) Per share amounts are calculated based on average shares outstanding during the year or period. |
| | |
See Notes to Financial Statements. |
| |
Janus Investment Fund | 19 |
Janus Henderson Global Research Fund
Financial Highlights
| | | | | | | | | | | | | | | | | | | | | | |
Class D Shares | | | | | | | | | | | | | | | | | | |
For a share outstanding during the period ended March 31, 2023 (unaudited) and the year ended September 30 | 2023 | | | 2022 | | | 2021 | | | 2020 | | | 2019 | | | 2018 | |
| Net Asset Value, Beginning of Period | | $74.51 | | | $109.10 | | | $88.69 | | | $80.85 | | | $84.93 | | | $75.50 | |
| Income/(Loss) from Investment Operations: | | | | | | | | | | | | | | | | | | |
| | Net investment income/(loss)(1) | | 0.43 | | | 0.68 | | | 0.56 | | | 0.55 | | | 0.88 | | | 0.82 | |
| | Net realized and unrealized gain/(loss) | | 14.43 | | | (23.29) | | | 23.50 | | | 11.36 | | | (0.21) | | | 9.14 | |
| Total from Investment Operations | | 14.86 | | | (22.61) | | | 24.06 | | | 11.91 | | | 0.67 | | | 9.96 | |
| Less Dividends and Distributions: | | | | | | | | | | | | | | | | | | |
| | Dividends (from net investment income) | | (0.81) | | | (0.55) | | | (0.39) | | | (0.83) | | | (0.63) | | | (0.53) | |
| | Distributions (from capital gains) | | (2.78) | | | (11.43) | | | (3.26) | | | (3.24) | | | (4.12) | | | — | |
| Total Dividends and Distributions | | (3.59) | | | (11.98) | | | (3.65) | | | (4.07) | | | (4.75) | | | (0.53) | |
| Net Asset Value, End of Period | | $85.78 | | | $74.51 | | | $109.10 | | | $88.69 | | | $80.85 | | | $84.93 | |
| Total Return* | | 20.40% | | | (23.37)% | | | 27.68% | | | 15.06% | | | 1.76% | | | 13.25% | |
| Net Assets, End of Period (in thousands) | | $1,663,183 | | | $1,424,181 | | | $1,959,177 | | | $1,607,701 | | | $1,493,928 | | | $1,564,083 | |
| Average Net Assets for the Period (in thousands) | | $1,586,719 | | | $1,797,317 | | | $1,873,058 | | | $1,511,011 | | | $1,463,525 | | | $1,527,522 | |
| Ratios to Average Net Assets**: | | | | | | | | | | | | | | | | | | |
| | Ratio of Gross Expenses | | 0.72% | | | 0.75% | | | 0.86% | | | 0.89% | | | 0.83% | | | 0.69% | |
| | Ratio of Net Expenses (After Waivers and Expense Offsets) | | 0.72% | | | 0.75% | | | 0.86% | | | 0.89% | | | 0.83% | | | 0.69% | |
| | Ratio of Net Investment Income/(Loss) | | 1.04% | | | 0.72% | | | 0.54% | | | 0.68% | | | 1.13% | | | 1.02% | |
| Portfolio Turnover Rate | | 10% | | | 33% | | | 25% | | | 34% | | | 35% | | | 32% | |
| | | | | | | | | | | | | | | | | | | | | | |
| |
* Total return includes adjustments in accordance with generally accepted accounting principles required at the year or period end and are not annualized for periods of less than one full year. ** Annualized for periods of less than one full year. (1) Per share amounts are calculated based on average shares outstanding during the year or period. |
| | |
See Notes to Financial Statements. |
| |
20 | MARCH 31, 2023 |
Janus Henderson Global Research Fund
Financial Highlights
| | | | | | | | | | | | | | | | | | | | | | |
Class I Shares | | | | | | | | | | | | | | | | | | |
For a share outstanding during the period ended March 31, 2023 (unaudited) and the year ended September 30 | 2023 | | | 2022 | | | 2021 | | | 2020 | | | 2019 | | | 2018 | |
| Net Asset Value, Beginning of Period | | $75.93 | | | $110.96 | | | $90.13 | | | $82.10 | | | $86.16 | | | $76.57 | |
| Income/(Loss) from Investment Operations: | | | | | | | | | | | | | | | | | | |
| | Net investment income/(loss)(1) | | 0.46 | | | 0.75 | | | 0.64 | | | 0.63 | | | 0.95 | | | 0.91 | |
| | Net realized and unrealized gain/(loss) | | 14.73 | | | (23.73) | | | 23.90 | | | 11.54 | | | (0.20) | | | 9.27 | |
| Total from Investment Operations | | 15.19 | | | (22.98) | | | 24.54 | | | 12.17 | | | 0.75 | | | 10.18 | |
| Less Dividends and Distributions: | | | | | | | | | | | | | | | | | | |
| | Dividends (from net investment income) | | (0.88) | | | (0.62) | | | (0.45) | | | (0.90) | | | (0.69) | | | (0.59) | |
| | Distributions (from capital gains) | | (2.78) | | | (11.43) | | | (3.26) | | | (3.24) | | | (4.12) | | | — | |
| Total Dividends and Distributions | | (3.66) | | | (12.05) | | | (3.71) | | | (4.14) | | | (4.81) | | | (0.59) | |
| Net Asset Value, End of Period | | $87.46 | | | $75.93 | | | $110.96 | | | $90.13 | | | $82.10 | | | $86.16 | |
| Total Return* | | 20.45% | | | (23.33)% | | | 27.78% | | | 15.15% | | | 1.85% | | | 13.36% | |
| Net Assets, End of Period (in thousands) | | $115,498 | | | $100,359 | | | $145,610 | | | $135,394 | | | $139,584 | | | $179,093 | |
| Average Net Assets for the Period (in thousands) | | $112,191 | | | $128,292 | | | $145,201 | | | $132,597 | | | $146,672 | | | $167,007 | |
| Ratios to Average Net Assets**: | | | | | | | | | | | | | | | | | | |
| | Ratio of Gross Expenses | | 0.65% | | | 0.68% | | | 0.79% | | | 0.81% | | | 0.74% | | | 0.60% | |
| | Ratio of Net Expenses (After Waivers and Expense Offsets) | | 0.65% | | | 0.68% | | | 0.79% | | | 0.81% | | | 0.74% | | | 0.60% | |
| | Ratio of Net Investment Income/(Loss) | | 1.11% | | | 0.78% | | | 0.61% | | | 0.76% | | | 1.21% | | | 1.11% | |
| Portfolio Turnover Rate | | 10% | | | 33% | | | 25% | | | 34% | | | 35% | | | 32% | |
| | | | | | | | | | | | | | | | | | | | | | |
| |
* Total return includes adjustments in accordance with generally accepted accounting principles required at the year or period end and are not annualized for periods of less than one full year. ** Annualized for periods of less than one full year. (1) Per share amounts are calculated based on average shares outstanding during the year or period. |
| | |
See Notes to Financial Statements. |
| |
Janus Investment Fund | 21 |
Janus Henderson Global Research Fund
Financial Highlights
| | | | | | | | | | | | | | | | | | | | | | |
Class N Shares | | | | | | | | | | | | | | | | | | |
For a share outstanding during the period ended March 31, 2023 (unaudited) and the year ended September 30 | 2023 | | | 2022 | | | 2021 | | | 2020 | | | 2019 | | | 2018 | |
| Net Asset Value, Beginning of Period | | $74.42 | | | $109.00 | | | $88.60 | | | $80.77 | | | $84.85 | | | $75.44 | |
| Income/(Loss) from Investment Operations: | | | | | | | | | | | | | | | | | | |
| | Net investment income/(loss)(1) | | 0.48 | | | 0.80 | | | 0.69 | | | 0.66 | | | 1.02 | | | 0.96 | |
| | Net realized and unrealized gain/(loss) | | 14.42 | | | (23.27) | | | 23.48 | | | 11.36 | | | (0.25) | | | 9.11 | |
| Total from Investment Operations | | 14.90 | | | (22.47) | | | 24.17 | | | 12.02 | | | 0.77 | | | 10.07 | |
| Less Dividends and Distributions: | | | | | | | | | | | | | | | | | | |
| | Dividends (from net investment income) | | (0.94) | | | (0.68) | | | (0.51) | | | (0.95) | | | (0.73) | | | (0.66) | |
| | Distributions (from capital gains) | | (2.78) | | | (11.43) | | | (3.26) | | | (3.24) | | | (4.12) | | | — | |
| Total Dividends and Distributions | | (3.72) | | | (12.11) | | | (3.77) | | | (4.19) | | | (4.85) | | | (0.66) | |
| Net Asset Value, End of Period | | $85.60 | | | $74.42 | | | $109.00 | | | $88.60 | | | $80.77 | | | $84.85 | |
| Total Return* | | 20.49% | | | (23.28)% | | | 27.85% | | | 15.23% | | | 1.91% | | | 13.42% | |
| Net Assets, End of Period (in thousands) | | $37,063 | | | $30,831 | | | $43,521 | | | $40,607 | | | $31,393 | | | $38,195 | |
| Average Net Assets for the Period (in thousands) | | $34,736 | | | $37,593 | | | $44,557 | | | $30,617 | | | $37,778 | | | $36,802 | |
| Ratios to Average Net Assets**: | | | | | | | | | | | | | | | | | | |
| | Ratio of Gross Expenses | | 0.59% | | | 0.62% | | | 0.73% | | | 0.76% | | | 0.68% | | | 0.54% | |
| | Ratio of Net Expenses (After Waivers and Expense Offsets) | | 0.59% | | | 0.62% | | | 0.73% | | | 0.76% | | | 0.68% | | | 0.54% | |
| | Ratio of Net Investment Income/(Loss) | | 1.17% | | | 0.85% | | | 0.67% | | | 0.81% | | | 1.32% | | | 1.19% | |
| Portfolio Turnover Rate | | 10% | | | 33% | | | 25% | | | 34% | | | 35% | | | 32% | |
| | | | | | | | | | | | | | | | | | | | | | |
| |
* Total return includes adjustments in accordance with generally accepted accounting principles required at the year or period end and are not annualized for periods of less than one full year. ** Annualized for periods of less than one full year. (1) Per share amounts are calculated based on average shares outstanding during the year or period. |
| | |
See Notes to Financial Statements. |
| |
22 | MARCH 31, 2023 |
Janus Henderson Global Research Fund
Financial Highlights
| | | | | | | | | | | | | | | | | | | | | | |
Class R Shares | | | | | | | | | | | | | | | | | | |
For a share outstanding during the period ended March 31, 2023 (unaudited) and the year ended September 30 | 2023 | | | 2022 | | | 2021 | | | 2020 | | | 2019 | | | 2018 | |
| Net Asset Value, Beginning of Period | | $74.11 | | | $108.69 | | | $88.57 | | | $80.78 | | | $84.95 | | | $75.55 | |
| Income/(Loss) from Investment Operations: | | | | | | | | | | | | | | | | | | |
| | Net investment income/(loss)(1) | | 0.15 | | | 0.08 | | | (0.10) | | | 0.02 | | | 0.39 | | | 0.32 | |
| | Net realized and unrealized gain/(loss) | | 14.41 | | | (23.23) | | | 23.48 | | | 11.34 | | | (0.18) | | | 9.15 | |
| Total from Investment Operations | | 14.56 | | | (23.15) | | | 23.38 | | | 11.36 | | | 0.21 | | | 9.47 | |
| Less Dividends and Distributions: | | | | | | | | | | | | | | | | | | |
| | Dividends (from net investment income) | | (0.26) | | | — | | | — | | | (0.33) | | | (0.26) | | | (0.07) | |
| | Distributions (from capital gains) | | (2.78) | | | (11.43) | | | (3.26) | | | (3.24) | | | (4.12) | | | — | |
| Total Dividends and Distributions | | (3.04) | | | (11.43) | | | (3.26) | | | (3.57) | | | (4.38) | | | (0.07) | |
| Net Asset Value, End of Period | | $85.63 | | | $74.11 | | | $108.69 | | | $88.57 | | | $80.78 | | | $84.95 | |
| Total Return* | | 20.03% | | | (23.87)% | | | 26.87% | | | 14.33% | | | 1.11% | | | 12.55% | |
| Net Assets, End of Period (in thousands) | | $7,174 | | | $8,123 | | | $9,736 | | | $7,802 | | | $6,574 | | | $6,417 | |
| Average Net Assets for the Period (in thousands) | | $8,513 | | | $9,507 | | | $8,777 | | | $6,410 | | | $6,232 | | | $6,245 | |
| Ratios to Average Net Assets**: | | | | | | | | | | | | | | | | | | |
| | Ratio of Gross Expenses | | 1.36% | | | 1.39% | | | 1.50% | | | 1.54% | | | 1.47% | | | 1.31% | |
| | Ratio of Net Expenses (After Waivers and Expense Offsets) | | 1.36% | | | 1.39% | | | 1.50% | | | 1.54% | | | 1.47% | | | 1.31% | |
| | Ratio of Net Investment Income/(Loss) | | 0.37% | | | 0.09% | | | (0.10)% | | | 0.03% | | | 0.50% | | | 0.40% | |
| Portfolio Turnover Rate | | 10% | | | 33% | | | 25% | | | 34% | | | 35% | | | 32% | |
| | | | | | | | | | | | | | | | | | | | | | |
| |
* Total return includes adjustments in accordance with generally accepted accounting principles required at the year or period end and are not annualized for periods of less than one full year. ** Annualized for periods of less than one full year. (1) Per share amounts are calculated based on average shares outstanding during the year or period. |
| | |
See Notes to Financial Statements. |
| |
Janus Investment Fund | 23 |
Janus Henderson Global Research Fund
Financial Highlights
| | | | | | | | | | | | | | | | | | | | | | |
Class S Shares | | | | | | | | | | | | | | | | | | |
For a share outstanding during the period ended March 31, 2023 (unaudited) and the year ended September 30 | 2023 | | | 2022 | | | 2021 | | | 2020 | | | 2019 | | | 2018 | |
| Net Asset Value, Beginning of Period | | $75.58 | | | $110.34 | | | $89.62 | | | $81.85 | | | $85.96 | | | $76.40 | |
| Income/(Loss) from Investment Operations: | | | | | | | | | | | | | | | | | | |
| | Net investment income/(loss)(1) | | 0.28 | | | 0.32 | | | 0.28 | | | 0.27 | | | 0.61 | | | 0.51 | |
| | Net realized and unrealized gain/(loss) | | 14.67 | | | (23.65) | | | 23.70 | | | 11.48 | | | (0.18) | | | 9.30 | |
| Total from Investment Operations | | 14.95 | | | (23.33) | | | 23.98 | | | 11.75 | | | 0.43 | | | 9.81 | |
| Less Dividends and Distributions: | | | | | | | | | | | | | | | | | | |
| | Dividends (from net investment income) | | (0.41) | | | — | | | — | | | (0.74) | | | (0.42) | | | (0.25) | |
| | Distributions (from capital gains) | | (2.78) | | | (11.43) | | | (3.26) | | | (3.24) | | | (4.12) | | | — | |
| Total Dividends and Distributions | | (3.19) | | | (11.43) | | | (3.26) | | | (3.98) | | | (4.54) | | | (0.25) | |
| Net Asset Value, End of Period | | $87.34 | | | $75.58 | | | $110.34 | | | $89.62 | | | $81.85 | | | $85.96 | |
| Total Return* | | 20.18% | | | (23.66)% | | | 27.23% | | | 14.66% | | | 1.40% | | | 12.86% | |
| Net Assets, End of Period (in thousands) | | $16,269 | | | $14,034 | | | $24,088 | | | $131,161 | | | $109,878 | | | $62,331 | |
| Average Net Assets for the Period (in thousands) | | $15,546 | | | $18,904 | | | $25,744 | | | $128,108 | | | $64,355 | | | $67,144 | |
| Ratios to Average Net Assets**: | | | | | | | | | | | | | | | | | | |
| | Ratio of Gross Expenses | | 1.10% | | | 1.13% | | | 1.21% | | | 1.24% | | | 1.18% | | | 1.04% | |
| | Ratio of Net Expenses (After Waivers and Expense Offsets) | | 1.09% | | | 1.12% | | | 1.21% | | | 1.24% | | | 1.18% | | | 1.04% | |
| | Ratio of Net Investment Income/(Loss) | | 0.67% | | | 0.33% | | | 0.27% | | | 0.33% | | | 0.77% | | | 0.63% | |
| Portfolio Turnover Rate | | 10% | | | 33% | | | 25% | | | 34% | | | 35% | | | 32% | |
| | | | | | | | | | | | | | | | | | | | | | |
| |
* Total return includes adjustments in accordance with generally accepted accounting principles required at the year or period end and are not annualized for periods of less than one full year. ** Annualized for periods of less than one full year. (1) Per share amounts are calculated based on average shares outstanding during the year or period. |
| | |
See Notes to Financial Statements. |
| |
24 | MARCH 31, 2023 |
Janus Henderson Global Research Fund
Financial Highlights
| | | | | | | | | | | | | | | | | | | | | | |
Class T Shares | | | | | | | | | | | | | | | | | | |
For a share outstanding during the period ended March 31, 2023 (unaudited) and the year ended September 30 | 2023 | | | 2022 | | | 2021 | | | 2020 | | | 2019 | | | 2018 | |
| Net Asset Value, Beginning of Period | | $74.35 | | | $108.88 | | | $88.54 | | | $80.73 | | | $84.82 | | | $75.41 | |
| Income/(Loss) from Investment Operations: | | | | | | | | | | | | | | | | | | |
| | Net investment income/(loss)(1) | | 0.39 | | | 0.58 | | | 0.45 | | | 0.48 | | | 0.82 | | | 0.75 | |
| | Net realized and unrealized gain/(loss) | | 14.42 | | | (23.25) | | | 23.47 | | | 11.34 | | | (0.21) | | | 9.13 | |
| Total from Investment Operations | | 14.81 | | | (22.67) | | | 23.92 | | | 11.82 | | | 0.61 | | | 9.88 | |
| Less Dividends and Distributions: | | | | | | | | | | | | | | | | | | |
| | Dividends (from net investment income) | | (0.72) | | | (0.43) | | | (0.32) | | | (0.77) | | | (0.58) | | | (0.47) | |
| | Distributions (from capital gains) | | (2.78) | | | (11.43) | | | (3.26) | | | (3.24) | | | (4.12) | | | — | |
| Total Dividends and Distributions | | (3.50) | | | (11.86) | | | (3.58) | | | (4.01) | | | (4.70) | | | (0.47) | |
| Net Asset Value, End of Period | | $85.66 | | | $74.35 | | | $108.88 | | | $88.54 | | | $80.73 | | | $84.82 | |
| Total Return* | | 20.35% | | | (23.45)% | | | 27.55% | | | 14.96% | | | 1.67% | | | 13.16% | |
| Net Assets, End of Period (in thousands) | | $1,051,257 | | | $916,960 | | | $1,307,732 | | | $1,057,492 | | | $1,014,552 | | | $1,054,640 | |
| Average Net Assets for the Period (in thousands) | | $1,006,455 | | | $1,173,459 | | | $1,262,884 | | | $1,009,337 | | | $988,429 | | | $1,033,780 | |
| Ratios to Average Net Assets**: | | | | | | | | | | | | | | | | | | |
| | Ratio of Gross Expenses | | 0.83% | | | 0.86% | | | 0.97% | | | 0.99% | | | 0.93% | | | 0.79% | |
| | Ratio of Net Expenses (After Waivers and Expense Offsets) | | 0.81% | | | 0.84% | | | 0.96% | | | 0.99% | | | 0.92% | | | 0.78% | |
| | Ratio of Net Investment Income/(Loss) | | 0.95% | | | 0.62% | | | 0.44% | | | 0.59% | | | 1.05% | | | 0.93% | |
| Portfolio Turnover Rate | | 10% | | | 33% | | | 25% | | | 34% | | | 35% | | | 32% | |
| | | | | | | | | | | | | | | | | | | | | | |
| |
* Total return includes adjustments in accordance with generally accepted accounting principles required at the year or period end and are not annualized for periods of less than one full year. ** Annualized for periods of less than one full year. (1) Per share amounts are calculated based on average shares outstanding during the year or period. |
| | |
See Notes to Financial Statements. |
| |
Janus Investment Fund | 25 |
Janus Henderson Global Research Fund
Notes to Financial Statements (unaudited)
1. Organization and Significant Accounting Policies
Janus Henderson Global Research Fund (the “Fund”) is a series of Janus Investment Fund (the “Trust”), which is organized as a Massachusetts business trust and is registered under the Investment Company Act of 1940, as amended (the “1940 Act”), as an open-end management investment company, and therefore has applied the specialized accounting and reporting guidance in Financial Accounting Standards Board (“FASB”) Accounting Standards Codification (“ASC”) Topic 946. The Trust offers 40 funds, each of which offers multiple share classes, with differing investment objectives and policies. The Fund seeks long-term growth of capital. The Fund is classified as diversified, as defined in the 1940 Act. Janus Henderson Investors US LLC is the investment adviser (the “Adviser”) to the Fund.
The Fund offers multiple classes of shares in order to meet the needs of various types of investors. Each class represents an interest in the same portfolio of investments. Certain financial intermediaries may not offer all classes of shares.
Class A Shares are offered through financial intermediary platforms including, but not limited to, traditional brokerage platforms, mutual fund wrap fee programs, bank trust platforms, and retirement platforms.
Class C Shares are offered through financial intermediary platforms including, but not limited to, traditional brokerage platforms, mutual fund wrap fee programs, and bank trust platforms.
Class C Shares are closed to investments by new employer-sponsored retirement plans and existing employer-sponsored retirement plans are no longer able to make additional purchases or exchanges into Class C Shares.
The Fund currently implements an automatic conversion feature pursuant to which Class C Shares that have been held for eight years are automatically converted to Class A Shares without the imposition of any sales charge, fee or other charge. The conversion will generally occur no later than ten business days in the month following the month of the eighth anniversary of the date of purchase. Class C Shares purchased through the reinvestment of dividends and other distributions on Class C Shares will convert to Class A Shares at the same time as the original Class C Shares with respect to which they were purchased. For Class C Shares held in omnibus accounts on intermediary platforms, the Fund relies on these intermediaries to implement this conversion feature. Your financial intermediary may have separate policies and procedures as to when and how Class C Shares may be converted to Class A Shares.
Effective July 6, 2020, Class D Shares are available to new investors, subject to any closed fund policies for a Fund, as applicable. Previously, Class D Shares were only available to investors who already had a direct account with the Janus Henderson funds; immediate family members or members of the same household of an eligible individual investor; and existing beneficial owners of sole proprietorships or partnerships that hold accounts directly with the Janus Henderson funds.
Class I Shares are available through certain financial intermediary platforms including, but not limited to, mutual fund wrap fee programs, managed account programs, asset allocation programs, bank trust platforms, as well as certain retirement platforms. Class I Shares are also available to certain direct institutional investors including, but not limited to, corporations, certain retirement plans, public plans, and foundations/endowments, who established Class I Share accounts before August 4, 2017.
Class N Shares are generally available only to financial intermediaries purchasing on behalf of: 1) certain adviser-assisted, employer-sponsored retirement plans, including 401(k) plans, 457 plans, 403(b) plans, Taft-Hartley multi-employer plans, profit-sharing and money purchase pension plans, defined benefit plans and certain welfare benefit plans, such as health savings accounts, and nonqualified deferred compensation plans; and 2) retail investors purchasing in qualified or nonqualified accounts, whose accounts are held through an omnibus account at their financial intermediary, and where the financial intermediary requires no payment or reimbursement from the Fund, the Adviser, or its affiliates. Class N Shares are also available to Janus Henderson proprietary products and to certain direct institutional investors approved by Janus Henderson Distributors US LLC (the “Distributor”) including, but not limited to, corporations, certain retirement plans, public plans, and foundations and endowments, subject to minimum investment requirements.
Class R Shares are offered through financial intermediary platforms including, but not limited to, retirement platforms.
Janus Henderson Global Research Fund
Notes to Financial Statements (unaudited)
Class S Shares are offered through financial intermediary platforms including, but not limited to, retirement platforms and asset allocation, mutual fund wrap, or other discretionary or nondiscretionary fee-based investment advisory programs. In addition, Class S Shares may be available through certain financial intermediaries who have an agreement with the Adviser or its affiliates to offer Class S Shares on their supermarket platforms.
Class T Shares are available through certain financial intermediary platforms including, but not limited to, mutual fund wrap fee programs, managed account programs, asset allocation programs, bank trust platforms, as well as certain retirement platforms. In addition, Class T Shares may be available through certain financial intermediaries who have an agreement with the Adviser or its affiliates to offer Class T Shares on their supermarket platforms.
The following accounting policies have been followed by the Fund and are in conformity with US GAAP.
Investment Valuation
Fund holdings are valued in accordance with policies and procedures established by the Adviser pursuant to Rule 2a-5 under the 1940 Act and approved by and subject to the oversight of the Trustees (the “Valuation Procedures”). Equity securities traded on a domestic securities exchange are generally valued at readily available market quotations, which are (i) the official close prices or (ii) last sale prices on the primary market or exchange in which the securities trade. If such price is lacking for the trading period immediately preceding the time of determination, such securities are generally valued at their current bid price. Equity securities that are traded on a foreign exchange are generally valued at the closing prices on such markets. In the event that there is no current trading volume on a particular security in such foreign exchange, the bid price from the primary exchange is generally used to value the security. Foreign securities and currencies are converted to U.S. dollars using the current spot USD dollar exchange rate in effect at the close of the New York Stock Exchange (“NYSE”). The Fund will determine the market value of individual securities held by it by using prices provided by one or more approved professional pricing services or, as needed, by obtaining market quotations from independent broker-dealers. Most debt securities are valued in accordance with the evaluated bid price supplied by the Adviser-approved pricing service that is intended to reflect market value. The evaluated bid price supplied by the pricing service is an evaluation that may consider factors such as security prices, yields, maturities and ratings. Certain short-term securities maturing within 60 days or less may be evaluated and valued on an amortized cost basis provided that the amortized cost determined approximates market value. Securities for which market quotations or evaluated prices are not readily available or deemed unreliable are valued at fair value determined in good faith by the Adviser pursuant to the Valuation Procedures. Circumstances in which fair valuation may be utilized include, but are not limited to: (i) a significant event that may affect the securities of a single issuer, such as a merger, bankruptcy, or significant issuer-specific development; (ii) an event that may affect an entire market, such as a natural disaster or significant governmental action; (iii) a nonsignificant event such as a market closing early or not opening, or a security trading halt; and (iv) pricing of a nonvalued security and a restricted or nonpublic security. Special valuation considerations may apply with respect to “odd-lot” fixed-income transactions which, due to their small size, may receive evaluated prices by pricing services which reflect a large block trade and not what actually could be obtained for the odd-lot position. The valuation policies provide for the use of systematic fair valuation models provided by independent pricing services to value foreign equity securities in order to adjust for stale pricing, which may occur between the close of certain foreign exchanges and the close of the NYSE. The value of the securities of other mutual funds held by a Fund, if any, will be calculated using the NAV of such mutual funds.
Valuation Inputs Summary
FASB ASC 820, Fair Value Measurements and Disclosures (“ASC 820”), defines fair value, establishes a framework for measuring fair value, and expands disclosure requirements regarding fair value measurements. This standard emphasizes that fair value is a market-based measurement that should be determined based on the assumptions that market participants would use in pricing an asset or liability and establishes a hierarchy that prioritizes inputs to valuation techniques used to measure fair value. These inputs are summarized into three broad levels:
Level 1 – Unadjusted quoted prices in active markets the Fund has the ability to access for identical assets or liabilities.
Level 2 – Observable inputs other than unadjusted quoted prices included in Level 1 that are observable for the asset or liability either directly or indirectly. These inputs may include quoted prices for the identical instrument on an inactive market, prices for similar instruments, interest rates, prepayment speeds, credit risk, yield curves, default rates and similar data.
Janus Henderson Global Research Fund
Notes to Financial Statements (unaudited)
Assets or liabilities categorized as Level 2 in the hierarchy generally include: debt securities fair valued in accordance with the evaluated bid or ask prices supplied by a pricing service; securities traded on OTC markets and listed securities for which no sales are reported that are fair valued at the latest bid price (or yield equivalent thereof) obtained from one or more dealers transacting in a market for such securities or by a pricing service approved by the Fund’s Trustees; certain short-term debt securities with maturities of 60 days or less that are fair valued at amortized cost; and equity securities of foreign issuers whose fair value is determined by using systematic fair valuation models provided by independent third parties in order to adjust for stale pricing which may occur between the close of certain foreign exchanges and the close of the NYSE. Other securities that may be categorized as Level 2 in the hierarchy include, but are not limited to, preferred stocks, bank loans, swaps, investments in unregistered investment companies, options, and forward contracts.
Level 3 – Unobservable inputs for the asset or liability to the extent that relevant observable inputs are not available, representing the Fund’s own assumptions about the assumptions that a market participant would use in valuing the asset or liability, and that would be based on the best information available.
There have been no significant changes in valuation techniques used in valuing any such positions held by the Fund since the beginning of the fiscal period.
The inputs or methodology used for fair valuing securities are not necessarily an indication of the risk associated with investing in those securities. The summary of inputs used as of March 31, 2023 to fair value the Fund’s investments in securities and other financial instruments is included in the “Valuation Inputs Summary” in the Notes to Schedule of Investments and Other Information.
The Fund did not hold a significant amount of Level 3 securities as of March 31, 2023.
Investment Transactions and Investment Income
Investment transactions are accounted for as of the date purchased or sold (trade date). Dividend income is recorded on the ex-dividend date. Certain dividends from foreign securities will be recorded as soon as the Fund is informed of the dividend, if such information is obtained subsequent to the ex-dividend date. Dividends from foreign securities may be subject to withholding taxes in foreign jurisdictions. Non-cash dividends, if any, are recorded on the ex-dividend date at fair value. Interest income is recorded daily on an accrual basis and includes amortization of premiums and accretion of discounts. The Fund classifies gains and losses on prepayments received as an adjustment to interest income. Debt securities may be placed in non-accrual status and related interest income may be reduced by stopping current accruals and writing off interest receivables when collection of all or a portion of interest has become doubtful. Gains and losses are determined on the identified cost basis, which is the same basis used for federal income tax purposes. Income, as well as gains and losses, both realized and unrealized, are allocated daily to each class of shares based upon the ratio of net assets represented by each class as a percentage of total net assets.
Expenses
The Fund bears expenses incurred specifically on its behalf. Each class of shares bears a portion of general expenses, which are allocated daily to each class of shares based upon the ratio of net assets represented by each class as a percentage of total net assets. Expenses directly attributable to a specific class of shares are charged against the operations of such class.
Estimates
The preparation of financial statements in conformity with US GAAP requires management to make estimates and assumptions that affect the reported amount of assets and liabilities and disclosure of contingent assets and liabilities at the date of the financial statements, and the reported amounts of income and expenses during the reporting period. Actual results could differ from those estimates.
Indemnifications
In the normal course of business, the Fund may enter into contracts that contain provisions for indemnification of other parties against certain potential liabilities. The Fund’s maximum exposure under these arrangements is unknown, and would involve future claims that may be made against the Fund that have not yet occurred. Currently, the risk of material loss from such claims is considered remote.
Foreign Currency Translations
The Fund does not isolate that portion of the results of operations resulting from the effect of changes in foreign exchange rates on investments from the fluctuations arising from changes in market prices of securities held at the
Janus Henderson Global Research Fund
Notes to Financial Statements (unaudited)
date of the financial statements. Net unrealized appreciation or depreciation of investments and foreign currency translations arise from changes in the value of assets and liabilities, including investments in securities held at the date of the financial statements, resulting from changes in the exchange rates and changes in market prices of securities held.
Currency gains and losses are also calculated on payables and receivables that are denominated in foreign currencies. The payables and receivables are generally related to foreign security transactions and income translations.
Foreign currency-denominated assets and forward currency contracts may involve more risks than domestic transactions, including currency risk, counterparty risk, political and economic risk, regulatory risk and equity risk. Risks may arise from unanticipated movements in the value of foreign currencies relative to the U.S. dollar.
Dividends and Distributions
The Fund generally declares and distributes dividends of net investment income and realized capital gains (if any) annually. The Fund may treat a portion of the amount paid to redeem shares as a distribution of investment company taxable income and realized capital gains that are reflected in the net asset value. This practice, commonly referred to as “equalization,” has no effect on the redeeming shareholder or a Fund’s total return, but may reduce the amounts that would otherwise be required to be paid as taxable dividends to the remaining shareholders. It is possible that the Internal Revenue Service (IRS) could challenge the Fund's equalization methodology or calculations, and any such challenge could result in additional tax, interest, or penalties to be paid by the Fund.
The Fund may make certain investments in real estate investment trusts (“REITs”) which pay dividends to their shareholders based upon funds available from operations. It is quite common for these dividends to exceed the REITs’ taxable earnings and profits, resulting in the excess portion of such dividends being designated as a return of capital. If the Fund distributes such amounts, such distributions could constitute a return of capital to shareholders for federal income tax purposes.
Federal Income Taxes
The Fund intends to continue to qualify as a regulated investment company and distribute all of its taxable income in accordance with the requirements of Subchapter M of the Internal Revenue Code. Management has analyzed the Fund’s tax positions taken for all open federal income tax years, generally a three-year period, and has concluded that no provision for federal income tax is required in the Fund’s financial statements. The Fund is not aware of any tax positions for which it is reasonably possible that the total amounts of unrecognized tax benefits will significantly change in the next twelve months.
2. Other Investments and Strategies
Additional Investment Risk
The U.S. government and the Federal Reserve, as well as certain foreign governments and central banks, have taken extraordinary actions to support local and global economies and the financial markets in response to the COVID-19 pandemic. This and other government intervention into the economy and financial markets to address the COVID-19 pandemic may not work as intended, particularly if the efforts are perceived by investors as being unlikely to achieve the desired results. Government actions to mitigate the economic impact of the pandemic have resulted in a large expansion of government deficits and debt, the long term consequences of which are not known. The COVID-19 pandemic could adversely affect the value and liquidity of a Fund’s investments, impair a Fund’s ability to satisfy redemption requests, and negatively impact a Fund’s performance. In addition, the outbreak of COVID-19, and measures taken to mitigate its effects, could result in disruptions to the services provided to a Fund by its service providers.
Widespread disease, including pandemics and epidemics, and natural or environmental disasters, including those which may be attributable to global climate change, such as earthquakes, fires, floods, hurricanes, tsunamis and weather-related phenomena generally, have been and can be highly disruptive to economies and markets, adversely impacting individual companies, sectors, industries, markets, currencies, interest and inflation rates, credit ratings, investor sentiment, and other factors affecting the value of a Fund’s investments. Economies and financial markets throughout the world have become increasingly interconnected, which increases the likelihood that events or conditions in one region or country will adversely affect markets or issuers in other regions or countries, including the United States. These disruptions could prevent a Fund from executing advantageous investment decisions in a timely manner and negatively impact a Fund’s ability to achieve its investment objective(s). Any such event(s) could have a significant
Janus Henderson Global Research Fund
Notes to Financial Statements (unaudited)
adverse impact on the value of a Fund. In addition, these disruptions could also impair the information technology and other operational systems upon which the Fund’s service providers, including the Adviser or the subadviser (as applicable), rely, and could otherwise disrupt the ability of employees of the Fund’s service providers to perform essential tasks on behalf of the Fund. Adverse weather conditions may also have a particularly significant negative effect on issuers in the agricultural sector and on insurance and reinsurance companies that insure or reinsure against the impact of natural disasters.
A number of countries in the European Union (the “EU”) have experienced, and may continue to experience, severe economic and financial difficulties. In particular, many EU nations are susceptible to economic risks associated with high levels of debt. Many non-governmental issuers, and even certain governments, have defaulted on, or been forced to restructure, their debts. Many other issuers have faced difficulties obtaining credit or refinancing existing obligations. Financial institutions have in many cases required government or central bank support, have needed to raise capital, and/or have been impaired in their ability to extend credit. As a result, financial markets in the EU have experienced extreme volatility and declines in asset values and liquidity. These difficulties may continue, worsen, or spread further within the EU. Responses to these financial problems by European governments, central banks, and others, including austerity measures and reforms, may not work, may result in social unrest, and may limit future growth and economic recovery or have other unintended consequences. Among other things, these developments have adversely affected the value and exchange rate of the euro and pound sterling, and may continue to significantly affect the economies of all EU countries, which in turn may have a material adverse effect on the Fund’s investments in such countries, other countries that depend on EU countries for significant amounts of trade or investment, or issuers with exposure to debt issued by certain EU countries.
Real Estate Investing
The Fund may invest in equity and debt securities of real estate-related companies. Such companies may include those in the real estate industry or real estate-related industries. These securities may include common stocks, corporate bonds, preferred stocks, and other equity securities, including, but not limited to, mortgage-backed securities, real estate-backed securities, securities of REITs and similar REIT-like entities. A REIT is a trust that invests in real estate-related projects, such as properties, mortgage loans, and construction loans. REITs are generally categorized as equity, mortgage, or hybrid REITs. A REIT may be listed on an exchange or traded OTC.
Restricted Security Transactions
Restricted securities held by the Fund may not be sold except in exempt transactions or in a public offering registered under the Securities Act of 1933, as amended. The risk of investing in such securities is generally greater than the risk of investing in the securities of widely held, publicly traded companies. Lack of a secondary market and resale restrictions may result in the inability of the Fund to sell a security at a fair price and may substantially delay the sale of the security. In addition, these securities may exhibit greater price volatility than securities for which secondary markets exist.
Counterparties
Fund transactions involving a counterparty are subject to the risk that the counterparty or a third party will not fulfill its obligation to the Fund (“counterparty risk”). Counterparty risk may arise because of the counterparty’s financial condition (i.e., financial difficulties, bankruptcy, or insolvency), market activities and developments, or other reasons, whether foreseen or not. A counterparty’s inability to fulfill its obligation may result in significant financial loss to the Fund. The Fund may be unable to recover its investment from the counterparty or may obtain a limited recovery, and/or recovery may be delayed. The extent of the Fund’s exposure to counterparty risk with respect to financial assets and liabilities approximates its carrying value.
The Fund may be exposed to counterparty risk through participation in various programs, including, but not limited to, lending its securities to third parties, cash sweep arrangements whereby the Fund’s cash balance is invested in one or more types of cash management vehicles, as well as investments in, but not limited to, repurchase agreements, debt securities, and derivatives, including various types of swaps, futures and options. The Fund intends to enter into financial transactions with counterparties that the Adviser believes to be creditworthy at the time of the transaction. There is always the risk that the Adviser’s analysis of a counterparty’s creditworthiness is incorrect or may change due to market conditions. To the extent that the Fund focuses its transactions with a limited number of counterparties, it will have greater exposure to the risks associated with one or more counterparties.
Janus Henderson Global Research Fund
Notes to Financial Statements (unaudited)
Securities Lending
Under procedures adopted by the Trustees, the Fund may seek to earn additional income by lending securities to certain qualified broker-dealers and institutions. JPMorgan Chase Bank, National Association acts as securities lending agent and a limited purpose custodian or subcustodian to receive and disburse cash balances and cash collateral, hold short-term investments, hold collateral, and perform other custodial functions in accordance with the Non-Custodial Securities Lending Agreement. For financial reporting purposes, the Fund does not offset financial instruments’ payables and receivables and related collateral on the Statement of Assets and Liabilities. The Fund may lend fund securities in an amount equal to up to 1/3 of its total assets as determined at the time of the loan origination. There is the risk of delay in recovering a loaned security or the risk of loss in collateral rights if the borrower fails financially. In addition, the Adviser makes efforts to balance the benefits and risks from granting such loans. All loans will be continuously secured by collateral which may consist of cash, U.S. Government securities, domestic and foreign short-term debt instruments, letters of credit, time deposits, repurchase agreements, money market mutual funds or other money market accounts, or such other collateral as permitted by the SEC. If the Fund is unable to recover a security on loan, the Fund may use the collateral to purchase replacement securities in the market. There is a risk that the value of the collateral could decrease below the cost of the replacement security by the time the replacement investment is made, resulting in a loss to the Fund. In certain circumstances individual loan transactions could yield negative returns.
Upon receipt of cash collateral, the Adviser may invest it in affiliated or non-affiliated cash management vehicles, whether registered or unregistered entities, as permitted by the 1940 Act and rules promulgated thereunder. The Adviser currently intends to primarily invest the cash collateral in a cash management vehicle for which the Adviser serves as investment adviser, Janus Henderson Cash Collateral Fund LLC, or in time deposits. An investment in Janus Henderson Cash Collateral Fund LLC is generally subject to the same risks that shareholders experience when investing in similarly structured vehicles, such as the potential for significant fluctuations in assets as a result of the purchase and redemption activity of the securities lending program, a decline in the value of the collateral, and possible liquidity issues. Such risks may delay the return of the cash collateral and cause the Fund to violate its agreement to return the cash collateral to a borrower in a timely manner. As adviser to the Fund and Janus Henderson Cash Collateral Fund LLC, the Adviser has an inherent conflict of interest as a result of its fiduciary duties to both the Fund and Janus Henderson Cash Collateral Fund LLC. Additionally, the Adviser receives an investment advisory fee of 0.05% for managing Janus Henderson Cash Collateral Fund LLC, but it may not receive a fee for managing certain other affiliated cash management vehicles in which the Fund may invest, and therefore may have an incentive to allocate preferred investment opportunities to investment vehicles for which it is receiving a fee.
The value of the collateral must be at least 102% of the market value of the loaned securities that are denominated in U.S. dollars and 105% of the market value of the loaned securities that are not denominated in U.S. dollars. Loaned securities and related collateral are marked-to-market each business day based upon the market value of the loaned securities at the close of business, employing the most recent available pricing information. Collateral levels are then adjusted based on this mark-to-market evaluation. Additional required collateral, or excess collateral returned, is delivered on the next business day. Therefore, the value of the collateral held may be temporarily less than 102% or 105% value of the securities on loan. The cash collateral invested by the Adviser is disclosed in the Schedule of Investments (if applicable).
Income earned from the investment of the cash collateral, net of rebates paid to, or fees paid by, borrowers and less the fees paid to the lending agent are included as “Affiliated securities lending income, net” on the Statement of Operations. As of March 31, 2023, securities lending transactions accounted for as secured borrowings with an overnight and continuous contractual maturity are $14,676,793. Gross amounts of recognized liabilities for securities lending (collateral received) as of March 31, 2023 is $15,288,000, resulting in the net amount due to the counterparty of $611,207.
Offsetting Assets and Liabilities
The Fund presents gross and net information about transactions that are either offset in the financial statements or subject to an enforceable master netting arrangement or similar agreement with a designated counterparty, regardless of whether the transactions are actually offset in the Statement of Assets and Liabilities.
The Offsetting Assets and Liabilities table located in the Schedule of Investments presents gross amounts of recognized assets and/or liabilities and the net amounts after deducting collateral that has been pledged by counterparties or has been pledged to counterparties (if applicable). For corresponding information grouped by type of instrument, see the Fund's Schedule of Investments.
Janus Henderson Global Research Fund
Notes to Financial Statements (unaudited)
3. Investment Advisory Agreements and Other Transactions with Affiliates
The Fund pays the Adviser an investment advisory fee rate that may adjust up or down based on the Fund’s performance relative to its benchmark index.
The investment advisory fee rate paid to the Adviser by the Fund consists of two components: (1) a base fee calculated by applying the contractual fixed rate of the advisory fee to the Fund’s average daily net assets during the previous month (the “Base Fee Rate”), plus or minus (2) a performance-fee adjustment (the “Performance Adjustment”) calculated by applying a variable rate of up to 0.15% (positive or negative) to the Fund’s average daily net assets based on the Fund’s relative performance compared to the cumulative investment record of its benchmark index over a 36-month performance measurement period or shorter time period, as applicable. The investment advisory fee rate is calculated daily and paid monthly.
The investment performance of the Fund’s Class A Shares (waiving the upfront sales load) for the performance measurement period is used to calculate the Performance Adjustment. The Fund’s Base Fee Rate prior to any performance adjustment (expressed as an annual rate) is 0.60%, and the Fund’s benchmark index used in the calculation is the MSCI World IndexSM.
No Performance Adjustment is applied unless the difference between the Fund’s investment performance and the cumulative investment record of the Fund’s benchmark index is 0.50% or greater (positive or negative) during the applicable performance measurement period. The Base Fee Rate is subject to an upward or downward Performance Adjustment for every full 0.50% increment by which the Fund outperforms or underperforms its benchmark index, up to the Fund’s full performance rate of ±6.00%. Because the Performance Adjustment is tied to a Fund’s relative performance compared to its benchmark index (and not its absolute performance), the Performance Adjustment could increase the Adviser’s fee even if the Fund’s Shares lose value during the performance measurement period and could decrease the Adviser’s fee even if the Fund’s Shares increase in value during the performance measurement period. For purposes of computing the Base Fee Rate and the Performance Adjustment, net assets are averaged over different periods (average daily net assets during the previous month for the Base Fee Rate, versus average daily net assets during the performance measurement period for the Performance Adjustment). Performance of the Fund is calculated net of expenses whereas the Fund’s benchmark index does not have any fees or expenses. Reinvestment of dividends and distributions is included in calculating both the performance of a Fund and the Fund’s benchmark index.
The Fund’s prospectuses and statement(s) of additional information contain additional information about performance-based fees. The amount shown as advisory fees on the Statement of Operations reflects the Base Fee Rate plus/minus any Performance Adjustment. For the period ended March 31, 2023, the performance adjusted investment advisory fee rate before any waivers and/or reimbursements of expenses is 0.54%.
The Adviser has contractually agreed to waive the investment advisory fee and/or reimburse operating expenses to the extent that the Fund’s total annual fund operating expenses, excluding any performance adjustments to management fees (if applicable), the fees payable pursuant to a Rule 12b-1 plan, shareholder servicing fees, such as transfer agency fees (including out-of-pocket costs), administrative services fees and any networking/omnibus payable by any share class, brokerage commissions, interest, dividends, taxes, acquired fund fees and expenses, and extraordinary expenses, exceed the annual rate of 0.86% of the Fund’s average daily net assets. The Adviser has agreed to continue the waivers for at least a one-year period commencing January 27, 2023. If applicable, amounts waived and/or reimbursed to the Fund by the Adviser are disclosed as “Excess Expense Reimbursement and Waivers” on the Statement of Operations.
The Adviser serves as administrator to the Fund pursuant to an administration agreement between the Adviser and the Trust. Under the administration agreement, the Adviser is authorized to perform, or cause others to perform certain administration, compliance, and accounting services to the Fund, including providing office space for the Fund, and is reimbursed by the Fund for certain of its costs in providing these services (to the extent the Adviser seeks reimbursement and such costs are not otherwise waived). In addition, employees of the Adviser and/or its affiliates may serve as officers of the Trust. The Fund pays for some or all of the salaries, fees, and expenses of the Adviser employees and Fund officers, with respect to certain specified administration functions they perform on behalf of the Fund. The Fund pays these costs based on out-of-pocket expenses incurred by the Adviser, and these costs are separate and apart from advisory fees and other expenses paid in connection with the investment advisory services the Adviser (or any subadvisor, as applicable) provides to the Fund. These amounts are disclosed as “Affiliated fund administration fees” on the Statement of Operations. In addition, some expenses related to compensation payable to the
Janus Henderson Global Research Fund
Notes to Financial Statements (unaudited)
Fund’s Chief Compliance Officer and certain compliance staff, all of whom are employees of the Adviser and/or its affiliates, are shared with the Fund. Total compensation of $114,430 was paid to the Chief Compliance Officer and certain compliance staff by the Trust during the period ended March 31, 2023. The Fund's portion is reported as part of “Other expenses” on the Statement of Operations.
Janus Henderson Services US LLC (the “Transfer Agent”), a wholly-owned subsidiary of the Adviser, is the Fund’s transfer agent. The Transfer Agent provides or arranges for the provision of shareholder services including, but not limited to, recordkeeping, subaccounting, answering inquiries regarding accounts, order processing, transaction confirmations, the mailing of prospectuses and shareholder reports, and other shareholder services provided to or on behalf of shareholders. These amounts are disclosed as “Transfer agent administrative fees and expenses” on the Statement of Operations.
Class D Shares of the Fund pay the Transfer Agent an annual administrative services fee based on the average daily net assets of Class D Shares as detailed below.
| | |
Average Daily Net Assets of Class D Shares of the Janus Henderson funds | Administrative Services Fee |
Under $40 billion | 0.12% |
$40 billion – $49.9 billion | 0.10% |
Over $49.9 billion | 0.08% |
During the reporting period, the administrative services fee rate was 0.12%.
The Transfer Agent receives an administrative services fee at an annual rate of up to 0.25% of the average daily net assets of the Fund’s Class R Shares, Class S Shares, and Class T Shares for providing or procuring administrative services to investors in Class R Shares, Class S Shares, and Class T Shares of the Fund. The Transfer Agent expects to use all or a significant portion of this fee to compensate retirement plan service providers, broker-dealers, bank trust departments, financial advisors, and other financial intermediaries for providing these services. The Transfer Agent may keep certain amounts retained for reimbursement of out-of-pocket costs incurred for servicing clients of Class R Shares, Class S Shares, and Class T Shares.
Shareholder Services provided by these financial intermediaries may include, but are not limited to, recordkeeping, subaccounting, order processing, providing order confirmations, periodic statements, forwarding prospectuses, shareholder reports, and other materials to existing customers, answering inquiries regarding accounts, and other administrative services. Order processing includes the submission of transactions through the National Securities Clearing Corporation (“NSCC”) or similar systems, or those processed on a manual basis with the Adviser. For all share classes, the Transfer Agent also seeks reimbursement for costs it incurs as transfer agent and for providing servicing.
Certain, but not all, intermediaries may charge administrative fees to investors in Class A Shares, Class C Shares, and Class I Shares for administrative services provided on behalf of such investors. These administrative fees are paid by the Class A Shares, Class C Shares, and Class I Shares of the Fund to the Transfer Agent, which uses such fees to reimburse intermediaries. Consistent with the Transfer Agency Agreement between the Transfer Agent and the Fund, the Transfer Agent may negotiate the level, structure, and/or terms of the administrative fees with intermediaries requiring such fees on behalf of the Fund. The Adviser and its affiliates benefit from an increase in assets that may result from such relationships. The Adviser has agreed to limit these fees up to 0.20% for Class A Shares and Class C Shares, and up to 0.15% for Class I Shares on an annual basis based on the daily net assets of each share class. Such limits are subject to change by the Trustees in the future. These amounts are disclosed as “Transfer agent networking and omnibus fees” on the Statement of Operations.
The Transfer Agent is not compensated for its services related to the shares, except for out-of-pocket costs, although the Transfer Agent is compensated for its services related to Fund’s Class D Shares. These amounts are disclosed as “Other transfer agent fees and expenses” on the Statement of Operations.
Under distribution and shareholder servicing plans (the “Plans”) adopted in accordance with Rule 12b-1 under the 1940 Act, the Fund pays the Trust’s distributor, the Distributor, a wholly-owned subsidiary of the Adviser, a fee for the sale and distribution and/or shareholder servicing of the shares based on the average daily net assets for each share class at an annual rate of up to 0.25% for Class A Shares, up to 1.00% for Class C Shares, of up to 0.50% of the Class R Shares' average daily net assets, and up to 0.25% for Class S Shares. Under the terms of the Plans, the Trust is authorized to make payments to the Distributor for remittance to retirement plan service providers, broker-dealers, bank
Janus Henderson Global Research Fund
Notes to Financial Statements (unaudited)
trust departments, financial advisors, and other financial intermediaries, as compensation for distribution and/or shareholder services performed by such entities for their customers who are investors in the Fund. These amounts are disclosed as “12b-1 Distribution and shareholder servicing fees” on the Statement of Operations.
Class A Shares include a 5.75% upfront sales charge of the offering price of the Fund. The sales charge is allocated between the Distributor and financial intermediaries. During the period ended March 31, 2023, the Distributor retained upfront sales charges of $252.
A contingent deferred sales charge (“CDSC”) of 1.00% will be deducted with respect to Class A Shares purchased without a sales load and redeemed within 12 months of purchase, unless waived. Any applicable CDSC will be 1.00% of the lesser of the original purchase price or the value of the redemption of the Class A Shares redeemed. There were no CDSCs paid by redeeming shareholders of Class A Shares to the Distributor during the period ended March 31, 2023.
A CDSC of 1.00% will be deducted with respect to Class C Shares redeemed within 12 months of purchase, unless waived. Any applicable CDSC will be 1.00% of the lesser of the original purchase price or the value of the redemption of the Class C Shares redeemed. During the period ended March 31, 2023, redeeming shareholders of Class C Shares paid CDSCs of $11.
The Board of Trustees has adopted a deferred compensation plan (the “Deferred Plan”) for independent Trustees to elect to defer receipt of all or a portion of the annual compensation they are entitled to receive from the Fund. All deferred fees are credited to an account established in the name of the Trustees. The amounts credited to the account then increase or decrease, as the case may be, in accordance with the performance of one or more of the Janus Henderson funds that are selected by the Trustees. The account balance continues to fluctuate in accordance with the performance of the selected fund or funds until final payment of all amounts are credited to the account. The fluctuation of the account balance is recorded by the Fund as unrealized appreciation/(depreciation) and is included as of March 31, 2023 on the Statement of Assets and Liabilities in the asset, “Trustees’ deferred compensation,” and liability, “Trustees’ deferred compensation fees.” Additionally, the recorded unrealized appreciation/(depreciation) is included in “Total distributable earnings (loss)” on the Statement of Assets and Liabilities. Deferred compensation expenses for the period ended March 31, 2023 are included in “Trustees’ fees and expenses” on the Statement of Operations. Trustees are allowed to change their designation of mutual funds from time to time. Amounts will be deferred until distributed in accordance with the Deferred Plan. Deferred fees of $205,688 were paid by the Trust to the Trustees under the Deferred Plan during the period ended March 31, 2023.
Pursuant to the provisions of the 1940 Act and related rules, the Fund may participate in an affiliated or non-affiliated cash sweep program. In the cash sweep program, uninvested cash balances of the Fund may be used to purchase shares of affiliated or non-affiliated money market funds or cash management pooled investment vehicles that operate as money market funds. The Fund is eligible to participate in the cash sweep program (the “Investing Funds”). The Adviser has an inherent conflict of interest because of its fiduciary duties to the affiliated money market funds or cash management pooled investment vehicles and the Investing Funds. Janus Henderson Cash Liquidity Fund LLC (the “Sweep Vehicle”) is an affiliated unregistered cash management pooled investment vehicle that invests primarily in highly-rated short-term fixed-income securities. The Sweep Vehicle operates pursuant to the provisions of the 1940 Act that govern the operation of money market funds and prices its shares at NAV reflecting market-based values of its portfolio securities (i.e., a “floating” NAV) rounded to the fourth decimal place (e.g., $1.0000). The Sweep Vehicle is permitted to impose a liquidity fee (of up to 2%) on redemptions from the Sweep Vehicle or a redemption gate that temporarily suspends redemptions from the Sweep Vehicle for up to 10 business days during a 90 day period. There are no restrictions on the Fund's ability to withdraw investments from the Sweep Vehicle at will, and there are no unfunded capital commitments due from the Fund to the Sweep Vehicle. The Sweep Vehicle does not charge any management fee, sales charge or service fee.
Any purchases and sales, realized gains/losses and recorded dividends from affiliated investments during the period ended March 31, 2023 can be found in the “Schedules of Affiliated Investments” located in the Schedule of Investments.
Janus Henderson Global Research Fund
Notes to Financial Statements (unaudited)
As of March 31, 2023, shares of the Fund were owned by affiliates of the Adviser, and/or other funds advised by the Adviser, as indicated in the table below:
| | | | | | |
Class | % of Class Owned | | % of Fund Owned | | |
Class A Shares | - | % | - | % | |
Class C Shares | - | | - | | |
Class D Shares | - | | - | | |
Class I Shares | - | | - | | |
Class N Shares | 47 | | 1 | | |
Class R Shares | - | | - | | |
Class S Shares | - | | - | | |
Class T Shares | - | | - | | |
| | | | | | |
4. Federal Income Tax
Income and capital gains distributions are determined in accordance with income tax regulations that may differ from US GAAP. These differences are due to differing treatments for items such as net short-term gains, deferral of wash sale losses, foreign currency transactions, net investment losses, and capital loss carryovers.
The Fund has elected to treat gains and losses on forward foreign currency contracts as capital gains and losses, if applicable. Other foreign currency gains and losses on debt instruments are treated as ordinary income for federal income tax purposes pursuant to Section 988 of the Internal Revenue Code.
The aggregate cost of investments and the composition of unrealized appreciation and depreciation of investment securities for federal income tax purposes as of March 31, 2023 are noted below. The primary difference between book and tax appreciation or depreciation of investments are wash sale loss deferrals and investments in partnerships.
| | | | |
Federal Tax Cost | Unrealized
Appreciation | Unrealized
(Depreciation) | Net Tax Appreciation/
(Depreciation) |
$2,071,305,360 | $954,493,411 | $(104,396,573) | $ 850,096,838 |
Janus Henderson Global Research Fund
Notes to Financial Statements (unaudited)
5. Capital Share Transactions
| | | | | | | |
| | | | | | |
| | Period ended March 31, 2023 | | Year ended September 30, 2022 |
| | Shares | Amount | | Shares | Amount |
| | | | | | | |
Class A Shares: | | | | | |
Shares sold | 7,556 | $ 620,417 | | 53,979 | $ 5,198,977 |
Reinvested dividends and distributions | 7,278 | 580,764 | | 18,870 | 1,879,233 |
Shares repurchased | (37,140) | (3,044,621) | | (65,698) | (6,400,008) |
Net Increase/(Decrease) | (22,306) | $ (1,843,440) | | 7,151 | $ 678,202 |
Class C Shares: | | | | | |
Shares sold | 2,687 | $ 216,875 | | 4,028 | $ 377,090 |
Reinvested dividends and distributions | 1,365 | 104,747 | | 4,695 | 450,451 |
Shares repurchased | (7,566) | (600,888) | | (9,756) | (859,914) |
Net Increase/(Decrease) | (3,514) | $ (279,266) | | (1,033) | $ (32,373) |
Class D Shares: | | | | | |
Shares sold | 167,118 | $13,685,487 | | 304,275 | $ 28,952,846 |
Reinvested dividends and distributions | 820,842 | 64,493,576 | | 2,058,031 | 202,078,044 |
Shares repurchased | (714,153) | (58,826,930) | | (1,204,742) | (114,085,335) |
Net Increase/(Decrease) | 273,807 | $19,352,133 | | 1,157,564 | $116,945,555 |
Class I Shares: | | | | | |
Shares sold | 122,947 | $10,266,895 | | 235,153 | $ 23,460,934 |
Reinvested dividends and distributions | 57,162 | 4,578,707 | | 146,533 | 14,654,763 |
Shares repurchased | (181,223) | (15,160,572) | | (372,248) | (37,345,516) |
Net Increase/(Decrease) | (1,114) | $ (314,970) | | 9,438 | $ 770,181 |
Class N Shares: | | | | | |
Shares sold | 32,944 | $ 2,736,964 | | 78,556 | $ 7,013,474 |
Reinvested dividends and distributions | 19,261 | 1,509,705 | | 42,847 | 4,197,755 |
Shares repurchased | (33,492) | (2,719,706) | | (106,433) | (10,862,885) |
Net Increase/(Decrease) | 18,713 | $ 1,526,963 | | 14,970 | $ 348,344 |
Class R Shares: | | | | | |
Shares sold | 6,965 | $ 561,305 | | 30,052 | $ 2,853,871 |
Reinvested dividends and distributions | 4,237 | 332,948 | | 10,544 | 1,035,016 |
Shares repurchased | (37,026) | (3,059,236) | | (20,573) | (1,967,985) |
Net Increase/(Decrease) | (25,824) | $ (2,164,983) | | 20,023 | $ 1,920,902 |
Class S Shares: | | | | | |
Shares sold | 14,219 | $ 1,188,212 | | 35,285 | $ 3,371,394 |
Reinvested dividends and distributions | 7,276 | 582,768 | | 21,077 | 2,105,395 |
Shares repurchased | (20,915) | (1,742,823) | | (88,978) | (9,184,837) |
Net Increase/(Decrease) | 580 | $ 28,157 | | (32,616) | $ (3,708,048) |
Class T Shares: | | | | | |
Shares sold | 315,966 | $26,098,668 | | 588,800 | $ 55,748,125 |
Reinvested dividends and distributions | 527,928 | 41,431,792 | | 1,390,985 | 136,386,095 |
Shares repurchased | (904,560) | (73,631,033) | | (1,657,212) | (158,831,749) |
Net Increase/(Decrease) | (60,666) | $ (6,100,573) | | 322,573 | $ 33,302,471 |
6. Purchases and Sales of Investment Securities
For the period ended March 31, 2023, the aggregate cost of purchases and proceeds from sales of investment securities (excluding any short-term securities, short-term options contracts, TBAs, and in-kind transactions, as applicable) was as follows:
| | | | |
Purchases of
Securities | Proceeds from Sales
of Securities | Purchases of Long-
Term U.S. Government
Obligations | Proceeds from Sales
of Long-Term U.S.
Government Obligations |
$279,659,025 | $380,417,466 | $ - | $ - |
Janus Henderson Global Research Fund
Notes to Financial Statements (unaudited)
7. Recent Accounting Pronouncements
The FASB issued Accounting Standards Update 2022-03: Fair Value Measurement of Equity Securities Subject to Contractual Sale Restrictions (“ASU 2022-03”) in June 2022. The new guidance in the ASU clarifies existing guidance in ASC 820 related to the fair value measurement of an equity security subject to contractual sale restrictions with the intent to reduce diversity in interpretation. Under the guidance, a contractual restriction on the sale of an equity security would not be considered when measuring fair value as such restriction is not treated as part of the equity security’s unit of account. The amendments would be applied prospectively on or after adoption date to equity securities with a contract containing a sale restriction that is executed or modified after such date. The effective date set by the FASB is December 15, 2023, with early adoption permitted. The Adviser is currently evaluating whether to early adopt and does not anticipate it to have a material impact on the Fund.
8. Subsequent Event
Management has evaluated whether any events or transactions occurred subsequent to March 31, 2023 and through the date of issuance of the Fund’s financial statements and determined that there were no material events or transactions that would require recognition or disclosure in the Fund’s financial statements.
Janus Henderson Global Research Fund
Additional Information (unaudited)
Proxy Voting Policies and Voting Record
A description of the policies and procedures that the Fund uses to determine how to vote proxies relating to its portfolio securities is available without charge: (i) upon request, by calling 1-800-525-1093; (ii) on the Fund’s website at janushenderson.com/proxyvoting; and (iii) on the SEC’s website at http://www.sec.gov. Additionally, information regarding the Fund’s proxy voting record for the most recent twelve-month period ended June 30 is also available, free of charge, through janushenderson.com/proxyvoting and from the SEC’s website at http://www.sec.gov.
Full Holdings
The Fund files its complete portfolio holdings (schedule of investments) with the SEC as an exhibit to Form N-PORT within 60 days of the end of the first and third fiscal quarters, and in the annual report and semiannual report to shareholders. The Fund’s Form N-PORT filings and annual and semiannual reports: (i) are available on the SEC’s website at http://www.sec.gov; and (ii) are available without charge, upon request, by calling a Janus Henderson representative at 1-877-335-2687 (toll free) (or 1-800-525-3713 if you hold Class D Shares). Portfolio holdings consisting of at least the names of the holdings are generally available on a monthly basis with a 30-day lag under Full Holdings for the Fund at janushenderson.com/info (or janushenderson.com/reports if you hold Class D Shares).
APPROVAL OF ADVISORY AGREEMENTS DURING THE PERIOD
The Trustees of Janus Aspen Series, each of whom serves as an “independent” Trustee (the “Trustees”), oversee the management of each portfolio of Janus Aspen Series (each, a “VIT Portfolio,” and collectively, the “VIT Portfolios”), as well as each fund of Janus Investment Fund (each, a “Fund,” and collectively, the “Funds” and together with the VIT Portfolios, the “Janus Henderson Funds,” and each, a “Janus Henderson Fund”). As required by law, the Trustees determine annually whether to continue the investment advisory agreement for each Janus Henderson Fund.
In connection with their most recent consideration of those agreements for each Janus Henderson Fund, the Trustees received and reviewed information provided by Janus Henderson Investors US LLC (the “Adviser”) in response to requests of the Trustees and their independent legal counsel. They also received and reviewed information and analysis provided by, and in response to requests of, their independent fee consultant. Throughout their consideration of the agreements, the Trustees were advised by their independent legal counsel. The Trustees met with management to consider the agreements, and also met separately in executive session with their independent legal counsel and their independent fee consultant.
At meetings held on November 9-10, 2022 and December 13-14, 2022, the Trustees evaluated the information provided by the Adviser and the independent fee consultant, as well as other information provided by the Adviser and the independent fee consultant during the year. Following such evaluation, the Trustees determined that the overall arrangements between each Janus Henderson Fund and the Adviser were fair and reasonable in light of the nature, extent, and quality of the services provided by the Adviser and its affiliates, the fees charged for those services, and other matters that the Trustees considered relevant in the exercise of their business judgment, and unanimously approved the continuation of the investment advisory agreement for each Janus Henderson Fund for the period from February 1, 2023 through February 1, 2024, subject to earlier termination as provided for in each agreement.
In considering the continuation of those agreements, the Trustees reviewed and analyzed various factors that they determined were relevant, including the factors described below, none of which by itself was considered dispositive. However, the material factors and conclusions that formed the basis for the Trustees’ determination to approve the continuation of the agreements are discussed separately below. Also included is a summary of the independent fee consultant’s conclusions and opinions that arose during, and were included as part of, the Trustees’ consideration of the agreements. “Management fees,” as used herein, reflect actual annual advisory fees and, for the purpose of peer comparisons any administration fees (excluding out of pocket costs), net of any waivers, paid by a fund as a percentage of average net assets.
Nature, Extent and Quality of Services
The Trustees reviewed the nature, extent, and quality of the services provided by the Adviser to the Janus Henderson Funds, taking into account the investment objective, strategies, and policies of each Janus Henderson Fund, and the knowledge the Trustees gained from their regular meetings with management on at least a quarterly basis and their ongoing review of information related to the Janus Henderson Funds. In addition, the Trustees reviewed the resources and key personnel of the Adviser, particularly noting those employees who provide investment and risk management services to the Janus Henderson Funds. The Trustees also considered other services provided to the Janus Henderson
Janus Henderson Global Research Fund
Additional Information (unaudited)
Funds by the Adviser, such as managing the execution of portfolio transactions and the selection of broker-dealers for those transactions. The Trustees considered the Adviser’s role as administrator to the Janus Henderson Funds, noting that the Adviser generally does not receive a fee for its services as administrator, but is reimbursed for its out-of-pocket costs. The Trustees considered the role of the Adviser in monitoring adherence to the Janus Henderson Funds’ investment restrictions, providing support services for the Trustees and Trustee committees, and overseeing communications with Janus Henderson Fund shareholders and the activities of other service providers, including monitoring compliance with various policies and procedures of the Janus Henderson Funds and with applicable securities laws and regulations.
In this regard, the independent fee consultant noted that the Adviser provides a number of different services for the Janus Henderson Funds and their shareholders, ranging from investment management services to various other servicing functions, and that, in its view, the Adviser is a capable provider of those services. The independent fee consultant also provided its belief that the Adviser has developed a number of institutional competitive advantages that should enable it to provide superior investment and service performance over the long term.
The Trustees concluded that the nature, extent, and quality of the services provided by the Adviser to each Janus Henderson Fund were appropriate and consistent with the terms of the respective advisory agreements, and that, taking into account steps taken to address those Janus Henderson Funds whose performance lagged that of their peers for certain periods, the Janus Henderson Funds were likely to benefit from the continued provision of those services. They also concluded that the Adviser had sufficient personnel, with the appropriate education and experience, to serve the Janus Henderson Funds effectively and had demonstrated its ability to attract well-qualified personnel.
Performance of the Funds
The Trustees considered the performance results of each Janus Henderson Fund over various time periods. They noted that they considered Janus Henderson Fund performance data throughout the year, including periodic meetings with each Janus Henderson Fund’s portfolio manager(s), and also reviewed information comparing each Janus Henderson Fund’s performance with the performance of comparable fund peer groups identified by Broadridge Financial Solutions, Inc. (“Broadridge”), an independent data provider, and with the Janus Henderson Fund’s benchmark index. In this regard, the independent fee consultant found that the overall Janus Henderson Funds’ performance has been reasonable, noting that: (i) for the 36 months ended May 31, 2022, approximately 38% of the Janus Henderson Funds were in the top two quartiles of their Broadridge peer groups; (ii) for the 36 months ended September 30, 2022, approximately 45% of the Janus Henderson Funds were in the top two quartiles of performance as reported by Morningstar, and (iii) for the 12 months ended September 30, 2022, approximately 55% of the Janus Henderson Funds were in the top two quartiles of performance as reported by Morningstar.
The Trustees considered the performance of each Janus Henderson Fund, noting that performance may vary by share class, and noted the following with respect to the Funds:
Asset Allocation Funds
· For Janus Henderson Global Allocation Fund – Conservative, the Trustees noted that the Fund’s performance was in the third Broadridge quartile for the 36 months ended May 31, 2022 and the bottom Broadridge quartile for the 12 months ended May 31, 2022. The Trustees noted the reasons for the Fund’s underperformance and the steps the Adviser had taken or was taking to improve performance.
· For Janus Henderson Global Allocation Fund – Growth, the Trustees noted that the Fund’s performance was in the bottom Broadridge quartile for the 36 months ended May 31, 2022 and the bottom Broadridge quartile for the 12 months ended May 31, 2022. The Trustees noted the reasons for the Fund’s underperformance and the steps the Adviser had taken or was taking to improve performance.
· For Janus Henderson Global Allocation Fund – Moderate, the Trustees noted that the Fund’s performance was in the bottom Broadridge quartile for the 36 months ended May 31, 2022 and the bottom Broadridge quartile for the 12 months ended May 31, 2022. The Trustees noted the reasons for the Fund’s underperformance and the steps the Adviser had taken or was taking to improve performance.
Fixed-Income Funds
· For Janus Henderson Absolute Return Income Opportunities Fund, the Trustees noted that the Fund’s performance was in the third Broadridge quartile for the 36 months ended May 31, 2022 and the first Broadridge quartile for the 12 months ended May 31, 2022. The Trustees noted the reasons for the Fund’s underperformance,
Janus Henderson Global Research Fund
Additional Information (unaudited)
the steps the Adviser had taken or was taking to improve performance, and that the performance trend was improving.
· For Janus Developed World Bond Fund, the Trustees noted that the Fund’s performance was in the bottom Broadridge quartile for the 36 months ended May 31, 2022 and the bottom Broadridge quartile for the 12 months ended May 31, 2022. The Trustees noted the reasons for the Fund’s underperformance and the steps the Adviser had taken or was taking to improve performance.
· For Janus Henderson Flexible Bond Fund, the Trustees noted that the Fund’s performance was in the first Broadridge quartile for the 36 months ended May 31, 2022 and the second Broadridge quartile for the 12 months ended May 31, 2022.
· For Janus Henderson Global Bond Fund, the Trustees noted that the Fund’s performance was in the third Broadridge quartile for the 36 months ended May 31, 2022 and the bottom Broadridge quartile for the 12 months ended May 31, 2022. The Trustees noted the reasons for the Fund’s underperformance and the steps the Adviser had taken or was taking to improve performance.
· For Janus Henderson High-Yield Fund, the Trustees noted that the Fund’s performance was in the third Broadridge quartile for the 36 months ended May 31, 2022 and the bottom Broadridge quartile for the 12 months ended May 31, 2022. The Trustees noted the reasons for the Fund’s underperformance and the steps the Adviser had taken or was taking to improve performance.
· For Janus Henderson Multi-Sector Income Fund, the Trustees noted that the Fund’s performance was in the second Broadridge quartile for the 36 months ended May 31, 2022 and the third Broadridge quartile for the 12 months ended May 31, 2022.
· For Janus Henderson Short Duration Flexible Bond Fund, the Trustees noted that the Fund’s performance was in the third Broadridge quartile for the 36 months ended May 31, 2022 and the bottom Broadridge quartile for the 12 months ended May 31, 2022. The Trustees noted the reasons for the Fund’s underperformance and the steps the Adviser had taken or was taking to improve performance.
Global and International Equity Funds
· For Janus Henderson Asia Equity Fund, the Trustees noted that the Fund’s performance was in the third Broadridge quartile for the 36 months ended May 31, 2022 and the third Broadridge quartile for the 12 months ended May 31, 2022. The Trustees noted the reasons for the Fund’s underperformance, while also noting that the Fund has a performance fee structure that results in lower management fees during periods of underperformance, and the steps the Adviser had taken or was taking to improve performance.
· For Janus Henderson Emerging Markets Fund, the Trustees noted that the Fund’s performance was in the third Broadridge quartile for the 36 months ended May 31, 2022 and the third Broadridge quartile for the 12 months ended May 31, 2022. The Trustees noted the reasons for the Fund’s underperformance and the steps the Adviser had taken or was taking to improve performance.
· For Janus Henderson European Focus Fund, the Trustees noted that the Fund’s performance was in the first Broadridge quartile for the 36 months ended May 31, 2022 and the second Broadridge quartile for the 12 months ended May 31, 2022.
· For Janus Henderson Global Equity Income Fund, the Trustees noted that the Fund’s performance was in the third Broadridge quartile for the 36 months ended May 31, 2022 and the first Broadridge quartile for the 12 months ended May 31, 2022. The Trustees noted the reasons for the Fund’s underperformance, the steps the Adviser had taken or was taking to improve performance, and that the performance trend was improving.
· For Janus Henderson Global Life Sciences Fund, the Trustees noted that the Fund’s performance was in the third Broadridge quartile for the 36 months ended May 31, 2022 and the second Broadridge quartile for the 12 months ended May 31, 2022. The Trustees noted the reasons for the Fund’s underperformance, the steps the Adviser had taken or was taking to improve performance, and that the performance trend was improving.
· For Janus Henderson Global Sustainable Equity Fund, the Trustees noted that the Fund’s performance was in the second Broadridge quartile for the 12 months ended May 31, 2022. The Trustees noted that 36 month-end performance was not yet available.
Janus Henderson Global Research Fund
Additional Information (unaudited)
· For Janus Henderson Global Real Estate Fund, the Trustees noted that the Fund’s performance was in the second Broadridge quartile for the 36 months ended May 31, 2022 and the bottom Broadridge quartile for the 12 months ended May 31, 2022.
· For Janus Henderson Global Research Fund, the Trustees noted that the Fund’s performance was in the second Broadridge quartile for the 36 months ended May 31, 2022 and the first Broadridge quartile for the 12 months ended May 31, 2022.
· For Janus Henderson Global Select Fund, the Trustees noted that the Fund’s performance was in the first Broadridge quartile for the 36 months ended May 31, 2022 and the first Broadridge quartile for the 12 months ended May 31, 2022.
· For Janus Henderson Global Technology and Innovation Fund, the Trustees noted that the Fund’s performance was in the second Broadridge quartile for the 36 months ended May 31, 2022 and the second Broadridge quartile for the 12 months ended May 31, 2022.
· For Janus Henderson International Opportunities Fund, the Trustees noted that the Fund’s performance was in the bottom Broadridge quartile for the 36 months ended May 31, 2022 and the third Broadridge quartile for the 12 months ended May 31, 2022. The Trustees noted the reasons for the Fund’s underperformance and the steps the Adviser had taken or was taking to improve performance.
· For Janus Henderson Overseas Fund, the Trustees noted that the Fund’s performance was in the first Broadridge quartile for the 36 months ended May 31, 2022 and the first Broadridge quartile for the 12 months ended May 31, 2022.
· For Janus Henderson Responsible International Dividend Fund (formerly the Janus Henderson Dividend & Income Builder Fund), the Trustees noted that the Fund’s performance was in the bottom Broadridge quartile for the 36 months ended May 31, 2022 and the bottom Broadridge quartile for the 12 months ended May 31, 2022. The Trustees noted the reasons for the Fund’s underperformance and the steps the Adviser had taken or was taking to improve performance.
Money Market Funds
· For Janus Henderson Government Money Market Fund, the Trustees noted that the Fund’s performance was in the third Broadridge quartile for the 36 months ended May 31, 2022 and the bottom Broadridge quartile for the 12 months ended May 31, 2022. The Trustees noted the reasons for the Fund’s underperformance and the steps the Adviser had taken or was taking to improve performance.
· For Janus Henderson Money Market Fund, the Trustees noted that the Fund’s performance was in the third Broadridge quartile for the 36 months ended May 31, 2022 and the bottom Broadridge quartile for the 12 months ended May 31, 2022. The Trustees noted the reasons for the Fund’s underperformance and the steps the Adviser had taken or was taking to improve performance.
Multi-Asset Funds
· For Janus Henderson Adaptive Global Allocation Fund, the Trustees noted that the Fund’s performance was in bottom Broadridge quartile for the 36 months ended May 31, 2022 and the second Broadridge quartile for the 12 months ended May 31, 2022. The Trustees noted the reasons for the Fund’s underperformance, the steps the Adviser had taken or was taking to improve performance, and that the performance trend was improving.
· For Janus Henderson Balanced Fund, the Trustees noted that the Fund’s performance was in the first Broadridge quartile for the 36 months ended May 31, 2022 and the first Broadridge quartile for the 12 months ended May 31, 2022.
U.S. Equity Funds
· For Janus Henderson Adaptive Risk Managed U.S. Equity Fund, the Trustees noted that the Fund’s performance was in the bottom Broadridge quartile for the 36 months ended May 31, 2022 and the second Broadridge quartile for the 12 months ended May 31, 2022. The Trustees noted the reasons for the Fund’s underperformance, the steps the Adviser had taken or were taking to improve performance, and that the performance trend was improving.
Janus Henderson Global Research Fund
Additional Information (unaudited)
· For Janus Henderson Contrarian Fund, the Trustees noted that the Fund’s performance was in the first Broadridge quartile for the 36 months ended May 31, 2022 and the bottom Broadridge quartile for the 12 months ended May 31, 2022.
· For Janus Henderson Enterprise Fund, the Trustees noted that the Fund’s performance was in the second Broadridge quartile for the 36 months ended May 31, 2022 and the first Broadridge quartile for the 12 months ended May 31, 2022.
· For Janus Henderson Forty Fund, the Trustees noted that the Fund’s performance was in the third Broadridge quartile for the 36 months ended May 31, 2022 and the bottom Broadridge quartile for the 12 months ended May 31, 2022. The Trustees noted the reasons for the Fund’s underperformance and the steps the Adviser had taken or was taking to improve performance.
· For Janus Henderson Growth and Income Fund, the Trustees noted that the Fund’s performance was in the bottom Broadridge quartile for the 36 months ended May 31, 2022 and the first Broadridge quartile for the 12 months ended May 31, 2022. The Trustees noted the reasons for the Fund’s underperformance, the steps the Adviser had taken or was taking to improve performance, and that the performance trend was improving.
· For Janus Henderson Mid Cap Value Fund, the Trustees noted that the Fund’s performance was in the bottom Broadridge quartile for the 36 months ended May 31, 2022 and the second Broadridge quartile for the 12 months ended May 31, 2022. The Trustees noted the reasons for the Fund’s underperformance, while also noting that the Fund has a performance fee structure that results in lower management fees during periods of underperformance, the steps the Adviser had taken or was taking to improve performance, and that the performance trend was improving.
· For Janus Henderson Research Fund, the Trustees noted that the Fund’s performance was in the third Broadridge quartile for the 36 months ended May 31, 2022 and the third Broadridge quartile for the 12 months ended May 31, 2022. The Trustees noted the reasons for the Fund’s underperformance, while also noting that the Fund has a performance fee structure that results in lower management fees during periods of underperformance and the steps the Adviser had taken or was taking to improve performance.
· For Janus Henderson Small Cap Value Fund, the Trustees noted that the Fund’s performance was in the bottom Broadridge quartile for the 36 months ended May 31, 2022 and the second Broadridge quartile for the 12 months ended May 31, 2022. The Trustees noted the reasons for the Fund’s underperformance, while also noting that the Fund has a performance fee structure that results in lower management fees during periods of underperformance, the steps the Adviser had taken or was taking to improve performance, and that the performance trend was improving.
· For Janus Henderson Small-Mid Cap Value Fund, the Trustees noted that the Fund’s performance was in the bottom Broadridge quartile for the 36 months ended May 31, 2022 and the second Broadridge quartile for the 12 months ended May 31, 2022. The Trustees noted the reasons for the Fund’s underperformance, while also noting that the Fund has a performance fee structure that results in lower management fees during periods of underperformance, the steps the Adviser had taken or was taking to improve performance, and that the performance trend is improving.
· For Janus Henderson Triton Fund, the Trustees noted that the Fund’s performance was in the bottom Broadridge quartile for the 36 months ended May 31, 2022 and the second Broadridge quartile for the 12 months ended May 31, 2022. The Trustees noted the reasons for the Fund’s underperformance, the steps the Adviser had taken or was taking to improve performance, and that the performance trend was improving.
· For Janus Henderson Venture Fund, the Trustees noted that the Fund’s performance was in the bottom Broadridge quartile for the 36 months ended May 31, 2022 and the second Broadridge quartile for the 12 months ended May 31, 2022. The Trustees noted the reasons for the Fund’s underperformance, the steps the Adviser had taken or was taking to improve performance, and that the performance trend was improving.
In consideration of each Janus Henderson Fund’s performance, the Trustees concluded that, taking into account the factors relevant to performance, as well as other considerations, including steps taken to improve performance, as applicable, the Janus Henderson Fund’s performance warranted continuation of such Janus Henderson Fund’s investment advisory agreement.
Janus Henderson Global Research Fund
Additional Information (unaudited)
Costs of Services Provided
The Trustees examined information regarding the fees and expenses of each Janus Henderson Fund in comparison to similar information for other comparable funds as provided by Broadridge, an independent data provider. They also reviewed an analysis of that information provided by their independent fee consultant. The independent fee consultant provided its belief that the management fees charged by the Adviser to each of the Janus Henderson Funds under the current investment advisory and administration agreements are reasonable in relation to the services provided by the Adviser. The independent fee consultant found: (1) the total expenses and management fees of the Janus Henderson Funds to be reasonable relative to other comparable mutual funds; (2) the total expenses, on average, were 6% under the average total expenses of the respective Broadridge peer group; and (3) the management fees for the Janus Henderson Funds, on average, were 5% under the average management fees for the respective Broadridge peer group. The Trustees also considered the total expenses for each share class of each Janus Henderson Fund compared to the average total expenses for its Broadridge Expense Group and to average total expenses for its Broadridge Expense Universe.
For Janus Henderson Funds with three or more years of performance history, the independent fee consultant also performed a systematic “focus list” analysis of expenses which assessed fund fees in the context of fund performance being delivered. Based on this analysis, the independent fee consultant found that the combination of service quality/performance and expenses on these individual Janus Henderson Funds was reasonable in light of performance trends, performance histories, changes in portfolio management, relative average net asset levels, and the existence of performance fees, breakpoints, and/or expense waivers on such Janus Henderson Funds.
The Trustees considered the methodology used by the Adviser in determining compensation payable to portfolio managers, the competitive environment for investment management talent, and the competitive market for mutual funds in different distribution channels.
The Trustees also reviewed management fees charged by the Adviser to comparable separate account clients and to comparable non-affiliated funds subadvised by the Adviser (for which the Adviser provides only or primarily portfolio management services). Although in most instances subadvisory and separate account fee rates for various investment strategies were lower than management fee rates for Janus Henderson Funds having a similar strategy, the Trustees considered that the Adviser noted that, under the terms of the management agreements with the Janus Henderson Funds, the Adviser performs significant additional services for the Janus Henderson Funds that it does not provide to those other clients, including administration services, oversight of the Janus Henderson Funds’ other service providers, Trustee support, regulatory compliance and numerous other services, and that, in serving the Janus Henderson Funds, the Adviser assumes many legal risks and other costs that it does not assume in servicing its other clients. Moreover, the Trustees noted that the independent fee consultant found that: (1) the management fees the Adviser charges to the Janus Henderson Funds are reasonable in relation to the management fees the Adviser charges to funds subadvised by the Adviser and to the fees the Adviser charges to its institutional separate account clients; (2) these subadvised and institutional separate accounts have different service and infrastructure needs and operate in markets very different from the retail fund market; (3) Janus Henderson mutual fund investors enjoy reasonable fees relative to the fees charged in these other markets; and (4) as part of its 2022 review, 9 of 11 Janus Henderson Funds have lower management fees than similar funds subadvised by the Adviser. The Trustees noted that for the two Janus Henderson Funds that did not, management fees for each were under the average of its 15(c) peer group.
The Trustees considered the fees for each Janus Henderson Fund for its fiscal year ended in 2021 and noted the following with regard to each Janus Henderson Fund’s total expenses, net of applicable fee waivers (the Fund’s “total expenses”) as reflected in the comparative information provided by Broadridge:
Asset Allocation Funds
· For Janus Henderson Global Allocation Fund – Conservative, the Trustees noted that, although the Fund’s total expenses exceeded the peer group average for certain share classes, overall the Fund’s total expenses were reasonable. The Trustees also noted that the Adviser has contractually agreed to limit the Fund’s expenses.
· For Janus Henderson Global Allocation Fund – Growth, the Trustees noted that, although the Fund’s total expenses exceeded the peer group average for certain share classes, overall the Fund’s total expenses were reasonable. The Trustees also noted that the Adviser has contractually agreed to limit the Fund’s expenses, although this limit did not apply because the Fund’s total expenses as shown were below the applicable fee limit.
Janus Henderson Global Research Fund
Additional Information (unaudited)
· For Janus Henderson Global Allocation Fund – Moderate, the Trustees noted that, although the Fund’s total expenses exceeded the peer group average for one share class, overall the Fund’s total expenses were reasonable. The Trustees also noted that the Adviser has contractually agreed to limit the Fund’s expenses.
Fixed-Income Funds
· For Janus Henderson Absolute Return Income Opportunities Fund, the Trustees noted that, although the Fund’s total expenses exceeded the peer group average for certain share classes, overall the Fund’s total expenses were reasonable. The Trustees also noted that the Adviser has contractually agreed to limit the Fund’s expenses.
· For Janus Henderson Developed World Bond Fund, the Trustees noted that, although the Fund’s total expenses exceeded the peer group average for one share class, overall the Fund’s total expenses were reasonable. The Trustees also noted that the Adviser has contractually agreed to limit the Fund’s expenses.
· For Janus Henderson Flexible Bond Fund, the Trustees noted that, although the Fund’s total expenses exceeded the peer group average for certain share classes, overall the Fund’s total expenses were reasonable. The Trustees also noted that the Adviser has contractually agreed to limit the Fund’s expenses, although this limit did not apply because the Fund’s total expenses as shown were below the applicable fee limit.
· For Janus Henderson Global Bond Fund, the Trustees noted that, although the Fund’s total expenses exceeded the peer group average for certain share classes, overall the Fund’s total expenses were reasonable. The Trustees also noted that the Adviser has contractually agreed to limit the Fund’s expenses.
· For Janus Henderson High-Yield Fund, the Trustees noted that, although the Fund’s total expenses exceeded the peer group average for certain share classes, overall the Fund’s total expenses were reasonable. The Trustees also noted that the Adviser has contractually agreed to limit the Fund’s expenses.
· For Janus Henderson Multi-Sector Income Fund, the Trustees noted that, although the Fund’s total expenses exceeded the peer group average for certain share classes, overall the Fund’s total expenses were reasonable. The Trustees also noted that the Adviser has contractually agreed to limit the Fund’s expenses.
· For Janus Henderson Short Duration Flexible Bond Fund, the Trustees noted that, although the Fund’s total expenses exceeded the peer group average for certain share classes, overall the Fund’s total expenses were reasonable. The Trustees also noted that the Adviser has contractually agreed to limit the Fund’s expenses.
Global and International Equity Funds
· For Janus Henderson Asia Equity Fund, the Trustees noted that, although the Fund’s total expenses exceeded the peer group average for certain share classes, overall the Fund’s total expenses were reasonable. The Trustees also noted that the Adviser has contractually agreed to limit the Fund’s expenses.
· For Janus Henderson Emerging Markets Fund, the Trustees noted that, although the Fund’s total expenses exceeded the peer group average for certain share classes, overall the Fund’s total expenses were reasonable. The Trustees also noted that the Adviser has contractually agreed to limit the Fund’s expenses.
· For Janus Henderson European Focus Fund, the Trustees noted that, although the Fund’s total expenses exceeded the peer group average for one share class, overall the Fund’s expenses were reasonable. The Trustees also noted that the Adviser has contractually agreed to limit the Fund’s expenses.
· For Janus Henderson Global Equity Income Fund, the Trustees noted that, although the Fund’s total expenses exceeded the peer group average for one share class, overall the Fund’s total expenses were reasonable. The Trustees also noted that the Adviser has contractually agreed to limit the Fund’s expenses, although this limit did not apply because the Fund’s total expenses as shown were below the applicable fee limit.
· For Janus Henderson Global Life Sciences Fund, the Trustees noted that the Fund’s total expenses were below the peer group average for all share classes.
· For Janus Henderson Global Real Estate Fund, the Trustees noted that, although the Fund’s total expenses exceeded the peer group average for certain share classes, overall the Fund’s total expenses were reasonable. The Trustees also noted that the Adviser has contractually agreed to limit the Fund’s expenses, although this limit did not apply because the Fund’s total expenses as shown were below the applicable fee limit.
Janus Henderson Global Research Fund
Additional Information (unaudited)
· For Janus Henderson Global Research Fund, the Trustees noted that, although the Fund’s total expenses exceeded the peer group average for one share class, overall the Fund’s total expenses were reasonable. The Trustees also noted that the Adviser has contractually agreed to limit the Fund’s expenses, although this limit did not apply because the Fund’s total expenses as shown were below the applicable fee limit.
· For Janus Henderson Global Select Fund, the Trustees noted that, although the Fund’s total expenses exceeded the peer group average for certain share classes, overall the Fund’s total expenses were reasonable. The Trustees also noted that the Adviser has contractually agreed to limit the Fund’s expenses.
· For Janus Henderson Global Sustainable Equity Fund, the Trustees noted that, although the Fund’s total expenses exceeded the peer group average for certain share classes, overall the Fund’s expenses were reasonable. The Trustees also noted that the Adviser has contractually agreed to limit the Fund’s expenses.
· For Janus Henderson Global Technology and Innovation Fund, the Trustees noted that the Fund’s total expenses were below the peer group average for all share classes.
· For Janus Henderson International Opportunities Fund, the Trustees noted that, although the Fund’s total expenses exceeded the peer group average for certain share classes, overall the Fund’s expenses were reasonable. The Trustees also noted that the Adviser has contractually agreed to limit the Fund’s expenses.
· For Janus Henderson Overseas Fund, the Trustees noted that although the Fund’s total expenses exceeded the peer group average for certain share classes, overall the Fund’s total expenses were reasonable. The Trustees also noted that the Adviser has contractually agreed to limit the Fund’s expenses, although this limit did not apply because the Fund’s total expenses as shown were below the applicable fee limit.
· For Janus Henderson Responsible International Dividend Fund (formerly the Janus Henderson Dividend & Income Builder Fund), the Trustees noted that, although the Fund’s total expenses exceeded the peer group for one share class, overall the Fund’s total expenses were reasonable. The Trustees also noted that the Adviser has contractually agreed to limit the Fund’s expenses.
Money Market Funds
· For Janus Henderson Government Money Market Fund, the Trustees noted that the Fund’s total expenses were below the peer group average for all share classes.
· For Janus Henderson Money Market Fund, the Trustees noted that the Fund’s total expenses were below the peer group average for all share classes.
Multi-Asset Funds
· For Janus Henderson Adaptive Global Allocation Fund, the Trustees noted that, that the Fund’s total expenses were below the peer group average for all share classes.
· For Janus Henderson Balanced Fund, the Trustees noted that, although the Fund’s total expenses exceeded the peer group average for certain share classes, overall the Fund’s total expenses were reasonable. The Trustees also noted that the Adviser has contractually agreed to limit the Fund’s expenses, although this limit did not apply because the Fund’s total expenses as shown were below the applicable fee limit.
U.S. Equity Funds
· For Janus Henderson Adaptive Risk Managed U.S. Equity Fund, the Trustees noted that, although the Fund’s total expenses exceeded the peer group average for certain share classes, overall the Fund’s total expenses were reasonable. The Trustees also noted that the Adviser has contractually agreed to limit the Fund’s expenses, although this limit did not apply because the Fund’s total expenses as shown were below the applicable fee limit.
· For Janus Henderson Contrarian Fund, the Trustees noted that, although the Fund’s total expenses exceeded the peer group average for all share classes, overall the Fund’s total expenses were reasonable. The Trustees also noted that the Adviser had contractually agreed to limit the Fund’s expenses.
· For Janus Henderson Enterprise Fund, the Trustees noted that, although the Fund’s total expenses exceeded the peer group average for certain share classes, overall the Fund’s total expenses were reasonable. The Trustees also noted that the Adviser has contractually agreed to limit the Fund’s expenses, although this limit did not apply because the Fund’s total expenses as shown were below the applicable fee limit.
Janus Henderson Global Research Fund
Additional Information (unaudited)
· For Janus Henderson Forty Fund, the Trustees noted that, although the Fund’s total expenses exceeded the peer group average for certain share classes, overall the Fund’s total expenses were reasonable. The Trustees also noted that the Adviser has contractually agreed to limit the Fund’s expenses, although this limit did not apply because the Fund’s total expenses as shown were below the applicable fee limit.
· For Janus Henderson Growth and Income Fund, the Trustees noted that, although the Fund’s total expenses exceeded the peer group average for certain share classes, overall the Fund’s total expenses were reasonable. The Trustees also noted that the Adviser has contractually agreed to limit the Fund’s expenses, although this limit did not apply because the Fund’s total expenses as shown were below the applicable fee limit.
· For Janus Henderson Mid Cap Value Fund, the Trustees noted that the Fund’s total expenses were below the peer group average for all share classes.
· For Janus Henderson Research Fund, the Trustees noted that, although the Fund’s total expenses exceeded the peer group average for certain share classes, overall the Fund’s total expenses were reasonable. The Trustees also noted that the Adviser has contractually agreed to limit the Fund’s expenses.
· For Janus Henderson Small Cap Value Fund, the Trustees noted that, although the Fund’s total expenses exceeded the peer group average for one share class, overall the Fund’s total expenses were reasonable. The Trustees also noted that the Adviser has contractually agreed to limit the Fund’s expenses, although this limit did not apply because the Fund’s total expenses as shown were below the applicable fee limit.
· For Janus Henderson Small-Mid Cap Value Fund, the Trustees noted that the Fund’s total expenses were below the peer group average for all share classes.
· For Janus Henderson Triton Fund, the Trustees noted that, although the Fund’s total expenses exceeded the peer group average for one share class, overall the Fund’s total expenses were reasonable. The Trustees also noted that the Adviser has contractually agreed to limit the Fund’s expenses, although this limit did not apply because the Fund’s total expenses as shown were below the applicable fee limit.
· For Janus Henderson Venture Fund, the Trustees noted that although the Fund’s total expenses exceeded the peer group average for one share class, overall the Fund’s total expenses were reasonable. The Trustees also noted that the Adviser has contractually agreed to limit the Fund’s expenses, although this limit did not apply because the Fund’s total expenses as shown were below the applicable fee limit.
The Trustees reviewed information on the overall profitability to the Adviser and its affiliates from their relationships with the Janus Henderson Funds, and considered profitability data of other publicly traded mutual fund advisers. The Trustees recognized that profitability comparisons among fund managers are difficult because of the variation in the type of comparative information that is publicly available, and the profitability of any fund manager is affected by numerous factors, including the organizational structure of the particular fund manager, differences in complex size, difference in product mix, difference in types of business (mutual fund, institutional and other), differences in the types of funds and other accounts it manages, possible other lines of business, the methodology for allocating expenses and the fund manager’s capital structure and cost of capital.
Additionally, the Trustees considered the estimated profitability to the Adviser from the investment management services it provided to each Janus Henderson Fund. In their review, the Trustees considered whether the Adviser receive adequate incentives and resources to manage the Janus Henderson Funds effectively. In reviewing profitability, the Trustees noted that the estimated profitability for an individual Janus Henderson Fund is necessarily a product of the allocation methodology utilized by the Adviser to allocate its expenses as part of the estimated profitability calculation. In this regard, the Trustees noted that the independent fee consultant found as part of its 2022 review that (1) the expense allocation methodology and rationales utilized by the Adviser were reasonable and (2) no clear correlation exists between expense allocations and operating margins. The Trustees also considered that the estimated profitability for an individual Janus Henderson Fund was influenced by a number of factors, including not only the allocation methodology selected, but also the presence of fee waivers and expense caps, and whether the Janus Henderson Fund’s investment management agreement contained breakpoints or a performance fee component. The Trustees determined, after taking into account these factors, among others, that the Adviser’s estimated profitability with respect to each Janus Henderson Fund was not unreasonable in relation to the services provided, and that the variation in the range of such estimated profitability among the Janus Henderson Funds was not a material factor in the Board’s approval of the reasonableness of any Janus Henderson Fund’s investment management fees.
Janus Henderson Global Research Fund
Additional Information (unaudited)
The Trustees concluded that the management fees payable by each Janus Henderson Fund to the Adviser were reasonable in relation to the nature, extent, and quality of the services provided, taking into account the fees charged by other advisers for managing comparable mutual funds with similar strategies, the fees the Adviser charges to other clients, and, as applicable, the impact of fund performance on management fees payable by the Janus Henderson Funds. The Trustees also concluded that each Janus Henderson Fund’s total expenses were reasonable, taking into account the size of the Janus Henderson Fund, the quality of services provided by the Adviser, the investment performance of the Janus Henderson Fund, and any expense limitations agreed to or provided by the Adviser.
Economies of Scale
The Trustees considered information about the potential for the Adviser to realize economies of scale as the assets of the Janus Henderson Funds increase. They noted that their independent fee consultant published a report to the Trustees in June 2022 which provided its research and analysis into economies of scale. They also noted that, although many Janus Henderson Funds pay advisory fees at a fixed base rate as a percentage of net assets, without any breakpoints or performance fees, their independent fee consultant concluded that 75% of these Janus Henderson Funds’ have contractual management fees (gross of waivers) below their Broadridge Expense Group averages. The Trustees also noted the following from the independent fee consultant’s report: (1) that 31% of Janus Henderson Funds had management fee breakpoints in place whereby investors pay lower management fees as fund AUM increases; (2) that 29% of Janus Henderson Funds have low flat-rate fees and performance fees where the Adviser is incentivized to invest in resources which drive Janus Henderson Fund performance; and (3) that 39% of Janus Henderson Funds have low flat-rate fees versus peers where investors pay low fixed fees when the Janus Henderson Fund is small/midsized and higher fees when the Janus Henderson Fund grows in assets. The Trustees also noted that the Janus Henderson Funds share directly in economies of scale through the significant investments made by the Adviser and its affiliates related to services provided to the Funds and the lower charges of third-party service providers that are based in part on the combined scale of all of the Janus Henderson Funds.
The Trustees also considered the independent fee consultant’s conclusion that, given the limitations of various analytical approaches to economies of scale and their conflicting results, it is difficult to analytically confirm or deny the existence of economies of scale in the Janus Henderson complex. In this regard, the independent consultant concluded that (1) to the extent there were economies of scale at the Adviser, the Adviser’s general strategy of setting fixed management fees below peers appeared to share any such economies with investors even on smaller Janus Henderson Funds which have not yet achieved those economies and (2) by setting lower fixed fees from the start on these Janus Henderson Funds, the Adviser appeared to be investing to increase the likelihood that these Janus Henderson Funds will grow to a level to achieve any economies of scale that may exist. Further, the independent fee consultant provided its belief that Janus Henderson Fund investors are well-served by the fee levels and performance fee structures in place on the Janus Henderson Funds in light of any economies of scale that may be present at the Adviser.
Based on all of the information reviewed, including the recent and past research and analysis conducted by the Trustees’ independent fee consultant, the Trustees concluded that the current fee structure of each Janus Henderson Fund was reasonable and that the current rates of fees do reflect a sharing between the Adviser and the Janus Henderson Fund of any economies of scale that may be present at the current asset level of the Janus Henderson Fund.
Other Benefits to the Adviser
The Trustees also considered benefits that accrue to the Adviser and its affiliates from their relationships with the Janus Henderson Funds. They recognized that two affiliates of the Adviser separately serve the Janus Henderson Funds as transfer agent and distributor, respectively, and the transfer agent receives compensation directly from the non-money market Janus Henderson Funds for services provided, and that such compensation contributes to the overall profitability of the Adviser and its affiliates that results from their relationship with the Janus Henderson Funds. The Trustees also considered the Adviser’s past and proposed use of commissions paid by the Janus Henderson Funds on portfolio brokerage transactions to obtain proprietary and third-party research products and services benefiting the Janus Henderson Fund and/or other clients of the Adviser and/or the Adviser. The Trustees concluded that the Adviser’s use of these types of client commission arrangements to obtain proprietary and third-party research products and services was consistent with regulatory requirements and guidelines and was likely to benefit each Janus Henderson Fund. The Trustees also concluded that, other than the services provided by the Adviser and its affiliates pursuant to the agreements and the fees to be paid by each Janus Henderson Fund therefor, the Janus Henderson
Janus Henderson Global Research Fund
Additional Information (unaudited)
Funds and the Adviser may potentially benefit from their relationship with each other in other ways. They concluded that the Adviser and its affiliates share directly in economies of scale through the lower charges of third-party service providers that are based in part on the combined scale of the Janus Henderson Funds and other clients serviced by the Adviser and its affiliates. They also concluded that the Adviser benefits from the receipt of research products and services acquired through commissions paid on portfolio transactions of the Janus Henderson Funds and that the Janus Henderson Funds benefit from the Adviser’s receipt of those products and services as well as research products and services acquired through commissions paid by other clients of the Adviser. They further concluded that the success of any Janus Henderson Fund could attract other business to the Adviser or other Janus Henderson Funds, and that the success of the Adviser could enhance the Adviser’s ability to serve the Janus Henderson Funds.
Janus Henderson Global Research Fund
Liquidity Risk Management Program (unaudited)
Liquidity Risk Management Program
Rule 22e-4 under the Investment Company Act of 1940, as amended (the “Liquidity Rule”), requires open-end funds (but not money market funds) to adopt and implement a written liquidity risk management program (the “LRMP”) that is reasonably designed to assess and manage liquidity risk, which is the risk that a fund could not meet redemption requests without significant dilution of remaining investors’ interest in the fund. The Fund has implemented a LRMP, which incorporates the following elements: (i) assessment, management, and periodic review of liquidity risk; (ii) classification of portfolio holdings; (iii) the establishment and monitoring of a highly liquid investment minimum, as applicable; (iv) a 15% limitation on a Fund’s illiquid investments; (v) redemptions in-kind; and (vi) board oversight.
The Trustees of the Fund (the “Trustees”) have designated Janus Henderson Investors US LLC, the Fund’s investment adviser (the “Adviser”), as the Program Administrator for the LRMP responsible for administering the LRMP and carrying out the specific responsibilities of the LRMP. A working group comprised of various teams within the Adviser’s business is responsible for administering the LRMP and carrying out the specific responsibilities of different aspects of the LRMP (the “Liquidity Risk Working Group”). In assessing each Fund’s liquidity risk, the Liquidity Risk Working Group periodically considers, as relevant, factors including (i) the liquidity of a Fund’s portfolio investments during normal and reasonably foreseeable stressed conditions; (ii) whether a Fund’s investment strategy is appropriate for an open-end fund; (iii) the extent to which a Fund’s strategy involves a relatively concentrated portfolio or large positions in any issuer; (iv) a Fund’s use of borrowing for investment purposes; and (v) a Fund’s use of derivatives.
The Liquidity Rule requires the Trustees to review at least annually a written report provided by the Program Administrator that addresses the operation of the LRMP and assesses its adequacy and the effectiveness of its implementation, including, if applicable, the operation of the highly liquid investment minimum, and any material changes to the LRMP (the “Program Administrator Report”). At a meeting held on March 15, 2023, the Adviser provided the Program Administrator Report to the Trustees which covered the operation of the LRMP from January 1, 2022 through December 31, 2022 (the “Reporting Period”).
The Program Administrator Report discussed the operation and effectiveness of the LRMP during the Reporting Period. Among other things, the Program Administrator Report indicated that there were no material changes to the LRMP during the Reporting Period, although there were certain methodology adjustments implemented relating to a change in data provider. Additionally, the findings presented in the Program Administrator Report indicated that the LRMP operated adequately during the Reporting Period. These findings included that the Fund was able to meet redemptions during the normal course of business during the Reporting Period. The Program Administrator Report also stated that the Fund did not exceed the 15% limit on illiquid assets during the Reporting Period, that the Fund held primarily highly liquid assets, and was considered to be a primarily highly liquid fund during the Reporting Period. Also included among the Program Administrator Report’s findings was the determination that the Fund’s investment strategy remains appropriate for an open-end fund. In addition, the Adviser expressed its belief in the Program Administrator Report that the LRMP is reasonably designed and adequate to assess and manage the Fund’s liquidity risk, considering the Fund’s particular risks and circumstances, and includes policies and procedures reasonably designed to implement each required component of the Liquidity Rule.
There can be no assurance that the LRMP will achieve its objectives in the future. Please refer to your Fund’s prospectus for more information regarding the risks to which an investment in the Fund may be subject.
Janus Henderson Global Research Fund
Useful Information About Your Fund Report (unaudited)
Performance Overviews
Performance overview graphs compare the performance of a hypothetical $10,000 investment in the Fund with one or more widely used market indices. When comparing the performance of the Fund with an index, keep in mind that market indices are not available for investment and do not reflect deduction of expenses.
Average annual total returns are quoted for a Fund with more than one year of performance history. Average annual total return is calculated by taking the growth or decline in value of an investment over a period of time, including reinvestment of dividends and distributions, then calculating the annual compounded percentage rate that would have produced the same result had the rate of growth been constant throughout the period. Average annual total return does not reflect the deduction of taxes that a shareholder would pay on Fund distributions or redemptions of Fund shares.
Cumulative total returns are quoted for a Fund with less than one year of performance history. Cumulative total return is the growth or decline in value of an investment over time, independent of the period of time involved. Cumulative total return does not reflect the deduction of taxes that a shareholder would pay on Fund distributions or redemptions of Fund shares.
Pursuant to federal securities rules, expense ratios shown in the performance chart reflect subsidized (if applicable) and unsubsidized ratios. The total annual fund operating expenses ratio is gross of any fee waivers, reflecting the Fund’s unsubsidized expense ratio. The net annual fund operating expenses ratio (if applicable) includes contractual waivers of the Adviser and reflects the Fund’s subsidized expense ratio. Ratios may be higher or lower than those shown in the “Financial Highlights” in this report.
Schedule of Investments
Following the performance overview section is the Fund’s Schedule of Investments. This schedule reports the types of securities held in the Fund on the last day of the reporting period. Securities are usually listed by type (common stock, corporate bonds, U.S. Government obligations, etc.) and by industry classification (banking, communications, insurance, etc.). Holdings are subject to change without notice.
The value of each security is quoted as of the last day of the reporting period. The value of securities denominated in foreign currencies is converted into U.S. dollars.
If the Fund invests in foreign securities, it will also provide a summary of investments by country. This summary reports the Fund exposure to different countries by providing the percentage of securities invested in each country. The country of each security represents the country of risk. A company may be allocated to a country based on other factors such as location of the company’s principal office, the location of the principal trading market for the company’s securities, or the country where a majority of the company’s revenues are derived. The Fund’s Schedule of Investments relies upon the industry group and country classifications published by Bloomberg and/or MSCI Inc.
Tables listing details of individual forward currency contracts, futures, written options, swaptions, and swaps follow the Fund’s Schedule of Investments (if applicable).
Statement of Assets and Liabilities
This statement is often referred to as the “balance sheet.” It lists the assets and liabilities of the Fund on the last day of the reporting period.
The Fund’s assets are calculated by adding the value of the securities owned, the receivable for securities sold but not yet settled, the receivable for dividends declared but not yet received on securities owned, and the receivable for Fund shares sold to investors but not yet settled. The Fund’s liabilities include payables for securities purchased but not yet settled, Fund shares redeemed but not yet paid, and expenses owed but not yet paid. Additionally, there may be other assets and liabilities such as unrealized gain or loss on forward currency contracts.
The section entitled “Net Assets Consist of” breaks down the components of the Fund’s net assets. Because the Fund must distribute substantially all earnings, you will notice that a significant portion of net assets is shareholder capital.
The last section of this statement reports the net asset value (“NAV”) per share on the last day of the reporting period. The NAV is calculated by dividing the Fund’s net assets for each share class (assets minus liabilities) by the number of shares outstanding.
Janus Henderson Global Research Fund
Useful Information About Your Fund Report (unaudited)
Statement of Operations
This statement details the Fund’s income, expenses, realized gains and losses on securities and currency transactions, and changes in unrealized appreciation or depreciation of Fund holdings.
The first section in this statement, entitled “Investment Income,” reports the dividends earned from securities and interest earned from interest-bearing securities in the Fund.
The next section reports the expenses incurred by the Fund, including the advisory fee paid to the investment adviser, transfer agent fees and expenses, and printing and postage for mailing statements, financial reports and prospectuses. Expense offsets and expense reimbursements, if any, are also shown.
The last section lists the amounts of realized gains or losses from investment and foreign currency transactions, and changes in unrealized appreciation or depreciation of investments and foreign currency-denominated assets and liabilities. The Fund will realize a gain (or loss) when it sells its position in a particular security. A change in unrealized gain (or loss) refers to the change in net appreciation or depreciation of the Fund during the reporting period. “Net Realized and Unrealized Gain/(Loss) on Investments” is affected both by changes in the market value of Fund holdings and by gains (or losses) realized during the reporting period.
Statements of Changes in Net Assets
These statements report the increase or decrease in the Fund’s net assets during the reporting period. Changes in the Fund’s net assets are attributable to investment operations, dividends and distributions to investors, and capital share transactions. This is important to investors because it shows exactly what caused the Fund’s net asset size to change during the period.
The first section summarizes the information from the Statement of Operations regarding changes in net assets due to the Fund’s investment operations. The Fund’s net assets may also change as a result of dividend and capital gains distributions to investors. If investors receive their dividends and/or distributions in cash, money is taken out of the Fund to pay the dividend and/or distribution. If investors reinvest their dividends and/or distributions, the Fund’s net assets will not be affected.
The reinvestment of dividends and distributions is included under “Capital Share Transactions.” “Capital Shares” refers to the money investors contribute to the Fund through purchases or withdrawals via redemptions. The Fund’s net assets will increase and decrease in value as investors purchase and redeem shares from the Fund.
Financial Highlights
This schedule provides a per-share breakdown of the components that affect the Fund’s NAV for current and past reporting periods as well as total return, asset size, ratios, and portfolio turnover rate.
The first line in the table reflects the NAV per share at the beginning of the reporting period. The next line reports the net investment income/(loss) per share. Following is the per share total of net gains/(losses), realized and unrealized. Per share dividends and distributions to investors are then subtracted to arrive at the NAV per share at the end of the period. The next line reflects the total return for the period. The total return may include adjustments in accordance with generally accepted accounting principles required at the period end for financial reporting purposes. As a result, the total return may differ from the total return reflected for individual shareholder transactions. Also included are ratios of expenses and net investment income to average net assets.
The Fund’s expenses may be reduced through expense offsets and expense reimbursements. The ratios shown reflect expenses before and after any such offsets and reimbursements.
The ratio of net investment income/(loss) summarizes the income earned less expenses, divided by the average net assets of the Fund during the reporting period. Do not confuse this ratio with the Fund’s yield. The net investment income ratio is not a true measure of the Fund’s yield because it does not take into account the dividends distributed to the Fund’s investors.
The next figure is the portfolio turnover rate, which measures the buying and selling activity in the Fund. Portfolio turnover is affected by market conditions, changes in the asset size of the Fund, fluctuating volume of shareholder purchase and redemption orders, the nature of the Fund’s investments, and the investment style and/or outlook of the portfolio manager(s) and/or investment personnel. A 100% rate implies that an amount equal to the value of the entire portfolio was replaced once during the fiscal year; a 50% rate means that an amount equal to the value of half the
Janus Henderson Global Research Fund
Useful Information About Your Fund Report (unaudited)
portfolio is traded in a year; and a 200% rate means that an amount equal to the value of the entire portfolio is traded every six months.
Janus Henderson Global Research Fund
Notes
NotesPage1
| | | | | | | | |
| | | | | |

| | | | |
This report is submitted for the general information of shareholders of the Fund. It is not an offer or solicitation for the Fund and is not authorized for distribution to prospective investors unless preceded or accompanied by an effective prospectus. |
Janus Henderson is a trademark of Janus Henderson Group plc or one of its subsidiaries. © Janus Henderson Group plc. Janus Henderson Group is the ultimate parent of Janus Henderson Distributors US LLC. Janus Henderson Distributors US LLC |
| | | | 125-24-93045 05-23 |
| | | | |
| | | |
| | | SEMIANNUAL REPORT March 31, 2023 |
| | |
| | Janus Henderson Global Select Fund |
| | |
| | Janus Investment Fund |
| |
| | | HIGHLIGHTS · Investment strategy behind your fund · Fund performance, characteristics
and holdings |
Table of Contents
Janus Henderson Global Select Fund
| | | | | | |
| | | | | 
Julian McManus co-portfolio manager | 
George Maris co-portfolio manager |
| | | |
Janus Henderson Global Select Fund (unaudited)
Fund At A Glance
March 31, 2023
| | | | | | | | | | |
| | | | | | | | | |
| | | | | | | | | |
| | | | | | | | | |
| 5 Top Contributors - Holdings | 5 Top Detractors - Holdings |
| | Average
Weight | | Relative
Contribution | | | Average
Weight | | Relative
Contribution |
| PulteGroup Inc | 2.29% | | 0.79% | | NRG Energy Inc | 2.46% | | -1.50% |
| Marathon Petroleum Corp | 3.75% | | 0.69% | | Fidelity National Information Services Inc | 1.19% | | -0.74% |
| Airbus SE | 1.71% | | 0.52% | | JD.com Inc - Class A | 1.99% | | -0.66% |
| Under Armour Inc | 1.90% | | 0.52% | | Humana Inc | 2.50% | | -0.40% |
| ASML Holding NV | 1.77% | | 0.49% | | WR Berkley Corp | 1.76% | | -0.33% |
| | | | | | | |
| 5 Top Contributors - Sectors* | | | | | |
| | | Relative | | Fund | MSCI All Country World Index |
| | | Contribution | | Average Weight | Average Weight |
| Consumer Discretionary | | 2.65% | | 15.25% | 10.88% |
| Energy | | 0.99% | | 5.91% | 5.43% |
| Financials | | 0.58% | | 15.56% | 15.05% |
| Health Care | | 0.55% | | 13.46% | 12.84% |
| Industrials | | 0.46% | | 12.51% | 10.06% |
| | | | | | |
| | | | | | |
| 5 Top Detractors - Sectors* | | | | | |
| | | Relative | | Fund | MSCI All Country World Index |
| | | Contribution | | Average Weight | Average Weight |
| Utilities | | -1.29% | | 3.74% | 3.02% |
| Information Technology | | -1.08% | | 13.90% | 20.68% |
| Materials | | -0.53% | | 5.47% | 4.92% |
| Other** | | -0.33% | | 1.73% | 0.00% |
| Communication Services | | 0.15% | | 7.14% | 7.02% |
| | | | | | | |
| Relative contribution reflects how the portolio's holdings impacted return relative to the benchmark. Cash and securities not held in the portfolio are not shown. For equity portfolios, relative contribution compares the performance of a security in the portfolio to the benchmark's total return, factoring in the difference in weight of that security in the benchmark. Returns are calculated using daily returns and previous day ending weights rolled up by ticker, excluding fixed income securities, gross of advisory fees, may exclude certain derivatives and will differ from actual performance.
Performance attribution reflects returns gross of advisory fees and may differ from actual returns as they are based on end of day holdings. Attribution is calculated by geometrically linking daily returns for the portfolio and index. |
* | Based on sector classification according to the Global Industry Classification Standard (“GICS”) codes, which are the exclusive property and a service mark of MSCI Inc. and Standard & Poor’s. |
** | Not a GICS classified sector. |
Janus Henderson Global Select Fund (unaudited)
Fund At A Glance
March 31, 2023
| | |
5 Largest Equity Holdings - (% of Net Assets) |
Microsoft Corp | |
Software | 4.9% |
Marathon Petroleum Corp | |
Oil, Gas & Consumable Fuels | 4.1% |
Taiwan Semiconductor Manufacturing Co Ltd | |
Semiconductor & Semiconductor Equipment | 3.6% |
Teck Resources Ltd | |
Metals & Mining | 3.2% |
BAE Systems PLC | |
Aerospace & Defense | 3.1% |
| | 18.9% |
| | | | | | |
Asset Allocation - (% of Net Assets) | |
Common Stocks | | 99.0% | |
Investment Companies | | 0.8% | |
Private Placements | | 0.0% | |
Other | | 0.2% |
| | | 100.0% |
Emerging markets comprised 6.1% of total net assets.
| | |
Top Country Allocations - Long Positions - (% of Investment Securities) |
As of March 31, 2023 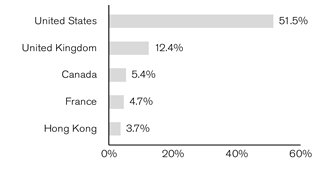
| As of September 30, 2022 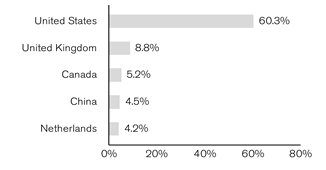
|
Janus Henderson Global Select Fund (unaudited)
Performance
| |
See important disclosures on the next page. |
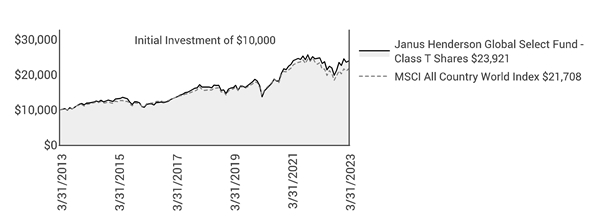
| | | | | | | | | | | | |
| | | | | | | | | | |
| | | | | | | | | | |
Average Annual Total Return - for the periods ended March 31, 2023 | | | Prospectus Expense Ratios |
| | Fiscal
Year-to-Date | One
Year | Five
Year | Ten
Year | Since
Inception* | | | Total Annual Fund
Operating Expenses‡ | Net Annual Fund
Operating Expenses‡ |
Class A Shares at NAV | | 20.63% | -3.54% | 7.55% | 8.98% | 4.41% | | | 1.04% | 1.04% |
Class A Shares at MOP | | 13.72% | -9.08% | 6.28% | 8.34% | 4.13% | | | | |
Class C Shares at NAV | | 20.00% | -4.43% | 6.61% | 8.06% | 3.58% | | | 2.25% | 1.89% |
Class C Shares at CDSC | | 19.00% | -5.36% | 6.61% | 8.06% | 3.58% | | | | |
Class D Shares | | 20.70% | -3.37% | 7.78% | 9.18% | 4.54% | | | 0.82% | 0.82% |
Class I Shares | | 20.69% | -3.35% | 7.82% | 9.28% | 4.59% | | | 0.77% | 0.77% |
Class N Shares | | 20.75% | -3.24% | 7.94% | 9.25% | 4.55% | | | 0.69% | 0.69% |
Class R Shares | | 20.21% | -4.17% | 6.91% | 8.43% | 3.93% | | | 3.67% | 1.58% |
Class S Shares | | 20.40% | -3.89% | 7.20% | 8.72% | 4.21% | | | 3.97% | 1.33% |
Class T Shares | | 20.68% | -3.47% | 7.69% | 9.11% | 4.50% | | | 0.92% | 0.92% |
MSCI All Country World Index | | 17.78% | -7.44% | 6.93% | 8.06% | 4.96% | | | | |
Morningstar Quartile - Class T Shares | | - | 1st | 1st | 1st | 3rd | | | | |
Morningstar Ranking - based on total returns for World Large Stock Funds | | - | 81/367 | 73/321 | 26/242 | 71/89 | | | | |
Returns quoted are past performance and do not guarantee future results; current performance may be lower or higher. Investment returns and principal value will vary; there may be a gain or loss when shares are sold. For the most recent month-end performance call 800.668.0434 (or 800.525.3713 if you hold shares directly with Janus Henderson) or visit janushenderson.com/performance (or janushenderson.com/allfunds if you hold shares directly with Janus Henderson).
Maximum Offering Price (MOP) returns include the maximum sales charge of 5.75%. Net Asset Value (NAV) returns exclude this charge, which would have reduced returns.
CDSC returns include a 1% contingent deferred sales charge (CDSC) on Shares redeemed within 12 months of purchase. Net Asset Value (NAV) returns exclude this charge, which would have reduced returns.
Net expense ratios reflect the expense waiver, if any, contractually agreed to for at least a one-year period commencing on January 27, 2023. This contractual waiver may be terminated or modified only at the discretion of the Board of Trustees.
Janus Henderson Global Select Fund (unaudited)
Performance
Performance may be affected by risks that include those associated with foreign and emerging markets, fixed income securities, high-yield and high-risk securities, undervalued, overlooked and smaller capitalization companies, real estate related securities including Real Estate Investment Trusts (REITs), Environmental, Social and Governance (ESG) factors, non-diversification, portfolio turnover, derivatives, short sales, initial public offerings (IPOs) and potential conflicts of interest. Each product has different risks. Please see the prospectus for more information about risks, holdings and other details.
Returns include reinvestment of all dividends and distributions and do not reflect the deduction of taxes that a shareholder would pay on Fund distributions or redemptions of Fund shares. The returns do not include adjustments in accordance with generally accepted accounting principles required at the period end for financial reporting purposes.
Class A Shares, Class C Shares, Class R Shares, and Class S Shares commenced operations on July 6, 2009. Performance shown for each class prior to July 6, 2009, reflects the performance of the Fund’s Class J Shares, the initial share class (renamed Class T Shares effective February 16, 2010), calculated using the fees and expenses of each respective class, without the effect of any fee and expense limitations or waivers.
Class D Shares commenced operations on February 16, 2010. Performance shown for periods prior to February 16, 2010, reflects the performance of the Fund’s former Class J Shares, calculated using the fees and expenses in effect during the periods shown, net of any applicable fee and expense limitations or waivers.
Class I Shares commenced operations on July 6, 2009. Performance shown for periods prior to July 6, 2009, reflects the performance of the Fund’s former Class J Shares, calculated using the fees and expenses of Class J Shares, net of any applicable fee and expense limitations or waivers.
Class N Shares commenced operations on August 4, 2017. Performance shown for periods prior to August 4, 2017, reflects the performance of the Fund’s Class T Shares, calculated using the fees and expenses of Class T Shares, net of any applicable fee and expense limitations or waivers.
If each share class of the Fund had been available during periods prior to its commencement, the performance shown may have been different. The performance shown for periods following the Fund’s commencement of each share class reflects the fees and expenses of each respective share class, net of any applicable fee and expense limitations or waivers. Please refer to the Fund’s prospectuses for further details concerning historical performance.
Ranking is for the share class shown only; other classes may have different performance characteristics. When an expense waiver is in effect, it may have a material effect on the total return, and therefore the ranking for the period
© 2023 Morningstar, Inc. All Rights Reserved.
There is no assurance that the investment process will consistently lead to successful investing.
See Notes to Schedule of Investments and Other Information for index definitions.
Index performance does not reflect the expenses of managing a portfolio as an index is unmanaged and not available for direct investment.
See “Useful Information About Your Fund Report.”
*The Fund’s inception date – June 30, 2000
‡ As stated in the prospectus. See Financial Highlights for actual expense ratios during the reporting period.
Janus Henderson Global Select Fund (unaudited)
Expense Examples
As a shareholder of the Fund, you incur two types of costs: (1) transaction costs, such as sales charges (loads) on purchase payments (applicable to Class A Shares only); and (2) ongoing costs, including management fees; 12b-1 distribution and shareholder servicing fees; transfer agent fees and expenses payable pursuant to the Transfer Agency Agreement; and other Fund expenses. This example is intended to help you understand your ongoing costs (in dollars) of investing in the Fund and to compare these costs with the ongoing costs of investing in other mutual funds. To do so, compare this 5% hypothetical example with the 5% hypothetical examples that appear in the shareholder reports of the other funds. The example is based upon an investment of $1,000 invested at the beginning of the period and held for the six-months indicated, unless noted otherwise in the table and footnotes below.
Actual Expenses
The information in the table under the heading “Actual” provides information about actual account values and actual expenses. You may use the information in these columns, together with the amount you invested, to estimate the expenses that you paid over the period. Simply divide your account value by $1,000 (for example, an $8,600 account value divided by $1,000 = 8.6), then multiply the result by the number in the appropriate column for your share class under the heading entitled “Expenses Paid During Period” to estimate the expenses you paid on your account during the period.
Hypothetical Example for Comparison Purposes
The information in the table under the heading “Hypothetical (5% return before expenses)” provides information about hypothetical account values and hypothetical expenses based upon the Fund’s actual expense ratio and an assumed rate of return of 5% per year before expenses, which is not the Fund’s actual return. The hypothetical account values and expenses may not be used to estimate the actual ending account balance or expenses you paid for the period. You may use this information to compare the ongoing costs of investing in the Fund and other funds. To do so, compare this 5% hypothetical example with the 5% hypothetical examples that appear in the shareholder reports of the other funds. Additionally, for an analysis of the fees associated with an investment in any share class or other similar funds, please visit www.finra.org/fundanalyzer.
Please note that the expenses shown in the table are meant to highlight your ongoing costs only and do not reflect any transaction costs. These fees are fully described in the Fund’s prospectuses. Therefore, the hypothetical examples are useful in comparing ongoing costs only, and will not help you determine the relative total costs of owning different funds. In addition, if these transaction costs were included, your costs would have been higher.
| | | | | | | | | | | |
| | | | | | | | |
| | | Actual | | Hypothetical
(5% return before expenses) | |
| Beginning
Account
Value
(10/1/22) | Ending
Account
Value
(3/31/23) | Expenses
Paid During
Period
(10/1/22 - 3/31/23)† | | Beginning
Account
Value
(10/1/22) | Ending
Account
Value
(3/31/23) | Expenses
Paid During
Period
(10/1/22 - 3/31/23)† | Net Annualized
Expense Ratio
(10/1/22 - 3/31/23) |
Class A Shares | $1,000.00 | $1,206.30 | $5.78 | | $1,000.00 | $1,019.70 | $5.29 | 1.05% |
Class C Shares | $1,000.00 | $1,200.00 | $11.02 | | $1,000.00 | $1,014.91 | $10.10 | 2.01% |
Class D Shares | $1,000.00 | $1,207.00 | $4.62 | | $1,000.00 | $1,020.74 | $4.23 | 0.84% |
Class I Shares | $1,000.00 | $1,206.90 | $4.46 | | $1,000.00 | $1,020.89 | $4.08 | 0.81% |
Class N Shares | $1,000.00 | $1,207.50 | $3.85 | | $1,000.00 | $1,021.44 | $3.53 | 0.70% |
Class R Shares | $1,000.00 | $1,202.10 | $8.84 | | $1,000.00 | $1,016.90 | $8.10 | 1.61% |
Class S Shares | $1,000.00 | $1,204.00 | $7.47 | | $1,000.00 | $1,018.15 | $6.84 | 1.36% |
Class T Shares | $1,000.00 | $1,206.80 | $5.01 | | $1,000.00 | $1,020.39 | $4.58 | 0.91% |
† | Expenses Paid During Period are equal to the Net Annualized Expense Ratio multiplied by the average account value over the period, multiplied by 182/365 (to reflect the one-half year period). Expenses in the examples include the effect of applicable fee waivers and/or expense reimbursements, if any. Had such waivers and/or reimbursements not been in effect, your expenses would have been higher. Please refer to the Notes to Financial Statements or the Fund’s prospectuses for more information regarding waivers and/or reimbursements. |
Janus Henderson Global Select Fund
Schedule of Investments (unaudited)
March 31, 2023
| | | | | | | | |
Shares
| | | Value | |
Common Stocks– 99.0% | | | |
Aerospace & Defense – 4.2% | | | |
| | Airbus SE | | 196,709 | | | $26,349,915 | |
| | BAE Systems PLC | | 5,920,148 | | | 71,758,136 | |
| | | 98,108,051 | |
Air Freight & Logistics – 2.6% | | | |
| | United Parcel Service Inc | | 315,703 | | | 61,243,225 | |
Banks – 7.6% | | | |
| | BNP Paribas SA | | 741,073 | | | 44,319,247 | |
| | Citigroup Inc | | 764,866 | | | 35,864,567 | |
| | Erste Group Bank AG | | 758,300 | | | 25,079,610 | |
| | Natwest Group PLC | | 8,207,084 | | | 26,811,253 | |
| | Permanent TSB Group Holdings PLC* | | 5,290,709 | | | 13,255,605 | |
| | UniCredit SpA | | 1,777,047 | | | 33,654,996 | |
| | | 178,985,278 | |
Beverages – 3.1% | | | |
| | Heineken NV | | 277,831 | | | 29,907,042 | |
| | Monster Beverage Corp | | 809,680 | | | 43,730,817 | |
| | | 73,637,859 | |
Biotechnology – 2.1% | | | |
| | Argenx SE (ADR)* | | 63,720 | | | 23,740,798 | |
| | Sarepta Therapeutics Inc* | | 102,704 | | | 14,155,692 | |
| | Vaxcyte Inc* | | 280,054 | | | 10,496,424 | |
| | | 48,392,914 | |
Capital Markets – 2.3% | | | |
| | Morgan Stanley | | 605,487 | | | 53,161,759 | |
Containers & Packaging – 1.5% | | | |
| | Crown Holdings Inc | | 434,837 | | | 35,965,368 | |
Diversified Telecommunication Services – 2.3% | | | |
| | Deutsche Telekom AG | | 2,214,325 | | | 53,627,949 | |
Electronic Equipment, Instruments & Components – 2.3% | | | |
| | Hexagon AB - Class B | | 1,152,232 | | | 13,263,922 | |
| | Keyence Corp | | 81,300 | | | 39,863,176 | |
| | | 53,127,098 | |
Entertainment – 2.7% | | | |
| | Liberty Media Corp-Liberty Formula One* | | 852,580 | | | 63,798,561 | |
Health Care Providers & Services – 2.3% | | | |
| | Humana Inc | | 110,071 | | | 53,435,068 | |
Hotels, Restaurants & Leisure – 4.0% | | | |
| | Caesars Entertainment Inc* | | 765,316 | | | 37,355,074 | |
| | Entain PLC | | 3,583,995 | | | 55,768,375 | |
| | | 93,123,449 | |
Household Durables – 2.4% | | | |
| | PulteGroup Inc | | 973,321 | | | 56,725,148 | |
Independent Power and Renewable Electricity Producers – 2.1% | | | |
| | Vistra Energy Corp | | 2,075,797 | | | 49,819,128 | |
Insurance – 5.6% | | | |
| | AIA Group Ltd | | 3,776,600 | | | 39,683,186 | |
| | Beazley PLC | | 4,371,108 | | | 32,223,546 | |
| | Dai-ichi Life Holdings Inc | | 2,269,100 | | | 41,696,557 | |
| | WR Berkley Corp | | 274,317 | | | 17,078,976 | |
| | | 130,682,265 | |
Interactive Media & Services – 0.9% | | | |
| | Alphabet Inc - Class A* | | 203,257 | | | 21,083,849 | |
Machinery – 2.7% | | | |
| | Deere & Co | | 112,825 | | | 46,583,186 | |
| | Wabtec Corp | | 168,913 | | | 17,070,348 | |
| | | 63,653,534 | |
Metals & Mining – 3.2% | | | |
| | Teck Resources Ltd | | 2,093,768 | | | 76,465,219 | |
| | |
See Notes to Schedule of Investments and Other Information and Notes to Financial Statements. |
| |
6 | MARCH 31, 2023 |
Janus Henderson Global Select Fund
Schedule of Investments (unaudited)
March 31, 2023
| | | | | | | | |
Shares
| | | Value | |
Common Stocks– (continued) | | | |
Multiline Retail – 1.7% | | | |
| | JD.Com Inc - Class A | | 1,816,026 | | | $39,802,261 | |
Oil, Gas & Consumable Fuels – 6.2% | | | |
| | Canadian Natural Resources Ltd | | 882,590 | | | 48,851,357 | |
| | Marathon Petroleum Corp | | 715,156 | | | 96,424,484 | |
| | | 145,275,841 | |
Personal Products – 2.1% | | | |
| | Unilever PLC | | 949,646 | | | 49,190,967 | |
Pharmaceuticals – 9.5% | | | |
| | AstraZeneca PLC | | 402,875 | | | 55,909,837 | |
| | Bayer AG | | 514,530 | | | 32,770,464 | |
| | Catalent Inc* | | 501,459 | | | 32,950,871 | |
| | Merck & Co Inc | | 431,261 | | | 45,881,858 | |
| | Novartis AG | | 257,457 | | | 23,642,269 | |
| | Organon & Co | | 1,416,819 | | | 33,323,583 | |
| | | 224,478,882 | |
Road & Rail – 1.4% | | | |
| | Full Truck Alliance Co (ADR)* | | 2,441,097 | | | 18,576,748 | |
| | Uber Technologies Inc* | | 488,539 | | | 15,486,686 | |
| | | 34,063,434 | |
Semiconductor & Semiconductor Equipment – 6.1% | | | |
| | ASML Holding NV | | 68,922 | | | 47,089,660 | |
| | Lam Research Corp | | 22,915 | | | 12,147,700 | |
| | Taiwan Semiconductor Manufacturing Co Ltd | | 4,821,000 | | | 85,415,229 | |
| | | 144,652,589 | |
Software – 6.9% | | | |
| | Microsoft Corp | | 400,660 | | | 115,510,278 | |
| | Workday Inc - Class A* | | 221,317 | | | 45,710,813 | |
| | | 161,221,091 | |
Specialty Retail – 1.8% | | | |
| | TJX Cos Inc | | 534,932 | | | 41,917,272 | |
Textiles, Apparel & Luxury Goods – 5.5% | | | |
| | LVMH Moet Hennessy Louis Vuitton SE | | 44,206 | | | 40,509,153 | |
| | Samsonite International SA (144A)* | | 15,384,900 | | | 47,287,639 | |
| | Under Armour Inc* | | 4,744,387 | | | 40,469,621 | |
| | | 128,266,413 | |
Trading Companies & Distributors – 2.3% | | | �� |
| | Ferguson PLC | | 410,530 | | | 54,166,716 | |
Wireless Telecommunication Services – 1.6% | | | |
| | T-Mobile US Inc* | | 260,036 | | | 37,663,614 | |
Total Common Stocks (cost $1,750,682,078) | | 2,325,734,802 | |
Private Placements– 0% | | | |
Software – 0% | | | |
| | Magic Leap Inc - Class A private equity common shares*,¢,§((cost $9,254,547) | | 19,041 | | | 0 | |
Investment Companies– 0.8% | | | |
Money Markets – 0.8% | | | |
| | Janus Henderson Cash Liquidity Fund LLC, 4.7988%ºº,£((cost $19,118,504) | | 19,116,219 | | | 19,120,042 | |
Total Investments (total cost $1,779,055,129) – 99.8% | | 2,344,854,844 | |
Cash, Receivables and Other Assets, net of Liabilities – 0.2% | | 4,434,921 | |
Net Assets – 100% | | $2,349,289,765 | |
| | |
See Notes to Schedule of Investments and Other Information and Notes to Financial Statements. |
| |
Janus Investment Fund | 7 |
Janus Henderson Global Select Fund
Schedule of Investments (unaudited)
March 31, 2023
| | | | | | |
Summary of Investments by Country - (Long Positions) (unaudited) |
| |
| | | | | % of | |
| | | | | Investment | |
Country | | Value | | Securities | |
United States | | $1,208,340,728 | | 51.5 | % |
United Kingdom | | 291,662,114 | | 12.4 | |
Canada | | 125,316,576 | | 5.4 | |
France | | 111,178,315 | | 4.7 | |
Hong Kong | | 86,970,825 | | 3.7 | |
Germany | | 86,398,413 | | 3.7 | |
Taiwan | | 85,415,229 | | 3.6 | |
Japan | | 81,559,733 | | 3.5 | |
Netherlands | | 76,996,702 | | 3.3 | |
China | | 58,379,009 | | 2.5 | |
Italy | | 33,654,996 | | 1.4 | |
Austria | | 25,079,610 | | 1.1 | |
Belgium | | 23,740,798 | | 1.0 | |
Switzerland | | 23,642,269 | | 1.0 | |
Sweden | | 13,263,922 | | 0.6 | |
Ireland | | 13,255,605 | | 0.6 | |
| | | | | | |
| | | | | | |
Total | | $2,344,854,844 | | 100.0 | % |
| | |
See Notes to Schedule of Investments and Other Information and Notes to Financial Statements. |
| |
8 | MARCH 31, 2023 |
Janus Henderson Global Select Fund
Schedule of Investments (unaudited)
March 31, 2023
Schedules of Affiliated Investments – (% of Net Assets)
| | | | | | | | | | | |
| | Dividend Income | Realized Gain/(Loss) | Change in Unrealized Appreciation/ Depreciation | Value at 3/31/23 |
Investment Companies - 0.8% |
Money Markets - 0.8% | |
| | Janus Henderson Cash Liquidity Fund LLC, 4.7988%ºº | $ | 771,875 | $ | 5,211 | $ | (1,291) | $ | 19,120,042 |
Investments Purchased with Cash Collateral from Securities Lending - N/A |
Investment Companies - N/A | |
| | Janus Henderson Cash Collateral Fund LLC, 4.8170%ºº | | 13,126∆ | | - | | - | | - |
Total Affiliated Investments - 0.8% | $ | 785,001 | $ | 5,211 | $ | (1,291) | $ | 19,120,042 |
| | | | | | | | | | | |
| | Value at 9/30/22 | Purchases | Sales Proceeds | Value at 3/31/23 |
Investment Companies - 0.8% |
Money Markets - 0.8% | |
| | Janus Henderson Cash Liquidity Fund LLC, 4.7988%ºº | | 28,298,020 | | 250,011,919 | | (259,193,817) | | 19,120,042 |
Investments Purchased with Cash Collateral from Securities Lending - N/A |
Investment Companies - N/A | |
| | Janus Henderson Cash Collateral Fund LLC, 4.8170%ºº | | 13,167,540 | | 66,740,178 | | (79,907,718) | | - |
| | |
See Notes to Schedule of Investments and Other Information and Notes to Financial Statements. |
| |
Janus Investment Fund | 9 |
Janus Henderson Global Select Fund
Notes to Schedule of Investments and Other Information (unaudited)
| | |
MSCI All Country World IndexSM | MSCI All Country World IndexSM reflects the equity market performance of global developed and emerging markets. |
| | |
ADR | American Depositary Receipt |
LLC | Limited Liability Company |
PLC | Public Limited Company |
| | |
144A | Securities sold under Rule 144A of the Securities Act of 1933, as amended, are subject to legal and/or contractual restrictions on resale and may not be publicly sold without registration under the 1933 Act. Unless otherwise noted, these securities have been determined to be liquid under guidelines established by the Board of Trustees. The total value of 144A securities as of the period ended March 31, 2023 is $47,287,639, which represents 2.0% of net assets. |
* | Non-income producing security. |
ºº | Rate shown is the 7-day yield as of March 31, 2023. |
¢ | Security is valued using significant unobservable inputs. The total value of Level 3 securities as of the period ended March 31, 2023 is $0, which represents 0.0% of net assets. |
£ | The Fund may invest in certain securities that are considered affiliated companies. As defined by the Investment Company Act of 1940, as amended, an affiliated company is one in which the Fund owns 5% or more of the outstanding voting securities, or a company which is under common ownership or control. |
∆ | Net of income paid to the securities lending agent and rebates paid to the borrowing counterparties. |
| | | | | | | | | | | |
§ | Schedule of Restricted Securities (as of March 31, 2023) |
| | | | | | | | Value as a | |
| | Acquisition | | | | | | % of Net | |
| | Date | | Cost | | Value | | Assets | |
Magic Leap Inc - Class A private equity common shares | 10/5/17 | $ | 9,254,547 | $ | 0 | | 0.0 | % |
| | | | | | | | | |
| | | | | | | | | |
The Fund has registration rights for certain restricted securities held as of March 31, 2023. The issuer incurs all registration costs. | |
Janus Henderson Global Select Fund
Notes to Schedule of Investments and Other Information (unaudited)
| | | | | | | | | | | | | |
The following is a summary of the inputs that were used to value the Fund’s investments in securities and other financial instruments as of March 31, 2023. See Notes to Financial Statements for more information. |
| |
Valuation Inputs Summary |
| | | | | | | |
| | | | | Level 2 - | | Level 3 - |
| | | Level 1 - | | Other Significant | | Significant |
| | | Quoted Prices | | Observable Inputs | | Unobservable Inputs |
| | | | | | | |
Assets | | | | | | |
Investments In Securities: | | | | | | |
Common Stocks | | | | | | |
Aerospace & Defense | $ | - | $ | 98,108,051 | $ | - |
Banks | | 35,864,567 | | 143,120,711 | | - |
Beverages | | 43,730,817 | | 29,907,042 | | - |
Diversified Telecommunication Services | | - | | 53,627,949 | | - |
Electronic Equipment, Instruments & Components | | - | | 53,127,098 | | - |
Hotels, Restaurants & Leisure | | 37,355,074 | | 55,768,375 | | - |
Insurance | | 17,078,976 | | 113,603,289 | | - |
Multiline Retail | | - | | 39,802,261 | | - |
Personal Products | | - | | 49,190,967 | | - |
Pharmaceuticals | | 112,156,312 | | 112,322,570 | | - |
Semiconductor & Semiconductor Equipment | | 12,147,700 | | 132,504,889 | | - |
Textiles, Apparel & Luxury Goods | | 40,469,621 | | 87,796,792 | | - |
Trading Companies & Distributors | | - | | 54,166,716 | | - |
All Other | | 1,003,885,025 | | - | | - |
Private Placements | | - | | - | | 0 |
Investment Companies | | - | | 19,120,042 | | - |
Total Assets | $ | 1,302,688,092 | $ | 1,042,166,752 | $ | 0 |
| | | | | | | |
Janus Henderson Global Select Fund
Statement of Assets and Liabilities (unaudited)
March 31, 2023
| |
See footnotes at the end of the Statement. |
| | | | | | | |
| | | | | | |
Assets: | | | | |
| Unaffiliated investments, at value (cost $1,759,936,625) | | $ | 2,325,734,802 | |
| Affiliated investments, at value (cost $19,118,504) | | | 19,120,042 | |
| Trustees' deferred compensation | | | 58,127 | |
| Receivables: | | | | |
| | Dividends | | | 5,928,649 | |
| | Fund shares sold | | | 2,345,052 | |
| | Foreign tax reclaims | | | 509,887 | |
| | Dividends from affiliates | | | 101,288 | |
| Other assets | | | 180,271 | |
Total Assets | | | 2,353,978,118 | |
Liabilities: | | | | |
| Due to custodian | | | 1,714 | |
| Foreign cash due to custodian | | | 115,209 | |
| Payables: | | | — | |
| | Fund shares repurchased | | | 2,532,257 | |
| | Advisory fees | | | 1,324,102 | |
| | Transfer agent fees and expenses | | | 375,900 | |
| | Trustees' deferred compensation fees | | | 58,127 | |
| | Professional fees | | | 39,279 | |
| | Custodian fees | | | 15,732 | |
| | Trustees' fees and expenses | | | 14,678 | |
| | Affiliated fund administration fees payable | | | 5,174 | |
| | 12b-1 Distribution and shareholder servicing fees | | | 2,424 | |
| | Accrued expenses and other payables | | | 203,757 | |
Total Liabilities | | | 4,688,353 | |
Net Assets | | $ | 2,349,289,765 | |
| | |
See Notes to Financial Statements. |
| |
12 | MARCH 31, 2023 |
Janus Henderson Global Select Fund
Statement of Assets and Liabilities (unaudited)
March 31, 2023
| | | | | | | |
| | | | | | |
| | | | | | | |
Net Assets Consist of: | | | | |
| Capital (par value and paid-in surplus) | | $ | 1,703,259,588 | |
| Total distributable earnings (loss) | | | 646,030,177 | |
Total Net Assets | | $ | 2,349,289,765 | |
Net Assets - Class A Shares | | $ | 6,804,411 | |
| Shares Outstanding, $0.01 Par Value (unlimited shares authorized) | | | 408,257 | |
Net Asset Value Per Share(1) | | $ | 16.67 | |
Maximum Offering Price Per Share(2) | | $ | 17.69 | |
Net Assets - Class C Shares | | $ | 881,323 | |
| Shares Outstanding, $0.01 Par Value (unlimited shares authorized) | | | 55,949 | |
Net Asset Value Per Share(1) | | $ | 15.75 | |
Net Assets - Class D Shares | | $ | 1,722,374,109 | |
| Shares Outstanding, $0.01 Par Value (unlimited shares authorized) | | | 104,152,044 | |
Net Asset Value Per Share | | $ | 16.54 | |
Net Assets - Class I Shares | | $ | 49,149,349 | |
| Shares Outstanding, $0.01 Par Value (unlimited shares authorized) | | | 2,962,403 | |
Net Asset Value Per Share | | $ | 16.59 | |
Net Assets - Class N Shares | | $ | 35,580,944 | |
| Shares Outstanding, $0.01 Par Value (unlimited shares authorized) | | | 2,149,839 | |
Net Asset Value Per Share | | $ | 16.55 | |
Net Assets - Class R Shares | | $ | 154,202 | |
| Shares Outstanding, $0.01 Par Value (unlimited shares authorized) | | | 9,425 | |
Net Asset Value Per Share | | $ | 16.36 | |
Net Assets - Class S Shares | | $ | 188,208 | |
| Shares Outstanding, $0.01 Par Value (unlimited shares authorized) | | | 11,274 | |
Net Asset Value Per Share | | $ | 16.69 | |
Net Assets - Class T Shares | | $ | 534,157,219 | |
| Shares Outstanding, $0.01 Par Value (unlimited shares authorized) | | | 32,218,504 | |
Net Asset Value Per Share | | $ | 16.58 | |
| |
(1) Redemption price per share may be reduced for any applicable contingent deferred sales charge. (2) Maximum offering price is computed at 100/94.25 of net asset value. |
| | |
See Notes to Financial Statements. |
| |
Janus Investment Fund | 13 |
Janus Henderson Global Select Fund
Statement of Operations (unaudited)
For the period ended March 31, 2023
| | | | | | |
| | | | | |
Investment Income: | | | |
| Dividends | $ | 20,688,648 | |
| Dividends from affiliates | | 771,875 | |
| Affiliated securities lending income, net | | 13,126 | |
| Unaffiliated securities lending income, net | | 3,364 | |
| Other income | | 2,550 | |
| Foreign tax withheld | | (376,365) | |
Total Investment Income | | 21,103,198 | |
Expenses: | | | |
| Advisory fees | | 7,185,093 | |
| 12b-1 Distribution and shareholder servicing fees: | | | |
| | Class A Shares | | 8,203 | |
| | Class C Shares | | 5,516 | |
| | Class R Shares | | 346 | |
| | Class S Shares | | 218 | |
| Transfer agent administrative fees and expenses: | | | |
| | Class D Shares | | 977,126 | |
| | Class R Shares | | 175 | |
| | Class S Shares | | 217 | |
| | Class T Shares | | 640,069 | |
| Transfer agent networking and omnibus fees: | | | |
| | Class A Shares | | 2,094 | |
| | Class C Shares | | 338 | |
| | Class I Shares | | 21,149 | |
| Other transfer agent fees and expenses: | | | |
| | Class A Shares | | 260 | |
| | Class C Shares | | 35 | |
| | Class D Shares | | 183,182 | |
| | Class I Shares | | 1,119 | |
| | Class N Shares | | 717 | |
| | Class R Shares | | 11 | |
| | Class S Shares | | 5 | |
| | Class T Shares | | 3,285 | |
| Shareholder reports expense | | 160,681 | |
| Professional fees | | 107,045 | |
| Registration fees | | 82,257 | |
| Custodian fees | | 65,114 | |
| Trustees’ fees and expenses | | 33,141 | |
| Affiliated fund administration fees | | 28,067 | |
| Other expenses | | 102,583 | |
Total Expenses | | 9,608,046 | |
Less: Excess Expense Reimbursement and Waivers | | (45,684) | |
Net Expenses | | 9,562,362 | |
Net Investment Income/(Loss) | | 11,540,836 | |
| | | | | |
| | |
See Notes to Financial Statements. |
| |
14 | MARCH 31, 2023 |
Janus Henderson Global Select Fund
Statement of Operations (unaudited)
For the period ended March 31, 2023
| | | | | | |
| | | | | |
Net Realized Gain/(Loss) on Investments: | | | |
| Investments and foreign currency transactions | $ | 77,051,319 | |
| Investments in affiliates | | 5,211 | |
Total Net Realized Gain/(Loss) on Investments | | 77,056,530 | |
Change in Unrealized Net Appreciation/Depreciation: | | | |
| Investments, foreign currency translations and Trustees’ deferred compensation | | 316,064,921 | |
| Investments in affiliates | | (1,291) | |
Total Change in Unrealized Net Appreciation/Depreciation | | 316,063,630 | |
Net Increase/(Decrease) in Net Assets Resulting from Operations | $ | 404,660,996 | |
| | | | | |
| | |
See Notes to Financial Statements. |
| |
Janus Investment Fund | 15 |
Janus Henderson Global Select Fund
Statements of Changes in Net Assets
| | | | | | | | | |
| | | | | | | | |
| | | Period ended
March 31, 2023 (unaudited) | | Year ended
September 30, 2022 | |
| | | | | | | | | |
Operations: | | | | | | |
| Net investment income/(loss) | $ | 11,540,836 | | $ | 24,554,338 | |
| Net realized gain/(loss) on investments | | 77,056,530 | | | 47,140,551 | |
| Change in unrealized net appreciation/depreciation | | 316,063,630 | | | (513,007,900) | |
Net Increase/(Decrease) in Net Assets Resulting from Operations | | 404,660,996 | | | (441,313,011) | |
Dividends and Distributions to Shareholders: | | | | | | |
| | Class A Shares | | (163,306) | | | (826,160) | |
| | Class C Shares | | (26,138) | | | (68,065) | |
| | Class D Shares | | (45,052,612) | | | (220,714,191) | |
| | Class I Shares | | (1,110,286) | | | (2,697,365) | |
| | Class N Shares | | (953,930) | | | (3,114,836) | |
| | Class R Shares | | (2,679) | | | (16,669) | |
| | Class S Shares | | (4,436) | | | (15,445) | |
| | Class T Shares | | (13,349,721) | | | (68,619,381) | |
Net Decrease from Dividends and Distributions to Shareholders | | (60,663,108) | | | (296,072,112) | |
Capital Share Transactions: | | | | | | |
| | Class A Shares | | 216,153 | | | 637,559 | |
| | Class C Shares | | 162,742 | | | 170,165 | |
| | Class D Shares | | 7,763,306 | | | 131,997,273 | |
| | Class I Shares | | 20,681,658 | | | 9,202,478 | |
| | Class N Shares | | 10,170,260 | | | 2,920,908 | |
| | Class R Shares | | 11,971 | | | 41,900 | |
| | Class S Shares | | 81,575 | | | (23,685) | |
| | Class T Shares | | 4,386,298 | | | 34,360,785 | |
Net Increase/(Decrease) from Capital Share Transactions | | 43,473,963 | | | 179,307,383 | |
Net Increase/(Decrease) in Net Assets | | 387,471,851 | | | (558,077,740) | |
Net Assets: | | | | | | |
| Beginning of period | | 1,961,817,914 | | | 2,519,895,654 | |
| End of period | $ | 2,349,289,765 | | $ | 1,961,817,914 | |
| | | | | | | | |
| | |
See Notes to Financial Statements. |
| |
16 | MARCH 31, 2023 |
Janus Henderson Global Select Fund
Financial Highlights
| | | | | | | | | | | | | | | | | | | | | | |
Class A Shares | | | | | | | | | | | | | | | | | | |
For a share outstanding during the period ended March 31, 2023 (unaudited) and the year ended September 30 | 2023 | | | 2022 | | | 2021 | | | 2020 | | | 2019 | | | 2018 | |
| Net Asset Value, Beginning of Period | | $14.17 | | | $19.70 | | | $15.56 | | | $15.01 | | | $17.64 | | | $16.16 | |
| Income/(Loss) from Investment Operations: | | | | | | | | | | | | | | | | | | |
| | Net investment income/(loss)(1) | | 0.07 | | | 0.14 | | | 0.10 | | | 0.10 | | | 0.14 | | | 0.09 | |
| | Net realized and unrealized gain/(loss) | | 2.83 | | | (3.38) | | | 4.91 | | | 1.10 | | | (0.58) | | | 1.52 | |
| Total from Investment Operations | | 2.90 | | | (3.24) | | | 5.01 | | | 1.20 | | | (0.44) | | | 1.61 | |
| Less Dividends and Distributions: | | | | | | | | | | | | | | | | | | |
| | Dividends (from net investment income) | | (0.11) | | | (0.10) | | | (0.12) | | | (0.13) | | | (0.06) | | | (0.13) | |
| | Distributions (from capital gains) | | (0.29) | | | (2.19) | | | (0.75) | | | (0.52) | | | (2.13) | | | — | |
| Total Dividends and Distributions | | (0.40) | | | (2.29) | | | (0.87) | | | (0.65) | | | (2.19) | | | (0.13) | |
| Net Asset Value, End of Period | | $16.67 | | | $14.17 | | | $19.70 | | | $15.56 | | | $15.01 | | | $17.64 | |
| Total Return* | | 20.63% | | | (18.45)% | | | 32.96% | | | 7.96% | | | (0.72)% | | | 9.99% | |
| Net Assets, End of Period (in thousands) | | $6,804 | | | $5,582 | | | $7,039 | | | $5,788 | | | $5,380 | | | $4,666 | |
| Average Net Assets for the Period (in thousands) | | $6,568 | | | $6,759 | | | $6,717 | | | $5,354 | | | $4,885 | | | $4,885 | |
| Ratios to Average Net Assets**: | | | | | | | | | | | | | | | | | | |
| | Ratio of Gross Expenses | | 1.05% | | | 1.04% | | | 1.03% | | | 1.06% | | | 1.08% | | | 1.03% | |
| | Ratio of Net Expenses (After Waivers and Expense Offsets) | | 1.05% | | | 1.04% | | | 1.03% | | | 1.06% | | | 1.08% | | | 1.03% | |
| | Ratio of Net Investment Income/(Loss) | | 0.83% | | | 0.83% | | | 0.56% | | | 0.70% | | | 0.97% | | | 0.54% | |
| Portfolio Turnover Rate | | 25% | | | 56% | | | 37% | | | 31% | | | 30% | | | 41% | |
| | | | | | | | | | | | | | | | | | | | | | |
| |
* Total return includes adjustments in accordance with generally accepted accounting principles required at the year or period end and are not annualized for periods of less than one full year. ** Annualized for periods of less than one full year. (1) Per share amounts are calculated based on average shares outstanding during the year or period. |
| | |
See Notes to Financial Statements. |
| |
Janus Investment Fund | 17 |
Janus Henderson Global Select Fund
Financial Highlights
| | | | | | | | | | | | | | | | | | | | | | |
Class C Shares | | | | | | | | | | | | | | | | | | |
For a share outstanding during the period ended March 31, 2023 (unaudited) and the year ended September 30 | 2023 | | | 2022 | | | 2021 | | | 2020 | | | 2019 | | | 2018 | |
| Net Asset Value, Beginning of Period | | $13.42 | | | $18.82 | | | $14.92 | | | $14.42 | | | $17.10 | | | $15.69 | |
| Income/(Loss) from Investment Operations: | | | | | | | | | | | | | | | | | | |
| | Net investment income/(loss)(1) | | (0.01) | | | —(2) | | | (0.06) | | | (0.04) | | | —(2) | | | (0.05) | |
| | Net realized and unrealized gain/(loss) | | 2.68 | | | (3.21) | | | 4.71 | | | 1.06 | | | (0.55) | | | 1.49 | |
| Total from Investment Operations | | 2.67 | | | (3.21) | | | 4.65 | | | 1.02 | | | (0.55) | | | 1.44 | |
| Less Dividends and Distributions: | | | | | | | | | | | | | | | | | | |
| | Dividends (from net investment income) | | (0.05) | | | — | | | — | | | — | | | — | | | (0.03) | |
| | Distributions (from capital gains) | | (0.29) | | | (2.19) | | | (0.75) | | | (0.52) | | | (2.13) | | | — | |
| Total Dividends and Distributions | | (0.34) | | | (2.19) | | | (0.75) | | | (0.52) | | | (2.13) | | | (0.03) | |
| Net Asset Value, End of Period | | $15.75 | | | $13.42 | | | $18.82 | | | $14.92 | | | $14.42 | | | $17.10 | |
| Total Return* | | 20.00% | | | (19.14)% | | | 31.84% | | | 7.00% | | | (1.55)% | | | 9.15% | |
| Net Assets, End of Period (in thousands) | | $881 | | | $564 | | | $586 | | | $676 | | | $1,197 | | | $2,229 | |
| Average Net Assets for the Period (in thousands) | | $1,023 | | | $609 | | | $650 | | | $1,005 | | | $1,534 | | | $2,591 | |
| Ratios to Average Net Assets**: | | | | | | | | | | | | | | | | | | |
| | Ratio of Gross Expenses | | 2.13% | | | 2.16% | | | 2.14% | | | 2.01% | | | 1.94% | | | 1.84% | |
| | Ratio of Net Expenses (After Waivers and Expense Offsets) | | 2.01% | | | 1.87% | | | 1.88% | | | 1.91% | | | 1.94% | | | 1.84% | |
| | Ratio of Net Investment Income/(Loss) | | (0.15)% | | | 0.02% | | | (0.33)% | | | (0.26)% | | | (0.01)% | | | (0.27)% | |
| Portfolio Turnover Rate | | 25% | | | 56% | | | 37% | | | 31% | | | 30% | | | 41% | |
| | | | | | | | | | | | | | | | | | | | | | |
| |
* Total return includes adjustments in accordance with generally accepted accounting principles required at the year or period end and are not annualized for periods of less than one full year. ** Annualized for periods of less than one full year. (1) Per share amounts are calculated based on average shares outstanding during the year or period. (2) Less than $0.005 on a per share basis. |
| | |
See Notes to Financial Statements. |
| |
18 | MARCH 31, 2023 |
Janus Henderson Global Select Fund
Financial Highlights
| | | | | | | | | | | | | | | | | | | | | | |
Class D Shares | | | | | | | | | | | | | | | | | | |
For a share outstanding during the period ended March 31, 2023 (unaudited) and the year ended September 30 | 2023 | | | 2022 | | | 2021 | | | 2020 | | | 2019 | | | 2018 | |
| Net Asset Value, Beginning of Period | | $14.09 | | | $19.60 | | | $15.47 | | | $14.93 | | | $17.55 | | | $16.06 | |
| Income/(Loss) from Investment Operations: | | | | | | | | | | | | | | | | | | |
| | Net investment income/(loss)(1) | | 0.08 | | | 0.18 | | | 0.14 | | | 0.13 | | | 0.17 | | | 0.13 | |
| | Net realized and unrealized gain/(loss) | | 2.81 | | | (3.36) | | | 4.88 | | | 1.10 | | | (0.57) | | | 1.51 | |
| Total from Investment Operations | | 2.89 | | | (3.18) | | | 5.02 | | | 1.23 | | | (0.40) | | | 1.64 | |
| Less Dividends and Distributions: | | | | | | | | | | | | | | | | | | |
| | Dividends (from net investment income) | | (0.15) | | | (0.14) | | | (0.14) | | | (0.17) | | | (0.09) | | | (0.15) | |
| | Distributions (from capital gains) | | (0.29) | | | (2.19) | | | (0.75) | | | (0.52) | | | (2.13) | | | — | |
| Total Dividends and Distributions | | (0.44) | | | (2.33) | | | (0.89) | | | (0.69) | | | (2.22) | | | (0.15) | |
| Net Asset Value, End of Period | | $16.54 | | | $14.09 | | | $19.60 | | | $15.47 | | | $14.93 | | | $17.55 | |
| Total Return* | | 20.70% | | | (18.25)% | | | 33.28% | | | 8.18% | | | (0.51)% | | | 10.22% | |
| Net Assets, End of Period (in thousands) | | $1,722,374 | | | $1,459,358 | | | $1,876,374 | | | $1,494,051 | | | $1,493,415 | | | $1,615,089 | |
| Average Net Assets for the Period (in thousands) | | $1,658,281 | | | $1,787,127 | | | $1,803,402 | | | $1,455,934 | | | $1,479,323 | | | $1,629,405 | |
| Ratios to Average Net Assets**: | | | | | | | | | | | | | | | | | | |
| | Ratio of Gross Expenses | | 0.84% | | | 0.82% | | | 0.82% | | | 0.84% | | | 0.85% | | | 0.84% | |
| | Ratio of Net Expenses (After Waivers and Expense Offsets) | | 0.84% | | | 0.82% | | | 0.82% | | | 0.84% | | | 0.85% | | | 0.84% | |
| | Ratio of Net Investment Income/(Loss) | | 1.04% | | | 1.04% | | | 0.77% | | | 0.91% | | | 1.15% | | | 0.75% | |
| Portfolio Turnover Rate | | 25% | | | 56% | | | 37% | | | 31% | | | 30% | | | 41% | |
| | | | | | | | | | | | | | | | | | | | | | |
| |
* Total return includes adjustments in accordance with generally accepted accounting principles required at the year or period end and are not annualized for periods of less than one full year. ** Annualized for periods of less than one full year. (1) Per share amounts are calculated based on average shares outstanding during the year or period. |
| | |
See Notes to Financial Statements. |
| |
Janus Investment Fund | 19 |
Janus Henderson Global Select Fund
Financial Highlights
| | | | | | | | | | | | | | | | | | | | | | |
Class I Shares | | | | | | | | | | | | | | | | | | |
For a share outstanding during the period ended March 31, 2023 (unaudited) and the year ended September 30 | 2023 | | | 2022 | | | 2021 | | | 2020 | | | 2019 | | | 2018 | |
| Net Asset Value, Beginning of Period | | $14.15 | | | $19.68 | | | $15.53 | | | $14.99 | | | $17.61 | | | $16.12 | |
| Income/(Loss) from Investment Operations: | | | | | | | | | | | | | | | | | | |
| | Net investment income/(loss)(1) | | 0.09 | | | 0.19 | | | 0.16 | | | 0.14 | | | 0.19 | | | 0.15 | |
| | Net realized and unrealized gain/(loss) | | 2.81 | | | (3.38) | | | 4.89 | | | 1.10 | | | (0.58) | | | 1.49 | |
| Total from Investment Operations | | 2.90 | | | (3.19) | | | 5.05 | | | 1.24 | | | (0.39) | | | 1.64 | |
| Less Dividends and Distributions: | | | | | | | | | | | | | | | | | | |
| | Dividends (from net investment income) | | (0.17) | | | (0.15) | | | (0.15) | | | (0.18) | | | (0.10) | | | (0.15) | |
| | Distributions (from capital gains) | | (0.29) | | | (2.19) | | | (0.75) | | | (0.52) | | | (2.13) | | | — | |
| Total Dividends and Distributions | | (0.46) | | | (2.34) | | | (0.90) | | | (0.70) | | | (2.23) | | | (0.15) | |
| Net Asset Value, End of Period | | $16.59 | | | $14.15 | | | $19.68 | | | $15.53 | | | $14.99 | | | $17.61 | |
| Total Return* | | 20.69% | | | (18.23)% | | | 33.31% | | | 8.25% | | | (0.39)% | | | 10.22% | |
| Net Assets, End of Period (in thousands) | | $49,149 | | | $24,004 | | | $22,347 | | | $14,853 | | | $17,024 | | | $17,043 | |
| Average Net Assets for the Period (in thousands) | | $38,191 | | | $22,980 | | | $19,681 | | | $16,194 | | | $16,875 | | | $15,444 | |
| Ratios to Average Net Assets**: | | | | | | | | | | | | | | | | | | |
| | Ratio of Gross Expenses | | 0.81% | | | 0.77% | | | 0.77% | | | 0.78% | | | 0.80% | | | 0.77% | |
| | Ratio of Net Expenses (After Waivers and Expense Offsets) | | 0.81% | | | 0.77% | | | 0.77% | | | 0.78% | | | 0.80% | | | 0.77% | |
| | Ratio of Net Investment Income/(Loss) | | 1.17% | | | 1.12% | | | 0.83% | | | 0.91% | | | 1.27% | | | 0.86% | |
| Portfolio Turnover Rate | | 25% | | | 56% | | | 37% | | | 31% | | | 30% | | | 41% | |
| | | | | | | | | | | | | | | | | | | | | | |
| |
* Total return includes adjustments in accordance with generally accepted accounting principles required at the year or period end and are not annualized for periods of less than one full year. ** Annualized for periods of less than one full year. (1) Per share amounts are calculated based on average shares outstanding during the year or period. |
| | |
See Notes to Financial Statements. |
| |
20 | MARCH 31, 2023 |
Janus Henderson Global Select Fund
Financial Highlights
| | | | | | | | | | | | | | | | | | | | | | |
Class N Shares | | | | | | | | | | | | | | | | | | |
For a share outstanding during the period ended March 31, 2023 (unaudited) and the year ended September 30 | 2023 | | | 2022 | | | 2021 | | | 2020 | | | 2019 | | | 2018 | |
| Net Asset Value, Beginning of Period | | $14.11 | | | $19.64 | | | $15.50 | | | $14.96 | | | $17.58 | | | $16.09 | |
| Income/(Loss) from Investment Operations: | | | | | | | | | | | | | | | | | | |
| | Net investment income/(loss)(1) | | 0.10 | | | 0.20 | | | 0.17 | | | 0.14 | | | 0.19 | | | 0.16 | |
| | Net realized and unrealized gain/(loss) | | 2.81 | | | (3.37) | | | 4.88 | | | 1.12 | | | (0.56) | | | 1.50 | |
| Total from Investment Operations | | 2.91 | | | (3.17) | | | 5.05 | | | 1.26 | | | (0.37) | | | 1.66 | |
| Less Dividends and Distributions: | | | | | | | | | | | | | | | | | | |
| | Dividends (from net investment income) | | (0.18) | | | (0.17) | | | (0.16) | | | (0.20) | | | (0.12) | | | (0.17) | |
| | Distributions (from capital gains) | | (0.29) | | | (2.19) | | | (0.75) | | | (0.52) | | | (2.13) | | | — | |
| Total Dividends and Distributions | | (0.47) | | | (2.36) | | | (0.91) | | | (0.72) | | | (2.25) | | | (0.17) | |
| Net Asset Value, End of Period | | $16.55 | | | $14.11 | | | $19.64 | | | $15.50 | | | $14.96 | | | $17.58 | |
| Total Return* | | 20.83% | | | (18.21)% | | | 33.41% | | | 8.38% | | | (0.28)% | | | 10.34% | |
| Net Assets, End of Period (in thousands) | | $35,581 | | | $21,395 | | | $26,130 | | | $24,271 | | | $37,810 | | | $33,278 | |
| Average Net Assets for the Period (in thousands) | | $30,677 | | | $25,204 | | | $27,543 | | | $29,294 | | | $31,647 | | | $33,126 | |
| Ratios to Average Net Assets**: | | | | | | | | | | | | | | | | | | |
| | Ratio of Gross Expenses | | 0.70% | | | 0.69% | | | 0.68% | | | 0.68% | | | 0.69% | | | 0.68% | |
| | Ratio of Net Expenses (After Waivers and Expense Offsets) | | 0.70% | | | 0.69% | | | 0.68% | | | 0.68% | | | 0.69% | | | 0.68% | |
| | Ratio of Net Investment Income/(Loss) | | 1.22% | | | 1.18% | | | 0.90% | | | 0.97% | | | 1.32% | | | 0.92% | |
| Portfolio Turnover Rate | | 25% | | | 56% | | | 37% | | | 31% | | | 30% | | | 41% | |
| | | | | | | | | | | | | | | | | | | | | | |
| |
* Total return includes adjustments in accordance with generally accepted accounting principles required at the year or period end and are not annualized for periods of less than one full year. ** Annualized for periods of less than one full year. (1) Per share amounts are calculated based on average shares outstanding during the year or period. |
| | |
See Notes to Financial Statements. |
| |
Janus Investment Fund | 21 |
Janus Henderson Global Select Fund
Financial Highlights
| | | | | | | | | | | | | | | | | | | | | | |
Class R Shares | | | | | | | | | | | | | | | | | | |
For a share outstanding during the period ended March 31, 2023 (unaudited) and the year ended September 30 | 2023 | | | 2022 | | | 2021 | | | 2020 | | | 2019 | | | 2018 | |
| Net Asset Value, Beginning of Period | | $13.88 | | | $19.36 | | | $15.29 | | | $14.76 | | | $17.39 | | | $15.99 | |
| Income/(Loss) from Investment Operations: | | | | | | | | | | | | | | | | | | |
| | Net investment income/(loss)(1) | | 0.02 | | | 0.05 | | | —(2) | | | 0.01 | | | 0.05 | | | —(2) | |
| | Net realized and unrealized gain/(loss) | | 2.77 | | | (3.31) | | | 4.82 | | | 1.08 | | | (0.55) | | | 1.49 | |
| Total from Investment Operations | | 2.79 | | | (3.26) | | | 4.82 | | | 1.09 | | | (0.50) | | | 1.49 | |
| Less Dividends and Distributions: | | | | | | | | | | | | | | | | | | |
| | Dividends (from net investment income) | | (0.02) | | | (0.03) | | | — | | | (0.04) | | | — | | | (0.09) | |
| | Distributions (from capital gains) | | (0.29) | | | (2.19) | | | (0.75) | | | (0.52) | | | (2.13) | | | — | |
| Total Dividends and Distributions | | (0.31) | | | (2.22) | | | (0.75) | | | (0.56) | | | (2.13) | | | (0.09) | |
| Net Asset Value, End of Period | | $16.36 | | | $13.88 | | | $19.36 | | | $15.29 | | | $14.76 | | | $17.39 | |
| Total Return* | | 20.21% | | | (18.89)% | | | 32.19% | | | 7.29% | | | (1.21)% | | | 9.32% | |
| Net Assets, End of Period (in thousands) | | $154 | | | $120 | | | $123 | | | $107 | | | $188 | | | $230 | |
| Average Net Assets for the Period (in thousands) | | $140 | | | $135 | | | $118 | | | $170 | | | $198 | | | $459 | |
| Ratios to Average Net Assets**: | | | | | | | | | | | | | | | | | | |
| | Ratio of Gross Expenses | | 3.58% | | | 3.67% | | | 3.94% | | | 3.20% | | | 2.95% | | | 1.76% | |
| | Ratio of Net Expenses (After Waivers and Expense Offsets) | | 1.61% | | | 1.62% | | | 1.60% | | | 1.63% | | | 1.63% | | | 1.56% | |
| | Ratio of Net Investment Income/(Loss) | | 0.30% | | | 0.27% | | | (0.02)% | | | 0.05% | | | 0.37% | | | 0.01% | |
| Portfolio Turnover Rate | | 25% | | | 56% | | | 37% | | | 31% | | | 30% | | | 41% | |
| | | | | | | | | | | | | | | | | | | | | | |
| |
* Total return includes adjustments in accordance with generally accepted accounting principles required at the year or period end and are not annualized for periods of less than one full year. ** Annualized for periods of less than one full year. (1) Per share amounts are calculated based on average shares outstanding during the year or period. (2) Less than $0.005 on a per share basis. |
| | |
See Notes to Financial Statements. |
| |
22 | MARCH 31, 2023 |
Janus Henderson Global Select Fund
Financial Highlights
| | | | | | | | | | | | | | | | | | | | | | |
Class S Shares | | | | | | | | | | | | | | | | | | |
For a share outstanding during the period ended March 31, 2023 (unaudited) and the year ended September 30 | 2023 | | | 2022 | | | 2021 | | | 2020 | | | 2019 | | | 2018 | |
| Net Asset Value, Beginning of Period | | $14.21 | | | $19.71 | | | $15.57 | | | $15.02 | | | $17.74 | | | $16.24 | |
| Income/(Loss) from Investment Operations: | | | | | | | | | | | | | | | | | | |
| | Net investment income/(loss)(1) | | 0.05 | | | 0.08 | | | 0.03 | | | 0.06 | | | 0.10 | | | 0.04 | |
| | Net realized and unrealized gain/(loss) | | 2.83 | | | (3.39) | | | 4.93 | | | 1.09 | | | (0.58) | | | 1.53 | |
| Total from Investment Operations | | 2.88 | | | (3.31) | | | 4.96 | | | 1.15 | | | (0.48) | | | 1.57 | |
| Less Dividends and Distributions: | | | | | | | | | | | | | | | | | | |
| | Dividends (from net investment income) | | (0.11) | | | — | | | (0.07) | | | (0.08) | | | (0.11) | | | (0.07) | |
| | Distributions (from capital gains) | | (0.29) | | | (2.19) | | | (0.75) | | | (0.52) | | | (2.13) | | | — | |
| Total Dividends and Distributions | | (0.40) | | | (2.19) | | | (0.82) | | | (0.60) | | | (2.24) | | | (0.07) | |
| Net Asset Value, End of Period | | $16.69 | | | $14.21 | | | $19.71 | | | $15.57 | | | $15.02 | | | $17.74 | |
| Total Return* | | 20.40% | | | (18.75)% | | | 32.57% | | | 7.61% | | | (0.97)% | | | 9.69% | |
| Net Assets, End of Period (in thousands) | | $188 | | | $82 | | | $139 | | | $227 | | | $248 | | | $251 | |
| Average Net Assets for the Period (in thousands) | | $173 | | | $108 | | | $189 | | | $231 | | | $234 | | | $259 | |
| Ratios to Average Net Assets**: | | | | | | | | | | | | | | | | | | |
| | Ratio of Gross Expenses | | 2.93% | | | 3.97% | | | 2.76% | | | 2.48% | | | 2.47% | | | 1.75% | |
| | Ratio of Net Expenses (After Waivers and Expense Offsets) | | 1.36% | | | 1.37% | | | 1.36% | | | 1.37% | | | 1.36% | | | 1.29% | |
| | Ratio of Net Investment Income/(Loss) | | 0.62% | | | 0.42% | | | 0.16% | | | 0.38% | | | 0.66% | | | 0.25% | |
| Portfolio Turnover Rate | | 25% | | | 56% | | | 37% | | | 31% | | | 30% | | | 41% | |
| | | | | | | | | | | | | | | | | | | | | | |
| |
* Total return includes adjustments in accordance with generally accepted accounting principles required at the year or period end and are not annualized for periods of less than one full year. ** Annualized for periods of less than one full year. (1) Per share amounts are calculated based on average shares outstanding during the year or period. |
| | |
See Notes to Financial Statements. |
| |
Janus Investment Fund | 23 |
Janus Henderson Global Select Fund
Financial Highlights
| | | | | | | | | | | | | | | | | | | | | | |
Class T Shares | | | | | | | | | | | | | | | | | | |
For a share outstanding during the period ended March 31, 2023 (unaudited) and the year ended September 30 | 2023 | | | 2022 | | | 2021 | | | 2020 | | | 2019 | | | 2018 | |
| Net Asset Value, Beginning of Period | | $14.11 | | | $19.63 | | | $15.50 | | | $14.96 | | | $17.57 | | | $16.08 | |
| Income/(Loss) from Investment Operations: | | | | | | | | | | | | | | | | | | |
| | Net investment income/(loss)(1) | | 0.08 | | | 0.17 | | | 0.13 | | | 0.12 | | | 0.16 | | | 0.12 | |
| | Net realized and unrealized gain/(loss) | | 2.81 | | | (3.37) | | | 4.88 | | | 1.10 | | | (0.57) | | | 1.51 | |
| Total from Investment Operations | | 2.89 | | | (3.20) | | | 5.01 | | | 1.22 | | | (0.41) | | | 1.63 | |
| Less Dividends and Distributions: | | | | | | | | | | | | | | | | | | |
| | Dividends (from net investment income) | | (0.13) | | | (0.13) | | | (0.13) | | | (0.16) | | | (0.07) | | | (0.14) | |
| | Distributions (from capital gains) | | (0.29) | | | (2.19) | | | (0.75) | | | (0.52) | | | (2.13) | | | — | |
| Total Dividends and Distributions | | (0.42) | | | (2.32) | | | (0.88) | | | (0.68) | | | (2.20) | | | (0.14) | |
| Net Asset Value, End of Period | | $16.58 | | | $14.11 | | | $19.63 | | | $15.50 | | | $14.96 | | | $17.57 | |
| Total Return* | | 20.68% | | | (18.36)% | | | 33.15% | | | 8.08% | | | (0.54)% | | | 10.17% | |
| Net Assets, End of Period (in thousands) | | $534,157 | | | $450,713 | | | $587,159 | | | $464,956 | | | $484,175 | | | $533,974 | |
| Average Net Assets for the Period (in thousands) | | $512,654 | | | $554,055 | | | $561,617 | | | $464,019 | | | $481,731 | | | $539,796 | |
| Ratios to Average Net Assets**: | | | | | | | | | | | | | | | | | | |
| | Ratio of Gross Expenses | | 0.93% | | | 0.92% | | | 0.92% | | | 0.92% | | | 0.93% | | | 0.92% | |
| | Ratio of Net Expenses (After Waivers and Expense Offsets) | | 0.91% | | | 0.91% | | | 0.91% | | | 0.91% | | | 0.92% | | | 0.91% | |
| | Ratio of Net Investment Income/(Loss) | | 0.97% | | | 0.96% | | | 0.68% | | | 0.83% | | | 1.08% | | | 0.68% | |
| Portfolio Turnover Rate | | 25% | | | 56% | | | 37% | | | 31% | | | 30% | | | 41% | |
| | | | | | | | | | | | | | | | | | | | | | |
| |
* Total return includes adjustments in accordance with generally accepted accounting principles required at the year or period end and are not annualized for periods of less than one full year. ** Annualized for periods of less than one full year. (1) Per share amounts are calculated based on average shares outstanding during the year or period. |
| | |
See Notes to Financial Statements. |
| |
24 | MARCH 31, 2023 |
Janus Henderson Global Select Fund
Notes to Financial Statements (unaudited)
1. Organization and Significant Accounting Policies
Janus Henderson Global Select Fund (the “Fund”) is a series of Janus Investment Fund (the “Trust”), which is organized as a Massachusetts business trust and is registered under the Investment Company Act of 1940, as amended (the “1940 Act”), as an open-end management investment company, and therefore has applied the specialized accounting and reporting guidance in Financial Accounting Standards Board (“FASB”) Accounting Standards Codification (“ASC”) Topic 946. The Trust offers 40 funds, each of which offers multiple share classes, with differing investment objectives and policies. The Fund seeks long-term growth of capital. The Fund is classified as diversified, as defined in the 1940 Act. Janus Henderson Investors US LLC is the investment adviser (the “Adviser”) to the Fund.
The Fund offers multiple classes of shares in order to meet the needs of various types of investors. Each class represents an interest in the same portfolio of investments. Certain financial intermediaries may not offer all classes of shares.
Shareholders, including individuals, accounts, as well as the Fund’s portfolio manager(s) and/or investment personnel, may from time to time own (beneficially or of record) a significant percentage of the Fund’s Shares and can be considered to “control” the Fund when that ownership exceeds 25% of the Fund’s assets (and which may differ from control as determined in accordance with United States of America generally accepted accounting principles ("US GAAP")).
Class A Shares are offered through financial intermediary platforms including, but not limited to, traditional brokerage platforms, mutual fund wrap fee programs, bank trust platforms, and retirement platforms.
Class C Shares are offered through financial intermediary platforms including, but not limited to, traditional brokerage platforms, mutual fund wrap fee programs, and bank trust platforms.
Class C Shares are closed to investments by new employer-sponsored retirement plans and existing employer-sponsored retirement plans are no longer able to make additional purchases or exchanges into Class C Shares.
The Fund currently implements an automatic conversion feature pursuant to which Class C Shares that have been held for eight years are automatically converted to Class A Shares without the imposition of any sales charge, fee or other charge. The conversion will generally occur no later than ten business days in the month following the month of the eighth anniversary of the date of purchase. Class C Shares purchased through the reinvestment of dividends and other distributions on Class C Shares will convert to Class A Shares at the same time as the original Class C Shares with respect to which they were purchased. For Class C Shares held in omnibus accounts on intermediary platforms, the Fund relies on these intermediaries to implement this conversion feature. Your financial intermediary may have separate policies and procedures as to when and how Class C Shares may be converted to Class A Shares.
Effective July 6, 2020, Class D Shares are available to new investors, subject to any closed fund policies for a Fund, as applicable. Previously, Class D Shares were only available to investors who already had a direct account with the Janus Henderson funds; immediate family members or members of the same household of an eligible individual investor; and existing beneficial owners of sole proprietorships or partnerships that hold accounts directly with the Janus Henderson funds.
Class I Shares are available through certain financial intermediary platforms including, but not limited to, mutual fund wrap fee programs, managed account programs, asset allocation programs, bank trust platforms, as well as certain retirement platforms. Class I Shares are also available to certain direct institutional investors including, but not limited to, corporations, certain retirement plans, public plans, and foundations/endowments, who established Class I Share accounts before August 4, 2017.
Class N Shares are generally available only to financial intermediaries purchasing on behalf of: 1) certain adviser-assisted, employer-sponsored retirement plans, including 401(k) plans, 457 plans, 403(b) plans, Taft-Hartley multi-employer plans, profit-sharing and money purchase pension plans, defined benefit plans and certain welfare benefit plans, such as health savings accounts, and nonqualified deferred compensation plans; and 2) retail investors purchasing in qualified or nonqualified accounts, whose accounts are held through an omnibus account at their financial intermediary, and where the financial intermediary requires no payment or reimbursement from the Fund, the Adviser, or its affiliates. Class N Shares are also available to Janus Henderson proprietary products and to certain direct institutional investors approved by Janus Henderson Distributors US LLC (the “Distributor”) including, but not limited to,
Janus Henderson Global Select Fund
Notes to Financial Statements (unaudited)
corporations, certain retirement plans, public plans, and foundations and endowments, subject to minimum investment requirements.
Class R Shares are offered through financial intermediary platforms including, but not limited to, retirement platforms.
Class S Shares are offered through financial intermediary platforms including, but not limited to, retirement platforms and asset allocation, mutual fund wrap, or other discretionary or nondiscretionary fee-based investment advisory programs. In addition, Class S Shares may be available through certain financial intermediaries who have an agreement with the Adviser or its affiliates to offer Class S Shares on their supermarket platforms.
Class T Shares are available through certain financial intermediary platforms including, but not limited to, mutual fund wrap fee programs, managed account programs, asset allocation programs, bank trust platforms, as well as certain retirement platforms. In addition, Class T Shares may be available through certain financial intermediaries who have an agreement with the Adviser or its affiliates to offer Class T Shares on their supermarket platforms.
The following accounting policies have been followed by the Fund and are in conformity with US GAAP.
Investment Valuation
Fund holdings are valued in accordance with policies and procedures established by the Adviser pursuant to Rule 2a-5 under the 1940 Act and approved by and subject to the oversight of the Trustees (the “Valuation Procedures”). Equity securities traded on a domestic securities exchange are generally valued at readily available market quotations, which are (i) the official close prices or (ii) last sale prices on the primary market or exchange in which the securities trade. If such price is lacking for the trading period immediately preceding the time of determination, such securities are generally valued at their current bid price. Equity securities that are traded on a foreign exchange are generally valued at the closing prices on such markets. In the event that there is no current trading volume on a particular security in such foreign exchange, the bid price from the primary exchange is generally used to value the security. Foreign securities and currencies are converted to U.S. dollars using the current spot USD dollar exchange rate in effect at the close of the New York Stock Exchange (“NYSE”). The Fund will determine the market value of individual securities held by it by using prices provided by one or more approved professional pricing services or, as needed, by obtaining market quotations from independent broker-dealers. Most debt securities are valued in accordance with the evaluated bid price supplied by the Adviser-approved pricing service that is intended to reflect market value. The evaluated bid price supplied by the pricing service is an evaluation that may consider factors such as security prices, yields, maturities and ratings. Certain short-term securities maturing within 60 days or less may be evaluated and valued on an amortized cost basis provided that the amortized cost determined approximates market value. Securities for which market quotations or evaluated prices are not readily available or deemed unreliable are valued at fair value determined in good faith by the Adviser pursuant to the Valuation Procedures. Circumstances in which fair valuation may be utilized include, but are not limited to: (i) a significant event that may affect the securities of a single issuer, such as a merger, bankruptcy, or significant issuer-specific development; (ii) an event that may affect an entire market, such as a natural disaster or significant governmental action; (iii) a nonsignificant event such as a market closing early or not opening, or a security trading halt; and (iv) pricing of a nonvalued security and a restricted or nonpublic security. Special valuation considerations may apply with respect to “odd-lot” fixed-income transactions which, due to their small size, may receive evaluated prices by pricing services which reflect a large block trade and not what actually could be obtained for the odd-lot position. The valuation policies provide for the use of systematic fair valuation models provided by independent pricing services to value foreign equity securities in order to adjust for stale pricing, which may occur between the close of certain foreign exchanges and the close of the NYSE. The value of the securities of other mutual funds held by a Fund, if any, will be calculated using the NAV of such mutual funds.
Valuation Inputs Summary
FASB ASC 820, Fair Value Measurements and Disclosures (“ASC 820”), defines fair value, establishes a framework for measuring fair value, and expands disclosure requirements regarding fair value measurements. This standard emphasizes that fair value is a market-based measurement that should be determined based on the assumptions that market participants would use in pricing an asset or liability and establishes a hierarchy that prioritizes inputs to valuation techniques used to measure fair value. These inputs are summarized into three broad levels:
Level 1 – Unadjusted quoted prices in active markets the Fund has the ability to access for identical assets or liabilities.
Janus Henderson Global Select Fund
Notes to Financial Statements (unaudited)
Level 2 – Observable inputs other than unadjusted quoted prices included in Level 1 that are observable for the asset or liability either directly or indirectly. These inputs may include quoted prices for the identical instrument on an inactive market, prices for similar instruments, interest rates, prepayment speeds, credit risk, yield curves, default rates and similar data.
Assets or liabilities categorized as Level 2 in the hierarchy generally include: debt securities fair valued in accordance with the evaluated bid or ask prices supplied by a pricing service; securities traded on OTC markets and listed securities for which no sales are reported that are fair valued at the latest bid price (or yield equivalent thereof) obtained from one or more dealers transacting in a market for such securities or by a pricing service approved by the Fund’s Trustees; certain short-term debt securities with maturities of 60 days or less that are fair valued at amortized cost; and equity securities of foreign issuers whose fair value is determined by using systematic fair valuation models provided by independent third parties in order to adjust for stale pricing which may occur between the close of certain foreign exchanges and the close of the NYSE. Other securities that may be categorized as Level 2 in the hierarchy include, but are not limited to, preferred stocks, bank loans, swaps, investments in unregistered investment companies, options, and forward contracts.
Level 3 – Unobservable inputs for the asset or liability to the extent that relevant observable inputs are not available, representing the Fund’s own assumptions about the assumptions that a market participant would use in valuing the asset or liability, and that would be based on the best information available.
There have been no significant changes in valuation techniques used in valuing any such positions held by the Fund since the beginning of the fiscal period.
The inputs or methodology used for fair valuing securities are not necessarily an indication of the risk associated with investing in those securities. The summary of inputs used as of March 31, 2023 to fair value the Fund’s investments in securities and other financial instruments is included in the “Valuation Inputs Summary” in the Notes to Schedule of Investments and Other Information.
The Fund did not hold a significant amount of Level 3 securities as of March 31, 2023.
Investment Transactions and Investment Income
Investment transactions are accounted for as of the date purchased or sold (trade date). Dividend income is recorded on the ex-dividend date. Certain dividends from foreign securities will be recorded as soon as the Fund is informed of the dividend, if such information is obtained subsequent to the ex-dividend date. Dividends from foreign securities may be subject to withholding taxes in foreign jurisdictions. Non-cash dividends, if any, are recorded on the ex-dividend date at fair value. Interest income is recorded daily on an accrual basis and includes amortization of premiums and accretion of discounts. The Fund classifies gains and losses on prepayments received as an adjustment to interest income. Debt securities may be placed in non-accrual status and related interest income may be reduced by stopping current accruals and writing off interest receivables when collection of all or a portion of interest has become doubtful. Gains and losses are determined on the identified cost basis, which is the same basis used for federal income tax purposes. Income, as well as gains and losses, both realized and unrealized, are allocated daily to each class of shares based upon the ratio of net assets represented by each class as a percentage of total net assets.
Expenses
The Fund bears expenses incurred specifically on its behalf. Each class of shares bears a portion of general expenses, which are allocated daily to each class of shares based upon the ratio of net assets represented by each class as a percentage of total net assets. Expenses directly attributable to a specific class of shares are charged against the operations of such class.
Estimates
The preparation of financial statements in conformity with US GAAP requires management to make estimates and assumptions that affect the reported amount of assets and liabilities and disclosure of contingent assets and liabilities at the date of the financial statements, and the reported amounts of income and expenses during the reporting period. Actual results could differ from those estimates.
Indemnifications
In the normal course of business, the Fund may enter into contracts that contain provisions for indemnification of other parties against certain potential liabilities. The Fund’s maximum exposure under these arrangements is unknown, and
Janus Henderson Global Select Fund
Notes to Financial Statements (unaudited)
would involve future claims that may be made against the Fund that have not yet occurred. Currently, the risk of material loss from such claims is considered remote.
Foreign Currency Translations
The Fund does not isolate that portion of the results of operations resulting from the effect of changes in foreign exchange rates on investments from the fluctuations arising from changes in market prices of securities held at the date of the financial statements. Net unrealized appreciation or depreciation of investments and foreign currency translations arise from changes in the value of assets and liabilities, including investments in securities held at the date of the financial statements, resulting from changes in the exchange rates and changes in market prices of securities held.
Currency gains and losses are also calculated on payables and receivables that are denominated in foreign currencies. The payables and receivables are generally related to foreign security transactions and income translations.
Foreign currency-denominated assets and forward currency contracts may involve more risks than domestic transactions, including currency risk, counterparty risk, political and economic risk, regulatory risk and equity risk. Risks may arise from unanticipated movements in the value of foreign currencies relative to the U.S. dollar.
Dividends and Distributions
The Fund generally declares and distributes dividends of net investment income and realized capital gains (if any) annually. The Fund may treat a portion of the amount paid to redeem shares as a distribution of investment company taxable income and realized capital gains that are reflected in the net asset value. This practice, commonly referred to as “equalization,” has no effect on the redeeming shareholder or a Fund’s total return, but may reduce the amounts that would otherwise be required to be paid as taxable dividends to the remaining shareholders. It is possible that the Internal Revenue Service (IRS) could challenge the Fund's equalization methodology or calculations, and any such challenge could result in additional tax, interest, or penalties to be paid by the Fund.
The Fund may make certain investments in real estate investment trusts (“REITs”) which pay dividends to their shareholders based upon funds available from operations. It is quite common for these dividends to exceed the REITs’ taxable earnings and profits, resulting in the excess portion of such dividends being designated as a return of capital. If the Fund distributes such amounts, such distributions could constitute a return of capital to shareholders for federal income tax purposes.
Federal Income Taxes
The Fund intends to continue to qualify as a regulated investment company and distribute all of its taxable income in accordance with the requirements of Subchapter M of the Internal Revenue Code. Management has analyzed the Fund’s tax positions taken for all open federal income tax years, generally a three-year period, and has concluded that no provision for federal income tax is required in the Fund’s financial statements. The Fund is not aware of any tax positions for which it is reasonably possible that the total amounts of unrecognized tax benefits will significantly change in the next twelve months.
2. Other Investments and Strategies
Additional Investment Risk
The U.S. government and the Federal Reserve, as well as certain foreign governments and central banks, have taken extraordinary actions to support local and global economies and the financial markets in response to the COVID-19 pandemic. This and other government intervention into the economy and financial markets to address the COVID-19 pandemic may not work as intended, particularly if the efforts are perceived by investors as being unlikely to achieve the desired results. Government actions to mitigate the economic impact of the pandemic have resulted in a large expansion of government deficits and debt, the long term consequences of which are not known. The COVID-19 pandemic could adversely affect the value and liquidity of a Fund’s investments, impair a Fund’s ability to satisfy redemption requests, and negatively impact a Fund’s performance. In addition, the outbreak of COVID-19, and measures taken to mitigate its effects, could result in disruptions to the services provided to a Fund by its service providers.
Widespread disease, including pandemics and epidemics, and natural or environmental disasters, including those which may be attributable to global climate change, such as earthquakes, fires, floods, hurricanes, tsunamis and weather-related phenomena generally, have been and can be highly disruptive to economies and markets, adversely impacting individual companies, sectors, industries, markets, currencies, interest and inflation rates, credit ratings, investor
Janus Henderson Global Select Fund
Notes to Financial Statements (unaudited)
sentiment, and other factors affecting the value of a Fund’s investments. Economies and financial markets throughout the world have become increasingly interconnected, which increases the likelihood that events or conditions in one region or country will adversely affect markets or issuers in other regions or countries, including the United States. These disruptions could prevent a Fund from executing advantageous investment decisions in a timely manner and negatively impact a Fund’s ability to achieve its investment objective(s). Any such event(s) could have a significant adverse impact on the value of a Fund. In addition, these disruptions could also impair the information technology and other operational systems upon which the Fund’s service providers, including the Adviser or the subadviser (as applicable), rely, and could otherwise disrupt the ability of employees of the Fund’s service providers to perform essential tasks on behalf of the Fund. Adverse weather conditions may also have a particularly significant negative effect on issuers in the agricultural sector and on insurance and reinsurance companies that insure or reinsure against the impact of natural disasters.
A number of countries in the European Union (the “EU”) have experienced, and may continue to experience, severe economic and financial difficulties. In particular, many EU nations are susceptible to economic risks associated with high levels of debt. Many non-governmental issuers, and even certain governments, have defaulted on, or been forced to restructure, their debts. Many other issuers have faced difficulties obtaining credit or refinancing existing obligations. Financial institutions have in many cases required government or central bank support, have needed to raise capital, and/or have been impaired in their ability to extend credit. As a result, financial markets in the EU have experienced extreme volatility and declines in asset values and liquidity. These difficulties may continue, worsen, or spread further within the EU. Responses to these financial problems by European governments, central banks, and others, including austerity measures and reforms, may not work, may result in social unrest, and may limit future growth and economic recovery or have other unintended consequences. Among other things, these developments have adversely affected the value and exchange rate of the euro and pound sterling, and may continue to significantly affect the economies of all EU countries, which in turn may have a material adverse effect on the Fund’s investments in such countries, other countries that depend on EU countries for significant amounts of trade or investment, or issuers with exposure to debt issued by certain EU countries.
Emerging Market Investing
Within the parameters of its specific investment policies, the Fund may invest in securities of issuers or companies from or with exposure to one or more “developing countries” or “emerging market countries.” Such countries include but are not limited to countries included in the MSCI Emerging Markets IndexSM. Emerging market countries in which the Fund may invest include frontier market countries, the economies of which are less developed than other emerging market countries. To the extent that the Fund invests a significant amount of its assets in one or more of these countries, its returns and net asset value may be affected to a large degree by events and economic conditions in such countries. The risks of foreign investing are heightened when investing in emerging markets, which may result in the price of investments in emerging markets experiencing sudden and sharp price swings. In many developing markets, there is less government supervision and regulation of stock exchanges, brokers, and listed companies, making these investments potentially more volatile in price and less liquid than investments in developed securities markets, resulting in greater risk to investors. Similarly, issuers in such markets may not be subject to regulatory, accounting, auditing, and financial reporting and recordkeeping standards comparable to those to which U.S. companies are subject. There is a risk in developing countries that a current or future economic or political crisis could lead to price controls, forced mergers of companies, expropriation or confiscatory taxation, imposition or enforcement of foreign ownership limits, seizure, nationalization, sanctions or imposition of restrictions by various governmental entities on investment and trading, or creation of government monopolies, any of which may have a detrimental effect on the Fund’s investments. In addition, the Fund’s investments may be denominated in foreign currencies and therefore, changes in the value of a country’s currency compared to the U.S. dollar may affect the value of the Fund’s investments. To the extent that the Fund invests a significant portion of its assets in the securities of issuers in or companies of a single country or region, it is more likely to be impacted by events or conditions affecting that country or region, which could have a negative impact on the Fund’s performance. Developing countries may also experience a higher level of exposure and vulnerability to the adverse effects of climate change. This can be attributed to both the geographic location of emerging market countries and/or a country’s lack of access to technology or resources to adjust and adapt to its effects. An increased occurrence and severity of natural disasters and extreme weather events such as droughts and decreased crop yields, heat waves, flooding and rising sea levels, and increased spread of disease, could cause harmful effects to the performance of affected economies. Additionally, foreign and emerging market risks, including, but not limited to, price controls, expropriation or confiscatory taxation, imposition or enforcement of foreign ownership limits,
Janus Henderson Global Select Fund
Notes to Financial Statements (unaudited)
nationalization, and restrictions on repatriation of assets may be heightened to the extent the Fund invests in Chinese local market securities.
Restricted Security Transactions
Restricted securities held by the Fund may not be sold except in exempt transactions or in a public offering registered under the Securities Act of 1933, as amended. The risk of investing in such securities is generally greater than the risk of investing in the securities of widely held, publicly traded companies. Lack of a secondary market and resale restrictions may result in the inability of the Fund to sell a security at a fair price and may substantially delay the sale of the security. In addition, these securities may exhibit greater price volatility than securities for which secondary markets exist.
Counterparties
Fund transactions involving a counterparty are subject to the risk that the counterparty or a third party will not fulfill its obligation to the Fund (“counterparty risk”). Counterparty risk may arise because of the counterparty’s financial condition (i.e., financial difficulties, bankruptcy, or insolvency), market activities and developments, or other reasons, whether foreseen or not. A counterparty’s inability to fulfill its obligation may result in significant financial loss to the Fund. The Fund may be unable to recover its investment from the counterparty or may obtain a limited recovery, and/or recovery may be delayed. The extent of the Fund’s exposure to counterparty risk with respect to financial assets and liabilities approximates its carrying value.
The Fund may be exposed to counterparty risk through participation in various programs, including, but not limited to, lending its securities to third parties, cash sweep arrangements whereby the Fund’s cash balance is invested in one or more types of cash management vehicles, as well as investments in, but not limited to, repurchase agreements, debt securities, and derivatives, including various types of swaps, futures and options. The Fund intends to enter into financial transactions with counterparties that the Adviser believes to be creditworthy at the time of the transaction. There is always the risk that the Adviser’s analysis of a counterparty’s creditworthiness is incorrect or may change due to market conditions. To the extent that the Fund focuses its transactions with a limited number of counterparties, it will have greater exposure to the risks associated with one or more counterparties.
Securities Lending
Under procedures adopted by the Trustees, the Fund may seek to earn additional income by lending securities to certain qualified broker-dealers and institutions. JPMorgan Chase Bank, National Association acts as securities lending agent and a limited purpose custodian or subcustodian to receive and disburse cash balances and cash collateral, hold short-term investments, hold collateral, and perform other custodial functions in accordance with the Non-Custodial Securities Lending Agreement. For financial reporting purposes, the Fund does not offset financial instruments’ payables and receivables and related collateral on the Statement of Assets and Liabilities. The Fund may lend fund securities in an amount equal to up to 1/3 of its total assets as determined at the time of the loan origination. There is the risk of delay in recovering a loaned security or the risk of loss in collateral rights if the borrower fails financially. In addition, the Adviser makes efforts to balance the benefits and risks from granting such loans. All loans will be continuously secured by collateral which may consist of cash, U.S. Government securities, domestic and foreign short-term debt instruments, letters of credit, time deposits, repurchase agreements, money market mutual funds or other money market accounts, or such other collateral as permitted by the Securities and Exchange Commission (the "SEC"). If the Fund is unable to recover a security on loan, the Fund may use the collateral to purchase replacement securities in the market. There is a risk that the value of the collateral could decrease below the cost of the replacement security by the time the replacement investment is made, resulting in a loss to the Fund. In certain circumstances individual loan transactions could yield negative returns.
Upon receipt of cash collateral, the Adviser may invest it in affiliated or non-affiliated cash management vehicles, whether registered or unregistered entities, as permitted by the 1940 Act and rules promulgated thereunder. The Adviser currently intends to primarily invest the cash collateral in a cash management vehicle for which the Adviser serves as investment adviser, Janus Henderson Cash Collateral Fund LLC, or in time deposits. An investment in Janus Henderson Cash Collateral Fund LLC is generally subject to the same risks that shareholders experience when investing in similarly structured vehicles, such as the potential for significant fluctuations in assets as a result of the purchase and redemption activity of the securities lending program, a decline in the value of the collateral, and possible liquidity issues. Such risks may delay the return of the cash collateral and cause the Fund to violate its agreement to return the cash collateral to a borrower in a timely manner. As adviser to the Fund and Janus Henderson Cash Collateral Fund LLC, the Adviser has an inherent conflict of interest as a result of its fiduciary duties to both the Fund
Janus Henderson Global Select Fund
Notes to Financial Statements (unaudited)
and Janus Henderson Cash Collateral Fund LLC. Additionally, the Adviser receives an investment advisory fee of 0.05% for managing Janus Henderson Cash Collateral Fund LLC, but it may not receive a fee for managing certain other affiliated cash management vehicles in which the Fund may invest, and therefore may have an incentive to allocate preferred investment opportunities to investment vehicles for which it is receiving a fee.
The value of the collateral must be at least 102% of the market value of the loaned securities that are denominated in U.S. dollars and 105% of the market value of the loaned securities that are not denominated in U.S. dollars. Loaned securities and related collateral are marked-to-market each business day based upon the market value of the loaned securities at the close of business, employing the most recent available pricing information. Collateral levels are then adjusted based on this mark-to-market evaluation. Additional required collateral, or excess collateral returned, is delivered on the next business day. Therefore, the value of the collateral held may be temporarily less than 102% or 105% value of the securities on loan. The cash collateral invested by the Adviser is disclosed in the Schedule of Investments (if applicable).
Income earned from the investment of the cash collateral, net of rebates paid to, or fees paid by, borrowers and less the fees paid to the lending agent are included as “Affiliated securities lending income, net” on the Statement of Operations.
There were no securities on loan as of March 31, 2023.
3. Investment Advisory Agreements and Other Transactions with Affiliates
The Fund pays the Adviser an investment advisory fee which is calculated daily and paid monthly. The Fund’s contractual investment advisory fee rate (expressed as an annual rate) is 0.64% of its average daily net assets.
The Adviser has contractually agreed to waive the investment advisory fee and/or reimburse operating expenses to the extent that the Fund’s total annual fund operating expenses, excluding the fees payable pursuant to a Rule 12b-1 plan, shareholder servicing fees, such as transfer agency fees (including out-of-pocket costs), administrative services fees and any networking/omnibus payable by any share class, brokerage commissions, interest, dividends, taxes, acquired fund fees and expenses, and extraordinary expenses, exceed the annual rate of 0.81% of the Fund’s average daily net assets. The Adviser has agreed to continue the waivers for at least a one-year period commencing January 27, 2023. The previous expense limit (for the one-year period commencing January 28, 2022) was 0.87%. If applicable, amounts waived and/or reimbursed to the Fund by the Adviser are disclosed as “Excess Expense Reimbursement and Waivers” on the Statement of Operations.
The Adviser serves as administrator to the Fund pursuant to an administration agreement between the Adviser and the Trust. Under the administration agreement, the Adviser is authorized to perform, or cause others to perform certain administration, compliance, and accounting services to the Fund, including providing office space for the Fund, and is reimbursed by the Fund for certain of its costs in providing these services (to the extent the Adviser seeks reimbursement and such costs are not otherwise waived). In addition, employees of the Adviser and/or its affiliates may serve as officers of the Trust. The Fund pays for some or all of the salaries, fees, and expenses of the Adviser employees and Fund officers, with respect to certain specified administration functions they perform on behalf of the Fund. The Fund pays these costs based on out-of-pocket expenses incurred by the Adviser, and these costs are separate and apart from advisory fees and other expenses paid in connection with the investment advisory services the Adviser (or any subadvisor, as applicable) provides to the Fund. These amounts are disclosed as “Affiliated fund administration fees” on the Statement of Operations. In addition, some expenses related to compensation payable to the Fund’s Chief Compliance Officer and certain compliance staff, all of whom are employees of the Adviser and/or its affiliates, are shared with the Fund. Total compensation of $114,430 was paid to the Chief Compliance Officer and certain compliance staff by the Trust during the period ended March 31, 2023. The Fund's portion is reported as part of “Other expenses” on the Statement of Operations.
Janus Henderson Services US LLC (the “Transfer Agent”), a wholly-owned subsidiary of the Adviser, is the Fund’s transfer agent. The Transfer Agent provides or arranges for the provision of shareholder services including, but not limited to, recordkeeping, subaccounting, answering inquiries regarding accounts, order processing, transaction confirmations, the mailing of prospectuses and shareholder reports, and other shareholder services provided to or on behalf of shareholders. These amounts are disclosed as “Transfer agent administrative fees and expenses” on the Statement of Operations.
Janus Henderson Global Select Fund
Notes to Financial Statements (unaudited)
Class D Shares of the Fund pay the Transfer Agent an annual administrative services fee based on the average daily net assets of Class D Shares as detailed below.
| | |
Average Daily Net Assets of Class D Shares of the Janus Henderson funds | Administrative Services Fee |
Under $40 billion | 0.12% |
$40 billion – $49.9 billion | 0.10% |
Over $49.9 billion | 0.08% |
During the reporting period, the administrative services fee rate was 0.12%.
The Transfer Agent receives an administrative services fee at an annual rate of up to 0.25% of the average daily net assets of the Fund’s Class R Shares, Class S Shares, and Class T Shares for providing or procuring administrative services to investors in Class R Shares, Class S Shares, and Class T Shares of the Fund. The Transfer Agent expects to use all or a significant portion of this fee to compensate retirement plan service providers, broker-dealers, bank trust departments, financial advisors, and other financial intermediaries for providing these services. The Transfer Agent may keep certain amounts retained for reimbursement of out-of-pocket costs incurred for servicing clients of Class R Shares, Class S Shares, and Class T Shares.
Shareholder Services provided by these financial intermediaries may include, but are not limited to, recordkeeping, subaccounting, order processing, providing order confirmations, periodic statements, forwarding prospectuses, shareholder reports, and other materials to existing customers, answering inquiries regarding accounts, and other administrative services. Order processing includes the submission of transactions through the National Securities Clearing Corporation (“NSCC”) or similar systems, or those processed on a manual basis with the Adviser. For all share classes, the Transfer Agent also seeks reimbursement for costs it incurs as transfer agent and for providing servicing.
Certain, but not all, intermediaries may charge administrative fees to investors in Class A Shares, Class C Shares, and Class I Shares for administrative services provided on behalf of such investors. These administrative fees are paid by the Class A Shares, Class C Shares, and Class I Shares of the Fund to the Transfer Agent, which uses such fees to reimburse intermediaries. Consistent with the Transfer Agency Agreement between the Transfer Agent and the Fund, the Transfer Agent may negotiate the level, structure, and/or terms of the administrative fees with intermediaries requiring such fees on behalf of the Fund. The Adviser and its affiliates benefit from an increase in assets that may result from such relationships. The Adviser has agreed to limit these fees up to 0.20% for Class A Shares and Class C Shares, and up to 0.15% for Class I Shares on an annual basis based on the daily net assets of each share class. Such limits are subject to change by the Trustees in the future. These amounts are disclosed as “Transfer agent networking and omnibus fees” on the Statement of Operations.
The Transfer Agent is not compensated for its services related to the shares, except for out-of-pocket costs, although the Transfer Agent is compensated for its services related to Fund’s Class D Shares. These amounts are disclosed as “Other transfer agent fees and expenses” on the Statement of Operations.
Under distribution and shareholder servicing plans (the “Plans”) adopted in accordance with Rule 12b-1 under the 1940 Act, the Fund pays the Trust’s distributor, the Distributor, a wholly-owned subsidiary of the Adviser, a fee for the sale and distribution and/or shareholder servicing of the shares based on the average daily net assets for each share class at an annual rate of up to 0.25% for Class A Shares, up to 1.00% for Class C Shares, of up to 0.50% of the Class R Shares' average daily net assets, and up to 0.25% for Class S Shares. Under the terms of the Plans, the Trust is authorized to make payments to the Distributor for remittance to retirement plan service providers, broker-dealers, bank trust departments, financial advisors, and other financial intermediaries, as compensation for distribution and/or shareholder services performed by such entities for their customers who are investors in the Fund. These amounts are disclosed as “12b-1 Distribution and shareholder servicing fees” on the Statement of Operations.
Class A Shares include a 5.75% upfront sales charge of the offering price of the Fund. The sales charge is allocated between the Distributor and financial intermediaries. During the period ended March 31, 2023, the Distributor retained upfront sales charges of $314.
A contingent deferred sales charge (“CDSC”) of 1.00% will be deducted with respect to Class A Shares purchased without a sales load and redeemed within 12 months of purchase, unless waived. Any applicable CDSC will be 1.00% of the lesser of the original purchase price or the value of the redemption of the Class A Shares redeemed. There were
Janus Henderson Global Select Fund
Notes to Financial Statements (unaudited)
no CDSCs paid by redeeming shareholders of Class A Shares to the Distributor during the period ended March 31, 2023.
A CDSC of 1.00% will be deducted with respect to Class C Shares redeemed within 12 months of purchase, unless waived. Any applicable CDSC will be 1.00% of the lesser of the original purchase price or the value of the redemption of the Class C Shares redeemed. There were no CDSCs paid by redeeming shareholders of Class C Shares during the period ended March 31, 2023.
The Board of Trustees has adopted a deferred compensation plan (the “Deferred Plan”) for independent Trustees to elect to defer receipt of all or a portion of the annual compensation they are entitled to receive from the Fund. All deferred fees are credited to an account established in the name of the Trustees. The amounts credited to the account then increase or decrease, as the case may be, in accordance with the performance of one or more of the Janus Henderson funds that are selected by the Trustees. The account balance continues to fluctuate in accordance with the performance of the selected fund or funds until final payment of all amounts are credited to the account. The fluctuation of the account balance is recorded by the Fund as unrealized appreciation/(depreciation) and is included as of March 31, 2023 on the Statement of Assets and Liabilities in the asset, “Trustees’ deferred compensation,” and liability, “Trustees’ deferred compensation fees.” Additionally, the recorded unrealized appreciation/(depreciation) is included in “Total distributable earnings (loss)” on the Statement of Assets and Liabilities. Deferred compensation expenses for the period ended March 31, 2023 are included in “Trustees’ fees and expenses” on the Statement of Operations. Trustees are allowed to change their designation of mutual funds from time to time. Amounts will be deferred until distributed in accordance with the Deferred Plan. Deferred fees of $205,688 were paid by the Trust to the Trustees under the Deferred Plan during the period ended March 31, 2023.
Pursuant to the provisions of the 1940 Act and related rules, the Fund may participate in an affiliated or non-affiliated cash sweep program. In the cash sweep program, uninvested cash balances of the Fund may be used to purchase shares of affiliated or non-affiliated money market funds or cash management pooled investment vehicles that operate as money market funds. The Fund is eligible to participate in the cash sweep program (the “Investing Funds”). The Adviser has an inherent conflict of interest because of its fiduciary duties to the affiliated money market funds or cash management pooled investment vehicles and the Investing Funds. Janus Henderson Cash Liquidity Fund LLC (the “Sweep Vehicle”) is an affiliated unregistered cash management pooled investment vehicle that invests primarily in highly-rated short-term fixed-income securities. The Sweep Vehicle operates pursuant to the provisions of the 1940 Act that govern the operation of money market funds and prices its shares at NAV reflecting market-based values of its portfolio securities (i.e., a “floating” NAV) rounded to the fourth decimal place (e.g., $1.0000). The Sweep Vehicle is permitted to impose a liquidity fee (of up to 2%) on redemptions from the Sweep Vehicle or a redemption gate that temporarily suspends redemptions from the Sweep Vehicle for up to 10 business days during a 90 day period. There are no restrictions on the Fund's ability to withdraw investments from the Sweep Vehicle at will, and there are no unfunded capital commitments due from the Fund to the Sweep Vehicle. The Sweep Vehicle does not charge any management fee, sales charge or service fee.
Any purchases and sales, realized gains/losses and recorded dividends from affiliated investments during the period ended March 31, 2023 can be found in the “Schedules of Affiliated Investments” located in the Schedule of Investments.
As of March 31, 2023, shares of the Fund were owned by affiliates of the Adviser, and/or other funds advised by the Adviser, as indicated in the table below:
| | | | | | |
Class | % of Class Owned | | % of Fund Owned | | |
Class A Shares | - | % | - | % | |
Class C Shares | - | | - | | |
Class D Shares | - | | - | | |
Class I Shares | - | | - | | |
Class N Shares | 80 | | 1 | | |
Class R Shares | - | | - | | |
Class S Shares | - | | - | | |
Class T Shares | - | | - | | |
| | | | | | |
Janus Henderson Global Select Fund
Notes to Financial Statements (unaudited)
4. Federal Income Tax
Income and capital gains distributions are determined in accordance with income tax regulations that may differ from US GAAP. These differences are due to differing treatments for items such as net short-term gains, deferral of wash sale losses, foreign currency transactions, net investment losses, and capital loss carryovers.
The Fund has elected to treat gains and losses on forward foreign currency contracts as capital gains and losses, if applicable. Other foreign currency gains and losses on debt instruments are treated as ordinary income for federal income tax purposes pursuant to Section 988 of the Internal Revenue Code.
The aggregate cost of investments and the composition of unrealized appreciation and depreciation of investment securities for federal income tax purposes as of March 31, 2023 are noted below. The primary differences between book and tax appreciation or depreciation of investments are wash sale loss deferrals and investments in partnerships.
| | | | |
Federal Tax Cost | Unrealized
Appreciation | Unrealized
(Depreciation) | Net Tax Appreciation/
(Depreciation) |
$ 1,782,052,953 | $636,220,337 | $(73,418,446) | $ 562,801,891 |
Janus Henderson Global Select Fund
Notes to Financial Statements (unaudited)
5. Capital Share Transactions
| | | | | | | |
| | | | | | |
| | Period ended March 31, 2023 | | Year ended September 30, 2022 |
| | Shares | Amount | | Shares | Amount |
| | | | | | | |
Class A Shares: | | | | | |
Shares sold | 38,042 | $ 605,087 | | 45,159 | $ 797,321 |
Reinvested dividends and distributions | 9,502 | 149,282 | | 43,875 | 750,710 |
Shares repurchased | (33,149) | (538,216) | | (52,420) | (910,472) |
Net Increase/(Decrease) | 14,395 | $ 216,153 | | 36,614 | $ 637,559 |
Class C Shares: | | | | | |
Shares sold | 67,981 | $ 994,396 | | 12,911 | $ 201,178 |
Reinvested dividends and distributions | 1,755 | 26,138 | | 4,173 | 68,065 |
Shares repurchased | (55,788) | (857,792) | | (6,217) | (99,078) |
Net Increase/(Decrease) | 13,948 | $ 162,742 | | 10,867 | $ 170,165 |
Class D Shares: | | | | | |
Shares sold | 1,051,647 | $16,919,572 | | 1,789,338 | $ 30,973,256 |
Reinvested dividends and distributions | 2,806,176 | 43,720,218 | | 12,616,979 | 214,236,297 |
Shares repurchased | (3,303,923) | (52,876,484) | | (6,550,382) | (113,212,280) |
Net Increase/(Decrease) | 553,900 | $ 7,763,306 | | 7,855,935 | $131,997,273 |
Class I Shares: | | | | | |
Shares sold | 1,666,211 | $27,204,603 | | 700,589 | $ 11,575,199 |
Reinvested dividends and distributions | 69,568 | 1,087,351 | | 151,400 | 2,581,372 |
Shares repurchased | (470,074) | (7,610,296) | | (291,023) | (4,954,093) |
Net Increase/(Decrease) | 1,265,705 | $20,681,658 | | 560,966 | $ 9,202,478 |
Class N Shares: | | | | | |
Shares sold | 703,834 | $11,319,821 | | 217,485 | $ 3,531,454 |
Reinvested dividends and distributions | 61,189 | 953,930 | | 183,226 | 3,114,836 |
Shares repurchased | (130,930) | (2,103,491) | | (215,725) | (3,725,382) |
Net Increase/(Decrease) | 634,093 | $10,170,260 | | 184,986 | $ 2,920,908 |
Class R Shares: | | | | | |
Shares sold | 652 | $ 10,547 | | 1,868 | $ 33,827 |
Reinvested dividends and distributions | 171 | 2,646 | | 977 | 16,461 |
Shares repurchased | (79) | (1,222) | | (510) | (8,388) |
Net Increase/(Decrease) | 744 | $ 11,971 | | 2,335 | $ 41,900 |
Class S Shares: | | | | | |
Shares sold | 5,548 | $ 83,151 | | 187 | $ 3,213 |
Reinvested dividends and distributions | 282 | 4,436 | | 897 | 15,445 |
Shares repurchased | (358) | (6,012) | | (2,324) | (42,343) |
Net Increase/(Decrease) | 5,472 | $ 81,575 | | (1,240) | $ (23,685) |
Class T Shares: | | | | | |
Shares sold | 1,443,147 | $23,322,781 | | 2,015,918 | $ 35,089,015 |
Reinvested dividends and distributions | 836,147 | 13,060,618 | | 3,930,772 | 66,901,743 |
Shares repurchased | (2,001,180) | (31,997,101) | | (3,922,873) | (67,629,973) |
Net Increase/(Decrease) | 278,114 | $ 4,386,298 | | 2,023,817 | $ 34,360,785 |
6. Purchases and Sales of Investment Securities
For the period ended March 31, 2023, the aggregate cost of purchases and proceeds from sales of investment securities (excluding any short-term securities, short-term options contracts, TBAs, and in-kind transactions, as applicable) was as follows:
| | | | |
Purchases of
Securities | Proceeds from Sales
of Securities | Purchases of Long-
Term U.S. Government
Obligations | Proceeds from Sales
of Long-Term U.S.
Government Obligations |
$ 550,999,943 | $ 555,768,421 | $ - | $ - |
Janus Henderson Global Select Fund
Notes to Financial Statements (unaudited)
7. Recent Accounting Pronouncements
The FASB issued Accounting Standards Update 2022-03: Fair Value Measurement of Equity Securities Subject to Contractual Sale Restrictions (“ASU 2022-03”) in June 2022. The new guidance in the ASU clarifies existing guidance in ASC 820 related to the fair value measurement of an equity security subject to contractual sale restrictions with the intent to reduce diversity in interpretation. Under the guidance, a contractual restriction on the sale of an equity security would not be considered when measuring fair value as such restriction is not treated as part of the equity security’s unit of account. The amendments would be applied prospectively on or after adoption date to equity securities with a contract containing a sale restriction that is executed or modified after such date. The effective date set by the FASB is December 15, 2023, with early adoption permitted. The Adviser is currently evaluating whether to early adopt and does not anticipate it to have a material impact on the Fund.
8. Subsequent Event
Management has evaluated whether any events or transactions occurred subsequent to March 31, 2023 and through the date of issuance of the Fund’s financial statements and determined that there were no material events or transactions that would require recognition or disclosure in the Fund’s financial statements.
Janus Henderson Global Select Fund
Additional Information (unaudited)
Proxy Voting Policies and Voting Record
A description of the policies and procedures that the Fund uses to determine how to vote proxies relating to its portfolio securities is available without charge: (i) upon request, by calling 1-800-525-1093; (ii) on the Fund’s website at janushenderson.com/proxyvoting; and (iii) on the SEC’s website at http://www.sec.gov. Additionally, information regarding the Fund’s proxy voting record for the most recent twelve-month period ended June 30 is also available, free of charge, through janushenderson.com/proxyvoting and from the SEC’s website at http://www.sec.gov.
Full Holdings
The Fund files its complete portfolio holdings (schedule of investments) with the SEC as an exhibit to Form N-PORT within 60 days of the end of the first and third fiscal quarters, and in the annual report and semiannual report to shareholders. The Fund’s Form N-PORT filings and annual and semiannual reports: (i) are available on the SEC’s website at http://www.sec.gov; and (ii) are available without charge, upon request, by calling a Janus Henderson representative at 1-877-335-2687 (toll free) (or 1-800-525-3713 if you hold Class D Shares). Portfolio holdings consisting of at least the names of the holdings are generally available on a monthly basis with a 30-day lag under Full Holdings for the Fund at janushenderson.com/info (or janushenderson.com/reports if you hold Class D Shares).
APPROVAL OF ADVISORY AGREEMENTS DURING THE PERIOD
The Trustees of Janus Aspen Series, each of whom serves as an “independent” Trustee (the “Trustees”), oversee the management of each portfolio of Janus Aspen Series (each, a “VIT Portfolio,” and collectively, the “VIT Portfolios”), as well as each fund of Janus Investment Fund (each, a “Fund,” and collectively, the “Funds” and together with the VIT Portfolios, the “Janus Henderson Funds,” and each, a “Janus Henderson Fund”). As required by law, the Trustees determine annually whether to continue the investment advisory agreement for each Janus Henderson Fund.
In connection with their most recent consideration of those agreements for each Janus Henderson Fund, the Trustees received and reviewed information provided by Janus Henderson Investors US LLC (the “Adviser”) in response to requests of the Trustees and their independent legal counsel. They also received and reviewed information and analysis provided by, and in response to requests of, their independent fee consultant. Throughout their consideration of the agreements, the Trustees were advised by their independent legal counsel. The Trustees met with management to consider the agreements, and also met separately in executive session with their independent legal counsel and their independent fee consultant.
At meetings held on November 9-10, 2022 and December 13-14, 2022, the Trustees evaluated the information provided by the Adviser and the independent fee consultant, as well as other information provided by the Adviser and the independent fee consultant during the year. Following such evaluation, the Trustees determined that the overall arrangements between each Janus Henderson Fund and the Adviser were fair and reasonable in light of the nature, extent, and quality of the services provided by the Adviser and its affiliates, the fees charged for those services, and other matters that the Trustees considered relevant in the exercise of their business judgment, and unanimously approved the continuation of the investment advisory agreement for each Janus Henderson Fund for the period from February 1, 2023 through February 1, 2024, subject to earlier termination as provided for in each agreement.
In considering the continuation of those agreements, the Trustees reviewed and analyzed various factors that they determined were relevant, including the factors described below, none of which by itself was considered dispositive. However, the material factors and conclusions that formed the basis for the Trustees’ determination to approve the continuation of the agreements are discussed separately below. Also included is a summary of the independent fee consultant’s conclusions and opinions that arose during, and were included as part of, the Trustees’ consideration of the agreements. “Management fees,” as used herein, reflect actual annual advisory fees and, for the purpose of peer comparisons any administration fees (excluding out of pocket costs), net of any waivers, paid by a fund as a percentage of average net assets.
Nature, Extent and Quality of Services
The Trustees reviewed the nature, extent, and quality of the services provided by the Adviser to the Janus Henderson Funds, taking into account the investment objective, strategies, and policies of each Janus Henderson Fund, and the knowledge the Trustees gained from their regular meetings with management on at least a quarterly basis and their ongoing review of information related to the Janus Henderson Funds. In addition, the Trustees reviewed the resources and key personnel of the Adviser, particularly noting those employees who provide investment and risk management services to the Janus Henderson Funds. The Trustees also considered other services provided to the Janus Henderson
Janus Henderson Global Select Fund
Additional Information (unaudited)
Funds by the Adviser, such as managing the execution of portfolio transactions and the selection of broker-dealers for those transactions. The Trustees considered the Adviser’s role as administrator to the Janus Henderson Funds, noting that the Adviser generally does not receive a fee for its services as administrator, but is reimbursed for its out-of-pocket costs. The Trustees considered the role of the Adviser in monitoring adherence to the Janus Henderson Funds’ investment restrictions, providing support services for the Trustees and Trustee committees, and overseeing communications with Janus Henderson Fund shareholders and the activities of other service providers, including monitoring compliance with various policies and procedures of the Janus Henderson Funds and with applicable securities laws and regulations.
In this regard, the independent fee consultant noted that the Adviser provides a number of different services for the Janus Henderson Funds and their shareholders, ranging from investment management services to various other servicing functions, and that, in its view, the Adviser is a capable provider of those services. The independent fee consultant also provided its belief that the Adviser has developed a number of institutional competitive advantages that should enable it to provide superior investment and service performance over the long term.
The Trustees concluded that the nature, extent, and quality of the services provided by the Adviser to each Janus Henderson Fund were appropriate and consistent with the terms of the respective advisory agreements, and that, taking into account steps taken to address those Janus Henderson Funds whose performance lagged that of their peers for certain periods, the Janus Henderson Funds were likely to benefit from the continued provision of those services. They also concluded that the Adviser had sufficient personnel, with the appropriate education and experience, to serve the Janus Henderson Funds effectively and had demonstrated its ability to attract well-qualified personnel.
Performance of the Funds
The Trustees considered the performance results of each Janus Henderson Fund over various time periods. They noted that they considered Janus Henderson Fund performance data throughout the year, including periodic meetings with each Janus Henderson Fund’s portfolio manager(s), and also reviewed information comparing each Janus Henderson Fund’s performance with the performance of comparable fund peer groups identified by Broadridge Financial Solutions, Inc. (“Broadridge”), an independent data provider, and with the Janus Henderson Fund’s benchmark index. In this regard, the independent fee consultant found that the overall Janus Henderson Funds’ performance has been reasonable, noting that: (i) for the 36 months ended May 31, 2022, approximately 38% of the Janus Henderson Funds were in the top two quartiles of their Broadridge peer groups; (ii) for the 36 months ended September 30, 2022, approximately 45% of the Janus Henderson Funds were in the top two quartiles of performance as reported by Morningstar, and (iii) for the 12 months ended September 30, 2022, approximately 55% of the Janus Henderson Funds were in the top two quartiles of performance as reported by Morningstar.
The Trustees considered the performance of each Janus Henderson Fund, noting that performance may vary by share class, and noted the following with respect to the Funds:
Asset Allocation Funds
· For Janus Henderson Global Allocation Fund – Conservative, the Trustees noted that the Fund’s performance was in the third Broadridge quartile for the 36 months ended May 31, 2022 and the bottom Broadridge quartile for the 12 months ended May 31, 2022. The Trustees noted the reasons for the Fund’s underperformance and the steps the Adviser had taken or was taking to improve performance.
· For Janus Henderson Global Allocation Fund – Growth, the Trustees noted that the Fund’s performance was in the bottom Broadridge quartile for the 36 months ended May 31, 2022 and the bottom Broadridge quartile for the 12 months ended May 31, 2022. The Trustees noted the reasons for the Fund’s underperformance and the steps the Adviser had taken or was taking to improve performance.
· For Janus Henderson Global Allocation Fund – Moderate, the Trustees noted that the Fund’s performance was in the bottom Broadridge quartile for the 36 months ended May 31, 2022 and the bottom Broadridge quartile for the 12 months ended May 31, 2022. The Trustees noted the reasons for the Fund’s underperformance and the steps the Adviser had taken or was taking to improve performance.
Fixed-Income Funds
· For Janus Henderson Absolute Return Income Opportunities Fund, the Trustees noted that the Fund’s performance was in the third Broadridge quartile for the 36 months ended May 31, 2022 and the first Broadridge quartile for the 12 months ended May 31, 2022. The Trustees noted the reasons for the Fund’s underperformance,
Janus Henderson Global Select Fund
Additional Information (unaudited)
the steps the Adviser had taken or was taking to improve performance, and that the performance trend was improving.
· For Janus Developed World Bond Fund, the Trustees noted that the Fund’s performance was in the bottom Broadridge quartile for the 36 months ended May 31, 2022 and the bottom Broadridge quartile for the 12 months ended May 31, 2022. The Trustees noted the reasons for the Fund’s underperformance and the steps the Adviser had taken or was taking to improve performance.
· For Janus Henderson Flexible Bond Fund, the Trustees noted that the Fund’s performance was in the first Broadridge quartile for the 36 months ended May 31, 2022 and the second Broadridge quartile for the 12 months ended May 31, 2022.
· For Janus Henderson Global Bond Fund, the Trustees noted that the Fund’s performance was in the third Broadridge quartile for the 36 months ended May 31, 2022 and the bottom Broadridge quartile for the 12 months ended May 31, 2022. The Trustees noted the reasons for the Fund’s underperformance and the steps the Adviser had taken or was taking to improve performance.
· For Janus Henderson High-Yield Fund, the Trustees noted that the Fund’s performance was in the third Broadridge quartile for the 36 months ended May 31, 2022 and the bottom Broadridge quartile for the 12 months ended May 31, 2022. The Trustees noted the reasons for the Fund’s underperformance and the steps the Adviser had taken or was taking to improve performance.
· For Janus Henderson Multi-Sector Income Fund, the Trustees noted that the Fund’s performance was in the second Broadridge quartile for the 36 months ended May 31, 2022 and the third Broadridge quartile for the 12 months ended May 31, 2022.
· For Janus Henderson Short Duration Flexible Bond Fund, the Trustees noted that the Fund’s performance was in the third Broadridge quartile for the 36 months ended May 31, 2022 and the bottom Broadridge quartile for the 12 months ended May 31, 2022. The Trustees noted the reasons for the Fund’s underperformance and the steps the Adviser had taken or was taking to improve performance.
Global and International Equity Funds
· For Janus Henderson Asia Equity Fund, the Trustees noted that the Fund’s performance was in the third Broadridge quartile for the 36 months ended May 31, 2022 and the third Broadridge quartile for the 12 months ended May 31, 2022. The Trustees noted the reasons for the Fund’s underperformance, while also noting that the Fund has a performance fee structure that results in lower management fees during periods of underperformance, and the steps the Adviser had taken or was taking to improve performance.
· For Janus Henderson Emerging Markets Fund, the Trustees noted that the Fund’s performance was in the third Broadridge quartile for the 36 months ended May 31, 2022 and the third Broadridge quartile for the 12 months ended May 31, 2022. The Trustees noted the reasons for the Fund’s underperformance and the steps the Adviser had taken or was taking to improve performance.
· For Janus Henderson European Focus Fund, the Trustees noted that the Fund’s performance was in the first Broadridge quartile for the 36 months ended May 31, 2022 and the second Broadridge quartile for the 12 months ended May 31, 2022.
· For Janus Henderson Global Equity Income Fund, the Trustees noted that the Fund’s performance was in the third Broadridge quartile for the 36 months ended May 31, 2022 and the first Broadridge quartile for the 12 months ended May 31, 2022. The Trustees noted the reasons for the Fund’s underperformance, the steps the Adviser had taken or was taking to improve performance, and that the performance trend was improving.
· For Janus Henderson Global Life Sciences Fund, the Trustees noted that the Fund’s performance was in the third Broadridge quartile for the 36 months ended May 31, 2022 and the second Broadridge quartile for the 12 months ended May 31, 2022. The Trustees noted the reasons for the Fund’s underperformance, the steps the Adviser had taken or was taking to improve performance, and that the performance trend was improving.
· For Janus Henderson Global Sustainable Equity Fund, the Trustees noted that the Fund’s performance was in the second Broadridge quartile for the 12 months ended May 31, 2022. The Trustees noted that 36 month-end performance was not yet available.
Janus Henderson Global Select Fund
Additional Information (unaudited)
· For Janus Henderson Global Real Estate Fund, the Trustees noted that the Fund’s performance was in the second Broadridge quartile for the 36 months ended May 31, 2022 and the bottom Broadridge quartile for the 12 months ended May 31, 2022.
· For Janus Henderson Global Research Fund, the Trustees noted that the Fund’s performance was in the second Broadridge quartile for the 36 months ended May 31, 2022 and the first Broadridge quartile for the 12 months ended May 31, 2022.
· For Janus Henderson Global Select Fund, the Trustees noted that the Fund’s performance was in the first Broadridge quartile for the 36 months ended May 31, 2022 and the first Broadridge quartile for the 12 months ended May 31, 2022.
· For Janus Henderson Global Technology and Innovation Fund, the Trustees noted that the Fund’s performance was in the second Broadridge quartile for the 36 months ended May 31, 2022 and the second Broadridge quartile for the 12 months ended May 31, 2022.
· For Janus Henderson International Opportunities Fund, the Trustees noted that the Fund’s performance was in the bottom Broadridge quartile for the 36 months ended May 31, 2022 and the third Broadridge quartile for the 12 months ended May 31, 2022. The Trustees noted the reasons for the Fund’s underperformance and the steps the Adviser had taken or was taking to improve performance.
· For Janus Henderson Overseas Fund, the Trustees noted that the Fund’s performance was in the first Broadridge quartile for the 36 months ended May 31, 2022 and the first Broadridge quartile for the 12 months ended May 31, 2022.
· For Janus Henderson Responsible International Dividend Fund (formerly the Janus Henderson Dividend & Income Builder Fund), the Trustees noted that the Fund’s performance was in the bottom Broadridge quartile for the 36 months ended May 31, 2022 and the bottom Broadridge quartile for the 12 months ended May 31, 2022. The Trustees noted the reasons for the Fund’s underperformance and the steps the Adviser had taken or was taking to improve performance.
Money Market Funds
· For Janus Henderson Government Money Market Fund, the Trustees noted that the Fund’s performance was in the third Broadridge quartile for the 36 months ended May 31, 2022 and the bottom Broadridge quartile for the 12 months ended May 31, 2022. The Trustees noted the reasons for the Fund’s underperformance and the steps the Adviser had taken or was taking to improve performance.
· For Janus Henderson Money Market Fund, the Trustees noted that the Fund’s performance was in the third Broadridge quartile for the 36 months ended May 31, 2022 and the bottom Broadridge quartile for the 12 months ended May 31, 2022. The Trustees noted the reasons for the Fund’s underperformance and the steps the Adviser had taken or was taking to improve performance.
Multi-Asset Funds
· For Janus Henderson Adaptive Global Allocation Fund, the Trustees noted that the Fund’s performance was in bottom Broadridge quartile for the 36 months ended May 31, 2022 and the second Broadridge quartile for the 12 months ended May 31, 2022. The Trustees noted the reasons for the Fund’s underperformance, the steps the Adviser had taken or was taking to improve performance, and that the performance trend was improving.
· For Janus Henderson Balanced Fund, the Trustees noted that the Fund’s performance was in the first Broadridge quartile for the 36 months ended May 31, 2022 and the first Broadridge quartile for the 12 months ended May 31, 2022.
U.S. Equity Funds
· For Janus Henderson Adaptive Risk Managed U.S. Equity Fund, the Trustees noted that the Fund’s performance was in the bottom Broadridge quartile for the 36 months ended May 31, 2022 and the second Broadridge quartile for the 12 months ended May 31, 2022. The Trustees noted the reasons for the Fund’s underperformance, the steps the Adviser had taken or were taking to improve performance, and that the performance trend was improving.
Janus Henderson Global Select Fund
Additional Information (unaudited)
· For Janus Henderson Contrarian Fund, the Trustees noted that the Fund’s performance was in the first Broadridge quartile for the 36 months ended May 31, 2022 and the bottom Broadridge quartile for the 12 months ended May 31, 2022.
· For Janus Henderson Enterprise Fund, the Trustees noted that the Fund’s performance was in the second Broadridge quartile for the 36 months ended May 31, 2022 and the first Broadridge quartile for the 12 months ended May 31, 2022.
· For Janus Henderson Forty Fund, the Trustees noted that the Fund’s performance was in the third Broadridge quartile for the 36 months ended May 31, 2022 and the bottom Broadridge quartile for the 12 months ended May 31, 2022. The Trustees noted the reasons for the Fund’s underperformance and the steps the Adviser had taken or was taking to improve performance.
· For Janus Henderson Growth and Income Fund, the Trustees noted that the Fund’s performance was in the bottom Broadridge quartile for the 36 months ended May 31, 2022 and the first Broadridge quartile for the 12 months ended May 31, 2022. The Trustees noted the reasons for the Fund’s underperformance, the steps the Adviser had taken or was taking to improve performance, and that the performance trend was improving.
· For Janus Henderson Mid Cap Value Fund, the Trustees noted that the Fund’s performance was in the bottom Broadridge quartile for the 36 months ended May 31, 2022 and the second Broadridge quartile for the 12 months ended May 31, 2022. The Trustees noted the reasons for the Fund’s underperformance, while also noting that the Fund has a performance fee structure that results in lower management fees during periods of underperformance, the steps the Adviser had taken or was taking to improve performance, and that the performance trend was improving.
· For Janus Henderson Research Fund, the Trustees noted that the Fund’s performance was in the third Broadridge quartile for the 36 months ended May 31, 2022 and the third Broadridge quartile for the 12 months ended May 31, 2022. The Trustees noted the reasons for the Fund’s underperformance, while also noting that the Fund has a performance fee structure that results in lower management fees during periods of underperformance and the steps the Adviser had taken or was taking to improve performance.
· For Janus Henderson Small Cap Value Fund, the Trustees noted that the Fund’s performance was in the bottom Broadridge quartile for the 36 months ended May 31, 2022 and the second Broadridge quartile for the 12 months ended May 31, 2022. The Trustees noted the reasons for the Fund’s underperformance, while also noting that the Fund has a performance fee structure that results in lower management fees during periods of underperformance, the steps the Adviser had taken or was taking to improve performance, and that the performance trend was improving.
· For Janus Henderson Small-Mid Cap Value Fund, the Trustees noted that the Fund’s performance was in the bottom Broadridge quartile for the 36 months ended May 31, 2022 and the second Broadridge quartile for the 12 months ended May 31, 2022. The Trustees noted the reasons for the Fund’s underperformance, while also noting that the Fund has a performance fee structure that results in lower management fees during periods of underperformance, the steps the Adviser had taken or was taking to improve performance, and that the performance trend is improving.
· For Janus Henderson Triton Fund, the Trustees noted that the Fund’s performance was in the bottom Broadridge quartile for the 36 months ended May 31, 2022 and the second Broadridge quartile for the 12 months ended May 31, 2022. The Trustees noted the reasons for the Fund’s underperformance, the steps the Adviser had taken or was taking to improve performance, and that the performance trend was improving.
· For Janus Henderson Venture Fund, the Trustees noted that the Fund’s performance was in the bottom Broadridge quartile for the 36 months ended May 31, 2022 and the second Broadridge quartile for the 12 months ended May 31, 2022. The Trustees noted the reasons for the Fund’s underperformance, the steps the Adviser had taken or was taking to improve performance, and that the performance trend was improving.
In consideration of each Janus Henderson Fund’s performance, the Trustees concluded that, taking into account the factors relevant to performance, as well as other considerations, including steps taken to improve performance, as applicable, the Janus Henderson Fund’s performance warranted continuation of such Janus Henderson Fund’s investment advisory agreement.
Janus Henderson Global Select Fund
Additional Information (unaudited)
Costs of Services Provided
The Trustees examined information regarding the fees and expenses of each Janus Henderson Fund in comparison to similar information for other comparable funds as provided by Broadridge, an independent data provider. They also reviewed an analysis of that information provided by their independent fee consultant. The independent fee consultant provided its belief that the management fees charged by the Adviser to each of the Janus Henderson Funds under the current investment advisory and administration agreements are reasonable in relation to the services provided by the Adviser. The independent fee consultant found: (1) the total expenses and management fees of the Janus Henderson Funds to be reasonable relative to other comparable mutual funds; (2) the total expenses, on average, were 6% under the average total expenses of the respective Broadridge peer group; and (3) the management fees for the Janus Henderson Funds, on average, were 5% under the average management fees for the respective Broadridge peer group. The Trustees also considered the total expenses for each share class of each Janus Henderson Fund compared to the average total expenses for its Broadridge Expense Group and to average total expenses for its Broadridge Expense Universe.
For Janus Henderson Funds with three or more years of performance history, the independent fee consultant also performed a systematic “focus list” analysis of expenses which assessed fund fees in the context of fund performance being delivered. Based on this analysis, the independent fee consultant found that the combination of service quality/performance and expenses on these individual Janus Henderson Funds was reasonable in light of performance trends, performance histories, changes in portfolio management, relative average net asset levels, and the existence of performance fees, breakpoints, and/or expense waivers on such Janus Henderson Funds.
The Trustees considered the methodology used by the Adviser in determining compensation payable to portfolio managers, the competitive environment for investment management talent, and the competitive market for mutual funds in different distribution channels.
The Trustees also reviewed management fees charged by the Adviser to comparable separate account clients and to comparable non-affiliated funds subadvised by the Adviser (for which the Adviser provides only or primarily portfolio management services). Although in most instances subadvisory and separate account fee rates for various investment strategies were lower than management fee rates for Janus Henderson Funds having a similar strategy, the Trustees considered that the Adviser noted that, under the terms of the management agreements with the Janus Henderson Funds, the Adviser performs significant additional services for the Janus Henderson Funds that it does not provide to those other clients, including administration services, oversight of the Janus Henderson Funds’ other service providers, Trustee support, regulatory compliance and numerous other services, and that, in serving the Janus Henderson Funds, the Adviser assumes many legal risks and other costs that it does not assume in servicing its other clients. Moreover, the Trustees noted that the independent fee consultant found that: (1) the management fees the Adviser charges to the Janus Henderson Funds are reasonable in relation to the management fees the Adviser charges to funds subadvised by the Adviser and to the fees the Adviser charges to its institutional separate account clients; (2) these subadvised and institutional separate accounts have different service and infrastructure needs and operate in markets very different from the retail fund market; (3) Janus Henderson mutual fund investors enjoy reasonable fees relative to the fees charged in these other markets; and (4) as part of its 2022 review, 9 of 11 Janus Henderson Funds have lower management fees than similar funds subadvised by the Adviser. The Trustees noted that for the two Janus Henderson Funds that did not, management fees for each were under the average of its 15(c) peer group.
The Trustees considered the fees for each Janus Henderson Fund for its fiscal year ended in 2021 and noted the following with regard to each Janus Henderson Fund’s total expenses, net of applicable fee waivers (the Fund’s “total expenses”) as reflected in the comparative information provided by Broadridge:
Asset Allocation Funds
· For Janus Henderson Global Allocation Fund – Conservative, the Trustees noted that, although the Fund’s total expenses exceeded the peer group average for certain share classes, overall the Fund’s total expenses were reasonable. The Trustees also noted that the Adviser has contractually agreed to limit the Fund’s expenses.
· For Janus Henderson Global Allocation Fund – Growth, the Trustees noted that, although the Fund’s total expenses exceeded the peer group average for certain share classes, overall the Fund’s total expenses were reasonable. The Trustees also noted that the Adviser has contractually agreed to limit the Fund’s expenses, although this limit did not apply because the Fund’s total expenses as shown were below the applicable fee limit.
Janus Henderson Global Select Fund
Additional Information (unaudited)
· For Janus Henderson Global Allocation Fund – Moderate, the Trustees noted that, although the Fund’s total expenses exceeded the peer group average for one share class, overall the Fund’s total expenses were reasonable. The Trustees also noted that the Adviser has contractually agreed to limit the Fund’s expenses.
Fixed-Income Funds
· For Janus Henderson Absolute Return Income Opportunities Fund, the Trustees noted that, although the Fund’s total expenses exceeded the peer group average for certain share classes, overall the Fund’s total expenses were reasonable. The Trustees also noted that the Adviser has contractually agreed to limit the Fund’s expenses.
· For Janus Henderson Developed World Bond Fund, the Trustees noted that, although the Fund’s total expenses exceeded the peer group average for one share class, overall the Fund’s total expenses were reasonable. The Trustees also noted that the Adviser has contractually agreed to limit the Fund’s expenses.
· For Janus Henderson Flexible Bond Fund, the Trustees noted that, although the Fund’s total expenses exceeded the peer group average for certain share classes, overall the Fund’s total expenses were reasonable. The Trustees also noted that the Adviser has contractually agreed to limit the Fund’s expenses, although this limit did not apply because the Fund’s total expenses as shown were below the applicable fee limit.
· For Janus Henderson Global Bond Fund, the Trustees noted that, although the Fund’s total expenses exceeded the peer group average for certain share classes, overall the Fund’s total expenses were reasonable. The Trustees also noted that the Adviser has contractually agreed to limit the Fund’s expenses.
· For Janus Henderson High-Yield Fund, the Trustees noted that, although the Fund’s total expenses exceeded the peer group average for certain share classes, overall the Fund’s total expenses were reasonable. The Trustees also noted that the Adviser has contractually agreed to limit the Fund’s expenses.
· For Janus Henderson Multi-Sector Income Fund, the Trustees noted that, although the Fund’s total expenses exceeded the peer group average for certain share classes, overall the Fund’s total expenses were reasonable. The Trustees also noted that the Adviser has contractually agreed to limit the Fund’s expenses.
· For Janus Henderson Short Duration Flexible Bond Fund, the Trustees noted that, although the Fund’s total expenses exceeded the peer group average for certain share classes, overall the Fund’s total expenses were reasonable. The Trustees also noted that the Adviser has contractually agreed to limit the Fund’s expenses.
Global and International Equity Funds
· For Janus Henderson Asia Equity Fund, the Trustees noted that, although the Fund’s total expenses exceeded the peer group average for certain share classes, overall the Fund’s total expenses were reasonable. The Trustees also noted that the Adviser has contractually agreed to limit the Fund’s expenses.
· For Janus Henderson Emerging Markets Fund, the Trustees noted that, although the Fund’s total expenses exceeded the peer group average for certain share classes, overall the Fund’s total expenses were reasonable. The Trustees also noted that the Adviser has contractually agreed to limit the Fund’s expenses.
· For Janus Henderson European Focus Fund, the Trustees noted that, although the Fund’s total expenses exceeded the peer group average for one share class, overall the Fund’s expenses were reasonable. The Trustees also noted that the Adviser has contractually agreed to limit the Fund’s expenses.
· For Janus Henderson Global Equity Income Fund, the Trustees noted that, although the Fund’s total expenses exceeded the peer group average for one share class, overall the Fund’s total expenses were reasonable. The Trustees also noted that the Adviser has contractually agreed to limit the Fund’s expenses, although this limit did not apply because the Fund’s total expenses as shown were below the applicable fee limit.
· For Janus Henderson Global Life Sciences Fund, the Trustees noted that the Fund’s total expenses were below the peer group average for all share classes.
· For Janus Henderson Global Real Estate Fund, the Trustees noted that, although the Fund’s total expenses exceeded the peer group average for certain share classes, overall the Fund’s total expenses were reasonable. The Trustees also noted that the Adviser has contractually agreed to limit the Fund’s expenses, although this limit did not apply because the Fund’s total expenses as shown were below the applicable fee limit.
Janus Henderson Global Select Fund
Additional Information (unaudited)
· For Janus Henderson Global Research Fund, the Trustees noted that, although the Fund’s total expenses exceeded the peer group average for one share class, overall the Fund’s total expenses were reasonable. The Trustees also noted that the Adviser has contractually agreed to limit the Fund’s expenses, although this limit did not apply because the Fund’s total expenses as shown were below the applicable fee limit.
· For Janus Henderson Global Select Fund, the Trustees noted that, although the Fund’s total expenses exceeded the peer group average for certain share classes, overall the Fund’s total expenses were reasonable. The Trustees also noted that the Adviser has contractually agreed to limit the Fund’s expenses.
· For Janus Henderson Global Sustainable Equity Fund, the Trustees noted that, although the Fund’s total expenses exceeded the peer group average for certain share classes, overall the Fund’s expenses were reasonable. The Trustees also noted that the Adviser has contractually agreed to limit the Fund’s expenses.
· For Janus Henderson Global Technology and Innovation Fund, the Trustees noted that the Fund’s total expenses were below the peer group average for all share classes.
· For Janus Henderson International Opportunities Fund, the Trustees noted that, although the Fund’s total expenses exceeded the peer group average for certain share classes, overall the Fund’s expenses were reasonable. The Trustees also noted that the Adviser has contractually agreed to limit the Fund’s expenses.
· For Janus Henderson Overseas Fund, the Trustees noted that although the Fund’s total expenses exceeded the peer group average for certain share classes, overall the Fund’s total expenses were reasonable. The Trustees also noted that the Adviser has contractually agreed to limit the Fund’s expenses, although this limit did not apply because the Fund’s total expenses as shown were below the applicable fee limit.
· For Janus Henderson Responsible International Dividend Fund (formerly the Janus Henderson Dividend & Income Builder Fund), the Trustees noted that, although the Fund’s total expenses exceeded the peer group for one share class, overall the Fund’s total expenses were reasonable. The Trustees also noted that the Adviser has contractually agreed to limit the Fund’s expenses.
Money Market Funds
· For Janus Henderson Government Money Market Fund, the Trustees noted that the Fund’s total expenses were below the peer group average for all share classes.
· For Janus Henderson Money Market Fund, the Trustees noted that the Fund’s total expenses were below the peer group average for all share classes.
Multi-Asset Funds
· For Janus Henderson Adaptive Global Allocation Fund, the Trustees noted that, that the Fund’s total expenses were below the peer group average for all share classes.
· For Janus Henderson Balanced Fund, the Trustees noted that, although the Fund’s total expenses exceeded the peer group average for certain share classes, overall the Fund’s total expenses were reasonable. The Trustees also noted that the Adviser has contractually agreed to limit the Fund’s expenses, although this limit did not apply because the Fund’s total expenses as shown were below the applicable fee limit.
U.S. Equity Funds
· For Janus Henderson Adaptive Risk Managed U.S. Equity Fund, the Trustees noted that, although the Fund’s total expenses exceeded the peer group average for certain share classes, overall the Fund’s total expenses were reasonable. The Trustees also noted that the Adviser has contractually agreed to limit the Fund’s expenses, although this limit did not apply because the Fund’s total expenses as shown were below the applicable fee limit.
· For Janus Henderson Contrarian Fund, the Trustees noted that, although the Fund’s total expenses exceeded the peer group average for all share classes, overall the Fund’s total expenses were reasonable. The Trustees also noted that the Adviser had contractually agreed to limit the Fund’s expenses.
· For Janus Henderson Enterprise Fund, the Trustees noted that, although the Fund’s total expenses exceeded the peer group average for certain share classes, overall the Fund’s total expenses were reasonable. The Trustees also noted that the Adviser has contractually agreed to limit the Fund’s expenses, although this limit did not apply because the Fund’s total expenses as shown were below the applicable fee limit.
Janus Henderson Global Select Fund
Additional Information (unaudited)
· For Janus Henderson Forty Fund, the Trustees noted that, although the Fund’s total expenses exceeded the peer group average for certain share classes, overall the Fund’s total expenses were reasonable. The Trustees also noted that the Adviser has contractually agreed to limit the Fund’s expenses, although this limit did not apply because the Fund’s total expenses as shown were below the applicable fee limit.
· For Janus Henderson Growth and Income Fund, the Trustees noted that, although the Fund’s total expenses exceeded the peer group average for certain share classes, overall the Fund’s total expenses were reasonable. The Trustees also noted that the Adviser has contractually agreed to limit the Fund’s expenses, although this limit did not apply because the Fund’s total expenses as shown were below the applicable fee limit.
· For Janus Henderson Mid Cap Value Fund, the Trustees noted that the Fund’s total expenses were below the peer group average for all share classes.
· For Janus Henderson Research Fund, the Trustees noted that, although the Fund’s total expenses exceeded the peer group average for certain share classes, overall the Fund’s total expenses were reasonable. The Trustees also noted that the Adviser has contractually agreed to limit the Fund’s expenses.
· For Janus Henderson Small Cap Value Fund, the Trustees noted that, although the Fund’s total expenses exceeded the peer group average for one share class, overall the Fund’s total expenses were reasonable. The Trustees also noted that the Adviser has contractually agreed to limit the Fund’s expenses, although this limit did not apply because the Fund’s total expenses as shown were below the applicable fee limit.
· For Janus Henderson Small-Mid Cap Value Fund, the Trustees noted that the Fund’s total expenses were below the peer group average for all share classes.
· For Janus Henderson Triton Fund, the Trustees noted that, although the Fund’s total expenses exceeded the peer group average for one share class, overall the Fund’s total expenses were reasonable. The Trustees also noted that the Adviser has contractually agreed to limit the Fund’s expenses, although this limit did not apply because the Fund’s total expenses as shown were below the applicable fee limit.
· For Janus Henderson Venture Fund, the Trustees noted that although the Fund’s total expenses exceeded the peer group average for one share class, overall the Fund’s total expenses were reasonable. The Trustees also noted that the Adviser has contractually agreed to limit the Fund’s expenses, although this limit did not apply because the Fund’s total expenses as shown were below the applicable fee limit.
The Trustees reviewed information on the overall profitability to the Adviser and its affiliates from their relationships with the Janus Henderson Funds, and considered profitability data of other publicly traded mutual fund advisers. The Trustees recognized that profitability comparisons among fund managers are difficult because of the variation in the type of comparative information that is publicly available, and the profitability of any fund manager is affected by numerous factors, including the organizational structure of the particular fund manager, differences in complex size, difference in product mix, difference in types of business (mutual fund, institutional and other), differences in the types of funds and other accounts it manages, possible other lines of business, the methodology for allocating expenses and the fund manager’s capital structure and cost of capital.
Additionally, the Trustees considered the estimated profitability to the Adviser from the investment management services it provided to each Janus Henderson Fund. In their review, the Trustees considered whether the Adviser receive adequate incentives and resources to manage the Janus Henderson Funds effectively. In reviewing profitability, the Trustees noted that the estimated profitability for an individual Janus Henderson Fund is necessarily a product of the allocation methodology utilized by the Adviser to allocate its expenses as part of the estimated profitability calculation. In this regard, the Trustees noted that the independent fee consultant found as part of its 2022 review that (1) the expense allocation methodology and rationales utilized by the Adviser were reasonable and (2) no clear correlation exists between expense allocations and operating margins. The Trustees also considered that the estimated profitability for an individual Janus Henderson Fund was influenced by a number of factors, including not only the allocation methodology selected, but also the presence of fee waivers and expense caps, and whether the Janus Henderson Fund’s investment management agreement contained breakpoints or a performance fee component. The Trustees determined, after taking into account these factors, among others, that the Adviser’s estimated profitability with respect to each Janus Henderson Fund was not unreasonable in relation to the services provided, and that the variation in the range of such estimated profitability among the Janus Henderson Funds was not a material factor in the Board’s approval of the reasonableness of any Janus Henderson Fund’s investment management fees.
Janus Henderson Global Select Fund
Additional Information (unaudited)
The Trustees concluded that the management fees payable by each Janus Henderson Fund to the Adviser were reasonable in relation to the nature, extent, and quality of the services provided, taking into account the fees charged by other advisers for managing comparable mutual funds with similar strategies, the fees the Adviser charges to other clients, and, as applicable, the impact of fund performance on management fees payable by the Janus Henderson Funds. The Trustees also concluded that each Janus Henderson Fund’s total expenses were reasonable, taking into account the size of the Janus Henderson Fund, the quality of services provided by the Adviser, the investment performance of the Janus Henderson Fund, and any expense limitations agreed to or provided by the Adviser.
Economies of Scale
The Trustees considered information about the potential for the Adviser to realize economies of scale as the assets of the Janus Henderson Funds increase. They noted that their independent fee consultant published a report to the Trustees in June 2022 which provided its research and analysis into economies of scale. They also noted that, although many Janus Henderson Funds pay advisory fees at a fixed base rate as a percentage of net assets, without any breakpoints or performance fees, their independent fee consultant concluded that 75% of these Janus Henderson Funds’ have contractual management fees (gross of waivers) below their Broadridge Expense Group averages. The Trustees also noted the following from the independent fee consultant’s report: (1) that 31% of Janus Henderson Funds had management fee breakpoints in place whereby investors pay lower management fees as fund AUM increases; (2) that 29% of Janus Henderson Funds have low flat-rate fees and performance fees where the Adviser is incentivized to invest in resources which drive Janus Henderson Fund performance; and (3) that 39% of Janus Henderson Funds have low flat-rate fees versus peers where investors pay low fixed fees when the Janus Henderson Fund is small/midsized and higher fees when the Janus Henderson Fund grows in assets. The Trustees also noted that the Janus Henderson Funds share directly in economies of scale through the significant investments made by the Adviser and its affiliates related to services provided to the Funds and the lower charges of third-party service providers that are based in part on the combined scale of all of the Janus Henderson Funds.
The Trustees also considered the independent fee consultant’s conclusion that, given the limitations of various analytical approaches to economies of scale and their conflicting results, it is difficult to analytically confirm or deny the existence of economies of scale in the Janus Henderson complex. In this regard, the independent consultant concluded that (1) to the extent there were economies of scale at the Adviser, the Adviser’s general strategy of setting fixed management fees below peers appeared to share any such economies with investors even on smaller Janus Henderson Funds which have not yet achieved those economies and (2) by setting lower fixed fees from the start on these Janus Henderson Funds, the Adviser appeared to be investing to increase the likelihood that these Janus Henderson Funds will grow to a level to achieve any economies of scale that may exist. Further, the independent fee consultant provided its belief that Janus Henderson Fund investors are well-served by the fee levels and performance fee structures in place on the Janus Henderson Funds in light of any economies of scale that may be present at the Adviser.
Based on all of the information reviewed, including the recent and past research and analysis conducted by the Trustees’ independent fee consultant, the Trustees concluded that the current fee structure of each Janus Henderson Fund was reasonable and that the current rates of fees do reflect a sharing between the Adviser and the Janus Henderson Fund of any economies of scale that may be present at the current asset level of the Janus Henderson Fund.
Other Benefits to the Adviser
The Trustees also considered benefits that accrue to the Adviser and its affiliates from their relationships with the Janus Henderson Funds. They recognized that two affiliates of the Adviser separately serve the Janus Henderson Funds as transfer agent and distributor, respectively, and the transfer agent receives compensation directly from the non-money market Janus Henderson Funds for services provided, and that such compensation contributes to the overall profitability of the Adviser and its affiliates that results from their relationship with the Janus Henderson Funds. The Trustees also considered the Adviser’s past and proposed use of commissions paid by the Janus Henderson Funds on portfolio brokerage transactions to obtain proprietary and third-party research products and services benefiting the Janus Henderson Fund and/or other clients of the Adviser and/or the Adviser. The Trustees concluded that the Adviser’s use of these types of client commission arrangements to obtain proprietary and third-party research products and services was consistent with regulatory requirements and guidelines and was likely to benefit each Janus Henderson Fund. The Trustees also concluded that, other than the services provided by the Adviser and its affiliates pursuant to the agreements and the fees to be paid by each Janus Henderson Fund therefor, the Janus Henderson
Janus Henderson Global Select Fund
Additional Information (unaudited)
Funds and the Adviser may potentially benefit from their relationship with each other in other ways. They concluded that the Adviser and its affiliates share directly in economies of scale through the lower charges of third-party service providers that are based in part on the combined scale of the Janus Henderson Funds and other clients serviced by the Adviser and its affiliates. They also concluded that the Adviser benefits from the receipt of research products and services acquired through commissions paid on portfolio transactions of the Janus Henderson Funds and that the Janus Henderson Funds benefit from the Adviser’s receipt of those products and services as well as research products and services acquired through commissions paid by other clients of the Adviser. They further concluded that the success of any Janus Henderson Fund could attract other business to the Adviser or other Janus Henderson Funds, and that the success of the Adviser could enhance the Adviser’s ability to serve the Janus Henderson Funds.
Janus Henderson Global Select Fund
Liquidity Risk Management Program (unaudited)
Liquidity Risk Management Program
Rule 22e-4 under the Investment Company Act of 1940, as amended (the “Liquidity Rule”), requires open-end funds (but not money market funds) to adopt and implement a written liquidity risk management program (the “LRMP”) that is reasonably designed to assess and manage liquidity risk, which is the risk that a fund could not meet redemption requests without significant dilution of remaining investors’ interest in the fund. The Fund has implemented a LRMP, which incorporates the following elements: (i) assessment, management, and periodic review of liquidity risk; (ii) classification of portfolio holdings; (iii) the establishment and monitoring of a highly liquid investment minimum, as applicable; (iv) a 15% limitation on a Fund’s illiquid investments; (v) redemptions in-kind; and (vi) board oversight.
The Trustees of the Fund (the “Trustees”) have designated Janus Henderson Investors US LLC, the Fund’s investment adviser (the “Adviser”), as the Program Administrator for the LRMP responsible for administering the LRMP and carrying out the specific responsibilities of the LRMP. A working group comprised of various teams within the Adviser’s business is responsible for administering the LRMP and carrying out the specific responsibilities of different aspects of the LRMP (the “Liquidity Risk Working Group”). In assessing each Fund’s liquidity risk, the Liquidity Risk Working Group periodically considers, as relevant, factors including (i) the liquidity of a Fund’s portfolio investments during normal and reasonably foreseeable stressed conditions; (ii) whether a Fund’s investment strategy is appropriate for an open-end fund; (iii) the extent to which a Fund’s strategy involves a relatively concentrated portfolio or large positions in any issuer; (iv) a Fund’s use of borrowing for investment purposes; and (v) a Fund’s use of derivatives.
The Liquidity Rule requires the Trustees to review at least annually a written report provided by the Program Administrator that addresses the operation of the LRMP and assesses its adequacy and the effectiveness of its implementation, including, if applicable, the operation of the highly liquid investment minimum, and any material changes to the LRMP (the “Program Administrator Report”). At a meeting held on March 15, 2023, the Adviser provided the Program Administrator Report to the Trustees which covered the operation of the LRMP from January 1, 2022 through December 31, 2022 (the “Reporting Period”).
The Program Administrator Report discussed the operation and effectiveness of the LRMP during the Reporting Period. Among other things, the Program Administrator Report indicated that there were no material changes to the LRMP during the Reporting Period, although there were certain methodology adjustments implemented relating to a change in data provider. Additionally, the findings presented in the Program Administrator Report indicated that the LRMP operated adequately during the Reporting Period. These findings included that the Fund was able to meet redemptions during the normal course of business during the Reporting Period. The Program Administrator Report also stated that the Fund did not exceed the 15% limit on illiquid assets during the Reporting Period, that the Fund held primarily highly liquid assets, and was considered to be a primarily highly liquid fund during the Reporting Period. Also included among the Program Administrator Report’s findings was the determination that the Fund’s investment strategy remains appropriate for an open-end fund. In addition, the Adviser expressed its belief in the Program Administrator Report that the LRMP is reasonably designed and adequate to assess and manage the Fund’s liquidity risk, considering the Fund’s particular risks and circumstances, and includes policies and procedures reasonably designed to implement each required component of the Liquidity Rule.
There can be no assurance that the LRMP will achieve its objectives in the future. Please refer to your Fund’s prospectus for more information regarding the risks to which an investment in the Fund may be subject.
Janus Henderson Global Select Fund
Useful Information About Your Fund Report (unaudited)
Performance Overviews
Performance overview graphs compare the performance of a hypothetical $10,000 investment in the Fund with one or more widely used market indices. When comparing the performance of the Fund with an index, keep in mind that market indices are not available for investment and do not reflect deduction of expenses.
Average annual total returns are quoted for a Fund with more than one year of performance history. Average annual total return is calculated by taking the growth or decline in value of an investment over a period of time, including reinvestment of dividends and distributions, then calculating the annual compounded percentage rate that would have produced the same result had the rate of growth been constant throughout the period. Average annual total return does not reflect the deduction of taxes that a shareholder would pay on Fund distributions or redemptions of Fund shares.
Cumulative total returns are quoted for a Fund with less than one year of performance history. Cumulative total return is the growth or decline in value of an investment over time, independent of the period of time involved. Cumulative total return does not reflect the deduction of taxes that a shareholder would pay on Fund distributions or redemptions of Fund shares.
Pursuant to federal securities rules, expense ratios shown in the performance chart reflect subsidized (if applicable) and unsubsidized ratios. The total annual fund operating expenses ratio is gross of any fee waivers, reflecting the Fund’s unsubsidized expense ratio. The net annual fund operating expenses ratio (if applicable) includes contractual waivers of the Adviser and reflects the Fund’s subsidized expense ratio. Ratios may be higher or lower than those shown in the “Financial Highlights” in this report.
Schedule of Investments
Following the performance overview section is the Fund’s Schedule of Investments. This schedule reports the types of securities held in the Fund on the last day of the reporting period. Securities are usually listed by type (common stock, corporate bonds, U.S. Government obligations, etc.) and by industry classification (banking, communications, insurance, etc.). Holdings are subject to change without notice.
The value of each security is quoted as of the last day of the reporting period. The value of securities denominated in foreign currencies is converted into U.S. dollars.
If the Fund invests in foreign securities, it will also provide a summary of investments by country. This summary reports the Fund exposure to different countries by providing the percentage of securities invested in each country. The country of each security represents the country of risk. A company may be allocated to a country based on other factors such as location of the company’s principal office, the location of the principal trading market for the company’s securities, or the country where a majority of the company’s revenues are derived. The Fund’s Schedule of Investments relies upon the industry group and country classifications published by Bloomberg and/or MSCI Inc.
Tables listing details of individual forward currency contracts, futures, written options, swaptions, and swaps follow the Fund’s Schedule of Investments (if applicable).
Statement of Assets and Liabilities
This statement is often referred to as the “balance sheet.” It lists the assets and liabilities of the Fund on the last day of the reporting period.
The Fund’s assets are calculated by adding the value of the securities owned, the receivable for securities sold but not yet settled, the receivable for dividends declared but not yet received on securities owned, and the receivable for Fund shares sold to investors but not yet settled. The Fund’s liabilities include payables for securities purchased but not yet settled, Fund shares redeemed but not yet paid, and expenses owed but not yet paid. Additionally, there may be other assets and liabilities such as unrealized gain or loss on forward currency contracts.
The section entitled “Net Assets Consist of” breaks down the components of the Fund’s net assets. Because the Fund must distribute substantially all earnings, you will notice that a significant portion of net assets is shareholder capital.
The last section of this statement reports the net asset value (“NAV”) per share on the last day of the reporting period. The NAV is calculated by dividing the Fund’s net assets for each share class (assets minus liabilities) by the number of shares outstanding.
Janus Henderson Global Select Fund
Useful Information About Your Fund Report (unaudited)
Statement of Operations
This statement details the Fund’s income, expenses, realized gains and losses on securities and currency transactions, and changes in unrealized appreciation or depreciation of Fund holdings.
The first section in this statement, entitled “Investment Income,” reports the dividends earned from securities and interest earned from interest-bearing securities in the Fund.
The next section reports the expenses incurred by the Fund, including the advisory fee paid to the investment adviser, transfer agent fees and expenses, and printing and postage for mailing statements, financial reports and prospectuses. Expense offsets and expense reimbursements, if any, are also shown.
The last section lists the amounts of realized gains or losses from investment and foreign currency transactions, and changes in unrealized appreciation or depreciation of investments and foreign currency-denominated assets and liabilities. The Fund will realize a gain (or loss) when it sells its position in a particular security. A change in unrealized gain (or loss) refers to the change in net appreciation or depreciation of the Fund during the reporting period. “Net Realized and Unrealized Gain/(Loss) on Investments” is affected both by changes in the market value of Fund holdings and by gains (or losses) realized during the reporting period.
Statements of Changes in Net Assets
These statements report the increase or decrease in the Fund’s net assets during the reporting period. Changes in the Fund’s net assets are attributable to investment operations, dividends and distributions to investors, and capital share transactions. This is important to investors because it shows exactly what caused the Fund’s net asset size to change during the period.
The first section summarizes the information from the Statement of Operations regarding changes in net assets due to the Fund’s investment operations. The Fund’s net assets may also change as a result of dividend and capital gains distributions to investors. If investors receive their dividends and/or distributions in cash, money is taken out of the Fund to pay the dividend and/or distribution. If investors reinvest their dividends and/or distributions, the Fund’s net assets will not be affected.
The reinvestment of dividends and distributions is included under “Capital Share Transactions.” “Capital Shares” refers to the money investors contribute to the Fund through purchases or withdrawals via redemptions. The Fund’s net assets will increase and decrease in value as investors purchase and redeem shares from the Fund.
Financial Highlights
This schedule provides a per-share breakdown of the components that affect the Fund’s NAV for current and past reporting periods as well as total return, asset size, ratios, and portfolio turnover rate.
The first line in the table reflects the NAV per share at the beginning of the reporting period. The next line reports the net investment income/(loss) per share. Following is the per share total of net gains/(losses), realized and unrealized. Per share dividends and distributions to investors are then subtracted to arrive at the NAV per share at the end of the period. The next line reflects the total return for the period. The total return may include adjustments in accordance with generally accepted accounting principles required at the period end for financial reporting purposes. As a result, the total return may differ from the total return reflected for individual shareholder transactions. Also included are ratios of expenses and net investment income to average net assets.
The Fund’s expenses may be reduced through expense offsets and expense reimbursements. The ratios shown reflect expenses before and after any such offsets and reimbursements.
The ratio of net investment income/(loss) summarizes the income earned less expenses, divided by the average net assets of the Fund during the reporting period. Do not confuse this ratio with the Fund’s yield. The net investment income ratio is not a true measure of the Fund’s yield because it does not take into account the dividends distributed to the Fund’s investors.
The next figure is the portfolio turnover rate, which measures the buying and selling activity in the Fund. Portfolio turnover is affected by market conditions, changes in the asset size of the Fund, fluctuating volume of shareholder purchase and redemption orders, the nature of the Fund’s investments, and the investment style and/or outlook of the portfolio manager(s) and/or investment personnel. A 100% rate implies that an amount equal to the value of the entire portfolio was replaced once during the fiscal year; a 50% rate means that an amount equal to the value of half the
Janus Henderson Global Select Fund
Useful Information About Your Fund Report (unaudited)
portfolio is traded in a year; and a 200% rate means that an amount equal to the value of the entire portfolio is traded every six months.
Janus Henderson Global Select Fund
Notes
NotesPage1
Janus Henderson Global Select Fund
Notes
NotesPage2
| | | | | | | | |
| | | | | |

| | | | |
This report is submitted for the general information of shareholders of the Fund. It is not an offer or solicitation for the Fund and is not authorized for distribution to prospective investors unless preceded or accompanied by an effective prospectus. |
Janus Henderson is a trademark of Janus Henderson Group plc or one of its subsidiaries. © Janus Henderson Group plc. Janus Henderson Group is the ultimate parent of Janus Henderson Distributors US LLC. Janus Henderson Distributors US LLC |
| | | | 125-24-93046 05-23 |
| | | | |
| | | |
| | | SEMIANNUAL REPORT March 31, 2023 |
| | |
| | Janus Henderson Global Sustainable Equity Fund |
| | |
| | Janus Investment Fund |
| |
| | | HIGHLIGHTS · Investment strategy behind your fund · Fund performance, characteristics
and holdings |
Table of Contents
Janus Henderson Global Sustainable Equity Fund
| | | | | | |
| | | | | 
Aaron Scully co-portfolio manager | 
Hamish Chamberlayne co-portfolio manager |
| | | |
Janus Henderson Global Sustainable Equity Fund (unaudited)
Fund At A Glance
March 31, 2023
| | | | | | | | | | |
| | | | | | | | | |
| | | | | | | | | |
| | | | | | | | | |
| 5 Top Contributors - Holdings | 5 Top Detractors - Holdings |
| | Average
Weight | | Relative
Contribution | | | Average
Weight | | Relative
Contribution |
| NVIDIA Corp | 2.47% | | 1.30% | | Atlassian Corp - Class A | 1.10% | | -0.72% |
| Schneider Electric SE | 2.50% | | 0.56% | | Advanced Drainage Systems, Inc | 1.04% | | -0.71% |
| Evoqua Water Technologies Corp | 2.18% | | 0.55% | | Innergex Renewable Energy Inc | 1.49% | | -0.55% |
| Microchip Technology Inc | 2.81% | | 0.52% | | Humana Inc | 3.01% | | -0.55% |
| ASML Holding NV | 1.77% | | 0.46% | | Boralex Inc - Class A | 2.08% | | -0.54% |
| | | | | | | |
| 5 Top Contributors - Sectors* | | | | | |
| | | Relative | | Fund | MSCI World Index |
| | | Contribution | | Average Weight | Average Weight |
| Information Technology | | 2.02% | | 34.53% | 20.83% |
| Consumer Discretionary | | 1.09% | | 6.59% | 10.53% |
| Industrials | | 0.57% | | 17.61% | 10.56% |
| Health Care | | 0.41% | | 7.85% | 13.93% |
| Consumer Staples | | 0.21% | | 0.46% | 7.68% |
| | | | | | |
| | | | | | |
| 5 Top Detractors - Sectors* | | | | | |
| | | Relative | | Fund | MSCI World Index |
| | | Contribution | | Average Weight | Average Weight |
| Communication Services | | -0.76% | | 4.08% | 6.67% |
| Utilities | | -0.57% | | 5.63% | 3.04% |
| Other** | | -0.32% | | 2.52% | 0.00% |
| Financials | | -0.28% | | 15.22% | 14.20% |
| Materials | | 0.11% | | 1.93% | 4.43% |
| | | | | | | |
| Relative contribution reflects how the portolio's holdings impacted return relative to the benchmark. Cash and securities not held in the portfolio are not shown. For equity portfolios, relative contribution compares the performance of a security in the portfolio to the benchmark's total return, factoring in the difference in weight of that security in the benchmark. Returns are calculated using daily returns and previous day ending weights rolled up by ticker, excluding fixed income securities, gross of advisory fees, may exclude certain derivatives and will differ from actual performance.
Performance attribution reflects returns gross of advisory fees and may differ from actual returns as they are based on end of day holdings. Attribution is calculated by geometrically linking daily returns for the portfolio and index. |
* | Based on sector classification according to the Global Industry Classification Standard (“GICS”) codes, which are the exclusive property and a service mark of MSCI Inc. and Standard & Poor’s. |
** | Not a GICS classified sector. |
Janus Henderson Global Sustainable Equity Fund (unaudited)
Fund At A Glance
March 31, 2023
| | |
5 Largest Equity Holdings - (% of Net Assets) |
Microsoft Corp | |
Software | 6.3% |
Xylem Inc/NY | |
Machinery | 3.2% |
NVIDIA Corp | |
Semiconductor & Semiconductor Equipment | 3.2% |
Humana Inc | |
Health Care Providers & Services | 3.1% |
Aon PLC - Class A | |
Insurance | 3.0% |
| | 18.8% |
| | | | | | |
Asset Allocation - (% of Net Assets) | |
Common Stocks | | 98.2% | |
Investment Companies | | 1.8% | |
Other | | 0.0% |
| | | 100.0% |
| | |
Top Country Allocations - Long Positions - (% of Investment Securities) |
As of March 31, 2023 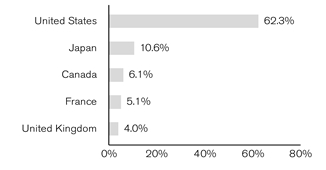
| As of September 30, 2022 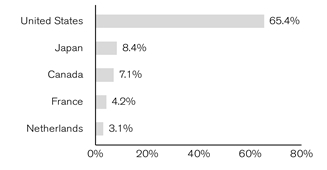
|
Janus Henderson Global Sustainable Equity Fund (unaudited)
Performance
| |
See important disclosures on the next page. |
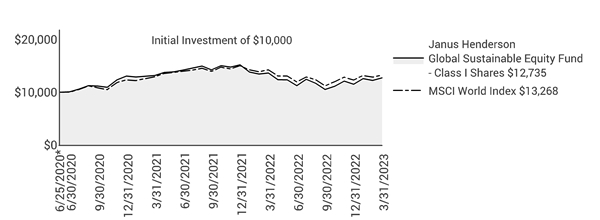
| | | | | | | | | | |
| | | | | | | | |
| | | | | | | | |
Average Annual Total Return - for the periods ended March 31, 2023 | | | Prospectus Expense Ratios |
| | Fiscal
Year-to-Date | One
Year | Since
Inception* | | | Total Annual Fund
Operating Expenses‡ | Net Annual Fund
Operating Expenses‡ |
Class A Shares at NAV | | 20.78% | -6.94% | 8.99% | | | 3.31% | 1.17% |
Class A Shares at MOP | | 13.87% | -12.29% | 6.68% | | | | |
Class C Shares at NAV | | 20.82% | -6.80% | 9.03% | | | 6.64% | 1.89% |
Class C Shares at CDSC | | 19.82% | -7.73% | 9.03% | | | | |
Class D Shares | | 20.86% | -6.82% | 9.06% | | | 1.71% | 1.01% |
Class I Shares | | 20.82% | -6.88% | 9.14% | | | 1.57% | 0.92% |
Class N Shares | | 21.02% | -6.71% | 9.24% | | | 1.73% | 0.86% |
Class R Shares | | 20.92% | -6.71% | 8.98% | | | 8.24% | 1.61% |
Class S Shares | | 20.91% | -6.84% | 9.03% | | | 6.62% | 1.36% |
Class T Shares | | 20.87% | -6.92% | 8.98% | | | 2.25% | 1.11% |
MSCI World Index | | 18.25% | -7.02% | 10.77% | | | | |
Morningstar Quartile - Class I Shares | | - | 2nd | 1st | | | | |
Morningstar Ranking - based on total returns for World Large Stock Funds | | - | 121/368 | 66/338 | | | | |
Returns quoted are past performance and do not guarantee future results; current performance may be lower or higher. Investment returns and principal value will vary; there may be a gain or loss when shares are sold. For the most recent month-end performance call 800.668.0434 (or 800.525.3713 if you hold shares directly with Janus Henderson) or visit janushenderson.com/performance (or janushenderson.com/allfunds if you hold shares directly with Janus Henderson).
Maximum Offering Price (MOP) returns include the maximum sales charge of 5.75%. Net Asset Value (NAV) returns exclude this charge, which would have reduced returns.
CDSC returns include a 1% contingent deferred sales charge (CDSC) on Shares redeemed within 12 months of purchase. Net Asset Value (NAV) returns exclude this charge, which would have reduced returns.
Net expense ratios reflect the expense waiver, if any, contractually agreed to for at least a one-year period commencing on January 27, 2023. This contractual waiver may be terminated or modified only at the discretion of the Board of Trustees.
Until the earlier of three years from inception or the Fund’s assets meeting the first fee breakpoint, expenses previously waived or reimbursed may be recovered if the expense ratio falls below certain limits.
Janus Henderson Global Sustainable Equity Fund (unaudited)
Performance
Performance may be affected by risks that include those associated with foreign and emerging markets, fixed income securities, high-yield and high-risk securities, undervalued, overlooked and smaller capitalization companies, real estate related securities including Real Estate Investment Trusts (REITs), Environmental, Social and Governance (ESG) factors, non-diversification, portfolio turnover, derivatives, short sales, initial public offerings (IPOs) and potential conflicts of interest. Each product has different risks. Please see the prospectus for more information about risks, holdings and other details.
Returns include reinvestment of all dividends and distributions and do not reflect the deduction of taxes that a shareholder would pay on Fund distributions or redemptions of Fund shares. The returns do not include adjustments in accordance with generally accepted accounting principles required at the period end for financial reporting purposes.
Class R Shares commenced operations on January 28, 2021. Performance shown for periods prior to January 28, 2021, reflects the historical performance of the Funds’s Class I Shares, calculated using the fees and expenses of Class R Shares, net of any applicable fee and expense limitations or waivers.
If Class R Shares of the Fund had been available during periods prior to January 28, 2021, the performance shown may have been different. The performance shown for periods following the Fund's commencement of Class R Shares reflects the fees and expenses of Class R Shares, net of any applicable fee and expense limitations or waivers.
If each share class of the Fund had been available during periods prior to its commencement, the performance shown may have been different. The performance shown for periods following the Fund’s commencement of each share class reflects the fees and expenses of each respective share class, net of any applicable fee and expense limitations or waivers. Please refer to the Fund’s prospectuses for further details concerning historical performance.
Ranking is for the share class shown only; other classes may have different performance characteristics. When an expense waiver is in effect, it may have a material effect on the total return, and therefore the ranking for the period.
© 2023 Morningstar, Inc. All Rights Reserved.
There is no assurance that the investment process will consistently lead to successful investing.
See Notes to Schedule of Investments and Other Information for index definitions.
Index performance does not reflect the expenses of managing a portfolio as an index is unmanaged and not available for direct investment.
See “Useful Information About Your Fund Report.”
*The Fund’s inception date – June 25, 2020
‡ As stated in the prospectus. See Financial Highlights for actual expense ratios during the reporting period.
Janus Henderson Global Sustainable Equity Fund (unaudited)
Expense Examples
As a shareholder of the Fund, you incur two types of costs: (1) transaction costs, such as sales charges (loads) on purchase payments (applicable to Class A Shares only); and (2) ongoing costs, including management fees; 12b-1 distribution and shareholder servicing fees; transfer agent fees and expenses payable pursuant to the Transfer Agency Agreement; and other Fund expenses. This example is intended to help you understand your ongoing costs (in dollars) of investing in the Fund and to compare these costs with the ongoing costs of investing in other mutual funds. To do so, compare this 5% hypothetical example with the 5% hypothetical examples that appear in the shareholder reports of the other funds. The example is based upon an investment of $1,000 invested at the beginning of the period and held for the six-months indicated, unless noted otherwise in the table and footnotes below.
Actual Expenses
The information in the table under the heading “Actual” provides information about actual account values and actual expenses. You may use the information in these columns, together with the amount you invested, to estimate the expenses that you paid over the period. Simply divide your account value by $1,000 (for example, an $8,600 account value divided by $1,000 = 8.6), then multiply the result by the number in the appropriate column for your share class under the heading entitled “Expenses Paid During Period” to estimate the expenses you paid on your account during the period.
Hypothetical Example for Comparison Purposes
The information in the table under the heading “Hypothetical (5% return before expenses)” provides information about hypothetical account values and hypothetical expenses based upon the Fund’s actual expense ratio and an assumed rate of return of 5% per year before expenses, which is not the Fund’s actual return. The hypothetical account values and expenses may not be used to estimate the actual ending account balance or expenses you paid for the period. You may use this information to compare the ongoing costs of investing in the Fund and other funds. To do so, compare this 5% hypothetical example with the 5% hypothetical examples that appear in the shareholder reports of the other funds. Additionally, for an analysis of the fees associated with an investment in any share class or other similar funds, please visit www.finra.org/fundanalyzer.
Please note that the expenses shown in the table are meant to highlight your ongoing costs only and do not reflect any transaction costs. These fees are fully described in the Fund’s prospectuses. Therefore, the hypothetical examples are useful in comparing ongoing costs only, and will not help you determine the relative total costs of owning different funds. In addition, if these transaction costs were included, your costs would have been higher.
| | | | | | | | | | | |
| | | | | | | | |
| | | Actual | | Hypothetical
(5% return before expenses) | |
| Beginning
Account
Value
(10/1/22) | Ending
Account
Value
(3/31/23) | Expenses
Paid During
Period
(10/1/22 - 3/31/23)† | | Beginning
Account
Value
(10/1/22) | Ending
Account
Value
(3/31/23) | Expenses
Paid During
Period
(10/1/22 - 3/31/23)† | Net Annualized
Expense Ratio
(10/1/22 - 3/31/23) |
Class A Shares | $1,000.00 | $1,207.80 | $6.33 | | $1,000.00 | $1,019.20 | $5.79 | 1.15% |
Class C Shares | $1,000.00 | $1,208.20 | $6.72 | | $1,000.00 | $1,018.85 | $6.14 | 1.22% |
Class D Shares | $1,000.00 | $1,208.60 | $5.62 | | $1,000.00 | $1,019.85 | $5.14 | 1.02% |
Class I Shares | $1,000.00 | $1,208.20 | $5.62 | | $1,000.00 | $1,019.85 | $5.14 | 1.02% |
Class N Shares | $1,000.00 | $1,210.20 | $4.79 | | $1,000.00 | $1,020.59 | $4.38 | 0.87% |
Class R Shares | $1,000.00 | $1,209.20 | $6.00 | | $1,000.00 | $1,019.50 | $5.49 | 1.09% |
Class S Shares | $1,000.00 | $1,209.10 | $5.73 | | $1,000.00 | $1,019.75 | $5.24 | 1.04% |
Class T Shares | $1,000.00 | $1,208.70 | $6.06 | | $1,000.00 | $1,019.45 | $5.54 | 1.10% |
† | Expenses Paid During Period are equal to the Net Annualized Expense Ratio multiplied by the average account value over the period, multiplied by 182/365 (to reflect the one-half year period). Expenses in the examples include the effect of applicable fee waivers and/or expense reimbursements, if any. Had such waivers and/or reimbursements not been in effect, your expenses would have been higher. Please refer to the Notes to Financial Statements or the Fund’s prospectuses for more information regarding waivers and/or reimbursements. |
Janus Henderson Global Sustainable Equity Fund
Schedule of Investments (unaudited)
March 31, 2023
| | | | | | | | |
Shares
| | | Value | |
Common Stocks– 98.2% | | | |
Auto Components – 1.9% | | | |
| | Aptiv PLC* | | 4,912 | | | $551,077 | |
Building Products – 0.9% | | | |
| | Advanced Drainage Systems Inc | | 3,184 | | | 268,125 | |
Containers & Packaging – 1.9% | | | |
| | DS Smith PLC | | 138,915 | | | 539,693 | |
Diversified Financial Services – 3.7% | | | |
| | Mastercard Inc | | 1,850 | | | 672,309 | |
| | Walker & Dunlop Inc | | 5,362 | | | 408,424 | |
| | | 1,080,733 | |
Electric Utilities – 2.2% | | | |
| | SSE PLC | | 27,920 | | | 621,803 | |
Electrical Equipment – 5.6% | | | |
| | Legrand SA | | 7,827 | | | 715,864 | |
| | Nidec Corp | | 2,900 | | | 150,551 | |
| | Schneider Electric SE | | 4,565 | | | 763,055 | |
| | | 1,629,470 | |
Electronic Equipment, Instruments & Components – 11.6% | | | |
| | IPG Photonics Corp* | | 4,238 | | | 522,588 | |
| | Keyence Corp | | 1,200 | | | 588,386 | |
| | Keysight Technologies Inc* | | 2,680 | | | 432,766 | |
| | Murata Manufacturing Co Ltd | | 8,700 | | | 531,316 | |
| | Shimadzu Corp | | 17,500 | | | 549,018 | |
| | TE Connectivity Ltd | | 5,426 | | | 711,620 | |
| | | 3,335,694 | |
Entertainment – 1.0% | | | |
| | Nintendo Co Ltd | | 7,600 | | | 294,651 | |
Food Products – 0.5% | | | |
| | McCormick & Co Inc/MD | | 1,557 | | | 129,558 | |
Health Care Equipment & Supplies – 1.8% | | | |
| | Nanosonics Ltd* | | 27,279 | | | 93,436 | |
| | Olympus Corp | | 24,700 | | | 433,832 | |
| | | 527,268 | |
Health Care Providers & Services – 4.8% | | | |
| | Encompass Health Corp | | 9,232 | | | 499,451 | |
| | Humana Inc | | 1,810 | | | 878,683 | |
| | | 1,378,134 | |
Independent Power and Renewable Electricity Producers – 3.5% | | | |
| | Boralex Inc - Class A | | 20,997 | | | 639,404 | |
| | Innergex Renewable Energy Inc | | 34,384 | | | 373,534 | |
| | | 1,012,938 | |
Industrial Real Estate Investment Trusts (REITs) – 1.2% | | | |
| | Prologis Inc | | 2,809 | | | 350,479 | |
Insurance – 12.8% | | | |
| | AIA Group Ltd | | 63,400 | | | 666,185 | |
| | Aon PLC - Class A | | 2,732 | | | 861,372 | |
| | Intact Financial Corp | | 5,175 | | | 740,730 | |
| | Marsh & McLennan Cos Inc | | 3,852 | | | 641,551 | |
| | Progressive Corp/The | | 5,498 | | | 786,544 | |
| | | 3,696,382 | |
Leisure Products – 1.8% | | | |
| | Shimano Inc | | 3,000 | | | 520,494 | |
Life Sciences Tools & Services – 2.4% | | | |
| | ICON PLC* | | 3,220 | | | 687,760 | |
Machinery – 8.1% | | | |
| | Knorr-Bremse AG | | 8,721 | | | 579,693 | |
| | Wabtec Corp | | 8,371 | | | 845,973 | |
| | Xylem Inc/NY | | 8,774 | | | 918,638 | |
| | | 2,344,304 | |
| | |
See Notes to Schedule of Investments and Other Information and Notes to Financial Statements. |
| |
6 | MARCH 31, 2023 |
Janus Henderson Global Sustainable Equity Fund
Schedule of Investments (unaudited)
March 31, 2023
| | | | | | | | |
Shares
| | | Value | |
Common Stocks– (continued) | | | |
Professional Services – 1.8% | | | |
| | Wolters Kluwer NV | | 4,215 | | | $531,837 | |
Semiconductor & Semiconductor Equipment – 12.2% | | | |
| | ASML Holding NV | | 819 | | | 559,566 | |
| | Lam Research Corp | | 1,000 | | | 530,120 | |
| | Microchip Technology Inc | | 9,280 | | | 777,478 | |
| | NVIDIA Corp | | 3,305 | | | 918,030 | |
| | Texas Instruments Inc | | 3,965 | | | 737,530 | |
| | | 3,522,724 | |
Software – 11.1% | | | |
| | Atlassian Corp - Class A* | | 835 | | | 142,927 | |
| | Autodesk Inc* | | 2,519 | | | 524,355 | |
| | Cadence Design Systems Inc* | | 1,726 | | | 362,615 | |
| | Linklogis Inc - Class B (144A)* | | 120,992 | | | 56,158 | |
| | Microsoft Corp | | 6,274 | | | 1,808,794 | |
| | Workday Inc - Class A* | | 1,448 | | | 299,070 | |
| | | 3,193,919 | |
Specialized Real Estate Investment Trusts (REITs) – 2.1% | | | |
| | Crown Castle International Corp | | 2,324 | | | 311,044 | |
| | Equinix Inc | | 405 | | | 292,021 | |
| | | 603,065 | |
Specialty Retail – 1.1% | | | |
| | Home Depot Inc | | 1,065 | | | 314,303 | |
Textiles, Apparel & Luxury Goods – 2.0% | | | |
| | adidas AG | | 1,412 | | | 249,281 | |
| | NIKE Inc - Class B | | 2,582 | | | 316,657 | |
| | | 565,938 | |
Wireless Telecommunication Services – 2.2% | | | |
| | T-Mobile US Inc* | | 4,282 | | | 620,205 | |
Total Common Stocks (cost $25,638,339) | | 28,320,554 | |
Investment Companies– 1.8% | | | |
Money Markets – 1.8% | | | |
| | Janus Henderson Cash Liquidity Fund LLC, 4.7988%ºº,£((cost $523,011) | | 522,925 | | | 523,029 | |
Total Investments (total cost $26,161,350) – 100.0% | | 28,843,583 | |
Cash, Receivables and Other Assets, net of Liabilities – 0% | | 3,314 | |
Net Assets – 100% | | $28,846,897 | |
| | | | | | |
Summary of Investments by Country - (Long Positions) (unaudited) |
| |
| | | | | % of | |
| | | | | Investment | |
Country | | Value | | Securities | |
United States | | $17,957,336 | | 62.3 | % |
Japan | | 3,068,248 | | 10.6 | |
Canada | | 1,753,668 | | 6.1 | |
France | | 1,478,919 | | 5.1 | |
United Kingdom | | 1,161,496 | | 4.0 | |
Netherlands | | 1,091,403 | | 3.8 | |
Germany | | 828,974 | | 2.9 | |
Ireland | | 687,760 | | 2.4 | |
Hong Kong | | 666,185 | | 2.3 | |
Australia | | 93,436 | | 0.3 | |
China | | 56,158 | | 0.2 | |
| | |
See Notes to Schedule of Investments and Other Information and Notes to Financial Statements. |
| |
Janus Investment Fund | 7 |
Janus Henderson Global Sustainable Equity Fund
Schedule of Investments (unaudited)
March 31, 2023
Schedules of Affiliated Investments – (% of Net Assets)
| | | | | | | | | | | |
| | Dividend Income | Realized Gain/(Loss) | Change in Unrealized Appreciation/ Depreciation | Value at 3/31/23 |
Investment Companies - 1.8% |
Money Markets - 1.8% | |
| | Janus Henderson Cash Liquidity Fund LLC, 4.7988%ºº | $ | 14,416 | $ | 94 | $ | (4) | $ | 523,029 |
| |
| | | | | | | | | | | |
| | Value at 9/30/22 | Purchases | Sales Proceeds | Value at 3/31/23 |
Investment Companies - 1.8% |
Money Markets - 1.8% | |
| | Janus Henderson Cash Liquidity Fund LLC, 4.7988%ºº | | 1,228,278 | | 4,202,655 | | (4,907,994) | | 523,029 |
| | |
See Notes to Schedule of Investments and Other Information and Notes to Financial Statements. |
| |
8 | MARCH 31, 2023 |
Janus Henderson Global Sustainable Equity Fund
Notes to Schedule of Investments and Other Information (unaudited)
| | |
MSCI World IndexSM | MSCI World IndexSM reflects the equity market performance of global developed markets. |
| | |
LLC | Limited Liability Company |
PLC | Public Limited Company |
| | |
144A | Securities sold under Rule 144A of the Securities Act of 1933, as amended, are subject to legal and/or contractual restrictions on resale and may not be publicly sold without registration under the 1933 Act. Unless otherwise noted, these securities have been determined to be liquid under guidelines established by the Board of Trustees. The total value of 144A securities as of the period ended March 31, 2023 is $56,158, which represents 0.2% of net assets. |
| | |
* | Non-income producing security. |
| | |
ºº | Rate shown is the 7-day yield as of March 31, 2023. |
| | |
£ | The Fund may invest in certain securities that are considered affiliated companies. As defined by the Investment Company Act of 1940, as amended, an affiliated company is one in which the Fund owns 5% or more of the outstanding voting securities, or a company which is under common ownership or control. |
| | | | | | | | | | | | | |
The following is a summary of the inputs that were used to value the Fund’s investments in securities and other financial instruments as of March 31, 2023. See Notes to Financial Statements for more information. |
| |
Valuation Inputs Summary |
| | | | | | | |
| | | | | Level 2 - | | Level 3 - |
| | | Level 1 - | | Other Significant | | Significant |
| | | Quoted Prices | | Observable Inputs | | Unobservable Inputs |
| | | | | | | |
Assets | | | | | | |
Investments In Securities: | | | | | | |
Common Stocks | | | | | | |
Containers & Packaging | $ | - | $ | 539,693 | $ | - |
Electric Utilities | | - | | 621,803 | | - |
Electrical Equipment | | - | | 1,629,470 | | - |
Electronic Equipment, Instruments & Components | | 1,666,974 | | 1,668,720 | | - |
Entertainment | | - | | 294,651 | | - |
Health Care Equipment & Supplies | | - | | 527,268 | | - |
Insurance | | 3,030,197 | | 666,185 | | - |
Leisure Products | | - | | 520,494 | | - |
Machinery | | 1,764,611 | | 579,693 | | - |
Professional Services | | - | | 531,837 | | - |
Semiconductor & Semiconductor Equipment | | 2,963,158 | | 559,566 | | - |
Software | | 3,137,761 | | 56,158 | | - |
Textiles, Apparel & Luxury Goods | | 316,657 | | 249,281 | | - |
All Other | | 6,996,377 | | - | | - |
Investment Companies | | - | | 523,029 | | - |
Total Assets | $ | 19,875,735 | $ | 8,967,848 | $ | - |
| | | | | | | |
Janus Henderson Global Sustainable Equity Fund
Statement of Assets and Liabilities (unaudited)
March 31, 2023
| |
See footnotes at the end of the Statement. |
| | | | | | | |
| | | | | | |
Assets: | | | | |
| Unaffiliated investments, at value (cost $25,638,339) | | $ | 28,320,554 | |
| Affiliated investments, at value (cost $523,011) | | | 523,029 | |
| Cash denominated in foreign currency (cost $10,807) | | | 10,807 | |
| Trustees' deferred compensation | | | 712 | |
| Receivables: | | | | |
| | Fund shares sold | | | 78,738 | |
| | Dividends | | | 26,542 | |
| | Due from adviser | | | 24,498 | |
| | Foreign tax reclaims | | | 4,973 | |
| | Dividends from affiliates | | | 2,065 | |
| Other assets | | | 231 | |
Total Assets | | | 28,992,149 | |
Liabilities: | | | | |
| Payables: | | | — | |
| | Fund shares repurchased | | | 27,994 | |
| | Professional fees | | | 26,439 | |
| | Advisory fees | | | 18,876 | |
| | Transfer agent fees and expenses | | | 4,830 | |
| | Custodian fees | | | 1,679 | |
| | Trustees' deferred compensation fees | | | 712 | |
| | Trustees' fees and expenses | | | 186 | |
| | 12b-1 Distribution and shareholder servicing fees | | | 178 | |
| | Affiliated fund administration fees payable | | | 63 | |
| | Accrued expenses and other payables | | | 64,295 | |
Total Liabilities | | | 145,252 | |
Net Assets | | $ | 28,846,897 | |
| | |
See Notes to Financial Statements. |
| |
10 | MARCH 31, 2023 |
Janus Henderson Global Sustainable Equity Fund
Statement of Assets and Liabilities (unaudited)
March 31, 2023
| | | | | | | |
| | | | | | |
| | | | | | | |
Net Assets Consist of: | | | | |
| Capital (par value and paid-in surplus) | | $ | 28,743,721 | |
| Total distributable earnings (loss) | | | 103,176 | |
Total Net Assets | | $ | 28,846,897 | |
Net Assets - Class A Shares | | $ | 317,816 | |
| Shares Outstanding, $0.01 Par Value (unlimited shares authorized) | | | 25,420 | |
Net Asset Value Per Share(1) | | $ | 12.50 | |
Maximum Offering Price Per Share(2) | | $ | 13.26 | |
Net Assets - Class C Shares | | $ | 104,605 | |
| Shares Outstanding, $0.01 Par Value (unlimited shares authorized) | | | 8,372 | |
Net Asset Value Per Share(1) | | $ | 12.49 | |
Net Assets - Class D Shares | | $ | 23,680,147 | |
| Shares Outstanding, $0.01 Par Value (unlimited shares authorized) | | | 1,888,424 | |
Net Asset Value Per Share | | $ | 12.54 | |
Net Assets - Class I Shares | | $ | 2,407,124 | |
| Shares Outstanding, $0.01 Par Value (unlimited shares authorized) | | | 192,829 | |
Net Asset Value Per Share | | $ | 12.48 | |
Net Assets - Class N Shares | | $ | 1,537,343 | |
| Shares Outstanding, $0.01 Par Value (unlimited shares authorized) | | | 122,345 | |
Net Asset Value Per Share | | $ | 12.57 | |
Net Assets - Class R Shares | | $ | 49,029 | |
| Shares Outstanding, $0.01 Par Value (unlimited shares authorized) | | | 3,923 | |
Net Asset Value Per Share | | $ | 12.50 | |
Net Assets - Class S Shares | | $ | 63,520 | |
| Shares Outstanding, $0.01 Par Value (unlimited shares authorized) | | | 5,092 | |
Net Asset Value Per Share | | $ | 12.47 | |
Net Assets - Class T Shares | | $ | 687,313 | |
| Shares Outstanding, $0.01 Par Value (unlimited shares authorized) | | | 54,860 | |
Net Asset Value Per Share | | $ | 12.53 | |
| |
(1) Redemption price per share may be reduced for any applicable contingent deferred sales charge. (2) Maximum offering price is computed at 100/94.25 of net asset value. |
| | |
See Notes to Financial Statements. |
| |
Janus Investment Fund | 11 |
Janus Henderson Global Sustainable Equity Fund
Statement of Operations (unaudited)
For the period ended March 31, 2023
| | | | | | |
| | | | | |
Investment Income: | | | |
| Dividends | $ | 167,409 | |
| Dividends from affiliates | | 14,416 | |
| Other income | | 11 | |
| Foreign tax withheld | | (5,933) | |
Total Investment Income | | 175,903 | |
Expenses: | | | |
| Advisory fees | | 103,080 | |
| 12b-1 Distribution and shareholder servicing fees: | | | |
| | Class A Shares | | 244 | |
| | Class C Shares | | 110 | |
| | Class R Shares | | 21 | |
| | Class S Shares | | 14 | |
| Transfer agent administrative fees and expenses: | | | |
| | Class D Shares | | 13,084 | |
| | Class R Shares | | 57 | |
| | Class S Shares | | 74 | |
| | Class T Shares | | 771 | |
| Transfer agent networking and omnibus fees: | | | |
| | Class A Shares | | 105 | |
| | Class C Shares | | 8 | |
| | Class I Shares | | 2,261 | |
| Other transfer agent fees and expenses: | | | |
| | Class A Shares | | 15 | |
| | Class C Shares | | 6 | |
| | Class D Shares | | 4,266 | |
| | Class I Shares | | 150 | |
| | Class N Shares | | 63 | |
| | Class R Shares | | 2 | |
| | Class S Shares | | 3 | |
| | Class T Shares | | 22 | |
| Registration fees | | 53,795 | |
| Non-affiliated fund administration fees | | 36,731 | |
| Professional fees | | 28,376 | |
| Custodian fees | | 4,147 | |
| Shareholder reports expense | | 4,089 | |
| Trustees’ fees and expenses | | 415 | |
| Affiliated fund administration fees | | 343 | |
| Other expenses | | 7,343 | |
Total Expenses | | 259,595 | |
Less: Excess Expense Reimbursement and Waivers | | (120,441) | |
Net Expenses | | 139,154 | |
Net Investment Income/(Loss) | | 36,749 | |
| | | | | |
| | |
See Notes to Financial Statements. |
| |
12 | MARCH 31, 2023 |
Janus Henderson Global Sustainable Equity Fund
Statement of Operations (unaudited)
For the period ended March 31, 2023
| | | | | | |
| | | | | |
Net Realized Gain/(Loss) on Investments: | | | |
| Investments and foreign currency transactions | $ | (784,770) | |
| Investments in affiliates | | 94 | |
Total Net Realized Gain/(Loss) on Investments | | (784,676) | |
Change in Unrealized Net Appreciation/Depreciation: | | | |
| Investments, foreign currency translations and Trustees’ deferred compensation | | 5,865,943 | |
| Investments in affiliates | | (4) | |
Total Change in Unrealized Net Appreciation/Depreciation | | 5,865,939 | |
Net Increase/(Decrease) in Net Assets Resulting from Operations | $ | 5,118,012 | |
| | | | | |
| | |
See Notes to Financial Statements. |
| |
Janus Investment Fund | 13 |
Janus Henderson Global Sustainable Equity Fund
Statements of Changes in Net Assets
| | | | | | | | | |
| | | | | | | | |
| | | Period ended
March 31, 2023 (unaudited) | | Year ended
September 30, 2022 | |
| | | | | | | | | |
Operations: | | | | | | |
| Net investment income/(loss) | $ | 36,749 | | $ | 52,899 | |
| Net realized gain/(loss) on investments | | (784,676) | | | (1,658,807) | |
| Change in unrealized net appreciation/depreciation | | 5,865,939 | | | (8,339,907) | |
Net Increase/(Decrease) in Net Assets Resulting from Operations | | 5,118,012 | | | (9,945,815) | |
Dividends and Distributions to Shareholders: | | | | | | |
| | Class A Shares | | (572) | | | (1,797) | |
| | Class C Shares | | (336) | | | (778) | |
| | Class D Shares | | (50,792) | | | (270,032) | |
| | Class I Shares | | (14,523) | | | (131,214) | |
| | Class N Shares | | (5,818) | | | (16,196) | |
| | Class R Shares | | (266) | | | (510) | |
| | Class S Shares | | (315) | | | (721) | |
| | Class T Shares | | (705) | | | (6,829) | |
Net Decrease from Dividends and Distributions to Shareholders | | (73,327) | | | (428,077) | |
Capital Share Transactions: | | | | | | |
| | Class A Shares | | 93,531 | | | 68,834 | |
| | Class C Shares | | 30,282 | | | 5,715 | |
| | Class D Shares | | (1,073,170) | | | 4,293,945 | |
| | Class I Shares | | (2,092,211) | | | (5,268,172) | |
| | Class N Shares | | 28,005 | | | 222,331 | |
| | Class R Shares | | 381 | | | 510 | |
| | Class S Shares | | 315 | | | 721 | |
| | Class T Shares | | 35,031 | | | 27,879 | |
Net Increase/(Decrease) from Capital Share Transactions | | (2,977,836) | | | (648,237) | |
Net Increase/(Decrease) in Net Assets | | 2,066,849 | | | (11,022,129) | |
Net Assets: | | | | | | |
| Beginning of period | | 26,780,048 | | | 37,802,177 | |
| End of period | $ | 28,846,897 | | $ | 26,780,048 | |
| | | | | | | | |
| | |
See Notes to Financial Statements. |
| |
14 | MARCH 31, 2023 |
Janus Henderson Global Sustainable Equity Fund
Financial Highlights
| | | | | | | | | | | | | | | | |
Class A Shares | | | | | | | | | | | | |
For a share outstanding during the period ended March 31, 2023 (unaudited) and the year or period ended September 30 | 2023 | | | 2022 | | | 2021 | | | 2020(1) | |
| Net Asset Value, Beginning of Period | | $10.37 | | | $14.16 | | | $11.18 | | | $10.00 | |
| Income/(Loss) from Investment Operations: | | | | | | | | | | | | |
| | Net investment income/(loss)(2) | | 0.01 | | | 0.02 | | | 0.02 | | | 0.01 | |
| | Net realized and unrealized gain/(loss) | | 2.14 | | | (3.67) | | | 3.00 | | | 1.17 | |
| Total from Investment Operations | | 2.15 | | | (3.65) | | | 3.02 | | | 1.18 | |
| Less Dividends and Distributions: | | | | | | | | | | | | |
| | Dividends (from net investment income) | | (0.02) | | | (0.01) | | | (0.03) | | | — | |
| | Distributions (from capital gains) | | — | | | (0.13) | | | (0.01) | | | — | |
| Total Dividends and Distributions | | (0.02) | | | (0.14) | | | (0.04) | | | — | |
| Net Asset Value, End of Period | | $12.50 | | | $10.37 | | | $14.16 | | | $11.18 | |
| Total Return* | | 20.78% | | | (26.05)% | | | 27.05% | | | 11.80% | |
| Net Assets, End of Period (in thousands) | | $318 | | | $182 | | | $181 | | | $67 | |
| Average Net Assets for the Period (in thousands) | | $258 | | | $208 | | | $123 | | | $63 | |
| Ratios to Average Net Assets**: | | | | | | | | | | | | |
| | Ratio of Gross Expenses | | 3.08% | | | 3.18% | | | 4.43% | | | 15.65% | |
| | Ratio of Net Expenses (After Waivers and Expense Offsets) | | 1.15% | | | 1.05% | | | 1.06% | | | 1.13% | |
| | Ratio of Net Investment Income/(Loss) | | 0.18% | | | 0.15% | | | 0.12% | | | 0.27% | |
| Portfolio Turnover Rate | | 15% | | | 33% | | | 12% | | | 11% | |
| | | | | | | | | | | | | | | | |
| |
* Total return includes adjustments in accordance with generally accepted accounting principles required at the year or period end and are not annualized for periods of less than one full year. ** Annualized for periods of less than one full year. (1) Period from June 25, 2020 (inception date) through September 30, 2020. (2) Per share amounts are calculated based on average shares outstanding during the year or period. |
| | |
See Notes to Financial Statements. |
| |
Janus Investment Fund | 15 |
Janus Henderson Global Sustainable Equity Fund
Financial Highlights
| | | | | | | | | | | | | | | | |
Class C Shares | | | | | | | | | | | | |
For a share outstanding during the period ended March 31, 2023 (unaudited) and the year or period ended September 30 | 2023 | | | 2022 | | | 2021 | | | 2020(1) | |
| Net Asset Value, Beginning of Period | | $10.39 | | | $14.13 | | | $11.16 | | | $10.00 | |
| Income/(Loss) from Investment Operations: | | | | | | | | | | | | |
| | Net investment income/(loss)(2) | | 0.01 | | | 0.07 | | | (0.01) | | | (0.01) | |
| | Net realized and unrealized gain/(loss) | | 2.15 | | | (3.68) | | | 3.01 | | | 1.17 | |
| Total from Investment Operations | | 2.16 | | | (3.61) | | | 3.00 | | | 1.16 | |
| Less Dividends and Distributions: | | | | | | | | | | | | |
| | Dividends (from net investment income) | | (0.06) | | | —(3) | | | (0.02) | | | — | |
| | Distributions (from capital gains) | | — | | | (0.13) | | | (0.01) | | | — | |
| Total Dividends and Distributions | | (0.06) | | | (0.13) | | | (0.03) | | | — | |
| Net Asset Value, End of Period | | $12.49 | | | $10.39 | | | $14.13 | | | $11.16 | |
| Total Return* | | 20.82% | | | (25.79)% | | | 26.91% | | | 11.60% | |
| Net Assets, End of Period (in thousands) | | $105 | | | $61 | | | $77 | | | $56 | |
| Average Net Assets for the Period (in thousands) | | $70 | | | $74 | | | $67 | | | $54 | |
| Ratios to Average Net Assets**: | | | | | | | | | | | | |
| | Ratio of Gross Expenses | | 6.28% | | | 5.34% | | | 6.64% | | | 17.28% | |
| | Ratio of Net Expenses (After Waivers and Expense Offsets) | | 1.22% | | | 0.59% | | | 1.19% | | | 1.87% | |
| | Ratio of Net Investment Income/(Loss) | | 0.11% | | | 0.57% | | | (0.04)% | | | (0.46)% | |
| Portfolio Turnover Rate | | 15% | | | 33% | | | 12% | | | 11% | |
| | | | | | | | | | | | | | | | |
| |
* Total return includes adjustments in accordance with generally accepted accounting principles required at the year or period end and are not annualized for periods of less than one full year. ** Annualized for periods of less than one full year. (1) Period from June 25, 2020 (inception date) through September 30, 2020. (2) Per share amounts are calculated based on average shares outstanding during the year or period. (3) Less than $0.005 on a per share basis. |
| | |
See Notes to Financial Statements. |
| |
16 | MARCH 31, 2023 |
Janus Henderson Global Sustainable Equity Fund
Financial Highlights
| | | | | | | | | | | | | | | | |
Class D Shares | | | | | | | | | | | | |
For a share outstanding during the period ended March 31, 2023 (unaudited) and the year or period ended September 30 | 2023 | | | 2022 | | | 2021 | | | 2020(1) | |
| Net Asset Value, Beginning of Period | | $10.40 | | | $14.20 | | | $11.18 | | | $10.00 | |
| Income/(Loss) from Investment Operations: | | | | | | | | | | | | |
| | Net investment income/(loss)(2) | | 0.02 | | | 0.02 | | | 0.02 | | | 0.01 | |
| | Net realized and unrealized gain/(loss) | | 2.15 | | | (3.68) | | | 3.01 | | | 1.17 | |
| Total from Investment Operations | | 2.17 | | | (3.66) | | | 3.03 | | | 1.18 | |
| Less Dividends and Distributions: | | | | | | | | | | | | |
| | Dividends (from net investment income) | | (0.03) | | | (0.01) | | | — | | | — | |
| | Distributions (from capital gains) | | — | | | (0.13) | | | (0.01) | | | — | |
| Total Dividends and Distributions | | (0.03) | | | (0.14) | | | (0.01) | | | — | |
| Net Asset Value, End of Period | | $12.54 | | | $10.40 | | | $14.20 | | | $11.18 | |
| Total Return* | | 20.86% | | | (26.02)% | | | 27.15% | | | 11.80% | |
| Net Assets, End of Period (in thousands) | | $23,680 | | | $20,664 | | | $23,921 | | | $5,226 | |
| Average Net Assets for the Period (in thousands) | | $22,212 | | | $24,549 | | | $16,804 | | | $2,485 | |
| Ratios to Average Net Assets**: | | | | | | | | | | | | |
| | Ratio of Gross Expenses | | 1.83% | | | 1.71% | | | 1.97% | | | 10.52% | |
| | Ratio of Net Expenses (After Waivers and Expense Offsets) | | 1.02% | | | 1.00% | | | 1.00% | | | 0.98% | |
| | Ratio of Net Investment Income/(Loss) | | 0.27% | | | 0.16% | | | 0.18% | | | 0.50% | |
| Portfolio Turnover Rate | | 15% | | | 33% | | | 12% | | | 11% | |
| | | | | | | | | | | | | | | | |
| |
* Total return includes adjustments in accordance with generally accepted accounting principles required at the year or period end and are not annualized for periods of less than one full year. ** Annualized for periods of less than one full year. (1) Period from June 25, 2020 (inception date) through September 30, 2020. (2) Per share amounts are calculated based on average shares outstanding during the year or period. |
| | |
See Notes to Financial Statements. |
| |
Janus Investment Fund | 17 |
Janus Henderson Global Sustainable Equity Fund
Financial Highlights
| | | | | | | | | | | | | | | | |
Class I Shares | | | | | | | | | | | | |
For a share outstanding during the period ended March 31, 2023 (unaudited) and the year or period ended September 30 | 2023 | | | 2022 | | | 2021 | | | 2020(1) | |
| Net Asset Value, Beginning of Period | | $10.39 | | | $14.19 | | | $11.19 | | | $10.00 | |
| Income/(Loss) from Investment Operations: | | | | | | | | | | | | |
| | Net investment income/(loss)(2) | | 0.01 | | | 0.02 | | | 0.04 | | | 0.02 | |
| | Net realized and unrealized gain/(loss) | | 2.15 | | | (3.66) | | | 3.00 | | | 1.17 | |
| Total from Investment Operations | | 2.16 | | | (3.64) | | | 3.04 | | | 1.19 | |
| Less Dividends and Distributions: | | | | | | | | | | | | |
| | Dividends (from net investment income) | | (0.07) | | | (0.03) | | | (0.03) | | | — | |
| | Distributions (from capital gains) | | — | | | (0.13) | | | (0.01) | | | — | |
| Total Dividends and Distributions | | (0.07) | | | (0.16) | | | (0.04) | | | — | |
| Net Asset Value, End of Period | | $12.48 | | | $10.39 | | | $14.19 | | | $11.19 | |
| Total Return* | | 20.82% | | | (25.97)% | | | 27.25% | | | 11.90% | |
| Net Assets, End of Period (in thousands) | | $2,407 | | | $3,991 | | | $11,353 | | | $5,317 | |
| Average Net Assets for the Period (in thousands) | | $2,874 | | | $7,265 | | | $7,780 | | | $5,071 | |
| Ratios to Average Net Assets**: | | | | | | | | | | | | |
| | Ratio of Gross Expenses | | 1.88% | | | 1.57% | | | 1.86% | | | 10.72% | |
| | Ratio of Net Expenses (After Waivers and Expense Offsets) | | 1.02% | | | 0.92% | | | 0.87% | | | 0.86% | |
| | Ratio of Net Investment Income/(Loss) | | 0.21% | | | 0.11% | | | 0.29% | | | 0.55% | |
| Portfolio Turnover Rate | | 15% | | | 33% | | | 12% | | | 11% | |
| | | | | | | | | | | | | | | | |
| |
* Total return includes adjustments in accordance with generally accepted accounting principles required at the year or period end and are not annualized for periods of less than one full year. ** Annualized for periods of less than one full year. (1) Period from June 25, 2020 (inception date) through September 30, 2020. (2) Per share amounts are calculated based on average shares outstanding during the year or period. |
| | |
See Notes to Financial Statements. |
| |
18 | MARCH 31, 2023 |
Janus Henderson Global Sustainable Equity Fund
Financial Highlights
| | | | | | | | | | | | | | | | |
Class N Shares | | | | | | | | | | | | |
For a share outstanding during the period ended March 31, 2023 (unaudited) and the year or period ended September 30 | 2023 | | | 2022 | | | 2021 | | | 2020(1) | |
| Net Asset Value, Beginning of Period | | $10.43 | | | $14.23 | | | $11.19 | | | $10.00 | |
| Income/(Loss) from Investment Operations: | | | | | | | | | | | | |
| | Net investment income/(loss)(2) | | 0.02 | | | 0.04 | | | 0.05 | | | 0.02 | |
| | Net realized and unrealized gain/(loss) | | 2.17 | | | (3.69) | | | 3.00 | | | 1.17 | |
| Total from Investment Operations | | 2.19 | | | (3.65) | | | 3.05 | | | 1.19 | |
| Less Dividends and Distributions: | | | | | | | | | | | | |
| | Dividends (from net investment income) | | (0.05) | | | (0.02) | | | — | | | — | |
| | Distributions (from capital gains) | | — | | | (0.13) | | | (0.01) | | | — | |
| Total Dividends and Distributions | | (0.05) | | | (0.15) | | | (0.01) | | | — | |
| Net Asset Value, End of Period | | $12.57 | | | $10.43 | | | $14.23 | | | $11.19 | |
| Total Return* | | 21.02% | | | (25.93)% | | | 27.30% | | | 11.90% | |
| Net Assets, End of Period (in thousands) | | $1,537 | | | $1,250 | | | $1,449 | | | $192 | |
| Average Net Assets for the Period (in thousands) | | $1,413 | | | $1,432 | | | $831 | | | $83 | |
| Ratios to Average Net Assets**: | | | | | | | | | | | | |
| | Ratio of Gross Expenses | | 1.85% | | | 1.73% | | | 2.14% | | | 14.24% | |
| | Ratio of Net Expenses (After Waivers and Expense Offsets) | | 0.87% | | | 0.86% | | | 0.86% | | | 0.86% | |
| | Ratio of Net Investment Income/(Loss) | | 0.42% | | | 0.31% | | | 0.33% | | | 0.73% | |
| Portfolio Turnover Rate | | 15% | | | 33% | | | 12% | | | 11% | |
| | | | | | | | | | | | | | | | |
| |
* Total return includes adjustments in accordance with generally accepted accounting principles required at the year or period end and are not annualized for periods of less than one full year. ** Annualized for periods of less than one full year. (1) Period from June 25, 2020 (inception date) through September 30, 2020. (2) Per share amounts are calculated based on average shares outstanding during the year or period. |
| | |
See Notes to Financial Statements. |
| |
Janus Investment Fund | 19 |
Janus Henderson Global Sustainable Equity Fund
Financial Highlights
| | | | | | | | | | | | | |
Class R Shares | | | | | | | | | |
For a share outstanding during the period ended March 31, 2023 (unaudited) and the year or period ended September 30 | 2023 | | | 2022 | | | 2021(1) | |
| Net Asset Value, Beginning of Period | | $10.40 | | | $14.13 | | | $13.08 | |
| Income/(Loss) from Investment Operations: | | | | | | | | | |
| | Net investment income/(loss)(2) | | 0.01 | | | 0.08 | | | (0.03) | |
| | Net realized and unrealized gain/(loss) | | 2.16 | | | (3.68) | | | 1.08 | |
| Total from Investment Operations | | 2.17 | | | (3.60) | | | 1.05 | |
| Less Dividends and Distributions: | | | | | | | | | |
| | Dividends (from net investment income) | | (0.07) | | | — | | | — | |
| | Distributions (from capital gains) | | — | | | (0.13) | | | — | |
| Total Dividends and Distributions | | (0.07) | | | (0.13) | | | — | |
| Net Asset Value, End of Period | | $12.50 | | | $10.40 | | | $14.13 | |
| Total Return* | | 20.92% | | | (25.72)% | | | 8.03% | |
| Net Assets, End of Period (in thousands) | | $49 | | | $40 | | | $54 | |
| Average Net Assets for the Period (in thousands) | | $45 | | | $51 | | | $53 | |
| Ratios to Average Net Assets**: | | | | | | | | | |
| | Ratio of Gross Expenses | | 8.57% | | | 7.35% | | | 7.99% | |
| | Ratio of Net Expenses (After Waivers and Expense Offsets) | | 1.09% | | | 0.57% | | | 1.46% | |
| | Ratio of Net Investment Income/(Loss) | | 0.20% | | | 0.59% | | | (0.27)% | |
| Portfolio Turnover Rate | | 15% | | | 33% | | | 12% | |
| | | | | | | | | | | | | |
| |
* Total return includes adjustments in accordance with generally accepted accounting principles required at the year or period end and are not annualized for periods of less than one full year. ** Annualized for periods of less than one full year. (1) Period from January 28, 2021 (inception date) through September 30, 2021. (2) Per share amounts are calculated based on average shares outstanding during the year or period. |
| | |
See Notes to Financial Statements. |
| |
20 | MARCH 31, 2023 |
Janus Henderson Global Sustainable Equity Fund
Financial Highlights
| | | | | | | | | | | | | | | | |
Class S Shares | | | | | | | | | | | | |
For a share outstanding during the period ended March 31, 2023 (unaudited) and the year or period ended September 30 | 2023 | | | 2022 | | | 2021 | | | 2020(1) | |
| Net Asset Value, Beginning of Period | | $10.37 | | | $14.15 | | | $11.17 | | | $10.00 | |
| Income/(Loss) from Investment Operations: | | | | | | | | | | | | |
| | Net investment income/(loss)(2) | | 0.01 | | | 0.04 | | | —(3) | | | —(3) | |
| | Net realized and unrealized gain/(loss) | | 2.15 | | | (3.68) | | | 3.01 | | | 1.17 | |
| Total from Investment Operations | | 2.16 | | | (3.64) | | | 3.01 | | | 1.17 | |
| Less Dividends and Distributions: | | | | | | | | | | | | |
| | Dividends (from net investment income) | | (0.06) | | | (0.01) | | | (0.02) | | | — | |
| | Distributions (from capital gains) | | — | | | (0.13) | | | (0.01) | | | — | |
| Total Dividends and Distributions | | (0.06) | | | (0.14) | | | (0.03) | | | — | |
| Net Asset Value, End of Period | | $12.47 | | | $10.37 | | | $14.15 | | | $11.17 | |
| Total Return* | | 20.91% | | | (25.98)% | | | 27.05% | | | 11.70% | |
| Net Assets, End of Period (in thousands) | | $64 | | | $53 | | | $71 | | | $56 | |
| Average Net Assets for the Period (in thousands) | | $59 | | | $66 | | | $67 | | | $54 | |
| Ratios to Average Net Assets**: | | | | | | | | | | | | |
| | Ratio of Gross Expenses | | 7.01% | | | 6.24% | | | 6.65% | | | 16.77% | |
| | Ratio of Net Expenses (After Waivers and Expense Offsets) | | 1.04% | | | 0.83% | | | 1.11% | | | 1.37% | |
| | Ratio of Net Investment Income/(Loss) | | 0.24% | | | 0.32% | | | 0.03% | | | 0.04% | |
| Portfolio Turnover Rate | | 15% | | | 33% | | | 12% | | | 11% | |
| | | | | | | | | | | | | | | | |
| |
* Total return includes adjustments in accordance with generally accepted accounting principles required at the year or period end and are not annualized for periods of less than one full year. ** Annualized for periods of less than one full year. (1) Period from June 25, 2020 (inception date) through September 30, 2020. (2) Per share amounts are calculated based on average shares outstanding during the year or period. (3) Less than $0.005 on a per share basis. |
| | |
See Notes to Financial Statements. |
| |
Janus Investment Fund | 21 |
Janus Henderson Global Sustainable Equity Fund
Financial Highlights
| | | | | | | | | | | | | | | | |
Class T Shares | | | | | | | | | | | | |
For a share outstanding during the period ended March 31, 2023 (unaudited) and the year or period ended September 30 | 2023 | | | 2022 | | | 2021 | | | 2020 | |
| Net Asset Value, Beginning of Period | | $10.38 | | | $14.18 | | | $11.18 | | | $10.00 | |
| Income/(Loss) from Investment Operations: | | | | | | | | | | | | |
| | Net investment income/(loss)(1) | | 0.01 | | | 0.01 | | | 0.01 | | | 0.01 | |
| | Net realized and unrealized gain/(loss) | | 2.16 | | | (3.68) | | | 3.01 | | | 1.17 | |
| Total from Investment Operations | | 2.17 | | | (3.67) | | | 3.02 | | | 1.18 | |
| Less Dividends and Distributions: | | | | | | | | | | | | |
| | Dividends (from net investment income) | | (0.02) | | | —(2) | | | (0.01) | | | — | |
| | Distributions (from capital gains) | | — | | | (0.13) | | | (0.01) | | | — | |
| Total Dividends and Distributions | | (0.02) | | | (0.13) | | | (0.02) | | | — | |
| Net Asset Value, End of Period | | $12.53 | | | $10.38 | | | $14.18 | | | $11.18 | |
| Total Return* | | 20.87% | | | (26.12)% | | | 27.02% | | | 11.80% | |
| Net Assets, End of Period (in thousands) | | $687 | | | $540 | | | $697 | | | $99 | |
| Average Net Assets for the Period (in thousands) | | $617 | | | $633 | | | $387 | | | $77 | |
| Ratios to Average Net Assets**: | | | | | | | | | | | | |
| | Ratio of Gross Expenses | | 2.36% | | | 2.25% | | | 2.82% | | | 14.65% | |
| | Ratio of Net Expenses (After Waivers and Expense Offsets) | | 1.10% | | | 1.09% | | | 1.09% | | | 1.11% | |
| | Ratio of Net Investment Income/(Loss) | | 0.19% | | | 0.05% | | | 0.10% | | | 0.33% | |
| Portfolio Turnover Rate | | 15% | | | 33% | | | 12% | | | 11% | |
| | | | | | | | | | | | | | | | |
| |
* Total return includes adjustments in accordance with generally accepted accounting principles required at the year or period end and are not annualized for periods of less than one full year. ** Annualized for periods of less than one full year. (1) Per share amounts are calculated based on average shares outstanding during the year or period. (2) Less than $0.005 on a per share basis. |
| | |
See Notes to Financial Statements. |
| |
22 | MARCH 31, 2023 |
Janus Henderson Global Sustainable Equity Fund
Notes to Financial Statements (unaudited)
1. Organization and Significant Accounting Policies
Janus Henderson Global Sustainable Equity Fund (the “Fund”) is a series of Janus Investment Fund (the “Trust”), which is organized as a Massachusetts business trust and is registered under the Investment Company Act of 1940, as amended (the “1940 Act”), as an open-end management investment company, and therefore has applied the specialized accounting and reporting guidance in Financial Accounting Standards Board (“FASB”) Accounting Standards Codification (“ASC”) Topic 946. The Trust offers 40 funds, each of which offers multiple share classes, with differing investment objectives and policies. The Fund seeks long-term growth of capital. The Fund is classified as diversified, as defined in the 1940 Act. Janus Henderson Investors US LLC is the investment adviser (the “Adviser”) to the Fund.
The Fund offers multiple classes of shares in order to meet the needs of various types of investors. Each class represents an interest in the same portfolio of investments. Certain financial intermediaries may not offer all classes of shares.
Class A Shares are offered through financial intermediary platforms including, but not limited to, traditional brokerage platforms, mutual fund wrap fee programs, bank trust platforms, and retirement platforms.
Class C Shares are offered through financial intermediary platforms including, but not limited to, traditional brokerage platforms, mutual fund wrap fee programs, and bank trust platforms.
Class C Shares are closed to investments by new employer-sponsored retirement plans and existing employer-sponsored retirement plans are no longer able to make additional purchases or exchanges into Class C Shares.
The Fund currently implements an automatic conversion feature pursuant to which Class C Shares that have been held for eight years are automatically converted to Class A Shares without the imposition of any sales charge, fee or other charge. The conversion will generally occur no later than ten business days in the month following the month of the eighth anniversary of the date of purchase. Class C Shares purchased through the reinvestment of dividends and other distributions on Class C Shares will convert to Class A Shares at the same time as the original Class C Shares with respect to which they were purchased. For Class C Shares held in omnibus accounts on intermediary platforms, the Fund relies on these intermediaries to implement this conversion feature. Your financial intermediary may have separate policies and procedures as to when and how Class C Shares may be converted to Class A Shares.
Effective July 6, 2020, Class D Shares are available to new investors, subject to any closed fund policies for a Fund, as applicable. Previously, Class D Shares were only available to investors who already had a direct account with the Janus Henderson funds; immediate family members or members of the same household of an eligible individual investor; and existing beneficial owners of sole proprietorships or partnerships that hold accounts directly with the Janus Henderson funds.
Class I Shares are available through certain financial intermediary platforms including, but not limited to, mutual fund wrap fee programs, managed account programs, asset allocation programs, bank trust platforms, as well as certain retirement platforms. Class I Shares are also available to certain direct institutional investors including, but not limited to, corporations, certain retirement plans, public plans, and foundations/endowments, who established Class I Share accounts before August 4, 2017.
Class N Shares are generally available only to financial intermediaries purchasing on behalf of: 1) certain adviser-assisted, employer-sponsored retirement plans, including 401(k) plans, 457 plans, 403(b) plans, Taft-Hartley multi-employer plans, profit-sharing and money purchase pension plans, defined benefit plans and certain welfare benefit plans, such as health savings accounts, and nonqualified deferred compensation plans; and 2) retail investors purchasing in qualified or nonqualified accounts, whose accounts are held through an omnibus account at their financial intermediary, and where the financial intermediary requires no payment or reimbursement from the Fund, the Adviser, or its affiliates. Class N Shares are also available to Janus Henderson proprietary products and to certain direct institutional investors approved by Janus Henderson Distributors US LLC (the “Distributor”) including, but not limited to, corporations, certain retirement plans, public plans, and foundations and endowments, subject to minimum investment requirements.
Class R Shares are offered through financial intermediary platforms including, but not limited to, retirement platforms.
Janus Henderson Global Sustainable Equity Fund
Notes to Financial Statements (unaudited)
Class S Shares are offered through financial intermediary platforms including, but not limited to, retirement platforms and asset allocation, mutual fund wrap, or other discretionary or nondiscretionary fee-based investment advisory programs. In addition, Class S Shares may be available through certain financial intermediaries who have an agreement with the Adviser or its affiliates to offer Class S Shares on their supermarket platforms.
Class T Shares are available through certain financial intermediary platforms including, but not limited to, mutual fund wrap fee programs, managed account programs, asset allocation programs, bank trust platforms, as well as certain retirement platforms. In addition, Class T Shares may be available through certain financial intermediaries who have an agreement with the Adviser or its affiliates to offer Class T Shares on their supermarket platforms.
The following accounting policies have been followed by the Fund and are in conformity with US GAAP.
Investment Valuation
Fund holdings are valued in accordance with policies and procedures established by the Adviser pursuant to Rule 2a-5 under the 1940 Act and approved by and subject to the oversight of the Trustees (the “Valuation Procedures”). Equity securities traded on a domestic securities exchange are generally valued at readily available market quotations, which are (i) the official close prices or (ii) last sale prices on the primary market or exchange in which the securities trade. If such price is lacking for the trading period immediately preceding the time of determination, such securities are generally valued at their current bid price. Equity securities that are traded on a foreign exchange are generally valued at the closing prices on such markets. In the event that there is no current trading volume on a particular security in such foreign exchange, the bid price from the primary exchange is generally used to value the security. Foreign securities and currencies are converted to U.S. dollars using the current spot USD dollar exchange rate in effect at the close of the New York Stock Exchange (“NYSE”). The Fund will determine the market value of individual securities held by it by using prices provided by one or more approved professional pricing services or, as needed, by obtaining market quotations from independent broker-dealers. Most debt securities are valued in accordance with the evaluated bid price supplied by the Adviser-approved pricing service that is intended to reflect market value. The evaluated bid price supplied by the pricing service is an evaluation that may consider factors such as security prices, yields, maturities and ratings. Certain short-term securities maturing within 60 days or less may be evaluated and valued on an amortized cost basis provided that the amortized cost determined approximates market value. Securities for which market quotations or evaluated prices are not readily available or deemed unreliable are valued at fair value determined in good faith by the Adviser pursuant to the Valuation Procedures. Circumstances in which fair valuation may be utilized include, but are not limited to: (i) a significant event that may affect the securities of a single issuer, such as a merger, bankruptcy, or significant issuer-specific development; (ii) an event that may affect an entire market, such as a natural disaster or significant governmental action; (iii) a nonsignificant event such as a market closing early or not opening, or a security trading halt; and (iv) pricing of a nonvalued security and a restricted or nonpublic security. Special valuation considerations may apply with respect to “odd-lot” fixed-income transactions which, due to their small size, may receive evaluated prices by pricing services which reflect a large block trade and not what actually could be obtained for the odd-lot position. The valuation policies provide for the use of systematic fair valuation models provided by independent pricing services to value foreign equity securities in order to adjust for stale pricing, which may occur between the close of certain foreign exchanges and the close of the NYSE. The value of the securities of other mutual funds held by a Fund, if any, will be calculated using the NAV of such mutual funds.
Valuation Inputs Summary
FASB ASC 820, Fair Value Measurements and Disclosures (“ASC 820”), defines fair value, establishes a framework for measuring fair value, and expands disclosure requirements regarding fair value measurements. This standard emphasizes that fair value is a market-based measurement that should be determined based on the assumptions that market participants would use in pricing an asset or liability and establishes a hierarchy that prioritizes inputs to valuation techniques used to measure fair value. These inputs are summarized into three broad levels:
Level 1 – Unadjusted quoted prices in active markets the Fund has the ability to access for identical assets or liabilities.
Level 2 – Observable inputs other than unadjusted quoted prices included in Level 1 that are observable for the asset or liability either directly or indirectly. These inputs may include quoted prices for the identical instrument on an inactive market, prices for similar instruments, interest rates, prepayment speeds, credit risk, yield curves, default rates and similar data.
Janus Henderson Global Sustainable Equity Fund
Notes to Financial Statements (unaudited)
Assets or liabilities categorized as Level 2 in the hierarchy generally include: debt securities fair valued in accordance with the evaluated bid or ask prices supplied by a pricing service; securities traded on OTC markets and listed securities for which no sales are reported that are fair valued at the latest bid price (or yield equivalent thereof) obtained from one or more dealers transacting in a market for such securities or by a pricing service approved by the Fund’s Trustees; certain short-term debt securities with maturities of 60 days or less that are fair valued at amortized cost; and equity securities of foreign issuers whose fair value is determined by using systematic fair valuation models provided by independent third parties in order to adjust for stale pricing which may occur between the close of certain foreign exchanges and the close of the NYSE. Other securities that may be categorized as Level 2 in the hierarchy include, but are not limited to, preferred stocks, bank loans, swaps, investments in unregistered investment companies, options, and forward contracts.
Level 3 – Unobservable inputs for the asset or liability to the extent that relevant observable inputs are not available, representing the Fund’s own assumptions about the assumptions that a market participant would use in valuing the asset or liability, and that would be based on the best information available.
There have been no significant changes in valuation techniques used in valuing any such positions held by the Fund since the beginning of the fiscal period.
The inputs or methodology used for fair valuing securities are not necessarily an indication of the risk associated with investing in those securities. The summary of inputs used as of March 31, 2023 to fair value the Fund’s investments in securities and other financial instruments is included in the “Valuation Inputs Summary” in the Notes to Schedule of Investments and Other Information.
Investment Transactions and Investment Income
Investment transactions are accounted for as of the date purchased or sold (trade date). Dividend income is recorded on the ex-dividend date. Certain dividends from foreign securities will be recorded as soon as the Fund is informed of the dividend, if such information is obtained subsequent to the ex-dividend date. Dividends from foreign securities may be subject to withholding taxes in foreign jurisdictions. Non-cash dividends, if any, are recorded on the ex-dividend date at fair value. Interest income is recorded daily on an accrual basis and includes amortization of premiums and accretion of discounts. The Fund classifies gains and losses on prepayments received as an adjustment to interest income. Debt securities may be placed in non-accrual status and related interest income may be reduced by stopping current accruals and writing off interest receivables when collection of all or a portion of interest has become doubtful. Gains and losses are determined on the identified cost basis, which is the same basis used for federal income tax purposes. Income, as well as gains and losses, both realized and unrealized, are allocated daily to each class of shares based upon the ratio of net assets represented by each class as a percentage of total net assets.
Expenses
The Fund bears expenses incurred specifically on its behalf. Each class of shares bears a portion of general expenses, which are allocated daily to each class of shares based upon the ratio of net assets represented by each class as a percentage of total net assets. Expenses directly attributable to a specific class of shares are charged against the operations of such class.
Estimates
The preparation of financial statements in conformity with US GAAP requires management to make estimates and assumptions that affect the reported amount of assets and liabilities and disclosure of contingent assets and liabilities at the date of the financial statements, and the reported amounts of income and expenses during the reporting period. Actual results could differ from those estimates.
Foreign Currency Translations
The Fund does not isolate that portion of the results of operations resulting from the effect of changes in foreign exchange rates on investments from the fluctuations arising from changes in market prices of securities held at the date of the financial statements. Net unrealized appreciation or depreciation of investments and foreign currency translations arise from changes in the value of assets and liabilities, including investments in securities held at the date of the financial statements, resulting from changes in the exchange rates and changes in market prices of securities held.
Currency gains and losses are also calculated on payables and receivables that are denominated in foreign currencies. The payables and receivables are generally related to foreign security transactions and income translations.
Janus Henderson Global Sustainable Equity Fund
Notes to Financial Statements (unaudited)
Foreign currency-denominated assets and forward currency contracts may involve more risks than domestic transactions, including currency risk, counterparty risk, political and economic risk, regulatory risk and equity risk. Risks may arise from unanticipated movements in the value of foreign currencies relative to the U.S. dollar.
Dividends and Distributions
The Fund generally declares and distributes dividends of net investment income and realized capital gains (if any) annually. The Fund may treat a portion of the amount paid to redeem shares as a distribution of investment company taxable income and realized capital gains that are reflected in the net asset value. This practice, commonly referred to as “equalization,” has no effect on the redeeming shareholder or a Fund’s total return, but may reduce the amounts that would otherwise be required to be paid as taxable dividends to the remaining shareholders. It is possible that the Internal Revenue Service (IRS) could challenge the Fund's equalization methodology or calculations, and any such challenge could result in additional tax, interest, or penalties to be paid by the Fund.
The Fund may make certain investments in real estate investment trusts (“REITs”) which pay dividends to their shareholders based upon funds available from operations. It is quite common for these dividends to exceed the REITs’ taxable earnings and profits, resulting in the excess portion of such dividends being designated as a return of capital. If the Fund distributes such amounts, such distributions could constitute a return of capital to shareholders for federal income tax purposes.
Federal Income Taxes
The Fund intends to continue to qualify as a regulated investment company and distribute all of its taxable income in accordance with the requirements of Subchapter M of the Internal Revenue Code. Management has analyzed the Fund’s tax positions taken for all open federal income tax years, generally a three-year period, and has concluded that no provision for federal income tax is required in the Fund’s financial statements. The Fund is not aware of any tax positions for which it is reasonably possible that the total amounts of unrecognized tax benefits will significantly change in the next twelve months.
2. Other Investments and Strategies
Additional Investment Risk
The U.S. government and the Federal Reserve, as well as certain foreign governments and central banks, have taken extraordinary actions to support local and global economies and the financial markets in response to the COVID-19 pandemic. This and other government intervention into the economy and financial markets to address the COVID-19 pandemic may not work as intended, particularly if the efforts are perceived by investors as being unlikely to achieve the desired results. Government actions to mitigate the economic impact of the pandemic have resulted in a large expansion of government deficits and debt, the long term consequences of which are not known. The COVID-19 pandemic could adversely affect the value and liquidity of a Fund’s investments, impair a Fund’s ability to satisfy redemption requests, and negatively impact a Fund’s performance. In addition, the outbreak of COVID-19, and measures taken to mitigate its effects, could result in disruptions to the services provided to a Fund by its service providers.
Widespread disease, including pandemics and epidemics, and natural or environmental disasters, including those which may be attributable to global climate change, such as earthquakes, fires, floods, hurricanes, tsunamis and weather-related phenomena generally, have been and can be highly disruptive to economies and markets, adversely impacting individual companies, sectors, industries, markets, currencies, interest and inflation rates, credit ratings, investor sentiment, and other factors affecting the value of a Fund’s investments. Economies and financial markets throughout the world have become increasingly interconnected, which increases the likelihood that events or conditions in one region or country will adversely affect markets or issuers in other regions or countries, including the United States. These disruptions could prevent a Fund from executing advantageous investment decisions in a timely manner and negatively impact a Fund’s ability to achieve its investment objective(s). Any such event(s) could have a significant adverse impact on the value of a Fund. In addition, these disruptions could also impair the information technology and other operational systems upon which the Fund’s service providers, including the Adviser or the subadviser (as applicable), rely, and could otherwise disrupt the ability of employees of the Fund’s service providers to perform essential tasks on behalf of the Fund. Adverse weather conditions may also have a particularly significant negative effect on issuers in the agricultural sector and on insurance and reinsurance companies that insure or reinsure against the impact of natural disasters.
Janus Henderson Global Sustainable Equity Fund
Notes to Financial Statements (unaudited)
A number of countries in the European Union (the “EU”) have experienced, and may continue to experience, severe economic and financial difficulties. In particular, many EU nations are susceptible to economic risks associated with high levels of debt. Many non-governmental issuers, and even certain governments, have defaulted on, or been forced to restructure, their debts. Many other issuers have faced difficulties obtaining credit or refinancing existing obligations. Financial institutions have in many cases required government or central bank support, have needed to raise capital, and/or have been impaired in their ability to extend credit. As a result, financial markets in the EU have experienced extreme volatility and declines in asset values and liquidity. These difficulties may continue, worsen, or spread further within the EU. Responses to these financial problems by European governments, central banks, and others, including austerity measures and reforms, may not work, may result in social unrest, and may limit future growth and economic recovery or have other unintended consequences. Among other things, these developments have adversely affected the value and exchange rate of the euro and pound sterling, and may continue to significantly affect the economies of all EU countries, which in turn may have a material adverse effect on the Fund’s investments in such countries, other countries that depend on EU countries for significant amounts of trade or investment, or issuers with exposure to debt issued by certain EU countries.
Real Estate Investing
The Fund may invest in equity and debt securities of real estate-related companies. Such companies may include those in the real estate industry or real estate-related industries. These securities may include common stocks, corporate bonds, preferred stocks, and other equity securities, including, but not limited to, mortgage-backed securities, real estate-backed securities, securities of REITs and similar REIT-like entities. A REIT is a trust that invests in real estate-related projects, such as properties, mortgage loans, and construction loans. REITs are generally categorized as equity, mortgage, or hybrid REITs. A REIT may be listed on an exchange or traded OTC.
3. Investment Advisory Agreements and Other Transactions with Affiliates
The Fund pays the Adviser an investment advisory fee which is calculated daily and paid monthly. The following table reflects the Fund’s contractual investment advisory fee rate (expressed as an annual rate).
| | |
Average Daily Net Assets of the Fund | Contractual Investment Advisory Fee (%) |
First $2 Billion | 0.75 |
Over $2 Billion | 0.70 |
The Fund’s actual investment advisory fee rate for the reporting period was 0.75% of average annual net assets before any applicable waivers.
The Adviser has contractually agreed to waive the investment advisory fee and/or reimburse operating expenses to the extent that the Fund’s total annual fund operating expenses, excluding the fees payable pursuant to a Rule 12b-1 plan, shareholder servicing fees, such as transfer agency fees (including out-of-pocket costs), administrative services fees and any networking/omnibus payable by any share class, brokerage commissions, interest, dividends, taxes, acquired fund fees and expenses, and extraordinary expenses, exceed the annual rate of 0.85% of the Fund’s average daily net assets. The Adviser has agreed to continue the waivers for at least a one-year period commencing January 27, 2023. If applicable, amounts waived and/or reimbursed to the Fund by the Adviser are disclosed as “Excess Expense Reimbursement and Waivers” on the Statement of Operations.
For the period of three years subsequent to the Fund’s commencement of operations, or until the Fund’s assets exceed the first breakpoint in the investment advisory fee schedule, whichever occurs first, the Adviser may recover from the Fund fees and expenses previously waived or reimbursed, which could then be considered a deferral, if the Fund’s expense ratio including recovered expenses, falls below the expense limit. If applicable, this amount is disclosed as “Recoupment expense” on the Statement of Operations. During the period ended March 31, 2023, the Adviser reimbursed the Fund $120,230 of fees and expense that are eligible for recoupment. As of March 31, 2023, the aggregate amount of recoupment that may potentially be made to the Adviser is $857,075. The recoupment of such reimbursements expires at the latest June 25, 2023.
The Adviser serves as administrator to the Fund pursuant to an administration agreement between the Adviser and the Trust. Under the administration agreement, the Adviser is authorized to perform, or cause others to perform certain administration, compliance, and accounting services to the Fund, including providing office space for the Fund, and is reimbursed by the Fund for certain of its costs in providing these services (to the extent the Adviser seeks
Janus Henderson Global Sustainable Equity Fund
Notes to Financial Statements (unaudited)
reimbursement and such costs are not otherwise waived). In addition, employees of the Adviser and/or its affiliates may serve as officers of the Trust. The Fund pays for some or all of the salaries, fees, and expenses of the Adviser employees and Fund officers, with respect to certain specified administration functions they perform on behalf of the Fund. The Fund pays these costs based on out-of-pocket expenses incurred by the Adviser, and these costs are separate and apart from advisory fees and other expenses paid in connection with the investment advisory services the Adviser (or any subadvisor, as applicable) provides to the Fund. These amounts are disclosed as “Affiliated fund administration fees” on the Statement of Operations. In addition, some expenses related to compensation payable to the Fund’s Chief Compliance Officer and certain compliance staff, all of whom are employees of the Adviser and/or its affiliates, are shared with the Fund. Total compensation of $114,430 was paid to the Chief Compliance Officer and certain compliance staff by the Trust during the period ended March 31, 2023. The Fund's portion is reported as part of “Other expenses” on the Statement of Operations.
Janus Henderson Services US LLC (the “Transfer Agent”), a wholly-owned subsidiary of the Adviser, is the Fund’s transfer agent. The Transfer Agent provides or arranges for the provision of shareholder services including, but not limited to, recordkeeping, subaccounting, answering inquiries regarding accounts, order processing, transaction confirmations, the mailing of prospectuses and shareholder reports, and other shareholder services provided to or on behalf of shareholders. These amounts are disclosed as “Transfer agent administrative fees and expenses” on the Statement of Operations.
Class D Shares of the Fund pay the Transfer Agent an annual administrative services fee based on the average daily net assets of Class D Shares as detailed below.
| | |
Average Daily Net Assets of Class D Shares of the Janus Henderson funds | Administrative Services Fee |
Under $40 billion | 0.12% |
$40 billion – $49.9 billion | 0.10% |
Over $49.9 billion | 0.08% |
During the reporting period, the administrative services fee rate was 0.12%.
The Transfer Agent receives an administrative services fee at an annual rate of up to 0.25% of the average daily net assets of the Fund’s Class S Shares and Class T Shares for providing or procuring administrative services to investors in Class S Shares and Class T Shares of the Fund. The Transfer Agent expects to use all or a significant portion of this fee to compensate retirement plan service providers, broker-dealers, bank trust departments, financial advisors, and other financial intermediaries for providing these services. The Transfer Agent may keep certain amounts retained for reimbursement of out-of-pocket costs incurred for servicing clients of Class S Shares and Class T Shares.
Shareholder Services provided by these financial intermediaries may include, but are not limited to, recordkeeping, subaccounting, order processing, providing order confirmations, periodic statements, forwarding prospectuses, shareholder reports, and other materials to existing customers, answering inquiries regarding accounts, and other administrative services. Order processing includes the submission of transactions through the National Securities Clearing Corporation (“NSCC”) or similar systems, or those processed on a manual basis with the Adviser. For all share classes, the Transfer Agent also seeks reimbursement for costs it incurs as transfer agent and for providing servicing.
Certain, but not all, intermediaries may charge administrative fees to investors in Class A Shares, Class C Shares, and Class I Shares for administrative services provided on behalf of such investors. These administrative fees are paid by the Class A Shares, Class C Shares, and Class I Shares of the Fund to the Transfer Agent, which uses such fees to reimburse intermediaries. Consistent with the Transfer Agency Agreement between the Transfer Agent and the Fund, the Transfer Agent may negotiate the level, structure, and/or terms of the administrative fees with intermediaries requiring such fees on behalf of the Fund. The Adviser and its affiliates benefit from an increase in assets that may result from such relationships. The Adviser has agreed to limit these fees up to 0.20% for Class A Shares and Class C Shares, and up to 0.15% for Class I Shares on an annual basis based on the daily net assets of each share class. Such limits are subject to change by the Trustees in the future. These amounts are disclosed as “Transfer agent networking and omnibus fees” on the Statement of Operations.
The Transfer Agent is not compensated for its services related to the shares, except for out-of-pocket costs, although the Transfer Agent is compensated for its services related to Fund’s Class D Shares. These amounts are disclosed as “Other transfer agent fees and expenses” on the Statement of Operations.
Janus Henderson Global Sustainable Equity Fund
Notes to Financial Statements (unaudited)
Under distribution and shareholder servicing plans (the “Plans”) adopted in accordance with Rule 12b-1 under the 1940 Act, the Fund pays the Trust’s distributor, the Distributor, a wholly-owned subsidiary of the Adviser, a fee for the sale and distribution and/or shareholder servicing of the shares based on the average daily net assets for each share class at an annual rate of up to 0.25% for Class A Shares, up to 1.00% for Class C Shares, and up to 0.25% for Class S Shares. Under the terms of the Plans, the Trust is authorized to make payments to the Distributor for remittance to retirement plan service providers, broker-dealers, bank trust departments, financial advisors, and other financial intermediaries, as compensation for distribution and/or shareholder services performed by such entities for their customers who are investors in the Fund. These amounts are disclosed as “12b-1 Distribution and shareholder servicing fees” on the Statement of Operations.
Class A Shares include a 5.75% upfront sales charge of the offering price of the Fund. The sales charge is allocated between the Distributor and financial intermediaries. During the period ended March 31, 2023, the Distributor retained upfront sales charges of $43.
A contingent deferred sales charge (“CDSC”) of 1.00% will be deducted with respect to Class A Shares purchased without a sales load and redeemed within 12 months of purchase, unless waived. Any applicable CDSC will be 1.00% of the lesser of the original purchase price or the value of the redemption of the Class A Shares redeemed. There were no CDSCs paid by redeeming shareholders of Class A Shares to the Distributor during the period ended March 31, 2023.
A CDSC of 1.00% will be deducted with respect to Class C Shares redeemed within 12 months of purchase, unless waived. Any applicable CDSC will be 1.00% of the lesser of the original purchase price or the value of the redemption of the Class C Shares redeemed. There were no CDSCs paid by redeeming shareholders of Class C Shares during the period ended March 31, 2023.
The Board of Trustees has adopted a deferred compensation plan (the “Deferred Plan”) for independent Trustees to elect to defer receipt of all or a portion of the annual compensation they are entitled to receive from the Fund. All deferred fees are credited to an account established in the name of the Trustees. The amounts credited to the account then increase or decrease, as the case may be, in accordance with the performance of one or more of the Janus Henderson funds that are selected by the Trustees. The account balance continues to fluctuate in accordance with the performance of the selected fund or funds until final payment of all amounts are credited to the account. The fluctuation of the account balance is recorded by the Fund as unrealized appreciation/(depreciation) and is included as of March 31, 2023 on the Statement of Assets and Liabilities in the asset, “Trustees’ deferred compensation,” and liability, “Trustees’ deferred compensation fees.” Additionally, the recorded unrealized appreciation/(depreciation) is included in “Total distributable earnings (loss)” on the Statement of Assets and Liabilities. Deferred compensation expenses for the period ended March 31, 2023 are included in “Trustees’ fees and expenses” on the Statement of Operations. Trustees are allowed to change their designation of mutual funds from time to time. Amounts will be deferred until distributed in accordance with the Deferred Plan. Deferred fees of $205,688 were paid by the Trust to the Trustees under the Deferred Plan during the period ended March 31, 2023.
Pursuant to the provisions of the 1940 Act and related rules, the Fund may participate in an affiliated or non-affiliated cash sweep program. In the cash sweep program, uninvested cash balances of the Fund may be used to purchase shares of affiliated or non-affiliated money market funds or cash management pooled investment vehicles that operate as money market funds. The Fund is eligible to participate in the cash sweep program (the “Investing Funds”). The Adviser has an inherent conflict of interest because of its fiduciary duties to the affiliated money market funds or cash management pooled investment vehicles and the Investing Funds. Janus Henderson Cash Liquidity Fund LLC (the “Sweep Vehicle”) is an affiliated unregistered cash management pooled investment vehicle that invests primarily in highly-rated short-term fixed-income securities. The Sweep Vehicle operates pursuant to the provisions of the 1940 Act that govern the operation of money market funds and prices its shares at NAV reflecting market-based values of its portfolio securities (i.e., a “floating” NAV) rounded to the fourth decimal place (e.g., $1.0000). The Sweep Vehicle is permitted to impose a liquidity fee (of up to 2%) on redemptions from the Sweep Vehicle or a redemption gate that temporarily suspends redemptions from the Sweep Vehicle for up to 10 business days during a 90 day period. There are no restrictions on the Fund's ability to withdraw investments from the Sweep Vehicle at will, and there are no unfunded capital commitments due from the Fund to the Sweep Vehicle. The Sweep Vehicle does not charge any management fee, sales charge or service fee.
Janus Henderson Global Sustainable Equity Fund
Notes to Financial Statements (unaudited)
Any purchases and sales, realized gains/losses and recorded dividends from affiliated investments during the period ended March 31, 2023 can be found in the “Schedules of Affiliated Investments” located in the Schedule of Investments.
As of March 31, 2023, shares of the Fund were owned by affiliates of the Adviser, and/or other funds advised by the Adviser, as indicated in the table below:
| | | | | | | |
Class | % of Class Owned | | % of Fund Owned | | |
Class A Shares | 20 | % | - | *% | |
Class C Shares | 61 | | -* | | |
Class D Shares | -* | | -* | | |
Class I Shares | - | | - | | |
Class N Shares | 4 | | -* | | |
Class R Shares | 100 | | -* | | |
Class S Shares | 100 | | -* | | |
Class T Shares | 10 | | -* | | |
| | | | | | |
* | Less than 0.50% | | | | | |
4. Federal Income Tax
Income and capital gains distributions are determined in accordance with income tax regulations that may differ from US GAAP. These differences are due to differing treatments for items such as net short-term gains, deferral of wash sale losses, foreign currency transactions, net investment losses, and capital loss carryovers.
The Fund has elected to treat gains and losses on forward foreign currency contracts as capital gains and losses, if applicable. Other foreign currency gains and losses on debt instruments are treated as ordinary income for federal income tax purposes pursuant to Section 988 of the Internal Revenue Code.
The aggregate cost of investments and the composition of unrealized appreciation and depreciation of investment securities for federal income tax purposes as of March 31, 2023 are noted below. The primary difference between book and tax appreciation or depreciation of investments is wash sale loss deferrals.
| | | | |
Federal Tax Cost | Unrealized
Appreciation | Unrealized
(Depreciation) | Net Tax Appreciation/
(Depreciation) |
$ 26,487,849 | $ 4,122,692 | $ (1,766,958) | $ 2,355,734 |
Janus Henderson Global Sustainable Equity Fund
Notes to Financial Statements (unaudited)
5. Capital Share Transactions
| | | | | | | |
| | | | | | |
| | Period ended March 31, 2023 | | Year ended September 30, 2022 |
| | Shares | Amount | | Shares | Amount |
| | | | | | | |
Class A Shares: | | | | | |
Shares sold | 8,538 | $ 100,076 | | 5,969 | $ 85,061 |
Reinvested dividends and distributions | 50 | 572 | | 125 | 1,797 |
Shares repurchased | (683) | (7,117) | | (1,356) | (18,024) |
Net Increase/(Decrease) | 7,905 | $ 93,531 | | 4,738 | $ 68,834 |
Class C Shares: | | | | | |
Shares sold | 2,494 | $ 29,946 | | 744 | $ 10,463 |
Reinvested dividends and distributions | 30 | 336 | | 54 | 778 |
Shares repurchased | - | - | | (371) | (5,526) |
Net Increase/(Decrease) | 2,524 | $ 30,282 | | 427 | $ 5,715 |
Class D Shares: | | | | | |
Shares sold | 140,829 | $ 1,678,043 | | 561,140 | $ 7,587,026 |
Reinvested dividends and distributions | 4,409 | 50,092 | | 18,393 | 265,600 |
Shares repurchased | (244,442) | (2,801,305) | | (276,713) | (3,558,681) |
Net Increase/(Decrease) | (99,204) | $(1,073,170) | | 302,820 | $ 4,293,945 |
Class I Shares: | | | | | |
Shares sold | 63,561 | $ 736,473 | | 212,724 | $ 2,770,878 |
Reinvested dividends and distributions | 1,284 | 14,523 | | 9,099 | 131,214 |
Shares repurchased | (256,198) | (2,843,207) | | (637,758) | (8,170,264) |
Net Increase/(Decrease) | (191,353) | $(2,092,211) | | (415,935) | $(5,268,172) |
Class N Shares: | | | | | |
Shares sold | 9,454 | $ 111,025 | | 27,058 | $ 350,626 |
Reinvested dividends and distributions | 511 | 5,818 | | 1,119 | 16,196 |
Shares repurchased | (7,479) | (88,838) | | (10,132) | (144,491) |
Net Increase/(Decrease) | 2,486 | $ 28,005 | | 18,045 | $ 222,331 |
Class R Shares: | | | | | |
Shares sold | 10 | $ 115 | | - | $ - |
Reinvested dividends and distributions | 23 | 266 | | 35 | 510 |
Shares repurchased | - | - | | - | - |
Net Increase/(Decrease) | 33 | $ 381 | | 35 | $ 510 |
Class S Shares: | | | | | |
Shares sold | - | $ - | | - | $ - |
Reinvested dividends and distributions | 27 | 315 | | 51 | 721 |
Shares repurchased | - | - | | - | - |
Net Increase/(Decrease) | 27 | $ 315 | | 51 | $ 721 |
Class T Shares: | | | | | |
Shares sold | 26,618 | $ 313,701 | | 11,608 | $ 142,737 |
Reinvested dividends and distributions | 62 | 705 | | 473 | 6,829 |
Shares repurchased | (23,835) | (279,375) | | (9,202) | (121,687) |
Net Increase/(Decrease) | 2,845 | $ 35,031 | | 2,879 | $ 27,879 |
Janus Henderson Global Sustainable Equity Fund
Notes to Financial Statements (unaudited)
6. Purchases and Sales of Investment Securities
For the period ended March 31, 2023, the aggregate cost of purchases and proceeds from sales of investment securities (excluding any short-term securities, short-term options contracts, TBAs, and in-kind transactions, as applicable) was as follows:
| | | | |
Purchases of
Securities | Proceeds from Sales
of Securities | Purchases of Long-
Term U.S. Government
Obligations | Proceeds from Sales
of Long-Term U.S.
Government Obligations |
$ 4,008,279 | $ 6,425,712 | $ - | $ - |
7. Subsequent Event
Management has evaluated whether any events or transactions occurred subsequent to March 31, 2023 and through the date of issuance of the Fund’s financial statements and determined that there were no material events or transactions that would require recognition or disclosure in the Fund’s financial statements.
Janus Henderson Global Sustainable Equity Fund
Additional Information (unaudited)
Proxy Voting Policies and Voting Record
A description of the policies and procedures that the Fund uses to determine how to vote proxies relating to its portfolio securities is available without charge: (i) upon request, by calling 1-800-525-1093; (ii) on the Fund’s website at janushenderson.com/proxyvoting; and (iii) on the SEC’s website at http://www.sec.gov. Additionally, information regarding the Fund’s proxy voting record for the most recent twelve-month period ended June 30 is also available, free of charge, through janushenderson.com/proxyvoting and from the SEC’s website at http://www.sec.gov.
Full Holdings
The Fund files its complete portfolio holdings (schedule of investments) with the SEC as an exhibit to Form N-PORT within 60 days of the end of the first and third fiscal quarters, and in the annual report and semiannual report to shareholders. The Fund’s Form N-PORT filings and annual and semiannual reports: (i) are available on the SEC’s website at http://www.sec.gov; and (ii) are available without charge, upon request, by calling a Janus Henderson representative at 1-877-335-2687 (toll free) (or 1-800-525-3713 if you hold Class D Shares). Portfolio holdings consisting of at least the names of the holdings are generally available on a monthly basis with a 30-day lag under Full Holdings for the Fund at janushenderson.com/info (or janushenderson.com/reports if you hold Class D Shares).
APPROVAL OF ADVISORY AGREEMENTS DURING THE PERIOD
The Trustees of Janus Aspen Series, each of whom serves as an “independent” Trustee (the “Trustees”), oversee the management of each portfolio of Janus Aspen Series (each, a “VIT Portfolio,” and collectively, the “VIT Portfolios”), as well as each fund of Janus Investment Fund (each, a “Fund,” and collectively, the “Funds” and together with the VIT Portfolios, the “Janus Henderson Funds,” and each, a “Janus Henderson Fund”). As required by law, the Trustees determine annually whether to continue the investment advisory agreement for each Janus Henderson Fund.
In connection with their most recent consideration of those agreements for each Janus Henderson Fund, the Trustees received and reviewed information provided by Janus Henderson Investors US LLC (the “Adviser”) in response to requests of the Trustees and their independent legal counsel. They also received and reviewed information and analysis provided by, and in response to requests of, their independent fee consultant. Throughout their consideration of the agreements, the Trustees were advised by their independent legal counsel. The Trustees met with management to consider the agreements, and also met separately in executive session with their independent legal counsel and their independent fee consultant.
At meetings held on November 9-10, 2022 and December 13-14, 2022, the Trustees evaluated the information provided by the Adviser and the independent fee consultant, as well as other information provided by the Adviser and the independent fee consultant during the year. Following such evaluation, the Trustees determined that the overall arrangements between each Janus Henderson Fund and the Adviser were fair and reasonable in light of the nature, extent, and quality of the services provided by the Adviser and its affiliates, the fees charged for those services, and other matters that the Trustees considered relevant in the exercise of their business judgment, and unanimously approved the continuation of the investment advisory agreement for each Janus Henderson Fund for the period from February 1, 2023 through February 1, 2024, subject to earlier termination as provided for in each agreement.
In considering the continuation of those agreements, the Trustees reviewed and analyzed various factors that they determined were relevant, including the factors described below, none of which by itself was considered dispositive. However, the material factors and conclusions that formed the basis for the Trustees’ determination to approve the continuation of the agreements are discussed separately below. Also included is a summary of the independent fee consultant’s conclusions and opinions that arose during, and were included as part of, the Trustees’ consideration of the agreements. “Management fees,” as used herein, reflect actual annual advisory fees and, for the purpose of peer comparisons any administration fees (excluding out of pocket costs), net of any waivers, paid by a fund as a percentage of average net assets.
Nature, Extent and Quality of Services
The Trustees reviewed the nature, extent, and quality of the services provided by the Adviser to the Janus Henderson Funds, taking into account the investment objective, strategies, and policies of each Janus Henderson Fund, and the knowledge the Trustees gained from their regular meetings with management on at least a quarterly basis and their ongoing review of information related to the Janus Henderson Funds. In addition, the Trustees reviewed the resources and key personnel of the Adviser, particularly noting those employees who provide investment and risk management services to the Janus Henderson Funds. The Trustees also considered other services provided to the Janus Henderson
Janus Henderson Global Sustainable Equity Fund
Additional Information (unaudited)
Funds by the Adviser, such as managing the execution of portfolio transactions and the selection of broker-dealers for those transactions. The Trustees considered the Adviser’s role as administrator to the Janus Henderson Funds, noting that the Adviser generally does not receive a fee for its services as administrator, but is reimbursed for its out-of-pocket costs. The Trustees considered the role of the Adviser in monitoring adherence to the Janus Henderson Funds’ investment restrictions, providing support services for the Trustees and Trustee committees, and overseeing communications with Janus Henderson Fund shareholders and the activities of other service providers, including monitoring compliance with various policies and procedures of the Janus Henderson Funds and with applicable securities laws and regulations.
In this regard, the independent fee consultant noted that the Adviser provides a number of different services for the Janus Henderson Funds and their shareholders, ranging from investment management services to various other servicing functions, and that, in its view, the Adviser is a capable provider of those services. The independent fee consultant also provided its belief that the Adviser has developed a number of institutional competitive advantages that should enable it to provide superior investment and service performance over the long term.
The Trustees concluded that the nature, extent, and quality of the services provided by the Adviser to each Janus Henderson Fund were appropriate and consistent with the terms of the respective advisory agreements, and that, taking into account steps taken to address those Janus Henderson Funds whose performance lagged that of their peers for certain periods, the Janus Henderson Funds were likely to benefit from the continued provision of those services. They also concluded that the Adviser had sufficient personnel, with the appropriate education and experience, to serve the Janus Henderson Funds effectively and had demonstrated its ability to attract well-qualified personnel.
Performance of the Funds
The Trustees considered the performance results of each Janus Henderson Fund over various time periods. They noted that they considered Janus Henderson Fund performance data throughout the year, including periodic meetings with each Janus Henderson Fund’s portfolio manager(s), and also reviewed information comparing each Janus Henderson Fund’s performance with the performance of comparable fund peer groups identified by Broadridge Financial Solutions, Inc. (“Broadridge”), an independent data provider, and with the Janus Henderson Fund’s benchmark index. In this regard, the independent fee consultant found that the overall Janus Henderson Funds’ performance has been reasonable, noting that: (i) for the 36 months ended May 31, 2022, approximately 38% of the Janus Henderson Funds were in the top two quartiles of their Broadridge peer groups; (ii) for the 36 months ended September 30, 2022, approximately 45% of the Janus Henderson Funds were in the top two quartiles of performance as reported by Morningstar, and (iii) for the 12 months ended September 30, 2022, approximately 55% of the Janus Henderson Funds were in the top two quartiles of performance as reported by Morningstar.
The Trustees considered the performance of each Janus Henderson Fund, noting that performance may vary by share class, and noted the following with respect to the Funds:
Asset Allocation Funds
· For Janus Henderson Global Allocation Fund – Conservative, the Trustees noted that the Fund’s performance was in the third Broadridge quartile for the 36 months ended May 31, 2022 and the bottom Broadridge quartile for the 12 months ended May 31, 2022. The Trustees noted the reasons for the Fund’s underperformance and the steps the Adviser had taken or was taking to improve performance.
· For Janus Henderson Global Allocation Fund – Growth, the Trustees noted that the Fund’s performance was in the bottom Broadridge quartile for the 36 months ended May 31, 2022 and the bottom Broadridge quartile for the 12 months ended May 31, 2022. The Trustees noted the reasons for the Fund’s underperformance and the steps the Adviser had taken or was taking to improve performance.
· For Janus Henderson Global Allocation Fund – Moderate, the Trustees noted that the Fund’s performance was in the bottom Broadridge quartile for the 36 months ended May 31, 2022 and the bottom Broadridge quartile for the 12 months ended May 31, 2022. The Trustees noted the reasons for the Fund’s underperformance and the steps the Adviser had taken or was taking to improve performance.
Fixed-Income Funds
· For Janus Henderson Absolute Return Income Opportunities Fund, the Trustees noted that the Fund’s performance was in the third Broadridge quartile for the 36 months ended May 31, 2022 and the first Broadridge quartile for the 12 months ended May 31, 2022. The Trustees noted the reasons for the Fund’s underperformance,
Janus Henderson Global Sustainable Equity Fund
Additional Information (unaudited)
the steps the Adviser had taken or was taking to improve performance, and that the performance trend was improving.
· For Janus Developed World Bond Fund, the Trustees noted that the Fund’s performance was in the bottom Broadridge quartile for the 36 months ended May 31, 2022 and the bottom Broadridge quartile for the 12 months ended May 31, 2022. The Trustees noted the reasons for the Fund’s underperformance and the steps the Adviser had taken or was taking to improve performance.
· For Janus Henderson Flexible Bond Fund, the Trustees noted that the Fund’s performance was in the first Broadridge quartile for the 36 months ended May 31, 2022 and the second Broadridge quartile for the 12 months ended May 31, 2022.
· For Janus Henderson Global Bond Fund, the Trustees noted that the Fund’s performance was in the third Broadridge quartile for the 36 months ended May 31, 2022 and the bottom Broadridge quartile for the 12 months ended May 31, 2022. The Trustees noted the reasons for the Fund’s underperformance and the steps the Adviser had taken or was taking to improve performance.
· For Janus Henderson High-Yield Fund, the Trustees noted that the Fund’s performance was in the third Broadridge quartile for the 36 months ended May 31, 2022 and the bottom Broadridge quartile for the 12 months ended May 31, 2022. The Trustees noted the reasons for the Fund’s underperformance and the steps the Adviser had taken or was taking to improve performance.
· For Janus Henderson Multi-Sector Income Fund, the Trustees noted that the Fund’s performance was in the second Broadridge quartile for the 36 months ended May 31, 2022 and the third Broadridge quartile for the 12 months ended May 31, 2022.
· For Janus Henderson Short Duration Flexible Bond Fund, the Trustees noted that the Fund’s performance was in the third Broadridge quartile for the 36 months ended May 31, 2022 and the bottom Broadridge quartile for the 12 months ended May 31, 2022. The Trustees noted the reasons for the Fund’s underperformance and the steps the Adviser had taken or was taking to improve performance.
Global and International Equity Funds
· For Janus Henderson Asia Equity Fund, the Trustees noted that the Fund’s performance was in the third Broadridge quartile for the 36 months ended May 31, 2022 and the third Broadridge quartile for the 12 months ended May 31, 2022. The Trustees noted the reasons for the Fund’s underperformance, while also noting that the Fund has a performance fee structure that results in lower management fees during periods of underperformance, and the steps the Adviser had taken or was taking to improve performance.
· For Janus Henderson Emerging Markets Fund, the Trustees noted that the Fund��s performance was in the third Broadridge quartile for the 36 months ended May 31, 2022 and the third Broadridge quartile for the 12 months ended May 31, 2022. The Trustees noted the reasons for the Fund’s underperformance and the steps the Adviser had taken or was taking to improve performance.
· For Janus Henderson European Focus Fund, the Trustees noted that the Fund’s performance was in the first Broadridge quartile for the 36 months ended May 31, 2022 and the second Broadridge quartile for the 12 months ended May 31, 2022.
· For Janus Henderson Global Equity Income Fund, the Trustees noted that the Fund’s performance was in the third Broadridge quartile for the 36 months ended May 31, 2022 and the first Broadridge quartile for the 12 months ended May 31, 2022. The Trustees noted the reasons for the Fund’s underperformance, the steps the Adviser had taken or was taking to improve performance, and that the performance trend was improving.
· For Janus Henderson Global Life Sciences Fund, the Trustees noted that the Fund’s performance was in the third Broadridge quartile for the 36 months ended May 31, 2022 and the second Broadridge quartile for the 12 months ended May 31, 2022. The Trustees noted the reasons for the Fund’s underperformance, the steps the Adviser had taken or was taking to improve performance, and that the performance trend was improving.
· For Janus Henderson Global Sustainable Equity Fund, the Trustees noted that the Fund’s performance was in the second Broadridge quartile for the 12 months ended May 31, 2022. The Trustees noted that 36 month-end performance was not yet available.
Janus Henderson Global Sustainable Equity Fund
Additional Information (unaudited)
· For Janus Henderson Global Real Estate Fund, the Trustees noted that the Fund’s performance was in the second Broadridge quartile for the 36 months ended May 31, 2022 and the bottom Broadridge quartile for the 12 months ended May 31, 2022.
· For Janus Henderson Global Research Fund, the Trustees noted that the Fund’s performance was in the second Broadridge quartile for the 36 months ended May 31, 2022 and the first Broadridge quartile for the 12 months ended May 31, 2022.
· For Janus Henderson Global Select Fund, the Trustees noted that the Fund’s performance was in the first Broadridge quartile for the 36 months ended May 31, 2022 and the first Broadridge quartile for the 12 months ended May 31, 2022.
· For Janus Henderson Global Technology and Innovation Fund, the Trustees noted that the Fund’s performance was in the second Broadridge quartile for the 36 months ended May 31, 2022 and the second Broadridge quartile for the 12 months ended May 31, 2022.
· For Janus Henderson International Opportunities Fund, the Trustees noted that the Fund’s performance was in the bottom Broadridge quartile for the 36 months ended May 31, 2022 and the third Broadridge quartile for the 12 months ended May 31, 2022. The Trustees noted the reasons for the Fund’s underperformance and the steps the Adviser had taken or was taking to improve performance.
· For Janus Henderson Overseas Fund, the Trustees noted that the Fund’s performance was in the first Broadridge quartile for the 36 months ended May 31, 2022 and the first Broadridge quartile for the 12 months ended May 31, 2022.
· For Janus Henderson Responsible International Dividend Fund (formerly the Janus Henderson Dividend & Income Builder Fund), the Trustees noted that the Fund’s performance was in the bottom Broadridge quartile for the 36 months ended May 31, 2022 and the bottom Broadridge quartile for the 12 months ended May 31, 2022. The Trustees noted the reasons for the Fund’s underperformance and the steps the Adviser had taken or was taking to improve performance.
Money Market Funds
· For Janus Henderson Government Money Market Fund, the Trustees noted that the Fund’s performance was in the third Broadridge quartile for the 36 months ended May 31, 2022 and the bottom Broadridge quartile for the 12 months ended May 31, 2022. The Trustees noted the reasons for the Fund’s underperformance and the steps the Adviser had taken or was taking to improve performance.
· For Janus Henderson Money Market Fund, the Trustees noted that the Fund’s performance was in the third Broadridge quartile for the 36 months ended May 31, 2022 and the bottom Broadridge quartile for the 12 months ended May 31, 2022. The Trustees noted the reasons for the Fund’s underperformance and the steps the Adviser had taken or was taking to improve performance.
Multi-Asset Funds
· For Janus Henderson Adaptive Global Allocation Fund, the Trustees noted that the Fund’s performance was in bottom Broadridge quartile for the 36 months ended May 31, 2022 and the second Broadridge quartile for the 12 months ended May 31, 2022. The Trustees noted the reasons for the Fund’s underperformance, the steps the Adviser had taken or was taking to improve performance, and that the performance trend was improving.
· For Janus Henderson Balanced Fund, the Trustees noted that the Fund’s performance was in the first Broadridge quartile for the 36 months ended May 31, 2022 and the first Broadridge quartile for the 12 months ended May 31, 2022.
U.S. Equity Funds
· For Janus Henderson Adaptive Risk Managed U.S. Equity Fund, the Trustees noted that the Fund’s performance was in the bottom Broadridge quartile for the 36 months ended May 31, 2022 and the second Broadridge quartile for the 12 months ended May 31, 2022. The Trustees noted the reasons for the Fund’s underperformance, the steps the Adviser had taken or were taking to improve performance, and that the performance trend was improving.
Janus Henderson Global Sustainable Equity Fund
Additional Information (unaudited)
· For Janus Henderson Contrarian Fund, the Trustees noted that the Fund’s performance was in the first Broadridge quartile for the 36 months ended May 31, 2022 and the bottom Broadridge quartile for the 12 months ended May 31, 2022.
· For Janus Henderson Enterprise Fund, the Trustees noted that the Fund’s performance was in the second Broadridge quartile for the 36 months ended May 31, 2022 and the first Broadridge quartile for the 12 months ended May 31, 2022.
· For Janus Henderson Forty Fund, the Trustees noted that the Fund’s performance was in the third Broadridge quartile for the 36 months ended May 31, 2022 and the bottom Broadridge quartile for the 12 months ended May 31, 2022. The Trustees noted the reasons for the Fund’s underperformance and the steps the Adviser had taken or was taking to improve performance.
· For Janus Henderson Growth and Income Fund, the Trustees noted that the Fund’s performance was in the bottom Broadridge quartile for the 36 months ended May 31, 2022 and the first Broadridge quartile for the 12 months ended May 31, 2022. The Trustees noted the reasons for the Fund’s underperformance, the steps the Adviser had taken or was taking to improve performance, and that the performance trend was improving.
· For Janus Henderson Mid Cap Value Fund, the Trustees noted that the Fund’s performance was in the bottom Broadridge quartile for the 36 months ended May 31, 2022 and the second Broadridge quartile for the 12 months ended May 31, 2022. The Trustees noted the reasons for the Fund’s underperformance, while also noting that the Fund has a performance fee structure that results in lower management fees during periods of underperformance, the steps the Adviser had taken or was taking to improve performance, and that the performance trend was improving.
· For Janus Henderson Research Fund, the Trustees noted that the Fund’s performance was in the third Broadridge quartile for the 36 months ended May 31, 2022 and the third Broadridge quartile for the 12 months ended May 31, 2022. The Trustees noted the reasons for the Fund’s underperformance, while also noting that the Fund has a performance fee structure that results in lower management fees during periods of underperformance and the steps the Adviser had taken or was taking to improve performance.
· For Janus Henderson Small Cap Value Fund, the Trustees noted that the Fund’s performance was in the bottom Broadridge quartile for the 36 months ended May 31, 2022 and the second Broadridge quartile for the 12 months ended May 31, 2022. The Trustees noted the reasons for the Fund’s underperformance, while also noting that the Fund has a performance fee structure that results in lower management fees during periods of underperformance, the steps the Adviser had taken or was taking to improve performance, and that the performance trend was improving.
· For Janus Henderson Small-Mid Cap Value Fund, the Trustees noted that the Fund’s performance was in the bottom Broadridge quartile for the 36 months ended May 31, 2022 and the second Broadridge quartile for the 12 months ended May 31, 2022. The Trustees noted the reasons for the Fund’s underperformance, while also noting that the Fund has a performance fee structure that results in lower management fees during periods of underperformance, the steps the Adviser had taken or was taking to improve performance, and that the performance trend is improving.
· For Janus Henderson Triton Fund, the Trustees noted that the Fund’s performance was in the bottom Broadridge quartile for the 36 months ended May 31, 2022 and the second Broadridge quartile for the 12 months ended May 31, 2022. The Trustees noted the reasons for the Fund’s underperformance, the steps the Adviser had taken or was taking to improve performance, and that the performance trend was improving.
· For Janus Henderson Venture Fund, the Trustees noted that the Fund’s performance was in the bottom Broadridge quartile for the 36 months ended May 31, 2022 and the second Broadridge quartile for the 12 months ended May 31, 2022. The Trustees noted the reasons for the Fund’s underperformance, the steps the Adviser had taken or was taking to improve performance, and that the performance trend was improving.
In consideration of each Janus Henderson Fund’s performance, the Trustees concluded that, taking into account the factors relevant to performance, as well as other considerations, including steps taken to improve performance, as applicable, the Janus Henderson Fund’s performance warranted continuation of such Janus Henderson Fund’s investment advisory agreement.
Janus Henderson Global Sustainable Equity Fund
Additional Information (unaudited)
Costs of Services Provided
The Trustees examined information regarding the fees and expenses of each Janus Henderson Fund in comparison to similar information for other comparable funds as provided by Broadridge, an independent data provider. They also reviewed an analysis of that information provided by their independent fee consultant. The independent fee consultant provided its belief that the management fees charged by the Adviser to each of the Janus Henderson Funds under the current investment advisory and administration agreements are reasonable in relation to the services provided by the Adviser. The independent fee consultant found: (1) the total expenses and management fees of the Janus Henderson Funds to be reasonable relative to other comparable mutual funds; (2) the total expenses, on average, were 6% under the average total expenses of the respective Broadridge peer group; and (3) the management fees for the Janus Henderson Funds, on average, were 5% under the average management fees for the respective Broadridge peer group. The Trustees also considered the total expenses for each share class of each Janus Henderson Fund compared to the average total expenses for its Broadridge Expense Group and to average total expenses for its Broadridge Expense Universe.
For Janus Henderson Funds with three or more years of performance history, the independent fee consultant also performed a systematic “focus list” analysis of expenses which assessed fund fees in the context of fund performance being delivered. Based on this analysis, the independent fee consultant found that the combination of service quality/performance and expenses on these individual Janus Henderson Funds was reasonable in light of performance trends, performance histories, changes in portfolio management, relative average net asset levels, and the existence of performance fees, breakpoints, and/or expense waivers on such Janus Henderson Funds.
The Trustees considered the methodology used by the Adviser in determining compensation payable to portfolio managers, the competitive environment for investment management talent, and the competitive market for mutual funds in different distribution channels.
The Trustees also reviewed management fees charged by the Adviser to comparable separate account clients and to comparable non-affiliated funds subadvised by the Adviser (for which the Adviser provides only or primarily portfolio management services). Although in most instances subadvisory and separate account fee rates for various investment strategies were lower than management fee rates for Janus Henderson Funds having a similar strategy, the Trustees considered that the Adviser noted that, under the terms of the management agreements with the Janus Henderson Funds, the Adviser performs significant additional services for the Janus Henderson Funds that it does not provide to those other clients, including administration services, oversight of the Janus Henderson Funds’ other service providers, Trustee support, regulatory compliance and numerous other services, and that, in serving the Janus Henderson Funds, the Adviser assumes many legal risks and other costs that it does not assume in servicing its other clients. Moreover, the Trustees noted that the independent fee consultant found that: (1) the management fees the Adviser charges to the Janus Henderson Funds are reasonable in relation to the management fees the Adviser charges to funds subadvised by the Adviser and to the fees the Adviser charges to its institutional separate account clients; (2) these subadvised and institutional separate accounts have different service and infrastructure needs and operate in markets very different from the retail fund market; (3) Janus Henderson mutual fund investors enjoy reasonable fees relative to the fees charged in these other markets; and (4) as part of its 2022 review, 9 of 11 Janus Henderson Funds have lower management fees than similar funds subadvised by the Adviser. The Trustees noted that for the two Janus Henderson Funds that did not, management fees for each were under the average of its 15(c) peer group.
The Trustees considered the fees for each Janus Henderson Fund for its fiscal year ended in 2021 and noted the following with regard to each Janus Henderson Fund’s total expenses, net of applicable fee waivers (the Fund’s “total expenses”) as reflected in the comparative information provided by Broadridge:
Asset Allocation Funds
· For Janus Henderson Global Allocation Fund – Conservative, the Trustees noted that, although the Fund’s total expenses exceeded the peer group average for certain share classes, overall the Fund’s total expenses were reasonable. The Trustees also noted that the Adviser has contractually agreed to limit the Fund’s expenses.
· For Janus Henderson Global Allocation Fund – Growth, the Trustees noted that, although the Fund’s total expenses exceeded the peer group average for certain share classes, overall the Fund’s total expenses were reasonable. The Trustees also noted that the Adviser has contractually agreed to limit the Fund’s expenses, although this limit did not apply because the Fund’s total expenses as shown were below the applicable fee limit.
Janus Henderson Global Sustainable Equity Fund
Additional Information (unaudited)
· For Janus Henderson Global Allocation Fund – Moderate, the Trustees noted that, although the Fund’s total expenses exceeded the peer group average for one share class, overall the Fund’s total expenses were reasonable. The Trustees also noted that the Adviser has contractually agreed to limit the Fund’s expenses.
Fixed-Income Funds
· For Janus Henderson Absolute Return Income Opportunities Fund, the Trustees noted that, although the Fund’s total expenses exceeded the peer group average for certain share classes, overall the Fund’s total expenses were reasonable. The Trustees also noted that the Adviser has contractually agreed to limit the Fund’s expenses.
· For Janus Henderson Developed World Bond Fund, the Trustees noted that, although the Fund’s total expenses exceeded the peer group average for one share class, overall the Fund’s total expenses were reasonable. The Trustees also noted that the Adviser has contractually agreed to limit the Fund’s expenses.
· For Janus Henderson Flexible Bond Fund, the Trustees noted that, although the Fund’s total expenses exceeded the peer group average for certain share classes, overall the Fund’s total expenses were reasonable. The Trustees also noted that the Adviser has contractually agreed to limit the Fund’s expenses, although this limit did not apply because the Fund’s total expenses as shown were below the applicable fee limit.
· For Janus Henderson Global Bond Fund, the Trustees noted that, although the Fund’s total expenses exceeded the peer group average for certain share classes, overall the Fund’s total expenses were reasonable. The Trustees also noted that the Adviser has contractually agreed to limit the Fund’s expenses.
· For Janus Henderson High-Yield Fund, the Trustees noted that, although the Fund’s total expenses exceeded the peer group average for certain share classes, overall the Fund’s total expenses were reasonable. The Trustees also noted that the Adviser has contractually agreed to limit the Fund’s expenses.
· For Janus Henderson Multi-Sector Income Fund, the Trustees noted that, although the Fund’s total expenses exceeded the peer group average for certain share classes, overall the Fund’s total expenses were reasonable. The Trustees also noted that the Adviser has contractually agreed to limit the Fund’s expenses.
· For Janus Henderson Short Duration Flexible Bond Fund, the Trustees noted that, although the Fund’s total expenses exceeded the peer group average for certain share classes, overall the Fund’s total expenses were reasonable. The Trustees also noted that the Adviser has contractually agreed to limit the Fund’s expenses.
Global and International Equity Funds
· For Janus Henderson Asia Equity Fund, the Trustees noted that, although the Fund’s total expenses exceeded the peer group average for certain share classes, overall the Fund’s total expenses were reasonable. The Trustees also noted that the Adviser has contractually agreed to limit the Fund’s expenses.
· For Janus Henderson Emerging Markets Fund, the Trustees noted that, although the Fund’s total expenses exceeded the peer group average for certain share classes, overall the Fund’s total expenses were reasonable. The Trustees also noted that the Adviser has contractually agreed to limit the Fund’s expenses.
· For Janus Henderson European Focus Fund, the Trustees noted that, although the Fund’s total expenses exceeded the peer group average for one share class, overall the Fund’s expenses were reasonable. The Trustees also noted that the Adviser has contractually agreed to limit the Fund’s expenses.
· For Janus Henderson Global Equity Income Fund, the Trustees noted that, although the Fund’s total expenses exceeded the peer group average for one share class, overall the Fund’s total expenses were reasonable. The Trustees also noted that the Adviser has contractually agreed to limit the Fund’s expenses, although this limit did not apply because the Fund’s total expenses as shown were below the applicable fee limit.
· For Janus Henderson Global Life Sciences Fund, the Trustees noted that the Fund’s total expenses were below the peer group average for all share classes.
· For Janus Henderson Global Real Estate Fund, the Trustees noted that, although the Fund’s total expenses exceeded the peer group average for certain share classes, overall the Fund’s total expenses were reasonable. The Trustees also noted that the Adviser has contractually agreed to limit the Fund’s expenses, although this limit did not apply because the Fund’s total expenses as shown were below the applicable fee limit.
Janus Henderson Global Sustainable Equity Fund
Additional Information (unaudited)
· For Janus Henderson Global Research Fund, the Trustees noted that, although the Fund’s total expenses exceeded the peer group average for one share class, overall the Fund’s total expenses were reasonable. The Trustees also noted that the Adviser has contractually agreed to limit the Fund’s expenses, although this limit did not apply because the Fund’s total expenses as shown were below the applicable fee limit.
· For Janus Henderson Global Select Fund, the Trustees noted that, although the Fund’s total expenses exceeded the peer group average for certain share classes, overall the Fund’s total expenses were reasonable. The Trustees also noted that the Adviser has contractually agreed to limit the Fund’s expenses.
· For Janus Henderson Global Sustainable Equity Fund, the Trustees noted that, although the Fund’s total expenses exceeded the peer group average for certain share classes, overall the Fund’s expenses were reasonable. The Trustees also noted that the Adviser has contractually agreed to limit the Fund’s expenses.
· For Janus Henderson Global Technology and Innovation Fund, the Trustees noted that the Fund’s total expenses were below the peer group average for all share classes.
· For Janus Henderson International Opportunities Fund, the Trustees noted that, although the Fund’s total expenses exceeded the peer group average for certain share classes, overall the Fund’s expenses were reasonable. The Trustees also noted that the Adviser has contractually agreed to limit the Fund’s expenses.
· For Janus Henderson Overseas Fund, the Trustees noted that although the Fund’s total expenses exceeded the peer group average for certain share classes, overall the Fund’s total expenses were reasonable. The Trustees also noted that the Adviser has contractually agreed to limit the Fund’s expenses, although this limit did not apply because the Fund’s total expenses as shown were below the applicable fee limit.
· For Janus Henderson Responsible International Dividend Fund (formerly the Janus Henderson Dividend & Income Builder Fund), the Trustees noted that, although the Fund’s total expenses exceeded the peer group for one share class, overall the Fund’s total expenses were reasonable. The Trustees also noted that the Adviser has contractually agreed to limit the Fund’s expenses.
Money Market Funds
· For Janus Henderson Government Money Market Fund, the Trustees noted that the Fund’s total expenses were below the peer group average for all share classes.
· For Janus Henderson Money Market Fund, the Trustees noted that the Fund’s total expenses were below the peer group average for all share classes.
Multi-Asset Funds
· For Janus Henderson Adaptive Global Allocation Fund, the Trustees noted that, that the Fund’s total expenses were below the peer group average for all share classes.
· For Janus Henderson Balanced Fund, the Trustees noted that, although the Fund’s total expenses exceeded the peer group average for certain share classes, overall the Fund’s total expenses were reasonable. The Trustees also noted that the Adviser has contractually agreed to limit the Fund’s expenses, although this limit did not apply because the Fund’s total expenses as shown were below the applicable fee limit.
U.S. Equity Funds
· For Janus Henderson Adaptive Risk Managed U.S. Equity Fund, the Trustees noted that, although the Fund’s total expenses exceeded the peer group average for certain share classes, overall the Fund’s total expenses were reasonable. The Trustees also noted that the Adviser has contractually agreed to limit the Fund’s expenses, although this limit did not apply because the Fund’s total expenses as shown were below the applicable fee limit.
· For Janus Henderson Contrarian Fund, the Trustees noted that, although the Fund’s total expenses exceeded the peer group average for all share classes, overall the Fund’s total expenses were reasonable. The Trustees also noted that the Adviser had contractually agreed to limit the Fund’s expenses.
· For Janus Henderson Enterprise Fund, the Trustees noted that, although the Fund’s total expenses exceeded the peer group average for certain share classes, overall the Fund’s total expenses were reasonable. The Trustees also noted that the Adviser has contractually agreed to limit the Fund’s expenses, although this limit did not apply because the Fund’s total expenses as shown were below the applicable fee limit.
Janus Henderson Global Sustainable Equity Fund
Additional Information (unaudited)
· For Janus Henderson Forty Fund, the Trustees noted that, although the Fund’s total expenses exceeded the peer group average for certain share classes, overall the Fund’s total expenses were reasonable. The Trustees also noted that the Adviser has contractually agreed to limit the Fund’s expenses, although this limit did not apply because the Fund’s total expenses as shown were below the applicable fee limit.
· For Janus Henderson Growth and Income Fund, the Trustees noted that, although the Fund’s total expenses exceeded the peer group average for certain share classes, overall the Fund’s total expenses were reasonable. The Trustees also noted that the Adviser has contractually agreed to limit the Fund’s expenses, although this limit did not apply because the Fund’s total expenses as shown were below the applicable fee limit.
· For Janus Henderson Mid Cap Value Fund, the Trustees noted that the Fund’s total expenses were below the peer group average for all share classes.
· For Janus Henderson Research Fund, the Trustees noted that, although the Fund’s total expenses exceeded the peer group average for certain share classes, overall the Fund’s total expenses were reasonable. The Trustees also noted that the Adviser has contractually agreed to limit the Fund’s expenses.
· For Janus Henderson Small Cap Value Fund, the Trustees noted that, although the Fund’s total expenses exceeded the peer group average for one share class, overall the Fund’s total expenses were reasonable. The Trustees also noted that the Adviser has contractually agreed to limit the Fund’s expenses, although this limit did not apply because the Fund’s total expenses as shown were below the applicable fee limit.
· For Janus Henderson Small-Mid Cap Value Fund, the Trustees noted that the Fund’s total expenses were below the peer group average for all share classes.
· For Janus Henderson Triton Fund, the Trustees noted that, although the Fund’s total expenses exceeded the peer group average for one share class, overall the Fund’s total expenses were reasonable. The Trustees also noted that the Adviser has contractually agreed to limit the Fund’s expenses, although this limit did not apply because the Fund’s total expenses as shown were below the applicable fee limit.
· For Janus Henderson Venture Fund, the Trustees noted that although the Fund’s total expenses exceeded the peer group average for one share class, overall the Fund’s total expenses were reasonable. The Trustees also noted that the Adviser has contractually agreed to limit the Fund’s expenses, although this limit did not apply because the Fund’s total expenses as shown were below the applicable fee limit.
The Trustees reviewed information on the overall profitability to the Adviser and its affiliates from their relationships with the Janus Henderson Funds, and considered profitability data of other publicly traded mutual fund advisers. The Trustees recognized that profitability comparisons among fund managers are difficult because of the variation in the type of comparative information that is publicly available, and the profitability of any fund manager is affected by numerous factors, including the organizational structure of the particular fund manager, differences in complex size, difference in product mix, difference in types of business (mutual fund, institutional and other), differences in the types of funds and other accounts it manages, possible other lines of business, the methodology for allocating expenses and the fund manager’s capital structure and cost of capital.
Additionally, the Trustees considered the estimated profitability to the Adviser from the investment management services it provided to each Janus Henderson Fund. In their review, the Trustees considered whether the Adviser receive adequate incentives and resources to manage the Janus Henderson Funds effectively. In reviewing profitability, the Trustees noted that the estimated profitability for an individual Janus Henderson Fund is necessarily a product of the allocation methodology utilized by the Adviser to allocate its expenses as part of the estimated profitability calculation. In this regard, the Trustees noted that the independent fee consultant found as part of its 2022 review that (1) the expense allocation methodology and rationales utilized by the Adviser were reasonable and (2) no clear correlation exists between expense allocations and operating margins. The Trustees also considered that the estimated profitability for an individual Janus Henderson Fund was influenced by a number of factors, including not only the allocation methodology selected, but also the presence of fee waivers and expense caps, and whether the Janus Henderson Fund’s investment management agreement contained breakpoints or a performance fee component. The Trustees determined, after taking into account these factors, among others, that the Adviser’s estimated profitability with respect to each Janus Henderson Fund was not unreasonable in relation to the services provided, and that the variation in the range of such estimated profitability among the Janus Henderson Funds was not a material factor in the Board’s approval of the reasonableness of any Janus Henderson Fund’s investment management fees.
Janus Henderson Global Sustainable Equity Fund
Additional Information (unaudited)
The Trustees concluded that the management fees payable by each Janus Henderson Fund to the Adviser were reasonable in relation to the nature, extent, and quality of the services provided, taking into account the fees charged by other advisers for managing comparable mutual funds with similar strategies, the fees the Adviser charges to other clients, and, as applicable, the impact of fund performance on management fees payable by the Janus Henderson Funds. The Trustees also concluded that each Janus Henderson Fund’s total expenses were reasonable, taking into account the size of the Janus Henderson Fund, the quality of services provided by the Adviser, the investment performance of the Janus Henderson Fund, and any expense limitations agreed to or provided by the Adviser.
Economies of Scale
The Trustees considered information about the potential for the Adviser to realize economies of scale as the assets of the Janus Henderson Funds increase. They noted that their independent fee consultant published a report to the Trustees in June 2022 which provided its research and analysis into economies of scale. They also noted that, although many Janus Henderson Funds pay advisory fees at a fixed base rate as a percentage of net assets, without any breakpoints or performance fees, their independent fee consultant concluded that 75% of these Janus Henderson Funds’ have contractual management fees (gross of waivers) below their Broadridge Expense Group averages. The Trustees also noted the following from the independent fee consultant’s report: (1) that 31% of Janus Henderson Funds had management fee breakpoints in place whereby investors pay lower management fees as fund AUM increases; (2) that 29% of Janus Henderson Funds have low flat-rate fees and performance fees where the Adviser is incentivized to invest in resources which drive Janus Henderson Fund performance; and (3) that 39% of Janus Henderson Funds have low flat-rate fees versus peers where investors pay low fixed fees when the Janus Henderson Fund is small/midsized and higher fees when the Janus Henderson Fund grows in assets. The Trustees also noted that the Janus Henderson Funds share directly in economies of scale through the significant investments made by the Adviser and its affiliates related to services provided to the Funds and the lower charges of third-party service providers that are based in part on the combined scale of all of the Janus Henderson Funds.
The Trustees also considered the independent fee consultant’s conclusion that, given the limitations of various analytical approaches to economies of scale and their conflicting results, it is difficult to analytically confirm or deny the existence of economies of scale in the Janus Henderson complex. In this regard, the independent consultant concluded that (1) to the extent there were economies of scale at the Adviser, the Adviser’s general strategy of setting fixed management fees below peers appeared to share any such economies with investors even on smaller Janus Henderson Funds which have not yet achieved those economies and (2) by setting lower fixed fees from the start on these Janus Henderson Funds, the Adviser appeared to be investing to increase the likelihood that these Janus Henderson Funds will grow to a level to achieve any economies of scale that may exist. Further, the independent fee consultant provided its belief that Janus Henderson Fund investors are well-served by the fee levels and performance fee structures in place on the Janus Henderson Funds in light of any economies of scale that may be present at the Adviser.
Based on all of the information reviewed, including the recent and past research and analysis conducted by the Trustees’ independent fee consultant, the Trustees concluded that the current fee structure of each Janus Henderson Fund was reasonable and that the current rates of fees do reflect a sharing between the Adviser and the Janus Henderson Fund of any economies of scale that may be present at the current asset level of the Janus Henderson Fund.
Other Benefits to the Adviser
The Trustees also considered benefits that accrue to the Adviser and its affiliates from their relationships with the Janus Henderson Funds. They recognized that two affiliates of the Adviser separately serve the Janus Henderson Funds as transfer agent and distributor, respectively, and the transfer agent receives compensation directly from the non-money market Janus Henderson Funds for services provided, and that such compensation contributes to the overall profitability of the Adviser and its affiliates that results from their relationship with the Janus Henderson Funds. The Trustees also considered the Adviser’s past and proposed use of commissions paid by the Janus Henderson Funds on portfolio brokerage transactions to obtain proprietary and third-party research products and services benefiting the Janus Henderson Fund and/or other clients of the Adviser and/or the Adviser. The Trustees concluded that the Adviser’s use of these types of client commission arrangements to obtain proprietary and third-party research products and services was consistent with regulatory requirements and guidelines and was likely to benefit each Janus Henderson Fund. The Trustees also concluded that, other than the services provided by the Adviser and its affiliates pursuant to the agreements and the fees to be paid by each Janus Henderson Fund therefor, the Janus Henderson
Janus Henderson Global Sustainable Equity Fund
Additional Information (unaudited)
Funds and the Adviser may potentially benefit from their relationship with each other in other ways. They concluded that the Adviser and its affiliates share directly in economies of scale through the lower charges of third-party service providers that are based in part on the combined scale of the Janus Henderson Funds and other clients serviced by the Adviser and its affiliates. They also concluded that the Adviser benefits from the receipt of research products and services acquired through commissions paid on portfolio transactions of the Janus Henderson Funds and that the Janus Henderson Funds benefit from the Adviser’s receipt of those products and services as well as research products and services acquired through commissions paid by other clients of the Adviser. They further concluded that the success of any Janus Henderson Fund could attract other business to the Adviser or other Janus Henderson Funds, and that the success of the Adviser could enhance the Adviser’s ability to serve the Janus Henderson Funds.
Janus Henderson Global Sustainable Equity Fund
Liquidity Risk Management Program (unaudited)
Liquidity Risk Management Program
Rule 22e-4 under the Investment Company Act of 1940, as amended (the “Liquidity Rule”), requires open-end funds (but not money market funds) to adopt and implement a written liquidity risk management program (the “LRMP”) that is reasonably designed to assess and manage liquidity risk, which is the risk that a fund could not meet redemption requests without significant dilution of remaining investors’ interest in the fund. The Fund has implemented a LRMP, which incorporates the following elements: (i) assessment, management, and periodic review of liquidity risk; (ii) classification of portfolio holdings; (iii) the establishment and monitoring of a highly liquid investment minimum, as applicable; (iv) a 15% limitation on a Fund’s illiquid investments; (v) redemptions in-kind; and (vi) board oversight.
The Trustees of the Fund (the “Trustees”) have designated Janus Henderson Investors US LLC, the Fund’s investment adviser (the “Adviser”), as the Program Administrator for the LRMP responsible for administering the LRMP and carrying out the specific responsibilities of the LRMP. A working group comprised of various teams within the Adviser’s business is responsible for administering the LRMP and carrying out the specific responsibilities of different aspects of the LRMP (the “Liquidity Risk Working Group”). In assessing each Fund’s liquidity risk, the Liquidity Risk Working Group periodically considers, as relevant, factors including (i) the liquidity of a Fund’s portfolio investments during normal and reasonably foreseeable stressed conditions; (ii) whether a Fund’s investment strategy is appropriate for an open-end fund; (iii) the extent to which a Fund’s strategy involves a relatively concentrated portfolio or large positions in any issuer; (iv) a Fund’s use of borrowing for investment purposes; and (v) a Fund’s use of derivatives.
The Liquidity Rule requires the Trustees to review at least annually a written report provided by the Program Administrator that addresses the operation of the LRMP and assesses its adequacy and the effectiveness of its implementation, including, if applicable, the operation of the highly liquid investment minimum, and any material changes to the LRMP (the “Program Administrator Report”). At a meeting held on March 15, 2023, the Adviser provided the Program Administrator Report to the Trustees which covered the operation of the LRMP from January 1, 2022 through December 31, 2022 (the “Reporting Period”).
The Program Administrator Report discussed the operation and effectiveness of the LRMP during the Reporting Period. Among other things, the Program Administrator Report indicated that there were no material changes to the LRMP during the Reporting Period, although there were certain methodology adjustments implemented relating to a change in data provider. Additionally, the findings presented in the Program Administrator Report indicated that the LRMP operated adequately during the Reporting Period. These findings included that the Fund was able to meet redemptions during the normal course of business during the Reporting Period. The Program Administrator Report also stated that the Fund did not exceed the 15% limit on illiquid assets during the Reporting Period, that the Fund held primarily highly liquid assets, and was considered to be a primarily highly liquid fund during the Reporting Period. Also included among the Program Administrator Report’s findings was the determination that the Fund’s investment strategy remains appropriate for an open-end fund. In addition, the Adviser expressed its belief in the Program Administrator Report that the LRMP is reasonably designed and adequate to assess and manage the Fund’s liquidity risk, considering the Fund’s particular risks and circumstances, and includes policies and procedures reasonably designed to implement each required component of the Liquidity Rule.
There can be no assurance that the LRMP will achieve its objectives in the future. Please refer to your Fund’s prospectus for more information regarding the risks to which an investment in the Fund may be subject.
Janus Henderson Global Sustainable Equity Fund
Useful Information About Your Fund Report (unaudited)
Performance Overviews
Performance overview graphs compare the performance of a hypothetical $10,000 investment in the Fund with one or more widely used market indices. When comparing the performance of the Fund with an index, keep in mind that market indices are not available for investment and do not reflect deduction of expenses.
Average annual total returns are quoted for a Fund with more than one year of performance history. Average annual total return is calculated by taking the growth or decline in value of an investment over a period of time, including reinvestment of dividends and distributions, then calculating the annual compounded percentage rate that would have produced the same result had the rate of growth been constant throughout the period. Average annual total return does not reflect the deduction of taxes that a shareholder would pay on Fund distributions or redemptions of Fund shares.
Cumulative total returns are quoted for a Fund with less than one year of performance history. Cumulative total return is the growth or decline in value of an investment over time, independent of the period of time involved. Cumulative total return does not reflect the deduction of taxes that a shareholder would pay on Fund distributions or redemptions of Fund shares.
Pursuant to federal securities rules, expense ratios shown in the performance chart reflect subsidized (if applicable) and unsubsidized ratios. The total annual fund operating expenses ratio is gross of any fee waivers, reflecting the Fund’s unsubsidized expense ratio. The net annual fund operating expenses ratio (if applicable) includes contractual waivers of the Adviser and reflects the Fund’s subsidized expense ratio. Ratios may be higher or lower than those shown in the “Financial Highlights” in this report.
Schedule of Investments
Following the performance overview section is the Fund’s Schedule of Investments. This schedule reports the types of securities held in the Fund on the last day of the reporting period. Securities are usually listed by type (common stock, corporate bonds, U.S. Government obligations, etc.) and by industry classification (banking, communications, insurance, etc.). Holdings are subject to change without notice.
The value of each security is quoted as of the last day of the reporting period. The value of securities denominated in foreign currencies is converted into U.S. dollars.
If the Fund invests in foreign securities, it will also provide a summary of investments by country. This summary reports the Fund exposure to different countries by providing the percentage of securities invested in each country. The country of each security represents the country of risk. A company may be allocated to a country based on other factors such as location of the company’s principal office, the location of the principal trading market for the company’s securities, or the country where a majority of the company’s revenues are derived. The Fund’s Schedule of Investments relies upon the industry group and country classifications published by Bloomberg and/or MSCI Inc.
Tables listing details of individual forward currency contracts, futures, written options, swaptions, and swaps follow the Fund’s Schedule of Investments (if applicable).
Statement of Assets and Liabilities
This statement is often referred to as the “balance sheet.” It lists the assets and liabilities of the Fund on the last day of the reporting period.
The Fund’s assets are calculated by adding the value of the securities owned, the receivable for securities sold but not yet settled, the receivable for dividends declared but not yet received on securities owned, and the receivable for Fund shares sold to investors but not yet settled. The Fund’s liabilities include payables for securities purchased but not yet settled, Fund shares redeemed but not yet paid, and expenses owed but not yet paid. Additionally, there may be other assets and liabilities such as unrealized gain or loss on forward currency contracts.
The section entitled “Net Assets Consist of” breaks down the components of the Fund’s net assets. Because the Fund must distribute substantially all earnings, you will notice that a significant portion of net assets is shareholder capital.
The last section of this statement reports the net asset value (“NAV”) per share on the last day of the reporting period. The NAV is calculated by dividing the Fund’s net assets for each share class (assets minus liabilities) by the number of shares outstanding.
Janus Henderson Global Sustainable Equity Fund
Useful Information About Your Fund Report (unaudited)
Statement of Operations
This statement details the Fund’s income, expenses, realized gains and losses on securities and currency transactions, and changes in unrealized appreciation or depreciation of Fund holdings.
The first section in this statement, entitled “Investment Income,” reports the dividends earned from securities and interest earned from interest-bearing securities in the Fund.
The next section reports the expenses incurred by the Fund, including the advisory fee paid to the investment adviser, transfer agent fees and expenses, and printing and postage for mailing statements, financial reports and prospectuses. Expense offsets and expense reimbursements, if any, are also shown.
The last section lists the amounts of realized gains or losses from investment and foreign currency transactions, and changes in unrealized appreciation or depreciation of investments and foreign currency-denominated assets and liabilities. The Fund will realize a gain (or loss) when it sells its position in a particular security. A change in unrealized gain (or loss) refers to the change in net appreciation or depreciation of the Fund during the reporting period. “Net Realized and Unrealized Gain/(Loss) on Investments” is affected both by changes in the market value of Fund holdings and by gains (or losses) realized during the reporting period.
Statements of Changes in Net Assets
These statements report the increase or decrease in the Fund’s net assets during the reporting period. Changes in the Fund’s net assets are attributable to investment operations, dividends and distributions to investors, and capital share transactions. This is important to investors because it shows exactly what caused the Fund’s net asset size to change during the period.
The first section summarizes the information from the Statement of Operations regarding changes in net assets due to the Fund’s investment operations. The Fund’s net assets may also change as a result of dividend and capital gains distributions to investors. If investors receive their dividends and/or distributions in cash, money is taken out of the Fund to pay the dividend and/or distribution. If investors reinvest their dividends and/or distributions, the Fund’s net assets will not be affected.
The reinvestment of dividends and distributions is included under “Capital Share Transactions.” “Capital Shares” refers to the money investors contribute to the Fund through purchases or withdrawals via redemptions. The Fund’s net assets will increase and decrease in value as investors purchase and redeem shares from the Fund.
Financial Highlights
This schedule provides a per-share breakdown of the components that affect the Fund’s NAV for current and past reporting periods as well as total return, asset size, ratios, and portfolio turnover rate.
The first line in the table reflects the NAV per share at the beginning of the reporting period. The next line reports the net investment income/(loss) per share. Following is the per share total of net gains/(losses), realized and unrealized. Per share dividends and distributions to investors are then subtracted to arrive at the NAV per share at the end of the period. The next line reflects the total return for the period. The total return may include adjustments in accordance with generally accepted accounting principles required at the period end for financial reporting purposes. As a result, the total return may differ from the total return reflected for individual shareholder transactions. Also included are ratios of expenses and net investment income to average net assets.
The Fund’s expenses may be reduced through expense offsets and expense reimbursements. The ratios shown reflect expenses before and after any such offsets and reimbursements.
The ratio of net investment income/(loss) summarizes the income earned less expenses, divided by the average net assets of the Fund during the reporting period. Do not confuse this ratio with the Fund’s yield. The net investment income ratio is not a true measure of the Fund’s yield because it does not take into account the dividends distributed to the Fund’s investors.
The next figure is the portfolio turnover rate, which measures the buying and selling activity in the Fund. Portfolio turnover is affected by market conditions, changes in the asset size of the Fund, fluctuating volume of shareholder purchase and redemption orders, the nature of the Fund’s investments, and the investment style and/or outlook of the portfolio manager(s) and/or investment personnel. A 100% rate implies that an amount equal to the value of the entire portfolio was replaced once during the fiscal year; a 50% rate means that an amount equal to the value of half the
Janus Henderson Global Sustainable Equity Fund
Useful Information About Your Fund Report (unaudited)
portfolio is traded in a year; and a 200% rate means that an amount equal to the value of the entire portfolio is traded every six months.
Janus Henderson Global Sustainable Equity Fund
Notes
NotesPage1
Janus Henderson Global Sustainable Equity Fund
Notes
NotesPage2
| | | | | | | | |
| | | | | |

| | | | |
This report is submitted for the general information of shareholders of the Fund. It is not an offer or solicitation for the Fund and is not authorized for distribution to prospective investors unless preceded or accompanied by an effective prospectus. |
Janus Henderson is a trademark of Janus Henderson Group plc or one of its subsidiaries. © Janus Henderson Group plc. Janus Henderson Group is the ultimate parent of Janus Henderson Distributors US LLC. Janus Henderson Distributors US LLC |
| | | | 125-24-93086 05-23 |
| | | | |
| | | |
| | | SEMIANNUAL REPORT March 31, 2023 |
| | |
| | Janus Henderson Global Technology and Innovation Fund |
| | |
| | Janus Investment Fund |
| |
| | | HIGHLIGHTS · Investment strategy behind your fund · Fund performance, characteristics
and holdings |
Table of Contents
Janus Henderson Global Technology and Innovation Fund
| | | | | | |
| | | | | 
Jonathan Cofsky co-portfolio manager | 
Denny Fish co-portfolio manager |
| | | |
Janus Henderson Global Technology and Innovation Fund (unaudited)
Fund At A Glance
March 31, 2023
| | | | | | | | | | |
| | | | | | | | | |
| | | | | | | | | |
| | | | | | | | | |
| 5 Top Contributors - Holdings | 5 Top Detractors - Holdings |
| | Average
Weight | | Relative
Contribution | | | Average
Weight | | Relative
Contribution |
| ASML Holding NV | 7.37% | | 1.61% | | Amazon.com Inc | 2.49% | | -1.62% |
| Apple Inc | 4.77% | | 1.36% | | Atlassian Corp - Class A | 2.98% | | -1.57% |
| Meta Platforms Inc - Class A | 1.29% | | 1.24% | | CoStar Group Inc | 3.54% | | -1.06% |
| Advanced Micro Devices Inc | 2.78% | | 0.57% | | NVIDIA Corp | 2.66% | | -0.69% |
| Axon Enterprise Inc | 1.02% | | 0.57% | | Salesforce.com Inc | 0.45% | | -0.65% |
| | | | | | | |
| 3 Top Contributors - Sectors* | | | | | |
| | | Relative | | Fund | MSCI All Country World Information Technology Index |
| | | Contribution | | Average Weight | Average Weight |
| Information Technology | | 1.41% | | 82.67% | 100.00% |
| Communication Services | | 0.17% | | 5.48% | 0.00% |
| Real Estate | | 0.00% | | 0.17% | 0.00% |
| | | | | | |
| | | | | | |
| 4 Top Detractors - Sectors* | | | | | |
| | | Relative | | Fund | MSCI All Country World Information Technology Index |
| | | Contribution | | Average Weight | Average Weight |
| Consumer Discretionary | | -1.17% | | 4.08% | 0.00% |
| Industrials | | -0.65% | | 4.95% | 0.00% |
| Other** | | -0.41% | | 2.10% | 0.00% |
| Financials | | -0.06% | | 0.55% | 0.00% |
| | | | | | | |
| Relative contribution reflects how the portolio's holdings impacted return relative to the benchmark. Cash and securities not held in the portfolio are not shown. For equity portfolios, relative contribution compares the performance of a security in the portfolio to the benchmark's total return, factoring in the difference in weight of that security in the benchmark. Returns are calculated using daily returns and previous day ending weights rolled up by ticker, excluding fixed income securities, gross of advisory fees, may exclude certain derivatives and will differ from actual performance.
Performance attribution reflects returns gross of advisory fees and may differ from actual returns as they are based on end of day holdings. Attribution is calculated by geometrically linking daily returns for the portfolio and index. |
* | Based on sector classification according to the Global Industry Classification Standard (“GICS”) codes, which are the exclusive property and a service mark of MSCI Inc. and Standard & Poor’s. |
** | Not a GICS classified sector. |
Janus Henderson Global Technology and Innovation Fund (unaudited)
Fund At A Glance
March 31, 2023
| | |
5 Largest Equity Holdings - (% of Net Assets) |
Microsoft Corp | |
Software | 12.2% |
Apple Inc | |
Technology Hardware, Storage & Peripherals | 6.5% |
ASML Holding NV | |
Semiconductor & Semiconductor Equipment | 6.4% |
Workday Inc - Class A | |
Software | 4.5% |
Mastercard Inc | |
Diversified Financial Services | 4.4% |
| | 34.0% |
| | | | | | |
Asset Allocation - (% of Net Assets) | |
Common Stocks | | 98.0% | |
Investment Companies | | 1.2% | |
Investments Purchased with Cash Collateral from Securities Lending | | 1.1% | |
Private Placements | | 0.9% | |
Warrants | | 0.0% | |
Other | | (1.2)% |
| | | 100.0% |
| | |
Top Country Allocations - Long Positions - (% of Investment Securities) |
As of March 31, 2023 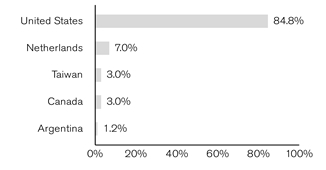
| As of September 30, 2022 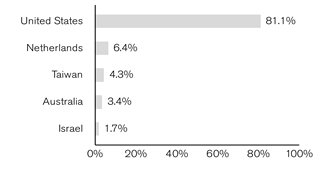
|
Janus Henderson Global Technology and Innovation Fund (unaudited)
Performance
| |
See important disclosures on the next page. |
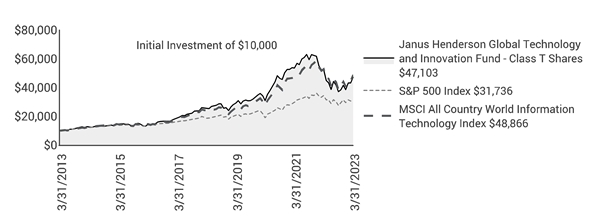
| | | | | | | | | | | |
| | | | | | | | | |
| | | | | | | | | | |
Average Annual Total Return - for the periods ended March 31, 2023 | | | Prospectus Expense Ratios |
| | Fiscal
Year-to-Date | One
Year | Five
Year | Ten
Year | Since
Inception* | | | Total Annual Fund
Operating Expenses‡ |
Class A Shares at NAV | | 26.73% | -10.55% | 12.82% | 16.63% | 9.71% | | | 0.99% |
Class A Shares at MOP | | 19.43% | -15.70% | 11.49% | 15.94% | 9.44% | | | |
Class C Shares at NAV | | 26.36% | -11.10% | 12.07% | 15.85% | 8.94% | | | 1.75% |
Class C Shares at CDSC | | 25.36% | -11.99% | 12.07% | 15.85% | 8.94% | | | |
Class D Shares | | 26.84% | -10.39% | 13.03% | 16.86% | 9.89% | | | 0.80% |
Class I Shares | | 26.86% | -10.35% | 13.09% | 16.94% | 9.94% | | | 0.76% |
Class N Shares | | 26.93% | -10.27% | 13.18% | 16.93% | 9.91% | | | 0.67% |
Class S Shares | | 26.61% | -10.72% | 12.60% | 16.45% | 9.55% | | | 1.18% |
Class T Shares | | 26.80% | -10.47% | 12.92% | 16.76% | 9.85% | | | 0.91% |
S&P 500 Index | | 15.62% | -7.73% | 11.19% | 12.24% | 7.09% | | | |
MSCI All Country World Information Technology Index | | 27.38% | -7.49% | 15.60% | 17.19% | 7.52% | | | |
Morningstar Quartile - Class T Shares | | - | 2nd | 2nd | 2nd | 2nd | | | |
Morningstar Ranking - based on total returns for Technology Funds | | - | 94/275 | 75/202 | 69/179 | 35/95 | | | |
Returns quoted are past performance and do not guarantee future results; current performance may be lower or higher. Investment returns and principal value will vary; there may be a gain or loss when shares are sold. For the most recent month-end performance call 800.668.0434 (or 800.525.3713 if you hold shares directly with Janus Henderson) or visit janushenderson.com/performance (or janushenderson.com/allfunds if you hold shares directly with Janus Henderson).
Maximum Offering Price (MOP) returns include the maximum sales charge of 5.75%. Net Asset Value (NAV) returns exclude this charge, which would have reduced returns.
CDSC returns include a 1% contingent deferred sales charge (CDSC) on Shares redeemed within 12 months of purchase. Net Asset Value (NAV) returns exclude this charge, which would have reduced returns.
Performance may be affected by risks that include those associated with foreign and emerging markets, fixed income securities, high-yield and high-risk securities, undervalued, overlooked and smaller capitalization companies, real estate related securities including Real Estate Investment Trusts (REITs), Environmental, Social and Governance (ESG) factors, non-diversification, portfolio turnover, derivatives, short sales, initial public offerings (IPOs) and
Janus Henderson Global Technology and Innovation Fund (unaudited)
Performance
potential conflicts of interest. Each product has different risks. Please see the prospectus for more information about risks, holdings and other details.
Returns include reinvestment of all dividends and distributions and do not reflect the deduction of taxes that a shareholder would pay on Fund distributions or redemptions of Fund shares. The returns do not include adjustments in accordance with generally accepted accounting principles required at the period end for financial reporting purposes.
Class A Shares, Class C Shares, and Class S Shares commenced operations on July 6, 2009. Performance shown for each class for periods prior to July 6, 2009, reflects the performance of the Fund’s Class J Shares, the initial share class (renamed Class T Shares effective February 16, 2010), calculated using the fees and expenses of each respective class, without the effect of any fee and expense limitations or waivers.
Class D Shares commenced operations on February 16, 2010. Performance shown for periods prior to February 16, 2010, reflects the performance of the Fund’s former Class J Shares, calculated using the fees and expenses in effect during the periods shown, net of any applicable fee and expense limitations or waivers.
Class I Shares commenced operations on July 6, 2009. Performance shown for periods prior to July 6, 2009, reflects the performance of the Fund’s former Class J Shares, calculated using the fees and expenses of Class J Shares, net of any applicable fee and expense limitations or waivers.
Class N Shares commenced operations on January 27, 2017. Performance shown for periods prior to January 27, 2017, reflects the historical performance of the Fund’s Class T Shares, calculated using the fees and expenses of Class T Shares, net of any applicable fee and expense limitations or waivers.
If each share class of the Fund had been available during periods prior to its commencement, the performance shown may have been different. The performance shown for periods following the Fund's commencement of each share class reflects the fees and expenses of each respective share class, net of any applicable fee and expense limitations or waivers. Please refer to the Fund's prospectuses for further details concerning historical performance.
Ranking is for the share class shown only; other classes may have different performance characteristics. When an expense waiver is in effect, it may have a material effect on the total return, and therefore the ranking for the period.
© 2023 Morningstar, Inc. All Rights Reserved.
There is no assurance that the investment process will consistently lead to successful investing.
See Notes to Schedule of Investments and Other Information for index definitions.
Index performance does not reflect the expenses of managing a portfolio as an index is unmanaged and not available for direct investment.
See “Useful Information About Your Fund Report.”
*The Fund’s inception date – December 31, 1998.
‡ As stated in the prospectus. See Financial Highlights for actual expense ratios during the reporting period.
Janus Henderson Global Technology and Innovation Fund (unaudited)
Expense Examples
As a shareholder of the Fund, you incur two types of costs: (1) transaction costs, such as sales charges (loads) on purchase payments (applicable to Class A Shares only); and (2) ongoing costs, including management fees; 12b-1 distribution and shareholder servicing fees; transfer agent fees and expenses payable pursuant to the Transfer Agency Agreement; and other Fund expenses. This example is intended to help you understand your ongoing costs (in dollars) of investing in the Fund and to compare these costs with the ongoing costs of investing in other mutual funds. To do so, compare this 5% hypothetical example with the 5% hypothetical examples that appear in the shareholder reports of the other funds. The example is based upon an investment of $1,000 invested at the beginning of the period and held for the six-months indicated, unless noted otherwise in the table and footnotes below.
Actual Expenses
The information in the table under the heading “Actual” provides information about actual account values and actual expenses. You may use the information in these columns, together with the amount you invested, to estimate the expenses that you paid over the period. Simply divide your account value by $1,000 (for example, an $8,600 account value divided by $1,000 = 8.6), then multiply the result by the number in the appropriate column for your share class under the heading entitled “Expenses Paid During Period” to estimate the expenses you paid on your account during the period.
Hypothetical Example for Comparison Purposes
The information in the table under the heading “Hypothetical (5% return before expenses)” provides information about hypothetical account values and hypothetical expenses based upon the Fund’s actual expense ratio and an assumed rate of return of 5% per year before expenses, which is not the Fund’s actual return. The hypothetical account values and expenses may not be used to estimate the actual ending account balance or expenses you paid for the period. You may use this information to compare the ongoing costs of investing in the Fund and other funds. To do so, compare this 5% hypothetical example with the 5% hypothetical examples that appear in the shareholder reports of the other funds. Additionally, for an analysis of the fees associated with an investment in any share class or other similar funds, please visit www.finra.org/fundanalyzer.
Please note that the expenses shown in the table are meant to highlight your ongoing costs only and do not reflect any transaction costs. These fees are fully described in the Fund’s prospectuses. Therefore, the hypothetical examples are useful in comparing ongoing costs only, and will not help you determine the relative total costs of owning different funds. In addition, if these transaction costs were included, your costs would have been higher.
| | | | | | | | | | | |
| | | | | | | | |
| | | Actual | | Hypothetical
(5% return before expenses) | |
| Beginning
Account
Value
(10/1/22) | Ending
Account
Value
(3/31/23) | Expenses
Paid During
Period
(10/1/22 - 3/31/23)† | | Beginning
Account
Value
(10/1/22) | Ending
Account
Value
(3/31/23) | Expenses
Paid During
Period
(10/1/22 - 3/31/23)† | Net Annualized
Expense Ratio
(10/1/22 - 3/31/23) |
Class A Shares | $1,000.00 | $1,267.30 | $5.71 | | $1,000.00 | $1,019.90 | $5.09 | 1.01% |
Class C Shares | $1,000.00 | $1,263.60 | $9.14 | | $1,000.00 | $1,016.85 | $8.15 | 1.62% |
Class D Shares | $1,000.00 | $1,268.40 | $4.64 | | $1,000.00 | $1,020.84 | $4.13 | 0.82% |
Class I Shares | $1,000.00 | $1,268.60 | $4.41 | | $1,000.00 | $1,021.04 | $3.93 | 0.78% |
Class N Shares | $1,000.00 | $1,269.30 | $3.85 | | $1,000.00 | $1,021.54 | $3.43 | 0.68% |
Class S Shares | $1,000.00 | $1,266.10 | $6.72 | | $1,000.00 | $1,019.00 | $5.99 | 1.19% |
Class T Shares | $1,000.00 | $1,268.00 | $5.15 | | $1,000.00 | $1,020.39 | $4.58 | 0.91% |
† | Expenses Paid During Period are equal to the Net Annualized Expense Ratio multiplied by the average account value over the period, multiplied by 182/365 (to reflect the one-half year period). Expenses in the examples include the effect of applicable fee waivers and/or expense reimbursements, if any. Had such waivers and/or reimbursements not been in effect, your expenses would have been higher. Please refer to the Notes to Financial Statements or the Fund’s prospectuses for more information regarding waivers and/or reimbursements. |
Janus Henderson Global Technology and Innovation Fund
Schedule of Investments (unaudited)
March 31, 2023
| | | | | | | | |
Shares or
Principal Amounts | | | Value | |
Common Stocks– 98.0% | | | |
Aerospace & Defense – 0.6% | | | |
| | Axon Enterprise Inc* | | 123,129 | | | $27,685,556 | |
Automobiles – 0.3% | | | |
| | Tesla Inc* | | 73,431 | | | 15,233,995 | |
Diversified Financial Services – 6.1% | | | |
| | Adyen NV (144A)* | | 17,360 | | | 27,523,737 | |
| | Marqeta Inc - Class A* | | 1,293,225 | | | 5,910,038 | |
| | Mastercard Inc | | 558,576 | | | 202,992,104 | |
| | Visa Inc | | 193,129 | | | 43,542,864 | |
| | | 279,968,743 | |
Electronic Equipment, Instruments & Components – 1.0% | | | |
| | Amphenol Corp | | 458,312 | | | 37,453,257 | |
| | E Ink Holdings Inc | | 919,000 | | | 5,629,176 | |
| | | 43,082,433 | |
Information Technology Services – 1.4% | | | |
| | MongoDB Inc* | | 45,058 | | | 10,503,921 | |
| | Okta Inc* | | 175,146 | | | 15,104,591 | |
| | Snowflake Inc - Class A* | | 254,941 | | | 39,334,847 | |
| | | 64,943,359 | |
Interactive Media & Services – 4.4% | | | |
| | Alphabet Inc - Class C* | | 964,189 | | | 100,275,656 | |
| | Meta Platforms Inc - Class A* | | 471,577 | | | 99,946,029 | |
| | | 200,221,685 | |
Multiline Retail – 2.2% | | | |
| | Amazon.com Inc* | | 446,392 | | | 46,107,830 | |
| | MercadoLibre Inc* | | 42,448 | | | 55,949,011 | |
| | | 102,056,841 | |
Professional Services – 2.9% | | | |
| | CoStar Group Inc* | | 1,899,122 | | | 130,754,550 | |
Road & Rail – 0.1% | | | |
| | Grab Holdings Ltd - Class A* | | 1,733,716 | | | 5,218,485 | |
Semiconductor & Semiconductor Equipment – 33.1% | | | |
| | Advanced Micro Devices Inc* | | 1,551,358 | | | 152,048,598 | |
| | Analog Devices Inc | | 636,819 | | | 125,593,443 | |
| | Applied Materials Inc | | 558,774 | | | 68,634,210 | |
| | ASML Holding NV | | 431,570 | | | 294,862,083 | |
| | KLA Corp | | 328,572 | | | 131,156,085 | |
| | Lam Research Corp | | 273,553 | | | 145,015,916 | |
| | Marvell Technology Inc | | 1,723,361 | | | 74,621,531 | |
| | NVIDIA Corp | | 711,691 | | | 197,686,409 | |
| | NXP Semiconductors NV | | 214,672 | | | 40,030,961 | |
| | ON Semiconductor Corp* | | 380,372 | | | 31,312,223 | |
| | Taiwan Semiconductor Manufacturing Co Ltd | | 7,599,000 | | | 134,633,962 | |
| | Texas Instruments Inc | | 672,747 | | | 125,137,669 | |
| | | 1,520,733,090 | |
Software – 38.0% | | | |
| | Adobe Inc* | | 156,712 | | | 60,392,103 | |
| | Atlassian Corp - Class A* | | 773,152 | | | 132,340,428 | |
| | Cadence Design Systems Inc* | | 437,708 | | | 91,958,074 | |
| | CCC Intelligent Solutions Holdings Inc* | | 5,672,247 | | | 50,880,056 | |
| | Ceridian HCM Holding Inc* | | 651,973 | | | 47,737,463 | |
| | Constellation Software Inc/Canada# | | 65,577 | | | 123,307,374 | |
| | Dynatrace Inc* | | 802,685 | | | 33,953,576 | |
| | HubSpot Inc* | | 61,941 | | | 26,557,204 | |
| | Intuit Inc | | 111,242 | | | 49,595,021 | |
| | Lumine Group Inc* | | 1,243,107 | | | 13,532,231 | |
| | Microsoft Corp | | 1,941,687 | | | 559,788,362 | |
| | Nice Ltd (ADR)* | | 190,077 | | | 43,506,725 | |
| | Olo Inc - Class A* | | 1,425,695 | | | 11,633,671 | |
| | Pagerduty Inc* | | 753,431 | | | 26,355,016 | |
| | |
See Notes to Schedule of Investments and Other Information and Notes to Financial Statements. |
| |
6 | MARCH 31, 2023 |
Janus Henderson Global Technology and Innovation Fund
Schedule of Investments (unaudited)
March 31, 2023
| | | | | | | | |
Shares or
Principal Amounts | | | Value | |
Common Stocks– (continued) | | | |
Software– (continued) | | | |
| | Palo Alto Networks Inc* | | 57,781 | | | $11,541,177 | |
| | Paylocity Holding Corp* | | 123,761 | | | 24,601,212 | |
| | Procore Technologies Inc* | | 495,098 | | | 31,007,988 | |
| | ServiceNow Inc* | | 148,215 | | | 68,878,475 | |
| | Synopsys Inc* | | 104,404 | | | 40,326,045 | |
| | Tyler Technologies Inc* | | 243,620 | | | 86,397,397 | |
| | Workday Inc - Class A* | | 1,004,996 | | | 207,571,874 | |
| | | 1,741,861,472 | |
Specialized Real Estate Investment Trusts (REITs) – 0.2% | | | |
| | Equinix Inc | | 10,683 | | | 7,702,870 | |
Technology Hardware, Storage & Peripherals – 6.5% | | | |
| | Apple Inc | | 1,818,841 | | | 299,926,881 | |
Wireless Telecommunication Services – 1.2% | | | |
| | T-Mobile US Inc* | | 386,979 | | | 56,050,038 | |
Total Common Stocks (cost $2,931,733,619) | | 4,495,439,998 | |
Private Placements– 0.9% | | | |
Professional Services – 0.2% | | | |
| | Apartment List Inc*,¢,§ | | 3,783,673 | | | 8,361,917 | |
Software – 0.7% | | | |
| | Magic Leap Inc - Class A private equity common shares*,¢,§ | | 18,847 | | | 0 | |
| | Via Transportation Inc - Preferred shares*,¢,§ | | 546,008 | | | 24,847,568 | |
| | Via Transportation Inc - private equity common shares*,¢,§ | | 78,474 | | | 3,571,171 | |
| | Via Transportation Inc - Series A*,¢,§ | | 50,741 | | | 2,309,106 | |
| | Via Transportation Inc - Series B*,¢,§ | | 9,272 | | | 421,947 | |
| | Via Transportation Inc - Series C*,¢,§ | | 8,331 | | | 379,125 | |
| | Via Transportation Inc - Series D*,¢,§ | | 29,804 | | | 1,356,312 | |
| | Via Transportation Inc - Series E*,¢,§ | | 13,836 | | | 629,645 | |
| | Via Transportation Inc - Series G-1*,¢,§ | | 17,973 | | | 817,910 | |
| | | 34,332,784 | |
Total Private Placements (cost $56,880,997) | | 42,694,701 | |
Warrants– 0% | | | |
Road & Rail – 0% | | | |
| | Grab Holdings Ltd, expires 12/1/26*((cost $986,182) | | 333,275 | | | 183,301 | |
Investment Companies– 1.2% | | | |
Money Markets – 1.2% | | | |
| | Janus Henderson Cash Liquidity Fund LLC, 4.7988%ºº,£((cost $55,244,939) | | 55,234,070 | | | 55,245,117 | |
Investments Purchased with Cash Collateral from Securities Lending– 1.1% | | | |
Investment Companies – 0.9% | | | |
| | Janus Henderson Cash Collateral Fund LLC, 4.8170%ºº,£ | | 41,734,440 | | | 41,734,440 | |
Time Deposits – 0.2% | | | |
| | Royal Bank of Canada, 4.8000%, 4/3/23 | | $10,433,610 | | | 10,433,610 | |
Total Investments Purchased with Cash Collateral from Securities Lending (cost $52,168,050) | | 52,168,050 | |
Total Investments (total cost $3,097,013,787) – 101.2% | | 4,645,731,167 | |
Liabilities, net of Cash, Receivables and Other Assets – (1.2)% | | (56,039,555) | |
Net Assets – 100% | | $4,589,691,612 | |
| | |
See Notes to Schedule of Investments and Other Information and Notes to Financial Statements. |
| |
Janus Investment Fund | 7 |
Janus Henderson Global Technology and Innovation Fund
Schedule of Investments (unaudited)
March 31, 2023
| | | | | | |
Summary of Investments by Country - (Long Positions) (unaudited) |
| |
| | | | | % of | |
| | | | | Investment | |
Country | | Value | | Securities | |
United States | | $3,941,385,082 | | 84.8 | % |
Netherlands | | 322,385,820 | | 7.0 | |
Taiwan | | 140,263,138 | | 3.0 | |
Canada | | 136,839,605 | | 3.0 | |
Argentina | | 55,949,011 | | 1.2 | |
Israel | | 43,506,725 | | 0.9 | |
Singapore | | 5,401,786 | | 0.1 | |
| | | | | | |
| | | | | | |
Total | | $4,645,731,167 | | 100.0 | % |
Schedules of Affiliated Investments – (% of Net Assets)
| | | | | | | | | | | |
| | Dividend Income | Realized Gain/(Loss) | Change in Unrealized Appreciation/ Depreciation | Value at 3/31/23 |
Investment Companies - 1.2% |
Money Markets - 1.2% | |
| | Janus Henderson Cash Liquidity Fund LLC, 4.7988%ºº | $ | 1,582,339 | $ | 8,592 | $ | 178 | $ | 55,245,117 |
Investments Purchased with Cash Collateral from Securities Lending - 0.9% |
Investment Companies - 0.9% | |
| | Janus Henderson Cash Collateral Fund LLC, 4.8170%ºº | | 5,315∆ | | - | | - | | 41,734,440 |
Total Affiliated Investments - 2.1% | $ | 1,587,654 | $ | 8,592 | $ | 178 | $ | 96,979,557 |
| | | | | | | | | | | |
| | Value at 9/30/22 | Purchases | Sales Proceeds | Value at 3/31/23 |
Investment Companies - 1.2% |
Money Markets - 1.2% | |
| | Janus Henderson Cash Liquidity Fund LLC, 4.7988%ºº | | 189,241,342 | | 446,576,982 | | (580,581,977) | | 55,245,117 |
Investments Purchased with Cash Collateral from Securities Lending - 0.9% |
Investment Companies - 0.9% | |
| | Janus Henderson Cash Collateral Fund LLC, 4.8170%ºº | | 219,182 | | 47,216,893 | | (5,701,635) | | 41,734,440 |
| | |
See Notes to Schedule of Investments and Other Information and Notes to Financial Statements. |
| |
8 | MARCH 31, 2023 |
Janus Henderson Global Technology and Innovation Fund
Schedule of Investments (unaudited)
March 31, 2023
| | | | | | | | | | |
Offsetting of Financial Assets and Derivative Assets |
| |
| | | Gross Amounts | | | | | | |
| | | of Recognized | | Offsetting Asset | | Collateral | | |
Counterparty | | Assets | | or Liability(a) | | Pledged(b) | | Net Amount |
| | | | | | | | | |
JPMorgan Chase Bank, National Association | $ | 50,769,311 | $ | — | $ | (50,769,311) | $ | — |
| | | | | | | | | |
(a) | Represents the amount of assets or liabilities that could be offset with the same counterparty under master netting or similar agreements that management elects not to offset on the Statement of Assets and Liabilities. |
(b) | Collateral pledged is limited to the net outstanding amount due to/from an individual counterparty. The actual collateral amounts pledged may exceed these amounts and may fluctuate in value. |
| | |
See Notes to Schedule of Investments and Other Information and Notes to Financial Statements. |
| |
Janus Investment Fund | 9 |
Janus Henderson Global Technology and Innovation Fund
Notes to Schedule of Investments and Other Information (unaudited)
| | |
MSCI All Country World Information Technology IndexSM | MSCI All Country World Information Technology IndexSM reflects the performance of information technology stocks from developed and emerging markets. |
S&P 500® Index | S&P 500® Index reflects U.S. large-cap equity performance and represents broad U.S. equity market performance. |
| | |
ADR | American Depositary Receipt |
LLC | Limited Liability Company |
| | |
144A | Securities sold under Rule 144A of the Securities Act of 1933, as amended, are subject to legal and/or contractual restrictions on resale and may not be publicly sold without registration under the 1933 Act. Unless otherwise noted, these securities have been determined to be liquid under guidelines established by the Board of Trustees. The total value of 144A securities as of the period ended March 31, 2023 is $27,523,737, which represents 0.6% of net assets. |
| | |
* | Non-income producing security. |
| | |
ºº | Rate shown is the 7-day yield as of March 31, 2023. |
| | |
# | Loaned security; a portion of the security is on loan at March 31, 2023. |
| | |
¢ | Security is valued using significant unobservable inputs. The total value of Level 3 securities as of the period ended March 31, 2023 is $42,694,701, which represents 0.9% of net assets. |
| | |
£ | The Fund may invest in certain securities that are considered affiliated companies. As defined by the Investment Company Act of 1940, as amended, an affiliated company is one in which the Fund owns 5% or more of the outstanding voting securities, or a company which is under common ownership or control. |
| | |
∆ | Net of income paid to the securities lending agent and rebates paid to the borrowing counterparties. |
| | | | | | | | | | | |
§ | Schedule of Restricted Securities (as of March 31, 2023) |
| | | | | | | | Value as a | |
| | Acquisition | | | | | | % of Net | |
| | Date | | Cost | | Value | | Assets | |
Apartment List Inc | 11/2/20 | $ | 13,821,757 | $ | 8,361,917 | | 0.2 | % |
Magic Leap Inc - Class A private equity common shares | 10/5/17 | | 9,160,263 | | 0 | | 0.0 | |
Via Transportation Inc - Preferred shares | 11/4/21 | | 24,847,568 | | 24,847,568 | | 0.5 | |
Via Transportation Inc - private equity common shares | 12/2/21 | | 3,392,431 | | 3,571,171 | | 0.1 | |
Via Transportation Inc - Series A | 12/2/21 | | 2,193,533 | | 2,309,106 | | 0.1 | |
Via Transportation Inc - Series B | 12/2/21 | | 400,829 | | 421,947 | | 0.0 | |
Via Transportation Inc - Series C | 12/2/21 | | 360,149 | | 379,125 | | 0.0 | |
Via Transportation Inc - Series D | 12/2/21 | | 1,288,427 | | 1,356,312 | | 0.0 | |
Via Transportation Inc - Series E | 12/2/21 | | 598,130 | | 629,645 | | 0.0 | |
Via Transportation Inc - Series G-1 | 2/2/23 | | 817,910 | | 817,910 | | 0.0 | |
Total | | $ | 56,880,997 | $ | 42,694,701 | | 0.9 | % |
| | | | | | | | | |
The Fund has registration rights for certain restricted securities held as of March 31, 2023. The issuer incurs all registration costs. | |
Janus Henderson Global Technology and Innovation Fund
Notes to Schedule of Investments and Other Information (unaudited)
| | | | | | | | | | | | | |
The following is a summary of the inputs that were used to value the Fund’s investments in securities and other financial instruments as of March 31, 2023. See Notes to Financial Statements for more information. |
| |
Valuation Inputs Summary |
| | | | | | | |
| | | | | Level 2 - | | Level 3 - |
| | | Level 1 - | | Other Significant | | Significant |
| | | Quoted Prices | | Observable Inputs | | Unobservable Inputs |
| | | | | | | |
Assets | | | | | | |
Investments In Securities: | | | | | | |
Common Stocks | | | | | | |
Diversified Financial Services | $ | 252,445,006 | $ | 27,523,737 | $ | - |
Electronic Equipment, Instruments & Components | | 37,453,257 | | 5,629,176 | | - |
Semiconductor & Semiconductor Equipment | | 1,091,237,045 | | 429,496,045 | | - |
All Other | | 2,651,655,732 | | - | | - |
Private Placements | | - | | - | | 42,694,701 |
Warrants | | - | | 183,301 | | - |
Investment Companies | | - | | 55,245,117 | | - |
Investments Purchased with Cash Collateral from Securities Lending | | - | | 52,168,050 | | - |
Total Assets | $ | 4,032,791,040 | $ | 570,245,426 | $ | 42,694,701 |
| | | | | | | |
Janus Henderson Global Technology and Innovation Fund
Statement of Assets and Liabilities (unaudited)
March 31, 2023
| | | | | | | |
| | | | | | |
Assets: | | | | |
| Unaffiliated investments, at value (cost $3,000,034,408)(1) | | $ | 4,548,751,610 | |
| Affiliated investments, at value (cost $96,979,379) | | | 96,979,557 | |
| Trustees' deferred compensation | | | 113,589 | |
| Receivables: | | | | |
| | Fund shares sold | | | 1,853,017 | |
| | Dividends | | | 1,292,884 | |
| | Dividends from affiliates | | | 296,577 | |
| | Foreign tax reclaims | | | 4,834 | |
| Other assets | | | 48,341 | |
Total Assets | | | 4,649,340,409 | |
Liabilities: | | | | |
| Due to custodian | | | 10 | |
| Collateral for securities loaned (Note 2) | | | 52,168,050 | |
| Payables: | | | — | |
| | Fund shares repurchased | | | 3,427,427 | |
| | Advisory fees | | | 2,501,051 | |
| | Transfer agent fees and expenses | | | 651,651 | |
| | Investments purchased | | | 314,933 | |
| | Trustees' deferred compensation fees | | | 113,589 | |
| | 12b-1 Distribution and shareholder servicing fees | | | 96,140 | |
| | Professional fees | | | 30,417 | |
| | Trustees' fees and expenses | | | 27,394 | |
| | Custodian fees | | | 21,864 | |
| | Affiliated fund administration fees payable | | | 9,770 | |
| | Accrued expenses and other payables | | | 286,501 | |
Total Liabilities | | | 59,648,797 | |
Net Assets | | $ | 4,589,691,612 | |
| | |
See Notes to Financial Statements. |
| |
12 | MARCH 31, 2023 |
Janus Henderson Global Technology and Innovation Fund
Statement of Assets and Liabilities (unaudited)
March 31, 2023
| | | | | | | |
| | | | | | |
| | | | | | | |
Net Assets Consist of: | | | | |
| Capital (par value and paid-in surplus) | | $ | 3,162,268,484 | |
| Total distributable earnings (loss) | | | 1,427,423,128 | |
Total Net Assets | | $ | 4,589,691,612 | |
Net Assets - Class A Shares | | $ | 204,808,580 | |
| Shares Outstanding, $0.01 Par Value (unlimited shares authorized) | | | 5,118,765 | |
Net Asset Value Per Share(2) | | $ | 40.01 | |
Maximum Offering Price Per Share(3) | | $ | 42.45 | |
Net Assets - Class C Shares | | $ | 55,465,429 | |
| Shares Outstanding, $0.01 Par Value (unlimited shares authorized) | | | 1,640,993 | |
Net Asset Value Per Share(2) | | $ | 33.80 | |
Net Assets - Class D Shares | | $ | 2,207,178,992 | |
| Shares Outstanding, $0.01 Par Value (unlimited shares authorized) | | | 53,004,037 | |
Net Asset Value Per Share | | $ | 41.64 | |
Net Assets - Class I Shares | | $ | 733,389,510 | |
| Shares Outstanding, $0.01 Par Value (unlimited shares authorized) | | | 17,385,721 | |
Net Asset Value Per Share | | $ | 42.18 | |
Net Assets - Class N Shares | | $ | 146,127,289 | |
| Shares Outstanding, $0.01 Par Value (unlimited shares authorized) | | | 3,507,313 | |
Net Asset Value Per Share | | $ | 41.66 | |
Net Assets - Class S Shares | | $ | 22,467,290 | |
| Shares Outstanding, $0.01 Par Value (unlimited shares authorized) | | | 580,067 | |
Net Asset Value Per Share | | $ | 38.73 | |
Net Assets - Class T Shares | | $ | 1,220,254,522 | |
| Shares Outstanding, $0.01 Par Value (unlimited shares authorized) | | | 29,677,666 | |
Net Asset Value Per Share | | $ | 41.12 | |
| |
(1) Includes $50,769,311 of securities on loan. See Note 2 in Notes to Financial Statements. (2) Redemption price per share may be reduced for any applicable contingent deferred sales charge. (3) Maximum offering price is computed at 100/94.25 of net asset value. |
| | |
See Notes to Financial Statements. |
| |
Janus Investment Fund | 13 |
Janus Henderson Global Technology and Innovation Fund
Statement of Operations (unaudited)
For the period ended March 31, 2023
| | | | | | |
| | | | | |
Investment Income: | | | |
| Dividends | $ | 12,786,682 | |
| Non-cash dividends | | 2,054,084 | |
| Dividends from affiliates | | 1,582,339 | |
| Affiliated securities lending income, net | | 5,315 | |
| Unaffiliated securities lending income, net | | 1,368 | |
| Other income | | 64,729 | |
| Foreign tax withheld | | (547,855) | |
Total Investment Income | | 15,946,662 | |
Expenses: | | | |
| Advisory fees | | 13,099,267 | |
| 12b-1 Distribution and shareholder servicing fees: | | | |
| | Class A Shares | | 231,842 | |
| | Class C Shares | | 214,613 | |
| | Class S Shares | | 24,258 | |
| Transfer agent administrative fees and expenses: | | | |
| | Class D Shares | | 1,144,278 | |
| | Class S Shares | | 24,316 | |
| | Class T Shares | | 1,368,172 | |
| Transfer agent networking and omnibus fees: | | | |
| | Class A Shares | | 71,576 | |
| | Class C Shares | | 24,361 | |
| | Class I Shares | | 320,530 | |
| Other transfer agent fees and expenses: | | | |
| | Class A Shares | | 6,771 | |
| | Class C Shares | | 1,256 | |
| | Class D Shares | | 136,883 | |
| | Class I Shares | | 20,206 | |
| | Class N Shares | | 3,168 | |
| | Class S Shares | | 119 | |
| | Class T Shares | | 5,872 | |
| Shareholder reports expense | | 159,288 | |
| Registration fees | | 90,061 | |
| Trustees’ fees and expenses | | 60,005 | |
| Affiliated fund administration fees | | 51,170 | |
| Professional fees | | 50,538 | |
| Custodian fees | | 41,855 | |
| Other expenses | | 378,973 | |
Total Expenses | | 17,529,378 | |
Less: Excess Expense Reimbursement and Waivers | | (72,808) | |
Net Expenses | | 17,456,570 | |
Net Investment Income/(Loss) | | (1,509,908) | |
| | | | | |
| | |
See Notes to Financial Statements. |
| |
14 | MARCH 31, 2023 |
Janus Henderson Global Technology and Innovation Fund
Statement of Operations (unaudited)
For the period ended March 31, 2023
| | | | | | |
| | | | | |
Net Realized Gain/(Loss) on Investments: | | | |
| Investments and foreign currency transactions | $ | (69,707,975) | |
| Investments in affiliates | | 8,592 | |
Total Net Realized Gain/(Loss) on Investments | | (69,699,383) | |
Change in Unrealized Net Appreciation/Depreciation: | | | |
| Investments, foreign currency translations and Trustees’ deferred compensation | | 1,059,985,896 | |
| Investments in affiliates | | 178 | |
Total Change in Unrealized Net Appreciation/Depreciation | | 1,059,986,074 | |
Net Increase/(Decrease) in Net Assets Resulting from Operations | $ | 988,776,783 | |
| | | | | |
| | |
See Notes to Financial Statements. |
| |
Janus Investment Fund | 15 |
Janus Henderson Global Technology and Innovation Fund
Statements of Changes in Net Assets
| | | | | | | | | |
| | | | | | | | |
| | | Period ended
March 31, 2023 (unaudited) | | Year ended
September 30, 2022 | |
| | | | | | | | | |
Operations: | | | | | | |
| Net investment income/(loss) | $ | (1,509,908) | | $ | (18,974,805) | |
| Net realized gain/(loss) on investments | | (69,699,383) | | | 47,068,517 | |
| Change in unrealized net appreciation/depreciation | | 1,059,986,074 | | | (2,452,270,459) | |
Net Increase/(Decrease) in Net Assets Resulting from Operations | | 988,776,783 | | | (2,424,176,747) | |
Dividends and Distributions to Shareholders: | | | | | | |
| | Class A Shares | | — | | | (46,604,439) | |
| | Class C Shares | | — | | | (16,566,428) | |
| | Class D Shares | | — | | | (431,253,501) | |
| | Class I Shares | | — | | | (166,649,528) | |
| | Class N Shares | | — | | | (25,779,168) | |
| | Class S Shares | | — | | | (5,259,139) | |
| | Class T Shares | | — | | | (278,237,921) | |
Net Decrease from Dividends and Distributions to Shareholders | | — | | | (970,350,124) | |
Capital Share Transactions: | | | | | | |
| | Class A Shares | | (22,075,512) | | | 23,568,044 | |
| | Class C Shares | | (7,162,217) | | | 384,649 | |
| | Class D Shares | | (57,545,307) | | | 276,314,024 | |
| | Class I Shares | | (74,259,541) | | | 31,451,226 | |
| | Class N Shares | | (263,363) | | | 34,697,306 | |
| | Class S Shares | | (194,709) | | | 8,846,141 | |
| | Class T Shares | | (88,477,484) | | | 39,626,244 | |
Net Increase/(Decrease) from Capital Share Transactions | | (249,978,133) | | | 414,887,634 | |
Net Increase/(Decrease) in Net Assets | | 738,798,650 | | | (2,979,639,237) | |
Net Assets: | | | | | | |
| Beginning of period | | 3,850,892,962 | | | 6,830,532,199 | |
| End of period | $ | 4,589,691,612 | | $ | 3,850,892,962 | |
| | | | | | | | |
| | |
See Notes to Financial Statements. |
| |
16 | MARCH 31, 2023 |
Janus Henderson Global Technology and Innovation Fund
Financial Highlights
| | | | | | | | | | | | | | | | | | | | | | |
Class A Shares | | | | | | | | | | | | | | | | | | |
For a share outstanding during the period ended March 31, 2023 (unaudited) and the year ended September 30 | 2023 | | | 2022 | | | 2021 | | | 2020 | | | 2019 | | | 2018 | |
| Net Asset Value, Beginning of Period | | $31.58 | | | $59.21 | | | $50.45 | | | $36.72 | | | $36.33 | | | $29.11 | |
| Income/(Loss) from Investment Operations: | | | | | | | | | | | | | | | | | | |
| | Net investment income/(loss)(1) | | (0.04) | | | (0.22) | | | (0.27) | | | (0.11) | | | (0.05) | | | (0.05) | |
| | Net realized and unrealized gain/(loss) | | 8.47 | | | (18.76) | | | 13.83 | | | 17.17 | | | 2.33 | | | 8.45 | |
| Total from Investment Operations | | 8.43 | | | (18.98) | | | 13.56 | | | 17.06 | | | 2.28 | | | 8.40 | |
| Less Dividends and Distributions: | | | | | | | | | | | | | | | | | | |
| | Dividends (from net investment income) | | — | | | — | | | — | | | — | | | —(2) | | | —(2) | |
| | Distributions (from capital gains) | | — | | | (8.65) | | | (4.80) | | | (3.33) | | | (1.89) | | | (1.18) | |
| Total Dividends and Distributions | | — | | | (8.65) | | | (4.80) | | | (3.33) | | | (1.89) | | | (1.18) | |
| Net Asset Value, End of Period | | $40.01 | | | $31.58 | | | $59.21 | | | $50.45 | | | $36.72 | | | $36.33 | |
| Total Return* | | 26.69% | | | (37.50)% | | | 28.19% | | | 49.64% | | | 7.70% | | | 29.63% | |
| Net Assets, End of Period (in thousands) | | $204,809 | | | $182,141 | | | $319,194 | | | $252,037 | | | $172,237 | | | $136,689 | |
| Average Net Assets for the Period (in thousands) | | $185,805 | | | $260,997 | | | $299,780 | | | $204,220 | | | $151,979 | | | $125,207 | |
| Ratios to Average Net Assets**: | | | | | | | | | | | | | | | | | | |
| | Ratio of Gross Expenses | | 1.01% | | | 0.99% | | | 0.98% | | | 0.99% | | | 1.01% | | | 1.00% | |
| | Ratio of Net Expenses (After Waivers and Expense Offsets) | | 1.01% | | | 0.99% | | | 0.98% | | | 0.99% | | | 1.01% | | | 1.00% | |
| | Ratio of Net Investment Income/(Loss) | | (0.23)% | | | (0.49)% | | | (0.47)% | | | (0.26)% | | | (0.14)% | | | (0.16)% | |
| Portfolio Turnover Rate | | 22% | | | 47% | | | 43% | | | 37% | | | 36% | | | 20% | |
| | | | | | | | | | | | | | | | | | | | | | |
| |
* Total return includes adjustments in accordance with generally accepted accounting principles required at the year or period end and are not annualized for periods of less than one full year. ** Annualized for periods of less than one full year. (1) Per share amounts are calculated based on average shares outstanding during the year or period. (2) Less than $0.005 on a per share basis. |
| | |
See Notes to Financial Statements. |
| |
Janus Investment Fund | 17 |
Janus Henderson Global Technology and Innovation Fund
Financial Highlights
| | | | | | | | | | | | | | | | | | | | | | |
Class C Shares | | | | | | | | | | | | | | | | | | |
For a share outstanding during the period ended March 31, 2023 (unaudited) and the year ended September 30 | 2023 | | | 2022 | | | 2021 | | | 2020 | | | 2019 | | | 2018 | |
| Net Asset Value, Beginning of Period | | $26.76 | | | $51.77 | | | $44.91 | | | $33.24 | | | $33.31 | | | $26.96 | |
| Income/(Loss) from Investment Operations: | | | | | | | | | | | | | | | | | | |
| | Net investment income/(loss)(1) | | (0.12) | | | (0.42) | | | (0.56) | | | (0.36) | | | (0.26) | | | (0.27) | |
| | Net realized and unrealized gain/(loss) | | 7.16 | | | (15.94) | | | 12.22 | | | 15.36 | | | 2.08 | | | 7.80 | |
| Total from Investment Operations | | 7.04 | | | (16.36) | | | 11.66 | | | 15.00 | | | 1.82 | | | 7.53 | |
| Less Dividends and Distributions: | | | | | | | | | | | | | | | | | | |
| | Dividends (from net investment income) | | — | | | — | | | — | | | — | | | — | | | — | |
| | Distributions (from capital gains) | | — | | | (8.65) | | | (4.80) | | | (3.33) | | | (1.89) | | | (1.18) | |
| Total Dividends and Distributions | | — | | | (8.65) | | | (4.80) | | | (3.33) | | | (1.89) | | | (1.18) | |
| Net Asset Value, End of Period | | $33.80 | | | $26.76 | | | $51.77 | | | $44.91 | | | $33.24 | | | $33.31 | |
| Total Return* | | 26.31% | | | (37.88)% | | | 27.37% | | | 48.56% | | | 6.97% | | | 28.73% | |
| Net Assets, End of Period (in thousands) | | $55,465 | | | $50,614 | | | $101,860 | | | $89,141 | | | $64,636 | | | $89,817 | |
| Average Net Assets for the Period (in thousands) | | $51,372 | | | $79,418 | | | $98,033 | | | $75,085 | | | $66,888 | | | $79,328 | |
| Ratios to Average Net Assets**: | | | | | | | | | | | | | | | | | | |
| | Ratio of Gross Expenses | | 1.62% | | | 1.58% | | | 1.64% | | | 1.69% | | | 1.70% | | | 1.72% | |
| | Ratio of Net Expenses (After Waivers and Expense Offsets) | | 1.62% | | | 1.58% | | | 1.64% | | | 1.69% | | | 1.70% | | | 1.72% | |
| | Ratio of Net Investment Income/(Loss) | | (0.84)% | | | (1.09)% | | | (1.13)% | | | (0.96)% | | | (0.85)% | | | (0.88)% | |
| Portfolio Turnover Rate | | 22% | | | 47% | | | 43% | | | 37% | | | 36% | | | 20% | |
| | | | | | | | | | | | | | | | | | | | | | |
| |
* Total return includes adjustments in accordance with generally accepted accounting principles required at the year or period end and are not annualized for periods of less than one full year. ** Annualized for periods of less than one full year. (1) Per share amounts are calculated based on average shares outstanding during the year or period. |
| | |
See Notes to Financial Statements. |
| |
18 | MARCH 31, 2023 |
Janus Henderson Global Technology and Innovation Fund
Financial Highlights
| | | | | | | | | | | | | | | | | | | | | | |
Class D Shares | | | | | | | | | | | | | | | | | | |
For a share outstanding during the period ended March 31, 2023 (unaudited) and the year ended September 30 | 2023 | | | 2022 | | | 2021 | | | 2020 | | | 2019 | | | 2018 | |
| Net Asset Value, Beginning of Period | | $32.83 | | | $61.11 | | | $51.89 | | | $37.62 | | | $37.14 | | | $29.69 | |
| Income/(Loss) from Investment Operations: | | | | | | | | | | | | | | | | | | |
| | Net investment income/(loss)(1) | | (0.01) | | | (0.14) | | | (0.16) | | | (0.03) | | | 0.01 | | | —(2) | |
| | Net realized and unrealized gain/(loss) | | 8.82 | | | (19.49) | | | 14.23 | | | 17.63 | | | 2.40 | | | 8.63 | |
| Total from Investment Operations | | 8.81 | | | (19.63) | | | 14.07 | | | 17.60 | | | 2.41 | | | 8.63 | |
| Less Dividends and Distributions: | | | | | | | | | | | | | | | | | | |
| | Dividends (from net investment income) | | — | | | — | | | (0.05) | | | — | | | (0.04) | | | —(2) | |
| | Distributions (from capital gains) | | — | | | (8.65) | | | (4.80) | | | (3.33) | | | (1.89) | | | (1.18) | |
| Total Dividends and Distributions | | — | | | (8.65) | | | (4.85) | | | (3.33) | | | (1.93) | | | (1.18) | |
| Net Asset Value, End of Period | | $41.64 | | | $32.83 | | | $61.11 | | | $51.89 | | | $37.62 | | | $37.14 | |
| Total Return* | | 26.84% | | | (37.39)% | | | 28.43% | | | 49.90% | | | 7.91% | | | 29.84% | |
| Net Assets, End of Period (in thousands) | | $2,207,179 | | | $1,794,752 | | | $3,058,182 | | | $2,426,380 | | | $1,603,112 | | | $1,570,846 | |
| Average Net Assets for the Period (in thousands) | | $1,941,289 | | | $2,524,660 | | | $2,878,436 | | | $1,911,725 | | | $1,501,953 | | | $1,400,342 | |
| Ratios to Average Net Assets**: | | | | | | | | | | | | | | | | | | |
| | Ratio of Gross Expenses | | 0.82% | | | 0.80% | | | 0.79% | | | 0.80% | | | 0.83% | | | 0.83% | |
| | Ratio of Net Expenses (After Waivers and Expense Offsets) | | 0.82% | | | 0.80% | | | 0.79% | | | 0.80% | | | 0.83% | | | 0.83% | |
| | Ratio of Net Investment Income/(Loss) | | (0.04)% | | | (0.30)% | | | (0.29)% | | | (0.08)% | | | 0.03% | | | 0.01% | |
| Portfolio Turnover Rate | | 22% | | | 47% | | | 43% | | | 37% | | | 36% | | | 20% | |
| | | | | | | | | | | | | | | | | | | | | | |
| |
* Total return includes adjustments in accordance with generally accepted accounting principles required at the year or period end and are not annualized for periods of less than one full year. ** Annualized for periods of less than one full year. (1) Per share amounts are calculated based on average shares outstanding during the year or period. (2) Less than $0.005 on a per share basis. |
| | |
See Notes to Financial Statements. |
| |
Janus Investment Fund | 19 |
Janus Henderson Global Technology and Innovation Fund
Financial Highlights
| | | | | | | | | | | | | | | | | | | | | | |
Class I Shares | | | | | | | | | | | | | | | | | | |
For a share outstanding during the period ended March 31, 2023 (unaudited) and the year ended September 30 | 2023 | | | 2022 | | | 2021 | | | 2020 | | | 2019 | | | 2018 | |
| Net Asset Value, Beginning of Period | | $33.25 | | | $61.76 | | | $52.40 | | | $37.94 | | | $37.45 | | | $29.91 | |
| Income/(Loss) from Investment Operations: | | | | | | | | | | | | | | | | | | |
| | Net investment income/(loss)(1) | | —(2) | | | (0.12) | | | (0.14) | | | (0.01) | | | 0.04 | | | 0.04 | |
| | Net realized and unrealized gain/(loss) | | 8.93 | | | (19.74) | | | 14.38 | | | 17.80 | | | 2.41 | | | 8.69 | |
| Total from Investment Operations | | 8.93 | | | (19.86) | | | 14.24 | | | 17.79 | | | 2.45 | | | 8.73 | |
| Less Dividends and Distributions: | | | | | | | | | | | | | | | | | | |
| | Dividends (from net investment income) | | — | | | — | | | (0.08) | | | — | | | (0.07) | | | (0.01) | |
| | Distributions (from capital gains) | | — | | | (8.65) | | | (4.80) | | | (3.33) | | | (1.89) | | | (1.18) | |
| Total Dividends and Distributions | | — | | | (8.65) | | | (4.88) | | | (3.33) | | | (1.96) | | | (1.19) | |
| Net Asset Value, End of Period | | $42.18 | | | $33.25 | | | $61.76 | | | $52.40 | | | $37.94 | | | $37.45 | |
| Total Return* | | 26.86% | | | (37.36)% | | | 28.48% | | | 49.99% | | | 7.97% | | | 29.97% | |
| Net Assets, End of Period (in thousands) | | $733,390 | | | $644,388 | | | $1,189,917 | | | $890,656 | | | $418,834 | | | $353,236 | |
| Average Net Assets for the Period (in thousands) | | $675,331 | | | $944,382 | | | $1,074,031 | | | $606,085 | | | $356,404 | | | $248,537 | |
| Ratios to Average Net Assets**: | | | | | | | | | | | | | | | | | | |
| | Ratio of Gross Expenses | | 0.78% | | | 0.76% | | | 0.75% | | | 0.75% | | | 0.76% | | | 0.75% | |
| | Ratio of Net Expenses (After Waivers and Expense Offsets) | | 0.78% | | | 0.76% | | | 0.75% | | | 0.75% | | | 0.76% | | | 0.75% | |
| | Ratio of Net Investment Income/(Loss) | | —(3) | | | (0.26)% | | | (0.24)% | | | (0.02)% | | | 0.11% | | | 0.10% | |
| Portfolio Turnover Rate | | 22% | | | 47% | | | 43% | | | 37% | | | 36% | | | 20% | |
| | | | | | | | | | | | | | | | | | | | | | |
| |
* Total return includes adjustments in accordance with generally accepted accounting principles required at the year or period end and are not annualized for periods of less than one full year. ** Annualized for periods of less than one full year. (1) Per share amounts are calculated based on average shares outstanding during the year or period. (2) Less than $0.005 on a per share basis. (3) Less than 0.005%. |
| | |
See Notes to Financial Statements. |
| |
20 | MARCH 31, 2023 |
Janus Henderson Global Technology and Innovation Fund
Financial Highlights
| | | | | | | | | | | | | | | | | | | | | | |
Class N Shares | | | | | | | | | | | | | | | | | | |
For a share outstanding during the period ended March 31, 2023 (unaudited) and the year ended September 30 | 2023 | | | 2022 | | | 2021 | | | 2020 | | | 2019 | | | 2018 | |
| Net Asset Value, Beginning of Period | | $32.83 | | | $61.03 | | | $51.81 | | | $37.52 | | | $37.05 | | | $29.59 | |
| Income/(Loss) from Investment Operations: | | | | | | | | | | | | | | | | | | |
| | Net investment income/(loss)(1) | | 0.02 | | | (0.08) | | | (0.09) | | | 0.02 | | | 0.07 | | | 0.06 | |
| | Net realized and unrealized gain/(loss) | | 8.81 | | | (19.47) | | | 14.21 | | | 17.60 | | | 2.37 | | | 8.60 | |
| Total from Investment Operations | | 8.83 | | | (19.55) | | | 14.12 | | | 17.62 | | | 2.44 | | | 8.66 | |
| Less Dividends and Distributions: | | | | | | | | | | | | | | | | | | |
| | Dividends (from net investment income) | | — | | | — | | | (0.10) | | | — | | | (0.08) | | | (0.02) | |
| | Distributions (from capital gains) | | — | | | (8.65) | | | (4.80) | | | (3.33) | | | (1.89) | | | (1.18) | |
| Total Dividends and Distributions | | — | | | (8.65) | | | (4.90) | | | (3.33) | | | (1.97) | | | (1.20) | |
| Net Asset Value, End of Period | | $41.66 | | | $32.83 | | | $61.03 | | | $51.81 | | | $37.52 | | | $37.05 | |
| Total Return* | | 26.90% | | | (37.29)% | | | 28.59% | | | 50.10% | | | 8.06% | | | 30.04% | |
| Net Assets, End of Period (in thousands) | | $146,127 | | | $115,297 | | | $175,740 | | | $117,541 | | | $41,043 | | | $20,522 | |
| Average Net Assets for the Period (in thousands) | | $128,875 | | | $155,684 | | | $158,218 | | | $70,265 | | | $28,002 | | | $11,360 | |
| Ratios to Average Net Assets**: | | | | | | | | | | | | | | | | | | |
| | Ratio of Gross Expenses | | 0.68% | | | 0.67% | | | 0.67% | | | 0.67% | | | 0.69% | | | 0.69% | |
| | Ratio of Net Expenses (After Waivers and Expense Offsets) | | 0.68% | | | 0.67% | | | 0.67% | | | 0.67% | | | 0.69% | | | 0.69% | |
| | Ratio of Net Investment Income/(Loss) | | 0.10% | | | (0.17)% | | | (0.16)% | | | 0.06% | | | 0.19% | | | 0.17% | |
| Portfolio Turnover Rate | | 22% | | | 47% | | | 43% | | | 37% | | | 36% | | | 20% | |
| | | | | | | | | | | | | | | | | | | | | | |
| |
* Total return includes adjustments in accordance with generally accepted accounting principles required at the year or period end and are not annualized for periods of less than one full year. ** Annualized for periods of less than one full year. (1) Per share amounts are calculated based on average shares outstanding during the year or period. |
| | |
See Notes to Financial Statements. |
| |
Janus Investment Fund | 21 |
Janus Henderson Global Technology and Innovation Fund
Financial Highlights
| | | | | | | | | | | | | | | | | | | | | | |
Class S Shares | | | | | | | | | | | | | | | | | | |
For a share outstanding during the period ended March 31, 2023 (unaudited) and the year ended September 30 | 2023 | | | 2022 | | | 2021 | | | 2020 | | | 2019 | | | 2018 | |
| Net Asset Value, Beginning of Period | | $30.59 | | | $57.73 | | | $49.38 | | | $36.07 | | | $35.79 | | | $28.75 | |
| Income/(Loss) from Investment Operations: | | | | | | | | | | | | | | | | | | |
| | Net investment income/(loss)(1) | | (0.07) | | | (0.29) | | | (0.36) | | | (0.19) | | | (0.12) | | | (0.12) | |
| | Net realized and unrealized gain/(loss) | | 8.21 | | | (18.20) | | | 13.51 | | | 16.83 | | | 2.29 | | | 8.34 | |
| Total from Investment Operations | | 8.14 | | | (18.49) | | | 13.15 | | | 16.64 | | | 2.17 | | | 8.22 | |
| Less Dividends and Distributions: | | | | | | | | | | | | | | | | | | |
| | Dividends (from net investment income) | | — | | | — | | | — | | | — | | | — | | | — | |
| | Distributions (from capital gains) | | — | | | (8.65) | | | (4.80) | | | (3.33) | | | (1.89) | | | (1.18) | |
| Total Dividends and Distributions | | — | | | (8.65) | | | (4.80) | | | (3.33) | | | (1.89) | | | (1.18) | |
| Net Asset Value, End of Period | | $38.73 | | | $30.59 | | | $57.73 | | | $49.38 | | | $36.07 | | | $35.79 | |
| Total Return* | | 26.61% | | | (37.63)% | | | 27.95% | | | 49.35% | | | 7.49% | | | 29.36% | |
| Net Assets, End of Period (in thousands) | | $22,467 | | | $17,985 | | | $27,069 | | | $21,002 | | | $9,084 | | | $6,628 | |
| Average Net Assets for the Period (in thousands) | | $19,464 | | | $26,676 | | | $25,961 | | | $14,529 | | | $7,654 | | | $6,405 | |
| Ratios to Average Net Assets**: | | | | | | | | | | | | | | | | | | |
| | Ratio of Gross Expenses | | 1.19% | | | 1.18% | | | 1.17% | | | 1.19% | | | 1.22% | | | 1.20% | |
| | Ratio of Net Expenses (After Waivers and Expense Offsets) | | 1.19% | | | 1.17% | | | 1.17% | | | 1.18% | | | 1.22% | | | 1.19% | |
| | Ratio of Net Investment Income/(Loss) | | (0.41)% | | | (0.68)% | | | (0.66)% | | | (0.46)% | | | (0.35)% | | | (0.36)% | |
| Portfolio Turnover Rate | | 22% | | | 47% | | | 43% | | | 37% | | | 36% | | | 20% | |
| | | | | | | | | | | | | | | | | | | | | | |
| |
* Total return includes adjustments in accordance with generally accepted accounting principles required at the year or period end and are not annualized for periods of less than one full year. ** Annualized for periods of less than one full year. (1) Per share amounts are calculated based on average shares outstanding during the year or period. |
| | |
See Notes to Financial Statements. |
| |
22 | MARCH 31, 2023 |
Janus Henderson Global Technology and Innovation Fund
Financial Highlights
| | | | | | | | | | | | | | | | | | | | | | |
Class T Shares | | | | | | | | | | | | | | | | | | |
For a share outstanding during the period ended March 31, 2023 (unaudited) and the year ended September 30 | 2023 | | | 2022 | | | 2021 | | | 2020 | | | 2019 | | | 2018 | |
| Net Asset Value, Beginning of Period | | $32.43 | | | $60.53 | | | $51.47 | | | $37.37 | | | $36.91 | | | $29.54 | |
| Income/(Loss) from Investment Operations: | | | | | | | | | | | | | | | | | | |
| | Net investment income/(loss)(1) | | (0.02) | | | (0.19) | | | (0.23) | | | (0.08) | | | (0.02) | | | (0.03) | |
| | Net realized and unrealized gain/(loss) | | 8.71 | | | (19.26) | | | 14.11 | | | 17.51 | | | 2.39 | | | 8.58 | |
| Total from Investment Operations | | 8.69 | | | (19.45) | | | 13.88 | | | 17.43 | | | 2.37 | | | 8.55 | |
| Less Dividends and Distributions: | | | | | | | | | | | | | | | | | | |
| | Dividends (from net investment income) | | — | | | — | | | (0.02) | | | — | | | (0.02) | | | — | |
| | Distributions (from capital gains) | | — | | | (8.65) | | | (4.80) | | | (3.33) | | | (1.89) | | | (1.18) | |
| Total Dividends and Distributions | | — | | | (8.65) | | | (4.82) | | | (3.33) | | | (1.91) | | | (1.18) | |
| Net Asset Value, End of Period | | $41.12 | | | $32.43 | | | $60.53 | | | $51.47 | | | $37.37 | | | $36.91 | |
| Total Return* | | 26.80% | | | (37.45)% | | | 28.26% | | | 49.77% | | | 7.82% | | | 29.70% | |
| Net Assets, End of Period (in thousands) | | $1,220,255 | | | $1,045,715 | | | $1,958,570 | | | $1,601,653 | | | $936,931 | | | $961,794 | |
| Average Net Assets for the Period (in thousands) | | $1,096,034 | | | $1,554,115 | | | $1,860,359 | | | $1,210,097 | | | $869,267 | | | $812,197 | |
| Ratios to Average Net Assets**: | | | | | | | | | | | | | | | | | | |
| | Ratio of Gross Expenses | | 0.93% | | | 0.91% | | | 0.91% | | | 0.92% | | | 0.93% | | | 0.92% | |
| | Ratio of Net Expenses (After Waivers and Expense Offsets) | | 0.91% | | | 0.90% | | | 0.91% | | | 0.91% | | | 0.92% | | | 0.92% | |
| | Ratio of Net Investment Income/(Loss) | | (0.13)% | | | (0.41)% | | | (0.40)% | | | (0.18)% | | | (0.06)% | | | (0.08)% | |
| Portfolio Turnover Rate | | 22% | | | 47% | | | 43% | | | 37% | | | 36% | | | 20% | |
| | | | | | | | | | | | | | | | | | | | | | |
| |
* Total return includes adjustments in accordance with generally accepted accounting principles required at the year or period end and are not annualized for periods of less than one full year. ** Annualized for periods of less than one full year. (1) Per share amounts are calculated based on average shares outstanding during the year or period. |
| | |
See Notes to Financial Statements. |
| |
Janus Investment Fund | 23 |
Janus Henderson Global Technology and Innovation Fund
Notes to Financial Statements (unaudited)
1. Organization and Significant Accounting Policies
Janus Henderson Global Technology and Innovation Fund (the “Fund”) is a series of Janus Investment Fund (the “Trust”), which is organized as a Massachusetts business trust and is registered under the Investment Company Act of 1940, as amended (the “1940 Act”), as an open-end management investment company, and therefore has applied the specialized accounting and reporting guidance in Financial Accounting Standards Board (“FASB”) Accounting Standards Codification (“ASC”) Topic 946. The Trust offers 40 funds, each of which offers multiple share classes, with differing investment objectives and policies. The Fund seeks long-term growth of capital. The Fund is classified as diversified, as defined in the 1940 Act. Janus Henderson Investors US LLC is the investment adviser (the “Adviser”) to the Fund.
The Fund offers multiple classes of shares in order to meet the needs of various types of investors. Each class represents an interest in the same portfolio of investments. Certain financial intermediaries may not offer all classes of shares.
Shareholders, including other funds, individuals, accounts, as well as the Fund’s portfolio manager(s) and/or investment personnel, may from time to time own (beneficially or of record) a significant percentage of the Fund’s Shares and can be considered to “control” the Fund when that ownership exceeds 25% of the Fund’s assets (and which may differ from control as determined in accordance with United States of America generally accepted accounting principles ("US GAAP")).
Class A Shares are offered through financial intermediary platforms including, but not limited to, traditional brokerage platforms, mutual fund wrap fee programs, bank trust platforms, and retirement platforms.
Class C Shares are offered through financial intermediary platforms including, but not limited to, traditional brokerage platforms, mutual fund wrap fee programs, and bank trust platforms.
Class C Shares are closed to investments by new employer-sponsored retirement plans and existing employer-sponsored retirement plans are no longer able to make additional purchases or exchanges into Class C Shares.
The Fund currently implements an automatic conversion feature pursuant to which Class C Shares that have been held for eight years are automatically converted to Class A Shares without the imposition of any sales charge, fee or other charge. The conversion will generally occur no later than ten business days in the month following the month of the eighth anniversary of the date of purchase. Class C Shares purchased through the reinvestment of dividends and other distributions on Class C Shares will convert to Class A Shares at the same time as the original Class C Shares with respect to which they were purchased. For Class C Shares held in omnibus accounts on intermediary platforms, the Fund relies on these intermediaries to implement this conversion feature. Your financial intermediary may have separate policies and procedures as to when and how Class C Shares may be converted to Class A Shares.
Effective July 6, 2020, Class D Shares are available to new investors, subject to any closed fund policies for a Fund, as applicable. Previously, Class D Shares were only available to investors who already had a direct account with the Janus Henderson funds; immediate family members or members of the same household of an eligible individual investor; and existing beneficial owners of sole proprietorships or partnerships that hold accounts directly with the Janus Henderson funds.
Class I Shares are available through certain financial intermediary platforms including, but not limited to, mutual fund wrap fee programs, managed account programs, asset allocation programs, bank trust platforms, as well as certain retirement platforms. Class I Shares are also available to certain direct institutional investors including, but not limited to, corporations, certain retirement plans, public plans, and foundations/endowments, who established Class I Share accounts before August 4, 2017.
Class N Shares are generally available only to financial intermediaries purchasing on behalf of: 1) certain adviser-assisted, employer-sponsored retirement plans, including 401(k) plans, 457 plans, 403(b) plans, Taft-Hartley multi-employer plans, profit-sharing and money purchase pension plans, defined benefit plans and certain welfare benefit plans, such as health savings accounts, and nonqualified deferred compensation plans; and 2) retail investors purchasing in qualified or nonqualified accounts, whose accounts are held through an omnibus account at their financial intermediary, and where the financial intermediary requires no payment or reimbursement from the Fund, the Adviser, or its affiliates. Class N Shares are also available to Janus Henderson proprietary products and to certain direct institutional investors approved by Janus Henderson Distributors US LLC (the “Distributor”) including, but not limited to,
Janus Henderson Global Technology and Innovation Fund
Notes to Financial Statements (unaudited)
corporations, certain retirement plans, public plans, and foundations and endowments, subject to minimum investment requirements.
Class S Shares are offered through financial intermediary platforms including, but not limited to, retirement platforms and asset allocation, mutual fund wrap, or other discretionary or nondiscretionary fee-based investment advisory programs. In addition, Class S Shares may be available through certain financial intermediaries who have an agreement with the Adviser or its affiliates to offer Class S Shares on their supermarket platforms.
Class T Shares are available through certain financial intermediary platforms including, but not limited to, mutual fund wrap fee programs, managed account programs, asset allocation programs, bank trust platforms, as well as certain retirement platforms. In addition, Class T Shares may be available through certain financial intermediaries who have an agreement with the Adviser or its affiliates to offer Class T Shares on their supermarket platforms.
The following accounting policies have been followed by the Fund and are in conformity with US GAAP.
Investment Valuation
Fund holdings are valued in accordance with policies and procedures established by the Adviser pursuant to Rule 2a-5 under the 1940 Act and approved by and subject to the oversight of the Trustees (the “Valuation Procedures”). Equity securities traded on a domestic securities exchange are generally valued at readily available market quotations, which are (i) the official close prices or (ii) last sale prices on the primary market or exchange in which the securities trade. If such price is lacking for the trading period immediately preceding the time of determination, such securities are generally valued at their current bid price. Equity securities that are traded on a foreign exchange are generally valued at the closing prices on such markets. In the event that there is no current trading volume on a particular security in such foreign exchange, the bid price from the primary exchange is generally used to value the security. Foreign securities and currencies are converted to U.S. dollars using the current spot USD dollar exchange rate in effect at the close of the New York Stock Exchange (“NYSE”). The Fund will determine the market value of individual securities held by it by using prices provided by one or more approved professional pricing services or, as needed, by obtaining market quotations from independent broker-dealers. Most debt securities are valued in accordance with the evaluated bid price supplied by the Adviser-approved pricing service that is intended to reflect market value. The evaluated bid price supplied by the pricing service is an evaluation that may consider factors such as security prices, yields, maturities and ratings. Certain short-term securities maturing within 60 days or less may be evaluated and valued on an amortized cost basis provided that the amortized cost determined approximates market value. Securities for which market quotations or evaluated prices are not readily available or deemed unreliable are valued at fair value determined in good faith by the Adviser pursuant to the Valuation Procedures. Circumstances in which fair valuation may be utilized include, but are not limited to: (i) a significant event that may affect the securities of a single issuer, such as a merger, bankruptcy, or significant issuer-specific development; (ii) an event that may affect an entire market, such as a natural disaster or significant governmental action; (iii) a nonsignificant event such as a market closing early or not opening, or a security trading halt; and (iv) pricing of a nonvalued security and a restricted or nonpublic security. Special valuation considerations may apply with respect to “odd-lot” fixed-income transactions which, due to their small size, may receive evaluated prices by pricing services which reflect a large block trade and not what actually could be obtained for the odd-lot position. The valuation policies provide for the use of systematic fair valuation models provided by independent pricing services to value foreign equity securities in order to adjust for stale pricing, which may occur between the close of certain foreign exchanges and the close of the NYSE. The value of the securities of other mutual funds held by a Fund, if any, will be calculated using the NAV of such mutual funds.
Valuation Inputs Summary
FASB ASC 820, Fair Value Measurements and Disclosures (“ASC 820”), defines fair value, establishes a framework for measuring fair value, and expands disclosure requirements regarding fair value measurements. This standard emphasizes that fair value is a market-based measurement that should be determined based on the assumptions that market participants would use in pricing an asset or liability and establishes a hierarchy that prioritizes inputs to valuation techniques used to measure fair value. These inputs are summarized into three broad levels:
Level 1 – Unadjusted quoted prices in active markets the Fund has the ability to access for identical assets or liabilities.
Level 2 – Observable inputs other than unadjusted quoted prices included in Level 1 that are observable for the asset or liability either directly or indirectly. These inputs may include quoted prices for the identical instrument on
Janus Henderson Global Technology and Innovation Fund
Notes to Financial Statements (unaudited)
an inactive market, prices for similar instruments, interest rates, prepayment speeds, credit risk, yield curves, default rates and similar data.
Assets or liabilities categorized as Level 2 in the hierarchy generally include: debt securities fair valued in accordance with the evaluated bid or ask prices supplied by a pricing service; securities traded on OTC markets and listed securities for which no sales are reported that are fair valued at the latest bid price (or yield equivalent thereof) obtained from one or more dealers transacting in a market for such securities or by a pricing service approved by the Fund’s Trustees; certain short-term debt securities with maturities of 60 days or less that are fair valued at amortized cost; and equity securities of foreign issuers whose fair value is determined by using systematic fair valuation models provided by independent third parties in order to adjust for stale pricing which may occur between the close of certain foreign exchanges and the close of the NYSE. Other securities that may be categorized as Level 2 in the hierarchy include, but are not limited to, preferred stocks, bank loans, swaps, investments in unregistered investment companies, options, and forward contracts.
Level 3 – Unobservable inputs for the asset or liability to the extent that relevant observable inputs are not available, representing the Fund’s own assumptions about the assumptions that a market participant would use in valuing the asset or liability, and that would be based on the best information available.
There have been no significant changes in valuation techniques used in valuing any such positions held by the Fund since the beginning of the fiscal period.
The inputs or methodology used for fair valuing securities are not necessarily an indication of the risk associated with investing in those securities. The summary of inputs used as of March 31, 2023 to fair value the Fund’s investments in securities and other financial instruments is included in the “Valuation Inputs Summary” in the Notes to Schedule of Investments and Other Information.
The Fund did not hold a significant amount of Level 3 securities as of March 31, 2023.
Investment Transactions and Investment Income
Investment transactions are accounted for as of the date purchased or sold (trade date). Dividend income is recorded on the ex-dividend date. Certain dividends from foreign securities will be recorded as soon as the Fund is informed of the dividend, if such information is obtained subsequent to the ex-dividend date. Dividends from foreign securities may be subject to withholding taxes in foreign jurisdictions. Non-cash dividends, if any, are recorded on the ex-dividend date at fair value. Interest income is recorded daily on an accrual basis and includes amortization of premiums and accretion of discounts. The Fund classifies gains and losses on prepayments received as an adjustment to interest income. Debt securities may be placed in non-accrual status and related interest income may be reduced by stopping current accruals and writing off interest receivables when collection of all or a portion of interest has become doubtful. Gains and losses are determined on the identified cost basis, which is the same basis used for federal income tax purposes. Income, as well as gains and losses, both realized and unrealized, are allocated daily to each class of shares based upon the ratio of net assets represented by each class as a percentage of total net assets.
Expenses
The Fund bears expenses incurred specifically on its behalf. Each class of shares bears a portion of general expenses, which are allocated daily to each class of shares based upon the ratio of net assets represented by each class as a percentage of total net assets. Expenses directly attributable to a specific class of shares are charged against the operations of such class.
Estimates
The preparation of financial statements in conformity with US GAAP requires management to make estimates and assumptions that affect the reported amount of assets and liabilities and disclosure of contingent assets and liabilities at the date of the financial statements, and the reported amounts of income and expenses during the reporting period. Actual results could differ from those estimates.
Indemnifications
In the normal course of business, the Fund may enter into contracts that contain provisions for indemnification of other parties against certain potential liabilities. The Fund’s maximum exposure under these arrangements is unknown, and would involve future claims that may be made against the Fund that have not yet occurred. Currently, the risk of material loss from such claims is considered remote.
Janus Henderson Global Technology and Innovation Fund
Notes to Financial Statements (unaudited)
Foreign Currency Translations
The Fund does not isolate that portion of the results of operations resulting from the effect of changes in foreign exchange rates on investments from the fluctuations arising from changes in market prices of securities held at the date of the financial statements. Net unrealized appreciation or depreciation of investments and foreign currency translations arise from changes in the value of assets and liabilities, including investments in securities held at the date of the financial statements, resulting from changes in the exchange rates and changes in market prices of securities held.
Currency gains and losses are also calculated on payables and receivables that are denominated in foreign currencies. The payables and receivables are generally related to foreign security transactions and income translations.
Foreign currency-denominated assets and forward currency contracts may involve more risks than domestic transactions, including currency risk, counterparty risk, political and economic risk, regulatory risk and equity risk. Risks may arise from unanticipated movements in the value of foreign currencies relative to the U.S. dollar.
Dividends and Distributions
The Fund generally declares and distributes dividends of net investment income and realized capital gains (if any) annually. The Fund may treat a portion of the amount paid to redeem shares as a distribution of investment company taxable income and realized capital gains that are reflected in the net asset value. This practice, commonly referred to as “equalization,” has no effect on the redeeming shareholder or a Fund’s total return, but may reduce the amounts that would otherwise be required to be paid as taxable dividends to the remaining shareholders. It is possible that the Internal Revenue Service (IRS) could challenge the Fund's equalization methodology or calculations, and any such challenge could result in additional tax, interest, or penalties to be paid by the Fund.
The Fund may make certain investments in real estate investment trusts (“REITs”) which pay dividends to their shareholders based upon funds available from operations. It is quite common for these dividends to exceed the REITs’ taxable earnings and profits, resulting in the excess portion of such dividends being designated as a return of capital. If the Fund distributes such amounts, such distributions could constitute a return of capital to shareholders for federal income tax purposes.
Federal Income Taxes
The Fund intends to continue to qualify as a regulated investment company and distribute all of its taxable income in accordance with the requirements of Subchapter M of the Internal Revenue Code. Management has analyzed the Fund’s tax positions taken for all open federal income tax years, generally a three-year period, and has concluded that no provision for federal income tax is required in the Fund’s financial statements. The Fund is not aware of any tax positions for which it is reasonably possible that the total amounts of unrecognized tax benefits will significantly change in the next twelve months.
2. Other Investments and Strategies
Additional Investment Risk
The U.S. government and the Federal Reserve, as well as certain foreign governments and central banks, have taken extraordinary actions to support local and global economies and the financial markets in response to the COVID-19 pandemic. This and other government intervention into the economy and financial markets to address the COVID-19 pandemic may not work as intended, particularly if the efforts are perceived by investors as being unlikely to achieve the desired results. Government actions to mitigate the economic impact of the pandemic have resulted in a large expansion of government deficits and debt, the long term consequences of which are not known. The COVID-19 pandemic could adversely affect the value and liquidity of a Fund’s investments, impair a Fund’s ability to satisfy redemption requests, and negatively impact a Fund’s performance. In addition, the outbreak of COVID-19, and measures taken to mitigate its effects, could result in disruptions to the services provided to a Fund by its service providers.
Widespread disease, including pandemics and epidemics, and natural or environmental disasters, including those which may be attributable to global climate change, such as earthquakes, fires, floods, hurricanes, tsunamis and weather-related phenomena generally, have been and can be highly disruptive to economies and markets, adversely impacting individual companies, sectors, industries, markets, currencies, interest and inflation rates, credit ratings, investor sentiment, and other factors affecting the value of a Fund’s investments. Economies and financial markets throughout the world have become increasingly interconnected, which increases the likelihood that events or conditions in one
Janus Henderson Global Technology and Innovation Fund
Notes to Financial Statements (unaudited)
region or country will adversely affect markets or issuers in other regions or countries, including the United States. These disruptions could prevent a Fund from executing advantageous investment decisions in a timely manner and negatively impact a Fund’s ability to achieve its investment objective(s). Any such event(s) could have a significant adverse impact on the value of a Fund. In addition, these disruptions could also impair the information technology and other operational systems upon which the Fund’s service providers, including the Adviser or the subadviser (as applicable), rely, and could otherwise disrupt the ability of employees of the Fund’s service providers to perform essential tasks on behalf of the Fund. Adverse weather conditions may also have a particularly significant negative effect on issuers in the agricultural sector and on insurance and reinsurance companies that insure or reinsure against the impact of natural disasters.
A number of countries in the European Union (the “EU”) have experienced, and may continue to experience, severe economic and financial difficulties. In particular, many EU nations are susceptible to economic risks associated with high levels of debt. Many non-governmental issuers, and even certain governments, have defaulted on, or been forced to restructure, their debts. Many other issuers have faced difficulties obtaining credit or refinancing existing obligations. Financial institutions have in many cases required government or central bank support, have needed to raise capital, and/or have been impaired in their ability to extend credit. As a result, financial markets in the EU have experienced extreme volatility and declines in asset values and liquidity. These difficulties may continue, worsen, or spread further within the EU. Responses to these financial problems by European governments, central banks, and others, including austerity measures and reforms, may not work, may result in social unrest, and may limit future growth and economic recovery or have other unintended consequences. Among other things, these developments have adversely affected the value and exchange rate of the euro and pound sterling, and may continue to significantly affect the economies of all EU countries, which in turn may have a material adverse effect on the Fund’s investments in such countries, other countries that depend on EU countries for significant amounts of trade or investment, or issuers with exposure to debt issued by certain EU countries.
Real Estate Investing
The Fund may invest in equity and debt securities of real estate-related companies. Such companies may include those in the real estate industry or real estate-related industries. These securities may include common stocks, corporate bonds, preferred stocks, and other equity securities, including, but not limited to, mortgage-backed securities, real estate-backed securities, securities of REITs and similar REIT-like entities. A REIT is a trust that invests in real estate-related projects, such as properties, mortgage loans, and construction loans. REITs are generally categorized as equity, mortgage, or hybrid REITs. A REIT may be listed on an exchange or traded OTC.
Restricted Security Transactions
Restricted securities held by the Fund may not be sold except in exempt transactions or in a public offering registered under the Securities Act of 1933, as amended. The risk of investing in such securities is generally greater than the risk of investing in the securities of widely held, publicly traded companies. Lack of a secondary market and resale restrictions may result in the inability of the Fund to sell a security at a fair price and may substantially delay the sale of the security. In addition, these securities may exhibit greater price volatility than securities for which secondary markets exist.
Counterparties
Fund transactions involving a counterparty are subject to the risk that the counterparty or a third party will not fulfill its obligation to the Fund (“counterparty risk”). Counterparty risk may arise because of the counterparty’s financial condition (i.e., financial difficulties, bankruptcy, or insolvency), market activities and developments, or other reasons, whether foreseen or not. A counterparty’s inability to fulfill its obligation may result in significant financial loss to the Fund. The Fund may be unable to recover its investment from the counterparty or may obtain a limited recovery, and/or recovery may be delayed. The extent of the Fund’s exposure to counterparty risk with respect to financial assets and liabilities approximates its carrying value. See the "Offsetting Assets and Liabilities" section of this Note for further details.
The Fund may be exposed to counterparty risk through participation in various programs, including, but not limited to, lending its securities to third parties, cash sweep arrangements whereby the Fund’s cash balance is invested in one or more types of cash management vehicles, as well as investments in, but not limited to, repurchase agreements, debt securities, and derivatives, including various types of swaps, futures and options. The Fund intends to enter into financial transactions with counterparties that the Adviser believes to be creditworthy at the time of the transaction. There is always the risk that the Adviser’s analysis of a counterparty’s creditworthiness is incorrect or may change due to market
Janus Henderson Global Technology and Innovation Fund
Notes to Financial Statements (unaudited)
conditions. To the extent that the Fund focuses its transactions with a limited number of counterparties, it will have greater exposure to the risks associated with one or more counterparties.
Securities Lending
Under procedures adopted by the Trustees, the Fund may seek to earn additional income by lending securities to certain qualified broker-dealers and institutions. JPMorgan Chase Bank, National Association acts as securities lending agent and a limited purpose custodian or subcustodian to receive and disburse cash balances and cash collateral, hold short-term investments, hold collateral, and perform other custodial functions in accordance with the Non-Custodial Securities Lending Agreement. For financial reporting purposes, the Fund does not offset financial instruments’ payables and receivables and related collateral on the Statement of Assets and Liabilities. The Fund may lend fund securities in an amount equal to up to 1/3 of its total assets as determined at the time of the loan origination. There is the risk of delay in recovering a loaned security or the risk of loss in collateral rights if the borrower fails financially. In addition, the Adviser makes efforts to balance the benefits and risks from granting such loans. All loans will be continuously secured by collateral which may consist of cash, U.S. Government securities, domestic and foreign short-term debt instruments, letters of credit, time deposits, repurchase agreements, money market mutual funds or other money market accounts, or such other collateral as permitted by the SEC. If the Fund is unable to recover a security on loan, the Fund may use the collateral to purchase replacement securities in the market. There is a risk that the value of the collateral could decrease below the cost of the replacement security by the time the replacement investment is made, resulting in a loss to the Fund. In certain circumstances individual loan transactions could yield negative returns.
Upon receipt of cash collateral, the Adviser may invest it in affiliated or non-affiliated cash management vehicles, whether registered or unregistered entities, as permitted by the 1940 Act and rules promulgated thereunder. The Adviser currently intends to primarily invest the cash collateral in a cash management vehicle for which the Adviser serves as investment adviser, Janus Henderson Cash Collateral Fund LLC, or in time deposits. An investment in Janus Henderson Cash Collateral Fund LLC is generally subject to the same risks that shareholders experience when investing in similarly structured vehicles, such as the potential for significant fluctuations in assets as a result of the purchase and redemption activity of the securities lending program, a decline in the value of the collateral, and possible liquidity issues. Such risks may delay the return of the cash collateral and cause the Fund to violate its agreement to return the cash collateral to a borrower in a timely manner. As adviser to the Fund and Janus Henderson Cash Collateral Fund LLC, the Adviser has an inherent conflict of interest as a result of its fiduciary duties to both the Fund and Janus Henderson Cash Collateral Fund LLC. Additionally, the Adviser receives an investment advisory fee of 0.05% for managing Janus Henderson Cash Collateral Fund LLC, but it may not receive a fee for managing certain other affiliated cash management vehicles in which the Fund may invest, and therefore may have an incentive to allocate preferred investment opportunities to investment vehicles for which it is receiving a fee.
The value of the collateral must be at least 102% of the market value of the loaned securities that are denominated in U.S. dollars and 105% of the market value of the loaned securities that are not denominated in U.S. dollars. Loaned securities and related collateral are marked-to-market each business day based upon the market value of the loaned securities at the close of business, employing the most recent available pricing information. Collateral levels are then adjusted based on this mark-to-market evaluation. Additional required collateral, or excess collateral returned, is delivered on the next business day. Therefore, the value of the collateral held may be temporarily less than 102% or 105% value of the securities on loan. The cash collateral invested by the Adviser is disclosed in the Schedule of Investments (if applicable).
Income earned from the investment of the cash collateral, net of rebates paid to, or fees paid by, borrowers and less the fees paid to the lending agent are included as “Affiliated securities lending income, net” on the Statement of Operations. As of March 31, 2023, securities lending transactions accounted for as secured borrowings with an overnight and continuous contractual maturity are $50,769,311. Gross amounts of recognized liabilities for securities lending (collateral received) as of March 31, 2023 is $52,168,050, resulting in the net amount due to the counterparty of $1,398,739.
Offsetting Assets and Liabilities
The Fund presents gross and net information about transactions that are either offset in the financial statements or subject to an enforceable master netting arrangement or similar agreement with a designated counterparty, regardless of whether the transactions are actually offset in the Statement of Assets and Liabilities.
Janus Henderson Global Technology and Innovation Fund
Notes to Financial Statements (unaudited)
The Offsetting Assets and Liabilities table located in the Schedule of Investments presents gross amounts of recognized assets and/or liabilities and the net amounts after deducting collateral that has been pledged by counterparties or has been pledged to counterparties (if applicable). For corresponding information grouped by type of instrument, see the Fund's Schedule of Investments.
3. Investment Advisory Agreements and Other Transactions with Affiliates
The Fund pays the Adviser an investment advisory fee which is calculated daily and paid monthly. The Fund’s contractual investment advisory fee rate (expressed as an annual rate) is 0.64% of its average daily net assets.
The Adviser has contractually agreed to waive the investment advisory fee and/or reimburse operating expenses to the extent that the Fund’s total annual fund operating expenses, excluding the fees payable pursuant to a Rule 12b-1 plan, shareholder servicing fees, such as transfer agency fees (including out-of-pocket costs), administrative services fees and any networking/omnibus payable by any share class, brokerage commissions, interest, dividends, taxes, acquired fund fees and expenses, and extraordinary expenses, exceed the annual rate of 0.71% of the Fund’s average daily net assets. The Adviser has agreed to continue the waivers for at least a one-year period commencing January 27, 2023. If applicable, amounts waived and/or reimbursed to the Fund by the Adviser are disclosed as “Excess Expense Reimbursement and Waivers” on the Statement of Operations.
The Adviser serves as administrator to the Fund pursuant to an administration agreement between the Adviser and the Trust. Under the administration agreement, the Adviser is authorized to perform, or cause others to perform certain administration, compliance, and accounting services to the Fund, including providing office space for the Fund, and is reimbursed by the Fund for certain of its costs in providing these services (to the extent the Adviser seeks reimbursement and such costs are not otherwise waived). In addition, employees of the Adviser and/or its affiliates may serve as officers of the Trust. The Fund pays for some or all of the salaries, fees, and expenses of the Adviser employees and Fund officers, with respect to certain specified administration functions they perform on behalf of the Fund. The Fund pays these costs based on out-of-pocket expenses incurred by the Adviser, and these costs are separate and apart from advisory fees and other expenses paid in connection with the investment advisory services the Adviser (or any subadvisor, as applicable) provides to the Fund. These amounts are disclosed as “Affiliated fund administration fees” on the Statement of Operations. In addition, some expenses related to compensation payable to the Fund’s Chief Compliance Officer and certain compliance staff, all of whom are employees of the Adviser and/or its affiliates, are shared with the Fund. Total compensation of $114,430 was paid to the Chief Compliance Officer and certain compliance staff by the Trust during the period ended March 31, 2023. The Fund's portion is reported as part of “Other expenses” on the Statement of Operations.
Janus Henderson Services US LLC (the “Transfer Agent”), a wholly-owned subsidiary of the Adviser, is the Fund’s transfer agent. The Transfer Agent provides or arranges for the provision of shareholder services including, but not limited to, recordkeeping, subaccounting, answering inquiries regarding accounts, order processing, transaction confirmations, the mailing of prospectuses and shareholder reports, and other shareholder services provided to or on behalf of shareholders. These amounts are disclosed as “Transfer agent administrative fees and expenses” on the Statement of Operations.
Class D Shares of the Fund pay the Transfer Agent an annual administrative services fee based on the average daily net assets of Class D Shares as detailed below.
| | |
Average Daily Net Assets of Class D Shares of the Janus Henderson funds | Administrative Services Fee |
Under $40 billion | 0.12% |
$40 billion – $49.9 billion | 0.10% |
Over $49.9 billion | 0.08% |
During the reporting period, the administrative services fee rate was 0.12%.
The Transfer Agent receives an administrative services fee at an annual rate of up to 0.25% of the average daily net assets of the Fund’s Class S Shares and Class T Shares for providing or procuring administrative services to investors in Class S Shares and Class T Shares of the Fund. The Transfer Agent expects to use all or a significant portion of this fee to compensate retirement plan service providers, broker-dealers, bank trust departments, financial advisors, and other financial intermediaries for providing these services. The Transfer Agent may keep certain amounts retained for reimbursement of out-of-pocket costs incurred for servicing clients of Class S Shares and Class T Shares.
Janus Henderson Global Technology and Innovation Fund
Notes to Financial Statements (unaudited)
Shareholder Services provided by these financial intermediaries may include, but are not limited to, recordkeeping, subaccounting, order processing, providing order confirmations, periodic statements, forwarding prospectuses, shareholder reports, and other materials to existing customers, answering inquiries regarding accounts, and other administrative services. Order processing includes the submission of transactions through the National Securities Clearing Corporation (“NSCC”) or similar systems, or those processed on a manual basis with the Adviser. For all share classes, the Transfer Agent also seeks reimbursement for costs it incurs as transfer agent and for providing servicing.
Certain, but not all, intermediaries may charge administrative fees to investors in Class A Shares, Class C Shares, and Class I Shares for administrative services provided on behalf of such investors. These administrative fees are paid by the Class A Shares, Class C Shares, and Class I Shares of the Fund to the Transfer Agent, which uses such fees to reimburse intermediaries. Consistent with the Transfer Agency Agreement between the Transfer Agent and the Fund, the Transfer Agent may negotiate the level, structure, and/or terms of the administrative fees with intermediaries requiring such fees on behalf of the Fund. The Adviser and its affiliates benefit from an increase in assets that may result from such relationships. The Adviser has agreed to limit these fees up to 0.20% for Class A Shares and Class C Shares, and up to 0.15% for Class I Shares on an annual basis based on the daily net assets of each share class. Such limits are subject to change by the Trustees in the future. These amounts are disclosed as “Transfer agent networking and omnibus fees” on the Statement of Operations.
The Transfer Agent is not compensated for its services related to the shares, except for out-of-pocket costs, although the Transfer Agent is compensated for its services related to Fund’s Class D Shares. These amounts are disclosed as “Other transfer agent fees and expenses” on the Statement of Operations.
Under distribution and shareholder servicing plans (the “Plans”) adopted in accordance with Rule 12b-1 under the 1940 Act, the Fund pays the Trust’s distributor, the Distributor, a wholly-owned subsidiary of the Adviser, a fee for the sale and distribution and/or shareholder servicing of the shares based on the average daily net assets for each share class at an annual rate of up to 0.25% for Class A Shares, up to 1.00% for Class C Shares, and up to 0.25% for Class S Shares. Under the terms of the Plans, the Trust is authorized to make payments to the Distributor for remittance to retirement plan service providers, broker-dealers, bank trust departments, financial advisors, and other financial intermediaries, as compensation for distribution and/or shareholder services performed by such entities for their customers who are investors in the Fund. These amounts are disclosed as “12b-1 Distribution and shareholder servicing fees” on the Statement of Operations.
Class A Shares include a 5.75% upfront sales charge of the offering price of the Fund. The sales charge is allocated between the Distributor and financial intermediaries. During the period ended March 31, 2023, the Distributor retained upfront sales charges of $8,263.
A contingent deferred sales charge (“CDSC”) of 1.00% will be deducted with respect to Class A Shares purchased without a sales load and redeemed within 12 months of purchase, unless waived. Any applicable CDSC will be 1.00% of the lesser of the original purchase price or the value of the redemption of the Class A Shares redeemed. There were no CDSCs paid by redeeming shareholders of Class A Shares to the Distributor during the period ended March 31, 2023.
A CDSC of 1.00% will be deducted with respect to Class C Shares redeemed within 12 months of purchase, unless waived. Any applicable CDSC will be 1.00% of the lesser of the original purchase price or the value of the redemption of the Class C Shares redeemed. During the period ended March 31, 2023, redeeming shareholders of Class C Shares paid CDSCs of $2,120.
The Board of Trustees has adopted a deferred compensation plan (the “Deferred Plan”) for independent Trustees to elect to defer receipt of all or a portion of the annual compensation they are entitled to receive from the Fund. All deferred fees are credited to an account established in the name of the Trustees. The amounts credited to the account then increase or decrease, as the case may be, in accordance with the performance of one or more of the Janus Henderson funds that are selected by the Trustees. The account balance continues to fluctuate in accordance with the performance of the selected fund or funds until final payment of all amounts are credited to the account. The fluctuation of the account balance is recorded by the Fund as unrealized appreciation/(depreciation) and is included as of March 31, 2023 on the Statement of Assets and Liabilities in the asset, “Trustees’ deferred compensation,” and liability, “Trustees’ deferred compensation fees.” Additionally, the recorded unrealized appreciation/(depreciation) is included in “Total distributable earnings (loss)” on the Statement of Assets and Liabilities. Deferred compensation expenses for the period ended March 31, 2023 are included in “Trustees’ fees and expenses” on the Statement of Operations. Trustees
Janus Henderson Global Technology and Innovation Fund
Notes to Financial Statements (unaudited)
are allowed to change their designation of mutual funds from time to time. Amounts will be deferred until distributed in accordance with the Deferred Plan. Deferred fees of $205,688 were paid by the Trust to the Trustees under the Deferred Plan during the period ended March 31, 2023.
Pursuant to the provisions of the 1940 Act and related rules, the Fund may participate in an affiliated or non-affiliated cash sweep program. In the cash sweep program, uninvested cash balances of the Fund may be used to purchase shares of affiliated or non-affiliated money market funds or cash management pooled investment vehicles that operate as money market funds. The Fund is eligible to participate in the cash sweep program (the “Investing Funds”). The Adviser has an inherent conflict of interest because of its fiduciary duties to the affiliated money market funds or cash management pooled investment vehicles and the Investing Funds. Janus Henderson Cash Liquidity Fund LLC (the “Sweep Vehicle”) is an affiliated unregistered cash management pooled investment vehicle that invests primarily in highly-rated short-term fixed-income securities. The Sweep Vehicle operates pursuant to the provisions of the 1940 Act that govern the operation of money market funds and prices its shares at NAV reflecting market-based values of its portfolio securities (i.e., a “floating” NAV) rounded to the fourth decimal place (e.g., $1.0000). The Sweep Vehicle is permitted to impose a liquidity fee (of up to 2%) on redemptions from the Sweep Vehicle or a redemption gate that temporarily suspends redemptions from the Sweep Vehicle for up to 10 business days during a 90 day period. There are no restrictions on the Fund's ability to withdraw investments from the Sweep Vehicle at will, and there are no unfunded capital commitments due from the Fund to the Sweep Vehicle. The Sweep Vehicle does not charge any management fee, sales charge or service fee.
Any purchases and sales, realized gains/losses and recorded dividends from affiliated investments during the period ended March 31, 2023 can be found in the “Schedules of Affiliated Investments” located in the Schedule of Investments.
The Fund is permitted to purchase or sell securities (“cross-trade”) between itself and other funds or accounts managed by the Adviser in accordance with Rule 17a-7 under the Investment Company Act of 1940 (“Rule 17a-7”), when the transaction is consistent with the investment objectives and policies of the Fund and in accordance with the Internal Cross Trade Procedures adopted by the Trust’s Board of Trustees. These procedures have been designed to ensure that any cross-trade of securities by the Fund from or to another fund or account that is or could be considered an affiliate of the Fund under certain limited circumstances by virtue of having a common investment adviser, common Officer, or common Trustee complies with Rule 17a-7. Under these procedures, each cross-trade is effected at the current market price to save costs where allowed. During the period ended March 31, 2023, the Fund engaged in cross trades amounting to $6,549,218 in purchases.
4. Federal Income Tax
Income and capital gains distributions are determined in accordance with income tax regulations that may differ from US GAAP. These differences are due to differing treatments for items such as net short-term gains, deferral of wash sale losses, foreign currency transactions, net investment losses, and capital loss carryovers.
The Fund has elected to treat gains and losses on forward foreign currency contracts as capital gains and losses, if applicable. Other foreign currency gains and losses on debt instruments are treated as ordinary income for federal income tax purposes pursuant to Section 988 of the Internal Revenue Code.
The aggregate cost of investments and the composition of unrealized appreciation and depreciation of investment securities for federal income tax purposes as of March 31, 2023 are noted below. The primary differences between book and tax appreciation or depreciation of investments are wash sale loss deferrals, investments in partnerships, and investments in passive foreign investment companies.
| | | | |
Federal Tax Cost | Unrealized
Appreciation | Unrealized
(Depreciation) | Net Tax Appreciation/
(Depreciation) |
$3,104,412,261 | $1,685,204,138 | $(143,885,232) | $1,541,318,906 |
Janus Henderson Global Technology and Innovation Fund
Notes to Financial Statements (unaudited)
5. Capital Share Transactions
| | | | | | | |
| | | | | | |
| | Period ended March 31, 2023 | | Year ended September 30, 2022 |
| | Shares | Amount | | Shares | Amount |
| | | | | | | |
Class A Shares: | | | | | |
Shares sold | 184,632 | $ 6,483,361 | | 877,413 | $ 39,900,994 |
Reinvested dividends and distributions | - | - | | 785,445 | 39,554,989 |
Shares repurchased | (834,160) | (28,558,873) | | (1,285,642) | (55,887,939) |
Net Increase/(Decrease) | (649,528) | $(22,075,512) | | 377,216 | $ 23,568,044 |
Class C Shares: | | | | | |
Shares sold | 75,253 | $ 2,240,615 | | 226,192 | $ 8,952,475 |
Reinvested dividends and distributions | - | - | | 359,888 | 15,435,591 |
Shares repurchased | (326,002) | (9,402,832) | | (662,056) | (24,003,417) |
Net Increase/(Decrease) | (250,749) | $ (7,162,217) | | (75,976) | $ 384,649 |
Class D Shares: | | | | | |
Shares sold | 1,235,416 | $ 46,047,237 | | 3,599,506 | $171,960,826 |
Reinvested dividends and distributions | - | - | | 8,016,491 | 419,182,331 |
Shares repurchased | (2,897,867) | (103,592,544) | | (6,992,723) | (314,829,133) |
Net Increase/(Decrease) | (1,662,451) | $(57,545,307) | | 4,623,274 | $276,314,024 |
Class I Shares: | | | | | |
Shares sold | 2,425,244 | $ 87,677,840 | | 7,091,813 | $326,578,396 |
Reinvested dividends and distributions | - | - | | 2,866,657 | 151,760,832 |
Shares repurchased | (4,418,746) | (161,937,381) | | (9,846,435) | (446,888,002) |
Net Increase/(Decrease) | (1,993,502) | $(74,259,541) | | 112,035 | $ 31,451,226 |
Class N Shares: | | | | | |
Shares sold | 784,420 | $ 28,134,550 | | 1,255,721 | $ 59,650,746 |
Reinvested dividends and distributions | - | - | | 493,570 | 25,779,168 |
Shares repurchased | (789,440) | (28,397,913) | | (1,116,408) | (50,732,608) |
Net Increase/(Decrease) | (5,020) | $ (263,363) | | 632,883 | $ 34,697,306 |
Class S Shares: | | | | | |
Shares sold | 103,074 | $ 3,519,086 | | 312,563 | $ 16,857,268 |
Reinvested dividends and distributions | - | - | | 107,615 | 5,259,139 |
Shares repurchased | (110,869) | (3,713,795) | | (301,224) | (13,270,266) |
Net Increase/(Decrease) | (7,795) | $ (194,709) | | 118,954 | $ 8,846,141 |
Class T Shares: | | | | | |
Shares sold | 1,256,569 | $ 45,656,236 | | 3,854,873 | $184,777,506 |
Reinvested dividends and distributions | - | - | | 5,264,764 | 272,188,274 |
Shares repurchased | (3,821,366) | (134,133,720) | | (9,232,493) | (417,339,536) |
Net Increase/(Decrease) | (2,564,797) | $(88,477,484) | | (112,856) | $ 39,626,244 |
6. Purchases and Sales of Investment Securities
For the period ended March 31, 2023, the aggregate cost of purchases and proceeds from sales of investment securities (excluding any short-term securities, short-term options contracts, TBAs, and in-kind transactions, as applicable) was as follows:
| | | | |
Purchases of
Securities | Proceeds from Sales
of Securities | Purchases of Long-
Term U.S. Government
Obligations | Proceeds from Sales
of Long-Term U.S.
Government Obligations |
$893,978,214 | $995,084,223 | $ - | $ - |
Janus Henderson Global Technology and Innovation Fund
Notes to Financial Statements (unaudited)
7. Recent Accounting Pronouncements
The FASB issued Accounting Standards Update 2022-03: Fair Value Measurement of Equity Securities Subject to Contractual Sale Restrictions (“ASU 2022-03”) in June 2022. The new guidance in the ASU clarifies existing guidance in ASC 820 related to the fair value measurement of an equity security subject to contractual sale restrictions with the intent to reduce diversity in interpretation. Under the guidance, a contractual restriction on the sale of an equity security would not be considered when measuring fair value as such restriction is not treated as part of the equity security’s unit of account. The amendments would be applied prospectively on or after adoption date to equity securities with a contract containing a sale restriction that is executed or modified after such date. The effective date set by the FASB is December 15, 2023, with early adoption permitted. The Adviser is currently evaluating whether to early adopt and does not anticipate it to have a material impact on the Fund.
8. Subsequent Event
Management has evaluated whether any events or transactions occurred subsequent to March 31, 2023 and through the date of issuance of the Fund’s financial statements and determined that there were no material events or transactions that would require recognition or disclosure in the Fund’s financial statements.
Janus Henderson Global Technology and Innovation Fund
Additional Information (unaudited)
Proxy Voting Policies and Voting Record
A description of the policies and procedures that the Fund uses to determine how to vote proxies relating to its portfolio securities is available without charge: (i) upon request, by calling 1-800-525-1093; (ii) on the Fund’s website at janushenderson.com/proxyvoting; and (iii) on the SEC’s website at http://www.sec.gov. Additionally, information regarding the Fund’s proxy voting record for the most recent twelve-month period ended June 30 is also available, free of charge, through janushenderson.com/proxyvoting and from the SEC’s website at http://www.sec.gov.
Full Holdings
The Fund files its complete portfolio holdings (schedule of investments) with the SEC as an exhibit to Form N-PORT within 60 days of the end of the first and third fiscal quarters, and in the annual report and semiannual report to shareholders. The Fund’s Form N-PORT filings and annual and semiannual reports: (i) are available on the SEC’s website at http://www.sec.gov; and (ii) are available without charge, upon request, by calling a Janus Henderson representative at 1-877-335-2687 (toll free) (or 1-800-525-3713 if you hold Class D Shares). Portfolio holdings consisting of at least the names of the holdings are generally available on a monthly basis with a 30-day lag under Full Holdings for the Fund at janushenderson.com/info (or janushenderson.com/reports if you hold Class D Shares).
APPROVAL OF ADVISORY AGREEMENTS DURING THE PERIOD
The Trustees of Janus Aspen Series, each of whom serves as an “independent” Trustee (the “Trustees”), oversee the management of each portfolio of Janus Aspen Series (each, a “VIT Portfolio,” and collectively, the “VIT Portfolios”), as well as each fund of Janus Investment Fund (each, a “Fund,” and collectively, the “Funds” and together with the VIT Portfolios, the “Janus Henderson Funds,” and each, a “Janus Henderson Fund”). As required by law, the Trustees determine annually whether to continue the investment advisory agreement for each Janus Henderson Fund.
In connection with their most recent consideration of those agreements for each Janus Henderson Fund, the Trustees received and reviewed information provided by Janus Henderson Investors US LLC (the “Adviser”) in response to requests of the Trustees and their independent legal counsel. They also received and reviewed information and analysis provided by, and in response to requests of, their independent fee consultant. Throughout their consideration of the agreements, the Trustees were advised by their independent legal counsel. The Trustees met with management to consider the agreements, and also met separately in executive session with their independent legal counsel and their independent fee consultant.
At meetings held on November 9-10, 2022 and December 13-14, 2022, the Trustees evaluated the information provided by the Adviser and the independent fee consultant, as well as other information provided by the Adviser and the independent fee consultant during the year. Following such evaluation, the Trustees determined that the overall arrangements between each Janus Henderson Fund and the Adviser were fair and reasonable in light of the nature, extent, and quality of the services provided by the Adviser and its affiliates, the fees charged for those services, and other matters that the Trustees considered relevant in the exercise of their business judgment, and unanimously approved the continuation of the investment advisory agreement for each Janus Henderson Fund for the period from February 1, 2023 through February 1, 2024, subject to earlier termination as provided for in each agreement.
In considering the continuation of those agreements, the Trustees reviewed and analyzed various factors that they determined were relevant, including the factors described below, none of which by itself was considered dispositive. However, the material factors and conclusions that formed the basis for the Trustees’ determination to approve the continuation of the agreements are discussed separately below. Also included is a summary of the independent fee consultant’s conclusions and opinions that arose during, and were included as part of, the Trustees’ consideration of the agreements. “Management fees,” as used herein, reflect actual annual advisory fees and, for the purpose of peer comparisons any administration fees (excluding out of pocket costs), net of any waivers, paid by a fund as a percentage of average net assets.
Nature, Extent and Quality of Services
The Trustees reviewed the nature, extent, and quality of the services provided by the Adviser to the Janus Henderson Funds, taking into account the investment objective, strategies, and policies of each Janus Henderson Fund, and the knowledge the Trustees gained from their regular meetings with management on at least a quarterly basis and their ongoing review of information related to the Janus Henderson Funds. In addition, the Trustees reviewed the resources and key personnel of the Adviser, particularly noting those employees who provide investment and risk management services to the Janus Henderson Funds. The Trustees also considered other services provided to the Janus Henderson
Janus Henderson Global Technology and Innovation Fund
Additional Information (unaudited)
Funds by the Adviser, such as managing the execution of portfolio transactions and the selection of broker-dealers for those transactions. The Trustees considered the Adviser’s role as administrator to the Janus Henderson Funds, noting that the Adviser generally does not receive a fee for its services as administrator, but is reimbursed for its out-of-pocket costs. The Trustees considered the role of the Adviser in monitoring adherence to the Janus Henderson Funds’ investment restrictions, providing support services for the Trustees and Trustee committees, and overseeing communications with Janus Henderson Fund shareholders and the activities of other service providers, including monitoring compliance with various policies and procedures of the Janus Henderson Funds and with applicable securities laws and regulations.
In this regard, the independent fee consultant noted that the Adviser provides a number of different services for the Janus Henderson Funds and their shareholders, ranging from investment management services to various other servicing functions, and that, in its view, the Adviser is a capable provider of those services. The independent fee consultant also provided its belief that the Adviser has developed a number of institutional competitive advantages that should enable it to provide superior investment and service performance over the long term.
The Trustees concluded that the nature, extent, and quality of the services provided by the Adviser to each Janus Henderson Fund were appropriate and consistent with the terms of the respective advisory agreements, and that, taking into account steps taken to address those Janus Henderson Funds whose performance lagged that of their peers for certain periods, the Janus Henderson Funds were likely to benefit from the continued provision of those services. They also concluded that the Adviser had sufficient personnel, with the appropriate education and experience, to serve the Janus Henderson Funds effectively and had demonstrated its ability to attract well-qualified personnel.
Performance of the Funds
The Trustees considered the performance results of each Janus Henderson Fund over various time periods. They noted that they considered Janus Henderson Fund performance data throughout the year, including periodic meetings with each Janus Henderson Fund’s portfolio manager(s), and also reviewed information comparing each Janus Henderson Fund’s performance with the performance of comparable fund peer groups identified by Broadridge Financial Solutions, Inc. (“Broadridge”), an independent data provider, and with the Janus Henderson Fund’s benchmark index. In this regard, the independent fee consultant found that the overall Janus Henderson Funds’ performance has been reasonable, noting that: (i) for the 36 months ended May 31, 2022, approximately 38% of the Janus Henderson Funds were in the top two quartiles of their Broadridge peer groups; (ii) for the 36 months ended September 30, 2022, approximately 45% of the Janus Henderson Funds were in the top two quartiles of performance as reported by Morningstar, and (iii) for the 12 months ended September 30, 2022, approximately 55% of the Janus Henderson Funds were in the top two quartiles of performance as reported by Morningstar.
The Trustees considered the performance of each Janus Henderson Fund, noting that performance may vary by share class, and noted the following with respect to the Funds:
Asset Allocation Funds
· For Janus Henderson Global Allocation Fund – Conservative, the Trustees noted that the Fund’s performance was in the third Broadridge quartile for the 36 months ended May 31, 2022 and the bottom Broadridge quartile for the 12 months ended May 31, 2022. The Trustees noted the reasons for the Fund’s underperformance and the steps the Adviser had taken or was taking to improve performance.
· For Janus Henderson Global Allocation Fund – Growth, the Trustees noted that the Fund’s performance was in the bottom Broadridge quartile for the 36 months ended May 31, 2022 and the bottom Broadridge quartile for the 12 months ended May 31, 2022. The Trustees noted the reasons for the Fund’s underperformance and the steps the Adviser had taken or was taking to improve performance.
· For Janus Henderson Global Allocation Fund – Moderate, the Trustees noted that the Fund’s performance was in the bottom Broadridge quartile for the 36 months ended May 31, 2022 and the bottom Broadridge quartile for the 12 months ended May 31, 2022. The Trustees noted the reasons for the Fund’s underperformance and the steps the Adviser had taken or was taking to improve performance.
Fixed-Income Funds
· For Janus Henderson Absolute Return Income Opportunities Fund, the Trustees noted that the Fund’s performance was in the third Broadridge quartile for the 36 months ended May 31, 2022 and the first Broadridge quartile for the 12 months ended May 31, 2022. The Trustees noted the reasons for the Fund’s underperformance,
Janus Henderson Global Technology and Innovation Fund
Additional Information (unaudited)
the steps the Adviser had taken or was taking to improve performance, and that the performance trend was improving.
· For Janus Developed World Bond Fund, the Trustees noted that the Fund’s performance was in the bottom Broadridge quartile for the 36 months ended May 31, 2022 and the bottom Broadridge quartile for the 12 months ended May 31, 2022. The Trustees noted the reasons for the Fund’s underperformance and the steps the Adviser had taken or was taking to improve performance.
· For Janus Henderson Flexible Bond Fund, the Trustees noted that the Fund’s performance was in the first Broadridge quartile for the 36 months ended May 31, 2022 and the second Broadridge quartile for the 12 months ended May 31, 2022.
· For Janus Henderson Global Bond Fund, the Trustees noted that the Fund’s performance was in the third Broadridge quartile for the 36 months ended May 31, 2022 and the bottom Broadridge quartile for the 12 months ended May 31, 2022. The Trustees noted the reasons for the Fund’s underperformance and the steps the Adviser had taken or was taking to improve performance.
· For Janus Henderson High-Yield Fund, the Trustees noted that the Fund’s performance was in the third Broadridge quartile for the 36 months ended May 31, 2022 and the bottom Broadridge quartile for the 12 months ended May 31, 2022. The Trustees noted the reasons for the Fund’s underperformance and the steps the Adviser had taken or was taking to improve performance.
· For Janus Henderson Multi-Sector Income Fund, the Trustees noted that the Fund’s performance was in the second Broadridge quartile for the 36 months ended May 31, 2022 and the third Broadridge quartile for the 12 months ended May 31, 2022.
· For Janus Henderson Short Duration Flexible Bond Fund, the Trustees noted that the Fund’s performance was in the third Broadridge quartile for the 36 months ended May 31, 2022 and the bottom Broadridge quartile for the 12 months ended May 31, 2022. The Trustees noted the reasons for the Fund’s underperformance and the steps the Adviser had taken or was taking to improve performance.
Global and International Equity Funds
· For Janus Henderson Asia Equity Fund, the Trustees noted that the Fund’s performance was in the third Broadridge quartile for the 36 months ended May 31, 2022 and the third Broadridge quartile for the 12 months ended May 31, 2022. The Trustees noted the reasons for the Fund’s underperformance, while also noting that the Fund has a performance fee structure that results in lower management fees during periods of underperformance, and the steps the Adviser had taken or was taking to improve performance.
· For Janus Henderson Emerging Markets Fund, the Trustees noted that the Fund’s performance was in the third Broadridge quartile for the 36 months ended May 31, 2022 and the third Broadridge quartile for the 12 months ended May 31, 2022. The Trustees noted the reasons for the Fund’s underperformance and the steps the Adviser had taken or was taking to improve performance.
· For Janus Henderson European Focus Fund, the Trustees noted that the Fund’s performance was in the first Broadridge quartile for the 36 months ended May 31, 2022 and the second Broadridge quartile for the 12 months ended May 31, 2022.
· For Janus Henderson Global Equity Income Fund, the Trustees noted that the Fund’s performance was in the third Broadridge quartile for the 36 months ended May 31, 2022 and the first Broadridge quartile for the 12 months ended May 31, 2022. The Trustees noted the reasons for the Fund’s underperformance, the steps the Adviser had taken or was taking to improve performance, and that the performance trend was improving.
· For Janus Henderson Global Life Sciences Fund, the Trustees noted that the Fund’s performance was in the third Broadridge quartile for the 36 months ended May 31, 2022 and the second Broadridge quartile for the 12 months ended May 31, 2022. The Trustees noted the reasons for the Fund’s underperformance, the steps the Adviser had taken or was taking to improve performance, and that the performance trend was improving.
· For Janus Henderson Global Sustainable Equity Fund, the Trustees noted that the Fund’s performance was in the second Broadridge quartile for the 12 months ended May 31, 2022. The Trustees noted that 36 month-end performance was not yet available.
Janus Henderson Global Technology and Innovation Fund
Additional Information (unaudited)
· For Janus Henderson Global Real Estate Fund, the Trustees noted that the Fund’s performance was in the second Broadridge quartile for the 36 months ended May 31, 2022 and the bottom Broadridge quartile for the 12 months ended May 31, 2022.
· For Janus Henderson Global Research Fund, the Trustees noted that the Fund’s performance was in the second Broadridge quartile for the 36 months ended May 31, 2022 and the first Broadridge quartile for the 12 months ended May 31, 2022.
· For Janus Henderson Global Select Fund, the Trustees noted that the Fund’s performance was in the first Broadridge quartile for the 36 months ended May 31, 2022 and the first Broadridge quartile for the 12 months ended May 31, 2022.
· For Janus Henderson Global Technology and Innovation Fund, the Trustees noted that the Fund’s performance was in the second Broadridge quartile for the 36 months ended May 31, 2022 and the second Broadridge quartile for the 12 months ended May 31, 2022.
· For Janus Henderson International Opportunities Fund, the Trustees noted that the Fund’s performance was in the bottom Broadridge quartile for the 36 months ended May 31, 2022 and the third Broadridge quartile for the 12 months ended May 31, 2022. The Trustees noted the reasons for the Fund’s underperformance and the steps the Adviser had taken or was taking to improve performance.
· For Janus Henderson Overseas Fund, the Trustees noted that the Fund’s performance was in the first Broadridge quartile for the 36 months ended May 31, 2022 and the first Broadridge quartile for the 12 months ended May 31, 2022.
· For Janus Henderson Responsible International Dividend Fund (formerly the Janus Henderson Dividend & Income Builder Fund), the Trustees noted that the Fund’s performance was in the bottom Broadridge quartile for the 36 months ended May 31, 2022 and the bottom Broadridge quartile for the 12 months ended May 31, 2022. The Trustees noted the reasons for the Fund’s underperformance and the steps the Adviser had taken or was taking to improve performance.
Money Market Funds
· For Janus Henderson Government Money Market Fund, the Trustees noted that the Fund’s performance was in the third Broadridge quartile for the 36 months ended May 31, 2022 and the bottom Broadridge quartile for the 12 months ended May 31, 2022. The Trustees noted the reasons for the Fund’s underperformance and the steps the Adviser had taken or was taking to improve performance.
· For Janus Henderson Money Market Fund, the Trustees noted that the Fund’s performance was in the third Broadridge quartile for the 36 months ended May 31, 2022 and the bottom Broadridge quartile for the 12 months ended May 31, 2022. The Trustees noted the reasons for the Fund’s underperformance and the steps the Adviser had taken or was taking to improve performance.
Multi-Asset Funds
· For Janus Henderson Adaptive Global Allocation Fund, the Trustees noted that the Fund’s performance was in bottom Broadridge quartile for the 36 months ended May 31, 2022 and the second Broadridge quartile for the 12 months ended May 31, 2022. The Trustees noted the reasons for the Fund’s underperformance, the steps the Adviser had taken or was taking to improve performance, and that the performance trend was improving.
· For Janus Henderson Balanced Fund, the Trustees noted that the Fund’s performance was in the first Broadridge quartile for the 36 months ended May 31, 2022 and the first Broadridge quartile for the 12 months ended May 31, 2022.
U.S. Equity Funds
· For Janus Henderson Adaptive Risk Managed U.S. Equity Fund, the Trustees noted that the Fund’s performance was in the bottom Broadridge quartile for the 36 months ended May 31, 2022 and the second Broadridge quartile for the 12 months ended May 31, 2022. The Trustees noted the reasons for the Fund’s underperformance, the steps the Adviser had taken or were taking to improve performance, and that the performance trend was improving.
Janus Henderson Global Technology and Innovation Fund
Additional Information (unaudited)
· For Janus Henderson Contrarian Fund, the Trustees noted that the Fund’s performance was in the first Broadridge quartile for the 36 months ended May 31, 2022 and the bottom Broadridge quartile for the 12 months ended May 31, 2022.
· For Janus Henderson Enterprise Fund, the Trustees noted that the Fund’s performance was in the second Broadridge quartile for the 36 months ended May 31, 2022 and the first Broadridge quartile for the 12 months ended May 31, 2022.
· For Janus Henderson Forty Fund, the Trustees noted that the Fund’s performance was in the third Broadridge quartile for the 36 months ended May 31, 2022 and the bottom Broadridge quartile for the 12 months ended May 31, 2022. The Trustees noted the reasons for the Fund’s underperformance and the steps the Adviser had taken or was taking to improve performance.
· For Janus Henderson Growth and Income Fund, the Trustees noted that the Fund’s performance was in the bottom Broadridge quartile for the 36 months ended May 31, 2022 and the first Broadridge quartile for the 12 months ended May 31, 2022. The Trustees noted the reasons for the Fund’s underperformance, the steps the Adviser had taken or was taking to improve performance, and that the performance trend was improving.
· For Janus Henderson Mid Cap Value Fund, the Trustees noted that the Fund’s performance was in the bottom Broadridge quartile for the 36 months ended May 31, 2022 and the second Broadridge quartile for the 12 months ended May 31, 2022. The Trustees noted the reasons for the Fund’s underperformance, while also noting that the Fund has a performance fee structure that results in lower management fees during periods of underperformance, the steps the Adviser had taken or was taking to improve performance, and that the performance trend was improving.
· For Janus Henderson Research Fund, the Trustees noted that the Fund’s performance was in the third Broadridge quartile for the 36 months ended May 31, 2022 and the third Broadridge quartile for the 12 months ended May 31, 2022. The Trustees noted the reasons for the Fund’s underperformance, while also noting that the Fund has a performance fee structure that results in lower management fees during periods of underperformance and the steps the Adviser had taken or was taking to improve performance.
· For Janus Henderson Small Cap Value Fund, the Trustees noted that the Fund’s performance was in the bottom Broadridge quartile for the 36 months ended May 31, 2022 and the second Broadridge quartile for the 12 months ended May 31, 2022. The Trustees noted the reasons for the Fund’s underperformance, while also noting that the Fund has a performance fee structure that results in lower management fees during periods of underperformance, the steps the Adviser had taken or was taking to improve performance, and that the performance trend was improving.
· For Janus Henderson Small-Mid Cap Value Fund, the Trustees noted that the Fund’s performance was in the bottom Broadridge quartile for the 36 months ended May 31, 2022 and the second Broadridge quartile for the 12 months ended May 31, 2022. The Trustees noted the reasons for the Fund’s underperformance, while also noting that the Fund has a performance fee structure that results in lower management fees during periods of underperformance, the steps the Adviser had taken or was taking to improve performance, and that the performance trend is improving.
· For Janus Henderson Triton Fund, the Trustees noted that the Fund’s performance was in the bottom Broadridge quartile for the 36 months ended May 31, 2022 and the second Broadridge quartile for the 12 months ended May 31, 2022. The Trustees noted the reasons for the Fund’s underperformance, the steps the Adviser had taken or was taking to improve performance, and that the performance trend was improving.
· For Janus Henderson Venture Fund, the Trustees noted that the Fund’s performance was in the bottom Broadridge quartile for the 36 months ended May 31, 2022 and the second Broadridge quartile for the 12 months ended May 31, 2022. The Trustees noted the reasons for the Fund’s underperformance, the steps the Adviser had taken or was taking to improve performance, and that the performance trend was improving.
In consideration of each Janus Henderson Fund’s performance, the Trustees concluded that, taking into account the factors relevant to performance, as well as other considerations, including steps taken to improve performance, as applicable, the Janus Henderson Fund’s performance warranted continuation of such Janus Henderson Fund’s investment advisory agreement.
Janus Henderson Global Technology and Innovation Fund
Additional Information (unaudited)
Costs of Services Provided
The Trustees examined information regarding the fees and expenses of each Janus Henderson Fund in comparison to similar information for other comparable funds as provided by Broadridge, an independent data provider. They also reviewed an analysis of that information provided by their independent fee consultant. The independent fee consultant provided its belief that the management fees charged by the Adviser to each of the Janus Henderson Funds under the current investment advisory and administration agreements are reasonable in relation to the services provided by the Adviser. The independent fee consultant found: (1) the total expenses and management fees of the Janus Henderson Funds to be reasonable relative to other comparable mutual funds; (2) the total expenses, on average, were 6% under the average total expenses of the respective Broadridge peer group; and (3) the management fees for the Janus Henderson Funds, on average, were 5% under the average management fees for the respective Broadridge peer group. The Trustees also considered the total expenses for each share class of each Janus Henderson Fund compared to the average total expenses for its Broadridge Expense Group and to average total expenses for its Broadridge Expense Universe.
For Janus Henderson Funds with three or more years of performance history, the independent fee consultant also performed a systematic “focus list” analysis of expenses which assessed fund fees in the context of fund performance being delivered. Based on this analysis, the independent fee consultant found that the combination of service quality/performance and expenses on these individual Janus Henderson Funds was reasonable in light of performance trends, performance histories, changes in portfolio management, relative average net asset levels, and the existence of performance fees, breakpoints, and/or expense waivers on such Janus Henderson Funds.
The Trustees considered the methodology used by the Adviser in determining compensation payable to portfolio managers, the competitive environment for investment management talent, and the competitive market for mutual funds in different distribution channels.
The Trustees also reviewed management fees charged by the Adviser to comparable separate account clients and to comparable non-affiliated funds subadvised by the Adviser (for which the Adviser provides only or primarily portfolio management services). Although in most instances subadvisory and separate account fee rates for various investment strategies were lower than management fee rates for Janus Henderson Funds having a similar strategy, the Trustees considered that the Adviser noted that, under the terms of the management agreements with the Janus Henderson Funds, the Adviser performs significant additional services for the Janus Henderson Funds that it does not provide to those other clients, including administration services, oversight of the Janus Henderson Funds’ other service providers, Trustee support, regulatory compliance and numerous other services, and that, in serving the Janus Henderson Funds, the Adviser assumes many legal risks and other costs that it does not assume in servicing its other clients. Moreover, the Trustees noted that the independent fee consultant found that: (1) the management fees the Adviser charges to the Janus Henderson Funds are reasonable in relation to the management fees the Adviser charges to funds subadvised by the Adviser and to the fees the Adviser charges to its institutional separate account clients; (2) these subadvised and institutional separate accounts have different service and infrastructure needs and operate in markets very different from the retail fund market; (3) Janus Henderson mutual fund investors enjoy reasonable fees relative to the fees charged in these other markets; and (4) as part of its 2022 review, 9 of 11 Janus Henderson Funds have lower management fees than similar funds subadvised by the Adviser. The Trustees noted that for the two Janus Henderson Funds that did not, management fees for each were under the average of its 15(c) peer group.
The Trustees considered the fees for each Janus Henderson Fund for its fiscal year ended in 2021 and noted the following with regard to each Janus Henderson Fund’s total expenses, net of applicable fee waivers (the Fund’s “total expenses”) as reflected in the comparative information provided by Broadridge:
Asset Allocation Funds
· For Janus Henderson Global Allocation Fund – Conservative, the Trustees noted that, although the Fund’s total expenses exceeded the peer group average for certain share classes, overall the Fund’s total expenses were reasonable. The Trustees also noted that the Adviser has contractually agreed to limit the Fund’s expenses.
· For Janus Henderson Global Allocation Fund – Growth, the Trustees noted that, although the Fund’s total expenses exceeded the peer group average for certain share classes, overall the Fund’s total expenses were reasonable. The Trustees also noted that the Adviser has contractually agreed to limit the Fund’s expenses, although this limit did not apply because the Fund’s total expenses as shown were below the applicable fee limit.
Janus Henderson Global Technology and Innovation Fund
Additional Information (unaudited)
· For Janus Henderson Global Allocation Fund – Moderate, the Trustees noted that, although the Fund’s total expenses exceeded the peer group average for one share class, overall the Fund’s total expenses were reasonable. The Trustees also noted that the Adviser has contractually agreed to limit the Fund’s expenses.
Fixed-Income Funds
· For Janus Henderson Absolute Return Income Opportunities Fund, the Trustees noted that, although the Fund’s total expenses exceeded the peer group average for certain share classes, overall the Fund’s total expenses were reasonable. The Trustees also noted that the Adviser has contractually agreed to limit the Fund’s expenses.
· For Janus Henderson Developed World Bond Fund, the Trustees noted that, although the Fund’s total expenses exceeded the peer group average for one share class, overall the Fund’s total expenses were reasonable. The Trustees also noted that the Adviser has contractually agreed to limit the Fund’s expenses.
· For Janus Henderson Flexible Bond Fund, the Trustees noted that, although the Fund’s total expenses exceeded the peer group average for certain share classes, overall the Fund’s total expenses were reasonable. The Trustees also noted that the Adviser has contractually agreed to limit the Fund’s expenses, although this limit did not apply because the Fund’s total expenses as shown were below the applicable fee limit.
· For Janus Henderson Global Bond Fund, the Trustees noted that, although the Fund’s total expenses exceeded the peer group average for certain share classes, overall the Fund’s total expenses were reasonable. The Trustees also noted that the Adviser has contractually agreed to limit the Fund’s expenses.
· For Janus Henderson High-Yield Fund, the Trustees noted that, although the Fund’s total expenses exceeded the peer group average for certain share classes, overall the Fund’s total expenses were reasonable. The Trustees also noted that the Adviser has contractually agreed to limit the Fund’s expenses.
· For Janus Henderson Multi-Sector Income Fund, the Trustees noted that, although the Fund’s total expenses exceeded the peer group average for certain share classes, overall the Fund’s total expenses were reasonable. The Trustees also noted that the Adviser has contractually agreed to limit the Fund’s expenses.
· For Janus Henderson Short Duration Flexible Bond Fund, the Trustees noted that, although the Fund’s total expenses exceeded the peer group average for certain share classes, overall the Fund’s total expenses were reasonable. The Trustees also noted that the Adviser has contractually agreed to limit the Fund’s expenses.
Global and International Equity Funds
· For Janus Henderson Asia Equity Fund, the Trustees noted that, although the Fund’s total expenses exceeded the peer group average for certain share classes, overall the Fund’s total expenses were reasonable. The Trustees also noted that the Adviser has contractually agreed to limit the Fund’s expenses.
· For Janus Henderson Emerging Markets Fund, the Trustees noted that, although the Fund’s total expenses exceeded the peer group average for certain share classes, overall the Fund’s total expenses were reasonable. The Trustees also noted that the Adviser has contractually agreed to limit the Fund’s expenses.
· For Janus Henderson European Focus Fund, the Trustees noted that, although the Fund’s total expenses exceeded the peer group average for one share class, overall the Fund’s expenses were reasonable. The Trustees also noted that the Adviser has contractually agreed to limit the Fund’s expenses.
· For Janus Henderson Global Equity Income Fund, the Trustees noted that, although the Fund’s total expenses exceeded the peer group average for one share class, overall the Fund’s total expenses were reasonable. The Trustees also noted that the Adviser has contractually agreed to limit the Fund’s expenses, although this limit did not apply because the Fund’s total expenses as shown were below the applicable fee limit.
· For Janus Henderson Global Life Sciences Fund, the Trustees noted that the Fund’s total expenses were below the peer group average for all share classes.
· For Janus Henderson Global Real Estate Fund, the Trustees noted that, although the Fund’s total expenses exceeded the peer group average for certain share classes, overall the Fund’s total expenses were reasonable. The Trustees also noted that the Adviser has contractually agreed to limit the Fund’s expenses, although this limit did not apply because the Fund’s total expenses as shown were below the applicable fee limit.
Janus Henderson Global Technology and Innovation Fund
Additional Information (unaudited)
· For Janus Henderson Global Research Fund, the Trustees noted that, although the Fund’s total expenses exceeded the peer group average for one share class, overall the Fund’s total expenses were reasonable. The Trustees also noted that the Adviser has contractually agreed to limit the Fund’s expenses, although this limit did not apply because the Fund’s total expenses as shown were below the applicable fee limit.
· For Janus Henderson Global Select Fund, the Trustees noted that, although the Fund’s total expenses exceeded the peer group average for certain share classes, overall the Fund’s total expenses were reasonable. The Trustees also noted that the Adviser has contractually agreed to limit the Fund’s expenses.
· For Janus Henderson Global Sustainable Equity Fund, the Trustees noted that, although the Fund’s total expenses exceeded the peer group average for certain share classes, overall the Fund’s expenses were reasonable. The Trustees also noted that the Adviser has contractually agreed to limit the Fund’s expenses.
· For Janus Henderson Global Technology and Innovation Fund, the Trustees noted that the Fund’s total expenses were below the peer group average for all share classes.
· For Janus Henderson International Opportunities Fund, the Trustees noted that, although the Fund’s total expenses exceeded the peer group average for certain share classes, overall the Fund’s expenses were reasonable. The Trustees also noted that the Adviser has contractually agreed to limit the Fund’s expenses.
· For Janus Henderson Overseas Fund, the Trustees noted that although the Fund’s total expenses exceeded the peer group average for certain share classes, overall the Fund’s total expenses were reasonable. The Trustees also noted that the Adviser has contractually agreed to limit the Fund’s expenses, although this limit did not apply because the Fund’s total expenses as shown were below the applicable fee limit.
· For Janus Henderson Responsible International Dividend Fund (formerly the Janus Henderson Dividend & Income Builder Fund), the Trustees noted that, although the Fund’s total expenses exceeded the peer group for one share class, overall the Fund’s total expenses were reasonable. The Trustees also noted that the Adviser has contractually agreed to limit the Fund’s expenses.
Money Market Funds
· For Janus Henderson Government Money Market Fund, the Trustees noted that the Fund’s total expenses were below the peer group average for all share classes.
· For Janus Henderson Money Market Fund, the Trustees noted that the Fund’s total expenses were below the peer group average for all share classes.
Multi-Asset Funds
· For Janus Henderson Adaptive Global Allocation Fund, the Trustees noted that, that the Fund’s total expenses were below the peer group average for all share classes.
· For Janus Henderson Balanced Fund, the Trustees noted that, although the Fund’s total expenses exceeded the peer group average for certain share classes, overall the Fund’s total expenses were reasonable. The Trustees also noted that the Adviser has contractually agreed to limit the Fund’s expenses, although this limit did not apply because the Fund’s total expenses as shown were below the applicable fee limit.
U.S. Equity Funds
· For Janus Henderson Adaptive Risk Managed U.S. Equity Fund, the Trustees noted that, although the Fund’s total expenses exceeded the peer group average for certain share classes, overall the Fund’s total expenses were reasonable. The Trustees also noted that the Adviser has contractually agreed to limit the Fund’s expenses, although this limit did not apply because the Fund’s total expenses as shown were below the applicable fee limit.
· For Janus Henderson Contrarian Fund, the Trustees noted that, although the Fund’s total expenses exceeded the peer group average for all share classes, overall the Fund’s total expenses were reasonable. The Trustees also noted that the Adviser had contractually agreed to limit the Fund’s expenses.
· For Janus Henderson Enterprise Fund, the Trustees noted that, although the Fund’s total expenses exceeded the peer group average for certain share classes, overall the Fund’s total expenses were reasonable. The Trustees also noted that the Adviser has contractually agreed to limit the Fund’s expenses, although this limit did not apply because the Fund’s total expenses as shown were below the applicable fee limit.
Janus Henderson Global Technology and Innovation Fund
Additional Information (unaudited)
· For Janus Henderson Forty Fund, the Trustees noted that, although the Fund’s total expenses exceeded the peer group average for certain share classes, overall the Fund’s total expenses were reasonable. The Trustees also noted that the Adviser has contractually agreed to limit the Fund’s expenses, although this limit did not apply because the Fund’s total expenses as shown were below the applicable fee limit.
· For Janus Henderson Growth and Income Fund, the Trustees noted that, although the Fund’s total expenses exceeded the peer group average for certain share classes, overall the Fund’s total expenses were reasonable. The Trustees also noted that the Adviser has contractually agreed to limit the Fund’s expenses, although this limit did not apply because the Fund’s total expenses as shown were below the applicable fee limit.
· For Janus Henderson Mid Cap Value Fund, the Trustees noted that the Fund’s total expenses were below the peer group average for all share classes.
· For Janus Henderson Research Fund, the Trustees noted that, although the Fund’s total expenses exceeded the peer group average for certain share classes, overall the Fund’s total expenses were reasonable. The Trustees also noted that the Adviser has contractually agreed to limit the Fund’s expenses.
· For Janus Henderson Small Cap Value Fund, the Trustees noted that, although the Fund’s total expenses exceeded the peer group average for one share class, overall the Fund’s total expenses were reasonable. The Trustees also noted that the Adviser has contractually agreed to limit the Fund’s expenses, although this limit did not apply because the Fund’s total expenses as shown were below the applicable fee limit.
· For Janus Henderson Small-Mid Cap Value Fund, the Trustees noted that the Fund’s total expenses were below the peer group average for all share classes.
· For Janus Henderson Triton Fund, the Trustees noted that, although the Fund’s total expenses exceeded the peer group average for one share class, overall the Fund’s total expenses were reasonable. The Trustees also noted that the Adviser has contractually agreed to limit the Fund’s expenses, although this limit did not apply because the Fund’s total expenses as shown were below the applicable fee limit.
· For Janus Henderson Venture Fund, the Trustees noted that although the Fund’s total expenses exceeded the peer group average for one share class, overall the Fund’s total expenses were reasonable. The Trustees also noted that the Adviser has contractually agreed to limit the Fund’s expenses, although this limit did not apply because the Fund’s total expenses as shown were below the applicable fee limit.
The Trustees reviewed information on the overall profitability to the Adviser and its affiliates from their relationships with the Janus Henderson Funds, and considered profitability data of other publicly traded mutual fund advisers. The Trustees recognized that profitability comparisons among fund managers are difficult because of the variation in the type of comparative information that is publicly available, and the profitability of any fund manager is affected by numerous factors, including the organizational structure of the particular fund manager, differences in complex size, difference in product mix, difference in types of business (mutual fund, institutional and other), differences in the types of funds and other accounts it manages, possible other lines of business, the methodology for allocating expenses and the fund manager’s capital structure and cost of capital.
Additionally, the Trustees considered the estimated profitability to the Adviser from the investment management services it provided to each Janus Henderson Fund. In their review, the Trustees considered whether the Adviser receive adequate incentives and resources to manage the Janus Henderson Funds effectively. In reviewing profitability, the Trustees noted that the estimated profitability for an individual Janus Henderson Fund is necessarily a product of the allocation methodology utilized by the Adviser to allocate its expenses as part of the estimated profitability calculation. In this regard, the Trustees noted that the independent fee consultant found as part of its 2022 review that (1) the expense allocation methodology and rationales utilized by the Adviser were reasonable and (2) no clear correlation exists between expense allocations and operating margins. The Trustees also considered that the estimated profitability for an individual Janus Henderson Fund was influenced by a number of factors, including not only the allocation methodology selected, but also the presence of fee waivers and expense caps, and whether the Janus Henderson Fund’s investment management agreement contained breakpoints or a performance fee component. The Trustees determined, after taking into account these factors, among others, that the Adviser’s estimated profitability with respect to each Janus Henderson Fund was not unreasonable in relation to the services provided, and that the variation in the range of such estimated profitability among the Janus Henderson Funds was not a material factor in the Board’s approval of the reasonableness of any Janus Henderson Fund’s investment management fees.
Janus Henderson Global Technology and Innovation Fund
Additional Information (unaudited)
The Trustees concluded that the management fees payable by each Janus Henderson Fund to the Adviser were reasonable in relation to the nature, extent, and quality of the services provided, taking into account the fees charged by other advisers for managing comparable mutual funds with similar strategies, the fees the Adviser charges to other clients, and, as applicable, the impact of fund performance on management fees payable by the Janus Henderson Funds. The Trustees also concluded that each Janus Henderson Fund’s total expenses were reasonable, taking into account the size of the Janus Henderson Fund, the quality of services provided by the Adviser, the investment performance of the Janus Henderson Fund, and any expense limitations agreed to or provided by the Adviser.
Economies of Scale
The Trustees considered information about the potential for the Adviser to realize economies of scale as the assets of the Janus Henderson Funds increase. They noted that their independent fee consultant published a report to the Trustees in June 2022 which provided its research and analysis into economies of scale. They also noted that, although many Janus Henderson Funds pay advisory fees at a fixed base rate as a percentage of net assets, without any breakpoints or performance fees, their independent fee consultant concluded that 75% of these Janus Henderson Funds’ have contractual management fees (gross of waivers) below their Broadridge Expense Group averages. The Trustees also noted the following from the independent fee consultant’s report: (1) that 31% of Janus Henderson Funds had management fee breakpoints in place whereby investors pay lower management fees as fund AUM increases; (2) that 29% of Janus Henderson Funds have low flat-rate fees and performance fees where the Adviser is incentivized to invest in resources which drive Janus Henderson Fund performance; and (3) that 39% of Janus Henderson Funds have low flat-rate fees versus peers where investors pay low fixed fees when the Janus Henderson Fund is small/midsized and higher fees when the Janus Henderson Fund grows in assets. The Trustees also noted that the Janus Henderson Funds share directly in economies of scale through the significant investments made by the Adviser and its affiliates related to services provided to the Funds and the lower charges of third-party service providers that are based in part on the combined scale of all of the Janus Henderson Funds.
The Trustees also considered the independent fee consultant’s conclusion that, given the limitations of various analytical approaches to economies of scale and their conflicting results, it is difficult to analytically confirm or deny the existence of economies of scale in the Janus Henderson complex. In this regard, the independent consultant concluded that (1) to the extent there were economies of scale at the Adviser, the Adviser’s general strategy of setting fixed management fees below peers appeared to share any such economies with investors even on smaller Janus Henderson Funds which have not yet achieved those economies and (2) by setting lower fixed fees from the start on these Janus Henderson Funds, the Adviser appeared to be investing to increase the likelihood that these Janus Henderson Funds will grow to a level to achieve any economies of scale that may exist. Further, the independent fee consultant provided its belief that Janus Henderson Fund investors are well-served by the fee levels and performance fee structures in place on the Janus Henderson Funds in light of any economies of scale that may be present at the Adviser.
Based on all of the information reviewed, including the recent and past research and analysis conducted by the Trustees’ independent fee consultant, the Trustees concluded that the current fee structure of each Janus Henderson Fund was reasonable and that the current rates of fees do reflect a sharing between the Adviser and the Janus Henderson Fund of any economies of scale that may be present at the current asset level of the Janus Henderson Fund.
Other Benefits to the Adviser
The Trustees also considered benefits that accrue to the Adviser and its affiliates from their relationships with the Janus Henderson Funds. They recognized that two affiliates of the Adviser separately serve the Janus Henderson Funds as transfer agent and distributor, respectively, and the transfer agent receives compensation directly from the non-money market Janus Henderson Funds for services provided, and that such compensation contributes to the overall profitability of the Adviser and its affiliates that results from their relationship with the Janus Henderson Funds. The Trustees also considered the Adviser’s past and proposed use of commissions paid by the Janus Henderson Funds on portfolio brokerage transactions to obtain proprietary and third-party research products and services benefiting the Janus Henderson Fund and/or other clients of the Adviser and/or the Adviser. The Trustees concluded that the Adviser’s use of these types of client commission arrangements to obtain proprietary and third-party research products and services was consistent with regulatory requirements and guidelines and was likely to benefit each Janus Henderson Fund. The Trustees also concluded that, other than the services provided by the Adviser and its affiliates pursuant to the agreements and the fees to be paid by each Janus Henderson Fund therefor, the Janus Henderson
Janus Henderson Global Technology and Innovation Fund
Additional Information (unaudited)
Funds and the Adviser may potentially benefit from their relationship with each other in other ways. They concluded that the Adviser and its affiliates share directly in economies of scale through the lower charges of third-party service providers that are based in part on the combined scale of the Janus Henderson Funds and other clients serviced by the Adviser and its affiliates. They also concluded that the Adviser benefits from the receipt of research products and services acquired through commissions paid on portfolio transactions of the Janus Henderson Funds and that the Janus Henderson Funds benefit from the Adviser’s receipt of those products and services as well as research products and services acquired through commissions paid by other clients of the Adviser. They further concluded that the success of any Janus Henderson Fund could attract other business to the Adviser or other Janus Henderson Funds, and that the success of the Adviser could enhance the Adviser’s ability to serve the Janus Henderson Funds.
Janus Henderson Global Technology and Innovation Fund
Liquidity Risk Management Program (unaudited)
Liquidity Risk Management Program
Rule 22e-4 under the Investment Company Act of 1940, as amended (the “Liquidity Rule”), requires open-end funds (but not money market funds) to adopt and implement a written liquidity risk management program (the “LRMP”) that is reasonably designed to assess and manage liquidity risk, which is the risk that a fund could not meet redemption requests without significant dilution of remaining investors’ interest in the fund. The Fund has implemented a LRMP, which incorporates the following elements: (i) assessment, management, and periodic review of liquidity risk; (ii) classification of portfolio holdings; (iii) the establishment and monitoring of a highly liquid investment minimum, as applicable; (iv) a 15% limitation on a Fund’s illiquid investments; (v) redemptions in-kind; and (vi) board oversight.
The Trustees of the Fund (the “Trustees”) have designated Janus Henderson Investors US LLC, the Fund’s investment adviser (the “Adviser”), as the Program Administrator for the LRMP responsible for administering the LRMP and carrying out the specific responsibilities of the LRMP. A working group comprised of various teams within the Adviser’s business is responsible for administering the LRMP and carrying out the specific responsibilities of different aspects of the LRMP (the “Liquidity Risk Working Group”). In assessing each Fund’s liquidity risk, the Liquidity Risk Working Group periodically considers, as relevant, factors including (i) the liquidity of a Fund’s portfolio investments during normal and reasonably foreseeable stressed conditions; (ii) whether a Fund’s investment strategy is appropriate for an open-end fund; (iii) the extent to which a Fund’s strategy involves a relatively concentrated portfolio or large positions in any issuer; (iv) a Fund’s use of borrowing for investment purposes; and (v) a Fund’s use of derivatives.
The Liquidity Rule requires the Trustees to review at least annually a written report provided by the Program Administrator that addresses the operation of the LRMP and assesses its adequacy and the effectiveness of its implementation, including, if applicable, the operation of the highly liquid investment minimum, and any material changes to the LRMP (the “Program Administrator Report”). At a meeting held on March 15, 2023, the Adviser provided the Program Administrator Report to the Trustees which covered the operation of the LRMP from January 1, 2022 through December 31, 2022 (the “Reporting Period”).
The Program Administrator Report discussed the operation and effectiveness of the LRMP during the Reporting Period. Among other things, the Program Administrator Report indicated that there were no material changes to the LRMP during the Reporting Period, although there were certain methodology adjustments implemented relating to a change in data provider. Additionally, the findings presented in the Program Administrator Report indicated that the LRMP operated adequately during the Reporting Period. These findings included that the Fund was able to meet redemptions during the normal course of business during the Reporting Period. The Program Administrator Report also stated that the Fund did not exceed the 15% limit on illiquid assets during the Reporting Period, that the Fund held primarily highly liquid assets, and was considered to be a primarily highly liquid fund during the Reporting Period. Also included among the Program Administrator Report’s findings was the determination that the Fund’s investment strategy remains appropriate for an open-end fund. In addition, the Adviser expressed its belief in the Program Administrator Report that the LRMP is reasonably designed and adequate to assess and manage the Fund’s liquidity risk, considering the Fund’s particular risks and circumstances, and includes policies and procedures reasonably designed to implement each required component of the Liquidity Rule.
There can be no assurance that the LRMP will achieve its objectives in the future. Please refer to your Fund’s prospectus for more information regarding the risks to which an investment in the Fund may be subject.
Janus Henderson Global Technology and Innovation Fund
Useful Information About Your Fund Report (unaudited)
Performance Overviews
Performance overview graphs compare the performance of a hypothetical $10,000 investment in the Fund with one or more widely used market indices. When comparing the performance of the Fund with an index, keep in mind that market indices are not available for investment and do not reflect deduction of expenses.
Average annual total returns are quoted for a Fund with more than one year of performance history. Average annual total return is calculated by taking the growth or decline in value of an investment over a period of time, including reinvestment of dividends and distributions, then calculating the annual compounded percentage rate that would have produced the same result had the rate of growth been constant throughout the period. Average annual total return does not reflect the deduction of taxes that a shareholder would pay on Fund distributions or redemptions of Fund shares.
Cumulative total returns are quoted for a Fund with less than one year of performance history. Cumulative total return is the growth or decline in value of an investment over time, independent of the period of time involved. Cumulative total return does not reflect the deduction of taxes that a shareholder would pay on Fund distributions or redemptions of Fund shares.
Pursuant to federal securities rules, expense ratios shown in the performance chart reflect subsidized (if applicable) and unsubsidized ratios. The total annual fund operating expenses ratio is gross of any fee waivers, reflecting the Fund’s unsubsidized expense ratio. The net annual fund operating expenses ratio (if applicable) includes contractual waivers of the Adviser and reflects the Fund’s subsidized expense ratio. Ratios may be higher or lower than those shown in the “Financial Highlights” in this report.
Schedule of Investments
Following the performance overview section is the Fund’s Schedule of Investments. This schedule reports the types of securities held in the Fund on the last day of the reporting period. Securities are usually listed by type (common stock, corporate bonds, U.S. Government obligations, etc.) and by industry classification (banking, communications, insurance, etc.). Holdings are subject to change without notice.
The value of each security is quoted as of the last day of the reporting period. The value of securities denominated in foreign currencies is converted into U.S. dollars.
If the Fund invests in foreign securities, it will also provide a summary of investments by country. This summary reports the Fund exposure to different countries by providing the percentage of securities invested in each country. The country of each security represents the country of risk. A company may be allocated to a country based on other factors such as location of the company’s principal office, the location of the principal trading market for the company’s securities, or the country where a majority of the company’s revenues are derived. The Fund’s Schedule of Investments relies upon the industry group and country classifications published by Bloomberg and/or MSCI Inc.
Tables listing details of individual forward currency contracts, futures, written options, swaptions, and swaps follow the Fund’s Schedule of Investments (if applicable).
Statement of Assets and Liabilities
This statement is often referred to as the “balance sheet.” It lists the assets and liabilities of the Fund on the last day of the reporting period.
The Fund’s assets are calculated by adding the value of the securities owned, the receivable for securities sold but not yet settled, the receivable for dividends declared but not yet received on securities owned, and the receivable for Fund shares sold to investors but not yet settled. The Fund’s liabilities include payables for securities purchased but not yet settled, Fund shares redeemed but not yet paid, and expenses owed but not yet paid. Additionally, there may be other assets and liabilities such as unrealized gain or loss on forward currency contracts.
The section entitled “Net Assets Consist of” breaks down the components of the Fund’s net assets. Because the Fund must distribute substantially all earnings, you will notice that a significant portion of net assets is shareholder capital.
The last section of this statement reports the net asset value (“NAV”) per share on the last day of the reporting period. The NAV is calculated by dividing the Fund’s net assets for each share class (assets minus liabilities) by the number of shares outstanding.
Janus Henderson Global Technology and Innovation Fund
Useful Information About Your Fund Report (unaudited)
Statement of Operations
This statement details the Fund’s income, expenses, realized gains and losses on securities and currency transactions, and changes in unrealized appreciation or depreciation of Fund holdings.
The first section in this statement, entitled “Investment Income,” reports the dividends earned from securities and interest earned from interest-bearing securities in the Fund.
The next section reports the expenses incurred by the Fund, including the advisory fee paid to the investment adviser, transfer agent fees and expenses, and printing and postage for mailing statements, financial reports and prospectuses. Expense offsets and expense reimbursements, if any, are also shown.
The last section lists the amounts of realized gains or losses from investment and foreign currency transactions, and changes in unrealized appreciation or depreciation of investments and foreign currency-denominated assets and liabilities. The Fund will realize a gain (or loss) when it sells its position in a particular security. A change in unrealized gain (or loss) refers to the change in net appreciation or depreciation of the Fund during the reporting period. “Net Realized and Unrealized Gain/(Loss) on Investments” is affected both by changes in the market value of Fund holdings and by gains (or losses) realized during the reporting period.
Statements of Changes in Net Assets
These statements report the increase or decrease in the Fund’s net assets during the reporting period. Changes in the Fund’s net assets are attributable to investment operations, dividends and distributions to investors, and capital share transactions. This is important to investors because it shows exactly what caused the Fund’s net asset size to change during the period.
The first section summarizes the information from the Statement of Operations regarding changes in net assets due to the Fund’s investment operations. The Fund’s net assets may also change as a result of dividend and capital gains distributions to investors. If investors receive their dividends and/or distributions in cash, money is taken out of the Fund to pay the dividend and/or distribution. If investors reinvest their dividends and/or distributions, the Fund’s net assets will not be affected.
The reinvestment of dividends and distributions is included under “Capital Share Transactions.” “Capital Shares” refers to the money investors contribute to the Fund through purchases or withdrawals via redemptions. The Fund’s net assets will increase and decrease in value as investors purchase and redeem shares from the Fund.
Financial Highlights
This schedule provides a per-share breakdown of the components that affect the Fund’s NAV for current and past reporting periods as well as total return, asset size, ratios, and portfolio turnover rate.
The first line in the table reflects the NAV per share at the beginning of the reporting period. The next line reports the net investment income/(loss) per share. Following is the per share total of net gains/(losses), realized and unrealized. Per share dividends and distributions to investors are then subtracted to arrive at the NAV per share at the end of the period. The next line reflects the total return for the period. The total return may include adjustments in accordance with generally accepted accounting principles required at the period end for financial reporting purposes. As a result, the total return may differ from the total return reflected for individual shareholder transactions. Also included are ratios of expenses and net investment income to average net assets.
The Fund’s expenses may be reduced through expense offsets and expense reimbursements. The ratios shown reflect expenses before and after any such offsets and reimbursements.
The ratio of net investment income/(loss) summarizes the income earned less expenses, divided by the average net assets of the Fund during the reporting period. Do not confuse this ratio with the Fund’s yield. The net investment income ratio is not a true measure of the Fund’s yield because it does not take into account the dividends distributed to the Fund’s investors.
The next figure is the portfolio turnover rate, which measures the buying and selling activity in the Fund. Portfolio turnover is affected by market conditions, changes in the asset size of the Fund, fluctuating volume of shareholder purchase and redemption orders, the nature of the Fund’s investments, and the investment style and/or outlook of the portfolio manager(s) and/or investment personnel. A 100% rate implies that an amount equal to the value of the entire portfolio was replaced once during the fiscal year; a 50% rate means that an amount equal to the value of half the
Janus Henderson Global Technology and Innovation Fund
Useful Information About Your Fund Report (unaudited)
portfolio is traded in a year; and a 200% rate means that an amount equal to the value of the entire portfolio is traded every six months.
| | | | | | | | |
| | | | | |

| | | | |
This report is submitted for the general information of shareholders of the Fund. It is not an offer or solicitation for the Fund and is not authorized for distribution to prospective investors unless preceded or accompanied by an effective prospectus. |
Janus Henderson is a trademark of Janus Henderson Group plc or one of its subsidiaries. © Janus Henderson Group plc. Janus Henderson Group is the ultimate parent of Janus Henderson Distributors US LLC. Janus Henderson Distributors US LLC |
| | | | 125-24-93047 05-23 |
| | | | |
| | | |
| | | SEMIANNUAL REPORT March 31, 2023 |
| | |
| | Janus Henderson Growth and Income Fund |
| | |
| | Janus Investment Fund |
| |
| | | HIGHLIGHTS · Investment strategy behind your fund · Fund performance, characteristics
and holdings |
Table of Contents
Janus Henderson Growth and Income Fund
| | | | | | |
| | | | | | 
Jeremiah Buckley Portfolio manager |
| | | |
Janus Henderson Growth and Income Fund (unaudited)
Fund At A Glance
March 31, 2023
| | | | | | | | | | |
| | | | | | | | | |
| | | | | | | | | |
| | | | | | | | | |
| 5 Top Contributors - Holdings | 5 Top Detractors - Holdings |
| | Average
Weight | | Relative
Contribution | | | Average
Weight | | Relative
Contribution |
| Oracle Corp | 1.73% | | 0.43% | | Hasbro Inc | 1.00% | | -0.45% |
| KLA Corp | 2.97% | | 0.43% | | UnitedHealth Group Inc | 3.24% | | -0.42% |
| Comcast Corp - Class A | 2.23% | | 0.25% | | Medtronic PLC | 1.47% | | -0.18% |
| Microsoft Corp | 8.08% | | 0.23% | | Automatic Data Processing Inc | 1.21% | | -0.16% |
| Warner Music Group Corp - Class A | 0.78% | | 0.23% | | Eli Lilly & Co | 2.37% | | -0.15% |
| | | | | | | |
| 5 Top Contributors - Sectors* | | | | | |
| | | Relative | | Fund | S&P 500 Index |
| | | Contribution | | Average Weight | Average Weight |
| Consumer Discretionary | | 1.32% | | 11.18% | 10.46% |
| Financials | | 1.00% | | 12.99% | 11.62% |
| Utilities | | 0.33% | | 0.00% | 2.99% |
| Communication Services | | 0.28% | | 3.01% | 7.66% |
| Health Care | | 0.28% | | 16.66% | 15.03% |
| | | | | | |
| | | | | | |
| 5 Top Detractors - Sectors* | | | | | |
| | | Relative | | Fund | S&P 500 Index |
| | | Contribution | | Average Weight | Average Weight |
| Information Technology | | -1.04% | | 33.19% | 26.45% |
| Industrials | | -0.30% | | 13.61% | 8.44% |
| Energy | | -0.27% | | 2.08% | 5.05% |
| Materials | | -0.06% | | 0.80% | 2.69% |
| Consumer Staples | | -0.05% | | 6.28% | 6.93% |
| | | | | | | |
| Relative contribution reflects how the portolio's holdings impacted return relative to the benchmark. Cash and securities not held in the portfolio are not shown. For equity portfolios, relative contribution compares the performance of a security in the portfolio to the benchmark's total return, factoring in the difference in weight of that security in the benchmark. Returns are calculated using daily returns and previous day ending weights rolled up by ticker, excluding fixed income securities, gross of advisory fees, may exclude certain derivatives and will differ from actual performance.
Performance attribution reflects returns gross of advisory fees and may differ from actual returns as they are based on end of day holdings. Attribution is calculated by geometrically linking daily returns for the portfolio and index. |
* | Based on sector classification according to the Global Industry Classification Standard (“GICS”) codes, which are the exclusive property and a service mark of MSCI Inc. and Standard & Poor’s. |
Janus Henderson Growth and Income Fund (unaudited)
Fund At A Glance
March 31, 2023
| | |
5 Largest Equity Holdings - (% of Net Assets) |
Microsoft Corp | |
Software | 9.1% |
Apple Inc | |
Technology Hardware, Storage & Peripherals | 6.6% |
Accenture PLC | |
Information Technology Services | 4.1% |
JPMorgan Chase & Co | |
Banks | 3.3% |
KLA Corp | |
Semiconductor & Semiconductor Equipment | 3.1% |
| | 26.2% |
| | | | | | |
Asset Allocation - (% of Net Assets) | |
Common Stocks | | 99.9% | |
Investment Companies | | 0.1% | |
Other | | (0.0)% |
| | | 100.0% |
| | |
Top Country Allocations - Long Positions - (% of Investment Securities) |
As of March 31, 2023 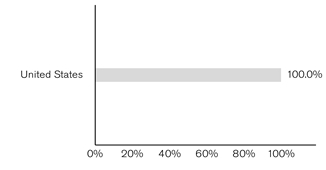
| As of September 30, 2022 
|
Janus Henderson Growth and Income Fund (unaudited)
Performance
| |
See important disclosures on the next page. |
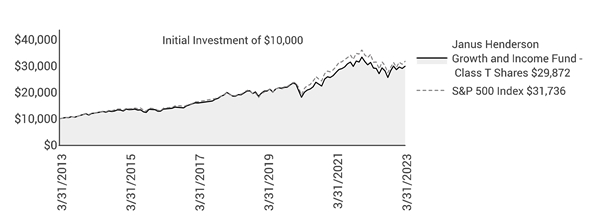
| | | | | | | | | | | |
| | | | | | | | | |
| | | | | | | | | | |
Average Annual Total Return - for the periods ended March 31, 2023 | | | Prospectus Expense Ratios |
| | Fiscal
Year-to-Date | One
Year | Five
Year | Ten
Year | Since
Inception* | | | Total Annual Fund
Operating Expenses‡ |
Class A Shares at NAV | | 16.71% | -4.75% | 9.80% | 11.45% | 10.54% | | | 1.01% |
Class A Shares at MOP | | 10.00% | -10.23% | 8.51% | 10.79% | 10.34% | | | |
Class C Shares at NAV | | 16.34% | -5.36% | 9.07% | 10.66% | 9.79% | | | 1.69% |
Class C Shares at CDSC | | 15.34% | -6.26% | 9.07% | 10.66% | 9.79% | | | |
Class D Shares | | 16.86% | -4.51% | 10.06% | 11.67% | 10.67% | | | 0.75% |
Class I Shares | | 16.90% | -4.46% | 10.12% | 11.74% | 10.70% | | | 0.70% |
Class N Shares | | 16.94% | -4.38% | 10.20% | 11.71% | 10.67% | | | 0.63% |
Class R Shares | | 16.47% | -5.14% | 9.34% | 10.97% | 10.11% | | | 1.41% |
Class S Shares | | 16.63% | -4.86% | 9.65% | 11.27% | 10.37% | | | 1.13% |
Class T Shares | | 16.79% | -4.62% | 9.94% | 11.56% | 10.62% | | | 0.87% |
S&P 500 Index | | 15.62% | -7.73% | 11.19% | 12.24% | 10.05% | | | |
Morningstar Quartile - Class T Shares | | - | 1st | 3rd | 2nd | 1st | | | |
Morningstar Ranking - based on total returns for Large Blend Funds | | - | 183/1,375 | 611/1,194 | 362/1,023 | 30/317 | | | |
Returns quoted are past performance and do not guarantee future results; current performance may be lower or higher. Investment returns and principal value will vary; there may be a gain or loss when shares are sold. For the most recent month-end performance call 800.668.0434 (or 800.525.3713 if you hold shares directly with Janus Henderson) or visit janushenderson.com/performance (or janushenderson.com/allfunds if you hold shares directly with Janus Henderson).
Maximum Offering Price (MOP) returns include the maximum sales charge of 5.75%. Net Asset Value (NAV) returns exclude this charge, which would have reduced returns.
CDSC returns include a 1% contingent deferred sales charge (CDSC) on Shares redeemed within 12 months of purchase. Net Asset Value (NAV) returns exclude this charge, which would have reduced returns.
Janus Henderson Growth and Income Fund (unaudited)
Performance
Performance may be affected by risks that include those associated with foreign and emerging markets, fixed income securities, high-yield and high-risk securities, undervalued, overlooked and smaller capitalization companies, real estate related securities including Real Estate Investment Trusts (REITs), Environmental, Social and Governance (ESG) factors, non-diversification, portfolio turnover, derivatives, short sales, initial public offerings (IPOs) and potential conflicts of interest. Each product has different risks. Please see the prospectus for more information about risks, holdings and other details.
Returns include reinvestment of all dividends and distributions and do not reflect the deduction of taxes that a shareholder would pay on Fund distributions or redemptions of Fund shares. The returns do not include adjustments in accordance with generally accepted accounting principles required at the period end for financial reporting purposes.
Class A Shares, Class C Shares, Class R Shares, and Class S Shares commenced operations on July 6, 2009. Performance shown for each class for periods prior to July 6, 2009, reflects the performance of the Fund’s Class J Shares, the initial share class (renamed Class T Shares effective February 16, 2010), calculated using the fees and expenses of each respective class, without the effect of any fee and expense limitations or waivers.
Class D Shares commenced operations on February 16, 2010. Performance shown for periods prior to February 16, 2010, reflects the performance of the Fund’s former Class J Shares, calculated using the fees and expenses in effect during the periods shown, net of any applicable fee and expense limitations or waivers.
Class I Shares commenced operations on July 6, 2009. Performance shown for periods prior to July 6, 2009, reflects the performance of the Fund’s former Class J Shares, calculated using the fees and expenses of Class J Shares, net of any applicable fee and expense limitations or waivers.
Class N Shares commenced operations on August 4, 2017. Performance shown for periods prior to August 4, 2017, reflects the performance of the Fund’s Class T Shares, calculated using the fees and expenses of Class T Shares, net of any applicable fee and expense limitations or waivers.
If each share class of the Fund had been available during periods prior to its commencement, the performance shown may have been different. The performance shown for periods following the Fund’s commencement of each share class reflects the fees and expenses of each respective share class, net of any applicable fee and expense limitations or waivers. Please refer to the Fund’s prospectuses for further details concerning historical performance.
Ranking is for the share class shown only; other classes may have different performance characteristics. When an expense waiver is in effect, it may have a material effect on the total return, and therefore the ranking for the period.
© 2023 Morningstar, Inc. All Rights Reserved.
There is no assurance that the investment process will consistently lead to successful investing.
See Notes to Schedule of Investments and Other Information for index definitions.
Index performance does not reflect the expenses of managing a portfolio as an index is unmanaged and not available for direct investment.
See “Useful Information About Your Fund Report.”
*The Fund’s inception date – May 15, 1991
‡ As stated in the prospectus. See Financial Highlights for actual expense ratios during the reporting period.
Janus Henderson Growth and Income Fund (unaudited)
Expense Examples
As a shareholder of the Fund, you incur two types of costs: (1) transaction costs, such as sales charges (loads) on purchase payments (applicable to Class A Shares only); and (2) ongoing costs, including management fees; 12b-1 distribution and shareholder servicing fees; transfer agent fees and expenses payable pursuant to the Transfer Agency Agreement; and other Fund expenses. This example is intended to help you understand your ongoing costs (in dollars) of investing in the Fund and to compare these costs with the ongoing costs of investing in other mutual funds. To do so, compare this 5% hypothetical example with the 5% hypothetical examples that appear in the shareholder reports of the other funds. The example is based upon an investment of $1,000 invested at the beginning of the period and held for the six-months indicated, unless noted otherwise in the table and footnotes below.
Actual Expenses
The information in the table under the heading “Actual” provides information about actual account values and actual expenses. You may use the information in these columns, together with the amount you invested, to estimate the expenses that you paid over the period. Simply divide your account value by $1,000 (for example, an $8,600 account value divided by $1,000 = 8.6), then multiply the result by the number in the appropriate column for your share class under the heading entitled “Expenses Paid During Period” to estimate the expenses you paid on your account during the period.
Hypothetical Example for Comparison Purposes
The information in the table under the heading “Hypothetical (5% return before expenses)” provides information about hypothetical account values and hypothetical expenses based upon the Fund’s actual expense ratio and an assumed rate of return of 5% per year before expenses, which is not the Fund’s actual return. The hypothetical account values and expenses may not be used to estimate the actual ending account balance or expenses you paid for the period. You may use this information to compare the ongoing costs of investing in the Fund and other funds. To do so, compare this 5% hypothetical example with the 5% hypothetical examples that appear in the shareholder reports of the other funds. Additionally, for an analysis of the fees associated with an investment in any share class or other similar funds, please visit www.finra.org/fundanalyzer.
Please note that the expenses shown in the table are meant to highlight your ongoing costs only and do not reflect any transaction costs. These fees are fully described in the Fund’s prospectuses. Therefore, the hypothetical examples are useful in comparing ongoing costs only, and will not help you determine the relative total costs of owning different funds. In addition, if these transaction costs were included, your costs would have been higher.
| | | | | | | | | | | |
| | | | | | | | |
| | | Actual | | Hypothetical
(5% return before expenses) | |
| Beginning
Account
Value
(10/1/22) | Ending
Account
Value
(3/31/23) | Expenses
Paid During
Period
(10/1/22 - 3/31/23)† | | Beginning
Account
Value
(10/1/22) | Ending
Account
Value
(3/31/23) | Expenses
Paid During
Period
(10/1/22 - 3/31/23)† | Net Annualized
Expense Ratio
(10/1/22 - 3/31/23) |
Class A Shares | $1,000.00 | $1,167.10 | $5.51 | | $1,000.00 | $1,019.85 | $5.14 | 1.02% |
Class C Shares | $1,000.00 | $1,163.40 | $8.85 | | $1,000.00 | $1,016.75 | $8.25 | 1.64% |
Class D Shares | $1,000.00 | $1,168.60 | $4.11 | | $1,000.00 | $1,021.14 | $3.83 | 0.76% |
Class I Shares | $1,000.00 | $1,169.00 | $3.79 | | $1,000.00 | $1,021.44 | $3.53 | 0.70% |
Class N Shares | $1,000.00 | $1,169.40 | $3.41 | | $1,000.00 | $1,021.79 | $3.18 | 0.63% |
Class R Shares | $1,000.00 | $1,164.70 | $7.66 | | $1,000.00 | $1,017.85 | $7.14 | 1.42% |
Class S Shares | $1,000.00 | $1,166.30 | $6.10 | | $1,000.00 | $1,019.30 | $5.69 | 1.13% |
Class T Shares | $1,000.00 | $1,167.90 | $4.59 | | $1,000.00 | $1,020.69 | $4.28 | 0.85% |
† | Expenses Paid During Period are equal to the Net Annualized Expense Ratio multiplied by the average account value over the period, multiplied by 182/365 (to reflect the one-half year period). Expenses in the examples include the effect of applicable fee waivers and/or expense reimbursements, if any. Had such waivers and/or reimbursements not been in effect, your expenses would have been higher. Please refer to the Notes to Financial Statements or the Fund’s prospectuses for more information regarding waivers and/or reimbursements. |
Janus Henderson Growth and Income Fund
Schedule of Investments (unaudited)
March 31, 2023
| | | | | | | | |
Shares
| | | Value | |
Common Stocks– 99.9% | | | |
Aerospace & Defense – 2.3% | | | |
| | General Dynamics Corp | | 518,446 | | | $118,314,562 | |
| | L3Harris Technologies Inc | | 161,112 | | | 31,616,619 | |
| | | 149,931,181 | |
Air Freight & Logistics – 2.6% | | | |
| | United Parcel Service Inc | | 865,394 | | | 167,877,782 | |
Banks – 3.3% | | | |
| | JPMorgan Chase & Co | | 1,636,113 | | | 213,201,885 | |
Beverages – 1.2% | | | |
| | Brown-Forman Corp | | 820,365 | | | 52,724,859 | |
| | Constellation Brands Inc - Class A | | 126,092 | | | 28,482,922 | |
| | | 81,207,781 | |
Biotechnology – 3.3% | | | |
| | AbbVie Inc | | 784,686 | | | 125,055,408 | |
| | Amgen Inc | | 153,892 | | | 37,203,391 | |
| | Gilead Sciences Inc | | 594,770 | | | 49,348,067 | |
| | | 211,606,866 | |
Building Products – 0.8% | | | |
| | Trane Technologies PLC | | 296,948 | | | 54,632,493 | |
Capital Markets – 5.5% | | | |
| | Charles Schwab Corp | | 426,118 | | | 22,320,061 | |
| | CME Group Inc | | 711,449 | | | 136,256,712 | |
| | Goldman Sachs Group Inc | | 264,729 | | | 86,595,503 | |
| | Morgan Stanley | | 1,278,728 | | | 112,272,318 | |
| | | 357,444,594 | |
Chemicals – 1.0% | | | |
| | Air Products & Chemicals Inc | | 116,716 | | | 33,522,002 | |
| | Corteva Inc | | 546,285 | | | 32,946,448 | |
| | | 66,468,450 | |
Commercial Services & Supplies – 0.5% | | | |
| | Waste Management Inc | | 198,318 | | | 32,359,548 | |
Communications Equipment – 1.1% | | | |
| | Cisco Systems Inc | | 1,321,330 | | | 69,072,526 | |
Consumer Finance – 2.7% | | | |
| | American Express Co | | 1,045,745 | | | 172,495,638 | |
Diversified Financial Services – 2.7% | | | |
| �� | Visa Inc | | 771,977 | | | 174,049,934 | |
Electrical Equipment – 0.8% | | | |
| | Rockwell Automation Inc | | 170,797 | | | 50,120,380 | |
Electronic Equipment, Instruments & Components – 1.9% | | | |
| | TE Connectivity Ltd | | 932,689 | | | 122,322,162 | |
Entertainment – 0.7% | | | |
| | Warner Music Group Corp - Class A | | 1,360,269 | | | 45,392,177 | |
Food & Staples Retailing – 1.7% | | | |
| | Costco Wholesale Corp | | 101,794 | | | 50,578,385 | |
| | Sysco Corp | | 806,945 | | | 62,320,362 | |
| | | 112,898,747 | |
Food Products – 1.7% | | | |
| | Hershey Co | | 435,143 | | | 110,704,731 | |
Health Care Equipment & Supplies – 3.9% | | | |
| | Abbott Laboratories | | 1,150,249 | | | 116,474,214 | |
| | Medtronic PLC | | 1,048,105 | | | 84,498,225 | |
| | Stryker Corp | | 175,694 | | | 50,155,366 | |
| | | 251,127,805 | |
Health Care Providers & Services – 3.8% | | | |
| | HCA Healthcare Inc | | 97,998 | | | 25,840,113 | |
| | Quest Diagnostics Inc | | 233,543 | | | 33,041,664 | |
| | UnitedHealth Group Inc | | 392,177 | | | 185,338,928 | |
| | | 244,220,705 | |
| | |
See Notes to Schedule of Investments and Other Information and Notes to Financial Statements. |
| |
6 | MARCH 31, 2023 |
Janus Henderson Growth and Income Fund
Schedule of Investments (unaudited)
March 31, 2023
| | | | | | | | |
Shares
| | | Value | |
Common Stocks– (continued) | | | |
Hotels, Restaurants & Leisure – 5.5% | | | |
| | Marriott International Inc/MD | | 516,738 | | | $85,799,178 | |
| | McDonald's Corp | | 555,812 | | | 155,410,593 | |
| | Starbucks Corp | | 1,098,038 | | | 114,338,697 | |
| | | 355,548,468 | |
Household Durables – 1.1% | | | |
| | Garmin Ltd | | 701,564 | | | 70,801,839 | |
Household Products – 2.0% | | | |
| | Procter & Gamble Co | | 858,448 | | | 127,642,633 | |
Industrial Conglomerates – 1.5% | | | |
| | Honeywell International Inc | | 516,689 | | | 98,749,602 | |
Information Technology Services – 4.1% | | | |
| | Accenture PLC | | 924,743 | | | 264,300,797 | |
Insurance – 0.4% | | | |
| | Travelers Cos Inc | | 155,556 | | | 26,663,854 | |
Leisure Products – 0.5% | | | |
| | Hasbro Inc | | 642,199 | | | 34,479,664 | |
Life Sciences Tools & Services – 0.6% | | | |
| | Danaher Corp | | 152,859 | | | 38,526,582 | |
Machinery – 4.1% | | | |
| | Cummins Inc | | 80,274 | | | 19,175,853 | |
| | Deere & Co | | 469,864 | | | 193,997,448 | |
| | Illinois Tool Works Inc | | 81,723 | | | 19,895,464 | |
| | Parker-Hannifin Corp | | 100,136 | | | 33,656,711 | |
| | | 266,725,476 | |
Media – 2.3% | | | |
| | Comcast Corp - Class A | | 3,974,377 | | | 150,668,632 | |
Oil, Gas & Consumable Fuels – 2.1% | | | |
| | Chevron Corp | | 644,787 | | | 105,203,447 | |
| | ConocoPhillips | | 320,354 | | | 31,782,320 | |
| | | 136,985,767 | |
Pharmaceuticals – 4.9% | | | |
| | Eli Lilly & Co | | 395,543 | | | 135,837,377 | |
| | Merck & Co Inc | | 1,167,582 | | | 124,219,049 | |
| | Zoetis Inc | | 355,726 | | | 59,207,035 | |
| | | 319,263,461 | |
Professional Services – 1.7% | | | |
| | Automatic Data Processing Inc | | 339,600 | | | 75,605,148 | |
| | Booz Allen Hamilton Holding Corp | | 371,867 | | | 34,468,352 | |
| | | 110,073,500 | |
Semiconductor & Semiconductor Equipment – 5.9% | | | |
| | KLA Corp | | 504,057 | | | 201,204,433 | |
| | Texas Instruments Inc | | 987,290 | | | 183,645,813 | |
| | | 384,850,246 | |
Software – 11.5% | | | |
| | Intuit Inc | | 77,110 | | | 34,377,951 | |
| | Microsoft Corp | | 2,053,735 | | | 592,091,801 | |
| | Oracle Corp | | 1,296,628 | | | 120,482,674 | |
| | | 746,952,426 | |
Specialty Retail – 2.8% | | | |
| | Home Depot Inc | | 365,821 | | | 107,961,094 | |
| | TJX Cos Inc | | 970,581 | | | 76,054,727 | |
| | | 184,015,821 | |
Technology Hardware, Storage & Peripherals – 6.6% | | | |
| | Apple Inc | | 2,581,206 | | | 425,640,869 | |
Textiles, Apparel & Luxury Goods – 0.8% | | | |
| | NIKE Inc - Class B | | 416,037 | | | 51,022,778 | |
Total Common Stocks (cost $3,408,367,500) | | 6,480,047,800 | |
| | |
See Notes to Schedule of Investments and Other Information and Notes to Financial Statements. |
| |
Janus Investment Fund | 7 |
Janus Henderson Growth and Income Fund
Schedule of Investments (unaudited)
March 31, 2023
| | | | | | | | |
Shares
| | | Value | |
Investment Companies– 0.1% | | | |
Money Markets – 0.1% | | | |
| | Janus Henderson Cash Liquidity Fund LLC, 4.7988%ºº,£((cost $7,844,427) | | 7,842,858 | | | $7,844,427 | |
Total Investments (total cost $3,416,211,927) – 100.0% | | 6,487,892,227 | |
Liabilities, net of Cash, Receivables and Other Assets – (0)% | | (2,216,587) | |
Net Assets – 100% | | $6,485,675,640 | |
Schedules of Affiliated Investments – (% of Net Assets)
| | | | | | | | | | | |
| | Dividend Income | Realized Gain/(Loss) | Change in Unrealized Appreciation/ Depreciation | Value at 3/31/23 |
Investment Companies - 0.1% |
Money Markets - 0.1% | |
| | Janus Henderson Cash Liquidity Fund LLC, 4.7988%ºº | $ | 111,998 | $ | 1,102 | $ | - | $ | 7,844,427 |
| |
| | | | | | | | | | | |
| | Value at 9/30/22 | Purchases | Sales Proceeds | Value at 3/31/23 |
Investment Companies - 0.1% |
Money Markets - 0.1% | |
| | Janus Henderson Cash Liquidity Fund LLC, 4.7988%ºº | | 11,984,222 | | 108,761,853 | | (112,902,750) | | 7,844,427 |
| | |
See Notes to Schedule of Investments and Other Information and Notes to Financial Statements. |
| |
8 | MARCH 31, 2023 |
Janus Henderson Growth and Income Fund
Notes to Schedule of Investments and Other Information (unaudited)
| | |
S&P 500® Index | S&P 500® Index reflects U.S. large-cap equity performance and represents broad U.S. equity market performance. |
| | |
LLC | Limited Liability Company |
PLC | Public Limited Company |
| | |
ºº | Rate shown is the 7-day yield as of March 31, 2023. |
| | |
£ | The Fund may invest in certain securities that are considered affiliated companies. As defined by the Investment Company Act of 1940, as amended, an affiliated company is one in which the Fund owns 5% or more of the outstanding voting securities, or a company which is under common ownership or control. |
| | | | | | | | | | | | | |
The following is a summary of the inputs that were used to value the Fund’s investments in securities and other financial instruments as of March 31, 2023. See Notes to Financial Statements for more information. |
| |
Valuation Inputs Summary |
| | | | | | | |
| | | | | Level 2 - | | Level 3 - |
| | | Level 1 - | | Other Significant | | Significant |
| | | Quoted Prices | | Observable Inputs | | Unobservable Inputs |
| | | | | | | |
Assets | | | | | | |
Investments In Securities: | | | | | | |
Common Stocks | $ | 6,480,047,800 | $ | - | $ | - |
Investment Companies | | - | | 7,844,427 | | - |
Total Assets | $ | 6,480,047,800 | $ | 7,844,427 | $ | - |
| | | | | | | |
Janus Henderson Growth and Income Fund
Statement of Assets and Liabilities (unaudited)
March 31, 2023
| |
See footnotes at the end of the Statement. |
| | | | | | | |
| | | | | | |
Assets: | | | | |
| Unaffiliated investments, at value (cost $3,408,367,500) | | $ | 6,480,047,800 | |
| Affiliated investments, at value (cost $7,844,427) | | | 7,844,427 | |
| Trustees' deferred compensation | | | 160,026 | |
| Receivables: | | | | |
| | Dividends | | | 3,299,820 | |
| | Investments sold | | | 2,023,467 | |
| | Fund shares sold | | | 815,467 | |
| | Foreign tax reclaims | | | 105,494 | |
| | Dividends from affiliates | | | 19,361 | |
| Other assets | | | 49,864 | |
Total Assets | | | 6,494,365,726 | |
Liabilities: | | | | |
| Due to custodian | | | 6 | |
| Payables: | | | — | |
| | Advisory fees | | | 3,413,867 | |
| | Fund shares repurchased | | | 2,846,878 | |
| | Transfer agent fees and expenses | | | 970,481 | |
| | Dividends | | | 747,817 | |
| | Trustees' deferred compensation fees | | | 160,026 | |
| | 12b-1 Distribution and shareholder servicing fees | | | 62,123 | |
| | Trustees' fees and expenses | | | 42,150 | |
| | Professional fees | | | 40,311 | |
| | Affiliated fund administration fees payable | | | 14,224 | |
| | Custodian fees | | | 7,141 | |
| | Accrued expenses and other payables | | | 385,062 | |
Total Liabilities | | | 8,690,086 | |
Net Assets | | $ | 6,485,675,640 | |
| | |
See Notes to Financial Statements. |
| |
10 | MARCH 31, 2023 |
Janus Henderson Growth and Income Fund
Statement of Assets and Liabilities (unaudited)
March 31, 2023
| | | | | | | |
| | | | | | |
| | | | | | | |
Net Assets Consist of: | | | | |
| Capital (par value and paid-in surplus) | | $ | 3,325,297,956 | |
| Total distributable earnings (loss) | | | 3,160,377,684 | |
Total Net Assets | | $ | 6,485,675,640 | |
Net Assets - Class A Shares | | $ | 81,791,202 | |
| Shares Outstanding, $0.01 Par Value (unlimited shares authorized) | | | 1,241,169 | |
Net Asset Value Per Share(1) | | $ | 65.90 | |
Maximum Offering Price Per Share(2) | | $ | 69.92 | |
Net Assets - Class C Shares | | $ | 43,228,065 | |
| Shares Outstanding, $0.01 Par Value (unlimited shares authorized) | | | 667,663 | |
Net Asset Value Per Share(1) | | $ | 64.75 | |
Net Assets - Class D Shares | | $ | 4,011,450,281 | |
| Shares Outstanding, $0.01 Par Value (unlimited shares authorized) | | | 60,751,961 | |
Net Asset Value Per Share | | $ | 66.03 | |
Net Assets - Class I Shares | | $ | 371,833,986 | |
| Shares Outstanding, $0.01 Par Value (unlimited shares authorized) | | | 5,627,902 | |
Net Asset Value Per Share | | $ | 66.07 | |
Net Assets - Class N Shares | | $ | 70,322,259 | |
| Shares Outstanding, $0.01 Par Value (unlimited shares authorized) | | | 1,066,254 | |
Net Asset Value Per Share | | $ | 65.95 | |
Net Assets - Class R Shares | | $ | 5,795,738 | |
| Shares Outstanding, $0.01 Par Value (unlimited shares authorized) | | | 88,631 | |
Net Asset Value Per Share | | $ | 65.39 | |
Net Assets - Class S Shares | | $ | 12,804,168 | |
| Shares Outstanding, $0.01 Par Value (unlimited shares authorized) | | | 194,370 | |
Net Asset Value Per Share | | $ | 65.88 | |
Net Assets - Class T Shares | | $ | 1,888,449,941 | |
| Shares Outstanding, $0.01 Par Value (unlimited shares authorized) | | | 28,631,351 | |
Net Asset Value Per Share | | $ | 65.96 | |
| |
(1) Redemption price per share may be reduced for any applicable contingent deferred sales charge. (2) Maximum offering price is computed at 100/94.25 of net asset value. |
| | |
See Notes to Financial Statements. |
| |
Janus Investment Fund | 11 |
Janus Henderson Growth and Income Fund
Statement of Operations (unaudited)
For the period ended March 31, 2023
| | | | | | |
| | | | | |
Investment Income: | | | |
| Dividends | $ | 66,428,825 | |
| Dividends from affiliates | | 111,998 | |
| Other income | | 17 | |
| Foreign withholding tax income | | 257,388 | |
Total Investment Income | | 66,798,228 | |
Expenses: | | | |
| Advisory fees | | 18,890,671 | |
| 12b-1 Distribution and shareholder servicing fees: | | | |
| | Class A Shares | | 98,461 | |
| | Class C Shares | | 207,294 | |
| | Class R Shares | | 14,648 | |
| | Class S Shares | | 15,769 | |
| Transfer agent administrative fees and expenses: | | | |
| | Class D Shares | | 2,292,949 | |
| | Class R Shares | | 7,343 | |
| | Class S Shares | | 15,859 | |
| | Class T Shares | | 2,302,145 | |
| Transfer agent networking and omnibus fees: | | | |
| | Class A Shares | | 56,495 | |
| | Class C Shares | | 14,516 | |
| | Class I Shares | | 144,385 | |
| Other transfer agent fees and expenses: | | | |
| | Class A Shares | | 2,798 | |
| | Class C Shares | | 1,008 | |
| | Class D Shares | | 206,498 | |
| | Class I Shares | | 10,525 | |
| | Class N Shares | | 1,326 | |
| | Class R Shares | | 89 | |
| | Class S Shares | | 121 | |
| | Class T Shares | | 8,070 | |
| Shareholder reports expense | | 194,494 | |
| Registration fees | | 98,114 | |
| Trustees’ fees and expenses | | 95,269 | |
| Affiliated fund administration fees | | 78,711 | |
| Professional fees | | 58,296 | |
| Custodian fees | | 28,425 | |
| Other expenses | | 204,728 | |
Total Expenses | | 25,049,007 | |
Less: Excess Expense Reimbursement and Waivers | | (146,993) | |
Net Expenses | | 24,902,014 | |
Net Investment Income/(Loss) | | 41,896,214 | |
| | | | | |
| | |
See Notes to Financial Statements. |
| |
12 | MARCH 31, 2023 |
Janus Henderson Growth and Income Fund
Statement of Operations (unaudited)
For the period ended March 31, 2023
| | | | | | |
| | | | | |
Net Realized Gain/(Loss) on Investments: | | | |
| Investments | $ | 95,775,009 | |
| Investments in affiliates | | 1,102 | |
Total Net Realized Gain/(Loss) on Investments | | 95,776,111 | |
Change in Unrealized Net Appreciation/Depreciation: | | | |
| Investments, foreign currency translations and Trustees’ deferred compensation | | 819,096,431 | |
Total Change in Unrealized Net Appreciation/Depreciation | | 819,096,431 | |
Net Increase/(Decrease) in Net Assets Resulting from Operations | $ | 956,768,756 | |
| | | | | |
| | |
See Notes to Financial Statements. |
| |
Janus Investment Fund | 13 |
Janus Henderson Growth and Income Fund
Statements of Changes in Net Assets
| | | | | | | | | |
| | | | | | | | |
| | | Period ended
March 31, 2023 (unaudited) | | Year ended
September 30, 2022 | |
| | | | | | | | | |
Operations: | | | | | | |
| Net investment income/(loss) | $ | 41,896,214 | | $ | 69,392,607 | |
| Net realized gain/(loss) on investments | | 95,776,111 | | | 370,337,386 | |
| Change in unrealized net appreciation/depreciation | | 819,096,431 | | | (1,387,712,807) | |
Net Increase/(Decrease) in Net Assets Resulting from Operations | | 956,768,756 | | | (947,982,814) | |
Dividends and Distributions to Shareholders: | | | | | | |
| | Class A Shares | | (4,444,661) | | | (5,314,593) | |
| | Class C Shares | | (2,454,142) | | | (2,753,238) | |
| | Class D Shares | | (225,288,444) | | | (260,184,925) | |
| | Class I Shares | | (21,266,903) | | | (26,709,382) | |
| | Class N Shares | | (3,729,866) | | | (4,394,143) | |
| | Class R Shares | | (322,263) | | | (391,842) | |
| | Class S Shares | | (725,954) | | | (1,294,942) | |
| | Class T Shares | | (106,474,284) | | | (125,047,566) | |
Net Decrease from Dividends and Distributions to Shareholders | | (364,706,517) | | | (426,090,631) | |
Capital Share Transactions: | | | | | | |
| | Class A Shares | | 2,633,429 | | | (2,581,520) | |
| | Class C Shares | | (926,311) | | | (3,207,945) | |
| | Class D Shares | | 116,551,039 | | | 87,339,620 | |
| | Class I Shares | | (8,269,048) | | | (30,154,463) | |
| | Class N Shares | | 17,672,645 | | | (11,386,114) | |
| | Class R Shares | | (259,730) | | | (565,996) | |
| | Class S Shares | | (462,682) | | | (8,461,564) | |
| | Class T Shares | | 31,819,464 | | | (22,616,596) | |
Net Increase/(Decrease) from Capital Share Transactions | | 158,758,806 | | | 8,365,422 | |
Net Increase/(Decrease) in Net Assets | | 750,821,045 | | | (1,365,708,023) | |
Net Assets: | | | | | | |
| Beginning of period | | 5,734,854,595 | | | 7,100,562,618 | |
| End of period | $ | 6,485,675,640 | | $ | 5,734,854,595 | |
| | | | | | | | |
| | |
See Notes to Financial Statements. |
| |
14 | MARCH 31, 2023 |
Janus Henderson Growth and Income Fund
Financial Highlights
| | | | | | | | | | | | | | | | | | | | | | |
Class A Shares | | | | | | | | | | | | | | | | | | |
For a share outstanding during the period ended March 31, 2023 (unaudited) and the year ended September 30 | 2023 | | | 2022 | | | 2021 | | | 2020 | | | 2019 | | | 2018 | |
| Net Asset Value, Beginning of Period | | $59.86 | | | $73.95 | | | $59.77 | | | $58.49 | | | $59.20 | | | $51.66 | |
| Income/(Loss) from Investment Operations: | | | | | | | | | | | | | | | | | | |
| | Net investment income/(loss)(1) | | 0.36 | | | 0.55 | | | 0.49 | | | 0.80 | | | 1.00 | | | 0.91 | |
| | Net realized and unrealized gain/(loss) | | 9.46 | | | (10.31) | | | 16.06 | | | 2.53 | | | 2.27 | | | 8.49 | |
| Total from Investment Operations | | 9.82 | | | (9.76) | | | 16.55 | | | 3.33 | | | 3.27 | | | 9.40 | |
| Less Dividends and Distributions: | | | | | | | | | | | | | | | | | | |
| | Dividends (from net investment income) | | (0.36) | | | (0.57) | | | (0.51) | | | (0.83) | | | (1.01) | | | (0.91) | |
| | Distributions (from capital gains) | | (3.42) | | | (3.76) | | | (1.86) | | | (1.22) | | | (2.97) | | | (0.95) | |
| Total Dividends and Distributions | | (3.78) | | | (4.33) | | | (2.37) | | | (2.05) | | | (3.98) | | | (1.86) | |
| Net Asset Value, End of Period | | $65.90 | | | $59.86 | | | $73.95 | | | $59.77 | | | $58.49 | | | $59.20 | |
| Total Return* | | 16.71% | | | (14.38)% | | | 28.28% | | | 5.81% | | | 6.53% | | | 18.48% | |
| Net Assets, End of Period (in thousands) | | $81,791 | | | $71,633 | | | $91,735 | | | $80,310 | | | $88,445 | | | $32,284 | |
| Average Net Assets for the Period (in thousands) | | $78,901 | | | $90,358 | | | $88,624 | | | $80,441 | | | $64,525 | | | $25,843 | |
| Ratios to Average Net Assets**: | | | | | | | | | | | | | | | | | | |
| | Ratio of Gross Expenses | | 1.02% | | | 1.01% | | | 1.01% | | | 0.99% | | | 0.95% | | | 0.95% | |
| | Ratio of Net Expenses (After Waivers and Expense Offsets) | | 1.02% | | | 1.01% | | | 1.01% | | | 0.99% | | | 0.95% | | | 0.95% | |
| | Ratio of Net Investment Income/(Loss) | | 1.10% | | | 0.77% | | | 0.71% | | | 1.41% | | | 1.79% | | | 1.63% | |
| Portfolio Turnover Rate | | 10% | | | 17% | | | 11% | | | 24% | | | 13% | | | 13% | |
| | | | | | | | | | | | | | | | | | | | | | |
| |
* Total return includes adjustments in accordance with generally accepted accounting principles required at the year or period end and are not annualized for periods of less than one full year. ** Annualized for periods of less than one full year. (1) Per share amounts are calculated based on average shares outstanding during the year or period. |
| | |
See Notes to Financial Statements. |
| |
Janus Investment Fund | 15 |
Janus Henderson Growth and Income Fund
Financial Highlights
| | | | | | | | | | | | | | | | | | | | | | |
Class C Shares | | | | | | | | | | | | | | | | | | |
For a share outstanding during the period ended March 31, 2023 (unaudited) and the year ended September 30 | 2023 | | | 2022 | | | 2021 | | | 2020 | | | 2019 | | | 2018 | |
| Net Asset Value, Beginning of Period | | $58.87 | | | $72.81 | | | $58.90 | | | $57.68 | | | $58.46 | | | $51.07 | |
| Income/(Loss) from Investment Operations: | | | | | | | | | | | | | | | | | | |
| | Net investment income/(loss)(1) | | 0.15 | | | 0.10 | | | 0.05 | | | 0.43 | | | 0.56 | | | 0.49 | |
| | Net realized and unrealized gain/(loss) | | 9.31 | | | (10.13) | | | 15.82 | | | 2.49 | | | 2.26 | | | 8.39 | |
| Total from Investment Operations | | 9.46 | | | (10.03) | | | 15.87 | | | 2.92 | | | 2.82 | | | 8.88 | |
| Less Dividends and Distributions: | | | | | | | | | | | | | | | | | | |
| | Dividends (from net investment income) | | (0.16) | | | (0.15) | | | (0.10) | | | (0.48) | | | (0.63) | | | (0.54) | |
| | Distributions (from capital gains) | | (3.42) | | | (3.76) | | | (1.86) | | | (1.22) | | | (2.97) | | | (0.95) | |
| Total Dividends and Distributions | | (3.58) | | | (3.91) | | | (1.96) | | | (1.70) | | | (3.60) | | | (1.49) | |
| Net Asset Value, End of Period | | $64.75 | | | $58.87 | | | $72.81 | | | $58.90 | | | $57.68 | | | $58.46 | |
| Total Return* | | 16.36% | | | (14.93)% | | | 27.48% | | | 5.12% | | | 5.75% | | | 17.59% | |
| Net Assets, End of Period (in thousands) | | $43,228 | | | $40,161 | | | $53,156 | | | $49,982 | | | $59,591 | | | $25,899 | |
| Average Net Assets for the Period (in thousands) | | $44,101 | | | $50,122 | | | $53,200 | | | $55,935 | | | $42,229 | | | $22,813 | |
| Ratios to Average Net Assets**: | | | | | | | | | | | | | | | | | | |
| | Ratio of Gross Expenses | | 1.64% | | | 1.64% | | | 1.65% | | | 1.64% | | | 1.69% | | | 1.68% | |
| | Ratio of Net Expenses (After Waivers and Expense Offsets) | | 1.64% | | | 1.64% | | | 1.65% | | | 1.64% | | | 1.69% | | | 1.68% | |
| | Ratio of Net Investment Income/(Loss) | | 0.49% | | | 0.15% | | | 0.08% | | | 0.77% | | | 1.02% | | | 0.90% | |
| Portfolio Turnover Rate | | 10% | | | 17% | | | 11% | | | 24% | | | 13% | | | 13% | |
| | | | | | | | | | | | | | | | | | | | | | |
| |
* Total return includes adjustments in accordance with generally accepted accounting principles required at the year or period end and are not annualized for periods of less than one full year. ** Annualized for periods of less than one full year. (1) Per share amounts are calculated based on average shares outstanding during the year or period. |
| | |
See Notes to Financial Statements. |
| |
16 | MARCH 31, 2023 |
Janus Henderson Growth and Income Fund
Financial Highlights
| | | | | | | | | | | | | | | | | | | | | | |
Class D Shares | | | | | | | | | | | | | | | | | | |
For a share outstanding during the period ended March 31, 2023 (unaudited) and the year ended September 30 | 2023 | | | 2022 | | | 2021 | | | 2020 | | | 2019 | | | 2018 | |
| Net Asset Value, Beginning of Period | | $59.97 | | | $74.09 | | | $59.87 | | | $58.58 | | | $59.27 | | | $51.71 | |
| Income/(Loss) from Investment Operations: | | | | | | | | | | | | | | | | | | |
| | Net investment income/(loss)(1) | | 0.44 | | | 0.74 | | | 0.67 | | | 0.93 | | | 1.09 | | | 1.01 | |
| | Net realized and unrealized gain/(loss) | | 9.48 | | | (10.34) | | | 16.11 | | | 2.54 | | | 2.28 | | | 8.51 | |
| Total from Investment Operations | | 9.92 | | | (9.60) | | | 16.78 | | | 3.47 | | | 3.37 | | | 9.52 | |
| Less Dividends and Distributions: | | | | | | | | | | | | | | | | | | |
| | Dividends (from net investment income) | | (0.44) | | | (0.76) | | | (0.70) | | | (0.96) | | | (1.09) | | | (1.01) | |
| | Distributions (from capital gains) | | (3.42) | | | (3.76) | | | (1.86) | | | (1.22) | | | (2.97) | | | (0.95) | |
| Total Dividends and Distributions | | (3.86) | | | (4.52) | | | (2.56) | | | (2.18) | | | (4.06) | | | (1.96) | |
| Net Asset Value, End of Period | | $66.03 | | | $59.97 | | | $74.09 | | | $59.87 | | | $58.58 | | | $59.27 | |
| Total Return* | | 16.86% | | | (14.17)% | | | 28.63% | | | 6.07% | | | 6.71% | | | 18.69% | |
| Net Assets, End of Period (in thousands) | | $4,011,450 | | | $3,529,397 | | | $4,284,567 | | | $3,506,038 | | | $3,546,939 | | | $3,508,493 | |
| Average Net Assets for the Period (in thousands) | | $3,893,051 | | | $4,238,795 | | | $4,038,177 | | | $3,410,901 | | | $3,396,252 | | | $3,349,596 | |
| Ratios to Average Net Assets**: | | | | | | | | | | | | | | | | | | |
| | Ratio of Gross Expenses | | 0.76% | | | 0.75% | | | 0.75% | | | 0.76% | | | 0.76% | | | 0.77% | |
| | Ratio of Net Expenses (After Waivers and Expense Offsets) | | 0.76% | | | 0.75% | | | 0.75% | | | 0.76% | | | 0.76% | | | 0.77% | |
| | Ratio of Net Investment Income/(Loss) | | 1.37% | | | 1.04% | | | 0.97% | | | 1.64% | | | 1.95% | | | 1.80% | |
| Portfolio Turnover Rate | | 10% | | | 17% | | | 11% | | | 24% | | | 13% | | | 13% | |
| | | | | | | | | | | | | | | | | | | | | | |
| |
* Total return includes adjustments in accordance with generally accepted accounting principles required at the year or period end and are not annualized for periods of less than one full year. ** Annualized for periods of less than one full year. (1) Per share amounts are calculated based on average shares outstanding during the year or period. |
| | |
See Notes to Financial Statements. |
| |
Janus Investment Fund | 17 |
Janus Henderson Growth and Income Fund
Financial Highlights
| | | | | | | | | | | | | | | | | | | | | | |
Class I Shares | | | | | | | | | | | | | | | | | | |
For a share outstanding during the period ended March 31, 2023 (unaudited) and the year ended September 30 | 2023 | | | 2022 | | | 2021 | | | 2020 | | | 2019 | | | 2018 | |
| Net Asset Value, Beginning of Period | | $60.00 | | | $74.12 | | | $59.90 | | | $58.61 | | | $59.29 | | | $51.74 | |
| Income/(Loss) from Investment Operations: | | | | | | | | | | | | | | | | | | |
| | Net investment income/(loss)(1) | | 0.46 | | | 0.78 | | | 0.71 | | | 0.97 | | | 1.13 | | | 1.05 | |
| | Net realized and unrealized gain/(loss) | | 9.49 | | | (10.35) | | | 16.10 | | | 2.52 | | | 2.29 | | | 8.50 | |
| Total from Investment Operations | | 9.95 | | | (9.57) | | | 16.81 | | | 3.49 | | | 3.42 | | | 9.55 | |
| Less Dividends and Distributions: | | | | | | | | | | | | | | | | | | |
| | Dividends (from net investment income) | | (0.46) | | | (0.79) | | | (0.73) | | | (0.98) | | | (1.13) | | | (1.05) | |
| | Distributions (from capital gains) | | (3.42) | | | (3.76) | | | (1.86) | | | (1.22) | | | (2.97) | | | (0.95) | |
| Total Dividends and Distributions | | (3.88) | | | (4.55) | | | (2.59) | | | (2.20) | | | (4.10) | | | (2.00) | |
| Net Asset Value, End of Period | | $66.07 | | | $60.00 | | | $74.12 | | | $59.90 | | | $58.61 | | | $59.29 | |
| Total Return* | | 16.90% | | | (14.12)% | | | 28.68% | | | 6.11% | | | 6.80% | | | 18.75% | |
| Net Assets, End of Period (in thousands) | | $371,834 | | | $344,524 | | | $458,387 | | | $429,567 | | | $537,792 | | | $175,321 | |
| Average Net Assets for the Period (in thousands) | | $367,084 | | | $425,515 | | | $443,087 | | | $500,070 | | | $359,418 | | | $129,552 | |
| Ratios to Average Net Assets**: | | | | | | | | | | | | | | | | | | |
| | Ratio of Gross Expenses | | 0.70% | | | 0.70% | | | 0.70% | | | 0.71% | | | 0.71% | | | 0.69% | |
| | Ratio of Net Expenses (After Waivers and Expense Offsets) | | 0.70% | | | 0.70% | | | 0.70% | | | 0.71% | | | 0.71% | | | 0.69% | |
| | Ratio of Net Investment Income/(Loss) | | 1.42% | | | 1.08% | | | 1.03% | | | 1.70% | | | 2.02% | | | 1.88% | |
| Portfolio Turnover Rate | | 10% | | | 17% | | | 11% | | | 24% | | | 13% | | | 13% | |
| | | | | | | | | | | | | | | | | | | | | | |
| |
* Total return includes adjustments in accordance with generally accepted accounting principles required at the year or period end and are not annualized for periods of less than one full year. ** Annualized for periods of less than one full year. (1) Per share amounts are calculated based on average shares outstanding during the year or period. |
| | |
See Notes to Financial Statements. |
| |
18 | MARCH 31, 2023 |
Janus Henderson Growth and Income Fund
Financial Highlights
| | | | | | | | | | | | | | | | | | | | | | |
Class N Shares | | | | | | | | | | | | | | | | | | |
For a share outstanding during the period ended March 31, 2023 (unaudited) and the year ended September 30 | 2023 | | | 2022 | | | 2021 | | | 2020 | | | 2019 | | | 2018 | |
| Net Asset Value, Beginning of Period | | $59.90 | | | $74.01 | | | $59.80 | | | $58.52 | | | $59.22 | | | $51.67 | |
| Income/(Loss) from Investment Operations: | | | | | | | | | | | | | | | | | | |
| | Net investment income/(loss)(1) | | 0.48 | | | 0.84 | | | 0.76 | | | 1.00 | | | 1.14 | | | 1.12 | |
| | Net realized and unrealized gain/(loss) | | 9.47 | | | (10.35) | | | 16.09 | | | 2.53 | | | 2.30 | | | 8.45 | |
| Total from Investment Operations | | 9.95 | | | (9.51) | | | 16.85 | | | 3.53 | | | 3.44 | | | 9.57 | |
| Less Dividends and Distributions: | | | | | | | | | | | | | | | | | | |
| | Dividends (from net investment income) | | (0.48) | | | (0.84) | | | (0.78) | | | (1.03) | | | (1.17) | | | (1.07) | |
| | Distributions (from capital gains) | | (3.42) | | | (3.76) | | | (1.86) | | | (1.22) | | | (2.97) | | | (0.95) | |
| Total Dividends and Distributions | | (3.90) | | | (4.60) | | | (2.64) | | | (2.25) | | | (4.14) | | | (2.02) | |
| Net Asset Value, End of Period | | $65.95 | | | $59.90 | | | $74.01 | | | $59.80 | | | $58.52 | | | $59.22 | |
| Total Return* | | 16.94% | | | (14.06)% | | | 28.81% | | | 6.20% | | | 6.85% | | | 18.83% | |
| Net Assets, End of Period (in thousands) | | $70,322 | | | $47,906 | | | $73,167 | | | $55,506 | | | $40,399 | | | $8,802 | |
| Average Net Assets for the Period (in thousands) | | $61,159 | | | $73,633 | | | $65,537 | | | $50,678 | | | $17,524 | | | $7,427 | |
| Ratios to Average Net Assets**: | | | | | | | | | | | | | | | | | | |
| | Ratio of Gross Expenses | | 0.63% | | | 0.63% | | | 0.62% | | | 0.63% | | | 0.64% | | | 0.65% | |
| | Ratio of Net Expenses (After Waivers and Expense Offsets) | | 0.63% | | | 0.63% | | | 0.62% | | | 0.63% | | | 0.64% | | | 0.65% | |
| | Ratio of Net Investment Income/(Loss) | | 1.48% | | | 1.17% | | | 1.09% | | | 1.76% | | | 2.04% | | | 2.00% | |
| Portfolio Turnover Rate | | 10% | | | 17% | | | 11% | | | 24% | | | 13% | | | 13% | |
| | | | | | | | | | | | | | | | | | | | | | |
| |
* Total return includes adjustments in accordance with generally accepted accounting principles required at the year or period end and are not annualized for periods of less than one full year. ** Annualized for periods of less than one full year. (1) Per share amounts are calculated based on average shares outstanding during the year or period. |
| | |
See Notes to Financial Statements. |
| |
Janus Investment Fund | 19 |
Janus Henderson Growth and Income Fund
Financial Highlights
| | | | | | | | | | | | | | | | | | | | | | |
Class R Shares | | | | | | | | | | | | | | | | | | |
For a share outstanding during the period ended March 31, 2023 (unaudited) and the year ended September 30 | 2023 | | | 2022 | | | 2021 | | | 2020 | | | 2019 | | | 2018 | |
| Net Asset Value, Beginning of Period | | $59.42 | | | $73.44 | | | $59.35 | | | $58.10 | | | $58.86 | | | $51.40 | |
| Income/(Loss) from Investment Operations: | | | | | | | | | | | | | | | | | | |
| | Net investment income/(loss)(1) | | 0.23 | | | 0.27 | | | 0.23 | | | 0.57 | | | 0.72 | | | 0.65 | |
| | Net realized and unrealized gain/(loss) | | 9.38 | | | (10.23) | | | 15.95 | | | 2.51 | | | 2.27 | | | 8.44 | |
| Total from Investment Operations | | 9.61 | | | (9.96) | | | 16.18 | | | 3.08 | | | 2.99 | | | 9.09 | |
| Less Dividends and Distributions: | | | | | | | | | | | | | | | | | | |
| | Dividends (from net investment income) | | (0.22) | | | (0.30) | | | (0.23) | | | (0.61) | | | (0.78) | | | (0.68) | |
| | Distributions (from capital gains) | | (3.42) | | | (3.76) | | | (1.86) | | | (1.22) | | | (2.97) | | | (0.95) | |
| Total Dividends and Distributions | | (3.64) | | | (4.06) | | | (2.09) | | | (1.83) | | | (3.75) | | | (1.63) | |
| Net Asset Value, End of Period | | $65.39 | | | $59.42 | | | $73.44 | | | $59.35 | | | $58.10 | | | $58.86 | |
| Total Return* | | 16.47% | | | (14.72)% | | | 27.82% | | | 5.38% | | | 6.03% | | | 17.92% | |
| Net Assets, End of Period (in thousands) | | $5,796 | | | $5,477 | | | $7,329 | | | $8,023 | | | $7,760 | | | $5,244 | |
| Average Net Assets for the Period (in thousands) | | $5,889 | | | $6,786 | | | $8,987 | | | $8,032 | | | $6,321 | | | $3,952 | |
| Ratios to Average Net Assets**: | | | | | | | | | | | | | | | | | | |
| | Ratio of Gross Expenses | | 1.42% | | | 1.40% | | | 1.39% | | | 1.40% | | | 1.42% | | | 1.41% | |
| | Ratio of Net Expenses (After Waivers and Expense Offsets) | | 1.42% | | | 1.40% | | | 1.39% | | | 1.40% | | | 1.42% | | | 1.41% | |
| | Ratio of Net Investment Income/(Loss) | | 0.71% | | | 0.38% | | | 0.34% | | | 1.00% | | | 1.30% | | | 1.18% | |
| Portfolio Turnover Rate | | 10% | | | 17% | | | 11% | | | 24% | | | 13% | | | 13% | |
| | | | | | | | | | | | | | | | | | | | | | |
| |
* Total return includes adjustments in accordance with generally accepted accounting principles required at the year or period end and are not annualized for periods of less than one full year. ** Annualized for periods of less than one full year. (1) Per share amounts are calculated based on average shares outstanding during the year or period. |
| | |
See Notes to Financial Statements. |
| |
20 | MARCH 31, 2023 |
Janus Henderson Growth and Income Fund
Financial Highlights
| | | | | | | | | | | | | | | | | | | | | | |
Class S Shares | | | | | | | | | | | | | | | | | | |
For a share outstanding during the period ended March 31, 2023 (unaudited) and the year ended September 30 | 2023 | | | 2022 | | | 2021 | | | 2020 | | | 2019 | | | 2018 | |
| Net Asset Value, Beginning of Period | | $59.83 | | | $73.92 | | | $59.74 | | | $58.47 | | | $59.17 | | | $51.63 | |
| Income/(Loss) from Investment Operations: | | | | | | | | | | | | | | | | | | |
| | Net investment income/(loss)(1) | | 0.32 | | | 0.46 | | | 0.42 | | | 0.72 | | | 0.89 | | | 0.80 | |
| | Net realized and unrealized gain/(loss) | | 9.47 | | | (10.31) | | | 16.05 | | | 2.53 | | | 2.28 | | | 8.50 | |
| Total from Investment Operations | | 9.79 | | | (9.85) | | | 16.47 | | | 3.25 | | | 3.17 | | | 9.30 | |
| Less Dividends and Distributions: | | | | | | | | | | | | | | | | | | |
| | Dividends (from net investment income) | | (0.32) | | | (0.48) | | | (0.43) | | | (0.76) | | | (0.90) | | | (0.81) | |
| | Distributions (from capital gains) | | (3.42) | | | (3.76) | | | (1.86) | | | (1.22) | | | (2.97) | | | (0.95) | |
| Total Dividends and Distributions | | (3.74) | | | (4.24) | | | (2.29) | | | (1.98) | | | (3.87) | | | (1.76) | |
| Net Asset Value, End of Period | | $65.88 | | | $59.83 | | | $73.92 | | | $59.74 | | | $58.47 | | | $59.17 | |
| Total Return* | | 16.67% | | | (14.49)% | | | 28.15% | | | 5.67% | | | 6.34% | | | 18.27% | |
| Net Assets, End of Period (in thousands) | | $12,804 | | | $12,049 | | | $23,935 | | | $22,870 | | | $24,559 | | | $23,236 | |
| Average Net Assets for the Period (in thousands) | | $12,718 | | | $19,602 | | | $23,621 | | | $23,489 | | | $22,203 | | | $24,627 | |
| Ratios to Average Net Assets**: | | | | | | | | | | | | | | | | | | |
| | Ratio of Gross Expenses | | 1.14% | | | 1.13% | | | 1.13% | | | 1.13% | | | 1.13% | | | 1.13% | |
| | Ratio of Net Expenses (After Waivers and Expense Offsets) | | 1.13% | | | 1.12% | | | 1.12% | | | 1.13% | | | 1.12% | | | 1.12% | |
| | Ratio of Net Investment Income/(Loss) | | 1.00% | | | 0.63% | | | 0.61% | | | 1.28% | | | 1.59% | | | 1.43% | |
| Portfolio Turnover Rate | | 10% | | | 17% | | | 11% | | | 24% | | | 13% | | | 13% | |
| | | | | | | | | | | | | | | | | | | | | | |
| |
* Total return includes adjustments in accordance with generally accepted accounting principles required at the year or period end and are not annualized for periods of less than one full year. ** Annualized for periods of less than one full year. (1) Per share amounts are calculated based on average shares outstanding during the year or period. |
| | |
See Notes to Financial Statements. |
| |
Janus Investment Fund | 21 |
Janus Henderson Growth and Income Fund
Financial Highlights
| | | | | | | | | | | | | | | | | | | | | | |
Class T Shares | | | | | | | | | | | | | | | | | | |
For a share outstanding during the period ended March 31, 2023 (unaudited) and the year ended September 30 | 2023 | | | 2022 | | | 2021 | | | 2020 | | | 2019 | | | 2018 | |
| Net Asset Value, Beginning of Period | | $59.90 | | | $74.01 | | | $59.81 | | | $58.53 | | | $59.22 | | | $51.68 | |
| Income/(Loss) from Investment Operations: | | | | | | | | | | | | | | | | | | |
| | Net investment income/(loss)(1) | | 0.41 | | | 0.67 | | | 0.60 | | | 0.88 | | | 1.04 | | | 0.95 | |
| | Net realized and unrealized gain/(loss) | | 9.48 | | | (10.34) | | | 16.08 | | | 2.52 | | | 2.28 | | | 8.49 | |
| Total from Investment Operations | | 9.89 | | | (9.67) | | | 16.68 | | | 3.40 | | | 3.32 | | | 9.44 | |
| Less Dividends and Distributions: | | | | | | | | | | | | | | | | | | |
| | Dividends (from net investment income) | | (0.41) | | | (0.68) | | | (0.62) | | | (0.90) | | | (1.04) | | | (0.95) | |
| | Distributions (from capital gains) | | (3.42) | | | (3.76) | | | (1.86) | | | (1.22) | | | (2.97) | | | (0.95) | |
| Total Dividends and Distributions | | (3.83) | | | (4.44) | | | (2.48) | | | (2.12) | | | (4.01) | | | (1.90) | |
| Net Asset Value, End of Period | | $65.96 | | | $59.90 | | | $74.01 | | | $59.81 | | | $58.53 | | | $59.22 | |
| Total Return* | | 16.82% | | | (14.26)% | | | 28.49% | | | 5.95% | | | 6.62% | | | 18.56% | |
| Net Assets, End of Period (in thousands) | | $1,888,450 | | | $1,683,707 | | | $2,108,286 | | | $1,805,935 | | | $1,996,900 | | | $1,842,777 | |
| Average Net Assets for the Period (in thousands) | | $1,845,150 | | | $2,048,237 | | | $2,025,668 | | | $1,863,456 | | | $1,852,659 | | | $1,735,754 | |
| Ratios to Average Net Assets**: | | | | | | | | | | | | | | | | | | |
| | Ratio of Gross Expenses | | 0.87% | | | 0.87% | | | 0.87% | | | 0.87% | | | 0.87% | | | 0.87% | |
| | Ratio of Net Expenses (After Waivers and Expense Offsets) | | 0.85% | | | 0.85% | | | 0.86% | | | 0.86% | | | 0.86% | | | 0.86% | |
| | Ratio of Net Investment Income/(Loss) | | 1.27% | | | 0.93% | | | 0.87% | | | 1.54% | | | 1.86% | | | 1.71% | |
| Portfolio Turnover Rate | | 10% | | | 17% | | | 11% | | | 24% | | | 13% | | | 13% | |
| | | | | | | | | | | | | | | | | | | | | | |
| |
* Total return includes adjustments in accordance with generally accepted accounting principles required at the year or period end and are not annualized for periods of less than one full year. ** Annualized for periods of less than one full year. (1) Per share amounts are calculated based on average shares outstanding during the year or period. |
| | |
See Notes to Financial Statements. |
| |
22 | MARCH 31, 2023 |
Janus Henderson Growth and Income Fund
Notes to Financial Statements (unaudited)
1. Organization and Significant Accounting Policies
Janus Henderson Growth and Income Fund (the “Fund”) is a series of Janus Investment Fund (the “Trust”), which is organized as a Massachusetts business trust and is registered under the Investment Company Act of 1940, as amended (the “1940 Act”), as an open-end management investment company, and therefore has applied the specialized accounting and reporting guidance in Financial Accounting Standards Board (“FASB”) Accounting Standards Codification (“ASC”) Topic 946. The Trust offers 40 funds, each of which offers multiple share classes, with differing investment objectives and policies. The Fund seeks long-term capital growth and current income. The Fund is classified as diversified, as defined in the 1940 Act. Janus Henderson Investors US LLC is the investment adviser (the “Adviser”) to the Fund.
The Fund offers multiple classes of shares in order to meet the needs of various types of investors. Each class represents an interest in the same portfolio of investments. Certain financial intermediaries may not offer all classes of shares.
Shareholders, including other funds, individuals, accounts, as well as the Fund’s portfolio manager(s) and/or investment personnel, may from time to time own (beneficially or of record) a significant percentage of the Fund’s Shares and can be considered to “control” the Fund when that ownership exceeds 25% of the Fund’s assets (and which may differ from control as determined in accordance with United States of America generally accepted accounting principles ("US GAAP")).
Class A Shares are offered through financial intermediary platforms including, but not limited to, traditional brokerage platforms, mutual fund wrap fee programs, bank trust platforms, and retirement platforms.
Class C Shares are offered through financial intermediary platforms including, but not limited to, traditional brokerage platforms, mutual fund wrap fee programs, and bank trust platforms.
Class C Shares are closed to investments by new employer-sponsored retirement plans and existing employer-sponsored retirement plans are no longer able to make additional purchases or exchanges into Class C Shares.
The Fund currently implements an automatic conversion feature pursuant to which Class C Shares that have been held for eight years are automatically converted to Class A Shares without the imposition of any sales charge, fee or other charge. The conversion will generally occur no later than ten business days in the month following the month of the eighth anniversary of the date of purchase. Class C Shares purchased through the reinvestment of dividends and other distributions on Class C Shares will convert to Class A Shares at the same time as the original Class C Shares with respect to which they were purchased. For Class C Shares held in omnibus accounts on intermediary platforms, the Fund relies on these intermediaries to implement this conversion feature. Your financial intermediary may have separate policies and procedures as to when and how Class C Shares may be converted to Class A Shares.
Effective July 6, 2020, Class D Shares are available to new investors, subject to any closed fund policies for a Fund, as applicable. Previously, Class D Shares were only available to investors who already had a direct account with the Janus Henderson funds; immediate family members or members of the same household of an eligible individual investor; and existing beneficial owners of sole proprietorships or partnerships that hold accounts directly with the Janus Henderson funds.
Class I Shares are available through certain financial intermediary platforms including, but not limited to, mutual fund wrap fee programs, managed account programs, asset allocation programs, bank trust platforms, as well as certain retirement platforms. Class I Shares are also available to certain direct institutional investors including, but not limited to, corporations, certain retirement plans, public plans, and foundations/endowments, who established Class I Share accounts before August 4, 2017.
Class N Shares are generally available only to financial intermediaries purchasing on behalf of: 1) certain adviser-assisted, employer-sponsored retirement plans, including 401(k) plans, 457 plans, 403(b) plans, Taft-Hartley multi-employer plans, profit-sharing and money purchase pension plans, defined benefit plans and certain welfare benefit plans, such as health savings accounts, and nonqualified deferred compensation plans; and 2) retail investors purchasing in qualified or nonqualified accounts, whose accounts are held through an omnibus account at their financial intermediary, and where the financial intermediary requires no payment or reimbursement from the Fund, the Adviser, or its affiliates. Class N Shares are also available to Janus Henderson proprietary products and to certain direct institutional investors approved by Janus Henderson Distributors US LLC (the “Distributor”) including, but not limited to,
Janus Henderson Growth and Income Fund
Notes to Financial Statements (unaudited)
corporations, certain retirement plans, public plans, and foundations and endowments, subject to minimum investment requirements.
Class R Shares are offered through financial intermediary platforms including, but not limited to, retirement platforms.
Class S Shares are offered through financial intermediary platforms including, but not limited to, retirement platforms and asset allocation, mutual fund wrap, or other discretionary or nondiscretionary fee-based investment advisory programs. In addition, Class S Shares may be available through certain financial intermediaries who have an agreement with the Adviser or its affiliates to offer Class S Shares on their supermarket platforms.
Class T Shares are available through certain financial intermediary platforms including, but not limited to, mutual fund wrap fee programs, managed account programs, asset allocation programs, bank trust platforms, as well as certain retirement platforms. In addition, Class T Shares may be available through certain financial intermediaries who have an agreement with the Adviser or its affiliates to offer Class T Shares on their supermarket platforms.
The following accounting policies have been followed by the Fund and are in conformity with US GAAP.
Investment Valuation
Fund holdings are valued in accordance with policies and procedures established by the Adviser pursuant to Rule 2a-5 under the 1940 Act and approved by and subject to the oversight of the Trustees (the “Valuation Procedures”). Equity securities traded on a domestic securities exchange are generally valued at readily available market quotations, which are (i) the official close prices or (ii) last sale prices on the primary market or exchange in which the securities trade. If such price is lacking for the trading period immediately preceding the time of determination, such securities are generally valued at their current bid price. Equity securities that are traded on a foreign exchange are generally valued at the closing prices on such markets. In the event that there is no current trading volume on a particular security in such foreign exchange, the bid price from the primary exchange is generally used to value the security. Foreign securities and currencies are converted to U.S. dollars using the current spot USD dollar exchange rate in effect at the close of the New York Stock Exchange (“NYSE”). The Fund will determine the market value of individual securities held by it by using prices provided by one or more approved professional pricing services or, as needed, by obtaining market quotations from independent broker-dealers. Most debt securities are valued in accordance with the evaluated bid price supplied by the Adviser-approved pricing service that is intended to reflect market value. The evaluated bid price supplied by the pricing service is an evaluation that may consider factors such as security prices, yields, maturities and ratings. Certain short-term securities maturing within 60 days or less may be evaluated and valued on an amortized cost basis provided that the amortized cost determined approximates market value. Securities for which market quotations or evaluated prices are not readily available or deemed unreliable are valued at fair value determined in good faith by the Adviser pursuant to the Valuation Procedures. Circumstances in which fair valuation may be utilized include, but are not limited to: (i) a significant event that may affect the securities of a single issuer, such as a merger, bankruptcy, or significant issuer-specific development; (ii) an event that may affect an entire market, such as a natural disaster or significant governmental action; (iii) a nonsignificant event such as a market closing early or not opening, or a security trading halt; and (iv) pricing of a nonvalued security and a restricted or nonpublic security. Special valuation considerations may apply with respect to “odd-lot” fixed-income transactions which, due to their small size, may receive evaluated prices by pricing services which reflect a large block trade and not what actually could be obtained for the odd-lot position. The valuation policies provide for the use of systematic fair valuation models provided by independent pricing services to value foreign equity securities in order to adjust for stale pricing, which may occur between the close of certain foreign exchanges and the close of the NYSE. The value of the securities of other mutual funds held by a Fund, if any, will be calculated using the NAV of such mutual funds.
Valuation Inputs Summary
FASB ASC 820, Fair Value Measurements and Disclosures (“ASC 820”), defines fair value, establishes a framework for measuring fair value, and expands disclosure requirements regarding fair value measurements. This standard emphasizes that fair value is a market-based measurement that should be determined based on the assumptions that market participants would use in pricing an asset or liability and establishes a hierarchy that prioritizes inputs to valuation techniques used to measure fair value. These inputs are summarized into three broad levels:
Level 1 – Unadjusted quoted prices in active markets the Fund has the ability to access for identical assets or liabilities.
Janus Henderson Growth and Income Fund
Notes to Financial Statements (unaudited)
Level 2 – Observable inputs other than unadjusted quoted prices included in Level 1 that are observable for the asset or liability either directly or indirectly. These inputs may include quoted prices for the identical instrument on an inactive market, prices for similar instruments, interest rates, prepayment speeds, credit risk, yield curves, default rates and similar data.
Assets or liabilities categorized as Level 2 in the hierarchy generally include: debt securities fair valued in accordance with the evaluated bid or ask prices supplied by a pricing service; securities traded on OTC markets and listed securities for which no sales are reported that are fair valued at the latest bid price (or yield equivalent thereof) obtained from one or more dealers transacting in a market for such securities or by a pricing service approved by the Fund’s Trustees; certain short-term debt securities with maturities of 60 days or less that are fair valued at amortized cost; and equity securities of foreign issuers whose fair value is determined by using systematic fair valuation models provided by independent third parties in order to adjust for stale pricing which may occur between the close of certain foreign exchanges and the close of the NYSE. Other securities that may be categorized as Level 2 in the hierarchy include, but are not limited to, preferred stocks, bank loans, swaps, investments in unregistered investment companies, options, and forward contracts.
Level 3 – Unobservable inputs for the asset or liability to the extent that relevant observable inputs are not available, representing the Fund’s own assumptions about the assumptions that a market participant would use in valuing the asset or liability, and that would be based on the best information available.
There have been no significant changes in valuation techniques used in valuing any such positions held by the Fund since the beginning of the fiscal period.
The inputs or methodology used for fair valuing securities are not necessarily an indication of the risk associated with investing in those securities. The summary of inputs used as of March 31, 2023 to fair value the Fund’s investments in securities and other financial instruments is included in the “Valuation Inputs Summary” in the Notes to Schedule of Investments and Other Information.
Investment Transactions and Investment Income
Investment transactions are accounted for as of the date purchased or sold (trade date). Dividend income is recorded on the ex-dividend date. Certain dividends from foreign securities will be recorded as soon as the Fund is informed of the dividend, if such information is obtained subsequent to the ex-dividend date. Dividends from foreign securities may be subject to withholding taxes in foreign jurisdictions. Non-cash dividends, if any, are recorded on the ex-dividend date at fair value. Interest income is recorded daily on an accrual basis and includes amortization of premiums and accretion of discounts. The Fund classifies gains and losses on prepayments received as an adjustment to interest income. Debt securities may be placed in non-accrual status and related interest income may be reduced by stopping current accruals and writing off interest receivables when collection of all or a portion of interest has become doubtful. Gains and losses are determined on the identified cost basis, which is the same basis used for federal income tax purposes. Income, as well as gains and losses, both realized and unrealized, are allocated daily to each class of shares based upon the ratio of net assets represented by each class as a percentage of total net assets.
Expenses
The Fund bears expenses incurred specifically on its behalf. Each class of shares bears a portion of general expenses, which are allocated daily to each class of shares based upon the ratio of net assets represented by each class as a percentage of total net assets. Expenses directly attributable to a specific class of shares are charged against the operations of such class.
Estimates
The preparation of financial statements in conformity with US GAAP requires management to make estimates and assumptions that affect the reported amount of assets and liabilities and disclosure of contingent assets and liabilities at the date of the financial statements, and the reported amounts of income and expenses during the reporting period. Actual results could differ from those estimates.
Indemnifications
In the normal course of business, the Fund may enter into contracts that contain provisions for indemnification of other parties against certain potential liabilities. The Fund’s maximum exposure under these arrangements is unknown, and would involve future claims that may be made against the Fund that have not yet occurred. Currently, the risk of material loss from such claims is considered remote.
Janus Henderson Growth and Income Fund
Notes to Financial Statements (unaudited)
Foreign Currency Translations
The Fund does not isolate that portion of the results of operations resulting from the effect of changes in foreign exchange rates on investments from the fluctuations arising from changes in market prices of securities held at the date of the financial statements. Net unrealized appreciation or depreciation of investments and foreign currency translations arise from changes in the value of assets and liabilities, including investments in securities held at the date of the financial statements, resulting from changes in the exchange rates and changes in market prices of securities held.
Currency gains and losses are also calculated on payables and receivables that are denominated in foreign currencies. The payables and receivables are generally related to foreign security transactions and income translations.
Foreign currency-denominated assets and forward currency contracts may involve more risks than domestic transactions, including currency risk, counterparty risk, political and economic risk, regulatory risk and equity risk. Risks may arise from unanticipated movements in the value of foreign currencies relative to the U.S. dollar.
Dividends and Distributions
Dividends of net investment income are generally declared and distributed quarterly, and realized capital gains (if any) are distributed annually. The Fund may treat a portion of the amount paid to redeem shares as a distribution of investment company taxable income and realized capital gains that are reflected in the net asset value. This practice, commonly referred to as “equalization,” has no effect on the redeeming shareholder or a Fund’s total return, but may reduce the amounts that would otherwise be required to be paid as taxable dividends to the remaining shareholders. It is possible that the Internal Revenue Service (IRS) could challenge the Fund's equalization methodology or calculations, and any such challenge could result in additional tax, interest, or penalties to be paid by the Fund.
The Fund may make certain investments in real estate investment trusts (“REITs���) which pay dividends to their shareholders based upon funds available from operations. It is quite common for these dividends to exceed the REITs’ taxable earnings and profits, resulting in the excess portion of such dividends being designated as a return of capital. If the Fund distributes such amounts, such distributions could constitute a return of capital to shareholders for federal income tax purposes.
Federal Income Taxes
The Fund intends to continue to qualify as a regulated investment company and distribute all of its taxable income in accordance with the requirements of Subchapter M of the Internal Revenue Code. Management has analyzed the Fund’s tax positions taken for all open federal income tax years, generally a three-year period, and has concluded that no provision for federal income tax is required in the Fund’s financial statements. The Fund is not aware of any tax positions for which it is reasonably possible that the total amounts of unrecognized tax benefits will significantly change in the next twelve months.
2. Other Investments and Strategies
Additional Investment Risk
The U.S. government and the Federal Reserve, as well as certain foreign governments and central banks, have taken extraordinary actions to support local and global economies and the financial markets in response to the COVID-19 pandemic. This and other government intervention into the economy and financial markets to address the COVID-19 pandemic may not work as intended, particularly if the efforts are perceived by investors as being unlikely to achieve the desired results. Government actions to mitigate the economic impact of the pandemic have resulted in a large expansion of government deficits and debt, the long term consequences of which are not known. The COVID-19 pandemic could adversely affect the value and liquidity of a Fund’s investments, impair a Fund’s ability to satisfy redemption requests, and negatively impact a Fund’s performance. In addition, the outbreak of COVID-19, and measures taken to mitigate its effects, could result in disruptions to the services provided to a Fund by its service providers.
Widespread disease, including pandemics and epidemics, and natural or environmental disasters, including those which may be attributable to global climate change, such as earthquakes, fires, floods, hurricanes, tsunamis and weather-related phenomena generally, have been and can be highly disruptive to economies and markets, adversely impacting individual companies, sectors, industries, markets, currencies, interest and inflation rates, credit ratings, investor sentiment, and other factors affecting the value of a Fund’s investments. Economies and financial markets throughout the world have become increasingly interconnected, which increases the likelihood that events or conditions in one
Janus Henderson Growth and Income Fund
Notes to Financial Statements (unaudited)
region or country will adversely affect markets or issuers in other regions or countries, including the United States. These disruptions could prevent a Fund from executing advantageous investment decisions in a timely manner and negatively impact a Fund’s ability to achieve its investment objective(s). Any such event(s) could have a significant adverse impact on the value of a Fund. In addition, these disruptions could also impair the information technology and other operational systems upon which the Fund’s service providers, including the Adviser or the subadviser (as applicable), rely, and could otherwise disrupt the ability of employees of the Fund’s service providers to perform essential tasks on behalf of the Fund. Adverse weather conditions may also have a particularly significant negative effect on issuers in the agricultural sector and on insurance and reinsurance companies that insure or reinsure against the impact of natural disasters.
A number of countries in the European Union (the “EU”) have experienced, and may continue to experience, severe economic and financial difficulties. In particular, many EU nations are susceptible to economic risks associated with high levels of debt. Many non-governmental issuers, and even certain governments, have defaulted on, or been forced to restructure, their debts. Many other issuers have faced difficulties obtaining credit or refinancing existing obligations. Financial institutions have in many cases required government or central bank support, have needed to raise capital, and/or have been impaired in their ability to extend credit. As a result, financial markets in the EU have experienced extreme volatility and declines in asset values and liquidity. These difficulties may continue, worsen, or spread further within the EU. Responses to these financial problems by European governments, central banks, and others, including austerity measures and reforms, may not work, may result in social unrest, and may limit future growth and economic recovery or have other unintended consequences. Among other things, these developments have adversely affected the value and exchange rate of the euro and pound sterling, and may continue to significantly affect the economies of all EU countries, which in turn may have a material adverse effect on the Fund’s investments in such countries, other countries that depend on EU countries for significant amounts of trade or investment, or issuers with exposure to debt issued by certain EU countries.
3. Investment Advisory Agreements and Other Transactions with Affiliates
The Fund pays the Adviser an investment advisory fee which is calculated daily and paid monthly. The Fund’s contractual investment advisory fee rate (expressed as an annual rate) is 0.60% of its average daily net assets.
The Adviser has contractually agreed to waive the investment advisory fee and/or reimburse operating expenses to the extent that the Fund’s total annual fund operating expenses, excluding the fees payable pursuant to a Rule 12b-1 plan, shareholder servicing fees, such as transfer agency fees (including out-of-pocket costs), administrative services fees and any networking/omnibus payable by any share class, brokerage commissions, interest, dividends, taxes, acquired fund fees and expenses, and extraordinary expenses, exceed the annual rate of 0.67% of the Fund’s average daily net assets. The Adviser has agreed to continue the waivers for at least a one-year period commencing January 27, 2023. If applicable, amounts waived and/or reimbursed to the Fund by the Adviser are disclosed as “Excess Expense Reimbursement and Waivers” on the Statement of Operations.
The Adviser serves as administrator to the Fund pursuant to an administration agreement between the Adviser and the Trust. Under the administration agreement, the Adviser is authorized to perform, or cause others to perform certain administration, compliance, and accounting services to the Fund, including providing office space for the Fund, and is reimbursed by the Fund for certain of its costs in providing these services (to the extent the Adviser seeks reimbursement and such costs are not otherwise waived). In addition, employees of the Adviser and/or its affiliates may serve as officers of the Trust. The Fund pays for some or all of the salaries, fees, and expenses of the Adviser employees and Fund officers, with respect to certain specified administration functions they perform on behalf of the Fund. The Fund pays these costs based on out-of-pocket expenses incurred by the Adviser, and these costs are separate and apart from advisory fees and other expenses paid in connection with the investment advisory services the Adviser (or any subadvisor, as applicable) provides to the Fund. These amounts are disclosed as “Affiliated fund administration fees” on the Statement of Operations. In addition, some expenses related to compensation payable to the Fund’s Chief Compliance Officer and certain compliance staff, all of whom are employees of the Adviser and/or its affiliates, are shared with the Fund. Total compensation of $114,430 was paid to the Chief Compliance Officer and certain compliance staff by the Trust during the period ended March 31, 2023. The Fund's portion is reported as part of “Other expenses” on the Statement of Operations.
Janus Henderson Services US LLC (the “Transfer Agent”), a wholly-owned subsidiary of the Adviser, is the Fund’s transfer agent. The Transfer Agent provides or arranges for the provision of shareholder services including, but not limited to, recordkeeping, subaccounting, answering inquiries regarding accounts, order processing, transaction
Janus Henderson Growth and Income Fund
Notes to Financial Statements (unaudited)
confirmations, the mailing of prospectuses and shareholder reports, and other shareholder services provided to or on behalf of shareholders. These amounts are disclosed as “Transfer agent administrative fees and expenses” on the Statement of Operations.
Class D Shares of the Fund pay the Transfer Agent an annual administrative services fee based on the average daily net assets of Class D Shares as detailed below.
| | |
Average Daily Net Assets of Class D Shares of the Janus Henderson funds | Administrative Services Fee |
Under $40 billion | 0.12% |
$40 billion – $49.9 billion | 0.10% |
Over $49.9 billion | 0.08% |
During the reporting period, the administrative services fee rate was 0.12%.
The Transfer Agent receives an administrative services fee at an annual rate of up to 0.25% of the average daily net assets of the Fund’s Class R Shares, Class S Shares and Class T Shares for providing or procuring administrative services to investors in Class R Shares, Class S Shares and Class T Shares of the Fund. The Transfer Agent expects to use all or a significant portion of this fee to compensate retirement plan service providers, broker-dealers, bank trust departments, financial advisors, and other financial intermediaries for providing these services. The Transfer Agent may keep certain amounts retained for reimbursement of out-of-pocket costs incurred for servicing clients of Class R Shares, Class S Shares and Class T Shares.
Shareholder Services provided by these financial intermediaries may include, but are not limited to, recordkeeping, subaccounting, order processing, providing order confirmations, periodic statements, forwarding prospectuses, shareholder reports, and other materials to existing customers, answering inquiries regarding accounts, and other administrative services. Order processing includes the submission of transactions through the National Securities Clearing Corporation (“NSCC”) or similar systems, or those processed on a manual basis with the Adviser. For all share classes, the Transfer Agent also seeks reimbursement for costs it incurs as transfer agent and for providing servicing.
Certain, but not all, intermediaries may charge administrative fees to investors in Class A Shares, Class C Shares, and Class I Shares for administrative services provided on behalf of such investors. These administrative fees are paid by the Class A Shares, Class C Shares, and Class I Shares of the Fund to the Transfer Agent, which uses such fees to reimburse intermediaries. Consistent with the Transfer Agency Agreement between the Transfer Agent and the Fund, the Transfer Agent may negotiate the level, structure, and/or terms of the administrative fees with intermediaries requiring such fees on behalf of the Fund. The Adviser and its affiliates benefit from an increase in assets that may result from such relationships. The Adviser has agreed to limit these fees up to 0.20% for Class A Shares and Class C Shares, and up to 0.15% for Class I Shares on an annual basis based on the daily net assets of each share class. Such limits are subject to change by the Trustees in the future. These amounts are disclosed as “Transfer agent networking and omnibus fees” on the Statement of Operations.
The Transfer Agent is not compensated for its services related to the shares, except for out-of-pocket costs, although the Transfer Agent is compensated for its services related to Fund’s Reordering IAA Comps to match JHI requestClass D Shares. These amounts are disclosed as “Other transfer agent fees and expenses” on the Statement of Operations.
Under distribution and shareholder servicing plans (the “Plans”) adopted in accordance with Rule 12b-1 under the 1940 Act, the Fund pays the Trust’s distributor, the Distributor, a wholly-owned subsidiary of the Adviser, a fee for the sale and distribution and/or shareholder servicing of the shares based on the average daily net assets for each share class at an annual rate of up to 0.25% for Class A Shares, up to 1.00% for Class C Shares, of up to 0.50% of the Class R Shares’ average daily net assets, and up to 0.25% for Class S Shares. Under the terms of the Plans, the Trust is authorized to make payments to the Distributor for remittance to retirement plan service providers, broker-dealers, bank trust departments, financial advisors, and other financial intermediaries, as compensation for distribution and/or shareholder services performed by such entities for their customers who are investors in the Fund. These amounts are disclosed as “12b-1 Distribution and shareholder servicing fees” on the Statement of Operations.
Class A Shares include a 5.75% upfront sales charge of the offering price of the Fund. The sales charge is allocated between the Distributor and financial intermediaries. During the period ended March 31, 2023, the Distributor retained upfront sales charges of $4,392.
Janus Henderson Growth and Income Fund
Notes to Financial Statements (unaudited)
A contingent deferred sales charge (“CDSC”) of 1.00% will be deducted with respect to Class A Shares purchased without a sales load and redeemed within 12 months of purchase, unless waived. Any applicable CDSC will be 1.00% of the lesser of the original purchase price or the value of the redemption of the Class A Shares redeemed. There were no CDSCs paid by redeeming shareholders of Class A Shares to the Distributor during the period ended March 31, 2023.
A CDSC of 1.00% will be deducted with respect to Class C Shares redeemed within 12 months of purchase, unless waived. Any applicable CDSC will be 1.00% of the lesser of the original purchase price or the value of the redemption of the Class C Shares redeemed. During the period ended March 31, 2023, redeeming shareholders of Class C Shares paid CDSCs of $461.
The Board of Trustees has adopted a deferred compensation plan (the “Deferred Plan”) for independent Trustees to elect to defer receipt of all or a portion of the annual compensation they are entitled to receive from the Fund. All deferred fees are credited to an account established in the name of the Trustees. The amounts credited to the account then increase or decrease, as the case may be, in accordance with the performance of one or more of the Janus Henderson funds that are selected by the Trustees. The account balance continues to fluctuate in accordance with the performance of the selected fund or funds until final payment of all amounts are credited to the account. The fluctuation of the account balance is recorded by the Fund as unrealized appreciation/(depreciation) and is included as of March 31, 2023 on the Statement of Assets and Liabilities in the asset, “Trustees’ deferred compensation,” and liability, “Trustees’ deferred compensation fees.” Additionally, the recorded unrealized appreciation/(depreciation) is included in “Total distributable earnings (loss)” on the Statement of Assets and Liabilities. Deferred compensation expenses for the period ended March 31, 2023 are included in “Trustees’ fees and expenses” on the Statement of Operations. Trustees are allowed to change their designation of mutual funds from time to time. Amounts will be deferred until distributed in accordance with the Deferred Plan. Deferred fees of $205,688 were paid by the Trust to the Trustees under the Deferred Plan during the period ended March 31, 2023.
Pursuant to the provisions of the 1940 Act and related rules, the Fund may participate in an affiliated or non-affiliated cash sweep program. In the cash sweep program, uninvested cash balances of the Fund may be used to purchase shares of affiliated or non-affiliated money market funds or cash management pooled investment vehicles that operate as money market funds. The Fund is eligible to participate in the cash sweep program (the “Investing Funds”). The Adviser has an inherent conflict of interest because of its fiduciary duties to the affiliated money market funds or cash management pooled investment vehicles and the Investing Funds. Janus Henderson Cash Liquidity Fund LLC (the “Sweep Vehicle”) is an affiliated unregistered cash management pooled investment vehicle that invests primarily in highly-rated short-term fixed-income securities. The Sweep Vehicle operates pursuant to the provisions of the 1940 Act that govern the operation of money market funds and prices its shares at NAV reflecting market-based values of its portfolio securities (i.e., a “floating” NAV) rounded to the fourth decimal place (e.g., $1.0000). The Sweep Vehicle is permitted to impose a liquidity fee (of up to 2%) on redemptions from the Sweep Vehicle or a redemption gate that temporarily suspends redemptions from the Sweep Vehicle for up to 10 business days during a 90 day period. There are no restrictions on the Fund's ability to withdraw investments from the Sweep Vehicle at will, and there are no unfunded capital commitments due from the Fund to the Sweep Vehicle. The Sweep Vehicle does not charge any management fee, sales charge or service fee.
Any purchases and sales, realized gains/losses and recorded dividends from affiliated investments during the period ended March 31, 2023 can be found in the “Schedules of Affiliated Investments” located in the Schedule of Investments.
Janus Henderson Growth and Income Fund
Notes to Financial Statements (unaudited)
As of March 31, 2023, shares of the Fund were owned by affiliates of the Adviser, and/or other funds advised by the Adviser, as indicated in the table below:
| | | | | | | |
Class | % of Class Owned | | % of Fund Owned | | |
Class A Shares | - | % | - | % | |
Class C Shares | - | | - | | |
Class D Shares | - | | - | | |
Class I Shares | - | | - | | |
Class N Shares | 32 | | -* | | |
Class R Shares | - | | - | | |
Class S Shares | - | | - | | |
Class T Shares | - | | - | | |
| | | | | | |
* | Less than 0.50% | | | | | |
4. Federal Income Tax
Income and capital gains distributions are determined in accordance with income tax regulations that may differ from US GAAP. These differences are due to differing treatments for items such as net short-term gains, deferral of wash sale losses, foreign currency transactions, net investment losses, and capital loss carryovers.
The Fund has elected to treat gains and losses on forward foreign currency contracts as capital gains and losses, if applicable. Other foreign currency gains and losses on debt instruments are treated as ordinary income for federal income tax purposes pursuant to Section 988 of the Internal Revenue Code.
The aggregate cost of investments and the composition of unrealized appreciation and depreciation of investment securities for federal income tax purposes as of March 31, 2023 are noted below. The primary differences between book and tax appreciation or depreciation of investments are wash sale loss deferrals and investments in partnerships.
| | | | |
Federal Tax Cost | Unrealized
Appreciation | Unrealized
(Depreciation) | Net Tax Appreciation/
(Depreciation) |
$ 3,417,794,371 | $3,105,528,744 | $(35,430,888) | $ 3,070,097,856 |
Janus Henderson Growth and Income Fund
Notes to Financial Statements (unaudited)
5. Capital Share Transactions
| | | | | | | |
| | | | | | |
| | Period ended March 31, 2023 | | Year ended September 30, 2022 |
| | Shares | Amount | | Shares | Amount |
| | | | | | | |
Class A Shares: | | | | | |
Shares sold | 177,537 | $ 11,452,287 | | 337,245 | $ 24,516,166 |
Reinvested dividends and distributions | 55,975 | 3,528,341 | | 57,277 | 4,326,800 |
Shares repurchased | (189,108) | (12,347,199) | | (438,197) | (31,424,486) |
Net Increase/(Decrease) | 44,404 | $ 2,633,429 | | (43,675) | $ (2,581,520) |
Class C Shares: | | | | | |
Shares sold | 68,139 | $ 4,436,636 | | 61,090 | $ 4,343,205 |
Reinvested dividends and distributions | 36,156 | 2,237,337 | | 33,118 | 2,489,705 |
Shares repurchased | (118,859) | (7,600,284) | | (142,074) | (10,040,855) |
Net Increase/(Decrease) | (14,564) | $ (926,311) | | (47,866) | $ (3,207,945) |
Class D Shares: | | | | | |
Shares sold | 719,133 | $ 46,795,446 | | 1,909,020 | $139,542,930 |
Reinvested dividends and distributions | 3,438,124 | 217,194,429 | | 3,338,269 | 251,383,633 |
Shares repurchased | (2,261,456) | (147,438,836) | | (4,223,345) | (303,586,943) |
Net Increase/(Decrease) | 1,895,801 | $116,551,039 | | 1,023,944 | $ 87,339,620 |
Class I Shares: | | | | | |
Shares sold | 523,067 | $ 34,142,705 | | 1,279,575 | $ 92,804,912 |
Reinvested dividends and distributions | 308,931 | 19,529,542 | | 325,224 | 24,502,380 |
Shares repurchased | (946,152) | (61,941,295) | | (2,046,739) | (147,461,755) |
Net Increase/(Decrease) | (114,154) | $ (8,269,048) | | (441,940) | $ (30,154,463) |
Class N Shares: | | | | | |
Shares sold | 296,776 | $ 19,765,247 | | 399,722 | $ 27,478,070 |
Reinvested dividends and distributions | 55,844 | 3,524,774 | | 55,534 | 4,172,414 |
Shares repurchased | (86,133) | (5,617,376) | | (644,155) | (43,036,598) |
Net Increase/(Decrease) | 266,487 | $ 17,672,645 | | (188,899) | $ (11,386,114) |
Class R Shares: | | | | | |
Shares sold | 5,440 | $ 350,860 | | 8,252 | $ 588,018 |
Reinvested dividends and distributions | 5,141 | 321,409 | | 5,174 | 391,000 |
Shares repurchased | (14,135) | (931,999) | | (21,043) | (1,545,014) |
Net Increase/(Decrease) | (3,554) | $ (259,730) | | (7,617) | $ (565,996) |
Class S Shares: | | | | | |
Shares sold | 8,488 | $ 547,746 | | 34,533 | $ 2,494,027 |
Reinvested dividends and distributions | 11,458 | 721,873 | | 16,974 | 1,290,405 |
Shares repurchased | (26,953) | (1,732,301) | | (173,932) | (12,245,996) |
Net Increase/(Decrease) | (7,007) | $ (462,682) | | (122,425) | $ (8,461,564) |
Class T Shares: | | | | | |
Shares sold | 816,887 | $ 53,433,503 | | 1,463,801 | $105,819,866 |
Reinvested dividends and distributions | 1,650,968 | 104,177,216 | | 1,617,397 | 121,911,409 |
Shares repurchased | (1,942,975) | (125,791,255) | | (3,459,836) | (250,347,871) |
Net Increase/(Decrease) | 524,880 | $ 31,819,464 | | (378,638) | $ (22,616,596) |
6. Purchases and Sales of Investment Securities
For the period ended March 31, 2023, the aggregate cost of purchases and proceeds from sales of investment securities (excluding any short-term securities, short-term options contracts, TBAs, and in-kind transactions, as applicable) was as follows:
| | | | |
Purchases of
Securities | Proceeds from Sales
of Securities | Purchases of Long-
Term U.S. Government
Obligations | Proceeds from Sales
of Long-Term U.S.
Government Obligations |
$610,750,678 | $ 772,895,570 | $ - | $ - |
Janus Henderson Growth and Income Fund
Notes to Financial Statements (unaudited)
7. Subsequent Event
Management has evaluated whether any events or transactions occurred subsequent to March 31, 2023 and through the date of issuance of the Fund’s financial statements and determined that there were no material events or transactions that would require recognition or disclosure in the Fund’s financial statements.
Janus Henderson Growth and Income Fund
Additional Information (unaudited)
Proxy Voting Policies and Voting Record
A description of the policies and procedures that the Fund uses to determine how to vote proxies relating to its portfolio securities is available without charge: (i) upon request, by calling 1-800-525-1093; (ii) on the Fund’s website at janushenderson.com/proxyvoting; and (iii) on the SEC’s website at http://www.sec.gov. Additionally, information regarding the Fund’s proxy voting record for the most recent twelve-month period ended June 30 is also available, free of charge, through janushenderson.com/proxyvoting and from the SEC’s website at http://www.sec.gov.
Full Holdings
The Fund files its complete portfolio holdings (schedule of investments) with the SEC as an exhibit to Form N-PORT within 60 days of the end of the first and third fiscal quarters, and in the annual report and semiannual report to shareholders. The Fund’s Form N-PORT filings and annual and semiannual reports: (i) are available on the SEC’s website at http://www.sec.gov; and (ii) are available without charge, upon request, by calling a Janus Henderson representative at 1-877-335-2687 (toll free) (or 1-800-525-3713 if you hold Class D Shares). Portfolio holdings consisting of at least the names of the holdings are generally available on a monthly basis with a 30-day lag under Full Holdings for the Fund at janushenderson.com/info (or janushenderson.com/reports if you hold Class D Shares).
APPROVAL OF ADVISORY AGREEMENTS DURING THE PERIOD
The Trustees of Janus Aspen Series, each of whom serves as an “independent” Trustee (the “Trustees”), oversee the management of each portfolio of Janus Aspen Series (each, a “VIT Portfolio,” and collectively, the “VIT Portfolios”), as well as each fund of Janus Investment Fund (each, a “Fund,” and collectively, the “Funds” and together with the VIT Portfolios, the “Janus Henderson Funds,” and each, a “Janus Henderson Fund”). As required by law, the Trustees determine annually whether to continue the investment advisory agreement for each Janus Henderson Fund.
In connection with their most recent consideration of those agreements for each Janus Henderson Fund, the Trustees received and reviewed information provided by Janus Henderson Investors US LLC (the “Adviser”) in response to requests of the Trustees and their independent legal counsel. They also received and reviewed information and analysis provided by, and in response to requests of, their independent fee consultant. Throughout their consideration of the agreements, the Trustees were advised by their independent legal counsel. The Trustees met with management to consider the agreements, and also met separately in executive session with their independent legal counsel and their independent fee consultant.
At meetings held on November 9-10, 2022 and December 13-14, 2022, the Trustees evaluated the information provided by the Adviser and the independent fee consultant, as well as other information provided by the Adviser and the independent fee consultant during the year. Following such evaluation, the Trustees determined that the overall arrangements between each Janus Henderson Fund and the Adviser were fair and reasonable in light of the nature, extent, and quality of the services provided by the Adviser and its affiliates, the fees charged for those services, and other matters that the Trustees considered relevant in the exercise of their business judgment, and unanimously approved the continuation of the investment advisory agreement for each Janus Henderson Fund for the period from February 1, 2023 through February 1, 2024, subject to earlier termination as provided for in each agreement.
In considering the continuation of those agreements, the Trustees reviewed and analyzed various factors that they determined were relevant, including the factors described below, none of which by itself was considered dispositive. However, the material factors and conclusions that formed the basis for the Trustees’ determination to approve the continuation of the agreements are discussed separately below. Also included is a summary of the independent fee consultant’s conclusions and opinions that arose during, and were included as part of, the Trustees’ consideration of the agreements. “Management fees,” as used herein, reflect actual annual advisory fees and, for the purpose of peer comparisons any administration fees (excluding out of pocket costs), net of any waivers, paid by a fund as a percentage of average net assets.
Nature, Extent and Quality of Services
The Trustees reviewed the nature, extent, and quality of the services provided by the Adviser to the Janus Henderson Funds, taking into account the investment objective, strategies, and policies of each Janus Henderson Fund, and the knowledge the Trustees gained from their regular meetings with management on at least a quarterly basis and their ongoing review of information related to the Janus Henderson Funds. In addition, the Trustees reviewed the resources and key personnel of the Adviser, particularly noting those employees who provide investment and risk management services to the Janus Henderson Funds. The Trustees also considered other services provided to the Janus Henderson
Janus Henderson Growth and Income Fund
Additional Information (unaudited)
Funds by the Adviser, such as managing the execution of portfolio transactions and the selection of broker-dealers for those transactions. The Trustees considered the Adviser’s role as administrator to the Janus Henderson Funds, noting that the Adviser generally does not receive a fee for its services as administrator, but is reimbursed for its out-of-pocket costs. The Trustees considered the role of the Adviser in monitoring adherence to the Janus Henderson Funds’ investment restrictions, providing support services for the Trustees and Trustee committees, and overseeing communications with Janus Henderson Fund shareholders and the activities of other service providers, including monitoring compliance with various policies and procedures of the Janus Henderson Funds and with applicable securities laws and regulations.
In this regard, the independent fee consultant noted that the Adviser provides a number of different services for the Janus Henderson Funds and their shareholders, ranging from investment management services to various other servicing functions, and that, in its view, the Adviser is a capable provider of those services. The independent fee consultant also provided its belief that the Adviser has developed a number of institutional competitive advantages that should enable it to provide superior investment and service performance over the long term.
The Trustees concluded that the nature, extent, and quality of the services provided by the Adviser to each Janus Henderson Fund were appropriate and consistent with the terms of the respective advisory agreements, and that, taking into account steps taken to address those Janus Henderson Funds whose performance lagged that of their peers for certain periods, the Janus Henderson Funds were likely to benefit from the continued provision of those services. They also concluded that the Adviser had sufficient personnel, with the appropriate education and experience, to serve the Janus Henderson Funds effectively and had demonstrated its ability to attract well-qualified personnel.
Performance of the Funds
The Trustees considered the performance results of each Janus Henderson Fund over various time periods. They noted that they considered Janus Henderson Fund performance data throughout the year, including periodic meetings with each Janus Henderson Fund’s portfolio manager(s), and also reviewed information comparing each Janus Henderson Fund’s performance with the performance of comparable fund peer groups identified by Broadridge Financial Solutions, Inc. (“Broadridge”), an independent data provider, and with the Janus Henderson Fund’s benchmark index. In this regard, the independent fee consultant found that the overall Janus Henderson Funds’ performance has been reasonable, noting that: (i) for the 36 months ended May 31, 2022, approximately 38% of the Janus Henderson Funds were in the top two quartiles of their Broadridge peer groups; (ii) for the 36 months ended September 30, 2022, approximately 45% of the Janus Henderson Funds were in the top two quartiles of performance as reported by Morningstar, and (iii) for the 12 months ended September 30, 2022, approximately 55% of the Janus Henderson Funds were in the top two quartiles of performance as reported by Morningstar.
The Trustees considered the performance of each Janus Henderson Fund, noting that performance may vary by share class, and noted the following with respect to the Funds:
Asset Allocation Funds
· For Janus Henderson Global Allocation Fund – Conservative, the Trustees noted that the Fund’s performance was in the third Broadridge quartile for the 36 months ended May 31, 2022 and the bottom Broadridge quartile for the 12 months ended May 31, 2022. The Trustees noted the reasons for the Fund’s underperformance and the steps the Adviser had taken or was taking to improve performance.
· For Janus Henderson Global Allocation Fund – Growth, the Trustees noted that the Fund’s performance was in the bottom Broadridge quartile for the 36 months ended May 31, 2022 and the bottom Broadridge quartile for the 12 months ended May 31, 2022. The Trustees noted the reasons for the Fund’s underperformance and the steps the Adviser had taken or was taking to improve performance.
· For Janus Henderson Global Allocation Fund – Moderate, the Trustees noted that the Fund’s performance was in the bottom Broadridge quartile for the 36 months ended May 31, 2022 and the bottom Broadridge quartile for the 12 months ended May 31, 2022. The Trustees noted the reasons for the Fund’s underperformance and the steps the Adviser had taken or was taking to improve performance.
Fixed-Income Funds
· For Janus Henderson Absolute Return Income Opportunities Fund, the Trustees noted that the Fund’s performance was in the third Broadridge quartile for the 36 months ended May 31, 2022 and the first Broadridge quartile for the 12 months ended May 31, 2022. The Trustees noted the reasons for the Fund’s underperformance,
Janus Henderson Growth and Income Fund
Additional Information (unaudited)
the steps the Adviser had taken or was taking to improve performance, and that the performance trend was improving.
· For Janus Developed World Bond Fund, the Trustees noted that the Fund’s performance was in the bottom Broadridge quartile for the 36 months ended May 31, 2022 and the bottom Broadridge quartile for the 12 months ended May 31, 2022. The Trustees noted the reasons for the Fund’s underperformance and the steps the Adviser had taken or was taking to improve performance.
· For Janus Henderson Flexible Bond Fund, the Trustees noted that the Fund’s performance was in the first Broadridge quartile for the 36 months ended May 31, 2022 and the second Broadridge quartile for the 12 months ended May 31, 2022.
· For Janus Henderson Global Bond Fund, the Trustees noted that the Fund’s performance was in the third Broadridge quartile for the 36 months ended May 31, 2022 and the bottom Broadridge quartile for the 12 months ended May 31, 2022. The Trustees noted the reasons for the Fund’s underperformance and the steps the Adviser had taken or was taking to improve performance.
· For Janus Henderson High-Yield Fund, the Trustees noted that the Fund’s performance was in the third Broadridge quartile for the 36 months ended May 31, 2022 and the bottom Broadridge quartile for the 12 months ended May 31, 2022. The Trustees noted the reasons for the Fund’s underperformance and the steps the Adviser had taken or was taking to improve performance.
· For Janus Henderson Multi-Sector Income Fund, the Trustees noted that the Fund’s performance was in the second Broadridge quartile for the 36 months ended May 31, 2022 and the third Broadridge quartile for the 12 months ended May 31, 2022.
· For Janus Henderson Short Duration Flexible Bond Fund, the Trustees noted that the Fund’s performance was in the third Broadridge quartile for the 36 months ended May 31, 2022 and the bottom Broadridge quartile for the 12 months ended May 31, 2022. The Trustees noted the reasons for the Fund’s underperformance and the steps the Adviser had taken or was taking to improve performance.
Global and International Equity Funds
· For Janus Henderson Asia Equity Fund, the Trustees noted that the Fund’s performance was in the third Broadridge quartile for the 36 months ended May 31, 2022 and the third Broadridge quartile for the 12 months ended May 31, 2022. The Trustees noted the reasons for the Fund’s underperformance, while also noting that the Fund has a performance fee structure that results in lower management fees during periods of underperformance, and the steps the Adviser had taken or was taking to improve performance.
· For Janus Henderson Emerging Markets Fund, the Trustees noted that the Fund’s performance was in the third Broadridge quartile for the 36 months ended May 31, 2022 and the third Broadridge quartile for the 12 months ended May 31, 2022. The Trustees noted the reasons for the Fund’s underperformance and the steps the Adviser had taken or was taking to improve performance.
· For Janus Henderson European Focus Fund, the Trustees noted that the Fund’s performance was in the first Broadridge quartile for the 36 months ended May 31, 2022 and the second Broadridge quartile for the 12 months ended May 31, 2022.
· For Janus Henderson Global Equity Income Fund, the Trustees noted that the Fund’s performance was in the third Broadridge quartile for the 36 months ended May 31, 2022 and the first Broadridge quartile for the 12 months ended May 31, 2022. The Trustees noted the reasons for the Fund’s underperformance, the steps the Adviser had taken or was taking to improve performance, and that the performance trend was improving.
· For Janus Henderson Global Life Sciences Fund, the Trustees noted that the Fund’s performance was in the third Broadridge quartile for the 36 months ended May 31, 2022 and the second Broadridge quartile for the 12 months ended May 31, 2022. The Trustees noted the reasons for the Fund’s underperformance, the steps the Adviser had taken or was taking to improve performance, and that the performance trend was improving.
· For Janus Henderson Global Sustainable Equity Fund, the Trustees noted that the Fund’s performance was in the second Broadridge quartile for the 12 months ended May 31, 2022. The Trustees noted that 36 month-end performance was not yet available.
Janus Henderson Growth and Income Fund
Additional Information (unaudited)
· For Janus Henderson Global Real Estate Fund, the Trustees noted that the Fund’s performance was in the second Broadridge quartile for the 36 months ended May 31, 2022 and the bottom Broadridge quartile for the 12 months ended May 31, 2022.
· For Janus Henderson Global Research Fund, the Trustees noted that the Fund’s performance was in the second Broadridge quartile for the 36 months ended May 31, 2022 and the first Broadridge quartile for the 12 months ended May 31, 2022.
· For Janus Henderson Global Select Fund, the Trustees noted that the Fund’s performance was in the first Broadridge quartile for the 36 months ended May 31, 2022 and the first Broadridge quartile for the 12 months ended May 31, 2022.
· For Janus Henderson Global Technology and Innovation Fund, the Trustees noted that the Fund’s performance was in the second Broadridge quartile for the 36 months ended May 31, 2022 and the second Broadridge quartile for the 12 months ended May 31, 2022.
· For Janus Henderson International Opportunities Fund, the Trustees noted that the Fund’s performance was in the bottom Broadridge quartile for the 36 months ended May 31, 2022 and the third Broadridge quartile for the 12 months ended May 31, 2022. The Trustees noted the reasons for the Fund’s underperformance and the steps the Adviser had taken or was taking to improve performance.
· For Janus Henderson Overseas Fund, the Trustees noted that the Fund’s performance was in the first Broadridge quartile for the 36 months ended May 31, 2022 and the first Broadridge quartile for the 12 months ended May 31, 2022.
· For Janus Henderson Responsible International Dividend Fund (formerly the Janus Henderson Dividend & Income Builder Fund), the Trustees noted that the Fund’s performance was in the bottom Broadridge quartile for the 36 months ended May 31, 2022 and the bottom Broadridge quartile for the 12 months ended May 31, 2022. The Trustees noted the reasons for the Fund’s underperformance and the steps the Adviser had taken or was taking to improve performance.
Money Market Funds
· For Janus Henderson Government Money Market Fund, the Trustees noted that the Fund’s performance was in the third Broadridge quartile for the 36 months ended May 31, 2022 and the bottom Broadridge quartile for the 12 months ended May 31, 2022. The Trustees noted the reasons for the Fund’s underperformance and the steps the Adviser had taken or was taking to improve performance.
· For Janus Henderson Money Market Fund, the Trustees noted that the Fund’s performance was in the third Broadridge quartile for the 36 months ended May 31, 2022 and the bottom Broadridge quartile for the 12 months ended May 31, 2022. The Trustees noted the reasons for the Fund’s underperformance and the steps the Adviser had taken or was taking to improve performance.
Multi-Asset Funds
· For Janus Henderson Adaptive Global Allocation Fund, the Trustees noted that the Fund’s performance was in bottom Broadridge quartile for the 36 months ended May 31, 2022 and the second Broadridge quartile for the 12 months ended May 31, 2022. The Trustees noted the reasons for the Fund’s underperformance, the steps the Adviser had taken or was taking to improve performance, and that the performance trend was improving.
· For Janus Henderson Balanced Fund, the Trustees noted that the Fund’s performance was in the first Broadridge quartile for the 36 months ended May 31, 2022 and the first Broadridge quartile for the 12 months ended May 31, 2022.
U.S. Equity Funds
· For Janus Henderson Adaptive Risk Managed U.S. Equity Fund, the Trustees noted that the Fund’s performance was in the bottom Broadridge quartile for the 36 months ended May 31, 2022 and the second Broadridge quartile for the 12 months ended May 31, 2022. The Trustees noted the reasons for the Fund’s underperformance, the steps the Adviser had taken or were taking to improve performance, and that the performance trend was improving.
Janus Henderson Growth and Income Fund
Additional Information (unaudited)
· For Janus Henderson Contrarian Fund, the Trustees noted that the Fund’s performance was in the first Broadridge quartile for the 36 months ended May 31, 2022 and the bottom Broadridge quartile for the 12 months ended May 31, 2022.
· For Janus Henderson Enterprise Fund, the Trustees noted that the Fund’s performance was in the second Broadridge quartile for the 36 months ended May 31, 2022 and the first Broadridge quartile for the 12 months ended May 31, 2022.
· For Janus Henderson Forty Fund, the Trustees noted that the Fund’s performance was in the third Broadridge quartile for the 36 months ended May 31, 2022 and the bottom Broadridge quartile for the 12 months ended May 31, 2022. The Trustees noted the reasons for the Fund’s underperformance and the steps the Adviser had taken or was taking to improve performance.
· For Janus Henderson Growth and Income Fund, the Trustees noted that the Fund’s performance was in the bottom Broadridge quartile for the 36 months ended May 31, 2022 and the first Broadridge quartile for the 12 months ended May 31, 2022. The Trustees noted the reasons for the Fund’s underperformance, the steps the Adviser had taken or was taking to improve performance, and that the performance trend was improving.
· For Janus Henderson Mid Cap Value Fund, the Trustees noted that the Fund’s performance was in the bottom Broadridge quartile for the 36 months ended May 31, 2022 and the second Broadridge quartile for the 12 months ended May 31, 2022. The Trustees noted the reasons for the Fund’s underperformance, while also noting that the Fund has a performance fee structure that results in lower management fees during periods of underperformance, the steps the Adviser had taken or was taking to improve performance, and that the performance trend was improving.
· For Janus Henderson Research Fund, the Trustees noted that the Fund’s performance was in the third Broadridge quartile for the 36 months ended May 31, 2022 and the third Broadridge quartile for the 12 months ended May 31, 2022. The Trustees noted the reasons for the Fund’s underperformance, while also noting that the Fund has a performance fee structure that results in lower management fees during periods of underperformance and the steps the Adviser had taken or was taking to improve performance.
· For Janus Henderson Small Cap Value Fund, the Trustees noted that the Fund’s performance was in the bottom Broadridge quartile for the 36 months ended May 31, 2022 and the second Broadridge quartile for the 12 months ended May 31, 2022. The Trustees noted the reasons for the Fund’s underperformance, while also noting that the Fund has a performance fee structure that results in lower management fees during periods of underperformance, the steps the Adviser had taken or was taking to improve performance, and that the performance trend was improving.
· For Janus Henderson Small-Mid Cap Value Fund, the Trustees noted that the Fund’s performance was in the bottom Broadridge quartile for the 36 months ended May 31, 2022 and the second Broadridge quartile for the 12 months ended May 31, 2022. The Trustees noted the reasons for the Fund’s underperformance, while also noting that the Fund has a performance fee structure that results in lower management fees during periods of underperformance, the steps the Adviser had taken or was taking to improve performance, and that the performance trend is improving.
· For Janus Henderson Triton Fund, the Trustees noted that the Fund’s performance was in the bottom Broadridge quartile for the 36 months ended May 31, 2022 and the second Broadridge quartile for the 12 months ended May 31, 2022. The Trustees noted the reasons for the Fund’s underperformance, the steps the Adviser had taken or was taking to improve performance, and that the performance trend was improving.
· For Janus Henderson Venture Fund, the Trustees noted that the Fund’s performance was in the bottom Broadridge quartile for the 36 months ended May 31, 2022 and the second Broadridge quartile for the 12 months ended May 31, 2022. The Trustees noted the reasons for the Fund’s underperformance, the steps the Adviser had taken or was taking to improve performance, and that the performance trend was improving.
In consideration of each Janus Henderson Fund’s performance, the Trustees concluded that, taking into account the factors relevant to performance, as well as other considerations, including steps taken to improve performance, as applicable, the Janus Henderson Fund’s performance warranted continuation of such Janus Henderson Fund’s investment advisory agreement.
Janus Henderson Growth and Income Fund
Additional Information (unaudited)
Costs of Services Provided
The Trustees examined information regarding the fees and expenses of each Janus Henderson Fund in comparison to similar information for other comparable funds as provided by Broadridge, an independent data provider. They also reviewed an analysis of that information provided by their independent fee consultant. The independent fee consultant provided its belief that the management fees charged by the Adviser to each of the Janus Henderson Funds under the current investment advisory and administration agreements are reasonable in relation to the services provided by the Adviser. The independent fee consultant found: (1) the total expenses and management fees of the Janus Henderson Funds to be reasonable relative to other comparable mutual funds; (2) the total expenses, on average, were 6% under the average total expenses of the respective Broadridge peer group; and (3) the management fees for the Janus Henderson Funds, on average, were 5% under the average management fees for the respective Broadridge peer group. The Trustees also considered the total expenses for each share class of each Janus Henderson Fund compared to the average total expenses for its Broadridge Expense Group and to average total expenses for its Broadridge Expense Universe.
For Janus Henderson Funds with three or more years of performance history, the independent fee consultant also performed a systematic “focus list” analysis of expenses which assessed fund fees in the context of fund performance being delivered. Based on this analysis, the independent fee consultant found that the combination of service quality/performance and expenses on these individual Janus Henderson Funds was reasonable in light of performance trends, performance histories, changes in portfolio management, relative average net asset levels, and the existence of performance fees, breakpoints, and/or expense waivers on such Janus Henderson Funds.
The Trustees considered the methodology used by the Adviser in determining compensation payable to portfolio managers, the competitive environment for investment management talent, and the competitive market for mutual funds in different distribution channels.
The Trustees also reviewed management fees charged by the Adviser to comparable separate account clients and to comparable non-affiliated funds subadvised by the Adviser (for which the Adviser provides only or primarily portfolio management services). Although in most instances subadvisory and separate account fee rates for various investment strategies were lower than management fee rates for Janus Henderson Funds having a similar strategy, the Trustees considered that the Adviser noted that, under the terms of the management agreements with the Janus Henderson Funds, the Adviser performs significant additional services for the Janus Henderson Funds that it does not provide to those other clients, including administration services, oversight of the Janus Henderson Funds’ other service providers, Trustee support, regulatory compliance and numerous other services, and that, in serving the Janus Henderson Funds, the Adviser assumes many legal risks and other costs that it does not assume in servicing its other clients. Moreover, the Trustees noted that the independent fee consultant found that: (1) the management fees the Adviser charges to the Janus Henderson Funds are reasonable in relation to the management fees the Adviser charges to funds subadvised by the Adviser and to the fees the Adviser charges to its institutional separate account clients; (2) these subadvised and institutional separate accounts have different service and infrastructure needs and operate in markets very different from the retail fund market; (3) Janus Henderson mutual fund investors enjoy reasonable fees relative to the fees charged in these other markets; and (4) as part of its 2022 review, 9 of 11 Janus Henderson Funds have lower management fees than similar funds subadvised by the Adviser. The Trustees noted that for the two Janus Henderson Funds that did not, management fees for each were under the average of its 15(c) peer group.
The Trustees considered the fees for each Janus Henderson Fund for its fiscal year ended in 2021 and noted the following with regard to each Janus Henderson Fund’s total expenses, net of applicable fee waivers (the Fund’s “total expenses”) as reflected in the comparative information provided by Broadridge:
Asset Allocation Funds
· For Janus Henderson Global Allocation Fund – Conservative, the Trustees noted that, although the Fund’s total expenses exceeded the peer group average for certain share classes, overall the Fund’s total expenses were reasonable. The Trustees also noted that the Adviser has contractually agreed to limit the Fund’s expenses.
· For Janus Henderson Global Allocation Fund – Growth, the Trustees noted that, although the Fund’s total expenses exceeded the peer group average for certain share classes, overall the Fund’s total expenses were reasonable. The Trustees also noted that the Adviser has contractually agreed to limit the Fund’s expenses, although this limit did not apply because the Fund’s total expenses as shown were below the applicable fee limit.
Janus Henderson Growth and Income Fund
Additional Information (unaudited)
· For Janus Henderson Global Allocation Fund – Moderate, the Trustees noted that, although the Fund’s total expenses exceeded the peer group average for one share class, overall the Fund’s total expenses were reasonable. The Trustees also noted that the Adviser has contractually agreed to limit the Fund’s expenses.
Fixed-Income Funds
· For Janus Henderson Absolute Return Income Opportunities Fund, the Trustees noted that, although the Fund’s total expenses exceeded the peer group average for certain share classes, overall the Fund’s total expenses were reasonable. The Trustees also noted that the Adviser has contractually agreed to limit the Fund’s expenses.
· For Janus Henderson Developed World Bond Fund, the Trustees noted that, although the Fund’s total expenses exceeded the peer group average for one share class, overall the Fund’s total expenses were reasonable. The Trustees also noted that the Adviser has contractually agreed to limit the Fund’s expenses.
· For Janus Henderson Flexible Bond Fund, the Trustees noted that, although the Fund’s total expenses exceeded the peer group average for certain share classes, overall the Fund’s total expenses were reasonable. The Trustees also noted that the Adviser has contractually agreed to limit the Fund’s expenses, although this limit did not apply because the Fund’s total expenses as shown were below the applicable fee limit.
· For Janus Henderson Global Bond Fund, the Trustees noted that, although the Fund’s total expenses exceeded the peer group average for certain share classes, overall the Fund’s total expenses were reasonable. The Trustees also noted that the Adviser has contractually agreed to limit the Fund’s expenses.
· For Janus Henderson High-Yield Fund, the Trustees noted that, although the Fund’s total expenses exceeded the peer group average for certain share classes, overall the Fund’s total expenses were reasonable. The Trustees also noted that the Adviser has contractually agreed to limit the Fund’s expenses.
· For Janus Henderson Multi-Sector Income Fund, the Trustees noted that, although the Fund’s total expenses exceeded the peer group average for certain share classes, overall the Fund’s total expenses were reasonable. The Trustees also noted that the Adviser has contractually agreed to limit the Fund’s expenses.
· For Janus Henderson Short Duration Flexible Bond Fund, the Trustees noted that, although the Fund’s total expenses exceeded the peer group average for certain share classes, overall the Fund’s total expenses were reasonable. The Trustees also noted that the Adviser has contractually agreed to limit the Fund’s expenses.
Global and International Equity Funds
· For Janus Henderson Asia Equity Fund, the Trustees noted that, although the Fund’s total expenses exceeded the peer group average for certain share classes, overall the Fund’s total expenses were reasonable. The Trustees also noted that the Adviser has contractually agreed to limit the Fund’s expenses.
· For Janus Henderson Emerging Markets Fund, the Trustees noted that, although the Fund’s total expenses exceeded the peer group average for certain share classes, overall the Fund’s total expenses were reasonable. The Trustees also noted that the Adviser has contractually agreed to limit the Fund’s expenses.
· For Janus Henderson European Focus Fund, the Trustees noted that, although the Fund’s total expenses exceeded the peer group average for one share class, overall the Fund’s expenses were reasonable. The Trustees also noted that the Adviser has contractually agreed to limit the Fund’s expenses.
· For Janus Henderson Global Equity Income Fund, the Trustees noted that, although the Fund’s total expenses exceeded the peer group average for one share class, overall the Fund’s total expenses were reasonable. The Trustees also noted that the Adviser has contractually agreed to limit the Fund’s expenses, although this limit did not apply because the Fund’s total expenses as shown were below the applicable fee limit.
· For Janus Henderson Global Life Sciences Fund, the Trustees noted that the Fund’s total expenses were below the peer group average for all share classes.
· For Janus Henderson Global Real Estate Fund, the Trustees noted that, although the Fund’s total expenses exceeded the peer group average for certain share classes, overall the Fund’s total expenses were reasonable. The Trustees also noted that the Adviser has contractually agreed to limit the Fund’s expenses, although this limit did not apply because the Fund’s total expenses as shown were below the applicable fee limit.
Janus Henderson Growth and Income Fund
Additional Information (unaudited)
· For Janus Henderson Global Research Fund, the Trustees noted that, although the Fund’s total expenses exceeded the peer group average for one share class, overall the Fund’s total expenses were reasonable. The Trustees also noted that the Adviser has contractually agreed to limit the Fund’s expenses, although this limit did not apply because the Fund’s total expenses as shown were below the applicable fee limit.
· For Janus Henderson Global Select Fund, the Trustees noted that, although the Fund’s total expenses exceeded the peer group average for certain share classes, overall the Fund’s total expenses were reasonable. The Trustees also noted that the Adviser has contractually agreed to limit the Fund’s expenses.
· For Janus Henderson Global Sustainable Equity Fund, the Trustees noted that, although the Fund’s total expenses exceeded the peer group average for certain share classes, overall the Fund’s expenses were reasonable. The Trustees also noted that the Adviser has contractually agreed to limit the Fund’s expenses.
· For Janus Henderson Global Technology and Innovation Fund, the Trustees noted that the Fund’s total expenses were below the peer group average for all share classes.
· For Janus Henderson International Opportunities Fund, the Trustees noted that, although the Fund’s total expenses exceeded the peer group average for certain share classes, overall the Fund’s expenses were reasonable. The Trustees also noted that the Adviser has contractually agreed to limit the Fund’s expenses.
· For Janus Henderson Overseas Fund, the Trustees noted that although the Fund’s total expenses exceeded the peer group average for certain share classes, overall the Fund’s total expenses were reasonable. The Trustees also noted that the Adviser has contractually agreed to limit the Fund’s expenses, although this limit did not apply because the Fund’s total expenses as shown were below the applicable fee limit.
· For Janus Henderson Responsible International Dividend Fund (formerly the Janus Henderson Dividend & Income Builder Fund), the Trustees noted that, although the Fund’s total expenses exceeded the peer group for one share class, overall the Fund’s total expenses were reasonable. The Trustees also noted that the Adviser has contractually agreed to limit the Fund’s expenses.
Money Market Funds
· For Janus Henderson Government Money Market Fund, the Trustees noted that the Fund’s total expenses were below the peer group average for all share classes.
· For Janus Henderson Money Market Fund, the Trustees noted that the Fund’s total expenses were below the peer group average for all share classes.
Multi-Asset Funds
· For Janus Henderson Adaptive Global Allocation Fund, the Trustees noted that, that the Fund’s total expenses were below the peer group average for all share classes.
· For Janus Henderson Balanced Fund, the Trustees noted that, although the Fund’s total expenses exceeded the peer group average for certain share classes, overall the Fund’s total expenses were reasonable. The Trustees also noted that the Adviser has contractually agreed to limit the Fund’s expenses, although this limit did not apply because the Fund’s total expenses as shown were below the applicable fee limit.
U.S. Equity Funds
· For Janus Henderson Adaptive Risk Managed U.S. Equity Fund, the Trustees noted that, although the Fund’s total expenses exceeded the peer group average for certain share classes, overall the Fund’s total expenses were reasonable. The Trustees also noted that the Adviser has contractually agreed to limit the Fund’s expenses, although this limit did not apply because the Fund’s total expenses as shown were below the applicable fee limit.
· For Janus Henderson Contrarian Fund, the Trustees noted that, although the Fund’s total expenses exceeded the peer group average for all share classes, overall the Fund’s total expenses were reasonable. The Trustees also noted that the Adviser had contractually agreed to limit the Fund’s expenses.
· For Janus Henderson Enterprise Fund, the Trustees noted that, although the Fund’s total expenses exceeded the peer group average for certain share classes, overall the Fund’s total expenses were reasonable. The Trustees also noted that the Adviser has contractually agreed to limit the Fund’s expenses, although this limit did not apply because the Fund’s total expenses as shown were below the applicable fee limit.
Janus Henderson Growth and Income Fund
Additional Information (unaudited)
· For Janus Henderson Forty Fund, the Trustees noted that, although the Fund’s total expenses exceeded the peer group average for certain share classes, overall the Fund’s total expenses were reasonable. The Trustees also noted that the Adviser has contractually agreed to limit the Fund’s expenses, although this limit did not apply because the Fund’s total expenses as shown were below the applicable fee limit.
· For Janus Henderson Growth and Income Fund, the Trustees noted that, although the Fund’s total expenses exceeded the peer group average for certain share classes, overall the Fund’s total expenses were reasonable. The Trustees also noted that the Adviser has contractually agreed to limit the Fund’s expenses, although this limit did not apply because the Fund’s total expenses as shown were below the applicable fee limit.
· For Janus Henderson Mid Cap Value Fund, the Trustees noted that the Fund’s total expenses were below the peer group average for all share classes.
· For Janus Henderson Research Fund, the Trustees noted that, although the Fund’s total expenses exceeded the peer group average for certain share classes, overall the Fund’s total expenses were reasonable. The Trustees also noted that the Adviser has contractually agreed to limit the Fund’s expenses.
· For Janus Henderson Small Cap Value Fund, the Trustees noted that, although the Fund’s total expenses exceeded the peer group average for one share class, overall the Fund’s total expenses were reasonable. The Trustees also noted that the Adviser has contractually agreed to limit the Fund’s expenses, although this limit did not apply because the Fund’s total expenses as shown were below the applicable fee limit.
· For Janus Henderson Small-Mid Cap Value Fund, the Trustees noted that the Fund’s total expenses were below the peer group average for all share classes.
· For Janus Henderson Triton Fund, the Trustees noted that, although the Fund’s total expenses exceeded the peer group average for one share class, overall the Fund’s total expenses were reasonable. The Trustees also noted that the Adviser has contractually agreed to limit the Fund’s expenses, although this limit did not apply because the Fund’s total expenses as shown were below the applicable fee limit.
· For Janus Henderson Venture Fund, the Trustees noted that although the Fund’s total expenses exceeded the peer group average for one share class, overall the Fund’s total expenses were reasonable. The Trustees also noted that the Adviser has contractually agreed to limit the Fund’s expenses, although this limit did not apply because the Fund’s total expenses as shown were below the applicable fee limit.
The Trustees reviewed information on the overall profitability to the Adviser and its affiliates from their relationships with the Janus Henderson Funds, and considered profitability data of other publicly traded mutual fund advisers. The Trustees recognized that profitability comparisons among fund managers are difficult because of the variation in the type of comparative information that is publicly available, and the profitability of any fund manager is affected by numerous factors, including the organizational structure of the particular fund manager, differences in complex size, difference in product mix, difference in types of business (mutual fund, institutional and other), differences in the types of funds and other accounts it manages, possible other lines of business, the methodology for allocating expenses and the fund manager’s capital structure and cost of capital.
Additionally, the Trustees considered the estimated profitability to the Adviser from the investment management services it provided to each Janus Henderson Fund. In their review, the Trustees considered whether the Adviser receive adequate incentives and resources to manage the Janus Henderson Funds effectively. In reviewing profitability, the Trustees noted that the estimated profitability for an individual Janus Henderson Fund is necessarily a product of the allocation methodology utilized by the Adviser to allocate its expenses as part of the estimated profitability calculation. In this regard, the Trustees noted that the independent fee consultant found as part of its 2022 review that (1) the expense allocation methodology and rationales utilized by the Adviser were reasonable and (2) no clear correlation exists between expense allocations and operating margins. The Trustees also considered that the estimated profitability for an individual Janus Henderson Fund was influenced by a number of factors, including not only the allocation methodology selected, but also the presence of fee waivers and expense caps, and whether the Janus Henderson Fund’s investment management agreement contained breakpoints or a performance fee component. The Trustees determined, after taking into account these factors, among others, that the Adviser’s estimated profitability with respect to each Janus Henderson Fund was not unreasonable in relation to the services provided, and that the variation in the range of such estimated profitability among the Janus Henderson Funds was not a material factor in the Board’s approval of the reasonableness of any Janus Henderson Fund’s investment management fees.
Janus Henderson Growth and Income Fund
Additional Information (unaudited)
The Trustees concluded that the management fees payable by each Janus Henderson Fund to the Adviser were reasonable in relation to the nature, extent, and quality of the services provided, taking into account the fees charged by other advisers for managing comparable mutual funds with similar strategies, the fees the Adviser charges to other clients, and, as applicable, the impact of fund performance on management fees payable by the Janus Henderson Funds. The Trustees also concluded that each Janus Henderson Fund’s total expenses were reasonable, taking into account the size of the Janus Henderson Fund, the quality of services provided by the Adviser, the investment performance of the Janus Henderson Fund, and any expense limitations agreed to or provided by the Adviser.
Economies of Scale
The Trustees considered information about the potential for the Adviser to realize economies of scale as the assets of the Janus Henderson Funds increase. They noted that their independent fee consultant published a report to the Trustees in June 2022 which provided its research and analysis into economies of scale. They also noted that, although many Janus Henderson Funds pay advisory fees at a fixed base rate as a percentage of net assets, without any breakpoints or performance fees, their independent fee consultant concluded that 75% of these Janus Henderson Funds’ have contractual management fees (gross of waivers) below their Broadridge Expense Group averages. The Trustees also noted the following from the independent fee consultant’s report: (1) that 31% of Janus Henderson Funds had management fee breakpoints in place whereby investors pay lower management fees as fund AUM increases; (2) that 29% of Janus Henderson Funds have low flat-rate fees and performance fees where the Adviser is incentivized to invest in resources which drive Janus Henderson Fund performance; and (3) that 39% of Janus Henderson Funds have low flat-rate fees versus peers where investors pay low fixed fees when the Janus Henderson Fund is small/midsized and higher fees when the Janus Henderson Fund grows in assets. The Trustees also noted that the Janus Henderson Funds share directly in economies of scale through the significant investments made by the Adviser and its affiliates related to services provided to the Funds and the lower charges of third-party service providers that are based in part on the combined scale of all of the Janus Henderson Funds.
The Trustees also considered the independent fee consultant’s conclusion that, given the limitations of various analytical approaches to economies of scale and their conflicting results, it is difficult to analytically confirm or deny the existence of economies of scale in the Janus Henderson complex. In this regard, the independent consultant concluded that (1) to the extent there were economies of scale at the Adviser, the Adviser’s general strategy of setting fixed management fees below peers appeared to share any such economies with investors even on smaller Janus Henderson Funds which have not yet achieved those economies and (2) by setting lower fixed fees from the start on these Janus Henderson Funds, the Adviser appeared to be investing to increase the likelihood that these Janus Henderson Funds will grow to a level to achieve any economies of scale that may exist. Further, the independent fee consultant provided its belief that Janus Henderson Fund investors are well-served by the fee levels and performance fee structures in place on the Janus Henderson Funds in light of any economies of scale that may be present at the Adviser.
Based on all of the information reviewed, including the recent and past research and analysis conducted by the Trustees’ independent fee consultant, the Trustees concluded that the current fee structure of each Janus Henderson Fund was reasonable and that the current rates of fees do reflect a sharing between the Adviser and the Janus Henderson Fund of any economies of scale that may be present at the current asset level of the Janus Henderson Fund.
Other Benefits to the Adviser
The Trustees also considered benefits that accrue to the Adviser and its affiliates from their relationships with the Janus Henderson Funds. They recognized that two affiliates of the Adviser separately serve the Janus Henderson Funds as transfer agent and distributor, respectively, and the transfer agent receives compensation directly from the non-money market Janus Henderson Funds for services provided, and that such compensation contributes to the overall profitability of the Adviser and its affiliates that results from their relationship with the Janus Henderson Funds. The Trustees also considered the Adviser’s past and proposed use of commissions paid by the Janus Henderson Funds on portfolio brokerage transactions to obtain proprietary and third-party research products and services benefiting the Janus Henderson Fund and/or other clients of the Adviser and/or the Adviser. The Trustees concluded that the Adviser’s use of these types of client commission arrangements to obtain proprietary and third-party research products and services was consistent with regulatory requirements and guidelines and was likely to benefit each Janus Henderson Fund. The Trustees also concluded that, other than the services provided by the Adviser and its affiliates pursuant to the agreements and the fees to be paid by each Janus Henderson Fund therefor, the Janus Henderson
Janus Henderson Growth and Income Fund
Additional Information (unaudited)
Funds and the Adviser may potentially benefit from their relationship with each other in other ways. They concluded that the Adviser and its affiliates share directly in economies of scale through the lower charges of third-party service providers that are based in part on the combined scale of the Janus Henderson Funds and other clients serviced by the Adviser and its affiliates. They also concluded that the Adviser benefits from the receipt of research products and services acquired through commissions paid on portfolio transactions of the Janus Henderson Funds and that the Janus Henderson Funds benefit from the Adviser’s receipt of those products and services as well as research products and services acquired through commissions paid by other clients of the Adviser. They further concluded that the success of any Janus Henderson Fund could attract other business to the Adviser or other Janus Henderson Funds, and that the success of the Adviser could enhance the Adviser’s ability to serve the Janus Henderson Funds.
Janus Henderson Growth and Income Fund
Liquidity Risk Management Program (unaudited)
Liquidity Risk Management Program
Rule 22e-4 under the Investment Company Act of 1940, as amended (the “Liquidity Rule”), requires open-end funds (but not money market funds) to adopt and implement a written liquidity risk management program (the “LRMP”) that is reasonably designed to assess and manage liquidity risk, which is the risk that a fund could not meet redemption requests without significant dilution of remaining investors’ interest in the fund. The Fund has implemented a LRMP, which incorporates the following elements: (i) assessment, management, and periodic review of liquidity risk; (ii) classification of portfolio holdings; (iii) the establishment and monitoring of a highly liquid investment minimum, as applicable; (iv) a 15% limitation on a Fund’s illiquid investments; (v) redemptions in-kind; and (vi) board oversight.
The Trustees of the Fund (the “Trustees”) have designated Janus Henderson Investors US LLC, the Fund’s investment adviser (the “Adviser”), as the Program Administrator for the LRMP responsible for administering the LRMP and carrying out the specific responsibilities of the LRMP. A working group comprised of various teams within the Adviser’s business is responsible for administering the LRMP and carrying out the specific responsibilities of different aspects of the LRMP (the “Liquidity Risk Working Group”). In assessing each Fund’s liquidity risk, the Liquidity Risk Working Group periodically considers, as relevant, factors including (i) the liquidity of a Fund’s portfolio investments during normal and reasonably foreseeable stressed conditions; (ii) whether a Fund’s investment strategy is appropriate for an open-end fund; (iii) the extent to which a Fund’s strategy involves a relatively concentrated portfolio or large positions in any issuer; (iv) a Fund’s use of borrowing for investment purposes; and (v) a Fund’s use of derivatives.
The Liquidity Rule requires the Trustees to review at least annually a written report provided by the Program Administrator that addresses the operation of the LRMP and assesses its adequacy and the effectiveness of its implementation, including, if applicable, the operation of the highly liquid investment minimum, and any material changes to the LRMP (the “Program Administrator Report”). At a meeting held on March 15, 2023, the Adviser provided the Program Administrator Report to the Trustees which covered the operation of the LRMP from January 1, 2022 through December 31, 2022 (the “Reporting Period”).
The Program Administrator Report discussed the operation and effectiveness of the LRMP during the Reporting Period. Among other things, the Program Administrator Report indicated that there were no material changes to the LRMP during the Reporting Period, although there were certain methodology adjustments implemented relating to a change in data provider. Additionally, the findings presented in the Program Administrator Report indicated that the LRMP operated adequately during the Reporting Period. These findings included that the Fund was able to meet redemptions during the normal course of business during the Reporting Period. The Program Administrator Report also stated that the Fund did not exceed the 15% limit on illiquid assets during the Reporting Period, that the Fund held primarily highly liquid assets, and was considered to be a primarily highly liquid fund during the Reporting Period. Also included among the Program Administrator Report’s findings was the determination that the Fund’s investment strategy remains appropriate for an open-end fund. In addition, the Adviser expressed its belief in the Program Administrator Report that the LRMP is reasonably designed and adequate to assess and manage the Fund’s liquidity risk, considering the Fund’s particular risks and circumstances, and includes policies and procedures reasonably designed to implement each required component of the Liquidity Rule.
There can be no assurance that the LRMP will achieve its objectives in the future. Please refer to your Fund’s prospectus for more information regarding the risks to which an investment in the Fund may be subject.
Janus Henderson Growth and Income Fund
Useful Information About Your Fund Report (unaudited)
Performance Overviews
Performance overview graphs compare the performance of a hypothetical $10,000 investment in the Fund with one or more widely used market indices. When comparing the performance of the Fund with an index, keep in mind that market indices are not available for investment and do not reflect deduction of expenses.
Average annual total returns are quoted for a Fund with more than one year of performance history. Average annual total return is calculated by taking the growth or decline in value of an investment over a period of time, including reinvestment of dividends and distributions, then calculating the annual compounded percentage rate that would have produced the same result had the rate of growth been constant throughout the period. Average annual total return does not reflect the deduction of taxes that a shareholder would pay on Fund distributions or redemptions of Fund shares.
Cumulative total returns are quoted for a Fund with less than one year of performance history. Cumulative total return is the growth or decline in value of an investment over time, independent of the period of time involved. Cumulative total return does not reflect the deduction of taxes that a shareholder would pay on Fund distributions or redemptions of Fund shares.
Pursuant to federal securities rules, expense ratios shown in the performance chart reflect subsidized (if applicable) and unsubsidized ratios. The total annual fund operating expenses ratio is gross of any fee waivers, reflecting the Fund’s unsubsidized expense ratio. The net annual fund operating expenses ratio (if applicable) includes contractual waivers of the Adviser and reflects the Fund’s subsidized expense ratio. Ratios may be higher or lower than those shown in the “Financial Highlights” in this report.
Schedule of Investments
Following the performance overview section is the Fund’s Schedule of Investments. This schedule reports the types of securities held in the Fund on the last day of the reporting period. Securities are usually listed by type (common stock, corporate bonds, U.S. Government obligations, etc.) and by industry classification (banking, communications, insurance, etc.). Holdings are subject to change without notice.
The value of each security is quoted as of the last day of the reporting period. The value of securities denominated in foreign currencies is converted into U.S. dollars.
If the Fund invests in foreign securities, it will also provide a summary of investments by country. This summary reports the Fund exposure to different countries by providing the percentage of securities invested in each country. The country of each security represents the country of risk. A company may be allocated to a country based on other factors such as location of the company’s principal office, the location of the principal trading market for the company’s securities, or the country where a majority of the company’s revenues are derived. The Fund’s Schedule of Investments relies upon the industry group and country classifications published by Bloomberg and/or MSCI Inc.
Tables listing details of individual forward currency contracts, futures, written options, swaptions, and swaps follow the Fund’s Schedule of Investments (if applicable).
Statement of Assets and Liabilities
This statement is often referred to as the “balance sheet.” It lists the assets and liabilities of the Fund on the last day of the reporting period.
The Fund’s assets are calculated by adding the value of the securities owned, the receivable for securities sold but not yet settled, the receivable for dividends declared but not yet received on securities owned, and the receivable for Fund shares sold to investors but not yet settled. The Fund’s liabilities include payables for securities purchased but not yet settled, Fund shares redeemed but not yet paid, and expenses owed but not yet paid. Additionally, there may be other assets and liabilities such as unrealized gain or loss on forward currency contracts.
The section entitled “Net Assets Consist of” breaks down the components of the Fund’s net assets. Because the Fund must distribute substantially all earnings, you will notice that a significant portion of net assets is shareholder capital.
The last section of this statement reports the net asset value (“NAV”) per share on the last day of the reporting period. The NAV is calculated by dividing the Fund’s net assets for each share class (assets minus liabilities) by the number of shares outstanding.
Janus Henderson Growth and Income Fund
Useful Information About Your Fund Report (unaudited)
Statement of Operations
This statement details the Fund’s income, expenses, realized gains and losses on securities and currency transactions, and changes in unrealized appreciation or depreciation of Fund holdings.
The first section in this statement, entitled “Investment Income,” reports the dividends earned from securities and interest earned from interest-bearing securities in the Fund.
The next section reports the expenses incurred by the Fund, including the advisory fee paid to the investment adviser, transfer agent fees and expenses, and printing and postage for mailing statements, financial reports and prospectuses. Expense offsets and expense reimbursements, if any, are also shown.
The last section lists the amounts of realized gains or losses from investment and foreign currency transactions, and changes in unrealized appreciation or depreciation of investments and foreign currency-denominated assets and liabilities. The Fund will realize a gain (or loss) when it sells its position in a particular security. A change in unrealized gain (or loss) refers to the change in net appreciation or depreciation of the Fund during the reporting period. “Net Realized and Unrealized Gain/(Loss) on Investments” is affected both by changes in the market value of Fund holdings and by gains (or losses) realized during the reporting period.
Statements of Changes in Net Assets
These statements report the increase or decrease in the Fund’s net assets during the reporting period. Changes in the Fund’s net assets are attributable to investment operations, dividends and distributions to investors, and capital share transactions. This is important to investors because it shows exactly what caused the Fund’s net asset size to change during the period.
The first section summarizes the information from the Statement of Operations regarding changes in net assets due to the Fund’s investment operations. The Fund’s net assets may also change as a result of dividend and capital gains distributions to investors. If investors receive their dividends and/or distributions in cash, money is taken out of the Fund to pay the dividend and/or distribution. If investors reinvest their dividends and/or distributions, the Fund’s net assets will not be affected.
The reinvestment of dividends and distributions is included under “Capital Share Transactions.” “Capital Shares” refers to the money investors contribute to the Fund through purchases or withdrawals via redemptions. The Fund’s net assets will increase and decrease in value as investors purchase and redeem shares from the Fund.
Financial Highlights
This schedule provides a per-share breakdown of the components that affect the Fund’s NAV for current and past reporting periods as well as total return, asset size, ratios, and portfolio turnover rate.
The first line in the table reflects the NAV per share at the beginning of the reporting period. The next line reports the net investment income/(loss) per share. Following is the per share total of net gains/(losses), realized and unrealized. Per share dividends and distributions to investors are then subtracted to arrive at the NAV per share at the end of the period. The next line reflects the total return for the period. The total return may include adjustments in accordance with generally accepted accounting principles required at the period end for financial reporting purposes. As a result, the total return may differ from the total return reflected for individual shareholder transactions. Also included are ratios of expenses and net investment income to average net assets.
The Fund’s expenses may be reduced through expense offsets and expense reimbursements. The ratios shown reflect expenses before and after any such offsets and reimbursements.
The ratio of net investment income/(loss) summarizes the income earned less expenses, divided by the average net assets of the Fund during the reporting period. Do not confuse this ratio with the Fund’s yield. The net investment income ratio is not a true measure of the Fund’s yield because it does not take into account the dividends distributed to the Fund’s investors.
The next figure is the portfolio turnover rate, which measures the buying and selling activity in the Fund. Portfolio turnover is affected by market conditions, changes in the asset size of the Fund, fluctuating volume of shareholder purchase and redemption orders, the nature of the Fund’s investments, and the investment style and/or outlook of the portfolio manager(s) and/or investment personnel. A 100% rate implies that an amount equal to the value of the entire portfolio was replaced once during the fiscal year; a 50% rate means that an amount equal to the value of half the
Janus Henderson Growth and Income Fund
Useful Information About Your Fund Report (unaudited)
portfolio is traded in a year; and a 200% rate means that an amount equal to the value of the entire portfolio is traded every six months.
Janus Henderson Growth and Income Fund
Notes
NotesPage1
Janus Henderson Growth and Income Fund
Notes
NotesPage2
| | | | | | | | |
| | | | | |

| | | | |
This report is submitted for the general information of shareholders of the Fund. It is not an offer or solicitation for the Fund and is not authorized for distribution to prospective investors unless preceded or accompanied by an effective prospectus. |
Janus Henderson is a trademark of Janus Henderson Group plc or one of its subsidiaries. © Janus Henderson Group plc. Janus Henderson Group is the ultimate parent of Janus Henderson Distributors US LLC. Janus Henderson Distributors US LLC |
| | | | 125-24-93048 05-23 |
| | | | |
| | | |
| | | SEMIANNUAL REPORT March 31, 2023 |
| | |
| | Janus Henderson International Opportunities Fund |
| | |
| | Janus Investment Fund |
| |
| | | HIGHLIGHTS · Investment strategy behind your fund · Fund performance, characteristics
and holdings |
Table of Contents
Janus Henderson International Opportunities Fund
| | | | | | |
| | | | | 
Paul O’Connor co-portfolio manager | 
George P. Maris co-portfolio manager |
| | | |
Janus Henderson International Opportunities Fund (unaudited)(closed to new investors)
Fund At A Glance
March 31, 2023
| | | | | | | | | | |
| | | | | | | | | |
| | | | | | | | | |
| | | | | | | | | |
| 5 Top Contributors - Holdings | 5 Top Detractors - Holdings |
| | Average
Weight | | Relative
Contribution | | | Average
Weight | | Relative
Contribution |
| UniCredit SpA | 2.14% | | 1.05% | | JD.Com Inc - Class A | 2.09% | | -1.23% |
| ASM International NV | 1.45% | | 0.74% | | Masan Group Corp | 1.30% | | -0.73% |
| New Horizon Health Ltd | 1.45% | | 0.69% | | ICICI Bank Ltd | 2.53% | | -0.63% |
| KION GROUP AG | 0.91% | | 0.63% | | Saudi Telecom Co | 3.02% | | -0.59% |
| Airbus SE | 2.11% | | 0.51% | | Allfunds Group PLC | 1.49% | | -0.57% |
| | | | | | | |
| 5 Top Contributors - Sectors* | | | | | |
| | | Relative | | Fund | MSCI All Country World ex-USA Index |
| | | Contribution | | Average Weight | Average Weight |
| Health Care | | 2.34% | | 11.35% | 9.63% |
| Industrials | | 1.75% | | 15.65% | 12.40% |
| Energy | | 0.72% | | 2.09% | 6.01% |
| Real Estate | | 0.32% | | 0.00% | 2.25% |
| Utilities | | 0.10% | | 3.42% | 3.25% |
| | | | | | |
| | | | | | |
| 5 Top Detractors - Sectors* | | | | | |
| | | Relative | | Fund | MSCI All Country World ex-USA Index |
| | | Contribution | | Average Weight | Average Weight |
| Consumer Discretionary | | -1.34% | | 10.35% | 11.47% |
| Materials | | -0.77% | | 9.01% | 8.34% |
| Other** | | -0.70% | | 0.80% | 0.00% |
| Consumer Staples | | -0.61% | | 11.66% | 8.83% |
| Communication Services | | -0.53% | | 5.56% | 5.88% |
| | | | | | | |
| Relative contribution reflects how the portolio's holdings impacted return relative to the benchmark. Cash and securities not held in the portfolio are not shown. For equity portfolios, relative contribution compares the performance of a security in the portfolio to the benchmark's total return, factoring in the difference in weight of that security in the benchmark. Returns are calculated using daily returns and previous day ending weights rolled up by ticker, excluding fixed income securities, gross of advisory fees, may exclude certain derivatives and will differ from actual performance.
Performance attribution reflects returns gross of advisory fees and may differ from actual returns as they are based on end of day holdings. Attribution is calculated by geometrically linking daily returns for the portfolio and index. |
* | Based on sector classification according to the Global Industry Classification Standard (“GICS”) codes, which are the exclusive property and a service mark of MSCI Inc. and Standard & Poor’s. |
** | Not a GICS classified sector. |
Janus Henderson International Opportunities Fund (unaudited)(closed to new investors)
Fund At A Glance
March 31, 2023
| | |
5 Largest Equity Holdings - (% of Net Assets) |
Taiwan Semiconductor Manufacturing Co Ltd | |
Semiconductor & Semiconductor Equipment | 5.1% |
Samsung Electronics Co Ltd | |
Technology Hardware, Storage & Peripherals | 4.1% |
Sanofi | |
Pharmaceuticals | 3.1% |
Wal-Mart de Mexico SAB de CV | |
Food & Staples Retailing | 2.8% |
Saudi Telecom Co | |
Diversified Telecommunication Services | 2.6% |
| | 17.7% |
| | | | | | |
Asset Allocation - (% of Net Assets) | |
Common Stocks | | 98.9% | |
Investment Companies | | 1.8% | |
Other | | (0.7)% |
| | | 100.0% |
Emerging markets comprised 33.0% of total net assets.
| | |
Top Country Allocations - Long Positions - (% of Investment Securities) |
As of March 31, 2023 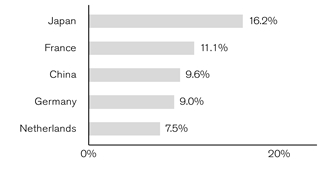
| As of September 30, 2022 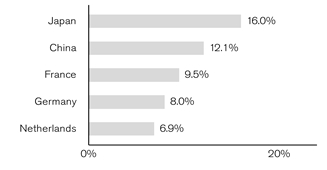
|
Janus Henderson International Opportunities Fund (unaudited)(closed to new investors)
Performance
| |
See important disclosures on the next page. |
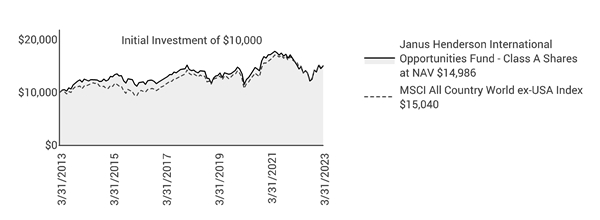
| | | | | | | | | | | | |
| | | | | | | | | | |
| | | | | | | | | | |
Average Annual Total Return - for the periods ended March 31, 2023 | | | Prospectus Expense Ratios |
| | Fiscal
Year-to-Date | One
Year | Five
Year | Ten
Year | Since
Inception* | | | Total Annual Fund
Operating Expenses‡ | Net Annual Fund
Operating Expenses‡ |
Class A Shares at NAV(1) | | 23.51% | -1.57% | 1.20% | 4.13% | 6.88% | | | 1.47% | 1.19% |
Class A Shares at MOP(1) | | 16.42% | -7.22% | 0.01% | 3.51% | 6.59% | | | | |
Class C Shares at NAV(1) | | 23.10% | -2.17% | 0.52% | 3.39% | 6.10% | | | 2.23% | 1.95% |
Class C Shares at CDSC(1) | | 22.10% | -3.10% | 0.52% | 3.39% | 6.10% | | | | |
Class D Shares(1) | | 23.65% | -1.39% | 1.41% | 4.25% | 6.94% | | | 1.47% | 0.99% |
Class I Shares(1) | | 23.70% | -1.29% | 1.50% | 4.43% | 7.08% | | | 1.19% | 0.90% |
Class N Shares(1) | | 23.76% | -1.24% | 1.56% | 4.38% | 7.00% | | | 1.12% | 0.83% |
Class R Shares(1) | | 23.39% | -1.75% | 0.98% | 3.85% | 6.65% | | | 1.95% | 1.54% |
Class S Shares(1) | | 23.63% | -1.38% | 1.26% | 4.12% | 6.88% | | | 6.25% | 1.34% |
Class T Shares(1) | | 23.63% | -1.43% | 1.33% | 4.21% | 6.92% | | | 1.52% | 1.08% |
MSCI All Country World ex-USA Index | | 22.13% | -5.07% | 2.47% | 4.17% | 5.62% | | | | |
Morningstar Quartile - Class A Shares | | - | 2nd | 4th | 3rd | 1st | | | | |
Morningstar Ranking - based on total returns for Foreign Large Blend Funds | | - | 330/751 | 592/665 | 401/533 | 26/308 | | | | |
Returns quoted are past performance and do not guarantee future results; current performance may be lower or higher. Investment returns and principal value will vary; there may be a gain or loss when shares are sold. For the most recent month-end performance call 800.668.0434 (or 800.525.3713 if you hold shares directly with Janus Henderson) or visit janushenderson.com/performance (or janushenderson.com/allfunds if you hold shares directly with Janus Henderson).
Maximum Offering Price (MOP) returns include the maximum sales charge of 5.75%. Net Asset Value (NAV) returns exclude this charge, which would have reduced returns.
CDSC returns include a 1% contingent deferred sales charge (CDSC) on Shares redeemed within 12 months of purchase. Net Asset Value (NAV) returns exclude this charge, which would have reduced returns.
Performance may be affected by risks that include those associated with foreign and emerging markets, fixed income securities, high-yield and high-risk securities, undervalued, overlooked and smaller capitalization companies, real estate related securities including Real Estate Investment Trusts (REITs),
Janus Henderson International Opportunities Fund (unaudited)(closed to new investors)
Performance
Environmental, Social and Governance (ESG) factors, non-diversification, portfolio turnover, derivatives, short sales, initial public offerings (IPOs) and potential conflicts of interest. Each product has different risks. Please see the prospectus for more information about risks, holdings and other details.
Returns include reinvestment of all dividends and distributions and do not reflect the deduction of taxes that a shareholder would pay on Fund distributions or redemptions of Fund shares. The returns do not include adjustments in accordance with generally accepted accounting principles required at the period end for financial reporting purposes.
Returns of the Fund shown prior to June 5, 2017, are those for Henderson International Opportunities Fund (the “Predecessor Fund”), which merged into the Fund after the close of business on June 2, 2017. The Predecessor Fund was advised by Henderson Global Investors (North America) Inc. and subadvised by Henderson Investment Management Limited. Class A Shares, Class C Shares, Class R Shares, Class I Shares, Class IF Shares, and Class R6 Shares of the Predecessor Fund were reorganized into Class A Shares, Class C Shares, Class R Shares, Class I Shares (Class I Shares and Class IF Shares of the Predecessor Fund were reorganized into Class I Shares of the Fund), and Class N Shares, respectively, of the Fund. In connection with this reorganization, certain shareholders of the Predecessor Fund who held shares directly with the Predecessor Fund and not through an intermediary had the Class A Shares, Class C Shares, Class R Shares, Class I Shares, and Class N Shares of the Fund received in the reorganization automatically exchanged for Class D Shares of the Fund following the reorganization. Class A Shares and Class C Shares of the Predecessor Fund commenced operations with the Predecessor Fund’s inception on August 31, 2001. Class R Shares, Class I Shares, Class R6 Shares, and Class IF Shares of the Predecessor Fund commenced operations on September 30, 2005, March 31, 2009, November 30, 2015, and March 31, 2016, respectively. Class D Shares, Class S Shares, and Class T Shares commenced operations on June 5, 2017.
Performance of Class A Shares shown for periods prior to June 5, 2017, reflects the performance of Class A Shares of the Predecessor Fund, calculated using the fees and expenses of Class A Shares of the Predecessor Fund, in effect during the periods shown, net of any applicable fee and expense limitations or waivers.
Performance of Class C Shares shown for periods prior to June 5, 2017, reflects the performance of Class C Shares of the Predecessor Fund, calculated using the fees and expenses of Class C Shares of the Predecessor Fund, in effect during the periods shown, net of any applicable fee and expense limitations or waivers.
Performance of Class R Shares shown for periods prior to June 5, 2017, reflects the performance of Class R Shares of the Predecessor Fund, calculated using the fees and expenses of Class R Shares of the Predecessor Fund, in effect during the periods shown, net of any applicable fee and expense limitations or waivers, except that for periods prior to September 30, 2005, performance for Class R Shares reflects the performance of Class A Shares of the Predecessor Fund, calculated using the fees and expenses of Class A Shares of the Predecessor Fund (without sales charges), net of any applicable fee and expense limitations or waivers.
Performance of Class I Shares shown for periods prior to June 5, 2017, reflects the performance of Class I Shares of the Predecessor Fund, calculated using the fees and expenses of Class I Shares of the Predecessor Fund, in effect during the periods shown, net of any applicable fee and expense limitations or waivers, except that for periods prior to March 31, 2009, performance for Class I Shares reflects the performance of Class A Shares of the Predecessor Fund, calculated using the fees and expenses of Class A Shares of the Predecessor Fund (without sales charges), net of any applicable fee and expense limitations or waivers.
Performance of Class N Shares shown for periods prior to June 5, 2017, reflects the performance of Class R6 Shares of the Predecessor Fund, calculated using the fees and expenses of Class R6 Shares of the Predecessor Fund, in effect during the periods shown, net of any applicable fee and expense limitations or waivers, except that for periods prior to November 30, 2015, performance for Class N Shares reflects the performance of Class A Shares of the Predecessor Fund, calculated using the fees and expenses of Class A Shares of the Predecessor Fund (without sales charges), net of any applicable fee and expense limitations or waivers.
Performance of Class S Shares shown for periods prior to June 5, 2017, reflects the performance of Class A Shares of the Predecessor Fund, calculated using the fees and expenses of Class A Shares of the Predecessor Fund (without sales charges), net of any applicable fee and expense limitations or waivers.
Performance of Class T Shares shown for periods prior to June 5, 2017, reflects the performance of Class A Shares of the Predecessor Fund, calculated using the fees and expenses of Class A Shares of the Predecessor Fund (without sales charges), net of any applicable fee and expense limitations or waivers.
Performance of Class D Shares shown for periods prior to June 5, 2017, reflects the performance of Class A Shares of the Predecessor Fund, calculated using the fees and expenses of Class A Shares of the Predecessor Fund (without sales charges), net of any applicable fee and expense limitations or waivers.
If each share class of the Fund had been available during periods prior to its commencement, the performance shown may have been different. The performance shown for periods following the Fund’s commencement of each share class reflects the fees and expenses of each respective share class, net of any applicable fee and expense limitations or waivers. Please refer to the Fund’s prospectuses for further details concerning historical performance.
Ranking is for the share class shown only; other classes may have different performance characteristics. When an expense waiver is in effect, it may have a material effect on the total return, and therefore the ranking for the period.
© 2023 Morningstar, Inc. All Rights Reserved.
There is no assurance that the investment process will consistently lead to successful investing.
See important disclosures on the next page.
See Notes to Schedule of Investments and Other Information for index definitions.
Janus Henderson International Opportunities Fund (unaudited)(closed to new investors)
Performance
Index performance does not reflect the expenses of managing a portfolio as an index is unmanaged and not available for direct investment.
See “Useful Information About Your Fund Report.”
Effective November 1, 2022, George Maris and Paul O’Connor are Portfolio Managers of the Fund, with George Maris serving as Lead Portfolio Manager.
*The Predecessor Fund’s inception date – August 31, 2001.
‡ As stated in the prospectus. See Financial Highlights for actual expense ratios during the reporting period.
(1) Closed to new investors.
Janus Henderson International Opportunities Fund (unaudited)(closed to new investors)
Expense Examples
As a shareholder of the Fund, you incur two types of costs: (1) transaction costs, such as sales charges (loads) on purchase payments (applicable to Class A Shares only); and (2) ongoing costs, including management fees; 12b-1 distribution and shareholder servicing fees; transfer agent fees and expenses payable pursuant to the Transfer Agency Agreement; and other Fund expenses. This example is intended to help you understand your ongoing costs (in dollars) of investing in the Fund and to compare these costs with the ongoing costs of investing in other mutual funds. To do so, compare this 5% hypothetical example with the 5% hypothetical examples that appear in the shareholder reports of the other funds. The example is based upon an investment of $1,000 invested at the beginning of the period and held for the six-months indicated, unless noted otherwise in the table and footnotes below.
Actual Expenses
The information in the table under the heading “Actual” provides information about actual account values and actual expenses. You may use the information in these columns, together with the amount you invested, to estimate the expenses that you paid over the period. Simply divide your account value by $1,000 (for example, an $8,600 account value divided by $1,000 = 8.6), then multiply the result by the number in the appropriate column for your share class under the heading entitled “Expenses Paid During Period” to estimate the expenses you paid on your account during the period.
Hypothetical Example for Comparison Purposes
The information in the table under the heading “Hypothetical (5% return before expenses)” provides information about hypothetical account values and hypothetical expenses based upon the Fund’s actual expense ratio and an assumed rate of return of 5% per year before expenses, which is not the Fund’s actual return. The hypothetical account values and expenses may not be used to estimate the actual ending account balance or expenses you paid for the period. You may use this information to compare the ongoing costs of investing in the Fund and other funds. To do so, compare this 5% hypothetical example with the 5% hypothetical examples that appear in the shareholder reports of the other funds. Additionally, for an analysis of the fees associated with an investment in any share class or other similar funds, please visit www.finra.org/fundanalyzer.
Please note that the expenses shown in the table are meant to highlight your ongoing costs only and do not reflect any transaction costs. These fees are fully described in the Fund’s prospectuses. Therefore, the hypothetical examples are useful in comparing ongoing costs only, and will not help you determine the relative total costs of owning different funds. In addition, if these transaction costs were included, your costs would have been higher.
| | | | | | | | | | | |
| | | | | | | | |
| | | Actual | | Hypothetical
(5% return before expenses) | |
| Beginning
Account
Value
(10/1/22) | Ending
Account
Value
(3/31/23) | Expenses
Paid During
Period
(10/1/22 - 3/31/23)† | | Beginning
Account
Value
(10/1/22) | Ending
Account
Value
(3/31/23) | Expenses
Paid During
Period
(10/1/22 - 3/31/23)† | Net Annualized
Expense Ratio
(10/1/22 - 3/31/23) |
Class A Shares | $1,000.00 | $1,235.10 | $6.74 | | $1,000.00 | $1,018.90 | $6.09 | 1.21% |
Class C Shares | $1,000.00 | $1,231.00 | $10.51 | | $1,000.00 | $1,015.51 | $9.50 | 1.89% |
Class D Shares | $1,000.00 | $1,236.50 | $5.58 | | $1,000.00 | $1,019.95 | $5.04 | 1.00% |
Class I Shares | $1,000.00 | $1,237.00 | $5.19 | | $1,000.00 | $1,020.29 | $4.68 | 0.93% |
Class N Shares | $1,000.00 | $1,237.60 | $4.74 | | $1,000.00 | $1,020.69 | $4.28 | 0.85% |
Class R Shares | $1,000.00 | $1,233.90 | $8.02 | | $1,000.00 | $1,017.75 | $7.24 | 1.44% |
Class S Shares | $1,000.00 | $1,236.30 | $5.97 | | $1,000.00 | $1,019.60 | $5.39 | 1.07% |
Class T Shares | $1,000.00 | $1,236.30 | $5.97 | | $1,000.00 | $1,019.60 | $5.39 | 1.07% |
† | Expenses Paid During Period are equal to the Net Annualized Expense Ratio multiplied by the average account value over the period, multiplied by 182/365 (to reflect the one-half year period). Expenses in the examples include the effect of applicable fee waivers and/or expense reimbursements, if any. Had such waivers and/or reimbursements not been in effect, your expenses would have been higher. Please refer to the Notes to Financial Statements or the Fund’s prospectuses for more information regarding waivers and/or reimbursements. |
Janus Henderson International Opportunities Fund
Schedule of Investments (unaudited)
March 31, 2023
| | | | | | | | |
Shares
| | | Value | |
Common Stocks– 98.9% | | | |
Aerospace & Defense – 2.3% | | | |
| | Airbus SE | | 108,086 | | | $14,478,529 | |
Automobiles – 2.9% | | | |
| | Daimler AG | | 114,488 | | | 8,793,894 | |
| | Toyota Motor Corp | | 680,000 | | | 9,681,039 | |
| | | 18,474,933 | |
Banks – 7.1% | | | |
| | Bank Negara Indonesia Persero Tbk PT | | 24,791,800 | | | 15,515,158 | |
| | BNP Paribas SA | | 95,094 | | | 5,687,017 | |
| | ICICI Bank Ltd | | 1,169,592 | | | 12,543,726 | |
| | UniCredit SpA | | 626,109 | | | 11,857,703 | |
| | | 45,603,604 | |
Beverages – 2.6% | | | |
| | Asahi Group Holdings Ltd | | 196,000 | | | 7,297,905 | |
| | Carlsberg A/S | | 58,464 | | | 9,040,700 | |
| | | 16,338,605 | |
Building Products – 1.3% | | | |
| | Cie de Saint-Gobain | | 144,188 | | | 8,208,967 | |
Capital Markets – 3.8% | | | |
| | Allfunds Group PLC | | 1,188,382 | | | 7,882,068 | |
| | CITIC Securities Co Ltd | | 7,631,500 | | | 16,349,094 | |
| | | 24,231,162 | |
Chemicals – 4.9% | | | |
| | Fertiglobe PLC | | 8,662,046 | | | 9,444,244 | |
| | Koninklijke DSM NV | | 100,098 | | | 11,829,738 | |
| | Shin-Etsu Chemical Co Ltd | | 305,000 | | | 9,893,657 | |
| | | 31,167,639 | |
Commercial Services & Supplies – 1.7% | | | |
| | SPIE SA | | 372,772 | | | 10,817,040 | |
Diversified Financial Services – 1.8% | | | |
| | Housing Development Finance Corp Ltd | | 353,908 | | | 11,340,670 | |
Diversified Telecommunication Services – 3.3% | | | |
| | Nippon Telegraph & Telephone Corp | | 150,000 | | | 4,480,631 | |
| | Saudi Telecom Co | | 1,560,293 | | | 16,689,857 | |
| | | 21,170,488 | |
Electric Utilities – 1.3% | | | |
| | EDP - Energias de Portugal SA | | 1,550,716 | | | 8,449,175 | |
Food & Staples Retailing – 4.1% | | | |
| | Seven & i Holdings Co Ltd | | 190,000 | | | 8,571,847 | |
| | Wal-Mart de Mexico SAB de CV | | 4,427,976 | | | 17,703,253 | |
| | | 26,275,100 | |
Food Products – 1.2% | | | |
| | Masan Group Corp | | 2,257,980 | | | 7,512,060 | |
Health Care Equipment & Supplies – 2.6% | | | |
| | Olympus Corp | | 312,000 | | | 5,479,979 | |
| | Siemens Healthineers AG (144A) | | 189,493 | | | 10,897,525 | |
| | | 16,377,504 | |
Health Care Providers & Services – 1.5% | | | |
| | New Horizon Health Ltd (144A)* | | 2,803,000 | | | 9,767,544 | |
Hotels, Restaurants & Leisure – 0.9% | | | |
| | Entain PLC | | 372,553 | | | 5,797,072 | |
Household Durables – 1.6% | | | |
| | Sony Corp | | 113,000 | | | 10,274,468 | |
Household Products – 2.0% | | | |
| | Reckitt Benckiser Group PLC | | 171,176 | | | 13,002,869 | |
Independent Power and Renewable Electricity Producers – 2.1% | | | |
| | RWE AG | | 305,132 | | | 13,115,996 | |
Industrial Conglomerates – 1.2% | | | |
| | Hitachi Ltd | | 138,000 | | | 7,586,306 | |
| | |
See Notes to Schedule of Investments and Other Information and Notes to Financial Statements. |
| |
Janus Investment Fund | 7 |
Janus Henderson International Opportunities Fund
Schedule of Investments (unaudited)
March 31, 2023
| | | | | | | | |
Shares
| | | Value | |
Common Stocks– (continued) | | | |
Insurance – 4.9% | | | |
| | AIA Group Ltd | | 769,800 | | | $8,088,788 | |
| | ASR Nederland NV | | 216,006 | | | 8,609,925 | |
| | Dai-ichi Life Holdings Inc | | 468,900 | | | 8,616,419 | |
| | Tokio Marine Holdings Inc | | 320,000 | | | 6,170,680 | |
| | | 31,485,812 | |
Machinery – 4.0% | | | |
| | Daimler Truck Holding AG* | | 179,848 | | | 6,073,422 | |
| | KION Group AG | | 98,724 | | | 3,813,311 | |
| | Outotec Oyj | | 565,860 | | | 6,171,246 | |
| | Shenzhen Inovance Technology Co Ltd - Class A | | 464,011 | | | 4,754,590 | |
| | SMC Corp/Japan | | 9,000 | | | 4,772,310 | |
| | | 25,584,879 | |
Media – 2.0% | | | |
| | Informa PLC | | 1,500,610 | | | 12,821,456 | |
Metals & Mining – 3.6% | | | |
| | Allkem Ltd* | | 1,141,922 | | | 9,144,971 | |
| | Ivanhoe Mines Ltd* | | 1,107,806 | | | 10,009,851 | |
| | Teck Resources Ltd | | 102,174 | | | 3,731,434 | |
| | | 22,886,256 | |
Multiline Retail – 1.7% | | | |
| | JD.Com Inc - Class A | | 482,528 | | | 10,575,678 | |
Oil, Gas & Consumable Fuels – 2.0% | | | |
| | TotalEnergies SE | | 211,303 | | | 12,466,297 | |
Paper & Forest Products – 1.4% | | | |
| | UPM-Kymmene Oyj* | | 269,484 | | | 9,048,847 | |
Personal Products – 0.7% | | | |
| | Unilever PLC | | 91,081 | | | 4,717,929 | |
Pharmaceuticals – 7.8% | | | |
| | AstraZeneca PLC | | 43,352 | | | 6,016,266 | |
| | Bayer AG | | 114,947 | | | 7,320,985 | |
| | Daiichi Sankyo Co Ltd | | 250,000 | | | 9,125,197 | |
| | Novo Nordisk A/S | | 49,700 | | | 7,887,883 | |
| | Sanofi | | 179,909 | | | 19,590,648 | |
| | | 49,940,979 | |
Professional Services – 1.7% | | | |
| | RELX PLC | | 340,696 | | | 11,031,404 | |
Road & Rail – 2.1% | | | |
| | Full Truck Alliance Co (ADR)* | | 1,724,557 | | | 13,123,879 | |
Semiconductor & Semiconductor Equipment – 8.4% | | | |
| | ASM International NV | | 26,532 | | | 10,773,437 | |
| | ASML Holding NV | | 8,174 | | | 5,584,732 | |
| | Renesas Electronics Corp* | | 333,000 | | | 4,835,266 | |
| | Taiwan Semiconductor Manufacturing Co Ltd | | 1,824,000 | | | 32,316,403 | |
| | | 53,509,838 | |
Software – 1.1% | | | |
| | Linklogis Inc - Class B (144A)* | | 15,248,500 | | | 7,077,544 | |
Technology Hardware, Storage & Peripherals – 4.1% | | | |
| | Samsung Electronics Co Ltd | | 524,242 | | | 25,999,271 | |
Textiles, Apparel & Luxury Goods – 2.0% | | | |
| | Hugo Boss AG | | 107,088 | | | 7,678,687 | |
| | Samsonite International SA (144A)* | | 1,647,900 | | | 5,065,051 | |
| | | 12,743,738 | |
Trading Companies & Distributors – 1.2% | | | |
| | Mitsubishi Corp | | 205,000 | | | 7,371,026 | |
Total Common Stocks (cost $577,698,920) | | 630,374,564 | |
| | |
See Notes to Schedule of Investments and Other Information and Notes to Financial Statements. |
| |
8 | MARCH 31, 2023 |
Janus Henderson International Opportunities Fund
Schedule of Investments (unaudited)
March 31, 2023
| | | | | | | | |
Shares
| | | Value | |
Investment Companies– 1.8% | | | |
Money Markets – 1.8% | | | |
| | Janus Henderson Cash Liquidity Fund LLC, 4.7988%ºº,£((cost $11,592,266) | | 11,590,459 | | | $11,592,777 | |
Total Investments (total cost $589,291,186) – 100.7% | | 641,967,341 | |
Liabilities, net of Cash, Receivables and Other Assets – (0.7)% | | (4,266,748) | |
Net Assets – 100% | | $637,700,593 | |
| | | | | | |
Summary of Investments by Country - (Long Positions) (unaudited) |
| |
| | | | | % of | |
| | | | | Investment | |
Country | | Value | | Securities | |
Japan | | $104,156,730 | | 16.2 | % |
France | | 71,248,498 | | 11.1 | |
China | | 61,648,329 | | 9.6 | |
Germany | | 57,693,820 | | 9.0 | |
Netherlands | | 47,829,236 | | 7.5 | |
United Kingdom | | 42,355,592 | | 6.6 | |
Taiwan | | 32,316,403 | | 5.0 | |
South Korea | | 25,999,271 | | 4.1 | |
India | | 23,884,396 | | 3.7 | |
Mexico | | 17,703,253 | | 2.8 | |
Denmark | | 16,928,583 | | 2.6 | |
Saudi Arabia | | 16,689,857 | | 2.6 | |
Indonesia | | 15,515,158 | | 2.4 | |
Finland | | 15,220,093 | | 2.4 | |
Canada | | 13,741,285 | | 2.1 | |
Hong Kong | | 13,153,839 | | 2.1 | |
Italy | | 11,857,703 | | 1.8 | |
United States | | 11,592,777 | | 1.8 | |
United Arab Emirates | | 9,444,244 | | 1.5 | |
Australia | | 9,144,971 | | 1.4 | |
Portugal | | 8,449,175 | | 1.3 | |
Spain | | 7,882,068 | | 1.2 | |
Vietnam | | 7,512,060 | | 1.2 | |
| | | | | | |
| | | | | | |
Total | | $641,967,341 | | 100.0 | % |
| | |
See Notes to Schedule of Investments and Other Information and Notes to Financial Statements. |
| |
Janus Investment Fund | 9 |
Janus Henderson International Opportunities Fund
Schedule of Investments (unaudited)
March 31, 2023
Schedules of Affiliated Investments – (% of Net Assets)
| | | | | | | | | | | |
| | Dividend Income | Realized Gain/(Loss) | Change in Unrealized Appreciation/ Depreciation | Value at 3/31/23 |
Investment Companies - 1.8% |
Money Markets - 1.8% | |
| | Janus Henderson Cash Liquidity Fund LLC, 4.7988%ºº | $ | 266,489 | $ | 180 | $ | 475 | $ | 11,592,777 |
| |
| | | | | | | | | | | |
| | Value at 9/30/22 | Purchases | Sales Proceeds | Value at 3/31/23 |
Investment Companies - 1.8% |
Money Markets - 1.8% | |
| | Janus Henderson Cash Liquidity Fund LLC, 4.7988%ºº | | 18,775,687 | | 130,193,009 | | (137,376,574) | | 11,592,777 |
| | |
See Notes to Schedule of Investments and Other Information and Notes to Financial Statements. |
| |
10 | MARCH 31, 2023 |
Janus Henderson International Opportunities Fund
Notes to Schedule of Investments and Other Information (unaudited)
| | |
MSCI All Country World ex-USA IndexSM | MSCI All Country World ex-USA IndexSM reflects the equity market performance of global developed and emerging markets, excluding the U.S. |
| | |
ADR | American Depositary Receipt |
LLC | Limited Liability Company |
PLC | Public Limited Company |
| | |
144A | Securities sold under Rule 144A of the Securities Act of 1933, as amended, are subject to legal and/or contractual restrictions on resale and may not be publicly sold without registration under the 1933 Act. Unless otherwise noted, these securities have been determined to be liquid under guidelines established by the Board of Trustees. The total value of 144A securities as of the period ended March 31, 2023 is $32,807,664, which represents 5.1% of net assets. |
| | |
* | Non-income producing security. |
| | |
ºº | Rate shown is the 7-day yield as of March 31, 2023. |
| | |
£ | The Fund may invest in certain securities that are considered affiliated companies. As defined by the Investment Company Act of 1940, as amended, an affiliated company is one in which the Fund owns 5% or more of the outstanding voting securities, or a company which is under common ownership or control. |
| | | | | | | | | | | | | |
The following is a summary of the inputs that were used to value the Fund’s investments in securities and other financial instruments as of March 31, 2023. See Notes to Financial Statements for more information. |
| |
Valuation Inputs Summary |
| | | | | | | |
| | | | | Level 2 - | | Level 3 - |
| | | Level 1 - | | Other Significant | | Significant |
| | | Quoted Prices | | Observable Inputs | | Unobservable Inputs |
| | | | | | | |
Assets | | | | | | |
Investments In Securities: | | | | | | |
Common Stocks | | | | | | |
Food & Staples Retailing | $ | 17,703,253 | $ | 8,571,847 | $ | - |
Metals & Mining | | 13,741,285 | | 9,144,971 | | - |
Road & Rail | | 13,123,879 | | - | | - |
All Other | | - | | 568,089,329 | | - |
Investment Companies | | - | | 11,592,777 | | - |
Total Assets | $ | 44,568,417 | $ | 597,398,924 | $ | - |
| | | | | | | |
Janus Henderson International Opportunities Fund
Statement of Assets and Liabilities (unaudited)
March 31, 2023
| |
See footnotes at the end of the Statement. |
| | | | | | | |
| | | | | | |
Assets: | | | | |
| Unaffiliated investments, at value (cost $577,698,920) | | $ | 630,374,564 | |
| Affiliated investments, at value (cost $11,592,266) | | | 11,592,777 | |
| Cash denominated in foreign currency (cost $120,126) | | | 120,126 | |
| Trustees' deferred compensation | | | 15,956 | |
| Receivables: | | | | |
| | Foreign tax reclaims | | | 4,676,442 | |
| | Dividends | | | 2,148,856 | |
| | Investments sold | | | 1,489,064 | |
| | Fund shares sold | | | 289,115 | |
| | Dividends from affiliates | | | 42,308 | |
| Other assets | | | 5,707 | |
Total Assets | | | 650,754,915 | |
Liabilities: | | | | |
| Due to custodian | | | 3,757 | |
| Payables: | | | — | |
| | Fund shares repurchased | | | 7,587,483 | |
| | Foreign withholding tax reclaim fee | | | 4,216,505 | |
| | Advisory fees | | | 399,066 | |
| | Foreign tax liability | | | 325,431 | |
| | Transfer agent fees and expenses | | | 77,406 | |
| | 12b-1 Distribution and shareholder servicing fees | | | 61,750 | |
| | Custodian fees | | | 54,166 | |
| | Trustees' deferred compensation fees | | | 15,956 | |
| | Professional fees | | | 10,431 | |
| | Trustees' fees and expenses | | | 4,505 | |
| | Affiliated fund administration fees payable | | | 1,435 | |
| | Accrued expenses and other payables | | | 296,431 | |
Total Liabilities | | | 13,054,322 | |
Net Assets | | $ | 637,700,593 | |
| | |
See Notes to Financial Statements. |
| |
12 | MARCH 31, 2023 |
Janus Henderson International Opportunities Fund
Statement of Assets and Liabilities (unaudited)
March 31, 2023
| | | | | | | |
| | | | | | |
| | | | | | | |
Net Assets Consist of: | | | | |
| Capital (par value and paid-in surplus) | | $ | 612,300,098 | |
| Total distributable earnings (loss) (includes $325,431 of foreign capital gains tax) | | | 25,400,495 | |
Total Net Assets | | $ | 637,700,593 | |
Net Assets - Class A Shares | | $ | 205,662,164 | |
| Shares Outstanding, $0.01 Par Value (unlimited shares authorized) | | | 10,399,352 | |
Net Asset Value Per Share(1) | | $ | 19.78 | |
Maximum Offering Price Per Share(2) | | $ | 20.99 | |
Net Assets - Class C Shares | | $ | 17,146,342 | |
| Shares Outstanding, $0.01 Par Value (unlimited shares authorized) | | | 944,927 | |
Net Asset Value Per Share(1) | | $ | 18.15 | |
Net Assets - Class D Shares | | $ | 3,086,000 | |
| Shares Outstanding, $0.01 Par Value (unlimited shares authorized) | | | 156,843 | |
Net Asset Value Per Share | | $ | 19.68 | |
Net Assets - Class I Shares | | $ | 347,485,016 | |
| Shares Outstanding, $0.01 Par Value (unlimited shares authorized) | | | 17,646,489 | |
Net Asset Value Per Share | | $ | 19.69 | |
Net Assets - Class N Shares | | $ | 61,374,563 | |
| Shares Outstanding, $0.01 Par Value (unlimited shares authorized) | | | 3,122,328 | |
Net Asset Value Per Share | | $ | 19.66 | |
Net Assets - Class R Shares | | $ | 1,846,026 | |
| Shares Outstanding, $0.01 Par Value (unlimited shares authorized) | | | 95,536 | |
Net Asset Value Per Share | | $ | 19.32 | |
Net Assets - Class S Shares | | $ | 65,714 | |
| Shares Outstanding, $0.01 Par Value (unlimited shares authorized) | | | 3,329 | |
Net Asset Value Per Share | | $ | 19.74 | |
Net Assets - Class T Shares | | $ | 1,034,768 | |
| Shares Outstanding, $0.01 Par Value (unlimited shares authorized) | | | 52,277 | |
Net Asset Value Per Share | | $ | 19.79 | |
| |
(1) Redemption price per share may be reduced for any applicable contingent deferred sales charge. (2) Maximum offering price is computed at 100/94.25 of net asset value. |
| | |
See Notes to Financial Statements. |
| |
Janus Investment Fund | 13 |
Janus Henderson International Opportunities Fund
Statement of Operations (unaudited)
For the period ended March 31, 2023
| | | | | | |
| | | | | |
Investment Income: | | | |
| Dividends | $ | 5,479,044 | |
| Dividends from affiliates | | 266,489 | |
| Other income | | 50,081 | |
| Foreign tax withheld | | (18,811) | |
Total Investment Income | | 5,776,803 | |
Expenses: | | | |
| Advisory fees | | 3,303,137 | |
| 12b-1 Distribution and shareholder servicing fees: | | | |
| | Class A Shares | | 255,545 | |
| | Class C Shares | | 84,291 | |
| | Class R Shares | | 3,305 | |
| | Class S Shares | | 23 | |
| Transfer agent administrative fees and expenses: | | | |
| | Class D Shares | | 1,683 | |
| | Class R Shares | | 2,155 | |
| | Class S Shares | | 75 | |
| | Class T Shares | | 1,336 | |
| Transfer agent networking and omnibus fees: | | | |
| | Class A Shares | | 114,342 | |
| | Class C Shares | | 11,291 | |
| | Class I Shares | | 146,571 | |
| Other transfer agent fees and expenses: | | | |
| | Class A Shares | | 8,135 | |
| | Class C Shares | | 511 | |
| | Class D Shares | | 582 | |
| | Class I Shares | | 12,346 | |
| | Class N Shares | | 1,577 | |
| | Class R Shares | | 52 | |
| | Class S Shares | | 3 | |
| | Class T Shares | | 16 | |
| Custodian fees | | 147,125 | |
| Registration fees | | 51,956 | |
| Professional fees | | 51,618 | |
| Shareholder reports expense | | 37,418 | |
| Trustees’ fees and expenses | | 9,640 | |
| Affiliated fund administration fees | | 7,918 | |
| Other expenses | | 76,944 | |
Total Expenses | | 4,329,595 | |
Less: Excess Expense Reimbursement and Waivers | | (910,126) | |
Net Expenses | | 3,419,469 | |
Net Investment Income/(Loss) | | 2,357,334 | |
| | | | | |
| | |
See Notes to Financial Statements. |
| |
14 | MARCH 31, 2023 |
Janus Henderson International Opportunities Fund
Statement of Operations (unaudited)
For the period ended March 31, 2023
| | | | | | |
| | | | | |
Net Realized Gain/(Loss) on Investments: | | | |
| Investments and foreign currency transactions (net of foreign taxes of $266,829) | $ | 4,075,656 | |
| Investments in affiliates | | 180 | |
Total Net Realized Gain/(Loss) on Investments | | 4,075,836 | |
Change in Unrealized Net Appreciation/Depreciation: | | | |
| Investments, foreign currency translations and Trustees’ deferred compensation (net of decrease in deferred foreign taxes of $38,270) | | 133,493,981 | |
| Investments in affiliates | | 475 | |
Total Change in Unrealized Net Appreciation/Depreciation | | 133,494,456 | |
Net Increase/(Decrease) in Net Assets Resulting from Operations | $ | 139,927,626 | |
| | | | | |
| | |
See Notes to Financial Statements. |
| |
Janus Investment Fund | 15 |
Janus Henderson International Opportunities Fund
Statements of Changes in Net Assets
| | | | | | | | | |
| | | | | | | | |
| | | Period ended
March 31, 2023 (unaudited) | | Year ended
September 30, 2022 | |
| | | | | | | | | |
Operations: | | | | | | |
| Net investment income/(loss) | $ | 2,357,334 | | $ | 12,824,259 | |
| Net realized gain/(loss) on investments | | 4,075,836 | | | 31,955,770 | |
| Change in unrealized net appreciation/depreciation | | 133,494,456 | | | (327,049,319) | |
Net Increase/(Decrease) in Net Assets Resulting from Operations | | 139,927,626 | | | (282,269,290) | |
Dividends and Distributions to Shareholders: | | | | | | |
| | Class A Shares | | (9,146,778) | | | (60,588,628) | |
| | Class C Shares | | (875,833) | | | (7,396,079) | |
| | Class D Shares | | (120,952) | | | (638,077) | |
| | Class I Shares | | (16,422,345) | | | (127,459,428) | |
| | Class N Shares | | (2,794,071) | | | (35,877,873) | |
| | Class R Shares | | (77,035) | | | (510,576) | |
| | Class S Shares | | (2,588) | | | (13,129) | |
| | Class T Shares | | (48,866) | | | (513,349) | |
Net Decrease from Dividends and Distributions to Shareholders | | (29,488,468) | | | (232,997,139) | |
Capital Share Transactions: | | | | | | |
| | Class A Shares | | (22,456,017) | | | 8,971,208 | |
| | Class C Shares | | (4,018,121) | | | (9,250,117) | |
| | Class D Shares | | 312,417 | | | 530,673 | |
| | Class I Shares | | (87,087,898) | | | (42,479,246) | |
| | Class N Shares | | (5,991,584) | | | (77,590,063) | |
| | Class R Shares | | (80,847) | | | (53,220) | |
| | Class S Shares | | 1,288 | | | 18,202 | |
| | Class T Shares | | (174,470) | | | (974,315) | |
Net Increase/(Decrease) from Capital Share Transactions | | (119,495,232) | | | (120,826,878) | |
Net Increase/(Decrease) in Net Assets | | (9,056,074) | | | (636,093,307) | |
Net Assets: | | | | | | |
| Beginning of period | | 646,756,667 | | | 1,282,849,974 | |
| End of period | $ | 637,700,593 | | $ | 646,756,667 | |
| | | | | | | | |
| | |
See Notes to Financial Statements. |
| |
16 | MARCH 31, 2023 |
Janus Henderson International Opportunities Fund
Financial Highlights
| | | | | | | | | | | | | | | | | | | | | | |
Class A Shares | | | | | | | | | | | | | | | | | | |
For a share outstanding during the period ended March 31, 2023 (unaudited) and the year ended September 30 | 2023 | | | 2022 | | | 2021 | | | 2020 | | | 2019 | | | 2018 | |
| Net Asset Value, Beginning of Period | | $16.76 | | | $28.82 | | | $24.77 | | | $24.08 | | | $29.10 | | | $29.50 | |
| Income/(Loss) from Investment Operations: | | | | | | | | | | | | | | | | | | |
| | Net investment income/(loss)(1) | | 0.05 | | | 0.27(2) | | | 0.44(3) | | | 0.11 | | | 0.23 | | | 0.28 | |
| | Net realized and unrealized gain/(loss) | | 3.83 | | | (6.99) | | | 3.79 | | | 1.49 | | | (1.64) | | | (0.39) | |
| Total from Investment Operations | | 3.88 | | | (6.72) | | | 4.23 | | | 1.60 | | | (1.41) | | | (0.11) | |
| Less Dividends and Distributions: | | | | | | | | | | | | | | | | | | |
| | Dividends (from net investment income) | | — | | | (1.33) | | | (0.18) | | | (0.22) | | | (0.44) | | | (0.29) | |
| | Distributions (from capital gains) | | (0.86) | | | (4.01) | | | — | | | (0.69) | | | (3.17) | | | — | |
| Total Dividends and Distributions | | (0.86) | | | (5.34) | | | (0.18) | | | (0.91) | | | (3.61) | | | (0.29) | |
| Net Asset Value, End of Period | | $19.78 | | | $16.76 | | | $28.82 | | | $24.77 | | | $24.08 | | | $29.10 | |
| Total Return* | | 23.57% | | | (28.19)% | | | 17.08% | | | 6.61% | | | (3.07)%(4) | | | (0.40)% | |
| Net Assets, End of Period (in thousands) | | $205,662 | | | $194,189 | | | $328,759 | | | $295,282 | | | $357,079 | | | $485,243 | |
| Average Net Assets for the Period (in thousands) | | $204,938 | | | $275,837 | | | $337,873 | | | $316,482 | | | $419,053 | | | $577,151 | |
| Ratios to Average Net Assets**: | | | | | | | | | | | | | | | | | | |
| | Ratio of Gross Expenses | | 1.48% | | | 1.47%(5) | | | 1.49%(6) | | | 1.42% | | | 1.45% | | | 1.29% | |
| | Ratio of Net Expenses (After Waivers and Expense Offsets) | | 1.21% | | | 1.21% | | | 1.23% | | | 1.28% | | | 1.32% | | | 1.29% | |
| | Ratio of Net Investment Income/(Loss) | | 0.56% | | | 1.20%(2) | | | 1.53%(3) | | | 0.46% | | | 0.96% | | | 0.94% | |
| Portfolio Turnover Rate | | 25% | | | 88% | | | 63% | | | 57% | | | 45% | | | 56% | |
| | | | | | | | | | | | | | | | | | | | | | |
| |
* Total return includes adjustments in accordance with generally accepted accounting principles required at the year or period end and are not annualized for periods of less than one full year. ** Annualized for periods of less than one full year. (1) Per share amounts are calculated based on average shares outstanding during the year or period. (2) Net investment income/(loss) per share and Ratio of Net Investment Income/(Loss) to Average Net Assets include foreign withholding tax reclaims received in November 2021 and March 2022. The impact of the foreign withholding tax reclaims received, net of the related professional fees, to Net investment income/(loss) per share and Ratio of Net Investment Income/(Loss) to Average Net Assets is $0.01 and 0.06%, respectively. (3) Net investment income/(loss) per share and Ratio of Net Investment Income/(Loss) to Average Net Assets include foreign withholding tax reclaims received in September 2021. The impact of the foreign withholding tax reclaims received, net of the related professional fees, to Net investment income/(loss) per share and Ratio of Net Investment Income/(Loss) to Average Net Assets is $0.15 and 0.52%, respectively. (4) Total return without the effect of affiliated payments would have been (3.11)%. (5) Ratio of Gross Expenses includes additional professional fees related to foreign withholding tax reclaims received in November 2021 and March 2022. The impact of the additional professional fees to Ratio of Gross Expenses is 0.03%. (6) Ratio of Gross Expenses includes additional professional fees related to foreign withholding tax reclaims received in September 2021. The impact of the additional professional fees to Ratio of Gross Expenses is 0.08%. |
| | |
See Notes to Financial Statements. |
| |
Janus Investment Fund | 17 |
Janus Henderson International Opportunities Fund
Financial Highlights
| | | | | | | | | | | | | | | | | | | | | | |
Class C Shares | | | | | | | | | | | | | | | | | | |
For a share outstanding during the period ended March 31, 2023 (unaudited) and the year ended September 30 | 2023 | | | 2022 | | | 2021 | | | 2020 | | | 2019 | | | 2018 | |
| Net Asset Value, Beginning of Period | | $15.49 | | | $26.95 | | | $23.17 | | | $22.53 | | | $27.13 | | | $27.46 | |
| Income/(Loss) from Investment Operations: | | | | | | | | | | | | | | | | | | |
| | Net investment income/(loss)(1) | | (0.01) | | | 0.09(2) | | | 0.16(3) | | | (0.05) | | | 0.02 | | | 0.06 | |
| | Net realized and unrealized gain/(loss) | | 3.53 | | | (6.47) | | | 3.62 | | | 1.38 | | | (1.45) | | | (0.36) | |
| Total from Investment Operations | | 3.52 | | | (6.38) | | | 3.78 | | | 1.33 | | | (1.43) | | | (0.30) | |
| Less Dividends and Distributions: | | | | | | | | | | | | | | | | | | |
| | Dividends (from net investment income) | | — | | | (1.07) | | | — | | | — | | | — | | | (0.03) | |
| | Distributions (from capital gains) | | (0.86) | | | (4.01) | | | — | | | (0.69) | | | (3.17) | | | — | |
| Total Dividends and Distributions | | (0.86) | | | (5.08) | | | — | | | (0.69) | | | (3.17) | | | (0.03) | |
| Net Asset Value, End of Period | | $18.15 | | | $15.49 | | | $26.95 | | | $23.17 | | | $22.53 | | | $27.13 | |
| Total Return* | | 23.17% | | | (28.70)% | | | 16.31% | | | 5.86% | | | (3.64)%(4) | | | (1.09)% | |
| Net Assets, End of Period (in thousands) | | $17,146 | | | $18,219 | | | $43,690 | | | $61,292 | | | $106,863 | | | $336,880 | |
| Average Net Assets for the Period (in thousands) | | $18,290 | | | $30,662 | | | $55,342 | | | $82,679 | | | $161,985 | | | $397,796 | |
| Ratios to Average Net Assets**: | | | | | | | | | | | | | | | | | | |
| | Ratio of Gross Expenses | | 2.18% | | | 2.14%(5) | | | 2.19%(6) | | | 2.06% | | | 2.09% | | | 2.00% | |
| | Ratio of Net Expenses (After Waivers and Expense Offsets) | | 1.89% | | | 1.88% | | | 1.95% | | | 1.92% | | | 1.97% | | | 2.00% | |
| | Ratio of Net Investment Income/(Loss) | | (0.17)% | | | 0.42%(2) | | | 0.60%(3) | | | (0.24)% | | | 0.10% | | | 0.22% | |
| Portfolio Turnover Rate | | 25% | | | 88% | | | 63% | | | 57% | | | 45% | | | 56% | |
| | | | | | | | | | | | | | | | | | | | | | |
| |
* Total return includes adjustments in accordance with generally accepted accounting principles required at the year or period end and are not annualized for periods of less than one full year. ** Annualized for periods of less than one full year. (1) Per share amounts are calculated based on average shares outstanding during the year or period. (2) Net investment income/(loss) per share and Ratio of Net Investment Income/(Loss) to Average Net Assets include foreign withholding tax reclaims received in November 2021 and March 2022. The impact of the foreign withholding tax reclaims received, net of the related professional fees, to Net investment income/(loss) per share and Ratio of Net Investment Income/(Loss) to Average Net Assets is $0.01 and 0.06%, respectively. (3) Net investment income/(loss) per share and Ratio of Net Investment Income/(Loss) to Average Net Assets include foreign withholding tax reclaims received in September 2021. The impact of the foreign withholding tax reclaims received, net of the related professional fees, to Net investment income/(loss) per share and Ratio of Net Investment Income/(Loss) to Average Net Assets is $0.14 and 0.52%, respectively. (4) Total return without the effect of affiliated payments would have been (3.68)%. (5) Ratio of Gross Expenses includes additional professional fees related to foreign withholding tax reclaims received in November 2021 and March 2022. The impact of the additional professional fees to Ratio of Gross Expenses is 0.03%. (6) Ratio of Gross Expenses includes additional professional fees related to foreign withholding tax reclaims received in September 2021. The impact of the additional professional fees to Ratio of Gross Expenses is 0.08%. |
| | |
See Notes to Financial Statements. |
| |
18 | MARCH 31, 2023 |
Janus Henderson International Opportunities Fund
Financial Highlights
| | | | | | | | | | | | | | | | | | | | | | |
Class D Shares | | | | | | | | | | | | | | | | | | |
For a share outstanding during the period ended March 31, 2023 (unaudited) and the year ended September 30 | 2023 | | | 2022 | | | 2021 | | | 2020 | | | 2019 | | | 2018 | |
| Net Asset Value, Beginning of Period | | $16.66 | | | $28.69 | | | $24.68 | | | $24.00 | | | $29.06 | | | $29.51 | |
| Income/(Loss) from Investment Operations: | | | | | | | | | | | | | | | | | | |
| | Net investment income/(loss)(1) | | 0.08 | | | 0.32(2) | | | 0.56(3) | | | 0.17 | | | 0.29 | | | 0.37 | |
| | Net realized and unrealized gain/(loss) | | 3.80 | | | (6.95) | | | 3.70 | | | 1.48 | | | (1.67) | | | (0.40) | |
| Total from Investment Operations | | 3.88 | | | (6.63) | | | 4.26 | | | 1.65 | | | (1.38) | | | (0.03) | |
| Less Dividends and Distributions: | | | | | | | | | | | | | | | | | | |
| | Dividends (from net investment income) | | — | | | (1.39) | | | (0.25) | | | (0.28) | | | (0.51) | | | (0.42) | |
| | Distributions (from capital gains) | | (0.86) | | | (4.01) | | | — | | | (0.69) | | | (3.17) | | | — | |
| Total Dividends and Distributions | | (0.86) | | | (5.40) | | | (0.25) | | | (0.97) | | | (3.68) | | | (0.42) | |
| Net Asset Value, End of Period | | $19.68 | | | $16.66 | | | $28.69 | | | $24.68 | | | $24.00 | | | $29.06 | |
| Total Return* | | 23.71% | | | (28.04)% | | | 17.29% | | | 6.84% | | | (2.90)%(4) | | | (0.15)% | |
| Net Assets, End of Period (in thousands) | | $3,086 | | | $2,347 | | | $3,379 | | | $2,210 | | | $2,257 | | | $3,002 | |
| Average Net Assets for the Period (in thousands) | | $2,853 | | | $3,028 | | | $3,047 | | | $2,132 | | | $2,483 | | | $3,163 | |
| Ratios to Average Net Assets**: | | | | | | | | | | | | | | | | | | |
| | Ratio of Gross Expenses | | 1.49% | | | 1.47%(5) | | | 1.44%(6) | | | 1.41% | | | 1.59% | | | 1.16% | |
| | Ratio of Net Expenses (After Waivers and Expense Offsets) | | 1.00% | | | 1.01% | | | 1.03% | | | 1.06% | | | 1.13% | | | 1.10% | |
| | Ratio of Net Investment Income/(Loss) | | 0.83% | | | 1.45%(2) | | | 1.93%(3) | | | 0.73% | | | 1.20% | | | 1.25% | |
| Portfolio Turnover Rate | | 25% | | | 88% | | | 63% | | | 57% | | | 45% | | | 56% | |
| | | | | | | | | | | | | | | | | | | | | | |
| |
* Total return includes adjustments in accordance with generally accepted accounting principles required at the year or period end and are not annualized for periods of less than one full year. ** Annualized for periods of less than one full year. (1) Per share amounts are calculated based on average shares outstanding during the year or period. (2) Net investment income/(loss) per share and Ratio of Net Investment Income/(Loss) to Average Net Assets include foreign withholding tax reclaims received in November 2021 and March 2022. The impact of the foreign withholding tax reclaims received, net of the related professional fees, to Net investment income/(loss) per share and Ratio of Net Investment Income/(Loss) to Average Net Assets is $0.01 and 0.06%, respectively. (3) Net investment income/(loss) per share and Ratio of Net Investment Income/(Loss) to Average Net Assets include foreign withholding tax reclaims received in September 2021. The impact of the foreign withholding tax reclaims received, net of the related professional fees, to Net investment income/(loss) per share and Ratio of Net Investment Income/(Loss) to Average Net Assets is $0.15 and 0.52%, respectively. (4) Total return without the effect of affiliated payments would have been (2.94)%. (5) Ratio of Gross Expenses includes additional professional fees related to foreign withholding tax reclaims received in November 2021 and March 2022. The impact of the additional professional fees to Ratio of Gross Expenses is 0.03%. (6) Ratio of Gross Expenses includes additional professional fees related to foreign withholding tax reclaims received in September 2021. The impact of the additional professional fees to Ratio of Gross Expenses is 0.08%. |
| | |
See Notes to Financial Statements. |
| |
Janus Investment Fund | 19 |
Janus Henderson International Opportunities Fund
Financial Highlights
| | | | | | | | | | | | | | | | | | | | | | |
Class I Shares | | | | | | | | | | | | | | | | | | |
For a share outstanding during the period ended March 31, 2023 (unaudited) and the year ended September 30 | 2023 | | | 2022 | | | 2021 | | | 2020 | | | 2019 | | | 2018 | |
| Net Asset Value, Beginning of Period | | $16.67 | | | $28.72 | | | $24.69 | | | $24.03 | | | $29.06 | | | $29.47 | |
| Income/(Loss) from Investment Operations: | | | | | | | | | | | | | | | | | | |
| | Net investment income/(loss)(1) | | 0.08 | | | 0.32(2) | | | 0.50(3) | | | 0.17 | | | 0.24 | | | 0.38 | |
| | Net realized and unrealized gain/(loss) | | 3.80 | | | (6.95) | | | 3.81 | | | 1.49 | | | (1.58) | | | (0.39) | |
| Total from Investment Operations | | 3.88 | | | (6.63) | | | 4.31 | | | 1.66 | | | (1.34) | | | (0.01) | |
| Less Dividends and Distributions: | | | | | | | | | | | | | | | | | | |
| | Dividends (from net investment income) | | — | | | (1.41) | | | (0.28) | | | (0.31) | | | (0.52) | | | (0.40) | |
| | Distributions (from capital gains) | | (0.86) | | | (4.01) | | | — | | | (0.69) | | | (3.17) | | | — | |
| Total Dividends and Distributions | | (0.86) | | | (5.42) | | | (0.28) | | | (1.00) | | | (3.69) | | | (0.40) | |
| Net Asset Value, End of Period | | $19.69 | | | $16.67 | | | $28.72 | | | $24.69 | | | $24.03 | | | $29.06 | |
| Total Return* | | 23.70% | | | (28.00)% | | | 17.47% | | | 6.87% | | | (2.75)%(4) | | | (0.07)% | |
| Net Assets, End of Period (in thousands) | | $347,485 | | | $371,968 | | | $703,785 | | | $720,915 | | | $1,050,061 | | | $3,021,157 | |
| Average Net Assets for the Period (in thousands) | | $372,573 | | | $551,653 | | | $770,690 | | | $860,681 | | | $1,621,134 | | | $3,542,904 | |
| Ratios to Average Net Assets**: | | | | | | | | | | | | | | | | | | |
| | Ratio of Gross Expenses | | 1.20% | | | 1.19%(5) | | | 1.20%(6) | | | 1.12% | | | 1.12% | | | 0.99% | |
| | Ratio of Net Expenses (After Waivers and Expense Offsets) | | 0.93% | | | 0.93% | | | 0.95% | | | 0.98% | | | 1.01% | | | 0.99% | |
| | Ratio of Net Investment Income/(Loss) | | 0.81% | | | 1.45%(2) | | | 1.75%(3) | | | 0.71% | | | 0.99% | | | 1.27% | |
| Portfolio Turnover Rate | | 25% | | | 88% | | | 63% | | | 57% | | | 45% | | | 56% | |
| | | | | | | | | | | | | | | | | | | | | | |
| |
* Total return includes adjustments in accordance with generally accepted accounting principles required at the year or period end and are not annualized for periods of less than one full year. ** Annualized for periods of less than one full year. (1) Per share amounts are calculated based on average shares outstanding during the year or period. (2) Net investment income/(loss) per share and Ratio of Net Investment Income/(Loss) to Average Net Assets include foreign withholding tax reclaims received in November 2021 and March 2022. The impact of the foreign withholding tax reclaims received, net of the related professional fees, to Net investment income/(loss) per share and Ratio of Net Investment Income/(Loss) to Average Net Assets is $0.01 and 0.06%, respectively. (3) Net investment income/(loss) per share and Ratio of Net Investment Income/(Loss) to Average Net Assets include foreign withholding tax reclaims received in September 2021. The impact of the foreign withholding tax reclaims received, net of the related professional fees, to Net investment income/(loss) per share and Ratio of Net Investment Income/(Loss) to Average Net Assets is $0.15 and 0.52%, respectively. (4) Total return without the effect of affiliated payments would have been (2.79)%. (5) Ratio of Gross Expenses includes additional professional fees related to foreign withholding tax reclaims received in November 2021 and March 2022. The impact of the additional professional fees to Ratio of Gross Expenses is 0.03%. (6) Ratio of Gross Expenses includes additional professional fees related to foreign withholding tax reclaims received in September 2021. The impact of the additional professional fees to Ratio of Gross Expenses is 0.08%. |
| | |
See Notes to Financial Statements. |
| |
20 | MARCH 31, 2023 |
Janus Henderson International Opportunities Fund
Financial Highlights
| | | | | | | | | | | | | | | | | | | | | | |
Class N Shares | | | | | | | | | | | | | | | | | | |
For a share outstanding during the period ended March 31, 2023 (unaudited) and the year ended September 30 | 2023 | | | 2022 | | | 2021 | | | 2020 | | | 2019 | | | 2018 | |
| Net Asset Value, Beginning of Period | | $16.63 | | | $28.73 | | | $24.67 | | | $23.99 | | | $29.08 | | | $29.47 | |
| Income/(Loss) from Investment Operations: | | | | | | | | | | | | | | | | | | |
| | Net investment income/(loss)(1) | | 0.09 | | | 0.28(2) | | | 0.44(3) | | | 0.22 | | | 0.48 | | | 0.41 | |
| | Net realized and unrealized gain/(loss) | | 3.80 | | | (6.92) | | | 3.91 | | | 1.46 | | | (1.85) | | | (0.38) | |
| Total from Investment Operations | | 3.89 | | | (6.64) | | | 4.35 | | | 1.68 | | | (1.37) | | | 0.03 | |
| Less Dividends and Distributions: | | | | | | | | | | | | | | | | | | |
| | Dividends (from net investment income) | | — | | | (1.45) | | | (0.29) | | | (0.31) | | | (0.55) | | | (0.42) | |
| | Distributions (from capital gains) | | (0.86) | | | (4.01) | | | — | | | (0.69) | | | (3.17) | | | — | |
| Total Dividends and Distributions | | (0.86) | | | (5.46) | | | (0.29) | | | (1.00) | | | (3.72) | | | (0.42) | |
| Net Asset Value, End of Period | | $19.66 | | | $16.63 | | | $28.73 | | | $24.67 | | | $23.99 | | | $29.08 | |
| Total Return* | | 23.82% | | | (28.07)% | | | 17.67% | | | 6.99% | | | (2.82)%(4) | | | 0.07% | |
| Net Assets, End of Period (in thousands) | | $61,375 | | | $57,298 | | | $197,222 | | | $366,371 | | | $280,749 | | | $43,305 | |
| Average Net Assets for the Period (in thousands) | | $61,022 | | | $107,875 | | | $337,046 | | | $315,851 | | | $128,934 | | | $12,868 | |
| Ratios to Average Net Assets**: | | | | | | | | | | | | | | | | | | |
| | Ratio of Gross Expenses | | 1.12% | | | 1.12%(5) | | | 1.10%(6) | | | 1.05% | | | 1.07% | | | 0.96% | |
| | Ratio of Net Expenses (After Waivers and Expense Offsets) | | 0.85% | | | 0.86% | | | 0.88% | | | 0.90% | | | 0.91% | | | 0.94% | |
| | Ratio of Net Investment Income/(Loss) | | 0.93% | | | 1.21%(2) | | | 1.54%(3) | | | 0.95% | | | 2.02% | | | 1.41% | |
| Portfolio Turnover Rate | | 25% | | | 88% | | | 63% | | | 57% | | | 45% | | | 56% | |
| | | | | | | | | | | | | | | | | | | | | | |
| |
* Total return includes adjustments in accordance with generally accepted accounting principles required at the year or period end and are not annualized for periods of less than one full year. ** Annualized for periods of less than one full year. (1) Per share amounts are calculated based on average shares outstanding during the year or period. (2) Net investment income/(loss) per share and Ratio of Net Investment Income/(Loss) to Average Net Assets include foreign withholding tax reclaims received in November 2021 and March 2022. The impact of the foreign withholding tax reclaims received, net of the related professional fees, to Net investment income/(loss) per share and Ratio of Net Investment Income/(Loss) to Average Net Assets is $0.01 and 0.06%, respectively. (3) Net investment income/(loss) per share and Ratio of Net Investment Income/(Loss) to Average Net Assets include foreign withholding tax reclaims received in September 2021. The impact of the foreign withholding tax reclaims received, net of the related professional fees, to Net investment income/(loss) per share and Ratio of Net Investment Income/(Loss) to Average Net Assets is $0.15 and 0.52%, respectively. (4) Total return without the effect of affiliated payments would have been (2.86)%. (5) Ratio of Gross Expenses includes additional professional fees related to foreign withholding tax reclaims received in November 2021 and March 2022. The impact of the additional professional fees to Ratio of Gross Expenses is 0.03%. (6) Ratio of Gross Expenses includes additional professional fees related to foreign withholding tax reclaims received in September 2021. The impact of the additional professional fees to Ratio of Gross Expenses is 0.08%. |
| | |
See Notes to Financial Statements. |
| |
Janus Investment Fund | 21 |
Janus Henderson International Opportunities Fund
Financial Highlights
| | | | | | | | | | | | | | | | | | | | | | |
Class R Shares | | | | | | | | | | | | | | | | | | |
For a share outstanding during the period ended March 31, 2023 (unaudited) and the year ended September 30 | 2023 | | | 2022 | | | 2021 | | | 2020 | | | 2019 | | | 2018 | |
| Net Asset Value, Beginning of Period | | $16.41 | | | $28.28 | | | $24.21 | | | $23.51 | | | $28.42 | | | $28.81 | |
| Income/(Loss) from Investment Operations: | | | | | | | | | | | | | | | | | | |
| | Net investment income/(loss)(1) | | 0.03 | | | 0.21(2) | | | 0.33(3) | | | 0.01 | | | 0.15 | | | 0.16 | |
| | Net realized and unrealized gain/(loss) | | 3.74 | | | (6.85) | | | 3.79 | | | 1.47 | | | (1.59) | | | (0.36) | |
| Total from Investment Operations | | 3.77 | | | (6.64) | | | 4.12 | | | 1.48 | | | (1.44) | | | (0.20) | |
| Less Dividends and Distributions: | | | | | | | | | | | | | | | | | | |
| | Dividends (from net investment income) | | — | | | (1.22) | | | (0.05) | | | (0.09) | | | (0.30) | | | (0.19) | |
| | Distributions (from capital gains) | | (0.86) | | | (4.01) | | | — | | | (0.69) | | | (3.17) | | | — | |
| Total Dividends and Distributions | | (0.86) | | | (5.23) | | | (0.05) | | | (0.78) | | | (3.47) | | | (0.19) | |
| Net Asset Value, End of Period | | $19.32 | | | $16.41 | | | $28.28 | | | $24.21 | | | $23.51 | | | $28.42 | |
| Total Return* | | 23.39% | | | (28.34)% | | | 17.01% | | | 6.27% | | | (3.35)%(4) | | | (0.71)% | |
| Net Assets, End of Period (in thousands) | | $1,846 | | | $1,654 | | | $2,905 | | | $4,147 | | | $9,168 | | | $16,214 | |
| Average Net Assets for the Period (in thousands) | | $1,730 | | | $2,318 | | | $4,093 | | | $6,096 | | | $11,867 | | | $19,820 | |
| Ratios to Average Net Assets**: | | | | | | | | | | | | | | | | | | |
| | Ratio of Gross Expenses | | 1.89% | | | 1.69%(5) | | | 1.70%(6) | | | 1.79% | | | 1.81% | | | 1.66% | |
| | Ratio of Net Expenses (After Waivers and Expense Offsets) | | 1.44% | | | 1.31% | | | 1.39% | | | 1.57% | | | 1.62% | | | 1.62% | |
| | Ratio of Net Investment Income/(Loss) | | 0.37% | | | 0.97%(2) | | | 1.15%(3) | | | 0.03% | | | 0.63% | | | 0.54% | |
| Portfolio Turnover Rate | | 25% | | | 88% | | | 63% | | | 57% | | | 45% | | | 56% | |
| | | | | | | | | | | | | | | | | | | | | | |
| |
* Total return includes adjustments in accordance with generally accepted accounting principles required at the year or period end and are not annualized for periods of less than one full year. ** Annualized for periods of less than one full year. (1) Per share amounts are calculated based on average shares outstanding during the year or period. (2) Net investment income/(loss) per share and Ratio of Net Investment Income/(Loss) to Average Net Assets include foreign withholding tax reclaims received in November 2021 and March 2022. The impact of the foreign withholding tax reclaims received, net of the related professional fees, to Net investment income/(loss) per share and Ratio of Net Investment Income/(Loss) to Average Net Assets is $0.01 and 0.06%, respectively. (3) Net investment income/(loss) per share and Ratio of Net Investment Income/(Loss) to Average Net Assets include foreign withholding tax reclaims received in September 2021. The impact of the foreign withholding tax reclaims received, net of the related professional fees, to Net investment income/(loss) per share and Ratio of Net Investment Income/(Loss) to Average Net Assets is $0.15 and 0.52%, respectively. (4) Total return without the effect of affiliated payments would have been (3.39)%. (5) Ratio of Gross Expenses includes additional professional fees related to foreign withholding tax reclaims received in November 2021 and March 2022. The impact of the additional professional fees to Ratio of Gross Expenses is 0.03%. (6) Ratio of Gross Expenses includes additional professional fees related to foreign withholding tax reclaims received in September 2021. The impact of the additional professional fees to Ratio of Gross Expenses is 0.08%. |
| | |
See Notes to Financial Statements. |
| |
22 | MARCH 31, 2023 |
Janus Henderson International Opportunities Fund
Financial Highlights
| | | | | | | | | | | | | | | | | | | | | | |
Class S Shares | | | | | | | | | | | | | | | | | | |
For a share outstanding during the period ended March 31, 2023 (unaudited) and the year ended September 30 | 2023 | | | 2022 | | | 2021 | | | 2020 | | | 2019 | | | 2018 | |
| Net Asset Value, Beginning of Period | | $16.72 | | | $28.71 | | | $24.66 | | | $23.80 | | | $29.00 | | | $29.48 | |
| Income/(Loss) from Investment Operations: | | | | | | | | | | | | | | | | | | |
| | Net investment income/(loss)(1) | | 0.07 | | | 0.34(2) | | | 0.52(3) | | | 0.09 | | | 0.23 | | | 0.44 | |
| | Net realized and unrealized gain/(loss) | | 3.81 | | | (6.97) | | | 3.75 | | | 1.46 | | | (1.72) | | | (0.53) | |
| Total from Investment Operations | | 3.88 | | | (6.63) | | | 4.27 | | | 1.55 | | | (1.49) | | | (0.09) | |
| Less Dividends and Distributions: | | | | | | | | | | | | | | | | | | |
| | Dividends (from net investment income) | | — | | | (1.35) | | | (0.22) | | | — | | | (0.54) | | | (0.39) | |
| | Distributions (from capital gains) | | (0.86) | | | (4.01) | | | — | | | (0.69) | | | (3.17) | | | — | |
| Total Dividends and Distributions | | (0.86) | | | (5.36) | | | (0.22) | | | (0.69) | | | (3.71) | | | (0.39) | |
| Net Asset Value, End of Period | | $19.74 | | | $16.72 | | | $28.71 | | | $24.66 | | | $23.80 | | | $29.00 | |
| Total Return* | | 23.63% | | | (27.96)% | | | 17.33% | | | 6.49% | | | (3.32)%(4) | | | (0.36)% | |
| Net Assets, End of Period (in thousands) | | $66 | | | $54 | | | $70 | | | $59 | | | $110 | | | $2,674 | |
| Average Net Assets for the Period (in thousands) | | $60 | | | $65 | | | $69 | | | $95 | | | $1,736 | | | $591 | |
| Ratios to Average Net Assets**: | | | | | | | | | | | | | | | | | | |
| | Ratio of Gross Expenses | | 6.41% | | | 5.93%(5) | | | 5.70%(6) | | | 4.69% | | | 1.76% | | | 1.75% | |
| | Ratio of Net Expenses (After Waivers and Expense Offsets) | | 1.07% | | | 0.89% | | | 0.99% | | | 1.41% | | | 1.46% | | | 1.43% | |
| | Ratio of Net Investment Income/(Loss) | | 0.74% | | | 1.53%(2) | | | 1.80%(3) | | | 0.40% | | | 0.97% | | | 1.57% | |
| Portfolio Turnover Rate | | 25% | | | 88% | | | 63% | | | 57% | | | 45% | | | 56% | |
| | | | | | | | | | | | | | | | | | | | | | |
| |
* Total return includes adjustments in accordance with generally accepted accounting principles required at the year or period end and are not annualized for periods of less than one full year. ** Annualized for periods of less than one full year. (1) Per share amounts are calculated based on average shares outstanding during the year or period. (2) Net investment income/(loss) per share and Ratio of Net Investment Income/(Loss) to Average Net Assets include foreign withholding tax reclaims received in November 2021 and March 2022. The impact of the foreign withholding tax reclaims received, net of the related professional fees, to Net investment income/(loss) per share and Ratio of Net Investment Income/(Loss) to Average Net Assets is $0.01 and 0.06%, respectively. (3) Net investment income/(loss) per share and Ratio of Net Investment Income/(Loss) to Average Net Assets include foreign withholding tax reclaims received in September 2021. The impact of the foreign withholding tax reclaims received, net of the related professional fees, to Net investment income/(loss) per share and Ratio of Net Investment Income/(Loss) to Average Net Assets is $0.15 and 0.52%, respectively. (4) Total return without the effect of affiliated payments would have been (3.36)%. (5) Ratio of Gross Expenses includes additional professional fees related to foreign withholding tax reclaims received in November 2021 and March 2022. The impact of the additional professional fees to Ratio of Gross Expenses is 0.03%. (6) Ratio of Gross Expenses includes additional professional fees related to foreign withholding tax reclaims received in September 2021. The impact of the additional professional fees to Ratio of Gross Expenses is 0.08%. |
| | |
See Notes to Financial Statements. |
| |
Janus Investment Fund | 23 |
Janus Henderson International Opportunities Fund
Financial Highlights
| | | | | | | | | | | | | | | | | | | | | | |
Class T Shares | | | | | | | | | | | | | | | | | | |
For a share outstanding during the period ended March 31, 2023 (unaudited) and the year ended September 30 | 2023 | | | 2022 | | | 2021 | | | 2020 | | | 2019 | | | 2018 | |
| Net Asset Value, Beginning of Period | | $16.76 | | | $28.87 | | | $24.69 | | | $24.00 | | | $29.02 | | | $29.50 | |
| Income/(Loss) from Investment Operations: | | | | | | | | | | | | | | | | | | |
| | Net investment income/(loss)(1) | | 0.06 | | | 0.22(2) | | | 0.62(3) | | | (0.01) | | | 0.57 | | | 0.30 | |
| | Net realized and unrealized gain/(loss) | | 3.83 | | | (6.98) | | | 3.70 | | | 1.63 | | | (1.95) | | | (0.37) | |
| Total from Investment Operations | | 3.89 | | | (6.76) | | | 4.32 | | | 1.62 | | | (1.38) | | | (0.07) | |
| Less Dividends and Distributions: | | | | | | | | | | | | | | | | | | |
| | Dividends (from net investment income) | | — | | | (1.34) | | | (0.14) | | | (0.24) | | | (0.47) | | | (0.41) | |
| | Distributions (from capital gains) | | (0.86) | | | (4.01) | | | — | | | (0.69) | | | (3.17) | | | — | |
| Total Dividends and Distributions | | (0.86) | | | (5.35) | | | (0.14) | | | (0.93) | | | (3.64) | | | (0.41) | |
| Net Asset Value, End of Period | | $19.79 | | | $16.76 | | | $28.87 | | | $24.69 | | | $24.00 | | | $29.02 | |
| Total Return* | | 23.63% | | | (28.28)% | | | 17.49% | | | 6.73% | | | (2.92)%(4) | | | (0.26)% | |
| Net Assets, End of Period (in thousands) | | $1,035 | | | $1,029 | | | $3,040 | | | $3,758 | | | $32,333 | | | $8,614 | |
| Average Net Assets for the Period (in thousands) | | $1,072 | | | $1,955 | | | $6,040 | | | $14,280 | | | $37,969 | | | $9,802 | |
| Ratios to Average Net Assets**: | | | | | | | | | | | | | | | | | | |
| | Ratio of Gross Expenses | | 1.64% | | | 1.52%(5) | | | 1.40%(6) | | | 1.31% | | | 1.48% | | | 1.19% | |
| | Ratio of Net Expenses (After Waivers and Expense Offsets) | | 1.07% | | | 1.11% | | | 1.10% | | | 1.16% | | | 1.33% | | | 1.17% | |
| | Ratio of Net Investment Income/(Loss) | | 0.67% | | | 0.95%(2) | | | 2.14%(3) | | | (0.03)% | | | 2.38% | | | 1.01% | |
| Portfolio Turnover Rate | | 25% | | | 88% | | | 63% | | | 57% | | | 45% | | | 56% | |
| | | | | | | | | | | | | | | | | | | | | | |
| |
* Total return includes adjustments in accordance with generally accepted accounting principles required at the year or period end and are not annualized for periods of less than one full year. ** Annualized for periods of less than one full year. (1) Per share amounts are calculated based on average shares outstanding during the year or period. (2) Net investment income/(loss) per share and Ratio of Net Investment Income/(Loss) to Average Net Assets include foreign withholding tax reclaims received in November 2021 and March 2022. The impact of the foreign withholding tax reclaims received, net of the related professional fees, to Net investment income/(loss) per share and Ratio of Net Investment Income/(Loss) to Average Net Assets is $0.01 and 0.06%, respectively. (3) Net investment income/(loss) per share and Ratio of Net Investment Income/(Loss) to Average Net Assets include foreign withholding tax reclaims received in September 2021. The impact of the foreign withholding tax reclaims received, net of the related professional fees, to Net investment income/(loss) per share and Ratio of Net Investment Income/(Loss) to Average Net Assets is $0.15 and 0.52%, respectively. (4) Total return without the effect of affiliated payments would have been (2.96)%. (5) Ratio of Gross Expenses includes additional professional fees related to foreign withholding tax reclaims received in November 2021 and March 2022. The impact of the additional professional fees to Ratio of Gross Expenses is 0.03%. (6) Ratio of Gross Expenses includes additional professional fees related to foreign withholding tax reclaims received in September 2021. The impact of the additional professional fees to Ratio of Gross Expenses is 0.08%. |
| | |
See Notes to Financial Statements. |
| |
24 | MARCH 31, 2023 |
Janus Henderson International Opportunities Fund
Notes to Financial Statements (unaudited)
1. Organization and Significant Accounting Policies
Janus Henderson International Opportunities Fund (the “Fund”) is a series of Janus Investment Fund (the “Trust”), which is organized as a Massachusetts business trust and is registered under the Investment Company Act of 1940, as amended (the “1940 Act”), as an open-end management investment company, and therefore has applied the specialized accounting and reporting guidance in Financial Accounting Standards Board (“FASB”) Accounting Standards Codification (“ASC”) Topic 946. The Trust offers 40 funds, each of which offers multiple share classes, with differing investment objectives and policies. The Fund seeks long-term capital appreciation primarily through investment in equities of non-U.S. companies. The Fund is classified as diversified, as defined in the 1940 Act. Janus Henderson Investors US LLC is the investment adviser (the “Adviser”) to the Fund.
The Fund offers multiple classes of shares in order to meet the needs of various types of investors. Each class represents an interest in the same portfolio of investments. Certain financial intermediaries may not offer all classes of shares.
Shareholders, including individuals, accounts, as well as the Fund’s portfolio manager(s) and/or investment personnel, may from time to time own (beneficially or of record) a significant percentage of the Fund’s Shares and can be considered to “control” the Fund when that ownership exceeds 25% of the Fund’s assets (and which may differ from control as determined in accordance with United States of America generally accepted accounting principles ("US GAAP")).
Class A Shares are offered through financial intermediary platforms including, but not limited to, traditional brokerage platforms, mutual fund wrap fee programs, bank trust platforms, and retirement platforms.
Class C Shares are offered through financial intermediary platforms including, but not limited to, traditional brokerage platforms, mutual fund wrap fee programs, and bank trust platforms.
Class C Shares are closed to investments by new employer-sponsored retirement plans and existing employer-sponsored retirement plans are no longer able to make additional purchases or exchanges into Class C Shares.
The Fund currently implements an automatic conversion feature pursuant to which Class C Shares that have been held for eight years are automatically converted to Class A Shares without the imposition of any sales charge, fee or other charge. The conversion will generally occur no later than ten business days in the month following the month of the eighth anniversary of the date of purchase. Class C Shares purchased through the reinvestment of dividends and other distributions on Class C Shares will convert to Class A Shares at the same time as the original Class C Shares with respect to which they were purchased. For Class C Shares held in omnibus accounts on intermediary platforms, the Fund relies on these intermediaries to implement this conversion feature. Your financial intermediary may have separate policies and procedures as to when and how Class C Shares may be converted to Class A Shares.
Effective July 6, 2020, Class D Shares are available to new investors, subject to any closed fund policies for a Fund, as applicable. Previously, Class D Shares were only available to investors who already had a direct account with the Janus Henderson funds; immediate family members or members of the same household of an eligible individual investor; and existing beneficial owners of sole proprietorships or partnerships that hold accounts directly with the Janus Henderson funds.
Class I Shares are available through certain financial intermediary platforms including, but not limited to, mutual fund wrap fee programs, managed account programs, asset allocation programs, bank trust platforms, as well as certain retirement platforms. Class I Shares are also available to certain direct institutional investors including, but not limited to, corporations, certain retirement plans, public plans, and foundations/endowments, who established Class I Share accounts before August 4, 2017.
Class N Shares are generally available only to financial intermediaries purchasing on behalf of: 1) certain adviser-assisted, employer-sponsored retirement plans, including 401(k) plans, 457 plans, 403(b) plans, Taft-Hartley multi-employer plans, profit-sharing and money purchase pension plans, defined benefit plans and certain welfare benefit plans, such as health savings accounts, and nonqualified deferred compensation plans; and 2) retail investors purchasing in qualified or nonqualified accounts, whose accounts are held through an omnibus account at their financial intermediary, and where the financial intermediary requires no payment or reimbursement from the Fund, the Adviser, or its affiliates. Class N Shares are also available to Janus Henderson proprietary products and to certain direct institutional investors approved by Janus Henderson Distributors US LLC (the “Distributor”) including, but not limited to,
Janus Henderson International Opportunities Fund
Notes to Financial Statements (unaudited)
corporations, certain retirement plans, public plans, and foundations and endowments, subject to minimum investment requirements.
Class R Shares are offered through financial intermediary platforms including, but not limited to, retirement platforms.
Class S Shares are offered through financial intermediary platforms including, but not limited to, retirement platforms and asset allocation, mutual fund wrap, or other discretionary or nondiscretionary fee-based investment advisory programs. In addition, Class S Shares may be available through certain financial intermediaries who have an agreement with the Adviser or its affiliates to offer Class S Shares on their supermarket platforms.
Class T Shares are available through certain financial intermediary platforms including, but not limited to, mutual fund wrap fee programs, managed account programs, asset allocation programs, bank trust platforms, as well as certain retirement platforms. In addition, Class T Shares may be available through certain financial intermediaries who have an agreement with the Adviser or its affiliates to offer Class T Shares on their supermarket platforms.
The following accounting policies have been followed by the Fund and are in conformity with US GAAP.
Investment Valuation
Fund holdings are valued in accordance with policies and procedures established by the Adviser pursuant to Rule 2a-5 under the 1940 Act and approved by and subject to the oversight of the Trustees (the “Valuation Procedures”). Equity securities traded on a domestic securities exchange are generally valued at readily available market quotations, which are (i) the official close prices or (ii) last sale prices on the primary market or exchange in which the securities trade. If such price is lacking for the trading period immediately preceding the time of determination, such securities are generally valued at their current bid price. Equity securities that are traded on a foreign exchange are generally valued at the closing prices on such markets. In the event that there is no current trading volume on a particular security in such foreign exchange, the bid price from the primary exchange is generally used to value the security. Foreign securities and currencies are converted to U.S. dollars using the current spot USD dollar exchange rate in effect at the close of the New York Stock Exchange (“NYSE”). The Fund will determine the market value of individual securities held by it by using prices provided by one or more approved professional pricing services or, as needed, by obtaining market quotations from independent broker-dealers. Most debt securities are valued in accordance with the evaluated bid price supplied by the Adviser-approved pricing service that is intended to reflect market value. The evaluated bid price supplied by the pricing service is an evaluation that may consider factors such as security prices, yields, maturities and ratings. Certain short-term securities maturing within 60 days or less may be evaluated and valued on an amortized cost basis provided that the amortized cost determined approximates market value. Securities for which market quotations or evaluated prices are not readily available or deemed unreliable are valued at fair value determined in good faith by the Adviser pursuant to the Valuation Procedures. Circumstances in which fair valuation may be utilized include, but are not limited to: (i) a significant event that may affect the securities of a single issuer, such as a merger, bankruptcy, or significant issuer-specific development; (ii) an event that may affect an entire market, such as a natural disaster or significant governmental action; (iii) a nonsignificant event such as a market closing early or not opening, or a security trading halt; and (iv) pricing of a nonvalued security and a restricted or nonpublic security. Special valuation considerations may apply with respect to “odd-lot” fixed-income transactions which, due to their small size, may receive evaluated prices by pricing services which reflect a large block trade and not what actually could be obtained for the odd-lot position. The valuation policies provide for the use of systematic fair valuation models provided by independent pricing services to value foreign equity securities in order to adjust for stale pricing, which may occur between the close of certain foreign exchanges and the close of the NYSE. The value of the securities of other mutual funds held by a Fund, if any, will be calculated using the NAV of such mutual funds.
Valuation Inputs Summary
FASB ASC 820, Fair Value Measurements and Disclosures (“ASC 820”), defines fair value, establishes a framework for measuring fair value, and expands disclosure requirements regarding fair value measurements. This standard emphasizes that fair value is a market-based measurement that should be determined based on the assumptions that market participants would use in pricing an asset or liability and establishes a hierarchy that prioritizes inputs to valuation techniques used to measure fair value. These inputs are summarized into three broad levels:
Level 1 – Unadjusted quoted prices in active markets the Fund has the ability to access for identical assets or liabilities.
Janus Henderson International Opportunities Fund
Notes to Financial Statements (unaudited)
Level 2 – Observable inputs other than unadjusted quoted prices included in Level 1 that are observable for the asset or liability either directly or indirectly. These inputs may include quoted prices for the identical instrument on an inactive market, prices for similar instruments, interest rates, prepayment speeds, credit risk, yield curves, default rates and similar data.
Assets or liabilities categorized as Level 2 in the hierarchy generally include: debt securities fair valued in accordance with the evaluated bid or ask prices supplied by a pricing service; securities traded on OTC markets and listed securities for which no sales are reported that are fair valued at the latest bid price (or yield equivalent thereof) obtained from one or more dealers transacting in a market for such securities or by a pricing service approved by the Fund’s Trustees; certain short-term debt securities with maturities of 60 days or less that are fair valued at amortized cost; and equity securities of foreign issuers whose fair value is determined by using systematic fair valuation models provided by independent third parties in order to adjust for stale pricing which may occur between the close of certain foreign exchanges and the close of the NYSE. Other securities that may be categorized as Level 2 in the hierarchy include, but are not limited to, preferred stocks, bank loans, swaps, investments in unregistered investment companies, options, and forward contracts.
Level 3 – Unobservable inputs for the asset or liability to the extent that relevant observable inputs are not available, representing the Fund’s own assumptions about the assumptions that a market participant would use in valuing the asset or liability, and that would be based on the best information available.
There have been no significant changes in valuation techniques used in valuing any such positions held by the Fund since the beginning of the fiscal period.
The inputs or methodology used for fair valuing securities are not necessarily an indication of the risk associated with investing in those securities. The summary of inputs used as of March 31, 2023 to fair value the Fund’s investments in securities and other financial instruments is included in the “Valuation Inputs Summary” in the Notes to Schedule of Investments and Other Information.
Investment Transactions and Investment Income
Investment transactions are accounted for as of the date purchased or sold (trade date). Dividend income is recorded on the ex-dividend date. Certain dividends from foreign securities will be recorded as soon as the Fund is informed of the dividend, if such information is obtained subsequent to the ex-dividend date. Dividends from foreign securities may be subject to withholding taxes in foreign jurisdictions. Non-cash dividends, if any, are recorded on the ex-dividend date at fair value. Interest income is recorded daily on an accrual basis and includes amortization of premiums and accretion of discounts. The Fund classifies gains and losses on prepayments received as an adjustment to interest income. Debt securities may be placed in non-accrual status and related interest income may be reduced by stopping current accruals and writing off interest receivables when collection of all or a portion of interest has become doubtful. Gains and losses are determined on the identified cost basis, which is the same basis used for federal income tax purposes. Income, as well as gains and losses, both realized and unrealized, are allocated daily to each class of shares based upon the ratio of net assets represented by each class as a percentage of total net assets.
Expenses
The Fund bears expenses incurred specifically on its behalf. Each class of shares bears a portion of general expenses, which are allocated daily to each class of shares based upon the ratio of net assets represented by each class as a percentage of total net assets. Expenses directly attributable to a specific class of shares are charged against the operations of such class.
Estimates
The preparation of financial statements in conformity with US GAAP requires management to make estimates and assumptions that affect the reported amount of assets and liabilities and disclosure of contingent assets and liabilities at the date of the financial statements, and the reported amounts of income and expenses during the reporting period. Actual results could differ from those estimates.
Indemnifications
In the normal course of business, the Fund may enter into contracts that contain provisions for indemnification of other parties against certain potential liabilities. The Fund’s maximum exposure under these arrangements is unknown, and would involve future claims that may be made against the Fund that have not yet occurred. Currently, the risk of material loss from such claims is considered remote.
Janus Henderson International Opportunities Fund
Notes to Financial Statements (unaudited)
Foreign Currency Translations
The Fund does not isolate that portion of the results of operations resulting from the effect of changes in foreign exchange rates on investments from the fluctuations arising from changes in market prices of securities held at the date of the financial statements. Net unrealized appreciation or depreciation of investments and foreign currency translations arise from changes in the value of assets and liabilities, including investments in securities held at the date of the financial statements, resulting from changes in the exchange rates and changes in market prices of securities held.
Currency gains and losses are also calculated on payables and receivables that are denominated in foreign currencies. The payables and receivables are generally related to foreign security transactions and income translations.
Foreign currency-denominated assets and forward currency contracts may involve more risks than domestic transactions, including currency risk, counterparty risk, political and economic risk, regulatory risk and equity risk. Risks may arise from unanticipated movements in the value of foreign currencies relative to the U.S. dollar.
Dividends and Distributions
The Fund generally declares and distributes dividends of net investment income and realized capital gains (if any) annually. The Fund may treat a portion of the amount paid to redeem shares as a distribution of investment company taxable income and realized capital gains that are reflected in the net asset value. This practice, commonly referred to as “equalization,” has no effect on the redeeming shareholder or a Fund’s total return, but may reduce the amounts that would otherwise be required to be paid as taxable dividends to the remaining shareholders. It is possible that the Internal Revenue Service (IRS) could challenge the Fund's equalization methodology or calculations, and any such challenge could result in additional tax, interest, or penalties to be paid by the Fund.
The Fund may make certain investments in real estate investment trusts (“REITs”) which pay dividends to their shareholders based upon funds available from operations. It is quite common for these dividends to exceed the REITs’ taxable earnings and profits, resulting in the excess portion of such dividends being designated as a return of capital. If the Fund distributes such amounts, such distributions could constitute a return of capital to shareholders for federal income tax purposes.
Federal Income Taxes
The Fund intends to continue to qualify as a regulated investment company and distribute all of its taxable income in accordance with the requirements of Subchapter M of the Internal Revenue Code. Management has analyzed the Fund’s tax positions taken for all open federal income tax years, generally a three-year period, and has concluded that no provision for federal income tax is required in the Fund’s financial statements. The Fund is not aware of any tax positions for which it is reasonably possible that the total amounts of unrecognized tax benefits will significantly change in the next twelve months.
2. Other Investments and Strategies
Additional Investment Risk
The U.S. government and the Federal Reserve, as well as certain foreign governments and central banks, have taken extraordinary actions to support local and global economies and the financial markets in response to the COVID-19 pandemic. This and other government intervention into the economy and financial markets to address the COVID-19 pandemic may not work as intended, particularly if the efforts are perceived by investors as being unlikely to achieve the desired results. Government actions to mitigate the economic impact of the pandemic have resulted in a large expansion of government deficits and debt, the long term consequences of which are not known. The COVID-19 pandemic could adversely affect the value and liquidity of a Fund’s investments, impair a Fund’s ability to satisfy redemption requests, and negatively impact a Fund’s performance. In addition, the outbreak of COVID-19, and measures taken to mitigate its effects, could result in disruptions to the services provided to a Fund by its service providers.
Widespread disease, including pandemics and epidemics, and natural or environmental disasters, including those which may be attributable to global climate change, such as earthquakes, fires, floods, hurricanes, tsunamis and weather-related phenomena generally, have been and can be highly disruptive to economies and markets, adversely impacting individual companies, sectors, industries, markets, currencies, interest and inflation rates, credit ratings, investor sentiment, and other factors affecting the value of a Fund’s investments. Economies and financial markets throughout the world have become increasingly interconnected, which increases the likelihood that events or conditions in one
Janus Henderson International Opportunities Fund
Notes to Financial Statements (unaudited)
region or country will adversely affect markets or issuers in other regions or countries, including the United States. These disruptions could prevent a Fund from executing advantageous investment decisions in a timely manner and negatively impact a Fund’s ability to achieve its investment objective(s). Any such event(s) could have a significant adverse impact on the value of a Fund. In addition, these disruptions could also impair the information technology and other operational systems upon which the Fund’s service providers, including the Adviser or the subadviser (as applicable), rely, and could otherwise disrupt the ability of employees of the Fund’s service providers to perform essential tasks on behalf of the Fund. Adverse weather conditions may also have a particularly significant negative effect on issuers in the agricultural sector and on insurance and reinsurance companies that insure or reinsure against the impact of natural disasters.
A number of countries in the European Union (the “EU”) have experienced, and may continue to experience, severe economic and financial difficulties. In particular, many EU nations are susceptible to economic risks associated with high levels of debt. Many non-governmental issuers, and even certain governments, have defaulted on, or been forced to restructure, their debts. Many other issuers have faced difficulties obtaining credit or refinancing existing obligations. Financial institutions have in many cases required government or central bank support, have needed to raise capital, and/or have been impaired in their ability to extend credit. As a result, financial markets in the EU have experienced extreme volatility and declines in asset values and liquidity. These difficulties may continue, worsen, or spread further within the EU. Responses to these financial problems by European governments, central banks, and others, including austerity measures and reforms, may not work, may result in social unrest, and may limit future growth and economic recovery or have other unintended consequences. Among other things, these developments have adversely affected the value and exchange rate of the euro and pound sterling, and may continue to significantly affect the economies of all EU countries, which in turn may have a material adverse effect on the Fund’s investments in such countries, other countries that depend on EU countries for significant amounts of trade or investment, or issuers with exposure to debt issued by certain EU countries.
Emerging Market Investing
Within the parameters of its specific investment policies, the Fund may invest in securities of issuers or companies from or with exposure to one or more “developing countries” or “emerging market countries.” Such countries include but are not limited to countries included in the MSCI Emerging Markets IndexSM. Emerging market countries in which the Fund may invest include frontier market countries, the economies of which are less developed than other emerging market countries. To the extent that the Fund invests a significant amount of its assets in one or more of these countries, its returns and net asset value may be affected to a large degree by events and economic conditions in such countries. The risks of foreign investing are heightened when investing in emerging markets, which may result in the price of investments in emerging markets experiencing sudden and sharp price swings. In many developing markets, there is less government supervision and regulation of stock exchanges, brokers, and listed companies, making these investments potentially more volatile in price and less liquid than investments in developed securities markets, resulting in greater risk to investors. Similarly, issuers in such markets may not be subject to regulatory, accounting, auditing, and financial reporting and recordkeeping standards comparable to those to which U.S. companies are subject. There is a risk in developing countries that a current or future economic or political crisis could lead to price controls, forced mergers of companies, expropriation or confiscatory taxation, imposition or enforcement of foreign ownership limits, seizure, nationalization, sanctions or imposition of restrictions by various governmental entities on investment and trading, or creation of government monopolies, any of which may have a detrimental effect on the Fund’s investments. In addition, the Fund’s investments may be denominated in foreign currencies and therefore, changes in the value of a country’s currency compared to the U.S. dollar may affect the value of the Fund’s investments. To the extent that the Fund invests a significant portion of its assets in the securities of issuers in or companies of a single country or region, it is more likely to be impacted by events or conditions affecting that country or region, which could have a negative impact on the Fund’s performance. Developing countries may also experience a higher level of exposure and vulnerability to the adverse effects of climate change. This can be attributed to both the geographic location of emerging market countries and/or a country’s lack of access to technology or resources to adjust and adapt to its effects. An increased occurrence and severity of natural disasters and extreme weather events such as droughts and decreased crop yields, heat waves, flooding and rising sea levels, and increased spread of disease, could cause harmful effects to the performance of affected economies. Additionally, foreign and emerging market risks, including, but not limited to, price controls, expropriation or confiscatory taxation, imposition or enforcement of foreign ownership limits, nationalization, and restrictions on repatriation of assets may be heightened to the extent the Fund invests in Chinese local market securities.
Janus Henderson International Opportunities Fund
Notes to Financial Statements (unaudited)
3. Investment Advisory Agreements and Other Transactions with Affiliates
The Fund pays the Adviser an investment advisory fee which is calculated daily and paid monthly. The following table reflects the Fund’s contractual investment advisory fee rate (expressed as an annual rate).
| | |
Average Daily Net Assets of the Fund | Contractual Investment Advisory Fee (%) |
First $2 Billion | 1.00 |
Next $1 Billion | 0.90 |
Next $1 Billion | 0.80 |
Next $1 Billion | 0.70 |
Next $5 Billion | 0.60 |
Over $10 Billion | 0.50 |
The Fund’s actual investment advisory fee rate for the reporting period was 1.00% of average annual net assets before any applicable waivers.
The Adviser has entered into a personnel-sharing arrangement with its foreign (non-U.S.) affiliates, Henderson Global Investors Limited, Henderson Global Investors (Japan) Ltd., and Henderson Global Investors (Singapore) Ltd. (collectively, “HGIL”), pursuant to which HGIL and certain employees of HGIL serve as “associated persons” of the Adviser. In this capacity, such employees of HGIL are subject to the oversight and supervision of the Adviser and may provide portfolio management, research, and related services to the Fund on behalf of the Adviser.
The Adviser has contractually agreed to waive the investment advisory fee payable by the Fund or reimburse expenses in an amount equal to the amount, if any, that the Fund’s total annual fund operating expenses, including the investment advisory fee, but excluding the fees payable pursuant to a Rule 12b-1 plan, shareholder servicing fees, such as transfer agency fees (including out-of-pocket costs), administrative services fees and any networking/omnibus payable by any share class, brokerage commissions, interest, dividends, taxes, acquired fund fees and expenses, and extraordinary expenses, exceed the annual rate of 0.83% of the Fund’s average daily net assets. The Adviser has agreed to continue the waivers for at least a one-year period commencing on January 27, 2023. If applicable, amounts waived and/or reimbursed to the Fund by the Adviser are disclosed as “Excess Expense Reimbursement and Waivers” on the Statement of Operations.
The Adviser serves as administrator to the Fund pursuant to an administration agreement between the Adviser and the Trust. Under the administration agreement, the Adviser is authorized to perform, or cause others to perform certain administration, compliance, and accounting services to the Fund, including providing office space for the Fund, and is reimbursed by the Fund for certain of its costs in providing these services (to the extent the Adviser seeks reimbursement and such costs are not otherwise waived). In addition, employees of the Adviser and/or its affiliates may serve as officers of the Trust. The Fund pays for some or all of the salaries, fees, and expenses of the Adviser employees and Fund officers, with respect to certain specified administration functions they perform on behalf of the Fund. The Fund pays these costs based on out-of-pocket expenses incurred by the Adviser, and these costs are separate and apart from advisory fees and other expenses paid in connection with the investment advisory services the Adviser (or any subadvisor, as applicable) provides to the Fund. These amounts are disclosed as “Affiliated fund administration fees” on the Statement of Operations. In addition, some expenses related to compensation payable to the Fund’s Chief Compliance Officer and certain compliance staff, all of whom are employees of the Adviser and/or its affiliates, are shared with the Fund. Total compensation of $114,430 was paid to the Chief Compliance Officer and certain compliance staff by the Trust during the period ended March 31, 2023. The Fund's portion is reported as part of “Other expenses” on the Statement of Operations.
Janus Henderson Services US LLC (the “Transfer Agent”), a wholly-owned subsidiary of the Adviser, is the Fund’s transfer agent. The Transfer Agent provides or arranges for the provision of shareholder services including, but not limited to, recordkeeping, subaccounting, answering inquiries regarding accounts, order processing, transaction confirmations, the mailing of prospectuses and shareholder reports, and other shareholder services provided to or on behalf of shareholders. These amounts are disclosed as “Transfer agent administrative fees and expenses” on the Statement of Operations.
Class D Shares of the Fund pay the Transfer Agent an annual administrative services fee based on the average daily net assets of Class D Shares as detailed below.
Janus Henderson International Opportunities Fund
Notes to Financial Statements (unaudited)
| | |
Average Daily Net Assets of Class D Shares of the Janus Henderson funds | Administrative Services Fee |
Under $40 billion | 0.12% |
$40 billion – $49.9 billion | 0.10% |
Over $49.9 billion | 0.08% |
During the reporting period, the administrative services fee rate was 0.12%.
The Transfer Agent receives an administrative services fee at an annual rate of up to 0.25% of the average daily net assets of the Fund’s Class R Shares, Class S Shares, and Class T Shares for providing or procuring administrative services to investors in Class R Shares, Class S Shares, and Class T Shares of the Fund. The Transfer Agent expects to use all or a significant portion of this fee to compensate retirement plan service providers, broker-dealers, bank trust departments, financial advisors, and other financial intermediaries for providing these services. The Transfer Agent may keep certain amounts retained for reimbursement of out-of-pocket costs incurred for servicing clients of Class R Shares, Class S Shares, and Class T Shares. For Class R Shares of the Fund, for at least a one-year period commencing on January 27, 2023, the Adviser has agreed to reduce the administrative service fee payable by the Fund’s Class R shares pursuant to the Fund’s Transfer Agency Agreement so that such fees do not exceed 0.21% of Class R Shares’ average daily net assets.
Shareholder Services provided by these financial intermediaries may include, but are not limited to, recordkeeping, subaccounting, order processing, providing order confirmations, periodic statements, forwarding prospectuses, shareholder reports, and other materials to existing customers, answering inquiries regarding accounts, and other administrative services. Order processing includes the submission of transactions through the National Securities Clearing Corporation (“NSCC”) or similar systems, or those processed on a manual basis with the Adviser. For all share classes, the Transfer Agent also seeks reimbursement for costs it incurs as transfer agent and for providing servicing.
Certain, but not all, intermediaries may charge administrative fees to investors in Class A Shares, Class C Shares, and Class I Shares for administrative services provided on behalf of such investors. These administrative fees are paid by the Class A Shares, Class C Shares, and Class I Shares of the Fund to the Transfer Agent, which uses such fees to reimburse intermediaries. Consistent with the Transfer Agency Agreement between the Transfer Agent and the Fund, the Transfer Agent may negotiate the level, structure, and/or terms of the administrative fees with intermediaries requiring such fees on behalf of the Fund. The Adviser and its affiliates benefit from an increase in assets that may result from such relationships. The Adviser has agreed to limit these fees up to 0.20% for Class A Shares and Class C Shares, and up to 0.15% for Class I Shares on an annual basis based on the daily net assets of each share class. Such limits are subject to change by the Trustees in the future. These amounts are disclosed as “Transfer agent networking and omnibus fees” on the Statement of Operations.
The Transfer Agent is not compensated for its services related to the shares, except for out-of-pocket costs, although the Transfer Agent is compensated for its services related to Fund’s Class D Shares. These amounts are disclosed as “Other transfer agent fees and expenses” on the Statement of Operations.
Under distribution and shareholder servicing plans (the “Plans”) adopted in accordance with Rule 12b-1 under the 1940 Act, the Fund pays the Trust’s distributor, the Distributor, a wholly-owned subsidiary of the Adviser, a fee for the sale and distribution and/or shareholder servicing of the Shares at an annual rate of up to 0.25% of the Class A Shares’ average daily net assets, of up to 1.00% of the Class C Shares’ average daily net assets, of up to 0.50% of the Class R Shares’ average daily net assets and of up to 0.25% of the Class S Shares’ average daily net assets. Under the terms of the Plans, the Trust is authorized to make payments to the Distributor for remittance to retirement plan service providers, broker-dealers, bank trust departments, financial advisors, and other financial intermediaries, as compensation for distribution and/or shareholder services performed by such entities for their customers who are investors in the Fund. These amounts are disclosed as “12b-1 Distribution and shareholder servicing fees” on the Statement of Operations.
Class A Shares include a 5.75% upfront sales charge of the offering price of the Fund. The sales charge is allocated between the Distributor and financial intermediaries. During the period ended March 31, 2023, the Distributor retained upfront sales charges of $533.
Janus Henderson International Opportunities Fund
Notes to Financial Statements (unaudited)
A contingent deferred sales charge (“CDSC”) of 1.00% will be deducted with respect to Class A Shares purchased without a sales load and redeemed within 12 months of purchase, unless waived. Any applicable CDSC will be 1.00% of the lesser of the original purchase price or the value of the redemption of the Class A Shares redeemed. There were no CDSCs paid by redeeming shareholders of Class A Shares to the Distributor during the period ended March 31, 2023.
A CDSC of 1.00% will be deducted with respect to Class C Shares redeemed within 12 months of purchase, unless waived. Any applicable CDSC will be 1.00% of the lesser of the original purchase price or the value of the redemption of the Class C Shares redeemed. During the period ended March 31, 2023, redeeming shareholders of Class C Shares paid CDSCs of $282.
The Board of Trustees has adopted a deferred compensation plan (the “Deferred Plan”) for independent Trustees to elect to defer receipt of all or a portion of the annual compensation they are entitled to receive from the Fund. All deferred fees are credited to an account established in the name of the Trustees. The amounts credited to the account then increase or decrease, as the case may be, in accordance with the performance of one or more of the Janus Henderson funds that are selected by the Trustees. The account balance continues to fluctuate in accordance with the performance of the selected fund or funds until final payment of all amounts are credited to the account. The fluctuation of the account balance is recorded by the Fund as unrealized appreciation/(depreciation) and is included as of March 31, 2023 on the Statement of Assets and Liabilities in the asset, “Trustees’ deferred compensation,” and liability, “Trustees’ deferred compensation fees.” Additionally, the recorded unrealized appreciation/(depreciation) is included in “Total distributable earnings (loss)” on the Statement of Assets and Liabilities. Deferred compensation expenses for the period ended March 31, 2023 are included in “Trustees’ fees and expenses” on the Statement of Operations. Trustees are allowed to change their designation of mutual funds from time to time. Amounts will be deferred until distributed in accordance with the Deferred Plan. Deferred fees of $205,688 were paid by the Trust to the Trustees under the Deferred Plan during the period ended March 31, 2023.
Pursuant to the provisions of the 1940 Act and related rules, the Fund may participate in an affiliated or non-affiliated cash sweep program. In the cash sweep program, uninvested cash balances of the Fund may be used to purchase shares of affiliated or non-affiliated money market funds or cash management pooled investment vehicles that operate as money market funds. The Fund is eligible to participate in the cash sweep program (the “Investing Funds”). The Adviser has an inherent conflict of interest because of its fiduciary duties to the affiliated money market funds or cash management pooled investment vehicles and the Investing Funds. Janus Henderson Cash Liquidity Fund LLC (the “Sweep Vehicle”) is an affiliated unregistered cash management pooled investment vehicle that invests primarily in highly-rated short-term fixed-income securities. The Sweep Vehicle operates pursuant to the provisions of the 1940 Act that govern the operation of money market funds and prices its shares at NAV reflecting market-based values of its portfolio securities (i.e., a “floating” NAV) rounded to the fourth decimal place (e.g., $1.0000). The Sweep Vehicle is permitted to impose a liquidity fee (of up to 2%) on redemptions from the Sweep Vehicle or a redemption gate that temporarily suspends redemptions from the Sweep Vehicle for up to 10 business days during a 90 day period. There are no restrictions on the Fund's ability to withdraw investments from the Sweep Vehicle at will, and there are no unfunded capital commitments due from the Fund to the Sweep Vehicle. The Sweep Vehicle does not charge any management fee, sales charge or service fee.
Any purchases and sales, realized gains/losses and recorded dividends from affiliated investments during the period ended March 31, 2023 can be found in the “Schedules of Affiliated Investments” located in the Schedule of Investments.
Janus Henderson International Opportunities Fund
Notes to Financial Statements (unaudited)
As of March 31, 2023, shares of the Fund were owned by affiliates of the Adviser, and/or other funds advised by the Adviser, as indicated in the table below:
| | | | | | | |
Class | % of Class Owned | | % of Fund Owned | | |
Class A Shares | - | % | - | % | |
Class C Shares | - | | - | | |
Class D Shares | - | | - | | |
Class I Shares | - | | - | | |
Class N Shares | - | | - | | |
Class R Shares | - | | - | | |
Class S Shares | 84 | | -* | | |
Class T Shares | - | | - | | |
| | | | | | |
* | Less than 0.50% | | | | | |
4. Federal Income Tax
Income and capital gains distributions are determined in accordance with income tax regulations that may differ from US GAAP. These differences are due to differing treatments for items such as net short-term gains, deferral of wash sale losses, foreign currency transactions, net investment losses, and capital loss carryovers.
The Fund has elected to treat gains and losses on forward foreign currency contracts as capital gains and losses, if applicable. Other foreign currency gains and losses on debt instruments are treated as ordinary income for federal income tax purposes pursuant to Section 988 of the Internal Revenue Code.
The aggregate cost of investments and the composition of unrealized appreciation and depreciation of investment securities for federal income tax purposes as of March 31, 2023 are noted below. The primary differences between book and tax appreciation or depreciation of investments are wash sale loss deferrals, investments in partnerships, and investments in passive foreign investment companies.
| | | | |
Federal Tax Cost | Unrealized
Appreciation | Unrealized
(Depreciation) | Net Tax Appreciation/
(Depreciation) |
$614,641,689 | $79,859,454 | $ (52,533,802) | $ 27,325,652 |
Janus Henderson International Opportunities Fund
Notes to Financial Statements (unaudited)
5. Capital Share Transactions
| | | | | | | |
| | | | | | |
| | Period ended March 31, 2023 | | Year ended September 30, 2022 |
| | Shares | Amount | | Shares | Amount |
| | | | | | | |
Class A Shares: | | | | | |
Shares sold | 457,525 | $ 8,563,159 | | 1,398,369 | $ 32,971,313 |
Reinvested dividends and distributions | 431,303 | 7,862,659 | | 2,277,920 | 51,777,126 |
Shares repurchased | (2,075,434) | (38,881,835) | | (3,496,152) | (75,777,231) |
Net Increase/(Decrease) | (1,186,606) | $(22,456,017) | | 180,137 | $ 8,971,208 |
Class C Shares: | | | | | |
Shares sold | 46,622 | $ 796,230 | | 63,225 | $ 1,345,788 |
Reinvested dividends and distributions | 50,713 | 849,956 | | 336,931 | 7,112,622 |
Shares repurchased | (328,426) | (5,664,307) | | (845,139) | (17,708,527) |
Net Increase/(Decrease) | (231,091) | $ (4,018,121) | | (444,983) | $ (9,250,117) |
Class D Shares: | | | | | |
Shares sold | 41,055 | $ 797,113 | | 39,793 | $ 893,672 |
Reinvested dividends and distributions | 6,671 | 120,952 | | 28,284 | 638,077 |
Shares repurchased | (31,744) | (605,648) | | (45,009) | (1,001,076) |
Net Increase/(Decrease) | 15,982 | $ 312,417 | | 23,068 | $ 530,673 |
Class I Shares: | | | | | |
Shares sold | 1,944,480 | $ 36,145,788 | | 4,533,828 | $101,375,429 |
Reinvested dividends and distributions | 833,336 | 15,116,708 | | 5,203,944 | 117,400,967 |
Shares repurchased | (7,446,832) | (138,350,394) | | (11,929,039) | (261,255,642) |
Net Increase/(Decrease) | (4,669,016) | $(87,087,898) | | (2,191,267) | $ (42,479,246) |
Class N Shares: | | | | | |
Shares sold | 323,279 | $ 5,846,493 | | 1,264,325 | $ 28,401,439 |
Reinvested dividends and distributions | 102,759 | 1,859,938 | | 1,099,629 | 24,741,657 |
Shares repurchased | (748,564) | (13,698,015) | | (5,784,157) | (130,733,159) |
Net Increase/(Decrease) | (322,526) | $ (5,991,584) | | (3,420,203) | $ (77,590,063) |
Class R Shares: | | | | | |
Shares sold | 7,645 | $ 139,532 | | 24,171 | $ 543,711 |
Reinvested dividends and distributions | 3,234 | 57,654 | | 15,868 | 353,708 |
Shares repurchased | (16,131) | (278,033) | | (41,972) | (950,639) |
Net Increase/(Decrease) | (5,252) | $ (80,847) | | (1,933) | $ (53,220) |
Class S Shares: | | | | | |
Shares sold | 215 | $ 4,077 | | 248 | $ 5,085 |
Reinvested dividends and distributions | 142 | 2,588 | | 580 | 13,129 |
Shares repurchased | (284) | (5,377) | | (1) | (12) |
Net Increase/(Decrease) | 73 | $ 1,288 | | 827 | $ 18,202 |
Class T Shares: | | | | | |
Shares sold | 501 | $ 9,193 | | 4,780 | $ 104,701 |
Reinvested dividends and distributions | 2,672 | 48,740 | | 22,516 | 511,333 |
Shares repurchased | (12,264) | (232,403) | | (71,241) | (1,590,349) |
Net Increase/(Decrease) | (9,091) | $ (174,470) | | (43,945) | $ (974,315) |
6. Purchases and Sales of Investment Securities
For the period ended March 31, 2023, the aggregate cost of purchases and proceeds from sales of investment securities (excluding any short-term securities, short-term options contracts, TBAs, and in-kind transactions, as applicable) was as follows:
| | | | |
Purchases of
Securities | Proceeds from Sales
of Securities | Purchases of Long-
Term U.S. Government
Obligations | Proceeds from Sales
of Long-Term U.S.
Government Obligations |
$163,028,629 | $295,913,757 | $ - | $ - |
Janus Henderson International Opportunities Fund
Notes to Financial Statements (unaudited)
7. Fund Merger
At a special meeting of shareholders of the Fund held on May 18, 2023, shareholders approved an Agreement and Plan of Reorganization which provides for the transfer of all or substantially all of the assets of the Fund to Janus Henderson Overseas Fund (the “Acquiring Fund”) in exchange for shares of beneficial interest of the Acquiring Fund and the assumption by the Acquiring Fund of all of the liabilities of the Fund, and subsequently the complete termination of the Fund. Effective on or about June 9, 2023, or as soon as practicable thereafter, the Fund will merge with the Acquiring Fund.
8. Subsequent Event
Management has evaluated whether any events or transactions occurred subsequent to March 31, 2023 and through the date of issuance of the Fund’s financial statements and determined that there were no material events or transactions that would require recognition or disclosure in the Fund’s financial statements.
Janus Henderson International Opportunities Fund
Additional Information (unaudited)
Proxy Voting Policies and Voting Record
A description of the policies and procedures that the Fund uses to determine how to vote proxies relating to its portfolio securities is available without charge: (i) upon request, by calling 1-800-525-1093; (ii) on the Fund’s website at janushenderson.com/proxyvoting; and (iii) on the SEC’s website at http://www.sec.gov. Additionally, information regarding the Fund’s proxy voting record for the most recent twelve-month period ended June 30 is also available, free of charge, through janushenderson.com/proxyvoting and from the SEC’s website at http://www.sec.gov.
Full Holdings
The Fund files its complete portfolio holdings (schedule of investments) with the SEC as an exhibit to Form N-PORT within 60 days of the end of the first and third fiscal quarters, and in the annual report and semiannual report to shareholders. The Fund’s Form N-PORT filings and annual and semiannual reports: (i) are available on the SEC’s website at http://www.sec.gov; and (ii) are available without charge, upon request, by calling a Janus Henderson representative at 1-877-335-2687 (toll free) (or 1-800-525-3713 if you hold Class D Shares). Portfolio holdings consisting of at least the names of the holdings are generally available on a monthly basis with a 30-day lag under Full Holdings for the Fund at janushenderson.com/info (or janushenderson.com/reports if you hold Class D Shares).
APPROVAL OF ADVISORY AGREEMENTS DURING THE PERIOD
The Trustees of Janus Aspen Series, each of whom serves as an “independent” Trustee (the “Trustees”), oversee the management of each portfolio of Janus Aspen Series (each, a “VIT Portfolio,” and collectively, the “VIT Portfolios”), as well as each fund of Janus Investment Fund (each, a “Fund,” and collectively, the “Funds” and together with the VIT Portfolios, the “Janus Henderson Funds,” and each, a “Janus Henderson Fund”). As required by law, the Trustees determine annually whether to continue the investment advisory agreement for each Janus Henderson Fund.
In connection with their most recent consideration of those agreements for each Janus Henderson Fund, the Trustees received and reviewed information provided by Janus Henderson Investors US LLC (the “Adviser”) in response to requests of the Trustees and their independent legal counsel. They also received and reviewed information and analysis provided by, and in response to requests of, their independent fee consultant. Throughout their consideration of the agreements, the Trustees were advised by their independent legal counsel. The Trustees met with management to consider the agreements, and also met separately in executive session with their independent legal counsel and their independent fee consultant.
At meetings held on November 9-10, 2022 and December 13-14, 2022, the Trustees evaluated the information provided by the Adviser and the independent fee consultant, as well as other information provided by the Adviser and the independent fee consultant during the year. Following such evaluation, the Trustees determined that the overall arrangements between each Janus Henderson Fund and the Adviser were fair and reasonable in light of the nature, extent, and quality of the services provided by the Adviser and its affiliates, the fees charged for those services, and other matters that the Trustees considered relevant in the exercise of their business judgment, and unanimously approved the continuation of the investment advisory agreement for each Janus Henderson Fund for the period from February 1, 2023 through February 1, 2024, subject to earlier termination as provided for in each agreement.
In considering the continuation of those agreements, the Trustees reviewed and analyzed various factors that they determined were relevant, including the factors described below, none of which by itself was considered dispositive. However, the material factors and conclusions that formed the basis for the Trustees’ determination to approve the continuation of the agreements are discussed separately below. Also included is a summary of the independent fee consultant’s conclusions and opinions that arose during, and were included as part of, the Trustees’ consideration of the agreements. “Management fees,” as used herein, reflect actual annual advisory fees and, for the purpose of peer comparisons any administration fees (excluding out of pocket costs), net of any waivers, paid by a fund as a percentage of average net assets.
Nature, Extent and Quality of Services
The Trustees reviewed the nature, extent, and quality of the services provided by the Adviser to the Janus Henderson Funds, taking into account the investment objective, strategies, and policies of each Janus Henderson Fund, and the knowledge the Trustees gained from their regular meetings with management on at least a quarterly basis and their ongoing review of information related to the Janus Henderson Funds. In addition, the Trustees reviewed the resources and key personnel of the Adviser, particularly noting those employees who provide investment and risk management services to the Janus Henderson Funds. The Trustees also considered other services provided to the Janus Henderson
Janus Henderson International Opportunities Fund
Additional Information (unaudited)
Funds by the Adviser, such as managing the execution of portfolio transactions and the selection of broker-dealers for those transactions. The Trustees considered the Adviser’s role as administrator to the Janus Henderson Funds, noting that the Adviser generally does not receive a fee for its services as administrator, but is reimbursed for its out-of-pocket costs. The Trustees considered the role of the Adviser in monitoring adherence to the Janus Henderson Funds’ investment restrictions, providing support services for the Trustees and Trustee committees, and overseeing communications with Janus Henderson Fund shareholders and the activities of other service providers, including monitoring compliance with various policies and procedures of the Janus Henderson Funds and with applicable securities laws and regulations.
In this regard, the independent fee consultant noted that the Adviser provides a number of different services for the Janus Henderson Funds and their shareholders, ranging from investment management services to various other servicing functions, and that, in its view, the Adviser is a capable provider of those services. The independent fee consultant also provided its belief that the Adviser has developed a number of institutional competitive advantages that should enable it to provide superior investment and service performance over the long term.
The Trustees concluded that the nature, extent, and quality of the services provided by the Adviser to each Janus Henderson Fund were appropriate and consistent with the terms of the respective advisory agreements, and that, taking into account steps taken to address those Janus Henderson Funds whose performance lagged that of their peers for certain periods, the Janus Henderson Funds were likely to benefit from the continued provision of those services. They also concluded that the Adviser had sufficient personnel, with the appropriate education and experience, to serve the Janus Henderson Funds effectively and had demonstrated its ability to attract well-qualified personnel.
Performance of the Funds
The Trustees considered the performance results of each Janus Henderson Fund over various time periods. They noted that they considered Janus Henderson Fund performance data throughout the year, including periodic meetings with each Janus Henderson Fund’s portfolio manager(s), and also reviewed information comparing each Janus Henderson Fund’s performance with the performance of comparable fund peer groups identified by Broadridge Financial Solutions, Inc. (“Broadridge”), an independent data provider, and with the Janus Henderson Fund’s benchmark index. In this regard, the independent fee consultant found that the overall Janus Henderson Funds’ performance has been reasonable, noting that: (i) for the 36 months ended May 31, 2022, approximately 38% of the Janus Henderson Funds were in the top two quartiles of their Broadridge peer groups; (ii) for the 36 months ended September 30, 2022, approximately 45% of the Janus Henderson Funds were in the top two quartiles of performance as reported by Morningstar, and (iii) for the 12 months ended September 30, 2022, approximately 55% of the Janus Henderson Funds were in the top two quartiles of performance as reported by Morningstar.
The Trustees considered the performance of each Janus Henderson Fund, noting that performance may vary by share class, and noted the following with respect to the Funds:
Asset Allocation Funds
· For Janus Henderson Global Allocation Fund – Conservative, the Trustees noted that the Fund’s performance was in the third Broadridge quartile for the 36 months ended May 31, 2022 and the bottom Broadridge quartile for the 12 months ended May 31, 2022. The Trustees noted the reasons for the Fund’s underperformance and the steps the Adviser had taken or was taking to improve performance.
· For Janus Henderson Global Allocation Fund – Growth, the Trustees noted that the Fund’s performance was in the bottom Broadridge quartile for the 36 months ended May 31, 2022 and the bottom Broadridge quartile for the 12 months ended May 31, 2022. The Trustees noted the reasons for the Fund’s underperformance and the steps the Adviser had taken or was taking to improve performance.
· For Janus Henderson Global Allocation Fund – Moderate, the Trustees noted that the Fund’s performance was in the bottom Broadridge quartile for the 36 months ended May 31, 2022 and the bottom Broadridge quartile for the 12 months ended May 31, 2022. The Trustees noted the reasons for the Fund’s underperformance and the steps the Adviser had taken or was taking to improve performance.
Fixed-Income Funds
· For Janus Henderson Absolute Return Income Opportunities Fund, the Trustees noted that the Fund’s performance was in the third Broadridge quartile for the 36 months ended May 31, 2022 and the first Broadridge quartile for the 12 months ended May 31, 2022. The Trustees noted the reasons for the Fund’s underperformance,
Janus Henderson International Opportunities Fund
Additional Information (unaudited)
the steps the Adviser had taken or was taking to improve performance, and that the performance trend was improving.
· For Janus Developed World Bond Fund, the Trustees noted that the Fund’s performance was in the bottom Broadridge quartile for the 36 months ended May 31, 2022 and the bottom Broadridge quartile for the 12 months ended May 31, 2022. The Trustees noted the reasons for the Fund’s underperformance and the steps the Adviser had taken or was taking to improve performance.
· For Janus Henderson Flexible Bond Fund, the Trustees noted that the Fund’s performance was in the first Broadridge quartile for the 36 months ended May 31, 2022 and the second Broadridge quartile for the 12 months ended May 31, 2022.
· For Janus Henderson Global Bond Fund, the Trustees noted that the Fund’s performance was in the third Broadridge quartile for the 36 months ended May 31, 2022 and the bottom Broadridge quartile for the 12 months ended May 31, 2022. The Trustees noted the reasons for the Fund’s underperformance and the steps the Adviser had taken or was taking to improve performance.
· For Janus Henderson High-Yield Fund, the Trustees noted that the Fund’s performance was in the third Broadridge quartile for the 36 months ended May 31, 2022 and the bottom Broadridge quartile for the 12 months ended May 31, 2022. The Trustees noted the reasons for the Fund’s underperformance and the steps the Adviser had taken or was taking to improve performance.
· For Janus Henderson Multi-Sector Income Fund, the Trustees noted that the Fund’s performance was in the second Broadridge quartile for the 36 months ended May 31, 2022 and the third Broadridge quartile for the 12 months ended May 31, 2022.
· For Janus Henderson Short Duration Flexible Bond Fund, the Trustees noted that the Fund’s performance was in the third Broadridge quartile for the 36 months ended May 31, 2022 and the bottom Broadridge quartile for the 12 months ended May 31, 2022. The Trustees noted the reasons for the Fund’s underperformance and the steps the Adviser had taken or was taking to improve performance.
Global and International Equity Funds
· For Janus Henderson Asia Equity Fund, the Trustees noted that the Fund’s performance was in the third Broadridge quartile for the 36 months ended May 31, 2022 and the third Broadridge quartile for the 12 months ended May 31, 2022. The Trustees noted the reasons for the Fund’s underperformance, while also noting that the Fund has a performance fee structure that results in lower management fees during periods of underperformance, and the steps the Adviser had taken or was taking to improve performance.
· For Janus Henderson Emerging Markets Fund, the Trustees noted that the Fund’s performance was in the third Broadridge quartile for the 36 months ended May 31, 2022 and the third Broadridge quartile for the 12 months ended May 31, 2022. The Trustees noted the reasons for the Fund’s underperformance and the steps the Adviser had taken or was taking to improve performance.
· For Janus Henderson European Focus Fund, the Trustees noted that the Fund’s performance was in the first Broadridge quartile for the 36 months ended May 31, 2022 and the second Broadridge quartile for the 12 months ended May 31, 2022.
· For Janus Henderson Global Equity Income Fund, the Trustees noted that the Fund’s performance was in the third Broadridge quartile for the 36 months ended May 31, 2022 and the first Broadridge quartile for the 12 months ended May 31, 2022. The Trustees noted the reasons for the Fund’s underperformance, the steps the Adviser had taken or was taking to improve performance, and that the performance trend was improving.
· For Janus Henderson Global Life Sciences Fund, the Trustees noted that the Fund’s performance was in the third Broadridge quartile for the 36 months ended May 31, 2022 and the second Broadridge quartile for the 12 months ended May 31, 2022. The Trustees noted the reasons for the Fund’s underperformance, the steps the Adviser had taken or was taking to improve performance, and that the performance trend was improving.
· For Janus Henderson Global Sustainable Equity Fund, the Trustees noted that the Fund’s performance was in the second Broadridge quartile for the 12 months ended May 31, 2022. The Trustees noted that 36 month-end performance was not yet available.
Janus Henderson International Opportunities Fund
Additional Information (unaudited)
· For Janus Henderson Global Real Estate Fund, the Trustees noted that the Fund’s performance was in the second Broadridge quartile for the 36 months ended May 31, 2022 and the bottom Broadridge quartile for the 12 months ended May 31, 2022.
· For Janus Henderson Global Research Fund, the Trustees noted that the Fund’s performance was in the second Broadridge quartile for the 36 months ended May 31, 2022 and the first Broadridge quartile for the 12 months ended May 31, 2022.
· For Janus Henderson Global Select Fund, the Trustees noted that the Fund’s performance was in the first Broadridge quartile for the 36 months ended May 31, 2022 and the first Broadridge quartile for the 12 months ended May 31, 2022.
· For Janus Henderson Global Technology and Innovation Fund, the Trustees noted that the Fund’s performance was in the second Broadridge quartile for the 36 months ended May 31, 2022 and the second Broadridge quartile for the 12 months ended May 31, 2022.
· For Janus Henderson International Opportunities Fund, the Trustees noted that the Fund’s performance was in the bottom Broadridge quartile for the 36 months ended May 31, 2022 and the third Broadridge quartile for the 12 months ended May 31, 2022. The Trustees noted the reasons for the Fund’s underperformance and the steps the Adviser had taken or was taking to improve performance.
· For Janus Henderson Overseas Fund, the Trustees noted that the Fund’s performance was in the first Broadridge quartile for the 36 months ended May 31, 2022 and the first Broadridge quartile for the 12 months ended May 31, 2022.
· For Janus Henderson Responsible International Dividend Fund (formerly the Janus Henderson Dividend & Income Builder Fund), the Trustees noted that the Fund’s performance was in the bottom Broadridge quartile for the 36 months ended May 31, 2022 and the bottom Broadridge quartile for the 12 months ended May 31, 2022. The Trustees noted the reasons for the Fund’s underperformance and the steps the Adviser had taken or was taking to improve performance.
Money Market Funds
· For Janus Henderson Government Money Market Fund, the Trustees noted that the Fund’s performance was in the third Broadridge quartile for the 36 months ended May 31, 2022 and the bottom Broadridge quartile for the 12 months ended May 31, 2022. The Trustees noted the reasons for the Fund’s underperformance and the steps the Adviser had taken or was taking to improve performance.
· For Janus Henderson Money Market Fund, the Trustees noted that the Fund’s performance was in the third Broadridge quartile for the 36 months ended May 31, 2022 and the bottom Broadridge quartile for the 12 months ended May 31, 2022. The Trustees noted the reasons for the Fund’s underperformance and the steps the Adviser had taken or was taking to improve performance.
Multi-Asset Funds
· For Janus Henderson Adaptive Global Allocation Fund, the Trustees noted that the Fund’s performance was in bottom Broadridge quartile for the 36 months ended May 31, 2022 and the second Broadridge quartile for the 12 months ended May 31, 2022. The Trustees noted the reasons for the Fund’s underperformance, the steps the Adviser had taken or was taking to improve performance, and that the performance trend was improving.
· For Janus Henderson Balanced Fund, the Trustees noted that the Fund’s performance was in the first Broadridge quartile for the 36 months ended May 31, 2022 and the first Broadridge quartile for the 12 months ended May 31, 2022.
U.S. Equity Funds
· For Janus Henderson Adaptive Risk Managed U.S. Equity Fund, the Trustees noted that the Fund’s performance was in the bottom Broadridge quartile for the 36 months ended May 31, 2022 and the second Broadridge quartile for the 12 months ended May 31, 2022. The Trustees noted the reasons for the Fund’s underperformance, the steps the Adviser had taken or were taking to improve performance, and that the performance trend was improving.
Janus Henderson International Opportunities Fund
Additional Information (unaudited)
· For Janus Henderson Contrarian Fund, the Trustees noted that the Fund’s performance was in the first Broadridge quartile for the 36 months ended May 31, 2022 and the bottom Broadridge quartile for the 12 months ended May 31, 2022.
· For Janus Henderson Enterprise Fund, the Trustees noted that the Fund’s performance was in the second Broadridge quartile for the 36 months ended May 31, 2022 and the first Broadridge quartile for the 12 months ended May 31, 2022.
· For Janus Henderson Forty Fund, the Trustees noted that the Fund’s performance was in the third Broadridge quartile for the 36 months ended May 31, 2022 and the bottom Broadridge quartile for the 12 months ended May 31, 2022. The Trustees noted the reasons for the Fund’s underperformance and the steps the Adviser had taken or was taking to improve performance.
· For Janus Henderson Growth and Income Fund, the Trustees noted that the Fund’s performance was in the bottom Broadridge quartile for the 36 months ended May 31, 2022 and the first Broadridge quartile for the 12 months ended May 31, 2022. The Trustees noted the reasons for the Fund’s underperformance, the steps the Adviser had taken or was taking to improve performance, and that the performance trend was improving.
· For Janus Henderson Mid Cap Value Fund, the Trustees noted that the Fund’s performance was in the bottom Broadridge quartile for the 36 months ended May 31, 2022 and the second Broadridge quartile for the 12 months ended May 31, 2022. The Trustees noted the reasons for the Fund’s underperformance, while also noting that the Fund has a performance fee structure that results in lower management fees during periods of underperformance, the steps the Adviser had taken or was taking to improve performance, and that the performance trend was improving.
· For Janus Henderson Research Fund, the Trustees noted that the Fund’s performance was in the third Broadridge quartile for the 36 months ended May 31, 2022 and the third Broadridge quartile for the 12 months ended May 31, 2022. The Trustees noted the reasons for the Fund’s underperformance, while also noting that the Fund has a performance fee structure that results in lower management fees during periods of underperformance and the steps the Adviser had taken or was taking to improve performance.
· For Janus Henderson Small Cap Value Fund, the Trustees noted that the Fund’s performance was in the bottom Broadridge quartile for the 36 months ended May 31, 2022 and the second Broadridge quartile for the 12 months ended May 31, 2022. The Trustees noted the reasons for the Fund’s underperformance, while also noting that the Fund has a performance fee structure that results in lower management fees during periods of underperformance, the steps the Adviser had taken or was taking to improve performance, and that the performance trend was improving.
· For Janus Henderson Small-Mid Cap Value Fund, the Trustees noted that the Fund’s performance was in the bottom Broadridge quartile for the 36 months ended May 31, 2022 and the second Broadridge quartile for the 12 months ended May 31, 2022. The Trustees noted the reasons for the Fund’s underperformance, while also noting that the Fund has a performance fee structure that results in lower management fees during periods of underperformance, the steps the Adviser had taken or was taking to improve performance, and that the performance trend is improving.
· For Janus Henderson Triton Fund, the Trustees noted that the Fund’s performance was in the bottom Broadridge quartile for the 36 months ended May 31, 2022 and the second Broadridge quartile for the 12 months ended May 31, 2022. The Trustees noted the reasons for the Fund’s underperformance, the steps the Adviser had taken or was taking to improve performance, and that the performance trend was improving.
· For Janus Henderson Venture Fund, the Trustees noted that the Fund’s performance was in the bottom Broadridge quartile for the 36 months ended May 31, 2022 and the second Broadridge quartile for the 12 months ended May 31, 2022. The Trustees noted the reasons for the Fund’s underperformance, the steps the Adviser had taken or was taking to improve performance, and that the performance trend was improving.
In consideration of each Janus Henderson Fund’s performance, the Trustees concluded that, taking into account the factors relevant to performance, as well as other considerations, including steps taken to improve performance, as applicable, the Janus Henderson Fund’s performance warranted continuation of such Janus Henderson Fund’s investment advisory agreement.
Janus Henderson International Opportunities Fund
Additional Information (unaudited)
Costs of Services Provided
The Trustees examined information regarding the fees and expenses of each Janus Henderson Fund in comparison to similar information for other comparable funds as provided by Broadridge, an independent data provider. They also reviewed an analysis of that information provided by their independent fee consultant. The independent fee consultant provided its belief that the management fees charged by the Adviser to each of the Janus Henderson Funds under the current investment advisory and administration agreements are reasonable in relation to the services provided by the Adviser. The independent fee consultant found: (1) the total expenses and management fees of the Janus Henderson Funds to be reasonable relative to other comparable mutual funds; (2) the total expenses, on average, were 6% under the average total expenses of the respective Broadridge peer group; and (3) the management fees for the Janus Henderson Funds, on average, were 5% under the average management fees for the respective Broadridge peer group. The Trustees also considered the total expenses for each share class of each Janus Henderson Fund compared to the average total expenses for its Broadridge Expense Group and to average total expenses for its Broadridge Expense Universe.
For Janus Henderson Funds with three or more years of performance history, the independent fee consultant also performed a systematic “focus list” analysis of expenses which assessed fund fees in the context of fund performance being delivered. Based on this analysis, the independent fee consultant found that the combination of service quality/performance and expenses on these individual Janus Henderson Funds was reasonable in light of performance trends, performance histories, changes in portfolio management, relative average net asset levels, and the existence of performance fees, breakpoints, and/or expense waivers on such Janus Henderson Funds.
The Trustees considered the methodology used by the Adviser in determining compensation payable to portfolio managers, the competitive environment for investment management talent, and the competitive market for mutual funds in different distribution channels.
The Trustees also reviewed management fees charged by the Adviser to comparable separate account clients and to comparable non-affiliated funds subadvised by the Adviser (for which the Adviser provides only or primarily portfolio management services). Although in most instances subadvisory and separate account fee rates for various investment strategies were lower than management fee rates for Janus Henderson Funds having a similar strategy, the Trustees considered that the Adviser noted that, under the terms of the management agreements with the Janus Henderson Funds, the Adviser performs significant additional services for the Janus Henderson Funds that it does not provide to those other clients, including administration services, oversight of the Janus Henderson Funds’ other service providers, Trustee support, regulatory compliance and numerous other services, and that, in serving the Janus Henderson Funds, the Adviser assumes many legal risks and other costs that it does not assume in servicing its other clients. Moreover, the Trustees noted that the independent fee consultant found that: (1) the management fees the Adviser charges to the Janus Henderson Funds are reasonable in relation to the management fees the Adviser charges to funds subadvised by the Adviser and to the fees the Adviser charges to its institutional separate account clients; (2) these subadvised and institutional separate accounts have different service and infrastructure needs and operate in markets very different from the retail fund market; (3) Janus Henderson mutual fund investors enjoy reasonable fees relative to the fees charged in these other markets; and (4) as part of its 2022 review, 9 of 11 Janus Henderson Funds have lower management fees than similar funds subadvised by the Adviser. The Trustees noted that for the two Janus Henderson Funds that did not, management fees for each were under the average of its 15(c) peer group.
The Trustees considered the fees for each Janus Henderson Fund for its fiscal year ended in 2021 and noted the following with regard to each Janus Henderson Fund’s total expenses, net of applicable fee waivers (the Fund’s “total expenses”) as reflected in the comparative information provided by Broadridge:
Asset Allocation Funds
· For Janus Henderson Global Allocation Fund – Conservative, the Trustees noted that, although the Fund’s total expenses exceeded the peer group average for certain share classes, overall the Fund’s total expenses were reasonable. The Trustees also noted that the Adviser has contractually agreed to limit the Fund’s expenses.
· For Janus Henderson Global Allocation Fund – Growth, the Trustees noted that, although the Fund’s total expenses exceeded the peer group average for certain share classes, overall the Fund’s total expenses were reasonable. The Trustees also noted that the Adviser has contractually agreed to limit the Fund’s expenses, although this limit did not apply because the Fund’s total expenses as shown were below the applicable fee limit.
Janus Henderson International Opportunities Fund
Additional Information (unaudited)
· For Janus Henderson Global Allocation Fund – Moderate, the Trustees noted that, although the Fund’s total expenses exceeded the peer group average for one share class, overall the Fund’s total expenses were reasonable. The Trustees also noted that the Adviser has contractually agreed to limit the Fund’s expenses.
Fixed-Income Funds
· For Janus Henderson Absolute Return Income Opportunities Fund, the Trustees noted that, although the Fund’s total expenses exceeded the peer group average for certain share classes, overall the Fund’s total expenses were reasonable. The Trustees also noted that the Adviser has contractually agreed to limit the Fund’s expenses.
· For Janus Henderson Developed World Bond Fund, the Trustees noted that, although the Fund’s total expenses exceeded the peer group average for one share class, overall the Fund’s total expenses were reasonable. The Trustees also noted that the Adviser has contractually agreed to limit the Fund’s expenses.
· For Janus Henderson Flexible Bond Fund, the Trustees noted that, although the Fund’s total expenses exceeded the peer group average for certain share classes, overall the Fund’s total expenses were reasonable. The Trustees also noted that the Adviser has contractually agreed to limit the Fund’s expenses, although this limit did not apply because the Fund’s total expenses as shown were below the applicable fee limit.
· For Janus Henderson Global Bond Fund, the Trustees noted that, although the Fund’s total expenses exceeded the peer group average for certain share classes, overall the Fund’s total expenses were reasonable. The Trustees also noted that the Adviser has contractually agreed to limit the Fund’s expenses.
· For Janus Henderson High-Yield Fund, the Trustees noted that, although the Fund’s total expenses exceeded the peer group average for certain share classes, overall the Fund’s total expenses were reasonable. The Trustees also noted that the Adviser has contractually agreed to limit the Fund’s expenses.
· For Janus Henderson Multi-Sector Income Fund, the Trustees noted that, although the Fund’s total expenses exceeded the peer group average for certain share classes, overall the Fund’s total expenses were reasonable. The Trustees also noted that the Adviser has contractually agreed to limit the Fund’s expenses.
· For Janus Henderson Short Duration Flexible Bond Fund, the Trustees noted that, although the Fund’s total expenses exceeded the peer group average for certain share classes, overall the Fund’s total expenses were reasonable. The Trustees also noted that the Adviser has contractually agreed to limit the Fund’s expenses.
Global and International Equity Funds
· For Janus Henderson Asia Equity Fund, the Trustees noted that, although the Fund’s total expenses exceeded the peer group average for certain share classes, overall the Fund’s total expenses were reasonable. The Trustees also noted that the Adviser has contractually agreed to limit the Fund’s expenses.
· For Janus Henderson Emerging Markets Fund, the Trustees noted that, although the Fund’s total expenses exceeded the peer group average for certain share classes, overall the Fund’s total expenses were reasonable. The Trustees also noted that the Adviser has contractually agreed to limit the Fund’s expenses.
· For Janus Henderson European Focus Fund, the Trustees noted that, although the Fund’s total expenses exceeded the peer group average for one share class, overall the Fund’s expenses were reasonable. The Trustees also noted that the Adviser has contractually agreed to limit the Fund’s expenses.
· For Janus Henderson Global Equity Income Fund, the Trustees noted that, although the Fund’s total expenses exceeded the peer group average for one share class, overall the Fund’s total expenses were reasonable. The Trustees also noted that the Adviser has contractually agreed to limit the Fund’s expenses, although this limit did not apply because the Fund’s total expenses as shown were below the applicable fee limit.
· For Janus Henderson Global Life Sciences Fund, the Trustees noted that the Fund’s total expenses were below the peer group average for all share classes.
· For Janus Henderson Global Real Estate Fund, the Trustees noted that, although the Fund’s total expenses exceeded the peer group average for certain share classes, overall the Fund’s total expenses were reasonable. The Trustees also noted that the Adviser has contractually agreed to limit the Fund’s expenses, although this limit did not apply because the Fund’s total expenses as shown were below the applicable fee limit.
Janus Henderson International Opportunities Fund
Additional Information (unaudited)
· For Janus Henderson Global Research Fund, the Trustees noted that, although the Fund’s total expenses exceeded the peer group average for one share class, overall the Fund’s total expenses were reasonable. The Trustees also noted that the Adviser has contractually agreed to limit the Fund’s expenses, although this limit did not apply because the Fund’s total expenses as shown were below the applicable fee limit.
· For Janus Henderson Global Select Fund, the Trustees noted that, although the Fund’s total expenses exceeded the peer group average for certain share classes, overall the Fund’s total expenses were reasonable. The Trustees also noted that the Adviser has contractually agreed to limit the Fund’s expenses.
· For Janus Henderson Global Sustainable Equity Fund, the Trustees noted that, although the Fund’s total expenses exceeded the peer group average for certain share classes, overall the Fund’s expenses were reasonable. The Trustees also noted that the Adviser has contractually agreed to limit the Fund’s expenses.
· For Janus Henderson Global Technology and Innovation Fund, the Trustees noted that the Fund’s total expenses were below the peer group average for all share classes.
· For Janus Henderson International Opportunities Fund, the Trustees noted that, although the Fund’s total expenses exceeded the peer group average for certain share classes, overall the Fund’s expenses were reasonable. The Trustees also noted that the Adviser has contractually agreed to limit the Fund’s expenses.
· For Janus Henderson Overseas Fund, the Trustees noted that although the Fund’s total expenses exceeded the peer group average for certain share classes, overall the Fund’s total expenses were reasonable. The Trustees also noted that the Adviser has contractually agreed to limit the Fund’s expenses, although this limit did not apply because the Fund’s total expenses as shown were below the applicable fee limit.
· For Janus Henderson Responsible International Dividend Fund (formerly the Janus Henderson Dividend & Income Builder Fund), the Trustees noted that, although the Fund’s total expenses exceeded the peer group for one share class, overall the Fund’s total expenses were reasonable. The Trustees also noted that the Adviser has contractually agreed to limit the Fund’s expenses.
Money Market Funds
· For Janus Henderson Government Money Market Fund, the Trustees noted that the Fund’s total expenses were below the peer group average for all share classes.
· For Janus Henderson Money Market Fund, the Trustees noted that the Fund’s total expenses were below the peer group average for all share classes.
Multi-Asset Funds
· For Janus Henderson Adaptive Global Allocation Fund, the Trustees noted that, that the Fund’s total expenses were below the peer group average for all share classes.
· For Janus Henderson Balanced Fund, the Trustees noted that, although the Fund’s total expenses exceeded the peer group average for certain share classes, overall the Fund’s total expenses were reasonable. The Trustees also noted that the Adviser has contractually agreed to limit the Fund’s expenses, although this limit did not apply because the Fund’s total expenses as shown were below the applicable fee limit.
U.S. Equity Funds
· For Janus Henderson Adaptive Risk Managed U.S. Equity Fund, the Trustees noted that, although the Fund’s total expenses exceeded the peer group average for certain share classes, overall the Fund’s total expenses were reasonable. The Trustees also noted that the Adviser has contractually agreed to limit the Fund’s expenses, although this limit did not apply because the Fund’s total expenses as shown were below the applicable fee limit.
· For Janus Henderson Contrarian Fund, the Trustees noted that, although the Fund’s total expenses exceeded the peer group average for all share classes, overall the Fund’s total expenses were reasonable. The Trustees also noted that the Adviser had contractually agreed to limit the Fund’s expenses.
· For Janus Henderson Enterprise Fund, the Trustees noted that, although the Fund’s total expenses exceeded the peer group average for certain share classes, overall the Fund’s total expenses were reasonable. The Trustees also noted that the Adviser has contractually agreed to limit the Fund’s expenses, although this limit did not apply because the Fund’s total expenses as shown were below the applicable fee limit.
Janus Henderson International Opportunities Fund
Additional Information (unaudited)
· For Janus Henderson Forty Fund, the Trustees noted that, although the Fund’s total expenses exceeded the peer group average for certain share classes, overall the Fund’s total expenses were reasonable. The Trustees also noted that the Adviser has contractually agreed to limit the Fund’s expenses, although this limit did not apply because the Fund’s total expenses as shown were below the applicable fee limit.
· For Janus Henderson Growth and Income Fund, the Trustees noted that, although the Fund’s total expenses exceeded the peer group average for certain share classes, overall the Fund’s total expenses were reasonable. The Trustees also noted that the Adviser has contractually agreed to limit the Fund’s expenses, although this limit did not apply because the Fund’s total expenses as shown were below the applicable fee limit.
· For Janus Henderson Mid Cap Value Fund, the Trustees noted that the Fund’s total expenses were below the peer group average for all share classes.
· For Janus Henderson Research Fund, the Trustees noted that, although the Fund’s total expenses exceeded the peer group average for certain share classes, overall the Fund’s total expenses were reasonable. The Trustees also noted that the Adviser has contractually agreed to limit the Fund’s expenses.
· For Janus Henderson Small Cap Value Fund, the Trustees noted that, although the Fund’s total expenses exceeded the peer group average for one share class, overall the Fund’s total expenses were reasonable. The Trustees also noted that the Adviser has contractually agreed to limit the Fund’s expenses, although this limit did not apply because the Fund’s total expenses as shown were below the applicable fee limit.
· For Janus Henderson Small-Mid Cap Value Fund, the Trustees noted that the Fund’s total expenses were below the peer group average for all share classes.
· For Janus Henderson Triton Fund, the Trustees noted that, although the Fund’s total expenses exceeded the peer group average for one share class, overall the Fund’s total expenses were reasonable. The Trustees also noted that the Adviser has contractually agreed to limit the Fund’s expenses, although this limit did not apply because the Fund’s total expenses as shown were below the applicable fee limit.
· For Janus Henderson Venture Fund, the Trustees noted that although the Fund’s total expenses exceeded the peer group average for one share class, overall the Fund’s total expenses were reasonable. The Trustees also noted that the Adviser has contractually agreed to limit the Fund’s expenses, although this limit did not apply because the Fund’s total expenses as shown were below the applicable fee limit.
The Trustees reviewed information on the overall profitability to the Adviser and its affiliates from their relationships with the Janus Henderson Funds, and considered profitability data of other publicly traded mutual fund advisers. The Trustees recognized that profitability comparisons among fund managers are difficult because of the variation in the type of comparative information that is publicly available, and the profitability of any fund manager is affected by numerous factors, including the organizational structure of the particular fund manager, differences in complex size, difference in product mix, difference in types of business (mutual fund, institutional and other), differences in the types of funds and other accounts it manages, possible other lines of business, the methodology for allocating expenses and the fund manager’s capital structure and cost of capital.
Additionally, the Trustees considered the estimated profitability to the Adviser from the investment management services it provided to each Janus Henderson Fund. In their review, the Trustees considered whether the Adviser receive adequate incentives and resources to manage the Janus Henderson Funds effectively. In reviewing profitability, the Trustees noted that the estimated profitability for an individual Janus Henderson Fund is necessarily a product of the allocation methodology utilized by the Adviser to allocate its expenses as part of the estimated profitability calculation. In this regard, the Trustees noted that the independent fee consultant found as part of its 2022 review that (1) the expense allocation methodology and rationales utilized by the Adviser were reasonable and (2) no clear correlation exists between expense allocations and operating margins. The Trustees also considered that the estimated profitability for an individual Janus Henderson Fund was influenced by a number of factors, including not only the allocation methodology selected, but also the presence of fee waivers and expense caps, and whether the Janus Henderson Fund’s investment management agreement contained breakpoints or a performance fee component. The Trustees determined, after taking into account these factors, among others, that the Adviser’s estimated profitability with respect to each Janus Henderson Fund was not unreasonable in relation to the services provided, and that the variation in the range of such estimated profitability among the Janus Henderson Funds was not a material factor in the Board’s approval of the reasonableness of any Janus Henderson Fund’s investment management fees.
Janus Henderson International Opportunities Fund
Additional Information (unaudited)
The Trustees concluded that the management fees payable by each Janus Henderson Fund to the Adviser were reasonable in relation to the nature, extent, and quality of the services provided, taking into account the fees charged by other advisers for managing comparable mutual funds with similar strategies, the fees the Adviser charges to other clients, and, as applicable, the impact of fund performance on management fees payable by the Janus Henderson Funds. The Trustees also concluded that each Janus Henderson Fund’s total expenses were reasonable, taking into account the size of the Janus Henderson Fund, the quality of services provided by the Adviser, the investment performance of the Janus Henderson Fund, and any expense limitations agreed to or provided by the Adviser.
Economies of Scale
The Trustees considered information about the potential for the Adviser to realize economies of scale as the assets of the Janus Henderson Funds increase. They noted that their independent fee consultant published a report to the Trustees in June 2022 which provided its research and analysis into economies of scale. They also noted that, although many Janus Henderson Funds pay advisory fees at a fixed base rate as a percentage of net assets, without any breakpoints or performance fees, their independent fee consultant concluded that 75% of these Janus Henderson Funds’ have contractual management fees (gross of waivers) below their Broadridge Expense Group averages. The Trustees also noted the following from the independent fee consultant’s report: (1) that 31% of Janus Henderson Funds had management fee breakpoints in place whereby investors pay lower management fees as fund AUM increases; (2) that 29% of Janus Henderson Funds have low flat-rate fees and performance fees where the Adviser is incentivized to invest in resources which drive Janus Henderson Fund performance; and (3) that 39% of Janus Henderson Funds have low flat-rate fees versus peers where investors pay low fixed fees when the Janus Henderson Fund is small/midsized and higher fees when the Janus Henderson Fund grows in assets. The Trustees also noted that the Janus Henderson Funds share directly in economies of scale through the significant investments made by the Adviser and its affiliates related to services provided to the Funds and the lower charges of third-party service providers that are based in part on the combined scale of all of the Janus Henderson Funds.
The Trustees also considered the independent fee consultant’s conclusion that, given the limitations of various analytical approaches to economies of scale and their conflicting results, it is difficult to analytically confirm or deny the existence of economies of scale in the Janus Henderson complex. In this regard, the independent consultant concluded that (1) to the extent there were economies of scale at the Adviser, the Adviser’s general strategy of setting fixed management fees below peers appeared to share any such economies with investors even on smaller Janus Henderson Funds which have not yet achieved those economies and (2) by setting lower fixed fees from the start on these Janus Henderson Funds, the Adviser appeared to be investing to increase the likelihood that these Janus Henderson Funds will grow to a level to achieve any economies of scale that may exist. Further, the independent fee consultant provided its belief that Janus Henderson Fund investors are well-served by the fee levels and performance fee structures in place on the Janus Henderson Funds in light of any economies of scale that may be present at the Adviser.
Based on all of the information reviewed, including the recent and past research and analysis conducted by the Trustees’ independent fee consultant, the Trustees concluded that the current fee structure of each Janus Henderson Fund was reasonable and that the current rates of fees do reflect a sharing between the Adviser and the Janus Henderson Fund of any economies of scale that may be present at the current asset level of the Janus Henderson Fund.
Other Benefits to the Adviser
The Trustees also considered benefits that accrue to the Adviser and its affiliates from their relationships with the Janus Henderson Funds. They recognized that two affiliates of the Adviser separately serve the Janus Henderson Funds as transfer agent and distributor, respectively, and the transfer agent receives compensation directly from the non-money market Janus Henderson Funds for services provided, and that such compensation contributes to the overall profitability of the Adviser and its affiliates that results from their relationship with the Janus Henderson Funds. The Trustees also considered the Adviser’s past and proposed use of commissions paid by the Janus Henderson Funds on portfolio brokerage transactions to obtain proprietary and third-party research products and services benefiting the Janus Henderson Fund and/or other clients of the Adviser and/or the Adviser. The Trustees concluded that the Adviser’s use of these types of client commission arrangements to obtain proprietary and third-party research products and services was consistent with regulatory requirements and guidelines and was likely to benefit each Janus Henderson Fund. The Trustees also concluded that, other than the services provided by the Adviser and its affiliates pursuant to the agreements and the fees to be paid by each Janus Henderson Fund therefor, the Janus Henderson
Janus Henderson International Opportunities Fund
Additional Information (unaudited)
Funds and the Adviser may potentially benefit from their relationship with each other in other ways. They concluded that the Adviser and its affiliates share directly in economies of scale through the lower charges of third-party service providers that are based in part on the combined scale of the Janus Henderson Funds and other clients serviced by the Adviser and its affiliates. They also concluded that the Adviser benefits from the receipt of research products and services acquired through commissions paid on portfolio transactions of the Janus Henderson Funds and that the Janus Henderson Funds benefit from the Adviser’s receipt of those products and services as well as research products and services acquired through commissions paid by other clients of the Adviser. They further concluded that the success of any Janus Henderson Fund could attract other business to the Adviser or other Janus Henderson Funds, and that the success of the Adviser could enhance the Adviser’s ability to serve the Janus Henderson Funds.
Janus Henderson International Opportunities Fund
Liquidity Risk Management Program (unaudited)
Liquidity Risk Management Program
Rule 22e-4 under the Investment Company Act of 1940, as amended (the “Liquidity Rule”), requires open-end funds (but not money market funds) to adopt and implement a written liquidity risk management program (the “LRMP”) that is reasonably designed to assess and manage liquidity risk, which is the risk that a fund could not meet redemption requests without significant dilution of remaining investors’ interest in the fund. The Fund has implemented a LRMP, which incorporates the following elements: (i) assessment, management, and periodic review of liquidity risk; (ii) classification of portfolio holdings; (iii) the establishment and monitoring of a highly liquid investment minimum, as applicable; (iv) a 15% limitation on a Fund’s illiquid investments; (v) redemptions in-kind; and (vi) board oversight.
The Trustees of the Fund (the “Trustees”) have designated Janus Henderson Investors US LLC, the Fund’s investment adviser (the “Adviser”), as the Program Administrator for the LRMP responsible for administering the LRMP and carrying out the specific responsibilities of the LRMP. A working group comprised of various teams within the Adviser’s business is responsible for administering the LRMP and carrying out the specific responsibilities of different aspects of the LRMP (the “Liquidity Risk Working Group”). In assessing each Fund’s liquidity risk, the Liquidity Risk Working Group periodically considers, as relevant, factors including (i) the liquidity of a Fund’s portfolio investments during normal and reasonably foreseeable stressed conditions; (ii) whether a Fund’s investment strategy is appropriate for an open-end fund; (iii) the extent to which a Fund’s strategy involves a relatively concentrated portfolio or large positions in any issuer; (iv) a Fund’s use of borrowing for investment purposes; and (v) a Fund’s use of derivatives.
The Liquidity Rule requires the Trustees to review at least annually a written report provided by the Program Administrator that addresses the operation of the LRMP and assesses its adequacy and the effectiveness of its implementation, including, if applicable, the operation of the highly liquid investment minimum, and any material changes to the LRMP (the “Program Administrator Report”). At a meeting held on March 15, 2023, the Adviser provided the Program Administrator Report to the Trustees which covered the operation of the LRMP from January 1, 2022 through December 31, 2022 (the “Reporting Period”).
The Program Administrator Report discussed the operation and effectiveness of the LRMP during the Reporting Period. Among other things, the Program Administrator Report indicated that there were no material changes to the LRMP during the Reporting Period, although there were certain methodology adjustments implemented relating to a change in data provider. Additionally, the findings presented in the Program Administrator Report indicated that the LRMP operated adequately during the Reporting Period. These findings included that the Fund was able to meet redemptions during the normal course of business during the Reporting Period. The Program Administrator Report also stated that the Fund did not exceed the 15% limit on illiquid assets during the Reporting Period, that the Fund held primarily highly liquid assets, and was considered to be a primarily highly liquid fund during the Reporting Period. Also included among the Program Administrator Report’s findings was the determination that the Fund’s investment strategy remains appropriate for an open-end fund. In addition, the Adviser expressed its belief in the Program Administrator Report that the LRMP is reasonably designed and adequate to assess and manage the Fund’s liquidity risk, considering the Fund’s particular risks and circumstances, and includes policies and procedures reasonably designed to implement each required component of the Liquidity Rule.
There can be no assurance that the LRMP will achieve its objectives in the future. Please refer to your Fund’s prospectus for more information regarding the risks to which an investment in the Fund may be subject.
Janus Henderson International Opportunities Fund
Useful Information About Your Fund Report (unaudited)
Performance Overviews
Performance overview graphs compare the performance of a hypothetical $10,000 investment in the Fund with one or more widely used market indices. When comparing the performance of the Fund with an index, keep in mind that market indices are not available for investment and do not reflect deduction of expenses.
Average annual total returns are quoted for a Fund with more than one year of performance history. Average annual total return is calculated by taking the growth or decline in value of an investment over a period of time, including reinvestment of dividends and distributions, then calculating the annual compounded percentage rate that would have produced the same result had the rate of growth been constant throughout the period. Average annual total return does not reflect the deduction of taxes that a shareholder would pay on Fund distributions or redemptions of Fund shares.
Cumulative total returns are quoted for a Fund with less than one year of performance history. Cumulative total return is the growth or decline in value of an investment over time, independent of the period of time involved. Cumulative total return does not reflect the deduction of taxes that a shareholder would pay on Fund distributions or redemptions of Fund shares.
Pursuant to federal securities rules, expense ratios shown in the performance chart reflect subsidized (if applicable) and unsubsidized ratios. The total annual fund operating expenses ratio is gross of any fee waivers, reflecting the Fund’s unsubsidized expense ratio. The net annual fund operating expenses ratio (if applicable) includes contractual waivers of the Adviser and reflects the Fund’s subsidized expense ratio. Ratios may be higher or lower than those shown in the “Financial Highlights” in this report.
Schedule of Investments
Following the performance overview section is the Fund’s Schedule of Investments. This schedule reports the types of securities held in the Fund on the last day of the reporting period. Securities are usually listed by type (common stock, corporate bonds, U.S. Government obligations, etc.) and by industry classification (banking, communications, insurance, etc.). Holdings are subject to change without notice.
The value of each security is quoted as of the last day of the reporting period. The value of securities denominated in foreign currencies is converted into U.S. dollars.
If the Fund invests in foreign securities, it will also provide a summary of investments by country. This summary reports the Fund exposure to different countries by providing the percentage of securities invested in each country. The country of each security represents the country of risk. A company may be allocated to a country based on other factors such as location of the company’s principal office, the location of the principal trading market for the company’s securities, or the country where a majority of the company’s revenues are derived. The Fund’s Schedule of Investments relies upon the industry group and country classifications published by Bloomberg and/or MSCI Inc.
Tables listing details of individual forward currency contracts, futures, written options, swaptions, and swaps follow the Fund’s Schedule of Investments (if applicable).
Statement of Assets and Liabilities
This statement is often referred to as the “balance sheet.” It lists the assets and liabilities of the Fund on the last day of the reporting period.
The Fund’s assets are calculated by adding the value of the securities owned, the receivable for securities sold but not yet settled, the receivable for dividends declared but not yet received on securities owned, and the receivable for Fund shares sold to investors but not yet settled. The Fund’s liabilities include payables for securities purchased but not yet settled, Fund shares redeemed but not yet paid, and expenses owed but not yet paid. Additionally, there may be other assets and liabilities such as unrealized gain or loss on forward currency contracts.
The section entitled “Net Assets Consist of” breaks down the components of the Fund’s net assets. Because the Fund must distribute substantially all earnings, you will notice that a significant portion of net assets is shareholder capital.
The last section of this statement reports the net asset value (“NAV”) per share on the last day of the reporting period. The NAV is calculated by dividing the Fund’s net assets for each share class (assets minus liabilities) by the number of shares outstanding.
Janus Henderson International Opportunities Fund
Useful Information About Your Fund Report (unaudited)
Statement of Operations
This statement details the Fund’s income, expenses, realized gains and losses on securities and currency transactions, and changes in unrealized appreciation or depreciation of Fund holdings.
The first section in this statement, entitled “Investment Income,” reports the dividends earned from securities and interest earned from interest-bearing securities in the Fund.
The next section reports the expenses incurred by the Fund, including the advisory fee paid to the investment adviser, transfer agent fees and expenses, and printing and postage for mailing statements, financial reports and prospectuses. Expense offsets and expense reimbursements, if any, are also shown.
The last section lists the amounts of realized gains or losses from investment and foreign currency transactions, and changes in unrealized appreciation or depreciation of investments and foreign currency-denominated assets and liabilities. The Fund will realize a gain (or loss) when it sells its position in a particular security. A change in unrealized gain (or loss) refers to the change in net appreciation or depreciation of the Fund during the reporting period. “Net Realized and Unrealized Gain/(Loss) on Investments” is affected both by changes in the market value of Fund holdings and by gains (or losses) realized during the reporting period.
Statements of Changes in Net Assets
These statements report the increase or decrease in the Fund’s net assets during the reporting period. Changes in the Fund’s net assets are attributable to investment operations, dividends and distributions to investors, and capital share transactions. This is important to investors because it shows exactly what caused the Fund’s net asset size to change during the period.
The first section summarizes the information from the Statement of Operations regarding changes in net assets due to the Fund’s investment operations. The Fund’s net assets may also change as a result of dividend and capital gains distributions to investors. If investors receive their dividends and/or distributions in cash, money is taken out of the Fund to pay the dividend and/or distribution. If investors reinvest their dividends and/or distributions, the Fund’s net assets will not be affected.
The reinvestment of dividends and distributions is included under “Capital Share Transactions.” “Capital Shares” refers to the money investors contribute to the Fund through purchases or withdrawals via redemptions. The Fund’s net assets will increase and decrease in value as investors purchase and redeem shares from the Fund.
Financial Highlights
This schedule provides a per-share breakdown of the components that affect the Fund’s NAV for current and past reporting periods as well as total return, asset size, ratios, and portfolio turnover rate.
The first line in the table reflects the NAV per share at the beginning of the reporting period. The next line reports the net investment income/(loss) per share. Following is the per share total of net gains/(losses), realized and unrealized. Per share dividends and distributions to investors are then subtracted to arrive at the NAV per share at the end of the period. The next line reflects the total return for the period. The total return may include adjustments in accordance with generally accepted accounting principles required at the period end for financial reporting purposes. As a result, the total return may differ from the total return reflected for individual shareholder transactions. Also included are ratios of expenses and net investment income to average net assets.
The Fund’s expenses may be reduced through expense offsets and expense reimbursements. The ratios shown reflect expenses before and after any such offsets and reimbursements.
The ratio of net investment income/(loss) summarizes the income earned less expenses, divided by the average net assets of the Fund during the reporting period. Do not confuse this ratio with the Fund’s yield. The net investment income ratio is not a true measure of the Fund’s yield because it does not take into account the dividends distributed to the Fund’s investors.
The next figure is the portfolio turnover rate, which measures the buying and selling activity in the Fund. Portfolio turnover is affected by market conditions, changes in the asset size of the Fund, fluctuating volume of shareholder purchase and redemption orders, the nature of the Fund’s investments, and the investment style and/or outlook of the portfolio manager(s) and/or investment personnel. A 100% rate implies that an amount equal to the value of the entire portfolio was replaced once during the fiscal year; a 50% rate means that an amount equal to the value of half the
Janus Henderson International Opportunities Fund
Useful Information About Your Fund Report (unaudited)
portfolio is traded in a year; and a 200% rate means that an amount equal to the value of the entire portfolio is traded every six months.
Janus Henderson International Opportunities Fund
Notes
NotesPage1
Janus Henderson International Opportunities Fund
Notes
NotesPage2
Janus Henderson International Opportunities Fund
Notes
NotesPage3
| | | | | | | | |
| | | | | |

| | | | |
This report is submitted for the general information of shareholders of the Fund. It is not an offer or solicitation for the Fund and is not authorized for distribution to prospective investors unless preceded or accompanied by an effective prospectus. |
Janus Henderson is a trademark of Janus Henderson Group plc or one of its subsidiaries. © Janus Henderson Group plc. Janus Henderson Group is the ultimate parent of Janus Henderson Distributors US LLC. Janus Henderson Distributors US LLC |
| | | | 125-24-93082 05-23 |
| | | | |
| | | |
| | | SEMIANNUAL REPORT March 31, 2023 |
| | |
| | Janus Henderson Overseas Fund |
| | |
| | Janus Investment Fund |
| |
| | | HIGHLIGHTS · Investment strategy behind your fund · Fund performance, characteristics
and holdings |
Table of Contents
Janus Henderson Overseas Fund
| | | | | | |
| | | | | 
Julian McManus co-portfolio manager | 
George Maris co-portfolio manager |
| | | |
Janus Henderson Overseas Fund (unaudited)
Fund At A Glance
March 31, 2023
| | | | | | | | | | |
| | | | | | | | | |
| | | | | | | | | |
| | | | | | | | | |
| 5 Top Contributors - Holdings | 5 Top Detractors - Holdings |
| | Average
Weight | | Relative
Contribution | | | Average
Weight | | Relative
Contribution |
| ASML Holding NV | 2.92% | | 0.64% | | JD.Com Inc - Class A | 3.02% | | -1.06% |
| BNP Paribas SA | 3.99% | | 0.59% | | Diageo PLC | 3.27% | | -0.53% |
| Airbus SE | 2.07% | | 0.55% | | Central Japan Railway Co | 1.63% | | -0.38% |
| BAE Systems PLC | 0.91% | | 0.54% | | Nintendo Co Ltd | 1.51% | | -0.36% |
| Keyence Corp | 2.66% | | 0.54% | | E Ink Holdings Inc | 0.43% | | -0.30% |
| | | | | | | |
| 5 Top Contributors - Sectors* | | | | | |
| | | Relative | | Fund | MSCI All Country World ex-USA Index |
| | | Contribution | | Average Weight | Average Weight |
| Financials | | 2.17% | | 20.12% | 20.78% |
| Health Care | | 0.84% | | 12.38% | 9.63% |
| Energy | | 0.77% | | 5.71% | 6.01% |
| Information Technology | | 0.37% | | 11.10% | 11.17% |
| Materials | | 0.35% | | 6.27% | 8.34% |
| | | | | | |
| | | | | | |
| 5 Top Detractors - Sectors* | | | | | |
| | | Relative | | Fund | MSCI All Country World ex-USA Index |
| | | Contribution | | Average Weight | Average Weight |
| Other** | | -0.95% | | 4.46% | 0.00% |
| Consumer Discretionary | | -0.25% | | 15.18% | 11.47% |
| Consumer Staples | | -0.21% | | 9.50% | 8.83% |
| Industrials | | 0.07% | | 8.28% | 12.40% |
| Communication Services | | 0.15% | | 7.01% | 5.88% |
| | | | | | | |
| Relative contribution reflects how the portolio's holdings impacted return relative to the benchmark. Cash and securities not held in the portfolio are not shown. For equity portfolios, relative contribution compares the performance of a security in the portfolio to the benchmark's total return, factoring in the difference in weight of that security in the benchmark. Returns are calculated using daily returns and previous day ending weights rolled up by ticker, excluding fixed income securities, gross of advisory fees, may exclude certain derivatives and will differ from actual performance.
Performance attribution reflects returns gross of advisory fees and may differ from actual returns as they are based on end of day holdings. Attribution is calculated by geometrically linking daily returns for the portfolio and index. |
* | Based on sector classification according to the Global Industry Classification Standard (“GICS”) codes, which are the exclusive property and a service mark of MSCI Inc. and Standard & Poor’s. |
** | Not a GICS classified sector. |
Janus Henderson Overseas Fund (unaudited)
Fund At A Glance
March 31, 2023
| | |
5 Largest Equity Holdings - (% of Net Assets) |
BNP Paribas SA | |
Banks | 3.8% |
Taiwan Semiconductor Manufacturing Co Ltd | |
Semiconductor & Semiconductor Equipment | 3.8% |
Yum China Holdings Inc | |
Hotels, Restaurants & Leisure | 3.7% |
Deutsche Telekom AG | |
Diversified Telecommunication Services | 3.5% |
Heineken NV | |
Beverages | 3.3% |
| | 18.1% |
| | | | | | |
Asset Allocation - (% of Net Assets) | |
Common Stocks | | 95.1% | |
Investment Companies | | 4.2% | |
Preferred Stocks | | 0.8% | |
Other | | (0.1)% |
| | | 100.0% |
Emerging markets comprised 12.5% of total net assets.
| | |
Top Country Allocations - Long Positions - (% of Investment Securities) |
As of March 31, 2023 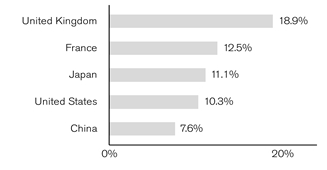
| As of September 30, 2022 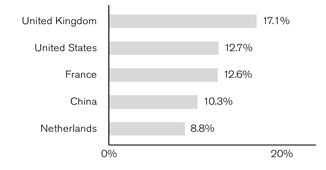
|
Janus Henderson Overseas Fund (unaudited)
Performance
| |
See important disclosures on the next page. |
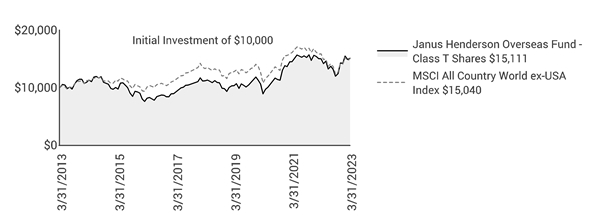
| | | | | | | | | | | | |
| | | | | | | | | | |
| | | | | | | | | | |
Average Annual Total Return - for the periods ended March 31, 2023 | | | Prospectus Expense Ratios |
| | Fiscal
Year-to-Date | One
Year | Five
Year | Ten
Year | Since
Inception* | | | Total Annual Fund
Operating Expenses‡ | Net Annual Fund
Operating Expenses‡ |
Class A Shares at NAV | | 26.29% | 0.48% | 5.98% | 4.00% | 7.64% | | | 1.22% | 1.22% |
Class A Shares at MOP | | 19.03% | -5.29% | 4.74% | 3.39% | 7.42% | | | | |
Class C Shares at NAV | | 25.81% | -0.33% | 5.11% | 3.18% | 6.88% | | | 2.13% | 2.06% |
Class C Shares at CDSC | | 24.81% | -1.32% | 5.11% | 3.18% | 6.88% | | | | |
Class D Shares | | 26.50% | 0.75% | 6.29% | 4.30% | 7.83% | | | 0.95% | 0.95% |
Class I Shares | | 26.50% | 0.80% | 6.33% | 4.34% | 7.85% | | | 0.92% | 0.92% |
Class N Shares | | 26.56% | 0.89% | 6.45% | 4.45% | 7.87% | | | 0.81% | 0.81% |
Class R Shares | | 26.07% | 0.13% | 5.64% | 3.68% | 7.27% | | | 1.56% | 1.56% |
Class S Shares | | 26.24% | 0.38% | 5.92% | 3.94% | 7.52% | | | 1.31% | 1.31% |
Class T Shares | | 26.40% | 0.65% | 6.19% | 4.21% | 7.78% | | | 1.05% | 1.05% |
MSCI All Country World ex-USA Index | | 22.13% | -5.07% | 2.47% | 4.17% | N/A** | | | | |
Morningstar Quartile - Class T Shares | | - | 1st | 1st | 3rd | 1st | | | | |
Morningstar Ranking - based on total returns for Foreign Large Blend Funds | | - | 119/751 | 41/665 | 384/533 | 13/119 | | | | |
Returns quoted are past performance and do not guarantee future results; current performance may be lower or higher. Investment returns and principal value will vary; there may be a gain or loss when shares are sold. For the most recent month-end performance call 800.668.0434 (or 800.525.3713 if you hold shares directly with Janus Henderson) or visit janushenderson.com/performance (or janushenderson.com/allfunds if you hold shares directly with Janus Henderson).
Maximum Offering Price (MOP) returns include the maximum sales charge of 5.75%. Net Asset Value (NAV) returns exclude this charge, which would have reduced returns.
CDSC returns include a 1% contingent deferred sales charge (CDSC) on Shares redeemed within 12 months of purchase. Net Asset Value (NAV) returns exclude this charge, which would have reduced returns.
Net expense ratios reflect the expense waiver, if any, contractually agreed to for at least a one-year period commencing on January 27, 2023. This contractual waiver may be terminated or modified only at the discretion of the Board of Trustees.
Janus Henderson Overseas Fund (unaudited)
Performance
This Fund has a performance-based management fee that may adjust up or down based on the Fund’s performance.
Performance may be affected by risks that include those associated with foreign and emerging markets, fixed income securities, high-yield and high-risk securities, undervalued, overlooked and smaller capitalization companies, real estate related securities including Real Estate Investment Trusts (REITs), Environmental, Social and Governance (ESG) factors, non-diversification, portfolio turnover, derivatives, short sales, initial public offerings (IPOs) and potential conflicts of interest. Each product has different risks. Please see the prospectus for more information about risks, holdings and other details.
Returns include reinvestment of all dividends and distributions and do not reflect the deduction of taxes that a shareholder would pay on Fund distributions or redemptions of Fund shares. The returns do not include adjustments in accordance with generally accepted accounting principles required at the period end for financial reporting purposes.
Class A Shares, Class C Shares, Class R Shares, and Class S Shares commenced operations on July 6, 2009. Performance shown for each class for periods prior to July 6, 2009, reflects the performance of the Fund’s Class J Shares, the initial share class (renamed Class T Shares effective February 16, 2010), calculated using the fees and expenses of each respective class, without the effect of any fee and expense limitations or waivers.
Class D Shares commenced operations on February 16, 2010. Performance shown for periods prior to February 16, 2010, reflects the performance of the Fund’s former Class J Shares, calculated using the fees and expenses in effect during the periods shown, net of any applicable fee and expense limitations or waivers.
Class I Shares commenced operations on July 6, 2009. Performance shown for periods prior to July 6, 2009, reflects the performance of the Fund’s former Class J Shares, calculated using the fees and expenses of Class J Shares, net of any applicable fee and expense limitations or waivers.
Class N Shares commenced operations on May 31, 2012. Performance shown for periods prior to May 31, 2012, reflects the performance of the Fund's Class T Shares, calculated using the fees and expenses of Class T Shares, net of any applicable fee and expense limitations or waivers.
If each share class of the Fund had been available during periods prior to its commencement, the performance shown may have been different. The performance shown for periods following the Fund’s commencement of each share class reflects the fees and expenses of each respective share class, net of any applicable fee and expense limitations or waivers. Please refer to the Fund’s prospectuses for further details concerning historical performance.
Ranking is for the share class shown only; other classes may have different performance characteristics. When an expense waiver is in effect, it may have a material effect on the total return, and therefore the ranking for the period.
© 2023 Morningstar, Inc. All Rights Reserved.
There is no assurance that the investment process will consistently lead to successful investing.
See Notes to Schedule of Investments and Other Information for index definitions.
Index performance does not reflect the expenses of managing a portfolio as an index is unmanaged and not available for direct investment.
See “Useful Information About Your Fund Report.”
*The Fund’s inception date – May 2, 1994
**Since inception index return is not available for indices created subsequent to fund inception.
‡ As stated in the prospectus. See Financial Highlights for actual expense ratios during the reporting period.
Janus Henderson Overseas Fund (unaudited)
Expense Examples
As a shareholder of the Fund, you incur two types of costs: (1) transaction costs, such as sales charges (loads) on purchase payments (applicable to Class A Shares only); and (2) ongoing costs, including management fees; 12b-1 distribution and shareholder servicing fees; transfer agent fees and expenses payable pursuant to the Transfer Agency Agreement; and other Fund expenses. This example is intended to help you understand your ongoing costs (in dollars) of investing in the Fund and to compare these costs with the ongoing costs of investing in other mutual funds. To do so, compare this 5% hypothetical example with the 5% hypothetical examples that appear in the shareholder reports of the other funds. The example is based upon an investment of $1,000 invested at the beginning of the period and held for the six-months indicated, unless noted otherwise in the table and footnotes below.
Actual Expenses
The information in the table under the heading “Actual” provides information about actual account values and actual expenses. You may use the information in these columns, together with the amount you invested, to estimate the expenses that you paid over the period. Simply divide your account value by $1,000 (for example, an $8,600 account value divided by $1,000 = 8.6), then multiply the result by the number in the appropriate column for your share class under the heading entitled “Expenses Paid During Period” to estimate the expenses you paid on your account during the period.
Hypothetical Example for Comparison Purposes
The information in the table under the heading “Hypothetical (5% return before expenses)” provides information about hypothetical account values and hypothetical expenses based upon the Fund’s actual expense ratio and an assumed rate of return of 5% per year before expenses, which is not the Fund’s actual return. The hypothetical account values and expenses may not be used to estimate the actual ending account balance or expenses you paid for the period. You may use this information to compare the ongoing costs of investing in the Fund and other funds. To do so, compare this 5% hypothetical example with the 5% hypothetical examples that appear in the shareholder reports of the other funds. Additionally, for an analysis of the fees associated with an investment in any share class or other similar funds, please visit www.finra.org/fundanalyzer.
Please note that the expenses shown in the table are meant to highlight your ongoing costs only and do not reflect any transaction costs. These fees are fully described in the Fund’s prospectuses. Therefore, the hypothetical examples are useful in comparing ongoing costs only, and will not help you determine the relative total costs of owning different funds. In addition, if these transaction costs were included, your costs would have been higher.
| | | | | | | | | | | |
| | | | | | | | |
| | | Actual | | Hypothetical
(5% return before expenses) | |
| Beginning
Account
Value
(10/1/22) | Ending
Account
Value
(3/31/23) | Expenses
Paid During
Period
(10/1/22 - 3/31/23)† | | Beginning
Account
Value
(10/1/22) | Ending
Account
Value
(3/31/23) | Expenses
Paid During
Period
(10/1/22 - 3/31/23)† | Net Annualized
Expense Ratio
(10/1/22 - 3/31/23) |
Class A Shares | $1,000.00 | $1,262.90 | $7.11 | | $1,000.00 | $1,018.65 | $6.34 | 1.26% |
Class C Shares | $1,000.00 | $1,258.10 | $11.26 | | $1,000.00 | $1,014.96 | $10.05 | 2.00% |
Class D Shares | $1,000.00 | $1,265.00 | $5.36 | | $1,000.00 | $1,020.19 | $4.78 | 0.95% |
Class I Shares | $1,000.00 | $1,265.00 | $5.14 | | $1,000.00 | $1,020.39 | $4.58 | 0.91% |
Class N Shares | $1,000.00 | $1,265.60 | $4.58 | | $1,000.00 | $1,020.89 | $4.08 | 0.81% |
Class R Shares | $1,000.00 | $1,260.70 | $8.79 | | $1,000.00 | $1,017.15 | $7.85 | 1.56% |
Class S Shares | $1,000.00 | $1,262.40 | $7.33 | | $1,000.00 | $1,018.45 | $6.54 | 1.30% |
Class T Shares | $1,000.00 | $1,264.00 | $5.87 | | $1,000.00 | $1,019.75 | $5.24 | 1.04% |
† | Expenses Paid During Period are equal to the Net Annualized Expense Ratio multiplied by the average account value over the period, multiplied by 182/365 (to reflect the one-half year period). Expenses in the examples include the effect of applicable fee waivers and/or expense reimbursements, if any. Had such waivers and/or reimbursements not been in effect, your expenses would have been higher. Please refer to the Notes to Financial Statements or the Fund’s prospectuses for more information regarding waivers and/or reimbursements. |
Janus Henderson Overseas Fund
Schedule of Investments (Unaudited)
March 31, 2023
| | | | | | | | |
Shares
| | | Value | |
Common Stocks– 95.1% | | | |
Aerospace & Defense – 4.2% | | | |
| | Airbus SE | | 193,173 | | | $25,876,255 | |
| | BAE Systems PLC | | 6,698,669 | | | 81,194,592 | |
| | | 107,070,847 | |
Banks – 11.7% | | | |
| | BNP Paribas SA | | 1,648,768 | | | 98,603,182 | |
| | Erste Group Bank AG | | 2,203,039 | | | 72,862,139 | |
| | Natwest Group PLC | | 21,606,263 | | | 70,584,263 | |
| | Permanent TSB Group Holdings PLC* | | 7,942,204 | | | 19,898,792 | |
| | UniCredit SpA | | 1,958,621 | | | 37,093,775 | |
| | | 299,042,151 | |
Beverages – 6.3% | | | |
| | Diageo PLC | | 1,707,686 | | | 76,202,084 | |
| | Heineken NV | | 793,062 | | | 85,368,943 | |
| | | 161,571,027 | |
Biotechnology – 1.7% | | | |
| | Argenx SE (ADR)* | | 72,733 | | | 27,098,861 | |
| | Ascendis Pharma A/S (ADR)* | | 155,150 | | | 16,635,183 | |
| | | 43,734,044 | |
Commercial Services & Supplies – 1.9% | | | |
| | Secom Co Ltd | | 794,300 | | | 48,895,040 | |
Diversified Telecommunication Services – 3.5% | | | |
| | Deutsche Telekom AG | | 3,680,104 | | | 89,127,128 | |
Electronic Equipment, Instruments & Components – 3.9% | | | |
| | Hexagon AB - Class B | | 2,258,153 | | | 25,994,735 | |
| | Keyence Corp | | 149,600 | | | 73,352,166 | |
| | | 99,346,901 | |
Entertainment – 2.6% | | | |
| | Liberty Media Corp-Liberty Formula One* | | 901,057 | | | 67,426,095 | |
Health Care Equipment & Supplies – 1.6% | | | |
| | Hoya Corp | | 372,300 | | | 41,174,772 | |
Hotels, Restaurants & Leisure – 6.6% | | | |
| | Entain PLC | | 4,714,439 | | | 73,358,529 | |
| | Yum China Holdings Inc | | 1,528,400 | | | 95,745,388 | |
| | | 169,103,917 | |
Insurance – 7.6% | | | |
| | AIA Group Ltd | | 7,296,600 | | | 76,670,109 | |
| | Beazley PLC | | 4,434,892 | | | 32,693,758 | |
| | Dai-ichi Life Holdings Inc | | 4,621,300 | | | 84,920,144 | |
| | | 194,284,011 | |
Metals & Mining – 4.4% | | | |
| | Freeport-McMoRan Inc | | 723,125 | | | 29,583,044 | |
| | Teck Resources Ltd | | 2,291,449 | | | 83,684,606 | |
| | | 113,267,650 | |
Multiline Retail – 2.9% | | | |
| | JD.Com Inc - Class A | | 3,416,461 | | | 74,879,365 | |
Oil, Gas & Consumable Fuels – 5.6% | | | |
| | Canadian Natural Resources Ltd | | 1,457,976 | | | 80,698,972 | |
| | Gaztransport Et Technigaz SA | | 48,601 | | | 4,979,067 | |
| | TotalEnergies SE | | 990,734 | | | 58,450,587 | |
| | | 144,128,626 | |
Personal Products – 3.0% | | | |
| | Unilever PLC | | 1,510,651 | | | 78,250,615 | |
Pharmaceuticals – 9.4% | | | |
| | AstraZeneca PLC | | 525,736 | | | 72,960,134 | |
| | Bayer AG | | 549,984 | | | 35,028,533 | |
| | Novartis AG | | 622,649 | | | 57,177,839 | |
| | Sanofi | | 703,087 | | | 76,560,540 | |
| | | 241,727,046 | |
| | |
See Notes to Schedule of Investments and Other Information and Notes to Financial Statements. |
| |
6 | MARCH 31, 2023 |
Janus Henderson Overseas Fund
Schedule of Investments (Unaudited)
March 31, 2023
| | | | | | | | |
Shares
| | | Value | |
Common Stocks– (continued) | | | |
Road & Rail – 2.4% | | | |
| | Central Japan Railway Co | | 312,900 | | | $37,361,426 | |
| | Full Truck Alliance Co (ADR)* | | 3,209,126 | | | 24,421,449 | |
| | | 61,782,875 | |
Semiconductor & Semiconductor Equipment – 8.1% | | | |
| | ASML Holding NV | | 121,498 | | | 83,011,223 | |
| | SK Hynix Inc | | 404,136 | | | 27,876,821 | |
| | Taiwan Semiconductor Manufacturing Co Ltd | | 5,457,000 | | | 96,683,449 | |
| | | 207,571,493 | |
Textiles, Apparel & Luxury Goods – 5.3% | | | |
| | LVMH Moet Hennessy Louis Vuitton SE | | 62,824 | | | 57,570,173 | |
| | Samsonite International SA (144A)* | | 25,904,700 | | | 79,621,714 | |
| | | 137,191,887 | |
Trading Companies & Distributors – 2.4% | | | |
| | Ferguson PLC | | 466,883 | | | 61,602,122 | |
Total Common Stocks (cost $2,075,141,914) | | 2,441,177,612 | |
Preferred Stocks– 0.8% | | | |
Automobiles – 0.8% | | | |
| | Dr Ing hc F Porsche AG((cost $12,506,554) | | 155,721 | | | 19,928,024 | |
Investment Companies– 4.2% | | | |
Money Markets – 4.2% | | | |
| | Janus Henderson Cash Liquidity Fund LLC, 4.7988%ºº,£((cost $106,667,633) | | 106,656,055 | | | 106,677,386 | |
Total Investments (total cost $2,194,316,101) – 100.1% | | 2,567,783,022 | |
Liabilities, net of Cash, Receivables and Other Assets – (0.1)% | | (1,756,859) | |
Net Assets – 100% | | $2,566,026,163 | |
| | | | | | |
Summary of Investments by Country - (Long Positions) (unaudited) |
| |
| | | | | % of | |
| | | | | Investment | |
Country | | Value | | Securities | |
United Kingdom | | $485,243,975 | | 18.9 | % |
France | | 322,039,804 | | 12.5 | |
Japan | | 285,703,548 | | 11.1 | |
United States | | 265,288,647 | | 10.3 | |
China | | 195,046,202 | | 7.6 | |
Netherlands | | 168,380,166 | | 6.6 | |
Canada | | 164,383,578 | | 6.4 | |
Hong Kong | | 156,291,823 | | 6.1 | |
Germany | | 144,083,685 | | 5.6 | |
Taiwan | | 96,683,449 | | 3.8 | |
Austria | | 72,862,139 | | 2.8 | |
Switzerland | | 57,177,839 | | 2.2 | |
Italy | | 37,093,775 | | 1.4 | |
South Korea | | 27,876,821 | | 1.1 | |
Belgium | | 27,098,861 | | 1.1 | |
Sweden | | 25,994,735 | | 1.0 | |
Ireland | | 19,898,792 | | 0.8 | |
Denmark | | 16,635,183 | | 0.7 | |
| | | | | | |
| | | | | | |
Total | | $2,567,783,022 | | 100.0 | % |
| | |
See Notes to Schedule of Investments and Other Information and Notes to Financial Statements. |
| |
Janus Investment Fund | 7 |
Janus Henderson Overseas Fund
Schedule of Investments (Unaudited)
March 31, 2023
Schedules of Affiliated Investments – (% of Net Assets)
| | | | | | | | | | | |
| | Dividend Income | Realized Gain/(Loss) | Change in Unrealized Appreciation/ Depreciation | Value at 3/31/23 |
Investment Companies - 4.2% |
Money Markets - 4.2% | |
| | Janus Henderson Cash Liquidity Fund LLC, 4.7988%ºº | $ | 2,099,636 | $ | 2,725 | $ | 7,272 | $ | 106,677,386 |
Investments Purchased with Cash Collateral from Securities Lending - N/A |
Investment Companies - N/A | |
| | Janus Henderson Cash Collateral Fund LLC, 4.8170%ºº | | 540,181∆ | | - | | - | | - |
Total Affiliated Investments - 4.2% | $ | 2,639,817 | $ | 2,725 | $ | 7,272 | $ | 106,677,386 |
| | | | | | | | | | | |
| | Value at 9/30/22 | Purchases | Sales Proceeds | Value at 3/31/23 |
Investment Companies - 4.2% |
Money Markets - 4.2% | |
| | Janus Henderson Cash Liquidity Fund LLC, 4.7988%ºº | | 75,216,629 | | 415,777,837 | | (384,327,077) | | 106,677,386 |
Investments Purchased with Cash Collateral from Securities Lending - N/A |
Investment Companies - N/A | |
| | Janus Henderson Cash Collateral Fund LLC, 4.8170%ºº | | 41,118,585 | | 84,115,236 | | (125,233,821) | | - |
| | |
See Notes to Schedule of Investments and Other Information and Notes to Financial Statements. |
| |
8 | MARCH 31, 2023 |
Janus Henderson Overseas Fund
Notes to Schedule of Investments and Other Information (Unaudited)
| | |
MSCI All Country World ex-USA IndexSM | MSCI All Country World ex-USA IndexSM reflects the equity market performance of global developed and emerging markets, excluding the U.S. |
| | |
| | |
ADR | American Depositary Receipt |
LLC | Limited Liability Company |
PLC | Public Limited Company |
| | |
144A | Securities sold under Rule 144A of the Securities Act of 1933, as amended, are subject to legal and/or contractual restrictions on resale and may not be publicly sold without registration under the 1933 Act. Unless otherwise noted, these securities have been determined to be liquid under guidelines established by the Board of Trustees. The total value of 144A securities as of the period ended March 31, 2023 is $79,621,714, which represents 3.1% of net assets. |
| | |
* | Non-income producing security. |
| | |
ºº | Rate shown is the 7-day yield as of March 31, 2023. |
| | |
£ | The Fund may invest in certain securities that are considered affiliated companies. As defined by the Investment Company Act of 1940, as amended, an affiliated company is one in which the Fund owns 5% or more of the outstanding voting securities, or a company which is under common ownership or control. |
| | |
∆ | Net of income paid to the securities lending agent and rebates paid to the borrowing counterparties. |
| | | | | | | | | | | | | |
The following is a summary of the inputs that were used to value the Fund’s investments in securities and other financial instruments as of March 31, 2023. See Notes to Financial Statements for more information. |
| |
Valuation Inputs Summary |
| | | | | | | |
| | | | | Level 2 - | | Level 3 - |
| | | Level 1 - | | Other Significant | | Significant |
| | | Quoted Prices | | Observable Inputs | | Unobservable Inputs |
| | | | | | | |
Assets | | | | | | |
Investments In Securities: | | | | | | |
Common Stocks | | | | | | |
Biotechnology | $ | 43,734,044 | $ | - | $ | - |
Entertainment | | 67,426,095 | | - | | - |
Metals & Mining | | 113,267,650 | | - | | - |
Oil, Gas & Consumable Fuels | | 80,698,972 | | 63,429,654 | | - |
Road & Rail | | 24,421,449 | | 37,361,426 | | - |
All Other | | - | | 2,010,838,322 | | - |
Preferred Stocks | | - | | 19,928,024 | | - |
Investment Companies | | - | | 106,677,386 | | - |
Total Assets | $ | 329,548,210 | $ | 2,238,234,812 | $ | - |
| | | | | | | |
Janus Henderson Overseas Fund
Statement of Assets and Liabilities (Unaudited)
March 31, 2023
| |
See footnotes at the end of the Statement. |
| | | | | | | |
| | | | | | |
Assets: | | | | |
| Unaffiliated investments, at value (cost $2,087,648,468) | | $ | 2,461,105,636 | |
| Affiliated investments, at value (cost $106,667,633) | | | 106,677,386 | |
| Trustees' deferred compensation | | | 63,448 | |
| Receivables: | | | | |
| | Dividends | | | 11,001,592 | |
| | Fund shares sold | | | 5,533,171 | |
| | Investments sold | | | 3,000,927 | |
| | Foreign tax reclaims | | | 1,875,379 | |
| | Dividends from affiliates | | | 452,659 | |
| Other assets | | | 92,390 | |
Total Assets | | | 2,589,802,588 | |
Liabilities: | | | | |
| Due to custodian | | | 138 | |
| Foreign cash due to custodian | | | 14,171 | |
| Payables: | | | — | |
| | Investments purchased | | | 17,392,938 | |
| | Fund shares repurchased | | | 4,074,086 | |
| | Advisory fees | | | 1,627,483 | |
| | Transfer agent fees and expenses | | | 338,805 | |
| | Trustees' deferred compensation fees | | | 63,448 | |
| | 12b-1 Distribution and shareholder servicing fees | | | 45,909 | |
| | Professional fees | | | 42,734 | |
| | Custodian fees | | | 26,772 | |
| | Trustees' fees and expenses | | | 13,127 | |
| | Affiliated fund administration fees payable | | | 5,567 | |
| | Accrued expenses and other payables | | | 131,247 | |
Total Liabilities | | | 23,776,425 | |
Net Assets | | $ | 2,566,026,163 | |
| | |
See Notes to Financial Statements. |
| |
10 | MARCH 31, 2023 |
Janus Henderson Overseas Fund
Statement of Assets and Liabilities (Unaudited)
March 31, 2023
| | | | | | | |
| | | | | | |
| | | | | | | |
Net Assets Consist of: | | | | |
| Capital (par value and paid-in surplus) | | $ | 3,705,453,846 | |
| Total distributable earnings (loss) | | | (1,139,427,683) | |
Total Net Assets | | $ | 2,566,026,163 | |
Net Assets - Class A Shares | | $ | 25,790,491 | |
| Shares Outstanding, $0.01 Par Value (unlimited shares authorized) | | | 607,034 | |
Net Asset Value Per Share(1) | | $ | 42.49 | |
Maximum Offering Price Per Share(2) | | $ | 45.08 | |
Net Assets - Class C Shares | | $ | 3,528,949 | |
| Shares Outstanding, $0.01 Par Value (unlimited shares authorized) | | | 84,595 | |
Net Asset Value Per Share(1) | | $ | 41.72 | |
Net Assets - Class D Shares | | $ | 651,380,690 | |
| Shares Outstanding, $0.01 Par Value (unlimited shares authorized) | | | 15,491,737 | |
Net Asset Value Per Share | | $ | 42.05 | |
Net Assets - Class I Shares | | $ | 1,064,248,873 | |
| Shares Outstanding, $0.01 Par Value (unlimited shares authorized) | | | 25,242,350 | |
Net Asset Value Per Share | | $ | 42.16 | |
Net Assets - Class N Shares | | $ | 151,269,470 | |
| Shares Outstanding, $0.01 Par Value (unlimited shares authorized) | | | 3,606,170 | |
Net Asset Value Per Share | | $ | 41.95 | |
Net Assets - Class R Shares | | $ | 22,620,487 | |
| Shares Outstanding, $0.01 Par Value (unlimited shares authorized) | | | 540,988 | |
Net Asset Value Per Share | | $ | 41.81 | |
Net Assets - Class S Shares | | $ | 122,319,856 | |
| Shares Outstanding, $0.01 Par Value (unlimited shares authorized) | | | 2,903,852 | |
Net Asset Value Per Share | | $ | 42.12 | |
Net Assets - Class T Shares | | $ | 524,867,347 | |
| Shares Outstanding, $0.01 Par Value (unlimited shares authorized) | | | 12,463,774 | |
Net Asset Value Per Share | | $ | 42.11 | |
| |
(1) Redemption price per share may be reduced for any applicable contingent deferred sales charge. (2) Maximum offering price is computed at 100/94.25 of net asset value. |
| | |
See Notes to Financial Statements. |
| |
Janus Investment Fund | 11 |
Janus Henderson Overseas Fund
Statement of Operations (Unaudited)
For the period ended March 31, 2023
| | | | | | |
| | | | | |
Investment Income: | | | |
| Dividends | $ | 24,156,224 | |
| Dividends from affiliates | | 2,099,636 | |
| Affiliated securities lending income, net | | 540,181 | |
| Unaffiliated securities lending income, net | | 91,800 | |
| Other income | | 216,410 | |
| Foreign tax withheld | | (2,541,525) | |
Total Investment Income | | 24,562,726 | |
Expenses: | | | |
| Advisory fees | | 8,018,532 | |
| 12b-1 Distribution and shareholder servicing fees: | | | |
| | Class A Shares | | 28,550 | |
| | Class C Shares | | 14,913 | |
| | Class R Shares | | 53,089 | |
| | Class S Shares | | 146,184 | |
| Transfer agent administrative fees and expenses: | | | |
| | Class D Shares | | 363,459 | |
| | Class R Shares | | 26,655 | |
| | Class S Shares | | 146,224 | |
| | Class T Shares | | 594,563 | |
| Transfer agent networking and omnibus fees: | | | |
| | Class A Shares | | 21,290 | |
| | Class C Shares | | 1,355 | |
| | Class I Shares | | 393,194 | |
| Other transfer agent fees and expenses: | | | |
| | Class A Shares | | 917 | |
| | Class C Shares | | 86 | |
| | Class D Shares | | 58,927 | |
| | Class I Shares | | 22,587 | |
| | Class N Shares | | 2,691 | |
| | Class R Shares | | 225 | |
| | Class S Shares | | 911 | |
| | Class T Shares | | 3,083 | |
| Registration fees | | 149,077 | |
| Custodian fees | | 98,111 | |
| Shareholder reports expense | | 90,976 | |
| Professional fees | | 44,359 | |
| Trustees’ fees and expenses | | 30,635 | |
| Affiliated fund administration fees | | 26,745 | |
| Other expenses | | 95,435 | |
Total Expenses | | 10,432,773 | |
Less: Excess Expense Reimbursement and Waivers | | (27,010) | |
Net Expenses | | 10,405,763 | |
Net Investment Income/(Loss) | | 14,156,963 | |
| | | | | |
| | |
See Notes to Financial Statements. |
| |
12 | MARCH 31, 2023 |
Janus Henderson Overseas Fund
Statement of Operations (Unaudited)
For the period ended March 31, 2023
| | | | | | |
| | | | | |
Net Realized Gain/(Loss) on Investments: | | | |
| Investments and foreign currency transactions (net of foreign taxes of $1,719) | $ | (1,759,092) | |
| Investments in affiliates | | 2,725 | |
Total Net Realized Gain/(Loss) on Investments | | (1,756,367) | |
Change in Unrealized Net Appreciation/Depreciation: | | | |
| Investments, foreign currency translations and Trustees’ deferred compensation | | 442,667,685 | |
| Investments in affiliates | | 7,272 | |
Total Change in Unrealized Net Appreciation/Depreciation | | 442,674,957 | |
Net Increase/(Decrease) in Net Assets Resulting from Operations | $ | 455,075,553 | |
| | | | | |
| | |
See Notes to Financial Statements. |
| |
Janus Investment Fund | 13 |
Janus Henderson Overseas Fund
Statements of Changes in Net Assets
| | | | | | | | | |
| | | | | | | | |
| | | Period ended
March 31, 2023 (unaudited) | | Year ended
September 30, 2022 | |
| | | | | | | | | |
Operations: | | | | | | |
| Net investment income/(loss) | $ | 14,156,963 | | $ | 32,969,684 | |
| Net realized gain/(loss) on investments | | (1,756,367) | | | (4,562,441) | |
| Change in unrealized net appreciation/depreciation | | 442,674,957 | | | (468,597,266) | |
Net Increase/(Decrease) in Net Assets Resulting from Operations | | 455,075,553 | | | (440,190,023) | |
Dividends and Distributions to Shareholders: | | | | | | |
| | Class A Shares | | (295,705) | | | (163,941) | |
| | Class C Shares | | (26,327) | | | — | |
| | Class D Shares | | (9,693,682) | | | (7,514,426) | |
| | Class I Shares | | (11,776,581) | | | (4,194,570) | |
| | Class N Shares | | (2,006,853) | | | (764,172) | |
| | Class R Shares | | (200,146) | | | (103,612) | |
| | Class S Shares | | (1,409,535) | | | (907,459) | |
| | Class T Shares | | (6,892,452) | | | (5,080,049) | |
Net Decrease from Dividends and Distributions to Shareholders | | (32,301,281) | | | (18,728,229) | |
Capital Share Transactions: | | | | | | |
| | Class A Shares | | 2,136,353 | | | 2,623,775 | |
| | Class C Shares | | 987,112 | | | 1,110,931 | |
| | Class D Shares | | (5,886,931) | | | (43,685,697) | |
| | Class I Shares | | 390,705,115 | | | 348,539,981 | |
| | Class N Shares | | 60,237,735 | | | 28,719,088 | |
| | Class R Shares | | 122,510 | | | (931,155) | |
| | Class S Shares | | (3,718,009) | | | 3,222 | |
| | Class T Shares | | 27,380,272 | | | (17,862,031) | |
Net Increase/(Decrease) from Capital Share Transactions | | 471,964,157 | | | 318,518,114 | |
Net Increase/(Decrease) in Net Assets | | 894,738,429 | | | (140,400,138) | |
Net Assets: | | | | | | |
| Beginning of period | | 1,671,287,734 | | | 1,811,687,872 | |
| End of period | $ | 2,566,026,163 | | $ | 1,671,287,734 | |
| | | | | | | | |
| | |
See Notes to Financial Statements. |
| |
14 | MARCH 31, 2023 |
Janus Henderson Overseas Fund
Financial Highlights
| | | | | | | | | | | | | | | | | | | | | | |
Class A Shares | | | | | | | | | | | | | | | | | | |
For a share outstanding during the period ended March 31, 2023 (unaudited) and the year ended September 30 | 2023 | | | 2022 | | | 2021 | | | 2020 | | | 2019 | | | 2018 | |
| Net Asset Value, Beginning of Period | | $34.10 | | | $43.91 | | | $33.08 | | | $30.94 | | | $32.42 | | | $32.21 | |
| Income/(Loss) from Investment Operations: | | | | | | | | | | | | | | | | | | |
| | Net investment income/(loss)(1) | | 0.20 | | | 0.63 | | | 0.43 | | | 0.21 | | | 0.53 | | | 0.37 | |
| | Net realized and unrealized gain/(loss) | | 8.73 | | | (10.09) | | | 10.64 | | | 2.51 | | | (1.77) | | | 0.34 | |
| Total from Investment Operations | | 8.93 | | | (9.46) | | | 11.07 | | | 2.72 | | | (1.24) | | | 0.71 | |
| Less Dividends and Distributions: | | | | | | | | | | | | | | | | | | |
| | Dividends (from net investment income) | | (0.54) | | | (0.35) | | | (0.24) | | | (0.58) | | | (0.24) | | | (0.50) | |
| Total Dividends and Distributions | | (0.54) | | | (0.35) | | | (0.24) | | | (0.58) | | | (0.24) | | | (0.50) | |
| Net Asset Value, End of Period | | $42.49 | | | $34.10 | | | $43.91 | | | $33.08 | | | $30.94 | | | $32.42 | |
| Total Return* | | 26.29% | | | (21.71)% | | | 33.54% | | | 8.74% | | | (3.74)% | | | 2.18% | |
| Net Assets, End of Period (in thousands) | | $25,790 | | | $19,008 | | | $21,130 | | | $15,231 | | | $17,470 | | | $16,739 | |
| Average Net Assets for the Period (in thousands) | | $22,800 | | | $19,976 | | | $19,864 | | | $15,904 | | | $17,537 | | | $18,900 | |
| Ratios to Average Net Assets**: | | | | | | | | | | | | | | | | | | |
| | Ratio of Gross Expenses | | 1.26% | | | 1.22% | | | 1.22% | | | 1.17% | | | 1.11% | | | 1.01% | |
| | Ratio of Net Expenses (After Waivers and Expense Offsets) | | 1.26% | | | 1.22% | | | 1.22% | | | 1.17% | | | 1.10% | | | 0.99% | |
| | Ratio of Net Investment Income/(Loss) | | 1.01% | | | 1.53% | | | 1.03% | | | 0.66% | | | 1.78% | | | 1.12% | |
| Portfolio Turnover Rate | | 15% | | | 32% | | | 27% | | | 18% | | | 22% | | | 23% | |
| | | | | | | | | | | | | | | | | | | | | | |
| |
* Total return includes adjustments in accordance with generally accepted accounting principles required at the year or period end and are not annualized for periods of less than one full year. ** Annualized for periods of less than one full year. (1) Per share amounts are calculated based on average shares outstanding during the year or period. |
| | |
See Notes to Financial Statements. |
| |
Janus Investment Fund | 15 |
Janus Henderson Overseas Fund
Financial Highlights
| | | | | | | | | | | | | | | | | | | | | | |
Class C Shares | | | | | | | | | | | | | | | | | | |
For a share outstanding during the period ended March 31, 2023 (unaudited) and the year ended September 30 | 2023 | | | 2022 | | | 2021 | | | 2020 | | | 2019 | | | 2018 | |
| Net Asset Value, Beginning of Period | | $33.48 | | | $43.14 | | | $32.58 | | | $30.34 | | | $31.76 | | | $31.52 | |
| Income/(Loss) from Investment Operations: | | | | | | | | | | | | | | | | | | |
| | Net investment income/(loss)(1) | | 0.05 | | | 0.36 | | | (0.02) | | | (0.06) | | | 0.28 | | | 0.10 | |
| | Net realized and unrealized gain/(loss) | | 8.58 | | | (10.02) | | | 10.58 | | | 2.43 | | | (1.70) | | | 0.35 | |
| Total from Investment Operations | | 8.63 | | | (9.66) | | | 10.56 | | | 2.37 | | | (1.42) | | | 0.45 | |
| Less Dividends and Distributions: | | | | | | | | | | | | | | | | | | |
| | Dividends (from net investment income) | | (0.39) | | | — | | | — | | | (0.13) | | | — | | | (0.21) | |
| Total Dividends and Distributions | | (0.39) | | | — | | | — | | | (0.13) | | | — | | | (0.21) | |
| Net Asset Value, End of Period | | $41.72 | | | $33.48 | | | $43.14 | | | $32.58 | | | $30.34 | | | $31.76 | |
| Total Return* | | 25.84% | | | (22.39)% | | | 32.41% | | | 7.79% | | | (4.47)% | | | 1.42% | |
| Net Assets, End of Period (in thousands) | | $3,529 | | | $1,941 | | | $1,295 | | | $2,665 | | | $3,693 | | | $10,244 | |
| Average Net Assets for the Period (in thousands) | | $2,974 | | | $1,631 | | | $1,910 | | | $3,305 | | | $5,809 | | | $13,589 | |
| Ratios to Average Net Assets**: | | | | | | | | | | | | | | | | | | |
| | Ratio of Gross Expenses | | 2.00% | | | 2.13% | | | 2.06% | | | 2.02% | | | 1.90% | | | 1.72% | |
| | Ratio of Net Expenses (After Waivers and Expense Offsets) | | 2.00% | | | 2.09% | | | 2.06% | | | 1.99% | | | 1.87% | | | 1.71% | |
| | Ratio of Net Investment Income/(Loss) | | 0.25% | | | 0.90% | | | (0.04)% | | | (0.19)% | | | 0.95% | | | 0.31% | |
| Portfolio Turnover Rate | | 15% | | | 32% | | | 27% | | | 18% | | | 22% | | | 23% | |
| | | | | | | | | | | | | | | | | | | | | | |
| |
* Total return includes adjustments in accordance with generally accepted accounting principles required at the year or period end and are not annualized for periods of less than one full year. ** Annualized for periods of less than one full year. (1) Per share amounts are calculated based on average shares outstanding during the year or period. |
| | |
See Notes to Financial Statements. |
| |
16 | MARCH 31, 2023 |
Janus Henderson Overseas Fund
Financial Highlights
| | | | | | | | | | | | | | | | | | | | | | |
Class D Shares | | | | | | | | | | | | | | | | | | |
For a share outstanding during the period ended March 31, 2023 (unaudited) and the year ended September 30 | 2023 | | | 2022 | | | 2021 | | | 2020 | | | 2019 | | | 2018 | |
| Net Asset Value, Beginning of Period | | $33.78 | | | $43.49 | | | $32.77 | | | $30.66 | | | $32.12 | | | $31.92 | |
| Income/(Loss) from Investment Operations: | | | | | | | | | | | | | | | | | | |
| | Net investment income/(loss)(1) | | 0.24 | | | 0.73 | | | 0.53 | | | 0.30 | | | 0.63 | | | 0.47 | |
| | Net realized and unrealized gain/(loss) | | 8.66 | | | (9.98) | | | 10.54 | | | 2.50 | | | (1.78) | | | 0.34 | |
| Total from Investment Operations | | 8.90 | | | (9.25) | | | 11.07 | | | 2.80 | | | (1.15) | | | 0.81 | |
| Less Dividends and Distributions: | | | | | | | | | | | | | | | | | | |
| | Dividends (from net investment income) | | (0.63) | | | (0.46) | | | (0.35) | | | (0.69) | | | (0.31) | | | (0.61) | |
| Total Dividends and Distributions | | (0.63) | | | (0.46) | | | (0.35) | | | (0.69) | | | (0.31) | | | (0.61) | |
| Net Asset Value, End of Period | | $42.05 | | | $33.78 | | | $43.49 | | | $32.77 | | | $30.66 | | | $32.12 | |
| Total Return* | | 26.46% | | | (21.48)% | | | 33.89% | | | 9.06% | | | (3.46)% | | | 2.52% | |
| Net Assets, End of Period (in thousands) | | $651,381 | | | $528,221 | | | $726,916 | | | $572,590 | | | $587,147 | | | $687,846 | |
| Average Net Assets for the Period (in thousands) | | $616,528 | | | $668,081 | | | $704,107 | | | $570,593 | | | $605,377 | | | $738,059 | |
| Ratios to Average Net Assets**: | | | | | | | | | | | | | | | | | | |
| | Ratio of Gross Expenses | | 0.95% | | | 0.95% | | | 0.95% | | | 0.89% | | | 0.79% | | | 0.68% | |
| | Ratio of Net Expenses (After Waivers and Expense Offsets) | | 0.95% | | | 0.95% | | | 0.95% | | | 0.89% | | | 0.79% | | | 0.68% | |
| | Ratio of Net Investment Income/(Loss) | | 1.24% | | | 1.77% | | | 1.28% | | | 0.98% | | | 2.11% | | | 1.42% | |
| Portfolio Turnover Rate | | 15% | | | 32% | | | 27% | | | 18% | | | 22% | | | 23% | |
| | | | | | | | | | | | | | | | | | | | | | |
| |
* Total return includes adjustments in accordance with generally accepted accounting principles required at the year or period end and are not annualized for periods of less than one full year. ** Annualized for periods of less than one full year. (1) Per share amounts are calculated based on average shares outstanding during the year or period. |
| | |
See Notes to Financial Statements. |
| |
Janus Investment Fund | 17 |
Janus Henderson Overseas Fund
Financial Highlights
| | | | | | | | | | | | | | | | | | | | | | |
Class I Shares | | | | | | | | | | | | | | | | | | |
For a share outstanding during the period ended March 31, 2023 (unaudited) and the year ended September 30 | 2023 | | | 2022 | | | 2021 | | | 2020 | | | 2019 | | | 2018 | |
| Net Asset Value, Beginning of Period | | $33.89 | | | $43.68 | | | $32.91 | | | $30.79 | | | $32.25 | | | $32.05 | |
| Income/(Loss) from Investment Operations: | | | | | | | | | | | | | | | | | | |
| | Net investment income/(loss)(1) | | 0.31 | | | 0.83 | | | 0.72 | | | 0.32 | | | 0.64 | | | 0.48 | |
| | Net realized and unrealized gain/(loss) | | 8.63 | | | (10.11) | | | 10.41 | | | 2.50 | | | (1.77) | | | 0.34 | |
| Total from Investment Operations | | 8.94 | | | (9.28) | | | 11.13 | | | 2.82 | | | (1.13) | | | 0.82 | |
| Less Dividends and Distributions: | | | | | | | | | | | | | | | | | | |
| | Dividends (from net investment income) | | (0.67) | | | (0.51) | | | (0.36) | | | (0.70) | | | (0.33) | | | (0.62) | |
| Total Dividends and Distributions | | (0.67) | | | (0.51) | | | (0.36) | | | (0.70) | | | (0.33) | | | (0.62) | |
| Net Asset Value, End of Period | | $42.16 | | | $33.89 | | | $43.68 | | | $32.91 | | | $30.79 | | | $32.25 | |
| Total Return* | | 26.50% | | | (21.46)% | | | 33.96% | | | 9.10% | | | (3.40)% | | | 2.54% | |
| Net Assets, End of Period (in thousands) | | $1,064,249 | | | $532,808 | | | $312,685 | | | $44,806 | | | $42,606 | | | $52,204 | |
| Average Net Assets for the Period (in thousands) | | $764,139 | | | $434,124 | | | $90,200 | | | $43,005 | | | $45,239 | | | $58,918 | |
| Ratios to Average Net Assets**: | | | | | | | | | | | | | | | | | | |
| | Ratio of Gross Expenses | | 0.91% | | | 0.92% | | | 0.90% | | | 0.84% | | | 0.74% | | | 0.64% | |
| | Ratio of Net Expenses (After Waivers and Expense Offsets) | | 0.91% | | | 0.92% | | | 0.90% | | | 0.84% | | | 0.74% | | | 0.64% | |
| | Ratio of Net Investment Income/(Loss) | | 1.56% | | | 2.05% | | | 1.72% | | | 1.04% | | | 2.14% | | | 1.44% | |
| Portfolio Turnover Rate | | 15% | | | 32% | | | 27% | | | 18% | | | 22% | | | 23% | |
| | | | | | | | | | | | | | | | | | | | | | |
| |
* Total return includes adjustments in accordance with generally accepted accounting principles required at the year or period end and are not annualized for periods of less than one full year. ** Annualized for periods of less than one full year. (1) Per share amounts are calculated based on average shares outstanding during the year or period. |
| | |
See Notes to Financial Statements. |
| |
18 | MARCH 31, 2023 |
Janus Henderson Overseas Fund
Financial Highlights
| | | | | | | | | | | | | | | | | | | | | | |
Class N Shares | | | | | | | | | | | | | | | | | | |
For a share outstanding during the period ended March 31, 2023 (unaudited) and the year ended September 30 | 2023 | | | 2022 | | | 2021 | | | 2020 | | | 2019 | | | 2018 | |
| Net Asset Value, Beginning of Period | | $33.73 | | | $43.43 | | | $32.72 | | | $30.62 | | | $32.08 | | | $31.89 | |
| Income/(Loss) from Investment Operations: | | | | | | | | | | | | | | | | | | |
| | Net investment income/(loss)(1) | | 0.32 | | | 0.84 | | | 0.64 | | | 0.32 | | | 0.68 | | | 0.52 | |
| | Net realized and unrealized gain/(loss) | | 8.59 | | | (10.02) | | | 10.46 | | | 2.52 | | | (1.77) | | | 0.33 | |
| Total from Investment Operations | | 8.91 | | | (9.18) | | | 11.10 | | | 2.84 | | | (1.09) | | | 0.85 | |
| Less Dividends and Distributions: | | | | | | | | | | | | | | | | | | |
| | Dividends (from net investment income) | | (0.69) | | | (0.52) | | | (0.39) | | | (0.74) | | | (0.37) | | | (0.66) | |
| Total Dividends and Distributions | | (0.69) | | | (0.52) | | | (0.39) | | | (0.74) | | | (0.37) | | | (0.66) | |
| Net Asset Value, End of Period | | $41.95 | | | $33.73 | | | $43.43 | | | $32.72 | | | $30.62 | | | $32.08 | |
| Total Return* | | 26.56% | | | (21.37)% | | | 34.06% | | | 9.20% | | | (3.27)% | | | 2.65% | |
| Net Assets, End of Period (in thousands) | | $151,269 | | | $70,342 | | | $61,263 | | | $23,810 | | | $51,945 | | | $69,995 | |
| Average Net Assets for the Period (in thousands) | | $115,437 | | | $72,777 | | | $42,249 | | | $45,317 | | | $59,886 | | | $74,170 | |
| Ratios to Average Net Assets**: | | | | | | | | | | | | | | | | | | |
| | Ratio of Gross Expenses | | 0.81% | | | 0.81% | | | 0.81% | | | 0.74% | | | 0.63% | | | 0.53% | |
| | Ratio of Net Expenses (After Waivers and Expense Offsets) | | 0.81% | | | 0.81% | | | 0.81% | | | 0.74% | | | 0.63% | | | 0.53% | |
| | Ratio of Net Investment Income/(Loss) | | 1.61% | | | 2.07% | | | 1.54% | | | 1.02% | | | 2.27% | | | 1.58% | |
| Portfolio Turnover Rate | | 15% | | | 32% | | | 27% | | | 18% | | | 22% | | | 23% | |
| | | | | | | | | | | | | | | | | | | | | | |
| |
* Total return includes adjustments in accordance with generally accepted accounting principles required at the year or period end and are not annualized for periods of less than one full year. ** Annualized for periods of less than one full year. (1) Per share amounts are calculated based on average shares outstanding during the year or period. |
| | |
See Notes to Financial Statements. |
| |
Janus Investment Fund | 19 |
Janus Henderson Overseas Fund
Financial Highlights
| | | | | | | | | | | | | | | | | | | | | | |
Class R Shares | | | | | | | | | | | | | | | | | | |
For a share outstanding during the period ended March 31, 2023 (unaudited) and the year ended September 30 | 2023 | | | 2022 | | | 2021 | | | 2020 | | | 2019 | | | 2018 | |
| Net Asset Value, Beginning of Period | | $33.48 | | | $43.10 | | | $32.48 | | | $30.41 | | | $31.78 | | | $31.60 | |
| Income/(Loss) from Investment Operations: | | | | | | | | | | | | | | | | | | |
| | Net investment income/(loss)(1) | | 0.13 | | | 0.47 | | | 0.27 | | | 0.11 | | | 0.44 | | | 0.26 | |
| | Net realized and unrealized gain/(loss) | | 8.57 | | | (9.90) | | | 10.48 | | | 2.45 | | | (1.72) | | | 0.34 | |
| Total from Investment Operations | | 8.70 | | | (9.43) | | | 10.75 | | | 2.56 | | | (1.28) | | | 0.60 | |
| Less Dividends and Distributions: | | | | | | | | | | | | | | | | | | |
| | Dividends (from net investment income) | | (0.37) | | | (0.19) | | | (0.13) | | | (0.49) | | | (0.09) | | | (0.42) | |
| Total Dividends and Distributions | | (0.37) | | | (0.19) | | | (0.13) | | | (0.49) | | | (0.09) | | | (0.42) | |
| Net Asset Value, End of Period | | $41.81 | | | $33.48 | | | $43.10 | | | $32.48 | | | $30.41 | | | $31.78 | |
| Total Return* | | 26.07% | | | (21.97)% | | | 33.12% | | | 8.37% | | | (4.00)% | | | 1.88% | |
| Net Assets, End of Period (in thousands) | | $22,620 | | | $18,008 | | | $24,155 | | | $21,288 | | | $24,381 | | | $30,258 | |
| Average Net Assets for the Period (in thousands) | | $21,333 | | | $22,449 | | | $24,617 | | | $22,679 | | | $25,588 | | | $34,353 | |
| Ratios to Average Net Assets**: | | | | | | | | | | | | | | | | | | |
| | Ratio of Gross Expenses | | 1.56% | | | 1.56% | | | 1.56% | | | 1.49% | | | 1.39% | | | 1.27% | |
| | Ratio of Net Expenses (After Waivers and Expense Offsets) | | 1.56% | | | 1.56% | | | 1.56% | | | 1.49% | | | 1.39% | | | 1.27% | |
| | Ratio of Net Investment Income/(Loss) | | 0.64% | | | 1.16% | | | 0.66% | | | 0.35% | | | 1.50% | | | 0.81% | |
| Portfolio Turnover Rate | | 15% | | | 32% | | | 27% | | | 18% | | | 22% | | | 23% | |
| | | | | | | | | | | | | | | | | | | | | | |
| |
* Total return includes adjustments in accordance with generally accepted accounting principles required at the year or period end and are not annualized for periods of less than one full year. ** Annualized for periods of less than one full year. (1) Per share amounts are calculated based on average shares outstanding during the year or period. |
| | |
See Notes to Financial Statements. |
| |
20 | MARCH 31, 2023 |
Janus Henderson Overseas Fund
Financial Highlights
| | | | | | | | | | | | | | | | | | | | | | |
Class S Shares | | | | | | | | | | | | | | | | | | |
For a share outstanding during the period ended March 31, 2023 (unaudited) and the year ended September 30 | 2023 | | | 2022 | | | 2021 | | | 2020 | | | 2019 | | | 2018 | |
| Net Asset Value, Beginning of Period | | $33.77 | | | $43.48 | | | $32.77 | | | $30.67 | | | $32.08 | | | $31.89 | |
| Income/(Loss) from Investment Operations: | | | | | | | | | | | | | | | | | | |
| | Net investment income/(loss)(1) | | 0.17 | | | 0.59 | | | 0.38 | | | 0.19 | | | 0.53 | | | 0.35 | |
| | Net realized and unrealized gain/(loss) | | 8.66 | | | (10.00) | | | 10.55 | | | 2.48 | | | (1.75) | | | 0.34 | |
| Total from Investment Operations | | 8.83 | | | (9.41) | | | 10.93 | | | 2.67 | | | (1.22) | | | 0.69 | |
| Less Dividends and Distributions: | | | | | | | | | | | | | | | | | | |
| | Dividends (from net investment income) | | (0.48) | | | (0.30) | | | (0.22) | | | (0.57) | | | (0.19) | | | (0.50) | |
| Total Dividends and Distributions | | (0.48) | | | (0.30) | | | (0.22) | | | (0.57) | | | (0.19) | | | (0.50) | |
| Net Asset Value, End of Period | | $42.12 | | | $33.77 | | | $43.48 | | | $32.77 | | | $30.67 | | | $32.08 | |
| Total Return* | | 26.24% | | | (21.77)% | | | 33.43% | | | 8.64% | | | (3.74)% | | | 2.16% | |
| Net Assets, End of Period (in thousands) | | $122,320 | | | $101,257 | | | $130,076 | | | $107,722 | | | $118,308 | | | $143,500 | |
| Average Net Assets for the Period (in thousands) | | $117,071 | | | $122,666 | | | $127,073 | | | $109,624 | | | $125,646 | | | $158,138 | |
| Ratios to Average Net Assets**: | | | | | | | | | | | | | | | | | | |
| | Ratio of Gross Expenses | | 1.30% | | | 1.31% | | | 1.31% | | | 1.23% | | | 1.13% | | | 1.02% | |
| | Ratio of Net Expenses (After Waivers and Expense Offsets) | | 1.30% | | | 1.31% | | | 1.31% | | | 1.23% | | | 1.13% | | | 1.02% | |
| | Ratio of Net Investment Income/(Loss) | | 0.88% | | | 1.43% | | | 0.92% | | | 0.62% | | | 1.77% | | | 1.06% | |
| Portfolio Turnover Rate | | 15% | | | 32% | | | 27% | | | 18% | | | 22% | | | 23% | |
| | | | | | | | | | | | | | | | | | | | | | |
| |
* Total return includes adjustments in accordance with generally accepted accounting principles required at the year or period end and are not annualized for periods of less than one full year. ** Annualized for periods of less than one full year. (1) Per share amounts are calculated based on average shares outstanding during the year or period. |
| | |
See Notes to Financial Statements. |
| |
Janus Investment Fund | 21 |
Janus Henderson Overseas Fund
Financial Highlights
| | | | | | | | | | | | | | | | | | | | | | |
Class T Shares | | | | | | | | | | | | | | | | | | |
For a share outstanding during the period ended March 31, 2023 (unaudited) and the year ended September 30 | 2023 | | | 2022 | | | 2021 | | | 2020 | | | 2019 | | | 2018 | |
| Net Asset Value, Beginning of Period | | $33.81 | | | $43.53 | | | $32.80 | | | $30.70 | | | $32.14 | | | $31.95 | |
| Income/(Loss) from Investment Operations: | | | | | | | | | | | | | | | | | | |
| | Net investment income/(loss)(1) | | 0.23 | | | 0.69 | | | 0.49 | | | 0.27 | | | 0.60 | | | 0.43 | |
| | Net realized and unrealized gain/(loss) | | 8.66 | | | (9.99) | | | 10.56 | | | 2.49 | | | (1.76) | | | 0.34 | |
| Total from Investment Operations | | 8.89 | | | (9.30) | | | 11.05 | | | 2.76 | | | (1.16) | | | 0.77 | |
| Less Dividends and Distributions: | | | | | | | | | | | | | | | | | | |
| | Dividends (from net investment income) | | (0.59) | | | (0.42) | | | (0.32) | | | (0.66) | | | (0.28) | | | (0.58) | |
| Total Dividends and Distributions | | (0.59) | | | (0.42) | | | (0.32) | | | (0.66) | | | (0.28) | | | (0.58) | |
| Net Asset Value, End of Period | | $42.11 | | | $33.81 | | | $43.53 | | | $32.80 | | | $30.70 | | | $32.14 | |
| Total Return* | | 26.40% | | | (21.56)% | | | 33.78% | | | 8.93% | | | (3.51)% | | | 2.40% | |
| Net Assets, End of Period (in thousands) | | $524,867 | | | $399,703 | | | $534,168 | | | $411,807 | | | $444,252 | | | $532,840 | |
| Average Net Assets for the Period (in thousands) | | $475,617 | | | $499,214 | | | $511,140 | | | $422,347 | | | $462,499 | | | $589,204 | |
| Ratios to Average Net Assets**: | | | | | | | | | | | | | | | | | | |
| | Ratio of Gross Expenses | | 1.05% | | | 1.05% | | | 1.05% | | | 0.98% | | | 0.88% | | | 0.77% | |
| | Ratio of Net Expenses (After Waivers and Expense Offsets) | | 1.04% | | | 1.04% | | | 1.05% | | | 0.97% | | | 0.87% | | | 0.77% | |
| | Ratio of Net Investment Income/(Loss) | | 1.18% | | | 1.68% | | | 1.19% | | | 0.88% | | | 2.03% | | | 1.32% | |
| Portfolio Turnover Rate | | 15% | | | 32% | | | 27% | | | 18% | | | 22% | | | 23% | |
| | | | | | | | | | | | | | | | | | | | | | |
| |
* Total return includes adjustments in accordance with generally accepted accounting principles required at the year or period end and are not annualized for periods of less than one full year. ** Annualized for periods of less than one full year. (1) Per share amounts are calculated based on average shares outstanding during the year or period. |
| | |
See Notes to Financial Statements. |
| |
22 | MARCH 31, 2023 |
Janus Henderson Overseas Fund
Notes to Financial Statements (Unaudited)
1. Organization and Significant Accounting Policies
Janus Henderson Overseas Fund (the “Fund”) is a series of Janus Investment Fund (the “Trust”), which is organized as a Massachusetts business trust and is registered under the Investment Company Act of 1940, as amended (the “1940 Act”), as an open-end management investment company, and therefore has applied the specialized accounting and reporting guidance in Financial Accounting Standards Board (“FASB”) Accounting Standards Codification (“ASC”) Topic 946. The Trust offers 40 funds, each of which offers multiple share classes, with differing investment objectives and policies. The Fund seeks long-term growth of capital. The Fund is classified as diversified, as defined in the 1940 Act. Janus Henderson Investors US LLC is the investment adviser (the “Adviser”) to the Fund.
The Fund offers multiple classes of shares in order to meet the needs of various types of investors. Each class represents an interest in the same portfolio of investments. Certain financial intermediaries may not offer all classes of shares.
Shareholders, including individuals, accounts, as well as the Fund’s portfolio manager(s) and/or investment personnel, may from time to time own (beneficially or of record) a significant percentage of the Fund’s Shares and can be considered to “control” the Fund when that ownership exceeds 25% of the Fund’s assets (and which may differ from control as determined in accordance with United States of America generally accepted accounting principles ("US GAAP")).
Class A Shares are offered through financial intermediary platforms including, but not limited to, traditional brokerage platforms, mutual fund wrap fee programs, bank trust platforms, and retirement platforms.
Class C Shares are offered through financial intermediary platforms including, but not limited to, traditional brokerage platforms, mutual fund wrap fee programs, and bank trust platforms.
Class C Shares are closed to investments by new employer-sponsored retirement plans and existing employer-sponsored retirement plans are no longer able to make additional purchases or exchanges into Class C Shares.
The Fund currently implements an automatic conversion feature pursuant to which Class C Shares that have been held for eight years are automatically converted to Class A Shares without the imposition of any sales charge, fee or other charge. The conversion will generally occur no later than ten business days in the month following the month of the eighth anniversary of the date of purchase. Class C Shares purchased through the reinvestment of dividends and other distributions on Class C Shares will convert to Class A Shares at the same time as the original Class C Shares with respect to which they were purchased. For Class C Shares held in omnibus accounts on intermediary platforms, the Fund relies on these intermediaries to implement this conversion feature. Your financial intermediary may have separate policies and procedures as to when and how Class C Shares may be converted to Class A Shares.
Effective July 6, 2020, Class D Shares are available to new investors, subject to any closed fund policies for a Fund, as applicable. Previously, Class D Shares were only available to investors who already had a direct account with the Janus Henderson funds; immediate family members or members of the same household of an eligible individual investor; and existing beneficial owners of sole proprietorships or partnerships that hold accounts directly with the Janus Henderson funds.
Class I Shares are available through certain financial intermediary platforms including, but not limited to, mutual fund wrap fee programs, managed account programs, asset allocation programs, bank trust platforms, as well as certain retirement platforms. Class I Shares are also available to certain direct institutional investors including, but not limited to, corporations, certain retirement plans, public plans, and foundations/endowments, who established Class I Share accounts before August 4, 2017.
Class N Shares are generally available only to financial intermediaries purchasing on behalf of: 1) certain adviser-assisted, employer-sponsored retirement plans, including 401(k) plans, 457 plans, 403(b) plans, Taft-Hartley multi-employer plans, profit-sharing and money purchase pension plans, defined benefit plans and certain welfare benefit plans, such as health savings accounts, and nonqualified deferred compensation plans; and 2) retail investors purchasing in qualified or nonqualified accounts, whose accounts are held through an omnibus account at their financial intermediary, and where the financial intermediary requires no payment or reimbursement from the Fund, the Adviser, or its affiliates. Class N Shares are also available to Janus Henderson proprietary products and to certain direct institutional investors approved by Janus Henderson Distributors US LLC (the “Distributor”) including, but not limited to,
Janus Henderson Overseas Fund
Notes to Financial Statements (Unaudited)
corporations, certain retirement plans, public plans, and foundations and endowments, subject to minimum investment requirements.
Class R Shares are offered through financial intermediary platforms including, but not limited to, retirement platforms.
Class S Shares are offered through financial intermediary platforms including, but not limited to, retirement platforms and asset allocation, mutual fund wrap, or other discretionary or nondiscretionary fee-based investment advisory programs. In addition, Class S Shares may be available through certain financial intermediaries who have an agreement with the Adviser or its affiliates to offer Class S Shares on their supermarket platforms.
Class T Shares are available through certain financial intermediary platforms including, but not limited to, mutual fund wrap fee programs, managed account programs, asset allocation programs, bank trust platforms, as well as certain retirement platforms. In addition, Class T Shares may be available through certain financial intermediaries who have an agreement with the Adviser or its affiliates to offer Class T Shares on their supermarket platforms.
The following accounting policies have been followed by the Fund and are in conformity with US GAAP.
Investment Valuation
Fund holdings are valued in accordance with policies and procedures established by the Adviser pursuant to Rule 2a-5 under the 1940 Act and approved by and subject to the oversight of the Trustees (the “Valuation Procedures”). Equity securities traded on a domestic securities exchange are generally valued at readily available market quotations, which are (i) the official close prices or (ii) last sale prices on the primary market or exchange in which the securities trade. If such price is lacking for the trading period immediately preceding the time of determination, such securities are generally valued at their current bid price. Equity securities that are traded on a foreign exchange are generally valued at the closing prices on such markets. In the event that there is no current trading volume on a particular security in such foreign exchange, the bid price from the primary exchange is generally used to value the security. Foreign securities and currencies are converted to U.S. dollars using the current spot USD dollar exchange rate in effect at the close of the New York Stock Exchange (“NYSE”). The Fund will determine the market value of individual securities held by it by using prices provided by one or more approved professional pricing services or, as needed, by obtaining market quotations from independent broker-dealers. Most debt securities are valued in accordance with the evaluated bid price supplied by the Adviser-approved pricing service that is intended to reflect market value. The evaluated bid price supplied by the pricing service is an evaluation that may consider factors such as security prices, yields, maturities and ratings. Certain short-term securities maturing within 60 days or less may be evaluated and valued on an amortized cost basis provided that the amortized cost determined approximates market value. Securities for which market quotations or evaluated prices are not readily available or deemed unreliable are valued at fair value determined in good faith by the Adviser pursuant to the Valuation Procedures. Circumstances in which fair valuation may be utilized include, but are not limited to: (i) a significant event that may affect the securities of a single issuer, such as a merger, bankruptcy, or significant issuer-specific development; (ii) an event that may affect an entire market, such as a natural disaster or significant governmental action; (iii) a nonsignificant event such as a market closing early or not opening, or a security trading halt; and (iv) pricing of a nonvalued security and a restricted or nonpublic security. Special valuation considerations may apply with respect to “odd-lot” fixed-income transactions which, due to their small size, may receive evaluated prices by pricing services which reflect a large block trade and not what actually could be obtained for the odd-lot position. The valuation policies provide for the use of systematic fair valuation models provided by independent pricing services to value foreign equity securities in order to adjust for stale pricing, which may occur between the close of certain foreign exchanges and the close of the NYSE. The value of the securities of other mutual funds held by a Fund, if any, will be calculated using the NAV of such mutual funds.
Valuation Inputs Summary
FASB ASC 820, Fair Value Measurements and Disclosures (“ASC 820”), defines fair value, establishes a framework for measuring fair value, and expands disclosure requirements regarding fair value measurements. This standard emphasizes that fair value is a market-based measurement that should be determined based on the assumptions that market participants would use in pricing an asset or liability and establishes a hierarchy that prioritizes inputs to valuation techniques used to measure fair value. These inputs are summarized into three broad levels:
Level 1 – Unadjusted quoted prices in active markets the Fund has the ability to access for identical assets or liabilities.
Janus Henderson Overseas Fund
Notes to Financial Statements (Unaudited)
Level 2 – Observable inputs other than unadjusted quoted prices included in Level 1 that are observable for the asset or liability either directly or indirectly. These inputs may include quoted prices for the identical instrument on an inactive market, prices for similar instruments, interest rates, prepayment speeds, credit risk, yield curves, default rates and similar data.
Assets or liabilities categorized as Level 2 in the hierarchy generally include: debt securities fair valued in accordance with the evaluated bid or ask prices supplied by a pricing service; securities traded on OTC markets and listed securities for which no sales are reported that are fair valued at the latest bid price (or yield equivalent thereof) obtained from one or more dealers transacting in a market for such securities or by a pricing service approved by the Fund’s Trustees; certain short-term debt securities with maturities of 60 days or less that are fair valued at amortized cost; and equity securities of foreign issuers whose fair value is determined by using systematic fair valuation models provided by independent third parties in order to adjust for stale pricing which may occur between the close of certain foreign exchanges and the close of the NYSE. Other securities that may be categorized as Level 2 in the hierarchy include, but are not limited to, preferred stocks, bank loans, swaps, investments in unregistered investment companies, options, and forward contracts.
Level 3 – Unobservable inputs for the asset or liability to the extent that relevant observable inputs are not available, representing the Fund’s own assumptions about the assumptions that a market participant would use in valuing the asset or liability, and that would be based on the best information available.
There have been no significant changes in valuation techniques used in valuing any such positions held by the Fund since the beginning of the fiscal period.
The inputs or methodology used for fair valuing securities are not necessarily an indication of the risk associated with investing in those securities. The summary of inputs used as of March 31, 2023 to fair value the Fund’s investments in securities and other financial instruments is included in the “Valuation Inputs Summary” in the Notes to Schedule of Investments and Other Information.
Investment Transactions and Investment Income
Investment transactions are accounted for as of the date purchased or sold (trade date). Dividend income is recorded on the ex-dividend date. Certain dividends from foreign securities will be recorded as soon as the Fund is informed of the dividend, if such information is obtained subsequent to the ex-dividend date. Dividends from foreign securities may be subject to withholding taxes in foreign jurisdictions. Non-cash dividends, if any, are recorded on the ex-dividend date at fair value. Interest income is recorded daily on an accrual basis and includes amortization of premiums and accretion of discounts. The Fund classifies gains and losses on prepayments received as an adjustment to interest income. Debt securities may be placed in non-accrual status and related interest income may be reduced by stopping current accruals and writing off interest receivables when collection of all or a portion of interest has become doubtful. Gains and losses are determined on the identified cost basis, which is the same basis used for federal income tax purposes. Income, as well as gains and losses, both realized and unrealized, are allocated daily to each class of shares based upon the ratio of net assets represented by each class as a percentage of total net assets.
Expenses
The Fund bears expenses incurred specifically on its behalf. Each class of shares bears a portion of general expenses, which are allocated daily to each class of shares based upon the ratio of net assets represented by each class as a percentage of total net assets. Expenses directly attributable to a specific class of shares are charged against the operations of such class.
Estimates
The preparation of financial statements in conformity with US GAAP requires management to make estimates and assumptions that affect the reported amount of assets and liabilities and disclosure of contingent assets and liabilities at the date of the financial statements, and the reported amounts of income and expenses during the reporting period. Actual results could differ from those estimates.
Indemnifications
In the normal course of business, the Fund may enter into contracts that contain provisions for indemnification of other parties against certain potential liabilities. The Fund’s maximum exposure under these arrangements is unknown, and would involve future claims that may be made against the Fund that have not yet occurred. Currently, the risk of material loss from such claims is considered remote.
Janus Henderson Overseas Fund
Notes to Financial Statements (Unaudited)
Foreign Currency Translations
The Fund does not isolate that portion of the results of operations resulting from the effect of changes in foreign exchange rates on investments from the fluctuations arising from changes in market prices of securities held at the date of the financial statements. Net unrealized appreciation or depreciation of investments and foreign currency translations arise from changes in the value of assets and liabilities, including investments in securities held at the date of the financial statements, resulting from changes in the exchange rates and changes in market prices of securities held.
Currency gains and losses are also calculated on payables and receivables that are denominated in foreign currencies. The payables and receivables are generally related to foreign security transactions and income translations.
Foreign currency-denominated assets and forward currency contracts may involve more risks than domestic transactions, including currency risk, counterparty risk, political and economic risk, regulatory risk and equity risk. Risks may arise from unanticipated movements in the value of foreign currencies relative to the U.S. dollar.
Dividends and Distributions
The Fund generally declares and distributes dividends of net investment income and realized capital gains (if any) annually. The Fund may treat a portion of the amount paid to redeem shares as a distribution of investment company taxable income and realized capital gains that are reflected in the net asset value. This practice, commonly referred to as “equalization,” has no effect on the redeeming shareholder or a Fund’s total return, but may reduce the amounts that would otherwise be required to be paid as taxable dividends to the remaining shareholders. It is possible that the Internal Revenue Service (IRS) could challenge the Fund's equalization methodology or calculations, and any such challenge could result in additional tax, interest, or penalties to be paid by the Fund.
The Fund may make certain investments in real estate investment trusts (“REITs”) which pay dividends to their shareholders based upon funds available from operations. It is quite common for these dividends to exceed the REITs’ taxable earnings and profits, resulting in the excess portion of such dividends being designated as a return of capital. If the Fund distributes such amounts, such distributions could constitute a return of capital to shareholders for federal income tax purposes.
Federal Income Taxes
The Fund intends to continue to qualify as a regulated investment company and distribute all of its taxable income in accordance with the requirements of Subchapter M of the Internal Revenue Code. Management has analyzed the Fund’s tax positions taken for all open federal income tax years, generally a three-year period, and has concluded that no provision for federal income tax is required in the Fund’s financial statements. The Fund is not aware of any tax positions for which it is reasonably possible that the total amounts of unrecognized tax benefits will significantly change in the next twelve months.
2. Other Investments and Strategies
Additional Investment Risk
The U.S. government and the Federal Reserve, as well as certain foreign governments and central banks, have taken extraordinary actions to support local and global economies and the financial markets in response to the COVID-19 pandemic. This and other government intervention into the economy and financial markets to address the COVID-19 pandemic may not work as intended, particularly if the efforts are perceived by investors as being unlikely to achieve the desired results. Government actions to mitigate the economic impact of the pandemic have resulted in a large expansion of government deficits and debt, the long term consequences of which are not known. The COVID-19 pandemic could adversely affect the value and liquidity of a Fund’s investments, impair a Fund’s ability to satisfy redemption requests, and negatively impact a Fund’s performance. In addition, the outbreak of COVID-19, and measures taken to mitigate its effects, could result in disruptions to the services provided to a Fund by its service providers.
Widespread disease, including pandemics and epidemics, and natural or environmental disasters, including those which may be attributable to global climate change, such as earthquakes, fires, floods, hurricanes, tsunamis and weather-related phenomena generally, have been and can be highly disruptive to economies and markets, adversely impacting individual companies, sectors, industries, markets, currencies, interest and inflation rates, credit ratings, investor sentiment, and other factors affecting the value of a Fund’s investments. Economies and financial markets throughout the world have become increasingly interconnected, which increases the likelihood that events or conditions in one
Janus Henderson Overseas Fund
Notes to Financial Statements (Unaudited)
region or country will adversely affect markets or issuers in other regions or countries, including the United States. These disruptions could prevent a Fund from executing advantageous investment decisions in a timely manner and negatively impact a Fund’s ability to achieve its investment objective(s). Any such event(s) could have a significant adverse impact on the value of a Fund. In addition, these disruptions could also impair the information technology and other operational systems upon which the Fund’s service providers, including the Adviser or the subadviser (as applicable), rely, and could otherwise disrupt the ability of employees of the Fund’s service providers to perform essential tasks on behalf of the Fund. Adverse weather conditions may also have a particularly significant negative effect on issuers in the agricultural sector and on insurance and reinsurance companies that insure or reinsure against the impact of natural disasters.
A number of countries in the European Union (the “EU”) have experienced, and may continue to experience, severe economic and financial difficulties. In particular, many EU nations are susceptible to economic risks associated with high levels of debt. Many non-governmental issuers, and even certain governments, have defaulted on, or been forced to restructure, their debts. Many other issuers have faced difficulties obtaining credit or refinancing existing obligations. Financial institutions have in many cases required government or central bank support, have needed to raise capital, and/or have been impaired in their ability to extend credit. As a result, financial markets in the EU have experienced extreme volatility and declines in asset values and liquidity. These difficulties may continue, worsen, or spread further within the EU. Responses to these financial problems by European governments, central banks, and others, including austerity measures and reforms, may not work, may result in social unrest, and may limit future growth and economic recovery or have other unintended consequences. Among other things, these developments have adversely affected the value and exchange rate of the euro and pound sterling, and may continue to significantly affect the economies of all EU countries, which in turn may have a material adverse effect on the Fund’s investments in such countries, other countries that depend on EU countries for significant amounts of trade or investment, or issuers with exposure to debt issued by certain EU countries.
Emerging Market Investing
Within the parameters of its specific investment policies, the Fund may invest in securities of issuers or companies from or with exposure to one or more “developing countries” or “emerging market countries.” Such countries include but are not limited to countries included in the MSCI Emerging Markets IndexSM. Emerging market countries in which the Fund may invest include frontier market countries, the economies of which are less developed than other emerging market countries. To the extent that the Fund invests a significant amount of its assets in one or more of these countries, its returns and net asset value may be affected to a large degree by events and economic conditions in such countries. The risks of foreign investing are heightened when investing in emerging markets, which may result in the price of investments in emerging markets experiencing sudden and sharp price swings. In many developing markets, there is less government supervision and regulation of stock exchanges, brokers, and listed companies, making these investments potentially more volatile in price and less liquid than investments in developed securities markets, resulting in greater risk to investors. Similarly, issuers in such markets may not be subject to regulatory, accounting, auditing, and financial reporting and recordkeeping standards comparable to those to which U.S. companies are subject. There is a risk in developing countries that a current or future economic or political crisis could lead to price controls, forced mergers of companies, expropriation or confiscatory taxation, imposition or enforcement of foreign ownership limits, seizure, nationalization, sanctions or imposition of restrictions by various governmental entities on investment and trading, or creation of government monopolies, any of which may have a detrimental effect on the Fund’s investments. In addition, the Fund’s investments may be denominated in foreign currencies and therefore, changes in the value of a country’s currency compared to the U.S. dollar may affect the value of the Fund’s investments. To the extent that the Fund invests a significant portion of its assets in the securities of issuers in or companies of a single country or region, it is more likely to be impacted by events or conditions affecting that country or region, which could have a negative impact on the Fund’s performance. Developing countries may also experience a higher level of exposure and vulnerability to the adverse effects of climate change. This can be attributed to both the geographic location of emerging market countries and/or a country’s lack of access to technology or resources to adjust and adapt to its effects. An increased occurrence and severity of natural disasters and extreme weather events such as droughts and decreased crop yields, heat waves, flooding and rising sea levels, and increased spread of disease, could cause harmful effects to the performance of affected economies. Additionally, foreign and emerging market risks, including, but not limited to, price controls, expropriation or confiscatory taxation, imposition or enforcement of foreign ownership limits, nationalization, and restrictions on repatriation of assets may be heightened to the extent the Fund invests in Chinese local market securities.
Janus Henderson Overseas Fund
Notes to Financial Statements (Unaudited)
Counterparties
Fund transactions involving a counterparty are subject to the risk that the counterparty or a third party will not fulfill its obligation to the Fund (“counterparty risk”). Counterparty risk may arise because of the counterparty’s financial condition (i.e., financial difficulties, bankruptcy, or insolvency), market activities and developments, or other reasons, whether foreseen or not. A counterparty’s inability to fulfill its obligation may result in significant financial loss to the Fund. The Fund may be unable to recover its investment from the counterparty or may obtain a limited recovery, and/or recovery may be delayed. The extent of the Fund’s exposure to counterparty risk with respect to financial assets and liabilities approximates its carrying value.
The Fund may be exposed to counterparty risk through participation in various programs, including, but not limited to, lending its securities to third parties, cash sweep arrangements whereby the Fund’s cash balance is invested in one or more types of cash management vehicles, as well as investments in, but not limited to, repurchase agreements, debt securities, and derivatives, including various types of swaps, futures and options. The Fund intends to enter into financial transactions with counterparties that the Adviser believes to be creditworthy at the time of the transaction. There is always the risk that the Adviser’s analysis of a counterparty’s creditworthiness is incorrect or may change due to market conditions. To the extent that the Fund focuses its transactions with a limited number of counterparties, it will have greater exposure to the risks associated with one or more counterparties.
Securities Lending
Under procedures adopted by the Trustees, the Fund may seek to earn additional income by lending securities to certain qualified broker-dealers and institutions. JPMorgan Chase Bank, National Association acts as securities lending agent and a limited purpose custodian or subcustodian to receive and disburse cash balances and cash collateral, hold short-term investments, hold collateral, and perform other custodial functions in accordance with the Non-Custodial Securities Lending Agreement. For financial reporting purposes, the Fund does not offset financial instruments’ payables and receivables and related collateral on the Statement of Assets and Liabilities. The Fund may lend fund securities in an amount equal to up to 1/3 of its total assets as determined at the time of the loan origination. There is the risk of delay in recovering a loaned security or the risk of loss in collateral rights if the borrower fails financially. In addition, the Adviser makes efforts to balance the benefits and risks from granting such loans. All loans will be continuously secured by collateral which may consist of cash, U.S. Government securities, domestic and foreign short-term debt instruments, letters of credit, time deposits, repurchase agreements, money market mutual funds or other money market accounts, or such other collateral as permitted by the Securities and Exchange Commission (the "SEC"). If the Fund is unable to recover a security on loan, the Fund may use the collateral to purchase replacement securities in the market. There is a risk that the value of the collateral could decrease below the cost of the replacement security by the time the replacement investment is made, resulting in a loss to the Fund. In certain circumstances individual loan transactions could yield negative returns.
Upon receipt of cash collateral, the Adviser may invest it in affiliated or non-affiliated cash management vehicles, whether registered or unregistered entities, as permitted by the 1940 Act and rules promulgated thereunder. The Adviser currently intends to primarily invest the cash collateral in a cash management vehicle for which the Adviser serves as investment adviser, Janus Henderson Cash Collateral Fund LLC, or in time deposits. An investment in Janus Henderson Cash Collateral Fund LLC is generally subject to the same risks that shareholders experience when investing in similarly structured vehicles, such as the potential for significant fluctuations in assets as a result of the purchase and redemption activity of the securities lending program, a decline in the value of the collateral, and possible liquidity issues. Such risks may delay the return of the cash collateral and cause the Fund to violate its agreement to return the cash collateral to a borrower in a timely manner. As adviser to the Fund and Janus Henderson Cash Collateral Fund LLC, the Adviser has an inherent conflict of interest as a result of its fiduciary duties to both the Fund and Janus Henderson Cash Collateral Fund LLC. Additionally, the Adviser receives an investment advisory fee of 0.05% for managing Janus Henderson Cash Collateral Fund LLC, but it may not receive a fee for managing certain other affiliated cash management vehicles in which the Fund may invest, and therefore may have an incentive to allocate preferred investment opportunities to investment vehicles for which it is receiving a fee.
The value of the collateral must be at least 102% of the market value of the loaned securities that are denominated in U.S. dollars and 105% of the market value of the loaned securities that are not denominated in U.S. dollars. Loaned securities and related collateral are marked-to-market each business day based upon the market value of the loaned securities at the close of business, employing the most recent available pricing information. Collateral levels are then adjusted based on this mark-to-market evaluation. Additional required collateral, or excess collateral returned, is
Janus Henderson Overseas Fund
Notes to Financial Statements (Unaudited)
delivered on the next business day. Therefore, the value of the collateral held may be temporarily less than 102% or 105% value of the securities on loan. The cash collateral invested by the Adviser is disclosed in the Schedule of Investments (if applicable).
Income earned from the investment of the cash collateral, net of rebates paid to, or fees paid by, borrowers and less the fees paid to the lending agent are included as “Affiliated securities lending income, net” on the Statement of Operations.
There were no securities on loan as of March 31, 2023.
3. Investment Advisory Agreements and Other Transactions with Affiliates
The Fund pays the Adviser an investment advisory fee rate that may adjust up or down based on the Fund’s performance relative to its benchmark index.
The investment advisory fee rate paid to the Adviser by the Fund consists of two components: (1) a base fee calculated by applying the contractual fixed rate of the advisory fee to the Fund’s average daily net assets during the previous month (the “Base Fee Rate”), plus or minus (2) a performance-fee adjustment (the “Performance Adjustment”) calculated by applying a variable rate of up to 0.15% (positive or negative) to the Fund’s average daily net assets based on the Fund’s relative performance compared to the cumulative investment record of its benchmark index over a 36-month performance measurement period or shorter time period, as applicable. The investment advisory fee rate is calculated daily and paid monthly.
The investment performance of the Fund’s Class A Shares (waiving the upfront sales load) for the performance measurement period is used to calculate the Performance Adjustment. The Fund’s Base Fee Rate prior to any performance adjustment (expressed as an annual rate) is 0.64%, and the Fund’s benchmark index used in the calculation is the MSCI All Country World ex-USA IndexSM.
No Performance Adjustment is applied unless the difference between the Fund’s investment performance and the cumulative investment record of the Fund’s benchmark index is 0.50% or greater (positive or negative) during the applicable performance measurement period. The Base Fee Rate is subject to an upward or downward Performance Adjustment for every full 0.50% increment by which the Fund outperforms or underperforms its benchmark index, up to the Fund’s full performance rate of ±7.00%. Because the Performance Adjustment is tied to a Fund’s relative performance compared to its benchmark index (and not its absolute performance), the Performance Adjustment could increase the Adviser’s fee even if the Fund’s Shares lose value during the performance measurement period and could decrease the Adviser’s fee even if the Fund’s Shares increase in value during the performance measurement period. For purposes of computing the Base Fee Rate and the Performance Adjustment, net assets are averaged over different periods (average daily net assets during the previous month for the Base Fee Rate, versus average daily net assets during the performance measurement period for the Performance Adjustment). Performance of the Fund is calculated net of expenses whereas the Fund’s benchmark index does not have any fees or expenses. Reinvestment of dividends and distributions is included in calculating both the performance of a Fund and the Fund’s benchmark index.
The Fund’s prospectuses and statement(s) of additional information contain additional information about performance-based fees. The amount shown as advisory fees on the Statement of Operations reflects the Base Fee Rate plus/minus any Performance Adjustment. For the period ended March 31, 2023, the performance adjusted investment advisory fee rate before any waivers and/or reimbursements of expenses is 0.75%.
The Adviser has contractually agreed to waive the investment advisory fee and/or reimburse operating expenses to the extent that the Fund’s total annual fund operating expenses, excluding any performance adjustments to management fees (if applicable), the fees payable pursuant to a Rule 12b-1 plan, shareholder servicing fees, such as transfer agency fees (including out-of-pocket costs), administrative services fees and any networking/omnibus payable by any share class, brokerage commissions, interest, dividends, taxes, acquired fund fees and expenses, and extraordinary expenses, exceed the annual rate of 0.82% of the Fund’s average daily net assets. The Adviser has agreed to continue the waivers for at least a one-year period commencing January 27, 2023. If applicable, amounts waived and/or reimbursed to the Fund by the Adviser are disclosed as “Excess Expense Reimbursement and Waivers” on the Statement of Operations.
The Adviser serves as administrator to the Fund pursuant to an administration agreement between the Adviser and the Trust. Under the administration agreement, the Adviser is authorized to perform, or cause others to perform certain administration, compliance, and accounting services to the Fund, including providing office space for the Fund, and is
Janus Henderson Overseas Fund
Notes to Financial Statements (Unaudited)
reimbursed by the Fund for certain of its costs in providing these services (to the extent the Adviser seeks reimbursement and such costs are not otherwise waived). In addition, employees of the Adviser and/or its affiliates may serve as officers of the Trust. The Fund pays for some or all of the salaries, fees, and expenses of the Adviser employees and Fund officers, with respect to certain specified administration functions they perform on behalf of the Fund. The Fund pays these costs based on out-of-pocket expenses incurred by the Adviser, and these costs are separate and apart from advisory fees and other expenses paid in connection with the investment advisory services the Adviser (or any subadvisor, as applicable) provides to the Fund. These amounts are disclosed as “Affiliated fund administration fees” on the Statement of Operations. In addition, some expenses related to compensation payable to the Fund’s Chief Compliance Officer and certain compliance staff, all of whom are employees of the Adviser and/or its affiliates, are shared with the Fund. Total compensation of $114,430 was paid to the Chief Compliance Officer and certain compliance staff by the Trust during the period ended March 31, 2023. The Fund's portion is reported as part of “Other expenses” on the Statement of Operations.
Janus Henderson Services US LLC (the “Transfer Agent”), a wholly-owned subsidiary of the Adviser, is the Fund’s transfer agent. The Transfer Agent provides or arranges for the provision of shareholder services including, but not limited to, recordkeeping, subaccounting, answering inquiries regarding accounts, order processing, transaction confirmations, the mailing of prospectuses and shareholder reports, and other shareholder services provided to or on behalf of shareholders. These amounts are disclosed as “Transfer agent administrative fees and expenses” on the Statement of Operations.
Class D Shares of the Fund pay the Transfer Agent an annual administrative services fee based on the average daily net assets of Class D Shares as detailed below.
| | |
Average Daily Net Assets of Class D Shares of the Janus Henderson funds | Administrative Services Fee |
Under $40 billion | 0.12% |
$40 billion – $49.9 billion | 0.10% |
Over $49.9 billion | 0.08% |
During the reporting period, the administrative services fee rate was 0.12%.
The Transfer Agent receives an administrative services fee at an annual rate of up to 0.25% of the average daily net assets of the Fund’s Class R Shares, Class S Shares, and Class T Shares for providing or procuring administrative services to investors in Class R Shares, Class S Shares, and Class T Shares of the Fund. The Transfer Agent expects to use all or a significant portion of this fee to compensate retirement plan service providers, broker-dealers, bank trust departments, financial advisors, and other financial intermediaries for providing these services. The Transfer Agent may keep certain amounts retained for reimbursement of out-of-pocket costs incurred for servicing clients of Class R Shares, Class S Shares, and Class T Shares.
Shareholder Services provided by these financial intermediaries may include, but are not limited to, recordkeeping, subaccounting, order processing, providing order confirmations, periodic statements, forwarding prospectuses, shareholder reports, and other materials to existing customers, answering inquiries regarding accounts, and other administrative services. Order processing includes the submission of transactions through the National Securities Clearing Corporation (“NSCC”) or similar systems, or those processed on a manual basis with the Adviser. For all share classes, the Transfer Agent also seeks reimbursement for costs it incurs as transfer agent and for providing servicing.
Certain, but not all, intermediaries may charge administrative fees to investors in Class A Shares, Class C Shares, and Class I Shares for administrative services provided on behalf of such investors. These administrative fees are paid by the Class A Shares, Class C Shares, and Class I Shares of the Fund to the Transfer Agent, which uses such fees to reimburse intermediaries. Consistent with the Transfer Agency Agreement between the Transfer Agent and the Fund, the Transfer Agent may negotiate the level, structure, and/or terms of the administrative fees with intermediaries requiring such fees on behalf of the Fund. The Adviser and its affiliates benefit from an increase in assets that may result from such relationships. The Adviser has agreed to limit these fees up to 0.20% for Class A Shares and Class C Shares, and up to 0.15% for Class I Shares on an annual basis based on the daily net assets of each share class. Such limits are subject to change by the Trustees in the future. These amounts are disclosed as “Transfer agent networking and omnibus fees” on the Statement of Operations.
Janus Henderson Overseas Fund
Notes to Financial Statements (Unaudited)
The Transfer Agent is not compensated for its services related to the shares, except for out-of-pocket costs, although the Transfer Agent is compensated for its services related to Fund’s Class D Shares. These amounts are disclosed as “Other transfer agent fees and expenses” on the Statement of Operations.
Under distribution and shareholder servicing plans (the “Plans”) adopted in accordance with Rule 12b-1 under the 1940 Act, the Fund pays the Trust’s distributor, the Distributor, a wholly-owned subsidiary of the Adviser, a fee for the sale and distribution and/or shareholder servicing of the shares based on the average daily net assets for each share class at an annual rate of up to 0.25% for Class A Shares, up to 1.00% for Class C Shares, of up to 0.50% of the Class R Shares’ average daily net assets, and up to 0.25% for Class S Shares. Under the terms of the Plans, the Trust is authorized to make payments to the Distributor for remittance to retirement plan service providers, broker-dealers, bank trust departments, financial advisors, and other financial intermediaries, as compensation for distribution and/or shareholder services performed by such entities for their customers who are investors in the Fund. These amounts are disclosed as “12b-1 Distribution and shareholder servicing fees” on the Statement of Operations.
Class A Shares include a 5.75% upfront sales charge of the offering price of the Fund. The sales charge is allocated between the Distributor and financial intermediaries. During the period ended March 31, 2023, the Distributor retained upfront sales charges of $2,413.
A contingent deferred sales charge (“CDSC”) of 1.00% will be deducted with respect to Class A Shares purchased without a sales load and redeemed within 12 months of purchase, unless waived. Any applicable CDSC will be 1.00% of the lesser of the original purchase price or the value of the redemption of the Class A Shares redeemed. There were no CDSCs paid by redeeming shareholders of Class A Shares to the Distributor during the period ended March 31, 2023.
A CDSC of 1.00% will be deducted with respect to Class C Shares redeemed within 12 months of purchase, unless waived. Any applicable CDSC will be 1.00% of the lesser of the original purchase price or the value of the redemption of the Class C Shares redeemed. There were no CDSCs paid by redeeming shareholders of Class C Shares during the period ended March 31, 2023.
The Board of Trustees has adopted a deferred compensation plan (the “Deferred Plan”) for independent Trustees to elect to defer receipt of all or a portion of the annual compensation they are entitled to receive from the Fund. All deferred fees are credited to an account established in the name of the Trustees. The amounts credited to the account then increase or decrease, as the case may be, in accordance with the performance of one or more of the Janus Henderson funds that are selected by the Trustees. The account balance continues to fluctuate in accordance with the performance of the selected fund or funds until final payment of all amounts are credited to the account. The fluctuation of the account balance is recorded by the Fund as unrealized appreciation/(depreciation) and is included as of March 31, 2023 on the Statement of Assets and Liabilities in the asset, “Trustees’ deferred compensation,” and liability, “Trustees’ deferred compensation fees.” Additionally, the recorded unrealized appreciation/(depreciation) is included in “Total distributable earnings (loss)” on the Statement of Assets and Liabilities. Deferred compensation expenses for the period ended March 31, 2023 are included in “Trustees’ fees and expenses” on the Statement of Operations. Trustees are allowed to change their designation of mutual funds from time to time. Amounts will be deferred until distributed in accordance with the Deferred Plan. Deferred fees of $205,688 were paid by the Trust to the Trustees under the Deferred Plan during the period ended March 31, 2023.
Pursuant to the provisions of the 1940 Act and related rules, the Fund may participate in an affiliated or non-affiliated cash sweep program. In the cash sweep program, uninvested cash balances of the Fund may be used to purchase shares of affiliated or non-affiliated money market funds or cash management pooled investment vehicles that operate as money market funds. The Fund is eligible to participate in the cash sweep program (the “Investing Funds”). The Adviser has an inherent conflict of interest because of its fiduciary duties to the affiliated money market funds or cash management pooled investment vehicles and the Investing Funds. Janus Henderson Cash Liquidity Fund LLC (the “Sweep Vehicle”) is an affiliated unregistered cash management pooled investment vehicle that invests primarily in highly-rated short-term fixed-income securities. The Sweep Vehicle operates pursuant to the provisions of the 1940 Act that govern the operation of money market funds and prices its shares at NAV reflecting market-based values of its portfolio securities (i.e., a “floating” NAV) rounded to the fourth decimal place (e.g., $1.0000). The Sweep Vehicle is permitted to impose a liquidity fee (of up to 2%) on redemptions from the Sweep Vehicle or a redemption gate that temporarily suspends redemptions from the Sweep Vehicle for up to 10 business days during a 90 day period. There are no restrictions on the Fund's ability to withdraw investments from the Sweep Vehicle at will, and there are no
Janus Henderson Overseas Fund
Notes to Financial Statements (Unaudited)
unfunded capital commitments due from the Fund to the Sweep Vehicle. The Sweep Vehicle does not charge any management fee, sales charge or service fee.
Any purchases and sales, realized gains/losses and recorded dividends from affiliated investments during the period ended March 31, 2023 can be found in the “Schedules of Affiliated Investments” located in the Schedule of Investments.
As of March 31, 2023, shares of the Fund were owned by affiliates of the Adviser, and/or other funds advised by the Adviser, as indicated in the table below:
| | | | | | |
Class | % of Class Owned | | % of Fund Owned | | |
Class A Shares | - | % | - | % | |
Class C Shares | - | | - | | |
Class D Shares | - | | - | | |
Class I Shares | - | | - | | |
Class N Shares | 32 | | 2 | | |
Class R Shares | - | | - | | |
Class S Shares | - | | - | | |
Class T Shares | - | | - | | |
| | | | | | |
The Fund is permitted to purchase or sell securities (“cross-trade”) between itself and other funds or accounts managed by the Adviser in accordance with Rule 17a-7 under the Investment Company Act of 1940 (“Rule 17a-7”), when the transaction is consistent with the investment objectives and policies of the Fund and in accordance with the Internal Cross Trade Procedures adopted by the Trust’s Board of Trustees. These procedures have been designed to ensure that any cross-trade of securities by the Fund from or to another fund or account that is or could be considered an affiliate of the Fund under certain limited circumstances by virtue of having a common investment adviser, common Officer, or common Trustee complies with Rule 17a-7. Under these procedures, each cross-trade is effected at the current market price to save costs where allowed. During the period ended March 31, 2023, the Fund engaged in cross trades amounting to $12,486,479 in purchases.
4. Federal Income Tax
Income and capital gains distributions are determined in accordance with income tax regulations that may differ from US GAAP. These differences are due to differing treatments for items such as net short-term gains, deferral of wash sale losses, foreign currency transactions, net investment losses, and capital loss carryovers.
The Fund has elected to treat gains and losses on forward foreign currency contracts as capital gains and losses, if applicable. Other foreign currency gains and losses on debt instruments are treated as ordinary income for federal income tax purposes pursuant to Section 988 of the Internal Revenue Code.
Accumulated capital losses noted below represent net capital loss carryovers, as of September 30, 2022, that may be available to offset future realized capital gains and thereby reduce future taxable gains distributions. The following table shows these capital loss carryovers.
| | | | | | |
| | | | | |
Capital Loss Carryover Schedule | | |
For the year ended September 30, 2022 | | |
| No Expiration | | | |
| Short-Term | Long-Term | Accumulated
Capital Losses | | |
| $(174,056,974) | $(1,347,187,852) | $(1,521,244,826) | | |
Janus Henderson Overseas Fund
Notes to Financial Statements (Unaudited)
The aggregate cost of investments and the composition of unrealized appreciation and depreciation of investment securities for federal income tax purposes as of March 31, 2023 are noted below. The primary differences between book and tax appreciation or depreciation of investments are wash sale loss deferrals and investments in partnerships
| | | | |
Federal Tax Cost | Unrealized
Appreciation | Unrealized
(Depreciation) | Net Tax Appreciation/
(Depreciation) |
$ 2,199,762,893 | $ 422,085,664 | $(54,065,535) | $ 368,020,129 |
5. Capital Share Transactions
| | | | | | | |
| | | | | | |
| | Period ended March 31, 2023 | | Year ended September 30, 2022 |
| | Shares | Amount | | Shares | Amount |
| | | | | | | |
Class A Shares: | | | | | |
Shares sold | 116,015 | $ 4,810,345 | | 150,131 | $ 5,617,275 |
Reinvested dividends and distributions | 5,978 | 237,997 | | 3,517 | 148,824 |
Shares repurchased | (72,379) | (2,911,989) | | (77,473) | (3,142,324) |
Net Increase/(Decrease) | 49,614 | $ 2,136,353 | | 76,175 | $ 2,623,775 |
Class C Shares: | | | | | |
Shares sold | 61,522 | $ 2,425,778 | | 36,815 | $ 1,473,830 |
Reinvested dividends and distributions | 672 | 26,327 | | - | - |
Shares repurchased | (35,583) | (1,464,993) | | (8,855) | (362,899) |
Net Increase/(Decrease) | 26,611 | $ 987,112 | | 27,960 | $ 1,110,931 |
Class D Shares: | | | | | |
Shares sold | 167,822 | $ 6,849,388 | | 295,417 | $ 12,439,513 |
Reinvested dividends and distributions | 230,818 | 9,085,002 | | 169,001 | 7,069,316 |
Shares repurchased | (546,038) | (21,821,321) | | (1,540,034) | (63,194,526) |
Net Increase/(Decrease) | (147,398) | $ (5,886,931) | | (1,075,616) | $ (43,685,697) |
Class I Shares: | | | | | |
Shares sold | 12,713,741 | $517,769,864 | | 11,619,053 | $468,755,843 |
Reinvested dividends and distributions | 286,787 | 11,319,469 | | 99,055 | 4,156,347 |
Shares repurchased | (3,479,297) | (138,384,218) | | (3,155,471) | (124,372,209) |
Net Increase/(Decrease) | 9,521,231 | $390,705,115 | | 8,562,637 | $348,539,981 |
Class N Shares: | | | | | |
Shares sold | 1,734,638 | $ 68,902,986 | | 979,538 | $ 41,252,029 |
Reinvested dividends and distributions | 51,130 | 2,006,853 | | 18,317 | 764,172 |
Shares repurchased | (265,226) | (10,672,104) | | (322,727) | (13,297,113) |
Net Increase/(Decrease) | 1,520,542 | $ 60,237,735 | | 675,128 | $ 28,719,088 |
Class R Shares: | | | | | |
Shares sold | 51,358 | $ 2,072,691 | | 99,343 | $ 4,051,490 |
Reinvested dividends and distributions | 5,082 | 199,263 | | 2,475 | 103,109 |
Shares repurchased | (53,365) | (2,149,444) | | (124,408) | (5,085,754) |
Net Increase/(Decrease) | 3,075 | $ 122,510 | | (22,590) | $ (931,155) |
Class S Shares: | | | | | |
Shares sold | 194,836 | $ 7,823,370 | | 481,312 | $ 19,583,450 |
Reinvested dividends and distributions | 35,677 | 1,408,178 | | 21,616 | 906,569 |
Shares repurchased | (325,085) | (12,949,557) | | (496,046) | (20,486,797) |
Net Increase/(Decrease) | (94,572) | $ (3,718,009) | | 6,882 | $ 3,222 |
Class T Shares: | | | | | |
Shares sold | 1,211,213 | $ 50,053,695 | | 990,010 | $ 41,112,070 |
Reinvested dividends and distributions | 171,986 | 6,781,400 | | 118,113 | 4,948,931 |
Shares repurchased | (742,194) | (29,454,823) | | (1,556,278) | (63,923,032) |
Net Increase/(Decrease) | 641,005 | $ 27,380,272 | | (448,155) | $ (17,862,031) |
Janus Henderson Overseas Fund
Notes to Financial Statements (Unaudited)
6. Purchases and Sales of Investment Securities
For the period ended March 31, 2023, the aggregate cost of purchases and proceeds from sales of investment securities (excluding any short-term securities, short-term options contracts, TBAs, and in-kind transactions, as applicable) was as follows:
| | | | |
Purchases of
Securities | Proceeds from Sales
of Securities | Purchases of Long-
Term U.S. Government
Obligations | Proceeds from Sales
of Long-Term U.S.
Government Obligations |
$715,610,605 | $ 299,268,829 | $ - | $ - |
7. Subsequent Event
Management has evaluated whether any events or transactions occurred subsequent to March 31, 2023 and through the date of issuance of the Fund’s financial statements and determined that there were no material events or transactions that would require recognition or disclosure in the Fund’s financial statements.
Janus Henderson Overseas Fund
Additional Information (unaudited)
Proxy Voting Policies and Voting Record
A description of the policies and procedures that the Fund uses to determine how to vote proxies relating to its portfolio securities is available without charge: (i) upon request, by calling 1-800-525-1093; (ii) on the Fund’s website at janushenderson.com/proxyvoting; and (iii) on the SEC’s website at http://www.sec.gov. Additionally, information regarding the Fund’s proxy voting record for the most recent twelve-month period ended June 30 is also available, free of charge, through janushenderson.com/proxyvoting and from the SEC’s website at http://www.sec.gov.
Full Holdings
The Fund files its complete portfolio holdings (schedule of investments) with the SEC as an exhibit to Form N-PORT within 60 days of the end of the first and third fiscal quarters, and in the annual report and semiannual report to shareholders. The Fund’s Form N-PORT filings and annual and semiannual reports: (i) are available on the SEC’s website at http://www.sec.gov; and (ii) are available without charge, upon request, by calling a Janus Henderson representative at 1-877-335-2687 (toll free) (or 1-800-525-3713 if you hold Class D Shares). Portfolio holdings consisting of at least the names of the holdings are generally available on a monthly basis with a 30-day lag under Full Holdings for the Fund at janushenderson.com/info (or janushenderson.com/reports if you hold Class D Shares).
APPROVAL OF ADVISORY AGREEMENTS DURING THE PERIOD
The Trustees of Janus Aspen Series, each of whom serves as an “independent” Trustee (the “Trustees”), oversee the management of each portfolio of Janus Aspen Series (each, a “VIT Portfolio,” and collectively, the “VIT Portfolios”), as well as each fund of Janus Investment Fund (each, a “Fund,” and collectively, the “Funds” and together with the VIT Portfolios, the “Janus Henderson Funds,” and each, a “Janus Henderson Fund”). As required by law, the Trustees determine annually whether to continue the investment advisory agreement for each Janus Henderson Fund.
In connection with their most recent consideration of those agreements for each Janus Henderson Fund, the Trustees received and reviewed information provided by Janus Henderson Investors US LLC (the “Adviser”) in response to requests of the Trustees and their independent legal counsel. They also received and reviewed information and analysis provided by, and in response to requests of, their independent fee consultant. Throughout their consideration of the agreements, the Trustees were advised by their independent legal counsel. The Trustees met with management to consider the agreements, and also met separately in executive session with their independent legal counsel and their independent fee consultant.
At meetings held on November 9-10, 2022 and December 13-14, 2022, the Trustees evaluated the information provided by the Adviser and the independent fee consultant, as well as other information provided by the Adviser and the independent fee consultant during the year. Following such evaluation, the Trustees determined that the overall arrangements between each Janus Henderson Fund and the Adviser were fair and reasonable in light of the nature, extent, and quality of the services provided by the Adviser and its affiliates, the fees charged for those services, and other matters that the Trustees considered relevant in the exercise of their business judgment, and unanimously approved the continuation of the investment advisory agreement for each Janus Henderson Fund for the period from February 1, 2023 through February 1, 2024, subject to earlier termination as provided for in each agreement.
In considering the continuation of those agreements, the Trustees reviewed and analyzed various factors that they determined were relevant, including the factors described below, none of which by itself was considered dispositive. However, the material factors and conclusions that formed the basis for the Trustees’ determination to approve the continuation of the agreements are discussed separately below. Also included is a summary of the independent fee consultant’s conclusions and opinions that arose during, and were included as part of, the Trustees’ consideration of the agreements. “Management fees,” as used herein, reflect actual annual advisory fees and, for the purpose of peer comparisons any administration fees (excluding out of pocket costs), net of any waivers, paid by a fund as a percentage of average net assets.
Nature, Extent and Quality of Services
The Trustees reviewed the nature, extent, and quality of the services provided by the Adviser to the Janus Henderson Funds, taking into account the investment objective, strategies, and policies of each Janus Henderson Fund, and the knowledge the Trustees gained from their regular meetings with management on at least a quarterly basis and their ongoing review of information related to the Janus Henderson Funds. In addition, the Trustees reviewed the resources and key personnel of the Adviser, particularly noting those employees who provide investment and risk management services to the Janus Henderson Funds. The Trustees also considered other services provided to the Janus Henderson
Janus Henderson Overseas Fund
Additional Information (unaudited)
Funds by the Adviser, such as managing the execution of portfolio transactions and the selection of broker-dealers for those transactions. The Trustees considered the Adviser’s role as administrator to the Janus Henderson Funds, noting that the Adviser generally does not receive a fee for its services as administrator, but is reimbursed for its out-of-pocket costs. The Trustees considered the role of the Adviser in monitoring adherence to the Janus Henderson Funds’ investment restrictions, providing support services for the Trustees and Trustee committees, and overseeing communications with Janus Henderson Fund shareholders and the activities of other service providers, including monitoring compliance with various policies and procedures of the Janus Henderson Funds and with applicable securities laws and regulations.
In this regard, the independent fee consultant noted that the Adviser provides a number of different services for the Janus Henderson Funds and their shareholders, ranging from investment management services to various other servicing functions, and that, in its view, the Adviser is a capable provider of those services. The independent fee consultant also provided its belief that the Adviser has developed a number of institutional competitive advantages that should enable it to provide superior investment and service performance over the long term.
The Trustees concluded that the nature, extent, and quality of the services provided by the Adviser to each Janus Henderson Fund were appropriate and consistent with the terms of the respective advisory agreements, and that, taking into account steps taken to address those Janus Henderson Funds whose performance lagged that of their peers for certain periods, the Janus Henderson Funds were likely to benefit from the continued provision of those services. They also concluded that the Adviser had sufficient personnel, with the appropriate education and experience, to serve the Janus Henderson Funds effectively and had demonstrated its ability to attract well-qualified personnel.
Performance of the Funds
The Trustees considered the performance results of each Janus Henderson Fund over various time periods. They noted that they considered Janus Henderson Fund performance data throughout the year, including periodic meetings with each Janus Henderson Fund’s portfolio manager(s), and also reviewed information comparing each Janus Henderson Fund’s performance with the performance of comparable fund peer groups identified by Broadridge Financial Solutions, Inc. (“Broadridge”), an independent data provider, and with the Janus Henderson Fund’s benchmark index. In this regard, the independent fee consultant found that the overall Janus Henderson Funds’ performance has been reasonable, noting that: (i) for the 36 months ended May 31, 2022, approximately 38% of the Janus Henderson Funds were in the top two quartiles of their Broadridge peer groups; (ii) for the 36 months ended September 30, 2022, approximately 45% of the Janus Henderson Funds were in the top two quartiles of performance as reported by Morningstar, and (iii) for the 12 months ended September 30, 2022, approximately 55% of the Janus Henderson Funds were in the top two quartiles of performance as reported by Morningstar.
The Trustees considered the performance of each Janus Henderson Fund, noting that performance may vary by share class, and noted the following with respect to the Funds:
Asset Allocation Funds
· For Janus Henderson Global Allocation Fund – Conservative, the Trustees noted that the Fund’s performance was in the third Broadridge quartile for the 36 months ended May 31, 2022 and the bottom Broadridge quartile for the 12 months ended May 31, 2022. The Trustees noted the reasons for the Fund’s underperformance and the steps the Adviser had taken or was taking to improve performance.
· For Janus Henderson Global Allocation Fund – Growth, the Trustees noted that the Fund’s performance was in the bottom Broadridge quartile for the 36 months ended May 31, 2022 and the bottom Broadridge quartile for the 12 months ended May 31, 2022. The Trustees noted the reasons for the Fund’s underperformance and the steps the Adviser had taken or was taking to improve performance.
· For Janus Henderson Global Allocation Fund – Moderate, the Trustees noted that the Fund’s performance was in the bottom Broadridge quartile for the 36 months ended May 31, 2022 and the bottom Broadridge quartile for the 12 months ended May 31, 2022. The Trustees noted the reasons for the Fund’s underperformance and the steps the Adviser had taken or was taking to improve performance.
Fixed-Income Funds
· For Janus Henderson Absolute Return Income Opportunities Fund, the Trustees noted that the Fund’s performance was in the third Broadridge quartile for the 36 months ended May 31, 2022 and the first Broadridge quartile for the 12 months ended May 31, 2022. The Trustees noted the reasons for the Fund’s underperformance,
Janus Henderson Overseas Fund
Additional Information (unaudited)
the steps the Adviser had taken or was taking to improve performance, and that the performance trend was improving.
· For Janus Developed World Bond Fund, the Trustees noted that the Fund’s performance was in the bottom Broadridge quartile for the 36 months ended May 31, 2022 and the bottom Broadridge quartile for the 12 months ended May 31, 2022. The Trustees noted the reasons for the Fund’s underperformance and the steps the Adviser had taken or was taking to improve performance.
· For Janus Henderson Flexible Bond Fund, the Trustees noted that the Fund’s performance was in the first Broadridge quartile for the 36 months ended May 31, 2022 and the second Broadridge quartile for the 12 months ended May 31, 2022.
· For Janus Henderson Global Bond Fund, the Trustees noted that the Fund’s performance was in the third Broadridge quartile for the 36 months ended May 31, 2022 and the bottom Broadridge quartile for the 12 months ended May 31, 2022. The Trustees noted the reasons for the Fund’s underperformance and the steps the Adviser had taken or was taking to improve performance.
· For Janus Henderson High-Yield Fund, the Trustees noted that the Fund’s performance was in the third Broadridge quartile for the 36 months ended May 31, 2022 and the bottom Broadridge quartile for the 12 months ended May 31, 2022. The Trustees noted the reasons for the Fund’s underperformance and the steps the Adviser had taken or was taking to improve performance.
· For Janus Henderson Multi-Sector Income Fund, the Trustees noted that the Fund’s performance was in the second Broadridge quartile for the 36 months ended May 31, 2022 and the third Broadridge quartile for the 12 months ended May 31, 2022.
· For Janus Henderson Short Duration Flexible Bond Fund, the Trustees noted that the Fund’s performance was in the third Broadridge quartile for the 36 months ended May 31, 2022 and the bottom Broadridge quartile for the 12 months ended May 31, 2022. The Trustees noted the reasons for the Fund’s underperformance and the steps the Adviser had taken or was taking to improve performance.
Global and International Equity Funds
· For Janus Henderson Asia Equity Fund, the Trustees noted that the Fund’s performance was in the third Broadridge quartile for the 36 months ended May 31, 2022 and the third Broadridge quartile for the 12 months ended May 31, 2022. The Trustees noted the reasons for the Fund’s underperformance, while also noting that the Fund has a performance fee structure that results in lower management fees during periods of underperformance, and the steps the Adviser had taken or was taking to improve performance.
· For Janus Henderson Emerging Markets Fund, the Trustees noted that the Fund’s performance was in the third Broadridge quartile for the 36 months ended May 31, 2022 and the third Broadridge quartile for the 12 months ended May 31, 2022. The Trustees noted the reasons for the Fund’s underperformance and the steps the Adviser had taken or was taking to improve performance.
· For Janus Henderson European Focus Fund, the Trustees noted that the Fund’s performance was in the first Broadridge quartile for the 36 months ended May 31, 2022 and the second Broadridge quartile for the 12 months ended May 31, 2022.
· For Janus Henderson Global Equity Income Fund, the Trustees noted that the Fund’s performance was in the third Broadridge quartile for the 36 months ended May 31, 2022 and the first Broadridge quartile for the 12 months ended May 31, 2022. The Trustees noted the reasons for the Fund’s underperformance, the steps the Adviser had taken or was taking to improve performance, and that the performance trend was improving.
· For Janus Henderson Global Life Sciences Fund, the Trustees noted that the Fund’s performance was in the third Broadridge quartile for the 36 months ended May 31, 2022 and the second Broadridge quartile for the 12 months ended May 31, 2022. The Trustees noted the reasons for the Fund’s underperformance, the steps the Adviser had taken or was taking to improve performance, and that the performance trend was improving.
· For Janus Henderson Global Sustainable Equity Fund, the Trustees noted that the Fund’s performance was in the second Broadridge quartile for the 12 months ended May 31, 2022. The Trustees noted that 36 month-end performance was not yet available.
Janus Henderson Overseas Fund
Additional Information (unaudited)
· For Janus Henderson Global Real Estate Fund, the Trustees noted that the Fund’s performance was in the second Broadridge quartile for the 36 months ended May 31, 2022 and the bottom Broadridge quartile for the 12 months ended May 31, 2022.
· For Janus Henderson Global Research Fund, the Trustees noted that the Fund’s performance was in the second Broadridge quartile for the 36 months ended May 31, 2022 and the first Broadridge quartile for the 12 months ended May 31, 2022.
· For Janus Henderson Global Select Fund, the Trustees noted that the Fund’s performance was in the first Broadridge quartile for the 36 months ended May 31, 2022 and the first Broadridge quartile for the 12 months ended May 31, 2022.
· For Janus Henderson Global Technology and Innovation Fund, the Trustees noted that the Fund’s performance was in the second Broadridge quartile for the 36 months ended May 31, 2022 and the second Broadridge quartile for the 12 months ended May 31, 2022.
· For Janus Henderson International Opportunities Fund, the Trustees noted that the Fund’s performance was in the bottom Broadridge quartile for the 36 months ended May 31, 2022 and the third Broadridge quartile for the 12 months ended May 31, 2022. The Trustees noted the reasons for the Fund’s underperformance and the steps the Adviser had taken or was taking to improve performance.
· For Janus Henderson Overseas Fund, the Trustees noted that the Fund’s performance was in the first Broadridge quartile for the 36 months ended May 31, 2022 and the first Broadridge quartile for the 12 months ended May 31, 2022.
· For Janus Henderson Responsible International Dividend Fund (formerly the Janus Henderson Dividend & Income Builder Fund), the Trustees noted that the Fund’s performance was in the bottom Broadridge quartile for the 36 months ended May 31, 2022 and the bottom Broadridge quartile for the 12 months ended May 31, 2022. The Trustees noted the reasons for the Fund’s underperformance and the steps the Adviser had taken or was taking to improve performance.
Money Market Funds
· For Janus Henderson Government Money Market Fund, the Trustees noted that the Fund’s performance was in the third Broadridge quartile for the 36 months ended May 31, 2022 and the bottom Broadridge quartile for the 12 months ended May 31, 2022. The Trustees noted the reasons for the Fund’s underperformance and the steps the Adviser had taken or was taking to improve performance.
· For Janus Henderson Money Market Fund, the Trustees noted that the Fund’s performance was in the third Broadridge quartile for the 36 months ended May 31, 2022 and the bottom Broadridge quartile for the 12 months ended May 31, 2022. The Trustees noted the reasons for the Fund’s underperformance and the steps the Adviser had taken or was taking to improve performance.
Multi-Asset Funds
· For Janus Henderson Adaptive Global Allocation Fund, the Trustees noted that the Fund’s performance was in bottom Broadridge quartile for the 36 months ended May 31, 2022 and the second Broadridge quartile for the 12 months ended May 31, 2022. The Trustees noted the reasons for the Fund’s underperformance, the steps the Adviser had taken or was taking to improve performance, and that the performance trend was improving.
· For Janus Henderson Balanced Fund, the Trustees noted that the Fund’s performance was in the first Broadridge quartile for the 36 months ended May 31, 2022 and the first Broadridge quartile for the 12 months ended May 31, 2022.
U.S. Equity Funds
· For Janus Henderson Adaptive Risk Managed U.S. Equity Fund, the Trustees noted that the Fund’s performance was in the bottom Broadridge quartile for the 36 months ended May 31, 2022 and the second Broadridge quartile for the 12 months ended May 31, 2022. The Trustees noted the reasons for the Fund’s underperformance, the steps the Adviser had taken or were taking to improve performance, and that the performance trend was improving.
Janus Henderson Overseas Fund
Additional Information (unaudited)
· For Janus Henderson Contrarian Fund, the Trustees noted that the Fund’s performance was in the first Broadridge quartile for the 36 months ended May 31, 2022 and the bottom Broadridge quartile for the 12 months ended May 31, 2022.
· For Janus Henderson Enterprise Fund, the Trustees noted that the Fund’s performance was in the second Broadridge quartile for the 36 months ended May 31, 2022 and the first Broadridge quartile for the 12 months ended May 31, 2022.
· For Janus Henderson Forty Fund, the Trustees noted that the Fund’s performance was in the third Broadridge quartile for the 36 months ended May 31, 2022 and the bottom Broadridge quartile for the 12 months ended May 31, 2022. The Trustees noted the reasons for the Fund’s underperformance and the steps the Adviser had taken or was taking to improve performance.
· For Janus Henderson Growth and Income Fund, the Trustees noted that the Fund’s performance was in the bottom Broadridge quartile for the 36 months ended May 31, 2022 and the first Broadridge quartile for the 12 months ended May 31, 2022. The Trustees noted the reasons for the Fund’s underperformance, the steps the Adviser had taken or was taking to improve performance, and that the performance trend was improving.
· For Janus Henderson Mid Cap Value Fund, the Trustees noted that the Fund’s performance was in the bottom Broadridge quartile for the 36 months ended May 31, 2022 and the second Broadridge quartile for the 12 months ended May 31, 2022. The Trustees noted the reasons for the Fund’s underperformance, while also noting that the Fund has a performance fee structure that results in lower management fees during periods of underperformance, the steps the Adviser had taken or was taking to improve performance, and that the performance trend was improving.
· For Janus Henderson Research Fund, the Trustees noted that the Fund’s performance was in the third Broadridge quartile for the 36 months ended May 31, 2022 and the third Broadridge quartile for the 12 months ended May 31, 2022. The Trustees noted the reasons for the Fund’s underperformance, while also noting that the Fund has a performance fee structure that results in lower management fees during periods of underperformance and the steps the Adviser had taken or was taking to improve performance.
· For Janus Henderson Small Cap Value Fund, the Trustees noted that the Fund’s performance was in the bottom Broadridge quartile for the 36 months ended May 31, 2022 and the second Broadridge quartile for the 12 months ended May 31, 2022. The Trustees noted the reasons for the Fund’s underperformance, while also noting that the Fund has a performance fee structure that results in lower management fees during periods of underperformance, the steps the Adviser had taken or was taking to improve performance, and that the performance trend was improving.
· For Janus Henderson Small-Mid Cap Value Fund, the Trustees noted that the Fund’s performance was in the bottom Broadridge quartile for the 36 months ended May 31, 2022 and the second Broadridge quartile for the 12 months ended May 31, 2022. The Trustees noted the reasons for the Fund’s underperformance, while also noting that the Fund has a performance fee structure that results in lower management fees during periods of underperformance, the steps the Adviser had taken or was taking to improve performance, and that the performance trend is improving.
· For Janus Henderson Triton Fund, the Trustees noted that the Fund’s performance was in the bottom Broadridge quartile for the 36 months ended May 31, 2022 and the second Broadridge quartile for the 12 months ended May 31, 2022. The Trustees noted the reasons for the Fund’s underperformance, the steps the Adviser had taken or was taking to improve performance, and that the performance trend was improving.
· For Janus Henderson Venture Fund, the Trustees noted that the Fund’s performance was in the bottom Broadridge quartile for the 36 months ended May 31, 2022 and the second Broadridge quartile for the 12 months ended May 31, 2022. The Trustees noted the reasons for the Fund’s underperformance, the steps the Adviser had taken or was taking to improve performance, and that the performance trend was improving.
In consideration of each Janus Henderson Fund’s performance, the Trustees concluded that, taking into account the factors relevant to performance, as well as other considerations, including steps taken to improve performance, as applicable, the Janus Henderson Fund’s performance warranted continuation of such Janus Henderson Fund’s investment advisory agreement.
Janus Henderson Overseas Fund
Additional Information (unaudited)
Costs of Services Provided
The Trustees examined information regarding the fees and expenses of each Janus Henderson Fund in comparison to similar information for other comparable funds as provided by Broadridge, an independent data provider. They also reviewed an analysis of that information provided by their independent fee consultant. The independent fee consultant provided its belief that the management fees charged by the Adviser to each of the Janus Henderson Funds under the current investment advisory and administration agreements are reasonable in relation to the services provided by the Adviser. The independent fee consultant found: (1) the total expenses and management fees of the Janus Henderson Funds to be reasonable relative to other comparable mutual funds; (2) the total expenses, on average, were 6% under the average total expenses of the respective Broadridge peer group; and (3) the management fees for the Janus Henderson Funds, on average, were 5% under the average management fees for the respective Broadridge peer group. The Trustees also considered the total expenses for each share class of each Janus Henderson Fund compared to the average total expenses for its Broadridge Expense Group and to average total expenses for its Broadridge Expense Universe.
For Janus Henderson Funds with three or more years of performance history, the independent fee consultant also performed a systematic “focus list” analysis of expenses which assessed fund fees in the context of fund performance being delivered. Based on this analysis, the independent fee consultant found that the combination of service quality/performance and expenses on these individual Janus Henderson Funds was reasonable in light of performance trends, performance histories, changes in portfolio management, relative average net asset levels, and the existence of performance fees, breakpoints, and/or expense waivers on such Janus Henderson Funds.
The Trustees considered the methodology used by the Adviser in determining compensation payable to portfolio managers, the competitive environment for investment management talent, and the competitive market for mutual funds in different distribution channels.
The Trustees also reviewed management fees charged by the Adviser to comparable separate account clients and to comparable non-affiliated funds subadvised by the Adviser (for which the Adviser provides only or primarily portfolio management services). Although in most instances subadvisory and separate account fee rates for various investment strategies were lower than management fee rates for Janus Henderson Funds having a similar strategy, the Trustees considered that the Adviser noted that, under the terms of the management agreements with the Janus Henderson Funds, the Adviser performs significant additional services for the Janus Henderson Funds that it does not provide to those other clients, including administration services, oversight of the Janus Henderson Funds’ other service providers, Trustee support, regulatory compliance and numerous other services, and that, in serving the Janus Henderson Funds, the Adviser assumes many legal risks and other costs that it does not assume in servicing its other clients. Moreover, the Trustees noted that the independent fee consultant found that: (1) the management fees the Adviser charges to the Janus Henderson Funds are reasonable in relation to the management fees the Adviser charges to funds subadvised by the Adviser and to the fees the Adviser charges to its institutional separate account clients; (2) these subadvised and institutional separate accounts have different service and infrastructure needs and operate in markets very different from the retail fund market; (3) Janus Henderson mutual fund investors enjoy reasonable fees relative to the fees charged in these other markets; and (4) as part of its 2022 review, 9 of 11 Janus Henderson Funds have lower management fees than similar funds subadvised by the Adviser. The Trustees noted that for the two Janus Henderson Funds that did not, management fees for each were under the average of its 15(c) peer group.
The Trustees considered the fees for each Janus Henderson Fund for its fiscal year ended in 2021 and noted the following with regard to each Janus Henderson Fund’s total expenses, net of applicable fee waivers (the Fund’s “total expenses”) as reflected in the comparative information provided by Broadridge:
Asset Allocation Funds
· For Janus Henderson Global Allocation Fund – Conservative, the Trustees noted that, although the Fund’s total expenses exceeded the peer group average for certain share classes, overall the Fund’s total expenses were reasonable. The Trustees also noted that the Adviser has contractually agreed to limit the Fund’s expenses.
· For Janus Henderson Global Allocation Fund – Growth, the Trustees noted that, although the Fund’s total expenses exceeded the peer group average for certain share classes, overall the Fund’s total expenses were reasonable. The Trustees also noted that the Adviser has contractually agreed to limit the Fund’s expenses, although this limit did not apply because the Fund’s total expenses as shown were below the applicable fee limit.
Janus Henderson Overseas Fund
Additional Information (unaudited)
· For Janus Henderson Global Allocation Fund – Moderate, the Trustees noted that, although the Fund’s total expenses exceeded the peer group average for one share class, overall the Fund’s total expenses were reasonable. The Trustees also noted that the Adviser has contractually agreed to limit the Fund’s expenses.
Fixed-Income Funds
· For Janus Henderson Absolute Return Income Opportunities Fund, the Trustees noted that, although the Fund’s total expenses exceeded the peer group average for certain share classes, overall the Fund’s total expenses were reasonable. The Trustees also noted that the Adviser has contractually agreed to limit the Fund’s expenses.
· For Janus Henderson Developed World Bond Fund, the Trustees noted that, although the Fund’s total expenses exceeded the peer group average for one share class, overall the Fund’s total expenses were reasonable. The Trustees also noted that the Adviser has contractually agreed to limit the Fund’s expenses.
· For Janus Henderson Flexible Bond Fund, the Trustees noted that, although the Fund’s total expenses exceeded the peer group average for certain share classes, overall the Fund’s total expenses were reasonable. The Trustees also noted that the Adviser has contractually agreed to limit the Fund’s expenses, although this limit did not apply because the Fund’s total expenses as shown were below the applicable fee limit.
· For Janus Henderson Global Bond Fund, the Trustees noted that, although the Fund’s total expenses exceeded the peer group average for certain share classes, overall the Fund’s total expenses were reasonable. The Trustees also noted that the Adviser has contractually agreed to limit the Fund’s expenses.
· For Janus Henderson High-Yield Fund, the Trustees noted that, although the Fund’s total expenses exceeded the peer group average for certain share classes, overall the Fund’s total expenses were reasonable. The Trustees also noted that the Adviser has contractually agreed to limit the Fund’s expenses.
· For Janus Henderson Multi-Sector Income Fund, the Trustees noted that, although the Fund’s total expenses exceeded the peer group average for certain share classes, overall the Fund’s total expenses were reasonable. The Trustees also noted that the Adviser has contractually agreed to limit the Fund’s expenses.
· For Janus Henderson Short Duration Flexible Bond Fund, the Trustees noted that, although the Fund’s total expenses exceeded the peer group average for certain share classes, overall the Fund’s total expenses were reasonable. The Trustees also noted that the Adviser has contractually agreed to limit the Fund’s expenses.
Global and International Equity Funds
· For Janus Henderson Asia Equity Fund, the Trustees noted that, although the Fund’s total expenses exceeded the peer group average for certain share classes, overall the Fund’s total expenses were reasonable. The Trustees also noted that the Adviser has contractually agreed to limit the Fund’s expenses.
· For Janus Henderson Emerging Markets Fund, the Trustees noted that, although the Fund’s total expenses exceeded the peer group average for certain share classes, overall the Fund’s total expenses were reasonable. The Trustees also noted that the Adviser has contractually agreed to limit the Fund’s expenses.
· For Janus Henderson European Focus Fund, the Trustees noted that, although the Fund’s total expenses exceeded the peer group average for one share class, overall the Fund’s expenses were reasonable. The Trustees also noted that the Adviser has contractually agreed to limit the Fund’s expenses.
· For Janus Henderson Global Equity Income Fund, the Trustees noted that, although the Fund’s total expenses exceeded the peer group average for one share class, overall the Fund’s total expenses were reasonable. The Trustees also noted that the Adviser has contractually agreed to limit the Fund’s expenses, although this limit did not apply because the Fund’s total expenses as shown were below the applicable fee limit.
· For Janus Henderson Global Life Sciences Fund, the Trustees noted that the Fund’s total expenses were below the peer group average for all share classes.
· For Janus Henderson Global Real Estate Fund, the Trustees noted that, although the Fund’s total expenses exceeded the peer group average for certain share classes, overall the Fund’s total expenses were reasonable. The Trustees also noted that the Adviser has contractually agreed to limit the Fund’s expenses, although this limit did not apply because the Fund’s total expenses as shown were below the applicable fee limit.
Janus Henderson Overseas Fund
Additional Information (unaudited)
· For Janus Henderson Global Research Fund, the Trustees noted that, although the Fund’s total expenses exceeded the peer group average for one share class, overall the Fund’s total expenses were reasonable. The Trustees also noted that the Adviser has contractually agreed to limit the Fund’s expenses, although this limit did not apply because the Fund’s total expenses as shown were below the applicable fee limit.
· For Janus Henderson Global Select Fund, the Trustees noted that, although the Fund’s total expenses exceeded the peer group average for certain share classes, overall the Fund’s total expenses were reasonable. The Trustees also noted that the Adviser has contractually agreed to limit the Fund’s expenses.
· For Janus Henderson Global Sustainable Equity Fund, the Trustees noted that, although the Fund’s total expenses exceeded the peer group average for certain share classes, overall the Fund’s expenses were reasonable. The Trustees also noted that the Adviser has contractually agreed to limit the Fund’s expenses.
· For Janus Henderson Global Technology and Innovation Fund, the Trustees noted that the Fund’s total expenses were below the peer group average for all share classes.
· For Janus Henderson International Opportunities Fund, the Trustees noted that, although the Fund’s total expenses exceeded the peer group average for certain share classes, overall the Fund’s expenses were reasonable. The Trustees also noted that the Adviser has contractually agreed to limit the Fund’s expenses.
· For Janus Henderson Overseas Fund, the Trustees noted that although the Fund’s total expenses exceeded the peer group average for certain share classes, overall the Fund’s total expenses were reasonable. The Trustees also noted that the Adviser has contractually agreed to limit the Fund’s expenses, although this limit did not apply because the Fund’s total expenses as shown were below the applicable fee limit.
· For Janus Henderson Responsible International Dividend Fund (formerly the Janus Henderson Dividend & Income Builder Fund), the Trustees noted that, although the Fund’s total expenses exceeded the peer group for one share class, overall the Fund’s total expenses were reasonable. The Trustees also noted that the Adviser has contractually agreed to limit the Fund’s expenses.
Money Market Funds
· For Janus Henderson Government Money Market Fund, the Trustees noted that the Fund’s total expenses were below the peer group average for all share classes.
· For Janus Henderson Money Market Fund, the Trustees noted that the Fund’s total expenses were below the peer group average for all share classes.
Multi-Asset Funds
· For Janus Henderson Adaptive Global Allocation Fund, the Trustees noted that, that the Fund’s total expenses were below the peer group average for all share classes.
· For Janus Henderson Balanced Fund, the Trustees noted that, although the Fund’s total expenses exceeded the peer group average for certain share classes, overall the Fund’s total expenses were reasonable. The Trustees also noted that the Adviser has contractually agreed to limit the Fund’s expenses, although this limit did not apply because the Fund’s total expenses as shown were below the applicable fee limit.
U.S. Equity Funds
· For Janus Henderson Adaptive Risk Managed U.S. Equity Fund, the Trustees noted that, although the Fund’s total expenses exceeded the peer group average for certain share classes, overall the Fund’s total expenses were reasonable. The Trustees also noted that the Adviser has contractually agreed to limit the Fund’s expenses, although this limit did not apply because the Fund’s total expenses as shown were below the applicable fee limit.
· For Janus Henderson Contrarian Fund, the Trustees noted that, although the Fund’s total expenses exceeded the peer group average for all share classes, overall the Fund’s total expenses were reasonable. The Trustees also noted that the Adviser had contractually agreed to limit the Fund’s expenses.
· For Janus Henderson Enterprise Fund, the Trustees noted that, although the Fund’s total expenses exceeded the peer group average for certain share classes, overall the Fund’s total expenses were reasonable. The Trustees also noted that the Adviser has contractually agreed to limit the Fund’s expenses, although this limit did not apply because the Fund’s total expenses as shown were below the applicable fee limit.
Janus Henderson Overseas Fund
Additional Information (unaudited)
· For Janus Henderson Forty Fund, the Trustees noted that, although the Fund’s total expenses exceeded the peer group average for certain share classes, overall the Fund’s total expenses were reasonable. The Trustees also noted that the Adviser has contractually agreed to limit the Fund’s expenses, although this limit did not apply because the Fund’s total expenses as shown were below the applicable fee limit.
· For Janus Henderson Growth and Income Fund, the Trustees noted that, although the Fund’s total expenses exceeded the peer group average for certain share classes, overall the Fund’s total expenses were reasonable. The Trustees also noted that the Adviser has contractually agreed to limit the Fund’s expenses, although this limit did not apply because the Fund’s total expenses as shown were below the applicable fee limit.
· For Janus Henderson Mid Cap Value Fund, the Trustees noted that the Fund’s total expenses were below the peer group average for all share classes.
· For Janus Henderson Research Fund, the Trustees noted that, although the Fund’s total expenses exceeded the peer group average for certain share classes, overall the Fund’s total expenses were reasonable. The Trustees also noted that the Adviser has contractually agreed to limit the Fund’s expenses.
· For Janus Henderson Small Cap Value Fund, the Trustees noted that, although the Fund’s total expenses exceeded the peer group average for one share class, overall the Fund’s total expenses were reasonable. The Trustees also noted that the Adviser has contractually agreed to limit the Fund’s expenses, although this limit did not apply because the Fund’s total expenses as shown were below the applicable fee limit.
· For Janus Henderson Small-Mid Cap Value Fund, the Trustees noted that the Fund’s total expenses were below the peer group average for all share classes.
· For Janus Henderson Triton Fund, the Trustees noted that, although the Fund’s total expenses exceeded the peer group average for one share class, overall the Fund’s total expenses were reasonable. The Trustees also noted that the Adviser has contractually agreed to limit the Fund’s expenses, although this limit did not apply because the Fund’s total expenses as shown were below the applicable fee limit.
· For Janus Henderson Venture Fund, the Trustees noted that although the Fund’s total expenses exceeded the peer group average for one share class, overall the Fund’s total expenses were reasonable. The Trustees also noted that the Adviser has contractually agreed to limit the Fund’s expenses, although this limit did not apply because the Fund’s total expenses as shown were below the applicable fee limit.
The Trustees reviewed information on the overall profitability to the Adviser and its affiliates from their relationships with the Janus Henderson Funds, and considered profitability data of other publicly traded mutual fund advisers. The Trustees recognized that profitability comparisons among fund managers are difficult because of the variation in the type of comparative information that is publicly available, and the profitability of any fund manager is affected by numerous factors, including the organizational structure of the particular fund manager, differences in complex size, difference in product mix, difference in types of business (mutual fund, institutional and other), differences in the types of funds and other accounts it manages, possible other lines of business, the methodology for allocating expenses and the fund manager’s capital structure and cost of capital.
Additionally, the Trustees considered the estimated profitability to the Adviser from the investment management services it provided to each Janus Henderson Fund. In their review, the Trustees considered whether the Adviser receive adequate incentives and resources to manage the Janus Henderson Funds effectively. In reviewing profitability, the Trustees noted that the estimated profitability for an individual Janus Henderson Fund is necessarily a product of the allocation methodology utilized by the Adviser to allocate its expenses as part of the estimated profitability calculation. In this regard, the Trustees noted that the independent fee consultant found as part of its 2022 review that (1) the expense allocation methodology and rationales utilized by the Adviser were reasonable and (2) no clear correlation exists between expense allocations and operating margins. The Trustees also considered that the estimated profitability for an individual Janus Henderson Fund was influenced by a number of factors, including not only the allocation methodology selected, but also the presence of fee waivers and expense caps, and whether the Janus Henderson Fund’s investment management agreement contained breakpoints or a performance fee component. The Trustees determined, after taking into account these factors, among others, that the Adviser’s estimated profitability with respect to each Janus Henderson Fund was not unreasonable in relation to the services provided, and that the variation in the range of such estimated profitability among the Janus Henderson Funds was not a material factor in the Board’s approval of the reasonableness of any Janus Henderson Fund’s investment management fees.
Janus Henderson Overseas Fund
Additional Information (unaudited)
The Trustees concluded that the management fees payable by each Janus Henderson Fund to the Adviser were reasonable in relation to the nature, extent, and quality of the services provided, taking into account the fees charged by other advisers for managing comparable mutual funds with similar strategies, the fees the Adviser charges to other clients, and, as applicable, the impact of fund performance on management fees payable by the Janus Henderson Funds. The Trustees also concluded that each Janus Henderson Fund’s total expenses were reasonable, taking into account the size of the Janus Henderson Fund, the quality of services provided by the Adviser, the investment performance of the Janus Henderson Fund, and any expense limitations agreed to or provided by the Adviser.
Economies of Scale
The Trustees considered information about the potential for the Adviser to realize economies of scale as the assets of the Janus Henderson Funds increase. They noted that their independent fee consultant published a report to the Trustees in June 2022 which provided its research and analysis into economies of scale. They also noted that, although many Janus Henderson Funds pay advisory fees at a fixed base rate as a percentage of net assets, without any breakpoints or performance fees, their independent fee consultant concluded that 75% of these Janus Henderson Funds’ have contractual management fees (gross of waivers) below their Broadridge Expense Group averages. The Trustees also noted the following from the independent fee consultant’s report: (1) that 31% of Janus Henderson Funds had management fee breakpoints in place whereby investors pay lower management fees as fund AUM increases; (2) that 29% of Janus Henderson Funds have low flat-rate fees and performance fees where the Adviser is incentivized to invest in resources which drive Janus Henderson Fund performance; and (3) that 39% of Janus Henderson Funds have low flat-rate fees versus peers where investors pay low fixed fees when the Janus Henderson Fund is small/midsized and higher fees when the Janus Henderson Fund grows in assets. The Trustees also noted that the Janus Henderson Funds share directly in economies of scale through the significant investments made by the Adviser and its affiliates related to services provided to the Funds and the lower charges of third-party service providers that are based in part on the combined scale of all of the Janus Henderson Funds.
The Trustees also considered the independent fee consultant’s conclusion that, given the limitations of various analytical approaches to economies of scale and their conflicting results, it is difficult to analytically confirm or deny the existence of economies of scale in the Janus Henderson complex. In this regard, the independent consultant concluded that (1) to the extent there were economies of scale at the Adviser, the Adviser’s general strategy of setting fixed management fees below peers appeared to share any such economies with investors even on smaller Janus Henderson Funds which have not yet achieved those economies and (2) by setting lower fixed fees from the start on these Janus Henderson Funds, the Adviser appeared to be investing to increase the likelihood that these Janus Henderson Funds will grow to a level to achieve any economies of scale that may exist. Further, the independent fee consultant provided its belief that Janus Henderson Fund investors are well-served by the fee levels and performance fee structures in place on the Janus Henderson Funds in light of any economies of scale that may be present at the Adviser.
Based on all of the information reviewed, including the recent and past research and analysis conducted by the Trustees’ independent fee consultant, the Trustees concluded that the current fee structure of each Janus Henderson Fund was reasonable and that the current rates of fees do reflect a sharing between the Adviser and the Janus Henderson Fund of any economies of scale that may be present at the current asset level of the Janus Henderson Fund.
Other Benefits to the Adviser
The Trustees also considered benefits that accrue to the Adviser and its affiliates from their relationships with the Janus Henderson Funds. They recognized that two affiliates of the Adviser separately serve the Janus Henderson Funds as transfer agent and distributor, respectively, and the transfer agent receives compensation directly from the non-money market Janus Henderson Funds for services provided, and that such compensation contributes to the overall profitability of the Adviser and its affiliates that results from their relationship with the Janus Henderson Funds. The Trustees also considered the Adviser’s past and proposed use of commissions paid by the Janus Henderson Funds on portfolio brokerage transactions to obtain proprietary and third-party research products and services benefiting the Janus Henderson Fund and/or other clients of the Adviser and/or the Adviser. The Trustees concluded that the Adviser’s use of these types of client commission arrangements to obtain proprietary and third-party research products and services was consistent with regulatory requirements and guidelines and was likely to benefit each Janus Henderson Fund. The Trustees also concluded that, other than the services provided by the Adviser and its affiliates pursuant to the agreements and the fees to be paid by each Janus Henderson Fund therefor, the Janus Henderson
Janus Henderson Overseas Fund
Additional Information (unaudited)
Funds and the Adviser may potentially benefit from their relationship with each other in other ways. They concluded that the Adviser and its affiliates share directly in economies of scale through the lower charges of third-party service providers that are based in part on the combined scale of the Janus Henderson Funds and other clients serviced by the Adviser and its affiliates. They also concluded that the Adviser benefits from the receipt of research products and services acquired through commissions paid on portfolio transactions of the Janus Henderson Funds and that the Janus Henderson Funds benefit from the Adviser’s receipt of those products and services as well as research products and services acquired through commissions paid by other clients of the Adviser. They further concluded that the success of any Janus Henderson Fund could attract other business to the Adviser or other Janus Henderson Funds, and that the success of the Adviser could enhance the Adviser’s ability to serve the Janus Henderson Funds.
Janus Henderson Overseas Fund
Liquidity Risk Management Program (unaudited)
Liquidity Risk Management Program
Rule 22e-4 under the Investment Company Act of 1940, as amended (the “Liquidity Rule”), requires open-end funds (but not money market funds) to adopt and implement a written liquidity risk management program (the “LRMP”) that is reasonably designed to assess and manage liquidity risk, which is the risk that a fund could not meet redemption requests without significant dilution of remaining investors’ interest in the fund. The Fund has implemented a LRMP, which incorporates the following elements: (i) assessment, management, and periodic review of liquidity risk; (ii) classification of portfolio holdings; (iii) the establishment and monitoring of a highly liquid investment minimum, as applicable; (iv) a 15% limitation on a Fund’s illiquid investments; (v) redemptions in-kind; and (vi) board oversight.
The Trustees of the Fund (the “Trustees”) have designated Janus Henderson Investors US LLC, the Fund’s investment adviser (the “Adviser”), as the Program Administrator for the LRMP responsible for administering the LRMP and carrying out the specific responsibilities of the LRMP. A working group comprised of various teams within the Adviser’s business is responsible for administering the LRMP and carrying out the specific responsibilities of different aspects of the LRMP (the “Liquidity Risk Working Group”). In assessing each Fund’s liquidity risk, the Liquidity Risk Working Group periodically considers, as relevant, factors including (i) the liquidity of a Fund’s portfolio investments during normal and reasonably foreseeable stressed conditions; (ii) whether a Fund’s investment strategy is appropriate for an open-end fund; (iii) the extent to which a Fund’s strategy involves a relatively concentrated portfolio or large positions in any issuer; (iv) a Fund’s use of borrowing for investment purposes; and (v) a Fund’s use of derivatives.
The Liquidity Rule requires the Trustees to review at least annually a written report provided by the Program Administrator that addresses the operation of the LRMP and assesses its adequacy and the effectiveness of its implementation, including, if applicable, the operation of the highly liquid investment minimum, and any material changes to the LRMP (the “Program Administrator Report”). At a meeting held on March 15, 2023, the Adviser provided the Program Administrator Report to the Trustees which covered the operation of the LRMP from January 1, 2022 through December 31, 2022 (the “Reporting Period”).
The Program Administrator Report discussed the operation and effectiveness of the LRMP during the Reporting Period. Among other things, the Program Administrator Report indicated that there were no material changes to the LRMP during the Reporting Period, although there were certain methodology adjustments implemented relating to a change in data provider. Additionally, the findings presented in the Program Administrator Report indicated that the LRMP operated adequately during the Reporting Period. These findings included that the Fund was able to meet redemptions during the normal course of business during the Reporting Period. The Program Administrator Report also stated that the Fund did not exceed the 15% limit on illiquid assets during the Reporting Period, that the Fund held primarily highly liquid assets, and was considered to be a primarily highly liquid fund during the Reporting Period. Also included among the Program Administrator Report’s findings was the determination that the Fund’s investment strategy remains appropriate for an open-end fund. In addition, the Adviser expressed its belief in the Program Administrator Report that the LRMP is reasonably designed and adequate to assess and manage the Fund’s liquidity risk, considering the Fund’s particular risks and circumstances, and includes policies and procedures reasonably designed to implement each required component of the Liquidity Rule.
There can be no assurance that the LRMP will achieve its objectives in the future. Please refer to your Fund’s prospectus for more information regarding the risks to which an investment in the Fund may be subject.
Janus Henderson Overseas Fund
Useful Information About Your Fund Report (unaudited)
Performance Overviews
Performance overview graphs compare the performance of a hypothetical $10,000 investment in the Fund with one or more widely used market indices. When comparing the performance of the Fund with an index, keep in mind that market indices are not available for investment and do not reflect deduction of expenses.
Average annual total returns are quoted for a Fund with more than one year of performance history. Average annual total return is calculated by taking the growth or decline in value of an investment over a period of time, including reinvestment of dividends and distributions, then calculating the annual compounded percentage rate that would have produced the same result had the rate of growth been constant throughout the period. Average annual total return does not reflect the deduction of taxes that a shareholder would pay on Fund distributions or redemptions of Fund shares.
Cumulative total returns are quoted for a Fund with less than one year of performance history. Cumulative total return is the growth or decline in value of an investment over time, independent of the period of time involved. Cumulative total return does not reflect the deduction of taxes that a shareholder would pay on Fund distributions or redemptions of Fund shares.
Pursuant to federal securities rules, expense ratios shown in the performance chart reflect subsidized (if applicable) and unsubsidized ratios. The total annual fund operating expenses ratio is gross of any fee waivers, reflecting the Fund’s unsubsidized expense ratio. The net annual fund operating expenses ratio (if applicable) includes contractual waivers of the Adviser and reflects the Fund’s subsidized expense ratio. Ratios may be higher or lower than those shown in the “Financial Highlights” in this report.
Schedule of Investments
Following the performance overview section is the Fund’s Schedule of Investments. This schedule reports the types of securities held in the Fund on the last day of the reporting period. Securities are usually listed by type (common stock, corporate bonds, U.S. Government obligations, etc.) and by industry classification (banking, communications, insurance, etc.). Holdings are subject to change without notice.
The value of each security is quoted as of the last day of the reporting period. The value of securities denominated in foreign currencies is converted into U.S. dollars.
If the Fund invests in foreign securities, it will also provide a summary of investments by country. This summary reports the Fund exposure to different countries by providing the percentage of securities invested in each country. The country of each security represents the country of risk. A company may be allocated to a country based on other factors such as location of the company’s principal office, the location of the principal trading market for the company’s securities, or the country where a majority of the company’s revenues are derived. The Fund’s Schedule of Investments relies upon the industry group and country classifications published by Bloomberg and/or MSCI Inc.
Tables listing details of individual forward currency contracts, futures, written options, swaptions, and swaps follow the Fund’s Schedule of Investments (if applicable).
Statement of Assets and Liabilities
This statement is often referred to as the “balance sheet.” It lists the assets and liabilities of the Fund on the last day of the reporting period.
The Fund’s assets are calculated by adding the value of the securities owned, the receivable for securities sold but not yet settled, the receivable for dividends declared but not yet received on securities owned, and the receivable for Fund shares sold to investors but not yet settled. The Fund’s liabilities include payables for securities purchased but not yet settled, Fund shares redeemed but not yet paid, and expenses owed but not yet paid. Additionally, there may be other assets and liabilities such as unrealized gain or loss on forward currency contracts.
The section entitled “Net Assets Consist of” breaks down the components of the Fund’s net assets. Because the Fund must distribute substantially all earnings, you will notice that a significant portion of net assets is shareholder capital.
The last section of this statement reports the net asset value (“NAV”) per share on the last day of the reporting period. The NAV is calculated by dividing the Fund’s net assets for each share class (assets minus liabilities) by the number of shares outstanding.
Janus Henderson Overseas Fund
Useful Information About Your Fund Report (unaudited)
Statement of Operations
This statement details the Fund’s income, expenses, realized gains and losses on securities and currency transactions, and changes in unrealized appreciation or depreciation of Fund holdings.
The first section in this statement, entitled “Investment Income,” reports the dividends earned from securities and interest earned from interest-bearing securities in the Fund.
The next section reports the expenses incurred by the Fund, including the advisory fee paid to the investment adviser, transfer agent fees and expenses, and printing and postage for mailing statements, financial reports and prospectuses. Expense offsets and expense reimbursements, if any, are also shown.
The last section lists the amounts of realized gains or losses from investment and foreign currency transactions, and changes in unrealized appreciation or depreciation of investments and foreign currency-denominated assets and liabilities. The Fund will realize a gain (or loss) when it sells its position in a particular security. A change in unrealized gain (or loss) refers to the change in net appreciation or depreciation of the Fund during the reporting period. “Net Realized and Unrealized Gain/(Loss) on Investments” is affected both by changes in the market value of Fund holdings and by gains (or losses) realized during the reporting period.
Statements of Changes in Net Assets
These statements report the increase or decrease in the Fund’s net assets during the reporting period. Changes in the Fund’s net assets are attributable to investment operations, dividends and distributions to investors, and capital share transactions. This is important to investors because it shows exactly what caused the Fund’s net asset size to change during the period.
The first section summarizes the information from the Statement of Operations regarding changes in net assets due to the Fund’s investment operations. The Fund’s net assets may also change as a result of dividend and capital gains distributions to investors. If investors receive their dividends and/or distributions in cash, money is taken out of the Fund to pay the dividend and/or distribution. If investors reinvest their dividends and/or distributions, the Fund’s net assets will not be affected.
The reinvestment of dividends and distributions is included under “Capital Share Transactions.” “Capital Shares” refers to the money investors contribute to the Fund through purchases or withdrawals via redemptions. The Fund’s net assets will increase and decrease in value as investors purchase and redeem shares from the Fund.
Financial Highlights
This schedule provides a per-share breakdown of the components that affect the Fund’s NAV for current and past reporting periods as well as total return, asset size, ratios, and portfolio turnover rate.
The first line in the table reflects the NAV per share at the beginning of the reporting period. The next line reports the net investment income/(loss) per share. Following is the per share total of net gains/(losses), realized and unrealized. Per share dividends and distributions to investors are then subtracted to arrive at the NAV per share at the end of the period. The next line reflects the total return for the period. The total return may include adjustments in accordance with generally accepted accounting principles required at the period end for financial reporting purposes. As a result, the total return may differ from the total return reflected for individual shareholder transactions. Also included are ratios of expenses and net investment income to average net assets.
The Fund’s expenses may be reduced through expense offsets and expense reimbursements. The ratios shown reflect expenses before and after any such offsets and reimbursements.
The ratio of net investment income/(loss) summarizes the income earned less expenses, divided by the average net assets of the Fund during the reporting period. Do not confuse this ratio with the Fund’s yield. The net investment income ratio is not a true measure of the Fund’s yield because it does not take into account the dividends distributed to the Fund’s investors.
The next figure is the portfolio turnover rate, which measures the buying and selling activity in the Fund. Portfolio turnover is affected by market conditions, changes in the asset size of the Fund, fluctuating volume of shareholder purchase and redemption orders, the nature of the Fund’s investments, and the investment style and/or outlook of the portfolio manager(s) and/or investment personnel. A 100% rate implies that an amount equal to the value of the entire portfolio was replaced once during the fiscal year; a 50% rate means that an amount equal to the value of half the
Janus Henderson Overseas Fund
Useful Information About Your Fund Report (unaudited)
portfolio is traded in a year; and a 200% rate means that an amount equal to the value of the entire portfolio is traded every six months.
| | | | | | | | |
| | | | | |

| | | | |
This report is submitted for the general information of shareholders of the Fund. It is not an offer or solicitation for the Fund and is not authorized for distribution to prospective investors unless preceded or accompanied by an effective prospectus. |
Janus Henderson is a trademark of Janus Henderson Group plc or one of its subsidiaries. © Janus Henderson Group plc. Janus Henderson Group is the ultimate parent of Janus Henderson Distributors US LLC. Janus Henderson Distributors US LLC |
| | | | 125-24-93050 05-23 |
| | | | |
| | | |
| | | SEMIANNUAL REPORT March 31, 2023 |
| | |
| | Janus Henderson Research Fund |
| | |
| | Janus Investment Fund |
| |
| | | HIGHLIGHTS · Investment strategy behind your fund · Fund performance, characteristics
and holdings |
Table of Contents
Janus Henderson Research Fund
| | | | | | |
| | | | | | Team-Based Approach Led by Matthew Peron, Director of Research |
| | | |
Janus Henderson Research Fund (unaudited)
Fund At A Glance
March 31, 2023
| | | | | | | | | | |
| | | | | | | | | |
| | | | | | | | | |
| | | | | | | | | |
| 5 Top Contributors - Holdings | 5 Top Detractors - Holdings |
| | Average
Weight | | Relative
Contribution | | | Average
Weight | | Relative
Contribution |
| NVIDIA Corp | 3.82% | | 1.18% | | Atlassian Corp - Class A | 1.36% | | -0.66% |
| Tesla Inc | 0.79% | | 1.01% | | Rivian Automotive Inc - Class A | 0.35% | | -0.40% |
| Booking Holdings Inc | 2.36% | | 0.73% | | Constellation Brands Inc - Class A | 1.51% | | -0.30% |
| ASML Holding NV | 1.69% | | 0.64% | | CoStar Group Inc | 1.21% | | -0.18% |
| Advanced Micro Devices Inc | 1.43% | | 0.33% | | Olaplex Holdings Inc | 0.13% | | -0.17% |
| | | | | | | |
| 5 Top Contributors - Sectors* | | | | | |
| | | Relative | | Fund | Russell 1000 Growth Index |
| | | Contribution | | Average Weight | Average Weight |
| Technology | | 1.63% | | 38.42% | 38.86% |
| Consumer | | 1.40% | | 18.46% | 18.23% |
| Industrials | | 0.93% | | 11.29% | 11.32% |
| Financials | | 0.12% | | 8.57% | 8.55% |
| Energy | | 0.05% | | 1.54% | 1.67% |
| | | | | | |
| | | | | | |
| 3 Top Detractors - Sectors* | | | | | |
| | | Relative | | Fund | Russell 1000 Growth Index |
| | | Contribution | | Average Weight | Average Weight |
| Communications | | -0.53% | | 8.82% | 8.81% |
| Healthcare | | -0.15% | | 12.70% | 12.55% |
| Other** | | 0.02% | | 0.20% | 0.00% |
| | | | | | | |
| Relative contribution reflects how the portolio's holdings impacted return relative to the benchmark. Cash and securities not held in the portfolio are not shown. For equity portfolios, relative contribution compares the performance of a security in the portfolio to the benchmark's total return, factoring in the difference in weight of that security in the benchmark. Returns are calculated using daily returns and previous day ending weights rolled up by ticker, excluding fixed income securities, gross of advisory fees, may exclude certain derivatives and will differ from actual performance.
Performance attribution reflects returns gross of advisory fees and may differ from actual returns as they are based on end of day holdings. Attribution is calculated by geometrically linking daily returns for the portfolio and index. |
* | The sectors listed above reflect those covered by the six analyst teams who comprise the Janus Henderson Research Team. |
** | Not a GICS classified sector. |
Janus Henderson Research Fund (unaudited)
Fund At A Glance
March 31, 2023
| | |
5 Largest Equity Holdings - (% of Net Assets) |
Microsoft Corp | |
Software | 11.6% |
Apple Inc | |
Technology Hardware, Storage & Peripherals | 7.4% |
Alphabet Inc - Class C | |
Interactive Media & Services | 5.7% |
NVIDIA Corp | |
Semiconductor & Semiconductor Equipment | 5.2% |
Amazon.com Inc | |
Multiline Retail | 4.7% |
| | 34.6% |
| | | | | | |
Asset Allocation - (% of Net Assets) | |
Common Stocks | | 99.9% | |
Investments Purchased with Cash Collateral from Securities Lending | | 0.0% | |
Private Placements | | 0.0% | |
Other | | 0.1% |
| | | 100.0% |
| | |
Top Country Allocations - Long Positions - (% of Investment Securities) |
As of March 31, 2023 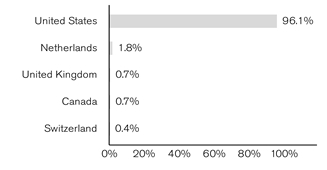
| As of September 30, 2022 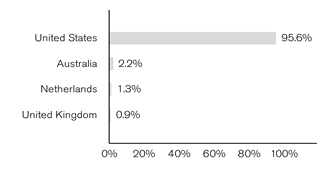
|
Janus Henderson Research Fund (unaudited)
Performance
| |
See important disclosures on the next page. |
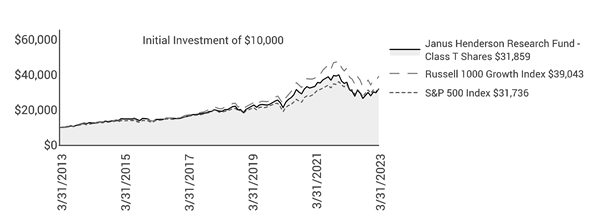
| | | | | | | | | | | | |
| | | | | | | | | | |
| | | | | | | | | | |
Average Annual Total Return - for the periods ended March 31, 2023 | | | Prospectus Expense Ratios |
| | Fiscal
Year-to-Date | One
Year | Five
Year | Ten
Year | Since
Inception* | | | Total Annual Fund
Operating Expenses‡ | Net Annual Fund
Operating Expenses‡ |
Class A Shares at NAV | | 19.87% | -11.02% | 10.43% | 12.16% | 10.87% | | | 0.84% | 0.84% |
Class A Shares at MOP | | 12.97% | -16.13% | 9.13% | 11.50% | 10.65% | | | | |
Class C Shares at NAV | | 19.30% | -11.75% | 9.65% | 11.36% | 10.09% | | | 1.62% | 1.62% |
Class C Shares at CDSC | | 18.30% | -12.63% | 9.65% | 11.36% | 10.09% | | | | |
Class D Shares | | 19.99% | -10.84% | 10.65% | 12.38% | 11.10% | | | 0.64% | 0.64% |
Class I Shares | | 19.99% | -10.81% | 10.71% | 12.46% | 11.14% | | | 0.59% | 0.59% |
Class N Shares | | 20.06% | -10.73% | 10.80% | 12.55% | 11.15% | | | 0.52% | 0.52% |
Class R Shares | | 19.60% | -11.41% | 9.94% | 11.72% | 10.57% | | | 1.34% | 1.29% |
Class S Shares | | 19.76% | -11.18% | 10.24% | 11.99% | 10.71% | | | 1.04% | 1.04% |
Class T Shares | | 19.94% | -10.92% | 10.54% | 12.29% | 11.06% | | | 0.77% | 0.77% |
Russell 1000 Growth Index | | 16.88% | -10.90% | 13.66% | 14.59% | 10.06% | | | | |
S&P 500 Index | | 15.62% | -7.73% | 11.19% | 12.24% | 9.86% | | | | |
Morningstar Quartile - Class T Shares | | - | 2nd | 2nd | 2nd | 1st | | | | |
Morningstar Ranking - based on total returns for Large Growth Funds | | - | 436/1,256 | 530/1,129 | 512/1,037 | 24/364 | | | | |
Returns quoted are past performance and do not guarantee future results; current performance may be lower or higher. Investment returns and principal value will vary; there may be a gain or loss when shares are sold. For the most recent month-end performance call 800.668.0434 (or 800.525.3713 if you hold shares directly with Janus Henderson) or visit janushenderson.com/performance (or janushenderson.com/allfunds if you hold shares directly with Janus Henderson).
Maximum Offering Price (MOP) returns include the maximum sales charge of 5.75%. Net Asset Value (NAV) returns exclude this charge, which would have reduced returns.
CDSC returns include a 1% contingent deferred sales charge (CDSC) on Shares redeemed within 12 months of purchase. Net Asset Value (NAV) returns exclude this charge, which would have reduced returns.
Janus Henderson Research Fund (unaudited)
Performance
Net expense ratios reflect the expense waiver, if any, contractually agreed to for at least a one-year period commencing on January 27, 2023. This contractual waiver may be terminated or modified only at the discretion of the Board of Trustees.
This Fund has a performance-based management fee that may adjust up or down based on the Fund’s performance.
Performance may be affected by risks that include those associated with foreign and emerging markets, fixed income securities, high-yield and high-risk securities, undervalued, overlooked and smaller capitalization companies, real estate related securities including Real Estate Investment Trusts (REITs), Environmental, Social and Governance (ESG) factors, non-diversification, portfolio turnover, derivatives, short sales, initial public offerings (IPOs) and potential conflicts of interest. Each product has different risks. Please see the prospectus for more information about risks, holdings and other details.
Returns include reinvestment of all dividends and distributions and do not reflect the deduction of taxes that a shareholder would pay on Fund distributions or redemptions of Fund shares. The returns do not include adjustments in accordance with generally accepted accounting principles required at the period end for financial reporting purposes.
Class A Shares, Class C Shares, and Class S Shares commenced operations on July 6, 2009. Performance shown for each class for periods prior to July 6, 2009, reflects the performance of the Fund’s Class J Shares, the initial share class (renamed Class T Shares effective February 16, 2010), calculated using the fees and expenses of each respective class, without the effect of any fee and expense limitations or waivers.
Class D Shares commenced operations on February 16, 2010. Performance shown for periods prior to February 16, 2010, reflects the performance of the Fund’s former Class J Shares, calculated using the fees and expenses in effect during the periods shown, net of any applicable fee and expense limitations or waivers.
Class I Shares commenced operations on July 6, 2009. Performance shown for periods prior to July 6, 2009, reflects the performance of the Fund’s former Class J Shares, calculated using the fees and expenses of Class J Shares, net of any applicable fee and expense limitations or waivers.
Class N Shares commenced operations on May 31, 2012. Performance shown for periods prior to May 31, 2012, reflects the performance of the Fund's Class T Shares, calculated using the fees and expenses of Class T Shares, net of any applicable fee and expense limitations or waivers.
Class R Shares commenced operations on January 27, 2017. Performance shown for periods prior to January 27, 2017, reflects the historical performance of the Fund’s Class T Shares, calculated using the fees and expenses of Class R Shares, without the effect of any fee and expense limitations or waivers.
If each share class of the Fund had been available during periods prior to its commencement, the performance shown may have been different. The performance shown for periods following the Fund's commencement of each share class reflects the fees and expenses of each respective share class, net of any applicable fee and expense limitations or waivers. Please refer to the Fund's prospectuses for further details concerning historical performance.
Ranking is for the share class shown only; other classes may have different performance characteristics. When an expense waiver is in effect, it may have a material effect on the total return, and therefore the ranking for the period.
© 2023 Morningstar, Inc. All Rights Reserved.
There is no assurance that the investment process will consistently lead to successful investing.
See Notes to Schedule of Investments and Other Information for index definitions.
Index performance does not reflect the expenses of managing a portfolio as an index is unmanaged and not available for direct investment.
See “Useful Information About Your Fund Report.”
*The Fund’s inception date – May 3, 1993
‡ As stated in the prospectus. See Financial Highlights for actual expense ratios during the reporting period.
Janus Henderson Research Fund (unaudited)
Expense Examples
As a shareholder of the Fund, you incur two types of costs: (1) transaction costs, such as sales charges (loads) on purchase payments (applicable to Class A Shares only); and (2) ongoing costs, including management fees; 12b-1 distribution and shareholder servicing fees; transfer agent fees and expenses payable pursuant to the Transfer Agency Agreement; and other Fund expenses. This example is intended to help you understand your ongoing costs (in dollars) of investing in the Fund and to compare these costs with the ongoing costs of investing in other mutual funds. To do so, compare this 5% hypothetical example with the 5% hypothetical examples that appear in the shareholder reports of the other funds. The example is based upon an investment of $1,000 invested at the beginning of the period and held for the six-months indicated, unless noted otherwise in the table and footnotes below.
Actual Expenses
The information in the table under the heading “Actual” provides information about actual account values and actual expenses. You may use the information in these columns, together with the amount you invested, to estimate the expenses that you paid over the period. Simply divide your account value by $1,000 (for example, an $8,600 account value divided by $1,000 = 8.6), then multiply the result by the number in the appropriate column for your share class under the heading entitled “Expenses Paid During Period” to estimate the expenses you paid on your account during the period.
Hypothetical Example for Comparison Purposes
The information in the table under the heading “Hypothetical (5% return before expenses)” provides information about hypothetical account values and hypothetical expenses based upon the Fund’s actual expense ratio and an assumed rate of return of 5% per year before expenses, which is not the Fund’s actual return. The hypothetical account values and expenses may not be used to estimate the actual ending account balance or expenses you paid for the period. You may use this information to compare the ongoing costs of investing in the Fund and other funds. To do so, compare this 5% hypothetical example with the 5% hypothetical examples that appear in the shareholder reports of the other funds. Additionally, for an analysis of the fees associated with an investment in any share class or other similar funds, please visit www.finra.org/fundanalyzer.
Please note that the expenses shown in the table are meant to highlight your ongoing costs only and do not reflect any transaction costs. These fees are fully described in the Fund’s prospectuses. Therefore, the hypothetical examples are useful in comparing ongoing costs only, and will not help you determine the relative total costs of owning different funds. In addition, if these transaction costs were included, your costs would have been higher.
| | | | | | | | | | | |
| | | | | | | | |
| | | Actual | | Hypothetical
(5% return before expenses) | |
| Beginning
Account
Value
(10/1/22) | Ending
Account
Value
(3/31/23) | Expenses
Paid During
Period
(10/1/22 - 3/31/23)† | | Beginning
Account
Value
(10/1/22) | Ending
Account
Value
(3/31/23) | Expenses
Paid During
Period
(10/1/22 - 3/31/23)† | Net Annualized
Expense Ratio
(10/1/22 - 3/31/23) |
Class A Shares | $1,000.00 | $1,198.70 | $4.44 | | $1,000.00 | $1,020.89 | $4.08 | 0.81% |
Class C Shares | $1,000.00 | $1,193.00 | $9.79 | | $1,000.00 | $1,016.01 | $9.00 | 1.79% |
Class D Shares | $1,000.00 | $1,199.90 | $3.35 | | $1,000.00 | $1,021.89 | $3.07 | 0.61% |
Class I Shares | $1,000.00 | $1,199.90 | $3.13 | | $1,000.00 | $1,022.09 | $2.87 | 0.57% |
Class N Shares | $1,000.00 | $1,200.60 | $2.63 | | $1,000.00 | $1,022.54 | $2.42 | 0.48% |
Class R Shares | $1,000.00 | $1,196.00 | $6.84 | | $1,000.00 | $1,018.70 | $6.29 | 1.25% |
Class S Shares | $1,000.00 | $1,197.60 | $5.48 | | $1,000.00 | $1,019.95 | $5.04 | 1.00% |
Class T Shares | $1,000.00 | $1,199.40 | $3.89 | | $1,000.00 | $1,021.39 | $3.58 | 0.71% |
† | Expenses Paid During Period are equal to the Net Annualized Expense Ratio multiplied by the average account value over the period, multiplied by 182/365 (to reflect the one-half year period). Expenses in the examples include the effect of applicable fee waivers and/or expense reimbursements, if any. Had such waivers and/or reimbursements not been in effect, your expenses would have been higher. Please refer to the Notes to Financial Statements or the Fund’s prospectuses for more information regarding waivers and/or reimbursements. |
Janus Henderson Research Fund
Schedule of Investments (unaudited)
March 31, 2023
| | | | | | | | |
Shares or
Principal Amounts | | | Value | |
Common Stocks– 99.9% | | | |
Aerospace & Defense – 1.9% | | | |
| | General Dynamics Corp | | 622,170 | | | $141,985,416 | |
| | Howmet Aerospace Inc | | 3,755,644 | | | 159,126,636 | |
| | | 301,112,052 | |
Air Freight & Logistics – 2.5% | | | |
| | United Parcel Service Inc | | 2,061,352 | | | 399,881,674 | |
Automobiles – 1.0% | | | |
| | Rivian Automotive Inc - Class A* | | 2,351,114 | | | 36,395,245 | |
| | Tesla Inc* | | 626,275 | | | 129,927,011 | |
| | | 166,322,256 | |
Beverages – 2.0% | | | |
| | Constellation Brands Inc - Class A | | 933,812 | | | 210,938,793 | |
| | Monster Beverage Corp | | 2,015,402 | | | 108,851,862 | |
| | | 319,790,655 | |
Biotechnology – 4.3% | | | |
| | AbbVie Inc | | 1,506,566 | | | 240,101,423 | |
| | Amgen Inc | | 268,450 | | | 64,897,787 | |
| | Argenx SE (ADR)* | | 140,832 | | | 52,471,187 | |
| | Regeneron Pharmaceuticals Inc* | | 65,316 | | | 53,668,198 | |
| | Sarepta Therapeutics Inc* | | 676,485 | | | 93,239,927 | |
| | United Therapeutics Corp* | | 376,534 | | | 84,328,555 | |
| | Vertex Pharmaceuticals Inc* | | 294,423 | | | 92,763,855 | |
| | | 681,470,932 | |
Capital Markets – 1.4% | | | |
| | Blackstone Group Inc | | 960,626 | | | 84,381,388 | |
| | Charles Schwab Corp | | 1,612,532 | | | 84,464,426 | |
| | LPL Financial Holdings Inc | | 242,319 | | | 49,045,366 | |
| | | 217,891,180 | |
Chemicals – 0.5% | | | |
| | Sherwin-Williams Co | | 359,469 | | | 80,797,847 | |
Diversified Financial Services – 6.0% | | | |
| | Apollo Global Management Inc | | 1,248,699 | | | 78,867,829 | |
| | Fidelity National Information Services Inc | | 326,614 | | | 17,744,939 | |
| | Global Payments Inc | | 232,921 | | | 24,512,606 | |
| | Mastercard Inc | | 1,162,792 | | | 422,570,241 | |
| | Visa Inc | | 1,830,101 | | | 412,614,571 | |
| | | 956,310,186 | |
Electronic Equipment, Instruments & Components – 0.4% | | | |
| | Keysight Technologies Inc* | | 384,933 | | | 62,158,981 | |
Energy Equipment & Services – 0.2% | | | |
| | Atlas Energy Solutions Inc - Class A*,# | | 1,780,960 | | | 30,329,749 | |
Entertainment – 1.2% | | | |
| | Liberty Media Corp-Liberty Formula One* | | 2,618,731 | | | 195,959,641 | |
Health Care Equipment & Supplies – 1.1% | | | |
| | Abbott Laboratories | | 979,140 | | | 99,147,716 | |
| | Edwards Lifesciences Corp* | | 998,711 | | | 82,623,361 | |
| | | 181,771,077 | |
Health Care Providers & Services – 2.6% | | | |
| | Centene Corp* | | 671,736 | | | 42,460,433 | |
| | UnitedHealth Group Inc | | 777,861 | | | 367,609,330 | |
| | | 410,069,763 | |
Hotels, Restaurants & Leisure – 3.5% | | | |
| | Booking Holdings Inc* | | 138,799 | | | 368,151,856 | |
| | Caesars Entertainment Inc* | | 1,035,039 | | | 50,520,254 | |
| | Chipotle Mexican Grill Inc* | | 78,093 | | | 133,405,491 | |
| | | 552,077,601 | |
Household Products – 1.6% | | | |
| | Procter & Gamble Co | | 1,730,667 | | | 257,332,876 | |
| | |
See Notes to Schedule of Investments and Other Information and Notes to Financial Statements. |
| |
6 | MARCH 31, 2023 |
Janus Henderson Research Fund
Schedule of Investments (unaudited)
March 31, 2023
| | | | | | | | |
Shares or
Principal Amounts | | | Value | |
Common Stocks– (continued) | | | |
Information Technology Services – 0.3% | | | |
| | Snowflake Inc - Class A* | | 293,557 | | | $45,292,909 | |
Insurance – 0.6% | | | |
| | Aon PLC - Class A | | 283,675 | | | 89,439,891 | |
Interactive Media & Services – 5.7% | | | |
| | Alphabet Inc - Class C* | | 8,665,240 | | | 901,184,960 | |
Life Sciences Tools & Services – 1.1% | | | |
| | Danaher Corp | | 277,102 | | | 69,840,788 | |
| | Illumina Inc* | | 167,323 | | | 38,910,964 | |
| | Thermo Fisher Scientific Inc | | 107,243 | | | 61,811,648 | |
| | | 170,563,400 | |
Machinery – 2.4% | | | |
| | Deere & Co | | 628,012 | | | 259,293,595 | |
| | Ingersoll Rand Inc | | 2,231,045 | | | 129,802,198 | |
| | | 389,095,793 | |
Multiline Retail – 4.7% | | | |
| | Amazon.com Inc* | | 7,261,295 | | | 750,019,160 | |
Oil, Gas & Consumable Fuels – 1.3% | | | |
| | EOG Resources Inc | | 1,751,268 | | | 200,747,851 | |
Personal Products – 0.1% | | | |
| | Olaplex Holdings Inc* | | 3,475,713 | | | 14,841,294 | |
Pharmaceuticals – 2.8% | | | |
| | AstraZeneca PLC (ADR) | | 1,713,250 | | | 118,916,682 | |
| | Eli Lilly & Co | | 373,573 | | | 128,292,440 | |
| | Merck & Co Inc | | 1,346,428 | | | 143,246,475 | |
| | Novartis AG (ADR) | | 677,993 | | | 62,375,356 | |
| | | 452,830,953 | |
Professional Services – 1.0% | | | |
| | CoStar Group Inc* | | 2,188,401 | | | 150,671,409 | |
Road & Rail – 2.0% | | | |
| | JB Hunt Transport Services Inc | | 611,632 | | | 107,316,951 | |
| | TFI International Inc | | 932,904 | | | 111,286,118 | |
| | Uber Technologies Inc* | | 3,326,869 | | | 105,461,747 | |
| | | 324,064,816 | |
Semiconductor & Semiconductor Equipment – 12.9% | | | |
| | Advanced Micro Devices Inc* | | 2,881,503 | | | 282,416,109 | |
| | ASML Holding NV | | 409,431 | | | 278,703,776 | |
| | KLA Corp | | 336,383 | | | 134,274,002 | |
| | Lam Research Corp | | 482,227 | | | 255,638,177 | |
| | Lattice Semiconductor Corp* | | 338,326 | | | 32,310,133 | |
| | Marvell Technology Inc | | 930,418 | | | 40,287,099 | |
| | NVIDIA Corp | | 2,983,770 | | | 828,801,793 | |
| | ON Semiconductor Corp* | | 1,073,856 | | | 88,399,826 | |
| | Texas Instruments Inc | | 652,228 | | | 121,320,930 | |
| | | 2,062,151,845 | |
Software – 20.2% | | | |
| | Adobe Inc* | | 597,116 | | | 230,110,593 | |
| | Atlassian Corp - Class A* | | 900,700 | | | 154,172,819 | |
| | Autodesk Inc* | | 354,366 | | | 73,764,827 | |
| | Cadence Design Systems Inc* | | 975,308 | | | 204,902,458 | |
| | Microsoft Corp | | 6,432,369 | | | 1,854,451,983 | |
| | Palo Alto Networks Inc* | | 460,752 | | | 92,030,604 | |
| | ServiceNow Inc* | | 293,152 | | | 136,233,597 | |
| | Synopsys Inc* | | 481,723 | | | 186,065,509 | |
| | Tyler Technologies Inc* | | 128,980 | | | 45,741,467 | |
| | Workday Inc - Class A* | | 1,160,524 | | | 239,694,627 | |
| | | 3,217,168,484 | |
Specialized Real Estate Investment Trusts (REITs) – 0.3% | | | |
| | American Tower Corp | | 249,792 | | | 51,042,497 | |
| | |
See Notes to Schedule of Investments and Other Information and Notes to Financial Statements. |
| |
Janus Investment Fund | 7 |
Janus Henderson Research Fund
Schedule of Investments (unaudited)
March 31, 2023
| | | | | | | | |
Shares or
Principal Amounts | | | Value | |
Common Stocks– (continued) | | | |
Specialty Retail – 2.7% | | | |
| | O'Reilly Automotive Inc* | | 264,141 | | | $224,250,426 | |
| | TJX Cos Inc | | 2,708,246 | | | 212,218,157 | |
| | | 436,468,583 | |
Technology Hardware, Storage & Peripherals – 7.4% | | | |
| | Apple Inc | | 7,167,006 | | | 1,181,839,289 | |
Textiles, Apparel & Luxury Goods – 1.9% | | | |
| | Deckers Outdoor Corp* | | 262,250 | | | 117,894,487 | |
| | NIKE Inc - Class B | | 1,552,429 | | | 190,389,893 | |
| | | 308,284,380 | |
Trading Companies & Distributors – 0.8% | | | |
| | Ferguson PLC | | 976,413 | | | 130,595,239 | |
Wireless Telecommunication Services – 1.5% | | | |
| | T-Mobile US Inc* | | 1,666,818 | | | 241,421,919 | |
Total Common Stocks (cost $9,673,467,521) | | 15,931,001,142 | |
Private Placements– 0% | | | |
Health Care Equipment & Supplies – 0% | | | |
| | MedicaMetrix Inc*,¢,£,§((cost $3,000,000) | | 2,727,273 | | | 3 | |
Investments Purchased with Cash Collateral from Securities Lending– 0% | | | |
Investment Companies – 0% | | | |
| | Janus Henderson Cash Collateral Fund LLC, 4.8170%ºº,£ | | 4,754,267 | | | 4,754,267 | |
Time Deposits – 0% | | | |
| | Royal Bank of Canada, 4.8000%, 4/3/23 | | $1,188,567 | | | 1,188,567 | |
Total Investments Purchased with Cash Collateral from Securities Lending (cost $5,942,834) | | 5,942,834 | |
Total Investments (total cost $9,682,410,355) – 99.9% | | 15,936,943,979 | |
Cash, Receivables and Other Assets, net of Liabilities – 0.1% | | 8,700,283 | |
Net Assets – 100% | | $15,945,644,262 | |
| | | | | | |
Summary of Investments by Country - (Long Positions) (unaudited) |
| |
| | | | | % of | |
| | | | | Investment | |
Country | | Value | | Securities | |
United States | | $15,313,190,860 | | 96.1 | % |
Netherlands | | 278,703,776 | | 1.8 | |
United Kingdom | | 118,916,682 | | 0.7 | |
Canada | | 111,286,118 | | 0.7 | |
Switzerland | | 62,375,356 | | 0.4 | |
Belgium | | 52,471,187 | | 0.3 | |
| | | | | | |
| | | | | | |
Total | | $15,936,943,979 | | 100.0 | % |
| | |
See Notes to Schedule of Investments and Other Information and Notes to Financial Statements. |
| |
8 | MARCH 31, 2023 |
Janus Henderson Research Fund
Schedule of Investments (unaudited)
March 31, 2023
Schedules of Affiliated Investments – (% of Net Assets)
| | | | | | | | | | | |
| | Dividend Income(1) | Realized Gain/(Loss)(1) | Change in Unrealized Appreciation/ Depreciation(1) | Value at 3/31/23 |
Private Placements - 0.0% |
Health Care Equipment & Supplies - 0.0% | |
| | MedicaMetrix Inc*,¢,§ | $ | - | $ | - | $ | - | $ | 3 |
Investment Companies - N/A |
Money Markets - N/A | |
| | Janus Henderson Cash Liquidity Fund LLC, 4.7988%ºº | | 379,041 | | 1,313 | | - | | - |
Investments Purchased with Cash Collateral from Securities Lending - 0.0% |
Investment Companies - 0.0% | |
| | Janus Henderson Cash Collateral Fund LLC, 4.8170%ºº | | 23,645∆ | | - | | - | | 4,754,267 |
Total Affiliated Investments - 0.0% | $ | 402,686 | $ | 1,313 | $ | - | $ | 4,754,270 |
(1) For securities that were affiliated for a portion of the period ended March 31, 2023, this column reflects amounts for the entire period ended March 31, 2023 and not just the period in which the security was affiliated.
| | | | | | | | | | | |
| | Value at 9/30/22 | Purchases | Sales Proceeds | Value at 3/31/23 |
Private Placements - 0.0% |
Health Care Equipment & Supplies - 0.0% | |
| | MedicaMetrix Inc*,¢,§ | | 3 | | - | | - | | 3 |
Investment Companies - N/A |
Money Markets - N/A | |
| | Janus Henderson Cash Liquidity Fund LLC, 4.7988%ºº | | 13,038,186 | | 377,464,257 | | (390,503,756) | | - |
Investments Purchased with Cash Collateral from Securities Lending - 0.0% |
Investment Companies - 0.0% | |
| | Janus Henderson Cash Collateral Fund LLC, 4.8170%ºº | | 1,275,965 | | 130,440,623 | | (126,962,321) | | 4,754,267 |
| | | | | | | | | | |
Offsetting of Financial Assets and Derivative Assets |
| |
| | | Gross Amounts | | | | | | |
| | | of Recognized | | Offsetting Asset | | Collateral | | |
Counterparty | | Assets | | or Liability(a) | | Pledged(b) | | Net Amount |
| | | | | | | | | |
JPMorgan Chase Bank, National Association | $ | 5,791,120 | $ | — | $ | (5,791,120) | $ | — |
| | | | | | | | | |
(a) | Represents the amount of assets or liabilities that could be offset with the same counterparty under master netting or similar agreements that management elects not to offset on the Statement of Assets and Liabilities. |
(b) | Collateral pledged is limited to the net outstanding amount due to/from an individual counterparty. The actual collateral amounts pledged may exceed these amounts and may fluctuate in value. |
| | |
See Notes to Schedule of Investments and Other Information and Notes to Financial Statements. |
| |
Janus Investment Fund | 9 |
Janus Henderson Research Fund
Notes to Schedule of Investments and Other Information (unaudited)
| | |
Russell 1000® Growth Index | Russell 1000® Growth Index reflects the performance of U.S. large-cap equities with higher price-to-book ratios and higher forecasted growth values. |
S&P 500® Index | S&P 500® Index reflects U.S. large-cap equity performance and represents broad U.S. equity market performance. |
| | |
ADR | American Depositary Receipt |
LLC | Limited Liability Company |
PLC | Public Limited Company |
| | |
* | Non-income producing security. |
ºº | Rate shown is the 7-day yield as of March 31, 2023. |
# | Loaned security; a portion of the security is on loan at March 31, 2023. |
¢ | Security is valued using significant unobservable inputs. The total value of Level 3 securities as of the period ended March 31, 2023 is $3, which represents 0.0% of net assets. |
£ | The Fund may invest in certain securities that are considered affiliated companies. As defined by the Investment Company Act of 1940, as amended, an affiliated company is one in which the Fund owns 5% or more of the outstanding voting securities, or a company which is under common ownership or control. |
∆ | Net of income paid to the securities lending agent and rebates paid to the borrowing counterparties. |
| | | | | | | | | | | |
§ | Schedule of Restricted Securities (as of March 31, 2023) |
| | | | | | | | Value as a | |
| | Acquisition | | | | | | % of Net | |
| | Date | | Cost | | Value | | Assets | |
MedicaMetrix Inc | 1/26/21 | $ | 3,000,000 | $ | 3 | | 0.0 | % |
| | | | | | | | | |
| | | | | | | | | |
The Fund has registration rights for certain restricted securities held as of March 31, 2023. The issuer incurs all registration costs. | |
| | | | | | | | | | | | | |
The following is a summary of the inputs that were used to value the Fund’s investments in securities and other financial instruments as of March 31, 2023. See Notes to Financial Statements for more information. |
| |
Valuation Inputs Summary |
| | | | | | | |
| | | | | Level 2 - | | Level 3 - |
| | | Level 1 - | | Other Significant | | Significant |
| | | Quoted Prices | | Observable Inputs | | Unobservable Inputs |
| | | | | | | |
Assets | | | | | | |
Investments In Securities: | | | | | | |
Common Stocks | $ | 15,931,001,142 | $ | - | $ | - |
Private Placements | | - | | - | | 3 |
Investments Purchased with Cash Collateral from Securities Lending | | - | | 5,942,834 | | - |
Total Assets | $ | 15,931,001,142 | $ | 5,942,834 | $ | 3 |
| | | | | | | |
Janus Henderson Research Fund
Statement of Assets and Liabilities (unaudited)
March 31, 2023
| | | | | | | |
| | | | | | |
Assets: | | | | |
| Unaffiliated investments, at value (cost $9,674,656,088)(1) | | $ | 15,932,189,709 | |
| Affiliated investments, at value (cost $7,754,267) | | | 4,754,270 | |
| Trustees' deferred compensation | | | 394,572 | |
| Receivables: | | | | |
| | Investments sold | | | 35,825,988 | |
| | Dividends | | | 4,121,702 | |
| | Fund shares sold | | | 2,186,545 | |
| | Foreign tax reclaims | | | 498,964 | |
| | Dividends from affiliates | | | 51,193 | |
| Other assets | | | 145,883 | |
Total Assets | | | 15,980,168,826 | |
Liabilities: | | | | |
| Due to custodian | | | 2,342,472 | |
| Collateral for securities loaned (Note 2) | | | 5,942,834 | |
| Payables: | | | — | |
| | Investments purchased | | | 10,978,589 | |
| | Advisory fees | | | 6,631,713 | |
| | Fund shares repurchased | | | 5,082,926 | |
| | Transfer agent fees and expenses | | | 2,209,116 | |
| | Trustees' deferred compensation fees | | | 394,572 | |
| | Trustees' fees and expenses | | | 98,332 | |
| | Professional fees | | | 38,225 | |
| | Affiliated fund administration fees payable | | | 34,420 | |
| | 12b-1 Distribution and shareholder servicing fees | | | 21,417 | |
| | Custodian fees | | | 17,309 | |
| | Accrued expenses and other payables | | | 732,639 | |
Total Liabilities | | | 34,524,564 | |
Net Assets | | $ | 15,945,644,262 | |
| | |
See Notes to Financial Statements. |
| |
Janus Investment Fund | 11 |
Janus Henderson Research Fund
Statement of Assets and Liabilities (unaudited)
March 31, 2023
| | | | | | | |
| | | | | | |
| | | | | | | |
Net Assets Consist of: | | | | |
| Capital (par value and paid-in surplus) | | $ | 9,683,043,823 | |
| Total distributable earnings (loss) | | | 6,262,600,439 | |
Total Net Assets | | $ | 15,945,644,262 | |
Net Assets - Class A Shares | | $ | 41,484,565 | |
| Shares Outstanding, $0.01 Par Value (unlimited shares authorized) | | | 776,406 | |
Net Asset Value Per Share(2) | | $ | 53.43 | |
Maximum Offering Price Per Share(3) | | $ | 56.69 | |
Net Assets - Class C Shares | | $ | 7,943,372 | |
| Shares Outstanding, $0.01 Par Value (unlimited shares authorized) | | | 167,788 | |
Net Asset Value Per Share(2) | | $ | 47.34 | |
Net Assets - Class D Shares | | $ | 11,657,456,381 | |
| Shares Outstanding, $0.01 Par Value (unlimited shares authorized) | | | 215,411,098 | |
Net Asset Value Per Share | | $ | 54.12 | |
Net Assets - Class I Shares | | $ | 349,208,953 | |
| Shares Outstanding, $0.01 Par Value (unlimited shares authorized) | | | 6,466,326 | |
Net Asset Value Per Share | | $ | 54.00 | |
Net Assets - Class N Shares | | $ | 338,430,249 | |
| Shares Outstanding, $0.01 Par Value (unlimited shares authorized) | | | 6,262,724 | |
Net Asset Value Per Share | | $ | 54.04 | |
Net Assets - Class R Shares | | $ | 3,198,454 | |
| Shares Outstanding, $0.01 Par Value (unlimited shares authorized) | | | 60,898 | |
Net Asset Value Per Share | | $ | 52.52 | |
Net Assets - Class S Shares | | $ | 18,801,562 | |
| Shares Outstanding, $0.01 Par Value (unlimited shares authorized) | | | 361,234 | |
Net Asset Value Per Share | | $ | 52.05 | |
Net Assets - Class T Shares | | $ | 3,529,120,726 | |
| Shares Outstanding, $0.01 Par Value (unlimited shares authorized) | | | 65,237,627 | |
Net Asset Value Per Share | | $ | 54.10 | |
| |
(1) Includes $5,791,120 of securities on loan. See Note 2 in Notes to Financial Statements. (2) Redemption price per share may be reduced for any applicable contingent deferred sales charge. (3) Maximum offering price is computed at 100/94.25 of net asset value. |
| | |
See Notes to Financial Statements. |
| |
12 | MARCH 31, 2023 |
Janus Henderson Research Fund
Statement of Operations (unaudited)
For the period ended March 31, 2023
| | | | | | |
| | | | | |
Investment Income: | | | |
| Dividends | $ | 75,365,354 | |
| Dividends from affiliates | | 379,041 | |
| Affiliated securities lending income, net | | 23,645 | |
| Unaffiliated securities lending income, net | | 6,530 | |
| Other income | | 117 | |
| Foreign tax withheld | | (621,212) | |
Total Investment Income | | 75,153,475 | |
Expenses: | | | |
| Advisory fees | | 34,025,436 | |
| 12b-1 Distribution and shareholder servicing fees: | | | |
| | Class A Shares | | 48,322 | |
| | Class C Shares | | 49,380 | |
| | Class R Shares | | 7,611 | |
| | Class S Shares | | 22,770 | |
| Transfer agent administrative fees and expenses: | | | |
| | Class D Shares | | 6,352,916 | |
| | Class R Shares | | 3,852 | |
| | Class S Shares | | 22,942 | |
| | Class T Shares | | 4,077,971 | |
| Transfer agent networking and omnibus fees: | | | |
| | Class A Shares | | 12,105 | |
| | Class C Shares | | 3,773 | |
| | Class I Shares | | 129,491 | |
| Other transfer agent fees and expenses: | | | |
| | Class A Shares | | 1,358 | |
| | Class C Shares | | 204 | |
| | Class D Shares | | 520,724 | |
| | Class I Shares | | 8,981 | |
| | Class N Shares | | 6,619 | |
| | Class R Shares | | 29 | |
| | Class S Shares | | 1,427 | |
| | Class T Shares | | 13,234 | |
| Shareholder reports expense | | 439,472 | |
| Trustees’ fees and expenses | | 218,139 | |
| Affiliated fund administration fees | | 184,121 | |
| Registration fees | | 99,804 | |
| Professional fees | | 94,062 | |
| Custodian fees | | 62,942 | |
| Other expenses | | 437,902 | |
Total Expenses | | 46,845,587 | |
Less: Excess Expense Reimbursement and Waivers | | (330,766) | |
Net Expenses | | 46,514,821 | |
Net Investment Income/(Loss) | | 28,638,654 | |
| | | | | |
| | |
See Notes to Financial Statements. |
| |
Janus Investment Fund | 13 |
Janus Henderson Research Fund
Statement of Operations (unaudited)
For the period ended March 31, 2023
| | | | | | |
| | | | | |
Net Realized Gain/(Loss) on Investments: | | | |
| Investments and foreign currency transactions | $ | 38,461,303 | |
| Investments in affiliates | | 1,313 | |
Total Net Realized Gain/(Loss) on Investments | | 38,462,616 | |
Change in Unrealized Net Appreciation/Depreciation: | | | |
| Investments, foreign currency translations and Trustees’ deferred compensation | | 2,627,243,142 | |
Total Change in Unrealized Net Appreciation/Depreciation | | 2,627,243,142 | |
Net Increase/(Decrease) in Net Assets Resulting from Operations | $ | 2,694,344,412 | |
| | | | | |
| | |
See Notes to Financial Statements. |
| |
14 | MARCH 31, 2023 |
Janus Henderson Research Fund
Statements of Changes in Net Assets
| | | | | | | | | |
| | | | | | | | |
| | | Period ended
March 31, 2023 (unaudited) | | Year ended
September 30, 2022 | |
| | | | | | | | | |
Operations: | | | | | | |
| Net investment income/(loss) | $ | 28,638,654 | | $ | 1,821,436 | |
| Net realized gain/(loss) on investments | | 38,462,616 | | | 156,764,212 | |
| Change in unrealized net appreciation/depreciation | | 2,627,243,142 | | | (5,572,729,768) | |
Net Increase/(Decrease) in Net Assets Resulting from Operations | | 2,694,344,412 | | | (5,414,144,120) | |
Dividends and Distributions to Shareholders: | | | | | | |
| | Class A Shares | | (90,957) | | | (6,911,925) | |
| | Class C Shares | | (22,695) | | | (2,088,374) | |
| | Class D Shares | | (44,917,697) | | | (1,802,485,719) | |
| | Class I Shares | | (1,571,320) | | | (55,752,162) | |
| | Class N Shares | | (1,852,697) | | | (53,166,280) | |
| | Class R Shares | | (7,488) | | | (537,126) | |
| | Class S Shares | | (43,861) | | | (3,541,069) | |
| | Class T Shares | | (8,746,211) | | | (562,781,567) | |
Net Decrease from Dividends and Distributions to Shareholders | | (57,252,926) | | | (2,487,264,222) | |
Capital Share Transactions: | | | | | | |
| | Class A Shares | | (1,960,775) | | | 4,554,902 | |
| | Class C Shares | | (2,014,139) | | | (1,479,412) | |
| | Class D Shares | | (285,148,504) | | | 1,046,592,560 | |
| | Class I Shares | | (6,120,872) | | | 24,195,712 | |
| | Class N Shares | | (3,037,510) | | | 18,448,765 | |
| | Class R Shares | | (247,850) | | | 382,838 | |
| | Class S Shares | | (3,598,227) | | | (453,903) | |
| | Class T Shares | | (109,055,229) | | | 250,068,736 | |
Net Increase/(Decrease) from Capital Share Transactions | | (411,183,106) | | | 1,342,310,198 | |
Net Increase/(Decrease) in Net Assets | | 2,225,908,380 | | | (6,559,098,144) | |
Net Assets: | | | | | | |
| Beginning of period | | 13,719,735,882 | | | 20,278,834,026 | |
| End of period | $ | 15,945,644,262 | | $ | 13,719,735,882 | |
| | | | | | | | |
| | |
See Notes to Financial Statements. |
| |
Janus Investment Fund | 15 |
Janus Henderson Research Fund
Financial Highlights
| | | | | | | | | | | | | | | | | | | | | | |
Class A Shares | | | | | | | | | | | | | | | | | | |
For a share outstanding during the period ended March 31, 2023 (unaudited) and the year ended September 30 | 2023 | | | 2022 | | | 2021 | | | 2020 | | | 2019 | | | 2018 | |
| Net Asset Value, Beginning of Period | | $44.68 | | | $70.69 | | | $59.31 | | | $49.56 | | | $53.33 | | | $45.29 | |
| Income/(Loss) from Investment Operations: | | | | | | | | | | | | | | | | | | |
| | Net investment income/(loss)(1) | | 0.05 | | | (0.10) | | | (0.15) | | | 0.06 | | | 0.14 | | | 0.08 | |
| | Net realized and unrealized gain/(loss) | | 8.81 | | | (17.06) | | | 13.37 | | | 14.75 | | | 0.50 | | | 10.25 | |
| Total from Investment Operations | | 8.86 | | | (17.16) | | | 13.22 | | | 14.81 | | | 0.64 | | | 10.33 | |
| Less Dividends and Distributions: | | | | | | | | | | | | | | | | | | |
| | Dividends (from net investment income) | | — | | | — | | | — | | | (0.13) | | | (0.06) | | | (0.03) | |
| | Distributions (from capital gains) | | (0.11) | | | (8.85) | | | (1.84) | | | (4.93) | | | (4.35) | | | (2.26) | |
| Total Dividends and Distributions | | (0.11) | | | (8.85) | | | (1.84) | | | (5.06) | | | (4.41) | | | (2.29) | |
| Net Asset Value, End of Period | | $53.43 | | | $44.68 | | | $70.69 | | | $59.31 | | | $49.56 | | | $53.33 | |
| Total Return* | | 19.87% | | | (28.11)% | | | 22.66% | | | 32.14% | | | 2.98% | | | 23.56% | |
| Net Assets, End of Period (in thousands) | | $41,485 | | | $36,486 | | | $53,589 | | | $36,300 | | | $29,853 | | | $28,474 | |
| Average Net Assets for the Period (in thousands) | | $38,724 | | | $48,724 | | | $45,054 | | | $31,223 | | | $28,823 | | | $26,135 | |
| Ratios to Average Net Assets**: | | | | | | | | | | | | | | | | | | |
| | Ratio of Gross Expenses | | 0.81% | | | 0.84% | | | 0.86% | | | 0.86% | | | 0.89% | | | 0.93% | |
| | Ratio of Net Expenses (After Waivers and Expense Offsets) | | 0.81% | | | 0.84% | | | 0.86% | | | 0.86% | | | 0.89% | | | 0.91% | |
| | Ratio of Net Investment Income/(Loss) | | 0.21% | | | (0.16)% | | | (0.22)% | | | 0.12% | | | 0.30% | | | 0.17% | |
| Portfolio Turnover Rate | | 11% | | | 32% | | | 31% | | | 38% | | | 41% | | | 43% | |
| | | | | | | | | | | | | | | | | | | | | | |
| |
* Total return includes adjustments in accordance with generally accepted accounting principles required at the year or period end and are not annualized for periods of less than one full year. ** Annualized for periods of less than one full year. (1) Per share amounts are calculated based on average shares outstanding during the year or period. |
| | |
See Notes to Financial Statements. |
| |
16 | MARCH 31, 2023 |
Janus Henderson Research Fund
Financial Highlights
| | | | | | | | | | | | | | | | | | | | | | |
Class C Shares | | | | | | | | | | | | | | | | | | |
For a share outstanding during the period ended March 31, 2023 (unaudited) and the year ended September 30 | 2023 | | | 2022 | | | 2021 | | | 2020 | | | 2019 | | | 2018 | |
| Net Asset Value, Beginning of Period | | $39.79 | | | $64.28 | | | $54.45 | | | $46.06 | | | $50.18 | | | $42.99 | |
| Income/(Loss) from Investment Operations: | | | | | | | | | | | | | | | | | | |
| | Net investment income/(loss)(1) | | (0.17) | | | (0.45) | | | (0.53) | | | (0.27) | | | (0.18) | | | (0.23) | |
| | Net realized and unrealized gain/(loss) | | 7.83 | | | (15.19) | | | 12.20 | | | 13.59 | | | 0.41 | | | 9.68 | |
| Total from Investment Operations | | 7.66 | | | (15.64) | | | 11.67 | | | 13.32 | | | 0.23 | | | 9.45 | |
| Less Dividends and Distributions: | | | | | | | | | | | | | | | | | | |
| | Dividends (from net investment income) | | — | | | — | | | — | | | — | | | — | | | — | |
| | Distributions (from capital gains) | | (0.11) | | | (8.85) | | | (1.84) | | | (4.93) | | | (4.35) | | | (2.26) | |
| Total Dividends and Distributions | | (0.11) | | | (8.85) | | | (1.84) | | | (4.93) | | | (4.35) | | | (2.26) | |
| Net Asset Value, End of Period | | $47.34 | | | $39.79 | | | $64.28 | | | $54.45 | | | $46.06 | | | $50.18 | |
| Total Return* | | 19.30% | | | (28.60)% | | | 21.81% | | | 31.20% | | | 2.27% | | | 22.73% | |
| Net Assets, End of Period (in thousands) | | $7,943 | | | $8,523 | | | $15,910 | | | $18,502 | | | $19,109 | | | $27,515 | |
| Average Net Assets for the Period (in thousands) | | $8,364 | | | $12,989 | | | $17,155 | | | $18,763 | | | $21,832 | | | $26,463 | |
| Ratios to Average Net Assets**: | | | | | | | | | | | | | | | | | | |
| | Ratio of Gross Expenses | | 1.79% | | | 1.52% | | | 1.54% | | | 1.55% | | | 1.58% | | | 1.61% | |
| | Ratio of Net Expenses (After Waivers and Expense Offsets) | | 1.79% | | | 1.52% | | | 1.54% | | | 1.55% | | | 1.57% | | | 1.58% | |
| | Ratio of Net Investment Income/(Loss) | | (0.77)% | | | (0.85)% | | | (0.88)% | | | (0.57)% | | | (0.39)% | | | (0.50)% | |
| Portfolio Turnover Rate | | 11% | | | 32% | | | 31% | | | 38% | | | 41% | | | 43% | |
| | | | | | | | | | | | | | | | | | | | | | |
| |
* Total return includes adjustments in accordance with generally accepted accounting principles required at the year or period end and are not annualized for periods of less than one full year. ** Annualized for periods of less than one full year. (1) Per share amounts are calculated based on average shares outstanding during the year or period. |
| | |
See Notes to Financial Statements. |
| |
Janus Investment Fund | 17 |
Janus Henderson Research Fund
Financial Highlights
| | | | | | | | | | | | | | | | | | | | | | |
Class D Shares | | | | | | | | | | | | | | | | | | |
For a share outstanding during the period ended March 31, 2023 (unaudited) and the year ended September 30 | 2023 | | | 2022 | | | 2021 | | | 2020 | | | 2019 | | | 2018 | |
| Net Asset Value, Beginning of Period | | $45.30 | | | $71.42 | | | $59.86 | | | $49.98 | | | $53.74 | | | $45.60 | |
| Income/(Loss) from Investment Operations: | | | | | | | | | | | | | | | | | | |
| | Net investment income/(loss)(1) | | 0.10 | | | 0.02 | | | (0.01) | | | 0.17 | | | 0.24 | | | 0.19 | |
| | Net realized and unrealized gain/(loss) | | 8.92 | | | (17.29) | | | 13.48 | | | 14.87 | | | 0.50 | | | 10.33 | |
| Total from Investment Operations | | 9.02 | | | (17.27) | | | 13.47 | | | 15.04 | | | 0.74 | | | 10.52 | |
| Less Dividends and Distributions: | | | | | | | | | | | | | | | | | | |
| | Dividends (from net investment income) | | (0.09) | | | — | | | (0.07) | | | (0.23) | | | (0.15) | | | (0.12) | |
| | Distributions (from capital gains) | | (0.11) | | | (8.85) | | | (1.84) | | | (4.93) | | | (4.35) | | | (2.26) | |
| Total Dividends and Distributions | | (0.20) | | | (8.85) | | | (1.91) | | | (5.16) | | | (4.50) | | | (2.38) | |
| Net Asset Value, End of Period | | $54.12 | | | $45.30 | | | $71.42 | | | $59.86 | | | $49.98 | | | $53.74 | |
| Total Return* | | 19.99% | | | (27.96)% | | | 22.89% | | | 32.40% | | | 3.20% | | | 23.85% | |
| Net Assets, End of Period (in thousands) | | $11,657,456 | | | $10,017,030 | | | $14,715,777 | | | $12,635,778 | | | $10,221,640 | | | $10,550,222 | |
| Average Net Assets for the Period (in thousands) | | $10,783,566 | | | $13,156,776 | | | $14,113,628 | | | $11,047,912 | | | $9,901,606 | | | $9,778,967 | |
| Ratios to Average Net Assets**: | | | | | | | | | | | | | | | | | | |
| | Ratio of Gross Expenses | | 0.61% | | | 0.64% | | | 0.66% | | | 0.66% | | | 0.69% | | | 0.72% | |
| | Ratio of Net Expenses (After Waivers and Expense Offsets) | | 0.61% | | | 0.64% | | | 0.66% | | | 0.66% | | | 0.68% | | | 0.69% | |
| | Ratio of Net Investment Income/(Loss) | | 0.41% | | | 0.03% | | | (0.02)% | | | 0.32% | | | 0.50% | | | 0.39% | |
| Portfolio Turnover Rate | | 11% | | | 32% | | | 31% | | | 38% | | | 41% | | | 43% | |
| | | | | | | | | | | | | | | | | | | | | | |
| |
* Total return includes adjustments in accordance with generally accepted accounting principles required at the year or period end and are not annualized for periods of less than one full year. ** Annualized for periods of less than one full year. (1) Per share amounts are calculated based on average shares outstanding during the year or period. |
| | |
See Notes to Financial Statements. |
| |
18 | MARCH 31, 2023 |
Janus Henderson Research Fund
Financial Highlights
| | | | | | | | | | | | | | | | | | | | | | |
Class I Shares | | | | | | | | | | | | | | | | | | |
For a share outstanding during the period ended March 31, 2023 (unaudited) and the year ended September 30 | 2023 | | | 2022 | | | 2021 | | | 2020 | | | 2019 | | | 2018 | |
| Net Asset Value, Beginning of Period | | $45.23 | | | $71.28 | | | $59.74 | | | $49.89 | | | $53.67 | | | $45.53 | |
| Income/(Loss) from Investment Operations: | | | | | | | | | | | | | | | | | | |
| | Net investment income/(loss)(1) | | 0.11 | | | 0.05 | | | 0.02 | | | 0.20 | | | 0.27 | | | 0.22 | |
| | Net realized and unrealized gain/(loss) | | 8.90 | | | (17.25) | | | 13.46 | | | 14.84 | | | 0.48 | | | 10.32 | |
| Total from Investment Operations | | 9.01 | | | (17.20) | | | 13.48 | | | 15.04 | | | 0.75 | | | 10.54 | |
| Less Dividends and Distributions: | | | | | | | | | | | | | | | | | | |
| | Dividends (from net investment income) | | (0.13) | | | — | | | (0.10) | | | (0.26) | | | (0.18) | | | (0.14) | |
| | Distributions (from capital gains) | | (0.11) | | | (8.85) | | | (1.84) | | | (4.93) | | | (4.35) | | | (2.26) | |
| Total Dividends and Distributions | | (0.24) | | | (8.85) | | | (1.94) | | | (5.19) | | | (4.53) | | | (2.40) | |
| Net Asset Value, End of Period | | $54.00 | | | $45.23 | | | $71.28 | | | $59.74 | | | $49.89 | | | $53.67 | |
| Total Return* | | 19.99% | | | (27.91)% | | | 22.95% | | | 32.47% | | | 3.23% | | | 23.94% | |
| Net Assets, End of Period (in thousands) | | $349,209 | | | $298,319 | | | $448,508 | | | $383,533 | | | $340,425 | | | $387,130 | |
| Average Net Assets for the Period (in thousands) | | $321,019 | | | $396,836 | | | $428,367 | | | $349,367 | | | $339,641 | | | $382,642 | |
| Ratios to Average Net Assets**: | | | | | | | | | | | | | | | | | | |
| | Ratio of Gross Expenses | | 0.57% | | | 0.59% | | | 0.61% | | | 0.60% | | | 0.63% | | | 0.65% | |
| | Ratio of Net Expenses (After Waivers and Expense Offsets) | | 0.57% | | | 0.59% | | | 0.61% | | | 0.60% | | | 0.62% | | | 0.63% | |
| | Ratio of Net Investment Income/(Loss) | | 0.46% | | | 0.08% | | | 0.03% | | | 0.38% | | | 0.56% | | | 0.45% | |
| Portfolio Turnover Rate | | 11% | | | 32% | | | 31% | | | 38% | | | 41% | | | 43% | |
| | | | | | | | | | | | | | | | | | | | | | |
| |
* Total return includes adjustments in accordance with generally accepted accounting principles required at the year or period end and are not annualized for periods of less than one full year. ** Annualized for periods of less than one full year. (1) Per share amounts are calculated based on average shares outstanding during the year or period. |
| | |
See Notes to Financial Statements. |
| |
Janus Investment Fund | 19 |
Janus Henderson Research Fund
Financial Highlights
| | | | | | | | | | | | | | | | | | | | | | |
Class N Shares | | | | | | | | | | | | | | | | | | |
For a share outstanding during the period ended March 31, 2023 (unaudited) and the year ended September 30 | 2023 | | | 2022 | | | 2021 | | | 2020 | | | 2019 | | | 2018 | |
| Net Asset Value, Beginning of Period | | $45.29 | | | $71.32 | | | $59.75 | | | $49.90 | | | $53.69 | | | $45.54 | |
| Income/(Loss) from Investment Operations: | | | | | | | | | | | | | | | | | | |
| | Net investment income/(loss)(1) | | 0.13 | | | 0.09 | | | 0.07 | | | 0.23 | | | 0.31 | | | 0.26 | |
| | Net realized and unrealized gain/(loss) | | 8.91 | | | (17.27) | | | 13.47 | | | 14.85 | | | 0.47 | | | 10.31 | |
| Total from Investment Operations | | 9.04 | | | (17.18) | | | 13.54 | | | 15.08 | | | 0.78 | | | 10.57 | |
| Less Dividends and Distributions: | | | | | | | | | | | | | | | | | | |
| | Dividends (from net investment income) | | (0.18) | | | — | | | (0.13) | | | (0.30) | | | (0.22) | | | (0.16) | |
| | Distributions (from capital gains) | | (0.11) | | | (8.85) | | | (1.84) | | | (4.93) | | | (4.35) | | | (2.26) | |
| Total Dividends and Distributions | | (0.29) | | | (8.85) | | | (1.97) | | | (5.23) | | | (4.57) | | | (2.42) | |
| Net Asset Value, End of Period | | $54.04 | | | $45.29 | | | $71.32 | | | $59.75 | | | $49.90 | | | $53.69 | |
| Total Return* | | 20.06% | | | (27.86)% | | | 23.05% | | | 32.57% | | | 3.31% | | | 24.02% | |
| Net Assets, End of Period (in thousands) | | $338,430 | | | $286,346 | | | $432,553 | | | $394,953 | | | $308,922 | | | $311,140 | |
| Average Net Assets for the Period (in thousands) | | $310,525 | | | $378,504 | | | $426,650 | | | $350,927 | | | $296,644 | | | $278,339 | |
| Ratios to Average Net Assets**: | | | | | | | | | | | | | | | | | | |
| | Ratio of Gross Expenses | | 0.48% | | | 0.52% | | | 0.54% | | | 0.53% | | | 0.55% | | | 0.58% | |
| | Ratio of Net Expenses (After Waivers and Expense Offsets) | | 0.48% | | | 0.52% | | | 0.54% | | | 0.53% | | | 0.54% | | | 0.56% | |
| | Ratio of Net Investment Income/(Loss) | | 0.54% | | | 0.15% | | | 0.11% | | | 0.45% | | | 0.64% | | | 0.53% | |
| Portfolio Turnover Rate | | 11% | | | 32% | | | 31% | | | 38% | | | 41% | | | 43% | |
| | | | | | | | | | | | | | | | | | | | | | |
| |
* Total return includes adjustments in accordance with generally accepted accounting principles required at the year or period end and are not annualized for periods of less than one full year. ** Annualized for periods of less than one full year. (1) Per share amounts are calculated based on average shares outstanding during the year or period. |
| | |
See Notes to Financial Statements. |
| |
20 | MARCH 31, 2023 |
Janus Henderson Research Fund
Financial Highlights
| | | | | | | | | | | | | | | | | | | | | | |
Class R Shares | | | | | | | | | | | | | | | | | | |
For a share outstanding during the period ended March 31, 2023 (unaudited) and the year ended September 30 | 2023 | | | 2022 | | | 2021 | | | 2020 | | | 2019 | | | 2018 | |
| Net Asset Value, Beginning of Period | | $44.02 | | | $70.04 | | | $59.04 | | | $49.46 | | | $53.37 | | | $45.47 | |
| Income/(Loss) from Investment Operations: | | | | | | | | | | | | | | | | | | |
| | Net investment income/(loss)(1) | | (0.06) | | | (0.35) | | | (0.42) | | | (0.18) | | | (0.05) | | | (0.12) | |
| | Net realized and unrealized gain/(loss) | | 8.67 | | | (16.82) | | | 13.26 | | | 14.69 | | | 0.49 | | | 10.28 | |
| Total from Investment Operations | | 8.61 | | | (17.17) | | | 12.84 | | | 14.51 | | | 0.44 | | | 10.16 | |
| Less Dividends and Distributions: | | | | | | | | | | | | | | | | | | |
| | Dividends (from net investment income) | | — | | | — | | | — | | | — | | | — | | | — | |
| | Distributions (from capital gains) | | (0.11) | | | (8.85) | | | (1.84) | | | (4.93) | | | (4.35) | | | (2.26) | |
| Total Dividends and Distributions | | (0.11) | | | (8.85) | | | (1.84) | | | (4.93) | | | (4.35) | | | (2.26) | |
| Net Asset Value, End of Period | | $52.52 | | | $44.02 | | | $70.04 | | | $59.04 | | | $49.46 | | | $53.37 | |
| Total Return* | | 19.60% | | | (28.41)% | | | 22.10% | | | 31.48% | | | 2.55% | | | 23.06% | |
| Net Assets, End of Period (in thousands) | | $3,198 | | | $2,903 | | | $4,226 | | | $4,269 | | | $4,476 | | | $5,021 | |
| Average Net Assets for the Period (in thousands) | | $3,088 | | | $3,822 | | | $4,354 | | | $4,322 | | | $4,550 | | | $4,931 | |
| Ratios to Average Net Assets**: | | | | | | | | | | | | | | | | | | |
| | Ratio of Gross Expenses | | 1.32% | | | 1.33% | | | 1.34% | | | 1.34% | | | 1.30% | | | 1.35% | |
| | Ratio of Net Expenses (After Waivers and Expense Offsets) | | 1.25% | | | 1.27% | | | 1.30% | | | 1.34% | | | 1.30% | | | 1.33% | |
| | Ratio of Net Investment Income/(Loss) | | (0.23)% | | | (0.60)% | | | (0.64)% | | | (0.36)% | | | (0.11)% | | | (0.25)% | |
| Portfolio Turnover Rate | | 11% | | | 32% | | | 31% | | | 38% | | | 41% | | | 43% | |
| | | | | | | | | | | | | | | | | | | | | | |
| |
* Total return includes adjustments in accordance with generally accepted accounting principles required at the year or period end and are not annualized for periods of less than one full year. ** Annualized for periods of less than one full year. (1) Per share amounts are calculated based on average shares outstanding during the year or period. |
| | |
See Notes to Financial Statements. |
| |
Janus Investment Fund | 21 |
Janus Henderson Research Fund
Financial Highlights
| | | | | | | | | | | | | | | | | | | | | | |
Class S Shares | | | | | | | | | | | | | | | | | | |
For a share outstanding during the period ended March 31, 2023 (unaudited) and the year ended September 30 | 2023 | | | 2022 | | | 2021 | | | 2020 | | | 2019 | | | 2018 | |
| Net Asset Value, Beginning of Period | | $43.57 | | | $69.26 | | | $58.25 | | | $48.72 | | | $52.52 | | | $44.68 | |
| Income/(Loss) from Investment Operations: | | | | | | | | | | | | | | | | | | |
| | Net investment income/(loss)(1) | | 0.01 | | | (0.20) | | | (0.26) | | | (0.03) | | | 0.07 | | | 0.01 | |
| | Net realized and unrealized gain/(loss) | | 8.58 | | | (16.64) | | | 13.11 | | | 14.49 | | | 0.48 | | | 10.10 | |
| Total from Investment Operations | | 8.59 | | | (16.84) | | | 12.85 | | | 14.46 | | | 0.55 | | | 10.11 | |
| Less Dividends and Distributions: | | | | | | | | | | | | | | | | | | |
| | Dividends (from net investment income) | | — | | | — | | | — | | | — | | | — | | | (0.01) | |
| | Distributions (from capital gains) | | (0.11) | | | (8.85) | | | (1.84) | | | (4.93) | | | (4.35) | | | (2.26) | |
| Total Dividends and Distributions | | (0.11) | | | (8.85) | | | (1.84) | | | (4.93) | | | (4.35) | | | (2.27) | |
| Net Asset Value, End of Period | | $52.05 | | | $43.57 | | | $69.26 | | | $58.25 | | | $48.72 | | | $52.52 | |
| Total Return* | | 19.76% | | | (28.24)% | | | 22.43% | | | 31.89% | | | 2.82% | | | 23.38% | |
| Net Assets, End of Period (in thousands) | | $18,802 | | | $19,124 | | | $30,909 | | | $26,600 | | | $33,835 | | | $27,788 | |
| Average Net Assets for the Period (in thousands) | | $18,418 | | | $26,683 | | | $29,786 | | | $25,562 | | | $28,972 | | | $27,937 | |
| Ratios to Average Net Assets**: | | | | | | | | | | | | | | | | | | |
| | Ratio of Gross Expenses | | 1.01% | | | 1.04% | | | 1.05% | | | 1.03% | | | 1.06% | | | 1.08% | |
| | Ratio of Net Expenses (After Waivers and Expense Offsets) | | 1.00% | | | 1.03% | | | 1.04% | | | 1.03% | | | 1.05% | | | 1.06% | |
| | Ratio of Net Investment Income/(Loss) | | 0.02% | | | (0.35)% | | | (0.39)% | | | (0.06)% | | | 0.14% | | | 0.03% | |
| Portfolio Turnover Rate | | 11% | | | 32% | | | 31% | | | 38% | | | 41% | | | 43% | |
| | | | | | | | | | | | | | | | | | | | | | |
| |
* Total return includes adjustments in accordance with generally accepted accounting principles required at the year or period end and are not annualized for periods of less than one full year. ** Annualized for periods of less than one full year. (1) Per share amounts are calculated based on average shares outstanding during the year or period. |
| | |
See Notes to Financial Statements. |
| |
22 | MARCH 31, 2023 |
Janus Henderson Research Fund
Financial Highlights
| | | | | | | | | | | | | | | | | | | | | | |
Class T Shares | | | | | | | | | | | | | | | | | | |
For a share outstanding during the period ended March 31, 2023 (unaudited) and the year ended September 30 | 2023 | | | 2022 | | | 2021 | | | 2020 | | | 2019 | | | 2018 | |
| Net Asset Value, Beginning of Period | | $45.23 | | | $71.39 | | | $59.86 | | | $49.98 | | | $53.74 | | | $45.61 | |
| Income/(Loss) from Investment Operations: | | | | | | | | | | | | | | | | | | |
| | Net investment income/(loss)(1) | | 0.08 | | | (0.04) | | | (0.08) | | | 0.11 | | | 0.20 | | | 0.14 | |
| | Net realized and unrealized gain/(loss) | | 8.92 | | | (17.27) | | | 13.48 | | | 14.89 | | | 0.49 | | | 10.33 | |
| Total from Investment Operations | | 9.00 | | | (17.31) | | | 13.40 | | | 15.00 | | | 0.69 | | | 10.47 | |
| Less Dividends and Distributions: | | | | | | | | | | | | | | | | | | |
| | Dividends (from net investment income) | | (0.02) | | | — | | | (0.03) | | | (0.19) | | | (0.10) | | | (0.08) | |
| | Distributions (from capital gains) | | (0.11) | | | (8.85) | | | (1.84) | | | (4.93) | | | (4.35) | | | (2.26) | |
| Total Dividends and Distributions | | (0.13) | | | (8.85) | | | (1.87) | | | (5.12) | | | (4.45) | | | (2.34) | |
| Net Asset Value, End of Period | | $54.10 | | | $45.23 | | | $71.39 | | | $59.86 | | | $49.98 | | | $53.74 | |
| Total Return* | | 19.94% | | | (28.04)% | | | 22.76% | | | 32.27% | | | 3.07% | | | 23.74% | |
| Net Assets, End of Period (in thousands) | | $3,529,121 | | | $3,051,003 | | | $4,577,362 | | | $3,940,635 | | | $3,319,149 | | | $3,481,882 | |
| Average Net Assets for the Period (in thousands) | | $3,267,272 | | | $4,056,851 | | | $4,384,575 | | | $3,505,134 | | | $3,219,617 | | | $3,264,878 | |
| Ratios to Average Net Assets**: | | | | | | | | | | | | | | | | | | |
| | Ratio of Gross Expenses | | 0.73% | | | 0.77% | | | 0.79% | | | 0.78% | | | 0.80% | | | 0.83% | |
| | Ratio of Net Expenses (After Waivers and Expense Offsets) | | 0.71% | | | 0.74% | | | 0.77% | | | 0.76% | | | 0.77% | | | 0.79% | |
| | Ratio of Net Investment Income/(Loss) | | 0.31% | | | (0.07)% | | | (0.13)% | | | 0.22% | | | 0.41% | | | 0.29% | |
| Portfolio Turnover Rate | | 11% | | | 32% | | | 31% | | | 38% | | | 41% | | | 43% | |
| | | | | | | | | | | | | | | | | | | | | | |
| |
* Total return includes adjustments in accordance with generally accepted accounting principles required at the year or period end and are not annualized for periods of less than one full year. ** Annualized for periods of less than one full year. (1) Per share amounts are calculated based on average shares outstanding during the year or period. |
| | |
See Notes to Financial Statements. |
| |
Janus Investment Fund | 23 |
Janus Henderson Research Fund
Notes to Financial Statements (unaudited)
1. Organization and Significant Accounting Policies
Janus Henderson Research Fund (the “Fund”) is a series of Janus Investment Fund (the “Trust”), which is organized as a Massachusetts business trust and is registered under the Investment Company Act of 1940, as amended (the “1940 Act”), as an open-end management investment company, and therefore has applied the specialized accounting and reporting guidance in Financial Accounting Standards Board (“FASB”) Accounting Standards Codification (“ASC”) Topic 946. The Trust offers 40 funds, each of which offers multiple share classes, with differing investment objectives and policies. The Fund seeks long-term growth of capital. The Fund is classified as diversified, as defined in the 1940 Act. Janus Henderson Investors US LLC is the investment adviser (the “Adviser”) to the Fund.
The Fund offers multiple classes of shares in order to meet the needs of various types of investors. Each class represents an interest in the same portfolio of investments. Certain financial intermediaries may not offer all classes of shares.
Shareholders, including other funds, individuals, accounts, as well as the Fund’s portfolio manager(s) and/or investment personnel, may from time to time own (beneficially or of record) a significant percentage of the Fund’s Shares and can be considered to “control” the Fund when that ownership exceeds 25% of the Fund’s assets (and which may differ from control as determined in accordance with United States of America generally accepted accounting principles ("US GAAP")).
Class A Shares are offered through financial intermediary platforms including, but not limited to, traditional brokerage platforms, mutual fund wrap fee programs, bank trust platforms, and retirement platforms.
Class C Shares are offered through financial intermediary platforms including, but not limited to, traditional brokerage platforms, mutual fund wrap fee programs, and bank trust platforms.
Class C Shares are closed to investments by new employer-sponsored retirement plans and existing employer-sponsored retirement plans are no longer able to make additional purchases or exchanges into Class C Shares.
The Fund currently implements an automatic conversion feature pursuant to which Class C Shares that have been held for eight years are automatically converted to Class A Shares without the imposition of any sales charge, fee or other charge. The conversion will generally occur no later than ten business days in the month following the month of the eighth anniversary of the date of purchase. Class C Shares purchased through the reinvestment of dividends and other distributions on Class C Shares will convert to Class A Shares at the same time as the original Class C Shares with respect to which they were purchased. For Class C Shares held in omnibus accounts on intermediary platforms, the Fund relies on these intermediaries to implement this conversion feature. Your financial intermediary may have separate policies and procedures as to when and how Class C Shares may be converted to Class A Shares.
Effective July 6, 2020, Class D Shares are available to new investors, subject to any closed fund policies for a Fund, as applicable. Previously, Class D Shares were only available to investors who already had a direct account with the Janus Henderson funds; immediate family members or members of the same household of an eligible individual investor; and existing beneficial owners of sole proprietorships or partnerships that hold accounts directly with the Janus Henderson funds.
Class I Shares are available through certain financial intermediary platforms including, but not limited to, mutual fund wrap fee programs, managed account programs, asset allocation programs, bank trust platforms, as well as certain retirement platforms. Class I Shares are also available to certain direct institutional investors including, but not limited to, corporations, certain retirement plans, public plans, and foundations/endowments, who established Class I Share accounts before August 4, 2017.
Class N Shares are generally available only to financial intermediaries purchasing on behalf of: 1) certain adviser-assisted, employer-sponsored retirement plans, including 401(k) plans, 457 plans, 403(b) plans, Taft-Hartley multi-employer plans, profit-sharing and money purchase pension plans, defined benefit plans and certain welfare benefit plans, such as health savings accounts, and nonqualified deferred compensation plans; and 2) retail investors purchasing in qualified or nonqualified accounts, whose accounts are held through an omnibus account at their financial intermediary, and where the financial intermediary requires no payment or reimbursement from the Fund, the Adviser, or its affiliates. Class N Shares are also available to Janus Henderson proprietary products and to certain direct institutional investors approved by Janus Henderson Distributors US LLC (the “Distributor”) including, but not limited to,
Janus Henderson Research Fund
Notes to Financial Statements (unaudited)
corporations, certain retirement plans, public plans, and foundations and endowments, subject to minimum investment requirements.
Class R Shares are offered through financial intermediary platforms including, but not limited to, retirement platforms.
Class S Shares are offered through financial intermediary platforms including, but not limited to, retirement platforms and asset allocation, mutual fund wrap, or other discretionary or nondiscretionary fee-based investment advisory programs. In addition, Class S Shares may be available through certain financial intermediaries who have an agreement with the Adviser or its affiliates to offer Class S Shares on their supermarket platforms.
Class T Shares are available through certain financial intermediary platforms including, but not limited to, mutual fund wrap fee programs, managed account programs, asset allocation programs, bank trust platforms, as well as certain retirement platforms. In addition, Class T Shares may be available through certain financial intermediaries who have an agreement with the Adviser or its affiliates to offer Class T Shares on their supermarket platforms.
The following accounting policies have been followed by the Fund and are in conformity with US GAAP.
Investment Valuation
Fund holdings are valued in accordance with policies and procedures established by the Adviser pursuant to Rule 2a-5 under the 1940 Act and approved by and subject to the oversight of the Trustees (the “Valuation Procedures”). Equity securities traded on a domestic securities exchange are generally valued at readily available market quotations, which are (i) the official close prices or (ii) last sale prices on the primary market or exchange in which the securities trade. If such price is lacking for the trading period immediately preceding the time of determination, such securities are generally valued at their current bid price. Equity securities that are traded on a foreign exchange are generally valued at the closing prices on such markets. In the event that there is no current trading volume on a particular security in such foreign exchange, the bid price from the primary exchange is generally used to value the security. Foreign securities and currencies are converted to U.S. dollars using the current spot USD dollar exchange rate in effect at the close of the New York Stock Exchange (“NYSE”). The Fund will determine the market value of individual securities held by it by using prices provided by one or more approved professional pricing services or, as needed, by obtaining market quotations from independent broker-dealers. Most debt securities are valued in accordance with the evaluated bid price supplied by the Adviser-approved pricing service that is intended to reflect market value. The evaluated bid price supplied by the pricing service is an evaluation that may consider factors such as security prices, yields, maturities and ratings. Certain short-term securities maturing within 60 days or less may be evaluated and valued on an amortized cost basis provided that the amortized cost determined approximates market value. Securities for which market quotations or evaluated prices are not readily available or deemed unreliable are valued at fair value determined in good faith by the Adviser pursuant to the Valuation Procedures. Circumstances in which fair valuation may be utilized include, but are not limited to: (i) a significant event that may affect the securities of a single issuer, such as a merger, bankruptcy, or significant issuer-specific development; (ii) an event that may affect an entire market, such as a natural disaster or significant governmental action; (iii) a nonsignificant event such as a market closing early or not opening, or a security trading halt; and (iv) pricing of a nonvalued security and a restricted or nonpublic security. Special valuation considerations may apply with respect to “odd-lot” fixed-income transactions which, due to their small size, may receive evaluated prices by pricing services which reflect a large block trade and not what actually could be obtained for the odd-lot position. The valuation policies provide for the use of systematic fair valuation models provided by independent pricing services to value foreign equity securities in order to adjust for stale pricing, which may occur between the close of certain foreign exchanges and the close of the NYSE. The value of the securities of other mutual funds held by a Fund, if any, will be calculated using the NAV of such mutual funds.
Valuation Inputs Summary
FASB ASC 820, Fair Value Measurements and Disclosures (“ASC 820”), defines fair value, establishes a framework for measuring fair value, and expands disclosure requirements regarding fair value measurements. This standard emphasizes that fair value is a market-based measurement that should be determined based on the assumptions that market participants would use in pricing an asset or liability and establishes a hierarchy that prioritizes inputs to valuation techniques used to measure fair value. These inputs are summarized into three broad levels:
Level 1 – Unadjusted quoted prices in active markets the Fund has the ability to access for identical assets or liabilities.
Janus Henderson Research Fund
Notes to Financial Statements (unaudited)
Level 2 – Observable inputs other than unadjusted quoted prices included in Level 1 that are observable for the asset or liability either directly or indirectly. These inputs may include quoted prices for the identical instrument on an inactive market, prices for similar instruments, interest rates, prepayment speeds, credit risk, yield curves, default rates and similar data.
Assets or liabilities categorized as Level 2 in the hierarchy generally include: debt securities fair valued in accordance with the evaluated bid or ask prices supplied by a pricing service; securities traded on OTC markets and listed securities for which no sales are reported that are fair valued at the latest bid price (or yield equivalent thereof) obtained from one or more dealers transacting in a market for such securities or by a pricing service approved by the Fund’s Trustees; certain short-term debt securities with maturities of 60 days or less that are fair valued at amortized cost; and equity securities of foreign issuers whose fair value is determined by using systematic fair valuation models provided by independent third parties in order to adjust for stale pricing which may occur between the close of certain foreign exchanges and the close of the NYSE. Other securities that may be categorized as Level 2 in the hierarchy include, but are not limited to, preferred stocks, bank loans, swaps, investments in unregistered investment companies, options, and forward contracts.
Level 3 – Unobservable inputs for the asset or liability to the extent that relevant observable inputs are not available, representing the Fund’s own assumptions about the assumptions that a market participant would use in valuing the asset or liability, and that would be based on the best information available.
There have been no significant changes in valuation techniques used in valuing any such positions held by the Fund since the beginning of the fiscal period.
The inputs or methodology used for fair valuing securities are not necessarily an indication of the risk associated with investing in those securities. The summary of inputs used as of March 31, 2023 to fair value the Fund’s investments in securities and other financial instruments is included in the “Valuation Inputs Summary” in the Notes to Schedule of Investments and Other Information.
The Fund did not hold a significant amount of Level 3 securities as of March 31, 2023.
Investment Transactions and Investment Income
Investment transactions are accounted for as of the date purchased or sold (trade date). Dividend income is recorded on the ex-dividend date. Certain dividends from foreign securities will be recorded as soon as the Fund is informed of the dividend, if such information is obtained subsequent to the ex-dividend date. Dividends from foreign securities may be subject to withholding taxes in foreign jurisdictions. Non-cash dividends, if any, are recorded on the ex-dividend date at fair value. Interest income is recorded daily on an accrual basis and includes amortization of premiums and accretion of discounts. The Fund classifies gains and losses on prepayments received as an adjustment to interest income. Debt securities may be placed in non-accrual status and related interest income may be reduced by stopping current accruals and writing off interest receivables when collection of all or a portion of interest has become doubtful. Gains and losses are determined on the identified cost basis, which is the same basis used for federal income tax purposes. Income, as well as gains and losses, both realized and unrealized, are allocated daily to each class of shares based upon the ratio of net assets represented by each class as a percentage of total net assets.
Expenses
The Fund bears expenses incurred specifically on its behalf. Each class of shares bears a portion of general expenses, which are allocated daily to each class of shares based upon the ratio of net assets represented by each class as a percentage of total net assets. Expenses directly attributable to a specific class of shares are charged against the operations of such class.
Estimates
The preparation of financial statements in conformity with US GAAP requires management to make estimates and assumptions that affect the reported amount of assets and liabilities and disclosure of contingent assets and liabilities at the date of the financial statements, and the reported amounts of income and expenses during the reporting period. Actual results could differ from those estimates.
Indemnifications
In the normal course of business, the Fund may enter into contracts that contain provisions for indemnification of other parties against certain potential liabilities. The Fund’s maximum exposure under these arrangements is unknown, and
Janus Henderson Research Fund
Notes to Financial Statements (unaudited)
would involve future claims that may be made against the Fund that have not yet occurred. Currently, the risk of material loss from such claims is considered remote.
Foreign Currency Translations
The Fund does not isolate that portion of the results of operations resulting from the effect of changes in foreign exchange rates on investments from the fluctuations arising from changes in market prices of securities held at the date of the financial statements. Net unrealized appreciation or depreciation of investments and foreign currency translations arise from changes in the value of assets and liabilities, including investments in securities held at the date of the financial statements, resulting from changes in the exchange rates and changes in market prices of securities held.
Currency gains and losses are also calculated on payables and receivables that are denominated in foreign currencies. The payables and receivables are generally related to foreign security transactions and income translations.
Foreign currency-denominated assets and forward currency contracts may involve more risks than domestic transactions, including currency risk, counterparty risk, political and economic risk, regulatory risk and equity risk. Risks may arise from unanticipated movements in the value of foreign currencies relative to the U.S. dollar.
Dividends and Distributions
The Fund generally declares and distributes dividends of net investment income and realized capital gains (if any) annually. The Fund may treat a portion of the amount paid to redeem shares as a distribution of investment company taxable income and realized capital gains that are reflected in the net asset value. This practice, commonly referred to as “equalization,” has no effect on the redeeming shareholder or a Fund’s total return, but may reduce the amounts that would otherwise be required to be paid as taxable dividends to the remaining shareholders. It is possible that the Internal Revenue Service (IRS) could challenge the Fund's equalization methodology or calculations, and any such challenge could result in additional tax, interest, or penalties to be paid by the Fund.
The Fund may make certain investments in real estate investment trusts (“REITs”) which pay dividends to their shareholders based upon funds available from operations. It is quite common for these dividends to exceed the REITs’ taxable earnings and profits, resulting in the excess portion of such dividends being designated as a return of capital. If the Fund distributes such amounts, such distributions could constitute a return of capital to shareholders for federal income tax purposes.
Federal Income Taxes
The Fund intends to continue to qualify as a regulated investment company and distribute all of its taxable income in accordance with the requirements of Subchapter M of the Internal Revenue Code. Management has analyzed the Fund’s tax positions taken for all open federal income tax years, generally a three-year period, and has concluded that no provision for federal income tax is required in the Fund’s financial statements. The Fund is not aware of any tax positions for which it is reasonably possible that the total amounts of unrecognized tax benefits will significantly change in the next twelve months.
2. Other Investments and Strategies
Additional Investment Risk
The U.S. government and the Federal Reserve, as well as certain foreign governments and central banks, have taken extraordinary actions to support local and global economies and the financial markets in response to the COVID-19 pandemic. This and other government intervention into the economy and financial markets to address the COVID-19 pandemic may not work as intended, particularly if the efforts are perceived by investors as being unlikely to achieve the desired results. Government actions to mitigate the economic impact of the pandemic have resulted in a large expansion of government deficits and debt, the long term consequences of which are not known. The COVID-19 pandemic could adversely affect the value and liquidity of a Fund’s investments, impair a Fund’s ability to satisfy redemption requests, and negatively impact a Fund’s performance. In addition, the outbreak of COVID-19, and measures taken to mitigate its effects, could result in disruptions to the services provided to a Fund by its service providers.
Widespread disease, including pandemics and epidemics, and natural or environmental disasters, including those which may be attributable to global climate change, such as earthquakes, fires, floods, hurricanes, tsunamis and weather-related phenomena generally, have been and can be highly disruptive to economies and markets, adversely impacting individual companies, sectors, industries, markets, currencies, interest and inflation rates, credit ratings, investor
Janus Henderson Research Fund
Notes to Financial Statements (unaudited)
sentiment, and other factors affecting the value of a Fund’s investments. Economies and financial markets throughout the world have become increasingly interconnected, which increases the likelihood that events or conditions in one region or country will adversely affect markets or issuers in other regions or countries, including the United States. These disruptions could prevent a Fund from executing advantageous investment decisions in a timely manner and negatively impact a Fund’s ability to achieve its investment objective(s). Any such event(s) could have a significant adverse impact on the value of a Fund. In addition, these disruptions could also impair the information technology and other operational systems upon which the Fund’s service providers, including the Adviser or the subadviser (as applicable), rely, and could otherwise disrupt the ability of employees of the Fund’s service providers to perform essential tasks on behalf of the Fund. Adverse weather conditions may also have a particularly significant negative effect on issuers in the agricultural sector and on insurance and reinsurance companies that insure or reinsure against the impact of natural disasters.
A number of countries in the European Union (the “EU”) have experienced, and may continue to experience, severe economic and financial difficulties. In particular, many EU nations are susceptible to economic risks associated with high levels of debt. Many non-governmental issuers, and even certain governments, have defaulted on, or been forced to restructure, their debts. Many other issuers have faced difficulties obtaining credit or refinancing existing obligations. Financial institutions have in many cases required government or central bank support, have needed to raise capital, and/or have been impaired in their ability to extend credit. As a result, financial markets in the EU have experienced extreme volatility and declines in asset values and liquidity. These difficulties may continue, worsen, or spread further within the EU. Responses to these financial problems by European governments, central banks, and others, including austerity measures and reforms, may not work, may result in social unrest, and may limit future growth and economic recovery or have other unintended consequences. Among other things, these developments have adversely affected the value and exchange rate of the euro and pound sterling, and may continue to significantly affect the economies of all EU countries, which in turn may have a material adverse effect on the Fund’s investments in such countries, other countries that depend on EU countries for significant amounts of trade or investment, or issuers with exposure to debt issued by certain EU countries.
Real Estate Investing
The Fund may invest in equity and debt securities of real estate-related companies. Such companies may include those in the real estate industry or real estate-related industries. These securities may include common stocks, corporate bonds, preferred stocks, and other equity securities, including, but not limited to, mortgage-backed securities, real estate-backed securities, securities of REITs and similar REIT-like entities. A REIT is a trust that invests in real estate-related projects, such as properties, mortgage loans, and construction loans. REITs are generally categorized as equity, mortgage, or hybrid REITs. A REIT may be listed on an exchange or traded OTC.
Restricted Security Transactions
Restricted securities held by the Fund may not be sold except in exempt transactions or in a public offering registered under the Securities Act of 1933, as amended. The risk of investing in such securities is generally greater than the risk of investing in the securities of widely held, publicly traded companies. Lack of a secondary market and resale restrictions may result in the inability of the Fund to sell a security at a fair price and may substantially delay the sale of the security. In addition, these securities may exhibit greater price volatility than securities for which secondary markets exist.
Counterparties
Fund transactions involving a counterparty are subject to the risk that the counterparty or a third party will not fulfill its obligation to the Fund (“counterparty risk”). Counterparty risk may arise because of the counterparty’s financial condition (i.e., financial difficulties, bankruptcy, or insolvency), market activities and developments, or other reasons, whether foreseen or not. A counterparty’s inability to fulfill its obligation may result in significant financial loss to the Fund. The Fund may be unable to recover its investment from the counterparty or may obtain a limited recovery, and/or recovery may be delayed. The extent of the Fund’s exposure to counterparty risk with respect to financial assets and liabilities approximates its carrying value. See the "Offsetting Assets and Liabilities" section of this Note for further details.
The Fund may be exposed to counterparty risk through participation in various programs, including, but not limited to, lending its securities to third parties, cash sweep arrangements whereby the Fund’s cash balance is invested in one or more types of cash management vehicles, as well as investments in, but not limited to, repurchase agreements, debt securities, and derivatives, including various types of swaps, futures and options. The Fund intends to enter into financial transactions with counterparties that the Adviser believes to be creditworthy at the time of the transaction. There is
Janus Henderson Research Fund
Notes to Financial Statements (unaudited)
always the risk that the Adviser’s analysis of a counterparty’s creditworthiness is incorrect or may change due to market conditions. To the extent that the Fund focuses its transactions with a limited number of counterparties, it will have greater exposure to the risks associated with one or more counterparties.
Securities Lending
Under procedures adopted by the Trustees, the Fund may seek to earn additional income by lending securities to certain qualified broker-dealers and institutions. JPMorgan Chase Bank, National Association acts as securities lending agent and a limited purpose custodian or subcustodian to receive and disburse cash balances and cash collateral, hold short-term investments, hold collateral, and perform other custodial functions in accordance with the Non-Custodial Securities Lending Agreement. For financial reporting purposes, the Fund does not offset financial instruments’ payables and receivables and related collateral on the Statement of Assets and Liabilities. The Fund may lend fund securities in an amount equal to up to 1/3 of its total assets as determined at the time of the loan origination. There is the risk of delay in recovering a loaned security or the risk of loss in collateral rights if the borrower fails financially. In addition, the Adviser makes efforts to balance the benefits and risks from granting such loans. All loans will be continuously secured by collateral which may consist of cash, U.S. Government securities, domestic and foreign short-term debt instruments, letters of credit, time deposits, repurchase agreements, money market mutual funds or other money market accounts, or such other collateral as permitted by the SEC. If the Fund is unable to recover a security on loan, the Fund may use the collateral to purchase replacement securities in the market. There is a risk that the value of the collateral could decrease below the cost of the replacement security by the time the replacement investment is made, resulting in a loss to the Fund. In certain circumstances individual loan transactions could yield negative returns.
Upon receipt of cash collateral, the Adviser may invest it in affiliated or non-affiliated cash management vehicles, whether registered or unregistered entities, as permitted by the 1940 Act and rules promulgated thereunder. The Adviser currently intends to primarily invest the cash collateral in a cash management vehicle for which the Adviser serves as investment adviser, Janus Henderson Cash Collateral Fund LLC, or in time deposits. An investment in Janus Henderson Cash Collateral Fund LLC is generally subject to the same risks that shareholders experience when investing in similarly structured vehicles, such as the potential for significant fluctuations in assets as a result of the purchase and redemption activity of the securities lending program, a decline in the value of the collateral, and possible liquidity issues. Such risks may delay the return of the cash collateral and cause the Fund to violate its agreement to return the cash collateral to a borrower in a timely manner. As adviser to the Fund and Janus Henderson Cash Collateral Fund LLC, the Adviser has an inherent conflict of interest as a result of its fiduciary duties to both the Fund and Janus Henderson Cash Collateral Fund LLC. Additionally, the Adviser receives an investment advisory fee of 0.05% for managing Janus Henderson Cash Collateral Fund LLC, but it may not receive a fee for managing certain other affiliated cash management vehicles in which the Fund may invest, and therefore may have an incentive to allocate preferred investment opportunities to investment vehicles for which it is receiving a fee.
The value of the collateral must be at least 102% of the market value of the loaned securities that are denominated in U.S. dollars and 105% of the market value of the loaned securities that are not denominated in U.S. dollars. Loaned securities and related collateral are marked-to-market each business day based upon the market value of the loaned securities at the close of business, employing the most recent available pricing information. Collateral levels are then adjusted based on this mark-to-market evaluation. Additional required collateral, or excess collateral returned, is delivered on the next business day. Therefore, the value of the collateral held may be temporarily less than 102% or 105% value of the securities on loan. The cash collateral invested by the Adviser is disclosed in the Schedule of Investments (if applicable).
Income earned from the investment of the cash collateral, net of rebates paid to, or fees paid by, borrowers and less the fees paid to the lending agent are included as “Affiliated securities lending income, net” on the Statement of Operations. As of March 31, 2023, securities lending transactions accounted for as secured borrowings with an overnight and continuous contractual maturity are $5,791,120. Gross amounts of recognized liabilities for securities lending (collateral received) as of March 31, 2023 is $5,942,834, resulting in the net amount due to the counterparty of $151,714.
Offsetting Assets and Liabilities
The Fund presents gross and net information about transactions that are either offset in the financial statements or subject to an enforceable master netting arrangement or similar agreement with a designated counterparty, regardless of whether the transactions are actually offset in the Statement of Assets and Liabilities.
Janus Henderson Research Fund
Notes to Financial Statements (unaudited)
The Offsetting Assets and Liabilities table located in the Schedule of Investments present gross amounts of recognized assets and/or liabilities and the net amounts after deducting collateral that has been pledged by counterparties or has been pledged to counterparties (if applicable). For corresponding information grouped by type of instrument, see the Fund's Schedule of Investments.
3. Investment Advisory Agreements and Other Transactions with Affiliates
The Fund pays the Adviser an investment advisory fee rate that may adjust up or down based on the Fund’s performance relative to its benchmark index.
The investment advisory fee rate paid to the Adviser by the Fund consists of two components: (1) a base fee calculated by applying the contractual fixed rate of the advisory fee to the Fund’s average daily net assets during the previous month (the “Base Fee Rate”), plus or minus (2) a performance-fee adjustment (the “Performance Adjustment”) calculated by applying a variable rate of up to 0.15% (positive or negative) to the Fund’s average daily net assets based on the Fund’s relative performance compared to the cumulative investment record of its benchmark index over a 36-month performance measurement period or shorter time period, as applicable. The investment advisory fee rate is calculated daily and paid monthly.
The investment performance of the Fund’s Class A Shares (waiving the upfront sales load) for the performance measurement period is used to calculate the Performance Adjustment. The Fund’s Base Fee Rate prior to any performance adjustment (expressed as an annual rate) is 0.64%, and the Fund’s benchmark index used in the calculation is the Russell 1000® Growth Index.
No Performance Adjustment is applied unless the difference between the Fund’s investment performance and the cumulative investment record of the Fund’s benchmark index is 0.50% or greater (positive or negative) during the applicable performance measurement period. The Base Fee Rate is subject to an upward or downward Performance Adjustment for every full 0.50% increment by which the Fund outperforms or underperforms its benchmark index, up to the Fund’s full performance rate of ±5.00%. Because the Performance Adjustment is tied to a Fund’s relative performance compared to its benchmark index (and not its absolute performance), the Performance Adjustment could increase the Adviser’s fee even if the Fund’s Shares lose value during the performance measurement period and could decrease the Adviser’s fee even if the Fund’s Shares increase in value during the performance measurement period. For purposes of computing the Base Fee Rate and the Performance Adjustment, net assets are averaged over different periods (average daily net assets during the previous month for the Base Fee Rate, versus average daily net assets during the performance measurement period for the Performance Adjustment). Performance of the Fund is calculated net of expenses whereas the Fund’s benchmark index does not have any fees or expenses. Reinvestment of dividends and distributions is included in calculating both the performance of a Fund and the Fund’s benchmark index.
The Fund’s prospectuses and statement(s) of additional information contain additional information about performance-based fees. The amount shown as advisory fees on the Statement of Operations reflects the Base Fee Rate plus/minus any Performance Adjustment. For the period ended March 31, 2023, the performance adjusted investment advisory fee rate before any waivers and/or reimbursements of expenses is 0.46%.
The Adviser has contractually agreed to waive the investment advisory fee and/or reimburse operating expenses to the extent that the Fund’s total annual fund operating expenses, excluding any performance adjustments to management fees (if applicable), the fees payable pursuant to a Rule 12b-1 plan, shareholder servicing fees, such as transfer agency fees (including out-of-pocket costs), administrative services fees and any networking/omnibus payable by any share class, brokerage commissions, interest, dividends, taxes, acquired fund fees and expenses, and extraordinary expenses, exceed the annual rate of 0.68% of the Fund’s average daily net assets. The Adviser has agreed to continue the waivers for at least a one-year period ending January 27, 2023. If applicable, amounts waived and/or reimbursed to the Fund by the Adviser are disclosed as “Excess Expense Reimbursement and Waivers” on the Statement of Operations.
The Adviser serves as administrator to the Fund pursuant to an administration agreement between the Adviser and the Trust. Under the administration agreement, the Adviser is authorized to perform, or cause others to perform certain administration, compliance, and accounting services to the Fund, including providing office space for the Fund, and is reimbursed by the Fund for certain of its costs in providing these services (to the extent the Adviser seeks reimbursement and such costs are not otherwise waived). In addition, employees of the Adviser and/or its affiliates may serve as officers of the Trust. The Fund pays for some or all of the salaries, fees, and expenses of the Adviser employees and Fund officers, with respect to certain specified administration functions they perform on behalf of the
Janus Henderson Research Fund
Notes to Financial Statements (unaudited)
Fund. The Fund pays these costs based on out-of-pocket expenses incurred by the Adviser, and these costs are separate and apart from advisory fees and other expenses paid in connection with the investment advisory services the Adviser (or any subadvisor, as applicable) provides to the Fund. These amounts are disclosed as “Affiliated fund administration fees” on the Statement of Operations. In addition, some expenses related to compensation payable to the Fund’s Chief Compliance Officer and certain compliance staff, all of whom are employees of the Adviser and/or its affiliates, are shared with the Fund. Total compensation of $114,430 was paid to the Chief Compliance Officer and certain compliance staff by the Trust during the period ended March 31, 2023. The Fund's portion is reported as part of “Other expenses” on the Statement of Operations.
Janus Henderson Services US LLC (the “Transfer Agent”), a wholly-owned subsidiary of the Adviser, is the Fund’s transfer agent. The Transfer Agent provides or arranges for the provision of shareholder services including, but not limited to, recordkeeping, subaccounting, answering inquiries regarding accounts, order processing, transaction confirmations, the mailing of prospectuses and shareholder reports, and other shareholder services provided to or on behalf of shareholders. These amounts are disclosed as “Transfer agent administrative fees and expenses” on the Statement of Operations.
Class D Shares of the Fund pay the Transfer Agent an annual administrative services fee based on the average daily net assets of Class D Shares as detailed below.
| | |
Average Daily Net Assets of Class D Shares of the Janus Henderson funds | Administrative Services Fee |
Under $40 billion | 0.12% |
$40 billion – $49.9 billion | 0.10% |
Over $49.9 billion | 0.08% |
During the reporting period, the administrative services fee rate was 0.12%.
The Transfer Agent receives an administrative services fee at an annual rate of up to 0.25% of the average daily net assets of the Fund’s Class R Shares, Class S Shares and Class T Shares for providing or procuring administrative services to investors in Class R Shares, Class S Shares and Class T Shares of the Fund. The Transfer Agent expects to use all or a significant portion of this fee to compensate retirement plan service providers, broker-dealers, bank trust departments, financial advisors, and other financial intermediaries for providing these services. The Transfer Agent may keep certain amounts retained for reimbursement of out-of-pocket costs incurred for servicing clients of Class R Shares, Class S Shares and Class T Shares.
Shareholder Services provided by these financial intermediaries may include, but are not limited to, recordkeeping, subaccounting, order processing, providing order confirmations, periodic statements, forwarding prospectuses, shareholder reports, and other materials to existing customers, answering inquiries regarding accounts, and other administrative services. Order processing includes the submission of transactions through the National Securities Clearing Corporation (“NSCC”) or similar systems, or those processed on a manual basis with the Adviser. For all share classes, the Transfer Agent also seeks reimbursement for costs it incurs as transfer agent and for providing servicing.
Certain, but not all, intermediaries may charge administrative fees to investors in Class A Shares, Class C Shares, and Class I Shares for administrative services provided on behalf of such investors. These administrative fees are paid by the Class A Shares, Class C Shares, and Class I Shares of the Fund to the Transfer Agent, which uses such fees to reimburse intermediaries. Consistent with the Transfer Agency Agreement between the Transfer Agent and the Fund, the Transfer Agent may negotiate the level, structure, and/or terms of the administrative fees with intermediaries requiring such fees on behalf of the Fund. The Adviser and its affiliates benefit from an increase in assets that may result from such relationships. The Adviser has agreed to limit these fees up to 0.20% for Class A Shares and Class C Shares, and up to 0.15% for Class I Shares on an annual basis based on the daily net assets of each share class. Such limits are subject to change by the Trustees in the future. These amounts are disclosed as “Transfer agent networking and omnibus fees” on the Statement of Operations.
The Transfer Agent is not compensated for its services related to the shares, except for out-of-pocket costs, although the Transfer Agent is compensated for its services related to Fund’s Class D Shares. These amounts are disclosed as “Other transfer agent fees and expenses” on the Statement of Operations.
Under distribution and shareholder servicing plans (the “Plans”) adopted in accordance with Rule 12b-1 under the 1940 Act, the Fund pays the Trust’s distributor, the Distributor, a wholly-owned subsidiary of the Adviser, a fee for the
Janus Henderson Research Fund
Notes to Financial Statements (unaudited)
sale and distribution and/or shareholder servicing of the shares based on the average daily net assets for each share class at an annual rate of up to 0.25% for Class A Shares, up to 1.00% for Class C Shares, of up to 0.50% of the Class R Shares’ average daily net assets, and up to 0.25% for Class S Shares. Under the terms of the Plans, the Trust is authorized to make payments to the Distributor for remittance to retirement plan service providers, broker-dealers, bank trust departments, financial advisors, and other financial intermediaries, as compensation for distribution and/or shareholder services performed by such entities for their customers who are investors in the Fund. These amounts are disclosed as “12b-1 Distribution and shareholder servicing fees” on the Statement of Operations.
Class A Shares include a 5.75% upfront sales charge of the offering price of the Fund. The sales charge is allocated between the Distributor and financial intermediaries. During the period ended March 31, 2023, the Distributor retained upfront sales charges of $374.
A contingent deferred sales charge (“CDSC”) of 1.00% will be deducted with respect to Class A Shares purchased without a sales load and redeemed within 12 months of purchase, unless waived. Any applicable CDSC will be 1.00% of the lesser of the original purchase price or the value of the redemption of the Class A Shares redeemed. There were no CDSCs paid by redeeming shareholders of Class A Shares to the Distributor during the period ended March 31, 2023.
A CDSC of 1.00% will be deducted with respect to Class C Shares redeemed within 12 months of purchase, unless waived. Any applicable CDSC will be 1.00% of the lesser of the original purchase price or the value of the redemption of the Class C Shares redeemed. During the period ended March 31, 2023, redeeming shareholders of Class C Shares paid CDSCs of $4.
The Board of Trustees has adopted a deferred compensation plan (the “Deferred Plan”) for independent Trustees to elect to defer receipt of all or a portion of the annual compensation they are entitled to receive from the Fund. All deferred fees are credited to an account established in the name of the Trustees. The amounts credited to the account then increase or decrease, as the case may be, in accordance with the performance of one or more of the Janus Henderson funds that are selected by the Trustees. The account balance continues to fluctuate in accordance with the performance of the selected fund or funds until final payment of all amounts are credited to the account. The fluctuation of the account balance is recorded by the Fund as unrealized appreciation/(depreciation) and is included as of March 31, 2023 on the Statement of Assets and Liabilities in the asset, “Trustees’ deferred compensation,” and liability, “Trustees’ deferred compensation fees.” Additionally, the recorded unrealized appreciation/(depreciation) is included in “Total distributable earnings (loss)” on the Statement of Assets and Liabilities. Deferred compensation expenses for the period ended March 31, 2023 are included in “Trustees’ fees and expenses” on the Statement of Operations. Trustees are allowed to change their designation of mutual funds from time to time. Amounts will be deferred until distributed in accordance with the Deferred Plan. Deferred fees of $205,688 were paid by the Trust to the Trustees under the Deferred Plan during the period ended March 31, 2023.
Pursuant to the provisions of the 1940 Act and related rules, the Fund may participate in an affiliated or non-affiliated cash sweep program. In the cash sweep program, uninvested cash balances of the Fund may be used to purchase shares of affiliated or non-affiliated money market funds or cash management pooled investment vehicles that operate as money market funds. The Fund is eligible to participate in the cash sweep program (the “Investing Funds”). The Adviser has an inherent conflict of interest because of its fiduciary duties to the affiliated money market funds or cash management pooled investment vehicles and the Investing Funds. Janus Henderson Cash Liquidity Fund LLC (the “Sweep Vehicle”) is an affiliated unregistered cash management pooled investment vehicle that invests primarily in highly-rated short-term fixed-income securities. The Sweep Vehicle operates pursuant to the provisions of the 1940 Act that govern the operation of money market funds and prices its shares at NAV reflecting market-based values of its portfolio securities (i.e., a “floating” NAV) rounded to the fourth decimal place (e.g., $1.0000). The Sweep Vehicle is permitted to impose a liquidity fee (of up to 2%) on redemptions from the Sweep Vehicle or a redemption gate that temporarily suspends redemptions from the Sweep Vehicle for up to 10 business days during a 90 day period. There are no restrictions on the Fund's ability to withdraw investments from the Sweep Vehicle at will, and there are no unfunded capital commitments due from the Fund to the Sweep Vehicle. The Sweep Vehicle does not charge any management fee, sales charge or service fee.
Any purchases and sales, realized gains/losses and recorded dividends from affiliated investments during the period ended March 31, 2023 can be found in the “Schedules of Affiliated Investments” located in the Schedule of Investments.
Janus Henderson Research Fund
Notes to Financial Statements (unaudited)
The Fund is permitted to purchase or sell securities (“cross-trade”) between itself and other funds or accounts managed by the Adviser in accordance with Rule 17a-7 under the Investment Company Act of 1940 (“Rule 17a-7”), when the transaction is consistent with the investment objectives and policies of the Fund and in accordance with the Internal Cross Trade Procedures adopted by the Trust’s Board of Trustees. These procedures have been designed to ensure that any cross-trade of securities by the Fund from or to another fund or account that is or could be considered an affiliate of the Fund under certain limited circumstances by virtue of having a common investment adviser, common Officer, or common Trustee complies with Rule 17a-7. Under these procedures, each cross-trade is effected at the current market price to save costs where allowed. During the period ended March 31, 2023, the Fund engaged in cross trades amounting to $11,160,573 in sales, resulting in a net realized loss of $700,297. The net realized loss is included within the “Net Realized Gain/(Loss) on Investments” section of the Fund’s Statement of Operations.
4. Federal Income Tax
Income and capital gains distributions are determined in accordance with income tax regulations that may differ from US GAAP. These differences are due to differing treatments for items such as net short-term gains, deferral of wash sale losses, foreign currency transactions, net investment losses, and capital loss carryovers.
The Fund has elected to treat gains and losses on forward foreign currency contracts as capital gains and losses, if applicable. Other foreign currency gains and losses on debt instruments are treated as ordinary income for federal income tax purposes pursuant to Section 988 of the Internal Revenue Code.
The aggregate cost of investments and the composition of unrealized appreciation and depreciation of investment securities for federal income tax purposes as of March 31, 2023 are noted below. The primary differences between book and tax appreciation or depreciation of investments are wash sale loss deferrals, straddle deferrals, and investments in partnerships.
| | | | |
Federal Tax Cost | Unrealized
Appreciation | Unrealized
(Depreciation) | Net Tax Appreciation/
(Depreciation) |
$ 9,714,640,247 | $6,735,200,682 | $(512,896,950) | $ 6,222,303,732 |
Janus Henderson Research Fund
Notes to Financial Statements (unaudited)
5. Capital Share Transactions
| | | | | | | |
| | | | | | |
| | Period ended March 31, 2023 | | Year ended September 30, 2022 |
| | Shares | Amount | | Shares | Amount |
| | | | | | | |
Class A Shares: | | | | | |
Shares sold | 119,393 | $ 5,842,666 | | 175,606 | $ 10,649,895 |
Reinvested dividends and distributions | 1,743 | 81,942 | | 95,791 | 6,169,874 |
Shares repurchased | (161,285) | (7,885,383) | | (212,938) | (12,264,867) |
Net Increase/(Decrease) | (40,149) | $ (1,960,775) | | 58,459 | $ 4,554,902 |
Class C Shares: | | | | | |
Shares sold | 8,542 | $ 369,153 | | 9,627 | $ 570,670 |
Reinvested dividends and distributions | 532 | 22,223 | | 35,103 | 2,024,369 |
Shares repurchased | (55,471) | (2,405,515) | | (78,041) | (4,074,451) |
Net Increase/(Decrease) | (46,397) | $ (2,014,139) | | (33,311) | $ (1,479,412) |
Class D Shares: | | | | | |
Shares sold | 1,231,849 | $ 60,706,979 | | 2,832,009 | $ 171,231,315 |
Reinvested dividends and distributions | 903,656 | 43,004,989 | | 26,529,687 | 1,729,735,563 |
Shares repurchased | (7,865,666) | (388,860,472) | | (14,276,695) | (854,374,318) |
Net Increase/(Decrease) | (5,730,161) | $(285,148,504) | | 15,085,001 | $1,046,592,560 |
Class I Shares: | | | | | |
Shares sold | 708,436 | $ 35,045,696 | | 1,299,315 | $ 76,937,896 |
Reinvested dividends and distributions | 30,850 | 1,464,759 | | 795,671 | 51,774,306 |
Shares repurchased | (869,280) | (42,631,327) | | (1,790,464) | (104,516,490) |
Net Increase/(Decrease) | (129,994) | $ (6,120,872) | | 304,522 | $ 24,195,712 |
Class N Shares: | | | | | |
Shares sold | 299,993 | $ 14,917,824 | | 544,068 | $ 32,790,860 |
Reinvested dividends and distributions | 38,960 | 1,850,588 | | 815,570 | 53,109,893 |
Shares repurchased | (399,190) | (19,805,922) | | (1,101,554) | (67,451,988) |
Net Increase/(Decrease) | (60,237) | $ (3,037,510) | | 258,084 | $ 18,448,765 |
Class R Shares: | | | | | |
Shares sold | 1,389 | $ 67,060 | | 9,779 | $ 536,087 |
Reinvested dividends and distributions | 160 | 7,408 | | 8,356 | 532,028 |
Shares repurchased | (6,600) | (322,318) | | (12,520) | (685,277) |
Net Increase/(Decrease) | (5,051) | $ (247,850) | | 5,615 | $ 382,838 |
Class S Shares: | | | | | |
Shares sold | 10,722 | $ 508,861 | | 95,521 | $ 5,406,583 |
Reinvested dividends and distributions | 955 | 43,737 | | 56,135 | 3,531,423 |
Shares repurchased | (89,373) | (4,150,825) | | (158,984) | (9,391,909) |
Net Increase/(Decrease) | (77,696) | $ (3,598,227) | | (7,328) | $ (453,903) |
Class T Shares: | | | | | |
Shares sold | 2,399,843 | $ 118,928,446 | | 4,935,340 | $ 301,385,804 |
Reinvested dividends and distributions | 180,157 | 8,571,880 | | 8,407,226 | 547,814,842 |
Shares repurchased | (4,796,096) | (236,555,555) | | (10,007,466) | (599,131,910) |
Net Increase/(Decrease) | (2,216,096) | $(109,055,229) | | 3,335,100 | $ 250,068,736 |
6. Purchases and Sales of Investment Securities
For the period ended March 31, 2023, the aggregate cost of purchases and proceeds from sales of investment securities (excluding any short-term securities, short-term options contracts, TBAs, and in-kind transactions, as applicable) was as follows:
| | | | |
Purchases of
Securities | Proceeds from Sales
of Securities | Purchases of Long-
Term U.S. Government
Obligations | Proceeds from Sales
of Long-Term U.S.
Government Obligations |
$1,580,789,468 | $2,042,768,230 | $ - | $ - |
Janus Henderson Research Fund
Notes to Financial Statements (unaudited)
7. Recent Accounting Pronouncements
The FASB issued Accounting Standards Update 2022-03: Fair Value Measurement of Equity Securities Subject to Contractual Sale Restrictions (“ASU 2022-03”) in June 2022. The new guidance in the ASU clarifies existing guidance in ASC 820 related to the fair value measurement of an equity security subject to contractual sale restrictions with the intent to reduce diversity in interpretation. Under the guidance, a contractual restriction on the sale of an equity security would not be considered when measuring fair value as such restriction is not treated as part of the equity security’s unit of account. The amendments would be applied prospectively on or after adoption date to equity securities with a contract containing a sale restriction that is executed or modified after such date. The effective date set by the FASB is December 15, 2023, with early adoption permitted. The Adviser is currently evaluating whether to early adopt and does not anticipate it to have a material impact on the Fund.
8. Subsequent Event
Management has evaluated whether any events or transactions occurred subsequent to March 31, 2023 and through the date of issuance of the Fund's financial statements and determined that there were no material events or transactions that would require recognition or disclosure in the Fund’s financial statements.
Janus Henderson Research Fund
Additional Information (unaudited)
Proxy Voting Policies and Voting Record
A description of the policies and procedures that the Fund uses to determine how to vote proxies relating to its portfolio securities is available without charge: (i) upon request, by calling 1-800-525-1093; (ii) on the Fund’s website at janushenderson.com/proxyvoting; and (iii) on the SEC’s website at http://www.sec.gov. Additionally, information regarding the Fund’s proxy voting record for the most recent twelve-month period ended June 30 is also available, free of charge, through janushenderson.com/proxyvoting and from the SEC’s website at http://www.sec.gov.
Full Holdings
The Fund files its complete portfolio holdings (schedule of investments) with the SEC as an exhibit to Form N-PORT within 60 days of the end of the first and third fiscal quarters, and in the annual report and semiannual report to shareholders. The Fund’s Form N-PORT filings and annual and semiannual reports: (i) are available on the SEC’s website at http://www.sec.gov; and (ii) are available without charge, upon request, by calling a Janus Henderson representative at 1-877-335-2687 (toll free) (or 1-800-525-3713 if you hold Class D Shares). Portfolio holdings consisting of at least the names of the holdings are generally available on a monthly basis with a 30-day lag under Full Holdings for the Fund at janushenderson.com/info (or janushenderson.com/reports if you hold Class D Shares).
APPROVAL OF ADVISORY AGREEMENTS DURING THE PERIOD
The Trustees of Janus Aspen Series, each of whom serves as an “independent” Trustee (the “Trustees”), oversee the management of each portfolio of Janus Aspen Series (each, a “VIT Portfolio,” and collectively, the “VIT Portfolios”), as well as each fund of Janus Investment Fund (each, a “Fund,” and collectively, the “Funds” and together with the VIT Portfolios, the “Janus Henderson Funds,” and each, a “Janus Henderson Fund”). As required by law, the Trustees determine annually whether to continue the investment advisory agreement for each Janus Henderson Fund.
In connection with their most recent consideration of those agreements for each Janus Henderson Fund, the Trustees received and reviewed information provided by Janus Henderson Investors US LLC (the “Adviser”) in response to requests of the Trustees and their independent legal counsel. They also received and reviewed information and analysis provided by, and in response to requests of, their independent fee consultant. Throughout their consideration of the agreements, the Trustees were advised by their independent legal counsel. The Trustees met with management to consider the agreements, and also met separately in executive session with their independent legal counsel and their independent fee consultant.
At meetings held on November 9-10, 2022 and December 13-14, 2022, the Trustees evaluated the information provided by the Adviser and the independent fee consultant, as well as other information provided by the Adviser and the independent fee consultant during the year. Following such evaluation, the Trustees determined that the overall arrangements between each Janus Henderson Fund and the Adviser were fair and reasonable in light of the nature, extent, and quality of the services provided by the Adviser and its affiliates, the fees charged for those services, and other matters that the Trustees considered relevant in the exercise of their business judgment, and unanimously approved the continuation of the investment advisory agreement for each Janus Henderson Fund for the period from February 1, 2023 through February 1, 2024, subject to earlier termination as provided for in each agreement.
In considering the continuation of those agreements, the Trustees reviewed and analyzed various factors that they determined were relevant, including the factors described below, none of which by itself was considered dispositive. However, the material factors and conclusions that formed the basis for the Trustees’ determination to approve the continuation of the agreements are discussed separately below. Also included is a summary of the independent fee consultant’s conclusions and opinions that arose during, and were included as part of, the Trustees’ consideration of the agreements. “Management fees,” as used herein, reflect actual annual advisory fees and, for the purpose of peer comparisons any administration fees (excluding out of pocket costs), net of any waivers, paid by a fund as a percentage of average net assets.
Nature, Extent and Quality of Services
The Trustees reviewed the nature, extent, and quality of the services provided by the Adviser to the Janus Henderson Funds, taking into account the investment objective, strategies, and policies of each Janus Henderson Fund, and the knowledge the Trustees gained from their regular meetings with management on at least a quarterly basis and their ongoing review of information related to the Janus Henderson Funds. In addition, the Trustees reviewed the resources and key personnel of the Adviser, particularly noting those employees who provide investment and risk management services to the Janus Henderson Funds. The Trustees also considered other services provided to the Janus Henderson
Janus Henderson Research Fund
Additional Information (unaudited)
Funds by the Adviser, such as managing the execution of portfolio transactions and the selection of broker-dealers for those transactions. The Trustees considered the Adviser’s role as administrator to the Janus Henderson Funds, noting that the Adviser generally does not receive a fee for its services as administrator, but is reimbursed for its out-of-pocket costs. The Trustees considered the role of the Adviser in monitoring adherence to the Janus Henderson Funds’ investment restrictions, providing support services for the Trustees and Trustee committees, and overseeing communications with Janus Henderson Fund shareholders and the activities of other service providers, including monitoring compliance with various policies and procedures of the Janus Henderson Funds and with applicable securities laws and regulations.
In this regard, the independent fee consultant noted that the Adviser provides a number of different services for the Janus Henderson Funds and their shareholders, ranging from investment management services to various other servicing functions, and that, in its view, the Adviser is a capable provider of those services. The independent fee consultant also provided its belief that the Adviser has developed a number of institutional competitive advantages that should enable it to provide superior investment and service performance over the long term.
The Trustees concluded that the nature, extent, and quality of the services provided by the Adviser to each Janus Henderson Fund were appropriate and consistent with the terms of the respective advisory agreements, and that, taking into account steps taken to address those Janus Henderson Funds whose performance lagged that of their peers for certain periods, the Janus Henderson Funds were likely to benefit from the continued provision of those services. They also concluded that the Adviser had sufficient personnel, with the appropriate education and experience, to serve the Janus Henderson Funds effectively and had demonstrated its ability to attract well-qualified personnel.
Performance of the Funds
The Trustees considered the performance results of each Janus Henderson Fund over various time periods. They noted that they considered Janus Henderson Fund performance data throughout the year, including periodic meetings with each Janus Henderson Fund’s portfolio manager(s), and also reviewed information comparing each Janus Henderson Fund’s performance with the performance of comparable fund peer groups identified by Broadridge Financial Solutions, Inc. (“Broadridge”), an independent data provider, and with the Janus Henderson Fund’s benchmark index. In this regard, the independent fee consultant found that the overall Janus Henderson Funds’ performance has been reasonable, noting that: (i) for the 36 months ended May 31, 2022, approximately 38% of the Janus Henderson Funds were in the top two quartiles of their Broadridge peer groups; (ii) for the 36 months ended September 30, 2022, approximately 45% of the Janus Henderson Funds were in the top two quartiles of performance as reported by Morningstar, and (iii) for the 12 months ended September 30, 2022, approximately 55% of the Janus Henderson Funds were in the top two quartiles of performance as reported by Morningstar.
The Trustees considered the performance of each Janus Henderson Fund, noting that performance may vary by share class, and noted the following with respect to the Funds:
Asset Allocation Funds
· For Janus Henderson Global Allocation Fund – Conservative, the Trustees noted that the Fund’s performance was in the third Broadridge quartile for the 36 months ended May 31, 2022 and the bottom Broadridge quartile for the 12 months ended May 31, 2022. The Trustees noted the reasons for the Fund’s underperformance and the steps the Adviser had taken or was taking to improve performance.
· For Janus Henderson Global Allocation Fund – Growth, the Trustees noted that the Fund’s performance was in the bottom Broadridge quartile for the 36 months ended May 31, 2022 and the bottom Broadridge quartile for the 12 months ended May 31, 2022. The Trustees noted the reasons for the Fund’s underperformance and the steps the Adviser had taken or was taking to improve performance.
· For Janus Henderson Global Allocation Fund – Moderate, the Trustees noted that the Fund’s performance was in the bottom Broadridge quartile for the 36 months ended May 31, 2022 and the bottom Broadridge quartile for the 12 months ended May 31, 2022. The Trustees noted the reasons for the Fund’s underperformance and the steps the Adviser had taken or was taking to improve performance.
Fixed-Income Funds
· For Janus Henderson Absolute Return Income Opportunities Fund, the Trustees noted that the Fund’s performance was in the third Broadridge quartile for the 36 months ended May 31, 2022 and the first Broadridge quartile for the 12 months ended May 31, 2022. The Trustees noted the reasons for the Fund’s underperformance,
Janus Henderson Research Fund
Additional Information (unaudited)
the steps the Adviser had taken or was taking to improve performance, and that the performance trend was improving.
· For Janus Developed World Bond Fund, the Trustees noted that the Fund’s performance was in the bottom Broadridge quartile for the 36 months ended May 31, 2022 and the bottom Broadridge quartile for the 12 months ended May 31, 2022. The Trustees noted the reasons for the Fund’s underperformance and the steps the Adviser had taken or was taking to improve performance.
· For Janus Henderson Flexible Bond Fund, the Trustees noted that the Fund’s performance was in the first Broadridge quartile for the 36 months ended May 31, 2022 and the second Broadridge quartile for the 12 months ended May 31, 2022.
· For Janus Henderson Global Bond Fund, the Trustees noted that the Fund’s performance was in the third Broadridge quartile for the 36 months ended May 31, 2022 and the bottom Broadridge quartile for the 12 months ended May 31, 2022. The Trustees noted the reasons for the Fund’s underperformance and the steps the Adviser had taken or was taking to improve performance.
· For Janus Henderson High-Yield Fund, the Trustees noted that the Fund’s performance was in the third Broadridge quartile for the 36 months ended May 31, 2022 and the bottom Broadridge quartile for the 12 months ended May 31, 2022. The Trustees noted the reasons for the Fund’s underperformance and the steps the Adviser had taken or was taking to improve performance.
· For Janus Henderson Multi-Sector Income Fund, the Trustees noted that the Fund’s performance was in the second Broadridge quartile for the 36 months ended May 31, 2022 and the third Broadridge quartile for the 12 months ended May 31, 2022.
· For Janus Henderson Short Duration Flexible Bond Fund, the Trustees noted that the Fund’s performance was in the third Broadridge quartile for the 36 months ended May 31, 2022 and the bottom Broadridge quartile for the 12 months ended May 31, 2022. The Trustees noted the reasons for the Fund’s underperformance and the steps the Adviser had taken or was taking to improve performance.
Global and International Equity Funds
· For Janus Henderson Asia Equity Fund, the Trustees noted that the Fund’s performance was in the third Broadridge quartile for the 36 months ended May 31, 2022 and the third Broadridge quartile for the 12 months ended May 31, 2022. The Trustees noted the reasons for the Fund’s underperformance, while also noting that the Fund has a performance fee structure that results in lower management fees during periods of underperformance, and the steps the Adviser had taken or was taking to improve performance.
· For Janus Henderson Emerging Markets Fund, the Trustees noted that the Fund’s performance was in the third Broadridge quartile for the 36 months ended May 31, 2022 and the third Broadridge quartile for the 12 months ended May 31, 2022. The Trustees noted the reasons for the Fund’s underperformance and the steps the Adviser had taken or was taking to improve performance.
· For Janus Henderson European Focus Fund, the Trustees noted that the Fund’s performance was in the first Broadridge quartile for the 36 months ended May 31, 2022 and the second Broadridge quartile for the 12 months ended May 31, 2022.
· For Janus Henderson Global Equity Income Fund, the Trustees noted that the Fund’s performance was in the third Broadridge quartile for the 36 months ended May 31, 2022 and the first Broadridge quartile for the 12 months ended May 31, 2022. The Trustees noted the reasons for the Fund’s underperformance, the steps the Adviser had taken or was taking to improve performance, and that the performance trend was improving.
· For Janus Henderson Global Life Sciences Fund, the Trustees noted that the Fund’s performance was in the third Broadridge quartile for the 36 months ended May 31, 2022 and the second Broadridge quartile for the 12 months ended May 31, 2022. The Trustees noted the reasons for the Fund’s underperformance, the steps the Adviser had taken or was taking to improve performance, and that the performance trend was improving.
· For Janus Henderson Global Sustainable Equity Fund, the Trustees noted that the Fund’s performance was in the second Broadridge quartile for the 12 months ended May 31, 2022. The Trustees noted that 36 month-end performance was not yet available.
Janus Henderson Research Fund
Additional Information (unaudited)
· For Janus Henderson Global Real Estate Fund, the Trustees noted that the Fund’s performance was in the second Broadridge quartile for the 36 months ended May 31, 2022 and the bottom Broadridge quartile for the 12 months ended May 31, 2022.
· For Janus Henderson Global Research Fund, the Trustees noted that the Fund’s performance was in the second Broadridge quartile for the 36 months ended May 31, 2022 and the first Broadridge quartile for the 12 months ended May 31, 2022.
· For Janus Henderson Global Select Fund, the Trustees noted that the Fund’s performance was in the first Broadridge quartile for the 36 months ended May 31, 2022 and the first Broadridge quartile for the 12 months ended May 31, 2022.
· For Janus Henderson Global Technology and Innovation Fund, the Trustees noted that the Fund’s performance was in the second Broadridge quartile for the 36 months ended May 31, 2022 and the second Broadridge quartile for the 12 months ended May 31, 2022.
· For Janus Henderson International Opportunities Fund, the Trustees noted that the Fund’s performance was in the bottom Broadridge quartile for the 36 months ended May 31, 2022 and the third Broadridge quartile for the 12 months ended May 31, 2022. The Trustees noted the reasons for the Fund’s underperformance and the steps the Adviser had taken or was taking to improve performance.
· For Janus Henderson Overseas Fund, the Trustees noted that the Fund’s performance was in the first Broadridge quartile for the 36 months ended May 31, 2022 and the first Broadridge quartile for the 12 months ended May 31, 2022.
· For Janus Henderson Responsible International Dividend Fund (formerly the Janus Henderson Dividend & Income Builder Fund), the Trustees noted that the Fund’s performance was in the bottom Broadridge quartile for the 36 months ended May 31, 2022 and the bottom Broadridge quartile for the 12 months ended May 31, 2022. The Trustees noted the reasons for the Fund’s underperformance and the steps the Adviser had taken or was taking to improve performance.
Money Market Funds
· For Janus Henderson Government Money Market Fund, the Trustees noted that the Fund’s performance was in the third Broadridge quartile for the 36 months ended May 31, 2022 and the bottom Broadridge quartile for the 12 months ended May 31, 2022. The Trustees noted the reasons for the Fund’s underperformance and the steps the Adviser had taken or was taking to improve performance.
· For Janus Henderson Money Market Fund, the Trustees noted that the Fund’s performance was in the third Broadridge quartile for the 36 months ended May 31, 2022 and the bottom Broadridge quartile for the 12 months ended May 31, 2022. The Trustees noted the reasons for the Fund’s underperformance and the steps the Adviser had taken or was taking to improve performance.
Multi-Asset Funds
· For Janus Henderson Adaptive Global Allocation Fund, the Trustees noted that the Fund’s performance was in bottom Broadridge quartile for the 36 months ended May 31, 2022 and the second Broadridge quartile for the 12 months ended May 31, 2022. The Trustees noted the reasons for the Fund’s underperformance, the steps the Adviser had taken or was taking to improve performance, and that the performance trend was improving.
· For Janus Henderson Balanced Fund, the Trustees noted that the Fund’s performance was in the first Broadridge quartile for the 36 months ended May 31, 2022 and the first Broadridge quartile for the 12 months ended May 31, 2022.
U.S. Equity Funds
· For Janus Henderson Adaptive Risk Managed U.S. Equity Fund, the Trustees noted that the Fund’s performance was in the bottom Broadridge quartile for the 36 months ended May 31, 2022 and the second Broadridge quartile for the 12 months ended May 31, 2022. The Trustees noted the reasons for the Fund’s underperformance, the steps the Adviser had taken or were taking to improve performance, and that the performance trend was improving.
Janus Henderson Research Fund
Additional Information (unaudited)
· For Janus Henderson Contrarian Fund, the Trustees noted that the Fund’s performance was in the first Broadridge quartile for the 36 months ended May 31, 2022 and the bottom Broadridge quartile for the 12 months ended May 31, 2022.
· For Janus Henderson Enterprise Fund, the Trustees noted that the Fund’s performance was in the second Broadridge quartile for the 36 months ended May 31, 2022 and the first Broadridge quartile for the 12 months ended May 31, 2022.
· For Janus Henderson Forty Fund, the Trustees noted that the Fund’s performance was in the third Broadridge quartile for the 36 months ended May 31, 2022 and the bottom Broadridge quartile for the 12 months ended May 31, 2022. The Trustees noted the reasons for the Fund’s underperformance and the steps the Adviser had taken or was taking to improve performance.
· For Janus Henderson Growth and Income Fund, the Trustees noted that the Fund’s performance was in the bottom Broadridge quartile for the 36 months ended May 31, 2022 and the first Broadridge quartile for the 12 months ended May 31, 2022. The Trustees noted the reasons for the Fund’s underperformance, the steps the Adviser had taken or was taking to improve performance, and that the performance trend was improving.
· For Janus Henderson Mid Cap Value Fund, the Trustees noted that the Fund’s performance was in the bottom Broadridge quartile for the 36 months ended May 31, 2022 and the second Broadridge quartile for the 12 months ended May 31, 2022. The Trustees noted the reasons for the Fund’s underperformance, while also noting that the Fund has a performance fee structure that results in lower management fees during periods of underperformance, the steps the Adviser had taken or was taking to improve performance, and that the performance trend was improving.
· For Janus Henderson Research Fund, the Trustees noted that the Fund’s performance was in the third Broadridge quartile for the 36 months ended May 31, 2022 and the third Broadridge quartile for the 12 months ended May 31, 2022. The Trustees noted the reasons for the Fund’s underperformance, while also noting that the Fund has a performance fee structure that results in lower management fees during periods of underperformance and the steps the Adviser had taken or was taking to improve performance.
· For Janus Henderson Small Cap Value Fund, the Trustees noted that the Fund’s performance was in the bottom Broadridge quartile for the 36 months ended May 31, 2022 and the second Broadridge quartile for the 12 months ended May 31, 2022. The Trustees noted the reasons for the Fund’s underperformance, while also noting that the Fund has a performance fee structure that results in lower management fees during periods of underperformance, the steps the Adviser had taken or was taking to improve performance, and that the performance trend was improving.
· For Janus Henderson Small-Mid Cap Value Fund, the Trustees noted that the Fund’s performance was in the bottom Broadridge quartile for the 36 months ended May 31, 2022 and the second Broadridge quartile for the 12 months ended May 31, 2022. The Trustees noted the reasons for the Fund’s underperformance, while also noting that the Fund has a performance fee structure that results in lower management fees during periods of underperformance, the steps the Adviser had taken or was taking to improve performance, and that the performance trend is improving.
· For Janus Henderson Triton Fund, the Trustees noted that the Fund’s performance was in the bottom Broadridge quartile for the 36 months ended May 31, 2022 and the second Broadridge quartile for the 12 months ended May 31, 2022. The Trustees noted the reasons for the Fund’s underperformance, the steps the Adviser had taken or was taking to improve performance, and that the performance trend was improving.
· For Janus Henderson Venture Fund, the Trustees noted that the Fund’s performance was in the bottom Broadridge quartile for the 36 months ended May 31, 2022 and the second Broadridge quartile for the 12 months ended May 31, 2022. The Trustees noted the reasons for the Fund’s underperformance, the steps the Adviser had taken or was taking to improve performance, and that the performance trend was improving.
In consideration of each Janus Henderson Fund’s performance, the Trustees concluded that, taking into account the factors relevant to performance, as well as other considerations, including steps taken to improve performance, as applicable, the Janus Henderson Fund’s performance warranted continuation of such Janus Henderson Fund’s investment advisory agreement.
Janus Henderson Research Fund
Additional Information (unaudited)
Costs of Services Provided
The Trustees examined information regarding the fees and expenses of each Janus Henderson Fund in comparison to similar information for other comparable funds as provided by Broadridge, an independent data provider. They also reviewed an analysis of that information provided by their independent fee consultant. The independent fee consultant provided its belief that the management fees charged by the Adviser to each of the Janus Henderson Funds under the current investment advisory and administration agreements are reasonable in relation to the services provided by the Adviser. The independent fee consultant found: (1) the total expenses and management fees of the Janus Henderson Funds to be reasonable relative to other comparable mutual funds; (2) the total expenses, on average, were 6% under the average total expenses of the respective Broadridge peer group; and (3) the management fees for the Janus Henderson Funds, on average, were 5% under the average management fees for the respective Broadridge peer group. The Trustees also considered the total expenses for each share class of each Janus Henderson Fund compared to the average total expenses for its Broadridge Expense Group and to average total expenses for its Broadridge Expense Universe.
For Janus Henderson Funds with three or more years of performance history, the independent fee consultant also performed a systematic “focus list” analysis of expenses which assessed fund fees in the context of fund performance being delivered. Based on this analysis, the independent fee consultant found that the combination of service quality/performance and expenses on these individual Janus Henderson Funds was reasonable in light of performance trends, performance histories, changes in portfolio management, relative average net asset levels, and the existence of performance fees, breakpoints, and/or expense waivers on such Janus Henderson Funds.
The Trustees considered the methodology used by the Adviser in determining compensation payable to portfolio managers, the competitive environment for investment management talent, and the competitive market for mutual funds in different distribution channels.
The Trustees also reviewed management fees charged by the Adviser to comparable separate account clients and to comparable non-affiliated funds subadvised by the Adviser (for which the Adviser provides only or primarily portfolio management services). Although in most instances subadvisory and separate account fee rates for various investment strategies were lower than management fee rates for Janus Henderson Funds having a similar strategy, the Trustees considered that the Adviser noted that, under the terms of the management agreements with the Janus Henderson Funds, the Adviser performs significant additional services for the Janus Henderson Funds that it does not provide to those other clients, including administration services, oversight of the Janus Henderson Funds’ other service providers, Trustee support, regulatory compliance and numerous other services, and that, in serving the Janus Henderson Funds, the Adviser assumes many legal risks and other costs that it does not assume in servicing its other clients. Moreover, the Trustees noted that the independent fee consultant found that: (1) the management fees the Adviser charges to the Janus Henderson Funds are reasonable in relation to the management fees the Adviser charges to funds subadvised by the Adviser and to the fees the Adviser charges to its institutional separate account clients; (2) these subadvised and institutional separate accounts have different service and infrastructure needs and operate in markets very different from the retail fund market; (3) Janus Henderson mutual fund investors enjoy reasonable fees relative to the fees charged in these other markets; and (4) as part of its 2022 review, 9 of 11 Janus Henderson Funds have lower management fees than similar funds subadvised by the Adviser. The Trustees noted that for the two Janus Henderson Funds that did not, management fees for each were under the average of its 15(c) peer group.
The Trustees considered the fees for each Janus Henderson Fund for its fiscal year ended in 2021 and noted the following with regard to each Janus Henderson Fund’s total expenses, net of applicable fee waivers (the Fund’s “total expenses”) as reflected in the comparative information provided by Broadridge:
Asset Allocation Funds
· For Janus Henderson Global Allocation Fund – Conservative, the Trustees noted that, although the Fund’s total expenses exceeded the peer group average for certain share classes, overall the Fund’s total expenses were reasonable. The Trustees also noted that the Adviser has contractually agreed to limit the Fund’s expenses.
· For Janus Henderson Global Allocation Fund – Growth, the Trustees noted that, although the Fund’s total expenses exceeded the peer group average for certain share classes, overall the Fund’s total expenses were reasonable. The Trustees also noted that the Adviser has contractually agreed to limit the Fund’s expenses, although this limit did not apply because the Fund’s total expenses as shown were below the applicable fee limit.
Janus Henderson Research Fund
Additional Information (unaudited)
· For Janus Henderson Global Allocation Fund – Moderate, the Trustees noted that, although the Fund’s total expenses exceeded the peer group average for one share class, overall the Fund’s total expenses were reasonable. The Trustees also noted that the Adviser has contractually agreed to limit the Fund’s expenses.
Fixed-Income Funds
· For Janus Henderson Absolute Return Income Opportunities Fund, the Trustees noted that, although the Fund’s total expenses exceeded the peer group average for certain share classes, overall the Fund’s total expenses were reasonable. The Trustees also noted that the Adviser has contractually agreed to limit the Fund’s expenses.
· For Janus Henderson Developed World Bond Fund, the Trustees noted that, although the Fund’s total expenses exceeded the peer group average for one share class, overall the Fund’s total expenses were reasonable. The Trustees also noted that the Adviser has contractually agreed to limit the Fund’s expenses.
· For Janus Henderson Flexible Bond Fund, the Trustees noted that, although the Fund’s total expenses exceeded the peer group average for certain share classes, overall the Fund’s total expenses were reasonable. The Trustees also noted that the Adviser has contractually agreed to limit the Fund’s expenses, although this limit did not apply because the Fund’s total expenses as shown were below the applicable fee limit.
· For Janus Henderson Global Bond Fund, the Trustees noted that, although the Fund’s total expenses exceeded the peer group average for certain share classes, overall the Fund’s total expenses were reasonable. The Trustees also noted that the Adviser has contractually agreed to limit the Fund’s expenses.
· For Janus Henderson High-Yield Fund, the Trustees noted that, although the Fund’s total expenses exceeded the peer group average for certain share classes, overall the Fund’s total expenses were reasonable. The Trustees also noted that the Adviser has contractually agreed to limit the Fund’s expenses.
· For Janus Henderson Multi-Sector Income Fund, the Trustees noted that, although the Fund’s total expenses exceeded the peer group average for certain share classes, overall the Fund’s total expenses were reasonable. The Trustees also noted that the Adviser has contractually agreed to limit the Fund’s expenses.
· For Janus Henderson Short Duration Flexible Bond Fund, the Trustees noted that, although the Fund’s total expenses exceeded the peer group average for certain share classes, overall the Fund’s total expenses were reasonable. The Trustees also noted that the Adviser has contractually agreed to limit the Fund’s expenses.
Global and International Equity Funds
· For Janus Henderson Asia Equity Fund, the Trustees noted that, although the Fund’s total expenses exceeded the peer group average for certain share classes, overall the Fund’s total expenses were reasonable. The Trustees also noted that the Adviser has contractually agreed to limit the Fund’s expenses.
· For Janus Henderson Emerging Markets Fund, the Trustees noted that, although the Fund’s total expenses exceeded the peer group average for certain share classes, overall the Fund’s total expenses were reasonable. The Trustees also noted that the Adviser has contractually agreed to limit the Fund’s expenses.
· For Janus Henderson European Focus Fund, the Trustees noted that, although the Fund’s total expenses exceeded the peer group average for one share class, overall the Fund’s expenses were reasonable. The Trustees also noted that the Adviser has contractually agreed to limit the Fund’s expenses.
· For Janus Henderson Global Equity Income Fund, the Trustees noted that, although the Fund’s total expenses exceeded the peer group average for one share class, overall the Fund’s total expenses were reasonable. The Trustees also noted that the Adviser has contractually agreed to limit the Fund’s expenses, although this limit did not apply because the Fund’s total expenses as shown were below the applicable fee limit.
· For Janus Henderson Global Life Sciences Fund, the Trustees noted that the Fund’s total expenses were below the peer group average for all share classes.
· For Janus Henderson Global Real Estate Fund, the Trustees noted that, although the Fund’s total expenses exceeded the peer group average for certain share classes, overall the Fund’s total expenses were reasonable. The Trustees also noted that the Adviser has contractually agreed to limit the Fund’s expenses, although this limit did not apply because the Fund’s total expenses as shown were below the applicable fee limit.
Janus Henderson Research Fund
Additional Information (unaudited)
· For Janus Henderson Global Research Fund, the Trustees noted that, although the Fund’s total expenses exceeded the peer group average for one share class, overall the Fund’s total expenses were reasonable. The Trustees also noted that the Adviser has contractually agreed to limit the Fund’s expenses, although this limit did not apply because the Fund’s total expenses as shown were below the applicable fee limit.
· For Janus Henderson Global Select Fund, the Trustees noted that, although the Fund’s total expenses exceeded the peer group average for certain share classes, overall the Fund’s total expenses were reasonable. The Trustees also noted that the Adviser has contractually agreed to limit the Fund’s expenses.
· For Janus Henderson Global Sustainable Equity Fund, the Trustees noted that, although the Fund’s total expenses exceeded the peer group average for certain share classes, overall the Fund’s expenses were reasonable. The Trustees also noted that the Adviser has contractually agreed to limit the Fund’s expenses.
· For Janus Henderson Global Technology and Innovation Fund, the Trustees noted that the Fund’s total expenses were below the peer group average for all share classes.
· For Janus Henderson International Opportunities Fund, the Trustees noted that, although the Fund’s total expenses exceeded the peer group average for certain share classes, overall the Fund’s expenses were reasonable. The Trustees also noted that the Adviser has contractually agreed to limit the Fund’s expenses.
· For Janus Henderson Overseas Fund, the Trustees noted that although the Fund’s total expenses exceeded the peer group average for certain share classes, overall the Fund’s total expenses were reasonable. The Trustees also noted that the Adviser has contractually agreed to limit the Fund’s expenses, although this limit did not apply because the Fund’s total expenses as shown were below the applicable fee limit.
· For Janus Henderson Responsible International Dividend Fund (formerly the Janus Henderson Dividend & Income Builder Fund), the Trustees noted that, although the Fund’s total expenses exceeded the peer group for one share class, overall the Fund’s total expenses were reasonable. The Trustees also noted that the Adviser has contractually agreed to limit the Fund’s expenses.
Money Market Funds
· For Janus Henderson Government Money Market Fund, the Trustees noted that the Fund’s total expenses were below the peer group average for all share classes.
· For Janus Henderson Money Market Fund, the Trustees noted that the Fund’s total expenses were below the peer group average for all share classes.
Multi-Asset Funds
· For Janus Henderson Adaptive Global Allocation Fund, the Trustees noted that, that the Fund’s total expenses were below the peer group average for all share classes.
· For Janus Henderson Balanced Fund, the Trustees noted that, although the Fund’s total expenses exceeded the peer group average for certain share classes, overall the Fund’s total expenses were reasonable. The Trustees also noted that the Adviser has contractually agreed to limit the Fund’s expenses, although this limit did not apply because the Fund’s total expenses as shown were below the applicable fee limit.
U.S. Equity Funds
· For Janus Henderson Adaptive Risk Managed U.S. Equity Fund, the Trustees noted that, although the Fund’s total expenses exceeded the peer group average for certain share classes, overall the Fund’s total expenses were reasonable. The Trustees also noted that the Adviser has contractually agreed to limit the Fund’s expenses, although this limit did not apply because the Fund’s total expenses as shown were below the applicable fee limit.
· For Janus Henderson Contrarian Fund, the Trustees noted that, although the Fund’s total expenses exceeded the peer group average for all share classes, overall the Fund’s total expenses were reasonable. The Trustees also noted that the Adviser had contractually agreed to limit the Fund’s expenses.
· For Janus Henderson Enterprise Fund, the Trustees noted that, although the Fund’s total expenses exceeded the peer group average for certain share classes, overall the Fund’s total expenses were reasonable. The Trustees also noted that the Adviser has contractually agreed to limit the Fund’s expenses, although this limit did not apply because the Fund’s total expenses as shown were below the applicable fee limit.
Janus Henderson Research Fund
Additional Information (unaudited)
· For Janus Henderson Forty Fund, the Trustees noted that, although the Fund’s total expenses exceeded the peer group average for certain share classes, overall the Fund’s total expenses were reasonable. The Trustees also noted that the Adviser has contractually agreed to limit the Fund’s expenses, although this limit did not apply because the Fund’s total expenses as shown were below the applicable fee limit.
· For Janus Henderson Growth and Income Fund, the Trustees noted that, although the Fund’s total expenses exceeded the peer group average for certain share classes, overall the Fund’s total expenses were reasonable. The Trustees also noted that the Adviser has contractually agreed to limit the Fund’s expenses, although this limit did not apply because the Fund’s total expenses as shown were below the applicable fee limit.
· For Janus Henderson Mid Cap Value Fund, the Trustees noted that the Fund’s total expenses were below the peer group average for all share classes.
· For Janus Henderson Research Fund, the Trustees noted that, although the Fund’s total expenses exceeded the peer group average for certain share classes, overall the Fund’s total expenses were reasonable. The Trustees also noted that the Adviser has contractually agreed to limit the Fund’s expenses.
· For Janus Henderson Small Cap Value Fund, the Trustees noted that, although the Fund’s total expenses exceeded the peer group average for one share class, overall the Fund’s total expenses were reasonable. The Trustees also noted that the Adviser has contractually agreed to limit the Fund’s expenses, although this limit did not apply because the Fund’s total expenses as shown were below the applicable fee limit.
· For Janus Henderson Small-Mid Cap Value Fund, the Trustees noted that the Fund’s total expenses were below the peer group average for all share classes.
· For Janus Henderson Triton Fund, the Trustees noted that, although the Fund’s total expenses exceeded the peer group average for one share class, overall the Fund’s total expenses were reasonable. The Trustees also noted that the Adviser has contractually agreed to limit the Fund’s expenses, although this limit did not apply because the Fund’s total expenses as shown were below the applicable fee limit.
· For Janus Henderson Venture Fund, the Trustees noted that although the Fund’s total expenses exceeded the peer group average for one share class, overall the Fund’s total expenses were reasonable. The Trustees also noted that the Adviser has contractually agreed to limit the Fund’s expenses, although this limit did not apply because the Fund’s total expenses as shown were below the applicable fee limit.
The Trustees reviewed information on the overall profitability to the Adviser and its affiliates from their relationships with the Janus Henderson Funds, and considered profitability data of other publicly traded mutual fund advisers. The Trustees recognized that profitability comparisons among fund managers are difficult because of the variation in the type of comparative information that is publicly available, and the profitability of any fund manager is affected by numerous factors, including the organizational structure of the particular fund manager, differences in complex size, difference in product mix, difference in types of business (mutual fund, institutional and other), differences in the types of funds and other accounts it manages, possible other lines of business, the methodology for allocating expenses and the fund manager’s capital structure and cost of capital.
Additionally, the Trustees considered the estimated profitability to the Adviser from the investment management services it provided to each Janus Henderson Fund. In their review, the Trustees considered whether the Adviser receive adequate incentives and resources to manage the Janus Henderson Funds effectively. In reviewing profitability, the Trustees noted that the estimated profitability for an individual Janus Henderson Fund is necessarily a product of the allocation methodology utilized by the Adviser to allocate its expenses as part of the estimated profitability calculation. In this regard, the Trustees noted that the independent fee consultant found as part of its 2022 review that (1) the expense allocation methodology and rationales utilized by the Adviser were reasonable and (2) no clear correlation exists between expense allocations and operating margins. The Trustees also considered that the estimated profitability for an individual Janus Henderson Fund was influenced by a number of factors, including not only the allocation methodology selected, but also the presence of fee waivers and expense caps, and whether the Janus Henderson Fund’s investment management agreement contained breakpoints or a performance fee component. The Trustees determined, after taking into account these factors, among others, that the Adviser’s estimated profitability with respect to each Janus Henderson Fund was not unreasonable in relation to the services provided, and that the variation in the range of such estimated profitability among the Janus Henderson Funds was not a material factor in the Board’s approval of the reasonableness of any Janus Henderson Fund’s investment management fees.
Janus Henderson Research Fund
Additional Information (unaudited)
The Trustees concluded that the management fees payable by each Janus Henderson Fund to the Adviser were reasonable in relation to the nature, extent, and quality of the services provided, taking into account the fees charged by other advisers for managing comparable mutual funds with similar strategies, the fees the Adviser charges to other clients, and, as applicable, the impact of fund performance on management fees payable by the Janus Henderson Funds. The Trustees also concluded that each Janus Henderson Fund’s total expenses were reasonable, taking into account the size of the Janus Henderson Fund, the quality of services provided by the Adviser, the investment performance of the Janus Henderson Fund, and any expense limitations agreed to or provided by the Adviser.
Economies of Scale
The Trustees considered information about the potential for the Adviser to realize economies of scale as the assets of the Janus Henderson Funds increase. They noted that their independent fee consultant published a report to the Trustees in June 2022 which provided its research and analysis into economies of scale. They also noted that, although many Janus Henderson Funds pay advisory fees at a fixed base rate as a percentage of net assets, without any breakpoints or performance fees, their independent fee consultant concluded that 75% of these Janus Henderson Funds’ have contractual management fees (gross of waivers) below their Broadridge Expense Group averages. The Trustees also noted the following from the independent fee consultant’s report: (1) that 31% of Janus Henderson Funds had management fee breakpoints in place whereby investors pay lower management fees as fund AUM increases; (2) that 29% of Janus Henderson Funds have low flat-rate fees and performance fees where the Adviser is incentivized to invest in resources which drive Janus Henderson Fund performance; and (3) that 39% of Janus Henderson Funds have low flat-rate fees versus peers where investors pay low fixed fees when the Janus Henderson Fund is small/midsized and higher fees when the Janus Henderson Fund grows in assets. The Trustees also noted that the Janus Henderson Funds share directly in economies of scale through the significant investments made by the Adviser and its affiliates related to services provided to the Funds and the lower charges of third-party service providers that are based in part on the combined scale of all of the Janus Henderson Funds.
The Trustees also considered the independent fee consultant’s conclusion that, given the limitations of various analytical approaches to economies of scale and their conflicting results, it is difficult to analytically confirm or deny the existence of economies of scale in the Janus Henderson complex. In this regard, the independent consultant concluded that (1) to the extent there were economies of scale at the Adviser, the Adviser’s general strategy of setting fixed management fees below peers appeared to share any such economies with investors even on smaller Janus Henderson Funds which have not yet achieved those economies and (2) by setting lower fixed fees from the start on these Janus Henderson Funds, the Adviser appeared to be investing to increase the likelihood that these Janus Henderson Funds will grow to a level to achieve any economies of scale that may exist. Further, the independent fee consultant provided its belief that Janus Henderson Fund investors are well-served by the fee levels and performance fee structures in place on the Janus Henderson Funds in light of any economies of scale that may be present at the Adviser.
Based on all of the information reviewed, including the recent and past research and analysis conducted by the Trustees’ independent fee consultant, the Trustees concluded that the current fee structure of each Janus Henderson Fund was reasonable and that the current rates of fees do reflect a sharing between the Adviser and the Janus Henderson Fund of any economies of scale that may be present at the current asset level of the Janus Henderson Fund.
Other Benefits to the Adviser
The Trustees also considered benefits that accrue to the Adviser and its affiliates from their relationships with the Janus Henderson Funds. They recognized that two affiliates of the Adviser separately serve the Janus Henderson Funds as transfer agent and distributor, respectively, and the transfer agent receives compensation directly from the non-money market Janus Henderson Funds for services provided, and that such compensation contributes to the overall profitability of the Adviser and its affiliates that results from their relationship with the Janus Henderson Funds. The Trustees also considered the Adviser’s past and proposed use of commissions paid by the Janus Henderson Funds on portfolio brokerage transactions to obtain proprietary and third-party research products and services benefiting the Janus Henderson Fund and/or other clients of the Adviser and/or the Adviser. The Trustees concluded that the Adviser’s use of these types of client commission arrangements to obtain proprietary and third-party research products and services was consistent with regulatory requirements and guidelines and was likely to benefit each Janus Henderson Fund. The Trustees also concluded that, other than the services provided by the Adviser and its affiliates pursuant to the agreements and the fees to be paid by each Janus Henderson Fund therefor, the Janus Henderson
Janus Henderson Research Fund
Additional Information (unaudited)
Funds and the Adviser may potentially benefit from their relationship with each other in other ways. They concluded that the Adviser and its affiliates share directly in economies of scale through the lower charges of third-party service providers that are based in part on the combined scale of the Janus Henderson Funds and other clients serviced by the Adviser and its affiliates. They also concluded that the Adviser benefits from the receipt of research products and services acquired through commissions paid on portfolio transactions of the Janus Henderson Funds and that the Janus Henderson Funds benefit from the Adviser’s receipt of those products and services as well as research products and services acquired through commissions paid by other clients of the Adviser. They further concluded that the success of any Janus Henderson Fund could attract other business to the Adviser or other Janus Henderson Funds, and that the success of the Adviser could enhance the Adviser’s ability to serve the Janus Henderson Funds.
Janus Henderson Research Fund
Liquidity Risk Management Program (unaudited)
Liquidity Risk Management Program
Rule 22e-4 under the Investment Company Act of 1940, as amended (the “Liquidity Rule”), requires open-end funds (but not money market funds) to adopt and implement a written liquidity risk management program (the “LRMP”) that is reasonably designed to assess and manage liquidity risk, which is the risk that a fund could not meet redemption requests without significant dilution of remaining investors’ interest in the fund. The Fund has implemented a LRMP, which incorporates the following elements: (i) assessment, management, and periodic review of liquidity risk; (ii) classification of portfolio holdings; (iii) the establishment and monitoring of a highly liquid investment minimum, as applicable; (iv) a 15% limitation on a Fund’s illiquid investments; (v) redemptions in-kind; and (vi) board oversight.
The Trustees of the Fund (the “Trustees”) have designated Janus Henderson Investors US LLC, the Fund’s investment adviser (the “Adviser”), as the Program Administrator for the LRMP responsible for administering the LRMP and carrying out the specific responsibilities of the LRMP. A working group comprised of various teams within the Adviser’s business is responsible for administering the LRMP and carrying out the specific responsibilities of different aspects of the LRMP (the “Liquidity Risk Working Group”). In assessing each Fund’s liquidity risk, the Liquidity Risk Working Group periodically considers, as relevant, factors including (i) the liquidity of a Fund’s portfolio investments during normal and reasonably foreseeable stressed conditions; (ii) whether a Fund’s investment strategy is appropriate for an open-end fund; (iii) the extent to which a Fund’s strategy involves a relatively concentrated portfolio or large positions in any issuer; (iv) a Fund’s use of borrowing for investment purposes; and (v) a Fund’s use of derivatives.
The Liquidity Rule requires the Trustees to review at least annually a written report provided by the Program Administrator that addresses the operation of the LRMP and assesses its adequacy and the effectiveness of its implementation, including, if applicable, the operation of the highly liquid investment minimum, and any material changes to the LRMP (the “Program Administrator Report”). At a meeting held on March 15, 2023, the Adviser provided the Program Administrator Report to the Trustees which covered the operation of the LRMP from January 1, 2022 through December 31, 2022 (the “Reporting Period”).
The Program Administrator Report discussed the operation and effectiveness of the LRMP during the Reporting Period. Among other things, the Program Administrator Report indicated that there were no material changes to the LRMP during the Reporting Period, although there were certain methodology adjustments implemented relating to a change in data provider. Additionally, the findings presented in the Program Administrator Report indicated that the LRMP operated adequately during the Reporting Period. These findings included that the Fund was able to meet redemptions during the normal course of business during the Reporting Period. The Program Administrator Report also stated that the Fund did not exceed the 15% limit on illiquid assets during the Reporting Period, that the Fund held primarily highly liquid assets, and was considered to be a primarily highly liquid fund during the Reporting Period. Also included among the Program Administrator Report’s findings was the determination that the Fund’s investment strategy remains appropriate for an open-end fund. In addition, the Adviser expressed its belief in the Program Administrator Report that the LRMP is reasonably designed and adequate to assess and manage the Fund’s liquidity risk, considering the Fund’s particular risks and circumstances, and includes policies and procedures reasonably designed to implement each required component of the Liquidity Rule.
There can be no assurance that the LRMP will achieve its objectives in the future. Please refer to your Fund’s prospectus for more information regarding the risks to which an investment in the Fund may be subject.
Janus Henderson Research Fund
Useful Information About Your Fund Report (unaudited)
Performance Overviews
Performance overview graphs compare the performance of a hypothetical $10,000 investment in the Fund with one or more widely used market indices. When comparing the performance of the Fund with an index, keep in mind that market indices are not available for investment and do not reflect deduction of expenses.
Average annual total returns are quoted for a Fund with more than one year of performance history. Average annual total return is calculated by taking the growth or decline in value of an investment over a period of time, including reinvestment of dividends and distributions, then calculating the annual compounded percentage rate that would have produced the same result had the rate of growth been constant throughout the period. Average annual total return does not reflect the deduction of taxes that a shareholder would pay on Fund distributions or redemptions of Fund shares.
Cumulative total returns are quoted for a Fund with less than one year of performance history. Cumulative total return is the growth or decline in value of an investment over time, independent of the period of time involved. Cumulative total return does not reflect the deduction of taxes that a shareholder would pay on Fund distributions or redemptions of Fund shares.
Pursuant to federal securities rules, expense ratios shown in the performance chart reflect subsidized (if applicable) and unsubsidized ratios. The total annual fund operating expenses ratio is gross of any fee waivers, reflecting the Fund’s unsubsidized expense ratio. The net annual fund operating expenses ratio (if applicable) includes contractual waivers of the Adviser and reflects the Fund’s subsidized expense ratio. Ratios may be higher or lower than those shown in the “Financial Highlights” in this report.
Schedule of Investments
Following the performance overview section is the Fund’s Schedule of Investments. This schedule reports the types of securities held in the Fund on the last day of the reporting period. Securities are usually listed by type (common stock, corporate bonds, U.S. Government obligations, etc.) and by industry classification (banking, communications, insurance, etc.). Holdings are subject to change without notice.
The value of each security is quoted as of the last day of the reporting period. The value of securities denominated in foreign currencies is converted into U.S. dollars.
If the Fund invests in foreign securities, it will also provide a summary of investments by country. This summary reports the Fund exposure to different countries by providing the percentage of securities invested in each country. The country of each security represents the country of risk. A company may be allocated to a country based on other factors such as location of the company’s principal office, the location of the principal trading market for the company’s securities, or the country where a majority of the company’s revenues are derived. The Fund’s Schedule of Investments relies upon the industry group and country classifications published by Bloomberg and/or MSCI Inc.
Tables listing details of individual forward currency contracts, futures, written options, swaptions, and swaps follow the Fund’s Schedule of Investments (if applicable).
Statement of Assets and Liabilities
This statement is often referred to as the “balance sheet.” It lists the assets and liabilities of the Fund on the last day of the reporting period.
The Fund’s assets are calculated by adding the value of the securities owned, the receivable for securities sold but not yet settled, the receivable for dividends declared but not yet received on securities owned, and the receivable for Fund shares sold to investors but not yet settled. The Fund’s liabilities include payables for securities purchased but not yet settled, Fund shares redeemed but not yet paid, and expenses owed but not yet paid. Additionally, there may be other assets and liabilities such as unrealized gain or loss on forward currency contracts.
The section entitled “Net Assets Consist of” breaks down the components of the Fund’s net assets. Because the Fund must distribute substantially all earnings, you will notice that a significant portion of net assets is shareholder capital.
The last section of this statement reports the net asset value (“NAV”) per share on the last day of the reporting period. The NAV is calculated by dividing the Fund’s net assets for each share class (assets minus liabilities) by the number of shares outstanding.
Janus Henderson Research Fund
Useful Information About Your Fund Report (unaudited)
Statement of Operations
This statement details the Fund’s income, expenses, realized gains and losses on securities and currency transactions, and changes in unrealized appreciation or depreciation of Fund holdings.
The first section in this statement, entitled “Investment Income,” reports the dividends earned from securities and interest earned from interest-bearing securities in the Fund.
The next section reports the expenses incurred by the Fund, including the advisory fee paid to the investment adviser, transfer agent fees and expenses, and printing and postage for mailing statements, financial reports and prospectuses. Expense offsets and expense reimbursements, if any, are also shown.
The last section lists the amounts of realized gains or losses from investment and foreign currency transactions, and changes in unrealized appreciation or depreciation of investments and foreign currency-denominated assets and liabilities. The Fund will realize a gain (or loss) when it sells its position in a particular security. A change in unrealized gain (or loss) refers to the change in net appreciation or depreciation of the Fund during the reporting period. “Net Realized and Unrealized Gain/(Loss) on Investments” is affected both by changes in the market value of Fund holdings and by gains (or losses) realized during the reporting period.
Statements of Changes in Net Assets
These statements report the increase or decrease in the Fund’s net assets during the reporting period. Changes in the Fund’s net assets are attributable to investment operations, dividends and distributions to investors, and capital share transactions. This is important to investors because it shows exactly what caused the Fund’s net asset size to change during the period.
The first section summarizes the information from the Statement of Operations regarding changes in net assets due to the Fund’s investment operations. The Fund’s net assets may also change as a result of dividend and capital gains distributions to investors. If investors receive their dividends and/or distributions in cash, money is taken out of the Fund to pay the dividend and/or distribution. If investors reinvest their dividends and/or distributions, the Fund’s net assets will not be affected.
The reinvestment of dividends and distributions is included under “Capital Share Transactions.” “Capital Shares” refers to the money investors contribute to the Fund through purchases or withdrawals via redemptions. The Fund’s net assets will increase and decrease in value as investors purchase and redeem shares from the Fund.
Financial Highlights
This schedule provides a per-share breakdown of the components that affect the Fund’s NAV for current and past reporting periods as well as total return, asset size, ratios, and portfolio turnover rate.
The first line in the table reflects the NAV per share at the beginning of the reporting period. The next line reports the net investment income/(loss) per share. Following is the per share total of net gains/(losses), realized and unrealized. Per share dividends and distributions to investors are then subtracted to arrive at the NAV per share at the end of the period. The next line reflects the total return for the period. The total return may include adjustments in accordance with generally accepted accounting principles required at the period end for financial reporting purposes. As a result, the total return may differ from the total return reflected for individual shareholder transactions. Also included are ratios of expenses and net investment income to average net assets.
The Fund’s expenses may be reduced through expense offsets and expense reimbursements. The ratios shown reflect expenses before and after any such offsets and reimbursements.
The ratio of net investment income/(loss) summarizes the income earned less expenses, divided by the average net assets of the Fund during the reporting period. Do not confuse this ratio with the Fund’s yield. The net investment income ratio is not a true measure of the Fund’s yield because it does not take into account the dividends distributed to the Fund’s investors.
The next figure is the portfolio turnover rate, which measures the buying and selling activity in the Fund. Portfolio turnover is affected by market conditions, changes in the asset size of the Fund, fluctuating volume of shareholder purchase and redemption orders, the nature of the Fund’s investments, and the investment style and/or outlook of the portfolio manager(s) and/or investment personnel. A 100% rate implies that an amount equal to the value of the entire portfolio was replaced once during the fiscal year; a 50% rate means that an amount equal to the value of half the
Janus Henderson Research Fund
Useful Information About Your Fund Report (unaudited)
portfolio is traded in a year; and a 200% rate means that an amount equal to the value of the entire portfolio is traded every six months.
Janus Henderson Research Fund
Notes
NotesPage1
Janus Henderson Research Fund
Notes
NotesPage2
Janus Henderson Research Fund
Notes
NotesPage3
| | | | | | | | |
| | | | | |

| | | | |
This report is submitted for the general information of shareholders of the Fund. It is not an offer or solicitation for the Fund and is not authorized for distribution to prospective investors unless preceded or accompanied by an effective prospectus. |
Janus Henderson is a trademark of Janus Henderson Group plc or one of its subsidiaries. © Janus Henderson Group plc. Janus Henderson Group is the ultimate parent of Janus Henderson Distributors US LLC. Janus Henderson Distributors US LLC |
| | | | 125-24-93053 05-23 |
| | | | |
| | | |
| | | SEMIANNUAL REPORT March 31, 2023 |
| | |
| | Janus Henderson Triton Fund |
| | |
| | Janus Investment Fund |
| |
| | | HIGHLIGHTS · Investment strategy behind your fund · Fund performance, characteristics
and holdings |
Table of Contents
Janus Henderson Triton Fund
| | | | | | |
| | | | | 
Jonathan Coleman co-portfolio manager | 
Scott Stutzman co-portfolio manager |
| | | |
Janus Henderson Triton Fund (unaudited)
Fund At A Glance
March 31, 2023
| | | | | | | | | | |
| | | | | | | | | |
| | | | | | | | | |
| | | | | | | | | |
| 5 Top Contributors - Holdings | 5 Top Detractors - Holdings |
| | Average
Weight | | Relative
Contribution | | | Average
Weight | | Relative
Contribution |
| Axon Enterprise Inc | 1.43% | | 0.61% | | National Vision Holdings Inc | 0.86% | | -0.40% |
| Blackbaud Inc | 1.54% | | 0.54% | | P3 Health Partners Inc | 0.24% | | -0.38% |
| Rentokil Initial PLC (ADR) | 2.28% | | 0.54% | | Catalent Inc | 1.82% | | -0.34% |
| ON Semiconductor Corp | 2.12% | | 0.44% | | Leslie's Inc | 0.81% | | -0.32% |
| OSI Systems Inc | 1.53% | | 0.43% | | Wolfspeed Inc | 0.45% | | -0.31% |
| | | | | | | |
| 5 Top Contributors - Sectors* | | | | | |
| | | Relative | | Fund | Russell 2500 Growth Index |
| | | Contribution | | Average Weight | Average Weight |
| Health Care | | 2.40% | | 22.21% | 18.83% |
| Information Technology | | 2.24% | | 25.48% | 22.02% |
| Industrials | | 1.08% | | 19.22% | 18.69% |
| Energy | | 0.47% | | 2.13% | 5.92% |
| Real Estate | | 0.05% | | 0.78% | 2.59% |
| | | | | | |
| | | | | | |
| 5 Top Detractors - Sectors* | | | | | |
| | | Relative | | Fund | Russell 2500 Growth Index |
| | | Contribution | | Average Weight | Average Weight |
| Consumer Discretionary | | -1.33% | | 7.27% | 12.54% |
| Materials | | -0.54% | | 6.58% | 5.14% |
| Financials | | -0.41% | | 6.74% | 7.20% |
| Consumer Staples | | -0.36% | | 5.02% | 3.90% |
| Communication Services | | -0.23% | | 2.23% | 1.90% |
| | | | | | | |
| Relative contribution reflects how the portolio's holdings impacted return relative to the benchmark. Cash and securities not held in the portfolio are not shown. For equity portfolios, relative contribution compares the performance of a security in the portfolio to the benchmark's total return, factoring in the difference in weight of that security in the benchmark. Returns are calculated using daily returns and previous day ending weights rolled up by ticker, excluding fixed income securities, gross of advisory fees, may exclude certain derivatives and will differ from actual performance.
Performance attribution reflects returns gross of advisory fees and may differ from actual returns as they are based on end of day holdings. Attribution is calculated by geometrically linking daily returns for the portfolio and index. |
* | Based on sector classification according to the Global Industry Classification Standard (“GICS”) codes, which are the exclusive property and a service mark of MSCI Inc. and Standard & Poor’s. |
Janus Henderson Triton Fund (unaudited)
Fund At A Glance
March 31, 2023
| | |
5 Largest Equity Holdings - (% of Net Assets) |
Rentokil Initial PLC (ADR) | |
Commercial Services & Supplies | 2.4% |
Catalent Inc | |
Pharmaceuticals | 2.2% |
Crown Holdings Inc | |
Containers & Packaging | 2.1% |
SS&C Technologies Holdings Inc | |
Professional Services | 2.0% |
ON Semiconductor Corp | |
Semiconductor & Semiconductor Equipment | 1.9% |
| | 10.6% |
| | | | | | |
Asset Allocation - (% of Net Assets) | |
Common Stocks | | 97.3% | |
Investment Companies | | 2.4% | |
Private Placements | | 0.6% | |
Investments Purchased with Cash Collateral from Securities Lending | | 0.2% | |
Warrants | | 0.0% | |
Other | | (0.5)% |
| | | 100.0% |
| | |
Top Country Allocations - Long Positions - (% of Investment Securities) |
As of March 31, 2023 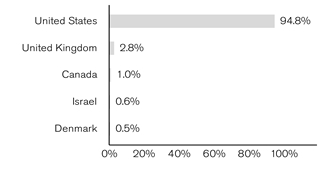
| As of September 30, 2022 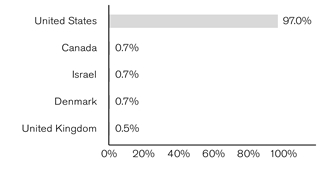
|
Janus Henderson Triton Fund (unaudited)
Performance
| |
See important disclosures on the next page. |
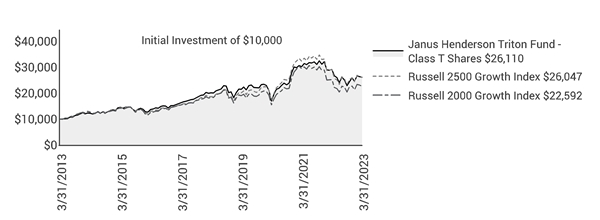
| | | | | | | | | | | |
| | | | | | | | | |
| | | | | | | | | | |
Average Annual Total Return - for the periods ended March 31, 2023 | | | Prospectus Expense Ratios |
| | Fiscal
Year-to-Date | One
Year | Five
Year | Ten
Year | Since
Inception* | | | Total Annual Fund
Operating Expenses‡ |
Class A Shares at NAV | | 14.03% | -10.54% | 5.05% | 9.84% | 10.81% | | | 1.30% |
Class A Shares at MOP | | 7.49% | -15.68% | 3.82% | 9.19% | 10.45% | | | |
Class C Shares at NAV | | 13.80% | -10.90% | 4.49% | 9.19% | 10.09% | | | 1.74% |
Class C Shares at CDSC | | 12.80% | -11.73% | 4.49% | 9.19% | 10.09% | | | |
Class D Shares | | 14.21% | -10.25% | 5.39% | 10.19% | 11.10% | | | 0.79% |
Class I Shares | | 14.22% | -10.24% | 5.42% | 10.23% | 11.16% | | | 0.76% |
Class N Shares | | 14.32% | -10.10% | 5.53% | 10.34% | 11.18% | | | 0.66% |
Class R Shares | | 13.88% | -10.78% | 4.74% | 9.52% | 10.46% | | | 1.42% |
Class S Shares | | 13.98% | -10.56% | 5.00% | 9.79% | 10.71% | | | 1.16% |
Class T Shares | | 14.19% | -10.34% | 5.28% | 10.07% | 11.02% | | | 0.91% |
Russell 2500 Growth Index | | 11.57% | -10.35% | 6.82% | 10.05% | 9.06% | | | |
Russell 2000 Growth Index | | 10.46% | -10.60% | 4.26% | 8.49% | 7.87% | | | |
Morningstar Quartile - Class T Shares | | - | 2nd | 4th | 2nd | 1st | | | |
Morningstar Ranking - based on total returns for Small Growth Funds | | - | 229/613 | 442/576 | 198/533 | 11/439 | | | |
Returns quoted are past performance and do not guarantee future results; current performance may be lower or higher. Investment returns and principal value will vary; there may be a gain or loss when shares are sold. For the most recent month-end performance call 800.668.0434 (or 800.525.3713 if you hold shares directly with Janus Henderson) or visit janushenderson.com/performance (or janushenderson.com/allfunds if you hold shares directly with Janus Henderson).
Maximum Offering Price (MOP) returns include the maximum sales charge of 5.75%. Net Asset Value (NAV) returns exclude this charge, which would have reduced returns.
CDSC returns include a 1% contingent deferred sales charge (CDSC) on Shares redeemed within 12 months of purchase. Net Asset Value (NAV) returns exclude this charge, which would have reduced returns.
Janus Henderson Triton Fund (unaudited)
Performance
Performance may be affected by risks that include those associated with foreign and emerging markets, fixed income securities, high-yield and high-risk securities, undervalued, overlooked and smaller capitalization companies, real estate related securities including Real Estate Investment Trusts (REITs), Environmental, Social and Governance (ESG) factors, non-diversification, portfolio turnover, derivatives, short sales, initial public offerings (IPOs) and potential conflicts of interest. Each product has different risks. Please see the prospectus for more information about risks, holdings and other details.
Returns include reinvestment of all dividends and distributions and do not reflect the deduction of taxes that a shareholder would pay on Fund distributions or redemptions of Fund shares. The returns do not include adjustments in accordance with generally accepted accounting principles required at the period end for financial reporting purposes.
Class A Shares, Class C Shares, Class R Shares, and Class S Shares commenced operations on July 6, 2009. Performance shown for each class for periods prior to July 6, 2009, reflects the performance of the Fund’s Class J Shares, the initial share class (renamed Class T Shares effective February 16, 2010), calculated using the fees and expenses of each respective class, without the effect of any fee and expense limitations or waivers.
Class D Shares commenced operations on February 16, 2010. Performance shown for periods prior to February 16, 2010, reflects the performance of the Fund’s former Class J Shares, calculated using the fees and expenses in effect during the periods shown, net of any applicable fee and expense limitations or waivers.
Class I Shares commenced operations on July 6, 2009. Performance shown for periods prior to July 6, 2009, reflects the performance of the Fund’s former Class J Shares, calculated using the fees and expenses of Class J Shares, net of any applicable fee and expense limitations or waivers.
Class N Shares commenced operations on May 31, 2012. Performance shown for periods prior to May 31, 2012, reflects the performance of the Fund's Class T Shares, calculated using the fees and expenses of Class T Shares, net of any applicable fee and expense limitations or waivers.
If each share class of the Fund had been available during periods prior to its commencement, the performance shown may have been different. The performance shown for periods following the Fund’s commencement of each share class reflects the fees and expenses of each respective share class, net of any applicable fee and expense limitations or waivers. Please refer to the Fund’s prospectuses for further details concerning historical performance.
Ranking is for the share class shown only; other classes may have different performance characteristics. When an expense waiver is in effect, it may have a material effect on the total return, and therefore the ranking for the period.
© 2023 Morningstar, Inc. All Rights Reserved.
There is no assurance that the investment process will consistently lead to successful investing.
See Notes to Schedule of Investments and Other Information for index definitions.
Index performance does not reflect the expenses of managing a portfolio as an index is unmanaged and not available for direct investment.
See “Useful Information About Your Fund Report.”
*The Fund’s inception date – February 25, 2005
‡ As stated in the prospectus. See Financial Highlights for actual expense ratios during the reporting period.
Janus Henderson Triton Fund (unaudited)
Expense Examples
As a shareholder of the Fund, you incur two types of costs: (1) transaction costs, such as sales charges (loads) on purchase payments (applicable to Class A Shares only); and (2) ongoing costs, including management fees; 12b-1 distribution and shareholder servicing fees; transfer agent fees and expenses payable pursuant to the Transfer Agency Agreement; and other Fund expenses. This example is intended to help you understand your ongoing costs (in dollars) of investing in the Fund and to compare these costs with the ongoing costs of investing in other mutual funds. To do so, compare this 5% hypothetical example with the 5% hypothetical examples that appear in the shareholder reports of the other funds. The example is based upon an investment of $1,000 invested at the beginning of the period and held for the six-months indicated, unless noted otherwise in the table and footnotes below.
Actual Expenses
The information in the table under the heading “Actual” provides information about actual account values and actual expenses. You may use the information in these columns, together with the amount you invested, to estimate the expenses that you paid over the period. Simply divide your account value by $1,000 (for example, an $8,600 account value divided by $1,000 = 8.6), then multiply the result by the number in the appropriate column for your share class under the heading entitled “Expenses Paid During Period” to estimate the expenses you paid on your account during the period.
Hypothetical Example for Comparison Purposes
The information in the table under the heading “Hypothetical (5% return before expenses)” provides information about hypothetical account values and hypothetical expenses based upon the Fund’s actual expense ratio and an assumed rate of return of 5% per year before expenses, which is not the Fund’s actual return. The hypothetical account values and expenses may not be used to estimate the actual ending account balance or expenses you paid for the period. You may use this information to compare the ongoing costs of investing in the Fund and other funds. To do so, compare this 5% hypothetical example with the 5% hypothetical examples that appear in the shareholder reports of the other funds. Additionally, for an analysis of the fees associated with an investment in any share class or other similar funds, please visit www.finra.org/fundanalyzer.
Please note that the expenses shown in the table are meant to highlight your ongoing costs only and do not reflect any transaction costs. These fees are fully described in the Fund’s prospectuses. Therefore, the hypothetical examples are useful in comparing ongoing costs only, and will not help you determine the relative total costs of owning different funds. In addition, if these transaction costs were included, your costs would have been higher.
| | | | | | | | | | | |
| | | | | | | | |
| | | Actual | | Hypothetical
(5% return before expenses) | |
| Beginning
Account
Value
(10/1/22) | Ending
Account
Value
(3/31/23) | Expenses
Paid During
Period
(10/1/22 - 3/31/23)† | | Beginning
Account
Value
(10/1/22) | Ending
Account
Value
(3/31/23) | Expenses
Paid During
Period
(10/1/22 - 3/31/23)† | Net Annualized
Expense Ratio
(10/1/22 - 3/31/23) |
Class A Shares | $1,000.00 | $1,140.30 | $6.03 | | $1,000.00 | $1,019.30 | $5.69 | 1.13% |
Class C Shares | $1,000.00 | $1,138.00 | $8.16 | | $1,000.00 | $1,017.30 | $7.70 | 1.53% |
Class D Shares | $1,000.00 | $1,142.10 | $4.33 | | $1,000.00 | $1,020.89 | $4.08 | 0.81% |
Class I Shares | $1,000.00 | $1,142.20 | $4.17 | | $1,000.00 | $1,021.04 | $3.93 | 0.78% |
Class N Shares | $1,000.00 | $1,143.20 | $3.58 | | $1,000.00 | $1,021.59 | $3.38 | 0.67% |
Class R Shares | $1,000.00 | $1,138.80 | $7.52 | | $1,000.00 | $1,017.90 | $7.09 | 1.41% |
Class S Shares | $1,000.00 | $1,139.80 | $6.24 | | $1,000.00 | $1,019.10 | $5.89 | 1.17% |
Class T Shares | $1,000.00 | $1,141.90 | $4.86 | | $1,000.00 | $1,020.39 | $4.58 | 0.91% |
† | Expenses Paid During Period are equal to the Net Annualized Expense Ratio multiplied by the average account value over the period, multiplied by 182/365 (to reflect the one-half year period). Expenses in the examples include the effect of applicable fee waivers and/or expense reimbursements, if any. Had such waivers and/or reimbursements not been in effect, your expenses would have been higher. Please refer to the Notes to Financial Statements or the Fund’s prospectuses for more information regarding waivers and/or reimbursements. |
Janus Henderson Triton Fund
Schedule of Investments (unaudited)
March 31, 2023
| | | | | | | | |
Shares or
Principal Amounts | | | Value | |
Common Stocks– 97.3% | | | |
Aerospace & Defense – 1.6% | | | |
| | Axon Enterprise Inc* | | 501,666 | | | $112,799,600 | |
Auto Components – 1.2% | | | |
| | Fox Factory Holding Corp* | | 347,181 | | | 42,137,358 | |
| | Quantumscape Corp*,# | | 1,293,635 | | | 10,581,934 | |
| | Visteon Corp* | | 195,200 | | | 30,613,216 | |
| | | 83,332,508 | |
Automobiles – 0.5% | | | |
| | Thor Industries Inc | | 469,665 | | | 37,404,121 | |
Banks – 0.2% | | | |
| | Cullen/Frost Bankers Inc | | 141,458 | | | 14,901,186 | |
Biotechnology – 6.3% | | | |
| | Abcam PLC (ADR)* | | 2,325,256 | | | 31,297,946 | |
| | Akero Therapeutics Inc* | | 327,062 | | | 12,513,392 | |
| | Apellis Pharmaceuticals Inc* | | 696,227 | | | 45,923,133 | |
| | Arrowhead Pharmaceuticals Inc* | | 503,310 | | | 12,784,074 | |
| | Ascendis Pharma A/S (ADR)* | | 355,464 | | | 38,112,850 | |
| | Eagle Pharmaceuticals Inc/DE*,£ | | 712,558 | | | 20,215,270 | |
| | IVERIC bio Inc* | | 1,196,042 | | | 29,099,702 | |
| | Legend Biotech Corp (ADR)* | | 320,301 | | | 15,444,914 | |
| | Neurocrine Biosciences Inc* | | 540,872 | | | 54,747,064 | |
| | Prothena Corp PLC* | | 265,780 | | | 12,882,357 | |
| | Sarepta Therapeutics Inc* | | 581,304 | | | 80,121,130 | |
| | Travere Therapeutics Inc* | | 1,539,744 | | | 34,628,843 | |
| | Vaxcyte Inc* | | 1,735,023 | | | 65,028,662 | |
| | | 452,799,337 | |
Building Products – 1.6% | | | |
| | Carlisle Cos Inc | | 273,659 | | | 61,866,090 | |
| | Zurn Water Solutions Corp | | 2,554,863 | | | 54,571,874 | |
| | | 116,437,964 | |
Capital Markets – 2.8% | | | |
| | Cboe Global Markets Inc | | 749,347 | | | 100,592,341 | |
| | LPL Financial Holdings Inc | | 487,076 | | | 98,584,182 | |
| | | 199,176,523 | |
Chemicals – 1.8% | | | |
| | Sensient Technologies Corp | | 1,708,055 | | | 130,768,691 | |
Commercial Services & Supplies – 4.9% | | | |
| | Brady Corp | | 1,610,863 | | | 86,551,669 | |
| | Clean Harbors Inc* | | 260,469 | | | 37,132,461 | |
| | Driven Brands Holdings Inc* | | 1,943,156 | | | 58,897,058 | |
| | Rentokil Initial PLC (ADR) | | 4,679,138 | | | 170,835,328 | |
| | | 353,416,516 | |
Construction Materials – 1.2% | | | |
| | Summit Materials Inc | | 2,961,079 | | | 84,361,141 | |
Containers & Packaging – 3.4% | | | |
| | Crown Holdings Inc | | 1,838,234 | | | 152,040,334 | |
| | Sealed Air Corp | | 2,039,827 | | | 93,648,458 | |
| | | 245,688,792 | |
Diversified Consumer Services – 0.3% | | | |
| | Mister Car Wash Inc* | | 2,471,947 | | | 21,308,183 | |
Diversified Financial Services – 3.8% | | | |
| | Euronet Worldwide Inc* | | 879,206 | | | 98,383,151 | |
| | Walker & Dunlop Inc | | 956,196 | | | 72,833,449 | |
| | WEX Inc* | | 539,247 | | | 99,162,131 | |
| | | 270,378,731 | |
Diversified Telecommunication Services – 0.1% | | | |
| | AST SpaceMobile Inc* | | 1,670,199 | | | 8,484,611 | |
Electric Utilities – 0.6% | | | |
| | NRG Energy Inc | | 1,174,049 | | | 40,258,140 | |
| | |
See Notes to Schedule of Investments and Other Information and Notes to Financial Statements. |
| |
6 | MARCH 31, 2023 |
Janus Henderson Triton Fund
Schedule of Investments (unaudited)
March 31, 2023
| | | | | | | | |
Shares or
Principal Amounts | | | Value | |
Common Stocks– (continued) | | | |
Electrical Equipment – 2.8% | | | |
| | Amprius Technologies Inc*,# | | 943,535 | | | $8,218,190 | |
| | EnerSys | | 845,374 | | | 73,446,093 | |
| | NEXTracker Inc - Class A*,# | | 513,523 | | | 18,620,344 | |
| | Regal Beloit Corp | | 517,096 | | | 72,770,920 | |
| | Stem Inc* | | 1,100,279 | | | 6,238,582 | |
| | Wallbox NV* | | 3,607,555 | | | 17,640,944 | |
| | | 196,935,073 | |
Electronic Equipment, Instruments & Components – 6.5% | | | |
| | Flex Ltd* | | 3,009,231 | | | 69,242,405 | |
| | Itron Inc* | | 460,116 | | | 25,513,432 | |
| | Mirion Technologies Inc*,£ | | 10,101,708 | | | 86,268,586 | |
| | National Instruments Corp | | 959,578 | | | 50,291,483 | |
| | OSI Systems Inc*,£ | | 1,196,316 | | | 122,454,906 | |
| | Teledyne Technologies Inc* | | 250,512 | | | 112,069,048 | |
| | | 465,839,860 | |
Energy Equipment & Services – 0.6% | | | |
| | Helmerich & Payne Inc | | 1,187,895 | | | 42,467,246 | |
Food & Staples Retailing – 1.3% | | | |
| | Casey's General Stores Inc | | 285,239 | | | 61,742,834 | |
| | Grocery Outlet Holding Corp* | | 1,232,726 | | | 34,836,837 | |
| | | 96,579,671 | |
Food Products – 3.7% | | | |
| | Hostess Brands Inc* | | 4,156,842 | | | 103,422,229 | |
| | Premium Brands Holdings Corp# | | 962,497 | | | 71,220,362 | |
| | Simply Good Foods Co* | | 2,239,066 | | | 89,047,655 | |
| | | 263,690,246 | |
Health Care Equipment & Supplies – 8.5% | | | |
| | Glaukos Corp*,# | | 1,040,179 | | | 52,112,968 | |
| | Globus Medical Inc* | | 1,508,074 | | | 85,417,311 | |
| | ICU Medical Inc* | | 503,933 | | | 83,128,788 | |
| | Integra LifeSciences Holdings Corp* | | 983,215 | | | 56,446,373 | |
| | iRhythm Technologies Inc* | | 433,241 | | | 53,734,881 | |
| | Lantheus Holdings Inc* | | 485,891 | | | 40,115,161 | |
| | Neogen Corp* | | 1,741,486 | | | 32,252,321 | |
| | QuidelOrtho Corp* | | 339,522 | | | 30,248,015 | |
| | Shockwave Medical Inc* | | 143,704 | | | 31,159,338 | |
| | STERIS PLC | | 402,789 | | | 77,045,480 | |
| | Tandem Diabetes Care Inc* | | 511,474 | | | 20,770,959 | |
| | Teleflex Inc | | 168,338 | | | 42,641,699 | |
| | | 605,073,294 | |
Health Care Providers & Services – 1.9% | | | |
| | Agiliti Inc* | | 3,707,172 | | | 59,240,609 | |
| | HealthEquity Inc* | | 760,733 | | | 44,662,634 | |
| | NeoGenomics Inc* | | 1,529,753 | | | 26,633,000 | |
| | P3 Health Partners Inc*,£ | | 5,398,408 | | | 5,722,312 | |
| | | 136,258,555 | |
Hotels, Restaurants & Leisure – 1.7% | | | |
| | Churchill Downs Inc | | 216,192 | | | 55,572,154 | |
| | Wendy's Co | | 2,894,078 | | | 63,033,019 | |
| | | 118,605,173 | |
Household Durables – 0.3% | | | |
| | Helen of Troy Ltd* | | 212,962 | | | 20,267,594 | |
Insurance – 0.7% | | | |
| | Axis Capital Holdings Ltd | | 368,952 | | | 20,115,263 | |
| | Selective Insurance Group Inc | | 290,937 | | | 27,735,024 | |
| | | 47,850,287 | |
Interactive Media & Services – 1.6% | | | |
| | Ziff Davis Inc* | | 1,449,131 | | | 113,104,675 | |
| | |
See Notes to Schedule of Investments and Other Information and Notes to Financial Statements. |
| |
Janus Investment Fund | 7 |
Janus Henderson Triton Fund
Schedule of Investments (unaudited)
March 31, 2023
| | | | | | | | |
Shares or
Principal Amounts | | | Value | |
Common Stocks– (continued) | | | |
Life Sciences Tools & Services – 3.0% | | | |
| | Azenta Inc* | | 677,225 | | | $30,217,779 | |
| | Bio-Techne Corp | | 603,632 | | | 44,783,458 | |
| | Bruker Corp | | 913,915 | | | 72,053,059 | |
| | OmniAb Inc*,# | | 4,399,802 | | | 16,191,271 | |
| | OmniAb Inc - 12.5 Earnout*,¢ | | 340,494 | | | 0 | |
| | OmniAb Inc - 15 Earnout*,¢ | | 340,494 | | | 0 | |
| | PerkinElmer Inc | | 361,928 | | | 48,230,525 | |
| | | 211,476,092 | |
Machinery – 4.0% | | | |
| | Desktop Metal Inc - Class A* | | 6,227,980 | | | 14,324,354 | |
| | Donaldson Co Inc | | 1,162,900 | | | 75,983,886 | |
| | Gates Industrial Corp PLC* | | 4,819,863 | | | 66,947,897 | |
| | ITT Inc | | 834,656 | | | 72,030,813 | |
| | Nordson Corp | | 234,491 | | | 52,117,970 | |
| | Xos Inc* | | 1,528,726 | | | 802,581 | |
| | | 282,207,501 | |
Media – 0.4% | | | |
| | Cable One Inc | | 43,181 | | | 30,313,062 | |
Multiline Retail – 0.5% | | | |
| | Etsy Inc* | | 321,306 | | | 35,770,997 | |
Oil, Gas & Consumable Fuels – 1.5% | | | |
| | Magnolia Oil & Gas Corp | | 3,041,158 | | | 66,540,537 | |
| | PDC Energy Inc | | 641,404 | | | 41,165,309 | |
| | | 107,705,846 | |
Pharmaceuticals – 3.2% | | | |
| | Catalent Inc* | | 2,354,464 | | | 154,711,829 | |
| | CymaBay Therapeutics Inc* | | 1,193,958 | | | 10,411,314 | |
| | Ligand Pharmaceuticals Inc*,£ | | 897,906 | | | 66,049,965 | |
| | | 231,173,108 | |
Professional Services – 8.3% | | | |
| | Alight Inc - Class A* | | 12,542,944 | | | 115,520,514 | |
| | Broadridge Financial Solutions Inc | | 630,204 | | | 92,369,000 | |
| | Clarivate Analytics PLC* | | 5,806,571 | | | 54,523,702 | |
| | MAXIMUS Inc | | 1,163,202 | | | 91,543,997 | |
| | SS&C Technologies Holdings Inc | | 2,537,944 | | | 143,317,698 | |
| | TriNet Group Inc* | | 1,152,140 | | | 92,874,005 | |
| | | 590,148,916 | |
Road & Rail – 1.3% | | | |
| | Saia Inc* | | 334,441 | | | 90,994,707 | |
Semiconductor & Semiconductor Equipment – 3.4% | | | |
| | Entegris Inc | | 650,275 | | | 53,329,053 | |
| | MACOM Technology Solutions Holdings Inc* | | 531,470 | | | 37,649,335 | |
| | ON Semiconductor Corp* | | 1,626,236 | | | 133,871,748 | |
| | Wolfspeed Inc* | | 327,809 | | | 21,291,195 | |
| | | 246,141,331 | |
Software – 9.7% | | | |
| | Altair Engineering Inc* | | 863,047 | | | 62,234,319 | |
| | Aspen Technology Inc* | | 203,626 | | | 46,603,883 | |
| | Blackbaud Inc* | | 1,875,343 | | | 129,961,270 | |
| | Ceridian HCM Holding Inc* | | 531,481 | | | 38,915,039 | |
| | Clearwater Analytics Holdings Inc - Class A* | | 1,460,677 | | | 23,312,405 | |
| | Consensus Cloud Solutions Inc* | | 703,228 | | | 23,973,043 | |
| | Dynatrace Inc* | | 1,901,578 | | | 80,436,749 | |
| | Envestnet Inc* | | 959,377 | | | 56,286,649 | |
| | LiveRamp Holdings Inc* | | 2,165,441 | | | 47,488,121 | |
| | NCR Corp* | | 1,657,219 | | | 39,093,796 | |
| | Nice Ltd (ADR)* | | 202,092 | | | 46,256,838 | |
| | Pagerduty Inc* | | 2,716,736 | | | 95,031,425 | |
| | | 689,593,537 | |
| | |
See Notes to Schedule of Investments and Other Information and Notes to Financial Statements. |
| |
8 | MARCH 31, 2023 |
Janus Henderson Triton Fund
Schedule of Investments (unaudited)
March 31, 2023
| | | | | | | | |
Shares or
Principal Amounts | | | Value | |
Common Stocks– (continued) | | | |
Specialized Real Estate Investment Trusts (REITs) – 0.8% | | | |
| | Lamar Advertising Co | | 576,730 | | | $57,609,560 | |
Specialty Retail – 1.3% | | | |
| | Leslie's Inc* | | 4,574,957 | | | 50,370,277 | |
| | Williams-Sonoma Inc | | 323,909 | | | 39,406,769 | |
| | | 89,777,046 | |
Total Common Stocks (cost $4,759,500,934) | | 6,941,099,421 | |
Private Placements– 0.6% | | | |
Professional Services – 0.2% | | | |
| | IntelyCare Inc*,¢,§ | | 1,023,958 | | | 14,889,271 | |
Software – 0.4% | | | |
| | Loadsmart Inc - Series A*,¢,§ | | 377,303 | | | 6,380,646 | |
| | Loadsmart Inc - Series D*,¢,§ | | 1,075,313 | | | 18,184,833 | |
| | | 24,565,479 | |
Total Private Placements (cost $53,756,971) | | 39,454,750 | |
Warrants– 0% | | | |
Electrical Equipment – 0% | | | |
| | Amprius Technologies Inc, expires 9/14/27* | | 1,887,070 | | | 943,535 | |
| | Wallbox NV - Class A, expires 12/31/26* | | 665,780 | | | 519,641 | |
Total Warrants (cost $1,754,802) | | 1,463,176 | |
Investment Companies– 2.4% | | | |
Money Markets – 2.4% | | | |
| | Janus Henderson Cash Liquidity Fund LLC, 4.7988%ºº,£((cost $174,748,292) | | 174,713,349 | | | 174,748,292 | |
Investments Purchased with Cash Collateral from Securities Lending– 0.2% | | | |
Investment Companies – 0.2% | | | |
| | Janus Henderson Cash Collateral Fund LLC, 4.8170%ºº,£ | | 9,551,549 | | | 9,551,549 | |
Time Deposits – 0% | | | |
| | Royal Bank of Canada, 4.8000%, 4/3/23 | | $2,387,887 | | | 2,387,887 | |
Total Investments Purchased with Cash Collateral from Securities Lending (cost $11,939,436) | | 11,939,436 | |
Total Investments (total cost $5,001,700,435) – 100.5% | | 7,168,705,075 | |
Liabilities, net of Cash, Receivables and Other Assets – (0.5)% | | (37,272,331) | |
Net Assets – 100% | | $7,131,432,744 | |
| | | | | | |
Summary of Investments by Country - (Long Positions) (unaudited) |
| |
| | | | | % of | |
| | | | | Investment | |
Country | | Value | | Securities | |
United States | | $6,792,821,166 | | 94.8 | % |
United Kingdom | | 202,133,274 | | 2.8 | |
Canada | | 71,220,362 | | 1.0 | |
Israel | | 46,256,838 | | 0.6 | |
Denmark | | 38,112,850 | | 0.5 | |
Spain | | 18,160,585 | | 0.3 | |
| | | | | | |
| | | | | | |
Total | | $7,168,705,075 | | 100.0 | % |
| | |
See Notes to Schedule of Investments and Other Information and Notes to Financial Statements. |
| |
Janus Investment Fund | 9 |
Janus Henderson Triton Fund
Schedule of Investments (unaudited)
March 31, 2023
Schedules of Affiliated Investments – (% of Net Assets)
| | | | | | | | | | | |
| | Dividend Income(1) | Realized Gain/(Loss)(1) | Change in Unrealized Appreciation/ Depreciation(1) | Value at 3/31/23 |
Common Stocks - 3.0% |
Banks - N/A | |
| | MSD Acquisition Corp š | $ | - | $ | 876,692 | $ | 377,842 | $ | N/A |
Biotechnology - 0.3% | |
| | Eagle Pharmaceuticals Inc/DE* | | - | | (3,809,847) | | 5,077,812 | | 20,215,270 |
Electronic Equipment, Instruments & Components - 1.7% | |
| | Mirion Technologies Inc*,š | | - | | (1,911,121) | | (11,219,005) | | N/A |
| | OSI Systems Inc* | | - | | (37,226) | | 37,961,813 | | 122,454,906 |
Total Electronic Equipment, Instruments & Components | $ | - | $ | (1,948,347) | $ | 26,742,809 | $ | 122,454,906 |
Health Care Providers & Services - 0.1% | |
| | P3 Health Partners Inc* | | - | | (6,881,481) | | (45,764,631) | | 5,722,312 |
Pharmaceuticals - 0.9% | |
| | Ligand Pharmaceuticals Inc* | | - | | - | | 17,231,878 | | 66,049,965 |
Total Common Stocks | $ | - | $ | (11,762,984) | $ | 3,665,709 | $ | 214,442,453 |
Investment Companies - 2.4% |
Money Markets - 2.4% | |
| | Janus Henderson Cash Liquidity Fund LLC, 4.7988%ºº | | 1,483,152 | | 7,822 | | (1,115) | | 174,748,292 |
Investments Purchased with Cash Collateral from Securities Lending - 0.2% |
Investment Companies - 0.2% | |
| | Janus Henderson Cash Collateral Fund LLC, 4.8170%ºº | | 1,068,104∆ | | - | | - | | 9,551,549 |
Total Affiliated Investments - 5.6% | $ | 2,551,256 | $ | (11,755,162) | $ | 3,664,594 | $ | 398,742,294 |
(1) For securities that were affiliated for a portion of the period ended March 31, 2023, this column reflects amounts for the entire period ended March 31, 2023 and not just the period in which the security was affiliated.
| | |
See Notes to Schedule of Investments and Other Information and Notes to Financial Statements. |
| |
10 | MARCH 31, 2023 |
Janus Henderson Triton Fund
Schedule of Investments (unaudited)
March 31, 2023
| | | | | | | | | | | |
| | Value at 9/30/22 | Purchases | Sales Proceeds | Value at 3/31/23 |
Common Stocks - 3.0% |
Banks - N/A | |
| | MSD Acquisition Corpš | | 37,406,328 | | - | | (38,660,862)Ð | | - |
Biotechnology - 0.3% | |
| | Eagle Pharmaceuticals Inc/DE* | | 20,956,661 | | - | | (2,009,355) | | 20,215,270 |
Electronic Equipment, Instruments & Components - 1.7% | |
| | Mirion Technologies Inc*,š | | 10,351,978 | | 94,584,070Ð | | (5,537,336) | | 86,268,586 |
| | OSI Systems Inc* | | 92,280,757 | | - | | (7,750,439) | | 122,454,906 |
Health Care Providers & Services - 0.1% | |
| | P3 Health Partners Inc* | | - | | 59,520,704Ð | | (1,152,279) | | 5,722,312 |
Pharmaceuticals - 0.9% | |
| | Ligand Pharmaceuticals Inc* | | 77,318,686 | | - | | (28,500,598)Ð | | 66,049,965 |
Investment Companies - 2.4% |
Money Markets - 2.4% | |
| | Janus Henderson Cash Liquidity Fund LLC, 4.7988%ºº | | 22,506,660 | | 708,225,675 | | (555,990,750) | | 174,748,292 |
Investments Purchased with Cash Collateral from Securities Lending - 0.2% |
Investment Companies - 0.2% | |
| | Janus Henderson Cash Collateral Fund LLC, 4.8170%ºº | | 54,754,734 | | 182,241,275 | | (227,444,460) | | 9,551,549 |
| | |
See Notes to Schedule of Investments and Other Information and Notes to Financial Statements. |
| |
Janus Investment Fund | 11 |
Janus Henderson Triton Fund
Schedule of Investments (unaudited)
March 31, 2023
| | | | | | | |
Schedule of Forward Foreign Currency Exchange Contracts | | | | | | |
| | | | | | | | | |
Counterparty/ Foreign Currency | Settlement Date | Foreign Currency Amount (Sold)/ Purchased | | USD Currency Amount (Sold)/ Purchased | | Market Value and Unrealized Appreciation/ (Depreciation) | |
Barclays Capital, Inc.: | | | | | | | | |
British Pound | 4/18/23 | 32,000 | $ | (38,185) | $ | 1,295 | | |
Canadian Dollar | 4/18/23 | (14,644,000) | | 10,640,122 | | (199,441) | | |
Euro | 4/18/23 | (7,056,000) | | 7,482,218 | | (175,652) | | |
| | | | | | | | | |
| | | | | | | (373,798) | | |
Citibank, National Association: | | | | | | | | |
British Pound | 4/18/23 | (68,003,000) | | 81,154,780 | | (2,744,126) | | |
Canadian Dollar | 4/18/23 | 726,000 | | (531,166) | | 6,223 | | |
Canadian Dollar | 4/18/23 | (5,993,000) | | 4,349,911 | | (86,138) | | |
Euro | 4/18/23 | (5,181,000) | | 5,492,845 | | (130,090) | | |
| | | | | | | | | |
| | | | | | | (2,954,131) | | |
Goldman Sachs & Co. LLC: | | | | | | | | |
British Pound | 4/18/23 | (4,425,000) | | 5,278,251 | | (181,106) | | |
Canadian Dollar | 4/18/23 | (859,000) | | 623,436 | | (12,401) | | |
Euro | 4/18/23 | 310,000 | | (328,498) | | 7,945 | | |
Euro | 4/18/23 | (200,000) | | 218,398 | | 1,339 | | |
Euro | 4/18/23 | (120,000) | | 127,170 | | (3,066) | | |
| | | | | | | | | |
| | | | | | | (187,289) | | |
HSBC Securities (USA), Inc.: | | | | | | | | |
British Pound | 4/18/23 | 5,300,000 | | (6,404,677) | | 134,214 | | |
British Pound | 4/18/23 | (16,684,000) | | 20,083,330 | | (500,604) | | |
Canadian Dollar | 4/18/23 | 3,800,000 | | (2,755,344) | | 57,435 | | |
Canadian Dollar | 4/18/23 | (27,685,000) | | 20,084,276 | | (408,302) | | |
Euro | 4/18/23 | 2,309,000 | | (2,465,487) | | 40,468 | | |
Euro | 4/18/23 | (4,993,000) | | 5,296,301 | | (122,598) | | |
| | | | | | | | | |
| | | | | | | (799,387) | | |
JPMorgan Chase Bank, National Association: | | | | | | | | |
British Pound | 4/18/23 | 19,274,000 | | (23,147,562) | | 631,794 | | |
Canadian Dollar | 4/18/23 | 1,500,000 | | (1,090,076) | | 20,232 | | |
Canadian Dollar | 4/18/23 | (15,020,000) | | 10,898,370 | | (219,511) | | |
Euro | 4/18/23 | 5,562,000 | | (5,901,472) | | 134,961 | | |
| | | | | | | | | |
| | | | | | | 567,476 | | |
State Street Bank and Trust Company: | | | | | | | | |
British Pound | 4/18/23 | (82,196,000) | | 98,153,400 | | (3,256,162) | | |
Canadian Dollar | 4/18/23 | (11,110,000) | | 8,068,746 | | (154,932) | | |
Euro | 4/18/23 | 878,000 | | (953,545) | | (653) | | |
| | |
See Notes to Schedule of Investments and Other Information and Notes to Financial Statements. |
| |
12 | MARCH 31, 2023 |
Janus Henderson Triton Fund
Schedule of Investments (unaudited)
March 31, 2023
| | | | | | | | | |
Counterparty/ Foreign Currency | Settlement Date | Foreign Currency Amount (Sold)/ Purchased | | USD Currency Amount (Sold)/ Purchased | | Market Value and Unrealized Appreciation/ (Depreciation) | | |
Euro | 4/18/23 | (1,867,000) | $ | 1,979,145 | | (47,108) | | |
| | | | | | | | |
| | | | | | | (3,458,855) | |
Total | | | | | $ | (7,205,984) | |
The following table, grouped by derivative type, provides information about the fair value and location of derivatives within the Statement of Assets and Liabilities as of March 31, 2023.
| | | | | | |
Fair Value of Derivative Instruments (not accounted for as hedging instruments) as of March 31, 2023 |
| | | | | |
| | | | | Currency
Contracts |
Asset Derivatives: | | | |
Forward foreign currency exchange contracts | | | $1,035,906 |
| | | | |
Liability Derivatives: | | | |
Forward foreign currency exchange contracts | | | $8,241,890 |
| | | | |
The following tables provide information about the effect of derivatives and hedging activities on the Fund’s Statement of Operations for the period ended March 31, 2023.
| | | | | |
The effect of Derivative Instruments (not accounted for as hedging instruments) on the Statement of Operations for the period ended March 31, 2023 |
| | | | |
Amount of Realized Gain/(Loss) Recognized on Derivatives |
Derivative | | Currency
Contracts |
Forward foreign currency exchange contracts | | $ (8,075,265) |
| | | | | |
| | | | | |
| | | | | |
Amount of Change in Unrealized Appreciation/Depreciation Recognized on Derivatives |
Derivative | | Currency
Contracts |
Forward foreign currency exchange contracts | | $(11,074,986) |
| | | | | |
Please see the "Net Realized Gain/(Loss) on Investments" and "Change in Unrealized Net Appreciation/Depreciation" sections of the Fund’s Statement of Operations.
| | |
See Notes to Schedule of Investments and Other Information and Notes to Financial Statements. |
| |
Janus Investment Fund | 13 |
Janus Henderson Triton Fund
Schedule of Investments (unaudited)
March 31, 2023
| | |
Average Ending Monthly Value of Derivative Instruments During the Period Ended March 31, 2023 |
| |
| |
Forward foreign currency exchange contracts: | |
Average amounts purchased - in USD | $38,700,948 |
Average amounts sold - in USD | 275,469,163 |
| | |
| |
| |
| |
| | | | | | | | | | |
Offsetting of Financial Assets and Derivative Assets |
| |
| | | Gross Amounts | | | | | | |
| | | of Recognized | | Offsetting Asset | | Collateral | | |
Counterparty | | Assets | | or Liability(a) | | Pledged(b) | | Net Amount |
| | | | | | | | | |
Barclays Capital, Inc. | $ | 1,295 | $ | (1,295) | $ | — | $ | — |
Citibank, National Association | | 6,223 | | (6,223) | | — | | — |
Goldman Sachs & Co. LLC | | 9,284 | | (9,284) | | — | | — |
HSBC Securities (USA), Inc. | | 232,117 | | (232,117) | | — | | — |
JPMorgan Chase Bank, National Association | | 12,885,185 | | (219,511) | | (11,939,437) | | 726,237 |
| | | | | | | | | |
Total | $ | 13,134,104 | $ | (468,430) | $ | (11,939,437) | $ | 726,237 |
Offsetting of Financial Liabilities and Derivative Liabilities |
| |
| | | Gross Amounts | | | | | | |
| | | of Recognized | | Offsetting Asset | | Collateral | | |
Counterparty | | Liabilities | | or Liability(a) | | Pledged(b) | | Net Amount |
| | | | | | | | | |
Barclays Capital, Inc. | $ | 375,093 | $ | (1,295) | $ | — | $ | 373,798 |
Citibank, National Association | | 2,960,354 | | (6,223) | | — | | 2,954,131 |
Goldman Sachs & Co. LLC | | 196,573 | | (9,284) | | — | | 187,289 |
HSBC Securities (USA), Inc. | | 1,031,504 | | (232,117) | | — | | 799,387 |
JPMorgan Chase Bank, National Association | | 219,511 | | (219,511) | | — | | — |
State Street Bank and Trust Company | | 3,458,855 | | — | | — | | 3,458,855 |
| | | | | | | | | |
Total | $ | 8,241,890 | $ | (468,430) | $ | — | $ | 7,773,460 |
(a) | Represents the amount of assets or liabilities that could be offset with the same counterparty under master netting or similar agreements that management elects not to offset on the Statement of Assets and Liabilities. |
(b) | Collateral pledged is limited to the net outstanding amount due to/from an individual counterparty. The actual collateral amounts pledged may exceed these amounts and may fluctuate in value. |
| | |
See Notes to Schedule of Investments and Other Information and Notes to Financial Statements. |
| |
14 | MARCH 31, 2023 |
Janus Henderson Triton Fund
Notes to Schedule of Investments and Other Information (unaudited)
| | |
Russell 2000® Growth Index | Russell 2000® Growth Index reflects the performance of U.S. small-cap equities with higher price-to-book ratios and higher forecasted growth values. |
Russell 2500TM Growth Index | Russell 2500TM Growth Index reflects the performance of U.S. small to mid-cap equities with higher price-to-book ratios and higher forecasted growth values. |
| | |
ADR | American Depositary Receipt |
LLC | Limited Liability Company |
PLC | Public Limited Company |
| | |
* | Non-income producing security. |
| | |
ºº | Rate shown is the 7-day yield as of March 31, 2023. |
| | |
# | Loaned security; a portion of the security is on loan at March 31, 2023. |
| | |
¢ | Security is valued using significant unobservable inputs. The total value of Level 3 securities as of the period ended March 31, 2023 is $39,454,750, which represents 0.6% of net assets. |
| | |
£ | The Fund may invest in certain securities that are considered affiliated companies. As defined by the Investment Company Act of 1940, as amended, an affiliated company is one in which the Fund owns 5% or more of the outstanding voting securities, or a company which is under common ownership or control. |
| | |
š | Company was no longer an affiliate as of March 31, 2023. |
| | |
∆ | Net of income paid to the securities lending agent and rebates paid to the borrowing counterparties. |
| | |
Ð | All or a portion is the result of a corporate action. |
| | | | | | | | | | | |
§ | Schedule of Restricted Securities (as of March 31, 2023) |
| | | | | | | | Value as a | |
| | Acquisition | | | | | | % of Net | |
| | Date | | Cost | | Value | | Assets | |
IntelyCare Inc | 3/29/22 | $ | 25,081,954 | $ | 14,889,271 | | 0.2 | % |
Loadsmart Inc - Series A | 1/4/22 | | 7,168,757 | | 6,380,646 | | 0.1 | |
Loadsmart Inc - Series D | 1/4/22 | | 21,506,260 | | 18,184,833 | | 0.3 | |
Total | | $ | 53,756,971 | $ | 39,454,750 | | 0.6 | % |
| | | | | | | | | |
The Fund has registration rights for certain restricted securities held as of March 31, 2023. The issuer incurs all registration costs. | |
Janus Henderson Triton Fund
Notes to Schedule of Investments and Other Information (unaudited)
| | | | | | | | | | | | | | |
The following is a summary of the inputs that were used to value the Fund’s investments in securities and other financial instruments as of March 31, 2023. See Notes to Financial Statements for more information. |
| |
Valuation Inputs Summary |
| | | | | | | |
| | | | | Level 2 - | | Level 3 - |
| | | Level 1 - | | Other Significant | | Significant |
| | | Quoted Prices | | Observable Inputs | | Unobservable Inputs |
| | | | | | | |
Assets | | | | | | |
Investments In Securities: | | | | | | |
Common Stocks | | | | | | |
Life Sciences Tools & Services | $ | 211,476,092 | $ | - | $ | 0 |
All Other | | 6,729,623,329 | | - | | - |
Private Placements | | - | | - | | 39,454,750 |
Warrants | | 1,463,176 | | - | | - |
Investment Companies | | - | | 174,748,292 | | - |
Investments Purchased with Cash Collateral from Securities Lending | | - | | 11,939,436 | | - |
Total Investments in Securities | $ | 6,942,562,597 | $ | 186,687,728 | $ | 39,454,750 |
Other Financial Instruments(a): | | | | | | |
Forward Foreign Currency Exchange Contracts | | - | | 1,035,906 | | - |
Total Assets | $ | 6,942,562,597 | $ | 187,723,634 | $ | 39,454,750 |
Liabilities | | | | | | |
Other Financial Instruments(a): | | | | | | |
Forward Foreign Currency Exchange Contracts | $ | - | $ | 8,241,890 | $ | - |
| | | | | | | |
(a) | Other financial instruments may include forward foreign currency exchange contracts, futures, written options, written swaptions, and swap contracts. Forward foreign currency exchange contracts, futures contracts, and swap contracts are reported at their unrealized appreciation/(depreciation) at measurement date, which represents the change in the contract's value from trade date. Written options and written swaptions are reported at their market value at measurement date. |
Janus Henderson Triton Fund
Statement of Assets and Liabilities (unaudited)
March 31, 2023
| |
See footnotes at the end of the Statement. |
| | | | | | | |
| | | | | | |
Assets: | | | | |
| Unaffiliated investments, at value (cost $4,474,695,158)(1) | | $ | 6,769,962,781 | |
| Affiliated investments, at value (cost $527,005,277) | | | 398,742,294 | |
| Forward foreign currency exchange contracts | | | 1,035,906 | |
| Trustees' deferred compensation | | | 176,605 | |
| Receivables: | | | | |
| | Fund shares sold | | | 4,190,558 | |
| | Dividends | | | 1,506,668 | |
| | Dividends from affiliates | | | 440,733 | |
| | Foreign tax reclaims | | | 201,263 | |
| | Investments sold | | | 46,787 | |
| Other assets | | | 868,777 | |
Total Assets | | | 7,177,172,372 | |
Liabilities: | | | | |
| Due to custodian | | | 963 | |
| Foreign cash due to custodian | | | 509,787 | |
| Collateral for securities loaned (Note 3) | | | 11,939,436 | |
| Forward foreign currency exchange contracts | | | 8,241,890 | |
| Payables: | | | — | |
| | Fund shares repurchased | | | 11,344,347 | |
| | Investments purchased | | | 7,949,538 | |
| | Advisory fees | | | 4,062,326 | |
| | Transfer agent fees and expenses | | | 814,216 | |
| | 12b-1 Distribution and shareholder servicing fees | | | 226,777 | |
| | Trustees' deferred compensation fees | | | 176,605 | |
| | Trustees' fees and expenses | | | 48,457 | |
| | Professional fees | | | 41,380 | |
| | Affiliated fund administration fees payable | | | 15,868 | |
| | Custodian fees | | | 1,595 | |
| | Accrued expenses and other payables | | | 366,443 | |
Total Liabilities | | | 45,739,628 | |
Net Assets | | $ | 7,131,432,744 | |
| | |
See Notes to Financial Statements. |
| |
Janus Investment Fund | 17 |
Janus Henderson Triton Fund
Statement of Assets and Liabilities (unaudited)
March 31, 2023
| | | | | | | |
| | | | | | |
| | | | | | | |
Net Assets Consist of: | | | | |
| Capital (par value and paid-in surplus) | | $ | 4,659,149,145 | |
| Total distributable earnings (loss) | | | 2,472,283,599 | |
Total Net Assets | | $ | 7,131,432,744 | |
Net Assets - Class A Shares | | $ | 296,998,539 | |
| Shares Outstanding, $0.01 Par Value (unlimited shares authorized) | | | 12,073,578 | |
Net Asset Value Per Share(2) | | $ | 24.60 | |
Maximum Offering Price Per Share(3) | | $ | 26.10 | |
Net Assets - Class C Shares | | $ | 16,227,261 | |
| Shares Outstanding, $0.01 Par Value (unlimited shares authorized) | | | 766,226 | |
Net Asset Value Per Share(2) | | $ | 21.18 | |
Net Assets - Class D Shares | | $ | 951,484,324 | |
| Shares Outstanding, $0.01 Par Value (unlimited shares authorized) | | | 36,679,055 | |
Net Asset Value Per Share | | $ | 25.94 | |
Net Assets - Class I Shares | | $ | 1,079,359,267 | |
| Shares Outstanding, $0.01 Par Value (unlimited shares authorized) | | | 41,126,150 | |
Net Asset Value Per Share | | $ | 26.25 | |
Net Assets - Class N Shares | | $ | 2,696,071,708 | |
| Shares Outstanding, $0.01 Par Value (unlimited shares authorized) | | | 101,559,058 | |
Net Asset Value Per Share | | $ | 26.55 | |
Net Assets - Class R Shares | | $ | 202,797,641 | |
| Shares Outstanding, $0.01 Par Value (unlimited shares authorized) | | | 8,771,645 | |
Net Asset Value Per Share | | $ | 23.12 | |
Net Assets - Class S Shares | | $ | 249,990,480 | |
| Shares Outstanding, $0.01 Par Value (unlimited shares authorized) | | | 10,329,693 | |
Net Asset Value Per Share | | $ | 24.20 | |
Net Assets - Class T Shares | | $ | 1,638,503,524 | |
| Shares Outstanding, $0.01 Par Value (unlimited shares authorized) | | | 64,287,214 | |
Net Asset Value Per Share | | $ | 25.49 | |
| |
(1) Includes $12,098,198 of securities on loan. See Note 3 in Notes to Financial Statements. (2) Redemption price per share may be reduced for any applicable contingent deferred sales charge. (3) Maximum offering price is computed at 100/94.25 of net asset value. |
| | |
See Notes to Financial Statements. |
| |
18 | MARCH 31, 2023 |
Janus Henderson Triton Fund
Statement of Operations (unaudited)
For the period ended March 31, 2023
| | | | | | |
| | | | | |
Investment Income: | | | |
| Dividends | $ | 23,165,971 | |
| Dividends from affiliates | | 1,483,152 | |
| Affiliated securities lending income, net | | 1,068,104 | |
| Unaffiliated securities lending income, net | | 142,564 | |
| Other income | | 114 | |
| Foreign tax withheld | | (156,220) | |
Total Investment Income | | 25,703,685 | |
Expenses: | | | |
| Advisory fees | | 23,100,995 | |
| 12b-1 Distribution and shareholder servicing fees: | | | |
| | Class A Shares | | 368,475 | |
| | Class C Shares | | 71,388 | |
| | Class R Shares | | 501,472 | |
| | Class S Shares | | 312,886 | |
| Transfer agent administrative fees and expenses: | | | |
| | Class D Shares | | 552,045 | |
| | Class R Shares | | 252,833 | |
| | Class S Shares | | 313,798 | |
| | Class T Shares | | 2,088,517 | |
| Transfer agent networking and omnibus fees: | | | |
| | Class A Shares | | 657,907 | |
| | Class C Shares | | 7,907 | |
| | Class I Shares | | 628,588 | |
| Other transfer agent fees and expenses: | | | |
| | Class A Shares | | 10,859 | |
| | Class C Shares | | 464 | |
| | Class D Shares | | 53,149 | |
| | Class I Shares | | 55,095 | |
| | Class N Shares | | 63,119 | |
| | Class R Shares | | 2,723 | |
| | Class S Shares | | 1,854 | |
| | Class T Shares | | 8,566 | |
| Shareholder reports expense | | 178,699 | |
| Custodian fees | | 149,720 | |
| Registration fees | | 109,530 | |
| Trustees’ fees and expenses | | 106,941 | |
| Affiliated fund administration fees | | 90,238 | |
| Professional fees | | 62,186 | |
| Other expenses | | 243,690 | |
Total Expenses | | 29,993,644 | |
Less: Excess Expense Reimbursement and Waivers | | (405,204) | |
Net Expenses | | 29,588,440 | |
Net Investment Income/(Loss) | | (3,884,755) | |
| | | | | |
| | |
See Notes to Financial Statements. |
| |
Janus Investment Fund | 19 |
Janus Henderson Triton Fund
Statement of Operations (unaudited)
For the period ended March 31, 2023
| | | | | | |
| | | | | |
Net Realized Gain/(Loss) on Investments: | | | |
| Investments and foreign currency transactions | $ | 432,686,627 | |
| Investments in affiliates | | (11,755,162) | |
| Forward foreign currency exchange contracts | | (8,075,265) | |
Total Net Realized Gain/(Loss) on Investments | | 412,856,200 | |
Change in Unrealized Net Appreciation/Depreciation: | | | |
| Investments, foreign currency translations and Trustees’ deferred compensation | | 547,149,781 | |
| Investments in affiliates | | 3,664,594 | |
| Forward foreign currency exchange contracts | | (11,074,986) | |
Total Change in Unrealized Net Appreciation/Depreciation | | 539,739,389 | |
Net Increase/(Decrease) in Net Assets Resulting from Operations | $ | 948,710,834 | |
| | | | | |
| | |
See Notes to Financial Statements. |
| |
20 | MARCH 31, 2023 |
Janus Henderson Triton Fund
Statements of Changes in Net Assets
| | | | | | | | | |
| | | | | | | | |
| | | Period ended
March 31, 2023 (unaudited) | | Year ended
September 30, 2022 | |
| | | | | | | | | |
Operations: | | | | | | |
| Net investment income/(loss) | $ | (3,884,755) | | $ | (31,991,552) | |
| Net realized gain/(loss) on investments | | 412,856,200 | | | 470,370,140 | |
| Change in unrealized net appreciation/depreciation | | 539,739,389 | | | (3,047,442,620) | |
Net Increase/(Decrease) in Net Assets Resulting from Operations | | 948,710,834 | | | (2,609,064,032) | |
Dividends and Distributions to Shareholders: | | | | | | |
| | Class A Shares | | (17,964,474) | | | (79,886,294) | |
| | Class C Shares | | (1,339,127) | | | (8,666,725) | |
| | Class D Shares | | (53,671,559) | | | (220,219,254) | |
| | Class I Shares | | (68,298,977) | | | (331,363,921) | |
| | Class N Shares | | (149,713,854) | | | (711,413,843) | |
| | Class R Shares | | (12,943,552) | | | (53,978,801) | |
| | Class S Shares | | (15,468,292) | | | (72,364,312) | |
| | Class T Shares | | (98,199,980) | | | (450,188,562) | |
Net Decrease from Dividends and Distributions to Shareholders | | (417,599,815) | | | (1,928,081,712) | |
Capital Share Transactions: | | | | | | |
| | Class A Shares | | (979,412) | | | (3,460,663) | |
| | Class C Shares | | (3,828,534) | | | (13,329,427) | |
| | Class D Shares | | 19,236,151 | | | 113,336,445 | |
| | Class I Shares | | (166,466,626) | | | (150,968,605) | |
| | Class N Shares | | 10,243,937 | | | (248,827,543) | |
| | Class R Shares | | 1,048,449 | | | 21,508,574 | |
| | Class S Shares | | (2,009,968) | | | (52,512,981) | |
| | Class T Shares | | (75,337,950) | | | (28,513,973) | |
Net Increase/(Decrease) from Capital Share Transactions | | (218,093,953) | | | (362,768,173) | |
Net Increase/(Decrease) in Net Assets | | 313,017,066 | | | (4,899,913,917) | |
Net Assets: | | | | | | |
| Beginning of period | | 6,818,415,678 | | | 11,718,329,595 | |
| End of period | $ | 7,131,432,744 | | $ | 6,818,415,678 | |
| | | | | | | | |
| | |
See Notes to Financial Statements. |
| |
Janus Investment Fund | 21 |
Janus Henderson Triton Fund
Financial Highlights
| | | | | | | | | | | | | | | | | | | | | | |
Class A Shares | | | | | | | | | | | | | | | | | | |
For a share outstanding during the period ended March 31, 2023 (unaudited) and the year ended September 30 | 2023 | | | 2022 | | | 2021 | | | 2020 | | | 2019 | | | 2018 | |
| Net Asset Value, Beginning of Period | | $23.01 | | | $38.38 | | | $30.01 | | | $29.95 | | | $33.12 | | | $28.03 | |
| Income/(Loss) from Investment Operations: | | | | | | | | | | | | | | | | | | |
| | Net investment income/(loss)(1) | | (0.05) | | | (0.19) | | | (0.26) | | | (0.16) | | | (0.08) | | | (0.07) | |
| | Net realized and unrealized gain/(loss) | | 3.16 | | | (8.25) | | | 10.22 | | | 1.55 | | | (1.19) | | | 6.62 | |
| Total from Investment Operations | | 3.11 | | | (8.44) | | | 9.96 | | | 1.39 | | | (1.27) | | | 6.55 | |
| Less Dividends and Distributions: | | | | | | | | | | | | | | | | | | |
| | Dividends (from net investment income) | | — | | | — | | | — | | | — | | | — | | | — | |
| | Distributions (from capital gains) | | (1.52) | | | (6.93) | | | (1.59) | | | (1.33) | | | (1.90) | | | (1.46) | |
| Total Dividends and Distributions | | (1.52) | | | (6.93) | | | (1.59) | | | (1.33) | | | (1.90) | | | (1.46) | |
| Net Asset Value, End of Period | | $24.60 | | | $23.01 | | | $38.38 | | | $30.01 | | | $29.95 | | | $33.12 | |
| Total Return* | | 14.03% | | | (26.63)% | | | 33.41% | | | 4.64% | | | (2.69)% | | | 24.26% | |
| Net Assets, End of Period (in thousands) | | $296,999 | | | $277,727 | | | $467,269 | | | $416,036 | | | $491,045 | | | $586,644 | |
| Average Net Assets for the Period (in thousands) | | $296,557 | | | $376,354 | | | $494,458 | | | $430,974 | | | $501,143 | | | $544,457 | |
| Ratios to Average Net Assets**: | | | | | | | | | | | | | | | | | | |
| | Ratio of Gross Expenses | | 1.37% | | | 1.30% | | | 1.29% | | | 1.35% | | | 1.33% | | | 1.30% | |
| | Ratio of Net Expenses (After Waivers and Expense Offsets) | | 1.13% | | | 1.12% | | | 1.10% | | | 1.12% | | | 1.12% | | | 1.12% | |
| | Ratio of Net Investment Income/(Loss) | | (0.41)% | | | (0.65)% | | | (0.69)% | | | (0.57)% | | | (0.28)% | | | (0.25)% | |
| Portfolio Turnover Rate | | 9% | | | 8% | | | 24% | | | 32% | | | 26% | | | 21% | |
| | | | | | | | | | | | | | | | | | | | | | |
| |
* Total return includes adjustments in accordance with generally accepted accounting principles required at the year or period end and are not annualized for periods of less than one full year. ** Annualized for periods of less than one full year. (1) Per share amounts are calculated based on average shares outstanding during the year or period. |
| | |
See Notes to Financial Statements. |
| |
22 | MARCH 31, 2023 |
Janus Henderson Triton Fund
Financial Highlights
| | | | | | | | | | | | | | | | | | | | | | |
Class C Shares | | | | | | | | | | | | | | | | | | |
For a share outstanding during the period ended March 31, 2023 (unaudited) and the year ended September 30 | 2023 | | | 2022 | | | 2021 | | | 2020 | | | 2019 | | | 2018 | |
| Net Asset Value, Beginning of Period | | $20.05 | | | $34.49 | | | $27.23 | | | $27.45 | | | $30.72 | | | $26.25 | |
| Income/(Loss) from Investment Operations: | | | | | | | | | | | | | | | | | | |
| | Net investment income/(loss)(1) | | (0.09) | | | (0.31) | | | (0.42) | | | (0.30) | | | (0.23) | | | (0.25) | |
| | Net realized and unrealized gain/(loss) | | 2.74 | | | (7.20) | | | 9.27 | | | 1.41 | | | (1.14) | | | 6.18 | |
| Total from Investment Operations | | 2.65 | | | (7.51) | | | 8.85 | | | 1.11 | | | (1.37) | | | 5.93 | |
| Less Dividends and Distributions: | | | | | | | | | | | | | | | | | | |
| | Dividends (from net investment income) | | — | | | — | | | — | | | — | | | — | | | — | |
| | Distributions (from capital gains) | | (1.52) | | | (6.93) | | | (1.59) | | | (1.33) | | | (1.90) | | | (1.46) | |
| Total Dividends and Distributions | | (1.52) | | | (6.93) | | | (1.59) | | | (1.33) | | | (1.90) | | | (1.46) | |
| Net Asset Value, End of Period | | $21.18 | | | $20.05 | | | $34.49 | | | $27.23 | | | $27.45 | | | $30.72 | |
| Total Return* | | 13.80% | | | (26.99)% | | | 32.72% | | | 4.02% | | | (3.26)% | | | 23.51% | |
| Net Assets, End of Period (in thousands) | | $16,227 | | | $18,940 | | | $49,738 | | | $97,105 | | | $150,431 | | | $206,617 | |
| Average Net Assets for the Period (in thousands) | | $18,775 | | | $33,240 | | | $75,187 | | | $124,872 | | | $168,909 | | | $219,336 | |
| Ratios to Average Net Assets**: | | | | | | | | | | | | | | | | | | |
| | Ratio of Gross Expenses | | 1.53% | | | 1.60% | | | 1.65% | | | 1.70% | | | 1.68% | | | 1.74% | |
| | Ratio of Net Expenses (After Waivers and Expense Offsets) | | 1.53% | | | 1.60% | | | 1.65% | | | 1.70% | | | 1.68% | | | 1.74% | |
| | Ratio of Net Investment Income/(Loss) | | (0.82)% | | | (1.15)% | | | (1.25)% | | | (1.14)% | | | (0.84)% | | | (0.88)% | |
| Portfolio Turnover Rate | | 9% | | | 8% | | | 24% | | | 32% | | | 26% | | | 21% | |
| | | | | | | | | | | | | | | | | | | | | | |
| |
* Total return includes adjustments in accordance with generally accepted accounting principles required at the year or period end and are not annualized for periods of less than one full year. ** Annualized for periods of less than one full year. (1) Per share amounts are calculated based on average shares outstanding during the year or period. |
| | |
See Notes to Financial Statements. |
| |
Janus Investment Fund | 23 |
Janus Henderson Triton Fund
Financial Highlights
| | | | | | | | | | | | | | | | | | | | | | |
Class D Shares | | | | | | | | | | | | | | | | | | |
For a share outstanding during the period ended March 31, 2023 (unaudited) and the year ended September 30 | 2023 | | | 2022 | | | 2021 | | | 2020 | | | 2019 | | | 2018 | |
| Net Asset Value, Beginning of Period | | $24.15 | | | $39.82 | | | $30.99 | | | $30.79 | | | $33.89 | | | $28.56 | |
| Income/(Loss) from Investment Operations: | | | | | | | | | | | | | | | | | | |
| | Net investment income/(loss)(1) | | (0.01) | | | (0.10) | | | (0.14) | | | (0.07) | | | 0.01 | | | 0.02 | |
| | Net realized and unrealized gain/(loss) | | 3.32 | | | (8.64) | | | 10.56 | | | 1.60 | | | (1.21) | | | 6.77 | |
| Total from Investment Operations | | 3.31 | | | (8.74) | | | 10.42 | | | 1.53 | | | (1.20) | | | 6.79 | |
| Less Dividends and Distributions: | | | | | | | | | | | | | | | | | | |
| | Dividends (from net investment income) | | — | | | — | | | — | | | — | | | — | | | — | |
| | Distributions (from capital gains) | | (1.52) | | | (6.93) | | | (1.59) | | | (1.33) | | | (1.90) | | | (1.46) | |
| Total Dividends and Distributions | | (1.52) | | | (6.93) | | | (1.59) | | | (1.33) | | | (1.90) | | | (1.46) | |
| Net Asset Value, End of Period | | $25.94 | | | $24.15 | | | $39.82 | | | $30.99 | | | $30.79 | | | $33.89 | |
| Total Return* | | 14.21% | | | (26.39)% | | | 33.85% | | | 4.98% | | | (2.41)% | | | 24.67% | |
| Net Assets, End of Period (in thousands) | | $951,484 | | | $864,531 | | | $1,289,904 | | | $1,057,332 | | | $1,191,950 | | | $1,302,196 | |
| Average Net Assets for the Period (in thousands) | | $937,582 | | | $1,111,102 | | | $1,297,945 | | | $1,088,543 | | | $1,183,056 | | | $1,190,715 | |
| Ratios to Average Net Assets**: | | | | | | | | | | | | | �� | | | | | |
| | Ratio of Gross Expenses | | 0.81% | | | 0.79% | | | 0.78% | | | 0.80% | | | 0.80% | | | 0.80% | |
| | Ratio of Net Expenses (After Waivers and Expense Offsets) | | 0.81% | | | 0.79% | | | 0.78% | | | 0.80% | | | 0.80% | | | 0.80% | |
| | Ratio of Net Investment Income/(Loss) | | (0.09)% | | | (0.32)% | | | (0.37)% | | | (0.25)% | | | 0.04% | | | 0.07% | |
| Portfolio Turnover Rate | | 9% | | | 8% | | | 24% | | | 32% | | | 26% | | | 21% | |
| | | | | | | | | | | | | | | | | | | | | | |
| |
* Total return includes adjustments in accordance with generally accepted accounting principles required at the year or period end and are not annualized for periods of less than one full year. ** Annualized for periods of less than one full year. (1) Per share amounts are calculated based on average shares outstanding during the year or period. |
| | |
See Notes to Financial Statements. |
| |
24 | MARCH 31, 2023 |
Janus Henderson Triton Fund
Financial Highlights
| | | | | | | | | | | | | | | | | | | | | | |
Class I Shares | | | | | | | | | | | | | | | | | | |
For a share outstanding during the period ended March 31, 2023 (unaudited) and the year ended September 30 | 2023 | | | 2022 | | | 2021 | | | 2020 | | | 2019 | | | 2018 | |
| Net Asset Value, Beginning of Period | | $24.41 | | | $40.17 | | | $31.24 | | | $31.02 | | | $34.11 | | | $28.72 | |
| Income/(Loss) from Investment Operations: | | | | | | | | | | | | | | | | | | |
| | Net investment income/(loss)(1) | | (0.01) | | | (0.09) | | | (0.13) | | | (0.06) | | | 0.02 | | | 0.04 | |
| | Net realized and unrealized gain/(loss) | | 3.37 | | | (8.74) | | | 10.65 | | | 1.61 | | | (1.21) | | | 6.81 | |
| Total from Investment Operations | | 3.36 | | | (8.83) | | | 10.52 | | | 1.55 | | | (1.19) | | | 6.85 | |
| Less Dividends and Distributions: | | | | | | | | | | | | | | | | | | |
| | Dividends (from net investment income) | | — | | | — | | | — | | | — | | | — | | | — | |
| | Distributions (from capital gains) | | (1.52) | | | (6.93) | | | (1.59) | | | (1.33) | | | (1.90) | | | (1.46) | |
| Total Dividends and Distributions | | (1.52) | | | (6.93) | | | (1.59) | | | (1.33) | | | (1.90) | | | (1.46) | |
| Net Asset Value, End of Period | | $26.25 | | | $24.41 | | | $40.17 | | | $31.24 | | | $31.02 | | | $34.11 | |
| Total Return* | | 14.26% | | | (26.38)% | | | 33.90% | | | 5.00% | | | (2.36)% | | | 24.74% | |
| Net Assets, End of Period (in thousands) | | $1,079,359 | | | $1,154,792 | | | $2,082,427 | | | $1,953,114 | | | $2,235,807 | | | $2,451,517 | |
| Average Net Assets for the Period (in thousands) | | $1,184,887 | | | $1,607,957 | | | $2,243,961 | | | $2,022,112 | | | $2,206,658 | | | $2,158,823 | |
| Ratios to Average Net Assets**: | | | | | | | | | | | | | | | | | | |
| | Ratio of Gross Expenses | | 0.78% | | | 0.76% | | | 0.75% | | | 0.76% | | | 0.76% | | | 0.75% | |
| | Ratio of Net Expenses (After Waivers and Expense Offsets) | | 0.78% | | | 0.76% | | | 0.75% | | | 0.76% | | | 0.76% | | | 0.75% | |
| | Ratio of Net Investment Income/(Loss) | | (0.07)% | | | (0.30)% | | | (0.34)% | | | (0.21)% | | | 0.08% | | | 0.12% | |
| Portfolio Turnover Rate | | 9% | | | 8% | | | 24% | | | 32% | | | 26% | | | 21% | |
| | | | | | | | | | | | | | | | | | | | | | |
| |
* Total return includes adjustments in accordance with generally accepted accounting principles required at the year or period end and are not annualized for periods of less than one full year. ** Annualized for periods of less than one full year. (1) Per share amounts are calculated based on average shares outstanding during the year or period. |
| | |
See Notes to Financial Statements. |
| |
Janus Investment Fund | 25 |
Janus Henderson Triton Fund
Financial Highlights
| | | | | | | | | | | | | | | | | | | | | | |
Class N Shares | | | | | | | | | | | | | | | | | | |
For a share outstanding during the period ended March 31, 2023 (unaudited) and the year ended September 30 | 2023 | | | 2022 | | | 2021 | | | 2020 | | | 2019 | | | 2018 | |
| Net Asset Value, Beginning of Period | | $24.66 | | | $40.48 | | | $31.44 | | | $31.18 | | | $34.24 | | | $28.80 | |
| Income/(Loss) from Investment Operations: | | | | | | | | | | | | | | | | | | |
| | Net investment income/(loss)(1) | | 0.01 | | | (0.06) | | | (0.10) | | | (0.03) | | | 0.05 | �� | | 0.07 | |
| | Net realized and unrealized gain/(loss) | | 3.40 | | | (8.83) | | | 10.73 | | | 1.62 | | | (1.21) | | | 6.83 | |
| Total from Investment Operations | | 3.41 | | | (8.89) | | | 10.63 | | | 1.59 | | | (1.16) | | | 6.90 | |
| Less Dividends and Distributions: | | | | | | | | | | | | | | | | | | |
| | Dividends (from net investment income) | | — | | | — | | | — | | | — | | | — | | | — | |
| | Distributions (from capital gains) | | (1.52) | | | (6.93) | | | (1.59) | | | (1.33) | | | (1.90) | | | (1.46) | |
| Total Dividends and Distributions | | (1.52) | | | (6.93) | | | (1.59) | | | (1.33) | | | (1.90) | | | (1.46) | |
| Net Asset Value, End of Period | | $26.55 | | | $24.66 | | | $40.48 | | | $31.44 | | | $31.18 | | | $34.24 | |
| Total Return* | | 14.32% | | | (26.32)% | | | 34.04% | | | 5.11% | | | (2.26)% | | | 24.85% | |
| Net Assets, End of Period (in thousands) | | $2,696,072 | | | $2,485,743 | | | $4,412,467 | | | $3,824,419 | | | $3,848,034 | | | $3,218,359 | |
| Average Net Assets for the Period (in thousands) | | $2,670,121 | | | $3,483,140 | | | $4,658,162 | | | $3,817,816 | | | $3,452,214 | | | $2,381,425 | |
| Ratios to Average Net Assets**: | | | | | | | | | | | | | | | | | | |
| | Ratio of Gross Expenses | | 0.67% | | | 0.66% | | | 0.66% | | | 0.66% | | | 0.66% | | | 0.66% | |
| | Ratio of Net Expenses (After Waivers and Expense Offsets) | | 0.67% | | | 0.66% | | | 0.66% | | | 0.66% | | | 0.66% | | | 0.66% | |
| | Ratio of Net Investment Income/(Loss) | | 0.04% | | | (0.20)% | | | (0.25)% | | | (0.12)% | | | 0.17% | | | 0.23% | |
| Portfolio Turnover Rate | | 9% | | | 8% | | | 24% | | | 32% | | | 26% | | | 21% | |
| | | | | | | | | | | | | | | | | | | | | | |
| |
* Total return includes adjustments in accordance with generally accepted accounting principles required at the year or period end and are not annualized for periods of less than one full year. ** Annualized for periods of less than one full year. (1) Per share amounts are calculated based on average shares outstanding during the year or period. |
| | |
See Notes to Financial Statements. |
| |
26 | MARCH 31, 2023 |
Janus Henderson Triton Fund
Financial Highlights
| | | | | | | | | | | | | | | | | | | | | | |
Class R Shares | | | | | | | | | | | | | | | | | | |
For a share outstanding during the period ended March 31, 2023 (unaudited) and the year ended September 30 | 2023 | | | 2022 | | | 2021 | | | 2020 | | | 2019 | | | 2018 | |
| Net Asset Value, Beginning of Period | | $21.74 | | | $36.75 | | | $28.86 | | | $28.94 | | | $32.17 | | | $27.34 | |
| Income/(Loss) from Investment Operations: | | | | | | | | | | | | | | | | | | |
| | Net investment income/(loss)(1) | | (0.08) | | | (0.26) | | | (0.35) | | | (0.24) | | | (0.16) | | | (0.16) | |
| | Net realized and unrealized gain/(loss) | | 2.98 | | | (7.82) | | | 9.83 | | | 1.49 | | | (1.17) | | | 6.45 | |
| Total from Investment Operations | | 2.90 | | | (8.08) | | | 9.48 | | | 1.25 | | | (1.33) | | | 6.29 | |
| Less Dividends and Distributions: | | | | | | | | | | | | | | | | | | |
| | Dividends (from net investment income) | | — | | | — | | | — | | | — | | | — | | | — | |
| | Distributions (from capital gains) | | (1.52) | | | (6.93) | | | (1.59) | | | (1.33) | | | (1.90) | | | (1.46) | |
| Total Dividends and Distributions | | (1.52) | | | (6.93) | | | (1.59) | | | (1.33) | | | (1.90) | | | (1.46) | |
| Net Asset Value, End of Period | | $23.12 | | | $21.74 | | | $36.75 | | | $28.86 | | | $28.94 | | | $32.17 | |
| Total Return* | | 13.88% | | | (26.87)% | | | 33.06% | | | 4.30% | | | (2.97)% | | | 23.91% | |
| Net Assets, End of Period (in thousands) | | $202,798 | | | $188,832 | | | $293,567 | | | $281,907 | | | $325,507 | | | $386,643 | |
| Average Net Assets for the Period (in thousands) | | $202,732 | | | $248,880 | | | $316,824 | | | $295,035 | | | $341,001 | | | $352,329 | |
| Ratios to Average Net Assets**: | | | | | | | | | | | | | | | | | | |
| | Ratio of Gross Expenses | | 1.42% | | | 1.41% | | | 1.40% | | | 1.41% | | | 1.41% | | | 1.41% | |
| | Ratio of Net Expenses (After Waivers and Expense Offsets) | | 1.41% | | | 1.41% | | | 1.40% | | | 1.41% | | | 1.41% | | | 1.41% | |
| | Ratio of Net Investment Income/(Loss) | | (0.70)% | | | (0.94)% | | | (0.99)% | | | (0.86)% | | | (0.57)% | | | (0.54)% | |
| Portfolio Turnover Rate | | 9% | | | 8% | | | 24% | | | 32% | | | 26% | | | 21% | |
| | | | | | | | | | | | | | | | | | | | | | |
| |
* Total return includes adjustments in accordance with generally accepted accounting principles required at the year or period end and are not annualized for periods of less than one full year. ** Annualized for periods of less than one full year. (1) Per share amounts are calculated based on average shares outstanding during the year or period. |
| | |
See Notes to Financial Statements. |
| |
Janus Investment Fund | 27 |
Janus Henderson Triton Fund
Financial Highlights
| | | | | | | | | | | | | | | | | | | | | | |
Class S Shares | | | | | | | | | | | | | | | | | | |
For a share outstanding during the period ended March 31, 2023 (unaudited) and the year ended September 30 | 2023 | | | 2022 | | | 2021 | | | 2020 | | | 2019 | | | 2018 | |
| Net Asset Value, Beginning of Period | | $22.67 | | | $37.93 | | | $29.68 | | | $29.65 | | | $32.83 | | | $27.81 | |
| Income/(Loss) from Investment Operations: | | | | | | | | | | | | | | | | | | |
| | Net investment income/(loss)(1) | | (0.05) | | | (0.21) | | | (0.28) | | | (0.17) | | | (0.09) | | | (0.09) | |
| | Net realized and unrealized gain/(loss) | | 3.10 | | | (8.12) | | | 10.12 | | | 1.53 | | | (1.19) | | | 6.57 | |
| Total from Investment Operations | | 3.05 | | | (8.33) | | | 9.84 | | | 1.36 | | | (1.28) | | | 6.48 | |
| Less Dividends and Distributions: | | | | | | | | | | | | | | | | | | |
| | Dividends (from net investment income) | | — | | | — | | | — | | | — | | | — | | | — | |
| | Distributions (from capital gains) | | (1.52) | | | (6.93) | | | (1.59) | | | (1.33) | | | (1.90) | | | (1.46) | |
| Total Dividends and Distributions | | (1.52) | | | (6.93) | | | (1.59) | | | (1.33) | | | (1.90) | | | (1.46) | |
| Net Asset Value, End of Period | | $24.20 | | | $22.67 | | | $37.93 | | | $29.68 | | | $29.65 | | | $32.83 | |
| Total Return* | | 13.98% | | | (26.66)% | | | 33.37% | | | 4.58% | | | (2.75)% | | | 24.20% | |
| Net Assets, End of Period (in thousands) | | $249,990 | | | $234,961 | | | $452,832 | | | $450,947 | | | $520,950 | | | $619,660 | |
| Average Net Assets for the Period (in thousands) | | $251,636 | | | $338,266 | | | $498,603 | | | $471,543 | | | $541,037 | | | $553,006 | |
| Ratios to Average Net Assets**: | | | | | | | | | | | | | | | | | | |
| | Ratio of Gross Expenses | | 1.17% | | | 1.16% | | | 1.16% | | | 1.16% | | | 1.16% | | | 1.16% | |
| | Ratio of Net Expenses (After Waivers and Expense Offsets) | | 1.17% | | | 1.16% | | | 1.16% | | | 1.16% | | | 1.16% | | | 1.16% | |
| | Ratio of Net Investment Income/(Loss) | | (0.45)% | | | (0.69)% | | | (0.75)% | | | (0.61)% | | | (0.32)% | | | (0.29)% | |
| Portfolio Turnover Rate | | 9% | | | 8% | | | 24% | | | 32% | | | 26% | | | 21% | |
| | | | | | | | | | | | | | | | | | | | | | |
| |
* Total return includes adjustments in accordance with generally accepted accounting principles required at the year or period end and are not annualized for periods of less than one full year. ** Annualized for periods of less than one full year. (1) Per share amounts are calculated based on average shares outstanding during the year or period. |
| | |
See Notes to Financial Statements. |
| |
28 | MARCH 31, 2023 |
Janus Henderson Triton Fund
Financial Highlights
| | | | | | | | | | | | | | | | | | | | | | |
Class T Shares | | | | | | | | | | | | | | | | | | |
For a share outstanding during the period ended March 31, 2023 (unaudited) and the year ended September 30 | 2023 | | | 2022 | | | 2021 | | | 2020 | | | 2019 | | | 2018 | |
| Net Asset Value, Beginning of Period | | $23.76 | | | $39.34 | | | $30.67 | | | $30.51 | | | $33.64 | | | $28.39 | |
| Income/(Loss) from Investment Operations: | | | | | | | | | | | | | | | | | | |
| | Net investment income/(loss)(1) | | (0.02) | | | (0.13) | | | (0.19) | | | (0.10) | | | (0.02) | | | (0.01) | |
| | Net realized and unrealized gain/(loss) | | 3.27 | | | (8.52) | | | 10.45 | | | 1.59 | | | (1.21) | | | 6.72 | |
| Total from Investment Operations | | 3.25 | | | (8.65) | | | 10.26 | | | 1.49 | | | (1.23) | | | 6.71 | |
| Less Dividends and Distributions: | | | | | | | | | | | | | | | | | | |
| | Dividends (from net investment income) | | — | | | — | | | — | | | — | | | — | | | — | |
| | Distributions (from capital gains) | | (1.52) | | | (6.93) | | | (1.59) | | | (1.33) | | | (1.90) | | | (1.46) | |
| Total Dividends and Distributions | | (1.52) | | | (6.93) | | | (1.59) | | | (1.33) | | | (1.90) | | | (1.46) | |
| Net Asset Value, End of Period | | $25.49 | | | $23.76 | | | $39.34 | | | $30.67 | | | $30.51 | | | $33.64 | |
| Total Return* | | 14.19% | | | (26.50)% | | | 33.67% | | | 4.89% | | | (2.52)% | | | 24.53% | |
| Net Assets, End of Period (in thousands) | | $1,638,504 | | | $1,592,889 | | | $2,670,126 | | | $2,379,045 | | | $2,881,377 | | | $3,317,058 | |
| Average Net Assets for the Period (in thousands) | | $1,675,368 | | | $2,140,397 | | | $2,809,155 | | | $2,557,135 | | | $2,940,071 | | | $3,031,535 | |
| Ratios to Average Net Assets**: | | | | | | | | | | | | | | | | | | |
| | Ratio of Gross Expenses | | 0.92% | | | 0.91% | | | 0.91% | | | 0.91% | | | 0.91% | | | 0.91% | |
| | Ratio of Net Expenses (After Waivers and Expense Offsets) | | 0.91% | | | 0.90% | | | 0.90% | | | 0.90% | | | 0.90% | | | 0.91% | |
| | Ratio of Net Investment Income/(Loss) | | (0.20)% | | | (0.44)% | | | (0.49)% | | | (0.35)% | | | (0.07)% | | | (0.04)% | |
| Portfolio Turnover Rate | | 9% | | | 8% | | | 24% | | | 32% | | | 26% | | | 21% | |
| | | | | | | | | | | | | | | | | | | | | | |
| |
* Total return includes adjustments in accordance with generally accepted accounting principles required at the year or period end and are not annualized for periods of less than one full year. ** Annualized for periods of less than one full year. (1) Per share amounts are calculated based on average shares outstanding during the year or period. |
| | |
See Notes to Financial Statements. |
| |
Janus Investment Fund | 29 |
Janus Henderson Triton Fund
Notes to Financial Statements (unaudited)
1. Organization and Significant Accounting Policies
Janus Henderson Triton Fund (the “Fund”) is a series of Janus Investment Fund (the “Trust”), which is organized as a Massachusetts business trust and is registered under the Investment Company Act of 1940, as amended (the “1940 Act”), as an open-end management investment company, and therefore has applied the specialized accounting and reporting guidance in Financial Accounting Standards Board (“FASB”) Accounting Standards Codification (“ASC”) Topic 946. The Trust offers 40 funds, each of which offers multiple share classes, with differing investment objectives and policies. The Fund seeks long-term growth of capital. The Fund is classified as diversified, as defined in the 1940 Act. Janus Henderson Investors US LLC is the investment adviser (the “Adviser”) to the Fund.
The Fund offers multiple classes of shares in order to meet the needs of various types of investors. Each class represents an interest in the same portfolio of investments. Certain financial intermediaries may not offer all classes of shares. Effective July 18, 2022, the Fund reopened to all new investors.
Shareholders, including other funds, individuals, accounts, as well as the Fund’s portfolio manager(s) and/or investment personnel, may from time to time own (beneficially or of record) a significant percentage of the Fund’s Shares and can be considered to “control” the Fund when that ownership exceeds 25% of the Fund’s assets (and which may differ from control as determined in accordance with United States of America generally accepted accounting principles ("US GAAP")).
Class A Shares are offered through financial intermediary platforms including, but not limited to, traditional brokerage platforms, mutual fund wrap fee programs, bank trust platforms, and retirement platforms.
Class C Shares are offered through financial intermediary platforms including, but not limited to, traditional brokerage platforms, mutual fund wrap fee programs, employer-sponsored retirement plans, and bank trust platforms.
The Fund currently implements an automatic conversion feature pursuant to which Class C Shares that have been held for eight years are automatically converted to Class A Shares without the imposition of any sales charge, fee or other charge. The conversion will generally occur no later than ten business days in the month following the month of the eighth anniversary of the date of purchase. Class C Shares purchased through the reinvestment of dividends and other distributions on Class C Shares will convert to Class A Shares at the same time as the original Class C Shares with respect to which they were purchased. For Class C Shares held in omnibus accounts on intermediary platforms, the Fund relies on these intermediaries to implement this conversion feature. Your financial intermediary may have separate policies and procedures as to when and how Class C Shares may be converted to Class A Shares.
Effective July 6, 2020, Class D Shares are available to new investors, subject to any closed fund policies for a Fund, as applicable. Previously, Class D Shares were only available to investors who already had a direct account with the Janus Henderson funds; immediate family members or members of the same household of an eligible individual investor; and existing beneficial owners of sole proprietorships or partnerships that hold accounts directly with the Janus Henderson funds.
Class I Shares are available through certain financial intermediary platforms including, but not limited to, mutual fund wrap fee programs, managed account programs, asset allocation programs, bank trust platforms, as well as certain retirement platforms. Class I Shares are also available to certain direct institutional investors including, but not limited to, corporations, certain retirement plans, public plans, and foundations/endowments, who established Class I Share accounts before August 4, 2017.
Class N Shares are generally available only to financial intermediaries purchasing on behalf of: 1) certain adviser-assisted, employer-sponsored retirement plans, including 401(k) plans, 457 plans, 403(b) plans, Taft-Hartley multi-employer plans, profit-sharing and money purchase pension plans, defined benefit plans and certain welfare benefit plans, such as health savings accounts, and nonqualified deferred compensation plans; and 2) retail investors purchasing in qualified or nonqualified accounts, whose accounts are held through an omnibus account at their financial intermediary, and where the financial intermediary requires no payment or reimbursement from the Fund, the Adviser, or its affiliates. Class N Shares are also available to Janus Henderson proprietary products and to certain direct institutional investors approved by Janus Henderson Distributors US LLC (the “Distributor”) including, but not limited to, corporations, certain retirement plans, public plans, and foundations and endowments, subject to minimum investment requirements.
Class R Shares are offered through financial intermediary platforms including, but not limited to, retirement platforms.
Janus Henderson Triton Fund
Notes to Financial Statements (unaudited)
Class S Shares are offered through financial intermediary platforms including, but not limited to, retirement platforms and asset allocation, mutual fund wrap, or other discretionary or nondiscretionary fee-based investment advisory programs. In addition, Class S Shares may be available through certain financial intermediaries who have an agreement with the Adviser or its affiliates to offer Class S Shares on their supermarket platforms.
Class T Shares are available through certain financial intermediary platforms including, but not limited to, mutual fund wrap fee programs, managed account programs, asset allocation programs, bank trust platforms, as well as certain retirement platforms. In addition, Class T Shares may be available through certain financial intermediaries who have an agreement with the Adviser or its affiliates to offer Class T Shares on their supermarket platforms.
The following accounting policies have been followed by the Fund and are in conformity with US GAAP.
Investment Valuation
Fund holdings are valued in accordance with policies and procedures established by the Adviser pursuant to Rule 2a-5 under the 1940 Act and approved by and subject to the oversight of the Trustees (the “Valuation Procedures”). Equity securities traded on a domestic securities exchange are generally valued at readily available market quotations, which are (i) the official close prices or (ii) last sale prices on the primary market or exchange in which the securities trade. If such price is lacking for the trading period immediately preceding the time of determination, such securities are generally valued at their current bid price. Equity securities that are traded on a foreign exchange are generally valued at the closing prices on such markets. In the event that there is no current trading volume on a particular security in such foreign exchange, the bid price from the primary exchange is generally used to value the security. Foreign securities and currencies are converted to U.S. dollars using the current spot USD dollar exchange rate in effect at the close of the New York Stock Exchange (“NYSE”). The Fund will determine the market value of individual securities held by it by using prices provided by one or more approved professional pricing services or, as needed, by obtaining market quotations from independent broker-dealers. Most debt securities are valued in accordance with the evaluated bid price supplied by the Adviser-approved pricing service that is intended to reflect market value. The evaluated bid price supplied by the pricing service is an evaluation that may consider factors such as security prices, yields, maturities and ratings. Certain short-term securities maturing within 60 days or less may be evaluated and valued on an amortized cost basis provided that the amortized cost determined approximates market value. Securities for which market quotations or evaluated prices are not readily available or deemed unreliable are valued at fair value determined in good faith by the Adviser pursuant to the Valuation Procedures. Circumstances in which fair valuation may be utilized include, but are not limited to: (i) a significant event that may affect the securities of a single issuer, such as a merger, bankruptcy, or significant issuer-specific development; (ii) an event that may affect an entire market, such as a natural disaster or significant governmental action; (iii) a nonsignificant event such as a market closing early or not opening, or a security trading halt; and (iv) pricing of a nonvalued security and a restricted or nonpublic security. Special valuation considerations may apply with respect to “odd-lot” fixed-income transactions which, due to their small size, may receive evaluated prices by pricing services which reflect a large block trade and not what actually could be obtained for the odd-lot position. The valuation policies provide for the use of systematic fair valuation models provided by independent pricing services to value foreign equity securities in order to adjust for stale pricing, which may occur between the close of certain foreign exchanges and the close of the NYSE. The value of the securities of other mutual funds held by a Fund, if any, will be calculated using the NAV of such mutual funds.
Valuation Inputs Summary
FASB ASC 820, Fair Value Measurements and Disclosures (“ASC 820”), defines fair value, establishes a framework for measuring fair value, and expands disclosure requirements regarding fair value measurements. This standard emphasizes that fair value is a market-based measurement that should be determined based on the assumptions that market participants would use in pricing an asset or liability and establishes a hierarchy that prioritizes inputs to valuation techniques used to measure fair value. These inputs are summarized into three broad levels:
Level 1 – Unadjusted quoted prices in active markets the Fund has the ability to access for identical assets or liabilities.
Level 2 – Observable inputs other than unadjusted quoted prices included in Level 1 that are observable for the asset or liability either directly or indirectly. These inputs may include quoted prices for the identical instrument on an inactive market, prices for similar instruments, interest rates, prepayment speeds, credit risk, yield curves, default rates and similar data.
Janus Henderson Triton Fund
Notes to Financial Statements (unaudited)
Assets or liabilities categorized as Level 2 in the hierarchy generally include: debt securities fair valued in accordance with the evaluated bid or ask prices supplied by a pricing service; securities traded on OTC markets and listed securities for which no sales are reported that are fair valued at the latest bid price (or yield equivalent thereof) obtained from one or more dealers transacting in a market for such securities or by a pricing service approved by the Fund’s Trustees; certain short-term debt securities with maturities of 60 days or less that are fair valued at amortized cost; and equity securities of foreign issuers whose fair value is determined by using systematic fair valuation models provided by independent third parties in order to adjust for stale pricing which may occur between the close of certain foreign exchanges and the close of the NYSE. Other securities that may be categorized as Level 2 in the hierarchy include, but are not limited to, preferred stocks, bank loans, swaps, investments in unregistered investment companies, options, and forward contracts.
Level 3 – Unobservable inputs for the asset or liability to the extent that relevant observable inputs are not available, representing the Fund’s own assumptions about the assumptions that a market participant would use in valuing the asset or liability, and that would be based on the best information available.
There have been no significant changes in valuation techniques used in valuing any such positions held by the Fund since the beginning of the fiscal period.
The inputs or methodology used for fair valuing securities are not necessarily an indication of the risk associated with investing in those securities. The summary of inputs used as of March 31, 2023 to fair value the Fund’s investments in securities and other financial instruments is included in the “Valuation Inputs Summary” in the Notes to Schedule of Investments and Other Information.
The Fund did not hold a significant amount of Level 3 securities as of March 31, 2023.
Investment Transactions and Investment Income
Investment transactions are accounted for as of the date purchased or sold (trade date). Dividend income is recorded on the ex-dividend date. Certain dividends from foreign securities will be recorded as soon as the Fund is informed of the dividend, if such information is obtained subsequent to the ex-dividend date. Dividends from foreign securities may be subject to withholding taxes in foreign jurisdictions. Non-cash dividends, if any, are recorded on the ex-dividend date at fair value. Interest income is recorded daily on an accrual basis and includes amortization of premiums and accretion of discounts. The Fund classifies gains and losses on prepayments received as an adjustment to interest income. Debt securities may be placed in non-accrual status and related interest income may be reduced by stopping current accruals and writing off interest receivables when collection of all or a portion of interest has become doubtful. Gains and losses are determined on the identified cost basis, which is the same basis used for federal income tax purposes. Income, as well as gains and losses, both realized and unrealized, are allocated daily to each class of shares based upon the ratio of net assets represented by each class as a percentage of total net assets.
Expenses
The Fund bears expenses incurred specifically on its behalf. Each class of shares bears a portion of general expenses, which are allocated daily to each class of shares based upon the ratio of net assets represented by each class as a percentage of total net assets. Expenses directly attributable to a specific class of shares are charged against the operations of such class.
Estimates
The preparation of financial statements in conformity with US GAAP requires management to make estimates and assumptions that affect the reported amount of assets and liabilities and disclosure of contingent assets and liabilities at the date of the financial statements, and the reported amounts of income and expenses during the reporting period. Actual results could differ from those estimates.
Indemnifications
In the normal course of business, the Fund may enter into contracts that contain provisions for indemnification of other parties against certain potential liabilities. The Fund’s maximum exposure under these arrangements is unknown, and would involve future claims that may be made against the Fund that have not yet occurred. Currently, the risk of material loss from such claims is considered remote.
Foreign Currency Translations
The Fund does not isolate that portion of the results of operations resulting from the effect of changes in foreign exchange rates on investments from the fluctuations arising from changes in market prices of securities held at the
Janus Henderson Triton Fund
Notes to Financial Statements (unaudited)
date of the financial statements. Net unrealized appreciation or depreciation of investments and foreign currency translations arise from changes in the value of assets and liabilities, including investments in securities held at the date of the financial statements, resulting from changes in the exchange rates and changes in market prices of securities held.
Currency gains and losses are also calculated on payables and receivables that are denominated in foreign currencies. The payables and receivables are generally related to foreign security transactions and income translations.
Foreign currency-denominated assets and forward currency contracts may involve more risks than domestic transactions, including currency risk, counterparty risk, political and economic risk, regulatory risk and equity risk. Risks may arise from unanticipated movements in the value of foreign currencies relative to the U.S. dollar.
Dividends and Distributions
The Fund generally declares and distributes dividends of net investment income and realized capital gains (if any) annually. The Fund may treat a portion of the amount paid to redeem shares as a distribution of investment company taxable income and realized capital gains that are reflected in the net asset value. This practice, commonly referred to as “equalization,” has no effect on the redeeming shareholder or a Fund’s total return, but may reduce the amounts that would otherwise be required to be paid as taxable dividends to the remaining shareholders. It is possible that the Internal Revenue Service (IRS) could challenge the Fund's equalization methodology or calculations, and any such challenge could result in additional tax, interest, or penalties to be paid by the Fund.
The Fund may make certain investments in real estate investment trusts (“REITs”) which pay dividends to their shareholders based upon funds available from operations. It is quite common for these dividends to exceed the REITs’ taxable earnings and profits, resulting in the excess portion of such dividends being designated as a return of capital. If the Fund distributes such amounts, such distributions could constitute a return of capital to shareholders for federal income tax purposes.
Federal Income Taxes
The Fund intends to continue to qualify as a regulated investment company and distribute all of its taxable income in accordance with the requirements of Subchapter M of the Internal Revenue Code. Management has analyzed the Fund’s tax positions taken for all open federal income tax years, generally a three-year period, and has concluded that no provision for federal income tax is required in the Fund’s financial statements. The Fund is not aware of any tax positions for which it is reasonably possible that the total amounts of unrecognized tax benefits will significantly change in the next twelve months.
2. Derivative Instruments
The Fund may invest in various types of derivatives, which may at times result in significant derivative exposure. A derivative is a financial instrument whose performance is derived from the performance of another asset. The Fund may invest in derivative instruments including, but not limited to: futures contracts, put options, call options, options on futures contracts, options on foreign currencies, options on recovery locks, options on security and commodity indices, swaps, forward contracts, structured investments, and other equity-linked derivatives. Each derivative instrument that was held by the Fund during the period ended March 31, 2023 is discussed in further detail below. A summary of derivative activity by the Fund is reflected in the tables at the end of the Schedule of Investments.
The Fund may use derivative instruments for hedging purposes (to offset risks associated with an investment, currency exposure, or market conditions), to adjust currency exposure relative to a benchmark index, or for speculative purposes (to earn income and seek to enhance returns). When the Fund invests in a derivative for speculative purposes, the Fund will be fully exposed to the risks of loss of that derivative, which may sometimes be greater than the derivative’s cost. The Fund may not use any derivative to gain exposure to an asset or class of assets that it would be prohibited by its investment restrictions from purchasing directly. The Fund’s ability to use derivative instruments may also be limited by tax considerations.
Investments in derivatives in general are subject to market risks that may cause their prices to fluctuate over time. Investments in derivatives may not directly correlate with the price movements of the underlying instrument. As a result, the use of derivatives may expose the Fund to additional risks that it would not be subject to if it invested directly in the securities underlying those derivatives. The use of derivatives may result in larger losses or smaller gains than otherwise would be the case. Derivatives can be volatile and may involve significant risks.
Janus Henderson Triton Fund
Notes to Financial Statements (unaudited)
In pursuit of its investment objective, the Fund may seek to use derivatives to increase or decrease exposure to the following market risk factors:
· Commodity Risk – the risk related to the change in value of commodities or commodity-linked investments due to changes in the overall market movements, volatility of the underlying benchmark, changes in interest rates, or other factors affecting a particular industry or commodity such as drought, floods, weather, livestock disease, embargoes, tariffs, and international economic, political, and regulatory developments.
· Counterparty Risk – the risk that the counterparty (the party on the other side of the transaction) on a derivative transaction will be unable to honor its financial obligation to the Fund.
· Credit Risk – the risk an issuer will be unable to make principal and interest payments when due, or will default on its obligations.
· Currency Risk – the risk that changes in the exchange rate between currencies will adversely affect the value (in U.S. dollar terms) of an investment.
· Equity Risk – the risk related to the change in value of equity securities as they relate to increases or decreases in the general market.
· Index Risk – if the derivative is linked to the performance of an index, it will be subject to the risks associated with changes in that index. If the index changes, the Fund could receive lower interest payments or experience a reduction in the value of the derivative to below what the Fund paid. Certain indexed securities, including inverse securities (which move in an opposite direction to the index), may create leverage, to the extent that they increase or decrease in value at a rate that is a multiple of the changes in the applicable index.
· Interest Rate Risk – the risk that the value of fixed-income securities will generally decline as prevailing interest rates rise, which may cause the Fund’s NAV to likewise decrease.
· Leverage Risk – the risk associated with certain types of leveraged investments or trading strategies pursuant to which relatively small market movements may result in large changes in the value of an investment. The Fund creates leverage by investing in instruments, including derivatives, where the investment loss can exceed the original amount invested. Certain investments or trading strategies, such as short sales, that involve leverage can result in losses that greatly exceed the amount originally invested.
· Liquidity Risk – the risk that certain securities may be difficult or impossible to sell at the time that the seller would like or at the price that the seller believes the security is currently worth.
Derivatives may generally be traded OTC or on an exchange. Derivatives traded OTC are agreements that are individually negotiated between parties and can be tailored to meet a purchaser’s needs. OTC derivatives are not guaranteed by a clearing agency and may be subject to increased credit risk.
In an effort to mitigate credit risk associated with derivatives traded OTC, the Fund may enter into collateral agreements with certain counterparties whereby, subject to certain minimum exposure requirements, the Fund may require the counterparty to post collateral if the Fund has a net aggregate unrealized gain on all OTC derivative contracts with a particular counterparty. Additionally, the Fund may deposit cash and/or treasuries as collateral with the counterparty and/or custodian daily (based on the daily valuation of the financial asset) if the Fund has a net aggregate unrealized loss on OTC derivative contracts with a particular counterparty. All liquid securities and restricted cash are considered to cover in an amount at all times equal to or greater than the Fund’s commitment with respect to certain exchange-traded derivatives, centrally cleared derivatives, forward foreign currency exchange contracts, short sales, and/or securities with extended settlement dates. There is no guarantee that counterparty exposure is reduced and these arrangements are dependent on the Adviser’s ability to establish and maintain appropriate systems and trading.
Forward Foreign Currency Exchange Contracts
A forward foreign currency exchange contract (“forward currency contract”) is an obligation to buy or sell a specified currency at a future date at a negotiated rate (which may be U.S. dollars or a foreign currency). The Fund may enter into forward currency contracts for hedging purposes, including, but not limited to, reducing exposure to changes in foreign currency exchange rates on foreign portfolio holdings and locking in the U.S. dollar cost of firm purchase and sale commitments for securities denominated in or exposed to foreign currencies. The Fund may also invest in forward currency contracts for non-hedging purposes such as seeking to enhance returns. The Fund is subject to currency risk
Janus Henderson Triton Fund
Notes to Financial Statements (unaudited)
and counterparty risk in the normal course of pursuing its investment objective through its investments in forward currency contracts.
Forward currency contracts are valued by converting the foreign value to U.S. dollars by using the current spot U.S. dollar exchange rate and/or forward rate for that currency. Exchange and forward rates as of the close of the NYSE are used to value the forward currency contracts. The unrealized appreciation/(depreciation) for forward currency contracts is reported in the Statement of Assets and Liabilities as a receivable or payable and in the Statement of Operations for the change in unrealized net appreciation/depreciation (if applicable). The realized gain or loss arising from the difference between the U.S. dollar cost of the original contract and the value of the foreign currency in U.S. dollars upon closing a forward currency contract is reported on the Statement of Operations (if applicable).
During the period, the Fund entered into forward currency contracts with the obligation to purchase foreign currencies in the future at an agreed upon rate in order to decrease exposure to currency risk associated with foreign currency denominated securities held by the Fund.
During the period, the Fund entered into forward currency contracts with the obligation to sell foreign currencies in the future at an agreed upon rate in order to decrease exposure to currency risk associated with foreign currency denominated securities held by the Fund.
3. Other Investments and Strategies
Additional Investment Risk
The U.S. government and the Federal Reserve, as well as certain foreign governments and central banks, have taken extraordinary actions to support local and global economies and the financial markets in response to the COVID-19 pandemic. This and other government intervention into the economy and financial markets to address the COVID-19 pandemic may not work as intended, particularly if the efforts are perceived by investors as being unlikely to achieve the desired results. Government actions to mitigate the economic impact of the pandemic have resulted in a large expansion of government deficits and debt, the long term consequences of which are not known. The COVID-19 pandemic could adversely affect the value and liquidity of a Fund’s investments, impair a Fund’s ability to satisfy redemption requests, and negatively impact a Fund’s performance. In addition, the outbreak of COVID-19, and measures taken to mitigate its effects, could result in disruptions to the services provided to a Fund by its service providers.
Widespread disease, including pandemics and epidemics, and natural or environmental disasters, including those which may be attributable to global climate change, such as earthquakes, fires, floods, hurricanes, tsunamis and weather-related phenomena generally, have been and can be highly disruptive to economies and markets, adversely impacting individual companies, sectors, industries, markets, currencies, interest and inflation rates, credit ratings, investor sentiment, and other factors affecting the value of a Fund’s investments. Economies and financial markets throughout the world have become increasingly interconnected, which increases the likelihood that events or conditions in one region or country will adversely affect markets or issuers in other regions or countries, including the United States. These disruptions could prevent a Fund from executing advantageous investment decisions in a timely manner and negatively impact a Fund’s ability to achieve its investment objective(s). Any such event(s) could have a significant adverse impact on the value of a Fund. In addition, these disruptions could also impair the information technology and other operational systems upon which the Fund’s service providers, including the Adviser or the subadviser (as applicable), rely, and could otherwise disrupt the ability of employees of the Fund’s service providers to perform essential tasks on behalf of the Fund. Adverse weather conditions may also have a particularly significant negative effect on issuers in the agricultural sector and on insurance and reinsurance companies that insure or reinsure against the impact of natural disasters.
A number of countries in the European Union (the “EU”) have experienced, and may continue to experience, severe economic and financial difficulties. In particular, many EU nations are susceptible to economic risks associated with high levels of debt. Many non-governmental issuers, and even certain governments, have defaulted on, or been forced to restructure, their debts. Many other issuers have faced difficulties obtaining credit or refinancing existing obligations. Financial institutions have in many cases required government or central bank support, have needed to raise capital, and/or have been impaired in their ability to extend credit. As a result, financial markets in the EU have experienced extreme volatility and declines in asset values and liquidity. These difficulties may continue, worsen, or spread further within the EU. Responses to these financial problems by European governments, central banks, and others, including austerity measures and reforms, may not work, may result in social unrest, and may limit future growth and economic
Janus Henderson Triton Fund
Notes to Financial Statements (unaudited)
recovery or have other unintended consequences. Among other things, these developments have adversely affected the value and exchange rate of the euro and pound sterling, and may continue to significantly affect the economies of all EU countries, which in turn may have a material adverse effect on the Fund’s investments in such countries, other countries that depend on EU countries for significant amounts of trade or investment, or issuers with exposure to debt issued by certain EU countries.
Real Estate Investing
The Fund may invest in equity and debt securities of real estate-related companies. Such companies may include those in the real estate industry or real estate-related industries. These securities may include common stocks, corporate bonds, preferred stocks, and other equity securities, including, but not limited to, mortgage-backed securities, real estate-backed securities, securities of REITs and similar REIT-like entities. A REIT is a trust that invests in real estate-related projects, such as properties, mortgage loans, and construction loans. REITs are generally categorized as equity, mortgage, or hybrid REITs. A REIT may be listed on an exchange or traded OTC.
Restricted Security Transactions
Restricted securities held by the Fund may not be sold except in exempt transactions or in a public offering registered under the Securities Act of 1933, as amended. The risk of investing in such securities is generally greater than the risk of investing in the securities of widely held, publicly traded companies. Lack of a secondary market and resale restrictions may result in the inability of the Fund to sell a security at a fair price and may substantially delay the sale of the security. In addition, these securities may exhibit greater price volatility than securities for which secondary markets exist.
Counterparties
Fund transactions involving a counterparty are subject to the risk that the counterparty or a third party will not fulfill its obligation to the Fund (“counterparty risk”). Counterparty risk may arise because of the counterparty’s financial condition (i.e., financial difficulties, bankruptcy, or insolvency), market activities and developments, or other reasons, whether foreseen or not. A counterparty’s inability to fulfill its obligation may result in significant financial loss to the Fund. The Fund may be unable to recover its investment from the counterparty or may obtain a limited recovery, and/or recovery may be delayed. The extent of the Fund’s exposure to counterparty risk with respect to financial assets and liabilities approximates its carrying value. See the "Offsetting Assets and Liabilities" section of this Note for further details.
The Fund may be exposed to counterparty risk through participation in various programs, including, but not limited to, lending its securities to third parties, cash sweep arrangements whereby the Fund’s cash balance is invested in one or more types of cash management vehicles, as well as investments in, but not limited to, repurchase agreements, debt securities, and derivatives, including various types of swaps, futures and options. The Fund intends to enter into financial transactions with counterparties that the Adviser believes to be creditworthy at the time of the transaction. There is always the risk that the Adviser’s analysis of a counterparty’s creditworthiness is incorrect or may change due to market conditions. To the extent that the Fund focuses its transactions with a limited number of counterparties, it will have greater exposure to the risks associated with one or more counterparties.
Securities Lending
Under procedures adopted by the Trustees, the Fund may seek to earn additional income by lending securities to certain qualified broker-dealers and institutions. JPMorgan Chase Bank, National Association acts as securities lending agent and a limited purpose custodian or subcustodian to receive and disburse cash balances and cash collateral, hold short-term investments, hold collateral, and perform other custodial functions in accordance with the Non-Custodial Securities Lending Agreement. For financial reporting purposes, the Fund does not offset financial instruments’ payables and receivables and related collateral on the Statement of Assets and Liabilities. The Fund may lend fund securities in an amount equal to up to 1/3 of its total assets as determined at the time of the loan origination. There is the risk of delay in recovering a loaned security or the risk of loss in collateral rights if the borrower fails financially. In addition, the Adviser makes efforts to balance the benefits and risks from granting such loans. All loans will be continuously secured by collateral which may consist of cash, U.S. Government securities, domestic and foreign short-term debt instruments, letters of credit, time deposits, repurchase agreements, money market mutual funds or other money market accounts, or such other collateral as permitted by the SEC. If the Fund is unable to recover a security on loan, the Fund may use the collateral to purchase replacement securities in the market. There is a risk that the value of the collateral could decrease below the cost of the replacement security by the time the replacement investment is made, resulting in a loss to the Fund. In certain circumstances individual loan transactions could yield negative returns.
Janus Henderson Triton Fund
Notes to Financial Statements (unaudited)
Upon receipt of cash collateral, the Adviser may invest it in affiliated or non-affiliated cash management vehicles, whether registered or unregistered entities, as permitted by the 1940 Act and rules promulgated thereunder. The Adviser currently intends to primarily invest the cash collateral in a cash management vehicle for which the Adviser serves as investment adviser, Janus Henderson Cash Collateral Fund LLC, or in time deposits. An investment in Janus Henderson Cash Collateral Fund LLC is generally subject to the same risks that shareholders experience when investing in similarly structured vehicles, such as the potential for significant fluctuations in assets as a result of the purchase and redemption activity of the securities lending program, a decline in the value of the collateral, and possible liquidity issues. Such risks may delay the return of the cash collateral and cause the Fund to violate its agreement to return the cash collateral to a borrower in a timely manner. As adviser to the Fund and Janus Henderson Cash Collateral Fund LLC, the Adviser has an inherent conflict of interest as a result of its fiduciary duties to both the Fund and Janus Henderson Cash Collateral Fund LLC. Additionally, the Adviser receives an investment advisory fee of 0.05% for managing Janus Henderson Cash Collateral Fund LLC, but it may not receive a fee for managing certain other affiliated cash management vehicles in which the Fund may invest, and therefore may have an incentive to allocate preferred investment opportunities to investment vehicles for which it is receiving a fee.
The value of the collateral must be at least 102% of the market value of the loaned securities that are denominated in U.S. dollars and 105% of the market value of the loaned securities that are not denominated in U.S. dollars. Loaned securities and related collateral are marked-to-market each business day based upon the market value of the loaned securities at the close of business, employing the most recent available pricing information. Collateral levels are then adjusted based on this mark-to-market evaluation. Additional required collateral, or excess collateral returned, is delivered on the next business day. Therefore, the value of the collateral held may be temporarily less than 102% or 105% value of the securities on loan. The cash collateral invested by the Adviser is disclosed in the Schedule of Investments (if applicable).
Income earned from the investment of the cash collateral, net of rebates paid to, or fees paid by, borrowers and less the fees paid to the lending agent are included as “Affiliated securities lending income, net” on the Statement of Operations. As of March 31, 2023, securities lending transactions accounted for as secured borrowings with an overnight and continuous contractual maturity are $12,098,198. Gross amounts of recognized liabilities for securities lending (collateral received) as of March 31, 2023 is $11,939,436, resulting in the net amount due from the counterparty of $158,762.
Offsetting Assets and Liabilities
The Fund presents gross and net information about transactions that are either offset in the financial statements or subject to an enforceable master netting arrangement or similar agreement with a designated counterparty, regardless of whether the transactions are actually offset in the Statement of Assets and Liabilities.
In order to better define its contractual rights and to secure rights that will help the Fund mitigate its counterparty risk, the Fund has entered into an International Swaps and Derivatives Association, Inc. Master Agreement (“ISDA Master Agreement”) or similar agreement with its derivative contract counterparties. An ISDA Master Agreement is a bilateral agreement between the Fund and a counterparty that governs OTC derivatives and forward foreign currency exchange contracts and typically contains, among other things, collateral posting terms and netting provisions in the event of a default and/or termination event. Under an ISDA Master Agreement, in the event of a default and/or termination event, the Fund may offset with each counterparty certain derivative financial instruments’ payables and/or receivables with collateral held and/or posted and create one single net payment.
The Offsetting Assets and Liabilities tables located in the Schedule of Investments present gross amounts of recognized assets and/or liabilities and the net amounts after deducting collateral that has been pledged by counterparties or has been pledged to counterparties (if applicable). For corresponding information grouped by type of instrument, see the “Fair Value of Derivative Instruments (not accounted for as hedging instruments) as of March 31, 2023” table located in the Fund’s Schedule of Investments.The Fund generally does not exchange collateral on its forward foreign currency contracts with its counterparties; however, all liquid securities and restricted cash are considered to cover in an amount at all times equal to or greater than the Fund’s commitment with respect to these contracts. Certain securities may be segregated at the Fund’s custodian. These segregated securities are denoted on the accompanying Schedule of Investments and are evaluated daily to ensure their cover and/or market value equals or exceeds the Fund’s corresponding forward foreign currency exchange contract's obligation value.
Janus Henderson Triton Fund
Notes to Financial Statements (unaudited)
4. Investment Advisory Agreements and Other Transactions with Affiliates
The Fund pays the Adviser an investment advisory fee which is calculated daily and paid monthly. The Fund’s contractual investment advisory fee rate (expressed as an annual rate) is 0.64% of its average daily net assets.
The Adviser has contractually agreed to waive the investment advisory fee and/or reimburse operating expenses to the extent that the Fund’s total annual fund operating expenses, excluding the fees payable pursuant to a Rule 12b-1 plan, shareholder servicing fees, such as transfer agency fees (including out-of-pocket costs), administrative services fees and any networking/omnibus payable by any share class, brokerage commissions, interest, dividends, taxes, acquired fund fees and expenses, and extraordinary expenses, exceed the annual rate of 0.86% of the Fund’s average daily net assets. The Adviser has agreed to continue the waivers for at least a one-year period commencing January 27, 2023. The previous expense limit (for the one-year period commencing January 28, 2022) was 0.92%. If applicable, amounts waived and/or reimbursed to the Fund by the Adviser are disclosed as “Excess Expense Reimbursement and Waivers” on the Statement of Operations.
The Adviser serves as administrator to the Fund pursuant to an administration agreement between the Adviser and the Trust. Under the administration agreement, the Adviser is authorized to perform, or cause others to perform certain administration, compliance, and accounting services to the Fund, including providing office space for the Fund, and is reimbursed by the Fund for certain of its costs in providing these services (to the extent the Adviser seeks reimbursement and such costs are not otherwise waived). In addition, employees of the Adviser and/or its affiliates may serve as officers of the Trust. The Fund pays for some or all of the salaries, fees, and expenses of the Adviser employees and Fund officers, with respect to certain specified administration functions they perform on behalf of the Fund. The Fund pays these costs based on out-of-pocket expenses incurred by the Adviser, and these costs are separate and apart from advisory fees and other expenses paid in connection with the investment advisory services the Adviser (or any subadvisor, as applicable) provides to the Fund. These amounts are disclosed as “Affiliated fund administration fees” on the Statement of Operations. In addition, some expenses related to compensation payable to the Fund’s Chief Compliance Officer and certain compliance staff, all of whom are employees of the Adviser and/or its affiliates, are shared with the Fund. Total compensation of $114,430 was paid to the Chief Compliance Officer and certain compliance staff by the Trust during the period ended March 31, 2023. The Fund's portion is reported as part of “Other expenses” on the Statement of Operations.
Janus Henderson Services US LLC (the “Transfer Agent”), a wholly-owned subsidiary of the Adviser, is the Fund’s transfer agent. The Transfer Agent provides or arranges for the provision of shareholder services including, but not limited to, recordkeeping, subaccounting, answering inquiries regarding accounts, order processing, transaction confirmations, the mailing of prospectuses and shareholder reports, and other shareholder services provided to or on behalf of shareholders. These amounts are disclosed as “Transfer agent administrative fees and expenses” on the Statement of Operations.
Class D Shares of the Fund pay the Transfer Agent an annual administrative services fee based on the average daily net assets of Class D Shares as detailed below.
| | |
Average Daily Net Assets of Class D Shares of the Janus Henderson funds | Administrative Services Fee |
Under $40 billion | 0.12% |
$40 billion – $49.9 billion | 0.10% |
Over $49.9 billion | 0.08% |
During the reporting period, the administrative services fee rate was 0.12%.
The Transfer Agent receives an administrative services fee at an annual rate of up to 0.25% of the average daily net assets of the Fund’s Class R Shares, Class S Shares, and Class T Shares for providing or procuring administrative services to investors in Class R Shares, Class S Shares, and Class T Shares of the Fund. The Transfer Agent expects to use all or a significant portion of this fee to compensate retirement plan service providers, broker-dealers, bank trust departments, financial advisors, and other financial intermediaries for providing these services. The Transfer Agent may keep certain amounts retained for reimbursement of out-of-pocket costs incurred for servicing clients of Class R Shares, Class S Shares, and Class T Shares.
Shareholder Services provided by these financial intermediaries may include, but are not limited to, recordkeeping, subaccounting, order processing, providing order confirmations, periodic statements, forwarding prospectuses,
Janus Henderson Triton Fund
Notes to Financial Statements (unaudited)
shareholder reports, and other materials to existing customers, answering inquiries regarding accounts, and other administrative services. Order processing includes the submission of transactions through the National Securities Clearing Corporation (“NSCC”) or similar systems, or those processed on a manual basis with the Adviser. For all share classes, the Transfer Agent also seeks reimbursement for costs it incurs as transfer agent and for providing servicing.
Certain, but not all, intermediaries may charge administrative fees to investors in Class A Shares, Class C Shares, and Class I Shares for administrative services provided on behalf of such investors. These administrative fees are paid by the Class A Shares, Class C Shares, and Class I Shares of the Fund to the Transfer Agent, which uses such fees to reimburse intermediaries. Consistent with the Transfer Agency Agreement between the Transfer Agent and the Fund, the Transfer Agent may negotiate the level, structure, and/or terms of the administrative fees with intermediaries requiring such fees on behalf of the Fund. The Adviser and its affiliates benefit from an increase in assets that may result from such relationships. The Adviser has agreed to limit these fees up to 0.20% for Class A Shares and Class C Shares, and up to 0.15% for Class I Shares on an annual basis based on the daily net assets of each share class. Such limits are subject to change by the Trustees in the future. These amounts are disclosed as “Transfer agent networking and omnibus fees” on the Statement of Operations.
The Transfer Agent is not compensated for its services related to the shares, except for out-of-pocket costs, although the Transfer Agent is compensated for its services related to Fund’s Class D Shares. These amounts are disclosed as “Other transfer agent fees and expenses” on the Statement of Operations.
Under distribution and shareholder servicing plans (the “Plans”) adopted in accordance with Rule 12b-1 under the 1940 Act, the Fund pays the Trust’s distributor, the Distributor, a wholly-owned subsidiary of the Adviser, a fee for the sale and distribution and/or shareholder servicing of the shares based on the average daily net assets for each share class at an annual rate of up to 0.25% for Class A Shares, up to 1.00% for Class C Shares, of up to 0.50% of the Class R Shares' average daily net assets, and up to 0.25% for Class S Shares. Under the terms of the Plans, the Trust is authorized to make payments to the Distributor for remittance to retirement plan service providers, broker-dealers, bank trust departments, financial advisors, and other financial intermediaries, as compensation for distribution and/or shareholder services performed by such entities for their customers who are investors in the Fund. These amounts are disclosed as “12b-1 Distribution and shareholder servicing fees” on the Statement of Operations.
Class A Shares include a 5.75% upfront sales charge of the offering price of the Fund. The sales charge is allocated between the Distributor and financial intermediaries. During the period ended March 31, 2023, the Distributor retained upfront sales charges of $4,730.
A contingent deferred sales charge (“CDSC”) of 1.00% will be deducted with respect to Class A Shares purchased without a sales load and redeemed within 12 months of purchase, unless waived. Any applicable CDSC will be 1.00% of the lesser of the original purchase price or the value of the redemption of the Class A Shares redeemed. There were no CDSCs paid by redeeming shareholders of Class A Shares to the Distributor during the period ended March 31, 2023.
A CDSC of 1.00% will be deducted with respect to Class C Shares redeemed within 12 months of purchase, unless waived. Any applicable CDSC will be 1.00% of the lesser of the original purchase price or the value of the redemption of the Class C Shares redeemed. During the period ended March 31, 2023, redeeming shareholders of Class C Shares paid CDSCs of $46.
The Board of Trustees has adopted a deferred compensation plan (the “Deferred Plan”) for independent Trustees to elect to defer receipt of all or a portion of the annual compensation they are entitled to receive from the Fund. All deferred fees are credited to an account established in the name of the Trustees. The amounts credited to the account then increase or decrease, as the case may be, in accordance with the performance of one or more of the Janus Henderson funds that are selected by the Trustees. The account balance continues to fluctuate in accordance with the performance of the selected fund or funds until final payment of all amounts are credited to the account. The fluctuation of the account balance is recorded by the Fund as unrealized appreciation/(depreciation) and is included as of March 31, 2023 on the Statement of Assets and Liabilities in the asset, “Trustees’ deferred compensation,” and liability, “Trustees’ deferred compensation fees.” Additionally, the recorded unrealized appreciation/(depreciation) is included in “Total distributable earnings (loss)” on the Statement of Assets and Liabilities. Deferred compensation expenses for the period ended March 31, 2023 are included in “Trustees’ fees and expenses” on the Statement of Operations. Trustees are allowed to change their designation of mutual funds from time to time. Amounts will be deferred until distributed in
Janus Henderson Triton Fund
Notes to Financial Statements (unaudited)
accordance with the Deferred Plan. Deferred fees of $205,688 were paid by the Trust to the Trustees under the Deferred Plan during the period ended March 31, 2023.
Pursuant to the provisions of the 1940 Act and related rules, the Fund may participate in an affiliated or non-affiliated cash sweep program. In the cash sweep program, uninvested cash balances of the Fund may be used to purchase shares of affiliated or non-affiliated money market funds or cash management pooled investment vehicles that operate as money market funds. The Fund is eligible to participate in the cash sweep program (the “Investing Funds”). The Adviser has an inherent conflict of interest because of its fiduciary duties to the affiliated money market funds or cash management pooled investment vehicles and the Investing Funds. Janus Henderson Cash Liquidity Fund LLC (the “Sweep Vehicle”) is an affiliated unregistered cash management pooled investment vehicle that invests primarily in highly-rated short-term fixed-income securities. The Sweep Vehicle operates pursuant to the provisions of the 1940 Act that govern the operation of money market funds and prices its shares at NAV reflecting market-based values of its portfolio securities (i.e., a “floating” NAV) rounded to the fourth decimal place (e.g., $1.0000). The Sweep Vehicle is permitted to impose a liquidity fee (of up to 2%) on redemptions from the Sweep Vehicle or a redemption gate that temporarily suspends redemptions from the Sweep Vehicle for up to 10 business days during a 90 day period. There are no restrictions on the Fund's ability to withdraw investments from the Sweep Vehicle at will, and there are no unfunded capital commitments due from the Fund to the Sweep Vehicle. The Sweep Vehicle does not charge any management fee, sales charge or service fee.
Any purchases and sales, realized gains/losses and recorded dividends from affiliated investments during the period ended March 31, 2023 can be found in the “Schedules of Affiliated Investments” located in the Schedule of Investments.
The Fund is permitted to purchase or sell securities (“cross-trade”) between itself and other funds or accounts managed by the Adviser in accordance with Rule 17a-7 under the Investment Company Act of 1940 (“Rule 17a-7”), when the transaction is consistent with the investment objectives and policies of the Fund and in accordance with the Internal Cross Trade Procedures adopted by the Trust’s Board of Trustees. These procedures have been designed to ensure that any cross-trade of securities by the Fund from or to another fund or account that is or could be considered an affiliate of the Fund under certain limited circumstances by virtue of having a common investment adviser, common Officer, or common Trustee complies with Rule 17a-7. Under these procedures, each cross-trade is effected at the current market price to save costs where allowed. During the period ended March 31, 2023, the Fund engaged in cross trades amounting to $6,975,690 in sales, resulting in a net realized loss of $219,956. The net realized loss is included within the “Net Realized Gain/(Loss) on Investments” section of the Fund’s Statement of Operations.
5. Federal Income Tax
Income and capital gains distributions are determined in accordance with income tax regulations that may differ from US GAAP. These differences are due to differing treatments for items such as net short-term gains, deferral of wash sale losses, foreign currency transactions, net investment losses, and capital loss carryovers.
The Fund has elected to treat gains and losses on forward foreign currency contracts as capital gains and losses, if applicable. Other foreign currency gains and losses on debt instruments are treated as ordinary income for federal income tax purposes pursuant to Section 988 of the Internal Revenue Code.
The aggregate cost of investments and the composition of unrealized appreciation and depreciation of investment securities for federal income tax purposes as of March 31, 2023 are noted below. The primary difference between book and tax appreciation or depreciation of investments are wash sale loss deferrals and investments in partnerships.
| | | | |
Federal Tax Cost | Unrealized
Appreciation | Unrealized
(Depreciation) | Net Tax Appreciation/
(Depreciation) |
$5,007,570,843 | $2,603,746,472 | $(442,612,240) | $2,161,134,232 |
Janus Henderson Triton Fund
Notes to Financial Statements (unaudited)
6. Capital Share Transactions
| | | | | | | |
| | | | | | |
| | Period ended March 31, 2023 | | Year ended September 30, 2022 |
| | Shares | Amount | | Shares | Amount |
| | | | | | | |
Class A Shares: | | | | | |
Shares sold | 1,180,688 | $ 28,360,847 | | 2,937,275 | $ 88,643,047 |
Reinvested dividends and distributions | 496,850 | 11,338,124 | | 1,630,945 | 50,477,762 |
Shares repurchased | (1,673,490) | (40,678,383) | | (4,672,637) | (142,581,472) |
Net Increase/(Decrease) | 4,048 | $ (979,412) | | (104,417) | $ (3,460,663) |
Class C Shares: | | | | | |
Shares sold | 50,020 | $ 1,067,595 | | 41,904 | $ 1,116,254 |
Reinvested dividends and distributions | 66,657 | 1,311,143 | | 315,522 | 8,538,022 |
Shares repurchased | (295,031) | (6,207,272) | | (855,073) | (22,983,703) |
Net Increase/(Decrease) | (178,354) | $ (3,828,534) | | (497,647) | $ (13,329,427) |
Class D Shares: | | | | | |
Shares sold | 514,447 | $ 13,307,066 | | 1,135,387 | $ 34,665,655 |
Reinvested dividends and distributions | 2,153,271 | 51,764,626 | | 6,559,596 | 212,530,907 |
Shares repurchased | (1,786,720) | (45,835,541) | | (4,287,428) | (133,860,117) |
Net Increase/(Decrease) | 880,998 | $ 19,236,151 | | 3,407,555 | $ 113,336,445 |
Class I Shares: | | | | | |
Shares sold | 3,954,179 | $ 103,105,068 | | 5,914,164 | $ 184,023,211 |
Reinvested dividends and distributions | 2,549,500 | 62,003,849 | | 9,090,129 | 297,610,830 |
Shares repurchased | (12,679,313) | (331,575,543) | | (19,540,591) | (632,602,646) |
Net Increase/(Decrease) | (6,175,634) | $(166,466,626) | | (4,536,298) | $ (150,968,605) |
Class N Shares: | | | | | |
Shares sold | 8,449,033 | $ 221,976,941 | | 16,856,775 | $ 530,171,185 |
Reinvested dividends and distributions | 5,765,645 | 141,834,865 | | 20,501,639 | 677,579,161 |
Shares repurchased | (13,438,758) | (353,567,869) | | (45,586,136) | (1,456,577,889) |
Net Increase/(Decrease) | 775,920 | $ 10,243,937 | | (8,227,722) | $ (248,827,543) |
Class R Shares: | | | | | |
Shares sold | 429,854 | $ 9,926,473 | | 1,063,048 | $ 29,759,479 |
Reinvested dividends and distributions | 599,036 | 12,861,310 | | 1,823,751 | 53,454,135 |
Shares repurchased | (942,007) | (21,739,334) | | (2,191,161) | (61,705,040) |
Net Increase/(Decrease) | 86,883 | $ 1,048,449 | | 695,638 | $ 21,508,574 |
Class S Shares: | | | | | |
Shares sold | 503,604 | $ 12,086,629 | | 1,423,695 | $ 42,111,779 |
Reinvested dividends and distributions | 675,912 | 15,174,226 | | 2,334,571 | 71,181,074 |
Shares repurchased | (1,215,917) | (29,270,823) | | (5,331,144) | (165,805,834) |
Net Increase/(Decrease) | (36,401) | $ (2,009,968) | | (1,572,878) | $ (52,512,981) |
Class T Shares: | | | | | |
Shares sold | 1,679,136 | $ 42,390,139 | | 4,993,809 | $ 146,578,935 |
Reinvested dividends and distributions | 4,090,248 | 96,652,553 | | 13,871,334 | 442,634,268 |
Shares repurchased | (8,509,397) | (214,380,642) | | (19,713,824) | (617,727,176) |
Net Increase/(Decrease) | (2,740,013) | $ (75,337,950) | | (848,681) | $ (28,513,973) |
7. Purchases and Sales of Investment Securities
For the period ended March 31, 2023, the aggregate cost of purchases and proceeds from sales of investment securities (excluding any short-term securities, short-term options contracts, TBAs, and in-kind transactions, as applicable) was as follows:
| | | | |
Purchases of
Securities | Proceeds from Sales
of Securities | Purchases of Long-
Term U.S. Government
Obligations | Proceeds from Sales
of Long-Term U.S.
Government Obligations |
$626,880,743 | $1,419,596,088 | $ - | $ - |
Janus Henderson Triton Fund
Notes to Financial Statements (unaudited)
8. Recent Accounting Pronouncements
The FASB issued Accounting Standards Update 2022-03: Fair Value Measurement of Equity Securities Subject to Contractual Sale Restrictions (“ASU 2022-03”) in June 2022. The new guidance in the ASU clarifies existing guidance in ASC 820 related to the fair value measurement of an equity security subject to contractual sale restrictions with the intent to reduce diversity in interpretation. Under the guidance, a contractual restriction on the sale of an equity security would not be considered when measuring fair value as such restriction is not treated as part of the equity security’s unit of account. The amendments would be applied prospectively on or after adoption date to equity securities with a contract containing a sale restriction that is executed or modified after such date. The effective date set by the FASB is December 15, 2023, with early adoption permitted. The Adviser is currently evaluating whether to early adopt and does not anticipate it to have a material impact on the Fund.
9. Subsequent Event
Management has evaluated whether any events or transactions occurred subsequent to March 31, 2023 and through the date of issuance of the Fund’s financial statements and determined that there were no material events or transactions that would require recognition or disclosure in the Fund’s financial statements.
Janus Henderson Triton Fund
Additional Information (unaudited)
Proxy Voting Policies and Voting Record
A description of the policies and procedures that the Fund uses to determine how to vote proxies relating to its portfolio securities is available without charge: (i) upon request, by calling 1-800-525-1093; (ii) on the Fund’s website at janushenderson.com/proxyvoting; and (iii) on the SEC’s website at http://www.sec.gov. Additionally, information regarding the Fund’s proxy voting record for the most recent twelve-month period ended June 30 is also available, free of charge, through janushenderson.com/proxyvoting and from the SEC’s website at http://www.sec.gov.
Full Holdings
The Fund files its complete portfolio holdings (schedule of investments) with the SEC as an exhibit to Form N-PORT within 60 days of the end of the first and third fiscal quarters, and in the annual report and semiannual report to shareholders. The Fund’s Form N-PORT filings and annual and semiannual reports: (i) are available on the SEC’s website at http://www.sec.gov; and (ii) are available without charge, upon request, by calling a Janus Henderson representative at 1-877-335-2687 (toll free) (or 1-800-525-3713 if you hold Class D Shares). Portfolio holdings consisting of at least the names of the holdings are generally available on a monthly basis with a 30-day lag under Full Holdings for the Fund at janushenderson.com/info (or janushenderson.com/reports if you hold Class D Shares).
APPROVAL OF ADVISORY AGREEMENTS DURING THE PERIOD
The Trustees of Janus Aspen Series, each of whom serves as an “independent” Trustee (the “Trustees”), oversee the management of each portfolio of Janus Aspen Series (each, a “VIT Portfolio,” and collectively, the “VIT Portfolios”), as well as each fund of Janus Investment Fund (each, a “Fund,” and collectively, the “Funds” and together with the VIT Portfolios, the “Janus Henderson Funds,” and each, a “Janus Henderson Fund”). As required by law, the Trustees determine annually whether to continue the investment advisory agreement for each Janus Henderson Fund.
In connection with their most recent consideration of those agreements for each Janus Henderson Fund, the Trustees received and reviewed information provided by Janus Henderson Investors US LLC (the “Adviser”) in response to requests of the Trustees and their independent legal counsel. They also received and reviewed information and analysis provided by, and in response to requests of, their independent fee consultant. Throughout their consideration of the agreements, the Trustees were advised by their independent legal counsel. The Trustees met with management to consider the agreements, and also met separately in executive session with their independent legal counsel and their independent fee consultant.
At meetings held on November 9-10, 2022 and December 13-14, 2022, the Trustees evaluated the information provided by the Adviser and the independent fee consultant, as well as other information provided by the Adviser and the independent fee consultant during the year. Following such evaluation, the Trustees determined that the overall arrangements between each Janus Henderson Fund and the Adviser were fair and reasonable in light of the nature, extent, and quality of the services provided by the Adviser and its affiliates, the fees charged for those services, and other matters that the Trustees considered relevant in the exercise of their business judgment, and unanimously approved the continuation of the investment advisory agreement for each Janus Henderson Fund for the period from February 1, 2023 through February 1, 2024, subject to earlier termination as provided for in each agreement.
In considering the continuation of those agreements, the Trustees reviewed and analyzed various factors that they determined were relevant, including the factors described below, none of which by itself was considered dispositive. However, the material factors and conclusions that formed the basis for the Trustees’ determination to approve the continuation of the agreements are discussed separately below. Also included is a summary of the independent fee consultant’s conclusions and opinions that arose during, and were included as part of, the Trustees’ consideration of the agreements. “Management fees,” as used herein, reflect actual annual advisory fees and, for the purpose of peer comparisons any administration fees (excluding out of pocket costs), net of any waivers, paid by a fund as a percentage of average net assets.
Nature, Extent and Quality of Services
The Trustees reviewed the nature, extent, and quality of the services provided by the Adviser to the Janus Henderson Funds, taking into account the investment objective, strategies, and policies of each Janus Henderson Fund, and the knowledge the Trustees gained from their regular meetings with management on at least a quarterly basis and their ongoing review of information related to the Janus Henderson Funds. In addition, the Trustees reviewed the resources and key personnel of the Adviser, particularly noting those employees who provide investment and risk management services to the Janus Henderson Funds. The Trustees also considered other services provided to the Janus Henderson
Janus Henderson Triton Fund
Additional Information (unaudited)
Funds by the Adviser, such as managing the execution of portfolio transactions and the selection of broker-dealers for those transactions. The Trustees considered the Adviser’s role as administrator to the Janus Henderson Funds, noting that the Adviser generally does not receive a fee for its services as administrator, but is reimbursed for its out-of-pocket costs. The Trustees considered the role of the Adviser in monitoring adherence to the Janus Henderson Funds’ investment restrictions, providing support services for the Trustees and Trustee committees, and overseeing communications with Janus Henderson Fund shareholders and the activities of other service providers, including monitoring compliance with various policies and procedures of the Janus Henderson Funds and with applicable securities laws and regulations.
In this regard, the independent fee consultant noted that the Adviser provides a number of different services for the Janus Henderson Funds and their shareholders, ranging from investment management services to various other servicing functions, and that, in its view, the Adviser is a capable provider of those services. The independent fee consultant also provided its belief that the Adviser has developed a number of institutional competitive advantages that should enable it to provide superior investment and service performance over the long term.
The Trustees concluded that the nature, extent, and quality of the services provided by the Adviser to each Janus Henderson Fund were appropriate and consistent with the terms of the respective advisory agreements, and that, taking into account steps taken to address those Janus Henderson Funds whose performance lagged that of their peers for certain periods, the Janus Henderson Funds were likely to benefit from the continued provision of those services. They also concluded that the Adviser had sufficient personnel, with the appropriate education and experience, to serve the Janus Henderson Funds effectively and had demonstrated its ability to attract well-qualified personnel.
Performance of the Funds
The Trustees considered the performance results of each Janus Henderson Fund over various time periods. They noted that they considered Janus Henderson Fund performance data throughout the year, including periodic meetings with each Janus Henderson Fund’s portfolio manager(s), and also reviewed information comparing each Janus Henderson Fund’s performance with the performance of comparable fund peer groups identified by Broadridge Financial Solutions, Inc. (“Broadridge”), an independent data provider, and with the Janus Henderson Fund’s benchmark index. In this regard, the independent fee consultant found that the overall Janus Henderson Funds’ performance has been reasonable, noting that: (i) for the 36 months ended May 31, 2022, approximately 38% of the Janus Henderson Funds were in the top two quartiles of their Broadridge peer groups; (ii) for the 36 months ended September 30, 2022, approximately 45% of the Janus Henderson Funds were in the top two quartiles of performance as reported by Morningstar, and (iii) for the 12 months ended September 30, 2022, approximately 55% of the Janus Henderson Funds were in the top two quartiles of performance as reported by Morningstar.
The Trustees considered the performance of each Janus Henderson Fund, noting that performance may vary by share class, and noted the following with respect to the Funds:
Asset Allocation Funds
· For Janus Henderson Global Allocation Fund – Conservative, the Trustees noted that the Fund’s performance was in the third Broadridge quartile for the 36 months ended May 31, 2022 and the bottom Broadridge quartile for the 12 months ended May 31, 2022. The Trustees noted the reasons for the Fund’s underperformance and the steps the Adviser had taken or was taking to improve performance.
· For Janus Henderson Global Allocation Fund – Growth, the Trustees noted that the Fund’s performance was in the bottom Broadridge quartile for the 36 months ended May 31, 2022 and the bottom Broadridge quartile for the 12 months ended May 31, 2022. The Trustees noted the reasons for the Fund’s underperformance and the steps the Adviser had taken or was taking to improve performance.
· For Janus Henderson Global Allocation Fund – Moderate, the Trustees noted that the Fund’s performance was in the bottom Broadridge quartile for the 36 months ended May 31, 2022 and the bottom Broadridge quartile for the 12 months ended May 31, 2022. The Trustees noted the reasons for the Fund’s underperformance and the steps the Adviser had taken or was taking to improve performance.
Fixed-Income Funds
· For Janus Henderson Absolute Return Income Opportunities Fund, the Trustees noted that the Fund’s performance was in the third Broadridge quartile for the 36 months ended May 31, 2022 and the first Broadridge quartile for the 12 months ended May 31, 2022. The Trustees noted the reasons for the Fund’s underperformance,
Janus Henderson Triton Fund
Additional Information (unaudited)
the steps the Adviser had taken or was taking to improve performance, and that the performance trend was improving.
· For Janus Developed World Bond Fund, the Trustees noted that the Fund’s performance was in the bottom Broadridge quartile for the 36 months ended May 31, 2022 and the bottom Broadridge quartile for the 12 months ended May 31, 2022. The Trustees noted the reasons for the Fund’s underperformance and the steps the Adviser had taken or was taking to improve performance.
· For Janus Henderson Flexible Bond Fund, the Trustees noted that the Fund’s performance was in the first Broadridge quartile for the 36 months ended May 31, 2022 and the second Broadridge quartile for the 12 months ended May 31, 2022.
· For Janus Henderson Global Bond Fund, the Trustees noted that the Fund’s performance was in the third Broadridge quartile for the 36 months ended May 31, 2022 and the bottom Broadridge quartile for the 12 months ended May 31, 2022. The Trustees noted the reasons for the Fund’s underperformance and the steps the Adviser had taken or was taking to improve performance.
· For Janus Henderson High-Yield Fund, the Trustees noted that the Fund’s performance was in the third Broadridge quartile for the 36 months ended May 31, 2022 and the bottom Broadridge quartile for the 12 months ended May 31, 2022. The Trustees noted the reasons for the Fund’s underperformance and the steps the Adviser had taken or was taking to improve performance.
· For Janus Henderson Multi-Sector Income Fund, the Trustees noted that the Fund’s performance was in the second Broadridge quartile for the 36 months ended May 31, 2022 and the third Broadridge quartile for the 12 months ended May 31, 2022.
· For Janus Henderson Short Duration Flexible Bond Fund, the Trustees noted that the Fund’s performance was in the third Broadridge quartile for the 36 months ended May 31, 2022 and the bottom Broadridge quartile for the 12 months ended May 31, 2022. The Trustees noted the reasons for the Fund’s underperformance and the steps the Adviser had taken or was taking to improve performance.
Global and International Equity Funds
· For Janus Henderson Asia Equity Fund, the Trustees noted that the Fund’s performance was in the third Broadridge quartile for the 36 months ended May 31, 2022 and the third Broadridge quartile for the 12 months ended May 31, 2022. The Trustees noted the reasons for the Fund’s underperformance, while also noting that the Fund has a performance fee structure that results in lower management fees during periods of underperformance, and the steps the Adviser had taken or was taking to improve performance.
· For Janus Henderson Emerging Markets Fund, the Trustees noted that the Fund’s performance was in the third Broadridge quartile for the 36 months ended May 31, 2022 and the third Broadridge quartile for the 12 months ended May 31, 2022. The Trustees noted the reasons for the Fund’s underperformance and the steps the Adviser had taken or was taking to improve performance.
· For Janus Henderson European Focus Fund, the Trustees noted that the Fund’s performance was in the first Broadridge quartile for the 36 months ended May 31, 2022 and the second Broadridge quartile for the 12 months ended May 31, 2022.
· For Janus Henderson Global Equity Income Fund, the Trustees noted that the Fund’s performance was in the third Broadridge quartile for the 36 months ended May 31, 2022 and the first Broadridge quartile for the 12 months ended May 31, 2022. The Trustees noted the reasons for the Fund’s underperformance, the steps the Adviser had taken or was taking to improve performance, and that the performance trend was improving.
· For Janus Henderson Global Life Sciences Fund, the Trustees noted that the Fund’s performance was in the third Broadridge quartile for the 36 months ended May 31, 2022 and the second Broadridge quartile for the 12 months ended May 31, 2022. The Trustees noted the reasons for the Fund’s underperformance, the steps the Adviser had taken or was taking to improve performance, and that the performance trend was improving.
· For Janus Henderson Global Sustainable Equity Fund, the Trustees noted that the Fund’s performance was in the second Broadridge quartile for the 12 months ended May 31, 2022. The Trustees noted that 36 month-end performance was not yet available.
Janus Henderson Triton Fund
Additional Information (unaudited)
· For Janus Henderson Global Real Estate Fund, the Trustees noted that the Fund’s performance was in the second Broadridge quartile for the 36 months ended May 31, 2022 and the bottom Broadridge quartile for the 12 months ended May 31, 2022.
· For Janus Henderson Global Research Fund, the Trustees noted that the Fund’s performance was in the second Broadridge quartile for the 36 months ended May 31, 2022 and the first Broadridge quartile for the 12 months ended May 31, 2022.
· For Janus Henderson Global Select Fund, the Trustees noted that the Fund’s performance was in the first Broadridge quartile for the 36 months ended May 31, 2022 and the first Broadridge quartile for the 12 months ended May 31, 2022.
· For Janus Henderson Global Technology and Innovation Fund, the Trustees noted that the Fund’s performance was in the second Broadridge quartile for the 36 months ended May 31, 2022 and the second Broadridge quartile for the 12 months ended May 31, 2022.
· For Janus Henderson International Opportunities Fund, the Trustees noted that the Fund’s performance was in the bottom Broadridge quartile for the 36 months ended May 31, 2022 and the third Broadridge quartile for the 12 months ended May 31, 2022. The Trustees noted the reasons for the Fund’s underperformance and the steps the Adviser had taken or was taking to improve performance.
· For Janus Henderson Overseas Fund, the Trustees noted that the Fund’s performance was in the first Broadridge quartile for the 36 months ended May 31, 2022 and the first Broadridge quartile for the 12 months ended May 31, 2022.
· For Janus Henderson Responsible International Dividend Fund (formerly the Janus Henderson Dividend & Income Builder Fund), the Trustees noted that the Fund’s performance was in the bottom Broadridge quartile for the 36 months ended May 31, 2022 and the bottom Broadridge quartile for the 12 months ended May 31, 2022. The Trustees noted the reasons for the Fund’s underperformance and the steps the Adviser had taken or was taking to improve performance.
Money Market Funds
· For Janus Henderson Government Money Market Fund, the Trustees noted that the Fund’s performance was in the third Broadridge quartile for the 36 months ended May 31, 2022 and the bottom Broadridge quartile for the 12 months ended May 31, 2022. The Trustees noted the reasons for the Fund’s underperformance and the steps the Adviser had taken or was taking to improve performance.
· For Janus Henderson Money Market Fund, the Trustees noted that the Fund’s performance was in the third Broadridge quartile for the 36 months ended May 31, 2022 and the bottom Broadridge quartile for the 12 months ended May 31, 2022. The Trustees noted the reasons for the Fund’s underperformance and the steps the Adviser had taken or was taking to improve performance.
Multi-Asset Funds
· For Janus Henderson Adaptive Global Allocation Fund, the Trustees noted that the Fund’s performance was in bottom Broadridge quartile for the 36 months ended May 31, 2022 and the second Broadridge quartile for the 12 months ended May 31, 2022. The Trustees noted the reasons for the Fund’s underperformance, the steps the Adviser had taken or was taking to improve performance, and that the performance trend was improving.
· For Janus Henderson Balanced Fund, the Trustees noted that the Fund’s performance was in the first Broadridge quartile for the 36 months ended May 31, 2022 and the first Broadridge quartile for the 12 months ended May 31, 2022.
U.S. Equity Funds
· For Janus Henderson Adaptive Risk Managed U.S. Equity Fund, the Trustees noted that the Fund’s performance was in the bottom Broadridge quartile for the 36 months ended May 31, 2022 and the second Broadridge quartile for the 12 months ended May 31, 2022. The Trustees noted the reasons for the Fund’s underperformance, the steps the Adviser had taken or were taking to improve performance, and that the performance trend was improving.
Janus Henderson Triton Fund
Additional Information (unaudited)
· For Janus Henderson Contrarian Fund, the Trustees noted that the Fund’s performance was in the first Broadridge quartile for the 36 months ended May 31, 2022 and the bottom Broadridge quartile for the 12 months ended May 31, 2022.
· For Janus Henderson Enterprise Fund, the Trustees noted that the Fund’s performance was in the second Broadridge quartile for the 36 months ended May 31, 2022 and the first Broadridge quartile for the 12 months ended May 31, 2022.
· For Janus Henderson Forty Fund, the Trustees noted that the Fund’s performance was in the third Broadridge quartile for the 36 months ended May 31, 2022 and the bottom Broadridge quartile for the 12 months ended May 31, 2022. The Trustees noted the reasons for the Fund’s underperformance and the steps the Adviser had taken or was taking to improve performance.
· For Janus Henderson Growth and Income Fund, the Trustees noted that the Fund’s performance was in the bottom Broadridge quartile for the 36 months ended May 31, 2022 and the first Broadridge quartile for the 12 months ended May 31, 2022. The Trustees noted the reasons for the Fund’s underperformance, the steps the Adviser had taken or was taking to improve performance, and that the performance trend was improving.
· For Janus Henderson Mid Cap Value Fund, the Trustees noted that the Fund’s performance was in the bottom Broadridge quartile for the 36 months ended May 31, 2022 and the second Broadridge quartile for the 12 months ended May 31, 2022. The Trustees noted the reasons for the Fund’s underperformance, while also noting that the Fund has a performance fee structure that results in lower management fees during periods of underperformance, the steps the Adviser had taken or was taking to improve performance, and that the performance trend was improving.
· For Janus Henderson Research Fund, the Trustees noted that the Fund’s performance was in the third Broadridge quartile for the 36 months ended May 31, 2022 and the third Broadridge quartile for the 12 months ended May 31, 2022. The Trustees noted the reasons for the Fund’s underperformance, while also noting that the Fund has a performance fee structure that results in lower management fees during periods of underperformance and the steps the Adviser had taken or was taking to improve performance.
· For Janus Henderson Small Cap Value Fund, the Trustees noted that the Fund’s performance was in the bottom Broadridge quartile for the 36 months ended May 31, 2022 and the second Broadridge quartile for the 12 months ended May 31, 2022. The Trustees noted the reasons for the Fund’s underperformance, while also noting that the Fund has a performance fee structure that results in lower management fees during periods of underperformance, the steps the Adviser had taken or was taking to improve performance, and that the performance trend was improving.
· For Janus Henderson Small-Mid Cap Value Fund, the Trustees noted that the Fund’s performance was in the bottom Broadridge quartile for the 36 months ended May 31, 2022 and the second Broadridge quartile for the 12 months ended May 31, 2022. The Trustees noted the reasons for the Fund’s underperformance, while also noting that the Fund has a performance fee structure that results in lower management fees during periods of underperformance, the steps the Adviser had taken or was taking to improve performance, and that the performance trend is improving.
· For Janus Henderson Triton Fund, the Trustees noted that the Fund’s performance was in the bottom Broadridge quartile for the 36 months ended May 31, 2022 and the second Broadridge quartile for the 12 months ended May 31, 2022. The Trustees noted the reasons for the Fund’s underperformance, the steps the Adviser had taken or was taking to improve performance, and that the performance trend was improving.
· For Janus Henderson Venture Fund, the Trustees noted that the Fund’s performance was in the bottom Broadridge quartile for the 36 months ended May 31, 2022 and the second Broadridge quartile for the 12 months ended May 31, 2022. The Trustees noted the reasons for the Fund’s underperformance, the steps the Adviser had taken or was taking to improve performance, and that the performance trend was improving.
In consideration of each Janus Henderson Fund’s performance, the Trustees concluded that, taking into account the factors relevant to performance, as well as other considerations, including steps taken to improve performance, as applicable, the Janus Henderson Fund’s performance warranted continuation of such Janus Henderson Fund’s investment advisory agreement.
Janus Henderson Triton Fund
Additional Information (unaudited)
Costs of Services Provided
The Trustees examined information regarding the fees and expenses of each Janus Henderson Fund in comparison to similar information for other comparable funds as provided by Broadridge, an independent data provider. They also reviewed an analysis of that information provided by their independent fee consultant. The independent fee consultant provided its belief that the management fees charged by the Adviser to each of the Janus Henderson Funds under the current investment advisory and administration agreements are reasonable in relation to the services provided by the Adviser. The independent fee consultant found: (1) the total expenses and management fees of the Janus Henderson Funds to be reasonable relative to other comparable mutual funds; (2) the total expenses, on average, were 6% under the average total expenses of the respective Broadridge peer group; and (3) the management fees for the Janus Henderson Funds, on average, were 5% under the average management fees for the respective Broadridge peer group. The Trustees also considered the total expenses for each share class of each Janus Henderson Fund compared to the average total expenses for its Broadridge Expense Group and to average total expenses for its Broadridge Expense Universe.
For Janus Henderson Funds with three or more years of performance history, the independent fee consultant also performed a systematic “focus list” analysis of expenses which assessed fund fees in the context of fund performance being delivered. Based on this analysis, the independent fee consultant found that the combination of service quality/performance and expenses on these individual Janus Henderson Funds was reasonable in light of performance trends, performance histories, changes in portfolio management, relative average net asset levels, and the existence of performance fees, breakpoints, and/or expense waivers on such Janus Henderson Funds.
The Trustees considered the methodology used by the Adviser in determining compensation payable to portfolio managers, the competitive environment for investment management talent, and the competitive market for mutual funds in different distribution channels.
The Trustees also reviewed management fees charged by the Adviser to comparable separate account clients and to comparable non-affiliated funds subadvised by the Adviser (for which the Adviser provides only or primarily portfolio management services). Although in most instances subadvisory and separate account fee rates for various investment strategies were lower than management fee rates for Janus Henderson Funds having a similar strategy, the Trustees considered that the Adviser noted that, under the terms of the management agreements with the Janus Henderson Funds, the Adviser performs significant additional services for the Janus Henderson Funds that it does not provide to those other clients, including administration services, oversight of the Janus Henderson Funds’ other service providers, Trustee support, regulatory compliance and numerous other services, and that, in serving the Janus Henderson Funds, the Adviser assumes many legal risks and other costs that it does not assume in servicing its other clients. Moreover, the Trustees noted that the independent fee consultant found that: (1) the management fees the Adviser charges to the Janus Henderson Funds are reasonable in relation to the management fees the Adviser charges to funds subadvised by the Adviser and to the fees the Adviser charges to its institutional separate account clients; (2) these subadvised and institutional separate accounts have different service and infrastructure needs and operate in markets very different from the retail fund market; (3) Janus Henderson mutual fund investors enjoy reasonable fees relative to the fees charged in these other markets; and (4) as part of its 2022 review, 9 of 11 Janus Henderson Funds have lower management fees than similar funds subadvised by the Adviser. The Trustees noted that for the two Janus Henderson Funds that did not, management fees for each were under the average of its 15(c) peer group.
The Trustees considered the fees for each Janus Henderson Fund for its fiscal year ended in 2021 and noted the following with regard to each Janus Henderson Fund’s total expenses, net of applicable fee waivers (the Fund’s “total expenses”) as reflected in the comparative information provided by Broadridge:
Asset Allocation Funds
· For Janus Henderson Global Allocation Fund – Conservative, the Trustees noted that, although the Fund’s total expenses exceeded the peer group average for certain share classes, overall the Fund’s total expenses were reasonable. The Trustees also noted that the Adviser has contractually agreed to limit the Fund’s expenses.
· For Janus Henderson Global Allocation Fund – Growth, the Trustees noted that, although the Fund’s total expenses exceeded the peer group average for certain share classes, overall the Fund’s total expenses were reasonable. The Trustees also noted that the Adviser has contractually agreed to limit the Fund’s expenses, although this limit did not apply because the Fund’s total expenses as shown were below the applicable fee limit.
Janus Henderson Triton Fund
Additional Information (unaudited)
· For Janus Henderson Global Allocation Fund – Moderate, the Trustees noted that, although the Fund’s total expenses exceeded the peer group average for one share class, overall the Fund’s total expenses were reasonable. The Trustees also noted that the Adviser has contractually agreed to limit the Fund’s expenses.
Fixed-Income Funds
· For Janus Henderson Absolute Return Income Opportunities Fund, the Trustees noted that, although the Fund’s total expenses exceeded the peer group average for certain share classes, overall the Fund’s total expenses were reasonable. The Trustees also noted that the Adviser has contractually agreed to limit the Fund’s expenses.
· For Janus Henderson Developed World Bond Fund, the Trustees noted that, although the Fund’s total expenses exceeded the peer group average for one share class, overall the Fund’s total expenses were reasonable. The Trustees also noted that the Adviser has contractually agreed to limit the Fund’s expenses.
· For Janus Henderson Flexible Bond Fund, the Trustees noted that, although the Fund’s total expenses exceeded the peer group average for certain share classes, overall the Fund’s total expenses were reasonable. The Trustees also noted that the Adviser has contractually agreed to limit the Fund’s expenses, although this limit did not apply because the Fund’s total expenses as shown were below the applicable fee limit.
· For Janus Henderson Global Bond Fund, the Trustees noted that, although the Fund’s total expenses exceeded the peer group average for certain share classes, overall the Fund’s total expenses were reasonable. The Trustees also noted that the Adviser has contractually agreed to limit the Fund’s expenses.
· For Janus Henderson High-Yield Fund, the Trustees noted that, although the Fund’s total expenses exceeded the peer group average for certain share classes, overall the Fund’s total expenses were reasonable. The Trustees also noted that the Adviser has contractually agreed to limit the Fund’s expenses.
· For Janus Henderson Multi-Sector Income Fund, the Trustees noted that, although the Fund’s total expenses exceeded the peer group average for certain share classes, overall the Fund’s total expenses were reasonable. The Trustees also noted that the Adviser has contractually agreed to limit the Fund’s expenses.
· For Janus Henderson Short Duration Flexible Bond Fund, the Trustees noted that, although the Fund’s total expenses exceeded the peer group average for certain share classes, overall the Fund’s total expenses were reasonable. The Trustees also noted that the Adviser has contractually agreed to limit the Fund’s expenses.
Global and International Equity Funds
· For Janus Henderson Asia Equity Fund, the Trustees noted that, although the Fund’s total expenses exceeded the peer group average for certain share classes, overall the Fund’s total expenses were reasonable. The Trustees also noted that the Adviser has contractually agreed to limit the Fund’s expenses.
· For Janus Henderson Emerging Markets Fund, the Trustees noted that, although the Fund’s total expenses exceeded the peer group average for certain share classes, overall the Fund’s total expenses were reasonable. The Trustees also noted that the Adviser has contractually agreed to limit the Fund’s expenses.
· For Janus Henderson European Focus Fund, the Trustees noted that, although the Fund’s total expenses exceeded the peer group average for one share class, overall the Fund’s expenses were reasonable. The Trustees also noted that the Adviser has contractually agreed to limit the Fund’s expenses.
· For Janus Henderson Global Equity Income Fund, the Trustees noted that, although the Fund’s total expenses exceeded the peer group average for one share class, overall the Fund’s total expenses were reasonable. The Trustees also noted that the Adviser has contractually agreed to limit the Fund’s expenses, although this limit did not apply because the Fund’s total expenses as shown were below the applicable fee limit.
· For Janus Henderson Global Life Sciences Fund, the Trustees noted that the Fund’s total expenses were below the peer group average for all share classes.
· For Janus Henderson Global Real Estate Fund, the Trustees noted that, although the Fund’s total expenses exceeded the peer group average for certain share classes, overall the Fund’s total expenses were reasonable. The Trustees also noted that the Adviser has contractually agreed to limit the Fund’s expenses, although this limit did not apply because the Fund’s total expenses as shown were below the applicable fee limit.
Janus Henderson Triton Fund
Additional Information (unaudited)
· For Janus Henderson Global Research Fund, the Trustees noted that, although the Fund’s total expenses exceeded the peer group average for one share class, overall the Fund’s total expenses were reasonable. The Trustees also noted that the Adviser has contractually agreed to limit the Fund’s expenses, although this limit did not apply because the Fund’s total expenses as shown were below the applicable fee limit.
· For Janus Henderson Global Select Fund, the Trustees noted that, although the Fund’s total expenses exceeded the peer group average for certain share classes, overall the Fund’s total expenses were reasonable. The Trustees also noted that the Adviser has contractually agreed to limit the Fund’s expenses.
· For Janus Henderson Global Sustainable Equity Fund, the Trustees noted that, although the Fund’s total expenses exceeded the peer group average for certain share classes, overall the Fund’s expenses were reasonable. The Trustees also noted that the Adviser has contractually agreed to limit the Fund’s expenses.
· For Janus Henderson Global Technology and Innovation Fund, the Trustees noted that the Fund’s total expenses were below the peer group average for all share classes.
· For Janus Henderson International Opportunities Fund, the Trustees noted that, although the Fund’s total expenses exceeded the peer group average for certain share classes, overall the Fund’s expenses were reasonable. The Trustees also noted that the Adviser has contractually agreed to limit the Fund’s expenses.
· For Janus Henderson Overseas Fund, the Trustees noted that although the Fund’s total expenses exceeded the peer group average for certain share classes, overall the Fund’s total expenses were reasonable. The Trustees also noted that the Adviser has contractually agreed to limit the Fund’s expenses, although this limit did not apply because the Fund’s total expenses as shown were below the applicable fee limit.
· For Janus Henderson Responsible International Dividend Fund (formerly the Janus Henderson Dividend & Income Builder Fund), the Trustees noted that, although the Fund’s total expenses exceeded the peer group for one share class, overall the Fund’s total expenses were reasonable. The Trustees also noted that the Adviser has contractually agreed to limit the Fund’s expenses.
Money Market Funds
· For Janus Henderson Government Money Market Fund, the Trustees noted that the Fund’s total expenses were below the peer group average for all share classes.
· For Janus Henderson Money Market Fund, the Trustees noted that the Fund’s total expenses were below the peer group average for all share classes.
Multi-Asset Funds
· For Janus Henderson Adaptive Global Allocation Fund, the Trustees noted that, that the Fund’s total expenses were below the peer group average for all share classes.
· For Janus Henderson Balanced Fund, the Trustees noted that, although the Fund’s total expenses exceeded the peer group average for certain share classes, overall the Fund’s total expenses were reasonable. The Trustees also noted that the Adviser has contractually agreed to limit the Fund’s expenses, although this limit did not apply because the Fund’s total expenses as shown were below the applicable fee limit.
U.S. Equity Funds
· For Janus Henderson Adaptive Risk Managed U.S. Equity Fund, the Trustees noted that, although the Fund’s total expenses exceeded the peer group average for certain share classes, overall the Fund’s total expenses were reasonable. The Trustees also noted that the Adviser has contractually agreed to limit the Fund’s expenses, although this limit did not apply because the Fund’s total expenses as shown were below the applicable fee limit.
· For Janus Henderson Contrarian Fund, the Trustees noted that, although the Fund’s total expenses exceeded the peer group average for all share classes, overall the Fund’s total expenses were reasonable. The Trustees also noted that the Adviser had contractually agreed to limit the Fund’s expenses.
· For Janus Henderson Enterprise Fund, the Trustees noted that, although the Fund’s total expenses exceeded the peer group average for certain share classes, overall the Fund’s total expenses were reasonable. The Trustees also noted that the Adviser has contractually agreed to limit the Fund’s expenses, although this limit did not apply because the Fund’s total expenses as shown were below the applicable fee limit.
Janus Henderson Triton Fund
Additional Information (unaudited)
· For Janus Henderson Forty Fund, the Trustees noted that, although the Fund’s total expenses exceeded the peer group average for certain share classes, overall the Fund’s total expenses were reasonable. The Trustees also noted that the Adviser has contractually agreed to limit the Fund’s expenses, although this limit did not apply because the Fund’s total expenses as shown were below the applicable fee limit.
· For Janus Henderson Growth and Income Fund, the Trustees noted that, although the Fund’s total expenses exceeded the peer group average for certain share classes, overall the Fund’s total expenses were reasonable. The Trustees also noted that the Adviser has contractually agreed to limit the Fund’s expenses, although this limit did not apply because the Fund’s total expenses as shown were below the applicable fee limit.
· For Janus Henderson Mid Cap Value Fund, the Trustees noted that the Fund’s total expenses were below the peer group average for all share classes.
· For Janus Henderson Research Fund, the Trustees noted that, although the Fund’s total expenses exceeded the peer group average for certain share classes, overall the Fund’s total expenses were reasonable. The Trustees also noted that the Adviser has contractually agreed to limit the Fund’s expenses.
· For Janus Henderson Small Cap Value Fund, the Trustees noted that, although the Fund’s total expenses exceeded the peer group average for one share class, overall the Fund’s total expenses were reasonable. The Trustees also noted that the Adviser has contractually agreed to limit the Fund’s expenses, although this limit did not apply because the Fund’s total expenses as shown were below the applicable fee limit.
· For Janus Henderson Small-Mid Cap Value Fund, the Trustees noted that the Fund’s total expenses were below the peer group average for all share classes.
· For Janus Henderson Triton Fund, the Trustees noted that, although the Fund’s total expenses exceeded the peer group average for one share class, overall the Fund’s total expenses were reasonable. The Trustees also noted that the Adviser has contractually agreed to limit the Fund’s expenses, although this limit did not apply because the Fund’s total expenses as shown were below the applicable fee limit.
· For Janus Henderson Venture Fund, the Trustees noted that although the Fund’s total expenses exceeded the peer group average for one share class, overall the Fund’s total expenses were reasonable. The Trustees also noted that the Adviser has contractually agreed to limit the Fund’s expenses, although this limit did not apply because the Fund’s total expenses as shown were below the applicable fee limit.
The Trustees reviewed information on the overall profitability to the Adviser and its affiliates from their relationships with the Janus Henderson Funds, and considered profitability data of other publicly traded mutual fund advisers. The Trustees recognized that profitability comparisons among fund managers are difficult because of the variation in the type of comparative information that is publicly available, and the profitability of any fund manager is affected by numerous factors, including the organizational structure of the particular fund manager, differences in complex size, difference in product mix, difference in types of business (mutual fund, institutional and other), differences in the types of funds and other accounts it manages, possible other lines of business, the methodology for allocating expenses and the fund manager’s capital structure and cost of capital.
Additionally, the Trustees considered the estimated profitability to the Adviser from the investment management services it provided to each Janus Henderson Fund. In their review, the Trustees considered whether the Adviser receive adequate incentives and resources to manage the Janus Henderson Funds effectively. In reviewing profitability, the Trustees noted that the estimated profitability for an individual Janus Henderson Fund is necessarily a product of the allocation methodology utilized by the Adviser to allocate its expenses as part of the estimated profitability calculation. In this regard, the Trustees noted that the independent fee consultant found as part of its 2022 review that (1) the expense allocation methodology and rationales utilized by the Adviser were reasonable and (2) no clear correlation exists between expense allocations and operating margins. The Trustees also considered that the estimated profitability for an individual Janus Henderson Fund was influenced by a number of factors, including not only the allocation methodology selected, but also the presence of fee waivers and expense caps, and whether the Janus Henderson Fund’s investment management agreement contained breakpoints or a performance fee component. The Trustees determined, after taking into account these factors, among others, that the Adviser’s estimated profitability with respect to each Janus Henderson Fund was not unreasonable in relation to the services provided, and that the variation in the range of such estimated profitability among the Janus Henderson Funds was not a material factor in the Board’s approval of the reasonableness of any Janus Henderson Fund’s investment management fees.
Janus Henderson Triton Fund
Additional Information (unaudited)
The Trustees concluded that the management fees payable by each Janus Henderson Fund to the Adviser were reasonable in relation to the nature, extent, and quality of the services provided, taking into account the fees charged by other advisers for managing comparable mutual funds with similar strategies, the fees the Adviser charges to other clients, and, as applicable, the impact of fund performance on management fees payable by the Janus Henderson Funds. The Trustees also concluded that each Janus Henderson Fund’s total expenses were reasonable, taking into account the size of the Janus Henderson Fund, the quality of services provided by the Adviser, the investment performance of the Janus Henderson Fund, and any expense limitations agreed to or provided by the Adviser.
Economies of Scale
The Trustees considered information about the potential for the Adviser to realize economies of scale as the assets of the Janus Henderson Funds increase. They noted that their independent fee consultant published a report to the Trustees in June 2022 which provided its research and analysis into economies of scale. They also noted that, although many Janus Henderson Funds pay advisory fees at a fixed base rate as a percentage of net assets, without any breakpoints or performance fees, their independent fee consultant concluded that 75% of these Janus Henderson Funds’ have contractual management fees (gross of waivers) below their Broadridge Expense Group averages. The Trustees also noted the following from the independent fee consultant’s report: (1) that 31% of Janus Henderson Funds had management fee breakpoints in place whereby investors pay lower management fees as fund AUM increases; (2) that 29% of Janus Henderson Funds have low flat-rate fees and performance fees where the Adviser is incentivized to invest in resources which drive Janus Henderson Fund performance; and (3) that 39% of Janus Henderson Funds have low flat-rate fees versus peers where investors pay low fixed fees when the Janus Henderson Fund is small/midsized and higher fees when the Janus Henderson Fund grows in assets. The Trustees also noted that the Janus Henderson Funds share directly in economies of scale through the significant investments made by the Adviser and its affiliates related to services provided to the Funds and the lower charges of third-party service providers that are based in part on the combined scale of all of the Janus Henderson Funds.
The Trustees also considered the independent fee consultant’s conclusion that, given the limitations of various analytical approaches to economies of scale and their conflicting results, it is difficult to analytically confirm or deny the existence of economies of scale in the Janus Henderson complex. In this regard, the independent consultant concluded that (1) to the extent there were economies of scale at the Adviser, the Adviser’s general strategy of setting fixed management fees below peers appeared to share any such economies with investors even on smaller Janus Henderson Funds which have not yet achieved those economies and (2) by setting lower fixed fees from the start on these Janus Henderson Funds, the Adviser appeared to be investing to increase the likelihood that these Janus Henderson Funds will grow to a level to achieve any economies of scale that may exist. Further, the independent fee consultant provided its belief that Janus Henderson Fund investors are well-served by the fee levels and performance fee structures in place on the Janus Henderson Funds in light of any economies of scale that may be present at the Adviser.
Based on all of the information reviewed, including the recent and past research and analysis conducted by the Trustees’ independent fee consultant, the Trustees concluded that the current fee structure of each Janus Henderson Fund was reasonable and that the current rates of fees do reflect a sharing between the Adviser and the Janus Henderson Fund of any economies of scale that may be present at the current asset level of the Janus Henderson Fund.
Other Benefits to the Adviser
The Trustees also considered benefits that accrue to the Adviser and its affiliates from their relationships with the Janus Henderson Funds. They recognized that two affiliates of the Adviser separately serve the Janus Henderson Funds as transfer agent and distributor, respectively, and the transfer agent receives compensation directly from the non-money market Janus Henderson Funds for services provided, and that such compensation contributes to the overall profitability of the Adviser and its affiliates that results from their relationship with the Janus Henderson Funds. The Trustees also considered the Adviser’s past and proposed use of commissions paid by the Janus Henderson Funds on portfolio brokerage transactions to obtain proprietary and third-party research products and services benefiting the Janus Henderson Fund and/or other clients of the Adviser and/or the Adviser. The Trustees concluded that the Adviser’s use of these types of client commission arrangements to obtain proprietary and third-party research products and services was consistent with regulatory requirements and guidelines and was likely to benefit each Janus Henderson Fund. The Trustees also concluded that, other than the services provided by the Adviser and its affiliates pursuant to the agreements and the fees to be paid by each Janus Henderson Fund therefor, the Janus Henderson
Janus Henderson Triton Fund
Additional Information (unaudited)
Funds and the Adviser may potentially benefit from their relationship with each other in other ways. They concluded that the Adviser and its affiliates share directly in economies of scale through the lower charges of third-party service providers that are based in part on the combined scale of the Janus Henderson Funds and other clients serviced by the Adviser and its affiliates. They also concluded that the Adviser benefits from the receipt of research products and services acquired through commissions paid on portfolio transactions of the Janus Henderson Funds and that the Janus Henderson Funds benefit from the Adviser’s receipt of those products and services as well as research products and services acquired through commissions paid by other clients of the Adviser. They further concluded that the success of any Janus Henderson Fund could attract other business to the Adviser or other Janus Henderson Funds, and that the success of the Adviser could enhance the Adviser’s ability to serve the Janus Henderson Funds.
Janus Henderson Triton Fund
Liquidity Risk Management Program (unaudited)
Liquidity Risk Management Program
Rule 22e-4 under the Investment Company Act of 1940, as amended (the “Liquidity Rule”), requires open-end funds (but not money market funds) to adopt and implement a written liquidity risk management program (the “LRMP”) that is reasonably designed to assess and manage liquidity risk, which is the risk that a fund could not meet redemption requests without significant dilution of remaining investors’ interest in the fund. The Fund has implemented a LRMP, which incorporates the following elements: (i) assessment, management, and periodic review of liquidity risk; (ii) classification of portfolio holdings; (iii) the establishment and monitoring of a highly liquid investment minimum, as applicable; (iv) a 15% limitation on a Fund’s illiquid investments; (v) redemptions in-kind; and (vi) board oversight.
The Trustees of the Fund (the “Trustees”) have designated Janus Henderson Investors US LLC, the Fund’s investment adviser (the “Adviser”), as the Program Administrator for the LRMP responsible for administering the LRMP and carrying out the specific responsibilities of the LRMP. A working group comprised of various teams within the Adviser’s business is responsible for administering the LRMP and carrying out the specific responsibilities of different aspects of the LRMP (the “Liquidity Risk Working Group”). In assessing each Fund’s liquidity risk, the Liquidity Risk Working Group periodically considers, as relevant, factors including (i) the liquidity of a Fund’s portfolio investments during normal and reasonably foreseeable stressed conditions; (ii) whether a Fund’s investment strategy is appropriate for an open-end fund; (iii) the extent to which a Fund’s strategy involves a relatively concentrated portfolio or large positions in any issuer; (iv) a Fund’s use of borrowing for investment purposes; and (v) a Fund’s use of derivatives.
The Liquidity Rule requires the Trustees to review at least annually a written report provided by the Program Administrator that addresses the operation of the LRMP and assesses its adequacy and the effectiveness of its implementation, including, if applicable, the operation of the highly liquid investment minimum, and any material changes to the LRMP (the “Program Administrator Report”). At a meeting held on March 15, 2023, the Adviser provided the Program Administrator Report to the Trustees which covered the operation of the LRMP from January 1, 2022 through December 31, 2022 (the “Reporting Period”).
The Program Administrator Report discussed the operation and effectiveness of the LRMP during the Reporting Period. Among other things, the Program Administrator Report indicated that there were no material changes to the LRMP during the Reporting Period, although there were certain methodology adjustments implemented relating to a change in data provider. Additionally, the findings presented in the Program Administrator Report indicated that the LRMP operated adequately during the Reporting Period. These findings included that the Fund was able to meet redemptions during the normal course of business during the Reporting Period. The Program Administrator Report also stated that the Fund did not exceed the 15% limit on illiquid assets during the Reporting Period, that the Fund held primarily highly liquid assets, and was considered to be a primarily highly liquid fund during the Reporting Period. Also included among the Program Administrator Report’s findings was the determination that the Fund’s investment strategy remains appropriate for an open-end fund. In addition, the Adviser expressed its belief in the Program Administrator Report that the LRMP is reasonably designed and adequate to assess and manage the Fund’s liquidity risk, considering the Fund’s particular risks and circumstances, and includes policies and procedures reasonably designed to implement each required component of the Liquidity Rule.
There can be no assurance that the LRMP will achieve its objectives in the future. Please refer to your Fund’s prospectus for more information regarding the risks to which an investment in the Fund may be subject.
Janus Henderson Triton Fund
Useful Information About Your Fund Report (unaudited)
Performance Overviews
Performance overview graphs compare the performance of a hypothetical $10,000 investment in the Fund with one or more widely used market indices. When comparing the performance of the Fund with an index, keep in mind that market indices are not available for investment and do not reflect deduction of expenses.
Average annual total returns are quoted for a Fund with more than one year of performance history. Average annual total return is calculated by taking the growth or decline in value of an investment over a period of time, including reinvestment of dividends and distributions, then calculating the annual compounded percentage rate that would have produced the same result had the rate of growth been constant throughout the period. Average annual total return does not reflect the deduction of taxes that a shareholder would pay on Fund distributions or redemptions of Fund shares.
Cumulative total returns are quoted for a Fund with less than one year of performance history. Cumulative total return is the growth or decline in value of an investment over time, independent of the period of time involved. Cumulative total return does not reflect the deduction of taxes that a shareholder would pay on Fund distributions or redemptions of Fund shares.
Pursuant to federal securities rules, expense ratios shown in the performance chart reflect subsidized (if applicable) and unsubsidized ratios. The total annual fund operating expenses ratio is gross of any fee waivers, reflecting the Fund’s unsubsidized expense ratio. The net annual fund operating expenses ratio (if applicable) includes contractual waivers of the Adviser and reflects the Fund’s subsidized expense ratio. Ratios may be higher or lower than those shown in the “Financial Highlights” in this report.
Schedule of Investments
Following the performance overview section is the Fund’s Schedule of Investments. This schedule reports the types of securities held in the Fund on the last day of the reporting period. Securities are usually listed by type (common stock, corporate bonds, U.S. Government obligations, etc.) and by industry classification (banking, communications, insurance, etc.). Holdings are subject to change without notice.
The value of each security is quoted as of the last day of the reporting period. The value of securities denominated in foreign currencies is converted into U.S. dollars.
If the Fund invests in foreign securities, it will also provide a summary of investments by country. This summary reports the Fund exposure to different countries by providing the percentage of securities invested in each country. The country of each security represents the country of risk. A company may be allocated to a country based on other factors such as location of the company’s principal office, the location of the principal trading market for the company’s securities, or the country where a majority of the company’s revenues are derived. The Fund’s Schedule of Investments relies upon the industry group and country classifications published by Bloomberg and/or MSCI Inc.
Tables listing details of individual forward currency contracts, futures, written options, swaptions, and swaps follow the Fund’s Schedule of Investments (if applicable).
Statement of Assets and Liabilities
This statement is often referred to as the “balance sheet.” It lists the assets and liabilities of the Fund on the last day of the reporting period.
The Fund’s assets are calculated by adding the value of the securities owned, the receivable for securities sold but not yet settled, the receivable for dividends declared but not yet received on securities owned, and the receivable for Fund shares sold to investors but not yet settled. The Fund’s liabilities include payables for securities purchased but not yet settled, Fund shares redeemed but not yet paid, and expenses owed but not yet paid. Additionally, there may be other assets and liabilities such as unrealized gain or loss on forward currency contracts.
The section entitled “Net Assets Consist of” breaks down the components of the Fund’s net assets. Because the Fund must distribute substantially all earnings, you will notice that a significant portion of net assets is shareholder capital.
The last section of this statement reports the net asset value (“NAV”) per share on the last day of the reporting period. The NAV is calculated by dividing the Fund’s net assets for each share class (assets minus liabilities) by the number of shares outstanding.
Janus Henderson Triton Fund
Useful Information About Your Fund Report (unaudited)
Statement of Operations
This statement details the Fund’s income, expenses, realized gains and losses on securities and currency transactions, and changes in unrealized appreciation or depreciation of Fund holdings.
The first section in this statement, entitled “Investment Income,” reports the dividends earned from securities and interest earned from interest-bearing securities in the Fund.
The next section reports the expenses incurred by the Fund, including the advisory fee paid to the investment adviser, transfer agent fees and expenses, and printing and postage for mailing statements, financial reports and prospectuses. Expense offsets and expense reimbursements, if any, are also shown.
The last section lists the amounts of realized gains or losses from investment and foreign currency transactions, and changes in unrealized appreciation or depreciation of investments and foreign currency-denominated assets and liabilities. The Fund will realize a gain (or loss) when it sells its position in a particular security. A change in unrealized gain (or loss) refers to the change in net appreciation or depreciation of the Fund during the reporting period. “Net Realized and Unrealized Gain/(Loss) on Investments” is affected both by changes in the market value of Fund holdings and by gains (or losses) realized during the reporting period.
Statements of Changes in Net Assets
These statements report the increase or decrease in the Fund’s net assets during the reporting period. Changes in the Fund’s net assets are attributable to investment operations, dividends and distributions to investors, and capital share transactions. This is important to investors because it shows exactly what caused the Fund’s net asset size to change during the period.
The first section summarizes the information from the Statement of Operations regarding changes in net assets due to the Fund’s investment operations. The Fund’s net assets may also change as a result of dividend and capital gains distributions to investors. If investors receive their dividends and/or distributions in cash, money is taken out of the Fund to pay the dividend and/or distribution. If investors reinvest their dividends and/or distributions, the Fund’s net assets will not be affected.
The reinvestment of dividends and distributions is included under “Capital Share Transactions.” “Capital Shares” refers to the money investors contribute to the Fund through purchases or withdrawals via redemptions. The Fund’s net assets will increase and decrease in value as investors purchase and redeem shares from the Fund.
Financial Highlights
This schedule provides a per-share breakdown of the components that affect the Fund’s NAV for current and past reporting periods as well as total return, asset size, ratios, and portfolio turnover rate.
The first line in the table reflects the NAV per share at the beginning of the reporting period. The next line reports the net investment income/(loss) per share. Following is the per share total of net gains/(losses), realized and unrealized. Per share dividends and distributions to investors are then subtracted to arrive at the NAV per share at the end of the period. The next line reflects the total return for the period. The total return may include adjustments in accordance with generally accepted accounting principles required at the period end for financial reporting purposes. As a result, the total return may differ from the total return reflected for individual shareholder transactions. Also included are ratios of expenses and net investment income to average net assets.
The Fund’s expenses may be reduced through expense offsets and expense reimbursements. The ratios shown reflect expenses before and after any such offsets and reimbursements.
The ratio of net investment income/(loss) summarizes the income earned less expenses, divided by the average net assets of the Fund during the reporting period. Do not confuse this ratio with the Fund’s yield. The net investment income ratio is not a true measure of the Fund’s yield because it does not take into account the dividends distributed to the Fund’s investors.
The next figure is the portfolio turnover rate, which measures the buying and selling activity in the Fund. Portfolio turnover is affected by market conditions, changes in the asset size of the Fund, fluctuating volume of shareholder purchase and redemption orders, the nature of the Fund’s investments, and the investment style and/or outlook of the portfolio manager(s) and/or investment personnel. A 100% rate implies that an amount equal to the value of the entire portfolio was replaced once during the fiscal year; a 50% rate means that an amount equal to the value of half the
Janus Henderson Triton Fund
Useful Information About Your Fund Report (unaudited)
portfolio is traded in a year; and a 200% rate means that an amount equal to the value of the entire portfolio is traded every six months.
| | | | | | | | |
| | | | | |

| | | | |
This report is submitted for the general information of shareholders of the Fund. It is not an offer or solicitation for the Fund and is not authorized for distribution to prospective investors unless preceded or accompanied by an effective prospectus. |
Janus Henderson is a trademark of Janus Henderson Group plc or one of its subsidiaries. © Janus Henderson Group plc. Janus Henderson Group is the ultimate parent of Janus Henderson Distributors US LLC. Janus Henderson Distributors US LLC |
| | | | 125-24-93054 05-23 |
| | | | |
| | | |
| | | SEMIANNUAL REPORT March 31, 2023 |
| | |
| | Janus Henderson U.S. Dividend Income Fund |
| | |
| | Janus Investment Fund |
| |
| | | HIGHLIGHTS · Investment strategy behind your fund · Fund performance, characteristics
and holdings |
Table of Contents
Janus Henderson U.S. Dividend Income Fund
| | | | | | |
| | | | | | 
Jeremiah Buckley portfolio manager |
| | | |
Janus Henderson U.S. Dividend Income Fund (unaudited)
Fund At A Glance
March 31, 2023
| | | | | | | | | | |
| | | | | | | | | |
| | | | | | | | | |
| | | | | | | | | |
| 5 Top Contributors - Holdings | 5 Top Detractors - Holdings |
| | Average
Weight | | Relative
Contribution | | | Average
Weight | | Relative
Contribution |
| CME Group Inc | 3.23% | | 0.39% | | Travelers Cos Inc | 2.43% | | -0.21% |
| Texas Instruments Inc | 3.88% | | 0.37% | | ConocoPhillips | 2.12% | | -0.20% |
| Interpublic Group of Cos Inc | 2.83% | | 0.35% | | International Business Machines Corp | 2.93% | | -0.20% |
| United Parcel Service Inc | 3.31% | | 0.32% | | Goldman Sachs Group Inc | 3.34% | | -0.20% |
| Illinois Tool Works Inc | 2.38% | | 0.23% | | Air Products & Chemicals Inc | 2.15% | | -0.18% |
| | | | | | | |
| 5 Top Contributors - Sectors* | | | | | |
| | | Relative | | Fund | Russell 1000 Value Index |
| | | Contribution | | Average Weight | Average Weight |
| Financials | | 0.71% | | 22.38% | 20.29% |
| Health Care | | 0.60% | | 16.22% | 16.60% |
| Other** | | 0.27% | | 1.17% | 0.00% |
| Utilities | | 0.19% | | 1.33% | 5.56% |
| Industrials | | -0.00% | | 11.96% | 10.62% |
| | | | | | |
| | | | | | |
| 5 Top Detractors - Sectors* | | | | | |
| | | Relative | | Fund | Russell 1000 Value Index |
| | | Contribution | | Average Weight | Average Weight |
| Communication Services | | -0.85% | | 5.90% | 7.96% |
| Information Technology | | -0.62% | | 11.69% | 8.53% |
| Materials | | -0.35% | | 2.15% | 4.44% |
| Energy | | -0.25% | | 5.77% | 8.12% |
| Consumer Discretionary | | -0.21% | | 11.36% | 6.14% |
| | | | | | | |
| Relative contribution reflects how the portolio's holdings impacted return relative to the benchmark. Cash and securities not held in the portfolio are not shown. For equity portfolios, relative contribution compares the performance of a security in the portfolio to the benchmark's total return, factoring in the difference in weight of that security in the benchmark. Returns are calculated using daily returns and previous day ending weights rolled up by ticker, excluding fixed income securities, gross of advisory fees, may exclude certain derivatives and will differ from actual performance.
Performance attribution reflects returns gross of advisory fees and may differ from actual returns as they are based on end of day holdings. Attribution is calculated by geometrically linking daily returns for the portfolio and index. |
* | Based on sector classification according to the Global Industry Classification Standard (“GICS”) codes, which are the exclusive property and a service mark of MSCI Inc. and Standard & Poor’s. |
** | Not a GICS classified sector. |
Janus Henderson U.S. Dividend Income Fund (unaudited)
Fund At A Glance
March 31, 2023
| | |
5 Largest Equity Holdings - (% of Net Assets) |
Texas Instruments Inc | |
Semiconductor & Semiconductor Equipment | 4.2% |
Gilead Sciences Inc | |
Biotechnology | 4.1% |
Merck & Co Inc | |
Pharmaceuticals | 3.9% |
JPMorgan Chase & Co | |
Banks | 3.8% |
Chevron Corp | |
Oil, Gas & Consumable Fuels | 3.6% |
| | 19.6% |
| | | | | | |
Asset Allocation - (% of Net Assets) | |
Common Stocks | | 99.7% | |
Investment Companies | | 0.7% | |
Other | | (0.4)% |
| | | 100.0% |
| | |
Top Country Allocations - Long Positions - (% of Investment Securities) |
As of March 31, 2023 
| |
Janus Henderson U.S. Dividend Income Fund (unaudited)
Performance
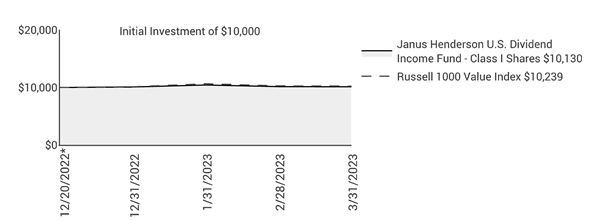
| | | | | | | | |
| | | | | | |
| | | | | | |
Cumulative Total Return - for the periods ended March 31, 2023 | | | Prospectus Expense Ratios |
| | Since
Inception* | | | Total Annual Fund
Operating Expenses‡ | Net Annual Fund
Operating Expenses‡ |
Class D Shares | | 1.30% | | | 10.72% | 0.88% |
Class I Shares | | 1.30% | | | 10.25% | 0.81% |
Class N Shares | | 1.30% | | | 10.19% | 0.75% |
Russell 1000 Value Index | | 2.39% | | | | |
Returns quoted are past performance and do not guarantee future results; current performance may be lower or higher. Investment returns and principal value will vary; there may be a gain or loss when shares are sold. For the most recent month-end performance call 800.668.0434 (or 800.525.3713 if you hold shares directly with Janus Henderson) or visit janushenderson.com/performance (or janushenderson.com/allfunds if you hold shares directly with Janus Henderson).
Net expense ratios reflect the expense waiver, if any, contractually agreed to through at least January 31, 2024. This contractual waiver may be terminated or modified prior to this date only at the discretion of the Board of Trustees.
Performance may be affected by risks that include those associated with foreign and emerging markets, fixed income securities, high-yield and high-risk securities, undervalued, overlooked and smaller capitalization companies, real estate related securities including Real Estate Investment Trusts (REITs), Environmental, Social and Governance (ESG) factors, non-diversification, portfolio turnover, derivatives, short sales, initial public offerings (IPOs) and potential conflicts of interest. Each product has different risks. Please see the prospectus for more information about risks, holdings and other details.
Returns include reinvestment of all dividends and distributions and do not reflect the deduction of taxes that a shareholder would pay on Fund distributions or redemptions of Fund shares. The returns do not include adjustments in accordance with generally accepted accounting principles required at the period end for financial reporting purposes.
There is no assurance that the investment process will consistently lead to successful investing.
See Notes to Schedule of Investments and Other Information for index definitions.
Index performance does not reflect the expenses of managing a portfolio as an index is unmanaged and not available for direct investment.
See “Useful Information About Your Fund Report.”
*The Fund’s inception date – December 20, 2022
‡ As stated in the prospectus. See Financial Highlights for actual expense ratios during the reporting period.
Janus Henderson U.S. Dividend Income Fund (unaudited)
Expense Examples
As a shareholder of the Fund, you incur two types of costs: (1) transaction costs and (2) ongoing costs, including management fees; 12b-1 distribution and shareholder servicing fees; transfer agent fees and expenses payable pursuant to the Transfer Agency Agreement; and other Fund expenses. This example is intended to help you understand your ongoing costs (in dollars) of investing in the Fund and to compare these costs with the ongoing costs of investing in other mutual funds. To do so, compare this 5% hypothetical example with the 5% hypothetical examples that appear in the shareholder reports of the other funds. The example is based upon an investment of $1,000 invested at the beginning of the period and held for the six-months indicated, unless noted otherwise in the table and footnotes below.
Actual Expenses
The information in the table under the heading “Actual” provides information about actual account values and actual expenses. You may use the information in these columns, together with the amount you invested, to estimate the expenses that you paid over the period. Simply divide your account value by $1,000 (for example, an $8,600 account value divided by $1,000 = 8.6), then multiply the result by the number in the appropriate column for your share class under the heading entitled “Expenses Paid During Period” to estimate the expenses you paid on your account during the period.
Hypothetical Example for Comparison Purposes
The information in the table under the heading “Hypothetical (5% return before expenses)” provides information about hypothetical account values and hypothetical expenses based upon the Fund’s actual expense ratio and an assumed rate of return of 5% per year before expenses, which is not the Fund’s actual return. The hypothetical account values and expenses may not be used to estimate the actual ending account balance or expenses you paid for the period. You may use this information to compare the ongoing costs of investing in the Fund and other funds. To do so, compare this 5% hypothetical example with the 5% hypothetical examples that appear in the shareholder reports of the other funds. Additionally, for an analysis of the fees associated with an investment in any share class or other similar funds, please visit www.finra.org/fundanalyzer.
Please note that the expenses shown in the table are meant to highlight your ongoing costs only and do not reflect any transaction costs. These fees are fully described in the Fund’s prospectuses. Therefore, the hypothetical examples are useful in comparing ongoing costs only, and will not help you determine the relative total costs of owning different funds. In addition, if these transaction costs were included, your costs would have been higher.
| | | | | | | | | | | |
| | | | | | | | |
| | | Actual | | Hypothetical
(5% return before expenses) | |
| Beginning
Account
Value
(12/20/22) | Ending
Account
Value
(3/31/23) | Expenses
Paid During
Period
(12/20/22 - 3/31/23)* | | Beginning
Account
Value
(10/1/22) | Ending
Account
Value
(3/31/23) | Expenses
Paid During
Period
(10/1/22 - 3/31/23)† | Net Annualized
Expense Ratio
(12/20/22 - 3/31/23) |
Class D Shares | $1,000.00 | $1,013.00 | $2.64 | | $1,000.00 | $1,011.35 | $2.64 | 0.94% |
Class I Shares | $1,000.00 | $1,013.00 | $2.31 | | $1,000.00 | $1,011.68 | $2.30 | 0.82% |
Class N Shares | $1,000.00 | $1,013.00 | $2.31 | | $1,000.00 | $1,011.68 | $2.30 | 0.82% |
* | Actual Expenses Paid During Period reflect only the inception period for the Fund (December 20, 2022 to March 31, 2023) and are equal to the Net Annualized Expense Ratio multiplied by the average account value over the period, multiplied by 102/365 (to reflect the period). Therefore, actual expenses shown are lower than would be expected for a six-month period. |
† | Hypothetical Expenses Paid During Period are equal to the Net Annualized Expense Ratio multiplied by the average account value over the period, multiplied by 182/365 (to reflect the one-half year period). Expenses in the examples include the effect of applicable fee waivers and/or expense reimbursements, if any. Had such waivers and/or reimbursements not been in effect, your expenses would have been higher. Please refer to the Notes to Financial Statements or the Fund’s prospectuses for more information regarding waivers and/or reimbursements. |
Janus Henderson U.S. Dividend Income Fund
Schedule of Investments (unaudited)
March 31, 2023
| | | | | | | | |
Shares
| | | Value | |
Common Stocks– 99.7% | | | |
Aerospace & Defense – 1.9% | | | |
| | General Dynamics Corp | | 126 | | | $28,755 | |
Air Freight & Logistics – 3.6% | | | |
| | United Parcel Service Inc | | 274 | | | 53,153 | |
Banks – 5.0% | | | |
| | Bank of America Corp | | 637 | | | 18,218 | |
| | JPMorgan Chase & Co | | 430 | | | 56,033 | |
| | | 74,251 | |
Beverages – 4.5% | | | |
| | Coca-Cola Co | | 587 | | | 36,412 | |
| | PepsiCo Inc | | 166 | | | 30,262 | |
| | | 66,674 | |
Biotechnology – 8.3% | | | |
| | AbbVie Inc | | 274 | | | 43,667 | |
| | Amgen Inc | | 76 | | | 18,373 | |
| | Gilead Sciences Inc | | 741 | | | 61,481 | |
| | | 123,521 | |
Capital Markets – 12.1% | | | |
| | CME Group Inc | | 272 | | | 52,093 | |
| | Goldman Sachs Group Inc | | 149 | | | 48,739 | |
| | Morgan Stanley | | 431 | | | 37,842 | |
| | State Street Corp | | 549 | | | 41,554 | |
| | | 180,228 | |
Chemicals – 2.1% | | | |
| | Air Products & Chemicals Inc | | 110 | | | 31,593 | |
Communications Equipment – 3.4% | | | |
| | Cisco Systems Inc | | 970 | | | 50,707 | |
Electric Utilities – 1.1% | | | |
| | American Electric Power Co Inc | | 177 | | | 16,105 | |
Food & Staples Retailing – 3.6% | | | |
| | Sysco Corp | | 536 | | | 41,395 | |
| | Target Corp | | 74 | | | 12,257 | |
| | | 53,652 | |
Health Care Equipment & Supplies – 2.5% | | | |
| | Medtronic PLC | | 468 | | | 37,730 | |
Hotels, Restaurants & Leisure – 4.2% | | | |
| | McDonald's Corp | | 88 | | | 24,606 | |
| | Starbucks Corp | | 364 | | | 37,903 | |
| | | 62,509 | |
Household Durables – 1.5% | | | |
| | Garmin Ltd | | 225 | | | 22,707 | |
Household Products – 5.1% | | | |
| | Colgate-Palmolive Co | | 449 | | | 33,742 | |
| | Procter & Gamble Co | | 285 | | | 42,377 | |
| | | 76,119 | |
Information Technology Services – 3.2% | | | |
| | International Business Machines Corp | | 364 | | | 47,717 | |
Insurance – 1.8% | | | |
| | Travelers Cos Inc | | 155 | | | 26,569 | |
Leisure Products – 0.6% | | | |
| | Hasbro Inc | | 151 | | | 8,107 | |
Machinery – 5.3% | | | |
| | Cummins Inc | | 169 | | | 40,371 | |
| | Illinois Tool Works Inc | | 156 | | | 37,978 | |
| | | 78,349 | |
Media – 6.0% | | | |
| | Comcast Corp - Class A | | 1,077 | | | 40,829 | |
| | Interpublic Group of Cos Inc | | 1,285 | | | 47,853 | |
| | | 88,682 | |
| | |
See Notes to Schedule of Investments and Other Information and Notes to Financial Statements. |
| |
Janus Investment Fund | 5 |
Janus Henderson U.S. Dividend Income Fund
Schedule of Investments (unaudited)
March 31, 2023
| | | | | | | | |
Shares
| | | Value | |
Common Stocks– (continued) | | | |
Oil, Gas & Consumable Fuels – 6.1% | | | |
| | Chevron Corp | | 330 | | | $53,843 | |
| | ConocoPhillips | | 378 | | | 37,501 | |
| | | 91,344 | |
Pharmaceuticals – 6.4% | | | |
| | Bristol-Myers Squibb Co | | 520 | | | 36,041 | |
| | Merck & Co Inc | | 551 | | | 58,621 | |
| | | 94,662 | |
Professional Services – 1.9% | | | |
| | Paychex Inc | | 250 | | | 28,648 | |
Road & Rail – 1.5% | | | |
| | Union Pacific Corp | | 107 | | | 21,535 | |
Semiconductor & Semiconductor Equipment – 4.2% | | | |
| | Texas Instruments Inc | | 338 | | | 62,871 | |
Specialty Retail – 3.8% | | | |
| | Best Buy Co Inc | | 399 | | | 31,230 | |
| | Home Depot Inc | | 84 | | | 24,790 | |
| | | 56,020 | |
Total Common Stocks (cost $1,480,438) | | 1,482,208 | |
Investment Companies– 0.7% | | | |
Money Markets – 0.7% | | | |
| | Janus Henderson Cash Liquidity Fund LLC, 4.7988%ºº,£((cost $10,641) | | 10,639 | | | 10,641 | |
Total Investments (total cost $1,491,079) – 100.4% | | 1,492,849 | |
Liabilities, net of Cash, Receivables and Other Assets – (0.4)% | | (6,463) | |
Net Assets – 100% | | $1,486,386 | |
Schedules of Affiliated Investments – (% of Net Assets)
| | | | | | | | | | | |
| | Dividend Income | Realized Gain/(Loss) | Change in Unrealized Appreciation/ Depreciation | Value at 3/31/23 |
Investment Companies - 0.7% |
Money Markets - 0.7% | |
| | Janus Henderson Cash Liquidity Fund LLC, 4.7988%ºº | $ | 526 | $ | - | $ | - | $ | 10,641 |
| |
| | | | | | | | | | | |
| | Value at 12/20/22 | Purchases | Sales Proceeds | Value at 3/31/23 |
Investment Companies - 0.7% |
Money Markets - 0.7% | |
| | Janus Henderson Cash Liquidity Fund LLC, 4.7988%ºº | | - | | 1,251,923 | | (1,241,282) | | 10,641 |
| | |
See Notes to Schedule of Investments and Other Information and Notes to Financial Statements. |
| |
6 | MARCH 31, 2023 |
Janus Henderson U.S. Dividend Income Fund
Notes to Schedule of Investments and Other Information (unaudited)
| | |
Russell 1000® Value Index | Russell 1000® Value Index reflects the performance of U.S. large-cap equities with lower price-to-book ratios and lower expected growth values. |
| | |
LLC | Limited Liability Company |
PLC | Public Limited Company |
| | |
ºº | Rate shown is the 7-day yield as of March 31, 2023. |
| | |
£ | The Fund may invest in certain securities that are considered affiliated companies. As defined by the Investment Company Act of 1940, as amended, an affiliated company is one in which the Fund owns 5% or more of the outstanding voting securities, or a company which is under common ownership or control. |
| | | | | | | | | | | | | |
The following is a summary of the inputs that were used to value the Fund’s investments in securities and other financial instruments as of March 31, 2023. See Notes to Financial Statements for more information. |
| |
Valuation Inputs Summary |
| | | | | | | |
| | | | | Level 2 - | | Level 3 - |
| | | Level 1 - | | Other Significant | | Significant |
| | | Quoted Prices | | Observable Inputs | | Unobservable Inputs |
| | | | | | | |
Assets | | | | | | |
Investments In Securities: | | | | | | |
Common Stocks | $ | 1,482,208 | $ | - | $ | - |
Investment Companies | | - | | 10,641 | | - |
Total Assets | $ | 1,482,208 | $ | 10,641 | $ | - |
| | | | | | | |
Janus Henderson U.S. Dividend Income Fund
Statement of Assets and Liabilities (unaudited)
March 31, 2023
| | | | | | | |
| | | | | | |
Assets: | | | | |
| Unaffiliated investments, at value (cost $1,480,438) | | $ | 1,482,208 | |
| Affiliated investments, at value (cost $10,641) | | | 10,641 | |
| Cash | | | 135 | |
| Trustees' deferred compensation | | | 51,270 | |
| Receivables: | | | | |
| | Due from adviser | | | 34,430 | |
| | Dividends | | | 2,265 | |
| | Dividends from affiliates | | | 116 | |
Total Assets | | | 1,581,065 | |
Liabilities: | | | | |
| Payables: | | | — | |
| | Trustees' deferred compensation fees | | | 51,270 | |
| | Professional fees | | | 20,213 | |
| | Custodian fees | | | 2,869 | |
| | Investments purchased | | | 1,212 | |
| | Advisory fees | | | 772 | |
| | Transfer agent fees and expenses | | | 111 | |
| | Accrued expenses and other payables | | | 18,232 | |
Total Liabilities | | | 94,679 | |
Net Assets | | $ | 1,486,386 | |
Net Assets Consist of: | | | | |
| Capital (par value and paid-in surplus) | | $ | 1,488,249 | |
| Total distributable earnings (loss) | | | (1,863) | |
Total Net Assets | | $ | 1,486,386 | |
Net Assets - Class D Shares | | $ | 1,081,162 | |
| Shares Outstanding, $0.01 Par Value (unlimited shares authorized) | | | 106,720 | |
Net Asset Value Per Share | | $ | 10.13 | |
Net Assets - Class I Shares | | $ | 202,611 | |
| Shares Outstanding, $0.01 Par Value (unlimited shares authorized) | | | 20,000 | |
Net Asset Value Per Share | | $ | 10.13 | |
Net Assets - Class N Shares | | $ | 202,613 | |
| Shares Outstanding, $0.01 Par Value (unlimited shares authorized) | | | 20,000 | |
Net Asset Value Per Share | | $ | 10.13 | |
| | |
See Notes to Financial Statements. |
| |
8 | MARCH 31, 2023 |
Janus Henderson U.S. Dividend Income Fund
Statement of Operations (unaudited)
For the period ended March 31, 2023(1)
| | | | | | |
| | | | | |
Investment Income: |
| Dividends | $ | 10,528 | |
| Dividends from affiliates | | 526 | |
Total Investment Income | | 11,054 | |
Expenses: | | | |
| Advisory fees | | 2,015 | |
| Transfer agent administrative fees and expenses: | | | |
| | Class D Shares | | 259 | |
| | Class I Shares | | — | |
| Other transfer agent fees and expenses: | | | |
| | Class D Shares | | 101 | |
| | Class I Shares | | 30 | |
| | Class N Shares | | 29 | |
| Registration fees | | 74,060 | |
| Professional fees | | 20,375 | |
| Non-affiliated fund administration fees | | 13,642 | |
| Custodian fees | | 3,387 | |
| Shareholder reports expense | | 2,430 | |
| Other expenses | | 2,865 | |
Total Expenses | | 119,193 | |
Less: Excess Expense Reimbursement and Waivers | | (116,251) | |
Net Expenses | | 2,942 | |
Net Investment Income/(Loss) | | 8,112 | |
Net Realized Gain/(Loss) on Investments: | |
| Investments | | (11,745) | |
Total Net Realized Gain/(Loss) on Investments | (11,745) | |
Change in Unrealized Net Appreciation/Depreciation: |
| Investments and Trustees’ deferred compensation | | 1,770 | |
Total Change in Unrealized Net Appreciation/Depreciation | 1,770 | |
Net Increase/(Decrease) in Net Assets Resulting from Operations | $ | (1,863) | |
| | | | | |
| |
(1) Period from December 20, 2022 (inception date) through March 31, 2023. |
| | |
See Notes to Financial Statements. |
| |
Janus Investment Fund | 9 |
Janus Henderson U.S. Dividend Income Fund
Statement of Changes in Net Assets
| | | | | | |
| | | | | |
| | | Period ended
March 31, 2023 (unaudited)(1) | |
| | | | | | |
Operations: | | | |
| Net investment income/(loss) | $ | 8,112 | |
| Net realized gain/(loss) on investments | | (11,745) | |
| Change in unrealized net appreciation/depreciation | | 1,770 | |
Net Increase/(Decrease) in Net Assets Resulting from Operations | | (1,863) | |
Net Decrease from Dividends and Distributions to Shareholders | | — | |
Capital Share Transactions: | | | |
| | Class D Shares | | 1,088,249 | |
| | Class I Shares | | 200,000 | |
| | Class N Shares | | 200,000 | |
Net Increase/(Decrease) from Capital Share Transactions | | 1,488,249 | |
Net Increase/(Decrease) in Net Assets | | 1,486,386 | |
Net Assets: | | | |
| Beginning of period | | — | |
| End of period | $ | 1,486,386 | |
| | | | | |
| |
(1) Period from December 20, 2022 (inception date) through March 31, 2023. |
| | |
See Notes to Financial Statements. |
| |
10 | MARCH 31, 2023 |
Janus Henderson U.S. Dividend Income Fund
Financial Highlights
| | | | | | | |
Class D Shares | | | |
For a share outstanding during the period ended March 31 (unaudited) | | 2023(1) | |
| Net Asset Value, Beginning of Period | | $10.00 | |
| Income/(Loss) from Investment Operations: | | | |
| | Net investment income/(loss)(2) | | 0.07 | |
| | Net realized and unrealized gain/(loss) | | 0.06(3) | |
| Total from Investment Operations | | 0.13 | |
| Less Dividends and Distributions: | | | |
| | Dividends (from net investment income) | | — | |
| Total Dividends and Distributions | | — | |
| Net Asset Value, End of Period | | $10.13 | |
| Total Return* | | 1.30% | |
| Net Assets, End of Period (in thousands) | | $1,081 | |
| Average Net Assets for the Period (in thousands) | | $766 | |
| Ratios to Average Net Assets**: | | | |
| | Ratio of Gross Expenses | | 36.10% | |
| | Ratio of Net Expenses (After Waivers and Expense Offsets) | | 0.94% | |
| | Ratio of Net Investment Income/(Loss) | | 2.40% | |
| Portfolio Turnover Rate | | 28% | |
| | | | | | | |
| |
* Total return includes adjustments in accordance with generally accepted accounting principles required at the year or period end and are not annualized for periods of less than one full year. ** Annualized for periods of less than one full year. (1) Period from December 20, 2022 (inception date) through March 31, 2023. (2) Per share amounts are calculated based on average shares outstanding during the year or period. (3) The amount shown does not correlate with the change in the aggregate gains and losses in the Fund's securities for the year or period due to the timing of sales and repurchases of the Fund's shares in relation to fluctuating market values for the Fund's securities. |
| | |
See Notes to Financial Statements. |
| |
Janus Investment Fund | 11 |
Janus Henderson U.S. Dividend Income Fund
Financial Highlights
| | | | | | | |
Class I Shares | | | |
For a share outstanding during the period ended March 31 (unaudited) | | 2023(1) | |
| Net Asset Value, Beginning of Period | | $10.00 | |
| Income/(Loss) from Investment Operations: | | | |
| | Net investment income/(loss)(2) | | 0.07 | |
| | Net realized and unrealized gain/(loss) | | 0.06(3) | |
| Total from Investment Operations | | 0.13 | |
| Less Dividends and Distributions: | | | |
| | Dividends (from net investment income) | | — | |
| Total Dividends and Distributions | | — | |
| Net Asset Value, End of Period | | $10.13 | |
| Total Return* | | 1.30% | |
| Net Assets, End of Period (in thousands) | | $203 | |
| Average Net Assets for the Period (in thousands) | | $204 | |
| Ratios to Average Net Assets**: | | | |
| | Ratio of Gross Expenses | | 36.83% | |
| | Ratio of Net Expenses (After Waivers and Expense Offsets) | | 0.82% | |
| | Ratio of Net Investment Income/(Loss) | | 2.61% | |
| Portfolio Turnover Rate | | 28% | |
| | | | | | | |
| |
* Total return includes adjustments in accordance with generally accepted accounting principles required at the year or period end and are not annualized for periods of less than one full year. ** Annualized for periods of less than one full year. (1) Period from December 20, 2022 (inception date) through March 31, 2023. (2) Per share amounts are calculated based on average shares outstanding during the year or period. (3) The amount shown does not correlate with the change in the aggregate gains and losses in the Fund's securities for the year or period due to the timing of sales and repurchases of the Fund's shares in relation to fluctuating market values for the Fund's securities. |
| | |
See Notes to Financial Statements. |
| |
12 | MARCH 31, 2023 |
Janus Henderson U.S. Dividend Income Fund
Financial Highlights
| | | | | | | |
Class N Shares | | | |
For a share outstanding during the period ended March 31 (unaudited) | | 2023(1) | |
| Net Asset Value, Beginning of Period | | $10.00 | |
| Income/(Loss) from Investment Operations: | | | |
| | Net investment income/(loss)(2) | | 0.07 | |
| | Net realized and unrealized gain/(loss) | | 0.06(3) | |
| Total from Investment Operations | | 0.13 | |
| Less Dividends and Distributions: | | | |
| | Dividends (from net investment income) | | — | |
| Total Dividends and Distributions | | — | |
| Net Asset Value, End of Period | | $10.13 | |
| Total Return* | | 1.30% | |
| Net Assets, End of Period (in thousands) | | $203 | |
| Average Net Assets for the Period (in thousands) | | $204 | |
| Ratios to Average Net Assets**: | | | |
| | Ratio of Gross Expenses | | 36.83% | |
| | Ratio of Net Expenses (After Waivers and Expense Offsets) | | 0.82% | |
| | Ratio of Net Investment Income/(Loss) | | 2.61% | |
| Portfolio Turnover Rate | | 28% | |
| | | | | | | |
| |
* Total return includes adjustments in accordance with generally accepted accounting principles required at the year or period end and are not annualized for periods of less than one full year. ** Annualized for periods of less than one full year. (1) Period from December 20, 2022 (inception date) through March 31, 2023. (2) Per share amounts are calculated based on average shares outstanding during the year or period. (3) The amount shown does not correlate with the change in the aggregate gains and losses in the Fund’s securities for the year or period due to the timing of sales and repurchases of the Fund’s shares in relation to fluctuating market values for the Fund’s securities. |
| | |
See Notes to Financial Statements. |
| |
Janus Investment Fund | 13 |
Janus Henderson U.S. Dividend Income Fund
Notes to Financial Statements (unaudited)
1. Organization and Significant Accounting Policies
Janus Henderson U.S. Dividend Income Fund (the “Fund”) is a series of Janus Investment Fund (the “Trust”), which is organized as a Massachusetts business trust and is registered under the Investment Company Act of 1940, as amended (the “1940 Act”), as an open-end management investment company, and therefore has applied the specialized accounting and reporting guidance in Financial Accounting Standards Board (“FASB”) Accounting Standards Codification (“ASC”) Topic 946. The Trust offers 40 funds, each of which offers multiple share classes, with differing investment objectives and policies. The Fund seeks to provide current income and aims to provide a growing stream of income per share over time. The Fund’s secondary objective is to seek to provide long-term capital appreciation. The Fund is classified as diversified, as defined in the 1940 Act. Janus Henderson Investors US LLC is the investment adviser (the “Adviser”) to the Fund.
The Fund offers multiple classes of shares in order to meet the needs of various types of investors. Each class represents an interest in the same portfolio of investments. Certain financial intermediaries may not offer all classes of shares.
Shareholders, including other funds, individuals, accounts, as well as the Fund’s portfolio manager(s) and/or investment personnel, may from time to time own (beneficially or of record) a significant percentage of the Fund’s Shares and can be considered to “control” the Fund when that ownership exceeds 25% of the Fund’s assets (and which may differ from control as determined in accordance with United States of America generally accepted accounting principles ("US GAAP")).
The Fund currently offers Class D Shares. Class D Shares are available to new investors, subject to any closed fund policies for a Fund, as applicable.
Class I Shares are available through certain financial intermediary platforms including, but not limited to, mutual fund wrap fee programs, managed account programs, asset allocation programs, bank trust platforms, as well as certain retirement platforms. Class I Shares are also available to certain direct institutional investors including, but not limited to, corporations, certain retirement plans, public plans, and foundations/endowments, who established Class I Share accounts before August 4, 2017.
Class N Shares are generally available only to financial intermediaries purchasing on behalf of: 1) certain adviser-assisted, employer-sponsored retirement plans, including 401(k) plans, 457 plans, 403(b) plans, Taft-Hartley multi-employer plans, profit-sharing and money purchase pension plans, defined benefit plans and certain welfare benefit plans, such as health savings accounts, and nonqualified deferred compensation plans; and 2) retail investors purchasing in qualified or nonqualified accounts, whose accounts are held through an omnibus account at their financial intermediary, and where the financial intermediary requires no payment or reimbursement from the Fund, the Adviser, or its affiliates. Class N Shares are also available to Janus Henderson proprietary products and to certain direct institutional investors approved by Janus Henderson Distributors US LLC (the “Distributor”) including, but not limited to, corporations, certain retirement plans, public plans, and foundations and endowments, subject to minimum investment requirements.
The following accounting policies have been followed by the Fund and are in conformity with US GAAP.
Investment Valuation
Fund holdings are valued in accordance with policies and procedures established by the Adviser pursuant to Rule 2a-5 under the 1940 Act and approved by and subject to the oversight of the Trustees (the “Valuation Procedures”). Equity securities traded on a domestic securities exchange are generally valued at readily available market quotations, which are (i) the official close prices or (ii) last sale prices on the primary market or exchange in which the securities trade. If such price is lacking for the trading period immediately preceding the time of determination, such securities are generally valued at their current bid price. Equity securities that are traded on a foreign exchange are generally valued at the closing prices on such markets. In the event that there is no current trading volume on a particular security in such foreign exchange, the bid price from the primary exchange is generally used to value the security. Foreign securities and currencies are converted to U.S. dollars using the current spot USD dollar exchange rate in effect at the close of the New York Stock Exchange (“NYSE”). The Fund will determine the market value of individual securities held by it by using prices provided by one or more approved professional pricing services or, as needed, by obtaining market quotations from independent broker-dealers. Most debt securities are valued in accordance with the evaluated bid price supplied by the Adviser-approved pricing service that is intended to reflect market value. The evaluated bid price
Janus Henderson U.S. Dividend Income Fund
Notes to Financial Statements (unaudited)
supplied by the pricing service is an evaluation that may consider factors such as security prices, yields, maturities and ratings. Certain short-term securities maturing within 60 days or less may be evaluated and valued on an amortized cost basis provided that the amortized cost determined approximates market value. Securities for which market quotations or evaluated prices are not readily available or deemed unreliable are valued at fair value determined in good faith by the Adviser pursuant to the Valuation Procedures. Circumstances in which fair valuation may be utilized include, but are not limited to: (i) a significant event that may affect the securities of a single issuer, such as a merger, bankruptcy, or significant issuer-specific development; (ii) an event that may affect an entire market, such as a natural disaster or significant governmental action; (iii) a nonsignificant event such as a market closing early or not opening, or a security trading halt; and (iv) pricing of a nonvalued security and a restricted or nonpublic security. Special valuation considerations may apply with respect to “odd-lot” fixed-income transactions which, due to their small size, may receive evaluated prices by pricing services which reflect a large block trade and not what actually could be obtained for the odd-lot position. The valuation policies provide for the use of systematic fair valuation models provided by independent pricing services to value foreign equity securities in order to adjust for stale pricing, which may occur between the close of certain foreign exchanges and the close of the NYSE. The value of the securities of other mutual funds held by a Fund, if any, will be calculated using the NAV of such mutual funds.
Valuation Inputs Summary
FASB ASC 820, Fair Value Measurements and Disclosures (“ASC 820”), defines fair value, establishes a framework for measuring fair value, and expands disclosure requirements regarding fair value measurements. This standard emphasizes that fair value is a market-based measurement that should be determined based on the assumptions that market participants would use in pricing an asset or liability and establishes a hierarchy that prioritizes inputs to valuation techniques used to measure fair value. These inputs are summarized into three broad levels:
Level 1 – Unadjusted quoted prices in active markets the Fund has the ability to access for identical assets or liabilities.
Level 2 – Observable inputs other than unadjusted quoted prices included in Level 1 that are observable for the asset or liability either directly or indirectly. These inputs may include quoted prices for the identical instrument on an inactive market, prices for similar instruments, interest rates, prepayment speeds, credit risk, yield curves, default rates and similar data.
Assets or liabilities categorized as Level 2 in the hierarchy generally include: debt securities fair valued in accordance with the evaluated bid or ask prices supplied by a pricing service; securities traded on OTC markets and listed securities for which no sales are reported that are fair valued at the latest bid price (or yield equivalent thereof) obtained from one or more dealers transacting in a market for such securities or by a pricing service approved by the Fund’s Trustees; certain short-term debt securities with maturities of 60 days or less that are fair valued at amortized cost; and equity securities of foreign issuers whose fair value is determined by using systematic fair valuation models provided by independent third parties in order to adjust for stale pricing which may occur between the close of certain foreign exchanges and the close of the NYSE. Other securities that may be categorized as Level 2 in the hierarchy include, but are not limited to, preferred stocks, bank loans, swaps, investments in unregistered investment companies, options, and forward contracts.
Level 3 – Unobservable inputs for the asset or liability to the extent that relevant observable inputs are not available, representing the Fund’s own assumptions about the assumptions that a market participant would use in valuing the asset or liability, and that would be based on the best information available.
There have been no significant changes in valuation techniques used in valuing any such positions held by the Fund since the beginning of the fiscal period.
The inputs or methodology used for fair valuing securities are not necessarily an indication of the risk associated with investing in those securities. The summary of inputs used as of March 31, 2023 to fair value the Fund’s investments in securities and other financial instruments is included in the “Valuation Inputs Summary” in the Notes to Schedule of Investments and Other Information.
Investment Transactions and Investment Income
Investment transactions are accounted for as of the date purchased or sold (trade date). Dividend income is recorded on the ex-dividend date. Certain dividends from foreign securities will be recorded as soon as the Fund is informed of the dividend, if such information is obtained subsequent to the ex-dividend date. Dividends from foreign securities may
Janus Henderson U.S. Dividend Income Fund
Notes to Financial Statements (unaudited)
be subject to withholding taxes in foreign jurisdictions. Non-cash dividends, if any, are recorded on the ex-dividend date at fair value. Interest income is recorded daily on an accrual basis and includes amortization of premiums and accretion of discounts. The Fund classifies gains and losses on prepayments received as an adjustment to interest income. Debt securities may be placed in non-accrual status and related interest income may be reduced by stopping current accruals and writing off interest receivables when collection of all or a portion of interest has become doubtful. Gains and losses are determined on the identified cost basis, which is the same basis used for federal income tax purposes. Income, as well as gains and losses, both realized and unrealized, are allocated daily to each class of shares based upon the ratio of net assets represented by each class as a percentage of total net assets.
Expenses
The Fund bears expenses incurred specifically on its behalf. Each class of shares bears a portion of general expenses, which are allocated daily to each class of shares based upon the ratio of net assets represented by each class as a percentage of total net assets. Expenses directly attributable to a specific class of shares are charged against the operations of such class.
Estimates
The preparation of financial statements in conformity with US GAAP requires management to make estimates and assumptions that affect the reported amount of assets and liabilities and disclosure of contingent assets and liabilities at the date of the financial statements, and the reported amounts of income and expenses during the reporting period. Actual results could differ from those estimates.
Indemnifications
In the normal course of business, the Fund may enter into contracts that contain provisions for indemnification of other parties against certain potential liabilities. The Fund’s maximum exposure under these arrangements is unknown, and would involve future claims that may be made against the Fund that have not yet occurred. Currently, the risk of material loss from such claims is considered remote.
Dividends and Distributions
The Fund generally declares and distributes dividends of net investment income and realized capital gains (if any) quarterly. The Fund may treat a portion of the amount paid to redeem shares as a distribution of investment company taxable income and realized capital gains that are reflected in the net asset value. This practice, commonly referred to as “equalization,” has no effect on the redeeming shareholder or a Fund’s total return, but may reduce the amounts that would otherwise be required to be paid as taxable dividends to the remaining shareholders. It is possible that the Internal Revenue Service (IRS) could challenge the Fund's equalization methodology or calculations, and any such challenge could result in additional tax, interest, or penalties to be paid by the Fund.
The Fund may make certain investments in real estate investment trusts (“REITs”) which pay dividends to their shareholders based upon funds available from operations. It is quite common for these dividends to exceed the REITs’ taxable earnings and profits, resulting in the excess portion of such dividends being designated as a return of capital. If the Fund distributes such amounts, such distributions could constitute a return of capital to shareholders for federal income tax purposes.
Federal Income Taxes
The Fund intends to continue to qualify as a regulated investment company and distribute all of its taxable income in accordance with the requirements of Subchapter M of the Internal Revenue Code. Management has analyzed the Fund’s tax positions taken for all open federal income tax years, generally a three-year period, and has concluded that no provision for federal income tax is required in the Fund’s financial statements. The Fund is not aware of any tax positions for which it is reasonably possible that the total amounts of unrecognized tax benefits will significantly change in the next twelve months.
2. Other Investments and Strategies
Additional Investment Risk
The U.S. government and the Federal Reserve, as well as certain foreign governments and central banks, have taken extraordinary actions to support local and global economies and the financial markets in response to the COVID-19 pandemic. This and other government intervention into the economy and financial markets to address the COVID-19 pandemic may not work as intended, particularly if the efforts are perceived by investors as being unlikely to achieve the desired results. Government actions to mitigate the economic impact of the pandemic have resulted in a large
Janus Henderson U.S. Dividend Income Fund
Notes to Financial Statements (unaudited)
expansion of government deficits and debt, the long term consequences of which are not known. The COVID-19 pandemic could adversely affect the value and liquidity of a Fund’s investments, impair a Fund’s ability to satisfy redemption requests, and negatively impact a Fund’s performance. In addition, the outbreak of COVID-19, and measures taken to mitigate its effects, could result in disruptions to the services provided to a Fund by its service providers.
Widespread disease, including pandemics and epidemics, and natural or environmental disasters, including those which may be attributable to global climate change, such as earthquakes, fires, floods, hurricanes, tsunamis and weather-related phenomena generally, have been and can be highly disruptive to economies and markets, adversely impacting individual companies, sectors, industries, markets, currencies, interest and inflation rates, credit ratings, investor sentiment, and other factors affecting the value of a Fund’s investments. Economies and financial markets throughout the world have become increasingly interconnected, which increases the likelihood that events or conditions in one region or country will adversely affect markets or issuers in other regions or countries, including the United States. These disruptions could prevent a Fund from executing advantageous investment decisions in a timely manner and negatively impact a Fund’s ability to achieve its investment objective(s). Any such event(s) could have a significant adverse impact on the value of a Fund. In addition, these disruptions could also impair the information technology and other operational systems upon which the Fund’s service providers, including the Adviser or the subadviser (as applicable), rely, and could otherwise disrupt the ability of employees of the Fund’s service providers to perform essential tasks on behalf of the Fund. Adverse weather conditions may also have a particularly significant negative effect on issuers in the agricultural sector and on insurance and reinsurance companies that insure or reinsure against the impact of natural disasters.
A number of countries in the European Union (the “EU”) have experienced, and may continue to experience, severe economic and financial difficulties. In particular, many EU nations are susceptible to economic risks associated with high levels of debt. Many non-governmental issuers, and even certain governments, have defaulted on, or been forced to restructure, their debts. Many other issuers have faced difficulties obtaining credit or refinancing existing obligations. Financial institutions have in many cases required government or central bank support, have needed to raise capital, and/or have been impaired in their ability to extend credit. As a result, financial markets in the EU have experienced extreme volatility and declines in asset values and liquidity. These difficulties may continue, worsen, or spread further within the EU. Responses to these financial problems by European governments, central banks, and others, including austerity measures and reforms, may not work, may result in social unrest, and may limit future growth and economic recovery or have other unintended consequences. Among other things, these developments have adversely affected the value and exchange rate of the euro and pound sterling, and may continue to significantly affect the economies of all EU countries, which in turn may have a material adverse effect on the Fund’s investments in such countries, other countries that depend on EU countries for significant amounts of trade or investment, or issuers with exposure to debt issued by certain EU countries.
3. Investment Advisory Agreements and Other Transactions with Affiliates
The Fund pays the Adviser an investment advisory fee which is calculated daily and paid monthly. The following table reflects the Fund’s contractual investment advisory fee rate (expressed as an annual rate).
| | |
Average Daily Net Assets of the Fund | Contractual Investment Advisory Fee (%) |
First $2 Billion | 0.60 |
Over $2 Billion | 0.55 |
The Fund’s actual investment advisory fee rate for the reporting period was 0.60% of average annual net assets before applicable waivers.
The Adviser has contractually agreed to waive the investment advisory fee and/or reimburse operating expenses to the extent that the Fund’s total annual fund operating expenses, excluding shareholder servicing fees, such as transfer agency fees (including out-of-pocket costs), brokerage commissions, interest, dividends, taxes, and extraordinary expenses, exceed the annual rate of 0.75% of the Fund’s average daily net assets. The Adviser has agreed to continue the waiver until at least January 31, 2024. If applicable, amounts waived and/or reimbursed to the Fund by the Adviser are disclosed as “Excess Expense Reimbursement and Waivers” on the Statement of Operations.
Janus Henderson U.S. Dividend Income Fund
Notes to Financial Statements (unaudited)
For a period of three years subsequent to the Fund’s commencement of operations, or until the Fund’s assets meet the first breakpoint in the investment advisory fee schedule, whichever occurs first, the Adviser may recover from the Fund fees and expenses previously waived or reimbursed, if the Fund’s expense ratio, including recovered expenses, falls below the expense limit. If applicable, this amount is disclosed as “Recoupment expense” on the Statement of Operations. During the period ended March 31, 2023, the Adviser reimbursed the Fund $116,251 of fees and expense that are eligible for recoupment. As of March 31, 2023, the aggregate amount of recoupment that may potentially be made to the Adviser is $116,251. The recoupment of such reimbursements expires at the latest December 20, 2025.
The Adviser serves as administrator to the Fund pursuant to an administration agreement between the Adviser and the Trust. Under the administration agreement, the Adviser is authorized to perform, or cause others to perform certain administration, compliance, and accounting services to the Fund, including providing office space for the Fund, and is reimbursed by the Fund for certain of its costs in providing these services (to the extent the Adviser seeks reimbursement and such costs are not otherwise waived). In addition, employees of the Adviser and/or its affiliates may serve as officers of the Trust. The Fund pays for some or all of the salaries, fees, and expenses of the Adviser employees and Fund officers, with respect to certain specified administration functions they perform on behalf of the Fund. The Fund pays these costs based on out-of-pocket expenses incurred by the Adviser, and these costs are separate and apart from advisory fees and other expenses paid in connection with the investment advisory services the Adviser (or any subadvisor, as applicable) provides to the Fund. These amounts are disclosed as “Affiliated fund administration fees” on the Statement of Operations. In addition, some expenses related to compensation payable to the Fund’s Chief Compliance Officer and certain compliance staff, all of whom are employees of the Adviser and/or its affiliates, are shared with the Fund. Total compensation of $114,430 was paid to the Chief Compliance Officer and certain compliance staff by the Trust during the period ended March 31, 2023. The Fund's portion is reported as part of “Other expenses” on the Statement of Operations.
Janus Henderson Services US LLC (the “Transfer Agent”), a wholly-owned subsidiary of the Adviser, is the Fund’s transfer agent. The Transfer Agent provides or arranges for the provision of shareholder services including, but not limited to, recordkeeping, subaccounting, answering inquiries regarding accounts, order processing, transaction confirmations, the mailing of prospectuses and shareholder reports, and other shareholder services provided to or on behalf of shareholders. These amounts are disclosed as “Transfer agent administrative fees and expenses” on the Statement of Operations.
Class D Shares of the Fund pay the Transfer Agent an annual administrative services fee based on the average daily net assets of Class D Shares as detailed below.
| | |
Average Daily Net Assets of Class D Shares of the Janus Henderson funds | Administrative Services Fee |
Under $40 billion | 0.12% |
$40 billion – $49.9 billion | 0.10% |
Over $49.9 billion | 0.08% |
During the reporting period, the administrative services fee rate was 0.12%.
Shareholder Services provided by these financial intermediaries may include, but are not limited to, recordkeeping, subaccounting, order processing, providing order confirmations, periodic statements, forwarding prospectuses, shareholder reports, and other materials to existing customers, answering inquiries regarding accounts, and other administrative services. Order processing includes the submission of transactions through the National Securities Clearing Corporation (“NSCC”) or similar systems, or those processed on a manual basis with the Adviser. For all share classes, the Transfer Agent also seeks reimbursement for costs it incurs as transfer agent and for providing servicing.
Certain, but not all, intermediaries may charge administrative fees to investors in Class I Shares for administrative services provided on behalf of such investors. These administrative fees are paid by the Class I Shares of the Fund to the Transfer Agent, which uses such fees to reimburse intermediaries. Consistent with the Transfer Agency Agreement between the Transfer Agent and the Fund, the Transfer Agent may negotiate the level, structure, and/or terms of the administrative fees with intermediaries requiring such fees on behalf of the Fund. The Adviser and its affiliates benefit from an increase in assets that may result from such relationships. The Adviser has agreed to limit these fees up to 0.15% for Class I Shares on an annual basis based on the daily net assets of the share class. Such limits are subject to change by the Trustees in the future. These amounts are disclosed as “Transfer agent networking and omnibus fees” on the Statement of Operations.
Janus Henderson U.S. Dividend Income Fund
Notes to Financial Statements (unaudited)
The Transfer Agent is not compensated for its services related to the shares, except for out-of-pocket costs, although the Transfer Agent is compensated for its services related to Fund’s Class D Shares. These amounts are disclosed as “Other transfer agent fees and expenses” on the Statement of Operations.
The Board of Trustees has adopted a deferred compensation plan (the “Deferred Plan”) for independent Trustees to elect to defer receipt of all or a portion of the annual compensation they are entitled to receive from the Fund. All deferred fees are credited to an account established in the name of the Trustees. The amounts credited to the account then increase or decrease, as the case may be, in accordance with the performance of one or more of the Janus Henderson funds that are selected by the Trustees. The account balance continues to fluctuate in accordance with the performance of the selected fund or funds until final payment of all amounts are credited to the account. The fluctuation of the account balance is recorded by the Fund as unrealized appreciation/(depreciation) and is included as of March 31, 2023 on the Statement of Assets and Liabilities in the asset, “Trustees’ deferred compensation,” and liability, “Trustees’ deferred compensation fees.” Additionally, the recorded unrealized appreciation/(depreciation) is included in “Total distributable earnings (loss)” on the Statement of Assets and Liabilities. Deferred compensation expenses for the period ended March 31, 2023 are included in “Trustees’ fees and expenses” on the Statement of Operations. Trustees are allowed to change their designation of mutual funds from time to time. Amounts will be deferred until distributed in accordance with the Deferred Plan. Deferred fees of $205,688 were paid by the Trust to the Trustees under the Deferred Plan during the period ended March 31, 2023.
Pursuant to the provisions of the 1940 Act and related rules, the Fund may participate in an affiliated or non-affiliated cash sweep program. In the cash sweep program, uninvested cash balances of the Fund may be used to purchase shares of affiliated or non-affiliated money market funds or cash management pooled investment vehicles that operate as money market funds. The Fund is eligible to participate in the cash sweep program (the “Investing Funds”). The Adviser has an inherent conflict of interest because of its fiduciary duties to the affiliated money market funds or cash management pooled investment vehicles and the Investing Funds. Janus Henderson Cash Liquidity Fund LLC (the “Sweep Vehicle”) is an affiliated unregistered cash management pooled investment vehicle that invests primarily in highly-rated short-term fixed-income securities. The Sweep Vehicle operates pursuant to the provisions of the 1940 Act that govern the operation of money market funds and prices its shares at NAV reflecting market-based values of its portfolio securities (i.e., a “floating” NAV) rounded to the fourth decimal place (e.g., $1.0000). The Sweep Vehicle is permitted to impose a liquidity fee (of up to 2%) on redemptions from the Sweep Vehicle or a redemption gate that temporarily suspends redemptions from the Sweep Vehicle for up to 10 business days during a 90 day period. There are no restrictions on the Fund's ability to withdraw investments from the Sweep Vehicle at will, and there are no unfunded capital commitments due from the Fund to the Sweep Vehicle. The Sweep Vehicle does not charge any management fee, sales charge or service fee.
Any purchases and sales, realized gains/losses and recorded dividends from affiliated investments during the period ended March 31, 2023 can be found in the “Schedules of Affiliated Investments” located in the Schedule of Investments.
As of March 31, 2023, shares of the Fund were owned by affiliates of the Adviser, and/or other funds advised by the Adviser, as indicated in the table below:
| | | | | | |
Class | % of Class Owned | | % of Fund Owned | | |
Class D Shares | 9 | % | 7 | % | |
Class I Shares | 100 | | 14 | | |
Class N Shares | 100 | | 14 | | |
| | | | | | |
4. Federal Income Tax
Income and capital gains distributions are determined in accordance with income tax regulations that may differ from US GAAP. These differences are due to differing treatments for items such as net short-term gains, deferral of wash sale losses, foreign currency transactions, net investment losses, and capital loss carryovers.
The Fund has elected to treat gains and losses on forward foreign currency contracts as capital gains and losses, if applicable. Other foreign currency gains and losses on debt instruments are treated as ordinary income for federal income tax purposes pursuant to Section 988 of the Internal Revenue Code.
Janus Henderson U.S. Dividend Income Fund
Notes to Financial Statements (unaudited)
The aggregate cost of investments and the composition of unrealized appreciation and depreciation of investment securities for federal income tax purposes as of March 31, 2023 are noted below. The primary difference between book and tax appreciation or depreciation of investments is wash sale loss deferrals.
| | | | |
Federal Tax Cost | Unrealized
Appreciation | Unrealized
(Depreciation) | Net Tax Appreciation/
(Depreciation) |
$ 1,495,987 | $ 37,320 | $ (40,458) | $ (3,138) |
5. Capital Share Transactions
| | | | |
| | | |
| | Period ended March 31, 2023(1) |
| | Shares | Amount |
| | | | |
Class D Shares: | | |
Shares sold | 113,550 | $1,158,367 |
Reinvested dividends and distributions | - | - |
Shares repurchased | (6,830) | (70,118) |
Net Increase/(Decrease) | 106,720 | $1,088,249 |
Class I Shares: | | |
Shares sold | 20,000 | $ 200,000 |
Reinvested dividends and distributions | - | - |
Shares repurchased | - | - |
Net Increase/(Decrease) | 20,000 | $ 200,000 |
Class N Shares: | | |
Shares sold | 20,000 | $ 200,000 |
Reinvested dividends and distributions | - | - |
Shares repurchased | - | - |
Net Increase/(Decrease) | 20,000 | $ 200,000 |
(1) | Period from December 20, 2022 (inception date) through March 31, 2023. |
6. Purchases and Sales of Investment Securities
For the period ended March 31, 2023, the aggregate cost of purchases and proceeds from sales of investment securities (excluding any short-term securities, short-term options contracts, TBAs, and in-kind transactions, as applicable) was as follows:
| | | | |
Purchases of
Securities | Proceeds from Sales
of Securities | Purchases of Long-
Term U.S. Government
Obligations | Proceeds from Sales
of Long-Term U.S.
Government Obligations |
$ 1,674,987 | $ 182,805 | $ - | $ - |
7. Subsequent Event
Management has evaluated whether any events or transactions occurred subsequent to March 31, 2023 and through the date of issuance of the Fund’s financial statements and determined that there were no material events or transactions that would require recognition or disclosure in the Fund’s financial statements.
Janus Henderson U.S. Dividend Income Fund
Additional Information (unaudited)
Proxy Voting Policies and Voting Record
A description of the policies and procedures that the Fund uses to determine how to vote proxies relating to its portfolio securities is available without charge: (i) upon request, by calling 1-800-525-1093; (ii) on the Fund’s website at janushenderson.com/proxyvoting; and (iii) on the SEC’s website at http://www.sec.gov. Additionally, information regarding the Fund’s proxy voting record for the most recent twelve-month period ended June 30 is also available, free of charge, through janushenderson.com/proxyvoting and from the SEC’s website at http://www.sec.gov.
Full Holdings
The Fund files its complete portfolio holdings (schedule of investments) with the SEC as an exhibit to Form N-PORT within 60 days of the end of the first and third fiscal quarters, and in the annual report and semiannual report to shareholders. The Fund’s Form N-PORT filings and annual and semiannual reports: (i) are available on the SEC’s website at http://www.sec.gov; and (ii) are available without charge, upon request, by calling a Janus Henderson representative at 1-877-335-2687 (toll free) (or 1-800-525-3713 if you hold Class D Shares). Portfolio holdings consisting of at least the names of the holdings are generally available on a monthly basis with a 30-day lag under Full Holdings for the Fund at janushenderson.com/info (or janushenderson.com/reports if you hold Class D Shares).
APPROVAL OF ADVISORY AGREEMENTS DURING THE PERIOD
The Trustees of Janus Aspen Series, each of whom serves as an “independent” Trustee (the “Trustees”), oversee the management of each portfolio of Janus Aspen Series (each, a “VIT Portfolio,” and collectively, the “VIT Portfolios”), as well as each fund of Janus Investment Fund (each, a “Fund,” and collectively, the “Funds” and together with the VIT Portfolios, the “Janus Henderson Funds,” and each, a “Janus Henderson Fund”). As required by law, the Trustees determine annually whether to continue the investment advisory agreement for each Janus Henderson Fund.
In connection with their most recent consideration of those agreements for each Janus Henderson Fund, the Trustees received and reviewed information provided by Janus Henderson Investors US LLC (the “Adviser”) in response to requests of the Trustees and their independent legal counsel. They also received and reviewed information and analysis provided by, and in response to requests of, their independent fee consultant. Throughout their consideration of the agreements, the Trustees were advised by their independent legal counsel. The Trustees met with management to consider the agreements, and also met separately in executive session with their independent legal counsel and their independent fee consultant.
At meetings held on November 9-10, 2022 and December 13-14, 2022, the Trustees evaluated the information provided by the Adviser and the independent fee consultant, as well as other information provided by the Adviser and the independent fee consultant during the year. Following such evaluation, the Trustees determined that the overall arrangements between each Janus Henderson Fund and the Adviser were fair and reasonable in light of the nature, extent, and quality of the services provided by the Adviser and its affiliates, the fees charged for those services, and other matters that the Trustees considered relevant in the exercise of their business judgment, and unanimously approved the continuation of the investment advisory agreement for each Janus Henderson Fund for the period from February 1, 2023 through February 1, 2024, subject to earlier termination as provided for in each agreement.
In considering the continuation of those agreements, the Trustees reviewed and analyzed various factors that they determined were relevant, including the factors described below, none of which by itself was considered dispositive. However, the material factors and conclusions that formed the basis for the Trustees’ determination to approve the continuation of the agreements are discussed separately below. Also included is a summary of the independent fee consultant’s conclusions and opinions that arose during, and were included as part of, the Trustees’ consideration of the agreements. “Management fees,” as used herein, reflect actual annual advisory fees and, for the purpose of peer comparisons any administration fees (excluding out of pocket costs), net of any waivers, paid by a fund as a percentage of average net assets.
Nature, Extent and Quality of Services
The Trustees reviewed the nature, extent, and quality of the services provided by the Adviser to the Janus Henderson Funds, taking into account the investment objective, strategies, and policies of each Janus Henderson Fund, and the knowledge the Trustees gained from their regular meetings with management on at least a quarterly basis and their ongoing review of information related to the Janus Henderson Funds. In addition, the Trustees reviewed the resources and key personnel of the Adviser, particularly noting those employees who provide investment and risk management services to the Janus Henderson Funds. The Trustees also considered other services provided to the Janus Henderson
Janus Henderson U.S. Dividend Income Fund
Additional Information (unaudited)
Funds by the Adviser, such as managing the execution of portfolio transactions and the selection of broker-dealers for those transactions. The Trustees considered the Adviser’s role as administrator to the Janus Henderson Funds, noting that the Adviser generally does not receive a fee for its services as administrator, but is reimbursed for its out-of-pocket costs. The Trustees considered the role of the Adviser in monitoring adherence to the Janus Henderson Funds’ investment restrictions, providing support services for the Trustees and Trustee committees, and overseeing communications with Janus Henderson Fund shareholders and the activities of other service providers, including monitoring compliance with various policies and procedures of the Janus Henderson Funds and with applicable securities laws and regulations.
In this regard, the independent fee consultant noted that the Adviser provides a number of different services for the Janus Henderson Funds and their shareholders, ranging from investment management services to various other servicing functions, and that, in its view, the Adviser is a capable provider of those services. The independent fee consultant also provided its belief that the Adviser has developed a number of institutional competitive advantages that should enable it to provide superior investment and service performance over the long term.
The Trustees concluded that the nature, extent, and quality of the services provided by the Adviser to each Janus Henderson Fund were appropriate and consistent with the terms of the respective advisory agreements, and that, taking into account steps taken to address those Janus Henderson Funds whose performance lagged that of their peers for certain periods, the Janus Henderson Funds were likely to benefit from the continued provision of those services. They also concluded that the Adviser had sufficient personnel, with the appropriate education and experience, to serve the Janus Henderson Funds effectively and had demonstrated its ability to attract well-qualified personnel.
Performance of the Funds
The Trustees considered the performance results of each Janus Henderson Fund over various time periods. They noted that they considered Janus Henderson Fund performance data throughout the year, including periodic meetings with each Janus Henderson Fund’s portfolio manager(s), and also reviewed information comparing each Janus Henderson Fund’s performance with the performance of comparable fund peer groups identified by Broadridge Financial Solutions, Inc. (“Broadridge”), an independent data provider, and with the Janus Henderson Fund’s benchmark index. In this regard, the independent fee consultant found that the overall Janus Henderson Funds’ performance has been reasonable, noting that: (i) for the 36 months ended May 31, 2022, approximately 38% of the Janus Henderson Funds were in the top two quartiles of their Broadridge peer groups; (ii) for the 36 months ended September 30, 2022, approximately 45% of the Janus Henderson Funds were in the top two quartiles of performance as reported by Morningstar, and (iii) for the 12 months ended September 30, 2022, approximately 55% of the Janus Henderson Funds were in the top two quartiles of performance as reported by Morningstar.
The Trustees considered the performance of each Janus Henderson Fund, noting that performance may vary by share class, and noted the following with respect to the Funds:
Asset Allocation Funds
· For Janus Henderson Global Allocation Fund – Conservative, the Trustees noted that the Fund’s performance was in the third Broadridge quartile for the 36 months ended May 31, 2022 and the bottom Broadridge quartile for the 12 months ended May 31, 2022. The Trustees noted the reasons for the Fund’s underperformance and the steps the Adviser had taken or was taking to improve performance.
· For Janus Henderson Global Allocation Fund – Growth, the Trustees noted that the Fund’s performance was in the bottom Broadridge quartile for the 36 months ended May 31, 2022 and the bottom Broadridge quartile for the 12 months ended May 31, 2022. The Trustees noted the reasons for the Fund’s underperformance and the steps the Adviser had taken or was taking to improve performance.
· For Janus Henderson Global Allocation Fund – Moderate, the Trustees noted that the Fund’s performance was in the bottom Broadridge quartile for the 36 months ended May 31, 2022 and the bottom Broadridge quartile for the 12 months ended May 31, 2022. The Trustees noted the reasons for the Fund’s underperformance and the steps the Adviser had taken or was taking to improve performance.
Fixed-Income Funds
· For Janus Henderson Absolute Return Income Opportunities Fund, the Trustees noted that the Fund’s performance was in the third Broadridge quartile for the 36 months ended May 31, 2022 and the first Broadridge quartile for the 12 months ended May 31, 2022. The Trustees noted the reasons for the Fund’s underperformance,
Janus Henderson U.S. Dividend Income Fund
Additional Information (unaudited)
the steps the Adviser had taken or was taking to improve performance, and that the performance trend was improving.
· For Janus Developed World Bond Fund, the Trustees noted that the Fund’s performance was in the bottom Broadridge quartile for the 36 months ended May 31, 2022 and the bottom Broadridge quartile for the 12 months ended May 31, 2022. The Trustees noted the reasons for the Fund’s underperformance and the steps the Adviser had taken or was taking to improve performance.
· For Janus Henderson Flexible Bond Fund, the Trustees noted that the Fund’s performance was in the first Broadridge quartile for the 36 months ended May 31, 2022 and the second Broadridge quartile for the 12 months ended May 31, 2022.
· For Janus Henderson Global Bond Fund, the Trustees noted that the Fund’s performance was in the third Broadridge quartile for the 36 months ended May 31, 2022 and the bottom Broadridge quartile for the 12 months ended May 31, 2022. The Trustees noted the reasons for the Fund’s underperformance and the steps the Adviser had taken or was taking to improve performance.
· For Janus Henderson High-Yield Fund, the Trustees noted that the Fund’s performance was in the third Broadridge quartile for the 36 months ended May 31, 2022 and the bottom Broadridge quartile for the 12 months ended May 31, 2022. The Trustees noted the reasons for the Fund’s underperformance and the steps the Adviser had taken or was taking to improve performance.
· For Janus Henderson Multi-Sector Income Fund, the Trustees noted that the Fund’s performance was in the second Broadridge quartile for the 36 months ended May 31, 2022 and the third Broadridge quartile for the 12 months ended May 31, 2022.
· For Janus Henderson Short Duration Flexible Bond Fund, the Trustees noted that the Fund’s performance was in the third Broadridge quartile for the 36 months ended May 31, 2022 and the bottom Broadridge quartile for the 12 months ended May 31, 2022. The Trustees noted the reasons for the Fund’s underperformance and the steps the Adviser had taken or was taking to improve performance.
Global and International Equity Funds
· For Janus Henderson Asia Equity Fund, the Trustees noted that the Fund’s performance was in the third Broadridge quartile for the 36 months ended May 31, 2022 and the third Broadridge quartile for the 12 months ended May 31, 2022. The Trustees noted the reasons for the Fund’s underperformance, while also noting that the Fund has a performance fee structure that results in lower management fees during periods of underperformance, and the steps the Adviser had taken or was taking to improve performance.
· For Janus Henderson Emerging Markets Fund, the Trustees noted that the Fund’s performance was in the third Broadridge quartile for the 36 months ended May 31, 2022 and the third Broadridge quartile for the 12 months ended May 31, 2022. The Trustees noted the reasons for the Fund’s underperformance and the steps the Adviser had taken or was taking to improve performance.
· For Janus Henderson European Focus Fund, the Trustees noted that the Fund’s performance was in the first Broadridge quartile for the 36 months ended May 31, 2022 and the second Broadridge quartile for the 12 months ended May 31, 2022.
· For Janus Henderson Global Equity Income Fund, the Trustees noted that the Fund’s performance was in the third Broadridge quartile for the 36 months ended May 31, 2022 and the first Broadridge quartile for the 12 months ended May 31, 2022. The Trustees noted the reasons for the Fund’s underperformance, the steps the Adviser had taken or was taking to improve performance, and that the performance trend was improving.
· For Janus Henderson Global Life Sciences Fund, the Trustees noted that the Fund’s performance was in the third Broadridge quartile for the 36 months ended May 31, 2022 and the second Broadridge quartile for the 12 months ended May 31, 2022. The Trustees noted the reasons for the Fund’s underperformance, the steps the Adviser had taken or was taking to improve performance, and that the performance trend was improving.
· For Janus Henderson Global Sustainable Equity Fund, the Trustees noted that the Fund’s performance was in the second Broadridge quartile for the 12 months ended May 31, 2022. The Trustees noted that 36 month-end performance was not yet available.
Janus Henderson U.S. Dividend Income Fund
Additional Information (unaudited)
· For Janus Henderson Global Real Estate Fund, the Trustees noted that the Fund’s performance was in the second Broadridge quartile for the 36 months ended May 31, 2022 and the bottom Broadridge quartile for the 12 months ended May 31, 2022.
· For Janus Henderson Global Research Fund, the Trustees noted that the Fund’s performance was in the second Broadridge quartile for the 36 months ended May 31, 2022 and the first Broadridge quartile for the 12 months ended May 31, 2022.
· For Janus Henderson Global Select Fund, the Trustees noted that the Fund’s performance was in the first Broadridge quartile for the 36 months ended May 31, 2022 and the first Broadridge quartile for the 12 months ended May 31, 2022.
· For Janus Henderson Global Technology and Innovation Fund, the Trustees noted that the Fund’s performance was in the second Broadridge quartile for the 36 months ended May 31, 2022 and the second Broadridge quartile for the 12 months ended May 31, 2022.
· For Janus Henderson International Opportunities Fund, the Trustees noted that the Fund’s performance was in the bottom Broadridge quartile for the 36 months ended May 31, 2022 and the third Broadridge quartile for the 12 months ended May 31, 2022. The Trustees noted the reasons for the Fund’s underperformance and the steps the Adviser had taken or was taking to improve performance.
· For Janus Henderson Overseas Fund, the Trustees noted that the Fund’s performance was in the first Broadridge quartile for the 36 months ended May 31, 2022 and the first Broadridge quartile for the 12 months ended May 31, 2022.
· For Janus Henderson Responsible International Dividend Fund (formerly the Janus Henderson Dividend & Income Builder Fund), the Trustees noted that the Fund’s performance was in the bottom Broadridge quartile for the 36 months ended May 31, 2022 and the bottom Broadridge quartile for the 12 months ended May 31, 2022. The Trustees noted the reasons for the Fund’s underperformance and the steps the Adviser had taken or was taking to improve performance.
Money Market Funds
· For Janus Henderson Government Money Market Fund, the Trustees noted that the Fund’s performance was in the third Broadridge quartile for the 36 months ended May 31, 2022 and the bottom Broadridge quartile for the 12 months ended May 31, 2022. The Trustees noted the reasons for the Fund’s underperformance and the steps the Adviser had taken or was taking to improve performance.
· For Janus Henderson Money Market Fund, the Trustees noted that the Fund’s performance was in the third Broadridge quartile for the 36 months ended May 31, 2022 and the bottom Broadridge quartile for the 12 months ended May 31, 2022. The Trustees noted the reasons for the Fund’s underperformance and the steps the Adviser had taken or was taking to improve performance.
Multi-Asset Funds
· For Janus Henderson Adaptive Global Allocation Fund, the Trustees noted that the Fund’s performance was in bottom Broadridge quartile for the 36 months ended May 31, 2022 and the second Broadridge quartile for the 12 months ended May 31, 2022. The Trustees noted the reasons for the Fund’s underperformance, the steps the Adviser had taken or was taking to improve performance, and that the performance trend was improving.
· For Janus Henderson Balanced Fund, the Trustees noted that the Fund’s performance was in the first Broadridge quartile for the 36 months ended May 31, 2022 and the first Broadridge quartile for the 12 months ended May 31, 2022.
U.S. Equity Funds
· For Janus Henderson Adaptive Risk Managed U.S. Equity Fund, the Trustees noted that the Fund’s performance was in the bottom Broadridge quartile for the 36 months ended May 31, 2022 and the second Broadridge quartile for the 12 months ended May 31, 2022. The Trustees noted the reasons for the Fund’s underperformance, the steps the Adviser had taken or were taking to improve performance, and that the performance trend was improving.
Janus Henderson U.S. Dividend Income Fund
Additional Information (unaudited)
· For Janus Henderson Contrarian Fund, the Trustees noted that the Fund’s performance was in the first Broadridge quartile for the 36 months ended May 31, 2022 and the bottom Broadridge quartile for the 12 months ended May 31, 2022.
· For Janus Henderson Enterprise Fund, the Trustees noted that the Fund’s performance was in the second Broadridge quartile for the 36 months ended May 31, 2022 and the first Broadridge quartile for the 12 months ended May 31, 2022.
· For Janus Henderson Forty Fund, the Trustees noted that the Fund’s performance was in the third Broadridge quartile for the 36 months ended May 31, 2022 and the bottom Broadridge quartile for the 12 months ended May 31, 2022. The Trustees noted the reasons for the Fund’s underperformance and the steps the Adviser had taken or was taking to improve performance.
· For Janus Henderson Growth and Income Fund, the Trustees noted that the Fund’s performance was in the bottom Broadridge quartile for the 36 months ended May 31, 2022 and the first Broadridge quartile for the 12 months ended May 31, 2022. The Trustees noted the reasons for the Fund’s underperformance, the steps the Adviser had taken or was taking to improve performance, and that the performance trend was improving.
· For Janus Henderson Mid Cap Value Fund, the Trustees noted that the Fund’s performance was in the bottom Broadridge quartile for the 36 months ended May 31, 2022 and the second Broadridge quartile for the 12 months ended May 31, 2022. The Trustees noted the reasons for the Fund’s underperformance, while also noting that the Fund has a performance fee structure that results in lower management fees during periods of underperformance, the steps the Adviser had taken or was taking to improve performance, and that the performance trend was improving.
· For Janus Henderson Research Fund, the Trustees noted that the Fund’s performance was in the third Broadridge quartile for the 36 months ended May 31, 2022 and the third Broadridge quartile for the 12 months ended May 31, 2022. The Trustees noted the reasons for the Fund’s underperformance, while also noting that the Fund has a performance fee structure that results in lower management fees during periods of underperformance and the steps the Adviser had taken or was taking to improve performance.
· For Janus Henderson Small Cap Value Fund, the Trustees noted that the Fund’s performance was in the bottom Broadridge quartile for the 36 months ended May 31, 2022 and the second Broadridge quartile for the 12 months ended May 31, 2022. The Trustees noted the reasons for the Fund’s underperformance, while also noting that the Fund has a performance fee structure that results in lower management fees during periods of underperformance, the steps the Adviser had taken or was taking to improve performance, and that the performance trend was improving.
· For Janus Henderson Small-Mid Cap Value Fund, the Trustees noted that the Fund’s performance was in the bottom Broadridge quartile for the 36 months ended May 31, 2022 and the second Broadridge quartile for the 12 months ended May 31, 2022. The Trustees noted the reasons for the Fund’s underperformance, while also noting that the Fund has a performance fee structure that results in lower management fees during periods of underperformance, the steps the Adviser had taken or was taking to improve performance, and that the performance trend is improving.
· For Janus Henderson Triton Fund, the Trustees noted that the Fund’s performance was in the bottom Broadridge quartile for the 36 months ended May 31, 2022 and the second Broadridge quartile for the 12 months ended May 31, 2022. The Trustees noted the reasons for the Fund’s underperformance, the steps the Adviser had taken or was taking to improve performance, and that the performance trend was improving.
· For Janus Henderson Venture Fund, the Trustees noted that the Fund’s performance was in the bottom Broadridge quartile for the 36 months ended May 31, 2022 and the second Broadridge quartile for the 12 months ended May 31, 2022. The Trustees noted the reasons for the Fund’s underperformance, the steps the Adviser had taken or was taking to improve performance, and that the performance trend was improving.
In consideration of each Janus Henderson Fund’s performance, the Trustees concluded that, taking into account the factors relevant to performance, as well as other considerations, including steps taken to improve performance, as applicable, the Janus Henderson Fund’s performance warranted continuation of such Janus Henderson Fund’s investment advisory agreement.
Janus Henderson U.S. Dividend Income Fund
Additional Information (unaudited)
Costs of Services Provided
The Trustees examined information regarding the fees and expenses of each Janus Henderson Fund in comparison to similar information for other comparable funds as provided by Broadridge, an independent data provider. They also reviewed an analysis of that information provided by their independent fee consultant. The independent fee consultant provided its belief that the management fees charged by the Adviser to each of the Janus Henderson Funds under the current investment advisory and administration agreements are reasonable in relation to the services provided by the Adviser. The independent fee consultant found: (1) the total expenses and management fees of the Janus Henderson Funds to be reasonable relative to other comparable mutual funds; (2) the total expenses, on average, were 6% under the average total expenses of the respective Broadridge peer group; and (3) the management fees for the Janus Henderson Funds, on average, were 5% under the average management fees for the respective Broadridge peer group. The Trustees also considered the total expenses for each share class of each Janus Henderson Fund compared to the average total expenses for its Broadridge Expense Group and to average total expenses for its Broadridge Expense Universe.
For Janus Henderson Funds with three or more years of performance history, the independent fee consultant also performed a systematic “focus list” analysis of expenses which assessed fund fees in the context of fund performance being delivered. Based on this analysis, the independent fee consultant found that the combination of service quality/performance and expenses on these individual Janus Henderson Funds was reasonable in light of performance trends, performance histories, changes in portfolio management, relative average net asset levels, and the existence of performance fees, breakpoints, and/or expense waivers on such Janus Henderson Funds.
The Trustees considered the methodology used by the Adviser in determining compensation payable to portfolio managers, the competitive environment for investment management talent, and the competitive market for mutual funds in different distribution channels.
The Trustees also reviewed management fees charged by the Adviser to comparable separate account clients and to comparable non-affiliated funds subadvised by the Adviser (for which the Adviser provides only or primarily portfolio management services). Although in most instances subadvisory and separate account fee rates for various investment strategies were lower than management fee rates for Janus Henderson Funds having a similar strategy, the Trustees considered that the Adviser noted that, under the terms of the management agreements with the Janus Henderson Funds, the Adviser performs significant additional services for the Janus Henderson Funds that it does not provide to those other clients, including administration services, oversight of the Janus Henderson Funds’ other service providers, Trustee support, regulatory compliance and numerous other services, and that, in serving the Janus Henderson Funds, the Adviser assumes many legal risks and other costs that it does not assume in servicing its other clients. Moreover, the Trustees noted that the independent fee consultant found that: (1) the management fees the Adviser charges to the Janus Henderson Funds are reasonable in relation to the management fees the Adviser charges to funds subadvised by the Adviser and to the fees the Adviser charges to its institutional separate account clients; (2) these subadvised and institutional separate accounts have different service and infrastructure needs and operate in markets very different from the retail fund market; (3) Janus Henderson mutual fund investors enjoy reasonable fees relative to the fees charged in these other markets; and (4) as part of its 2022 review, 9 of 11 Janus Henderson Funds have lower management fees than similar funds subadvised by the Adviser. The Trustees noted that for the two Janus Henderson Funds that did not, management fees for each were under the average of its 15(c) peer group.
The Trustees considered the fees for each Janus Henderson Fund for its fiscal year ended in 2021 and noted the following with regard to each Janus Henderson Fund’s total expenses, net of applicable fee waivers (the Fund’s “total expenses”) as reflected in the comparative information provided by Broadridge:
Asset Allocation Funds
· For Janus Henderson Global Allocation Fund – Conservative, the Trustees noted that, although the Fund’s total expenses exceeded the peer group average for certain share classes, overall the Fund’s total expenses were reasonable. The Trustees also noted that the Adviser has contractually agreed to limit the Fund’s expenses.
· For Janus Henderson Global Allocation Fund – Growth, the Trustees noted that, although the Fund’s total expenses exceeded the peer group average for certain share classes, overall the Fund’s total expenses were reasonable. The Trustees also noted that the Adviser has contractually agreed to limit the Fund’s expenses, although this limit did not apply because the Fund’s total expenses as shown were below the applicable fee limit.
Janus Henderson U.S. Dividend Income Fund
Additional Information (unaudited)
· For Janus Henderson Global Allocation Fund – Moderate, the Trustees noted that, although the Fund’s total expenses exceeded the peer group average for one share class, overall the Fund’s total expenses were reasonable. The Trustees also noted that the Adviser has contractually agreed to limit the Fund’s expenses.
Fixed-Income Funds
· For Janus Henderson Absolute Return Income Opportunities Fund, the Trustees noted that, although the Fund’s total expenses exceeded the peer group average for certain share classes, overall the Fund’s total expenses were reasonable. The Trustees also noted that the Adviser has contractually agreed to limit the Fund’s expenses.
· For Janus Henderson Developed World Bond Fund, the Trustees noted that, although the Fund’s total expenses exceeded the peer group average for one share class, overall the Fund’s total expenses were reasonable. The Trustees also noted that the Adviser has contractually agreed to limit the Fund’s expenses.
· For Janus Henderson Flexible Bond Fund, the Trustees noted that, although the Fund’s total expenses exceeded the peer group average for certain share classes, overall the Fund’s total expenses were reasonable. The Trustees also noted that the Adviser has contractually agreed to limit the Fund’s expenses, although this limit did not apply because the Fund’s total expenses as shown were below the applicable fee limit.
· For Janus Henderson Global Bond Fund, the Trustees noted that, although the Fund’s total expenses exceeded the peer group average for certain share classes, overall the Fund’s total expenses were reasonable. The Trustees also noted that the Adviser has contractually agreed to limit the Fund’s expenses.
· For Janus Henderson High-Yield Fund, the Trustees noted that, although the Fund’s total expenses exceeded the peer group average for certain share classes, overall the Fund’s total expenses were reasonable. The Trustees also noted that the Adviser has contractually agreed to limit the Fund’s expenses.
· For Janus Henderson Multi-Sector Income Fund, the Trustees noted that, although the Fund’s total expenses exceeded the peer group average for certain share classes, overall the Fund’s total expenses were reasonable. The Trustees also noted that the Adviser has contractually agreed to limit the Fund’s expenses.
· For Janus Henderson Short Duration Flexible Bond Fund, the Trustees noted that, although the Fund’s total expenses exceeded the peer group average for certain share classes, overall the Fund’s total expenses were reasonable. The Trustees also noted that the Adviser has contractually agreed to limit the Fund’s expenses.
Global and International Equity Funds
· For Janus Henderson Asia Equity Fund, the Trustees noted that, although the Fund’s total expenses exceeded the peer group average for certain share classes, overall the Fund’s total expenses were reasonable. The Trustees also noted that the Adviser has contractually agreed to limit the Fund’s expenses.
· For Janus Henderson Emerging Markets Fund, the Trustees noted that, although the Fund’s total expenses exceeded the peer group average for certain share classes, overall the Fund’s total expenses were reasonable. The Trustees also noted that the Adviser has contractually agreed to limit the Fund’s expenses.
· For Janus Henderson European Focus Fund, the Trustees noted that, although the Fund’s total expenses exceeded the peer group average for one share class, overall the Fund’s expenses were reasonable. The Trustees also noted that the Adviser has contractually agreed to limit the Fund’s expenses.
· For Janus Henderson Global Equity Income Fund, the Trustees noted that, although the Fund’s total expenses exceeded the peer group average for one share class, overall the Fund’s total expenses were reasonable. The Trustees also noted that the Adviser has contractually agreed to limit the Fund’s expenses, although this limit did not apply because the Fund’s total expenses as shown were below the applicable fee limit.
· For Janus Henderson Global Life Sciences Fund, the Trustees noted that the Fund’s total expenses were below the peer group average for all share classes.
· For Janus Henderson Global Real Estate Fund, the Trustees noted that, although the Fund’s total expenses exceeded the peer group average for certain share classes, overall the Fund’s total expenses were reasonable. The Trustees also noted that the Adviser has contractually agreed to limit the Fund’s expenses, although this limit did not apply because the Fund’s total expenses as shown were below the applicable fee limit.
Janus Henderson U.S. Dividend Income Fund
Additional Information (unaudited)
· For Janus Henderson Global Research Fund, the Trustees noted that, although the Fund’s total expenses exceeded the peer group average for one share class, overall the Fund’s total expenses were reasonable. The Trustees also noted that the Adviser has contractually agreed to limit the Fund’s expenses, although this limit did not apply because the Fund’s total expenses as shown were below the applicable fee limit.
· For Janus Henderson Global Select Fund, the Trustees noted that, although the Fund’s total expenses exceeded the peer group average for certain share classes, overall the Fund’s total expenses were reasonable. The Trustees also noted that the Adviser has contractually agreed to limit the Fund’s expenses.
· For Janus Henderson Global Sustainable Equity Fund, the Trustees noted that, although the Fund’s total expenses exceeded the peer group average for certain share classes, overall the Fund’s expenses were reasonable. The Trustees also noted that the Adviser has contractually agreed to limit the Fund’s expenses.
· For Janus Henderson Global Technology and Innovation Fund, the Trustees noted that the Fund’s total expenses were below the peer group average for all share classes.
· For Janus Henderson International Opportunities Fund, the Trustees noted that, although the Fund’s total expenses exceeded the peer group average for certain share classes, overall the Fund’s expenses were reasonable. The Trustees also noted that the Adviser has contractually agreed to limit the Fund’s expenses.
· For Janus Henderson Overseas Fund, the Trustees noted that although the Fund’s total expenses exceeded the peer group average for certain share classes, overall the Fund’s total expenses were reasonable. The Trustees also noted that the Adviser has contractually agreed to limit the Fund’s expenses, although this limit did not apply because the Fund’s total expenses as shown were below the applicable fee limit.
· For Janus Henderson Responsible International Dividend Fund (formerly the Janus Henderson Dividend & Income Builder Fund), the Trustees noted that, although the Fund’s total expenses exceeded the peer group for one share class, overall the Fund’s total expenses were reasonable. The Trustees also noted that the Adviser has contractually agreed to limit the Fund’s expenses.
Money Market Funds
· For Janus Henderson Government Money Market Fund, the Trustees noted that the Fund’s total expenses were below the peer group average for all share classes.
· For Janus Henderson Money Market Fund, the Trustees noted that the Fund’s total expenses were below the peer group average for all share classes.
Multi-Asset Funds
· For Janus Henderson Adaptive Global Allocation Fund, the Trustees noted that, that the Fund’s total expenses were below the peer group average for all share classes.
· For Janus Henderson Balanced Fund, the Trustees noted that, although the Fund’s total expenses exceeded the peer group average for certain share classes, overall the Fund’s total expenses were reasonable. The Trustees also noted that the Adviser has contractually agreed to limit the Fund’s expenses, although this limit did not apply because the Fund’s total expenses as shown were below the applicable fee limit.
U.S. Equity Funds
· For Janus Henderson Adaptive Risk Managed U.S. Equity Fund, the Trustees noted that, although the Fund’s total expenses exceeded the peer group average for certain share classes, overall the Fund’s total expenses were reasonable. The Trustees also noted that the Adviser has contractually agreed to limit the Fund’s expenses, although this limit did not apply because the Fund’s total expenses as shown were below the applicable fee limit.
· For Janus Henderson Contrarian Fund, the Trustees noted that, although the Fund’s total expenses exceeded the peer group average for all share classes, overall the Fund’s total expenses were reasonable. The Trustees also noted that the Adviser had contractually agreed to limit the Fund’s expenses.
· For Janus Henderson Enterprise Fund, the Trustees noted that, although the Fund’s total expenses exceeded the peer group average for certain share classes, overall the Fund’s total expenses were reasonable. The Trustees also noted that the Adviser has contractually agreed to limit the Fund’s expenses, although this limit did not apply because the Fund’s total expenses as shown were below the applicable fee limit.
Janus Henderson U.S. Dividend Income Fund
Additional Information (unaudited)
· For Janus Henderson Forty Fund, the Trustees noted that, although the Fund’s total expenses exceeded the peer group average for certain share classes, overall the Fund’s total expenses were reasonable. The Trustees also noted that the Adviser has contractually agreed to limit the Fund’s expenses, although this limit did not apply because the Fund’s total expenses as shown were below the applicable fee limit.
· For Janus Henderson Growth and Income Fund, the Trustees noted that, although the Fund’s total expenses exceeded the peer group average for certain share classes, overall the Fund’s total expenses were reasonable. The Trustees also noted that the Adviser has contractually agreed to limit the Fund’s expenses, although this limit did not apply because the Fund’s total expenses as shown were below the applicable fee limit.
· For Janus Henderson Mid Cap Value Fund, the Trustees noted that the Fund’s total expenses were below the peer group average for all share classes.
· For Janus Henderson Research Fund, the Trustees noted that, although the Fund’s total expenses exceeded the peer group average for certain share classes, overall the Fund’s total expenses were reasonable. The Trustees also noted that the Adviser has contractually agreed to limit the Fund’s expenses.
· For Janus Henderson Small Cap Value Fund, the Trustees noted that, although the Fund’s total expenses exceeded the peer group average for one share class, overall the Fund’s total expenses were reasonable. The Trustees also noted that the Adviser has contractually agreed to limit the Fund’s expenses, although this limit did not apply because the Fund’s total expenses as shown were below the applicable fee limit.
· For Janus Henderson Small-Mid Cap Value Fund, the Trustees noted that the Fund’s total expenses were below the peer group average for all share classes.
· For Janus Henderson Triton Fund, the Trustees noted that, although the Fund’s total expenses exceeded the peer group average for one share class, overall the Fund’s total expenses were reasonable. The Trustees also noted that the Adviser has contractually agreed to limit the Fund’s expenses, although this limit did not apply because the Fund’s total expenses as shown were below the applicable fee limit.
· For Janus Henderson Venture Fund, the Trustees noted that although the Fund’s total expenses exceeded the peer group average for one share class, overall the Fund’s total expenses were reasonable. The Trustees also noted that the Adviser has contractually agreed to limit the Fund’s expenses, although this limit did not apply because the Fund’s total expenses as shown were below the applicable fee limit.
The Trustees reviewed information on the overall profitability to the Adviser and its affiliates from their relationships with the Janus Henderson Funds, and considered profitability data of other publicly traded mutual fund advisers. The Trustees recognized that profitability comparisons among fund managers are difficult because of the variation in the type of comparative information that is publicly available, and the profitability of any fund manager is affected by numerous factors, including the organizational structure of the particular fund manager, differences in complex size, difference in product mix, difference in types of business (mutual fund, institutional and other), differences in the types of funds and other accounts it manages, possible other lines of business, the methodology for allocating expenses and the fund manager’s capital structure and cost of capital.
Additionally, the Trustees considered the estimated profitability to the Adviser from the investment management services it provided to each Janus Henderson Fund. In their review, the Trustees considered whether the Adviser receive adequate incentives and resources to manage the Janus Henderson Funds effectively. In reviewing profitability, the Trustees noted that the estimated profitability for an individual Janus Henderson Fund is necessarily a product of the allocation methodology utilized by the Adviser to allocate its expenses as part of the estimated profitability calculation. In this regard, the Trustees noted that the independent fee consultant found as part of its 2022 review that (1) the expense allocation methodology and rationales utilized by the Adviser were reasonable and (2) no clear correlation exists between expense allocations and operating margins. The Trustees also considered that the estimated profitability for an individual Janus Henderson Fund was influenced by a number of factors, including not only the allocation methodology selected, but also the presence of fee waivers and expense caps, and whether the Janus Henderson Fund’s investment management agreement contained breakpoints or a performance fee component. The Trustees determined, after taking into account these factors, among others, that the Adviser’s estimated profitability with respect to each Janus Henderson Fund was not unreasonable in relation to the services provided, and that the variation in the range of such estimated profitability among the Janus Henderson Funds was not a material factor in the Board’s approval of the reasonableness of any Janus Henderson Fund’s investment management fees.
Janus Henderson U.S. Dividend Income Fund
Additional Information (unaudited)
The Trustees concluded that the management fees payable by each Janus Henderson Fund to the Adviser were reasonable in relation to the nature, extent, and quality of the services provided, taking into account the fees charged by other advisers for managing comparable mutual funds with similar strategies, the fees the Adviser charges to other clients, and, as applicable, the impact of fund performance on management fees payable by the Janus Henderson Funds. The Trustees also concluded that each Janus Henderson Fund’s total expenses were reasonable, taking into account the size of the Janus Henderson Fund, the quality of services provided by the Adviser, the investment performance of the Janus Henderson Fund, and any expense limitations agreed to or provided by the Adviser.
Economies of Scale
The Trustees considered information about the potential for the Adviser to realize economies of scale as the assets of the Janus Henderson Funds increase. They noted that their independent fee consultant published a report to the Trustees in June 2022 which provided its research and analysis into economies of scale. They also noted that, although many Janus Henderson Funds pay advisory fees at a fixed base rate as a percentage of net assets, without any breakpoints or performance fees, their independent fee consultant concluded that 75% of these Janus Henderson Funds’ have contractual management fees (gross of waivers) below their Broadridge Expense Group averages. The Trustees also noted the following from the independent fee consultant’s report: (1) that 31% of Janus Henderson Funds had management fee breakpoints in place whereby investors pay lower management fees as fund AUM increases; (2) that 29% of Janus Henderson Funds have low flat-rate fees and performance fees where the Adviser is incentivized to invest in resources which drive Janus Henderson Fund performance; and (3) that 39% of Janus Henderson Funds have low flat-rate fees versus peers where investors pay low fixed fees when the Janus Henderson Fund is small/midsized and higher fees when the Janus Henderson Fund grows in assets. The Trustees also noted that the Janus Henderson Funds share directly in economies of scale through the significant investments made by the Adviser and its affiliates related to services provided to the Funds and the lower charges of third-party service providers that are based in part on the combined scale of all of the Janus Henderson Funds.
The Trustees also considered the independent fee consultant’s conclusion that, given the limitations of various analytical approaches to economies of scale and their conflicting results, it is difficult to analytically confirm or deny the existence of economies of scale in the Janus Henderson complex. In this regard, the independent consultant concluded that (1) to the extent there were economies of scale at the Adviser, the Adviser’s general strategy of setting fixed management fees below peers appeared to share any such economies with investors even on smaller Janus Henderson Funds which have not yet achieved those economies and (2) by setting lower fixed fees from the start on these Janus Henderson Funds, the Adviser appeared to be investing to increase the likelihood that these Janus Henderson Funds will grow to a level to achieve any economies of scale that may exist. Further, the independent fee consultant provided its belief that Janus Henderson Fund investors are well-served by the fee levels and performance fee structures in place on the Janus Henderson Funds in light of any economies of scale that may be present at the Adviser.
Based on all of the information reviewed, including the recent and past research and analysis conducted by the Trustees’ independent fee consultant, the Trustees concluded that the current fee structure of each Janus Henderson Fund was reasonable and that the current rates of fees do reflect a sharing between the Adviser and the Janus Henderson Fund of any economies of scale that may be present at the current asset level of the Janus Henderson Fund.
Other Benefits to the Adviser
The Trustees also considered benefits that accrue to the Adviser and its affiliates from their relationships with the Janus Henderson Funds. They recognized that two affiliates of the Adviser separately serve the Janus Henderson Funds as transfer agent and distributor, respectively, and the transfer agent receives compensation directly from the non-money market Janus Henderson Funds for services provided, and that such compensation contributes to the overall profitability of the Adviser and its affiliates that results from their relationship with the Janus Henderson Funds. The Trustees also considered the Adviser’s past and proposed use of commissions paid by the Janus Henderson Funds on portfolio brokerage transactions to obtain proprietary and third-party research products and services benefiting the Janus Henderson Fund and/or other clients of the Adviser and/or the Adviser. The Trustees concluded that the Adviser’s use of these types of client commission arrangements to obtain proprietary and third-party research products and services was consistent with regulatory requirements and guidelines and was likely to benefit each Janus Henderson Fund. The Trustees also concluded that, other than the services provided by the Adviser and its affiliates pursuant to the agreements and the fees to be paid by each Janus Henderson Fund therefor, the Janus Henderson
Janus Henderson U.S. Dividend Income Fund
Additional Information (unaudited)
Funds and the Adviser may potentially benefit from their relationship with each other in other ways. They concluded that the Adviser and its affiliates share directly in economies of scale through the lower charges of third-party service providers that are based in part on the combined scale of the Janus Henderson Funds and other clients serviced by the Adviser and its affiliates. They also concluded that the Adviser benefits from the receipt of research products and services acquired through commissions paid on portfolio transactions of the Janus Henderson Funds and that the Janus Henderson Funds benefit from the Adviser’s receipt of those products and services as well as research products and services acquired through commissions paid by other clients of the Adviser. They further concluded that the success of any Janus Henderson Fund could attract other business to the Adviser or other Janus Henderson Funds, and that the success of the Adviser could enhance the Adviser’s ability to serve the Janus Henderson Funds.
Janus Henderson U.S. Dividend Income Fund
Liquidity Risk Management Program (unaudited)
Liquidity Risk Management Program
Rule 22e-4 under the Investment Company Act of 1940, as amended (the “Liquidity Rule”), requires open-end funds (but not money market funds) to adopt and implement a written liquidity risk management program (the “LRMP”) that is reasonably designed to assess and manage liquidity risk, which is the risk that a fund could not meet redemption requests without significant dilution of remaining investors’ interest in the fund. The Fund has implemented a LRMP, which incorporates the following elements: (i) assessment, management, and periodic review of liquidity risk; (ii) classification of portfolio holdings; (iii) the establishment and monitoring of a highly liquid investment minimum, as applicable; (iv) a 15% limitation on a Fund’s illiquid investments; (v) redemptions in-kind; and (vi) board oversight.
The Trustees of the Fund (the “Trustees”) have designated Janus Henderson Investors US LLC, the Fund’s investment adviser (the “Adviser”), as the Program Administrator for the LRMP responsible for administering the LRMP and carrying out the specific responsibilities of the LRMP. A working group comprised of various teams within the Adviser’s business is responsible for administering the LRMP and carrying out the specific responsibilities of different aspects of the LRMP (the “Liquidity Risk Working Group”). In assessing each Fund’s liquidity risk, the Liquidity Risk Working Group periodically considers, as relevant, factors including (i) the liquidity of a Fund’s portfolio investments during normal and reasonably foreseeable stressed conditions; (ii) whether a Fund’s investment strategy is appropriate for an open-end fund; (iii) the extent to which a Fund’s strategy involves a relatively concentrated portfolio or large positions in any issuer; (iv) a Fund’s use of borrowing for investment purposes; and (v) a Fund’s use of derivatives.
The Liquidity Rule requires the Trustees to review at least annually a written report provided by the Program Administrator that addresses the operation of the LRMP and assesses its adequacy and the effectiveness of its implementation, including, if applicable, the operation of the highly liquid investment minimum, and any material changes to the LRMP (the “Program Administrator Report”). At a meeting held on March 15, 2023, the Adviser provided the Program Administrator Report to the Trustees which covered the operation of the LRMP from January 1, 2022 through December 31, 2022 (the “Reporting Period”).
The Program Administrator Report discussed the operation and effectiveness of the LRMP during the Reporting Period. Among other things, the Program Administrator Report indicated that there were no material changes to the LRMP during the Reporting Period, although there were certain methodology adjustments implemented relating to a change in data provider. Additionally, the findings presented in the Program Administrator Report indicated that the LRMP operated adequately during the Reporting Period. These findings included that the Fund was able to meet redemptions during the normal course of business during the Reporting Period. The Program Administrator Report also stated that the Fund did not exceed the 15% limit on illiquid assets during the Reporting Period, that the Fund held primarily highly liquid assets, and was considered to be a primarily highly liquid fund during the Reporting Period. Also included among the Program Administrator Report’s findings was the determination that the Fund’s investment strategy remains appropriate for an open-end fund. In addition, the Adviser expressed its belief in the Program Administrator Report that the LRMP is reasonably designed and adequate to assess and manage the Fund’s liquidity risk, considering the Fund’s particular risks and circumstances, and includes policies and procedures reasonably designed to implement each required component of the Liquidity Rule.
There can be no assurance that the LRMP will achieve its objectives in the future. Please refer to your Fund’s prospectus for more information regarding the risks to which an investment in the Fund may be subject.
Janus Henderson U.S. Dividend Income Fund
Useful Information About Your Fund Report (unaudited)
Performance Overviews
Performance overview graphs compare the performance of a hypothetical $10,000 investment in the Fund with one or more widely used market indices. When comparing the performance of the Fund with an index, keep in mind that market indices are not available for investment and do not reflect deduction of expenses.
Average annual total returns are quoted for a Fund with more than one year of performance history. Average annual total return is calculated by taking the growth or decline in value of an investment over a period of time, including reinvestment of dividends and distributions, then calculating the annual compounded percentage rate that would have produced the same result had the rate of growth been constant throughout the period. Average annual total return does not reflect the deduction of taxes that a shareholder would pay on Fund distributions or redemptions of Fund shares.
Cumulative total returns are quoted for a Fund with less than one year of performance history. Cumulative total return is the growth or decline in value of an investment over time, independent of the period of time involved. Cumulative total return does not reflect the deduction of taxes that a shareholder would pay on Fund distributions or redemptions of Fund shares.
Pursuant to federal securities rules, expense ratios shown in the performance chart reflect subsidized (if applicable) and unsubsidized ratios. The total annual fund operating expenses ratio is gross of any fee waivers, reflecting the Fund’s unsubsidized expense ratio. The net annual fund operating expenses ratio (if applicable) includes contractual waivers of the Adviser and reflects the Fund’s subsidized expense ratio. Ratios may be higher or lower than those shown in the “Financial Highlights” in this report.
Schedule of Investments
Following the performance overview section is the Fund’s Schedule of Investments. This schedule reports the types of securities held in the Fund on the last day of the reporting period. Securities are usually listed by type (common stock, corporate bonds, U.S. Government obligations, etc.) and by industry classification (banking, communications, insurance, etc.). Holdings are subject to change without notice.
The value of each security is quoted as of the last day of the reporting period. The value of securities denominated in foreign currencies is converted into U.S. dollars.
If the Fund invests in foreign securities, it will also provide a summary of investments by country. This summary reports the Fund exposure to different countries by providing the percentage of securities invested in each country. The country of each security represents the country of risk. A company may be allocated to a country based on other factors such as location of the company’s principal office, the location of the principal trading market for the company’s securities, or the country where a majority of the company’s revenues are derived. The Fund’s Schedule of Investments relies upon the industry group and country classifications published by Bloomberg and/or MSCI Inc.
Tables listing details of individual forward currency contracts, futures, written options, swaptions, and swaps follow the Fund’s Schedule of Investments (if applicable).
Statement of Assets and Liabilities
This statement is often referred to as the “balance sheet.” It lists the assets and liabilities of the Fund on the last day of the reporting period.
The Fund’s assets are calculated by adding the value of the securities owned, the receivable for securities sold but not yet settled, the receivable for dividends declared but not yet received on securities owned, and the receivable for Fund shares sold to investors but not yet settled. The Fund’s liabilities include payables for securities purchased but not yet settled, Fund shares redeemed but not yet paid, and expenses owed but not yet paid. Additionally, there may be other assets and liabilities such as unrealized gain or loss on forward currency contracts.
The section entitled “Net Assets Consist of” breaks down the components of the Fund’s net assets. Because the Fund must distribute substantially all earnings, you will notice that a significant portion of net assets is shareholder capital.
The last section of this statement reports the net asset value (“NAV”) per share on the last day of the reporting period. The NAV is calculated by dividing the Fund’s net assets for each share class (assets minus liabilities) by the number of shares outstanding.
Janus Henderson U.S. Dividend Income Fund
Useful Information About Your Fund Report (unaudited)
Statement of Operations
This statement details the Fund’s income, expenses, realized gains and losses on securities and currency transactions, and changes in unrealized appreciation or depreciation of Fund holdings.
The first section in this statement, entitled “Investment Income,” reports the dividends earned from securities and interest earned from interest-bearing securities in the Fund.
The next section reports the expenses incurred by the Fund, including the advisory fee paid to the investment adviser, transfer agent fees and expenses, and printing and postage for mailing statements, financial reports and prospectuses. Expense offsets and expense reimbursements, if any, are also shown.
The last section lists the amounts of realized gains or losses from investment and foreign currency transactions, and changes in unrealized appreciation or depreciation of investments and foreign currency-denominated assets and liabilities. The Fund will realize a gain (or loss) when it sells its position in a particular security. A change in unrealized gain (or loss) refers to the change in net appreciation or depreciation of the Fund during the reporting period. “Net Realized and Unrealized Gain/(Loss) on Investments” is affected both by changes in the market value of Fund holdings and by gains (or losses) realized during the reporting period.
Statements of Changes in Net Assets
These statements report the increase or decrease in the Fund’s net assets during the reporting period. Changes in the Fund’s net assets are attributable to investment operations, dividends and distributions to investors, and capital share transactions. This is important to investors because it shows exactly what caused the Fund’s net asset size to change during the period.
The first section summarizes the information from the Statement of Operations regarding changes in net assets due to the Fund’s investment operations. The Fund’s net assets may also change as a result of dividend and capital gains distributions to investors. If investors receive their dividends and/or distributions in cash, money is taken out of the Fund to pay the dividend and/or distribution. If investors reinvest their dividends and/or distributions, the Fund’s net assets will not be affected.
The reinvestment of dividends and distributions is included under “Capital Share Transactions.” “Capital Shares” refers to the money investors contribute to the Fund through purchases or withdrawals via redemptions. The Fund’s net assets will increase and decrease in value as investors purchase and redeem shares from the Fund.
Financial Highlights
This schedule provides a per-share breakdown of the components that affect the Fund’s NAV for current and past reporting periods as well as total return, asset size, ratios, and portfolio turnover rate.
The first line in the table reflects the NAV per share at the beginning of the reporting period. The next line reports the net investment income/(loss) per share. Following is the per share total of net gains/(losses), realized and unrealized. Per share dividends and distributions to investors are then subtracted to arrive at the NAV per share at the end of the period. The next line reflects the total return for the period. The total return may include adjustments in accordance with generally accepted accounting principles required at the period end for financial reporting purposes. As a result, the total return may differ from the total return reflected for individual shareholder transactions. Also included are ratios of expenses and net investment income to average net assets.
The Fund’s expenses may be reduced through expense offsets and expense reimbursements. The ratios shown reflect expenses before and after any such offsets and reimbursements.
The ratio of net investment income/(loss) summarizes the income earned less expenses, divided by the average net assets of the Fund during the reporting period. Do not confuse this ratio with the Fund’s yield. The net investment income ratio is not a true measure of the Fund’s yield because it does not take into account the dividends distributed to the Fund’s investors.
The next figure is the portfolio turnover rate, which measures the buying and selling activity in the Fund. Portfolio turnover is affected by market conditions, changes in the asset size of the Fund, fluctuating volume of shareholder purchase and redemption orders, the nature of the Fund’s investments, and the investment style and/or outlook of the portfolio manager(s) and/or investment personnel. A 100% rate implies that an amount equal to the value of the entire portfolio was replaced once during the fiscal year; a 50% rate means that an amount equal to the value of half the
Janus Henderson U.S. Dividend Income Fund
Useful Information About Your Fund Report (unaudited)
portfolio is traded in a year; and a 200% rate means that an amount equal to the value of the entire portfolio is traded every six months.
Janus Henderson U.S. Dividend Income Fund
Notes
NotesPage1
Janus Henderson U.S. Dividend Income Fund
Notes
NotesPage2
| | | | | | | | |
| | | | | |

| | | | |
This report is submitted for the general information of shareholders of the Fund. It is not an offer or solicitation for the Fund and is not authorized for distribution to prospective investors unless preceded or accompanied by an effective prospectus. |
Janus Henderson is a trademark of Janus Henderson Group plc or one of its subsidiaries. © Janus Henderson Group plc. Janus Henderson Group is the ultimate parent of Janus Henderson Distributors US LLC. Janus Henderson Distributors US LLC |
| | | | 125-24-93097 05-23 |
| | | | |
| | | |
| | | SEMIANNUAL REPORT March 31, 2023 |
| | |
| | Janus Henderson Venture Fund |
| | |
| | Janus Investment Fund |
| |
| | | HIGHLIGHTS · Investment strategy behind your fund · Fund performance, characteristics
and holdings |
Table of Contents
Janus Henderson Venture Fund
| | | | | | |
| | | | | 
Jonathan Coleman co-portfolio manager | 
Scott Stutzman co-portfolio manager |
| | | |
Janus Henderson Venture Fund (unaudited)
Fund At A Glance
March 31, 2023
| | | | | | | | | | |
| | | | | | | | | |
| | | | | | | | | |
| | | | | | | | | |
| 5 Top Contributors - Holdings | 5 Top Detractors - Holdings |
| | Average
Weight | | Relative
Contribution | | | Average
Weight | | Relative
Contribution |
| ATS Corp | 1.82% | | 0.71% | | Paylocity Holding Corp | 1.71% | | -0.65% |
| Shift4 Payments Inc - Class A | 0.88% | | 0.50% | | Xometry Inc - Class A | 0.55% | | -0.64% |
| Valvoline Inc | 1.87% | | 0.49% | | Consensus Cloud Solutions Inc | 0.67% | | -0.28% |
| Rentokil Initial PLC (ADR) | 1.78% | | 0.46% | | Catalent Inc | 1.76% | | -0.25% |
| ON Semiconductor Corp | 2.24% | | 0.43% | | Madrigal Pharmaceuticals Inc | 0.10% | | -0.25% |
| | | | | | | |
| 5 Top Contributors - Sectors* | | | | | |
| | | Relative | | Fund | Russell 2000 Growth Index |
| | | Contribution | | Average Weight | Average Weight |
| Health Care | | 3.05% | | 22.99% | 22.47% |
| Financials | | 1.60% | | 7.21% | 5.94% |
| Information Technology | | 0.81% | | 27.68% | 19.71% |
| Industrials | | 0.52% | | 18.92% | 18.12% |
| Communication Services | | 0.27% | | 3.33% | 2.42% |
| | | | | | |
| | | | | | |
| 5 Top Detractors - Sectors* | | | | | |
| | | Relative | | Fund | Russell 2000 Growth Index |
| | | Contribution | | Average Weight | Average Weight |
| Consumer Discretionary | | -1.56% | | 6.59% | 11.22% |
| Consumer Staples | | -0.16% | | 2.01% | 4.41% |
| Energy | | -0.05% | | 2.05% | 7.18% |
| Other** | | -0.02% | | 1.36% | 0.00% |
| Real Estate | | 0.00% | | 0.92% | 2.22% |
| | | | | | | |
| Relative contribution reflects how the portolio's holdings impacted return relative to the benchmark. Cash and securities not held in the portfolio are not shown. For equity portfolios, relative contribution compares the performance of a security in the portfolio to the benchmark's total return, factoring in the difference in weight of that security in the benchmark. Returns are calculated using daily returns and previous day ending weights rolled up by ticker, excluding fixed income securities, gross of advisory fees, may exclude certain derivatives and will differ from actual performance.
Performance attribution reflects returns gross of advisory fees and may differ from actual returns as they are based on end of day holdings. Attribution is calculated by geometrically linking daily returns for the portfolio and index. |
* | Based on sector classification according to the Global Industry Classification Standard (“GICS”) codes, which are the exclusive property and a service mark of MSCI Inc. and Standard & Poor’s. |
** | Not a GICS classified sector. |
Janus Henderson Venture Fund (unaudited)
Fund At A Glance
March 31, 2023
| | |
5 Largest Equity Holdings - (% of Net Assets) |
Nice Ltd (ADR) | |
Software | 2.4% |
WNS Holdings Ltd (ADR) | |
Professional Services | 2.1% |
Catalent Inc | |
Pharmaceuticals | 2.1% |
ATS Corp | |
Machinery | 2.1% |
Rentokil Initial PLC (ADR) | |
Commercial Services & Supplies | 2.1% |
| | 10.8% |
| | | | | | |
Asset Allocation - (% of Net Assets) | |
Common Stocks | | 97.0% | |
Investment Companies | | 2.6% | |
Private Placements | | 0.6% | |
Investments Purchased with Cash Collateral from Securities Lending | | 0.6% | |
Warrants | | 0.0% | |
Other | | (0.8)% |
| | | 100.0% |
| | |
Top Country Allocations - Long Positions - (% of Investment Securities) |
As of March 31, 2023 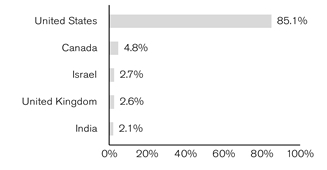
| As of September 30, 2022 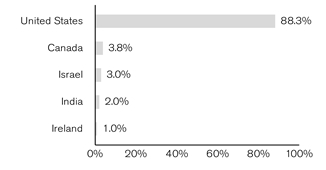
|
Janus Henderson Venture Fund (unaudited)
Performance
| |
See important disclosures on the next page. |
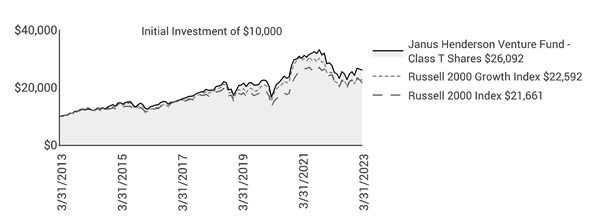
| | | | | | | | | | | |
| | | | | | | | | |
| | | | | | | | | | |
Average Annual Total Return - for the periods ended March 31, 2023 | | | Prospectus Expense Ratios |
| | Fiscal
Year-to-Date | One
Year | Five
Year | Ten
Year | Since
Inception* | | | Total Annual Fund
Operating Expenses‡ |
Class A Shares at NAV | | 14.62% | -5.92% | 6.22% | 9.92% | 11.34% | | | 1.01% |
Class A Shares at MOP | | 8.02% | -11.33% | 4.97% | 9.27% | 11.17% | | | |
Class C Shares at NAV | | 14.01% | -6.79% | 5.42% | 9.12% | 10.59% | | | 1.87% |
Class C Shares at CDSC | | 13.01% | -7.67% | 5.42% | 9.12% | 10.59% | | | |
Class D Shares | | 14.75% | -5.71% | 6.46% | 10.18% | 11.56% | | | 0.79% |
Class I Shares | | 14.75% | -5.69% | 6.50% | 10.24% | 11.57% | | | 0.76% |
Class N Shares | | 14.82% | -5.60% | 6.59% | 10.33% | 11.59% | | | 0.67% |
Class S Shares | | 14.53% | -6.07% | 6.06% | 9.78% | 11.21% | | | 1.17% |
Class T Shares | | 14.68% | -5.83% | 6.34% | 10.07% | 11.51% | | | 0.92% |
Russell 2000 Growth Index | | 10.46% | -10.60% | 4.26% | 8.49% | 7.87% | | | |
Russell 2000 Index | | 9.14% | -11.61% | 4.71% | 8.04% | 9.18% | | | |
Morningstar Quartile - Class T Shares | | - | 1st | 3rd | 2nd | 1st | | | |
Morningstar Ranking - based on total returns for Small Growth Funds | | - | 54/613 | 334/576 | 200/533 | 7/47 | | | |
Returns quoted are past performance and do not guarantee future results; current performance may be lower or higher. Investment returns and principal value will vary; there may be a gain or loss when shares are sold. For the most recent month-end performance call 800.668.0434 (or 800.525.3713 if you hold shares directly with Janus Henderson) or visit janushenderson.com/performance (or janushenderson.com/allfunds if you hold shares directly with Janus Henderson).
Maximum Offering Price (MOP) returns include the maximum sales charge of 5.75%. Net Asset Value (NAV) returns exclude this charge, which would have reduced returns.
CDSC returns include a 1% contingent deferred sales charge (CDSC) on Shares redeemed within 12 months of purchase. Net Asset Value (NAV) returns exclude this charge, which would have reduced returns.
Performance may be affected by risks that include those associated with foreign and emerging markets, fixed income securities, high-yield and high-risk securities, undervalued, overlooked and smaller capitalization companies, real estate related securities including Real Estate Investment Trusts (REITs), Environmental, Social and Governance (ESG) factors, non-diversification, portfolio turnover, derivatives, short sales, initial public offerings (IPOs) and potential conflicts of interest. Each product has different risks. Please see the prospectus for more information about risks, holdings and other details.
Janus Henderson Venture Fund (unaudited)
Performance
Returns include reinvestment of all dividends and distributions and do not reflect the deduction of taxes that a shareholder would pay on Fund distributions or redemptions of Fund shares. The returns do not include adjustments in accordance with generally accepted accounting principles required at the period end for financial reporting purposes.
Class A Shares, Class C Shares, and Class S Shares commenced operations on May 6, 2011. Performance shown for each class for periods prior to May 6, 2011, reflects the performance of the Fund’s Class J Shares, the initial share class (renamed Class T Shares effective February 16, 2010), calculated using the fees and expenses of each respective class, without the effect of any fee and expense limitations or waivers.
Class D Shares commenced operations on February 16, 2010. Performance shown for periods prior to February 16, 2010, reflects the performance of the Fund’s former Class J Shares, calculated using the fees and expenses in effect during the periods shown, net of any applicable fee and expense limitations or waivers.
Class I Shares commenced operations on May 6, 2011. Performance shown for periods prior to May 6, 2011, reflects the performance of the Fund’s former Class J Shares, calculated using the fees and expenses of Class J Shares, net of any applicable fee and expense limitations or waivers.
Class N Shares commenced operations on May 31, 2012. Performance shown for periods prior to May 31, 2012, reflects the performance of the Fund's Class T Shares, calculated using the fees and expenses of the Fund's Class T Shares, net of any applicable fee and expense limitations or waivers.
If each share class of the Fund had been available during periods prior to its commencement, the performance shown may have been different. The performance shown for periods following the Fund's commencement of each share class reflects the fees and expenses of each respective share class, net of any applicable fee and expense limitations or waivers. Please refer to the Fund's prospectuses for further details concerning historical performance.
Ranking is for the share class shown only; other classes may have different performance characteristics. When an expense waiver is in effect, it may have a material effect on the total return, and therefore the ranking for the period.
© 2023 Morningstar, Inc. All Rights Reserved.
There is no assurance that the investment process will consistently lead to successful investing.
See Notes to Schedule of Investments and Other Information for index definitions.
Index performance does not reflect the expenses of managing a portfolio as an index is unmanaged and not available for direct investment.
See “Useful Information About Your Fund Report.”
*The Fund’s inception date – April 30, 1985
‡ As stated in the prospectus. See Financial Highlights for actual expense ratios during the reporting period.
Janus Henderson Venture Fund (unaudited)
Expense Examples
As a shareholder of the Fund, you incur two types of costs: (1) transaction costs, such as sales charges (loads) on purchase payments (applicable to Class A Shares only); and (2) ongoing costs, including management fees; 12b-1 distribution and shareholder servicing fees; transfer agent fees and expenses payable pursuant to the Transfer Agency Agreement; and other Fund expenses. This example is intended to help you understand your ongoing costs (in dollars) of investing in the Fund and to compare these costs with the ongoing costs of investing in other mutual funds. To do so, compare this 5% hypothetical example with the 5% hypothetical examples that appear in the shareholder reports of the other funds. The example is based upon an investment of $1,000 invested at the beginning of the period and held for the six-months indicated, unless noted otherwise in the table and footnotes below.
Actual Expenses
The information in the table under the heading “Actual” provides information about actual account values and actual expenses. You may use the information in these columns, together with the amount you invested, to estimate the expenses that you paid over the period. Simply divide your account value by $1,000 (for example, an $8,600 account value divided by $1,000 = 8.6), then multiply the result by the number in the appropriate column for your share class under the heading entitled “Expenses Paid During Period” to estimate the expenses you paid on your account during the period.
Hypothetical Example for Comparison Purposes
The information in the table under the heading “Hypothetical (5% return before expenses)” provides information about hypothetical account values and hypothetical expenses based upon the Fund’s actual expense ratio and an assumed rate of return of 5% per year before expenses, which is not the Fund’s actual return. The hypothetical account values and expenses may not be used to estimate the actual ending account balance or expenses you paid for the period. You may use this information to compare the ongoing costs of investing in the Fund and other funds. To do so, compare this 5% hypothetical example with the 5% hypothetical examples that appear in the shareholder reports of the other funds. Additionally, for an analysis of the fees associated with an investment in any share class or other similar funds, please visit www.finra.org/fundanalyzer.
Please note that the expenses shown in the table are meant to highlight your ongoing costs only and do not reflect any transaction costs. These fees are fully described in the Fund’s prospectuses. Therefore, the hypothetical examples are useful in comparing ongoing costs only, and will not help you determine the relative total costs of owning different funds. In addition, if these transaction costs were included, your costs would have been higher.
| | | | | | | | | | | |
| | | | | | | | |
| | | Actual | | Hypothetical
(5% return before expenses) | |
| Beginning
Account
Value
(10/1/22) | Ending
Account
Value
(3/31/23) | Expenses
Paid During
Period
(10/1/22 - 3/31/23)† | | Beginning
Account
Value
(10/1/22) | Ending
Account
Value
(3/31/23) | Expenses
Paid During
Period
(10/1/22 - 3/31/23)† | Net Annualized
Expense Ratio
(10/1/22 - 3/31/23) |
Class A Shares | $1,000.00 | $1,146.20 | $5.46 | | $1,000.00 | $1,019.85 | $5.14 | 1.02% |
Class C Shares | $1,000.00 | $1,140.10 | $11.15 | | $1,000.00 | $1,014.51 | $10.50 | 2.09% |
Class D Shares | $1,000.00 | $1,147.50 | $4.28 | | $1,000.00 | $1,020.94 | $4.03 | 0.80% |
Class I Shares | $1,000.00 | $1,147.50 | $4.12 | | $1,000.00 | $1,021.09 | $3.88 | 0.77% |
Class N Shares | $1,000.00 | $1,148.20 | $3.59 | | $1,000.00 | $1,021.59 | $3.38 | 0.67% |
Class S Shares | $1,000.00 | $1,145.30 | $6.31 | | $1,000.00 | $1,019.05 | $5.94 | 1.18% |
Class T Shares | $1,000.00 | $1,146.80 | $4.82 | | $1,000.00 | $1,020.44 | $4.53 | 0.90% |
† | Expenses Paid During Period are equal to the Net Annualized Expense Ratio multiplied by the average account value over the period, multiplied by 182/365 (to reflect the one-half year period). Expenses in the examples include the effect of applicable fee waivers and/or expense reimbursements, if any. Had such waivers and/or reimbursements not been in effect, your expenses would have been higher. Please refer to the Notes to Financial Statements or the Fund’s prospectuses for more information regarding waivers and/or reimbursements. |
Janus Henderson Venture Fund
Schedule of Investments (unaudited)
March 31, 2023
| | | | | | | | |
Shares or
Principal Amounts | | | Value | |
Common Stocks– 97.0% | | | |
Auto Components – 0.5% | | | |
| | Quantumscape Corp*,# | | 486,572 | | | $3,980,159 | |
| | Visteon Corp* | | 80,275 | | | 12,589,528 | |
| | | 16,569,687 | |
Automobiles – 0.5% | | | |
| | Thor Industries Inc | | 202,891 | | | 16,158,239 | |
Banks – 0.8% | | | |
| | Bancorp Inc/The* | | 927,645 | | | 25,834,913 | |
Biotechnology – 7.0% | | | |
| | Akero Therapeutics Inc* | | 165,711 | | | 6,340,103 | |
| | Apellis Pharmaceuticals Inc* | | 315,237 | | | 20,793,033 | |
| | Ascendis Pharma A/S (ADR)* | | 170,315 | | | 18,261,174 | |
| | Biohaven Ltd* | | 1,002,857 | | | 13,699,027 | |
| | Biomea Fusion Inc* | | 98,744 | | | 3,062,051 | |
| | Eagle Pharmaceuticals Inc/DE* | | 360,214 | | | 10,219,271 | |
| | Halozyme Therapeutics Inc* | | 350,054 | | | 13,368,562 | |
| | Insmed Inc* | | 545,448 | | | 9,299,888 | |
| | IVERIC bio Inc* | | 534,779 | | | 13,011,173 | |
| | Madrigal Pharmaceuticals Inc* | | 19,953 | | | 4,833,814 | |
| | Neurocrine Biosciences Inc* | | 188,061 | | | 19,035,534 | |
| | PTC Therapeutics Inc* | | 287,254 | | | 13,914,584 | |
| | Sarepta Therapeutics Inc* | | 148,861 | | | 20,517,512 | |
| | Seres Therapeutics Inc* | | 1,406,930 | | | 7,977,293 | |
| | Travere Therapeutics Inc* | | 675,121 | | | 15,183,471 | |
| | Vaxcyte Inc* | | 683,894 | | | 25,632,347 | |
| | | 215,148,837 | |
Building Products – 3.1% | | | |
| | CSW Industrials Inc | | 324,162 | | | 45,035,827 | |
| | Janus International Group Inc* | | 2,317,505 | | | 22,850,599 | |
| | Zurn Water Solutions Corp | | 1,229,360 | | | 26,259,130 | |
| | | 94,145,556 | |
Capital Markets – 2.7% | | | |
| | Assetmark Financial Holdings Inc* | | 678,283 | | | 21,332,000 | |
| | Focus Financial Partners Inc* | | 382,516 | | | 19,841,105 | |
| | LPL Financial Holdings Inc | | 199,990 | | | 40,477,976 | |
| | | 81,651,081 | |
Chemicals – 4.7% | | | |
| | Innospec Inc | | 140,635 | | | 14,438,995 | |
| | Perimeter Solutions SA* | | 2,557,669 | | | 20,665,966 | |
| | PureCycle Technologies Inc*,# | | 1,100,416 | | | 7,702,912 | |
| | Sensient Technologies Corp | | 683,817 | | | 52,353,030 | |
| | Valvoline Inc | | 1,396,216 | | | 48,783,787 | |
| | | 143,944,690 | |
Commercial Services & Supplies – 3.6% | | | |
| | Brady Corp | | 650,431 | | | 34,947,658 | |
| | Montrose Environmental Group Inc* | | 325,995 | | | 11,628,242 | |
| | Rentokil Initial PLC (ADR) | | 1,745,274 | | | 63,719,954 | |
| | | 110,295,854 | |
Containers & Packaging – 1.2% | | | |
| | Sealed Air Corp | | 792,665 | | | 36,391,250 | |
Diversified Consumer Services – 1.3% | | | |
| | Stride Inc* | | 1,041,878 | | | 40,893,711 | |
Diversified Financial Services – 5.1% | | | |
| | AvidXchange Holdings Inc* | | 1,895,263 | | | 14,783,051 | |
| | Euronet Worldwide Inc* | | 364,509 | | | 40,788,557 | |
| | Payfare Inc*,£ | | 2,403,934 | | | 12,666,329 | |
| | Repay Holdings Corp* | | 1,108,768 | | | 7,284,606 | |
| | Shift4 Payments Inc - Class A* | | 506,393 | | | 38,384,589 | |
| | Walker & Dunlop Inc | | 133,001 | | | 10,130,686 | |
| | |
See Notes to Schedule of Investments and Other Information and Notes to Financial Statements. |
| |
6 | MARCH 31, 2023 |
Janus Henderson Venture Fund
Schedule of Investments (unaudited)
March 31, 2023
| | | | | | | | |
Shares or
Principal Amounts | | | Value | |
Common Stocks– (continued) | | | |
Diversified Financial Services– (continued) | | | |
| | WEX Inc* | | 175,079 | | | $32,195,277 | |
| | | 156,233,095 | |
Electrical Equipment – 2.0% | | | |
| | EnerSys | | 350,777 | | | 30,475,506 | |
| | Regal Beloit Corp | | 208,353 | | | 29,321,518 | |
| | | 59,797,024 | |
Electronic Equipment, Instruments & Components – 3.9% | | | |
| | Napco Security Technologies Inc* | | 1,111,964 | | | 41,787,607 | |
| | National Instruments Corp | | 229,880 | | | 12,048,011 | |
| | Novanta Inc* | | 156,991 | | | 24,975,698 | |
| | OSI Systems Inc* | | 409,632 | | | 41,929,932 | |
| | | 120,741,248 | |
Energy Equipment & Services – 0.5% | | | |
| | Helmerich & Payne Inc | | 460,240 | | | 16,453,580 | |
Entertainment – 1.6% | | | |
| | Liberty Braves Group* | | 491,966 | | | 16,574,335 | |
| | Manchester United PLC# | | 727,412 | | | 16,112,176 | |
| | Vivid Seats Inc - Class A* | | 2,074,318 | | | 15,827,046 | |
| | | 48,513,557 | |
Food & Staples Retailing – 0.8% | | | |
| | Casey's General Stores Inc | | 109,463 | | | 23,694,361 | |
Food Products – 0.4% | | | |
| | Hain Celestial Group Inc* | | 681,629 | | | 11,689,937 | |
Health Care Equipment & Supplies – 7.0% | | | |
| | Alphatec Holdings Inc* | | 1,573,461 | | | 24,545,992 | |
| | Glaukos Corp* | | 403,170 | | | 20,198,817 | |
| | Globus Medical Inc* | | 500,995 | | | 28,376,357 | |
| | ICU Medical Inc* | | 203,275 | | | 33,532,244 | |
| | Insulet Corp* | | 47,307 | | | 15,089,041 | |
| | Integra LifeSciences Holdings Corp* | | 532,725 | | | 30,583,742 | |
| | Paragon 28 Inc* | | 848,663 | | | 14,486,677 | |
| | Shockwave Medical Inc* | | 61,480 | | | 13,330,708 | |
| | Sight Sciences Inc* | | 88,204 | | | 770,903 | |
| | STERIS PLC | | 140,232 | | | 26,823,577 | |
| | Tandem Diabetes Care Inc* | | 179,825 | | | 7,302,693 | |
| | | 215,040,751 | |
Health Care Providers & Services – 1.7% | | | |
| | HealthEquity Inc* | | 258,812 | | | 15,194,853 | |
| | ModivCare Inc* | | 172,038 | | | 14,464,955 | |
| | NeoGenomics Inc* | | 1,327,705 | | | 23,115,344 | |
| | | 52,775,152 | |
Health Care Technology – 0.4% | | | |
| | Phreesia Inc* | | 421,437 | | | 13,608,201 | |
Hotels, Restaurants & Leisure – 0.9% | | | |
| | Inspirato Inc* | | 1,430,805 | | | 1,371,999 | |
| | Monarch Casino & Resort Inc | | 367,303 | | | 27,235,517 | |
| | | 28,607,516 | |
Household Durables – 0.6% | | | |
| | Lovesac Co* | | 593,257 | | | 17,145,127 | |
Insurance – 1.7% | | | |
| | BRP Group Inc - Class A* | | 797,587 | | | 20,306,565 | |
| | RLI Corp | | 230,486 | | | 30,633,894 | |
| | | 50,940,459 | |
Interactive Media & Services – 1.7% | | | |
| | Ziff Davis Inc* | | 659,980 | | | 51,511,439 | |
Life Sciences Tools & Services – 2.3% | | | |
| | Bio-Techne Corp | | 275,324 | | | 20,426,288 | |
| | CryoPort Inc* | | 669,993 | | | 16,079,832 | |
| | |
See Notes to Schedule of Investments and Other Information and Notes to Financial Statements. |
| |
Janus Investment Fund | 7 |
Janus Henderson Venture Fund
Schedule of Investments (unaudited)
March 31, 2023
| | | | | | | | |
Shares or
Principal Amounts | | | Value | |
Common Stocks– (continued) | | | |
Life Sciences Tools & Services– (continued) | | | |
| | ICON PLC* | | 132,873 | | | $28,380,344 | |
| | OmniAb Inc*,# | | 1,670,054 | | | 6,145,799 | |
| | OmniAb Inc - 12.5 Earnout*,¢ | | 104,942 | | | 0 | |
| | OmniAb Inc - 15 Earnout*,¢ | | 104,942 | | | 0 | |
| | | 71,032,263 | |
Machinery – 6.8% | | | |
| | Alamo Group Inc | | 125,047 | | | 23,028,656 | |
| | ATS Corp* | | 1,528,580 | | | 64,014,166 | |
| | Gates Industrial Corp PLC* | | 1,655,485 | | | 22,994,687 | |
| | ITT Inc | | 349,395 | | | 30,152,788 | |
| | Kornit Digital Ltd* | | 573,076 | | | 11,094,751 | |
| | Nordson Corp | | 119,951 | | | 26,660,309 | |
| | SPX Technologies Inc* | | 423,605 | | | 29,898,041 | |
| | | 207,843,398 | |
Metals & Mining – 1.2% | | | |
| | Constellium SE* | | 2,369,233 | | | 36,201,880 | |
Oil, Gas & Consumable Fuels – 1.8% | | | |
| | California Resources Corp | | 331,131 | | | 12,748,543 | |
| | Magnolia Oil & Gas Corp | | 930,132 | | | 20,351,288 | |
| | PDC Energy Inc | | 317,044 | | | 20,347,884 | |
| | | 53,447,715 | |
Personal Products – 1.1% | | | |
| | BellRing Brands Inc* | | 944,501 | | | 32,113,034 | |
Pharmaceuticals – 3.1% | | | |
| | Catalent Inc* | | 989,343 | | | 65,009,729 | |
| | Ligand Pharmaceuticals Inc* | | 276,741 | | | 20,357,068 | |
| | Reata Pharmaceuticals Inc - Class A* | | 113,633 | | | 10,331,512 | |
| | | 95,698,309 | |
Professional Services – 7.5% | | | |
| | Alight Inc - Class A* | | 3,351,074 | | | 30,863,392 | |
| | Broadridge Financial Solutions Inc | | 263,614 | | | 38,637,904 | |
| | Clarivate Analytics PLC* | | 2,412,527 | | | 22,653,629 | |
| | CRA International Inc | | 172,824 | | | 18,633,884 | |
| | SS&C Technologies Holdings Inc | | 951,434 | | | 53,727,478 | |
| | WNS Holdings Ltd (ADR)* | | 700,151 | | | 65,233,069 | |
| | | 229,749,356 | |
Real Estate Management & Development – 0.6% | | | |
| | FirstService Corp# | | 135,649 | | | 19,125,152 | |
Road & Rail – 0.6% | | | |
| | AMERCO Series N | | 358,929 | | | 18,610,469 | |
Semiconductor & Semiconductor Equipment – 2.9% | | | |
| | MACOM Technology Solutions Holdings Inc* | | 225,358 | | | 15,964,361 | |
| | ON Semiconductor Corp* | | 717,643 | | | 59,076,372 | |
| | PDF Solutions Inc* | | 316,509 | | | 13,419,982 | |
| | | 88,460,715 | |
Software – 12.9% | | | |
| | Altair Engineering Inc* | | 463,992 | | | 33,458,463 | |
| | Blackbaud Inc* | | 669,004 | | | 46,361,977 | |
| | Clear Secure Inc - Class A | | 614,038 | | | 16,069,374 | |
| | Consensus Cloud Solutions Inc* | | 430,026 | | | 14,659,586 | |
| | Descartes Systems Group Inc* | | 667,499 | | | 53,882,033 | |
| | Enfusion Inc - Class A* | | 1,235,040 | | | 12,967,920 | |
| | EngageSmart Inc* | | 583,009 | | | 11,222,923 | |
| | Envestnet Inc* | | 391,679 | | | 22,979,807 | |
| | Expensify Inc - Class A*,# | | 1,100,667 | | | 8,970,436 | |
| | Intelligent Systems Corp*,£ | | 477,352 | | | 14,382,616 | |
| | Nice Ltd (ADR)* | | 317,325 | | | 72,632,519 | |
| | Paylocity Holding Corp* | | 230,038 | | | 45,726,954 | |
| | Tyler Technologies Inc* | | 76,027 | | | 26,962,215 | |
| | |
See Notes to Schedule of Investments and Other Information and Notes to Financial Statements. |
| |
8 | MARCH 31, 2023 |
Janus Henderson Venture Fund
Schedule of Investments (unaudited)
March 31, 2023
| | | | | | | | |
Shares or
Principal Amounts | | | Value | |
Common Stocks– (continued) | | | |
Software– (continued) | | | |
| | Vertex Inc - Class A* | | 656,472 | | | $13,582,406 | |
| | | 393,859,229 | |
Specialty Retail – 1.0% | | | |
| | CarParts.com Inc* | | 2,453,642 | | | 13,102,448 | |
| | Williams-Sonoma Inc | | 139,943 | | | 17,025,465 | |
| | | 30,127,913 | |
Trading Companies & Distributors – 1.5% | | | |
| | Core & Main Inc - Class A* | | 1,695,615 | | | 39,168,706 | |
| | Xometry Inc - Class A*,# | | 446,365 | | | 6,682,084 | |
| | | 45,850,790 | |
Total Common Stocks (cost $2,007,708,644) | | 2,969,905,488 | |
Private Placements– 0.6% | | | |
Professional Services – 0.3% | | | |
| | Apartment List Inc*,¢,§ | | 2,431,401 | | | 5,373,396 | |
| | IntelyCare Inc*,¢,§ | | 384,276 | | | 5,587,719 | |
| | | 10,961,115 | |
Software – 0.3% | | | |
| | Loadsmart Inc - Series A*,¢,§ | | 140,312 | | | 2,372,844 | |
| | Loadsmart Inc - Series D*,¢,§ | | 399,891 | | | 6,762,637 | |
| | | 9,135,481 | |
Total Private Placements (cost $28,958,535) | | 20,096,596 | |
Warrants– 0% | | | |
Chemicals – 0% | | | |
| | Perimeter Solutions SA, expires 11/8/24*((cost $13,929) | | 1,392,883 | | | 1,183,951 | |
Investment Companies– 2.6% | | | |
Money Markets – 2.6% | | | |
| | Janus Henderson Cash Liquidity Fund LLC, 4.7988%ºº,£((cost $79,236,542) | | 79,221,510 | | | 79,237,354 | |
Investments Purchased with Cash Collateral from Securities Lending– 0.6% | | | |
Investment Companies – 0.5% | | | |
| | Janus Henderson Cash Collateral Fund LLC, 4.8170%ºº,£ | | 13,673,674 | | | 13,673,674 | |
Time Deposits – 0.1% | | | |
| | Royal Bank of Canada, 4.8000%, 4/3/23 | | $3,418,418 | | | 3,418,418 | |
Total Investments Purchased with Cash Collateral from Securities Lending (cost $17,092,092) | | 17,092,092 | |
Total Investments (total cost $2,133,009,742) – 100.8% | | 3,087,515,481 | |
Liabilities, net of Cash, Receivables and Other Assets – (0.8)% | | (25,490,971) | |
Net Assets – 100% | | $3,062,024,510 | |
| | | | | | |
Summary of Investments by Country - (Long Positions) (unaudited) |
| |
| | | | | % of | |
| | | | | Investment | |
Country | | Value | | Securities | |
United States | | $2,626,191,934 | | 85.1 | % |
Canada | | 149,687,680 | | 4.8 | |
Israel | | 83,727,270 | | 2.7 | |
United Kingdom | | 79,832,130 | | 2.6 | |
India | | 65,233,069 | | 2.1 | |
Netherlands | | 36,201,880 | | 1.2 | |
Ireland | | 28,380,344 | | 0.9 | |
Denmark | | 18,261,174 | | 0.6 | |
| | | | | | |
| | | | | | |
Total | | $3,087,515,481 | | 100.0 | % |
| | |
See Notes to Schedule of Investments and Other Information and Notes to Financial Statements. |
| |
Janus Investment Fund | 9 |
Janus Henderson Venture Fund
Schedule of Investments (unaudited)
March 31, 2023
Schedules of Affiliated Investments – (% of Net Assets)
| | | | | | | | | | | |
| | Dividend Income(1) | Realized Gain/(Loss)(1) | Change in Unrealized Appreciation/ Depreciation(1) | Value at 3/31/23 |
Common Stocks - 0.9% |
Diversified Financial Services - 0.4% | |
| | Payfare Inc* | $ | - | $ | - | $ | 3,459,255 | $ | 12,666,329 |
Software - 0.5% | |
| | ChannelAdvisor Corp* | | - | | 15,496,857 | | (14,904,550) | | - |
| | Intelligent Systems Corp* | | - | | - | | 3,990,663 | | 14,382,616 |
Total Software | $ | - | $ | 15,496,857 | $ | (10,913,887) | $ | 14,382,616 |
Total Common Stocks | $ | - | $ | 15,496,857 | $ | (7,454,632) | $ | 27,048,945 |
Investment Companies - 2.6% |
Money Markets - 2.6% | |
| | Janus Henderson Cash Liquidity Fund LLC, 4.7988%ºº | | 803,829 | | 2,446 | | 703 | | 79,237,354 |
Investments Purchased with Cash Collateral from Securities Lending - 0.5% |
Investment Companies - 0.5% | |
| | Janus Henderson Cash Collateral Fund LLC, 4.8170%ºº | | 222,978∆ | | - | | - | | 13,673,674 |
Total Affiliated Investments – 4.0% | $ | 1,026,807 | $ | 15,499,303 | $ | (7,453,929) | $ | 119,959,973 |
(1) For securities that were affiliated for a portion of the period ended March 31, 2023, this column reflects amounts for the entire period ended March 31, 2023 and not just the period in which the security was affiliated.
| | | | | | | | | | | |
| | Value at 9/30/22 | Purchases | Sales Proceeds | Value at 3/31/23 |
Common Stocks - 0.9% |
Diversified Financial Services - 0.4% | |
| | Payfare Inc* | | 9,207,074 | | - | | - | | 12,666,329 |
Software - 0.5% | |
| | ChannelAdvisor Corp* | | 37,349,662 | | - | | (37,941,969)Ð | | - |
| | Intelligent Systems Corp* | | 10,391,953 | | - | | - | | 14,382,616 |
Investment Companies - 2.6% |
Money Markets - 2.6% | |
| | Janus Henderson Cash Liquidity Fund LLC, 4.7988%ºº | | 13,005,929 | | 263,260,302 | | (197,032,026) | | 79,237,354 |
Investments Purchased with Cash Collateral from Securities Lending - 0.5% |
Investment Companies - 0.5% | |
| | Janus Henderson Cash Collateral Fund LLC, 4.8170%ºº | | 42,547,193 | | 168,545,808 | | (197,419,327) | | 13,673,674 |
| | |
See Notes to Schedule of Investments and Other Information and Notes to Financial Statements. |
| |
10 | MARCH 31, 2023 |
Janus Henderson Venture Fund
Schedule of Investments (unaudited)
March 31, 2023
| | | | | | | |
Schedule of Forward Foreign Currency Exchange Contracts | | | | | | |
| | | | | | | | | |
Counterparty/ Foreign Currency | Settlement Date | Foreign Currency Amount (Sold)/ Purchased | | USD Currency Amount (Sold)/ Purchased | | Market Value and Unrealized Appreciation/ (Depreciation) | |
Barclays Capital, Inc.: | | | | | | | | |
British Pound | 4/18/23 | 708,100 | $ | (844,969) | $ | 28,652 | | |
Canadian Dollar | 4/18/23 | (28,688,900) | | 20,844,947 | | (390,723) | | |
| | | | | | | | | |
| | | | | | | (362,071) | | |
Citibank, National Association: | | | | | | | | |
British Pound | 4/18/23 | (26,274,800) | | 31,356,346 | | (1,060,267) | | |
Canadian Dollar | 4/18/23 | 8,747,000 | | (6,399,596) | | 74,978 | | |
Canadian Dollar | 4/18/23 | (41,665,900) | | 30,242,445 | | (598,865) | | |
| | | | | | | | | |
| | | | | | | (1,584,154) | | |
Goldman Sachs & Co. LLC: | | | | | | | | |
British Pound | 4/18/23 | 137,000 | | (163,417) | | 5,607 | | |
British Pound | 4/18/23 | (1,000,000) | | 1,229,687 | | (4,066) | | |
Canadian Dollar | 4/18/23 | 3,365,000 | | (2,442,212) | | 48,578 | | |
| | | | | | | | | |
| | | | | | | 50,119 | | |
HSBC Securities (USA), Inc.: | | | | | | | | |
British Pound | 4/18/23 | 1,900,000 | | (2,296,016) | | 48,114 | | |
British Pound | 4/18/23 | (11,841,900) | | 14,245,598 | | (364,383) | | |
Canadian Dollar | 4/18/23 | 2,000,000 | | (1,450,181) | | 30,229 | | |
Canadian Dollar | 4/18/23 | (37,575,700) | | 27,272,144 | | (541,579) | | |
| | | | | | | | | |
| | | | | | | (827,619) | | |
JPMorgan Chase Bank, National Association: | | | | | | | | |
British Pound | 4/18/23 | 3,952,200 | | (4,780,780) | | 95,258 | | |
Canadian Dollar | 4/18/23 | 5,700,000 | | (4,143,479) | | 75,690 | | |
Canadian Dollar | 4/18/23 | (48,602,500) | | 35,262,233 | | (713,584) | | |
| | | | | | | | | |
| | | | | | | (542,636) | | |
State Street Bank and Trust Company: | | | | | | | | |
British Pound | 4/18/23 | (26,908,000) | | 32,170,499 | | (1,027,327) | | |
Canadian Dollar | 4/18/23 | (8,700,500) | | 6,330,914 | | (109,240) | | |
| | | | | | | | | |
| | | | | | | (1,136,567) | | |
Total | | | | | $ | (4,402,928) | | |
| | |
See Notes to Schedule of Investments and Other Information and Notes to Financial Statements. |
| |
Janus Investment Fund | 11 |
Janus Henderson Venture Fund
Schedule of Investments (unaudited)
March 31, 2023
The following table, grouped by derivative type, provides information about the fair value and location of derivatives within the Statement of Assets and Liabilities as of March 31, 2023.
| | | | | | |
Fair Value of Derivative Instruments (not accounted for as hedging instruments) as of March 31, 2023 |
| | | | | |
| | | | | Currency
Contracts |
Asset Derivatives: | | | |
Forward foreign currency exchange contracts | | | $ 407,106 |
| | | | |
Liability Derivatives: | | | |
Forward foreign currency exchange contracts | | | $4,810,034 |
| | | | |
The following tables provide information about the effect of derivatives and hedging activities on the Fund’s Statement of Operations for the period ended March 31, 2023.
| | | | | |
The effect of Derivative Instruments (not accounted for as hedging instruments) on the Statement of Operations for the period ended March 31, 2023 |
| | | | |
Amount of Realized Gain/(Loss) Recognized on Derivatives |
Derivative | | Currency
Contracts |
Forward foreign currency exchange contracts | | $ 1,963,138 |
| | | | | |
| | | | | |
| | | | | |
Amount of Change in Unrealized Appreciation/Depreciation Recognized on Derivatives |
Derivative | | Currency
Contracts |
Forward foreign currency exchange contracts | | $(8,920,212) |
| | | | | |
Please see the "Net Realized Gain/(Loss) on Investments" and "Change in Unrealized Net Appreciation/Depreciation" sections of the Fund’s Statement of Operations.
| | |
Average Ending Monthly Value of Derivative Instruments During the Period Ended March 31, 2023 |
| |
| |
Forward foreign currency exchange contracts: | |
Average amounts purchased - in USD | $15,031,233 |
Average amounts sold - in USD | 173,902,532 |
| | |
| |
| |
| |
| | |
See Notes to Schedule of Investments and Other Information and Notes to Financial Statements. |
| |
12 | MARCH 31, 2023 |
Janus Henderson Venture Fund
Schedule of Investments (unaudited)
March 31, 2023
| | | | | | | | | | |
Offsetting of Financial Assets and Derivative Assets |
| |
| | | Gross Amounts | | | | | | |
| | | of Recognized | | Offsetting Asset | | Collateral | | |
Counterparty | | Assets | | or Liability(a) | | Pledged(b) | | Net Amount |
| | | | | | | | | |
Barclays Capital, Inc. | $ | 28,652 | $ | (28,652) | $ | — | $ | — |
Citibank, National Association | | 74,978 | | (74,978) | | — | | — |
Goldman Sachs & Co. LLC | | 54,185 | | (4,066) | | — | | 50,119 |
HSBC Securities (USA), Inc. | | 78,343 | | (78,343) | | — | | — |
JPMorgan Chase Bank, National Association | | 17,133,412 | | (170,948) | | (16,962,464) | | — |
| | | | | | | | | |
Total | $ | 17,369,570 | $ | (356,987) | $ | (16,962,464) | $ | 50,119 |
Offsetting of Financial Liabilities and Derivative Liabilities |
| |
| | | Gross Amounts | | | | | | |
| | | of Recognized | | Offsetting Asset | | Collateral | | |
Counterparty | | Liabilities | | or Liability(a) | | Pledged(b) | | Net Amount |
| | | | | | | | | |
Barclays Capital, Inc. | $ | 390,723 | $ | (28,652) | $ | — | $ | 362,071 |
Citibank, National Association | | 1,659,132 | | (74,978) | | — | | 1,584,154 |
Goldman Sachs & Co. LLC | | 4,066 | | (4,066) | | — | | — |
HSBC Securities (USA), Inc. | | 905,962 | | (78,343) | | — | | 827,619 |
JPMorgan Chase Bank, National Association | | 713,584 | | (170,948) | | — | | 542,636 |
State Street Bank and Trust Company | | 1,136,567 | | — | | — | | 1,136,567 |
| | | | | | | | | |
Total | $ | 4,810,034 | $ | (356,987) | $ | — | $ | 4,453,047 |
(a) | Represents the amount of assets or liabilities that could be offset with the same counterparty under master netting or similar agreements that management elects not to offset on the Statement of Assets and Liabilities. |
(b) | Collateral pledged is limited to the net outstanding amount due to/from an individual counterparty. The actual collateral amounts pledged may exceed these amounts and may fluctuate in value. |
| | |
See Notes to Schedule of Investments and Other Information and Notes to Financial Statements. |
| |
Janus Investment Fund | 13 |
Janus Henderson Venture Fund
Notes to Schedule of Investments and Other Information (unaudited)
| | |
Russell 2000® Growth Index | Russell 2000® Growth Index reflects the performance of U.S. small-cap equities with higher price-to-book ratios and higher forecasted growth values. |
Russell 2000® Index | Russell 2000® Index reflects the performance of U.S. small-cap equities. |
| | |
ADR | American Depositary Receipt |
LLC | Limited Liability Company |
PLC | Public Limited Company |
| | |
* | Non-income producing security. |
ºº | Rate shown is the 7-day yield as of March 31, 2023. |
# | Loaned security; a portion of the security is on loan at March 31, 2023. |
¢ | Security is valued using significant unobservable inputs. The total value of Level 3 securities as of the period ended March 31, 2023 is $20,096,596, which represents 0.6% of net assets. |
£ | The Fund may invest in certain securities that are considered affiliated companies. As defined by the Investment Company Act of 1940, as amended, an affiliated company is one in which the Fund owns 5% or more of the outstanding voting securities, or a company which is under common ownership or control. |
∆ | Net of income paid to the securities lending agent and rebates paid to the borrowing counterparties. |
Ð | All or a portion is the result of a corporate action. |
| | | | | | | | | | | |
§ | Schedule of Restricted Securities (as of March 31, 2023) |
| | | | | | | | Value as a | |
| | Acquisition | | | | | | % of Net | |
| | Date | | Cost | | Value | | Assets | |
Apartment List Inc | 11/2/20 | $ | 8,881,908 | $ | 5,373,396 | | 0.1 | % |
IntelyCare Inc | 3/29/22 | | 9,412,879 | | 5,587,719 | | 0.2 | |
Loadsmart Inc - Series A | 1/4/22 | | 2,665,928 | | 2,372,844 | | 0.1 | |
Loadsmart Inc - Series D | 1/4/22 | | 7,997,820 | | 6,762,637 | | 0.2 | |
Total | | $ | 28,958,535 | $ | 20,096,596 | | 0.6 | % |
| | | | | | | | | |
The Fund has registration rights for certain restricted securities held as of March 31, 2023. The issuer incurs all registration costs. | |
Janus Henderson Venture Fund
Notes to Schedule of Investments and Other Information (unaudited)
| | | | | | | | | | | | | | |
The following is a summary of the inputs that were used to value the Fund’s investments in securities and other financial instruments as of March 31, 2023. See Notes to Financial Statements for more information. |
| |
Valuation Inputs Summary |
| | | | | | | |
| | | | | Level 2 - | | Level 3 - |
| | | Level 1 - | | Other Significant | | Significant |
| | | Quoted Prices | | Observable Inputs | | Unobservable Inputs |
| | | | | | | |
Assets | | | | | | |
Investments In Securities: | | | | | | |
Common Stocks | | | | | | |
Life Sciences Tools & Services | $ | 71,032,263 | $ | - | $ | 0 |
All Other | | 2,898,873,225 | | - | | - |
Private Placements | | - | | - | | 20,096,596 |
Warrants | | 1,183,951 | | - | | - |
Investment Companies | | - | | 79,237,354 | | - |
Investments Purchased with Cash Collateral from Securities Lending | | - | | 17,092,092 | | - |
Total Investments in Securities | $ | 2,971,089,439 | $ | 96,329,446 | $ | 20,096,596 |
Other Financial Instruments(a): | | | | | | |
Forward Foreign Currency Exchange Contracts | | - | | 407,106 | | - |
Total Assets | $ | 2,971,089,439 | $ | 96,736,552 | $ | 20,096,596 |
Liabilities | | | | | | |
Other Financial Instruments(a): | | | | | | |
Forward Foreign Currency Exchange Contracts | $ | - | $ | 4,810,034 | $ | - |
| | | | | | | |
(a) | Other financial instruments may include forward foreign currency exchange contracts, futures, written options, written swaptions, and swap contracts. Forward foreign currency exchange contracts, futures contracts, and swap contracts are reported at their unrealized appreciation/(depreciation) at measurement date, which represents the change in the contract's value from trade date. Written options and written swaptions are reported at their market value at measurement date. |
Janus Henderson Venture Fund
Statement of Assets and Liabilities (unaudited)
March 31, 2023
| |
See footnotes at the end of the Statement. |
| | | | | | | |
| | | | | | |
Assets: | | | | |
| Unaffiliated investments, at value (cost $1,999,707,621)(1) | | $ | 2,967,555,508 | |
| Affiliated investments, at value (cost $133,302,121) | | | 119,959,973 | |
| Forward foreign currency exchange contracts | | | 407,106 | |
| Trustees' deferred compensation | | | 75,758 | |
| Receivables: | | | | |
| | Fund shares sold | | | 1,843,503 | |
| | Investments sold | | | 864,824 | |
| | Dividends | | | 391,311 | |
| | Dividends from affiliates | | | 257,773 | |
| | Foreign tax reclaims | | | 71,362 | |
| Other assets | | | 88,215 | |
Total Assets | | | 3,091,515,333 | |
Liabilities: | | | | |
| Due to custodian | | | 1,076 | |
| Collateral for securities loaned (Note 3) | | | 17,092,092 | |
| Forward foreign currency exchange contracts | | | 4,810,034 | |
| Payables: | | | — | |
| | Investments purchased | | | 3,090,388 | |
| | Fund shares repurchased | | | 1,992,903 | |
| | Advisory fees | | | 1,740,660 | |
| | Transfer agent fees and expenses | | | 404,723 | |
| | Trustees' deferred compensation fees | | | 75,758 | |
| | Professional fees | | | 36,849 | |
| | Trustees' fees and expenses | | | 19,687 | |
| | 12b-1 Distribution and shareholder servicing fees | | | 12,434 | |
| | Affiliated fund administration fees payable | | | 6,800 | |
| | Custodian fees | | | 1,813 | |
| | Accrued expenses and other payables | | | 205,606 | |
Total Liabilities | | | 29,490,823 | |
Net Assets | | $ | 3,062,024,510 | |
| | |
See Notes to Financial Statements. |
| |
16 | MARCH 31, 2023 |
Janus Henderson Venture Fund
Statement of Assets and Liabilities (unaudited)
March 31, 2023
| | | | | | | |
| | | | | | |
| | | | | | | |
Net Assets Consist of: | | | | |
| Capital (par value and paid-in surplus) | | $ | 2,024,365,933 | |
| Total distributable earnings (loss) | | | 1,037,658,577 | |
Total Net Assets | | $ | 3,062,024,510 | |
Net Assets - Class A Shares | | $ | 18,782,669 | |
| Shares Outstanding, $0.01 Par Value (unlimited shares authorized) | | | 257,463 | |
Net Asset Value Per Share(2) | | $ | 72.95 | |
Maximum Offering Price Per Share(3) | | $ | 77.40 | |
Net Assets - Class C Shares | | $ | 1,394,225 | |
| Shares Outstanding, $0.01 Par Value (unlimited shares authorized) | | | 22,095 | |
Net Asset Value Per Share(2) | | $ | 63.10 | |
Net Assets - Class D Shares | | $ | 1,673,150,764 | |
| Shares Outstanding, $0.01 Par Value (unlimited shares authorized) | | | 21,825,644 | |
Net Asset Value Per Share | | $ | 76.66 | |
Net Assets - Class I Shares | | $ | 243,970,477 | |
| Shares Outstanding, $0.01 Par Value (unlimited shares authorized) | | | 3,157,553 | |
Net Asset Value Per Share | | $ | 77.27 | |
Net Assets - Class N Shares | | $ | 369,490,176 | |
| Shares Outstanding, $0.01 Par Value (unlimited shares authorized) | | | 4,720,011 | |
Net Asset Value Per Share | | $ | 78.28 | |
Net Assets - Class S Shares | | $ | 31,754,947 | |
| Shares Outstanding, $0.01 Par Value (unlimited shares authorized) | | | 444,860 | |
Net Asset Value Per Share | | $ | 71.38 | |
Net Assets - Class T Shares | | $ | 723,481,252 | |
| Shares Outstanding, $0.01 Par Value (unlimited shares authorized) | | | 9,664,045 | |
Net Asset Value Per Share | | $ | 74.86 | |
| |
(1) Includes $16,962,464 of securities on loan. See Note 3 in Notes to Financial Statements. (2) Redemption price per share may be reduced for any applicable contingent deferred sales charge. (3) Maximum offering price is computed at 100/94.25 of net asset value. |
| | |
See Notes to Financial Statements. |
| |
Janus Investment Fund | 17 |
Janus Henderson Venture Fund
Statement of Operations (unaudited)
For the period ended March 31, 2023
| | | | | | |
| | | | | |
Investment Income: |
| Dividends | $ | 10,478,457 | |
| Dividends from affiliates | | 803,829 | |
| Affiliated securities lending income, net | | 222,978 | |
| Unaffiliated securities lending income, net | | 57,607 | |
| Other income | | 27 | |
| Foreign tax withheld | | (5,468) | |
Total Investment Income | | 11,557,430 | |
Expenses: | | | |
| Advisory fees | | 9,558,425 | |
| 12b-1 Distribution and shareholder servicing fees: |
| | Class A Shares | | 22,494 | |
| | Class C Shares | | 8,932 | |
| | Class S Shares | | 38,318 | |
| Transfer agent administrative fees and expenses: | | |
| | Class D Shares | | 960,342 | |
| | Class S Shares | | 38,408 | |
| | Class T Shares | | 889,884 | |
| Transfer agent networking and omnibus fees: | | | |
| | Class A Shares | | 7,036 | |
| | Class C Shares | | 718 | |
| | Class I Shares | | 109,175 | |
| Other transfer agent fees and expenses: | | | |
| | Class A Shares | | 700 | |
| | Class C Shares | | 42 | |
| | Class D Shares | | 69,362 | |
| | Class I Shares | | 6,890 | |
| | Class N Shares | | 8,245 | |
| | Class S Shares | | 200 | |
| | Class T Shares | | 3,126 | |
| Registration fees | | 99,525 | |
| Shareholder reports expense | | 96,597 | |
| Trustees’ fees and expenses | | 44,212 | |
| Professional fees | | 43,142 | |
| Affiliated fund administration fees | | 37,337 | |
| Custodian fees | | 23,625 | |
| Other expenses | | 119,722 | |
Total Expenses | | 12,186,457 | |
Less: Excess Expense Reimbursement and Waivers | | (51,916) | |
Net Expenses | | 12,134,541 | |
Net Investment Income/(Loss) | | (577,111) | |
| | | | | |
| | |
See Notes to Financial Statements. |
| |
18 | MARCH 31, 2023 |
Janus Henderson Venture Fund
Statement of Operations (unaudited)
For the period ended March 31, 2023
| | | | | | |
| | | | | |
Net Realized Gain/(Loss) on Investments: | |
| Investments and foreign currency transactions | $ | 94,085,449 | |
| Investments in affiliates | | 15,499,303 | |
| Forward foreign currency exchange contracts | | 1,963,138 | |
Total Net Realized Gain/(Loss) on Investments | 111,547,890 | |
Change in Unrealized Net Appreciation/Depreciation: |
| Investments, foreign currency translations and Trustees’ deferred compensation | | 307,523,641 | |
| Investments in affiliates | | (7,453,929) | |
| Forward foreign currency exchange contracts | | (8,920,212) | |
Total Change in Unrealized Net Appreciation/Depreciation | 291,149,500 | |
Net Increase/(Decrease) in Net Assets Resulting from Operations | $ | 402,120,279 | |
| | | | | |
| | |
See Notes to Financial Statements. |
| |
Janus Investment Fund | 19 |
Janus Henderson Venture Fund
Statements of Changes in Net Assets
| | | | | | | | | |
| | | | | | | | |
| | | Period ended
March 31, 2023 (unaudited) | | Year ended
September 30, 2022 | |
| | | | | | | | | |
Operations: | | | | | | |
| Net investment income/(loss) | $ | (577,111) | | $ | (13,543,805) | |
| Net realized gain/(loss) on investments | | 111,547,890 | | | 167,985,475 | |
| Change in unrealized net appreciation/depreciation | 291,149,500 | | | (1,313,757,499) | |
Net Increase/(Decrease) in Net Assets Resulting from Operations | 402,120,279 | | | (1,159,315,829) | |
Dividends and Distributions to Shareholders: | | | | | | |
| | Class A Shares | | (755,705) | | | (2,765,688) | |
| | Class C Shares | | (77,952) | | | (429,596) | |
| | Class D Shares | | (66,559,828) | | | (245,929,527) | |
| | Class I Shares | | (9,789,044) | | | (39,332,133) | |
| | Class N Shares | | (14,171,285) | | | (60,480,498) | |
| | Class S Shares | | (1,332,618) | | | (6,073,592) | |
| | Class T Shares | | (29,907,426) | | | (117,792,659) | |
Net Decrease from Dividends and Distributions to Shareholders | (122,593,858) | | | (472,803,693) | |
Capital Share Transactions: | | | | | | |
| | Class A Shares | | 2,024,361 | | | (121,465) | |
| | Class C Shares | | (382,513) | | | (837,470) | |
| | Class D Shares | | 20,653,636 | | | 129,351,737 | |
| | Class I Shares | | 1,623,822 | | | (6,508,752) | |
| | Class N Shares | | (825,892) | | | (19,282,673) | |
| | Class S Shares | | (266,259) | | | (5,473,577) | |
| | Class T Shares | | (8,224,691) | | | 11,716,334 | |
Net Increase/(Decrease) from Capital Share Transactions | 14,602,464 | | | 108,844,134 | |
Net Increase/(Decrease) in Net Assets | | 294,128,885 | | | (1,523,275,388) | |
Net Assets: | | | | | | |
| Beginning of period | | 2,767,895,625 | | | 4,291,171,013 | |
| End of period | $ | 3,062,024,510 | | $ | 2,767,895,625 | |
| | | | | | | | |
| | |
See Notes to Financial Statements. |
| |
20 | MARCH 31, 2023 |
Janus Henderson Venture Fund
Financial Highlights
| | | | | | | | | | | | | | | | | | | | | | |
Class A Shares | | | | | | | | | | | | | | | | | | |
For a share outstanding during the period ended March 31, 2023 (unaudited) and the year ended September 30 | 2023 | | | 2022 | | | 2021 | | | 2020 | | | 2019 | | | 2018 | |
| Net Asset Value, Beginning of Period | | $66.65 | | | $106.21 | | | $82.08 | | | $76.74 | | | $88.38 | | | $76.48 | |
| Income/(Loss) from Investment Operations: | | | | | | | | | | | | | | | | | | |
| | Net investment income/(loss)(1) | | (0.09) | | | (0.49) | | | (0.67) | | | (0.37) | | | (0.24) | | | (0.25) | |
| | Net realized and unrealized gain/(loss) | | 9.53 | | | (26.74) | | | 30.42 | | | 8.89 | | | (4.67) | | | 16.26 | |
| Total from Investment Operations | | 9.44 | | | (27.23) | | | 29.75 | | | 8.52 | | | (4.91) | | | 16.01 | |
| Less Dividends and Distributions: | | | | | | | | | | | | | | | | | | |
| | Dividends (from net investment income) | | — | | | — | | | — | | | — | | | — | | | — | |
| | Distributions (from capital gains) | | (3.14) | | | (12.33) | | | (5.62) | | | (3.18) | | | (6.73) | | | (4.11) | |
| Total Dividends and Distributions | | (3.14) | | | (12.33) | | | (5.62) | | | (3.18) | | | (6.73) | | | (4.11) | |
| Net Asset Value, End of Period | | $72.95 | | | $66.65 | | | $106.21 | | | $82.08 | | | $76.74 | | | $88.38 | |
| Total Return* | | 14.60% | | | (28.58)% | | | 36.78% | | | 11.26% | | | (4.08)% | | | 21.83% | |
| Net Assets, End of Period (in thousands) | | $18,783 | | | $15,149 | | | $24,644 | | | $18,447 | | | $27,201 | | | $31,373 | |
| Average Net Assets for the Period (in thousands) | | $17,854 | | | $20,355 | | | $23,550 | | | $22,978 | | | $27,960 | | | $24,358 | |
| Ratios to Average Net Assets**: | | | | | | | | | | | | | | | | | | |
| | Ratio of Gross Expenses | | 1.02% | | | 1.01% | | | 1.00% | | | 1.02% | | | 1.02% | | | 1.01% | |
| | Ratio of Net Expenses (After Waivers and Expense Offsets) | | 1.02% | | | 1.01% | | | 1.00% | | | 1.02% | | | 1.02% | | | 1.01% | |
| | Ratio of Net Investment Income/(Loss) | | (0.25)% | | | (0.59)% | | | (0.66)% | | | (0.49)% | | | (0.32)% | | | (0.31)% | |
| Portfolio Turnover Rate | | 10% | | | 14% | | | 21% | | | 25% | | | 19% | | | 28% | |
| | | | | | | | | | | | | | | | | | | | | | |
| |
* Total return includes adjustments in accordance with generally accepted accounting principles required at the year or period end and are not annualized for periods of less than one full year. ** Annualized for periods of less than one full year. (1) Per share amounts are calculated based on average shares outstanding during the year or period. |
| | |
See Notes to Financial Statements. |
| |
Janus Investment Fund | 21 |
Janus Henderson Venture Fund
Financial Highlights
| | | | | | | | | | | | | | | | | | | | | | |
Class C Shares | | | | | | | | | | | | | | | | | | |
For a share outstanding during the period ended March 31, 2023 (unaudited) and the year ended September 30 | 2023 | | | 2022 | | | 2021 | | | 2020 | | | 2019 | | | 2018 | |
| Net Asset Value, Beginning of Period | | $58.35 | | | $95.22 | | | $74.59 | | | $70.48 | | | $82.39 | | | $72.06 | |
| Income/(Loss) from Investment Operations: | | | | | | | | | | | | | | | | | | |
| | Net investment income/(loss)(1) | | (0.41) | | | (0.99) | | | (1.29) | | | (0.82) | | | (0.72) | | | (0.78) | |
| | Net realized and unrealized gain/(loss) | | 8.30 | | | (23.55) | | | 27.54 | | | 8.11 | | | (4.46) | | | 15.22 | |
| Total from Investment Operations | | 7.89 | | | (24.54) | | | 26.25 | | | 7.29 | | | (5.18) | | | 14.44 | |
| Less Dividends and Distributions: | | | | | | | | | | | | | | | | | | |
| | Dividends (from net investment income) | | — | | | — | | | — | | | — | | | — | | | — | |
| | Distributions (from capital gains) | | (3.14) | | | (12.33) | | | (5.62) | | | (3.18) | | | (6.73) | | | (4.11) | |
| Total Dividends and Distributions | | (3.14) | | | (12.33) | | | (5.62) | | | (3.18) | | | (6.73) | | | (4.11) | |
| Net Asset Value, End of Period | | $63.10 | | | $58.35 | | | $95.22 | | | $74.59 | | | $70.48 | | | $82.39 | |
| Total Return* | | 14.01% | | | (29.11)% | | | 35.74% | | | 10.49% | | | (4.76)% | | | 20.95% | |
| Net Assets, End of Period (in thousands) | | $1,394 | | | $1,642 | | | $3,747 | | | $5,562 | | | $8,561 | | | $12,223 | |
| Average Net Assets for the Period (in thousands) | | $1,571 | | | $2,525 | | | $4,965 | | | $6,913 | | | $9,783 | | | $12,894 | |
| Ratios to Average Net Assets**: | | | | | | | | | | | | | | | | | | |
| | Ratio of Gross Expenses | | 2.09% | | | 1.73% | | | 1.76% | | | 1.71% | | | 1.73% | | | 1.74% | |
| | Ratio of Net Expenses (After Waivers and Expense Offsets) | | 2.09% | | | 1.73% | | | 1.76% | | | 1.71% | | | 1.73% | | | 1.74% | |
| | Ratio of Net Investment Income/(Loss) | | (1.32)% | | | (1.31)% | | | (1.42)% | | | (1.18)% | | | (1.03)% | | | (1.03)% | |
| Portfolio Turnover Rate | | 10% | | | 14% | | | 21% | | | 25% | | | 19% | | | 28% | |
| | | | | | | | | | | | | | | | | | | | | | |
| |
* Total return includes adjustments in accordance with generally accepted accounting principles required at the year or period end and are not annualized for periods of less than one full year. ** Annualized for periods of less than one full year. (1) Per share amounts are calculated based on average shares outstanding during the year or period. |
| | |
See Notes to Financial Statements. |
| |
22 | MARCH 31, 2023 |
Janus Henderson Venture Fund
Financial Highlights
| | | | | | | | | | | | | | | | | | | | | | |
Class D Shares | | | | | | | | | | | | | | | | | | |
For a share outstanding during the period ended March 31, 2023 (unaudited) and the year ended September 30 | 2023 | | | 2022 | | | 2021 | | | 2020 | | | 2019 | | | 2018 | |
| Net Asset Value, Beginning of Period | | $69.81 | | | $110.41 | | | $84.98 | | | $79.17 | | | $90.73 | | | $78.25 | |
| Income/(Loss) from Investment Operations: | | | | | | | | | | | | | | | | | | |
| | Net investment income/(loss)(1) | | (0.01) | | | (0.32) | | | (0.47) | | | (0.22) | | | (0.08) | | | (0.08) | |
| | Net realized and unrealized gain/(loss) | | 10.00 | | | (27.95) | | | 31.52 | | | 9.21 | | | (4.75) | | | 16.67 | |
| Total from Investment Operations | | 9.99 | | | (28.27) | | | 31.05 | | | 8.99 | | | (4.83) | | | 16.59 | |
| Less Dividends and Distributions: | | | | | | | | | | | | | | | | | | |
| | Dividends (from net investment income) | | — | | | — | | | — | | | — | | | — | | | — | |
| | Distributions (from capital gains) | | (3.14) | | | (12.33) | | | (5.62) | | | (3.18) | | | (6.73) | | | (4.11) | |
| Total Dividends and Distributions | | (3.14) | | | (12.33) | | | (5.62) | | | (3.18) | | | (6.73) | | | (4.11) | |
| Net Asset Value, End of Period | | $76.66 | | | $69.81 | | | $110.41 | | | $84.98 | | | $79.17 | | | $90.73 | |
| Total Return* | | 14.73% | | | (28.42)% | | | 37.07% | | | 11.52% | | | (3.87)% | | | 22.09% | |
| Net Assets, End of Period (in thousands) | | $1,673,151 | | | $1,500,311 | | | $2,228,324 | | | $1,731,098 | | | $1,668,639 | | | $1,843,494 | |
| Average Net Assets for the Period (in thousands) | | $1,630,766 | | | $1,877,171 | | | $2,160,434 | | | $1,645,324 | | | $1,668,200 | | | $1,712,398 | |
| Ratios to Average Net Assets**: | | | | | | | | | | | | | | | | | | |
| | Ratio of Gross Expenses | | 0.80% | | | 0.79% | | | 0.78% | | | 0.80% | | | 0.80% | | | 0.80% | |
| | Ratio of Net Expenses (After Waivers and Expense Offsets) | | 0.80% | | | 0.79% | | | 0.78% | | | 0.80% | | | 0.80% | | | 0.80% | |
| | Ratio of Net Investment Income/(Loss) | | (0.03)% | | | (0.37)% | | | (0.45)% | | | (0.28)% | | | (0.10)% | | | (0.09)% | |
| Portfolio Turnover Rate | | 10% | | | 14% | | | 21% | | | 25% | | | 19% | | | 28% | |
| | | | | | | | | | | | | | | | | | | | | | |
| |
* Total return includes adjustments in accordance with generally accepted accounting principles required at the year or period end and are not annualized for periods of less than one full year. ** Annualized for periods of less than one full year. (1) Per share amounts are calculated based on average shares outstanding during the year or period. |
| | |
See Notes to Financial Statements. |
| |
Janus Investment Fund | 23 |
Janus Henderson Venture Fund
Financial Highlights
| | | | | | | | | | | | | | | | | | | | | | |
Class I Shares | | | | | | | | | | | | | | | | | | |
For a share outstanding during the period ended March 31, 2023 (unaudited) and the year ended September 30 | 2023 | | | 2022 | | | 2021 | | | 2020 | | | 2019 | | | 2018 | |
| Net Asset Value, Beginning of Period | | $70.32 | | | $111.10 | | | $85.45 | | | $79.57 | | | $91.10 | | | $78.51 | |
| Income/(Loss) from Investment Operations: | | | | | | | | | | | | | | | | | | |
| | Net investment income/(loss)(1) | | —(2) | | | (0.30) | | | (0.44) | | | (0.19) | | | (0.04) | | | (0.03) | |
| | Net realized and unrealized gain/(loss) | | 10.09 | | | (28.15) | | | 31.71 | | | 9.25 | | | (4.76) | | | 16.73 | |
| Total from Investment Operations | | 10.09 | | | (28.45) | | | 31.27 | | | 9.06 | | | (4.80) | | | 16.70 | |
| Less Dividends and Distributions: | | | | | | | | | | | | | | | | | | |
| | Dividends (from net investment income) | | — | | | — | | | — | | | — | | | — | | | — | |
| | Distributions (from capital gains) | | (3.14) | | | (12.33) | | | (5.62) | | | (3.18) | | | (6.73) | | | (4.11) | |
| Total Dividends and Distributions | | (3.14) | | | (12.33) | | | (5.62) | | | (3.18) | | | (6.73) | | | (4.11) | |
| Net Asset Value, End of Period | | $77.27 | | | $70.32 | | | $111.10 | | | $85.45 | | | $79.57 | | | $91.10 | |
| Total Return* | | 14.77% | | | (28.40)% | | | 37.13% | | | 11.55% | | | (3.82)% | | | 22.16% | |
| Net Assets, End of Period (in thousands) | | $243,970 | | | $220,157 | | | $363,007 | | | $287,582 | | | $315,109 | | | $362,757 | |
| Average Net Assets for the Period (in thousands) | | $238,822 | | | $294,435 | | | $357,200 | | | $292,611 | | | $318,833 | | | $317,820 | |
| Ratios to Average Net Assets**: | | | | | | | | | | | | | | | | | | |
| | Ratio of Gross Expenses | | 0.77% | | | 0.76% | | | 0.75% | | | 0.75% | | | 0.75% | | | 0.75% | |
| | Ratio of Net Expenses (After Waivers and Expense Offsets) | | 0.77% | | | 0.76% | | | 0.75% | | | 0.75% | | | 0.75% | | | 0.75% | |
| | Ratio of Net Investment Income/(Loss) | | 0.01% | | | (0.34)% | | | (0.42)% | | | (0.23)% | | | (0.05)% | | | (0.04)% | |
| Portfolio Turnover Rate | | 10% | | | 14% | | | 21% | | | 25% | | | 19% | | | 28% | |
| | | | | | | | | | | | | | | | | | | | | | |
| |
* Total return includes adjustments in accordance with generally accepted accounting principles required at the year or period end and are not annualized for periods of less than one full year. ** Annualized for periods of less than one full year. (1) Per share amounts are calculated based on average shares outstanding during the year or period. (2) Less than $0.005 on a per share basis. |
| | |
See Notes to Financial Statements. |
| |
24 | MARCH 31, 2023 |
Janus Henderson Venture Fund
Financial Highlights
| | | | | | | | | | | | | | | | | | | | | | |
Class N Shares | | | | | | | | | | | | | | | | | | |
For a share outstanding during the period ended March 31, 2023 (unaudited) and the year ended September 30 | 2023 | | | 2022 | | | 2021 | | | 2020 | | | 2019 | | | 2018 | |
| Net Asset Value, Beginning of Period | | $71.17 | | | $112.20 | | | $86.18 | | | $80.15 | | | $91.63 | | | $78.88 | |
| Income/(Loss) from Investment Operations: | | | | | | | | | | | | | | | | | | |
| | Net investment income/(loss)(1) | | 0.04 | | | (0.22) | | | (0.35) | | | (0.12) | | | 0.02 | | | 0.03 | |
| | Net realized and unrealized gain/(loss) | | 10.21 | | | (28.48) | | | 31.99 | | | 9.33 | | | (4.77) | | | 16.83 | |
| Total from Investment Operations | | 10.25 | | | (28.70) | | | 31.64 | | | 9.21 | | | (4.75) | | | 16.86 | |
| Less Dividends and Distributions: | | | | | | | | | | | | | | | | | | |
| | Dividends (from net investment income) | | — | | | — | | | — | | | — | | | — | | | — | |
| | Distributions (from capital gains) | | (3.14) | | | (12.33) | | | (5.62) | | | (3.18) | | | (6.73) | | | (4.11) | |
| Total Dividends and Distributions | | (3.14) | | | (12.33) | | | (5.62) | | | (3.18) | | | (6.73) | | | (4.11) | |
| Net Asset Value, End of Period | | $78.28 | | | $71.17 | | | $112.20 | | | $86.18 | | | $80.15 | | | $91.63 | |
| Total Return* | | 14.82% | | | (28.34)% | | | 37.25% | | | 11.65% | | | (3.74)% | | | 22.26% | |
| Net Assets, End of Period (in thousands) | | $369,490 | | | $335,608 | | | $565,040 | | | $454,982 | | | $411,523 | | | $346,638 | |
| Average Net Assets for the Period (in thousands) | | $359,544 | | | $458,042 | | | $572,312 | | | $430,317 | | | $365,491 | | | $248,072 | |
| Ratios to Average Net Assets**: | | | | | | | | | | | | | | | | | | |
| | Ratio of Gross Expenses | | 0.67% | | | 0.67% | | | 0.66% | | | 0.66% | | | 0.67% | | | 0.67% | |
| | Ratio of Net Expenses (After Waivers and Expense Offsets) | | 0.67% | | | 0.67% | | | 0.66% | | | 0.66% | | | 0.67% | | | 0.67% | |
| | Ratio of Net Investment Income/(Loss) | | 0.10% | | | (0.25)% | | | (0.33)% | | | (0.15)% | | | 0.03% | | | 0.04% | |
| Portfolio Turnover Rate | | 10% | | | 14% | | | 21% | | | 25% | | | 19% | | | 28% | |
| | | | | | | | | | | | | | | | | | | | | | |
| |
* Total return includes adjustments in accordance with generally accepted accounting principles required at the year or period end and are not annualized for periods of less than one full year. ** Annualized for periods of less than one full year. (1) Per share amounts are calculated based on average shares outstanding during the year or period. |
| | |
See Notes to Financial Statements. |
| |
Janus Investment Fund | 25 |
Janus Henderson Venture Fund
Financial Highlights
| | | | | | | | | | | | | | | | | | | | | | |
Class S Shares | | | | | | | | | | | | | | | | | | |
For a share outstanding during the period ended March 31, 2023 (unaudited) and the year ended September 30 | 2023 | | | 2022 | | | 2021 | | | 2020 | | | 2019 | | | 2018 | |
| Net Asset Value, Beginning of Period | | $65.32 | | | $104.51 | | | $80.97 | | | $75.85 | | | $87.56 | | | $75.92 | |
| Income/(Loss) from Investment Operations: | | | | | | | | | | | | | | | | | | |
| | Net investment income/(loss)(1) | | (0.14) | | | (0.62) | | | (0.83) | | | (0.49) | | | (0.35) | | | (0.37) | |
| | Net realized and unrealized gain/(loss) | | 9.34 | | | (26.24) | | | 29.99 | | | 8.79 | | | (4.63) | | | 16.12 | |
| Total from Investment Operations | | 9.20 | | | (26.86) | | | 29.16 | | | 8.30 | | | (4.98) | | | 15.75 | |
| Less Dividends and Distributions: | | | | | | | | | | | | | | | | | | |
| | Dividends (from net investment income) | | — | | | — | | | — | | | — | | | — | | | — | |
| | Distributions (from capital gains) | | (3.14) | | | (12.33) | | | (5.62) | | | (3.18) | | | (6.73) | | | (4.11) | |
| Total Dividends and Distributions | | (3.14) | | | (12.33) | | | (5.62) | | | (3.18) | | | (6.73) | | | (4.11) | |
| Net Asset Value, End of Period | | $71.38 | | | $65.32 | | | $104.51 | | | $80.97 | | | $75.85 | | | $87.56 | |
| Total Return* | | 14.53% | | | (28.70)% | | | 36.55% | | | 11.10% | | | (4.21)% | | | 21.64% | |
| Net Assets, End of Period (in thousands) | | $31,755 | | | $29,213 | | | $54,537 | | | $64,120 | | | $73,302 | | | $82,776 | |
| Average Net Assets for the Period (in thousands) | | $30,793 | | | $42,248 | | | $59,918 | | | $66,822 | | | $74,076 | | | $69,664 | |
| Ratios to Average Net Assets**: | | | | | | | | | | | | | | | | | | |
| | Ratio of Gross Expenses | | 1.18% | | | 1.17% | | | 1.16% | | | 1.17% | | | 1.17% | | | 1.17% | |
| | Ratio of Net Expenses (After Waivers and Expense Offsets) | | 1.18% | | | 1.17% | | | 1.16% | | | 1.17% | | | 1.17% | | | 1.17% | |
| | Ratio of Net Investment Income/(Loss) | | (0.40)% | | | (0.75)% | | | (0.83)% | | | (0.65)% | | | (0.47)% | | | (0.46)% | |
| Portfolio Turnover Rate | | 10% | | | 14% | | | 21% | | | 25% | | | 19% | | | 28% | |
| | | | | | | | | | | | | | | | | | | | | | |
| |
* Total return includes adjustments in accordance with generally accepted accounting principles required at the year or period end and are not annualized for periods of less than one full year. ** Annualized for periods of less than one full year. (1) Per share amounts are calculated based on average shares outstanding during the year or period. |
| | |
See Notes to Financial Statements. |
| |
26 | MARCH 31, 2023 |
Janus Henderson Venture Fund
Financial Highlights
| | | | | | | | | | | | | | | | | | | | | | |
Class T Shares | | | | | | | | | | | | | | | | | | |
For a share outstanding during the period ended March 31, 2023 (unaudited) and the year ended September 30 | 2023 | | | 2022 | | | 2021 | | | 2020 | | | 2019 | | | 2018 | |
| Net Asset Value, Beginning of Period | | $68.27 | | | $108.38 | | | $83.59 | | | $78.01 | | | $89.60 | | | $77.41 | |
| Income/(Loss) from Investment Operations: | | | | | | | | | | | | | | | | | | |
| | Net investment income/(loss)(1) | | (0.05) | | | (0.41) | | | (0.58) | | | (0.30) | | | (0.16) | | | (0.16) | |
| | Net realized and unrealized gain/(loss) | | 9.78 | | | (27.37) | | | 30.99 | | | 9.06 | | | (4.70) | | | 16.46 | |
| Total from Investment Operations | | 9.73 | | | (27.78) | | | 30.41 | | | 8.76 | | | (4.86) | | | 16.30 | |
| Less Dividends and Distributions: | | | | | | | | | | | | | | | | | | |
| | Dividends (from net investment income) | | — | | | — | | | — | | | — | | | — | | | — | |
| | Distributions (from capital gains) | | (3.14) | | | (12.33) | | | (5.62) | | | (3.18) | | | (6.73) | | | (4.11) | |
| Total Dividends and Distributions | | (3.14) | | | (12.33) | | | (5.62) | | | (3.18) | | | (6.73) | | | (4.11) | |
| Net Asset Value, End of Period | | $74.86 | | | $68.27 | | | $108.38 | | | $83.59 | | | $78.01 | | | $89.60 | |
| Total Return* | | 14.68% | | | (28.51)% | | | 36.91% | | | 11.39% | | | (3.96)% | | | 21.95% | |
| Net Assets, End of Period (in thousands) | | $723,481 | | | $665,815 | | | $1,051,872 | | | $815,350 | | | $896,264 | | | $1,009,462 | |
| Average Net Assets for the Period (in thousands) | | $713,422 | | | $858,977 | | | $1,026,384 | | | $839,860 | | | $899,106 | | | $978,055 | |
| Ratios to Average Net Assets**: | | | | | | | | | | | | | | | | | | |
| | Ratio of Gross Expenses | | 0.92% | | | 0.92% | | | 0.91% | | | 0.91% | | | 0.91% | | | 0.91% | |
| | Ratio of Net Expenses (After Waivers and Expense Offsets) | | 0.90% | | | 0.90% | | | 0.90% | | | 0.91% | | | 0.91% | | | 0.91% | |
| | Ratio of Net Investment Income/(Loss) | | (0.13)% | | | (0.47)% | | | (0.57)% | | | (0.38)% | | | (0.20)% | | | (0.20)% | |
| Portfolio Turnover Rate | | 10% | | | 14% | | | 21% | | | 25% | | | 19% | | | 28% | |
| | | | | | | | | | | | | | | | | | | | | | |
| |
* Total return includes adjustments in accordance with generally accepted accounting principles required at the year or period end and are not annualized for periods of less than one full year. ** Annualized for periods of less than one full year. (1) Per share amounts are calculated based on average shares outstanding during the year or period. |
| | |
See Notes to Financial Statements. |
| |
Janus Investment Fund | 27 |
Janus Henderson Venture Fund
Notes to Financial Statements (unaudited)
1. Organization and Significant Accounting Policies
Janus Henderson Venture Fund (the “Fund”) is a series of Janus Investment Fund (the “Trust”), which is organized as a Massachusetts business trust and is registered under the Investment Company Act of 1940, as amended (the “1940 Act”), as an open-end management investment company, and therefore has applied the specialized accounting and reporting guidance in Financial Accounting Standards Board (“FASB”) Accounting Standards Codification (“ASC”) Topic 946. The Trust offers 40 funds, each of which offers multiple share classes, with differing investment objectives and policies. The Fund seeks capital appreciation. The Fund is classified as diversified, as defined in the 1940 Act. Janus Henderson Investors US LLC is the investment adviser (the “Adviser”) to the Fund.
The Fund offers multiple classes of shares in order to meet the needs of various types of investors. Each class represents an interest in the same portfolio of investments. Certain financial intermediaries may not offer all classes of shares. Effective July 18, 2022, the Fund reopened to all new investors.
Shareholders, including other funds, individuals, accounts, as well as the Fund’s portfolio manager(s) and/or investment personnel, may from time to time own (beneficially or of record) a significant percentage of the Fund’s Shares and can be considered to “control” the Fund when that ownership exceeds 25% of the Fund’s assets (and which may differ from control as determined in accordance with United States of America generally accepted accounting principles ("US GAAP")).
Class A Shares are offered through financial intermediary platforms including, but not limited to, traditional brokerage platforms, mutual fund wrap fee programs, bank trust platforms, and retirement platforms.
Class C Shares are offered through financial intermediary platforms including, but not limited to, traditional brokerage platforms, mutual fund wrap fee programs, employer-sponsored retirement plans, and bank trust platforms.
The Fund currently implements an automatic conversion feature pursuant to which Class C Shares that have been held for eight years are automatically converted to Class A Shares without the imposition of any sales charge, fee or other charge. The conversion will generally occur no later than ten business days in the month following the month of the eighth anniversary of the date of purchase. Class C Shares purchased through the reinvestment of dividends and other distributions on Class C Shares will convert to Class A Shares at the same time as the original Class C Shares with respect to which they were purchased. For Class C Shares held in omnibus accounts on intermediary platforms, the Fund relies on these intermediaries to implement this conversion feature. Your financial intermediary may have separate policies and procedures as to when and how Class C Shares may be converted to Class A Shares.
Effective July 6, 2020, Class D Shares are available to new investors, subject to any closed fund policies for a Fund, as applicable. Previously, Class D Shares were only available to investors who already had a direct account with the Janus Henderson funds; immediate family members or members of the same household of an eligible individual investor; and existing beneficial owners of sole proprietorships or partnerships that hold accounts directly with the Janus Henderson funds.
Class I Shares are available through certain financial intermediary platforms including, but not limited to, mutual fund wrap fee programs, managed account programs, asset allocation programs, bank trust platforms, as well as certain retirement platforms. Class I Shares are also available to certain direct institutional investors including, but not limited to, corporations, certain retirement plans, public plans, and foundations/endowments, who established Class I Share accounts before August 4, 2017.
Class N Shares are generally available only to financial intermediaries purchasing on behalf of: 1) certain adviser-assisted, employer-sponsored retirement plans, including 401(k) plans, 457 plans, 403(b) plans, Taft-Hartley multi-employer plans, profit-sharing and money purchase pension plans, defined benefit plans and certain welfare benefit plans, such as health savings accounts, and nonqualified deferred compensation plans; and 2) retail investors purchasing in qualified or nonqualified accounts, whose accounts are held through an omnibus account at their financial intermediary, and where the financial intermediary requires no payment or reimbursement from the Fund, the Adviser, or its affiliates. Class N Shares are also available to Janus Henderson proprietary products and to certain direct institutional investors approved by Janus Henderson Distributors US LLC (the “Distributor”) including, but not limited to, corporations, certain retirement plans, public plans, and foundations and endowments, subject to minimum investment requirements.
Janus Henderson Venture Fund
Notes to Financial Statements (unaudited)
Class S Shares are offered through financial intermediary platforms including, but not limited to, retirement platforms and asset allocation, mutual fund wrap, or other discretionary or nondiscretionary fee-based investment advisory programs. In addition, Class S Shares may be available through certain financial intermediaries who have an agreement with the Adviser or its affiliates to offer Class S Shares on their supermarket platforms.
Class T Shares are available through certain financial intermediary platforms including, but not limited to, mutual fund wrap fee programs, managed account programs, asset allocation programs, bank trust platforms, as well as certain retirement platforms. In addition, Class T Shares may be available through certain financial intermediaries who have an agreement with the Adviser or its affiliates to offer Class T Shares on their supermarket platforms.
The following accounting policies have been followed by the Fund and are in conformity with US GAAP.
Investment Valuation
Fund holdings are valued in accordance with policies and procedures established by the Adviser pursuant to Rule 2a-5 under the 1940 Act and approved by and subject to the oversight of the Trustees (the “Valuation Procedures”). Equity securities traded on a domestic securities exchange are generally valued at readily available market quotations, which are (i) the official close prices or (ii) last sale prices on the primary market or exchange in which the securities trade. If such price is lacking for the trading period immediately preceding the time of determination, such securities are generally valued at their current bid price. Equity securities that are traded on a foreign exchange are generally valued at the closing prices on such markets. In the event that there is no current trading volume on a particular security in such foreign exchange, the bid price from the primary exchange is generally used to value the security. Foreign securities and currencies are converted to U.S. dollars using the current spot USD dollar exchange rate in effect at the close of the New York Stock Exchange (“NYSE”). The Fund will determine the market value of individual securities held by it by using prices provided by one or more approved professional pricing services or, as needed, by obtaining market quotations from independent broker-dealers. Most debt securities are valued in accordance with the evaluated bid price supplied by the Adviser-approved pricing service that is intended to reflect market value. The evaluated bid price supplied by the pricing service is an evaluation that may consider factors such as security prices, yields, maturities and ratings. Certain short-term securities maturing within 60 days or less may be evaluated and valued on an amortized cost basis provided that the amortized cost determined approximates market value. Securities for which market quotations or evaluated prices are not readily available or deemed unreliable are valued at fair value determined in good faith by the Adviser pursuant to the Valuation Procedures. Circumstances in which fair valuation may be utilized include, but are not limited to: (i) a significant event that may affect the securities of a single issuer, such as a merger, bankruptcy, or significant issuer-specific development; (ii) an event that may affect an entire market, such as a natural disaster or significant governmental action; (iii) a nonsignificant event such as a market closing early or not opening, or a security trading halt; and (iv) pricing of a nonvalued security and a restricted or nonpublic security. Special valuation considerations may apply with respect to “odd-lot” fixed-income transactions which, due to their small size, may receive evaluated prices by pricing services which reflect a large block trade and not what actually could be obtained for the odd-lot position. The valuation policies provide for the use of systematic fair valuation models provided by independent pricing services to value foreign equity securities in order to adjust for stale pricing, which may occur between the close of certain foreign exchanges and the close of the NYSE. The value of the securities of other mutual funds held by a Fund, if any, will be calculated using the NAV of such mutual funds.
Valuation Inputs Summary
FASB ASC 820, Fair Value Measurements and Disclosures (“ASC 820”), defines fair value, establishes a framework for measuring fair value, and expands disclosure requirements regarding fair value measurements. This standard emphasizes that fair value is a market-based measurement that should be determined based on the assumptions that market participants would use in pricing an asset or liability and establishes a hierarchy that prioritizes inputs to valuation techniques used to measure fair value. These inputs are summarized into three broad levels:
Level 1 – Unadjusted quoted prices in active markets the Fund has the ability to access for identical assets or liabilities.
Level 2 – Observable inputs other than unadjusted quoted prices included in Level 1 that are observable for the asset or liability either directly or indirectly. These inputs may include quoted prices for the identical instrument on an inactive market, prices for similar instruments, interest rates, prepayment speeds, credit risk, yield curves, default rates and similar data.
Janus Henderson Venture Fund
Notes to Financial Statements (unaudited)
Assets or liabilities categorized as Level 2 in the hierarchy generally include: debt securities fair valued in accordance with the evaluated bid or ask prices supplied by a pricing service; securities traded on OTC markets and listed securities for which no sales are reported that are fair valued at the latest bid price (or yield equivalent thereof) obtained from one or more dealers transacting in a market for such securities or by a pricing service approved by the Fund’s Trustees; certain short-term debt securities with maturities of 60 days or less that are fair valued at amortized cost; and equity securities of foreign issuers whose fair value is determined by using systematic fair valuation models provided by independent third parties in order to adjust for stale pricing which may occur between the close of certain foreign exchanges and the close of the NYSE. Other securities that may be categorized as Level 2 in the hierarchy include, but are not limited to, preferred stocks, bank loans, swaps, investments in unregistered investment companies, options, and forward contracts.
Level 3 – Unobservable inputs for the asset or liability to the extent that relevant observable inputs are not available, representing the Fund’s own assumptions about the assumptions that a market participant would use in valuing the asset or liability, and that would be based on the best information available.
There have been no significant changes in valuation techniques used in valuing any such positions held by the Fund since the beginning of the fiscal period.
The inputs or methodology used for fair valuing securities are not necessarily an indication of the risk associated with investing in those securities. The summary of inputs used as of March 31, 2023 to fair value the Fund’s investments in securities and other financial instruments is included in the “Valuation Inputs Summary” in the Notes to Schedule of Investments and Other Information.
The Fund did not hold a significant amount of Level 3 securities as of March 31, 2023.
Investment Transactions and Investment Income
Investment transactions are accounted for as of the date purchased or sold (trade date). Dividend income is recorded on the ex-dividend date. Certain dividends from foreign securities will be recorded as soon as the Fund is informed of the dividend, if such information is obtained subsequent to the ex-dividend date. Dividends from foreign securities may be subject to withholding taxes in foreign jurisdictions. Non-cash dividends, if any, are recorded on the ex-dividend date at fair value. Interest income is recorded daily on an accrual basis and includes amortization of premiums and accretion of discounts. The Fund classifies gains and losses on prepayments received as an adjustment to interest income. Debt securities may be placed in non-accrual status and related interest income may be reduced by stopping current accruals and writing off interest receivables when collection of all or a portion of interest has become doubtful. Gains and losses are determined on the identified cost basis, which is the same basis used for federal income tax purposes. Income, as well as gains and losses, both realized and unrealized, are allocated daily to each class of shares based upon the ratio of net assets represented by each class as a percentage of total net assets.
Expenses
The Fund bears expenses incurred specifically on its behalf. Each class of shares bears a portion of general expenses, which are allocated daily to each class of shares based upon the ratio of net assets represented by each class as a percentage of total net assets. Expenses directly attributable to a specific class of shares are charged against the operations of such class.
Estimates
The preparation of financial statements in conformity with US GAAP requires management to make estimates and assumptions that affect the reported amount of assets and liabilities and disclosure of contingent assets and liabilities at the date of the financial statements, and the reported amounts of income and expenses during the reporting period. Actual results could differ from those estimates.
Indemnifications
In the normal course of business, the Fund may enter into contracts that contain provisions for indemnification of other parties against certain potential liabilities. The Fund’s maximum exposure under these arrangements is unknown, and would involve future claims that may be made against the Fund that have not yet occurred. Currently, the risk of material loss from such claims is considered remote.
Foreign Currency Translations
The Fund does not isolate that portion of the results of operations resulting from the effect of changes in foreign exchange rates on investments from the fluctuations arising from changes in market prices of securities held at the
Janus Henderson Venture Fund
Notes to Financial Statements (unaudited)
date of the financial statements. Net unrealized appreciation or depreciation of investments and foreign currency translations arise from changes in the value of assets and liabilities, including investments in securities held at the date of the financial statements, resulting from changes in the exchange rates and changes in market prices of securities held.
Currency gains and losses are also calculated on payables and receivables that are denominated in foreign currencies. The payables and receivables are generally related to foreign security transactions and income translations.
Foreign currency-denominated assets and forward currency contracts may involve more risks than domestic transactions, including currency risk, counterparty risk, political and economic risk, regulatory risk and equity risk. Risks may arise from unanticipated movements in the value of foreign currencies relative to the U.S. dollar.
Dividends and Distributions
The Fund generally declares and distributes dividends of net investment income and realized capital gains (if any) annually. The Fund may treat a portion of the amount paid to redeem shares as a distribution of investment company taxable income and realized capital gains that are reflected in the net asset value. This practice, commonly referred to as “equalization,” has no effect on the redeeming shareholder or a Fund’s total return, but may reduce the amounts that would otherwise be required to be paid as taxable dividends to the remaining shareholders. It is possible that the Internal Revenue Service (IRS) could challenge the Fund's equalization methodology or calculations, and any such challenge could result in additional tax, interest, or penalties to be paid by the Fund.
The Fund may make certain investments in real estate investment trusts (“REITs”) which pay dividends to their shareholders based upon funds available from operations. It is quite common for these dividends to exceed the REITs’ taxable earnings and profits, resulting in the excess portion of such dividends being designated as a return of capital. If the Fund distributes such amounts, such distributions could constitute a return of capital to shareholders for federal income tax purposes.
Federal Income Taxes
The Fund intends to continue to qualify as a regulated investment company and distribute all of its taxable income in accordance with the requirements of Subchapter M of the Internal Revenue Code. Management has analyzed the Fund’s tax positions taken for all open federal income tax years, generally a three-year period, and has concluded that no provision for federal income tax is required in the Fund’s financial statements. The Fund is not aware of any tax positions for which it is reasonably possible that the total amounts of unrecognized tax benefits will significantly change in the next twelve months.
2. Derivative Instruments
The Fund may invest in various types of derivatives, which may at times result in significant derivative exposure. A derivative is a financial instrument whose performance is derived from the performance of another asset. The Fund may invest in derivative instruments including, but not limited to: futures contracts, put options, call options, options on futures contracts, options on foreign currencies, options on recovery locks, options on security and commodity indices, swaps, forward contracts, structured investments, and other equity-linked derivatives. Each derivative instrument that was held by the Fund during the period ended March 31, 2023 is discussed in further detail below. A summary of derivative activity by the Fund is reflected in the tables at the end of the Schedule of Investments.
The Fund may use derivative instruments for hedging purposes (to offset risks associated with an investment, currency exposure, or market conditions), to adjust currency exposure relative to a benchmark index, or for speculative purposes (to earn income and seek to enhance returns). When the Fund invests in a derivative for speculative purposes, the Fund will be fully exposed to the risks of loss of that derivative, which may sometimes be greater than the derivative’s cost. The Fund may not use any derivative to gain exposure to an asset or class of assets that it would be prohibited by its investment restrictions from purchasing directly. The Fund’s ability to use derivative instruments may also be limited by tax considerations.
Investments in derivatives in general are subject to market risks that may cause their prices to fluctuate over time. Investments in derivatives may not directly correlate with the price movements of the underlying instrument. As a result, the use of derivatives may expose the Fund to additional risks that it would not be subject to if it invested directly in the securities underlying those derivatives. The use of derivatives may result in larger losses or smaller gains than otherwise would be the case. Derivatives can be volatile and may involve significant risks.
Janus Henderson Venture Fund
Notes to Financial Statements (unaudited)
In pursuit of its investment objective, the Fund may seek to use derivatives to increase or decrease exposure to the following market risk factors:
· Commodity Risk – the risk related to the change in value of commodities or commodity-linked investments due to changes in the overall market movements, volatility of the underlying benchmark, changes in interest rates, or other factors affecting a particular industry or commodity such as drought, floods, weather, livestock disease, embargoes, tariffs, and international economic, political, and regulatory developments.
· Counterparty Risk – the risk that the counterparty (the party on the other side of the transaction) on a derivative transaction will be unable to honor its financial obligation to the Fund.
· Credit Risk – the risk an issuer will be unable to make principal and interest payments when due, or will default on its obligations.
· Currency Risk – the risk that changes in the exchange rate between currencies will adversely affect the value (in U.S. dollar terms) of an investment.
· Equity Risk – the risk related to the change in value of equity securities as they relate to increases or decreases in the general market.
· Index Risk – if the derivative is linked to the performance of an index, it will be subject to the risks associated with changes in that index. If the index changes, the Fund could receive lower interest payments or experience a reduction in the value of the derivative to below what the Fund paid. Certain indexed securities, including inverse securities (which move in an opposite direction to the index), may create leverage, to the extent that they increase or decrease in value at a rate that is a multiple of the changes in the applicable index.
· Interest Rate Risk – the risk that the value of fixed-income securities will generally decline as prevailing interest rates rise, which may cause the Fund’s NAV to likewise decrease.
· Leverage Risk – the risk associated with certain types of leveraged investments or trading strategies pursuant to which relatively small market movements may result in large changes in the value of an investment. The Fund creates leverage by investing in instruments, including derivatives, where the investment loss can exceed the original amount invested. Certain investments or trading strategies, such as short sales, that involve leverage can result in losses that greatly exceed the amount originally invested.
· Liquidity Risk – the risk that certain securities may be difficult or impossible to sell at the time that the seller would like or at the price that the seller believes the security is currently worth.
Derivatives may generally be traded OTC or on an exchange. Derivatives traded OTC are agreements that are individually negotiated between parties and can be tailored to meet a purchaser’s needs. OTC derivatives are not guaranteed by a clearing agency and may be subject to increased credit risk.
In an effort to mitigate credit risk associated with derivatives traded OTC, the Fund may enter into collateral agreements with certain counterparties whereby, subject to certain minimum exposure requirements, the Fund may require the counterparty to post collateral if the Fund has a net aggregate unrealized gain on all OTC derivative contracts with a particular counterparty. Additionally, the Fund may deposit cash and/or treasuries as collateral with the counterparty and/or custodian daily (based on the daily valuation of the financial asset) if the Fund has a net aggregate unrealized loss on OTC derivative contracts with a particular counterparty. All liquid securities and restricted cash are considered to cover in an amount at all times equal to or greater than the Fund’s commitment with respect to certain exchange-traded derivatives, centrally cleared derivatives, forward foreign currency exchange contracts, short sales, and/or securities with extended settlement dates. There is no guarantee that counterparty exposure is reduced and these arrangements are dependent on the Adviser’s ability to establish and maintain appropriate systems and trading.
Forward Foreign Currency Exchange Contracts
A forward foreign currency exchange contract (“forward currency contract”) is an obligation to buy or sell a specified currency at a future date at a negotiated rate (which may be U.S. dollars or a foreign currency). The Fund may enter into forward currency contracts for hedging purposes, including, but not limited to, reducing exposure to changes in foreign currency exchange rates on foreign portfolio holdings and locking in the U.S. dollar cost of firm purchase and sale commitments for securities denominated in or exposed to foreign currencies. The Fund may also invest in forward currency contracts for non-hedging purposes such as seeking to enhance returns. The Fund is subject to currency risk
Janus Henderson Venture Fund
Notes to Financial Statements (unaudited)
and counterparty risk in the normal course of pursuing its investment objective through its investments in forward currency contracts.
Forward currency contracts are valued by converting the foreign value to U.S. dollars by using the current spot U.S. dollar exchange rate and/or forward rate for that currency. Exchange and forward rates as of the close of the NYSE are used to value the forward currency contracts. The unrealized appreciation/(depreciation) for forward currency contracts is reported in the Statement of Assets and Liabilities as a receivable or payable and in the Statement of Operations for the change in unrealized net appreciation/depreciation (if applicable). The realized gain or loss arising from the difference between the U.S. dollar cost of the original contract and the value of the foreign currency in U.S. dollars upon closing a forward currency contract is reported on the Statement of Operations (if applicable).
During the period, the Fund entered into forward currency contracts with the obligation to purchase foreign currencies in the future at an agreed upon rate in order to decrease exposure to currency risk associated with foreign currency denominated securities held by the Fund.
During the period, the Fund entered into forward currency contracts with the obligation to sell foreign currencies in the future at an agreed upon rate in order to decrease exposure to currency risk associated with foreign currency denominated securities held by the Fund.
3. Other Investments and Strategies
Additional Investment Risk
The U.S. government and the Federal Reserve, as well as certain foreign governments and central banks, have taken extraordinary actions to support local and global economies and the financial markets in response to the COVID-19 pandemic. This and other government intervention into the economy and financial markets to address the COVID-19 pandemic may not work as intended, particularly if the efforts are perceived by investors as being unlikely to achieve the desired results. Government actions to mitigate the economic impact of the pandemic have resulted in a large expansion of government deficits and debt, the long term consequences of which are not known. The COVID-19 pandemic could adversely affect the value and liquidity of a Fund’s investments, impair a Fund’s ability to satisfy redemption requests, and negatively impact a Fund’s performance. In addition, the outbreak of COVID-19, and measures taken to mitigate its effects, could result in disruptions to the services provided to a Fund by its service providers.
Widespread disease, including pandemics and epidemics, and natural or environmental disasters, including those which may be attributable to global climate change, such as earthquakes, fires, floods, hurricanes, tsunamis and weather-related phenomena generally, have been and can be highly disruptive to economies and markets, adversely impacting individual companies, sectors, industries, markets, currencies, interest and inflation rates, credit ratings, investor sentiment, and other factors affecting the value of a Fund’s investments. Economies and financial markets throughout the world have become increasingly interconnected, which increases the likelihood that events or conditions in one region or country will adversely affect markets or issuers in other regions or countries, including the United States. These disruptions could prevent a Fund from executing advantageous investment decisions in a timely manner and negatively impact a Fund’s ability to achieve its investment objective(s). Any such event(s) could have a significant adverse impact on the value of a Fund. In addition, these disruptions could also impair the information technology and other operational systems upon which the Fund’s service providers, including the Adviser or the subadviser (as applicable), rely, and could otherwise disrupt the ability of employees of the Fund’s service providers to perform essential tasks on behalf of the Fund. Adverse weather conditions may also have a particularly significant negative effect on issuers in the agricultural sector and on insurance and reinsurance companies that insure or reinsure against the impact of natural disasters.
A number of countries in the European Union (the “EU”) have experienced, and may continue to experience, severe economic and financial difficulties. In particular, many EU nations are susceptible to economic risks associated with high levels of debt. Many non-governmental issuers, and even certain governments, have defaulted on, or been forced to restructure, their debts. Many other issuers have faced difficulties obtaining credit or refinancing existing obligations. Financial institutions have in many cases required government or central bank support, have needed to raise capital, and/or have been impaired in their ability to extend credit. As a result, financial markets in the EU have experienced extreme volatility and declines in asset values and liquidity. These difficulties may continue, worsen, or spread further within the EU. Responses to these financial problems by European governments, central banks, and others, including austerity measures and reforms, may not work, may result in social unrest, and may limit future growth and economic
Janus Henderson Venture Fund
Notes to Financial Statements (unaudited)
recovery or have other unintended consequences. Among other things, these developments have adversely affected the value and exchange rate of the euro and pound sterling, and may continue to significantly affect the economies of all EU countries, which in turn may have a material adverse effect on the Fund’s investments in such countries, other countries that depend on EU countries for significant amounts of trade or investment, or issuers with exposure to debt issued by certain EU countries.
Real Estate Investing
The Fund may invest in equity and debt securities of real estate-related companies. Such companies may include those in the real estate industry or real estate-related industries. These securities may include common stocks, corporate bonds, preferred stocks, and other equity securities, including, but not limited to, mortgage-backed securities, real estate-backed securities, securities of REITs and similar REIT-like entities. A REIT is a trust that invests in real estate-related projects, such as properties, mortgage loans, and construction loans. REITs are generally categorized as equity, mortgage, or hybrid REITs. A REIT may be listed on an exchange or traded OTC.
Restricted Security Transactions
Restricted securities held by the Fund may not be sold except in exempt transactions or in a public offering registered under the Securities Act of 1933, as amended. The risk of investing in such securities is generally greater than the risk of investing in the securities of widely held, publicly traded companies. Lack of a secondary market and resale restrictions may result in the inability of the Fund to sell a security at a fair price and may substantially delay the sale of the security. In addition, these securities may exhibit greater price volatility than securities for which secondary markets exist.
Counterparties
Fund transactions involving a counterparty are subject to the risk that the counterparty or a third party will not fulfill its obligation to the Fund (“counterparty risk”). Counterparty risk may arise because of the counterparty’s financial condition (i.e., financial difficulties, bankruptcy, or insolvency), market activities and developments, or other reasons, whether foreseen or not. A counterparty’s inability to fulfill its obligation may result in significant financial loss to the Fund. The Fund may be unable to recover its investment from the counterparty or may obtain a limited recovery, and/or recovery may be delayed. The extent of the Fund’s exposure to counterparty risk with respect to financial assets and liabilities approximates its carrying value. See the "Offsetting Assets and Liabilities" section of this Note for further details.
The Fund may be exposed to counterparty risk through participation in various programs, including, but not limited to, lending its securities to third parties, cash sweep arrangements whereby the Fund’s cash balance is invested in one or more types of cash management vehicles, as well as investments in, but not limited to, repurchase agreements, debt securities, and derivatives, including various types of swaps, futures and options. The Fund intends to enter into financial transactions with counterparties that the Adviser believes to be creditworthy at the time of the transaction. There is always the risk that the Adviser’s analysis of a counterparty’s creditworthiness is incorrect or may change due to market conditions. To the extent that the Fund focuses its transactions with a limited number of counterparties, it will have greater exposure to the risks associated with one or more counterparties.
Securities Lending
Under procedures adopted by the Trustees, the Fund may seek to earn additional income by lending securities to certain qualified broker-dealers and institutions. JPMorgan Chase Bank, National Association acts as securities lending agent and a limited purpose custodian or subcustodian to receive and disburse cash balances and cash collateral, hold short-term investments, hold collateral, and perform other custodial functions in accordance with the Non-Custodial Securities Lending Agreement. For financial reporting purposes, the Fund does not offset financial instruments’ payables and receivables and related collateral on the Statement of Assets and Liabilities. The Fund may lend fund securities in an amount equal to up to 1/3 of its total assets as determined at the time of the loan origination. There is the risk of delay in recovering a loaned security or the risk of loss in collateral rights if the borrower fails financially. In addition, the Adviser makes efforts to balance the benefits and risks from granting such loans. All loans will be continuously secured by collateral which may consist of cash, U.S. Government securities, domestic and foreign short-term debt instruments, letters of credit, time deposits, repurchase agreements, money market mutual funds or other money market accounts, or such other collateral as permitted by the SEC. If the Fund is unable to recover a security on loan, the Fund may use the collateral to purchase replacement securities in the market. There is a risk that the value of the collateral could decrease below the cost of the replacement security by the time the replacement investment is made, resulting in a loss to the Fund. In certain circumstances individual loan transactions could yield negative returns.
Janus Henderson Venture Fund
Notes to Financial Statements (unaudited)
Upon receipt of cash collateral, the Adviser may invest it in affiliated or non-affiliated cash management vehicles, whether registered or unregistered entities, as permitted by the 1940 Act and rules promulgated thereunder. The Adviser currently intends to primarily invest the cash collateral in a cash management vehicle for which the Adviser serves as investment adviser, Janus Henderson Cash Collateral Fund LLC, or in time deposits. An investment in Janus Henderson Cash Collateral Fund LLC is generally subject to the same risks that shareholders experience when investing in similarly structured vehicles, such as the potential for significant fluctuations in assets as a result of the purchase and redemption activity of the securities lending program, a decline in the value of the collateral, and possible liquidity issues. Such risks may delay the return of the cash collateral and cause the Fund to violate its agreement to return the cash collateral to a borrower in a timely manner. As adviser to the Fund and Janus Henderson Cash Collateral Fund LLC, the Adviser has an inherent conflict of interest as a result of its fiduciary duties to both the Fund and Janus Henderson Cash Collateral Fund LLC. Additionally, the Adviser receives an investment advisory fee of 0.05% for managing Janus Henderson Cash Collateral Fund LLC, but it may not receive a fee for managing certain other affiliated cash management vehicles in which the Fund may invest, and therefore may have an incentive to allocate preferred investment opportunities to investment vehicles for which it is receiving a fee.
The value of the collateral must be at least 102% of the market value of the loaned securities that are denominated in U.S. dollars and 105% of the market value of the loaned securities that are not denominated in U.S. dollars. Loaned securities and related collateral are marked-to-market each business day based upon the market value of the loaned securities at the close of business, employing the most recent available pricing information. Collateral levels are then adjusted based on this mark-to-market evaluation. Additional required collateral, or excess collateral returned, is delivered on the next business day. Therefore, the value of the collateral held may be temporarily less than 102% or 105% value of the securities on loan. The cash collateral invested by the Adviser is disclosed in the Schedule of Investments (if applicable).
Income earned from the investment of the cash collateral, net of rebates paid to, or fees paid by, borrowers and less the fees paid to the lending agent are included as “Affiliated securities lending income, net” on the Statement of Operations. As of March 31, 2023, securities lending transactions accounted for as secured borrowings with an overnight and continuous contractual maturity are $16,962,464. Gross amounts of recognized liabilities for securities lending (collateral received) as of March 31, 2023 is $17,092,092, resulting in the net amount due to the counterparty of $129,628.
Offsetting Assets and Liabilities
The Fund presents gross and net information about transactions that are either offset in the financial statements or subject to an enforceable master netting arrangement or similar agreement with a designated counterparty, regardless of whether the transactions are actually offset in the Statement of Assets and Liabilities.
In order to better define its contractual rights and to secure rights that will help the Fund mitigate its counterparty risk, the Fund has entered into an International Swaps and Derivatives Association, Inc. Master Agreement (“ISDA Master Agreement”) or similar agreement with its derivative contract counterparties. An ISDA Master Agreement is a bilateral agreement between the Fund and a counterparty that governs OTC derivatives and forward foreign currency exchange contracts and typically contains, among other things, collateral posting terms and netting provisions in the event of a default and/or termination event. Under an ISDA Master Agreement, in the event of a default and/or termination event, the Fund may offset with each counterparty certain derivative financial instruments’ payables and/or receivables with collateral held and/or posted and create one single net payment.
The Offsetting Assets and Liabilities tables located in the Schedule of Investments present gross amounts of recognized assets and/or liabilities and the net amounts after deducting collateral that has been pledged by counterparties or has been pledged to counterparties (if applicable). For corresponding information grouped by type of instrument, see the “Fair Value of Derivative Instruments (not accounted for as hedging instruments) as of March 31, 2023” table located in the Fund’s Schedule of Investments.
The Fund generally does not exchange collateral on its forward foreign currency contracts with its counterparties; however, all liquid securities and restricted cash are considered to cover in an amount at all times equal to or greater than the Fund’s commitment with respect to these contracts. Certain securities may be segregated at the Fund’s custodian. These segregated securities are denoted on the accompanying Schedule of Investments and are evaluated daily to ensure their cover and/or market value equals or exceeds the Fund’s corresponding forward foreign currency exchange contract's obligation value.
Janus Henderson Venture Fund
Notes to Financial Statements (unaudited)
4. Investment Advisory Agreements and Other Transactions with Affiliates
The Fund pays the Adviser an investment advisory fee which is calculated daily and paid monthly. The Fund’s contractual investment advisory fee rate (expressed as an annual rate) is 0.64% of its average daily net assets.
The Adviser has contractually agreed to waive the investment advisory fee and/or reimburse operating expenses to the extent that the Fund’s total annual fund operating expenses, excluding the fees payable pursuant to a Rule 12b-1 plan, shareholder servicing fees, such as transfer agency fees (including out-of-pocket costs), administrative services fees and any networking/omnibus payable by any share class, brokerage commissions, interest, dividends, taxes, acquired fund fees and expenses, and extraordinary expenses, exceed the annual rate of 0.86% of the Fund’s average daily net assets. The Adviser has agreed to continue the waivers for at least a one-year period commencing January 27, 2023. The previous expense limit (for the one-year period commencing January 28, 2022) was 0.92%. If applicable, amounts waived and/or reimbursed to the Fund by the Adviser are disclosed as “Excess Expense Reimbursement and Waivers” on the Statement of Operations.
The Adviser serves as administrator to the Fund pursuant to an administration agreement between the Adviser and the Trust. Under the administration agreement, the Adviser is authorized to perform, or cause others to perform certain administration, compliance, and accounting services to the Fund, including providing office space for the Fund, and is reimbursed by the Fund for certain of its costs in providing these services (to the extent the Adviser seeks reimbursement and such costs are not otherwise waived). In addition, employees of the Adviser and/or its affiliates may serve as officers of the Trust. The Fund pays for some or all of the salaries, fees, and expenses of the Adviser employees and Fund officers, with respect to certain specified administration functions they perform on behalf of the Fund. The Fund pays these costs based on out-of-pocket expenses incurred by the Adviser, and these costs are separate and apart from advisory fees and other expenses paid in connection with the investment advisory services the Adviser (or any subadvisor, as applicable) provides to the Fund. These amounts are disclosed as “Affiliated fund administration fees” on the Statement of Operations. In addition, some expenses related to compensation payable to the Fund’s Chief Compliance Officer and certain compliance staff, all of whom are employees of the Adviser and/or its affiliates, are shared with the Fund. Total compensation of $114,430 was paid to the Chief Compliance Officer and certain compliance staff by the Trust during the period ended March 31, 2023. The Fund's portion is reported as part of “Other expenses” on the Statement of Operations.
Janus Henderson Services US LLC (the “Transfer Agent”), a wholly-owned subsidiary of the Adviser, is the Fund’s transfer agent. The Transfer Agent provides or arranges for the provision of shareholder services including, but not limited to, recordkeeping, subaccounting, answering inquiries regarding accounts, order processing, transaction confirmations, the mailing of prospectuses and shareholder reports, and other shareholder services provided to or on behalf of shareholders. These amounts are disclosed as “Transfer agent administrative fees and expenses” on the Statement of Operations.
Class D Shares of the Fund pay the Transfer Agent an annual administrative services fee based on the average daily net assets of Class D Shares as detailed below.
| | |
Average Daily Net Assets of Class D Shares of the Janus Henderson funds | Administrative Services Fee |
Under $40 billion | 0.12% |
$40 billion – $49.9 billion | 0.10% |
Over $49.9 billion | 0.08% |
During the reporting period, the administrative services fee rate was 0.12%.
The Transfer Agent receives an administrative services fee at an annual rate of up to 0.25% of the average daily net assets of the Fund’s Class S Shares and Class T Shares for providing or procuring administrative services to investors in Class S Shares and Class T Shares of the Fund. The Transfer Agent expects to use all or a significant portion of this fee to compensate retirement plan service providers, broker-dealers, bank trust departments, financial advisors, and other financial intermediaries for providing these services. The Transfer Agent may keep certain amounts retained for reimbursement of out-of-pocket costs incurred for servicing clients of Class S Shares and Class T Shares.
Shareholder Services provided by these financial intermediaries may include, but are not limited to, recordkeeping, subaccounting, order processing, providing order confirmations, periodic statements, forwarding prospectuses, shareholder reports, and other materials to existing customers, answering inquiries regarding accounts, and other
Janus Henderson Venture Fund
Notes to Financial Statements (unaudited)
administrative services. Order processing includes the submission of transactions through the National Securities Clearing Corporation (“NSCC”) or similar systems, or those processed on a manual basis with the Adviser. For all share classes, the Transfer Agent also seeks reimbursement for costs it incurs as transfer agent and for providing servicing.
Certain, but not all, intermediaries may charge administrative fees to investors in Class A Shares, Class C Shares, and Class I Shares for administrative services provided on behalf of such investors. These administrative fees are paid by the Class A Shares, Class C Shares, and Class I Shares of the Fund to the Transfer Agent, which uses such fees to reimburse intermediaries. Consistent with the Transfer Agency Agreement between the Transfer Agent and the Fund, the Transfer Agent may negotiate the level, structure, and/or terms of the administrative fees with intermediaries requiring such fees on behalf of the Fund. The Adviser and its affiliates benefit from an increase in assets that may result from such relationships. The Adviser has agreed to limit these fees up to 0.20% for Class A Shares and Class C Shares, and up to 0.15% for Class I Shares on an annual basis based on the daily net assets of each share class. Such limits are subject to change by the Trustees in the future. These amounts are disclosed as “Transfer agent networking and omnibus fees” on the Statement of Operations.
The Transfer Agent is not compensated for its services related to the shares, except for out-of-pocket costs, although the Transfer Agent is compensated for its services related to Fund’s Class D Shares. These amounts are disclosed as “Other transfer agent fees and expenses” on the Statement of Operations.
Under distribution and shareholder servicing plans (the “Plans”) adopted in accordance with Rule 12b-1 under the 1940 Act, the Fund pays the Trust’s distributor, the Distributor, a wholly-owned subsidiary of the Adviser, a fee for the sale and distribution and/or shareholder servicing of the shares based on the average daily net assets for each share class at an annual rate of up to 0.25% for Class A Shares, up to 1.00% for Class C Shares, and up to 0.25% for Class S Shares. Under the terms of the Plans, the Trust is authorized to make payments to the Distributor for remittance to retirement plan service providers, broker-dealers, bank trust departments, financial advisors, and other financial intermediaries, as compensation for distribution and/or shareholder services performed by such entities for their customers who are investors in the Fund. These amounts are disclosed as “12b-1 Distribution and shareholder servicing fees” on the Statement of Operations.
Class A Shares include a 5.75% upfront sales charge of the offering price of the Fund. The sales charge is allocated between the Distributor and financial intermediaries. During the period ended March 31, 2023, the Distributor retained upfront sales charges of $100.
A contingent deferred sales charge (“CDSC”) of 1.00% will be deducted with respect to Class A Shares purchased without a sales load and redeemed within 12 months of purchase, unless waived. Any applicable CDSC will be 1.00% of the lesser of the original purchase price or the value of the redemption of the Class A Shares redeemed. There were no CDSCs paid by redeeming shareholders of Class A Shares to the Distributor during the period ended March 31, 2023.
A CDSC of 1.00% will be deducted with respect to Class C Shares redeemed within 12 months of purchase, unless waived. Any applicable CDSC will be 1.00% of the lesser of the original purchase price or the value of the redemption of the Class C Shares redeemed. There were no CDSCs paid by redeeming shareholders of Class C Shares during the period ended March 31, 2023.
The Board of Trustees has adopted a deferred compensation plan (the “Deferred Plan”) for independent Trustees to elect to defer receipt of all or a portion of the annual compensation they are entitled to receive from the Fund. All deferred fees are credited to an account established in the name of the Trustees. The amounts credited to the account then increase or decrease, as the case may be, in accordance with the performance of one or more of the Janus Henderson funds that are selected by the Trustees. The account balance continues to fluctuate in accordance with the performance of the selected fund or funds until final payment of all amounts are credited to the account. The fluctuation of the account balance is recorded by the Fund as unrealized appreciation/(depreciation) and is included as of March 31, 2023 on the Statement of Assets and Liabilities in the asset, “Trustees’ deferred compensation,” and liability, “Trustees’ deferred compensation fees.” Additionally, the recorded unrealized appreciation/(depreciation) is included in “Total distributable earnings (loss)” on the Statement of Assets and Liabilities. Deferred compensation expenses for the period ended March 31, 2023 are included in “Trustees’ fees and expenses” on the Statement of Operations. Trustees are allowed to change their designation of mutual funds from time to time. Amounts will be deferred until distributed in accordance with the Deferred Plan. Deferred fees of $205,688 were paid by the Trust to the Trustees under the Deferred Plan during the period ended March 31, 2023.
Janus Henderson Venture Fund
Notes to Financial Statements (unaudited)
Pursuant to the provisions of the 1940 Act and related rules, the Fund may participate in an affiliated or non-affiliated cash sweep program. In the cash sweep program, uninvested cash balances of the Fund may be used to purchase shares of affiliated or non-affiliated money market funds or cash management pooled investment vehicles that operate as money market funds. The Fund is eligible to participate in the cash sweep program (the “Investing Funds”). The Adviser has an inherent conflict of interest because of its fiduciary duties to the affiliated money market funds or cash management pooled investment vehicles and the Investing Funds. Janus Henderson Cash Liquidity Fund LLC (the “Sweep Vehicle”) is an affiliated unregistered cash management pooled investment vehicle that invests primarily in highly-rated short-term fixed-income securities. The Sweep Vehicle operates pursuant to the provisions of the 1940 Act that govern the operation of money market funds and prices its shares at NAV reflecting market-based values of its portfolio securities (i.e., a “floating” NAV) rounded to the fourth decimal place (e.g., $1.0000). The Sweep Vehicle is permitted to impose a liquidity fee (of up to 2%) on redemptions from the Sweep Vehicle or a redemption gate that temporarily suspends redemptions from the Sweep Vehicle for up to 10 business days during a 90 day period. There are no restrictions on the Fund's ability to withdraw investments from the Sweep Vehicle at will, and there are no unfunded capital commitments due from the Fund to the Sweep Vehicle. The Sweep Vehicle does not charge any management fee, sales charge or service fee.
Any purchases and sales, realized gains/losses and recorded dividends from affiliated investments during the period ended March 31, 2023 can be found in the “Schedules of Affiliated Investments” located in the Schedule of Investments.
The Fund is permitted to purchase or sell securities (“cross-trade”) between itself and other funds or accounts managed by the Adviser in accordance with Rule 17a-7 under the Investment Company Act of 1940 (“Rule 17a-7”), when the transaction is consistent with the investment objectives and policies of the Fund and in accordance with the Internal Cross Trade Procedures adopted by the Trust’s Board of Trustees. These procedures have been designed to ensure that any cross-trade of securities by the Fund from or to another fund or account that is or could be considered an affiliate of the Fund under certain limited circumstances by virtue of having a common investment adviser, common Officer, or common Trustee complies with Rule 17a-7. Under these procedures, each cross-trade is effected at the current market price to save costs where allowed. During the period ended March 31, 2023, the Fund engaged in cross trades amounting to $3,991,557 in purchases.
5. Federal Income Tax
Income and capital gains distributions are determined in accordance with income tax regulations that may differ from US GAAP. These differences are due to differing treatments for items such as net short-term gains, deferral of wash sale losses, foreign currency transactions, net investment losses, and capital loss carryovers.
The Fund has elected to treat gains and losses on forward foreign currency contracts as capital gains and losses, if applicable. Other foreign currency gains and losses on debt instruments are treated as ordinary income for federal income tax purposes pursuant to Section 988 of the Internal Revenue Code.
The aggregate cost of investments and the composition of unrealized appreciation and depreciation of investment securities for federal income tax purposes as of March 31, 2023 are noted below. The primary differences between book and tax appreciation or depreciation of investments are wash sale loss deferrals and investments in partnerships.
| | | | |
Federal Tax Cost | Unrealized
Appreciation | Unrealized
(Depreciation) | Net Tax Appreciation/
(Depreciation) |
$ 2,134,957,286 | $1,148,833,974 | $(196,275,779) | $ 952,558,195 |
Janus Henderson Venture Fund
Notes to Financial Statements (unaudited)
6. Capital Share Transactions
| | | | | | | |
| | | | | | |
| | Period ended March 31, 2023 | | Year ended September 30, 2022 |
| | Shares | Amount | | Shares | Amount |
| | | | | | | |
Class A Shares: | | | | | |
Shares sold | 45,254 | $ 3,177,452 | | 64,744 | $ 5,895,760 |
Reinvested dividends and distributions | 11,317 | 754,729 | | 30,916 | 2,759,573 |
Shares repurchased | (26,417) | (1,907,820) | | (100,381) | (8,776,798) |
Net Increase/(Decrease) | 30,154 | $ 2,024,361 | | (4,721) | $ (121,465) |
Class C Shares: | | | | | |
Shares sold | 4,584 | $ 282,919 | | 1,236 | $ 83,173 |
Reinvested dividends and distributions | 1,348 | 77,952 | | 5,446 | 428,187 |
Shares repurchased | (11,980) | (743,384) | | (17,892) | (1,348,830) |
Net Increase/(Decrease) | (6,048) | $ (382,513) | | (11,210) | $ (837,470) |
Class D Shares: | | | | | |
Shares sold | 191,023 | $14,414,849 | | 305,542 | $ 26,256,961 |
Reinvested dividends and distributions | 884,233 | 61,922,862 | | 2,468,740 | 230,407,525 |
Shares repurchased | (742,278) | (55,684,075) | | (1,463,023) | (127,312,749) |
Net Increase/(Decrease) | 332,978 | $20,653,636 | | 1,311,259 | $129,351,737 |
Class I Shares: | | | | | |
Shares sold | 266,366 | $20,402,854 | | 445,613 | $ 39,292,085 |
Reinvested dividends and distributions | 138,314 | 9,762,171 | | 418,219 | 39,308,399 |
Shares repurchased | (377,853) | (28,541,203) | | (1,000,409) | (85,109,236) |
Net Increase/(Decrease) | 26,827 | $ 1,623,822 | | (136,577) | $ (6,508,752) |
Class N Shares: | | | | | |
Shares sold | 411,174 | $31,581,549 | | 871,586 | $ 77,195,805 |
Reinvested dividends and distributions | 197,315 | 14,106,023 | | 633,783 | 60,253,745 |
Shares repurchased | (603,749) | (46,513,464) | | (1,826,045) | (156,732,223) |
Net Increase/(Decrease) | 4,740 | $ (825,892) | | (320,676) | $(19,282,673) |
Class S Shares: | | | | | |
Shares sold | 68,876 | $ 4,858,274 | | 109,609 | $ 9,081,991 |
Reinvested dividends and distributions | 20,414 | 1,332,618 | | 69,333 | 6,073,592 |
Shares repurchased | (91,621) | (6,457,151) | | (253,566) | (20,629,160) |
Net Increase/(Decrease) | (2,331) | $ (266,259) | | (74,624) | $ (5,473,577) |
Class T Shares: | | | | | |
Shares sold | 304,972 | $22,535,119 | | 540,865 | $ 46,473,854 |
Reinvested dividends and distributions | 427,410 | 29,239,103 | | 1,248,594 | 114,071,542 |
Shares repurchased | (820,505) | (59,998,913) | | (1,742,321) | (148,829,062) |
Net Increase/(Decrease) | (88,123) | $(8,224,691) | | 47,138 | $ 11,716,334 |
7. Purchases and Sales of Investment Securities
For the period ended March 31, 2023, the aggregate cost of purchases and proceeds from sales of investment securities (excluding any short-term securities, short-term options contracts, TBAs, and in-kind transactions, as applicable) was as follows:
| | | | |
Purchases of
Securities | Proceeds from Sales
of Securities | Purchases of Long-
Term U.S. Government
Obligations | Proceeds from Sales
of Long-Term U.S.
Government Obligations |
$310,828,865 | $482,665,188 | $ - | $ - |
8. Recent Accounting Pronouncements
The FASB issued Accounting Standards Update 2022-03: Fair Value Measurement of Equity Securities Subject to Contractual Sale Restrictions (“ASU 2022-03”) in June 2022. The new guidance in the ASU clarifies existing guidance
Janus Henderson Venture Fund
Notes to Financial Statements (unaudited)
in ASC 820 related to the fair value measurement of an equity security subject to contractual sale restrictions with the intent to reduce diversity in interpretation. Under the guidance, a contractual restriction on the sale of an equity security would not be considered when measuring fair value as such restriction is not treated as part of the equity security’s unit of account. The amendments would be applied prospectively on or after adoption date to equity securities with a contract containing a sale restriction that is executed or modified after such date. The effective date set by the FASB is December 15, 2023, with early adoption permitted. The Adviser is currently evaluating whether to early adopt and does not anticipate it to have a material impact on the Fund.
9. Subsequent Event
Management has evaluated whether any events or transactions occurred subsequent to March 31, 2023 and through the date of issuance of the Fund’s financial statements and determined that there were no material events or transactions that would require recognition or disclosure in the Fund’s financial statements.
Janus Henderson Venture Fund
Additional Information (unaudited)
Proxy Voting Policies and Voting Record
A description of the policies and procedures that the Fund uses to determine how to vote proxies relating to its portfolio securities is available without charge: (i) upon request, by calling 1-800-525-1093; (ii) on the Fund’s website at janushenderson.com/proxyvoting; and (iii) on the SEC’s website at http://www.sec.gov. Additionally, information regarding the Fund’s proxy voting record for the most recent twelve-month period ended June 30 is also available, free of charge, through janushenderson.com/proxyvoting and from the SEC’s website at http://www.sec.gov.
Full Holdings
The Fund files its complete portfolio holdings (schedule of investments) with the SEC as an exhibit to Form N-PORT within 60 days of the end of the first and third fiscal quarters, and in the annual report and semiannual report to shareholders. The Fund’s Form N-PORT filings and annual and semiannual reports: (i) are available on the SEC’s website at http://www.sec.gov; and (ii) are available without charge, upon request, by calling a Janus Henderson representative at 1-877-335-2687 (toll free) (or 1-800-525-3713 if you hold Class D Shares). Portfolio holdings consisting of at least the names of the holdings are generally available on a monthly basis with a 30-day lag under Full Holdings for the Fund at janushenderson.com/info (or janushenderson.com/reports if you hold Class D Shares).
APPROVAL OF ADVISORY AGREEMENTS DURING THE PERIOD
The Trustees of Janus Aspen Series, each of whom serves as an “independent” Trustee (the “Trustees”), oversee the management of each portfolio of Janus Aspen Series (each, a “VIT Portfolio,” and collectively, the “VIT Portfolios”), as well as each fund of Janus Investment Fund (each, a “Fund,” and collectively, the “Funds” and together with the VIT Portfolios, the “Janus Henderson Funds,” and each, a “Janus Henderson Fund”). As required by law, the Trustees determine annually whether to continue the investment advisory agreement for each Janus Henderson Fund.
In connection with their most recent consideration of those agreements for each Janus Henderson Fund, the Trustees received and reviewed information provided by Janus Henderson Investors US LLC (the “Adviser”) in response to requests of the Trustees and their independent legal counsel. They also received and reviewed information and analysis provided by, and in response to requests of, their independent fee consultant. Throughout their consideration of the agreements, the Trustees were advised by their independent legal counsel. The Trustees met with management to consider the agreements, and also met separately in executive session with their independent legal counsel and their independent fee consultant.
At meetings held on November 9-10, 2022 and December 13-14, 2022, the Trustees evaluated the information provided by the Adviser and the independent fee consultant, as well as other information provided by the Adviser and the independent fee consultant during the year. Following such evaluation, the Trustees determined that the overall arrangements between each Janus Henderson Fund and the Adviser were fair and reasonable in light of the nature, extent, and quality of the services provided by the Adviser and its affiliates, the fees charged for those services, and other matters that the Trustees considered relevant in the exercise of their business judgment, and unanimously approved the continuation of the investment advisory agreement for each Janus Henderson Fund for the period from February 1, 2023 through February 1, 2024, subject to earlier termination as provided for in each agreement.
In considering the continuation of those agreements, the Trustees reviewed and analyzed various factors that they determined were relevant, including the factors described below, none of which by itself was considered dispositive. However, the material factors and conclusions that formed the basis for the Trustees’ determination to approve the continuation of the agreements are discussed separately below. Also included is a summary of the independent fee consultant’s conclusions and opinions that arose during, and were included as part of, the Trustees’ consideration of the agreements. “Management fees,” as used herein, reflect actual annual advisory fees and, for the purpose of peer comparisons any administration fees (excluding out of pocket costs), net of any waivers, paid by a fund as a percentage of average net assets.
Nature, Extent and Quality of Services
The Trustees reviewed the nature, extent, and quality of the services provided by the Adviser to the Janus Henderson Funds, taking into account the investment objective, strategies, and policies of each Janus Henderson Fund, and the knowledge the Trustees gained from their regular meetings with management on at least a quarterly basis and their ongoing review of information related to the Janus Henderson Funds. In addition, the Trustees reviewed the resources and key personnel of the Adviser, particularly noting those employees who provide investment and risk management services to the Janus Henderson Funds. The Trustees also considered other services provided to the Janus Henderson
Janus Henderson Venture Fund
Additional Information (unaudited)
Funds by the Adviser, such as managing the execution of portfolio transactions and the selection of broker-dealers for those transactions. The Trustees considered the Adviser’s role as administrator to the Janus Henderson Funds, noting that the Adviser generally does not receive a fee for its services as administrator, but is reimbursed for its out-of-pocket costs. The Trustees considered the role of the Adviser in monitoring adherence to the Janus Henderson Funds’ investment restrictions, providing support services for the Trustees and Trustee committees, and overseeing communications with Janus Henderson Fund shareholders and the activities of other service providers, including monitoring compliance with various policies and procedures of the Janus Henderson Funds and with applicable securities laws and regulations.
In this regard, the independent fee consultant noted that the Adviser provides a number of different services for the Janus Henderson Funds and their shareholders, ranging from investment management services to various other servicing functions, and that, in its view, the Adviser is a capable provider of those services. The independent fee consultant also provided its belief that the Adviser has developed a number of institutional competitive advantages that should enable it to provide superior investment and service performance over the long term.
The Trustees concluded that the nature, extent, and quality of the services provided by the Adviser to each Janus Henderson Fund were appropriate and consistent with the terms of the respective advisory agreements, and that, taking into account steps taken to address those Janus Henderson Funds whose performance lagged that of their peers for certain periods, the Janus Henderson Funds were likely to benefit from the continued provision of those services. They also concluded that the Adviser had sufficient personnel, with the appropriate education and experience, to serve the Janus Henderson Funds effectively and had demonstrated its ability to attract well-qualified personnel.
Performance of the Funds
The Trustees considered the performance results of each Janus Henderson Fund over various time periods. They noted that they considered Janus Henderson Fund performance data throughout the year, including periodic meetings with each Janus Henderson Fund’s portfolio manager(s), and also reviewed information comparing each Janus Henderson Fund’s performance with the performance of comparable fund peer groups identified by Broadridge Financial Solutions, Inc. (“Broadridge”), an independent data provider, and with the Janus Henderson Fund’s benchmark index. In this regard, the independent fee consultant found that the overall Janus Henderson Funds’ performance has been reasonable, noting that: (i) for the 36 months ended May 31, 2022, approximately 38% of the Janus Henderson Funds were in the top two quartiles of their Broadridge peer groups; (ii) for the 36 months ended September 30, 2022, approximately 45% of the Janus Henderson Funds were in the top two quartiles of performance as reported by Morningstar, and (iii) for the 12 months ended September 30, 2022, approximately 55% of the Janus Henderson Funds were in the top two quartiles of performance as reported by Morningstar.
The Trustees considered the performance of each Janus Henderson Fund, noting that performance may vary by share class, and noted the following with respect to the Funds:
Asset Allocation Funds
· For Janus Henderson Global Allocation Fund – Conservative, the Trustees noted that the Fund’s performance was in the third Broadridge quartile for the 36 months ended May 31, 2022 and the bottom Broadridge quartile for the 12 months ended May 31, 2022. The Trustees noted the reasons for the Fund’s underperformance and the steps the Adviser had taken or was taking to improve performance.
· For Janus Henderson Global Allocation Fund – Growth, the Trustees noted that the Fund’s performance was in the bottom Broadridge quartile for the 36 months ended May 31, 2022 and the bottom Broadridge quartile for the 12 months ended May 31, 2022. The Trustees noted the reasons for the Fund’s underperformance and the steps the Adviser had taken or was taking to improve performance.
· For Janus Henderson Global Allocation Fund – Moderate, the Trustees noted that the Fund’s performance was in the bottom Broadridge quartile for the 36 months ended May 31, 2022 and the bottom Broadridge quartile for the 12 months ended May 31, 2022. The Trustees noted the reasons for the Fund’s underperformance and the steps the Adviser had taken or was taking to improve performance.
Fixed-Income Funds
· For Janus Henderson Absolute Return Income Opportunities Fund, the Trustees noted that the Fund’s performance was in the third Broadridge quartile for the 36 months ended May 31, 2022 and the first Broadridge quartile for the 12 months ended May 31, 2022. The Trustees noted the reasons for the Fund’s underperformance,
Janus Henderson Venture Fund
Additional Information (unaudited)
the steps the Adviser had taken or was taking to improve performance, and that the performance trend was improving.
· For Janus Developed World Bond Fund, the Trustees noted that the Fund’s performance was in the bottom Broadridge quartile for the 36 months ended May 31, 2022 and the bottom Broadridge quartile for the 12 months ended May 31, 2022. The Trustees noted the reasons for the Fund’s underperformance and the steps the Adviser had taken or was taking to improve performance.
· For Janus Henderson Flexible Bond Fund, the Trustees noted that the Fund’s performance was in the first Broadridge quartile for the 36 months ended May 31, 2022 and the second Broadridge quartile for the 12 months ended May 31, 2022.
· For Janus Henderson Global Bond Fund, the Trustees noted that the Fund’s performance was in the third Broadridge quartile for the 36 months ended May 31, 2022 and the bottom Broadridge quartile for the 12 months ended May 31, 2022. The Trustees noted the reasons for the Fund’s underperformance and the steps the Adviser had taken or was taking to improve performance.
· For Janus Henderson High-Yield Fund, the Trustees noted that the Fund’s performance was in the third Broadridge quartile for the 36 months ended May 31, 2022 and the bottom Broadridge quartile for the 12 months ended May 31, 2022. The Trustees noted the reasons for the Fund’s underperformance and the steps the Adviser had taken or was taking to improve performance.
· For Janus Henderson Multi-Sector Income Fund, the Trustees noted that the Fund’s performance was in the second Broadridge quartile for the 36 months ended May 31, 2022 and the third Broadridge quartile for the 12 months ended May 31, 2022.
· For Janus Henderson Short Duration Flexible Bond Fund, the Trustees noted that the Fund’s performance was in the third Broadridge quartile for the 36 months ended May 31, 2022 and the bottom Broadridge quartile for the 12 months ended May 31, 2022. The Trustees noted the reasons for the Fund’s underperformance and the steps the Adviser had taken or was taking to improve performance.
Global and International Equity Funds
· For Janus Henderson Asia Equity Fund, the Trustees noted that the Fund’s performance was in the third Broadridge quartile for the 36 months ended May 31, 2022 and the third Broadridge quartile for the 12 months ended May 31, 2022. The Trustees noted the reasons for the Fund’s underperformance, while also noting that the Fund has a performance fee structure that results in lower management fees during periods of underperformance, and the steps the Adviser had taken or was taking to improve performance.
· For Janus Henderson Emerging Markets Fund, the Trustees noted that the Fund’s performance was in the third Broadridge quartile for the 36 months ended May 31, 2022 and the third Broadridge quartile for the 12 months ended May 31, 2022. The Trustees noted the reasons for the Fund’s underperformance and the steps the Adviser had taken or was taking to improve performance.
· For Janus Henderson European Focus Fund, the Trustees noted that the Fund’s performance was in the first Broadridge quartile for the 36 months ended May 31, 2022 and the second Broadridge quartile for the 12 months ended May 31, 2022.
· For Janus Henderson Global Equity Income Fund, the Trustees noted that the Fund’s performance was in the third Broadridge quartile for the 36 months ended May 31, 2022 and the first Broadridge quartile for the 12 months ended May 31, 2022. The Trustees noted the reasons for the Fund’s underperformance, the steps the Adviser had taken or was taking to improve performance, and that the performance trend was improving.
· For Janus Henderson Global Life Sciences Fund, the Trustees noted that the Fund’s performance was in the third Broadridge quartile for the 36 months ended May 31, 2022 and the second Broadridge quartile for the 12 months ended May 31, 2022. The Trustees noted the reasons for the Fund’s underperformance, the steps the Adviser had taken or was taking to improve performance, and that the performance trend was improving.
· For Janus Henderson Global Sustainable Equity Fund, the Trustees noted that the Fund’s performance was in the second Broadridge quartile for the 12 months ended May 31, 2022. The Trustees noted that 36 month-end performance was not yet available.
Janus Henderson Venture Fund
Additional Information (unaudited)
· For Janus Henderson Global Real Estate Fund, the Trustees noted that the Fund’s performance was in the second Broadridge quartile for the 36 months ended May 31, 2022 and the bottom Broadridge quartile for the 12 months ended May 31, 2022.
· For Janus Henderson Global Research Fund, the Trustees noted that the Fund’s performance was in the second Broadridge quartile for the 36 months ended May 31, 2022 and the first Broadridge quartile for the 12 months ended May 31, 2022.
· For Janus Henderson Global Select Fund, the Trustees noted that the Fund’s performance was in the first Broadridge quartile for the 36 months ended May 31, 2022 and the first Broadridge quartile for the 12 months ended May 31, 2022.
· For Janus Henderson Global Technology and Innovation Fund, the Trustees noted that the Fund’s performance was in the second Broadridge quartile for the 36 months ended May 31, 2022 and the second Broadridge quartile for the 12 months ended May 31, 2022.
· For Janus Henderson International Opportunities Fund, the Trustees noted that the Fund’s performance was in the bottom Broadridge quartile for the 36 months ended May 31, 2022 and the third Broadridge quartile for the 12 months ended May 31, 2022. The Trustees noted the reasons for the Fund’s underperformance and the steps the Adviser had taken or was taking to improve performance.
· For Janus Henderson Overseas Fund, the Trustees noted that the Fund’s performance was in the first Broadridge quartile for the 36 months ended May 31, 2022 and the first Broadridge quartile for the 12 months ended May 31, 2022.
· For Janus Henderson Responsible International Dividend Fund (formerly the Janus Henderson Dividend & Income Builder Fund), the Trustees noted that the Fund’s performance was in the bottom Broadridge quartile for the 36 months ended May 31, 2022 and the bottom Broadridge quartile for the 12 months ended May 31, 2022. The Trustees noted the reasons for the Fund’s underperformance and the steps the Adviser had taken or was taking to improve performance.
Money Market Funds
· For Janus Henderson Government Money Market Fund, the Trustees noted that the Fund’s performance was in the third Broadridge quartile for the 36 months ended May 31, 2022 and the bottom Broadridge quartile for the 12 months ended May 31, 2022. The Trustees noted the reasons for the Fund’s underperformance and the steps the Adviser had taken or was taking to improve performance.
· For Janus Henderson Money Market Fund, the Trustees noted that the Fund’s performance was in the third Broadridge quartile for the 36 months ended May 31, 2022 and the bottom Broadridge quartile for the 12 months ended May 31, 2022. The Trustees noted the reasons for the Fund’s underperformance and the steps the Adviser had taken or was taking to improve performance.
Multi-Asset Funds
· For Janus Henderson Adaptive Global Allocation Fund, the Trustees noted that the Fund’s performance was in bottom Broadridge quartile for the 36 months ended May 31, 2022 and the second Broadridge quartile for the 12 months ended May 31, 2022. The Trustees noted the reasons for the Fund’s underperformance, the steps the Adviser had taken or was taking to improve performance, and that the performance trend was improving.
· For Janus Henderson Balanced Fund, the Trustees noted that the Fund’s performance was in the first Broadridge quartile for the 36 months ended May 31, 2022 and the first Broadridge quartile for the 12 months ended May 31, 2022.
U.S. Equity Funds
· For Janus Henderson Adaptive Risk Managed U.S. Equity Fund, the Trustees noted that the Fund’s performance was in the bottom Broadridge quartile for the 36 months ended May 31, 2022 and the second Broadridge quartile for the 12 months ended May 31, 2022. The Trustees noted the reasons for the Fund’s underperformance, the steps the Adviser had taken or were taking to improve performance, and that the performance trend was improving.
Janus Henderson Venture Fund
Additional Information (unaudited)
· For Janus Henderson Contrarian Fund, the Trustees noted that the Fund’s performance was in the first Broadridge quartile for the 36 months ended May 31, 2022 and the bottom Broadridge quartile for the 12 months ended May 31, 2022.
· For Janus Henderson Enterprise Fund, the Trustees noted that the Fund’s performance was in the second Broadridge quartile for the 36 months ended May 31, 2022 and the first Broadridge quartile for the 12 months ended May 31, 2022.
· For Janus Henderson Forty Fund, the Trustees noted that the Fund’s performance was in the third Broadridge quartile for the 36 months ended May 31, 2022 and the bottom Broadridge quartile for the 12 months ended May 31, 2022. The Trustees noted the reasons for the Fund’s underperformance and the steps the Adviser had taken or was taking to improve performance.
· For Janus Henderson Growth and Income Fund, the Trustees noted that the Fund’s performance was in the bottom Broadridge quartile for the 36 months ended May 31, 2022 and the first Broadridge quartile for the 12 months ended May 31, 2022. The Trustees noted the reasons for the Fund’s underperformance, the steps the Adviser had taken or was taking to improve performance, and that the performance trend was improving.
· For Janus Henderson Mid Cap Value Fund, the Trustees noted that the Fund’s performance was in the bottom Broadridge quartile for the 36 months ended May 31, 2022 and the second Broadridge quartile for the 12 months ended May 31, 2022. The Trustees noted the reasons for the Fund’s underperformance, while also noting that the Fund has a performance fee structure that results in lower management fees during periods of underperformance, the steps the Adviser had taken or was taking to improve performance, and that the performance trend was improving.
· For Janus Henderson Research Fund, the Trustees noted that the Fund’s performance was in the third Broadridge quartile for the 36 months ended May 31, 2022 and the third Broadridge quartile for the 12 months ended May 31, 2022. The Trustees noted the reasons for the Fund’s underperformance, while also noting that the Fund has a performance fee structure that results in lower management fees during periods of underperformance and the steps the Adviser had taken or was taking to improve performance.
· For Janus Henderson Small Cap Value Fund, the Trustees noted that the Fund’s performance was in the bottom Broadridge quartile for the 36 months ended May 31, 2022 and the second Broadridge quartile for the 12 months ended May 31, 2022. The Trustees noted the reasons for the Fund’s underperformance, while also noting that the Fund has a performance fee structure that results in lower management fees during periods of underperformance, the steps the Adviser had taken or was taking to improve performance, and that the performance trend was improving.
· For Janus Henderson Small-Mid Cap Value Fund, the Trustees noted that the Fund’s performance was in the bottom Broadridge quartile for the 36 months ended May 31, 2022 and the second Broadridge quartile for the 12 months ended May 31, 2022. The Trustees noted the reasons for the Fund’s underperformance, while also noting that the Fund has a performance fee structure that results in lower management fees during periods of underperformance, the steps the Adviser had taken or was taking to improve performance, and that the performance trend is improving.
· For Janus Henderson Triton Fund, the Trustees noted that the Fund’s performance was in the bottom Broadridge quartile for the 36 months ended May 31, 2022 and the second Broadridge quartile for the 12 months ended May 31, 2022. The Trustees noted the reasons for the Fund’s underperformance, the steps the Adviser had taken or was taking to improve performance, and that the performance trend was improving.
· For Janus Henderson Venture Fund, the Trustees noted that the Fund’s performance was in the bottom Broadridge quartile for the 36 months ended May 31, 2022 and the second Broadridge quartile for the 12 months ended May 31, 2022. The Trustees noted the reasons for the Fund’s underperformance, the steps the Adviser had taken or was taking to improve performance, and that the performance trend was improving.
In consideration of each Janus Henderson Fund’s performance, the Trustees concluded that, taking into account the factors relevant to performance, as well as other considerations, including steps taken to improve performance, as applicable, the Janus Henderson Fund’s performance warranted continuation of such Janus Henderson Fund’s investment advisory agreement.
Janus Henderson Venture Fund
Additional Information (unaudited)
Costs of Services Provided
The Trustees examined information regarding the fees and expenses of each Janus Henderson Fund in comparison to similar information for other comparable funds as provided by Broadridge, an independent data provider. They also reviewed an analysis of that information provided by their independent fee consultant. The independent fee consultant provided its belief that the management fees charged by the Adviser to each of the Janus Henderson Funds under the current investment advisory and administration agreements are reasonable in relation to the services provided by the Adviser. The independent fee consultant found: (1) the total expenses and management fees of the Janus Henderson Funds to be reasonable relative to other comparable mutual funds; (2) the total expenses, on average, were 6% under the average total expenses of the respective Broadridge peer group; and (3) the management fees for the Janus Henderson Funds, on average, were 5% under the average management fees for the respective Broadridge peer group. The Trustees also considered the total expenses for each share class of each Janus Henderson Fund compared to the average total expenses for its Broadridge Expense Group and to average total expenses for its Broadridge Expense Universe.
For Janus Henderson Funds with three or more years of performance history, the independent fee consultant also performed a systematic “focus list” analysis of expenses which assessed fund fees in the context of fund performance being delivered. Based on this analysis, the independent fee consultant found that the combination of service quality/performance and expenses on these individual Janus Henderson Funds was reasonable in light of performance trends, performance histories, changes in portfolio management, relative average net asset levels, and the existence of performance fees, breakpoints, and/or expense waivers on such Janus Henderson Funds.
The Trustees considered the methodology used by the Adviser in determining compensation payable to portfolio managers, the competitive environment for investment management talent, and the competitive market for mutual funds in different distribution channels.
The Trustees also reviewed management fees charged by the Adviser to comparable separate account clients and to comparable non-affiliated funds subadvised by the Adviser (for which the Adviser provides only or primarily portfolio management services). Although in most instances subadvisory and separate account fee rates for various investment strategies were lower than management fee rates for Janus Henderson Funds having a similar strategy, the Trustees considered that the Adviser noted that, under the terms of the management agreements with the Janus Henderson Funds, the Adviser performs significant additional services for the Janus Henderson Funds that it does not provide to those other clients, including administration services, oversight of the Janus Henderson Funds’ other service providers, Trustee support, regulatory compliance and numerous other services, and that, in serving the Janus Henderson Funds, the Adviser assumes many legal risks and other costs that it does not assume in servicing its other clients. Moreover, the Trustees noted that the independent fee consultant found that: (1) the management fees the Adviser charges to the Janus Henderson Funds are reasonable in relation to the management fees the Adviser charges to funds subadvised by the Adviser and to the fees the Adviser charges to its institutional separate account clients; (2) these subadvised and institutional separate accounts have different service and infrastructure needs and operate in markets very different from the retail fund market; (3) Janus Henderson mutual fund investors enjoy reasonable fees relative to the fees charged in these other markets; and (4) as part of its 2022 review, 9 of 11 Janus Henderson Funds have lower management fees than similar funds subadvised by the Adviser. The Trustees noted that for the two Janus Henderson Funds that did not, management fees for each were under the average of its 15(c) peer group.
The Trustees considered the fees for each Janus Henderson Fund for its fiscal year ended in 2021 and noted the following with regard to each Janus Henderson Fund’s total expenses, net of applicable fee waivers (the Fund’s “total expenses”) as reflected in the comparative information provided by Broadridge:
Asset Allocation Funds
· For Janus Henderson Global Allocation Fund – Conservative, the Trustees noted that, although the Fund’s total expenses exceeded the peer group average for certain share classes, overall the Fund’s total expenses were reasonable. The Trustees also noted that the Adviser has contractually agreed to limit the Fund’s expenses.
· For Janus Henderson Global Allocation Fund – Growth, the Trustees noted that, although the Fund’s total expenses exceeded the peer group average for certain share classes, overall the Fund’s total expenses were reasonable. The Trustees also noted that the Adviser has contractually agreed to limit the Fund’s expenses, although this limit did not apply because the Fund’s total expenses as shown were below the applicable fee limit.
Janus Henderson Venture Fund
Additional Information (unaudited)
· For Janus Henderson Global Allocation Fund – Moderate, the Trustees noted that, although the Fund’s total expenses exceeded the peer group average for one share class, overall the Fund’s total expenses were reasonable. The Trustees also noted that the Adviser has contractually agreed to limit the Fund’s expenses.
Fixed-Income Funds
· For Janus Henderson Absolute Return Income Opportunities Fund, the Trustees noted that, although the Fund’s total expenses exceeded the peer group average for certain share classes, overall the Fund’s total expenses were reasonable. The Trustees also noted that the Adviser has contractually agreed to limit the Fund’s expenses.
· For Janus Henderson Developed World Bond Fund, the Trustees noted that, although the Fund’s total expenses exceeded the peer group average for one share class, overall the Fund’s total expenses were reasonable. The Trustees also noted that the Adviser has contractually agreed to limit the Fund’s expenses.
· For Janus Henderson Flexible Bond Fund, the Trustees noted that, although the Fund’s total expenses exceeded the peer group average for certain share classes, overall the Fund’s total expenses were reasonable. The Trustees also noted that the Adviser has contractually agreed to limit the Fund’s expenses, although this limit did not apply because the Fund’s total expenses as shown were below the applicable fee limit.
· For Janus Henderson Global Bond Fund, the Trustees noted that, although the Fund’s total expenses exceeded the peer group average for certain share classes, overall the Fund’s total expenses were reasonable. The Trustees also noted that the Adviser has contractually agreed to limit the Fund’s expenses.
· For Janus Henderson High-Yield Fund, the Trustees noted that, although the Fund’s total expenses exceeded the peer group average for certain share classes, overall the Fund’s total expenses were reasonable. The Trustees also noted that the Adviser has contractually agreed to limit the Fund’s expenses.
· For Janus Henderson Multi-Sector Income Fund, the Trustees noted that, although the Fund’s total expenses exceeded the peer group average for certain share classes, overall the Fund’s total expenses were reasonable. The Trustees also noted that the Adviser has contractually agreed to limit the Fund’s expenses.
· For Janus Henderson Short Duration Flexible Bond Fund, the Trustees noted that, although the Fund’s total expenses exceeded the peer group average for certain share classes, overall the Fund’s total expenses were reasonable. The Trustees also noted that the Adviser has contractually agreed to limit the Fund’s expenses.
Global and International Equity Funds
· For Janus Henderson Asia Equity Fund, the Trustees noted that, although the Fund’s total expenses exceeded the peer group average for certain share classes, overall the Fund’s total expenses were reasonable. The Trustees also noted that the Adviser has contractually agreed to limit the Fund’s expenses.
· For Janus Henderson Emerging Markets Fund, the Trustees noted that, although the Fund’s total expenses exceeded the peer group average for certain share classes, overall the Fund’s total expenses were reasonable. The Trustees also noted that the Adviser has contractually agreed to limit the Fund’s expenses.
· For Janus Henderson European Focus Fund, the Trustees noted that, although the Fund’s total expenses exceeded the peer group average for one share class, overall the Fund’s expenses were reasonable. The Trustees also noted that the Adviser has contractually agreed to limit the Fund’s expenses.
· For Janus Henderson Global Equity Income Fund, the Trustees noted that, although the Fund’s total expenses exceeded the peer group average for one share class, overall the Fund’s total expenses were reasonable. The Trustees also noted that the Adviser has contractually agreed to limit the Fund’s expenses, although this limit did not apply because the Fund’s total expenses as shown were below the applicable fee limit.
· For Janus Henderson Global Life Sciences Fund, the Trustees noted that the Fund’s total expenses were below the peer group average for all share classes.
· For Janus Henderson Global Real Estate Fund, the Trustees noted that, although the Fund’s total expenses exceeded the peer group average for certain share classes, overall the Fund’s total expenses were reasonable. The Trustees also noted that the Adviser has contractually agreed to limit the Fund’s expenses, although this limit did not apply because the Fund’s total expenses as shown were below the applicable fee limit.
Janus Henderson Venture Fund
Additional Information (unaudited)
· For Janus Henderson Global Research Fund, the Trustees noted that, although the Fund’s total expenses exceeded the peer group average for one share class, overall the Fund’s total expenses were reasonable. The Trustees also noted that the Adviser has contractually agreed to limit the Fund’s expenses, although this limit did not apply because the Fund’s total expenses as shown were below the applicable fee limit.
· For Janus Henderson Global Select Fund, the Trustees noted that, although the Fund’s total expenses exceeded the peer group average for certain share classes, overall the Fund’s total expenses were reasonable. The Trustees also noted that the Adviser has contractually agreed to limit the Fund’s expenses.
· For Janus Henderson Global Sustainable Equity Fund, the Trustees noted that, although the Fund’s total expenses exceeded the peer group average for certain share classes, overall the Fund’s expenses were reasonable. The Trustees also noted that the Adviser has contractually agreed to limit the Fund’s expenses.
· For Janus Henderson Global Technology and Innovation Fund, the Trustees noted that the Fund’s total expenses were below the peer group average for all share classes.
· For Janus Henderson International Opportunities Fund, the Trustees noted that, although the Fund’s total expenses exceeded the peer group average for certain share classes, overall the Fund’s expenses were reasonable. The Trustees also noted that the Adviser has contractually agreed to limit the Fund’s expenses.
· For Janus Henderson Overseas Fund, the Trustees noted that although the Fund’s total expenses exceeded the peer group average for certain share classes, overall the Fund’s total expenses were reasonable. The Trustees also noted that the Adviser has contractually agreed to limit the Fund’s expenses, although this limit did not apply because the Fund’s total expenses as shown were below the applicable fee limit.
· For Janus Henderson Responsible International Dividend Fund (formerly the Janus Henderson Dividend & Income Builder Fund), the Trustees noted that, although the Fund’s total expenses exceeded the peer group for one share class, overall the Fund’s total expenses were reasonable. The Trustees also noted that the Adviser has contractually agreed to limit the Fund’s expenses.
Money Market Funds
· For Janus Henderson Government Money Market Fund, the Trustees noted that the Fund’s total expenses were below the peer group average for all share classes.
· For Janus Henderson Money Market Fund, the Trustees noted that the Fund’s total expenses were below the peer group average for all share classes.
Multi-Asset Funds
· For Janus Henderson Adaptive Global Allocation Fund, the Trustees noted that, that the Fund’s total expenses were below the peer group average for all share classes.
· For Janus Henderson Balanced Fund, the Trustees noted that, although the Fund’s total expenses exceeded the peer group average for certain share classes, overall the Fund’s total expenses were reasonable. The Trustees also noted that the Adviser has contractually agreed to limit the Fund’s expenses, although this limit did not apply because the Fund’s total expenses as shown were below the applicable fee limit.
U.S. Equity Funds
· For Janus Henderson Adaptive Risk Managed U.S. Equity Fund, the Trustees noted that, although the Fund’s total expenses exceeded the peer group average for certain share classes, overall the Fund’s total expenses were reasonable. The Trustees also noted that the Adviser has contractually agreed to limit the Fund’s expenses, although this limit did not apply because the Fund’s total expenses as shown were below the applicable fee limit.
· For Janus Henderson Contrarian Fund, the Trustees noted that, although the Fund’s total expenses exceeded the peer group average for all share classes, overall the Fund’s total expenses were reasonable. The Trustees also noted that the Adviser had contractually agreed to limit the Fund’s expenses.
· For Janus Henderson Enterprise Fund, the Trustees noted that, although the Fund’s total expenses exceeded the peer group average for certain share classes, overall the Fund’s total expenses were reasonable. The Trustees also noted that the Adviser has contractually agreed to limit the Fund’s expenses, although this limit did not apply because the Fund’s total expenses as shown were below the applicable fee limit.
Janus Henderson Venture Fund
Additional Information (unaudited)
· For Janus Henderson Forty Fund, the Trustees noted that, although the Fund’s total expenses exceeded the peer group average for certain share classes, overall the Fund’s total expenses were reasonable. The Trustees also noted that the Adviser has contractually agreed to limit the Fund’s expenses, although this limit did not apply because the Fund’s total expenses as shown were below the applicable fee limit.
· For Janus Henderson Growth and Income Fund, the Trustees noted that, although the Fund’s total expenses exceeded the peer group average for certain share classes, overall the Fund’s total expenses were reasonable. The Trustees also noted that the Adviser has contractually agreed to limit the Fund’s expenses, although this limit did not apply because the Fund’s total expenses as shown were below the applicable fee limit.
· For Janus Henderson Mid Cap Value Fund, the Trustees noted that the Fund’s total expenses were below the peer group average for all share classes.
· For Janus Henderson Research Fund, the Trustees noted that, although the Fund’s total expenses exceeded the peer group average for certain share classes, overall the Fund’s total expenses were reasonable. The Trustees also noted that the Adviser has contractually agreed to limit the Fund’s expenses.
· For Janus Henderson Small Cap Value Fund, the Trustees noted that, although the Fund’s total expenses exceeded the peer group average for one share class, overall the Fund’s total expenses were reasonable. The Trustees also noted that the Adviser has contractually agreed to limit the Fund’s expenses, although this limit did not apply because the Fund’s total expenses as shown were below the applicable fee limit.
· For Janus Henderson Small-Mid Cap Value Fund, the Trustees noted that the Fund’s total expenses were below the peer group average for all share classes.
· For Janus Henderson Triton Fund, the Trustees noted that, although the Fund’s total expenses exceeded the peer group average for one share class, overall the Fund’s total expenses were reasonable. The Trustees also noted that the Adviser has contractually agreed to limit the Fund’s expenses, although this limit did not apply because the Fund’s total expenses as shown were below the applicable fee limit.
· For Janus Henderson Venture Fund, the Trustees noted that although the Fund’s total expenses exceeded the peer group average for one share class, overall the Fund’s total expenses were reasonable. The Trustees also noted that the Adviser has contractually agreed to limit the Fund’s expenses, although this limit did not apply because the Fund’s total expenses as shown were below the applicable fee limit.
The Trustees reviewed information on the overall profitability to the Adviser and its affiliates from their relationships with the Janus Henderson Funds, and considered profitability data of other publicly traded mutual fund advisers. The Trustees recognized that profitability comparisons among fund managers are difficult because of the variation in the type of comparative information that is publicly available, and the profitability of any fund manager is affected by numerous factors, including the organizational structure of the particular fund manager, differences in complex size, difference in product mix, difference in types of business (mutual fund, institutional and other), differences in the types of funds and other accounts it manages, possible other lines of business, the methodology for allocating expenses and the fund manager’s capital structure and cost of capital.
Additionally, the Trustees considered the estimated profitability to the Adviser from the investment management services it provided to each Janus Henderson Fund. In their review, the Trustees considered whether the Adviser receive adequate incentives and resources to manage the Janus Henderson Funds effectively. In reviewing profitability, the Trustees noted that the estimated profitability for an individual Janus Henderson Fund is necessarily a product of the allocation methodology utilized by the Adviser to allocate its expenses as part of the estimated profitability calculation. In this regard, the Trustees noted that the independent fee consultant found as part of its 2022 review that (1) the expense allocation methodology and rationales utilized by the Adviser were reasonable and (2) no clear correlation exists between expense allocations and operating margins. The Trustees also considered that the estimated profitability for an individual Janus Henderson Fund was influenced by a number of factors, including not only the allocation methodology selected, but also the presence of fee waivers and expense caps, and whether the Janus Henderson Fund’s investment management agreement contained breakpoints or a performance fee component. The Trustees determined, after taking into account these factors, among others, that the Adviser’s estimated profitability with respect to each Janus Henderson Fund was not unreasonable in relation to the services provided, and that the variation in the range of such estimated profitability among the Janus Henderson Funds was not a material factor in the Board’s approval of the reasonableness of any Janus Henderson Fund’s investment management fees.
Janus Henderson Venture Fund
Additional Information (unaudited)
The Trustees concluded that the management fees payable by each Janus Henderson Fund to the Adviser were reasonable in relation to the nature, extent, and quality of the services provided, taking into account the fees charged by other advisers for managing comparable mutual funds with similar strategies, the fees the Adviser charges to other clients, and, as applicable, the impact of fund performance on management fees payable by the Janus Henderson Funds. The Trustees also concluded that each Janus Henderson Fund’s total expenses were reasonable, taking into account the size of the Janus Henderson Fund, the quality of services provided by the Adviser, the investment performance of the Janus Henderson Fund, and any expense limitations agreed to or provided by the Adviser.
Economies of Scale
The Trustees considered information about the potential for the Adviser to realize economies of scale as the assets of the Janus Henderson Funds increase. They noted that their independent fee consultant published a report to the Trustees in June 2022 which provided its research and analysis into economies of scale. They also noted that, although many Janus Henderson Funds pay advisory fees at a fixed base rate as a percentage of net assets, without any breakpoints or performance fees, their independent fee consultant concluded that 75% of these Janus Henderson Funds’ have contractual management fees (gross of waivers) below their Broadridge Expense Group averages. The Trustees also noted the following from the independent fee consultant’s report: (1) that 31% of Janus Henderson Funds had management fee breakpoints in place whereby investors pay lower management fees as fund AUM increases; (2) that 29% of Janus Henderson Funds have low flat-rate fees and performance fees where the Adviser is incentivized to invest in resources which drive Janus Henderson Fund performance; and (3) that 39% of Janus Henderson Funds have low flat-rate fees versus peers where investors pay low fixed fees when the Janus Henderson Fund is small/midsized and higher fees when the Janus Henderson Fund grows in assets. The Trustees also noted that the Janus Henderson Funds share directly in economies of scale through the significant investments made by the Adviser and its affiliates related to services provided to the Funds and the lower charges of third-party service providers that are based in part on the combined scale of all of the Janus Henderson Funds.
The Trustees also considered the independent fee consultant’s conclusion that, given the limitations of various analytical approaches to economies of scale and their conflicting results, it is difficult to analytically confirm or deny the existence of economies of scale in the Janus Henderson complex. In this regard, the independent consultant concluded that (1) to the extent there were economies of scale at the Adviser, the Adviser’s general strategy of setting fixed management fees below peers appeared to share any such economies with investors even on smaller Janus Henderson Funds which have not yet achieved those economies and (2) by setting lower fixed fees from the start on these Janus Henderson Funds, the Adviser appeared to be investing to increase the likelihood that these Janus Henderson Funds will grow to a level to achieve any economies of scale that may exist. Further, the independent fee consultant provided its belief that Janus Henderson Fund investors are well-served by the fee levels and performance fee structures in place on the Janus Henderson Funds in light of any economies of scale that may be present at the Adviser.
Based on all of the information reviewed, including the recent and past research and analysis conducted by the Trustees’ independent fee consultant, the Trustees concluded that the current fee structure of each Janus Henderson Fund was reasonable and that the current rates of fees do reflect a sharing between the Adviser and the Janus Henderson Fund of any economies of scale that may be present at the current asset level of the Janus Henderson Fund.
Other Benefits to the Adviser
The Trustees also considered benefits that accrue to the Adviser and its affiliates from their relationships with the Janus Henderson Funds. They recognized that two affiliates of the Adviser separately serve the Janus Henderson Funds as transfer agent and distributor, respectively, and the transfer agent receives compensation directly from the non-money market Janus Henderson Funds for services provided, and that such compensation contributes to the overall profitability of the Adviser and its affiliates that results from their relationship with the Janus Henderson Funds. The Trustees also considered the Adviser’s past and proposed use of commissions paid by the Janus Henderson Funds on portfolio brokerage transactions to obtain proprietary and third-party research products and services benefiting the Janus Henderson Fund and/or other clients of the Adviser and/or the Adviser. The Trustees concluded that the Adviser’s use of these types of client commission arrangements to obtain proprietary and third-party research products and services was consistent with regulatory requirements and guidelines and was likely to benefit each Janus Henderson Fund. The Trustees also concluded that, other than the services provided by the Adviser and its affiliates pursuant to the agreements and the fees to be paid by each Janus Henderson Fund therefor, the Janus Henderson
Janus Henderson Venture Fund
Additional Information (unaudited)
Funds and the Adviser may potentially benefit from their relationship with each other in other ways. They concluded that the Adviser and its affiliates share directly in economies of scale through the lower charges of third-party service providers that are based in part on the combined scale of the Janus Henderson Funds and other clients serviced by the Adviser and its affiliates. They also concluded that the Adviser benefits from the receipt of research products and services acquired through commissions paid on portfolio transactions of the Janus Henderson Funds and that the Janus Henderson Funds benefit from the Adviser’s receipt of those products and services as well as research products and services acquired through commissions paid by other clients of the Adviser. They further concluded that the success of any Janus Henderson Fund could attract other business to the Adviser or other Janus Henderson Funds, and that the success of the Adviser could enhance the Adviser’s ability to serve the Janus Henderson Funds.
Janus Henderson Venture Fund
Liquidity Risk Management Program (unaudited)
Liquidity Risk Management Program
Rule 22e-4 under the Investment Company Act of 1940, as amended (the “Liquidity Rule”), requires open-end funds (but not money market funds) to adopt and implement a written liquidity risk management program (the “LRMP”) that is reasonably designed to assess and manage liquidity risk, which is the risk that a fund could not meet redemption requests without significant dilution of remaining investors’ interest in the fund. The Fund has implemented a LRMP, which incorporates the following elements: (i) assessment, management, and periodic review of liquidity risk; (ii) classification of portfolio holdings; (iii) the establishment and monitoring of a highly liquid investment minimum, as applicable; (iv) a 15% limitation on a Fund’s illiquid investments; (v) redemptions in-kind; and (vi) board oversight.
The Trustees of the Fund (the “Trustees”) have designated Janus Henderson Investors US LLC, the Fund’s investment adviser (the “Adviser”), as the Program Administrator for the LRMP responsible for administering the LRMP and carrying out the specific responsibilities of the LRMP. A working group comprised of various teams within the Adviser’s business is responsible for administering the LRMP and carrying out the specific responsibilities of different aspects of the LRMP (the “Liquidity Risk Working Group”). In assessing each Fund’s liquidity risk, the Liquidity Risk Working Group periodically considers, as relevant, factors including (i) the liquidity of a Fund’s portfolio investments during normal and reasonably foreseeable stressed conditions; (ii) whether a Fund’s investment strategy is appropriate for an open-end fund; (iii) the extent to which a Fund’s strategy involves a relatively concentrated portfolio or large positions in any issuer; (iv) a Fund’s use of borrowing for investment purposes; and (v) a Fund’s use of derivatives.
The Liquidity Rule requires the Trustees to review at least annually a written report provided by the Program Administrator that addresses the operation of the LRMP and assesses its adequacy and the effectiveness of its implementation, including, if applicable, the operation of the highly liquid investment minimum, and any material changes to the LRMP (the “Program Administrator Report”). At a meeting held on March 15, 2023, the Adviser provided the Program Administrator Report to the Trustees which covered the operation of the LRMP from January 1, 2022 through December 31, 2022 (the “Reporting Period”).
The Program Administrator Report discussed the operation and effectiveness of the LRMP during the Reporting Period. Among other things, the Program Administrator Report indicated that there were no material changes to the LRMP during the Reporting Period, although there were certain methodology adjustments implemented relating to a change in data provider. Additionally, the findings presented in the Program Administrator Report indicated that the LRMP operated adequately during the Reporting Period. These findings included that the Fund was able to meet redemptions during the normal course of business during the Reporting Period. The Program Administrator Report also stated that the Fund did not exceed the 15% limit on illiquid assets during the Reporting Period, that the Fund held primarily highly liquid assets, and was considered to be a primarily highly liquid fund during the Reporting Period. Also included among the Program Administrator Report’s findings was the determination that the Fund’s investment strategy remains appropriate for an open-end fund. In addition, the Adviser expressed its belief in the Program Administrator Report that the LRMP is reasonably designed and adequate to assess and manage the Fund’s liquidity risk, considering the Fund’s particular risks and circumstances, and includes policies and procedures reasonably designed to implement each required component of the Liquidity Rule.
There can be no assurance that the LRMP will achieve its objectives in the future. Please refer to your Fund’s prospectus for more information regarding the risks to which an investment in the Fund may be subject.
Janus Henderson Venture Fund
Useful Information About Your Fund Report (unaudited)
Performance Overviews
Performance overview graphs compare the performance of a hypothetical $10,000 investment in the Fund with one or more widely used market indices. When comparing the performance of the Fund with an index, keep in mind that market indices are not available for investment and do not reflect deduction of expenses.
Average annual total returns are quoted for a Fund with more than one year of performance history. Average annual total return is calculated by taking the growth or decline in value of an investment over a period of time, including reinvestment of dividends and distributions, then calculating the annual compounded percentage rate that would have produced the same result had the rate of growth been constant throughout the period. Average annual total return does not reflect the deduction of taxes that a shareholder would pay on Fund distributions or redemptions of Fund shares.
Cumulative total returns are quoted for a Fund with less than one year of performance history. Cumulative total return is the growth or decline in value of an investment over time, independent of the period of time involved. Cumulative total return does not reflect the deduction of taxes that a shareholder would pay on Fund distributions or redemptions of Fund shares.
Pursuant to federal securities rules, expense ratios shown in the performance chart reflect subsidized (if applicable) and unsubsidized ratios. The total annual fund operating expenses ratio is gross of any fee waivers, reflecting the Fund’s unsubsidized expense ratio. The net annual fund operating expenses ratio (if applicable) includes contractual waivers of the Adviser and reflects the Fund’s subsidized expense ratio. Ratios may be higher or lower than those shown in the “Financial Highlights” in this report.
Schedule of Investments
Following the performance overview section is the Fund’s Schedule of Investments. This schedule reports the types of securities held in the Fund on the last day of the reporting period. Securities are usually listed by type (common stock, corporate bonds, U.S. Government obligations, etc.) and by industry classification (banking, communications, insurance, etc.). Holdings are subject to change without notice.
The value of each security is quoted as of the last day of the reporting period. The value of securities denominated in foreign currencies is converted into U.S. dollars.
If the Fund invests in foreign securities, it will also provide a summary of investments by country. This summary reports the Fund exposure to different countries by providing the percentage of securities invested in each country. The country of each security represents the country of risk. A company may be allocated to a country based on other factors such as location of the company’s principal office, the location of the principal trading market for the company’s securities, or the country where a majority of the company’s revenues are derived. The Fund’s Schedule of Investments relies upon the industry group and country classifications published by Bloomberg and/or MSCI Inc.
Tables listing details of individual forward currency contracts, futures, written options, swaptions, and swaps follow the Fund’s Schedule of Investments (if applicable).
Statement of Assets and Liabilities
This statement is often referred to as the “balance sheet.” It lists the assets and liabilities of the Fund on the last day of the reporting period.
The Fund’s assets are calculated by adding the value of the securities owned, the receivable for securities sold but not yet settled, the receivable for dividends declared but not yet received on securities owned, and the receivable for Fund shares sold to investors but not yet settled. The Fund’s liabilities include payables for securities purchased but not yet settled, Fund shares redeemed but not yet paid, and expenses owed but not yet paid. Additionally, there may be other assets and liabilities such as unrealized gain or loss on forward currency contracts.
The section entitled “Net Assets Consist of” breaks down the components of the Fund’s net assets. Because the Fund must distribute substantially all earnings, you will notice that a significant portion of net assets is shareholder capital.
The last section of this statement reports the net asset value (“NAV”) per share on the last day of the reporting period. The NAV is calculated by dividing the Fund’s net assets for each share class (assets minus liabilities) by the number of shares outstanding.
Janus Henderson Venture Fund
Useful Information About Your Fund Report (unaudited)
Statement of Operations
This statement details the Fund’s income, expenses, realized gains and losses on securities and currency transactions, and changes in unrealized appreciation or depreciation of Fund holdings.
The first section in this statement, entitled “Investment Income,” reports the dividends earned from securities and interest earned from interest-bearing securities in the Fund.
The next section reports the expenses incurred by the Fund, including the advisory fee paid to the investment adviser, transfer agent fees and expenses, and printing and postage for mailing statements, financial reports and prospectuses. Expense offsets and expense reimbursements, if any, are also shown.
The last section lists the amounts of realized gains or losses from investment and foreign currency transactions, and changes in unrealized appreciation or depreciation of investments and foreign currency-denominated assets and liabilities. The Fund will realize a gain (or loss) when it sells its position in a particular security. A change in unrealized gain (or loss) refers to the change in net appreciation or depreciation of the Fund during the reporting period. “Net Realized and Unrealized Gain/(Loss) on Investments” is affected both by changes in the market value of Fund holdings and by gains (or losses) realized during the reporting period.
Statements of Changes in Net Assets
These statements report the increase or decrease in the Fund’s net assets during the reporting period. Changes in the Fund’s net assets are attributable to investment operations, dividends and distributions to investors, and capital share transactions. This is important to investors because it shows exactly what caused the Fund’s net asset size to change during the period.
The first section summarizes the information from the Statement of Operations regarding changes in net assets due to the Fund’s investment operations. The Fund’s net assets may also change as a result of dividend and capital gains distributions to investors. If investors receive their dividends and/or distributions in cash, money is taken out of the Fund to pay the dividend and/or distribution. If investors reinvest their dividends and/or distributions, the Fund’s net assets will not be affected.
The reinvestment of dividends and distributions is included under “Capital Share Transactions.” “Capital Shares” refers to the money investors contribute to the Fund through purchases or withdrawals via redemptions. The Fund’s net assets will increase and decrease in value as investors purchase and redeem shares from the Fund.
Financial Highlights
This schedule provides a per-share breakdown of the components that affect the Fund’s NAV for current and past reporting periods as well as total return, asset size, ratios, and portfolio turnover rate.
The first line in the table reflects the NAV per share at the beginning of the reporting period. The next line reports the net investment income/(loss) per share. Following is the per share total of net gains/(losses), realized and unrealized. Per share dividends and distributions to investors are then subtracted to arrive at the NAV per share at the end of the period. The next line reflects the total return for the period. The total return may include adjustments in accordance with generally accepted accounting principles required at the period end for financial reporting purposes. As a result, the total return may differ from the total return reflected for individual shareholder transactions. Also included are ratios of expenses and net investment income to average net assets.
The Fund’s expenses may be reduced through expense offsets and expense reimbursements. The ratios shown reflect expenses before and after any such offsets and reimbursements.
The ratio of net investment income/(loss) summarizes the income earned less expenses, divided by the average net assets of the Fund during the reporting period. Do not confuse this ratio with the Fund’s yield. The net investment income ratio is not a true measure of the Fund’s yield because it does not take into account the dividends distributed to the Fund’s investors.
The next figure is the portfolio turnover rate, which measures the buying and selling activity in the Fund. Portfolio turnover is affected by market conditions, changes in the asset size of the Fund, fluctuating volume of shareholder purchase and redemption orders, the nature of the Fund’s investments, and the investment style and/or outlook of the portfolio manager(s) and/or investment personnel. A 100% rate implies that an amount equal to the value of the entire portfolio was replaced once during the fiscal year; a 50% rate means that an amount equal to the value of half the
Janus Henderson Venture Fund
Useful Information About Your Fund Report (unaudited)
portfolio is traded in a year; and a 200% rate means that an amount equal to the value of the entire portfolio is traded every six months.
Janus Henderson Venture Fund
Notes
NotesPage1
Janus Henderson Venture Fund
Notes
NotesPage2
| | | | | | | | |
| | | | | |

| | | | |
This report is submitted for the general information of shareholders of the Fund. It is not an offer or solicitation for the Fund and is not authorized for distribution to prospective investors unless preceded or accompanied by an effective prospectus. |
Janus Henderson is a trademark of Janus Henderson Group plc or one of its subsidiaries. © Janus Henderson Group plc. Janus Henderson Group is the ultimate parent of Janus Henderson Distributors US LLC. Janus Henderson Distributors US LLC |
| | | | 125-24-93056 05-23 |
Item 2 - Code of Ethics
Not applicable to semiannual reports.
Item 3 - Audit Committee Financial Expert
Not applicable to semiannual reports.
Item 4 - Principal Accountant Fees and Services
Not applicable to semiannual reports.
Item 5 - Audit Committee of Listed Registrants
Not applicable.
Item 6 - Investments
(a) Schedule of Investments is contained in the Reports to Shareholders included under Item 1 of this Form N-CSR.
(b) Not applicable.
Item 7 - Disclosure of Proxy Voting Policies and Procedures for Closed-End Management Investment Companies
Not applicable to this Registrant.
Item 8 - Portfolio Managers of Closed-End Management Investment Companies
Not applicable to this Registrant.
Item 9 - Purchases of Equity Securities by Closed-End Management Investment Company and Affiliated Purchasers
Not applicable to this Registrant.
Item 10 - Submission of Matters to a Vote of Security Holders
There have been no material changes to the procedures by which shareholders may recommend nominees to the Registrant's Board of Trustees.
Item 11 - Controls and Procedures
(a) The Registrant's Principal Executive Officer and Principal Financial Officer have evaluated the Registrant's disclosure controls and procedures (as defined in Rule 30a-3(c) under the Investment Company Act of 1940, as amended) within 90 days of this filing and have concluded that the Registrant's disclosure controls and procedures were effective, as of that date.
(b) There have been no changes in the Registrant's internal control over financial reporting (as defined in Rule 30a-3(d) under the Investment Company Act of 1940, as amended) that occurred during the period covered by this report that have materially affected, or are reasonably likely to materially affect, the Registrant's internal control over financial reporting.
Item 12 – Disclosure of Securities Lending Activities for Closed-End Management Investment Companies
(a) Not applicable
(b) Not applicable.
Item 13 - Exhibits
(a) (1) Not applicable because the Registrant has posted its Code of Ethics (as defined in Item 2(b) of
Form N-CSR) on its website pursuant to paragraph (f)(2) of Item 2 of Form N-CSR.
(a) (2) Separate certifications for the Registrant's Principal Executive Officer and Principal Financial Officer, as required under Rule 30a-2(a) under the Investment Company Act of 1940, as amended, are attached as Ex99.CERT.
(b) A certification for the Registrant's Principal Executive Officer and Principal Financial Officer, as required by Rule 30a-2(b) under the Investment Company Act of 1940, as amended, is attached as Ex99.906CERT.
Signatures
Pursuant to the requirements of the Securities Exchange Act of 1934, as amended, and the Investment Company Act of 1940, as amended, the Registrant has duly caused this report to be signed on its behalf by the undersigned, thereunto duly authorized.
Janus Investment Fund
By: /s/ Michelle Rosenberg
Michelle Rosenberg, President and Chief Executive Officer of Janus Investment Fund
(Principal Executive Officer)
Date: May 30, 2023
Pursuant to the requirements of the Securities Exchange Act of 1934, as amended, and the Investment Company Act of 1940, as amended, this report has been signed below by the following persons on behalf of the Registrant and in the capacities and on the dates indicated.
By: /s/ Michelle Rosenberg
Michelle Rosenberg, President and Chief Executive Officer of Janus Investment Fund
(Principal Executive Officer)
Date: May 30, 2023
By: /s/ Jesper Nergaard
Jesper Nergaard, Vice President, Chief Financial Officer, Treasurer and Principal Accounting Officer of Janus Investment Fund
(Principal Accounting Officer and Principal Financial Officer)
Date: May 30, 2023