UNITED STATES SECURITIES AND EXCHANGE COMMISSION
WASHINGTON, D.C. 20549
FORM 10-K
| (X) | ANNUAL REPORT PURSUANT TO SECTION 13 OR 15(d) OF THE SECURITIES EXCHANGE ACT OF 1934 |
For the fiscal year ended December 28, 2007
OR
| ( ) | TRANSITION REPORT PURSUANT TO SECTION 13 OR 15(d) OF THE SECURITIES EXCHANGE ACT OF 1934 |
| | For the transition period from __________ to __________ |
| Commission File Number 1-8022 |
| |
| CSX CORPORATION |
(Exact name of registrant as specified in its charter) |
| Virginia | | 62-1051971 |
| (State or other jurisdiction of incorporation or organization) | | | | (I.R.S. Employer Identification No.) |
| |
| 500 Water Street, 15th Floor, Jacksonville, FL | | 32202 | | (904) 359-3200 |
| (Address of principal executive offices) | | (Zip Code) | | (Telephone number, including area code) |
| Securities registered pursuant to Section 12(b) of the Act: |
| |
| Title of each class | | Name of exchange on which registered |
| Common Stock, $1 Par Value | | New York Stock Exchange |
Securities registered pursuant to Section 12(g) of the Act: None
Indicate by check mark if the registrant is a well-known seasoned issuer (as defined in Rule 405 of the Securities Act).
Yes (X) No ( )
Indicate by check mark if the registrant is not required to file reports pursuant to Section 13 or Section 15(d) of the Act.
Yes ( ) No (X)
Indicate by check mark whether the registrant (1) has filed all reports required to be filed by Section 13 or 15(d) of the Securities Exchange Act of 1934 during the preceding 12 months (or for such shorter period that the registrant was required to file such reports), and (2) has been subject to such filing requirements for the past 90 days. Yes (X) No ( )
Indicate by check mark if disclosure of delinquent filers pursuant to Item 405 of Regulation S-K is not contained herein, and will not be contained, to the best of the registrant’s knowledge, in definitive proxy or information statements incorporated by reference in Part III of this Form 10-K or any amendment to this Form 10-K. ( )
Indicate by check mark whether the registrant is a large accelerated filer, an accelerated filer or a non-accelerated filer (as defined in Exchange Act Rule 12b-2).
Large Accelerated Filer (X) Accelerated Filer ( ) Non-accelerated Filer ( )
Indicate by check mark whether the registrant is a shell company (as defined in Exchange Act Rule 12b-2).
Yes ( ) No (X)
On June 29, 2007 (which is the last day of the second quarter and the required date to use), the aggregate market value of the Registrant’s voting stock held by non-affiliates was approximately $19.7 billion (based on the New York Stock Exchange closing price on such date).
There were 403,363,273 shares of Common Stock outstanding on February 15, 2008 (the latest practicable date that is closest to the filing date).
DOCUMENTS INCORPORATED BY REFERENCE
Portions of the Registrant’s Definitive Proxy Statement (the “Proxy Statement”) to be filed not later than April 25, 2008 with respect to its 2008 annual meeting of shareholders.
| |
| FORM 10-K | |
| TABLE OF CONTENTS | |
| | | | | |
| Item No. | | Page |
| | | | | |
| PART I |
| 1. | | 3 |
| | | 8 |
| | | 12 |
| 2. | | 12 |
| 3. | | 17 |
| 4. | | 18 |
| | | | | |
| PART II |
| 5. | | |
| | | | 21 |
| 6. | | 24 |
| 7. | | |
| | | | 26 |
| | | | | 26 |
| | | | | 27 |
| | | | | 30 |
| | | | | 33 |
| | | | | 35 |
| | | | | 48 |
| | | | | 50 |
| | | | | 51 |
| | | | | 51 |
| 7A. | | 61 |
| 8. | | 64 |
| 9. | | |
| | | | 131 |
| 9A. | | 131 |
| 9B. | | 134 |
| |
| PART III |
| 10. | | 135 |
| 11. | | 135 |
| 12. | | 135 |
| 13. | | 135 |
| 14. | | 135 |
| |
| PART IV |
| 15. | | 136 |
| | | | | |
| 142 |
Item 1. Business by Segment
CSX Corporation (“CSX” and together with its subsidiaries, the “Company”), based in Jacksonville, Florida, is one of the nation's leading transportation companies. Surface Transportation, which includes the Company’s rail and intermodal businesses, provides rail-based transportation services including traditional rail service and the transport of intermodal containers and trailers.
Rail
CSX’s principal operating company, CSX Transportation, Inc. (“CSXT”), provides a crucial link to the transportation supply chain through its approximately 21,000 route mile rail network, which serves every major population center in 23 states east of the Mississippi River, the District of Columbia, and the Canadian provinces of Ontario and Quebec. It serves 70 ocean, river and lake ports along the Atlantic and Gulf Coasts, the Mississippi River, the Great Lakes and the St. Lawrence Seaway. CSXT also serves thousands of production and distribution facilities through track connections to more than 230 short-line and regional railroads.
Other Entities
In addition to CSXT, the rail segment includes Total Distribution Services, Inc. (“TDSI”), Transflo Terminal Services, Inc. (“Transflo”), CSX Technology, Inc. (“CSX Technology”) and other subsidiaries. TDSI serves the automotive industry with distribution centers and storage locations, while Transflo provides logistical solutions for transferring products from rail to trucks. Technology and other support services are provided by CSX Technology and other subsidiaries.
Intermodal
CSX Intermodal, Inc. (“Intermodal”), one of the nation’s largest coast-to-coast intermodal transportation providers, is a stand-alone, integrated intermodal company linking customers to railroads via trucks and terminals. Containers and trailers are loaded and unloaded from trains, and trucks provide the link between intermodal terminals and the customer.
Surface Transportation Businesses
The rail and intermodal segments are designated by the Company on a combined basis as Surface Transportation businesses. Together, they generated $10 billion of revenue during 2007 and served four primary lines of business:
| | · | The merchandise business is the most diverse market with nearly 2.7 million carloads per year of aggregates, which includes crushed stone, sand and gravel, metal, phosphate, fertilizer, food, consumer, agricultural, paper and chemical products. The merchandise business generated approximately 50% of the Company’s revenue in 2007 and 38% of volume. |
| | · | Coal, which delivered approximately 1.9 million carloads of coal, coke and iron ore to electricity generating power plants, ocean, river and lake piers and terminals, steel makers and industrial plants, accounted for approximately 26% of the Company’s revenue and volume in 2007. The Company transports almost one-third of every ton of coal used for generating electricity in the areas served by CSX. |
| | · | Automotive, which delivers both finished vehicles and auto parts, generated 8% of the Company’s revenue and 6% of the Company’s volume in 2007. The Company delivers approximately one-third of North America’s light vehicles, serving both traditional manufacturers and the increasing number of global manufacturers. |
| | · | Intermodal offers a competitive cost advantage over long-haul trucking by combining the superior economics of rail transportation with the short-haul flexibility of trucks. Through its network of more than 50 terminals, Intermodal serves all major markets east of the Mississippi River and transports mainly manufactured consumer goods in containers, providing customers with truck-like service for longer shipments. For 2007, Intermodal accounted for approximately 14% of the Company’s total revenue and 30% of volume. |
Other revenue, which includes revenue from regional railroads (that are partially owned by CSX), demurrage, switching and other incidental charges, accounted for 2% of the Company’s total 2007 revenue. Revenue from regional railroads includes shipments by railroads that CSX does not directly operate. Demurrage represents charges assessed by railroads when shippers or receivers of freight hold railcars beyond a specified period of time. Switching revenue is generated when CSXT switches cars between trains for a customer or another railroad.
Other Businesses
CSX’s other holdings include CSX Real Property, Inc., a subsidiary responsible for the Company’s real estate sales, leasing, acquisition and management and development activities, and CSX Hotels, Inc., a resort doing business as The Greenbrier, located in White Sulphur Springs, West Virginia. Pretax earnings of $42 million, $24 million and $85 million for 2007, 2006 and 2005, respectively, from these activities are classified as a component of other income. These items are classified in other income because they are not considered by the Company to be operating activities and may fluctuate with the timing of real estate sales and resort seasonality.
The Company also has certain residual activities from formerly owned companies that include leasing of equipment and vessels. These results are included in consolidated operating income and totaled $5 million, $12 million and $1 million in 2007, 2006 and 2005, respectively.
Financial Information about Operating Segments
See Item 7. Management’s Discussion and Analysis of Financial Condition and Results of Operations for operating revenue, operating income and total assets by segment for each of the last three fiscal years.
Company History
A leader in freight rail transportation for 180 years, the Company’s roots date back to the early nineteenth century when the Baltimore and Ohio Railroad (“B&O”) – the nation’s first common carrier – was chartered in 1827. Since that time, CSX has built on the foundation laid by early pioneers who had a vision to create a railroad that safely and reliably services the ever-increasing demands of a growing nation.
In those 180 years, numerous railroads have combined with the former B&O through merger and consolidation to create what has become CSX. Each of the railroads that combined into the CSX family brought to CSX unique and valuable geographical reach to new markets, gateways, cities, ports and transportation corridors.
CSX was incorporated in 1978, under the laws of the Commonwealth of Virginia. In 1980, the Company completed the merger of the Chessie System (“Chessie”) and Seaboard Coast Line Industries (“Seaboard”) into CSX. The merger allowed CSX to connect northern population centers and Appalachian coal fields to growing southeastern markets. In 1986, the Chessie and Seaboard operating entities were transferred to the rail entity CSXT, which was created through the merger. Intermodal was originally formed in 1986 in order to provide nationwide, door-to-door intermodal service.
In 1997, CSXT and Norfolk Southern jointly acquired the rights to operate Conrail, Inc. (“Conrail”) and then in 2004, CSXT acquired an allocated portion of Conrail’s assets, which CSXT operated. Conrail was formed in 1976 from several financially troubled northeast railroads to restructure and revive the region’s railroads. CSX’s acquisition of key portions of Conrail allowed CSXT to link the northeast, including New England and the New York metropolitan area, with Chicago, Midwest markets and the growing areas in the southeast that were already served by CSXT. This current rail network allows the Company to directly serve every major market in the eastern United States with dependable, environmentally friendly and fuel efficient freight transportation and intermodal service.
Regulatory Environment
The Company's operations are subject to a variety of federal, state and local laws and regulations, generally applicable to many businesses in the United States. The railroad operations conducted by the Company's subsidiaries, including CSXT, are subject in many respects to the regulatory jurisdiction of the Surface Transportation Board (“STB”) and the Federal Railroad Administration (“FRA”), which are both part of the Department of Transportation (“DOT”). Additionally, the Transportation Security Administration (“TSA”), a component of the Department of Homeland Security (“DHS”), has the authority to issue regulations and other directives that may also affect railroad operations. In some cases, state and local laws and regulations can be preempted in their application to railroads by the operation of these and other federal authorities.
Although the Staggers Act of 1980 significantly deregulated rail rates and much of the rail traffic of the Company's subsidiaries is currently exempt from rate regulation by agency decision, the STB has broad jurisdiction over railroad commercial practices. This includes jurisdiction over freight car rent, the transfer, extension or abandonment of rail lines, rates charged on certain regulated rail traffic and any acquisition of control over rail common carriers. In 2007, for example, the STB issued decisions changing its long-standing policy on fuel surcharges, its rules for large freight rate cases and a new process for rate cases where smaller amounts are at issue.
The FRA and its sister agency within the DOT, the Pipeline and Hazardous Materials Administration, have broad jurisdiction over railroad operating standards and practices, including track, freight cars and locomotives, and hazardous materials requirements. The TSA has broad authority over railroad operating practices that may have homeland security implications. The TSA has proposed regulations that would apply to the transportation of certain kinds of highly hazardous materials. Decisions of these and other agencies can affect the profitability of the Company’s business. For further discussion on regulatory risks to the Company, see Item 1A. Risk Factors beginning on page 8.
Competition
The business environment in which the Company operates is highly competitive. Shippers typically select transportation providers that offer the most compelling combination of service and price. Service requirements, both in terms of transit time and reliability, vary by shipper and commodity. As a result, the Company’s primary competition varies by commodity, geographic location and mode of available transportation.
CSX’s primary rail competitor is the Norfolk Southern, which operates throughout much of CSX’s territory. Other railroads also operate in parts of the territory. Depending on the specific market, competing railroads and deregulated motor carriers may exert pressure on price and service levels. For further discussion on the risk of competition to the Company, see Item 1A. Risk Factors beginning on page 8.
Other Information
CSX makes available on its website www.csx.com, free of charge, its annual reports on Form 10-K, quarterly reports on Form 10-Q, current reports on Form 8-K and all amendments to those reports as soon as reasonably practicable after such reports are filed with or furnished to the Securities and Exchange Commission (“SEC”). Additionally, the Company has posted its code of ethics on its website, which is also available to any shareholder who requests it. This Form 10-K and other SEC filings are also accessible through the SEC’s website at www.sec.gov.
CSX has included the certifications of its Chief Executive Officer (“CEO”) and the Chief Financial Officer (“CFO”) regarding the Company’s public disclosure required by Section 302 of the Sarbanes-Oxley Act of 2002 (“the Act”) as Exhibits 31.1 and 31.2, as well as Section 906 of the Act as Exhibits 32.1 and 32.2 to this Form 10-K report. Additionally, on May 31, 2007, CSX filed its annual CEO certification with the New York Stock Exchange (“NYSE”) confirming the Company’s compliance with the NYSE Corporate Governance Listing Standards. The CEO was not aware of any violations of these standards by the Company as of January 31, 2008 (the latest practicable date that is closest to the filing of this Form 10-K).
The Company’s annual average number of employees was approximately 35,000 in 2007, which includes approximately 29,000 union employees. Most of the Company’s employees provide or support transportation services. The information set forth in Item 6. Selected Financial Data is incorporated herein by reference.
For additional information concerning business conducted by the Company during 2007, see Item 7. Management's Discussion and Analysis of Financial Condition and Results of Operations and Item 8. Financial Statements and Supplementary Data - Note 15, Business Segments.
The following risk factors could have a materially adverse effect on the Company’s results of operations, financial condition and liquidity, and could cause those results to differ materially from those expressed or implied in the Company’s forward-looking statements. Although the risks described below are those that management believes are the most significant, these are not the only risks facing the Company. Additional risks and uncertainties not currently known to the Company or that the Company currently does not deem to be material also may materially impact the Company’s financial position, results of operations and liquidity.
New legislation or regulatory changes could impact the Company’s earnings or regulate its ability to independently negotiate prices.
The Company is subject to the jurisdiction of various regulatory agencies, including the STB, the FRA and other state and federal regulatory agencies for a variety of economic, health, safety, labor, environmental, tax, legal and other matters. Legislation passed by Congress or regulations issued by these agencies can significantly affect the revenues, costs and profitability of the Company’s business. For example, regulations imposing price constraints or affecting rail-to-rail competition could adversely affect the Company’s profitability. Also, additional regulations related to environmental matters such as greenhouse gas emissions or legislative changes impacting hours of service requirements could adversely affect the Company’s financial position, results of operations and liquidity.
CSXT, as a common carrier by rail, is required by law to transport hazardous materials, which could expose the Company to significant costs and claims.
Under federal regulations, CSXT is required to transport hazardous materials under its common carrier obligation. A train accident involving the transport of hazardous materials could result in significant claims arising from personal injury, property damage, and environmental penalties and remediation. CSXT is also required to comply with regulations regarding the handling of hazardous materials. Failure to comply with these regulations can subject the Company to significant penalties and could be a factor in litigation arising out of a train accident. Finally, legislation preventing the transport of hazardous materials through certain cities could result in network congestion and increase the length of haul for hazardous substances.
The Company is subject to environmental laws and regulations that may result in significant costs.
The Company’s operations are subject to wide-ranging federal, state and local environmental laws and regulations concerning, among other things, emissions into the air, discharges into water, the handling, storage, transportation and disposal of waste and other materials and clean-up of hazardous material or petroleum releases. In certain circumstances, environmental liability can extend to formerly owned or operated properties, leased properties, adjacent properties and properties owned by third parties or Company predecessors, as well as to properties currently owned and used by the Company.
The Company has been, and may be subject to, allegations or findings to the effect that it has violated, or is strictly liable under, environmental laws or regulations, and such violations can result in the Company’s incurring fines, penalties or costs relating to the clean-up of environmental contamination. Although the Company believes it has appropriately recorded current and long-term liabilities for known future environmental costs, it could incur significant costs as a result of any of the foregoing and may be required to incur significant expenses to investigate and remediate known, unknown or future environmental contamination.
General economic, geo-political and compliance risks may affect the Company’s operations and financial results.
Changes in general economic conditions that affect demand for rail or intermodal services could adversely affect the Company’s financial position, results of operations and liquidity. In addition, abrupt political change or terrorist activity poses a risk of general economic disruption and could require changes in the operations and security arrangements, thus increasing the operating costs. These conditions may lend additional uncertainty to the timing and purchasing decisions by the Company’s customers.
Fuel prices and supply are influenced by international political and economic circumstances. Although a fuel recovery program is in place with a considerable number of customers, the Company could be negatively impacted if it were unable to realize fuel surcharges. Additionally, if a fuel supply shortage were to arise, whether due to the Organization of the Petroleum Exporting Countries (OPEC) or other production restrictions, lower refinery outputs, a disruption of oil imports or otherwise, the Company would be negatively impacted.
The FRA regulates several of the Company’s core operations including track and mechanical equipment standards, signaling systems, inspection of grade crossing warning devices, locomotive engineer certifications and employee injury reporting, among other areas. The Company’s unintentional failure to comply with applicable laws or regulations could erode public confidence in CSX. In addition, a change in these regulations could have a material adverse effect on the Company’s financial position, results of operations and liquidity.
Network congestion, caused by unanticipated increases in freight or passenger activity, could have a negative impact on service and operating efficiency.
The Company may experience rail network difficulties related to network capacity, unplanned increases in demand for rail service, increased passenger activities in capacity-constrained areas or regulatory changes impacting when CSXT can transport freight or its service routes that could have a negative effect on the Company’s operational fluidity, leading to deterioration of service, asset utilization and overall efficiency. In addition, the Company may face external factors such as severe weather and other natural occurrences, including floods, fires, hurricanes and earthquakes, which may disrupt the Company’s operations.
Increases in the number and magnitude of property damage and personal injury claims could adversely affect the Company’s operating results.
The Company faces inherent business risk from exposure to property damage, occupational injury claims, and personal injury claims resulting from train accidents, worker injury claims under FELA and claims from outside parties resulting from the Company’s operations. Although the Company is working diligently to enhance its safety programs and to continue to raise the awareness levels of its employees concerning safety, the Company could experience material property damage, personal injury or occupational claims in the future and it may incur significant costs to defend such claims.
Existing claims may suffer adverse developments not currently reflected in reserve estimates, as the ultimate outcome of existing claims is subject to numerous factors outside of the Company’s control. The Company establishes reserves to cover all of these types of claims. However, final amounts determined to be due on any outstanding matters may differ materially from the recorded reserves.
The Company may be subject to various claims and lawsuits that could result in significant expenditures.
The Company is subject to various existing lawsuits and potential unknown litigation. The Company may experience material judgments or incur significant costs to defend any such lawsuits. Additionally, existing litigation may suffer adverse development not currently reflected in the Company’s reserve estimates as the ultimate outcome of existing litigation is subject to numerous factors outside of the Company’s control. While the Company uses its best efforts to evaluate existing litigation, the final judgments may differ materially from the recorded reserves.
Future acts of terrorism, war or regulatory changes to combat the risk of terrorism may cause significant disruptions in the Company’s operations.
Terrorist attacks, such as those that occurred in the United States in September 2001, in Spain in March 2004, in England in July 2005, and in India in July 2006, along with any government response to those attacks, may adversely affect the Company’s financial position, results of operations and liquidity. CSXT’s rail lines or other key infrastructure may be direct targets or indirect casualties of acts of terror or war. This could cause significant business interruption and result in increased costs and liabilities and decreased revenues. In addition, insurance premiums charged for some or all of the coverage currently maintained by the Company could increase dramatically or the coverage may no longer be available.
Furthermore, in response to the heightened risk of terrorism, federal, state and local governmental bodies are proposing and beginning to adopt various legislation and regulations relating to security issues that impact the transportation industry. For example, the DHS proposed regulations that would require freight railroads to implement additional security protocols when transporting hazardous materials.
Failure to complete negotiations on collective bargaining agreements could result in strikes and/or work stoppages.
Most of CSXT's employees are represented by labor unions and are covered by collective bargaining agreements. Generally speaking, these agreements are bargained nationally by the National Carriers Committee. In the rail industry, negotiations have generally taken place over a number of years and previously have not resulted in any extended work stoppages. Over the last 30 years, there were only six days of work stoppage related to labor disputes over national handling. If the Company is unable to negotiate acceptable agreements, it could result in strikes by the affected workers, loss of business and increased operating costs as a result of higher wages or benefits paid to union members, any of which could have an adverse effect on the Company’s financial position, results of operations and liquidity. Under the Railway Labor Act’s procedures (which include mediation, cooling-off periods and the possibility of Presidential intervention), neither party may exercise self-help until the procedures are exhausted.
The Company relies on the stability and availability of its technology systems to operate its business.
The Company relies on information technology in all aspects of its business. A significant disruption or failure of our information technology systems, including computer hardware, software and communications equipment, could result in a service interruption, safety failure, security breach or other operational difficulties. While the Company has taken steps to mitigate these risks, the performance and reliability of its technology systems are critical to its ability to compete effectively.
The Company faces competition from rail carriers and other transportation providers.
The Company experiences competition in the form of pricing, service, reliability and other factors from other transportation providers including railroads and motor carriers that operate similar routes across its service area and, to a less significant extent, barges, ships and pipelines. Transportation providers such as motor carriers and barges utilize public rights-of-way that are built and maintained by governmental entities while CSXT and other railroads must build and maintain rail networks using largely internal resources. Any future improvements or expenditures materially increasing the quality or reducing the cost of alternative modes of transportation, or legislation providing for less stringent size or weight restrictions on trucks, could negatively impact the Company’s financial position, results of operations and liquidity.
Item 1B. Unresolved Staff Comments
None.
Item 2. Properties by Segment
Rail Property
CSXT’s properties primarily consist of track and its related infrastructure, locomotives and freight cars. These categories and the geography of the network are described below.
Track and Infrastructure
Serving 23 states, the District of Columbia, and the Canadian provinces of Ontario and Quebec, the CSXT rail network serves, among other markets, New York, Philadelphia and Boston in the northeast and mid-Atlantic, the southeast markets of Atlanta, Miami and New Orleans, and the Midwestern cities of St. Louis, Memphis and Chicago.
CSXT’s track structure includes main thoroughfares connecting terminals and yards (known as mainline track); track within terminals and switching yards; track adjacent to the mainlines used for passing trains; track connecting the mainline track to customer locations; and track that diverts trains from one track to another known as turnouts. Total track miles are greater than the Company’s approximately 21,000 route miles, which reflect the size of CSX’s rail network that connects markets, customers and western railroads. At December 2007, the breakdown of track miles was as follows:
| | Track |
| | Miles |
| Mainline track | 26,712 |
| Terminals and switching yards | 9,626 |
| Passing sidings and turnouts | 1,037 |
| Total | 37,375 |
In addition to its physical track structure, CSXT operates numerous yards and terminals. These serve as the hubs between CSXT and its local customers and as sorting facilities where rail cars often are received, re-sorted and placed onto new outbound trains.
The following 36 yards are identified as key to the CSXT system (listed in alphabetical order by state):
| |
| Rail Yards or Terminals |
| Birmingham, AL | Detroit, MI |
| Mobile, AL | Hamlet, NC |
| Montgomery, AL | Rocky Mount, NC |
| Baldwin, FL | Buffalo, NY |
| Moncrief (Jacksonville), FL | Selkirk, NY |
| Tampa, FL | Syracuse, NY |
| Atlanta, GA | Cincinnati, OH |
| East Savannah, GA | Cleveland, OH |
| Waycross, GA | Columbus, OH |
| Avon (Indianapolis), IN | Stanley (Toledo), OH |
| Chicago, IL | Walbridge (Toledo), OH |
| Evansville, IN | Willard, OH |
| Louisville, KY | Greenwich (Philadelphia), PA |
| Russell, KY | Charleston, SC |
| New Orleans, LA | Florence, SC |
| Cumberland, MD | Erwin, TN |
| Curtis Bay (Baltimore), MD | Nashville, TN |
| Locust Point (Baltimore), MD | Richmond, VA |
For a list of Intermodal’s terminals, see page 16.
Network Geography
CSXT’s train operations are primarily focused around the following four major transportation networks, which are defined geographically or by line of business and are described below.
Coal Network – Coal is used to generate more than half of the electricity in the United States. The CSXT coal network connects mining operations in nine states with industrial areas in the northeast and mid-Atlantic, as well as many river, lake and seaport facilities. This network also supports the strong, growing utility market in the southeast.
Southeastern Corridor – This section of the network runs from the western gateways of Chicago, Memphis and St. Louis through the growing cities of Nashville, Birmingham and Atlanta and into the expanding markets in the southeast. CSXT’s capacity investment in this corridor clearly strengthens this route and makes it the premier rail route connecting these key cities and gateways with the growing southeast. The corridor extends through the coal reserves of the southern Illinois basin and provides direct rail service between these coal sources and the increasing demand for coal in the southeast. The increase in capacity on this corridor positions CSXT well to handle the projected traffic volumes of intermodal, coal, automotive and general merchandise traffic.
Interstate 90 (I-90) Corridor – Chicago and metropolitan areas in New York and New England are linked by CSXT’s I-90 Corridor. Much of this route has two lanes of track side-by-side (referred to as double mainline track) supporting high-speed intermodal and automotive services. The I-90 Corridor is also a primary route for import traffic moving across the country, through Chicago and into the population centers in the northeast. Continued growth in consumption in the east and northeast makes this corridor a critical element in the Company’s overall system.
Interstate 95 (I-95) Corridor – Charleston, Jacksonville, Miami and many other cities throughout the growing southeast are connected to the heavily populated northeastern cities of Baltimore, Philadelphia and New York along CSXT’s I-95 Corridor. This route is primarily used to ship food and consumer products, as well as metals and chemicals. It is the only rail corridor along the east coast south of Washington, D.C., and provides access to all the major eastern ports.
Locomotives
CSXT focuses on maximum use of its fleet and prudent investment in new units to drive the rail network. Better locomotive management helps CSXT move freight more efficiently, while continued investment in CSXT’s power source means CSXT is operating more locomotives better.
CSXT operates more than 4,000 locomotives, of which over 95% are owned by CSXT. Freight locomotives are the power source used primarily to pull rail cars. Switching locomotives are used in yards to sort railcars so that the right railcar gets attached to the right train in order to get it to its final destination. Auxiliary units are typically used to provide extra traction for heavy trains in hilly terrain. At December 2007, CSXT’s owned and long-term leased locomotives consisted of the following:
| |
| | Locomotives | | % |
| Freight | 3,495 | | 87% |
| Switching | 324 | | 8% |
| Auxiliary Units | 188 | | 5% |
| Total | 4,007 | | 100% |
Freight Car Fleet
The average daily fleet of cars-on-line consists of approximately 222,000 cars, but at any point in time, over half of the railcars on the CSXT system are not owned or leased by CSXT. Examples of these are: railcars owned by other railroads (which are utilized by CSXT), shipper-furnished or private cars (which are generally used only in that shipper’s service) and multi-level railcars.
CSXT’s freight car fleet consists of six main types of cars:
Gondolas – Support CSXT’s metals markets and provide transport for woodchips and other bulk commodities. Some gondolas are equipped with special hoods for protecting products like coil and sheet steel.
Open-top hoppers – Transport heavy dry bulk commodities such as coal, coke, stone, sand, ores and gravel that are resistant to weather conditions.
Box cars – Include a variety of tonnages, sizes, door configurations and heights to accommodate a wide range of finished products, including paper, auto parts, appliances and building materials. Insulated box cars deliver food products, canned goods, beer and wine.
Covered hoppers – Have a permanent roof and are segregated based upon commodity density. Lighter bulk commodities such as grain, fertilizer, flour, salt, sugar, clay and lime are shipped in large cars called jumbo covered hoppers. Heavier commodities like cement, ground limestone and glass sand are shipped in small cube covered hoppers.
Multi-level flat cars – Transport finished automobiles and are differentiated by the number of levels: bi-levels for large vehicles such as pickup trucks and SUVs and tri-levels for sedans and smaller automobiles.
Flat cars – Used for shipping intermodal containers and trailers or bulk and finished goods, such as lumber, pipe, plywood, drywall and pulpwood.
Other cars owned or leased on the network include, but are not limited to, center beam cars for transporting lumber and building products.
CSXT owns more than 60% of its freight cars. At December 2007, CSXT’s owned and long-term leased freight car fleet consisted of the following:
| |
| | Freight Cars | | % |
| Gondolas | 26,490 | | 28% |
| Open-top hoppers | 19,604 | | 21% |
| Box cars | 13,911 | | 15% |
| Covered hoppers | 13,555 | | 14% |
| Multi-level flat cars | 12,340 | | 13% |
| Flat cars | 7,189 | | 8% |
| Other cars | 1,275 | | 1% |
| Total | 94,364 | | 100% |
Intermodal Property
Infrastructure
Intermodal serves 51 terminals in 22 states. These terminals serve as a transfer point between rail and trucks. If the city has more than one terminal, it is indicated by the number next to it.
| Intermodal Terminals |
| Mobile, AL | Kansas City, MO |
| Lathrop, CA | Charlotte, NC |
| Los Angeles/Long Beach, CA (3) | North Bergen, NJ |
| Oakland, CA | Blasdell, NY |
| Jacksonville, FL (2) | Syracuse, NY |
| Orlando, FL | New York, NY/NJ (5) |
| Tampa, FL | Cincinnati, OH |
| Atlanta, GA (2) | Cleveland, OH |
| Savannah, GA (2) | Columbus, OH (2) |
| Chicago, IL (2) | Marion, OH |
| East St. Louis, IL | Portland, OR |
| Avon, IN | Chambersburg, PA |
| Evansville, IN | Philadelphia, PA |
| New Orleans, LA | Charleston, SC |
| Boston, MA | Memphis, TN |
| Springfield, MA | Nashville, TN |
| Worcester, MA (3) | Mesquite, TX |
| Baltimore, MD | Portsmouth, VA |
| Detroit, MI | Seattle, WA |
Equipment
Intermodal equipment consists primarily of containers, chassis and other equipment (such as lift equipment). Containers are weather-proof boxes used for bulk shipment of freight, and chassis are the wheeled support framework for a container that allows it to be attached to a tractor. All of Intermodal’s chassis are leased. Intermodal also has other types of equipment such as doublestack railcars, which are railcars that allow for two containers to be mounted one above the other.
At December 28, 2007, Intermodal owned or long-term leased equipment consisted of the following:
| | Equipment | | % |
| Chassis | 25,980 | | 67% |
| Containers | 12,503 | | 32% |
| Other | 433 | | 1% |
| Total | 38,916 | | 100% |
Item 3. Legal Proceedings
The Company is subject to various legal proceedings and claims that arise in the ordinary course of business. For more information on legal proceedings, see Item 7. Management’s Discussion and Analysis of Financial Condition and Results of Operations under the caption “Critical Accounting Estimates – Casualty, Environmental and Legal Reserves” and Item 8. Financial Statements and Supplementary Data - Note 7, Commitments and Contingencies under the caption “Other Legal Proceedings.”
Item 4. Submission of Matters to a Vote of Security Holders
There were no matters submitted to a vote of security holders in the fourth quarter of 2007.
Executive Officers of the Registrant
Executive officers of CSX are elected by the CSX Board of Directors and generally hold office until the next annual election of officers. There are no family relationships or any arrangement or understanding between any officer and any other person pursuant to which such officer was elected. As of December 2007, the executive officers are:
Name and Age | Business Experience During Past 5 Years |
Michael J. Ward, 57 Chairman, President and Chief Executive Officer | A 30-year veteran of the Company, Ward has served as Chairman, President and Chief Executive Officer since January 2003. In 2000, he was named President of CSXT, and he was later appointed President of CSX and elected to the Board of Directors in 2002. His distinguished railroad career has included key executive positions in nearly all aspects of the Company’s business, including sales and marketing, operations and finance. |
Oscar Munoz, 48 Executive Vice President and Chief Financial Officer | Munoz has served as Executive Vice President and Chief Financial Officer of CSX and CSXT since May 2003 and is responsible for management and oversight of all financial, strategic planning, information technology, purchasing and real estate activities of CSX. He brings to the Company years of experience from a variety of industries. Before joining CSX in 2003, Munoz served as Chief Financial Officer and Vice President of AT&T Consumer Services. He has also held key executive positions within the telecommunication and beverage industries. |
Name and Age | Business Experience During Past 5 Years |
| Tony L. Ingram, 61 Executive Vice President and Chief Operating Officer | Ingram has served as Executive Vice President and Chief Operating Officer of CSXT since March 2004 and manages all aspects of the Company’s operations across its 21,000-mile network, including transportation, service design, customer service, engineering and mechanical. Prior to joining CSX in 2004, Ingram spent more than 30 years at Norfolk Southern where he served as Senior Vice President – Transportation, Network and Mechanical from February 2003 to March 2004 and Vice President, Transportation – Operations from March 2000 to February 2003. |
Clarence W. Gooden, 56 Executive Vice President of Sales and Marketing and Chief Commercial Officer | Gooden has been the Executive Vice President and Chief Commercial Officer of CSX and CSXT since April 2004 and is responsible for generating customer revenue, forecasting business trends and developing CSX’s model for future revenue growth. A member of the CSX family for more than 35 years, Gooden has held key executive positions in both operations and sales and marketing, including being appointed President of CSX Intermodal in 2001 and Senior Vice President of the Merchandise Service Group in 2002. |
Ellen M. Fitzsimmons, 47 Senior Vice President of Law and Public Affairs, General Counsel and Corporate Secretary | Fitzsimmons has been the Senior Vice President of Law and Public Affairs, General Counsel, and Corporate Secretary since December 2003. She serves as the Company’s chief legal officer and oversees all government relations and public affairs activities. During her 16-year tenure with the Company, her broad responsibilities have included key roles in major risk and corporate governance-related areas such as Senior Vice President – Law and Corporate Secretary from May to December 2003 and as Senior Vice President – Law from February 2001 to May 2003. |
Name and Age | Business Experience During Past 5 Years |
Robert J. Haulter, 54 Senior Vice President of Human Resources and Labor Relations | Haulter has served as Senior Vice President – Human Resources and Labor Relations of CSX and CSXT since December 2003 and is responsible for employee compensation and benefits, labor relations, organizational development and transformation, recruitment, training and various administrative activities. His 30-year career with the Company has included key executive positions in operations, finance and human resources before being appointed Vice President of Human Resources in 2000. |
Carolyn T. Sizemore, 44 Vice President and Controller | Sizemore has served as Vice President and Controller of CSX and CSXT since April 2002 and is responsible for financial and regulatory reporting, paying the Company’s 35,000 employees, accounts payable and billing and collections for outside party expenditures along with various other accounting processes. Her responsibilities during her 18-year tenure with the Company have included roles in finance and audit-related areas including a variety of positions in accounting, finance strategies, budgets and performance analysis. |
Item 5. Market for Registrant’s Common Equity, Related Stockholder Matters and Issuer Purchases of Equity Securities
Market Information
CSX’s common stock is listed on the NYSE, which is its principal trading market, and is traded over-the-counter and on exchanges nationwide. The official trading symbol is “CSX.”
Description of Common and Preferred Stock
A total of 600 million shares of common stock is authorized, of which 407,864,394 shares were outstanding as of December 28, 2007. Each share is entitled to one vote in all matters requiring a vote of shareholders. There are no pre-emptive rights. At January 31, 2008, the latest practicable date, there were 46,749 common stock shareholders of record. The weighted average of common shares outstanding, which was used in the calculation of diluted earnings per share, was approximately 448 million as of December 28, 2007. (See Note 2, Earnings Per Share.)
A total of 25 million shares of preferred stock is authorized, none of which is currently outstanding.
The following table sets forth, for the quarters indicated, the dividends declared and the high and low share prices of CSX common stock as required by SEC Regulation S-K.
| | Quarter | |
| | | | 1st | 2nd | 3rd | 4th | | Year |
| 2007 |
| | Dividends | $0.12 | $0.12 | $0.15 | $0.15 | | $0.54 |
| | Common Stock Price | |
| | High | $42.53 | $47.38 | $51.88 | $46.49 | | $51.88 |
| | Low | $33.50 | $39.36 | $38.09 | $40.17 | | $33.50 |
| |
| 2006 |
| | Dividends | $0.065 | $0.065 | $0.10 | $0.10 | | $0.33 |
| | Common Stock Price | |
| | High | $30.20 | $37.33 | $35.58 | $38.30 | | $38.30 |
| | Low | $24.29 | $30.05 | $28.60 | $32.51 | | $24.29 |
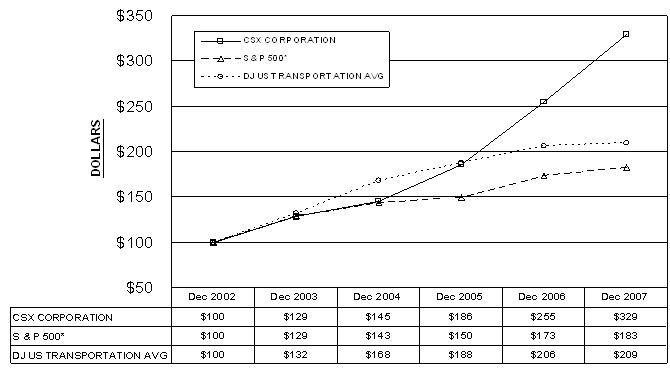
Stock Performance Graph
The cumulative shareholder returns, assuming reinvestment of dividends, on $100 invested at December 31, 2002 is illustrated on the graph below. The Company references the Standard & Poor 500 Stock Index (“S&P 500”) and the Dow Jones U.S. Transportation Average Index, which provide comparisons to a broad-based market index and other companies in the transportation industry. As shown in the graph, CSX’s five-year stock returns significantly outpaced those of the S&P 500. Additionally the Company’s stock has increased 120% over the past three years under the direction of the current management team.
* The S&P 500 is a registered trademark of the McGraw-Hill Companies, Inc.
CSX Purchases of Equity Securities
CSX is required to disclose any purchases of its own common stock for the most recent quarter. CSX purchases its own shares for two primary reasons: to further the goals under its share repurchase program and to fund the Company’s contribution required to be paid in CSX common stock under 401(k) plans which cover certain union employees.
Currently, CSX has purchased $2.1 billion of its outstanding common stock, which represents 50 million shares or about 70% of the $3 billion share repurchase program that was authorized in 2007. CSX intends to complete this repurchase program during 2008. The timing, method, amount of repurchase transactions and the sources of funds to affect any repurchases will be determined by the Company's management based on their evaluation of market conditions, share price and other factors. While it is not management’s intention, the program could be suspended or discontinued at any time.
Share repurchase activity for fourth quarter 2007 was as follows:
| | CSX Purchases of Equity Securities for the Quarter | |
| |
| Fourth Quarter | Total Number of Shares Purchased | Average Price Paid per Share | Total Number of Shares Purchased as Part of Publicly Announced Plans or Programs | | Approximate Dollar Value of Shares that May Yet Be Purchased Under the Plans or Programs |
| |
| Beginning Fourth Quarter Balance | | $ 1,439,716,780 |
| |
| October |
| | (September 29, 2007 - October 26, 2007) | 5,724,300 | $ 43.11 | 5,724,300 | | $ 1,192,930,945 |
| | | | | | | |
| November |
| | (October 27, 2007 - November 23, 2007) | 4,933,700 | $ 43.60 | 4,933,700 | | $ 977,804,729 |
| |
| December |
| | (November 24, 2007 - December 28, 2007) | 2,510,900 | $ 41.20 | 2,510,900 | | $ 874,363,982 |
| | | |
| Total/Ending Balance | 13,168,900 | $ 42.93 | 13,168,900 | | $ 874,363,982 |
Including previous share repurchase programs, CSX has purchased over $2.6 billion of its outstanding common stock over the past two years.
Item 6. Selected Financial Data
Selected financial data and significant events related to the Company’s financial results for the last five fiscal years are listed below.
| | Fiscal Years |
| (Dollars in Millions, Except Per Share Amounts) | 2007 | 2006 | 2005 | 2004 | 2003 |
| |
| Earnings From Continuing Operations |
| | Operating Revenue | $ 10,030 | $ 9,566 | $ 8,618 | $ 8,040 | $ 7,573 |
| | Operating Expense | 7,774 | 7,428 | 7,068 | 7,040 | 7,053 |
| | Operating Income | $ 2,256 | $ 2,138 | $ 1,550 | $ 1,000 | $ 520 |
| |
| Earnings from Continuing Operations | $ 1,226 | $ 1,310 | $ 720 | $ 418 | $ 137 |
| |
| Earnings Per Share: |
| | From Continuing Operations | $ 2.85 | $ 2.98 | $ 1.67 | $ 0.97 | $ 0.32 |
| | From Continuing Operations, Assuming Dilution | 2.74 | 2.82 | 1.59 | 0.94 | 0.31 |
| |
| Financial Position |
| | Cash, Cash Equivalents and Short-term Investments | $ 714 | $ 900 | $ 602 | $ 859 | $ 368 |
| | Total Assets | 25,534 | 25,129 | 24,232 | 24,605 | 21,760 |
| | Long-term Debt | 6,470 | 5,362 | 5,093 | 6,248 | 6,886 |
| | Shareholders' Equity | 8,685 | 8,942 | 7,954 | 6,811 | 6,448 |
| |
| Other Data Per Common Share |
| | Dividend Per Share | $ .54 | $ 0.33 | $ 0.215 | $ 0.20 | $ 0.20 |
| |
| Employees -- Annual Averages |
| | Rail | 32,477 | 32,987 | 32,033 | 32,074 | 32,892 |
| | Other | 2,966 | 3,018 | 3,076 | 3,833 | 4,624 |
| | Total | 35,443 | 36,005 | 35,109 | 35,907 | 37,516 |
Significant Events
| | 2007 | -- | Recognized gains of $27 million before tax, or $17 million after tax, on insurance recoveries from claims related to Hurricane Katrina. (See Note 5, Hurricane Katrina.) |
| | 2006 | -- | Two-for-one split of the Company’s common stock effective 2006. All periods have been retroactively restated to reflect the stock split. |
| | -- | Recognized gains of $168 million before tax, or $104 million after tax, on insurance recoveries from claims related to Hurricane Katrina. (See Note 5, Hurricane Katrina.) |
| | -- | Recognized an income tax benefit of $151 million primarily related to the resolution of certain tax matters, including resolution of ordinary course federal income tax audits for 1994 – 1998. |
| | -- | Recognized a $26 million after-tax non-cash gain on additional Conrail property received. |
| Significant events, continued: |
| | 2005 | -- | Recognized a charge of $192 million pretax, $123 million after tax, to repurchase $1.0 billion of outstanding debt, for costs of the increase in current market value above original issue value. (See Note 9, Debt and Credit Agreements.) |
| | -- | Recognized an income tax benefit of $71 million for the Ohio legislative change to gradually eliminate its corporate franchise tax. |
| | 2004 | -- | Recognized a charge of $71 million pretax, $44 million after tax, for separation expenses related to management restructuring. |
| | -- | Recognized a $16 million after-tax non-cash gain on the Conrail spin-off transaction. |
| | -- | Completed a corporate reorganization of Conrail that resulted in the direct ownership of certain Conrail assets by CSXT and caused a significant increase in total assets. |
| | 2003 | -- | Recognized a charge of $232 million pretax, $145 million after tax, in conjunction with the change in estimate of casualty reserves to include an estimate of incurred but not reported claims for asbestos and other occupational injuries to be received over the next seven years. |
| | -- | Recognized a charge of $108 million pretax, $67 million after tax, for two settlement agreements with Maersk that resolved all material disputes pending between the companies arising out of the 1999 sale of the international container-shipping assets. |
| | -- | Recognized a net charge of $22 million pretax, $13 million after tax. This includes a charge of $44 million pretax, $26 million after tax, which is comprised of the initial charge for separation expenses related to the management restructuring announced in 2003 of $34 million pretax and an additional separation charge of $10 million pretax included in the Company’s third quarter results. These amounts were offset by a net credit of $22 million pretax, $13 million after tax, related to revised estimates for railroad retirement taxes and the amount of benefits that will be paid to individuals under the 1991 and 1992 separation plans. |
Item 7. Management's Discussion and Analysis of Financial Condition and Results of Operations
STRATEGIC OVERVIEW
The Company provides customers access to a modern transportation network that connects ports, production and distribution centers to markets in the Northeast, Midwest and the rapidly growing southern states. The Company transports a diversified portfolio of products, from domestically abundant coal to new energy sources such as ethanol, from automobiles produced by traditional American manufacturers to “new domestic” factories owned by European, Japanese and Korean companies, and from life-essential chemicals to life-enriching consumer electronics. Additionally, the Company serves every major market in the eastern United States and has direct access to all Atlantic and Gulf Coast ports, as well as the Mississippi River, The Great Lakes and the St. Lawrence Seaway. Furthermore, the Company has access to Pacific ports through alliances with western railroads. Overall, the Company’s transportation network encompasses approximately 21,000 route miles of track in 23 states, the District of Columbia and the Canadian provinces of Ontario and Quebec.
As the nation consumes increasingly higher quantities of imported goods, those products must be transported across the country in a way that minimizes the impact on the environment, takes traffic off an already congested highway system and minimizes fuel consumption and transportation costs. The Company’s transportation network, located in the largest and fastest-growing population centers in the nation, is well-positioned to capitalize on consumption growth trends. In this regard, more than two-thirds of Americans live within the Company’s service territory, accounting for about three-quarters of the nation’s consumption.
The Company has made substantial strides in operating performance in order to capitalize on these consumption growth trends. In 2004, the Company implemented the ONE Plan, which continues to focus on optimizing the train network and utilizing rail assets more efficiently. Anchored by the ONE Plan and a variety of other initiatives implemented after the ONE Plan was introduced, the Company has achieved significant operational improvements that have enhanced safety, service reliability and productivity. These strong results include the highest customer satisfaction scores ever achieved by the Company as measured by independent surveys of its customers.
In addition to the ONE Plan, the Company recently embarked on a new initiative called Total Service Integration (“TSI”), which aims to better align the Company’s capabilities with customer demands. TSI aims to optimize train size and increase asset utilization while delivering more reliable service to customers.
These initiatives delivered strong results for shareholders while higher levels of customer service have led to improved pricing. These efforts combined with operational efficiencies have resulted in substantial improvements in CSX’s operating income and operating ratio.
In addition to driving better financial results to create value for shareholders, CSX also employs a balanced approach in deploying its capital for the benefit of shareholders. This approach includes investments in the future, share repurchases and dividends. Through this balanced use of financial resources, CSX will continue to capitalize on an economic environment that is increasingly favoring rail transportation.
Surface Transportation
| | · | Revenue grew $464 million or 5% to over $10 billion. |
| | · | Expenses increased $339 million or 5% to $7.8 billion, which included $141 million of higher prior year gains on insurance recoveries (which reduced operating expenses) and $98 million of higher fuel costs. |
| | · | Surface Transportation Operating Income, which excludes other operating income, increased $125 million to $2.3 billion. |
| | · | Service and safety measurements improved in all categories. |
Leadership, discipline and execution resulted in excellent 2007 results, which included the lowest Surface Transportation operating ratio in a decade. Revenue and revenue per unit increased 5% and 8%, respectively, from a year ago reflecting the improving value CSX provides its customers through better service. The Company was able to achieve substantial pricing gains predominantly due to CSXT service improvements and the overall cost advantages that the Company’s rail-based solutions provide to customers versus other modes of transportation.
The strong results in revenue were achieved despite volume declines in all of the Company’s four major lines of business. The overall 3% volume decrease versus last year was primarily driven by continued weakness in the merchandise market relating to housing construction and associated markets, as well as lower automotive production.
Expenses were higher due to the effects of rising fuel prices and higher prior year gains on insurance recoveries, which were recorded as a reduction to operating expenses. Lower 2007 volume and better productivity from improved operations partially offset the effects of inflation for certain expense categories.
For additional information, refer to Rail and Intermodal Results of Operations discussed on pages 40 through 43.
The Company’s continued focus on safety and operating plan execution helped all service measurements improve compared to last year. Within the service measures, CSX achieved record performance on both of its key safety measures (FRA Personal Injuries Frequency Index and FRA Train Accident Rate) in 2007 despite some costly train accidents. Improved safety is the result of the safety leadership and train accident prevention processes. Both of these use training, awareness, compliance measurement and root cause analysis to prevent incidents and create a safer work environment.
In addition, CSX continues to improve its train operations with gains of 4% and 12% in On-Time Train Originations and On-Time Destination Arrivals, respectively. Velocity, a measure of overall network fluidity, increased 5% in 2007. More important was the consistent week-to-week velocity, which indicates more reliable service to customers. Improved network operations also drove increased asset utilization, including an improvement of 8% in Dwell, which is the average time cars spend in terminals when being switched. The table below shows these key measurements and resources.
| RAIL OPERATING STATISTICS (Estimated) | Fiscal Years | |
| | 2007 | 2006 | Improvement | % |
| Service |
| Measurements | FRA Personal Injuries Frequency Index | 1.21 | 1.46 | 17 | % |
| |
| | FRA Train Accident Rate | 2.83 | 3.54 | 20 | |
| |
| | On-Time Train Originations | 79.3% | 76.0% | 4 | |
| | On-Time Destination Arrivals | 70.4% | 62.7% | 12 | |
| |
| | Dwell (hours) | 23.2 | 25.1 | 8 | |
| | Cars-On-Line | 221,943 | 224,680 | 1 | |
| |
| | System Train Velocity (miles per hour) | 20.8 | 19.9 | 5 | |
| |
| | Recrews (per day) | 57 | 59 | 3 | % |
| |
| | Increase/ | |
| | (Decrease) | |
| Resources | Route Miles | 21,166 | 21,114 | - | % |
| | Locomotives (owned and long-term leased) | 4,007 | 3,851 | 4 | |
| | Freight Cars (owned and long-term leased) | 94,364 | 101,602 | (7) | % |
Key Performance Measures Definitions
FRA Personal Injuries Frequency Index – Number of FRA-reportable injuries per 200,000 man-hours
FRA Train Accident Rate – Number of FRA-reportable train accidents per million train-miles
On-Time Train Originations – Percent of scheduled road trains that depart the origin yard on-time or ahead of schedule per the ONE Plan
On-Time Destination Arrivals – Percent of scheduled trains that arrive at the destination yard on-time to two hours late (30 minutes for intermodal trains) per the ONE Plan
Dwell – Measures the time (in hours) cars spend in each yard (does not include cars moving through the yard on the same train)
Cars-On-Line – A count of all cars on the CSX network, including those at customer locations (does not include locomotives, cabooses, trailers, containers or maintenance equipment)
System Train Velocity – Average train speed between terminals in miles per hour (does not include locals, yard jobs, work trains or passenger trains)
Recrews – Number of relief crews called, a measure of line of road efficiency in the use of crews
Other Highlights
While operating activities generated higher cash, free cash flow, which includes dividend payments, declined $216 million to $145 million during 2007. The decline was primarily due to higher capital expenditures and dividends, along with lower insurance recoveries from claims related to Hurricane Katrina. See page 32 for further details on the changes in free cash flow during 2007.
Surface Transportation capital expenditures, which exclude The Greenbrier, were $1.7 billion in 2007. This level of investment highlights the Company’s commitment to maintain and improve its existing infrastructure and to position itself for long-term growth through expanding network and terminal capacity. The increase compared to prior year was largely due to refinancing a portion of its locomotive capacity by replacing 150 leased units with newly owned locomotives.
CSX also announced three significant financial events in 2007. First, CSX increased its quarterly dividend from $0.10 to $0.12 during the first quarter of 2007. It then increased the dividend again during the third quarter of 2007 to $0.15, which represented a 50% increase from the quarterly dividend level at fourth quarter 2006. Finally, CSX announced a total of $3 billion in share repurchase programs during 2007 and has completed about 70% of the repurchases. See Note 1, Nature of Operations and Significant Accounting Policies.
Long-term Transportation Demand
Transportation demand is based on increases in population and higher consumption levels, which in turn drive the production of goods domestically and abroad that must be transported from factories and ports to the markets where they will be consumed.
Recent census projections estimate that today’s population of 301 million people will grow to more than 330 million by 2020. Major metropolitan areas in the southeast, where CSX has a strong presence, are projected to grow at significantly faster rates. Even in slower-growing areas over the remainder of the Company’s territory, consumption levels are projected to increase.
Freight tonnage – domestic and international – is expected to increase nearly 50% by 2020, according to the American Association of State Highway and Transportation Officials (AASHTO), placing further strain on the transportation system of America and requiring reliable solutions for shippers worldwide.
Impact on CSX
The Company is well positioned to meet the nation’s growing transportation demand. For example, due to factors such as highway congestion, new regulations on hours of service and driver shortages in the trucking industry, trucking companies are beginning to partner with the Company to outsource their long-haul services and reduce their cost of shipping due to the superior cost structure of the railroads for long-haul shipments.
Additionally, the need for environmentally sensitive transportation solutions also favors CSX because railroads are three times more fuel efficient than highway transportation. A single train can carry the load of more than 280 trucks, reducing highway congestion and pollution while moving goods more efficiently.
Industry analysts predict that the pricing environment will reflect the increasing importance of railroads in serving America’s growing transportation needs and the cost of the infrastructure investments needed to maintain the safety and security of these networks and to expand them. This will drive revenue growth as volumes increase. Furthermore, while the market for transportation services remains competitive, tighter capacity and improved service levels through initiatives such as the ONE Plan and TSI are expected to sustain this favorable pricing environment, reflecting the overall value that CSX provides to its customers.
Forecasts
The Company bases its performance expectations on external forecasts of economic indicators such as gross domestic product, industrial production and overall import levels. Although certain markets will remain weak, such as those that are impacted by the housing and automotive sectors, the indicators that influence CSX’s businesses are expected to be favorable in 2008. Considering these and other factors, the Company believes that its business environment remains strong and will support consistent, continuous financial improvements for the next several years.
Considering the Company’s solid overall business environment, along with momentum in its underlying business performance, CSX expects that its financial performance in 2008 will be consistent with its long-term financial targets, which include compounded annual growth rates (“CAGR”) as shown below:
| Long-term Financial Targets | 2008-2010 Targets |
| · | Operating Income Growth | 10% - 12% CAGR |
| · | Earnings Per Share Growth | 15% - 17% CAGR |
| · | Operating Ratio | Mid- to low- 70s by 2010 |
| · | Free Cash Flow (before the payment of dividends) | $800 million to $1 billion in 2010 |
To reinforce its long-term vision, the Company’s Surface Transportation capital budget is expected to be nearly $5 billion between 2008 and 2010. These investments come at a time when the return on investment in the railroad industry is improving. Approximately 60% of the Company’s capital is targeted for infrastructure investment to improve network reliability and recoverability and to drive even better performance in safety. Another 20% of the Company’s capital will be invested in its locomotive and freight car fleets. The remaining 20% of CSX’s capital spending will further expand network terminal capacity, improve technology and position the Company for long-term growth.
Free Cash Flow
Free cash flow is considered a non-GAAP financial measure under SEC Regulation G, Disclosure of Non-GAAP Measures. Management believes, however, that free cash flow is important in evaluating the Company’s financial performance and measures an ability to generate cash without incurring additional external financing. Free cash flow should be considered in addition to, rather than a substitute for, cash provided by operating activities.
Free cash flow is calculated by using net cash from operations and adjusting for property additions, dividends and certain other investing activities such as insurance proceeds. Also, added to free cash flow is the Company’s 42% economic interest in Conrail’s free cash flow which is not consolidated in CSX amounts. Other deposits, which are included in cash provided by operating activities, are not included in the Company’s free cash flow because these deposits represent assets that were set aside for specific debt payments.
The following table reconciles cash provided by operating activities (GAAP measure) to free cash flow (non-GAAP measure).
| | Fiscal Years | |
| | 2007 | 2006 | | Change |
| (Dollars in Millions) |
| Net cash provided by operating activities | $ 2,184 | $ 2,058 | | $ 126 |
| Property additions | (1,773) | (1,639) | | (134) |
| Insurance proceeds within investing activities | 16 | 147 | | (131) |
| Other investing activities | (57) | 4 | | (61) |
| Dividends | (231) | (145) | | (86) |
| Other deposits and Conrail free cash flow | 6 | (64) | | 70 |
| Free Cash Flow (after payment of dividends) | $ 145 | $ 361 | | $ (216) |
Certain statements in this report and in other materials filed with the SEC, as well as information included in oral statements or other written statements made by the Company, are forward-looking statements within the meaning of the Securities Act of 1933 and the Securities Exchange Act of 1934. These forward-looking statements include, among others, statements regarding:
| | · | Expectations as to results of operations and operational improvements; |
| | · | Expectations as to the effect of claims, lawsuits, environmental costs, commitments, contingent liabilities, labor negotiations or agreements on the Company’s financial condition; |
| | · | Management’s plans, goals, strategies and objectives for future operations and other similar expressions concerning matters that are not historical facts, and management’s expectations as to future performance and operations and the time by which objectives will be achieved; and |
| | · | Future economic, industry or market conditions or performance, including, but not limited to, the discussion regarding Expectations on page 30. |
Forward-looking statements are typically identified by words or phrases such as “believe,” “expect,” “anticipate,” “project,” “estimate” and similar expressions. The Company cautions against placing undue reliance on forward-looking statements, which reflect its good faith beliefs with respect to future events and are based on information currently available to it as of the date the forward-looking statement is made. Forward-looking statements should not be read as a guarantee of future performance or results and will not necessarily be accurate indications of the timing when, or by which, such performance or results will be achieved.
Forward-looking statements are subject to a number of risks and uncertainties and actual performance or results could differ materially from those anticipated by these forward-looking statements. The Company undertakes no obligation to update or revise any forward-looking statement. If the Company does update any forward-looking statement, no inference should be drawn that the Company will make additional updates with respect to that statement or any other forward-looking statements. The following important factors, in addition to those discussed elsewhere, may cause actual results to differ materially from those contemplated by these forward-looking statements:
| | · | Legislative, regulatory or legal developments involving transportation, including rail or intermodal transportation, the environment, hazardous materials, taxation, including the outcome of tax claims and litigation, the potential enactment of initiatives to re-regulate the rail industry and the ultimate outcome of shipper and rate claims subject to adjudication; |
| | · | The outcome of litigation and claims, including, but not limited to, those related to fuel surcharge, environmental contamination, personal injuries and occupational illnesses; |
| | · | Material changes in domestic or international economic or business conditions, including those affecting the transportation industry such as access to capital markets, ability to revise debt arrangements as contemplated, customer demand, customer acceptance of price increases, effects of adverse economic conditions affecting shippers and adverse economic conditions in the industries and geographic areas that consume and produce freight; |
| | · | Changes in fuel prices, surcharges for fuel and the availability of fuel; |
| | · | The impact of increased passenger activities in capacity-constrained areas or regulatory changes affecting when CSXT can transport freight or service routes; |
| | · | Natural events such as severe weather conditions, including floods, fire, hurricanes and earthquakes, a pandemic crisis affecting the health of the Company’s employees, its shippers or the consumers of goods, or other unforeseen disruptions of the Company’s operations, systems, property or equipment; |
| | · | An unintentional failure to comply with applicable laws or regulations; |
| | · | The inherent risks associated with safety and security, including the availability and cost of insurance, the availability and vulnerability of information technology, adverse economic or operational effects from actual or threatened war or terrorist activities and any governmental response; |
| | · | Labor costs and labor difficulties, including stoppages affecting either the Company’s operations or the customers’ ability to deliver goods to the Company for shipment; |
| | · | Competition from other modes of freight transportation, such as trucking and competition and consolidation within the transportation industry generally; |
| | · | The Company’s success in implementing its strategic plans and operational objectives and improving Surface Transportation operating efficiency; and |
| | · | Changes in operating conditions and costs or commodity concentrations. |
Other important assumptions and factors that could cause actual results to differ materially from those in the forward-looking statements are specified elsewhere in this report and in CSX’s other SEC reports, accessible on the SEC’s website at www.sec.gov and the Company’s website at www.csx.com.
2007 vs. 2006 Consolidated Results of Operations
| | CONSOLIDATED(a) | |
| | Includes Surface Transportation and Other Operating Income | |
| | |
| (Dollars in Millions) | 2007 | | 2006 | | $ Change | | % Change | |
| Operating Revenue | $ 10,030 | | $ 9,566 | | $ 464 | | 5 | % |
| Operating Expense | 7,774 | | 7,428 | | 346 | | 5 | |
| | Operating Income | 2,256 | | 2,138 | | 118 | | 6 | |
| | |
| Other Income | 93 | | 95 | | (2) | | (2) | |
| Interest Expense | (417) | | (392) | | (25) | | 6 | |
| Income Tax Expense | (706) | | (531) | | (175) | | 33 | |
| | Earnings from Continuing Operations | 1,226 | | 1,310 | | (84) | | (6) | |
| | |
| Discontinued Operations | 110 | | - | | 110 | | NM | |
| | Net Earnings | $ 1,336 | | $ 1,310 | | $ 26 | | 2 | % |
| | |
| Earnings Per Diluted Share | |
| From Continuing Operations | $ 2 .74 | | $ 2.82 | | $ (0.08) | | (3) | % |
| Discontinued Operations | 0.25 | | - | | 0.25 | | NM | |
| Net Earnings | $ 2.99 | | $ 2.82 | | $ 0.17 | | 6 | % |
Prior periods have been reclassified to conform to the current presentation.
NM - - not meaningful
(a) Other operating income was $5 million and $12 million for 2007 and 2006, respectively.
Operating Revenue
Operating revenue increased $464 million to over $10 billion in 2007 due to continued pricing efforts and service improvements. These gains were partially offset by lower volume due to weakness in housing construction, domestic automobile production and related markets.
Operating Income
Operating income increased $118 million to $2.3 billion in 2007. Improvements in revenue and productivity from improved operations were partially offset by lower gains on insurance recoveries and increased fuel costs.
Other Income
Other income of $93 million in 2007 was relatively flat compared to the prior year.
Interest Expense
Interest expense increased $25 million to $417 million in 2007 primarily due to higher average debt balances.
Income Tax Expense
Income tax expense increased $175 million to $706 million. This change is primarily due to higher earnings in 2007 and a prior year income tax benefit of $151 million related to the resolution of certain tax matters that were not repeated.
Net Earnings
Consolidated net earnings increased $26 million and totaled $1.3 billion, and earnings per diluted share increased $0.17 to $2.99. The principal elements of these increases are:
| | · | Operating income increased $118 million driven by strong Surface Transportation results. These strong results were more than offset by $151 million of prior year income tax benefits that were not repeated. The net of these and other items decreased earnings from continuing operations by $84 million or $.08 per diluted share. |
| | · | The $110 million or $.25 per diluted share gain in discontinued operations on the Company’s consolidated income statement in 2007 related to the resolution of certain tax matters associated with previously discontinued operations. |
2006 vs. 2005 Consolidated Results of Operations
| | CONSOLIDATED(a) |
| | Includes Surface Transportation and Other Operating Income | |
| | |
| (Dollars in Millions) | 2006 | | 2005 | | $ Change | | % Change | |
| Operating Revenue | $ 9,566 | | $ 8,618 | | $ 948 | | 11 | % |
| Operating Expense | 7,428 | | 7,068 | | 360 | | 5 | |
| | Operating Income | 2,138 | | 1,550 | | 588 | | 38 | |
| | |
| Other Income | 95 | | 101 | | (6) | | (6) | |
| Debt Repurchase | - | | (192) | | 192 | | (100) | |
| Interest Expense | (392) | | (423) | | 31 | | (7) | |
| Income Tax Expense | (531) | | (316) | | (215) | | 68 | |
| | Earnings from Continuing Operations | 1,310 | | 720 | | 590 | | 82 | |
| | |
| Discontinued Operations - Net of Tax | - | | 425 | | (425) | | (100) | |
| | Net Earnings | $ 1,310 | | $ 1,145 | | $ 165 | | 14 | % |
| | |
| Earnings Per Diluted Share | |
| From Continuing Operations | $ 2.82 | | $ 1.59 | | $ 1.23 | | 77 | % |
| Discontinued Operations | - | | 0.93 | | (0.93) | | (100) | |
| Net Earnings | $ 2.82 | | $ 2.52 | | $ 0.30 | | 12 | % |
Prior periods have been reclassified to conform to the current presentation.
| (a) | Other operating income was $12 million and $1 million in 2006 and 2005, respectively. |
Operating Revenue
Operating revenue increased $948 million in 2006 to $9.6 billion, compared to $8.6 billion for the prior year. The primary components of the revenue gain were continued yield management and the Company’s fuel surcharge program, which drove revenue per unit across all major markets.
Operating Income
Operating income increased $588 million to $2.1 billion in 2006, which was driven by increased operating revenues. These revenue gains and gains on insurance proceeds from Hurricane Katrina were partially offset by increases in fuel expense caused by higher fuel prices and lower hedge benefits.
Other Income
Other income decreased $6 million to $95 million in 2006. This change was driven primarily by lower real estate sales, which was partially offset by an after-tax non-cash gain on additional Conrail property value received in connection with the 2004 Conrail spin-off transaction.
Interest Expense
Interest expense decreased $31 million to $392 million in 2006 compared to the prior year. There was lower interest expense from lower average debt balances for 2006 (due to a $1.0 billion debt repurchase in mid-2005). However, this savings was partially offset by higher variable interest rates.
Income Tax Expense
Income tax expense increased $215 million to $531 million in 2006 as a result of higher earnings. This increase was partially offset by the net impact of favorable resolutions of certain tax matters in 2006 that were higher than benefits in 2005.
Net Earnings
Net earnings for 2006 increased $165 million to $1.3 billion, with earnings per share up $.30 to $2.82 per diluted share from the prior year. This increase was primarily due to the following factors:
| | · | Driven by Surface Transportation results, earnings from continuing operations were up $590 million, or $1.23 per diluted share; |
| | · | Offsetting this increase was income from discontinued operations, net of tax, of $425 million, or $.93 per diluted share, as a result of the sale of CSX’s International Terminals business in 2005. |
2007 vs. 2006 Surface Transportation Results of Operations
SURFACE TRANSPORTATION DETAIL (Unaudited) |
| (Dollars in Millions) |
| Fiscal Year |
| |
| | | | | | | | Surface | |
| | | | | Rail | Intermodal | Transportation | |
| | | | | 2007 | 2006 | 2007 | 2006 | 2007 | 2006 | $ Change |
| Revenue | $ 8,674 | $ 8,154 | $ 1,356 | $ 1,412 | $ 10,030 | $ 9,566 | $ 464 |
| Operating Expense: | | | | | | | |
| | Labor and Fringe | 2,897 | 2,840 | 81 | 82 | 2,978 | 2,922 | (56) |
| | Materials, Supplies and Other | 1,857 | 1,772 | 183 | 192 | 2,040 | 1,964 | (76) |
| | Fuel | 1,210 | 1,112 | - | - | 1,210 | 1,112 | (98) |
| | Depreciation | 848 | 818 | 34 | 38 | 882 | 856 | (26) |
| | Equipment and Other Rents | 346 | 382 | 110 | 130 | 456 | 512 | 56 |
| | Inland Transportation | (448) | (462) | 688 | 704 | 240 | 242 | 2 |
| | Gain on Insurance Recoveries | (27) | (166) | - | (2) | (27) | (168) | (141) |
| | | Total Expense | 6,683 | 6,296 | 1,096 | 1,144 | 7,779 | 7,440 | (339) |
| | Operating Income | $ 1,991 | $ 1,858 | $ 260 | $ 268 | $ 2,251 | $ 2,126 | $ 125 |
| |
| | Operating Ratio | 77.0% | 77.2% | 80.8% | 81.0% | 77.6% | 77.8% | |
| | Total Assets | $ 24,179 | $ 24,077 | $ 283 | $ 276 | | | |
_____________________________________________________________________________________________________________________________________________
|
| Volume (Thousands); Revenue (Dollars in Millions); Revenue Per Unit (Dollars) |
| Fiscal Year |
| |
| | | Volume | | Revenue | | Revenue Per Unit |
| | | 2007 | 2006 | % Change | | 2007 | 2006 | % Change | | 2007 | 2006 | % Change |
| | Chemicals | 522 | 528 | (1) | % | | $ 1,313 | $ 1,210 | 9 | % | $ 2,515 | $ 2,292 | 10 | % |
| | Emerging Markets | 491 | 524 | (6) | | | 605 | 580 | 4 | | | 1,232 | 1,107 | 11 | |
| | Forest Products | 352 | 404 | (13) | | | 722 | 773 | (7) | | | 2,051 | 1,913 | 7 | |
| | Agricultural Products | 410 | 397 | 3 | | | 786 | 681 | 15 | | | 1,917 | 1,715 | 12 | |
| | Metals | 355 | 364 | (2) | | | 702 | 673 | 4 | | | 1,977 | 1,849 | 7 | |
| | Phosphates and Fertilizers | 362 | 362 | - | | | 421 | 354 | 19 | | | 1,163 | 978 | 19 | |
| | Food and Consumer | 212 | 245 | (13) | | | 441 | 477 | (8) | | | 2,080 | 1,947 | 7 | |
| Total Merchandise | 2,704 | 2,824 | (4) | | | 4,990 | 4,748 | 5 | | | 1,845 | 1,681 | 10 | |
| | | | | | | | | | | | | | | | |
| | Coal | 1,771 | 1,798 | (2) | | | 2,483 | 2,259 | 10 | | | 1,402 | 1,256 | 12 | |
| | Coke and Iron Ore | 91 | 94 | (3) | | | 120 | 119 | 1 | | | 1,319 | 1,266 | 4 | |
| Total Coal | 1,862 | 1,892 | (2) | | | 2,603 | 2,378 | 9 | | | 1,398 | 1,257 | 11 | |
| | | | | | | | | | | | | | | | |
| Automotive | 439 | 463 | (5) | | | 839 | 847 | (1) | | | 1,911 | 1,829 | 4 | |
| | | | | | | | | | | | | | | | |
| Other | - | - | - | | | 242 | 181 | 34 | | | - | - | - | |
| Total Rail | 5,005 | 5,179 | (3) | | | 8,674 | 8,154 | 6 | | | 1,733 | 1,574 | 10 | |
| | | | | | | | | | | | | | | | |
| | International | 1,132 | 1,281 | (12) | | | 525 | 580 | (9) | | | 464 | 453 | 2 | |
| | Domestic | 979 | 898 | 9 | | | 807 | 786 | 3 | | | 824 | 875 | (6) | |
| | Other | - | - | - | | | 24 | 46 | (48) | | | - | - | - | |
| Total Intermodal | 2,111 | 2,179 | (3) | | | 1,356 | 1,412 | (4) | | | 642 | 648 | (1) | |
| | | | | | | | | | | | | | | | |
| Total Surface Transportation | 7,116 | 7,358 | (3) | % | | $ 10,030 | $ 9,566 | 5 | % | | $ 1,409 | $ 1,300 | 8 | % |
For both tables, prior periods have been reclassified to conform to the current presentation.
2007 vs. 2006 Rail Results of Operations
Rail Operating Revenue
Rail revenue is categorized by three main lines of business: merchandise, coal and automotive. Revenue increased $520 million, or 6%, to $8.7 billion in 2007 as compared to prior year. CSXT was able to achieve continued pricing gains predominantly due to the overall cost and service advantages that the Company’s rail based solutions provide to customers versus other modes of transportation. These pricing gains more than offset volume weakness in housing construction, domestic automobile production and related markets.
Merchandise
Chemicals – Revenue and revenue per unit improved due to a continued favorable pricing environment. Overall volume declined slightly driven by reduced chlorine shipments and weakness in propane demand due to a milder winter in 2007.
Emerging Markets – Revenue and revenue per unit grew due to continued yield management efforts. Volume was down as a result of declines in aggregate shipments, such as crushed stone, sand and gravel, caused by a continued weakness in residential construction.
Forest Products – Revenue and volume declined as shipments of building products and paper slowed due to the decline in residential housing starts and electronic media substitution.
Agriculture Products – Strong domestic demand in feed ingredients and soybean shipments supported growth in volume and revenue. Ethanol volumes also increased as a result of expanded use in the Northeast. Revenue per unit grew as a result of continued focus on yield management.
Metals – Revenue and revenue per unit increased due to continued pricing actions. Lower demand for steel due to weakness in housing construction and domestic automobile production resulted in volume declines.
Phosphates and Fertilizers – Volume was flat as higher domestic demand was offset by a decrease in export shipments. Favorable mix driven by these volume changes coupled with price increases resulted in significantly improved revenue and revenue per unit.
Food and Consumer – Revenue and volume declines were driven by decreased demand for building products, appliances and roofing granules, which are used to make shingles.
Coal
Favorable pricing positively influenced revenue and revenue per unit. Overall tonnage was flat even though carloads slightly declined due to the use of higher capacity cars allowing the movement of more tons with fewer cars. Strength in the export market was offset by weakness in utility shipments as stockpiles remain at record high levels.
Automotive
Volume declined due to a reduction in light vehicle production, several plant closures, and lower vehicle sales driven by the slowing economy and tight credit environment. Consistent with the overall automotive market, volumes continued to shift to foreign brands produced domestically.
Other Rail Revenue
The change is primarily due to increased shipments by the Company’s regional railroads and more transloading activities associated with ethanol shipments.
Rail Operating Expense
Total rail operating expenses for 2007 increased $387 million to $6.7 billion compared to the prior year. The description of what is included in each category as well as significant year over year changes is described below.
Labor and Fringe expenses include employee compensation and benefit programs. These expenses are primarily affected by inflation, headcount, wage rates, incentives earned, healthcare plan costs, and pension and other post-retirement plan expenses. These expenses increased $57 million primarily due to wage and benefit inflation, which was partially offset by improved productivity and reduced staffing levels.
Materials, Supplies and Other expenses consist primarily of materials and contracted services to maintain infrastructure and equipment and for terminal services at intermodal and automotive facilities. This category also includes costs related to personal injury claims, environmental remediation, train accidents, utilities, non-locomotive fuel, property and sales taxes and professional services. Overall, materials, supplies and other expenses increased by $85 million in 2007 primarily due to inflation, higher train accident related costs and higher environmental costs. These costs were partially offset by $99 million of favorable personal injury reserve adjustments during the year, which were based on management’s review of the actuarial analyses performed by an independent actuarial firm. This was due to a trend of significant decreases in the number and severity of work-related injuries for CSXT employees since 2003.
Depreciation expense primarily relates to recognizing the cost of a capital asset, such as locomotives, railcars and track structure, over its useful life. This expense is impacted primarily by the capital expenditures made each year. This expense increased $30 million primarily due to a larger asset base as a result of higher capital spending partially offset by lower depreciation rates resulting from periodic asset life studies.
Fuel expense includes locomotive diesel fuel. This expense is driven by the market price and locomotive consumption of diesel fuel offset by the effects of any hedging activities. This expense increased $98 million primarily due to higher fuel prices and prior year hedge benefits that were not repeated during 2007 due to the expiration of the fuel hedge program.
Equipment and Other Rents primarily includes rent paid for freight cars owned by other railroads or private companies, net of rents received by CSXT for use of CSXT equipment. This category of expenses also includes lease expenses primarily for locomotives, railcars, containers and trailers, office and other rentals. These expenses decreased $36 million due mainly to lower volume and fewer locomotive leases.
Inland Transportation expense included in the rail segment is for amounts paid to CSXT from Intermodal for shipments on CSXT’s network. These intercompany charges are eliminated in consolidated results.
Gain on Insurance Recoveries includes gains on insurance recoveries related to Hurricane Katrina. While gains were recognized in both years, the $139 million decrease for 2007 was due to higher cash receipts for lost profits and replacement value of property compared to the value of the property that was damaged in 2006 versus 2007.
2007 vs. 2006 Intermodal Results of Operations
Intermodal operating income declined 3% or $8 million versus last year on 4% lower revenue, partially offset by volume related cost savings. Revenue and volume decreases reflect losses of several International customers, the slowing of Asian imports throughout the year and mix impact related to growth in new short-haul domestic traffic. Other revenue declined $22 million from the termination of an agreement relating to the storage of containers as well as lower general business levels. Revenue per unit declined slightly with yield gains in the international market being offset by mix changes related to the new short-haul domestic traffic.
Despite rising fuel costs, Intermodal operating expense declined $48 million or 4% driven by lower car hire expense related to volume and improved operational efficiency. Additionally, depreciation decreased based on the results of a periodic review of asset useful lives.
2006 vs. 2005 Surface Transportation Results of Operations
SURFACE TRANSPORTATION DETAIL (Unaudited) |
| (Dollars in Millions) |
| Fiscal Year |
| |
| | | | | | | | Surface | |
| | | | | Rail | Intermodal | Transportation | |
| | | | | 2006 | 2005 | 2006 | 2005 | 2006 | 2005 | $ Change |
| Revenue | $ 8,154 | $ 7,256 | $ 1,412 | $ 1,362 | $ 9,566 | $ 8,618 | $ 948 |
| Operating Expense: | | | | | | | |
| | Labor and Fringe | 2,840 | 2,777 | 82 | 79 | 2,922 | 2,856 | (66) |
| | Materials, Supplies and Other | 1,772 | 1,649 | 192 | 200 | 1,964 | 1,849 | (115) |
| | Fuel | 1,112 | 783 | - | - | 1,112 | 783 | (329) |
| | Depreciation | 818 | 779 | 38 | 39 | 856 | 818 | (38) |
| | Equipment and Other Rents | 382 | 400 | 130 | 133 | 512 | 533 | 21 |
| | Inland Transportation | (462) | (433) | 704 | 663 | 242 | 230 | (12) |
| | Gain on Insurance Recoveries | (166) | - | (2) | - | (168) | - | 168 |
| | | Total Expense | 6,296 | 5,955 | 1,144 | 1,114 | 7,440 | 7,069 | (371) |
| | Operating Income | $ 1,858 | $ 1,301 | $ 268 | $ 248 | $ 2,126 | $ 1,549 | $ 577 |
| |
| | Operating Ratio | 77.2% | 82.1% | 81.0% | 81.8% | 77.8% | 82.0% | |
| | Total Assets | $ 24,077 | $ 23,182 | $ 276 | $ 305 | | | |
_____________________________________________________________________________________________________________________________________________
SURFACE TRANSPORTATION VOLUME AND REVENUE (Unaudited) |
| Volume (Thousands); Revenue (Dollars in Millions); Revenue Per Unit (Dollars) |
| Fiscal Year |
| |
| | | Volume | | Revenue | | Revenue Per Unit |
| | | 2006 | 2005 | % Change | | 2006 | 2005 | % Change | | 2006 | 2005 | % Change |
| | Chemicals | 528 | 533 | (1) | % | | $ 1,210 | $ 1,089 | 11 | % | $ 2,292 | $ 2,043 | 12 | % |
| | Emerging Markets | 524 | 505 | 4 | | | 580 | 513 | 13 | | | 1,107 | 1,016 | 9 | |
| | Forest Products | 404 | 439 | (8) | | | 773 | 717 | 8 | | | 1,913 | 1,633 | 17 | |
| | Agricultural Products | 397 | 357 | 11 | | | 681 | 550 | 24 | | | 1,715 | 1,541 | 11 | |
| | Metals | 364 | 361 | 1 | | | 673 | 570 | 18 | | | 1,849 | 1,579 | 17 | |
| | Phosphates and Fertilizers | 362 | 444 | (18) | | | 354 | 351 | 1 | | | 978 | 791 | 24 | |
| | Food and Consumer | 245 | 249 | (2) | | | 477 | 438 | 9 | | | 1,947 | 1,759 | 11 | |
| Total Merchandise | 2,824 | 2,888 | (2) | | | 4,748 | 4,228 | 12 | | | 1,681 | 1,464 | 15 | |
| | | | | | | | | | | | | | | | |
| | Coal | 1,798 | 1,726 | 4 | | | 2,259 | 1,992 | 13 | | | 1,256 | 1,154 | 9 | |
| | Coke and Iron Ore | 94 | 83 | 13 | | | 119 | 88 | 35 | | | 1,266 | 1,060 | 19 | |
| Total Coal | 1,892 | 1,809 | 5 | | | 2,378 | 2,080 | 14 | | | 1,257 | 1,150 | 9 | |
| | | | | | | | | | | | | | | | |
| Automotive | 463 | 488 | (5) | | | 847 | 844 | - | | | 1,829 | 1,730 | 6 | |
| | | | | | | | | | | | | | | | |
| Other | - | - | - | | | 181 | 104 | 74 | | | - | - | - | |
| Total Rail | 5,179 | 5,185 | - | | | 8,154 | 7,256 | 12 | | | 1,574 | 1,399 | 13 | |
| | | | | | | | | | | | | | | | |
| | International | 1,281 | 1,274 | 1 | | | 580 | 545 | 6 | | | 453 | 428 | 6 | |
| | Domestic | 898 | 891 | 1 | | | 786 | 766 | 3 | | | 875 | 860 | 2 | |
| | Other | - | - | - | | | 46 | 51 | (10) | | | - | - | - | |
| Total Intermodal | 2,179 | 2,165 | 1 | | | 1,412 | 1,362 | 4 | | | 648 | 629 | 3 | |
| | | | | | | | | | | | | | | | |
| Total Surface Transportation | 7,358 | 7,350 | - | % | | $ 9,566 | $ 8,618 | 11 | % | | $ 1,300 | $ 1,173 | 11 | % |
For both tables, prior periods have been reclassified to conform to the current presentation.
2006 vs. 2005 Rail Results of Operations
Rail Operating Revenue
CSXT categorizes rail revenue in three main lines of business: merchandise, coal and automotive. Revenue for CSXT increased $898 million, or 12%, to $8.2 billion in 2006 from a year ago. Continued yield management and fuel surcharge were the primary drivers of revenue per unit gains.
Merchandise
Chemicals – Revenue and revenue per unit improved by capitalizing on a continued strong pricing environment. Overall volume was down slightly because high raw material costs continued to negatively affect the U.S. chemical industry’s competitiveness and in turn, CSXT volumes.
Emerging Markets – Growth was driven by increased shipments of municipal waste, military, and aggregate products (which include rocks and sand). Revenue per unit also improved due to strong pricing actions.
Forest Products – Shipment of building products and printing paper slowed due to the decline in residential housing starts and electronic media conversion. However, revenue and revenue per unit improved due to a favorable pricing environment.
Agriculture Products – Strong domestic demand in feed grain, soybean, ethanol, and export shipments supported volume and revenue per unit. In addition, strong export demand for grain and increased shipments of beans helped volume growth.
Metals – Revenue and revenue per unit increased due to continued pricing gains and fuel surcharge coverage. Volume increased slightly driven by strong steel demand in the energy and non-residential construction end-markets. These gains were partially offset by lower demand for steel in the automotive sector.
Phosphates and Fertilizers – Volume declined from lower export shipments due to increased international phosphate production which caused several domestic phosphate plants to close. Favorable mix coupled with price increases resulted in significantly improved revenue per unit.
Food and Consumer – Volume growth in alcoholic beverages, canned goods, and rice and beans was offset by softness in building products, perishables, and the appliance markets. Strong pricing actions, and a focus on longer, more profitable shipments increased revenue and revenue per unit.
Coal
Revenue and volume improvements were due to increased shipments of utility and export coal. Utility companies built up their inventories which was a major contributor to CSX’s volume growth. Revenue per unit increased due to the continued favorable pricing environment and increased fuel surcharge coverage.
Automotive
Volume declined due to a reduction in North American light vehicle production. Consistent with the overall automotive market, CSXT’s volumes continued to shift from the Big 3 to foreign brands produced domestically. Revenue per unit was favorable due to price increases and fuel surcharge.
Rail Operating Expense
Total rail operating expenses for 2006 increased $341 million, or 6%, to $6.3 billion compared to the prior year. The description of what is included in each category as well as significant year over year changes is described below.
Labor and Fringe increased $63 million primarily due to wage and benefit inflation and increased staffing in rail operations.
Materials, Supplies and Other expenses increased by $113 million in 2006 primarily due to materials inflation, along with prior year casualty favorable adjustments and supplier reimbursements that were not repeated. These costs were partially offset by productivity gains from improved operations, such as efficient use of locomotives.
Depreciation expense increased $39 million due to a larger asset base related to higher capital spending.
Fuel expense increased $329 million primarily due to reduced hedge benefit from the expiration of the fuel hedge program as well as higher fuel prices.
Equipment and Other Rents expense decreased $18 million due mainly to improvement in operational fluidity, which drove improvements in asset utilization.
Gain on Insurance Recoveries was $166 million for 2006, which represented cash received for lost profits and higher replacement value of property compared to the value of the property that was damaged, after consideration of the Company’s insurance deductible expensed in 2005.
2006 vs. 2005 Intermodal Results of Operations
Intermodal operating income increased 8% or $20 million versus last year driven by revenue gains of $50 million along with expense containment. The increase in revenue and revenue per unit was driven by the continued yield management emphasis which was partially offset by mix of traffic. Volume increased slightly due to continued growth of imported consumer goods from Asia as well as the strength in the truckload market offset by weaker demand in services sold to transportation brokers (known as wholesale markets).
Intermodal operating expense increased $30 million primarily driven by an increase in fuel costs that are reflected in inland transportation expense. Fuel costs were higher due to rising market prices. Partially offsetting the increase in fuel were efficiency gains related to equipment utilization.
Liquidity is a company’s ability to generate adequate amounts of cash to meet both current and future needs for obligations as they mature and to provide for planned operational growth. In order to have a complete picture of a company’s liquidity, its balance sheet, sources and uses of cash flow and external factors should be reviewed.
Material Changes in the Consolidated Balance Sheets
CSX’s balance sheet reflects its strong capital base and the impact of CSX’s balanced approach in deploying its capital for the benefit of its shareholders, which includes reinvestment in the Company’s existing infrastructure, investments in the future, share repurchases and dividends.
Long-term debt increased $1.1 billion to $6.5 billion due to debt issuances in 2007 of $2.4 billion partially offset by the conversion of a portion of convertible debt into CSX common stock and the reclassification of debt from long-term to current. See the Schedule of Contractual Obligations and Commercial Commitments on page 50 and Note 9, Debt and Credit Agreements, for additional details.
Other capital decreased $1.4 billion to $37 million as a result of significant share repurchase activity partially offset by stock option exercises and the conversion of a portion of convertible debt into CSX common stock. For additional information on the Company’s share repurchase activity, see Note 1, Nature of Operations and Significant Accounting Policies.
Sources and Uses of Cash
CSX has multiple sources of cash. First, the Company generates cash from operations. In 2007, CSX generated $2.2 billion of cash from operating activities, which represented a $126 million increase from the prior year. Second, CSX has numerous financing sources including access to the capital markets and a $1.25 billion five-year unsecured revolving credit facility that expires in May 2012. This facility can be increased by an additional $500 million to $1.75 billion with the approval of the lending banks. See Note 9, Debt and Credit Agreements for more information.
CSX also has an effective shelf registration statement on file with the SEC that is unlimited as to amount and may be used, subject to market conditions and CSX Board authorization, to issue debt or equity securities at CSX’s discretion. While CSX seeks to give itself flexibility with respect to cash requirements, there can be no assurance that market conditions would permit CSX to sell such debt securities on acceptable terms at any given time, or at all.
Among other things, CSX uses cash for significant annual reinvestment in infrastructure and equipment, share repurchases and scheduled payments of debt and leases with manageable near-term maturities. The Company’s cash requirements also include dividends to shareholders.
During 2007, net cash used by investing activities was $1.7 billion. This use of funds was predominately driven by property additions and capital expansion projects made by the Company. Net cash used in financing activities was $584 million due to over $2 billion of cash used for share repurchases during 2007, largely offset by a net increase in long-term debt issued versus long-term debt repaid.
Dividend payments are another use of cash. The Company paid dividends of $231 million in 2007, which was $86 million more than prior year. The increase in 2007 was primarily due to the Company increasing quarterly dividends to $0.15 per share.
Working Capital
Working capital can be considered a measure of a company’s ability to meet its short-term needs. CSX had a working capital deficit at December 2007 of $180 million compared to a surplus of $150 million last year driven by lower cash and higher current debt balances in 2007. The larger current debt balance includes a reclassification of outstanding convertible debt with a face value of $174 million from long-term to current during 2007. This reflects bondholders’ rights under the convertible debt to require CSX to purchase the debentures in October 2008 in lieu of the later maturity date.
A working capital deficit is not unusual for CSX or other companies in the industry and does not indicate a lack of liquidity. The Company continues to maintain adequate current assets to satisfy current liabilities and maturing obligations when they come due. CSX has sufficient financial capacity, including the revolving line of credit and shelf registration, to manage its day-to-day cash requirements and any anticipated obligations.
Credit Ratings
Credit ratings reflect an independent agency’s judgment on the likelihood that a borrower will repay a debt obligation at maturity. The ratings reflect many considerations, such as the nature of the borrower’s industry and its competitive position, the size of the company, its liquidity and access to capital and the sensitivity of a company’s cash flows to changes in the economy. The two largest rating agencies, Standard & Poor’s (“S&P”) and Moody’s Investors Service (“Moody’s”), use alphanumeric codes to designate their ratings. The highest quality rating for long-term credit obligations is AAA+ and Aaa1 for S&P and Moody’s, respectively.
Long-term ratings of BBB- and Baa3 or better by S&P and Moody’s, respectively, reflect ratings on debt obligations that fall within a band of credit quality considered to be “investment grade.” Currently, the long-term ratings for CSX’s obligations, along with the other large U.S. Class 1 freight railroads, fall within the investment grade band of credit quality.
In 2007, S&P and Moody’s both lowered their ratings of CSX's long-term unsecured debt obligations from BBB and Baa2, respectively, to BBB- and Baa3, respectively. This was due to the Company’s announcement in second quarter 2007 of a plan to repurchase an additional $1 billion of CSX stock in addition to the $2 billion repurchase plan announced earlier in 2007. Both of these agencies indicate their outlook is “Stable” and these ratings continue to be investment grade. CSX maintained these credit ratings through December 2007 and does not expect that this reduction in credit ratings will materially increase its borrowing costs or materially affect its liquidity. If CSX's credit ratings were to decline to lower levels, the Company could experience more significant increases in its interest cost for new debt. In addition, the market’s demand, and thus the Company’s ability to readily issue new debt, could become further influenced by the economic and credit market environment.
Schedule of Contractual Obligations and Commercial Commitments
The following tables set forth maturities of the Company's contractual obligations and other commitments:
| Type of Obligation | 2008 | 2009 | 2010 | 2011 | 2012 | Thereafter | | Total |
| (Dollars in Millions) (Unaudited) | | | | | | | | |
| |
Contractual Obligations: | | | | | | | | |
| Long-term Debt (See Note 9) | $ 785 | $ 305 | $ 92 | $ 591 | $ 493 | $ 4,989 | | $ 7,255 |
| Operating Leases - Net (See Note 7) | 98 | 90 | 79 | 69 | 51 | 181 | | 568 |
Agreements with Conrail (a) | 14 | 13 | 9 | 4 | 3 | 9 | | 52 |
| Purchase Obligations (See Note 7) | 621 | 549 | 326 | 285 | 288 | 4,773 | | 6,842 |
| |
| Total Contractual Obligations | $ 1,518 | $ 957 | $ 506 | $ 949 | $ 835 | $ 9,952 | | $ 14,717 |
| |
| |
| Other Commitments: | | | | | | | | |
| Guarantees (See Note 7) | 15 | 16 | 16 | 13 | 12 | - | | 72 |
| Other | 53 | 2 | - | - | - | 41 | | 96 |
| |
| Total Other Commitments | $ 68 | $ 18 | $ 16 | $ 13 | $ 12 | $ 41 | | $ 168 |
| (a) Represents minimum future lease payments for freight cars and locomotives and is included in total lease commitments disclosed in Note 7, Commitments and Contingencies. |
For detailed information about the Company’s guarantees, operating leases and purchase obligations, see Note 7, Commitments and Contingencies.
There are no off-balance sheet arrangements that are reasonably likely to have a material effect on the Company’s results of operations, financial condition and liquidity.
The preparation of financial statements in conformity with accounting principles generally accepted in the United States requires that management make estimates in reporting the amounts of certain assets and liabilities, the disclosure of contingent assets and liabilities at the date of the financial statements and certain revenues and expenses during the reporting period. Actual results may differ from those estimates. These estimates and assumptions are discussed with the Audit Committee of the Board of Directors on a regular basis. Consistent with the prior year, significant estimates using management judgment are made for the following areas:
| | · | casualty, environmental and legal reserves; |
| | · | pension and post-retirement medical plan accounting; |
| | · | depreciation policies for assets under the group-life method; and |
Casualty, Environmental and Legal Reserves
Casualty
Casualty reserves represent accruals for personal injury and occupational injury claims. Currently, no individual claim is expected to exceed the Company’s self-insured retention amount. To the extent the value of an individual claim exceeds the self-insured retention amount, CSX would present the liability on a gross basis with a corresponding receivable for insurance recoveries. Personal injury and occupational claims are presented on a gross basis and in accordance with SFAS 5, Accounting for Contingencies (“SFAS 5”). These reserves fluctuate with estimates provided by independent third parties reviewed by management, and are offset by the timing of payments. Most of the claims were related to CSXT unless otherwise noted.
Defense and processing costs, which historically have been insignificant and are anticipated to be insignificant in the future, are not included in the recorded liabilities. The Company is presently self-insured for personal injury and occupational-related claims.
Personal Injury
Personal injury reserves represent liabilities for employee work-related and third-party injuries. Work-related injuries for CSXT employees are primarily subject to the Federal Employers’ Liability Act (“FELA”). In addition to FELA liabilities, employees of other CSX subsidiaries are covered by various state workers’ compensation laws, the Federal Longshore and Harbor Worker’s Compensation Program or the Maritime Jones Act.
CSXT retains an independent actuarial firm to assist management in assessing the value of personal injury claims and cases. An analysis is performed by the independent actuarial firm semi-annually and is reviewed by management. The methodology used by the actuary includes a development factor to reflect growth or reduction in the value of these personal injury claims. It is based largely on CSXT’s historical claims and settlement experience. Actual results may vary from estimates due to the type and severity of the injury, costs of medical treatments and uncertainties in litigation.
Based on management’s review of the actuarial analyses performed by an independent actuarial firm, the Company reduced personal injury reserves by $99 million during 2007. This reduction is due to a trend of significant decreases in the number and severity of work-related injuries for CSXT employees since 2003. The analyses further indicated an absence of large catastrophic claims since 2003, which also was determined to be a trend. These reductions were included in materials, supplies and other in the consolidated income statements.
Occupational
Occupational claims arise from allegations of exposures to certain materials in the workplace, such as asbestos, solvents (which include soaps and chemicals) and diesel fuels or allegations of chronic physical injuries resulting from work conditions, such as repetitive stress injuries, carpal tunnel syndrome and hearing loss.
Asbestos
The Company is party to a number of occupational claims by employees alleging exposure to asbestos in the workplace. The heaviest possible exposure for employees was due to work conducted in and around steam locomotive engines that were largely phased out beginning around the 1950s. However, other types of exposures, including exposure from locomotive component parts and building materials, continued until it was substantially eliminated by 1985. Additionally, the Company has retained liability for asbestos claims filed against the previously owned international container shipping business.
The Company retains a third party specialist with extensive experience in performing asbestos and other occupational studies to assist management in assessing the value of the Company’s claims and cases. The analysis is performed by the specialist semi-annually and is reviewed by management. The objective of the analysis is to determine the number of estimated incurred but not reported (“IBNR”) claims and the estimated average cost per claim to be received over the next seven years. Seven years was determined by management to be the time period in which probable claim filings and claim values could be estimated with more certainty.
The Company, with the assistance of the third party specialist, determines its potentially exposed population and it is then able to derive the estimated number of IBNR claims. The estimated average cost per claim is then determined utilizing recent actual average cost per claim data and national industry data. Key elements of the assessment include the following:
| | · | An estimate is computed using a ratio of Company employee data to national employment for select years during the period 1938-2001. The Company uses railroad industry historical census data because it does not have detailed employment records in order to compute the population of potentially exposed employees. |
| | · | The projected incidence of disease is estimated based on epidemiological studies using employees’ age and the duration and intensity of potential exposure while employed. Epidemiology is the medical science that deals with the incidence, distribution and control of diseases in a population. |
| | · | An estimate of the future anticipated claims filing rate by type of disease (non-malignant, cancer and mesothelioma) is computed using the Company’s average historical claim filing rates for a three-year calibration period, excluding a surge in claims originating in West Virginia. In 2006, the Company received 852 asbestos claims in West Virginia in which the claimants were neither exposed in West Virginia nor residents of the state. CSX believes these claims will not have merit as no medical evidence has been provided to substantiate the claims and therefore CSX has excluded them from the calibration period. Claim levels in 2007 returned to expected levels and management feels this calibration period represents the best estimate of future filing rates. |
| | · | An estimate of the future anticipated dismissal rate by type of claim is computed using the Company’s historical average dismissal rates observed during the current calibration period noted above. |
| | · | An estimate of the future anticipated settlement by type of disease is computed using the Company’s historical average of dollars paid per claim for pending and future claims using the average settlement by type of incident observed during the current calibration period noted above. |
From these assumptions, the Company projects the incidence of each type of disease to the estimated population to determine the total estimated number of employees that could potentially assert a claim. Historical claim filing rates are applied for each type of disease to the total number of employees that could potentially assert a claim to determine the total number of anticipated claim filings by disease type. Historical dismissal rates, which represented claims that were closed without payment, were deducted to calculate the number of future claims by disease type that would likely require payment by the Company. Finally, the number of such claims was multiplied by the average settlement value to estimate the Company’s future liability for IBNR asbestos claims.
The estimated future filing rates and estimated average claim values are the most sensitive assumptions for this reserve. A 1% increase or decrease in either the forecasted number of IBNR claims or the average claim values would result in an approximate $1 million increase or decrease in the liability recorded for unasserted asbestos claims.
Other Occupational
The Company retains a third party specialist with extensive experience in performing other occupational studies to assist management in assessing the value of the Company’s claims and cases. The analysis is performed by the specialist semi-annually and is reviewed by management. Similar to the asbestos liability estimation process, the key elements of the assessment include the following:
| | · | An estimate of the potentially exposed population for other occupational diseases is calculated by projecting active versus retired workforce from 2002 to 2010 using a growth rate projection for overall railroad employment made by the Railroad Retirement Board in its June 2003 report. |
| | · | An estimate of the future anticipated claims filing rate by type of injury, employee type, and active versus retired employee is computed using the Company’s average historical claim filing rates for the calibration periods management felt were representative of future filing rates. For carpal tunnel and repetitive stress injuries, the current calibration period is a 1-year average of claim filings. Hearing loss uses a 3-year calibration period, and all other diseases or injuries use a 2-year calibration period. An estimate is made to forecast future claims by using the filing rates by disease and the active and retired CSX population each year. |
| | · | An estimate of the future anticipated settlement by type of injury is computed using the Company’s historical average of dollars paid per claim for pending and future claims using the average settlement by type of injury observed during a period that management feels is representative of future settlement amounts. |
The estimated future filing rates and estimated average claim values are the most sensitive assumptions for this reserve. A 1% increase or decrease in either the forecasted number of IBNR claims or the average claim values would not result in a material increase or decrease in the liability recorded for unasserted other occupational claims.
Environmental
The Company is a party to various proceedings related to environmental issues, including administrative and judicial proceedings, involving private parties and regulatory agencies. The Company has been identified as a potentially responsible party (“PRP”) at approximately 247 environmentally impaired sites, many of which were, or may be, subject to remedial action under the Federal Comprehensive Environmental Response, Compensation and Liability Act of 1980, or CERCLA, also known as the Superfund law, or similar state statutes. Most of these proceedings arose from environmental conditions on properties used for ongoing or discontinued railroad operations. However, a number of these proceedings are based on allegations that the Company, or its predecessors, sent hazardous substances to facilities owned or operated by others for treatment or disposal. In addition, some of the Company’s land holdings were leased to others for commercial or industrial uses that may have resulted in releases of hazardous substances or other regulated materials onto the property and could give rise to proceedings against the Company.
In any such proceedings, the Company is subject to environmental clean-up and enforcement actions under the Superfund Law, as well as similar state laws that may impose joint and several liability for clean-up and enforcement costs on current and former owners and operators of a site without regard to fault or the legality of the original conduct. These costs could be substantial.
In accordance with Statement of Position 96-1, Environmental Remediation Liabilities, the Company reviews its role with respect to each site identified at least once a quarter, giving consideration to a number of factors such as:
| | · | type of clean-up required; |
| | · | nature of the Company’s alleged connection to the location (e.g. generator of waste sent to the site or owner or operator of the site); |
| | · | extent of the Company’s alleged connection (e.g. volume of waste sent to the location and other relevant factors); and |
| | · | number, connection and financial viability of other named and unnamed PRPs at the location. |
Based on the review process, the Company has recorded amounts to cover contingent future environmental remediation costs with respect to each site to the extent such costs are estimable and probable. The recorded liabilities for estimated future environmental costs are undiscounted and include amounts representing the Company's estimate of unasserted claims, which the Company believes to be immaterial. The liability includes future costs for remediation and restoration of sites as well as any significant ongoing monitoring costs, but excludes any anticipated insurance recoveries.
Currently, the Company does not possess sufficient information to reasonably estimate the amounts of additional liabilities, if any, on some sites until completion of future environmental studies. In addition, conditions that are currently unknown could, at any given location, result in exposure, the amount and materiality of which cannot presently be reliably estimated. Based upon information currently available, however, the Company believes its environmental reserves are adequate to fund remedial actions to comply with present laws and regulations, and that the ultimate liability for these matters, if any, will not materially affect its overall results of operations, financial condition and liquidity.
Legal
In accordance with SFAS 5, an accrual for a loss contingency is established if information available prior to issuance of the financial statements indicates that it is probable that an asset has been impaired or a liability has been incurred at the date of the financial statements, and the amount of loss can be reasonably estimated. If no accrual is made for a loss contingency because one or both of these conditions are not met, or if an exposure to loss exists in excess of the amount accrued, disclosure of the contingency is made when there is at least a reasonable possibility that a loss or an additional loss may have been incurred.
The Company evaluates all exposures relating to legal liabilities at least quarterly and adjusts reserves when appropriate under the guidance noted above. The amount of a particular reserve may be influenced by factors that include official rulings, newly discovered or developed evidence, or changes in laws, regulations, and evidentiary standards.
Pension and Post-retirement Medical Plan Accounting
The Company sponsors defined benefit pension plans principally for salaried, management personnel. The plans provide eligible employees with retirement benefits based predominantly on years of service and compensation rates near retirement. For employees hired after December 31, 2002, benefits are determined based on a cash balance formula, which provides benefits by utilizing interest and pay credits based upon age, service and compensation. CSX made pension plan contributions of $266 million to its qualified defined benefit pension plans in 2007.
In addition to these plans, CSX sponsors a post-retirement medical plan and one life insurance plan that provide benefits to full-time, salaried, management employees hired prior to January 1, 2003, upon their retirement if certain eligibility requirements are met. The post-retirement medical plan is contributory (partially funded by retirees), with retiree contributions adjusted annually. The life insurance plan is non-contributory.
The accounting for these plans is subject to the guidance provided in SFAS 158, Employers’ Accounting for Defined Benefit Pension and Other Postretirement Plans, an amendment of FASB Statements No. 87, 88, 106, and 132 (R) (“SFAS 158”), SFAS 87, Employers Accounting for Pensions (“SFAS 87”), and SFAS 106, Employers' Accounting for Postretirement Benefits Other than Pension (“SFAS 106”).
SFAS 87 requires that management make certain assumptions relating to the following:
| | · | long-term rate of return on plan assets; |
| | · | discount rates used to measure future obligations and interest expense; |
| | · | salary scale inflation rates; |
| | · | health care cost trend rates; and |
These assumptions are determined as of the beginning of the year. As permitted by SFAS 87, the Company has elected to use a plan measurement date of September 30 to actuarially value its pension and post-retirement plans. As required by SFAS 158, CSX will change its measurement date to the fiscal year end in 2008 and does not expect the impact to be material. The Company engages independent, external actuaries to compute the amounts of liabilities and expenses relating to these plans subject to the assumptions that the Company selects. The Company reviews the long-term rate of return, discount, salary scale inflation and health care cost trend rates on an annual basis and makes modifications to the assumptions based on current rates and trends as appropriate.
Long-term Rate of Return on Plan Assets
The expected long-term average rate of return on plan assets reflects the average rate of earnings expected on the funds invested, or to be invested, to provide for benefits included in the projected benefit obligation. In estimating that rate, the Company gives appropriate consideration to the returns being earned by the plan assets in the funds and the rates of return expected to be available for reinvestment.
The Company's expected long-term average rate of return on assets considers the current and projected asset mix of the funds. Management balances market expectations obtained from various investment managers and economists with both market and actual plan historical returns to develop a reasonable estimate of the expected long-term rate of return on assets. As this assumption is long-term, it is adjusted less frequently than other assumptions used in pension accounting. The long-term rate of return on plan assets used by the Company to value its 2007 pension obligation was 8.5%.
Discount Rates
Discount rates affect the amount of liability recorded and the interest expense component of pension and post-retirement expense. Discount rates reflect the rates at which pension and other post-retirement benefits could be effectively settled, or in other words, how much it would cost the Company to buy enough high quality bonds to generate cash flow equal to the Company’s expected future benefit payments. The Company determines the discount rate based on a hypothetical portfolio of high quality bonds with cash flows matching the plans’ expected benefit payments.
The discount rates used by the Company to value its 2007 pension and post-retirement obligations are 6% and 5.75%, respectively. The Company uses a different discount rate for pension and post-retirement benefits due to the different time horizons of future payments for each of the plans. For pensions, the time horizon is approximately 12 years, while for post-retirement, the time horizon is approximately 8 years.
Each year these discount rates are reevaluated and adjusted to reflect the best estimate of the current effective settlement rates. If interest rates generally decline or rise, the assumed discount rates will change.
Salary Scale Inflation Rates
Salary scale inflation rates are based on current trends and historical data accumulated by the Company. The Company reviews recent wage increases and management incentive compensation payments over the past five years in its assessment of salary scale inflation rates. The Company used a salary scale rate of 4.1% to value its 2007 pension obligation.
Health Care Cost Trend Rates
Health care cost trend rates are based on recent plan experience and industry trends. The Company uses actuarial data to substantiate the inflation assumption for health care costs, representing increases in total plan costs (which include claims and administrative fee cost components). The current assumed health care cost trend rate is 10% for Medicare-eligible participants and 9% for non-Medicare-eligible participants and is expected to decrease gradually until reaching 4.75% in 2014, based upon current actuarial projections.
Other Assumptions
The calculations made by the actuaries also include assumptions relating to mortality rates, turnover and retirement age. These assumptions are based upon historical data and are approved by management.
2007 Estimated Pension and Post-retirement Expense
Net periodic pension and post-retirement benefits expense for 2008 is expected to be approximately $34 million and $28 million, respectively, compared to $64 million and $25 million, respectively in 2007.
The following sensitivity analysis illustrates the effect of changes in certain assumptions like discount rates, salaries and health care costs on the 2008 estimated pension and post-retirement expense:
| (Dollars in Millions) | Pension | | OPEB |
| |
| Discount Rate 0.25% change | $ 4 | | $ 1 |
| Salary Inflation 0.25% change | 2 | | - |
| Health Care Cost 1% change | N/A | | 2 |
Depreciation Policies for Assets Under the Group-Life Method
CSXT accounts for its rail assets, including main-line track, locomotives and freight cars, using the group-life method. The group-life method pools similar assets by type and then depreciates each group as a whole. Under the group-life method, the service lives for each group of rail assets are determined by completing periodic life studies and applying management's assumptions concerning the service lives of its properties. These life studies are conducted by a third party expert, analyzed by the Company's management and approved by the STB. Life studies for equipment assets are required every three years, whereas road and track life studies are required every six years by the STB.
Changes in asset lives due to the results of the life studies could significantly impact future periods’ depreciation expense, and thus, the Company's results of operations. Factors taken into account during the life study include:
| | · | Statistical analysis of historical retirements for each group of property; |
| | · | Evaluation of current operations; |
| | · | Evaluation of technological advances and maintenance schedules; |
| | · | Previous assessment of the condition of the assets and outlook for their continued use; |
| | · | Expected net salvage to be received upon retirement; and |
| | · | Comparison of assets to the same asset groups with other companies. |
The life studies may also indicate that the recorded amount of accumulated depreciation is deficient (or in excess) of the appropriate amount indicated by the study. Any such deficiency (or excess) is amortized as a component of depreciation expense over the remaining useful life of the asset group until the next required life study.
In 2007, CSXT completed life studies for all of its equipment, road and track assets and also completed an analysis of the assets received in the Conrail reorganization, which resulted in a reduction in depreciation expense for equipment and road assets and an increase in depreciation expense for track assets. The combination of these adjustments reduced depreciation expense by $21 million in 2007. Also in 2007, the Company reviewed the useful lives of Intermodal terminal assets, as well as lift equipment and containers. A $4 million reduction in depreciation expense was recognized as a result of this periodic review.
Assets depreciated under the group-life method comprise 91% of CSXT's total fixed assets of $21 billion on a net basis at December 28, 2007. The Company’s depreciation expense for the year ended December 28, 2007 amounted to $883 million. A one percent change in the average life of all group-life assets would result in an $8 million change to the Company’s annual depreciation expense.
Income Taxes
In 2006, the Financial Accounting Standards Board issued FIN 48, which became effective for CSX beginning in 2007. FIN 48 addressed the determination of how tax benefits claimed or expected to be claimed on a tax return should be recorded in the financial statements. Under FIN 48, the Company must recognize the tax benefit from an uncertain tax position only if it is more likely than not that the tax position will be sustained on examination by the taxing authorities based on the technical merits of the position. The tax benefits recognized in the financial statements from such a position are measured based on the largest benefit that has a greater than fifty percent likelihood of being realized upon ultimate resolution. The Company’s reassessment of its tax positions in accordance with FIN 48 did not have a material impact on the Company’s results of operations, financial condition and liquidity.
CSX files a consolidated federal income tax return, which includes its principal domestic subsidiaries. Examinations of the federal income tax returns of CSX have been completed through 2003. Federal income tax returns for 2004 through 2007 currently are under examination. Management believes adequate provision has been made for any adjustments that might be assessed. While the final outcome of these matters cannot be predicted with certainty, it is the opinion of CSX management that none of these items will have a materially adverse effect on the results of operations, financial condition and liquidity of CSX. An unexpected adverse resolution of one or more of these items, however, could have a materially adverse effect on the results of operations, financial condition and liquidity in a particular fiscal quarter or fiscal year. Also, the Company is party to a number of legal and administrative proceedings, the resolution of which could result in gain realization in amounts that could be material to results of operations, financial condition and liquidity in a particular fiscal quarter or fiscal year.
New Accounting Pronouncements and Change in Accounting Policy
See Note 1, Nature of Operations and Significant Accounting Policies under the caption, “New Accounting Pronouncements and Changes in Accounting Policy.”
Item 7A. Quantitative and Qualitative Disclosures about Market Risk
CSX does not hold or issue derivative financial instruments for trading purposes. Historically, the Company has used derivative financial instruments to address market risk exposure to fluctuations in interest rates and the risk of volatility in its fuel costs, but as of December 2007, the Company did not have a significant position in derivative financial instruments.
At December 2007, CSX had $106 million of outstanding floating rate debt obligations outstanding. A 1% fluctuation in interest rates on these notes would cause a $1 million change in interest expense.
CSX CORPORATION
PART II
Item 8. Financial Statements and Supplementary Data
INDEX TO CONSOLIDATED FINANCIAL STATEMENTS | |
| | |
| | Page | |
| 63 | |
| |
| CSX Corporation | | |
| | | | | |
| Consolidated Financial Statements and Notes to Consolidated Financial Statements | | |
| | Herewith: | |
| | | | | |
| 64 | |
| | December 28, 2007 | |
| | December 29, 2006 | |
| | December 30, 2005 | |
| | | | | |
| 65 | |
| | December 28, 2007 | |
| | December 29, 2006 | |
| | | | |
| 66 | |
| | December 28, 2007 | |
| | December 29, 2006 | |
| | December 30, 2005 | |
| | | | | |
| 67 | |
| | December 28, 2007 | |
| | December 29, 2006 | |
| | December 30, 2005 | |
| | | | | |
| 68 | |
CSX CORPORATION
PART II
Item 8. Financial Statements and Supplementary Data
REPORT OF INDEPENDENT REGISTERED PUBLIC ACCOUNTING FIRM
To the Shareholders and Board of Directors of CSX Corporation
We have audited the accompanying consolidated balance sheets of CSX Corporation and subsidiaries as of December 28, 2007 and December 29, 2006, and the related consolidated statements of income, cash flows, and changes in shareholders' equity for each of the three fiscal years in the period ended December 28, 2007. These financial statements are the responsibility of the Company's management. Our responsibility is to express an opinion on these financial statements based on our audits.
We conducted our audits in accordance with the standards of the Public Company Accounting Oversight Board (United States). Those standards require that we plan and perform the audit to obtain reasonable assurance about whether the financial statements are free of material misstatement. An audit includes examining, on a test basis, evidence supporting the amounts and disclosures in the financial statements. An audit also includes assessing the accounting principles used and significant estimates made by management, as well as evaluating the overall financial statement presentation. We believe that our audits provide a reasonable basis for our opinion.
In our opinion, the financial statements referred to above present fairly, in all material respects, the consolidated financial position of CSX Corporation and subsidiaries at December 28, 2007 and December 29, 2006, and the consolidated results of their operations and their cash flows for each of the three fiscal years in the period ended December 28, 2007, in conformity with U.S. generally accepted accounting principles.
We also have audited, in accordance with the standards of the Public Company Accounting Oversight Board (United States), CSX Corporation’s internal control over financial reporting as of December 28, 2007, based on criteria established in Internal Control – Integrated Framework issued by the Committee of Sponsoring Organizations of the Treadway Commission and our report dated February 15, 2008 expressed an unqualified opinion thereon.
/s/ Ernst & Young LLP
Independent Certified Public Accountants
Jacksonville, Florida
February 15, 2008
CSX CORPORATION
PART II
Item 8. Financial Statements and Supplementary Data
CONSOLIDATED INCOME STATEMENTS (Dollars in Millions, Except Per Share Amounts)
| | Fiscal Years |
| | 2007 | 2006 | 2005 |
| | Operating Revenue | $ 10,030 | $ 9,566 | $ 8,618 |
| | Operating Expense | | | |
| | | Labor and Fringe | 2,986 | 2,930 | 2,864 |
| | | Materials, Supplies and Other | 2,031 | 1,948 | 1,855 |
| | | Fuel | 1,210 | 1,112 | 783 |
| | | Depreciation | 883 | 857 | 826 |
| | | Equipment and Other Rents | 451 | 507 | 510 |
| | | Inland Transportation | 240 | 242 | 230 |
| | | Gain on Insurance Recoveries (Note 5) | (27) | (168) | - |
| | | | Total Operating Expense | 7,774 | 7,428 | 7,068 |
| |
| | Operating Income | 2,256 | 2,138 | 1,550 |
| |
| | Other Income and Expense | |
| | Other Income - Net (Note 10) | 93 | 95 | 101 |
| | Debt Repurchase Expense (Note 9) | - | - | (192) |
| | Interest Expense | (417) | (392) | (423) |
| | Earnings From Continuing Operations before Income Taxes | 1,932 | 1,841 | 1,036 |
| | |
| | Income Tax Expense (Note 13) | (706) | (531) | (316) |
| | Earnings From Continuing Operations | 1,226 | 1,310 | 720 |
| | Discontinued Operations (Note 17) | 110 | - | 425 |
| | Net Earnings | $ 1,336 | $ 1,310 | $ 1,145 |
| |
| Per Common Share (Note 2) |
| Basic Earnings Per Share |
| | From Continuing Operations | $ 2.85 | $ 2.98 | $ 1.67 |
| | Discontinued Operations | 0.26 | - | 0.98 |
| | Net Earnings | $ 3.11 | $ 2.98 | $ 2.65 |
| |
| Earnings Per Common Share, Assuming Dilution |
| | From Continuing Operations | $ 2.74 | $ 2.82 | $ 1.59 |
| | Discontinued Operations | 0.25 | - | 0.93 |
| | Net Earnings | $ 2.99 | $ 2.82 | $ 2.52 |
| |
| Average Common Shares Outstanding (Thousands) | 430,270 | 440,084 | 432,851 |
| |
| Average Common Shares Outstanding, | 448,280 | 465,934 | 456,047 |
| | Assuming Dilution (Thousands) |
| |
| Cash Dividends Paid Per Common Share | $ 0.54 | $ 0.33 | $ 0.215 |
See accompanying Notes to Consolidated Financial Statements
CSX CORPORATION
PART II
Item 8. Financial Statements and Supplementary Data
CONSOLIDATED BALANCE SHEETS (Dollars in Millions) |
| | | | December 28, | December 29, |
| | | | 2007 | 2006 |
| | | | | |
| ASSETS |
| Current Assets: | | |
| | Cash and Cash Equivalents (Note 1) | $ 368 | $ 461 |
| | Short-term Investments | 346 | 439 |
| | Accounts Receivable, net of allowance for doubtful | | |
| | accounts of $74 and $82, respectively | 1,174 | 1,174 |
| | Materials and Supplies | 240 | 204 |
| | Deferred Income Taxes | 254 | 251 |
| | Other Current Assets | 109 | 143 |
| | Total Current Assets | 2,491 | 2,672 |
| |
| Properties | 28,999 | 27,715 |
| Accumulated Depreciation | (7,219) | (6,792) |
| | Properties - Net (Note 11) | 21,780 | 20,923 |
| |
| Investment in Conrail (Note 16) | 639 | 607 |
| Affiliates and Other Companies | 365 | 336 |
| Other Long-term Assets (Note 12) | 259 | 591 |
| | Total Assets | $ 25,534 | $ 25,129 |
| | | |
| LIABILITIES AND SHAREHOLDERS' EQUITY |
| Current Liabilities: | | |
| | Accounts Payable | $ 976 | $ 974 |
| | Labor and Fringe Benefits Payable | 461 | 495 |
| | Casualty, Environmental and Other Reserves (Note 6) | 247 | 253 |
| | Current Maturities of Long-term Debt (Note 9) | 785 | 592 |
| | Short-term Debt (Note 9) | 2 | 8 |
| | Income and Other Taxes Payable | 113 | 114 |
| | Other Current Liabilities | 87 | 86 |
| | Total Current Liabilities | 2,671 | 2,522 |
| |
| Casualty, Environmental and Other Reserves (Note 6) | 624 | 668 |
| Long-term Debt (Note 9) | 6,470 | 5,362 |
| Deferred Income Taxes | 6,096 | 6,110 |
| Other Long-term Liabilities (Note 12) | 988 | 1,525 |
| | Total Liabilities | 16,849 | 16,187 |
| |
| Shareholders' Equity: | | |
| | Common Stock, $1 Par Value (Note 3) | 408 | 438 |
| | Other Capital | 37 | 1,469 |
| | Retained Earnings (Note 13) | 8,565 | 7,427 |
| | Accumulated Other Comprehensive Loss | (325) | (392) |
| | Total Shareholders' Equity | 8,685 | 8,942 |
| | Total Liabilities and Shareholders' Equity | $ 25,534 | $ 25,129 |
See accompanying Notes to Consolidated Financial Statements
CSX CORPORATION
PART II
Item 8. Financial Statements and Supplementary Data
CONSOLIDATED CASH FLOW STATEMENTS (Dollars in Millions)
| | Fiscal Years |
| | 2007 | 2006 | 2005 |
| OPERATING ACTIVITIES | | | |
| | Net Earnings | $ 1,336 | $ 1,310 | $ 1,145 |
| | Adjustments to Reconcile Net Earnings to Net Cash Provided | | | |
| | by Operating Activities: | | | |
| | Depreciation | 890 | 867 | 833 |
| | Deferred Income Taxes | 272 | 42 | (46) |
| | | Gain on Sale of International Terminals - Net of Tax (Note 17) | - | - | (428) |
| | Non-cash Discontinued Operations (Note 17) | (110) | - | - |
| | Gain on Insurance Recoveries (Note 5) | (27) | (168) | - |
| | Insurance Proceeds (Note 5) | 13 | 121 | 29 |
| | | Net Gain on Conrail spin-off - after tax | - | (26) | - |
| | | Contributions to Qualified Pension Plans (Note 8) | (266) | (28) | (3) |
| | Other Operating Activities | (77) | 33 | (138) |
| | Changes in Operating Assets and Liabilities: | | | |
| | Accounts Receivable | (50) | (33) | (44) |
| | Other Current Assets | (41) | 96 | (29) |
| | Accounts Payable | 48 | 51 | 54 |
| | Income and Other Taxes Payable | 234 | (103) | (402) |
| | Other Current Liabilities | (38) | (104) | 139 |
| | Net Cash Provided by Operating Activities | 2,184 | 2,058 | 1,110 |
| | | | | | | | |
| INVESTING ACTIVITIES | | | |
| | Property Additions | (1,773) | (1,639) | (1,136) |
| | Insurance Proceeds (Note 5) | 16 | 147 | 41 |
| | Net Proceeds from Sale of International Terminals (Note 17) | - | - | 1,108 |
| | Purchase of Minority Interest in an International Terminals' | | | |
| | | Subsidiary (Note 17) | - | - | (110) |
| | Purchases of Short-term Investments | (2,338) | (1,412) | (2,601) |
| | Proceeds from Sales of Short-term Investments | 2,459 | 1,290 | 2,634 |
| | Other Investing Activities | (57) | 4 | 28 |
| | Net Cash Used in Investing Activities | (1,693) | (1,610) | (36) |
| | | | | | | | |
| FINANCING ACTIVITIES | | | |
| | Short-term Debt - Net | (6) | 7 | (99) |
| | Long-term Debt Issued (Note 9) | 2,381 | 471 | 105 |
| | Long-term Debt Repaid (Note 9) | (785) | (546) | (1,283) |
| | Dividends Paid | (231) | (145) | (93) |
| | Stock Options Exercised (Note 4) | 153 | 319 | 98 |
| | Shares Repurchased (Note 1) | (2,174) | (465) | - |
| | Other Financing Activities | 78 | 63 | (15) |
| | Net Cash Used in Financing Activities | (584) | (296) | (1,287) |
| | | | | | | | |
| | Net (Decrease) Increase in Cash and Cash Equivalents | (93) | 152 | (213) |
| | | | | | | | |
| CASH AND CASH EQUIVALENTS | | | |
| | Cash and Cash Equivalents at Beginning of Period | 461 | 309 | 522 |
| | Cash and Cash Equivalents at End of Period | $ 368 | $ 461 | $ 309 |
| | | | | | | | |
| SUPPLEMENTAL CASH FLOW INFORMATION | | | |
| | Interest Paid - Net of Amounts Capitalized | $ 411 | $ 387 | $ 444 |
| | Income Taxes Paid | $ 235 | $ 531 | $ 798 |
See accompanying Notes to Consolidated Financial Statements
CSX CORPORATION
PART II
Item 8. Financial Statements and Supplementary Data
CONSOLIDATED STATEMENTS OF CHANGES IN SHAREHOLDERS’ EQUITY (Dollars in Millions)
| | | | | | | | | Accumulated Other | |
| | | | Common | | | | | Comprehensive Income (Loss) | |
| | | | Shares | | | | | Pension | | | |
| | | | Outstanding | | Common | Other | Retained | and OPEB | Fuel | | |
| | | | (Thousands) | | Stock | Capital | Earnings | Adjustments(a) | Hedge(b) | Other | Total |
| | | | | | | | | | | | |
| Balance December 31, 2004 | 431,058 | | $ 431 | $ 1,390 | $ 5,210 | $ (292) | $ 72 | $ - | $ 6,811 |
| Comprehensive Earnings: | | | | | | | | | |
| | Net Earnings | - | | - | - | 1,145 | - | - | - | 1,145 |
| | Other Comprehensive Income | | | | | | | | | |
| | | (Loss) | - | | - | - | - | (15) | (42) | - | (57) |
| | | | | | | | | | | | |
| | Comprehensive Earnings | | | | | | | | | 1,088 |
| | | | | | | | | | | | |
| Dividends | - | | - | - | (93) | - | - | - | (93) |
| Stock Option Exercises and Other | 5,348 | | 5 | 143 | - | - | - | - | 148 |
| | | | | | | | | | | | |
| Balance December 30, 2005 | 436,406 | | 436 | 1,533 | 6,262 | (307) | 30 | - | 7,954 |
| Comprehensive Earnings: | | | | | | | | | |
| | Net Earnings | - | | - | - | 1,310 | - | - | - | 1,310 |
| | Other Comprehensive Income | | | | | | | | | |
| | | (Loss) | - | | - | - | - | (2) | (30) | - | (32) |
| | | | | | | | | | | | |
| | Comprehensive Earnings | | | | | | | | | 1,278 |
| | | | | | | | | | | | |
| | Adjustment for Initial Adoption | | | | | | | | | |
| | | of SFAS 158, net of tax(c) | - | | - | - | - | (83) | - | - | (83) |
| Dividends | - | | - | - | (145) | - | - | - | (145) |
| Share Repurchases | (14,533) | | (14) | (451) | - | - | - | - | (465) |
| Stock Option Exercises and Other | 15,891 | | 16 | 387 | - | - | - | - | 403 |
| | | | | | | | | | | | |
| Balance December 29, 2006 | 437,764 | | 438 | 1,469 | 7,427 | (392) | - | - | 8,942 |
| Comprehensive Earnings: | | | | | | | | | |
| | Net Earnings | - | | - | - | 1,336 | - | - | - | 1,336 |
| | Other Comprehensive Income | | | | | | | | |
| | | (Loss) | - | | - | - | - | 63 | - | 4 | 67 |
| | | | | | | | | | | | |
| | Comprehensive Earnings | | | | | | | | | 1,403 |
| | | | | | | | | | | | |
| Adjustment for Initial Adoption | | | | | | | | | |
| | | of FIN 48(d) | - | | - | - | 33 | - | - | - | 33 |
| Dividends | - | | - | - | (231) | - | - | - | (231) |
Share Repurchases (e) | (50,917) | | (51) | (2,123) | - | - | - | - | (2,174) |
Bond Conversions(f) | 13,296 | | 13 | 339 | - | - | - | - | 352 |
Subsidiary Equity Restructuring(g) | - | | - | 72 | - | - | - | - | 72 |
| Stock Option Exercises and Other | 7,721 | | 8 | 280 | - | - | - | - | 288 |
| | | | | | | | | | | | |
| Balance December 28, 2007 | 407,864 | | $ 408 | $ 37 | $ 8,565 | $ (329) | $ - | $ 4 | $ 8,685 |
| (a) | Pension and Other Postretirement Benefits balances are net of taxes of $146 million, $197 million and $166 million for 2005, 2006 and 2007, respectively. |
| (b) | Fuel hedge activity is net of taxes of $21 million for 2005 and 2006. |
| (c) | See Note 1, Nature of Operations and Significant Accounting Policies under caption New Accounting Pronouncements and Changes in Accounting Policy. |
| (d) | See Note 13, Income Taxes. |
| (e) | See Note 1, Nature of Operations and Significant Accounting Policies under caption Other Items – Share Repurchases. |
(f) | See Note 2, Earnings Per Share and Note 9, Debt and Credit Agreements. |
(g) | See Note 12, Other Long-term Assets and Other Long-term Liabilities. |
See accompanying Notes to Consolidated Financial Statements
CSX CORPORATION
PART II
Item 8. Financial Statements and Supplementary Data
NOTES TO CONSOLIDATED FINANCIAL STATEMENTS
NOTE 1. Nature of Operations and Significant Accounting Policies
Nature of Operations
CSX Corporation (“CSX” and together with its subsidiaries, the “Company”), based in Jacksonville, Florida, is one of the nation's leading transportation companies. Surface Transportation, which includes the Company’s rail and intermodal businesses, provides rail-based transportation services including traditional rail service and the transport of intermodal containers and trailers.
Rail
CSX’s principal operating company, CSX Transportation, Inc. (“CSXT”), provides a crucial link to the transportation supply chain through its approximately 21,000 route mile rail network, which serves every major population center in 23 states east of the Mississippi River, the District of Columbia and the Canadian provinces of Ontario and Quebec. It serves 70 ocean, river and lake ports along the Atlantic and Gulf Coasts, the Mississippi River, the Great Lakes and the St. Lawrence Seaway. CSXT also serves thousands of production and distribution facilities through track connections to more than 230 short-line and regional railroads.
Other Entities
In addition to CSXT, the rail segment includes Total Distribution Services, Inc. (“TDSI”), Transflo Terminal Services, Inc. (“Transflo”), CSX Technology, Inc. (“CSX Technology”) and other subsidiaries. TDSI serves the automotive industry with distribution centers and storage locations, while Transflo provides logistical solutions for transferring products from rail to trucks. Technology and other support services are provided by CSX Technology and other subsidiaries.
Intermodal
CSX Intermodal, Inc. (“Intermodal”), one of the nation’s largest coast-to-coast intermodal transportation providers, is a stand-alone, integrated intermodal company linking customers to railroads via trucks and terminals. Containers and trailers are loaded and unloaded from trains, and trucks provide the link between intermodal terminals and the customer.
Surface Transportation Businesses
The rail and intermodal segments are designated by the Company on a combined basis as Surface Transportation businesses. Together, they generated $10 billion of revenue during 2007 and served four primary lines of business, which are as follows:
CSX CORPORATION
PART II
Item 8. Financial Statements and Supplementary Data
NOTE 1. Nature of Operations and Significant Accounting Policies, continued
| | · | The merchandise business is the most diverse market with nearly 2.7 million carloads per year of aggregate, which includes crushed stone, sand and gravel, metal, phosphate, fertilizer, food, consumer, agricultural, paper and chemical products. The merchandise business generated approximately 50% of the Company’s revenue in 2007 and 38% of volume. |
| | · | Coal, which delivered approximately 1.9 million carloads of coal, coke and iron ore to electricity generating power plants, ocean, river and lake piers and terminals, steel makers and industrial plants, accounted for approximately 26% of the Company’s revenue and volume in 2007. The Company transports almost one-third of every ton of coal used for generating electricity in the areas served by CSX. |
| | · | Automotive, which delivers both finished vehicles and auto parts, generated 8% of the Company’s revenue in 2007 and 6% of the Company’s volume. The Company delivers approximately one-third of North America’s light vehicles, serving both traditional manufacturers and the increasing number of global manufacturers. |
| | · | Intermodal offers a competitive cost advantage over long-haul trucking by combining the superior economics of rail transportation with the short-haul flexibility of trucks. Through its network of more than 50 terminals, Intermodal serves all major markets east of the Mississippi and transports mainly manufactured consumer goods in containers, providing customers with truck-like service for longer shipments. For 2007, Intermodal accounted for approximately 14% of the Company’s total revenue and 30% of volume. |
Other revenue, which includes revenue from regional railroads (that are partially owned by CSX), demurrage, switching and other incidental charges, accounted for 2% of the Company’s total 2007 revenue. Revenue from regional railroads includes shipments by railroads that CSX does not directly operate. Demurrage represents charges assessed by railroads when shippers or receivers of freight hold railcars beyond a specified period of time. Switching revenue is generated when CSXT switches cars between trains for a customer or another railroad.
Other Businesses
CSX’s other holdings include CSX Real Property, Inc., a subsidiary responsible for the Company’s real estate sales, leasing, acquisition and management and development activities, and CSX Hotels, Inc., a resort doing business as The Greenbrier, located in White Sulphur Springs, West Virginia. Pretax earnings of $42 million, $24 million and $85 million for 2007, 2006 and 2005, respectively, from these activities are classified as a component of other income. These items are classified in other income because they are not considered by the Company to be operating activities and may fluctuate with the timing of real estate sales and resort seasonality.
CSX CORPORATION
PART II
Item 8. Financial Statements and Supplementary Data
NOTE 1. Nature of Operations and Significant Accounting Policies, continued
The Company also has certain residual activities from formerly owned companies that include leasing of equipment and vessels. These results are included in consolidated operating income and totaled $5 million, $12 million and $1 million in 2007, 2006 and 2005, respectively.
Basis of Presentation
In the opinion of management, the accompanying consolidated financial statements contain all normal, recurring adjustments necessary to fairly present the financial position of CSX and its subsidiaries at December 2007 and December 2006, and the Consolidated Statements of Income, Cash Flows and Changes in Shareholders’ Equity for fiscal years 2007, 2006 and 2005. Certain prior-year data have been reclassified to conform to the 2007 presentation.
Fiscal Year
CSX follows a 52/53 week fiscal reporting calendar. This fiscal calendar allows every quarter to consistently end on a Friday and to be of equal duration (13 weeks). However, to maintain this type of reporting calendar, every sixth or seventh year (depending on the Gregorian calendar and when leap year falls), an extra week will be included in one quarter (a 14-week fiscal quarter) and, therefore, the full fiscal year will have 53 weeks.
Fiscal years 2007, 2006 and 2005 each consisted of 52 weeks ending on December 28, 2007, December 29, 2006 and December 30, 2005, respectively. Except as otherwise specified, references to full year indicate CSX’s fiscal periods ended on these dates.
Principles of Consolidation
The consolidated financial statements include results of operations of CSX and its majority-owned subsidiaries. All significant intercompany accounts and transactions have been eliminated. Most investments in companies that were not majority-owned were carried at cost (if less than 20% owned and the Company has no significant influence) or equity (if the Company has significant influence).
Cash, Cash Equivalents and Short-term Investments
On a daily basis, cash in excess of current operating requirements is invested in various highly liquid investments having a typical maturity date of three months or less at the date of acquisition. These investments were carried at cost, which approximated market value, and were classified as cash equivalents. Investments in instruments with maturities greater than three months but less than one year were classified as short-term investments.
CSX CORPORATION
PART II
Item 8. Financial Statements and Supplementary Data
NOTE 1. Nature of Operations and Significant Accounting Policies, continued
CSX holds $270 million and $391 million of auction rate securities and classifies these investments as available for sale as of December 2007 and 2006, respectively. Accordingly, these investments were included in current assets as Short-term Investments on the Consolidated Balance Sheets. On the Consolidated Cash Flow Statements, purchases and sales of these assets were classified within Investing Activities.
Allowance for Doubtful Accounts
The Company maintains an allowance for doubtful accounts for the estimated probable losses on uncollectible accounts and other receivables. The allowance is based upon the credit worthiness of customers, historical experience, the age of the receivable and current market and economic conditions, as well as any known trends or uncertainties related to customer billing and account collectibility. Uncollectible amounts were charged against the allowance account. The allowance for doubtful accounts is netted against accounts receivable.
Materials and Supplies
Materials and Supplies in the Consolidated Balance Sheets were carried at average costs and consist primarily of fuel and parts used in the repair and maintenance of CSXT’s freight car and locomotive fleets, equipment and track structure.
Properties
All properties were stated at historical cost less an allowance for accumulated depreciation. Rail assets, including main-line track, locomotives and freight cars, were depreciated using the group-life method. Under this method, CSXT pools similar assets by road and equipment type and then depreciates each group as a whole. Regulations enforced by the Surface Transportation Board (“STB”) of the U.S. Department of Transportation require periodic formal studies of ultimate service lives (“life studies”) for all railroad assets. Factors taken into account during a life study include:
| | · | statistical analysis of historical retirements for each group of property; |
| | · | evaluation of current operations; |
| | · | evaluation of technological advances and maintenance schedules; |
| | · | previous assessment of the condition of the assets and outlook for their continued use; |
| | · | net salvage expected to be received upon retirement; and |
| | · | comparison of assets to the same asset groups with other companies. |
CSX CORPORATION
PART II
Item 8. Financial Statements and Supplementary Data
NOTE 1. Nature of Operations and Significant Accounting Policies, continued
The results of the life study process determine the service lives for each asset group under the group-life method. These studies are conducted by a third party expert and are analyzed by the Company's management. Resulting changes in service life estimates are subject to review and approval by the STB. Road assets, including main-line track, have estimated service lives ranging from six years for system roadway machinery to 80 years for grading. Equipment assets, including locomotives and freight cars, have estimated service lives ranging from six years for motor vehicles to 35 years for work equipment.
Changes in asset lives due to the results of the life studies are applied at the completion of the life study and continue until the next required life study. The life studies may also indicate that the recorded amount of accumulated depreciation is deficient (or in excess) of the amount indicated by the study. Any such deficiency (or excess) amount is amortized as a component of depreciation expense over the remaining useful life of the asset group until the next required life study.
The majority of non-rail property is depreciated using the straight-line method on a per asset basis. The depreciable lives of non-rail property is periodically reviewed by the Company and any changes are applied on a prospective basis. Amortization expense recorded under capital leases is included in depreciation expense on the Consolidated Income Statements.
For retirements or disposals of depreciable rail assets that occur in the ordinary course of business, the asset cost (net of salvage value or sales proceeds) is charged to accumulated depreciation and no gain or loss is recognized. For retirements or disposals of non-rail depreciable assets, infrequent disposal of rail assets outside the normal course of business and all dispositions of land, the resulting gains or losses are recognized at the time of disposal. Expenditures that significantly increase asset values or extend useful lives are capitalized. Repair and maintenance expenditures are charged to operating expense when the work is performed.
Revenue and Expense Recognition
The Company recognizes freight revenue using Free-On-Board (“FOB”) Origin pursuant to Emerging Issues Task Force (“EITF”) 91-9, Revenue and Expense Recognition for Freight Services in Process. The Company uses method (5) in the EITF, which provides for the allocation of revenue between reporting periods based on relative transit time in each reporting period. Expenses are recognized as incurred.
CSX CORPORATION
PART II
Item 8. Financial Statements and Supplementary Data
NOTE 1. Nature of Operations and Significant Accounting Policies, continued
The certain key estimates included in the recognition and measurement of revenue and related accounts receivable under the policies described above are as follows:
| | · | revenue associated with shipments in transit, which are based on historical freight car movement data as well as average cycle times to move commodities from their origin to their final destination or interchange; |
| | · | future adjustments to revenue or accounts receivable for billing corrections, billing discounts, bad debts and allowances for doubtful accounts; |
| | · | future adjustments to revenue for overcharge claims filed by customers, which are based on historical cash paid to customers for rate overcharges as a percentage of total billing; and |
| | · | incentive-based refunds to customers, which are primarily based on customers achieving certain volume thresholds and are recorded as a reduction to revenue on the basis of management’s best estimate of the projected liability. This estimate is based on historical activity, current volume levels and a forecast of future volume. |
The Company regularly updates the estimates described above based on historical experience. All other revenue, such as demurrage, switching and other incidental charges are recorded upon completion of the service.
Comprehensive Earnings
CSX reports comprehensive earnings (loss) in accordance with SFAS 130, Reporting Comprehensive Income, in the Consolidated Statement of Changes in Shareholders' Equity. Comprehensive earnings is defined as all changes in shareholders' equity during a period, other than those resulting from investments by and distributions to shareholders (i.e. issuance of equity securities and dividends). At December 2007 and 2006, Accumulated Other Comprehensive Loss consisted primarily of adjustments for pension and other post-retirement liabilities. (See Note 8, Employee Benefit Plans.)
Derivative Financial Instruments
CSX recognizes all derivatives as either assets or liabilities in the Consolidated Balance Sheets and measures those instruments at fair value. (See Note 14, Derivative Financial Instruments.)
CSX CORPORATION
PART II
Item 8. Financial Statements and Supplementary Data
NOTE 1. Nature of Operations and Significant Accounting Policies, continued
New Accounting Pronouncements and Changes in Accounting Policy
CSX adopted FASB Interpretation 48, Accounting for Uncertainty in Income Taxes (“FIN 48”), at the beginning of fiscal year 2007. FIN 48 addressed the determination of how tax benefits claimed or expected to be claimed on an income tax return should be recorded in the financial statements. Under FIN 48, the Company must recognize the tax benefit from an uncertain tax position only if it is more likely than not that the tax position will be sustained upon examination by the taxing authorities, based on the technical merits of the position. These tax benefits recognized in the financial statements are measured based on the largest benefit that has a greater than fifty percent likelihood of being realized upon ultimate resolution. The impact of the Company’s reassessment of its tax positions in accordance with FIN 48 did not have a material impact on the results of operations, financial condition and liquidity. (See Note 13, Income Taxes.)
In September 2006, the Financial Accounting Standards Board (“FASB”) issued SFAS 158, Employers’ Accounting for Defined Benefit Pension and Other Postretirement Plans, an Amendment of FASB Statements No. 87, 88, 106, and 132 (R) (“SFAS 158”), which changed the accounting rules for reporting and disclosures related to pensions and other post-retirement benefit plans. Companies were required to reflect the funded status of retirement and other post-retirement benefit plans on the balance sheet. This change was effective for the Company for fiscal year end 2006. The decrease in equity did not have any significant impact on the Company’s credit ratios or financing covenants. Pursuant to SFAS 158, the Company will be required to change its September measurement date for the Company’s pension and other postretirement benefit plans’ assets and obligations to its fiscal year end effective in 2008.
Effective fiscal year 2006, the Company adopted the fair value recognition provisions of SFAS 123(R), Share-Based Payment (“SFAS 123(R)”) using the modified-prospective-transition method. Under this method, compensation costs recognized in 2006 and forward include all unvested share-based payments as of the beginning of 2006. Share-based compensation at CSX may include stock options, restricted stock awards, stock issued to CSX directors and CSX’s Long-term Incentive Plans. The amount of compensation costs recognized is based upon the estimated grant date fair value method under the Black-Scholes-Merton formula and resulted in the recognition of additional compensation cost from the unvested portion of stock options granted prior to 2003.
The adoption of SFAS 123(R) did not result in a material impact to the Company’s Consolidated Income Statement or earnings per share. The Company recorded $3 million in 2006 of additional compensation expense for unvested stock options granted prior to 2003. Compensation costs for all other types of share-based payments were consistently reported for all periods presented.
CSX CORPORATION
PART II
Item 8. Financial Statements and Supplementary Data
NOTE 1. Nature of Operations and Significant Accounting Policies, continued
In 2007, the FASB issued SFAS No. 157, Fair Value Measurements (“SFAS 157”), and the Statement of Financial Accounting Standards No. 159, The Fair Value Option for Financial Assets and Financial Liabilities (“SFAS 159”). These statements define fair value, provide guidance on fair value measurement and give companies the option to report financial instruments and certain other items at fair value. CSX does not expect to be materially impacted by these statements.
In 2007, the FASB issued SFAS No. 160, Noncontrolling Interests in Consolidated Financial Statements- An amendment of ARB No. 51 (“SFAS 160”). This statement clarifies that minority interest should be reported as equity on the balance sheet. Additionally, it requires disclosure of consolidated net income attributable to the parent and to the noncontrolling interest on the face of the income statement. For CSX, SFAS 160 is effective beginning fiscal year 2009 and the Company does not expect to be materially impacted by this statement.
Use of Estimates
The preparation of financial statements in conformity with accounting principles generally accepted in the United States requires that management make estimates in reporting the amounts of certain assets and liabilities, the disclosure of contingent assets and liabilities at the date of the financial statements and the reported amount of certain revenues and expenses during the reporting period. Actual results may differ from those estimates. Critical accounting estimates using management judgment are made for the following areas:
| | · | casualty, environmental and legal reserves (see Note 6, Casualty, Environmental and Other Reserves); |
| | · | pension and post-retirement medical plan accounting (see Note 8, Employee Benefit Plans); |
| | · | depreciation policies for assets under the group-life method (see “Properties” in this note); and |
| | · | income taxes (see Note 13, Income Taxes). |
Other Items – Share Repurchases
Currently, CSX has purchased $2.1 billion of its outstanding common stock, which represents 50 million shares or about 70% of the $3 billion share repurchase program that was authorized in 2007. CSX intends to complete this repurchase program during 2008. The timing, method, amount of repurchase transactions and the sources of funds to affect any repurchases will be determined by the Company's management based on their evaluation of market conditions, share price and other factors. While it is not management’s intention, the program could be suspended or discontinued at any time.
CSX CORPORATION
PART II
Item 8. Financial Statements and Supplementary Data
NOTE 1. Nature of Operations and Significant Accounting Policies, continued
Total share repurchases under all publicly announced plans was as follows:
| (In Millions) | | 2007 | 2006 |
| Number of Shares Repurchased | | 51 | 15 |
| Value of Shares Repurchased | | $ 2,174 | $ 465 |
NOTE 2. Earnings Per Share
The following table sets forth the computation of basic earnings per share and earnings per share, assuming dilution:
| | | Fiscal Years | |
| | 2007 | 2006 | 2005 |
| Numerator (Millions): | | | |
| | Earnings from Continuing Operations | $ 1,226 | $ 1,310 | $ 720 |
| | Interest Expense on Convertible Debt - Net of Tax | 2 | 4 | 4 |
| | Net Earnings from Continuing Operations, If-Converted | 1,228 | 1,314 | 724 |
| | | | | |
| | Discontinued Operations - Net of Tax | 110 | - | 425 |
| | Net Earnings, If-Converted | 1,338 | 1,314 | 1,149 |
| | Interest Expense on Convertible Debt - Net of Tax | (2) | (4) | (4) |
| | Net Earnings | $ 1,336 | $ 1,310 | $ 1,145 |
| | | | | |
| Denominator (Thousands): | | | |
| | Average Common Shares Outstanding | 430,270 | 440,084 | 432,851 |
| | Convertible Debt | 11,469 | 19,456 | 19,456 |
| | Stock Options (a) | 5,010 | 6,057 | 2,811 |
| | Other Potentially Dilutive Common Shares | 1,531 | 337 | 929 |
| | Average Common Shares Outstanding, Assuming Dilution | 448,280 | 465,934 | 456,047 |
| | | | | |
| Earnings Per Share: | | | |
| | Income from Continuing Operations | $ 2.85 | $ 2.98 | $ 1.67 |
| | Discontinued Operations | 0.26 | - | 0.98 |
| | Net Earnings | $ 3.11 | $ 2.98 | $ 2.65 |
| | | | | |
| Earnings Per Share, Assuming Dilution: | | | |
| | Income from Continuing Operations | $ 2.74 | $ 2.82 | $ 1.59 |
| | Discontinued Operations | 0.25 | - | 0.93 |
| | Net Earnings | $ 2.99 | $ 2.82 | $ 2.52 |
| (a) | In calculating diluted earnings per share, SFAS 128, Earnings Per Share requires the Company to include the potential shares that would be outstanding if all outstanding stock options were exercised. This is offset by shares the Company could repurchase using the proceeds from these hypothetical exercises. This number is different from outstanding stock options, which is included in Note 4, Stock Plans and Share-Based Compensation. |
CSX CORPORATION
PART II
Item 8. Financial Statements and Supplementary Data
NOTE 2. Earnings Per Share, continued
Basic earnings per share was based on the weighted-average number of common shares outstanding. Earnings per share, assuming dilution, was based on the weighted-average number of common shares outstanding adjusted for the effect of the following types of potentially dilutive common shares:
| | · | employee stock options; and |
| | · | other equity awards, which include unvested restricted stock and long-term incentive awards. |
EITF 04-8, The Effect of Contingently Convertible Debt on Diluted Earnings Per Share, required CSX to include additional shares in the computation of earnings per share, assuming dilution. The amount included in diluted earnings per share represents the number of shares that would be issued if all of CSX’s convertible debentures were converted into CSX common stock.
When convertible debentures are converted into CSX common stock, the newly-issued shares are included in the calculation of both basic and diluted earnings per share on a weighted average basis. During 2007, $375 million of face value convertible debentures were converted into 13 million shares of CSX common stock. No material conversions occurred during 2006. At December 2007, $174 million face value remained outstanding, convertible into 6 million shares.
In 2005, 4.4 million stock options with an average exercise price of $26.55 were excluded from the computation of earnings per share, assuming dilution, since their related option exercise prices were greater than the average market price of the common shares during the period. In 2006 and 2007, no stock options were excluded from the calculation as all stock options were dilutive at that time.
CSX CORPORATION
PART II
Item 8. Financial Statements and Supplementary Data
NOTE 3. Shareholders’ Equity
Common and Preferred Stock consists of the following:
| | | December 28, |
| Common Stock, $1 Par Value | | 2007 |
| | | (in Thousands) |
| Common shares authorized | | 600,000 |
| Common shares issued and outstanding | | 407,864 |
| |
| Preferred Stock | | |
| Preferred shares authorized | | 25,000 |
| Preferred shares issued and outstanding | | - |
Holders of common stock are entitled to one vote on all matters requiring a vote for each share held. Preferred stock is senior to common stock with respect to dividends and upon liquidation of CSX.
NOTE 4. Stock Plans and Share-Based Compensation
CSX share-based compensation plans primarily include long-term incentive plans, restricted stock awards, stock options and stock plans for directors. CSX has not granted stock options since 2003. Awards granted under the various plans are determined and approved by the Compensation Committee of the Board of Directors or, in certain circumstances, by the Chief Executive Officer for awards to management employees other than senior executives. The Governance Committee of the Board of Directors approves awards granted to the Company’s non-management directors.
As of December 2007, there were 2,393 current or former employees with stock option grants outstanding under the various plans. Most new stock awards were granted under the authorization provided in the CSX Omnibus Incentive Plan. As of December 2007, an additional 12 million shares of stock could be issued under this plan.
SFAS 123(R) requires the cash flows resulting from income tax deductions in excess of compensation costs to be classified as financing cash flows. This requirement resulted in reduced net operating cash flows and increased net financing cash flows of approximately $60 million and $59 million for fiscal years 2007 and 2006, respectively. Prior to the adoption of SFAS 123(R), CSX presented all income tax benefits from deductions resulting from compensation costs as operating cash flows in the Consolidated Cash Flow Statements.
Total pre-tax expense associated with share-based compensation and its related income tax benefit is as follows:
| | | Fiscal Years |
| (Dollars in Millions) | | 2007 | 2006 | 2005 |
| Share-Based Compensation Expense | | $ 73 | $ 45 | $ 39 |
| Income Tax Benefit | | 27 | 17 | 14 |
CSX CORPORATION
PART II
Item 8. Financial Statements and Supplementary Data
NOTE 4. Stock Plans and Share-Based Compensation, continued
The following table illustrates the pro forma effect on net earnings and earnings per share prior to the adoption of SFAS 123(R). This table only shows 2005 pro forma amounts since the Company adopted the fair value recognition provisions of SFAS 123(R) in the first quarter of 2006. Therefore, expenses were recognized in the Consolidated Income Statement for all unvested share-based compensation in 2006 and 2007.
| | | Fiscal Year |
| (Dollars in Millions, Except Per Share Amounts) | 2005 |
| | | |
| Net Earnings - As Reported | $ 1,145 |
| Add: Stock-Based Employee Compensation Expense | |
| | Included in Reported Net Income - Net of Tax | 25 |
| Deduct: Total Stock-Based Employee Compensation | |
| | Expense Determined under the Fair Value Based Method | |
| | for all Awards - Net of Tax | (29) |
| |
| Pro Forma Net Earnings | $ 1,141 |
| Interest Expense on Convertible Debt - Net of Tax | 4 |
| Pro Forma Net Earnings, If-Converted | $ 1,145 |
| | | |
| Earnings Per Share: | |
| Basic - As Reported | $ 2.65 |
| Basic - Pro Forma | $ 2.64 |
| | | |
| Diluted - As Reported | $ 2.52 |
| Diluted - Pro Forma | $ 2.51 |
Stock Options
Stock options were granted with 10-year terms. Options outstanding at December 2007 are generally exercisable three to ten years after date of grant. The exercise price for options granted equals the market price of the underlying stock on the grant date. A summary of CSX's stock option activity and related information for the fiscal years 2007, 2006 and 2005 is as follows:
| | Fiscal Years |
| | 2007 | | 2006 | | 2005 |
| | | | Weighted- | | | | Weighted- | | | | Weighted- |
| | Options | | Average | | Options | | Average | | Options | | Average |
| | Outstanding | | Exercise | | Outstanding | | Exercise | | Outstanding | | Exercise |
| | (000s) | | Price | | (000s) | | Price | | (000s) | | Price |
Outstanding at Beginning of Year | 19,420 | | $ 18.96 | | 34,151 | | $ 20.13 | | 41,445 | | $ 19.81 |
| Granted | - | | $ - | | - | | $ - | | - | | $ - |
| Expired or Canceled | (44) | | $ 18.05 | | (101) | | $ 21.71 | | (1,766) | | $ 19.99 |
| Exercised | (7,605) | | $ 20.08 | | (14,630) | | $ 21.76 | | (5,528) | | $ 17.78 |
| | | | | | | | | | | | |
| Outstanding at End of Year | 11,771 | | $ 18.25 | | 19,420 | | $ 18.96 | | 34,151 | | $ 20.13 |
| | | | | | | | | | | | |
| Exercisable at End of Year | 9,612 | | $ 18.73 | | 12,670 | | $ 19.78 | | 15,746 | | $ 21.00 |
CSX CORPORATION
PART II
Item 8. Financial Statements and Supplementary Data
NOTE 4. Stock Plans and Share-Based Compensation, continued
The following table summarizes information about stock options outstanding at December 2007:
| | | | Weighted- | | | | |
| | | | Average | | Weighted- | | Aggregate |
| | Number | | Remaining | | Average | | Intrinsic |
| | Outstanding | | Contractual | | Exercise | | Value(a) |
| Exercise Price | (000s) | | Life (Years) | | Price | | (Millions) |
| | | | | | | | |
| Options Outstanding: | | | | | | | |
| $10 to $15 | 526 | | 2.31 | | $ 12.47 | | $ 16 |
$15 to $20(b) | 9,359 | | 4.54 | | $ 17.78 | | $ 240 |
| $20 to $25 | 1,789 | | 1.26 | | $ 21.92 | | $ 38 |
| $25 to $30 | 97 | | 0.33 | | $ 26.33 | | $ 2 |
| Total | 11,771 | | 3.90 | | $ 18.25 | | $ 296 |
| | | | | | | | |
| Options Exercisable: | | | | | | | |
| $10 to $15 | 526 | | 2.31 | | $ 12.47 | | $ 16 |
$15 to $20(b) | 7,200 | | 4.29 | | $ 18.30 | | $ 181 |
| $20 to $25 | 1,789 | | 1.26 | | $ 21.92 | | $ 38 |
| $25 to $30 | 97 | | 0.33 | | $ 26.33 | | $ 2 |
| Total | 9,612 | | 3.58 | | $ 18.73 | | $ 237 |
| (a) Aggregate intrinsic value represents the amount employees would have received if the options were exercised as of December 2007. |
| (b) The difference between options outstanding and options exercisable is that a portion of options granted in 2003 have not yet vested. |
The total intrinsic value of options exercised, which represents the value paid to current and former employees who exercised options for fiscal years ended 2007, 2006 and 2005, was $163 million, $147 million and $24 million, respectively.
Restricted Stock Awards
Restricted stock awards vest over an employment period of up to five years. The following table provides information about outstanding restricted stock awards.
| | Fiscal Years |
| | 2007 | 2006 | 2005 |
Number of Restricted Stock Awards Outstanding (Thousands) | 92 | 220 | 550 |
| Weighted Average Fair Value at Grant Date | $ 24.26 | $ 19.44 | $ 16.36 |
Restricted Stock Award Expense (Millions) | $ 1 | $ 2 | $ 2 |
CSX CORPORATION
PART II
Item 8. Financial Statements and Supplementary Data
NOTE 4. Stock Plans and Share-Based Compensation, continued
Long-term Incentive Plans
The CSX Long-term Incentive Plans were adopted under the CSX Omnibus Incentive Plan. The objective of these long-term incentive plans is to motivate and reward key members of management and executives for achieving and exceeding certain strategic initiatives.
In 2007, performance units were granted to certain layers of management under a new long-term incentive plan adopted under the CSX Omnibus Incentive Plan. This plan provides for a three-year cycle ending in fiscal year 2009. The key financial target is Surface Transportation operating ratio, which is defined as annual operating expenses divided by revenue of the Company’s rail and intermodal businesses and is calculated excluding certain non-recurring items. Grants were made in performance units and are payable in CSX common stock. The payout range for the majority of participants will be between 0% and 200% of the original grant, with each unit being equivalent to one share of CSX stock. The payout for certain senior executive officers is subject to a 20% increase or decrease based upon certain additional pre-established financial targets. This could result in a maximum payout of 240% of the original grant. However, any payout to certain senior executive officers is also subject to a reduction of up to 30% at the discretion of the Compensation Committee of the Board of Directors based upon Company performance against certain CSX strategic initiatives. Units in the plan have a weighted average grant date fair value of $43.33, which includes the value of both the initial grant and subsequent, smaller grants issued at different prices based on grant date fair value to new or promoted employees not previously included.
In 2006, grants under two long-term incentive plans were made in the form of performance units. One of the plans provided for a two-year cycle ending in fiscal year 2007 and the other plan provided for a three-year cycle ending in fiscal year 2008. The terms for these plans are substantially similar to the 2007 plan. Units in the plans have a weighted average grant date fair value of $36.86, which includes the value of both the initial grant and subsequent, smaller grants at different prices to new or promoted employees not previously included. One of the 2006 plans ended on December 28, 2007, and CSX issued 1.4 million net shares in 2008 as a result of the achievement of performance targets for the two preceding fiscal years, which had a net market value of $58 million.
CSX also issued 1.5 million shares in 2006 related to the expiration of the 2004/2005 long-term incentive plan. The objective of the 2004/2005 plan was to motivate and reward key members of management and executives for achieving and exceeding a two-year modified free cash flow goal, and the award was paid in cash and CSX common stock.
CSX CORPORATION
PART II
Item 8. Financial Statements and Supplementary Data
NOTE 4. Stock Plans and Share-Based Compensation, continued
Total expense incurred due to long-term incentive plans was as follows:
| | Fiscal Years |
| | 2007 | 2006 | 2005 |
| Long-term Incentive Plan Compensation Expense | $ 67 | $ 35 | $ 75 |
As of December 2007, there was $29 million of total unrecognized compensation cost related to these plans that is expected to be recognized over a weighted-average period of approximately 1.5 years. The activity related to each of the outstanding long-term incentive plans is summarized as follows:
| | 2006 - 2008 | 2007 - 2009 |
| | Plan Units | Plan Units |
| | Outstanding | Outstanding |
| | (000s) | (000s) |
| Unvested at December 30, 2005 | - | - |
| Granted in 2006 | 697 | - |
| Forfeited in 2006 | (7) | - |
| | | |
| Unvested at December 29, 2006 | 690 | - |
| Granted in 2007 | 26 | 526 |
| Forfeited in 2007 | (25) | (11) |
| | | |
| Unvested at December 28, 2007 | 691 | 515 |
CSX CORPORATION
PART II
Item 8. Financial Statements and Supplementary Data
NOTE 4. Stock Plans and Share-Based Compensation, continued
Stock Plan for Directors
The Stock Plan for Directors, approved by the shareholders in 1992, governs in part the manner in which directors' fees and retainers were paid. At the end of 2007, the minimum retainer to be paid in CSX common stock was 50% of the annual retainer, but each director may elect to receive the entire retainer and fees in CSX common stock. In addition, each director receives an annual payment made entirely in CSX common stock. The following table provides information about shares issued to directors.
| | | Fiscal Years |
| | | 2007 | 2006 | 2005 |
Shares Issued to Directors (Thousands) | | 68 | 70 | 74 |
Expense (Millions) | | $ 3 | $ 3 | $ 2 |
The Plan permits each director, in accordance with Internal Revenue Code Section 409A, to defer receipt of fees. Deferred cash amounts were credited to an account and invested in a choice of eight investment selections, including a CSX common stock equivalent fund. Distributions were made in accordance with elections made by the directors, consistent with the terms of the Plan. At December 2007, there were 1 million shares of common stock reserved for issuance under this Plan.
Shareholder Dividend Reinvestment Plan
CSX maintains the Shareholder Dividend Reinvestment Plan under which shareholders may use dividends paid on CSX common stock held in the plan to purchase additional shares of stock. The following table provides information about shares available for issuance under this plan at the end of fiscal years 2007, 2006 and 2005.
| | | Fiscal Years |
| | | 2007 | 2006 | 2005 |
Number of Shares Available for Issuance (Thousands) | 10,906 | 10,642 | 10,295 |
CSX CORPORATION
PART II
Item 8. Financial Statements and Supplementary Data
NOTE 5. Hurricane Katrina
In August 2005, Hurricane Katrina caused extensive damage to Company assets on the Gulf Coast including damage to track infrastructure and bridges. Operations were returned to pre-hurricane conditions by the end of the first quarter of 2006.
In order to determine the proper accounting treatment for the damage, the Company reviewed EITF 01-10, Accounting for the Impact of the Terrorist Attacks of September 11, 2001, specifically Issue 3, of that consensus, in which the Task Force concluded that insurance recoveries in connection with property and casualty losses should be recognized when realization of the claim for recovery of a loss recognized in the financial statements is deemed probable. Information regarding the Company’s insurance coverage at that time, damage estimates and the allocation of the insurance deductible is as follows:
Insurance Coverage
In 2005, the Company had insurance coverage of $535 million, after a $25 million deductible (per occurrence), for the following types of losses:
| | · | Fixed Assets Damages - CSX is entitled to the current replacement cost of the damaged assets. The Company’s bridges and track damaged by Hurricane Katrina comprised the majority of these types of losses. |
| | · | Business Interruption - The Company is entitled to recover the increased costs incurred to allow the Company to continue operations and to minimize the overall business impact to the Company during the period of indemnity. These increased costs include rerouting and other costs. |
| | · | Lost Profit - The Company is entitled to recover lost profits, net of associated expenses, during the period of indemnity. The period of indemnity is defined in the relevant policies of insurance and extends not only through the date upon which the railroad network was restored to its original operations, but for such additional time as may be required to restore revenue to the same level as would have existed had no loss occurred. |
The Company’s insurance policies do not prioritize coverage based on types of losses. As claims were submitted to the insurance companies, they were reviewed and preliminary payments were received until all losses were incurred and documented. A final payment will be received once the Company and its insurers agree on the total value of the claim.
CSX CORPORATION
PART II
Item 8. Financial Statements and Supplementary Data
| NOTE 5. Hurricane Katrina, continued |
Damage Estimates
Management’s current loss estimate is approximately $450 million. Damages are categorized as follows:
| | · | Fixed Asset Damages - The cost estimate was based on the replacement value of approximately 39 miles of continuous track, six major bridges, numerous small bridges, signal and communication damage, locomotive repair and facilities damaged throughout the region. |
| | · | Incremental Expenses - The Company’s incremental expenses relate primarily to rerouting and other costs. Rerouting costs are costs to move traffic either through alternative locations on the Company’s network or on other railroad lines. Other costs include debris removal, maintenance on equipment damaged by water, supplies, environmental expenses, maintenance labor and other various items. |
| | · | Lost Profit - The Company estimated the impact on revenue at a location and customer-specific level. |
Allocation of Deductible
The Company’s insurance policies required its participation in the first $25 million of each loss event, without regard to the category of the covered losses. Because the Company’s insurance policies do not specifically apply the deductible by the types of losses covered, CSX believes it is inconsistent with the form and economic substance of the Company’s policies to attribute the entire deductible to a single component of covered losses. Therefore, the Company allocated the $25 million self-insured deductible among the above three categories of losses in proportion to the best estimate of the total ultimate losses eligible for recovery under the Company’s insurance policies.
CSX CORPORATION
PART II
Item 8. Financial Statements and Supplementary Data
NOTE 5. Hurricane Katrina, continued
Gain on Insurance Recoveries
As of December 2007, the Company has collected $367 million of insurance proceeds and recognized $195 million of pre-tax gains for claims related to Hurricane Katrina. The gains were attributable to recovering amounts in excess of the net book value of damaged fixed assets and to recording recoveries related to lost profits. Additional cash proceeds are expected and will result in future gain recognition.
Details of how the gain was calculated are as follows:
| | Fiscal Years |
| (Dollars in Millions) | 2007 | 2006 | 2005 |
| Total Insurance Proceeds | $ 29 | $ 268 | $ 70 |
| Less Recoverable Losses: |
| | Net book value of fixed asset damage | - | 1 | 41 |
| | Incremental expense | 2 | 56 | 72 |
| | Prior year receivable | - | 43 | - |
| Gain/(Receivable) | $ 27 | $ 168 | $ (43) |
Gain contingencies subject to FIN 30, Accounting for Involuntary Conversions of Nonmonetary Assets to Monetary Assets and SFAS 5, Accounting for Contingencies (“SFAS 5”), were not recognized until the period in which all contingencies were resolved or cash proceeds were received. The insurance recovery for the replacement cost of property damage in excess of book value and the recovery of lost profits were considered to be gain contingencies. Therefore the net gain (after applying the insurance deductible) was deferred until the cash proceeds are/were received.
In measuring the losses incurred in 2005 attributed to Hurricane Katrina, the Company considered the actual losses reflected in the financial statements and the allocable deductible (based on expected total recoveries from insured losses), and recorded a receivable for the difference based on probable insurance recoveries at December 30, 2005. No receivables were recorded at the end of fiscal year 2007 or 2006 because cash proceeds exceeded the net book value of fixed asset damage and incremental expenses that were paid.
CSX CORPORATION
PART II
Item 8. Financial Statements and Supplementary Data
NOTE 5. Hurricane Katrina, continued
Cash Flows
Cash proceeds from the insurers are not specific to the types of losses and so, for cash flow presentation, the Company allocated the proceeds ratably among the three types of losses mentioned above. Allocated cash proceeds for lost profits and incremental expenses were classified as operating activities since they related directly to revenue and expenses from operations and were $13 million, $121 million and $29 million for 2007, 2006 and 2005, respectively. Allocated cash proceeds for fixed asset damage were classified as investing activities since these proceeds had a direct relationship to money the Company spent on property additions to repair the hurricane-damaged assets that were recorded in the same category. Cash proceeds for fixed asset damage were $16 million, $147 million and $41 million for 2007, 2006 and 2005, respectively.
NOTE 6. Casualty, Environmental and Other Reserves
Activity related to casualty, environmental and other reserves is as follows:
| | Casualty | Separation | Environmental | Other | |
| (Dollars in Millions) | Reserves | Liabilities | Reserves | Reserves | Total |
| |
| Balance December 31, 2004 | $ 705 | $ 155 | $ 59 | $ 128 | $ 1,047 |
| Charged to Expense | 181 | - | 32 | 47 | 260 |
| Change in Estimate | (38) | - | - | - | (38) |
| Payments | (173) | (34) | (20) | (78) | (305) |
| |
| Balance December 30, 2005 | $ 675 | $ 121 | $ 71 | $ 97 | $ 964 |
| Charged to Expense | 143 | - | 20 | 48 | 211 |
| Payments | (181) | (16) | (20) | (52) | (269) |
Reclassifications(a) | - | 15 | - | - | 15 |
| |
| Balance December 29, 2006 | $ 637 | $ 120 | $ 71 | $ 93 | $ 921 |
Charged to Expense(b) | 141 | - | 76 | 79 | 296 |
| Change in Estimate | (99) | - | - | - | (99) |
Payments(b) | (133) | (17) | (47) | (50) | (247) |
| | | | | | |
| Balance December 28, 2007 | $ 546 | $ 103 | $ 100 | $ 122 | $ 871 |
| (a) | The reclassifications in 2006 were reclassified from Labor and Fringe Benefits Payable. |
| (b) | Charges to expense and payments for environmental reserves were higher in 2007 primarily due to clean-up costs associated with an increase in significant train accidents. |
CSX CORPORATION
PART II
Item 8. Financial Statements and Supplementary Data
NOTE 6. Casualty, Environmental and Other Reserves, continued
Casualty, environmental and other reserves were determined to be critical accounting estimates due to the need for significant management judgments. They are provided for in the Consolidated Balance Sheets as follows:
| | | December 28, 2007 | | December 29, 2006 |
| (Dollars in Millions) | Current | Long-term | Total | | Current | Long-term | Total |
| | | | | | | | | |
| Casualty | $ 157 | $ 389 | $ 546 | | $ 172 | $ 465 | $ 637 |
| Separation | 16 | 87 | 103 | | 20 | 100 | 120 |
| Environmental | 42 | 58 | 100 | | 26 | 45 | 71 |
| Other | 32 | 90 | 122 | | 35 | 58 | 93 |
| | Total | $ 247 | $ 624 | $ 871 | | $ 253 | $ 668 | $ 921 |
Details with respect to each type of reserve are described below. Actual settlements and claims received could differ. The final outcome of these matters cannot be predicted with certainty. Considering the legal defenses available, the liabilities that have been recorded and other factors, it is the opinion of management that none of these items, when finally resolved, will have a material effect on the Company’s results of operations, financial condition and liquidity. However, should a number of these items occur in the same period, they could have a material effect on the results of operations, financial condition and liquidity in a particular quarter or fiscal year.
Casualty
Casualty reserves represent accruals for personal injury and occupational injury claims. Currently, no individual claim is expected to exceed the Company’s self-insured retention amount of $25 million. To the extent the value of an individual claim exceeds the self-insured retention amount, CSX would present the liability on a gross basis with a corresponding receivable for insurance recoveries. Personal injury and occupational claims are presented on a gross basis and in accordance with SFAS 5. These reserves fluctuate with independent third party estimates, which are reviewed by management, and the timing of payments. Most of the claims were related to CSXT unless otherwise noted.
Defense and processing costs, which historically have been insignificant and are anticipated to be insignificant in the future, are not included in the recorded liabilities. The Company is presently self-insured for personal injury and occupational-related claims.
CSX CORPORATION
PART II
Item 8. Financial Statements and Supplementary Data
NOTE 6. Casualty, Environmental and Other Reserves, continued
Personal Injury
Personal injury reserves represent liabilities for employee work-related and third-party injuries. Work-related injuries for CSXT employees are primarily subject to the Federal Employers’ Liability Act (“FELA”). In addition to FELA liabilities, employees of other CSX subsidiaries are covered by various state workers’ compensation laws, the Federal Longshore and Harbor Workers’ Compensation Program or the Maritime Jones Act.
CSXT retains an independent actuarial firm to assist management in assessing the value of personal injury claims and cases. An analysis is performed by the independent actuarial firm semi-annually and is reviewed by management. The methodology used by the actuary includes a development factor to reflect growth or reduction in the value of these personal injury claims. It is based largely on CSXT’s historical claims and settlement experience. Actual results may vary from estimates due to the type and severity of the injury, costs of medical treatments and uncertainties in litigation. Reserves for personal injury claims were $338 million and $424 million at December 2007 and December 2006, respectively.
During 2007, the Company reduced personal injury reserves by $99 million based on management’s review of the actuarial analyses performed by an independent actuarial firm. This reduction is due to a trend of significant decreases in the number and severity of work-related injuries for CSXT employees since 2003. The analyses further indicated a reduction of large catastrophic claims since 2003, which also was determined to be a trend. These reductions were included in materials, supplies and other in the Consolidated Income Statements.
Occupational
Occupational claims arise from allegations of exposures to certain materials in the workplace, such as asbestos, solvents (which include soaps and chemicals) and diesel fuels or allegations of chronic physical injuries resulting from work conditions, such as repetitive stress injuries, carpal tunnel syndrome and hearing loss.
Reserves for asbestos related claims were $129 million and $121 million at December 2007 and December 2006, respectively. Reserves for all other occupational claims were $79 million and $92 million at December 2007 and December 2006, respectively.
CSX CORPORATION
PART II
Item 8. Financial Statements and Supplementary Data
NOTE 6. Casualty, Environmental and Other Reserves, continued
Asbestos
The Company is party to a number of occupational claims by employees alleging exposure to asbestos in the workplace. The heaviest possible exposure for employees was due to work conducted in and around steam locomotive engines that were largely phased out beginning around the 1950s. However, other types of exposures, including exposure from locomotive component parts and building materials, continued until it was substantially eliminated by 1985. Additionally, the Company has retained liability for asbestos claims filed against its previously owned international container shipping business.
The Company retains a third party specialist with extensive experience in performing asbestos and other occupational studies to assist management in assessing the value of the Company’s claims and cases. The analysis is performed by the specialist semi-annually and is reviewed by management. The objective of the analysis is to determine the number of estimated incurred but not reported (“IBNR”) claims and the estimated average cost per claim to be received over the next seven years. Seven years was determined by management to be the time period in which probable claim filings and claim values could be estimated with more certainty.
The Company, with the assistance of the third party specialist, determines its potentially exposed population and is then able to calculate the estimated number of IBNR claims. The estimated average cost per claim is then determined utilizing recent actual average cost per claim data and national industry data. Key elements of the assessment include the following:
| | · | An estimate is computed using a ratio of Company employee data to national employment for select years during the period 1938-2001. The Company uses railroad industry historical census data because it does not have detailed employment records in order to compute the population of potentially exposed employees. |
| | · | The projected incidence of disease is estimated based on epidemiological studies using employees’ age and the duration and intensity of potential exposure while employed. Epidemiology is the medical science that deals with the incidence, distribution and control of diseases in a population. |
CSX CORPORATION
PART II
Item 8. Financial Statements and Supplementary Data
NOTE 6. Casualty, Environmental and Other Reserves, continued
| | · | An estimate of the future anticipated claims filing rate by type of disease (non-malignant, cancer and mesothelioma) is computed using the Company’s average historical claim filing rates for a three-year calibration period, excluding a surge in claims originating in West Virginia. In 2006, the Company received 852 asbestos claims in West Virginia in which the claimants were neither exposed in West Virginia nor residents of the state. CSX believes these claims will not have merit as no medical evidence has been provided to substantiate the claims and therefore CSX has excluded them from the calibration period. Claim levels in 2007 returned to expected levels and management feels this calibration period represents the best estimate of future filing rates. |
| | · | An estimate of the future anticipated dismissal rate by type of claim is computed using the Company’s historical average dismissal rates observed during the current calibration period noted above. |
| | · | An estimate of the future anticipated settlement by type of disease is computed using the Company’s historical average of dollars paid per claim for pending and future claims using the average settlement by type of incident observed during the current calibration period noted above. |
From these assumptions, the Company projects the incidence of each type of disease to the estimated population to determine the total estimated number of employees that could potentially assert a claim. Historical claim filing rates were applied for each type of disease to the total number of employees that could potentially assert a claim to determine the total number of anticipated claim filings by disease type. Historical dismissal rates, which represented claims that were closed without payment, were deducted to calculate the number of future claims by disease type that would likely require payment by the Company. Finally, the number of such claims was multiplied by the average settlement value to estimate the Company’s future liability for IBNR asbestos claims.
The estimated future filing rates and estimated average claim values were the most sensitive assumptions for this reserve. A 1% increase or decrease in either the forecasted number of IBNR claims or the average claim values would result in an approximate $1 million increase or decrease in the liability recorded for unasserted asbestos claims.
Undiscounted liabilities recorded related to asbestos claims were as follows:
| | December 28, | | December 29, |
| (Dollars in Millions) | 2007 | | 2006 |
| Asbestos: | | | |
| | | | |
| Incurred but not reported claims | 54 | | 52 |
| Asserted claims | 75 | | 69 |
| Total liability | 129 | | 121 |
| | | | |
| Current liability | 15 | | 30 |
CSX CORPORATION
PART II
Item 8. Financial Statements and Supplementary Data
NOTE 6. Casualty, Environmental and Other Reserves, continued
In 2005, management updated its estimate of the IBNR liability exposure with the assistance of the third party specialists, which resulted in recognition of a $48 million favorable change associated with asbestos liabilities (a net $38 million favorable change for all occupational liabilities). During 2004 and 2005, asbestos related disease claims filed against the Company dropped substantially, particularly bulk claims filed by certain law firms. In 2003, the Company received a significant number of filings. The Company believes the high 2003 number was attributable to an attempt to file before a new, more restrictive venue law took effect in West Virginia in mid-2003. As a result, management reassessed the calibration period from a four-year average to a three-year average in 2005, excluding the surge in claims originating in West Virginia. Management believes this calibration period represents the best estimate of future filing rates. There have been no changes to the number of years used in the calibration period since 2005.
Other Occupational
The Company retains a third party specialist with extensive experience in performing other occupational studies to assist management in assessing the value of the Company’s claims and cases. The analysis is performed by the specialist semi-annually and is reviewed by management. Similar to the asbestos liability estimation process, the key elements of the assessment include the following:
| | · | An estimate of the potentially exposed population for other occupational diseases is calculated by projecting active versus retired workforce from 2002 to 2010 using a growth rate projection for overall railroad employment made by the Railroad Retirement Board in its June 2003 report. |
| | · | An estimate of the future anticipated claims filing rate by type of injury, employee type and active versus retired employee is computed using the Company’s average historical claim filing rates for the calibration periods management felt were representative of future filing rates. For carpal tunnel and repetitive stress injuries, the current calibration period is a 1-year average of claim filings. Hearing loss uses a 3-year calibration period, and all other diseases or injuries use a 2-year calibration period. An estimate is made to forecast future claims by using the filing rates by disease and the active and retired Company population each year. |
CSX CORPORATION
PART II
Item 8. Financial Statements and Supplementary Data
NOTE 6. Casualty, Environmental and Other Reserves, continued
| | · | An estimate of the future anticipated settlement by type of injury is computed using the Company’s historical average of dollars paid per claim for pending and future claims using the average settlement by type of injury observed during a period that management feels is representative of future settlement amounts. |
The estimated future filing rates and estimated average claim values were the most sensitive assumptions for this reserve. A 1% increase or decrease in either the forecasted number of IBNR claims or the average claim values would not result in a material increase or decrease in the liability recorded for unasserted other occupational claims.
Undiscounted recorded liabilities related to other occupational claims were as follows:
| | December 28, | | December 29, |
| (Dollars in Millions) | 2007 | | 2006 |
| Other Occupational: | | | |
| | | | |
| Incurred but not reported claims | 47 | | 53 |
| Asserted claims | 32 | | 39 |
| Total liability | 79 | | 92 |
| | | | |
| Current liability | 29 | | 30 |
Summary
A summary of asbestos and other occupational claims activity is as follows:
| | Fiscal Years |
| | 2007 | 2006 |
| Asserted Claims | | |
| Open Claims - Beginning of Year | 11,116 | 10,639 |
| New Claims Filed | 930 | 1,504 |
| Claims Settled | (553) | (767) |
| Claims Dismissed | (505) | (260) |
| Open Claims - End of Year | 10,988 | 11,116 |
CSX CORPORATION
PART II
Item 8. Financial Statements and Supplementary Data
NOTE 6. Casualty, Environmental and Other Reserves, continued
Approximately 6,000 of the open claims at December 2007 were asbestos claims against CSX’s previously owned international container shipping business. Because these claims were against multiple vessel owners, the Company’s reserves reflect its portion of those claims. The Company had approximately $9 million reserved for these shipping business claims at December 2007 and 2006. The remaining open claims were asserted against CSXT.
Separation
Separation liabilities provide for the estimated costs of implementing workforce reductions, improvements in productivity and certain other cost reductions at the Company's major transportation units since 1991. These liabilities are expected to be paid out over the next 15 to 20 years from general corporate funds and may fluctuate depending on the timing of payments and associated taxes.
Environmental
The Company is a party to various proceedings related to environmental issues, including administrative and judicial proceedings, involving private parties and regulatory agencies. The Company has been identified as a potentially responsible party at approximately 247 environmentally impaired sites, many of which were, or may be, subject to remedial action under the Federal Comprehensive Environmental Response, Compensation and Liability Act of 1980, or CERCLA, also known as the Superfund law, or similar state statutes. Most of these proceedings arose from environmental conditions on properties used for ongoing or discontinued railroad operations. However, a number of these proceedings are based on allegations that the Company, or its predecessors, sent hazardous substances to facilities owned or operated by others for treatment or disposal. In addition, some of the Company’s land holdings were leased to others for commercial or industrial uses that may have resulted in releases of hazardous substances or other regulated materials onto the property and could give rise to proceedings against the Company.
In any such proceedings, the Company is subject to environmental clean-up and enforcement actions under the Superfund Law, as well as similar state laws that may impose joint and several liability for clean-up and enforcement costs on current and former owners and operators of a site without regard to fault or the legality of the original conduct. These costs could be substantial.
CSX CORPORATION
PART II
Item 8. Financial Statements and Supplementary Data
NOTE 6. Casualty, Environmental and Other Reserves, continued
In accordance with Statement of Position 96-1, Environmental Remediation Liabilities, the Company reviews its role with respect to each site identified at least once a quarter. Based on the review process, the Company has recorded amounts to cover contingent future environmental remediation costs with respect to each site to the extent such costs are estimable and probable. The recorded liabilities for estimated future environmental costs are undiscounted and include amounts representing the Company's estimate of unasserted claims, which the Company believes to be immaterial. The liability includes future costs for remediation and restoration of sites as well as any significant ongoing monitoring costs, but excludes any anticipated insurance recoveries. Payments related to these liabilities are expected to be made over the next several years.
Currently, the Company does not possess sufficient information to reasonably estimate the amounts of additional liabilities, if any, on some sites until completion of future environmental studies. In addition, conditions that are currently unknown could, at any given location, result in exposure, the amount and materiality of which cannot presently be reliably estimated. Based upon information currently available, however, the Company believes its environmental reserves are adequate to fund remedial actions to comply with present laws and regulations, and that the ultimate liability for these matters, if any, will not materially affect its overall results of operations, financial condition and liquidity.
Other
Other reserves of $122 million and $93 million for 2007 and 2006, respectively, include liabilities for various claims, such as longshoremen disability claims, freight claims and claims for property, automobile and general liability. These liabilities are accrued at the estimable and probable amount in accordance with SFAS 5.
Longshoremen disability claims represent liability for assessments under Section 8f of the United States Longshore and Harbor Workers’ Compensation Program. These reserves have amounts accrued for second injury fund liabilities, which represent the non-medical portion of employee claims which are paid by the United States Department of Labor and are attributed to an earlier injury to the same employee.
Freight claims represent claims for both freight loss and damage and freight rate disputes. Freight loss and damage claims are liabilities that resulted from the loss or damage of customer freight while being handled by the Company’s transportation services. Freight rate disputes represent liabilities for customer claims regarding the rate charged by the Company for its transportation services. Liabilities for freight rate disputes are recorded as a reduction of revenue.
CSX CORPORATION
PART II
Item 8. Financial Statements and Supplementary Data
NOTE 6. Casualty, Environmental and Other Reserves, continued
The Company accrues for claims related to property, automobile and general liability as noted above. The Company is also required to maintain primary and state mandated coverage for Company property and vehicle fleets. General liability is coverage for liability arising from operations of non-rail CSX subsidiaries.
NOTE 7. Commitments and Contingencies
Lease Commitments
The Company has various lease agreements with other parties with terms up to 30 years. Non-cancelable, long-term leases generally include provisions for maintenance, options to purchase and options to extend the terms.
At December 2007, minimum building and equipment rentals and commitments for vessels under these operating leases were as follows:
| (Dollars in millions) | | | |
| | Operating | Sublease | Net Lease |
| Years | Leases | Income | Commitments |
| 2008 | $ 160 | $ 48 | $ 112 |
| 2009 | 140 | 37 | 103 |
| 2010 | 119 | 31 | 88 |
| 2011 | 90 | 17 | 73 |
| 2012 | 75 | 21 | 54 |
| Thereafter | 264 | 74 | 190 |
| Total | $ 848 | $ 228 | $ 620 |
Operating leases and an equal portion of sublease income include approximately $171 million relating to ongoing operating lease commitments for vessels and equipment, which have been subleased to Horizon Lines, Inc. (“Horizon”), a former subsidiary previously named CSX Lines. CSX believes Horizon will fulfill its contractual commitments with respect to such leases and CSX will have no further liability for those obligations.
In addition to the commitments in the table, the Company also has agreements covering equipment leased from Conrail Inc. (“Conrail”).
| | Fiscal Years |
| (Dollars in Millions) | 2007 | 2006 | 2005 |
| Rent Expense on Operating Leases | $ 451 | $ 514 | $ 523 |
Rent expense on operating leases included $310 million, $355 million and $384 million of net daily rental charges on railroad operating equipment in 2007, 2006 and 2005, respectively, which are not long-term commitments. The Company uses the straight-line method to recognize rent expense associated with operating leases that include escalations over their terms.
CSX CORPORATION
PART II
Item 8. Financial Statements and Supplementary Data
NOTE 7. Commitments and Contingencies, continued
Purchase Commitments
CSXT has a commitment under a long-term maintenance program that currently covers 43% of CSXT’s fleet of locomotives. The agreement is based on the maintenance cycle for each locomotive. Under CSXT’s current obligations, the agreement will expire no earlier than 2028 and may last until 2031 depending upon when certain locomotives are placed in service. The costs expected to be incurred throughout the duration of the agreement fluctuate as locomotives are placed into, or removed from, service or as required maintenance schedules are revised. CSXT may terminate the agreement at its option after 2012, though such action would trigger certain liquidated damages provisions.
The following table summarizes CSXT’s payments under the long-term maintenance program:
| | Fiscal Years |
| (Dollars in Millions) | 2007 | 2006 | 2005 |
| Amounts Paid | $ 217 | $ 183 | $ 170 |
As a result of agreements executed in August 2005 and February 2006, CSXT has purchase obligations related to a multi-year plan to acquire additional locomotives between 2006 and 2011. The amount of the ultimate purchase commitment depends upon the model of locomotive acquired and the timing of delivery. Annual payments related to the locomotive purchase obligations, including amounts that would be payable under the long-term maintenance program were estimated as follows:
| | Payments |
| (Dollars in Millions) | |
| 2008 | 446 |
| 2009 | 423 |
| 2010 | 258 |
| 2011 | 266 |
| 2012 | 275 |
| Thereafter | 4,773 |
| Total | $ 6,441 |
CSX CORPORATION
PART II
Item 8. Financial Statements and Supplementary Data
NOTE 7. Commitments and Contingencies, continued
Additionally, the Company has various other commitments to purchase technology, communications, railcar maintenance and other services from various suppliers. Total annual payments under all of these additional purchase commitments were estimated as follows:
| | Payments |
| (Dollars in Millions) | |
| 2008 | $ 175 |
| 2009 | 126 |
| 2010 | 68 |
| 2011 | 19 |
| 2012 | 13 |
| 2013 - 2031 | - |
| Total | $ 401 |
Insurance
The Company maintains numerous insurance programs, most notably for third-party casualty liability and for Company property damage and business interruption, with substantial limits. A specific amount of risk is retained by the Company on each of the casualty and property programs. Specifically, the Company has a $25 million deductible for each of the casualty and non-catastrophic property programs and a $50 million deductible for the catastrophic property program. This deductible only applies to the first event. If an event occurs in excess of the Company’s deductible and the Company does not elect to purchase additional insurance coverage, then the deductible for the second covered event will equal the amount of the claim in the first event.
Guarantees
CSX and certain of its subsidiaries are contingently liable, individually and jointly with others, as guarantors of approximately $72 million in obligations principally relating to leased equipment, vessels and joint facilities used by the Company in its current and former business operations. Utilizing the Company’s guarantee for these obligations allows the obligor to take advantage of lower interest rates and to obtain other favorable terms. Guarantees are contingent commitments issued by the Company that could require CSX or one of its affiliates to make payment to or to perform certain actions for the beneficiary of the guarantee based on another entity’s failure to perform.
CSX CORPORATION
PART II
Item 8. Financial Statements and Supplementary Data
NOTE 7. Commitments and Contingencies, continued
At December 2007, the Company’s guarantees primarily related to the following:
| | · | Guarantee of approximately $61 million of obligations of a former subsidiary, CSX Energy, in connection with a sale-leaseback transaction. CSX is, in turn, indemnified by several subsequent owners of the subsidiary against payments made with respect to this guarantee. Management does not expect that the Company will be required to make any payments under this guarantee for which CSX will not be reimbursed. CSX’s obligation for this guarantee will be completed in 2012. |
| | · | Guarantee of approximately $11 million of lease commitments assumed by A.P. Moller-Maersk (“Maersk”) for which CSX is contingently liable. CSX believes Maersk will fulfill its contractual commitments with respect to such lease commitments and CSX will have no further liability for those obligations. CSX’s obligation under this guarantee will be completed in 2011. |
As of December 2007, the Company had not recognized any liabilities in its financial statements in connection with any guarantee arrangements. The maximum amount of future payments the Company could be required to make under these guarantees is the amount of the guarantees themselves.
Fuel Surcharge Antitrust Litigation
Since May 2007, at least 28 putative class action suits were filed in various federal district courts against CSXT and the four other U.S.-based Class I railroads. The lawsuits contain substantially similar allegations to the effect that the defendants’ fuel surcharge practices relating to contract and unregulated traffic resulted from an illegal conspiracy in violation of antitrust laws. The suits seek unquantified treble damages (three times the amount of actual damages) allegedly sustained by purported class members, attorneys’ fees and other relief. All but three of the lawsuits purport to be filed on behalf of a class of shippers that allegedly purchased rail freight transportation services from the defendants through the use of contracts or through other means exempt from rate regulation during defined periods commencing as early as June 2003 and that were assessed fuel surcharges. Three of the lawsuits purport to be on behalf of indirect purchasers of rail services.
In July 2007, CSXT received a grand jury subpoena from the New Jersey Office of the Attorney General seeking information related to the same fuel surcharges that are the subject of the purported class actions. It is possible that additional federal or state agencies could initiate investigations into similar matters.
CSX CORPORATION
PART II
Item 8. Financial Statements and Supplementary Data
NOTE 7. Commitments and Contingencies, continued
CSXT believes that its fuel surcharge practices are lawful. Accordingly, CSXT intends to vigorously defend itself against the purported class actions, which it believes are without merit. CSXT cannot predict the outcome of the putative class action lawsuits, which are in their preliminary stages, or of any government investigations, charges or additional litigation that may be filed in the future. Penalties for violating antitrust laws can be severe, involving both potential criminal and civil liability. CSXT is unable to assess at this time the possible financial impact of this litigation. CSXT has not accrued any liability for an adverse outcome in the litigation. If a material adverse outcome were to occur and be sustained, it could have a material adverse impact on the Company’s results of operations, financial condition and liquidity.
Other Legal Proceedings
In addition to the matter described above, the Company is involved in litigation incidental to its business and is a party to a number of legal actions and claims, various governmental proceedings and private civil lawsuits, including, but not limited to, those related to environmental matters, FELA claims by employees, other personal injury claims and disputes and complaints involving certain transportation rates and charges. Some of the legal proceedings include claims for compensatory as well as punitive damages and others are, or are purported to be, class actions. While the final outcome of these matters cannot be predicted with certainty, considering among other things the meritorious legal defenses available and liabilities that have been recorded along with applicable insurance, it is currently the opinion of CSX management that none of these items will have a material adverse effect on the Company’s results of operations, financial condition and liquidity. An unexpected adverse resolution of one or more of these items, however, could have a material adverse effect on the Company’s results of operations, financial condition and liquidity in a particular quarter or fiscal year.
CSX CORPORATION
PART II
Item 8. Financial Statements and Supplementary Data
NOTE 8. Employee Benefit Plans
General
The Company sponsors defined benefit pension plans principally for salaried, management personnel. The plans provide eligible employees with retirement benefits based predominantly on years of service and compensation rates near retirement. For employees hired after December 31, 2002, benefits are determined based on a cash balance formula, which provides benefits by utilizing interest and pay credits based upon age, service and compensation.
In addition to these plans, CSX sponsors a post-retirement medical plan and a life insurance plan that provide benefits to full-time, salaried, management employees hired on or before December 31, 2002 upon their retirement if certain eligibility requirements are met. The post-retirement medical plan is contributory (partially funded by retirees), with retiree contributions adjusted annually. The life insurance plan is non-contributory.
| | Summary of Participants |
| | as of January 1, 2007 |
| | | | |
| | Pension Plans | | Post-retirement Medical Plan |
| Active Employees | 7,228 | | 3,675 |
| Retirees and Beneficiaries | 10,943 | | 10,412 |
Other(a) | 5,182 | | 270 |
| | | | |
| Total | 23,353 | | 14,357 |
| | (a) For pension plans, the other category consists of terminated but vested former employees. For post-retirement plans, the other category consists of employees on long-term disability that have not yet retired. |
As currently permitted by SFAS 87, Employers Accounting for Pensions, the Company has elected to use a plan measurement date of September 30 to actuarially value its pension and post-retirement plans. Effective fiscal year 2008, under the provisions of SFAS 158, CSX will be required to change the measurement date for pension and post-retirement benefit plans from September 30 to the last day of the Company’s fiscal year.
The Company engages independent, external actuaries to compute the amounts of liabilities and expenses relating to these plans subject to the assumptions that the Company selects.
CSX CORPORATION
PART II
Item 8. Financial Statements and Supplementary Data
NOTE 8. Employee Benefit Plans, continued
The benefit obligation for these plans represents the liability of the Company for current and retired employees and is affected primarily by the following:
| | · | service cost (benefits attributed to employee service during the period); |
| | · | interest cost (interest on the liability due to the passage of time); |
| | · | actuarial gains/losses (experience during the year different from that assumed and changes in plan assumptions); and |
| | · | benefits paid to participants. |
Cash Flows
Plan assets are amounts that have been segregated and restricted to provide benefits and include amounts contributed by the Company and amounts earned from invested contributions, net of benefits paid. The Company funds the cost of the post-retirement medical and life insurance benefits on a pay-as-you go basis. CSX does not expect to make cash contributions to its qualified defined benefit pension plans in 2008.
Future expected benefit payments are as follows:
| | Expected Cash Flows |
| (Dollars in Millions) | Pension Benefits | | Post-retirement Benefits(a) |
| 2008 | $ 146 | | $ 45 |
| 2009 | 145 | | 44 |
| 2010 | 148 | | 42 |
| 2011 | 150 | | 41 |
| 2012 | 152 | | 39 |
| Thereafter | 789 | | 169 |
| Total | $ 1,530 | | $ 380 |
| (a) The post-retirement benefit payments include an estimated annual reduction of $6 million due to the Medicare Part D Subsidy. |
CSX CORPORATION
PART II
Item 8. Financial Statements and Supplementary Data
NOTE 8. Employee Benefit Plans, continued
Plan Assets
The CSX Investment Committee (“the Investment Committee”), whose members were selected by the CFO and approved by the CEO, is responsible for managing pension plan assets. The Investment Committee utilizes an asset allocation strategy that was developed using asset return simulation in conjunction with projected plan liabilities. The allocation seeks maximization of returns within the constraints of acceptable risks considering the long-term investment horizon. A target allocation of 60% equity and 40% fixed income investments was established.
The distribution of pension plan assets as of the measurement date is as follows:
| | September 30, 2007 | | September 30, 2006 |
| | | Percent of | | | Percent of |
| (Dollars in Millions) | Amount | Total Assets | | Amount | Total Assets |
| Common Stocks | $ 964 | 60 | % | | $ 900 | 60 | % |
| Fixed Income | 626 | 39 | | | 598 | 39 | |
| Cash and Cash Equivalents | 17 | 1 | | | 13 | 1 | |
| | | | | | | | |
| Total | $ 1,607 | 100 | % | | $ 1,511 | 100 | % |
The Investment Committee provides investment guidelines to both the plan’s fixed income and equity fund managers. Within the broad asset classes that comprise the plan’s investments, common stocks were diversified based on allocations to domestic and foreign stocks. Allocations were maintained within 3% of targets. The U.S. stock segment includes style diversification among managers of large and small capitalization stocks. The Investment Committee limits investment by industry sectors, outlines individual stock issuer concentration and monitors the use of derivatives and CSX securities.
Fixed income securities were diversified across fund managers with differing investment styles and were benchmarked to a long duration index. The Investment Committee specifies the types of allowable investments, such as government, corporate and asset-backed bonds, and limits diversification between domestic and foreign investments and the use of derivatives. Additionally, it stipulates minimum credit quality constraints and any prohibited securities.
Individual investments or fund managers were selected in accordance with standards of prudence applicable to asset diversification and investment suitability. Fund investment performance is continuously monitored. Acceptable performance is determined in the context of the long-term return objectives of the fund and appropriate asset class benchmarks.
CSX CORPORATION
PART II
Item 8. Financial Statements and Supplementary Data
NOTE 8. Employee Benefit Plans, continued
Benefit Obligation, Plan Assets and Funded Status
Changes in benefit obligation and the fair value of plan assets for the plan year (October 1, 2006 through September 30, 2007) are as follows:
| | | Pension Benefits | | Post-retirement Benefits |
| | | Plan Year | Plan Year | | Plan Year | Plan Year |
| (Dollars in Millions) | 2007 | 2006 | | 2007 | 2006 |
| | | | | | | |
| Actuarial Present Value of Benefit Obligation | | | | | |
| Accumulated Benefit Obligation | $ 1,935 | $ 1,946 | | N/A | N/A |
| Projected Benefit Obligation | 2,067 | 2,078 | | $ 404 | $ 398 |
| | | | | | | |
| Change in Projected Benefit Obligation | | | | | |
Projected Benefit Obligation at Beginning of the Plan Year | $ 2078 | $ 2082 | | $ 398 | $ 444 |
| Service Cost | 33 | 36 | | 6 | 7 |
| Interest Cost | 115 | 105 | | 21 | 21 |
| Plan Participants' Contributions | - | - | | 16 | 16 |
| Actuarial (Gain)/Loss | (13) | 1 | | 22 | (35) |
| Benefits Paid | (146) | (146) | | (59) | (55) |
| | | | | | | |
| Benefit Obligation at End of Plan Year | $ 2,067 | $ 2,078 | | $ 404 | $ 398 |
| | | | | | | |
| Change in Plan Assets: | | | | | |
| Fair Value of Plan Assets at Beginning of the Plan Year | $ 1,511 | $ 1,536 | | $ - | $ - |
| Actual Return on Plan Assets | 186 | 99 | | - | - |
| Qualified Employer Contributions | 42 | 9 | | - | - |
| Non-qualified Employer Contributions | 14 | 13 | | 43 | 39 |
| Plan Participants' Contributions | - | - | | 16 | 16 |
| Benefits Paid | (146) | (146) | | (59) | (55) |
| | | | | | | |
| Fair Value of Plan Assets at End of Plan Year | $ 1,607 | $ 1,511 | | $ - | $ - |
| | | | | | | |
| Funded Status at September 30, 2007 | $ (460) | $ (567) | | $ (404) | $ (398) |
CSX CORPORATION
PART II
Item 8. Financial Statements and Supplementary Data
NOTE 8. Employee Benefit Plans, continued
Employer contributions and net post-retirement benefits paid during the fourth quarter to arrive at the net funded status of qualified and non-qualified benefit plans as of the end of the Company’s fiscal year are as follows:
| | | Pension Benefits | | Post-retirement Benefits |
| | | December 28, | December 29, | | December 28, | December 29, |
| (Dollars in Millions) | 2007 | 2006 | | 2007 | 2006 |
| | | | | | | |
| Funded Status at September 30, 2007 | $ (460) | $ (567) | | $ (404) | $ (398) |
| | | | | | | |
| Fourth Quarter Activity: | | | | | |
| | Qualified Employer Contributions (a) | 245 | 21 | | - | - |
| | Non-qualified Employer Contributions | 4 | 3 | | - | - |
| | Net Post-retirement Benefits Paid | - | - | | 10 | 10 |
| | | | | | | |
| Ending Net Funded Status | $ (211) | $ (543) | | $ (394) | $ (388) |
| (a) | During fiscal 2007, CSX made contributions of $266 million to its qualified defined benefit pension plans. The components of this include the $245 million of contributions made in fourth quarter 2007 plus $42 million of contributions made during the 2007 plan year (October 1, 2006 through September 30, 2007) as noted on page 104 less $21 million of contributions made during fourth quarter 2006. |
Amounts related to pension and post-retirement benefits are recorded on the balance sheet are as follows:
| | | Pension Benefits | | Post-retirement Benefits |
| | | December 28, | December 29, | | December 28, | December 29, |
| (Dollars in Millions) | 2007 | 2006 | | 2007 | 2006 |
| | | | | | | |
| Amounts Recorded in Consolidated Balance Sheets: | | | | |
| Pension Assets | $ 4 | $ - | | $ - | $ - |
| Current Liability | (12) | (14) | | (45) | (43) |
| Long-term Liability | (203) | (529) | | (349) | (345) |
| Net Amount Recognized in | | | | | |
| | Consolidated Balance Sheet | $ (211) | $ (543) | | $ (394) | $ (388) |
The funded status, or amount by which the benefit obligation exceeds the fair value of plan assets, represents a liability. At December 2007, the status of CSX plans was as follows:
| | Aggregate | Aggregate |
| | Fair Value | Projected |
| Benefit Obligations in Excess of Plan Assets | of Plan Assets | Benefit Obligation |
| Projected benefit obligation | $1.8 billion | ($2 billion) |
| Accumulated benefit obligation | $51 million | ($219 million) |
CSX CORPORATION
PART II
Item 8. Financial Statements and Supplementary Data
NOTE 8. Employee Benefit Plans, continued
Net Periodic Benefit Expense
The following table describes the components of net periodic benefit expense.
| | Pension Benefits | | Post-retirement Benefits |
| | Fiscal Years | | Fiscal Years |
| (Dollars in Millions) | 2007 | 2006 | 2005 | | 2007 | 2006 | 2005 |
| | | | | | | | |
| Service Cost | $ 33 | $ 36 | $ 34 | | $ 6 | $ 7 | $ 8 |
| Interest Cost | 115 | 105 | 107 | | 21 | 21 | 24 |
| Expected Return on Plan Assets | (118) | (117) | (120) | | - | - | - |
| Amortization of Prior Service Cost | 3 | 4 | 4 | | (5) | (5) | (5) |
| Amortization of Net Loss | 31 | 34 | 21 | | 3 | 7 | 13 |
| Net Periodic Benefit Expense | $ 64 | $ 62 | $ 46 | | $ 25 | $ 30 | $ 40 |
Pension and Other Post-Employment Benefits Adjustments
The following table shows the pre-tax change in other comprehensive income (loss) attributable to the components of net expense and the change in benefit obligation for CSX for pension and other post-employment benefits.
| | | | Pension Benefits | | Post-retirement Benefits |
| Components of Other | December | | December | | December | | December |
| | Comprehensive Income (Loss) | 2007 | | 2006 | | 2007 | | 2006 |
| (Dollars in Millions) | | | | | |
| | | | | | | | |
| Recognized in the balance sheet | | | | | | | |
| | Gains (Losses) (a) | $ 111 | | $ (62) | | $ (18) | | $ (71) |
| | Prior service costs | 4 | | 19 | | 5 | | (8) |
| | | | | | | | |
| (Income) Expense recognized in the income statement | | | | | | | |
| | Amortization of net loss (b) | 31 | | 34 | | 3 | | 7 |
| | Amortization of prior service cost (c) | 3 | | 4 | | (5) | | (5) |
| (a) | Prior year losses are primarily due to the adoption of SFAS 158. For additional information, see Note 1, Nature of Operations and Significant Accounting Policies. |
| (b) | The estimated amount to be expensed for 2008 is $23 million and $6 million for pension benefits and post- retirement benefits, respectively. |
| (c) | The estimated amount to be expensed for prior service costs for 2008 is $3 million and $(3) million for pension benefits and post-retirement benefits, respectively. |
CSX CORPORATION
PART II
Item 8. Financial Statements and Supplementary Data
NOTE 8. Employee Benefit Plans, continued
At December 2007, the balances of pre-tax amounts to be amortized that are included in accumulated other comprehensive income (a component of shareholders’ Equity) are as follows:
| | | | Post-retirement |
| | Pension Benefits | | Benefits |
| (Gains)/Losses | $ 351 | | $ 89 |
| Prior Service Costs | 16 | | (3) |
| Total | $ 367 | | $ 86 |
Assumptions
Weighted-average assumptions used in accounting for the plans were as follows:
| | | Pension Benefits | | Post-retirement Benefits |
| | | 2007 | 2006 | | 2007 | 2006 |
| Expected Long-term Return on Plan Assets: | | | | | |
| | Benefit Cost for Plan Year | 8.50% | 8.50% | | N/A | N/A |
| | Benefit Obligation at End of Plan Year | 8.50% | 8.50% | | N/A | N/A |
| | | | | | | |
| Discount Rates: | | | | | |
| | Benefit Cost for Plan Year | 5.75% | 5.25% | | 5.50% | 5.00% |
| | Benefit Obligation at End of Plan Year | 6.00% | 5.75% | | 5.75% | 5.50% |
| | | | | | | |
| Salary Scale Inflation | 4.10% | 4.10% | | 4.10% | 4.10% |
The net post-retirement benefit obligation was determined using the following assumptions for the health care cost trend rate for medical plans. The rate is assumed to gradually decrease to 4.75% by 2014. Additionally, there are cost differentials between Medicare and Non-Medicare eligible individuals which are reflected below.
| | | | | |
| | | Post-retirement Benefits |
| | | 2007 | | 2006 |
| Health Care Cost Trend Rate | | | |
| | Components of Benefit Cost: Non-Medicare Eligible | 10% | | 11% |
| | Components of Benefit Cost: Medicare Eligible | 11% | | 12% |
| | | | | |
| | Benefit Obligations: Non-Medicare Eligible | 9% | | 10% |
| | Benefit Obligations: Medicare Eligible | 10% | | 11% |
For every 1% change in the assumed health care cost trend rate, service and interest cost will change $1 million (consolidated income statement impact). For every 1% increase in the health care cost trend rate the Company’s benefit obligation will increase by $15 million, and for every 1% decrease the Company’s benefit obligation will decrease by $13 million (consolidated balance sheet impact). An increase in rates has a greater effect on the Company’s benefit obligation due to the impact of compounding on future years.
CSX CORPORATION
PART II
Item 8. Financial Statements and Supplementary Data
NOTE 8. Employee Benefit Plans, continued
Medicare Prescription Drug, Improvement and Modernization Act of 2003
As required by the Medicare Prescription Drug, Improvement and Modernization Act of 2003 (the “Act”), CSX has determined that its medical plan’s prescription drug benefit qualifies as actuarially equivalent to the benefit that would be paid under the Act. CSX has received $4 million in tax free federal reimbursement for prescription drug claims in both 2007 and 2006.
Other Plans
Under collective bargaining agreements, the Company participates in a multi-employer benefit plan, which provides certain post-retirement health care and life insurance benefits to eligible contract employees. Premiums under this plan are expensed as incurred and amounted to $31 million, $30 million and $30 million in 2007, 2006 and 2005, respectively.
The Company maintains savings plans for virtually all full-time salaried employees and certain employees covered by collective bargaining agreements. Expense associated with these plans was $24 million, $18 million and $19 million for 2007, 2006 and 2005, respectively. The increase in 2007 is primarily driven by new labor agreements that increased the Company’s 401(k) match for certain plans.
NOTE 9. Debt and Credit Agreements
Debt was as follows:
| | | | Average | | |
| | | | Interest | | |
| | | | Rates at | | |
| | | | December 28, | December 28, | December 29, |
| (Dollars in Millions) | Maturity | 2007 | 2007 | 2006 |
| | | | | | |
| Notes | 2008-2043 | 6.5% | $ 6,291 | $ 4,924 |
| Convertible Debentures, net of $23 and | | | | |
| | $75 discount, respectively | 2021 | 2.1% | 151 | 473 |
| Equipment Obligations | 2008-2023 | 6.6% | 738 | 446 |
| Other Obligations, Including Capital Leases | 2008-2015 | 6.4% | 75 | 111 |
| | | | | | |
| Total Long-term Debt (including current portion) | | | 7,255 | 5,954 |
| | | | | | |
| Less Debt Due within One Year | | | (785) | (592) |
| Total Long-term Debt (excluding current portion) | | $ 6,470 | $ 5,362 |
Early Redemption of Long-term Debt
In 2007, CSX called $150 million of notes due in 2032. CSX recognized a $10 million reduction to Other Income for an early redemption premium and the write-off of debt issuance costs related to the $150 million of note repayments.
CSX CORPORATION
PART II
Item 8. Financial Statements and Supplementary Data
NOTE 9. Debt and Credit Agreements, continued
In 2005, CSX repurchased $1.0 billion of its publicly-traded notes. The consideration paid for these notes totaled $1.2 billion, including a pre-tax charge of $192 million for costs to repurchase the debt which primarily reflects the market value above original issue value. CSX used net cash proceeds from the disposition of its International Terminals business in 2005, along with cash on hand, to finance this repurchase.
Debt Issuance
CSX issued a total of $2.4 billion in debt during 2007 as follows:
| Notes | Principal Amount Issued |
| (Dollars in Millions) | |
CSXT 6.251% Notes due 2023 (See Note 19) (a) | $ 381 |
| CSX 5.75% Notes due 2013 | 400 |
| CSX 6.25% Notes due 2018 | 600 |
| CSX 5.60% Notes due 2017 | 300 |
| CSX 6.15% Notes due 2037 | 700 |
| | $ 2,381 |
(a) The CSXT notes are secured by a security interest in certain railroad equipment.
These notes were included in the Consolidated Balance Sheets under Long-term Debt and may be redeemed by the Company at any time. The net proceeds from the sale of the notes will be used for general corporate purposes, which may include repurchases of CSX common stock, capital expenditures, working capital requirements, improvements in productivity and other cost reductions at the Company's major transportation units.
Convertible Debentures
In October 2001, CSX issued $564 million aggregate principal amount at maturity in unsubordinated zero coupon convertible debentures (the "debentures") due October 30, 2021 for an initial offering price of approximately $462 million. The carrying value of outstanding debentures was $174 million and $473 million, at December 2007 and December 2006, respectively. From their date of issuance, these debentures had accreted (increased) in value at a yield to maturity of 1% per year. On October 30, 2007, the accretion rate was reset to 2.1%. The accretion rate may be reset again in October 2011 and October 2016 to a rate based on five-year United States Treasury Notes minus 2.8%. In no event, however, will the yield to maturity be reset below 1% or above 3% per annum. Accretion in value on the debentures is recorded for each period, but will not be paid prior to maturity.
CSX CORPORATION
PART II
Item 8. Financial Statements and Supplementary Data
NOTE 9. Debt and Credit Agreements, continued
The debentures allow holders to require CSX to purchase their debentures in October 2008, October 2011 and October 2016, at a purchase price equal to the accreted value of the debentures at the time. CSX may redeem the debentures for cash at any time on or after October 30, 2008, at a redemption price equal to the accreted value of the debentures. Therefore, at December 2007, the debentures were classified in current maturities of long-term debt in the Consolidated Balance Sheets.
Holders currently may convert their debentures into shares of CSX common stock at a conversion rate of 35.49 common shares per $1,000 principal amount at maturity of debentures. During 2007, $375 million face value of debentures were converted into 13 million shares of CSX common stock. No material conversions occurred during 2006. At December 2007, $174 million face value debentures remained outstanding convertible into 6 million shares.
Short-term Debt Balances and Rates
| | | December | | December |
| (Dollars in Millions) | | 2007 | | 2006 |
| Short-term Debt | | $ 2 | | $ 8 |
| Weighted Average Interest Rates | | 5.57% | | 6.07% |
Long-term Debt Maturities
| | | | | Maturities as |
| (Dollars in Millions) | | | | of December |
| Fiscal Years Ending | | | 2007 |
| 2008 | | | | $ 785 |
| 2009 | | | | 305 |
| 2010 | | | | 92 |
| 2011 | | | | 591 |
| 2012 | | | | 493 |
| 2013 and Thereafter | | | 4,989 |
| Total Long-term Debt Maturities (including current portion) | | $ 7,255 |
CSX CORPORATION
PART II
Item 8. Financial Statements and Supplementary Data
NOTE 9. Debt and Credit Agreements, continued
Credit Facilities
In 2006, the Company entered into a $1.25 billion five-year unsecured revolving credit facility and a $15 million secured revolving credit facility expiring in 2011. In 2007, with the consent of the lenders and in accordance with the facility’s terms, CSX extended the maturity date of the $1.25 billion facility an additional year, to 2012. CSX also has an $18.5 million 364-day unsecured revolving credit facility expiring in August 2008.
Additionally, with the approval of the lending banks, CSX may increase its total borrowing capacity under the $1.25 billion facility by $500 million, from $1.25 billion to up to $1.75 billion. The facility was not drawn on as of December 2007. Commitment fees and interest rates payable under the facility were similar to fees and rates available to comparably rated investment-grade borrowers.
In 2007, CSX paid approximately $2 million in total fees associated with the undrawn facilities. These credit facilities allow for borrowings at floating (LIBOR-based) interest rates, plus a spread, depending upon CSX’s senior unsecured debt ratings. LIBOR is the London Interbank Offered Rate which is a daily reference rate based on the interest rates at which banks offer to lend unsecured funds. At December 2007, CSX was in compliance with all covenant requirements under the facilities.
Fair Value of Financial Instruments
Fair values of CSX’s financial instruments were estimated by reference to quoted prices from market sources and financial institutions as well as other valuation techniques. Long-term debt is the only financial instrument of CSX with fair values significantly different from their carrying amounts. The fair value of long-term debt has been estimated using discounted cash flow analysis based upon CSX's current incremental borrowing rates for similar types of financing arrangements.
| | | | | | | December 28, | | December 29, |
| (Dollars in Billions) | | | | 2007 | | 2006 |
| Long-term Debt Including Current Maturities: | | | |
| | Fair Value | | | | $ 7.4 | | $ 6.6 |
| | Carrying Value | | | | $ 7.3 | | $ 6.0 |
CSX CORPORATION
PART II
Item 8. Financial Statements and Supplementary Data
NOTE 10. Other Income - Net and Supplemental Data
Other Income - Net consists of the following:
| | | | Fiscal Years | |
| (Dollars in Millions) | 2007 | 2006 | 2005 |
| | | | | |
Interest Income(a) | $ 55 | $ 41 | $ 38 |
Income from Real Estate and Resort Operations (b) | 42 | 24 | 85 |
Gain on Conrail Property (After Tax) (c) | - | 26 | - |
Miscellaneous (d) | (4) | 4 | (22) |
| | Total Other Income - Net | $ 93 | $ 95 | $ 101 |
| | | | | |
| Gross revenue from Real Estate and Resort | | | |
| | Operations included above | $ 211 | $ 193 | $ 262 |
| (a) | Interest income includes amounts earned from CSX’s cash, cash equivalents and short-term investments. |
| (b) | Income from real estate and resort operations includes the results of operations of the Company’s real estate sales, leasing, acquisition and management and development activities as well as the results of operations from CSX Hotels, Inc., a resort doing business as The Greenbrier, located in White Sulphur Springs, West Virginia. Results of these operations may fluctuate as a function of timing of real estate sales and resort seasonality. |
| (c) | Gain on Conrail property represents a non-cash gain on additional Conrail property value received in 2006. |
| (d) | Miscellaneous income is comprised of equity earnings, minority interest, investment gains and losses and other non-operating activities. |
Supplemental data consists of the following:
Operating expense of $7.8 billion, $7.4 billion and $7.1 billion included selling, general & administrative expenses of $585 million, $547 million and $552 million for fiscal years 2007, 2006 and 2005, respectively.
CSX CORPORATION
PART II
Item 8. Financial Statements and Supplementary Data
NOTE 11. Properties
The Company’s properties were as follows:
| | December 28, 2007 | | December 29, 2006 |
| | | Accumulated | | | | Accumulated | |
| (Dollars in Millions) | Cost | Depreciation | Net | | Cost | Depreciation | Net |
| Road | $ 20,522 | $ 3,564 | $ 16,958 | | $ 19,741 | $ 3,342 | $ 16,399 |
| Equipment | 6,951 | 2,829 | 4,122 | | 6,567 | 2,666 | 3,901 |
| Intermodal | 612 | 349 | 263 | | 559 | 321 | 238 |
| Other | 914 | 477 | 437 | | 848 | 463 | 385 |
| Total Properties | $ 28,999 | $ 7,219 | $ 21,780 | | $ 27,715 | $ 6,792 | $ 20,923 |
NOTE 12. Other Long-term Assets and Other Long-term Liabilities
Other Long-term Assets
Other Long-term Assets consisted of the following:
| | December 28, | | December 29, |
| (Dollars in Millions) | 2007 | | 2006 |
| | |
Available for Sale Securities (a) | $ 75 | | $ 44 |
Goodwill (b) | 64 | | 73 |
| Real Estate Development Costs | 42 | | 39 |
| Other Long-term Assets | 39 | | 54 |
| Debt Issuance Costs | 34 | | 30 |
| Pension Plan Assets | 4 | | - |
| Deposits | 1 | | 3 |
Income Taxes Receivable (c) | - | | 348 |
| | Total Other Long-term Assets | $ 259 | | $ 591 |
| (a) | Available for Sale Securities include investments in marketable securities. |
| (b) | Goodwill represents the purchase price in excess of fair value of identifiable tangible and intangible assets. |
| (c) | Income Taxes Receivable in 2006 included amounts on deposit with the Internal Revenue Service (“IRS”), bonds and other unpaid claims of income taxes. In 2007, the decrease was due to the Company applying its amounts on deposit with the IRS towards its 2007 tax obligations. |
CSX CORPORATION
PART II
Item 8. Financial Statements and Supplementary Data
NOTE 12. Other Long-term Assets and Other Long-term Liabilities, continued
Other Long-term Liabilities
Other Long-term Liabilities consisted of the following:
| | | December 28, | | December 29, |
| (Dollars in Millions) | 2007 | | 2006 |
| | | | | |
Post-retirement Benefit Liability (a) | $ 349 | | $ 345 |
Pension Plan Liability (a) | 203 | | 529 |
| Deferred Gains | 181 | | 200 |
| Accrued Deferred Compensation | 90 | | 90 |
| Other Long-term Liabilities | 81 | | 95 |
| Deferred Lease Payments | 40 | | 53 |
Minority Interest(b) | 21 | | 89 |
| Accrued Sick Leave | 16 | | 19 |
Income Taxes Payable(c) | 7 | | 105 |
| | Total Other Long-term Liabilities | $ 988 | | $ 1,525 |
| (a) See Note 8, Employee Benefit Plans, for a discussion on changes in pension and post-retirement benefit liabilities. |
| (b) Minority Interest decreased as a result of a change to a shareholder agreement at one of CSXT’s partially owned subsidiaries. CSXT now has greater participation in the subsidiary’s earnings resulting in a decrease to the minority interest liability and an increase in additional paid in capital. |
| (c) Income taxes payable decreased primarily due to amounts being reclassified to current. |
NOTE 13. Income Taxes
Earnings from continuing operations before income taxes of $1.9 billion, $1.8 billion and $1.0 billion for fiscal years 2007, 2006, and 2005, respectively represent earnings from domestic operations.
The significant components of deferred tax assets and liabilities include:
| | | 2007 | | 2006 |
| (Dollars in Millions) | Assets | Liabilities | | Assets | Liabilities |
| Employee Benefit Plans | $ 404 | $ - | | $ 498 | $ - |
| Accelerated Depreciation | - | 6,541 | | - | 6,464 |
| Other | 447 | 152 | | 580 | 473 |
| | Total | $ 851 | $ 6,693 | | $ 1,078 | $ 6,937 |
| Net Deferred Tax Liabilities | | $ 5,842 | | | $ 5,859 |
CSX CORPORATION
PART II
Item 8. Financial Statements and Supplementary Data
NOTE 13. Income Taxes, continued
The primary factors in the change in year-end net deferred income tax liability balances include:
| | · | Annual provision for deferred income tax expense; |
| | · | Accumulated other comprehensive loss and other capital adjustments; and |
| | · | The reclassification of income taxes payable balances as required by FIN 48. |
The breakdown of income tax expense (benefit) between current and deferred is as follows:
| (Dollars in Millions) | Fiscal Years |
| Current: | 2007 | 2006 | 2005 |
| | Federal | $ 388 | $ 458 | $ 350 |
| | State | 46 | 31 | 12 |
| | Total Current | 434 | 489 | 362 |
| Deferred: | | | |
| | Federal | 237 | 15 | 33 |
| | State | 35 | 27 | (79) |
| | Total Current | 272 | 42 | (46) |
| Total | $ 706 | $ 531 | $ 316 |
Income tax expense reconciled to the tax computed at statutory rates is as follows:
| | Fiscal Years | | |
| (Dollars In Millions) | 2007 | | 2006 | | 2005 | | |
| Federal Income Taxes | $ 676 | 35 | % | $ 644 | 35 | % | $ 362 | 35 | % |
| State Income Taxes | 50 | 3 | | 37 | 2 | | (44) | (4) | | |
| Prior Year Audit Resolutions | 5 | - | | (132) | (7) | | (1) | - | | |
| (25) | ( 1) | | (18) | (1) | | (1) | (1) | | |
| Income Tax Expense/Rate | $ 706 | 37 | % | $ 531 | 29 | % | $ 316 | 30 | % | |
| (a) Other items primarily include tax impacts from equity in Conrail and other partially owned subsidiaries’ earnings. |
The change in the 2007 effective income tax rate compared to the prior year is primarily attributed to prior year audit resolutions favorably impacting the 2006 effective rate. The net state income tax impact of the 2006 resolutions of federal income tax audits of $15 million is included on the 2006 state income taxes line above. The state income tax benefit in 2005 is largely due to the recognition of an income tax benefit of $71 million for the Ohio legislative change to gradually eliminate its corporate franchise tax.
CSX CORPORATION
PART II
Item 8. Financial Statements and Supplementary Data
NOTE 13. Income Taxes, continued
CSX adopted FIN 48, at the beginning of fiscal year 2007. As a result of the implementation, the Company recognized a $31 million decrease to reserves for uncertain tax positions. This decrease, along with a $2 million reduction for unconsolidated subsidiaries accounted for under the equity method of accounting, was recorded as a cumulative effect adjustment to the beginning balance of retained earnings on the balance sheet.
The change to the total gross unrecognized tax benefits of the Company during the fiscal year ended December 28, 2007 is reconciled as follows:
| Uncertain Tax Positions: | Fiscal Year |
| (Dollars in Millions) | 2007 |
| Beginning Balance | $ 207 |
| Additions based on tax positions related to current year | 1 |
| Settlements with IRS | (148) |
| Lapse of statute of limitations | (2) |
| Balance at December 28, 2007 | $ 58 |
Of the total gross reserve for uncertain tax positions listed above, $197 million (of the beginning balance) and $50 million (of the ending balance) net of federal benefit on state issues could favorably affect the effective tax rate. The annual decrease in unrecognized tax benefits primarily related to settlements with the IRS that resulted in a $110 million discontinued operations benefit (See Note 17, Discontinued Operations). The Company estimates that approximately $17 million of the unrecognized tax benefits as of December 2007 for various state and federal income tax matters will be resolved over the next 12 months. The final outcome of these uncertain tax positions, however, is not yet determinable.
The Company files a consolidated federal income tax return, which includes its principal domestic subsidiaries. CSX and its subsidiaries are subject to U.S. federal income tax as well as income tax of multiple state jurisdictions. The Company has substantially concluded all U.S. federal income tax examinations for years through 2003 and substantially all other income tax matters have been concluded for years through 1998. Federal income tax returns for 2004 through 2006 are currently under examination.
CSX’s continuing practice is to recognize net interest and penalties related to income tax matters in income tax expense. Included in the consolidated income statements are $(8) million, $(79) million, and $43 million for fiscal years 2007, 2006, and 2005, respectively, of interest and penalties expense/(benefit) for all prior year tax positions. Benefits for interest and penalties are due to favorable tax settlements of prior period tax audits where the Company had previously accrued a liability for interest and penalties. The Company had $4 million and $52 million accrued for interest and penalties for 2007 and 2006 respectively, for all prior year tax positions. The decrease for interest and penalties during both 2007 and 2006 is primarily related to the resolution of federal income tax audits and payments made to the IRS by the Company.
CSX CORPORATION
PART II
Item 8. Financial Statements and Supplementary Data
NOTE 14. Derivative Financial Instruments
CSX uses derivative financial instruments to manage its overall exposure to fluctuations in interest rates and has previously used such instruments to manage exposure to fluctuations in fuel costs.
Interest Rate Swaps
During 2007, CSX repaid $450 million of debentures that matured and called $150 million of debentures due in 2032 (See Note 9, Debt and Credit Agreements). As a result, CSX also settled the interest rate swaps related to these debentures. CSX had $35 million and $640 million of outstanding interest rate swaps that impacted interest expense by $2 million for 2007 and 2006. The interest rate swap agreements were designated and qualified as fair value hedges, and the gain or loss on the derivative instrument, as well as the offsetting gain or loss on the fixed rate note attributed to the hedged risk, were recognized in current earnings during the period of change in fair values. CSX’s interest rate swaps qualified as perfectly effective fair value hedges, as defined by SFAS 133. As such, there was no ineffective portion to the hedge recognized in earnings during the current or prior year periods.
Fuel Hedging
In 2003, CSX began a program to hedge a portion of CSXT’s future locomotive fuel purchases. This program was established to manage exposure to fuel price fluctuations. To minimize this risk, CSX entered into a series of swaps. Ineffectiveness, or the extent to which changes in the fair values of the fuel swaps did not offset changes in the fair values of the expected fuel purchases, was immaterial. CSX suspended entering into new swaps in its fuel hedge program in 2004 and there are currently no outstanding contracts.
Fuel hedging activity offset increased fuel expense for the fiscal years 2006 and 2005 by $55 million and $249 million, respectively. Since the end of third quarter 2006, there has been no impact on fuel expense as all contracts expired prior to that time.
NOTE 15. Business Segments
The Company operates primarily in two business segments: rail and intermodal. The rail segment provides rail freight transportation over a network of approximately 21,000 route miles in 23 states, the District of Columbia and the Canadian provinces of Ontario and Quebec. The intermodal segment provides integrated rail and truck transportation services and operates a network of dedicated intermodal facilities across North America. These segments are strategic business units that offer different services and are managed separately. Performance is evaluated and resources are allocated based on several factors, of which the principal financial measures are business segment operating income and operating ratio. The accounting policies of the segments are the same as those described in Note 1, Nature of Operations and Significant Accounting Policies.
CSX CORPORATION
PART II
Item 8. Financial Statements and Supplementary Data
NOTE 15. Business Segments, continued
Consolidated operating income includes the results of operations of Surface Transportation and other operating income. Other operating income includes the gain amortization on the conveyance of CSX Lines, net sublease income from assets formerly included in the Company’s marine services segment and other items.
Business segment information for the fiscal years 2007, 2006 and 2005 was as follows:
| | Fiscal Years |
| (Dollars in Millions) | 2007 | 2006 | 2005 |
| Revenue from External Customers: | | | |
| | Rail | $ 8,674 | $ 8,154 | $ 7,256 |
| | Intermodal | 1,356 | 1,412 | 1,362 |
| | | Consolidated | $ 10,030 | $ 9,566 | $ 8,618 |
| |
| Operating Income: | | | |
| | Rail | $ 1,991 | $ 1,858 | $ 1,301 |
| | Intermodal | 260 | 268 | 248 |
| | Other | 5 | 12 | 1 |
| | | Consolidated | $ 2,256 | $ 2,138 | $ 1,550 |
| |
| Assets: | | | |
| | Rail | $ 24,179 | $ 24,077 | $ 23,182 |
| | Intermodal | 283 | 276 | 305 |
| | Other | 25 | 43 | 123 |
| | Investment in Conrail | 639 | 607 | 603 |
| | Elimination of Intersegment Payables (Receivables) | (62) | (78) | (77) |
| | Non-segment Assets | 470 | 204 | 96 |
| | | Consolidated | $ 25,534 | $ 25,129 | $ 24,232 |
| |
| Depreciation Expense: | | | |
| | Rail | $ 848 | $ 818 | $ 779 |
| | Intermodal | 34 | 38 | 39 |
| | Other | 1 | 1 | 8 |
| | | Consolidated | $ 883 | $ 857 | $ 826 |
| |
| Property Additions: | | | |
| | Rail | $ 1,678 | $ 1,592 | $ 1,091 |
| | Intermodal | 60 | 28 | 25 |
| | Other | - | - | 5 |
| | Non-Segment | 35 | 19 | 15 |
| | Consolidated | $ 1,773 | $ 1,639 | $ 1,136 |
CSX CORPORATION
PART II
Item 8. Financial Statements and Supplementary Data
NOTE 16. Related Party Transactions
Through a limited liability company, CSX and Norfolk Southern Corporation (“NS”) jointly own Conrail. CSX has a 42% economic interest and 50% voting interest in the jointly owned entity and NS has the remainder of the economic and voting interests. Pursuant to the Accounting Principle Board (“APB”) Opinion 18, The Equity Method of Accounting for Investments in Common Stock, CSX applies the equity method of accounting to its investment in Conrail.
Conrail owns and operates rail infrastructure for the joint benefit of CSX and NS. This is known as the shared asset area (“shared asset area”). Conrail charges fees for right-of way usage, equipment rentals and transportation, switching and terminal service charges in the shared asset area. Historically, these expenses were included as an expense category, Conrail rents, fees and services, in the consolidated income statements. Beginning in 2007, these amounts have been included in materials, supplies and other on the consolidated income statements.
Also included in materials, supplies and other are CSX’s 42% share of Conrail’s income and its amortization of the fair value write-up arising from the acquisition of Conrail and certain other adjustments. The amortization primarily represents the additional after tax depreciation expense related to the write-up of Conrail’s fixed assets when the original purchase price, from the 1997 acquisition of Conrail, was allocated based on fair value.
The following table details the related Conrail amounts included in materials, supplies and other in the Company’s consolidated income statements:
| | | | | Fiscal Years | | |
| (Dollars in Millions) | 2007 | | 2006 | | 2005 |
| Rents, Fees and Services | $ 97 | | $ 91 | | $ 97 |
| Purchase Price Amortization and Other | 4 | | 4 | | 4 |
| Equity in Income of Conrail | (35) | | (20) | | (36) |
| | Total Conrail Rents, Fees and Services | $ 66 | | $ 75 | | $ 65 |
CSX CORPORATION
PART II
Item 8. Financial Statements and Supplementary Data
NOTE 16. Related Party Transactions, continued
As required by SFAS 57, Related Party Disclosures, the Company has identified below amounts owed to Conrail, or its affiliates, representing liabilities under the operating, equipment and shared area agreements with Conrail. The Company also executed two promissory notes with a subsidiary of Conrail which were included in long-term debt on the consolidated balance sheets.
| | | December 28, | | December 29, | | |
| | | 2007 | | 2006 | | |
| (Dollars in Millions) |
| Balance Sheet Information: | | |
CSX Payable to Conrail(a) | $ 49 | | $ 48 | | |
| Promissory Notes Payable to Conrail Subsidiary | | | | | |
| | 4.40% CSX Promissory Note due October 2035 (b) | $ 73 | | $ 73 | | |
| | 4.52% CSXT Promissory Note due March 2035 (b) | $ 23 | | $ 23 | | |
| | | | | | | |
| (a) Included on the consolidated balance sheet of CSX as accounts payable |
| (b) Included on the consolidated balance sheet and Schedule of Contractual Obligations of CSX as long-term debt |
| | | | | | | |
| | | Fiscal Years |
| (Dollars in Millions) | 2007 | | 2006 | | 2005 |
| Income Statement Information: | | | | | |
| Interest Expense Related to Conrail Notes Payable | $ 4 | | $ 4 | | $ 1 |
NOTE 17. Discontinued Operations
In 2005, CSX sold its International Terminals business, which included the capital stock of SL Services, Inc. (“SLSI”) to Dubai Ports International FZE (“DPI”) for gross cash consideration of $1.142 billion. Of the gross proceeds, approximately $110 million was paid for the purchase of a minority interest in an International Terminals’ subsidiary, which the Company acquired during the first quarter of 2005 and divested as part of the sale to DPI. Other related cash transaction costs amounted to approximately $34 million, including resolution of working capital and long-term debt adjustments.
CSX recognized a gain of $683 million pre-tax, $428 million after tax, in fiscal year 2005 as a result of the sale. Consequently, amounts related to this gain and the business were reported as discontinued operations on the Consolidated Income Statement.
SLSI also holds certain residual assets and liabilities as a result of prior divestitures and discontinuances. A wholly-owned subsidiary of CSX retains the rights to those assets and indemnifies DPI, SLSI and related entities against those liabilities pursuant to a separate agreement. CSX guarantees the obligations of its subsidiary under this separate agreement.
CSX CORPORATION
PART II
Item 8. Financial Statements and Supplementary Data
NOTE 17. Discontinued Operations, continued
The following table represents the results of operations of the Company’s International Terminals Business.
| | | Fiscal Year |
| (Dollars in Millions) | 2005 |
| Income Statement Information: |
| | Revenues | $ 14 |
| | Expenses | 21 |
| | Operating Income (Loss) | $ (7) |
| | Income Tax Benefit | 4 |
| | Net Income | $ (3) |
In 2007, the Internal Revenue Service completed its review of the Company’s pre-filing agreement, which is an early review of specific transactions. The Company recorded an income tax benefit of $110 million, primarily associated with the resolution of income tax matters related to former activities of the marine service businesses, including the International Terminals business described above. This 2007 benefit was recorded as discontinued operations as the Company no longer operates in these businesses. This benefit was associated with tax basis adjustments, foreign dividends and foreign tax credits from operations over a multi-year period.
CSX CORPORATION
PART II
Item 8. Financial Statements and Supplementary Data
NOTE 18. Quarterly Financial Data (Unaudited)
Pursuant to Article 3 of the SEC’s Regulation S-X, the following are selected quarterly financial data:
| | | 2007 |
| | | Quarters |
| (Dollars in Millions, Except Per Share Amounts) | | 1st (a) | 2nd | 3rd (b) | 4th (c) | Full Year |
| | | | | | | |
| Operating Revenue | | $ 2,422 | $ 2,530 | $ 2,501 | $ 2,577 | $ 10,030 |
| Operating Income | | 488 | 604 | 555 | 609 | 2,256 |
| Earnings from Continuing Operations | | 240 | 324 | 297 | 365 | 1,226 |
| Discontinued Operations | | - | - | 110 | - | 110 |
| Net Earnings | | $ 240 | $ 324 | $ 407 | $ 365 | $ 1,336 |
| | | | | | | |
| Earnings Per Share: | | | | | | |
| From Continuing Operations | | $ 0.55 | $ 0.74 | $ 0.69 | $ 0.89 | $ 2.85 |
| Discontinued Operations | | - | - | 0.25 | - | 0.26 |
| Net Earnings | | $ 0.55 | $ 0.74 | $ 0.94 | $ 0.89 | $ �� 3.11 |
| | | | | | | |
| Earnings Per Share Assuming Dilution: | | | | | | |
| From Continuing Operations | | $ 0.52 | $ 0.71 | $ 0.67 | $ 0.86 | $ 2.74 |
| Discontinued Operations | | - | - | 0.24 | - | 0.25 |
| Net Earnings | | $ 0.52 | $ 0.71 | $ 0.91 | $ 0.86 | $ 2.99 |
| | | | | | | |
| Dividend Per Share | | $ 0.12 | $ 0.12 | $ 0.15 | $ 0.15 | $ 0.54 |
| | | 2006 |
| | | Quarters |
| (Dollars in Millions, Except Per Share Amounts) | | 1st | 2nd (d) | 3rd (e) | 4th (f) | Full Year |
| | | | | | | |
| Operating Revenue | | $ 2,331 | $ 2,421 | $ 2,418 | $ 2,396 | $ 9,566 |
| Operating Income | | 496 | 646 | 489 | 507 | 2,138 |
| Net Earnings | | $ 245 | $ 390 | $ 328 | $ 347 | $ 1,310 |
| | | | | | | |
| Earnings Per Share: | | | | | | |
| Net Earnings | | $ 0.56 | $ 0.88 | $ 0.75 | $ 0.79 | $ 2.98 |
| | | | | | | |
| Earnings Per Share Assuming Dilution: | | | | | | |
| Net Earnings | | $ 0.53 | $ 0.83 | $ 0.71 | $ 0.75 | $ 2.82 |
| | | | | | | |
| Dividend Per Share | | $ 0.065 | $ 0.065 | $ 0.10 | $ 0.10 | $ 0.33 |
| (a) | CSX recognized an $18 million pre-tax benefit on insurance recoveries from gains related to Hurricane Katrina (See Note 5, Hurricane Katrina). |
| (b) | CSX recognized an income tax benefit of $110 million principally associated with the resolution of certain tax matters related to former activities of the container shipping and marine service businesses (See Note 17, Discontinued Operations). Additionally, CSX recognized a $1 million pre-tax benefit on insurance recoveries from gains related to Hurricane Katrina. |
| (c) | CSX recognized an $8 million pre-tax benefit on insurance recoveries from gains related to Hurricane Katrina. |
| (d) | CSX recognized an income tax benefit of $41 million principally related to the resolution of certain tax matters. Additionally, CSX recognized a $126 million pre-tax benefit on insurance recoveries from gains related to Hurricane Katrina. |
| (e) | CSX recognized an income tax benefit of $69 million, principally related to the resolution of federal income tax audits for 1994 – 1996. Additionally, CSX recognized a $15 million pre-tax benefit on insurance recoveries from gains related to Hurricane Katrina. |
| (f) | CSX recognized an income tax benefit of $41 million, principally related to the resolution of federal income tax audits for 1997 - 1998. Additionally, CSX recognized a $27 million pre-tax benefit on insurance recoveries from gains related to Hurricane Katrina and a $26 million after-tax non-cash gain on additional Conrail property received. |
CSX CORPORATION
PART II
Item 8. Financial Statements and Supplementary Data
NOTE 19. Summarized Consolidating Financial Data
In 2007, CSX announced that CSXT offered $381 million of Secured Equipment Notes due 2023 in a registered public offering pursuant to CSX’s existing automatic shelf registration statement. CSX will fully and unconditionally guarantee the notes. In connection with this offering, the Company is providing the following condensed consolidating financial information in accordance with SEC disclosure requirements. Each entity in the consolidating financial information follows the same accounting policies as described in the consolidated financial statements, except for the use of the equity method of accounting to reflect ownership interests in subsidiaries which are eliminated upon consolidation and the allocation of certain expenses of CSX incurred for the benefit of its subsidiaries.
The condensed consolidating balance sheets as of December 28, 2007 and December 29, 2006, and the statements of income and cash flows for each of the three fiscal years in the period ended December 28, 2007, for the parent and obligor are as follows:
CSX CORPORATION
PART II
Item 8. Financial Statements and Supplementary Data
NOTE 19. Summarized Consolidating Financial Data
Consolidating Income Statements
(Dollars in Millions)
| | CSX | CSX | | | |
| Fiscal Year Ended December 28, 2007 | Corporation | Transportation | Other | Eliminations | Consolidated |
| | | | | | |
| Operating Revenue | $ - | $ 8,591 | $ 1,546 | $ (107) | $ 10,030 |
| Operating Expense | (203) | 6,894 | 1,180 | (97) | 7,774 |
| Operating Income | 203 | 1,697 | 366 | (10) | 2,256 |
| | | | | | |
| Equity in Earnings of Subsidiaries | 1,363 | - | - | (1,363) | - |
| Other Income (Expense) | 166 | 154 | 198 | (425) | 93 |
| Interest Expense | (568) | (238) | (46) | 435 | (417) |
| | | | | | |
| Earnings from Continuing Operations before Income Taxes | 1,164 | 1,613 | 518 | (1,363) | 1,932 |
| Income Tax Benefit (Expense) | 62 | (614) | (154) | - | (706) |
| | | | | | |
| Earnings from Continuing Operations | 1,226 | 999 | 364 | (1,363) | 1,226 |
| Discontinued Operations - Net of Tax | 110 | - | - | - | 110 |
| | | | | | |
| Net Earnings | $ 1,336 | $ 999 | $ 364 | $ (1,363) | $ 1,336 |
| | | | | | |
| | CSX | CSX | | | |
| Fiscal Year Ended December 29, 2006 | Corporation | Transportation | Other | Eliminations | Consolidated |
| | | | | | |
| Operating Revenue | $ - | $ 8,140 | $ 1,426 | $ - | $ 9,566 |
| Operating Expense | (195) | 6,542 | 1,081 | - | 7,428 |
| Operating Income | 195 | 1,598 | 345 | - | 2,138 |
| | | | | | |
| Equity in Earnings of Subsidiaries | 1,281 | - | - | (1,281) | - |
| Other Income (Expense) | 283 | 87 | 142 | (417) | 95 |
| Interest Expense | (536) | (217) | (56) | 417 | (392) |
| | | | | | |
| Earnings from Continuing Operations before Income Taxes | 1,223 | 1,468 | 431 | (1,281) | 1,841 |
| Income Tax Benefit (Expense) | 87 | (489) | (129) | - | (531) |
| | | | | | |
| Net Earnings | $ 1,310 | $ 979 | $ 302 | $ (1,281) | $ 1,310 |
CSX CORPORATION
PART II
Item 8. Financial Statements and Supplementary Data
NOTE 19. Summarized Consolidating Financial Data, continued
Consolidating Income Statements
(Dollars in Millions)
| Fiscal Year Ended December 30, 2005 | CSX Corporation | CSX Transportation | Other | Eliminations | Consolidated |
| | | | | | |
| Operating Revenue | $ - | $ 7,256 | $ 1,362 | $ - | $ 8,618 |
| Operating Expense | (125) | 6,170 | 1,023 | - | 7,068 |
| Operating Income | 125 | 1,086 | 339 | - | 1,550 |
| | | | | | |
| Equity in Earnings of Subsidiaries | 946 | - | - | (946) | - |
| Other Income (Expense) | 141 | 56 | 112 | (208) | 101 |
| Debt Repurchase Expense | (192) | - | - | - | (192) |
| Interest Expense | (430) | (166) | (35) | 208 | (423) |
| | | | | | |
| Earnings from Continuing Operations before Income Taxes | 590 | 976 | 416 | (946) | 1,036 |
| Income Tax Benefit (Expense) | 127 | (289) | (154) | - | (316) |
| | | | | | |
| Earnings from Continuing Operations | 717 | 687 | 262 | (946) | 720 |
| Discontinued Operations - Net of Tax | 428 | - | (3) | - | 425 |
| | | | | | |
| Net Earnings | $ 1,145 | $ 687 | $ 259 | $ (946) | $ 1,145 |
CSX CORPORATION
PART II
Item 8. Financial Statements and Supplementary Data
NOTE 19. Summarized Consolidating Financial Data, continued
Consolidating Balance Sheets
(Dollars in Millions)
| | | | CSX | CSX | | | |
| December 28, 2007 | Corporation | Transportation | Other | Eliminations | Consolidated |
| | | | | | | | |
| ASSETS | | | | | |
| Current Assets: | | | | | |
| | Cash and Cash Equivalents | $ (594) | $ 12 | $ 950 | $ - | $ 368 |
| | Short-term Investments | 270 | - | 76 | - | 346 |
| | Accounts Receivable - Net | 155 | 1,069 | (25) | (25) | 1,174 |
| | Materials and Supplies | - | 230 | 10 | - | 240 |
| | Deferred Income Taxes | 23 | 232 | (1) | - | 254 |
| | Other Current Assets | 25 | 103 | 53 | (72) | 109 |
| | | Total Current Assets | (121) | 1,646 | 1,063 | (97) | 2,491 |
| | | | | | | | |
| Properties | 6 | 27,606 | 1,387 | - | 28,999 |
| Accumulated Depreciation | (9) | (6,400) | (810) | - | (7,219) |
| | | Properties - Net | (3) | 21,206 | 577 | - | 21,780 |
| | | | | | | | |
| Investment in Conrail | - | - | 639 | - | 639 |
| Affiliates and Other Companies | - | 470 | (105) | - | 365 |
| Investment in Consolidated Subsidiaries | 14,524 | - | 34 | (14,558) | - |
| Other Long-term Assets | (330) | 203 | 442 | (56) | 259 |
| | | Total Assets | $ 14,070 | $ 23,525 | $ 2,650 | $ (14,711) | $ 25,534 |
| | | | | | | | |
| LIABILITIES AND SHAREHOLDERS' EQUITY | | | | | |
| Current Liabilities: | | | | | |
| | Accounts Payable | $ 90 | $ 799 | $ 112 | $ (25) | $ 976 |
| | Labor and Fringe Benefits Payable | 36 | 374 | 51 | - | 461 |
| | Payable to Affiliates | - | 1,325 | (1,253) | (72) | - |
| | Casualty, Environmental and Other Reserves | - | 226 | 21 | - | 247 |
| | Current Maturities of Long-term Debt | 669 | 111 | 5 | - | 785 |
| | Short-term Debt | - | 2 | - | - | 2 |
| | Income and Other Taxes Payable | (761) | 572 | 302 | - | 113 |
| | Other Current Liabilities | 8 | 72 | 7 | - | 87 |
| | | Total Current Liabilities | 42 | 3,481 | (755) | (97) | 2,671 |
| | | | | | | | |
| Casualty, Environmental and Other Reserves | - | 540 | 84 | - | 624 |
| Long-term Debt | 5,229 | 1,230 | 11 | - | 6,470 |
| Deferred Income Taxes | (176) | 6,291 | (19) | - | 6,096 |
| Long-term Payable to Affiliates | - | - | 56 | (56) | - |
| Other Long-term Liabilities | 290 | 541 | 195 | (38) | 988 |
| | | Total Liabilities | 5,385 | 12,083 | (428) | (191) | 16,849 |
| | | | | | | | |
| Shareholders' Equity: | | | | | |
| | Common Stock | 408 | 181 | - | (181) | 408 |
| | Other Capital | 37 | 5,525 | 2,705 | (8,230) | 37 |
| | Retained Earnings | 8,565 | 5,768 | 421 | (6,189) | 8,565 |
| | Accumulated Other Comprehensive Loss | (325) | (32) | (48) | 80 | (325) |
| | | Total Shareholders' Equity | 8,685 | 11,442 | 3,078 | (14,520) | 8,685 |
| | | Total Liabilities and Shareholders' Equity | $ 14,070 | $ 23,525 | $ 2,650 | $ (14,711) | $ 25,534 |
CSX CORPORATION
PART II
Item 8. Financial Statements and Supplementary Data
NOTE 19. Summarized Consolidating Financial Data, continued
Consolidating Balance Sheets
(Dollars in Millions)
| | | | CSX | CSX | | | |
| December 29, 2006 | Corporation | Transportation | Other | Eliminations | Consolidated |
| | | | | | | | |
| ASSETS | | | | | |
| Current Assets: | | | | | |
| | Cash and Cash Equivalents | $ 419 | $ 17 | $ 25 | $ - | $ 461 |
| | Short-term Investments | 391 | - | 48 | - | 439 |
| | Accounts Receivable - Net | 121 | 1,058 | 27 | (32) | 1,174 |
| | Materials and Supplies | - | 195 | 9 | - | 204 |
| | Deferred Income Taxes | (103) | 225 | 129 | - | 251 |
| | Other Current Assets | 1 | 50 | 204 | (112) | 143 |
| | | Total Current Assets | 829 | 1,545 | 442 | (144) | 2,672 |
| | | | | | | | |
| Properties | 19 | 26,447 | 1,249 | - | 27,715 |
| Accumulated Depreciation | (24) | (6,032) | (736) | - | (6,792) |
| | | Properties - Net | (5) | 20,415 | 513 | - | 20,923 |
| | | | | | | | |
| Investment in Conrail | - | - | 607 | - | 607 |
| Affiliates and Other Companies | - | 434 | (71) | (27) | 336 |
| Investment in Consolidated Subsidiaries | 13,199 | - | - | (13,199) | - |
| Other Long-term Assets | 2,023 | 415 | (1,776) | (71) | 591 |
| | | Total Assets | $ 16,046 | $ 22,809 | $ (285) | $ (13,441) | $ 25,129 |
| | | | | | | | |
| LIABILITIES AND SHAREHOLDERS' EQUITY | | | | | |
| Current Liabilities: | | | | | |
| | Accounts Payable | $ 78 | $ 770 | $ 157 | $ (31) | $ 974 |
| | Labor and Fringe Benefits Payable | 44 | 396 | 55 | - | 495 |
| | Payable to Affiliates | - | 2,019 | (1,907) | (112) | - |
| | Casualty, Environmental and Other Reserves | - | 226 | 27 | - | 253 |
| | Current Maturities of Long-term Debt | 467 | 120 | 5 | - | 592 |
| | Short-term Debt | - | 8 | - | - | 8 |
| | Income and Other Taxes Payable | 1,308 | 245 | (1,439) | - | 114 |
| | Other Current Liabilities | 16 | 62 | 9 | (1) | 86 |
| | | Total Current Liabilities | 1,913 | 3,846 | (3,093) | (144) | 2,522 |
| | | | | | | | |
| Casualty, Environmental and Other Reserves | - | 599 | 69 | - | 668 |
| Long-term Debt | 4,377 | 970 | 15 | - | 5,362 |
| Deferred Income Taxes | (255) | 6,297 | 68 | - | 6,110 |
| Long-term Payable to Affiliates | - | - | 72 | (72) | - |
| Other Long-term Liabilities | 1,069 | 636 | (150) | (30) | 1,525 |
| | | Total Liabilities | $ 7,104 | $ 12,348 | $ (3,019) | $ (246) | $ 16,187 |
| | | | | | | | |
| Shareholders' Equity: | | | | | |
| | Common Stock | 438 | 181 | - | (181) | 438 |
| | Other Capital | 1,469 | 5,420 | 2,696 | (8,116) | 1,469 |
| | Retained Earnings | 7,427 | 4,879 | 93 | (4,972) | 7,427 |
| | Accumulated Other Comprehensive Loss | (392) | (19) | (55) | 74 | (392) |
| | | Total Shareholders' Equity | 8,942 | 10,461 | 2,734 | (13,195) | 8,942 |
| | | Total Liabilities and Shareholders' Equity | $ 16,046 | $ 22,809 | $ (285) | $ (13,441) | $ 25,129 |
CSX CORPORATION
PART II
Item 8. Financial Statements and Supplementary Data
NOTE 19. Summarized Consolidating Financial Data, continued
Consolidating Cash Flow Statements
(Dollars in Millions)
| | | CSX | CSX | | | |
| Fiscal Year Ended December 28, 2007 | Corporation | Transportation | Other | Eliminations | Consolidated |
| | | | | | | |
| Operating Activities | | | | | |
| | Net Cash (Used in) Provided by Operating Activities | $ (871) | $ 2,278 | $ 930 | $ (153) | $ 2,184 |
| | | | | | | |
| Investing Activities | | | | | |
| Property Additions | - | (1,632) | (141) | - | (1,773) |
| Insurance Proceeds | - | 16 | - | - | 16 |
| Purchases of Short-term Investments | (2,338) | - | - | - | (2,338) |
| Proceeds from Sales of Short-term Investments | 2,459 | - | - | - | 2,459 |
| Other Investing Activities | 512 | 219 | (780) | (8) | (57) |
| | Net Cash Provided by (Used in) Investing Activities | 633 | (1,397) | (921) | (8) | (1,693) |
| | | | | | | |
| Financing Activities | | | | | |
| Short-term Debt - Net | - | (6) | - | - | (6) |
| Long-term Debt Issued | 2,000 | 381 | - | - | 2,381 |
| Long-term Debt Repaid | (617) | (142) | (26) | - | (785) |
| Dividends Paid | (236) | (120) | (27) | 152 | (231) |
| Stock Options Exercised | 153 | - | - | - | 153 |
| Shares Repurchased | (2,174) | | - | | (2,174) |
| Other Financing Activities | 99 | (999) | 969 | 9 | 78 |
| | Net Cash (Used in) Provided by Financing Activities | (775) | (886) | 916 | 161 | (584) |
| | | | | | | |
| Net (Decrease) Increase in Cash and Cash Equivalents | (1,013) | (5) | 925 | - | (93) |
| Cash and Cash Equivalents at Beginning of Period | 419 | 17 | 25 | - | 461 |
| Cash and Cash Equivalents at End of Period | $ (594) | $ 12 | $ 950 | $ - | $ 368 |
CSX CORPORATION
PART II
Item 8. Financial Statements and Supplementary Data
NOTE 19. Summarized Consolidating Financial Data, continued
Consolidating Cash Flow Statements
(Dollars in Millions)
| | | CSX | CSX | | | |
| Fiscal Year Ended December 29, 2006 | Corporation | Transportation | Other | Eliminations | Consolidated |
| | | | | | | |
| Operating Activities | | | | | |
| | Net Cash Provided by (Used in) Operating Activities | $ 789 | $ 1,794 | $ 213 | $ (738) | $ 2,058 |
| | | | | | | |
| Investing Activities | | | | | |
| Property Additions | - | (1,554) | (85) | - | (1,639) |
| Insurance Proceeds | - | 144 | 3 | - | 147 |
| Purchases of Short-term Investments | (1,412) | - | - | - | (1,412) |
| Proceeds from Sales of Short-term Investments | 1,290 | - | - | - | 1,290 |
| Other Investing Activities | (38) | (16) | 45 | 13 | 4 |
| | Net Cash (Used in) Provided by Investing Activities | (160) | (1,426) | (37) | 13 | (1,610) |
| | | | | | | |
| Financing Activities | | | | | |
| Short-term Debt - Net | - | 8 | (1) | - | 7 |
| Long-term Debt Issued | 400 | 73 | (2) | - | 471 |
| Long-term Debt Repaid | (351) | (128) | (67) | - | (546) |
| Dividends Paid | (148) | (130) | (30) | 163 | (145) |
| Stock Options Exercised | 319 | - | - | - | 319 |
| Shares Repurchased | (465) | - | - | - | (465) |
| Other Financing Activities | 11 | (174) | (336) | 562 | 63 |
| | Net Cash (Used in) Provided by Financing Activities | (234) | (351) | (436) | 725 | (296) |
| | | | | | | |
| Net Increase (Decrease) in Cash and Cash Equivalents | 395 | 17 | (260) | - | 152 |
| Cash and Cash Equivalents at Beginning of Period | 24 | - | 285 | - | 309 |
| Cash and Cash Equivalents at End of Period | $ 419 | $ 17 | $ 25 | $ - | $ 461 |
CSX CORPORATION
PART II
Item 8. Financial Statements and Supplementary Data
NOTE 19. Summarized Consolidating Financial Data, continued
Consolidating Cash Flow Statements
(Dollars in Millions)
| | | CSX | CSX | | | |
| Fiscal Year Ended December 30, 2005 | Corporation | Transportation | Other | Eliminations | Consolidated |
| | | | | | | |
| Operating Activities | | | | | |
| | Net Cash (Used in) Provided by Operating Activities | $ (637) | $ 1,509 | $ 474 | $ (236) | $ 1,110 |
| | | | | | | |
| Investing Activities | | | | | |
| Property Additions | - | (1,066) | (70) | - | (1,136) |
| Insurance Proceeds | - | 40 | 1 | - | 41 |
| Net Proceeds from Sale of International Terminals | - | - | 1,108 | - | 1,108 |
| Purchase of Minority Interest in an International | | | | | |
| | Terminals' Subsidiary | - | - | (110) | - | (110) |
| Purchases of Short-term Investments | (2,601) | - | - | - | (2,601) |
| Proceeds from Sales of Short-term Investments | 2,634 | - | - | - | 2,634 |
| Other Investing Activities | 1,066 | (19) | (684) | (335) | 28 |
| | Net Cash Provided by (Used in) Investing Activities | 1,099 | (1,045) | 245 | (335) | (36) |
| | | | | | | |
| Financing Activities | | | | | |
| Short-term Debt - Net | (100) | - | 1 | - | (99) |
| Long-term Debt Issued | 73 | 32 | - | - | 105 |
| Long-term Debt Repaid | (1,125) | (135) | (23) | - | (1,283) |
| Dividends Paid | (95) | (200) | (33) | 235 | (93) |
| Stock Options Exercised | 98 | - | - | - | 98 |
| Other Financing Activities | (105) | (180) | (66) | 336 | (15) |
| | Net Cash (Used in) Provided by Financing Activities | (1,254) | (483) | (121) | 571 | (1,287) |
| | | | | | | |
| Net Increase (Decrease) in Cash and Cash Equivalents | (792) | (19) | 598 | - | (213) |
| Cash and Cash Equivalents at Beginning of Period | 816 | 19 | (313) | - | 522 |
| Cash and Cash Equivalents at End of Period | $ 24 | $ - | $ 285 | $ - | $ 309 |
Item 9. Changes in and Disagreements with Accountants on Accounting and Financial Disclosure
None.
Item 9A. Controls and Procedures
Evaluation of Disclosure Controls and Procedures
As of December 28, 2007, under the supervision and with the participation of CSX's Chief Executive Officer (“CEO”) and Chief Financial Officer (“CFO”), management has evaluated the effectiveness of the design and operation of the Company's disclosure controls and procedures. Based on that evaluation, the CEO and CFO concluded that, as of December 28, 2007, the Company's disclosure controls and procedures were effective at the reasonable assurance level in timely alerting them to material information required to be included in CSX’s periodic SEC reports. There were no changes in the Company's internal controls over financial reporting during the fourth quarter of 2007 that have materially affected or are reasonably likely to materially affect the Company's internal control over financial reporting.
Management's Report on Internal Control over Financial Reporting
CSX’s management is responsible for establishing and maintaining adequate internal control over financial reporting, as such term is defined in Exchange Act Rules 13a-15(f) and 15d-15(f). Under the supervision and with the participation of the management of CSX, including CSX’s CEO and CFO, CSX conducted an evaluation of the effectiveness of the Company’s internal control over financial reporting as of December 28, 2007 based on the framework in Internal Control – Integrated Framework issued by the Committee of Sponsoring Organizations of the Treadway Commission which is also referred to as COSO. Based on that evaluation, management of CSX concluded that the Company’s internal control over financial reporting was effective as of December 28, 2007. Management's assessment of the effectiveness of internal control over financial reporting is expressed at the level of reasonable assurance because a control system, no matter how well designed and operated, can provide only reasonable, but not absolute, assurance that the control system's objectives will be met.
The Company’s internal control over financial reporting as of December 28, 2007 has been audited by Ernst & Young LLP, an independent registered public accounting firm, as stated in their report which is included elsewhere herein.
Report of Independent Registered Public Accounting Firm
The Board of Directors and Shareholders of CSX Corporation
We have audited CSX Corporation’s internal control over financial reporting as of December 28, 2007, based on criteria established in Internal Control—Integrated Framework issued by the Committee of Sponsoring Organizations of the Treadway Commission (the COSO criteria). CSX Corporation’s management is responsible for maintaining effective internal control over financial reporting, and for its assessment of the effectiveness of internal control over financial reporting included in the accompanying Management’s Report on Internal Control over Financial Reporting. Our responsibility is to express an opinion on the company’s internal control over financial reporting based on our audit.
We conducted our audit in accordance with the standards of the Public Company Accounting Oversight Board (United States). Those standards require that we plan and perform the audit to obtain reasonable assurance about whether effective internal control over financial reporting was maintained in all material respects. Our audit included obtaining an understanding of internal control over financial reporting, assessing the risk that a material weakness exists, testing and evaluating the design and operating effectiveness of internal control based on the assessed risk, and performing such other procedures as we considered necessary in the circumstances. We believe that our audit provides a reasonable basis for our opinion.
A company’s internal control over financial reporting is a process designed to provide reasonable assurance regarding the reliability of financial reporting and the preparation of financial statements for external purposes in accordance with generally accepted accounting principles. A company’s internal control over financial reporting includes those policies and procedures that (1) pertain to the maintenance of records that, in reasonable detail, accurately and fairly reflect the transactions and dispositions of the assets of the company; (2) provide reasonable assurance that transactions are recorded as necessary to permit preparation of financial statements in accordance with generally accepted accounting principles, and that receipts and expenditures of the company are being made only in accordance with authorizations of management and directors of the company; and (3) provide reasonable assurance regarding prevention or timely detection of unauthorized acquisition, use, or disposition of the company’s assets that could have a material effect on the financial statements.
Because of its inherent limitations, internal control over financial reporting may not prevent or detect misstatements. Also, projections of any evaluation of effectiveness to future periods are subject to the risk that controls may become inadequate because of changes in conditions, or that the degree of compliance with the policies or procedures may deteriorate.
In our opinion, CSX Corporation maintained, in all material respects, effective internal control over financial reporting as of December 28, 2007, based on the COSO criteria.
We also have audited, in accordance with the standards of the Public Company Accounting Oversight Board (United States), the 2007 consolidated financial statements of CSX Corporation and our report dated February 15, 2008 expressed an unqualified opinion thereon.
/s/ Ernst & Young LLP
Independent Certified Public Accountants
Jacksonville, Florida
February 15, 2008
Changes in Internal Control over Financial Reporting
There were no material changes in the Company’s internal control over financial reporting.
Item 9B. Other Information
On January 24, 2008, CSX received notices from Icahn Masters Fund LP, Icahn Partners LP, Carl C. Icahn and Icahn Masters Fund II LP stating their intention to file notifications under the Hart-Scott-Rodino Antitrust Improvements Act of 1976 (“HSR”). The HSR notifications state a collective intent to acquire at least $418.6 million of CSX common stock and not more than $1.6 billion. The Company is voluntarily furnishing this information.
Item 10. Directors and Executive Officers of the Registrant
In accordance with Instruction G(3) of Form 10-K, the information required by this item is incorporated herein by reference to the Proxy Statement. The Proxy Statement will be filed not later than April 25, 2008 with respect to its 2008 annual meeting of shareholders, except for the information regarding the executive officers of the Company. Information regarding executive officers is included in Part I of this report under the caption "Executive Officers of the Registrant."
Item 11. Executive Compensation
In accordance with Instruction G(3) of Form 10-K, the information required by this Item is incorporated herein by reference to the Proxy Statement (see Item 10 above).
Item 12. Security Ownership of Certain Beneficial Owners and Management
In accordance with Instruction G(3) of Form 10-K, the information required by this Item is incorporated herein by reference to the Proxy Statement (see Item 10 above).
Item 13. Certain Relationships and Related Transactions
In accordance with Instruction G(3) of Form 10-K, the information required by this Item is incorporated herein by reference to the Proxy Statement (see Item 10 above).
Item 14. Principal Accounting Fees and Services
In accordance with Instruction G(3) of Form 10-K, the information required by this Item is incorporated herein by reference to the Proxy Statement (see Item 10 above).
Item 15. Exhibits and Financial Statement Schedules
(a)(1) Financial Statements
See Index to Consolidated Financial Statements on page 62.
(2) Financial Statement Schedules
The information required by Schedule II, Valuation and Qualifying Accounts, is included in Note 6 to the Consolidated Financial Statements, Casualty, Environmental and Other Reserves. All other financial statement schedules are not applicable.
(3) Exhibits
| 2.1 | Distribution Agreement, dated as of July 26, 2004, by and among CSX Corporation, CSX Transportation, Inc., CSX Rail Holding Corporation, CSX Northeast Holding Corporation, Norfolk Southern Corporation, Norfolk Southern Railway Company, CRR Holdings LLC, Green Acquisition Corp., Conrail Inc., Consolidated Rail Corporation, New York Central Lines LLC, Pennsylvania Lines LLC, NYC Newco, Inc. and PRR Newco, Inc. (incorporated herein by reference to Exhibit 2.1 to the Registrant’s Current Report on Form 8-K filed with the Commission on September 2, 2004) |
| 3.1 | Amended and Restated Articles of Incorporation of the Registrant (incorporated herein by reference to Exhibit 3.1 to the Registrant's Current Report on Form 8-K filed with the Commission on December 14, 2004) |
| 3.1(a) | Articles of Amendment to CSX Corporation’s Amended and Restated Articles of Incorporation of the Registrant (incorporated herein by reference to Exhibit 5.03 to the Registrant's Current Report on Form 8-K filed with the Commission on July 18, 2006) |
| 3.2 | Bylaws of the Registrant, amended effective as of February 4, 2008 (incorporated herein by reference to Exhibit 3.2 of the Registrant's Current Report on Form 8-K filed with the Commission on February 6, 2008) |
| 4.1(a) | Indenture, dated August 1, 1990, between the Registrant and The Chase Manhattan Bank, as Trustee (incorporated herein by reference to the Registrant's Form SE, dated September 7, 1990, filed with the Commission) |
| 4.1(b) | First Supplemental Indenture, dated as of June 15, 1991, between the Registrant and The Chase Manhattan Bank, as Trustee (incorporated herein by reference to Exhibit 4(c) to the Registrant's Form SE, dated May 28, 1992, filed with the Commission) |
| 4.1(c) | Second Supplemental Indenture, dated as of May 6, 1997, between the Registrant and The Chase Manhattan Bank, as Trustee (incorporated herein by reference to Exhibit 4.3 to the Registrant's Registration Statement on Form S-4 (Registration No. 333-28523) filed with the Commission on June 5, 1997) |
| 4.1(d) | Third Supplemental Indenture, dated as of April 22, 1998, between the Registrant and The Chase Manhattan Bank, as Trustee (incorporated herein by reference to Exhibit 4.2 to the Registrant's Current Report on Form 8-K filed with the Commission on May 12, 1998) |
| 4.1(e) | Fourth Supplemental Indenture, dated as of October 30, 2001, between the Registrant and The Chase Manhattan Bank, as Trustee (incorporated herein by reference to Exhibit 4.1 to the Registrant's Report on Form 10-Q filed with the Commission on November 7, 2001) |
| 4.1(f) | Fifth Supplemental Indenture, dated as of October 27, 2003 between the Registrant and The Chase Manhattan Bank, as Trustee (incorporated herein by reference to Exhibit 4.1 to the Registrant's Report on Form 8-K filed with the Commission on October 27, 2003) |
| 4.1(g) | Sixth Supplemental Indenture, dated as of September 23, 2004 between the Registrant and JP Morgan Chase Bank, formerly The Chase Manhattan Bank, as Trustee (incorporated herein by reference to Exhibit 4.1 to the Registrant’s Report on Form 10-Q filed with the Commission on November 3, 2004) |
| 4.1(h) | Seventh Supplemental Indenture, dated as of April 25, 2007, between the Registrant and The Bank of New York (as successor to JP Morgan Chase Bank), as Trustee (incorporated herein by reference to Exhibit 4.4 to the Registrant's Report on Form 8-K filed with the Commission on April 26, 2007). |
Pursuant to Regulation S-K, Item 601(b)(4)(iii), instruments that define the rights of holders of the Registrant's long-term debt securities, where the long-term debt securities authorized under each such instrument do not exceed 10% of the Registrant's total assets, have been omitted and will be furnished to the Commission upon request.
| 10.1** | CSX Stock Plan for Directors (as amended through January 1, 2004) (incorporated herein by reference to Exhibit 10.1 to the Registrant's Annual Report on Form 10-K filed with the Commission on March 10, 2004) |
| 10.2* ** | CSX Directors’ Pre-2005 Deferred Compensation Plan (as amended through January 8, 2008) |
| 10.3* ** | CSX Directors’ Deferred Compensation Plan effective January 1, 2005 |
| 10.4** | CSX Directors' Charitable Gift Plan, as amended (incorporated herein by reference to Exhibit 10.4 to the Registrant's Annual Report on Form 10-K filed with the Commission on March 4, 1994) |
| 10.5** | CSX Directors' Matching Gift Plan (as amended through December 31, 2003) (incorporated herein by reference to Exhibit 10.5 to the Registrant's Annual Report on Form 10-K filed with the Commission on March 10, 2004) |
| 10.6** | Railroad Retirement Benefits Agreement with M. J. Ward (incorporated herein by reference to Exhibit 10.13 to the Registrant's Report on Form 10-K filed with the Commission on February 26, 2003) |
| 10.7** | Employment Agreement with O. Munoz (incorporated herein by reference to Exhibit 10.1 to the Registrant's Report on Form 10-Q filed with the Commission on July 30, 2003) |
| 10.8** | Form of Employment Agreement with executive officers (incorporated herein by reference to Exhibit 10.1 of the Registrant's Current Report on Form 8-K filed with the Commission on January 6, 2005) |
| 10.9** | Form of Stock Option Agreement (incorporated herein by reference to Exhibit 10.17 of the Registrant's Report on Form 10-K filed with the Commission on March 4, 2002) |
| 10.10** | 1987 Long-term Performance Stock Plan, as Amended and Restated effective April 25, 1996 (as amended through February 7, 2003) (incorporated herein by reference to Exhibit 10.24 to the Registrant's Annual Report on Form 10-K filed with the Commission on March 10, 2004) |
| 10.11** | Deferred Compensation Program for Executives of CSX Corporation and Affiliated Companies (as amended through January 1, 1998) (incorporated herein by reference to Exhibit 10.25 to the Registrant's Annual Report on Form 10-K filed with the Commission on March 10, 2004) |
| 10.12** | 2002 Deferred Compensation Plan of CSX Corporation and Affiliated Corporations (as amended through February 7, 2003) (incorporated herein by reference to Exhibit 10.26 to the Registrant's Annual Report on Form 10-K filed with the Commission on March 10, 2004) |
| 10.13** | Supplementary Savings Plan and Incentive Award Deferral Plan for Eligible Executives of CSX Corporation and Affiliated Companies (as Amended through February 7, 2003) (incorporated herein by reference to Exhibit 10.27 to the Registrant's Annual Report on Form 10-K filed with the Commission on March 10, 2004) |
| 10.14** | Special Retirement Plan of CSX Corporation and Affiliated Companies (as amended through February 14, 2001) (incorporated herein by reference to Exhibit 10.23 to the Registrant's Report on Form 10-K filed with the Commission on March 4, 2002) |
| 10.15** | Supplemental Retirement Benefit Plan of CSX Corporation and Affiliated Companies (as amended through February 14, 2001) (incorporated herein by reference to Exhibit 10.24 of the Registrant's Report on Form 10-K filed with the Commission on March 4, 2002) |
| 10.16** | Senior Executive Incentive Compensation Plan (incorporated herein by reference to Appendix B to the Registrant's Definitive Proxy Statement filed with the Commission on March 17, 2000) |
| 10.17* ** | CSX Omnibus Incentive Plan (as Amended through December 12, 2007) |
| 10.18** | 1990 Stock Award Plan as Amended and Restated Effective February 14, 1996 (as amended through September 8, 1999) (incorporated herein by reference to Exhibit 10.24 to the Registrant's Annual Report on Form 10-K filed with the Commission on March 7, 2000) |
| 10.19 | Transaction Agreement, dated as of June 10, 1997, by and among CSX Corporation, CSX Transportation, Inc., Norfolk Southern Corporation, Norfolk Southern Railway Company, Conrail Inc., Consolidated Rail Corporation and CRR Holdings LLC, with certain schedules thereto (incorporated herein by reference to Exhibit 10 to the Registrant’s Current Report on Form 8-K filed with the Commission on July 8, 1997) |
| 10.20 | Amendment No. 1, dated as of August 22, 1998, to the Transaction Agreement, dated as of June 10, 1997, by and among CSX Corporation, CSX Transportation, Inc., Norfolk Southern Corporation, Norfolk Southern Railway Company, Conrail Inc., Consolidated Rail Corporation and CRR Holdings LLC (incorporated herein by reference to Exhibit 10.1 to the Registrant's Current Report on Form 8-K filed with the Commission on June 11, 1999) |
| 10.21 | Amendment No. 2, dated as of June 1, 1999, to the Transaction Agreement, dated as of June 10, 1997, by and among CSX Corporation, CSX Transportation, Inc., Norfolk Southern Corporation, Norfolk Southern Railway Company, Conrail Inc., Consolidated Rail Corporation and CRR Holdings, LLC (incorporated herein by reference to Exhibit 10.2 to the Registrant's Current Report on Form 8-K filed with the Commission on June 11, 1999) |
| 10.22 | Shared Assets Area Operating Agreement for Detroit, dated as of June 1, 1999, by and among Consolidated Rail Corporation, CSX Transportation, Inc. and Norfolk Southern Railway Corporation, with exhibit thereto (incorporated herein by reference to Exhibit 10.6 to the Registrant's Current Report on Form 8-K filed with the Commission on June 11, 1999) |
| 10.23 | Monongahela Usage Agreement, dated as of June 1, 1999, by and among CSX Transportation, Inc., Norfolk Southern Railway Company, Pennsylvania Lines LLC and New York Central Lines LLC, with exhibit thereto (incorporated herein by reference to Exhibit 10.7 to the Registrant's Current Report on Form 8-K filed with the Commission on June 11, 1999) |
| 10.24 | Tax Allocation Agreement, dated as of August 27, 2004, by and among CSX Corporation, Norfolk Southern Corporation, Green Acquisition Corp., Conrail Inc., Consolidated Rail Corporation, New York Central Lines LLC and Pennsylvania Lines LLC (incorporated herein by reference to Exhibit 10.2 to the Registrant's Current Report on Form 8-K filed with the Commission on September 2, 2004) |
| 10.25** | Employment Agreement with T. L. Ingram, dated as of March 15, 2004 (incorporated herein by reference to Exhibit 10.1 to the Registrant's Report on Form 10-Q filed with the Commission on April 30, 2004) |
| 10.26** | Restricted Stock Award Agreement with T. L. Ingram (incorporated herein by reference to Exhibit 10.1 to the Registrant's Report on Form 10-Q filed with the Commission on July 29, 2004) |
| 10.27** | Amendment No. 1, dated as of December 13, 2004, to Employment Agreement with T. L. Ingram, dated as of March 15, 2004 (incorporated herein by reference to Exhibit 10.2 to the Registrant's Current Report on Form 8-K filed with the Commission on December 14, 2004) |
| 10.28** | Restricted Stock Award Agreement with Ellen M. Fitzsimmons (incorporated herein by reference to Exhibit 10.41 of the Registrant's Annual Report on Form 10-K filed with the Commission on February 24, 2006) |
| 10.29 | Revolving Credit Agreement, dated May 4, 2006 (incorporated herein by reference to Exhibit 99.1 to the Registrant's Current Report on Form 8-K filed with the Commission on May 9, 2006) |
| 10.30 | Underwriting agreement, dated April 20, 2007 (incorporated herein by reference to Exhibit 1.1 to the Registrant's Current Report on Form 8-K filed with the Commission on April 26, 2007) |
| 10.31** | Long-term Incentive Plan, dated May 1, 2007 (incorporated herein by reference to Exhibit 10.1 to the Registrant's Current Report on Form 8-K filed with the Commission on May 7, 2007) |
| 10.32 | Underwriting agreement dated September 4, 2007 (incorporated herein by reference to Exhibit 1.1 to the Registrant's Current Report on Form 8-K filed with the Commission on September 10, 2007) |
| 10.33 | Underwriting agreement dated December 10, 2007 (incorporated herein by reference to Exhibit 1.1 to the Registrant's Current Report on Form 8-K filed with the Commission on December 17, 2007) |
| 21* | Subsidiaries of the Registrant |
| 23* | Consent of Ernst & Young LLP |
| 31.1* | Rule 13a-14(a) Certification of Principal Executive Officer |
| 31.2* | Rule 13a-14(a) Certification of Principal Financial Officer |
| 32.1* | Rule 13a-14(b) Certification of Principal Executive Officer |
| 32.2* | Rule 13a-14(b) Certification of Principal Financial Officer |
| | ** Management Contract or Compensatory Plan or Arrangement |
Pursuant to the requirements of Section 13 or 15(d) of the Securities Exchange Act of 1934, the Registrant has duly caused this report to be signed on its behalf by the undersigned, thereunto duly authorized.
CSX CORPORATION
(Registrant)
By: /s/ CAROLYN T. SIZEMORE
| | Vice President and Controller |
| | (Principal Accounting Officer) |
Dated: February 19, 2008
Pursuant to the requirements of the Securities Exchange Act of 1934, this report has been signed below by the following persons on behalf of the Registrant and in the capacities indicated on February 22, 2008.
| | Signature | Title |
| | | |
| | | Chairman of the Board, President, |
| | | Chief Executive Officer and Director |
| | /s/ MICHAEL J. WARD | (Principal Executive Officer) |
| | Michael J. Ward | |
| | | |
| | | Executive Vice President and |
| | /s/ OSCAR MUNOZ | Chief Financial Officer (Principle Financial Officer) |
| | Oscar Munoz | |
| | | |
| | | Vice President and Controller |
| | /s/ CAROLYN T. SIZEMORE | (Principle Accounting Officer) |
| | Carolyn T. Sizemore | |
| | | |
| | | Senior Vice President - Law and Public Affairs |
| | *By: /s/ ELLEN M. FITZSIMMONS | *Attorney-in-Fact |
| | Ellen M. Fitzsimmons | |
| | Signature | Title |
| | | |
| | * | Director |
| | Donna M. Alvarado | |
| | | |
| | * | Director |
| | Elizabeth E. Bailey | |
| | | |
| | * | Director |
| | John B. Breaux | |
| | | |
| | * | Director |
| | Steven T. Halverson | |
| | | |
| | * | Director |
| | Edward J. Kelly III | |
| | | |
| | * | Director |
| | Robert D. Kunisch | |
| | | |
| | * | Director |
| | Southwood J. Morcott | |
| | | |
| | * | Director |
| | David M. Ratcliffe | |
| | | |
| | * | Director |
| | William C. Richardson | |
| | | |
| | * | Director |
| | Frank S. Royal M.D. | |
| | | |
| | * | Director |
| | Donald J. Shepard | |