CSX Announces Record Fourth-Quarter
and Full-Year 2011 Earnings Per Share
JACKSONVILLE, Fla. - January 23, 2012 - CSX Corporation (NYSE: CSX) today announced fourth quarter 2011 earnings of $0.43 per share, versus $0.38 per share in the same period last year. This represents a 13 percent year-over-year improvement in earnings per share and a fourth quarter record. The results were driven by revenues of nearly $3.0 billion, operating income of $841 million and an operating ratio of 71.5 percent.
“CSX once again delivered record earnings per share while investing in resources to support high customer service levels and growth in the near- and long-term,” said Michael J. Ward, chairman, president and chief executive officer. “Our performance in 2011 has set a strong foundation for growth, and CSX remains committed to achieving a 65 percent operating ratio by no later than 2015.”
For the full year, CSX generated record performance in revenue, operating income, operating ratio and earnings per share. Revenues increased 10 percent to $11.7 billion, operating income rose 11 percent to $3.4 billion, the operating ratio improved to 70.9 percent, and earnings per share improved 24 percent to $1.67.
This earnings announcement, as well as a package of detailed financial information, is contained in the CSX Quarterly Financial Report available on the company's website at http://investors.csx.com and on Form 8-K with the Securities and Exchange Commission.
CSX executives will conduct a quarterly earnings conference call with the investment community on January 24, 2012, at 8:30 a.m. Eastern time. Investors, media and the public may listen to the conference call by dialing 1-888-327-6279 (888-EARN-CSX) and asking for the CSX earnings call. (Callers outside the U.S., dial 1-773-756-0199). Participants should dial in 10 minutes prior to the call. In conjunction with the call, a live webcast will be accessible and presentation materials will be posted on the company's website at http://investors.csx.com. Following the earnings call, an internet replay of the presentation will be archived on the company website.
|
| | | |
| Table of Contents | The accompanying unaudited | CSX CORPORATION | CONTACTS: |
| | financial information should be | 500 Water Street, C900 | |
| read in conjunction with the | Jacksonville, FL 32202 | INVESTOR RELATIONS |
| Company’s most recent | http://www.csx.com | David Baggs |
| Annual Report on Form 10-K, | | (904) 359-4812 |
| | Quarterly Reports on Form | | MEDIA |
| | 10-Q, and any Current | | Lauren Rueger |
| | Reports on Form 8-K. | | (877) 835-5279 |
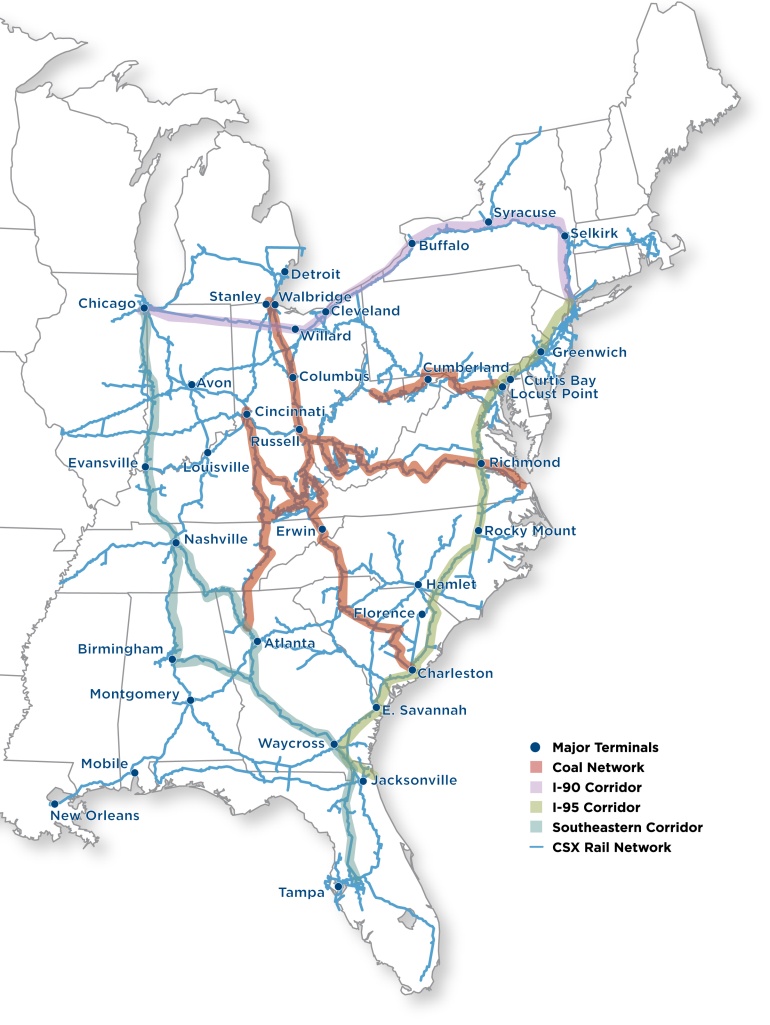
CSX Corporation, based in Jacksonville, Fla., is one of the nation's leading transportation companies, providing rail, intermodal and rail-to-truck transload services. The company's transportation network spans approximately 21,000 miles, with service to 23 eastern states and the District of Columbia. CSX's network connects to more than 240 short line and regional railroads and more than 70 ocean, river, and lake ports. More information about CSX Corporation and its subsidiaries is available at www.csx.com.
Forward-looking Statements
This information and other statements by the company may contain forward-looking statements within the meaning of the Private Securities Litigation Reform Act with respect to, among other items: projections and estimates of earnings, revenues, volumes, rates, cost-savings, expenses, taxes, liquidity, capital expenditures, dividends, share repurchases or other financial items, statements of management's plans, strategies and objectives for future operations, and management's expectations as to future performance and operations and the time by which objectives will be achieved, statements concerning proposed new services, and statements regarding future economic, industry or market conditions or performance. Forward-looking statements are typically identified by words or phrases such as “will,” “should,” “believe,” “expect,” “anticipate,” “project,” “estimate,” “preliminary” and similar expressions. Forward-looking statements speak only as of the date they are made, and the company undertakes no obligation to update or revise any forward-looking statement. If the company updates any forward-looking statement, no inference should be drawn that the company will make additional updates with respect to that statement or any other forward-looking statements.
Forward-looking statements are subject to a number of risks and uncertainties, and actual performance or results could differ materially from that anticipated by any forward-looking statements. Factors that may cause actual results to differ materially from those contemplated by any forward-looking statements include, among others; (i) the company's success in implementing its financial and operational initiatives; (ii) changes in domestic or international economic, political or business conditions, including those affecting the transportation industry (such as the impact of industry competition, conditions, performance and consolidation); (iii) legislative or regulatory changes; (iv) the inherent business risks associated with safety and security; (v) the outcome of claims and litigation involving or affecting the company; (vi) natural events such as severe weather conditions or pandemic health crises; and (vii) the inherent uncertainty associated with projecting economic and business conditions.
Other important assumptions and factors that could cause actual results to differ materially from those in the forward-looking statements are specified in the company's SEC reports, accessible on the SEC's website at www.sec.gov and the company's website at www.csx.com.
CONSOLIDATED INCOME STATEMENTS(a)
(Dollars in millions, except per share amounts)
|
| | | | | | | | | | | | | | | | | | | | | | | |
| | (Unaudited) | | (Unaudited) | | | |
| | Quarters Ended | | Years Ended |
| | Dec. 30, 2011 | Dec. 31, 2010 | $ Change | % Change | | Dec. 30, 2011 | Dec. 31, 2010 | $ Change | % Change |
| | | | | | | | | | |
| Revenue | $ | 2,951 |
| $ | 2,816 |
| $ | 135 |
| 5 | % | | $ | 11,743 |
| $ | 10,636 |
| $ | 1,107 |
| 10 | % |
| Expense | | | | | | | | | |
| Labor and Fringe | 779 |
| 776 |
| (3 | ) | — |
| | 3,073 |
| 2,957 |
| (116 | ) | (4 | ) |
| Materials, Supplies and Other | 580 |
| 496 |
| (84 | ) | (17 | ) | | 2,229 |
| 2,075 |
| (154 | ) | (7 | ) |
| Fuel | 423 |
| 346 |
| (77 | ) | (22 | ) | | 1,668 |
| 1,212 |
| (456 | ) | (38 | ) |
| Depreciation | 236 |
| 257 |
| 21 |
| 8 |
| | 976 |
| 947 |
| (29 | ) | (3 | ) |
| Equipment and Other Rents | 92 |
| 95 |
| 3 |
| 3 |
| | 379 |
| 374 |
| (5 | ) | (1 | ) |
| Total Expense | 2,110 |
| 1,970 |
| (140 | ) | (7 | ) | | 8,325 |
| 7,565 |
| (760 | ) | (10 | ) |
| | | | | | | | | | |
| Operating Income | 841 |
| 846 |
| (5 | ) | (1 | ) | | 3,418 |
| 3,071 |
| 347 |
| 11 |
|
| | | | | | | | | | |
| Interest Expense | (140 | ) | (149 | ) | 9 |
| 6 |
| | (552 | ) | (557 | ) | 5 |
| 1 |
|
Other Income - Net(b) | 11 |
| 4 |
| 7 |
| 175 |
| | 22 |
| 32 |
| (10 | ) | (31 | ) |
| Earnings Before Income Taxes | 712 |
| 701 |
| 11 |
| 2 |
| | 2,888 |
| 2,546 |
| 342 |
| 13 |
|
| | | | | | | | | | |
Income Tax Expense(c) | (255 | ) | (271 | ) | 16 |
| 6 |
| | (1,066 | ) | (983 | ) | (83 | ) | (8 | ) |
| Net Earnings | $ | 457 |
| $ | 430 |
| $ | 27 |
| 6 | % | | $ | 1,822 |
| $ | 1,563 |
| $ | 259 |
| 17 | % |
| | | | | | | | | | |
| Operating Ratio | 71.5 | % | 70.0 | % | | | | 70.9 | % | 71.1 | % | | |
| | | | | | | | | | |
| Per Common Share | | | | | | | | | |
Net Earnings Per Share, Assuming Dilution | $ | 0.43 |
| $ | 0.38 |
| $ | 0.05 |
| 13 | % | | $ | 1.67 |
| $ | 1.35 |
| $ | 0.32 |
| 24 | % |
| | | | | | | | | | |
Average Shares Outstanding, Assuming Dilution (Millions)(d) | 1,056 |
| 1,128 |
| | | | 1,089 |
| 1,154 |
| | |
| | | | | | | | | | |
Cash Dividends Paid Per Common Share | $ | 0.12 |
| $ | 0.09 |
| | | | $ | 0.45 |
| $ | 0.33 |
| | |
See accompanying Notes to Consolidated Financial Statements on page 6.
CONDENSED CONSOLIDATED BALANCE SHEETS
(Dollars in millions)
|
| | | | | | |
| | (Unaudited) | |
| | Dec. 30, 2011 | Dec. 31, 2010 |
| ASSETS |
| | | |
| Cash, Cash Equivalents and Short-term Investments | $ | 1,306 |
| $ | 1,346 |
|
| Other Current Assets | 1,629 |
| 1,509 |
|
| Properties - Net | 24,974 |
| 23,799 |
|
| Investment in Affiliates and Other Companies | 1,171 |
| 1,134 |
|
| Other Long-term Assets | 393 |
| 353 |
|
| Total Assets | $ | 29,473 |
| $ | 28,141 |
|
| | | |
| | | |
| LIABILITIES AND SHAREHOLDERS' EQUITY |
| | | |
| Current Maturities of Long-term Debt | $ | 507 |
| $ | 613 |
|
| Other Current Liabilities | 2,180 |
| 1,924 |
|
| Long-term Debt | 8,734 |
| 8,051 |
|
| Deferred Income Taxes | 7,601 |
| 7,053 |
|
| Other Long-term Liabilities | 1,983 |
| 1,800 |
|
| Total Liabilities | 21,005 |
| 19,441 |
|
| | | |
| Total Shareholders' Equity | 8,468 |
| 8,700 |
|
| Total Liabilities and Shareholders' Equity | $ | 29,473 |
| $ | 28,141 |
|
See accompanying Notes to Consolidated Financial Statements on page 6.
CONDENSED CONSOLIDATED CASH FLOW STATEMENTS
(Dollars in millions)
|
| | | | | | |
| | (Unaudited) | |
| | Years Ended |
| | Dec. 30, 2011 | Dec. 31, 2010 |
| OPERATING ACTIVITIES | | |
| Net Earnings | $ | 1,822 |
| $ | 1,563 |
|
| Depreciation | 976 |
| 947 |
|
| Deferred Income Taxes | 609 |
| 474 |
|
Other-Net(e) | 84 |
| 277 |
|
| Net Cash Provided by Operating Activities | 3,491 |
| 3,261 |
|
| | | |
| INVESTING ACTIVITIES | | |
Property Additions(f) | (2,297 | ) | (1,840 | ) |
Proceeds from Property Dispositions(g) | 240 |
| 108 |
|
| Purchase of Short-term Investments | (492 | ) | — |
|
| Other Investing Activities | (38 | ) | (39 | ) |
| Net Cash Used in Investing Activities | (2,587 | ) | (1,771 | ) |
| | | |
| FINANCING ACTIVITIES | | |
| Long-term Debt Issued | 1,200 |
| 800 |
|
| Long-term Debt Repaid | (605 | ) | (113 | ) |
| Dividends Paid | (480 | ) | (372 | ) |
Shares Repurchased(h) | (1,564 | ) | (1,452 | ) |
Other Financing Activities - Net(i) | 36 |
| (90 | ) |
| Net Cash Used in Financing Activities | (1,413 | ) | (1,227 | ) |
| | | |
| Net (Decrease) Increase in Cash and Cash Equivalents | (509 | ) | 263 |
|
| | | |
| CASH AND CASH EQUIVALENTS | | |
| Cash and Cash Equivalents at Beginning of Period | 1,292 |
| 1,029 |
|
| Cash and Cash Equivalents at End of Period | $ | 783 |
| $ | 1,292 |
|
See accompanying Notes to Consolidated Financial Statements on page 6.
NOTES TO CONSOLIDATED FINANCIAL STATEMENTS (Unaudited)
| |
| a) | Fiscal year: CSX follows a 52/53 week fiscal reporting calendar. The fourth quarter of 2010 included an extra week, making the fourth quarter 14 weeks and the year 53 weeks. |
| |
| b) | Other Income - Net: Other income - net consisted of the following: |
|
| | | | | | | | | | | | | | | | | | | |
| | Quarters Ended | | Years Ended |
| (Dollars in millions) | Dec. 30, 2011 | Dec. 31, 2010 | $ Change | | Dec. 30, 2011 | Dec. 31, 2010 | $ Change |
| Interest Income | $ | 2 |
| $ | 2 |
| $ | — |
| | $ | 5 |
| $ | 6 |
| $ | (1 | ) |
| Income from Real Estate Operations | 11 |
| 10 |
| 1 |
| | 25 |
| 30 |
| (5 | ) |
| Miscellaneous Expense | (2 | ) | (8 | ) | 6 |
| | (8 | ) | (4 | ) | (4 | ) |
| Total Other Income - Net | $ | 11 |
| $ | 4 |
| $ | 7 |
| | $ | 22 |
| $ | 32 |
| $ | (10 | ) |
| |
| c) | Income Tax Expense: In the fourth quarter of 2011, CSX recognized net benefits of $15 million primarily related to a change in the apportionment of state taxes. In last year's fourth quarter, a net expense of $4 million was recognized primarily related to a change in the apportionment of state taxes that was partially offset by a benefit from enacted federal income tax legislation. |
| |
| d) | Shares Outstanding: All share and per share data were retroactively restated to reflect the 3:1 stock split which was effective May 31, 2011. |
| |
| e) | Other Operating Activities - Net: During 2011, the decrease in other operating activities was primarily driven by larger incentive compensation payouts and higher accounts receivable balance related to higher revenue. |
| |
| f) | Property Additions: Property additions of $2,297 million include approximately $100 million of investments related to reimbursable public-private partnerships. These reimbursements may not be fully received in a given year. Also, certain reimbursements will be recorded in proceeds from property dispositions which are shown separately on the cash flow statement. |
| |
| g) | Proceeds from Property Dispositions: In 2011, CSX received proceeds of $146 million for the sale of a portion of its rail corridor to the state of Florida for their new commuter rail operation known as SunRail. |
| |
| h) | Shares Repurchased: During the fiscal years 2011 and 2010, 67 million shares were repurchased for $1.6 billion and 80 million shares were repurchased for $1.5 billion, respectively. Shares purchased before May 31, 2011 have been restated to reflect the 3:1 stock split for comparability purposes. |
| |
| i) | Other Financing Activities - Net: In 2010, other financing activities included $141 million paid as cash consideration to exchange higher interest rate debt for lower interest rate debt which did not repeat in 2011. |
|
| | | | | | | | | | | | | | | | | | | | | | | | | | | |
VOLUME AND REVENUE (Unaudited) | |
| Volume (Thousands of units); Revenue (Dollars in millions); Revenue Per Unit (Dollars) | |
| | |
REPORTED GAAP(a) (includes extra week in 2010) | |
| | |
Quarters Ended December 30, 2011 (13 weeks) and December 31, 2010 (14 weeks) | |
| | | | | | | | | |
| | Volume | | | Revenue | | | Revenue Per Unit | |
| | 2011 | 2010 | % Change | | 2011 | 2010 | % Change | | 2011 | 2010 | % Change |
| Agricultural | | | | | | | | | | | | | | |
| Agricultural Products | 110 |
| 121 |
| (8 | )% | | | $ | 281 |
| $ | 288 |
| (2 | )% | | | $ | 2,555 |
| $ | 2,380 |
| 6 | % | |
| Phosphates and Fertilizers | 78 |
| 76 |
| 3 |
| | | 117 |
| 126 |
| (7 | ) | | | 1,500 |
| 1,658 |
| (10 | ) | |
| Food and Consumer | 25 |
| 26 |
| (6 | ) | | | 66 |
| 65 |
| 2 |
| | | 2,640 |
| 2,500 |
| 8 |
| |
| Industrial | | | | | | | | | | | | | | |
| Chemicals | 110 |
| 117 |
| (7 | ) | | | 382 |
| 383 |
| — |
| | | 3,473 |
| 3,274 |
| 7 |
| |
| Automotive | 99 |
| 96 |
| 4 |
| | | 263 |
| 230 |
| 14 |
| | | 2,657 |
| 2,396 |
| 10 |
| |
| Metals | 64 |
| 60 |
| 8 |
| | | 152 |
| 127 |
| 19 |
| | | 2,375 |
| 2,117 |
| 10 |
| |
| Housing and Construction | | | | | | | | | | | | | | |
| Emerging Markets | 111 |
| 107 |
| 4 |
| | | 168 |
| 155 |
| 8 |
| | | 1,514 |
| 1,449 |
| 4 |
| |
| Forest Products | 69 |
| 70 |
| (1 | ) | | | 170 |
| 160 |
| 6 |
| | | 2,464 |
| 2,286 |
| 8 |
| |
| Total Merchandise | 666 |
| 673 |
| (1 | ) | | | 1,599 |
| 1,534 |
| 4 |
| | | 2,401 |
| 2,279 |
| 5 |
| |
| | | | | | | | | | | | | | | |
| Coal | 374 |
| 407 |
| (8 | ) | | | 915 |
| 861 |
| 6 |
| | | 2,447 |
| 2,115 |
| 16 |
| |
| | | | | | | | | | | | | | | |
| Intermodal | 579 |
| 611 |
| (5 | ) | | | 375 |
| 350 |
| 7 |
| | | 648 |
| 573 |
| 13 |
| |
| | | | | | | | | | | | | | | |
Other(b) | — |
| — |
| — |
| | | 62 |
| 71 |
| (12 | ) | | | — |
| — |
| — |
| |
| | | | | | | | | | | | | | | |
| Total | 1,619 |
| 1,691 |
| (4 | )% | | | $ | 2,951 |
| $ | 2,816 |
| 5 | % | | | $ | 1,823 |
| $ | 1,665 |
| 9 | % | |
|
| | | | | | | | | | | | | | | | | | | | | | | | | | | |
| | |
Years Ended December 30, 2011 (52 weeks) and December 31, 2010 (53 weeks) | |
| | | | | | | | | |
| | Volume | | | Revenue | | | Revenue Per Unit | |
| | 2011 | 2010 | % Change | | 2011 | 2010 | % Change | | 2011 | 2010 | % Change |
| Agricultural | | | | | | | | | | | | | | |
| Agricultural Products | 424 |
| 446 |
| (5 | )% | | | $ | 1,048 |
| $ | 1,056 |
| (1 | )% | | | $ | 2,472 |
| $ | 2,368 |
| 4 | % | |
| Phosphates and Fertilizers | 321 |
| 313 |
| 3 |
| | | 490 |
| 465 |
| 5 |
| | | 1,526 |
| 1,486 |
| 3 |
| |
| Food and Consumer | 101 |
| 102 |
| (1 | ) | | | 263 |
| 245 |
| 7 |
| | | 2,604 |
| 2,402 |
| 8 |
| |
| Industrial | | | | | | | | | | | | | | |
| Chemicals | 462 |
| 461 |
| — |
| | | 1,596 |
| 1,485 |
| 7 |
| | | 3,455 |
| 3,221 |
| 7 |
| |
| Automotive | 361 |
| 340 |
| 6 |
| | | 936 |
| 800 |
| 17 |
| | | 2,593 |
| 2,353 |
| 10 |
| |
| Metals | 265 |
| 243 |
| 9 |
| | | 613 |
| 520 |
| 18 |
| | | 2,313 |
| 2,140 |
| 8 |
| |
| Housing and Construction | | | | | | | | | | | | | | |
| Emerging Markets | 439 |
| 418 |
| 5 |
| | | 672 |
| 615 |
| 9 |
| | | 1,531 |
| 1,471 |
| 4 |
| |
| Forest Products | 281 |
| 265 |
| 6 |
| | | 684 |
| 600 |
| 14 |
| | | 2,434 |
| 2,264 |
| 7 |
| |
| Total Merchandise | 2,654 |
| 2,588 |
| 3 |
| | | 6,302 |
| 5,786 |
| 9 |
| | | 2,375 |
| 2,236 |
| 6 |
| |
| | | | | | | | | | | | | | | |
| Coal | 1,533 |
| 1,573 |
| (3 | ) | | | 3,709 |
| 3,267 |
| 14 |
| | | 2,419 |
| 2,077 |
| 17 |
| |
| | | | | | | | | | | | | | | |
Intermodal(b) | 2,289 |
| 2,223 |
| 3 |
| | | 1,434 |
| 1,291 |
| 11 |
| | | 626 |
| 581 |
| 8 |
| |
| | | | | | | | | | | | | | | |
| Other | — |
| — |
| — |
| | | 298 |
| 292 |
| 2 |
| | | — |
| — |
| — |
| |
| | | | | | | | | | | | | | | |
| Total | 6,476 |
| 6,384 |
| 1 | % | | | $ | 11,743 |
| $ | 10,636 |
| 10 | % | | | $ | 1,813 |
| $ | 1,666 |
| 9 | % | |
(a) GAAP represents generally accepted accounting principles.
(b) In the fourth quarter, CSX reduced revenue by $18 million correcting the first nine months of 2011 intermodal revenue on certain interline business. This adjustment is presented in other revenue for the fourth quarter table above as it relates to prior periods, however, it is presented in intermodal revenue for the full year. The impact relating to first, second and third quarters of 2011 were $5 million, $7 million and $6 million, respectively, and were immaterial to each quarter and full year.
|
| | | | | | | | | | | | | | | | | | | | | | | | | | | |
VOLUME AND REVENUE (Unaudited) | |
| Volume (Thousands of units); Revenue (Dollars in millions); Revenue Per Unit (Dollars) | |
| | |
COMPARABLE NON-GAAP (excludes extra week in 2010)(b) | |
Quarters Ended December 30, 2011 (13 weeks) and December 31, 2010 (13 weeks) | |
| | | | | | | | | |
| | Volume(a) | | | Revenue | | | Revenue Per Unit | |
| | 2011 | 2010 | % Change | | 2011 | 2010 | % Change | | 2011 | 2010 | % Change |
| Agricultural | | | | | | | | | | | | | | |
| Agricultural Products | 110 |
| 113 |
| (2 | )% | | | $ | 281 |
| $ | 269 |
| 5 | % | | | $ | 2,555 |
| $ | 2,381 |
| 6 | % | |
| Phosphates and Fertilizers | 78 |
| 71 |
| 11 |
| | | 117 |
| 116 |
| 1 |
| | | 1,500 |
| 1,634 |
| (9 | ) | |
| Food and Consumer | 25 |
| 24 |
| — |
| | | 66 |
| 62 |
| 8 |
| | | 2,640 |
| 2,583 |
| 9 |
| |
| Industrial | | | | | | | | | | | | | | |
| Chemicals | 110 |
| 109 |
| — |
| | | 382 |
| 357 |
| 7 |
| | | 3,473 |
| 3,275 |
| 7 |
| |
| Automotive | 99 |
| 92 |
| 9 |
| | | 263 |
| 220 |
| 19 |
| | | 2,657 |
| 2,391 |
| 10 |
| |
| Metals | 64 |
| 56 |
| 16 |
| | | 152 |
| 118 |
| 28 |
| | | 2,375 |
| 2,107 |
| 11 |
| |
| Housing and Construction | | | | | | | | | | | | | | |
| Emerging Markets | 111 |
| 103 |
| 8 |
| | | 168 |
| 149 |
| 12 |
| | | 1,514 |
| 1,447 |
| 4 |
| |
| Forest Products | 69 |
| 65 |
| 6 |
| | | 170 |
| 148 |
| 15 |
| | | 2,464 |
| 2,277 |
| 8 |
| |
| Total Merchandise | 666 |
| 633 |
| 5 |
| | | 1,599 |
| 1,439 |
| 11 |
| | | 2,401 |
| 2,273 |
| 5 |
| |
| | | | | | | | | | | | | | | |
| Coal | 374 |
| 384 |
| (3 | ) | | | 915 |
| 807 |
| 13 |
| | | 2,447 |
| 2,102 |
| 17 |
| |
| | | | | | | | | | | | | | | |
| Intermodal | 579 |
| 581 |
| — |
| | | 375 |
| 331 |
| 13 |
| | | 648 |
| 570 |
| 14 |
| |
| | | | | | | | | | | | | | | |
Other(c) | — |
| — |
| — |
| | | 62 |
| 68 |
| (9 | ) | | | — |
| — |
| — |
| |
| | | | | | | | | | | | | | | |
| Total | 1,619 |
| 1,598 |
| 1 | % | | | $ | 2,951 |
| $ | 2,645 |
| 12 | % | | | $ | 1,823 |
| $ | 1,655 |
| 10 | % | |
|
| | | | | | | | | | | | | | | | | | | | | | | | | | | |
Years Ended December 30, 2011 (52 weeks) and December 31, 2010 (52 weeks) | |
| | | | | | | | | |
| | Volume | | | Revenue | | | Revenue Per Unit | |
| | 2011 | 2010 | % Change | | 2011 | 2010 | % Change | | 2011 | 2010 | % Change |
| Agricultural | | | | | | | | | | | | | | |
| Agricultural Products | 424 |
| 438 |
| (3 | )% | | | $ | 1,048 |
| $ | 1,037 |
| 1 | % | | | $ | 2,472 |
| $ | 2,368 |
| 4 | % | |
| Phosphates and Fertilizers | 321 |
| 308 |
| 4 |
| | | 490 |
| 455 |
| 8 |
| | | 1,526 |
| 1,477 |
| 3 |
| |
| Food and Consumer | 101 |
| 100 |
| — |
| | | 263 |
| 242 |
| 9 |
| | | 2,604 |
| 2,420 |
| 8 |
| |
| Industrial | | | | | | | | | | | | | | |
| Chemicals | 462 |
| 453 |
| 2 |
| | | 1,596 |
| 1,459 |
| 9 |
| | | 3,455 |
| 3,221 |
| 7 |
| |
| Automotive | 361 |
| 336 |
| 8 |
| | | 936 |
| 790 |
| 18 |
| | | 2,593 |
| 2,351 |
| 10 |
| |
| Metals | 265 |
| 239 |
| 11 |
| | | 613 |
| 511 |
| 20 |
| | | 2,313 |
| 2,138 |
| 8 |
| |
| Housing and Construction | | | | | | | | | | | | | | |
| Emerging Markets | 439 |
| 414 |
| 6 |
| | | 672 |
| 609 |
| 10 |
| | | 1,531 |
| 1,471 |
| 4 |
| |
| Forest Products | 281 |
| 260 |
| 8 |
| | | 684 |
| 588 |
| 16 |
| | | 2,434 |
| 2,262 |
| 7 |
| |
| Total Merchandise | 2,654 |
| 2,548 |
| 4 |
| | | 6,302 |
| 5,691 |
| 11 |
| | | 2,375 |
| 2,234 |
| 6 |
| |
| | | | | | | | | | | | | | | |
| Coal | 1,533 |
| 1,550 |
| (1 | ) | | | 3,709 |
| 3,213 |
| 15 |
| | | 2,419 |
| 2,073 |
| 17 |
| |
| | | | | | | | | | | | | | | |
Intermodal(c) | 2,289 |
| 2,193 |
| 4 |
| | | 1,434 |
| 1,272 |
| 13 |
| | | 626 |
| 580 |
| 8 |
| |
| | | | | | | | | | | | | | | |
| Other | — |
| — |
| — |
| | | 298 |
| 289 |
| 3 |
| | | — |
| — |
| — |
| |
| | | | | | | | | | | | | | | |
| Total | 6,476 |
| 6,291 |
| 3 | % | | | $ | 11,743 |
| $ | 10,465 |
| 12 | % | | | $ | 1,813 |
| $ | 1,663 |
| 9 | % | |
(a) Volume on a GAAP basis decreased (4%) (see previous page). On a non-GAAP basis (as seen in the chart above), volume increased 1%; the 13 week period includes the Christmas to New Year's holiday week in 2011, but is not included in 2010. The Association of American Railroad's (“AAR”) volume for both years' fourth quarter includes the Christmas to New Year's holiday week. The AAR volume shows an increase of 4% in the fourth quarter versus a year ago.
(b) CSX reports its financial results in accordance with generally accepted accounting principles ("GAAP"). However, management believes that certain non-GAAP financial measures used to manage the company's business that fall within the meaning of Regulation G (Disclosure of Non-GAAP Financial Measures) by the SEC may provide users of the financial information with additional meaningful comparisons to prior reported results. In an effort to provide financial statement users with comparable information and because revenue can be systematically calculated on a weekly basis, CSX has provided financial information adjusted for the extra week, which are non-GAAP financial measures. Likewise, this information facilitates comparisons to financial results that are directly associated with ongoing business operations as well as provides comparable historical information. These non-GAAP measures should not be considered a substitute for GAAP measures.
(c) In the fourth quarter, CSX reduced revenue by $18 million correcting the first nine months of 2011 intermodal revenue on certain interline business. This adjustment is presented in other revenue for the fourth quarter table above as it relates to prior periods, however, it is presented in intermodal revenue for the full year. The impact relating to first, second and third quarters of 2011 were $5 million, $7 million and $6 million, respectively, and were immaterial to each quarter and full year.
VOLUME AND REVENUE
(Comparable Non-GAAP)
CSX follows a 52/53 week fiscal reporting calendar. The fourth quarter of 2010 included an extra week, making the fourth quarter 14 weeks and the year 53 weeks. In the following discussion of quarterly comparisons, the comparable 13 week periods outlined in the table on the previous page are compared.
The Company achieved positive year-over-year volume and revenue results as demand for rail service in the markets CSX serves continued to support profitable growth. The overall increase in volume was led by growth in the merchandise markets. Ongoing emphasis on pricing above rail inflation, along with higher fuel recovery associated with the increase in fuel prices, drove revenue-per-unit increases in almost all markets.
Merchandise
Agricultural
Agricultural Products - Volume decreased due to reduced feed shipments resulting from higher corn prices and lower production from producers of poultry and pork.
Phosphates and Fertilizers - Shipments of phosphate rock, which is used to make fertilizer, grew as suppliers were stocking up in anticipation of a strong spring season. Overall, revenue per unit declined mostly due to mix.
Food and Consumer - Volume was flat with increases in manufactured goods and refrigerated products resulting from truckload conversions due to tight truck capacity offset by weakness in canned and other dry goods.
Industrial
Chemicals - Volume was flat as plastics and their raw material inputs decreased due to weak domestic demand and volatile commodity prices which resulted in an inventory drawdown. This weakness was offset by an increase in shipments of bio-diesel, used for heating, and strong growth in frac sand, used in certain oil and gas drilling operations.
Automotive - Automotive volume grew as North American automotive production increased to meet pent up demand from delayed purchases during the slowed economy over the last few years.
Metals - Volume growth was driven by strong export demand for scrap shipments and higher domestic steel production resulting from strong demand in the automotive and oil and gas markets for products such as sheet steel and pipe.
Housing and Construction
Emerging Markets - Volume increased due to improved shipments of aggregates (which include crushed stone, sand and gravel), cement and waste (such as construction and demolition debris) driven by new distribution facilities as well as the mild winter weather allowed construction to continue longer than seasonally typical.
Forest Products - Volume increased, despite the weakness in housing-related markets, as a result of a stronger end-of-year peak in export wood pulp and pulpboard shipments related to a stronger season as well as increased shipments of building products resulting from inventory replenishments.
Coal
Shipments of utility coal declined as electrical generation declined in the eastern U.S., natural gas prices remained low and utility stockpiles were above target levels. This decrease was partially offset by higher export shipments driven by greater demand for U.S. coal in Europe, South America and Asia. During 2011, CSX shipped 40.2 million tons of export coal. The increase in revenue per unit reflects improved yield and fuel recovery.
Intermodal
Volume was flat, as growth in domestic shipments was offset by weak international demand. Domestic shipments improved from continued strength in over-the-road conversions due to higher fuel prices and expanded service offerings. International volume declined as retailers had a more moderate peak season this year. The increase in revenue per unit was attributable to higher fuel recovery due to rising fuel prices and increased yields in both sectors.
EXPENSE
Expenses in the quarter increased $140 million from last year's fourth quarter. Significant variances are described below.
Labor and Fringe expense increased $3 million primarily due to the following:
| |
| • | Inflation related to higher wages and healthcare costs was $28 million. |
| |
| • | Training expenses were $9 million higher related to additional resources to enhance customer service. |
| |
| • | Incentive compensation expenses were $22 million lower in 2011. |
| |
| • | Volume related and various other costs were favorable during the quarter. |
Materials, Supplies and Other expense increased $84 million due to the following:
| |
| • | Casualty expenses for rail-related injuries increased year-over-year by $41 million primarily due to a $40 million benefit in 2010. This prior year benefit was recorded for the improvement in safety and occupational claim trends. |
| |
| • | Volume-related expenses were $13 million higher due to increased activity related to export coal and domestic intermodal. |
| |
| • | Inflation-related expenses increased $11 million. |
| |
| • | Various other costs were higher during the quarter. |
Fuel expense increased $77 million primarily due to a 26% increase in average price per gallon for locomotive fuel. (See Fuel Statistics table below)
Depreciation expense decreased $21 million. While a larger asset base increased depreciation, there were two items that more than offset this increase. There was a favorable impact related to an extra week of depreciation last year that was not repeated this year, as well as a favorable, multi-year adjustment related to retirements.
|
| | | | | | | | | | | | | | | | | | | | |
| FUEL STATISTICS |
| | | | | |
| | | Quarters Ended | | Years Ended |
| | | Dec. 30, 2011 | Dec. 31, 2010 | Change | | Dec. 30, 2011 | Dec. 31, 2010 | Change |
Estimated Locomotive Fuel Consumption (Millions of gallons) | | 128.0 |
| 131.7 |
| 3.7 |
| | 500.7 |
| 489.6 |
| (11.1 | ) |
Price per Gallon (Dollars) | | $ | 3.05 |
| $ | 2.42 |
| $ | (0.63 | ) | | $ | 3.06 |
| $ | 2.26 |
| $ | (0.80 | ) |
Total Locomotive Fuel Expense (Dollars in millions) | | $ | 390 |
| $ | 319 |
| $ | (71 | ) | | $ | 1,533 |
| $ | 1,106 |
| $ | (427 | ) |
Total Non-Locomotive Fuel Expense (Dollars in millions) | | 33 |
| 27 |
| (6 | ) | | 135 |
| 106 |
| (29 | ) |
Total Fuel Expense (Dollars in millions) | | $ | 423 |
| $ | 346 |
| $ | (77 | ) | | $ | 1,668 |
| $ | 1,212 |
| $ | (456 | ) |
|
| | | | | | | | |
EMPLOYEE COUNTS (Estimated) |
| | | | | | |
| | 2011 | | 2010 | | Change |
| October | 31,900 |
| | 30,280 |
| | 1,620 |
|
| November | 32,283 |
| | 30,280 |
| | 2,003 |
|
| December | 32,235 |
| | 30,132 |
| | 2,103 |
|
| | | | | | |
| Average | 32,139 |
| | 30,231 |
| | 1,908 |
|
OPERATING STATISTICS (Estimated)(a)
|
| | | | | | | | | | | | | | |
| | | Quarters Ended | | Years Ended |
| | | Dec. 30, 2011 | Dec. 31, 2010 | Improvement (Decline) % | | Dec. 30, 2011 | Dec. 31, 2010 | Improvement (Decline) % |
Coal (Millions of Tons) | | | | | | | | |
| Domestic | | | | | | | | |
| Utility | | 25.4 |
| 31.1 |
| (18 | )% | | 108.8 |
| 121.6 |
| (11 | )% |
| Other | | 3.9 |
| 4.0 |
| (3 | ) | | 14.1 |
| 14.7 |
| (4 | ) |
| Total Domestic | | 29.3 |
| 35.1 |
| (17 | ) | | 122.9 |
| 136.3 |
| (10 | ) |
| Export | | 10.4 |
| 8.2 |
| 27 |
| | 40.2 |
| 30.1 |
| 34 |
|
| Coke and Iron Ore | | 2.1 |
| 2.0 |
| 5 |
| | 8.0 |
| 8.0 |
| — |
|
| Total Coal | | 41.8 |
| 45.3 |
| (8 | )% | | 171.1 |
| 174.4 |
| (2 | )% |
| | | | | | | | | |
Revenue Ton-Miles (Billions) | | | | | | | | |
| Merchandise | | 32.7 |
| 34.0 |
| (4 | )% | | 130.3 |
| 129.3 |
| 1 | % |
| Coal | | 18.5 |
| 20.2 |
| (8 | ) | | 76.4 |
| 79.5 |
| (4 | ) |
| Intermodal | | 5.5 |
| 5.6 |
| (2 | ) | | 21.8 |
| 20.4 |
| 7 |
|
| Total | | 56.7 |
| 59.8 |
| (5 | )% | | 228.5 |
| 229.2 |
| — | % |
| | | | | | | | | |
Gross Ton-Miles (Billions) | | | | | | | | |
| Total Gross Ton-Miles | | 104.7 |
| 110.2 |
| (5 | )% | | 419.8 |
| 417.9 |
| — | % |
| (Excludes locomotive gross ton-miles) | | | | | | | | |
| | | | | | | | | |
| Safety and Service Measurements | | | | | | | | |
| FRA Personal Injury Frequency Index | | 0.93 |
| 1.03 |
| 10 | % | | 0.91 |
| 1.01 |
| 10 | % |
| (Number of FRA-reportable train accidents per million train miles) | | | | | | | | |
| FRA Train Accident Rate | | 2.40 |
| 2.27 |
| (6 | )% | | 2.32 |
| 2.69 |
| 14 | % |
| (Number of FRA-reportable train accidents per million train miles) | | | | | | | | |
| | | | | | | | | |
| On-Time Train Originations | | 82 | % | 75 | % | 9 | % | | 72 | % | 75 | % | (4 | )% |
| On-Time Destination Arrivals | | 72 | % | 70 | % | 3 | % | | 62 | % | 69 | % | (10 | )% |
| | | | | | | | | |
Dwell (Hours) | | 25.4 |
| 25.5 |
| — | % | | 25.9 |
| 25.0 |
| (4 | )% |
| Cars-On-Line | | 200,243 |
| 208,944 |
| 4 | % | | 206,432 |
| 210,984 |
| 2 | % |
| | | | | | | | | |
Train Velocity (Miles per hour) | | 21.7 |
| 21.3 |
| 2 | % | | 20.6 |
| 21.0 |
| (2 | )% |
| | | | | | | | | |
| Resources | | | | Increase (Decrease) % | | | | |
| Route Miles | | 20,998 |
| 21,084 |
| — | % | | | | |
Locomotives (Owned and long-term leased) | | 4,116 |
| 4,072 |
| 1 | % | | | | |
Freight Cars (Owned and long-term leased) | | 68,372 |
| 70,318 |
| (3 | )% | | | | |
(a) CSX follows a 52/53 week fiscal reporting calendar. The fourth quarter of 2010 included an extra week, making the fourth quarter 14 weeks and the year 53 weeks.