CSX Corporation Announces First-Quarter Earnings
and Dividend Increase
Highlights:
| |
| • | First-quarter earnings per share of $0.40 |
| |
| • | CSX continues to expect modest full-year earnings growth |
| |
| • | Merchandise and intermodal show continued strength, and the utility coal environment is improving |
| |
| • | Quarterly dividend increases 7 percent beginning in second quarter to $0.16 per share |
JACKSONVILLE, Fla. - April 15, 2014 - CSX Corporation (NYSE: CSX) today announced first-quarter net earnings of $398 million, or $0.40 per share, down from $462 million, or $0.45 per share in the same quarter of 2013.
For the quarter, revenue grew 2 percent to $3.0 billion on volume increases of 3 percent, with strength in intermodal and merchandise markets more than offsetting declines in coal. However, operating income declined 16 percent to $739 million and the operating ratio increased 520 basis points to 75.5 percent, primarily due to the impact of harsh weather. CSX estimates that weather-related disruptions increased expenses by approximately six cents per share, and impacted revenue contribution by about two to three cents.
“The company is indebted to the dedicated men and women of CSX who worked tirelessly through one of the worst winters on record to keep the network running as fluidly as possible,” said Michael J. Ward, chairman, president and chief executive officer. “Thanks to the hard work of our employees, service levels are gradually recovering, and we are capitalizing on an economy that continues to show positive momentum.”
Looking forward, CSX expects modest full-year earnings growth for 2014 on the strength of broad-based merchandise and intermodal gains and an improving domestic coal environment. In addition, the company remains confident in its ability to sustain double-digit earnings growth and margin expansion for its shareholders in 2015 and beyond. The company expects to sustain a mid-60s operating ratio longer-term.
CSX also announced that its Board of Directors approved a 7 percent increase in the company’s quarterly dividend to $0.16 per share, payable on June 13, 2014 to shareholders of record at the close of business on May 28, 2014. This announcement builds on 11 increases over the past 8 years, representing a 20 percent compound annual growth rate during that time. It is consistent with CSX’s view of the strength of the business and the company’s approach to deploying cash within a balanced framework to support long-term value creation through investment, dividends, and share buybacks.
|
| | | |
| Table of Contents | The accompanying unaudited | CSX CORPORATION | CONTACTS: |
| | financial information should be | 500 Water Street, C900 | |
| read in conjunction with the | Jacksonville, FL 32202 | INVESTOR RELATIONS |
| Company’s most recent | www.csx.com | David Baggs |
| Annual Report on Form 10-K, | | (904) 359-4812 |
| | Quarterly Reports on Form | | MEDIA |
| | 10-Q, and any Current | | Melanie Cost |
| | Reports on Form 8-K. | | (904) 359-1702 |
CSX executives will conduct a quarterly earnings conference call with the investment community on April 16, 2014, at 8:30 a.m. Eastern time. Investors, media and the public may listen to the conference call by dialing 1-888-EARN-CSX (888-327-6279) and asking for the CSX earnings call. Callers outside the U.S., dial 1-773-756-0199. Participants should dial in 10 minutes prior to the call. In conjunction with the call, a live webcast will be accessible and presentation materials will be posted on the company's website at http://investors.csx.com. Following the earnings call, an internet replay of the presentation will be archived on the company website.
This earnings announcement, as well as additional detailed financial information, is contained in the CSX Quarterly Financial Report available on the company’s website at http://investors.csx.com and on Form 8-K with the Securities and Exchange Commission.
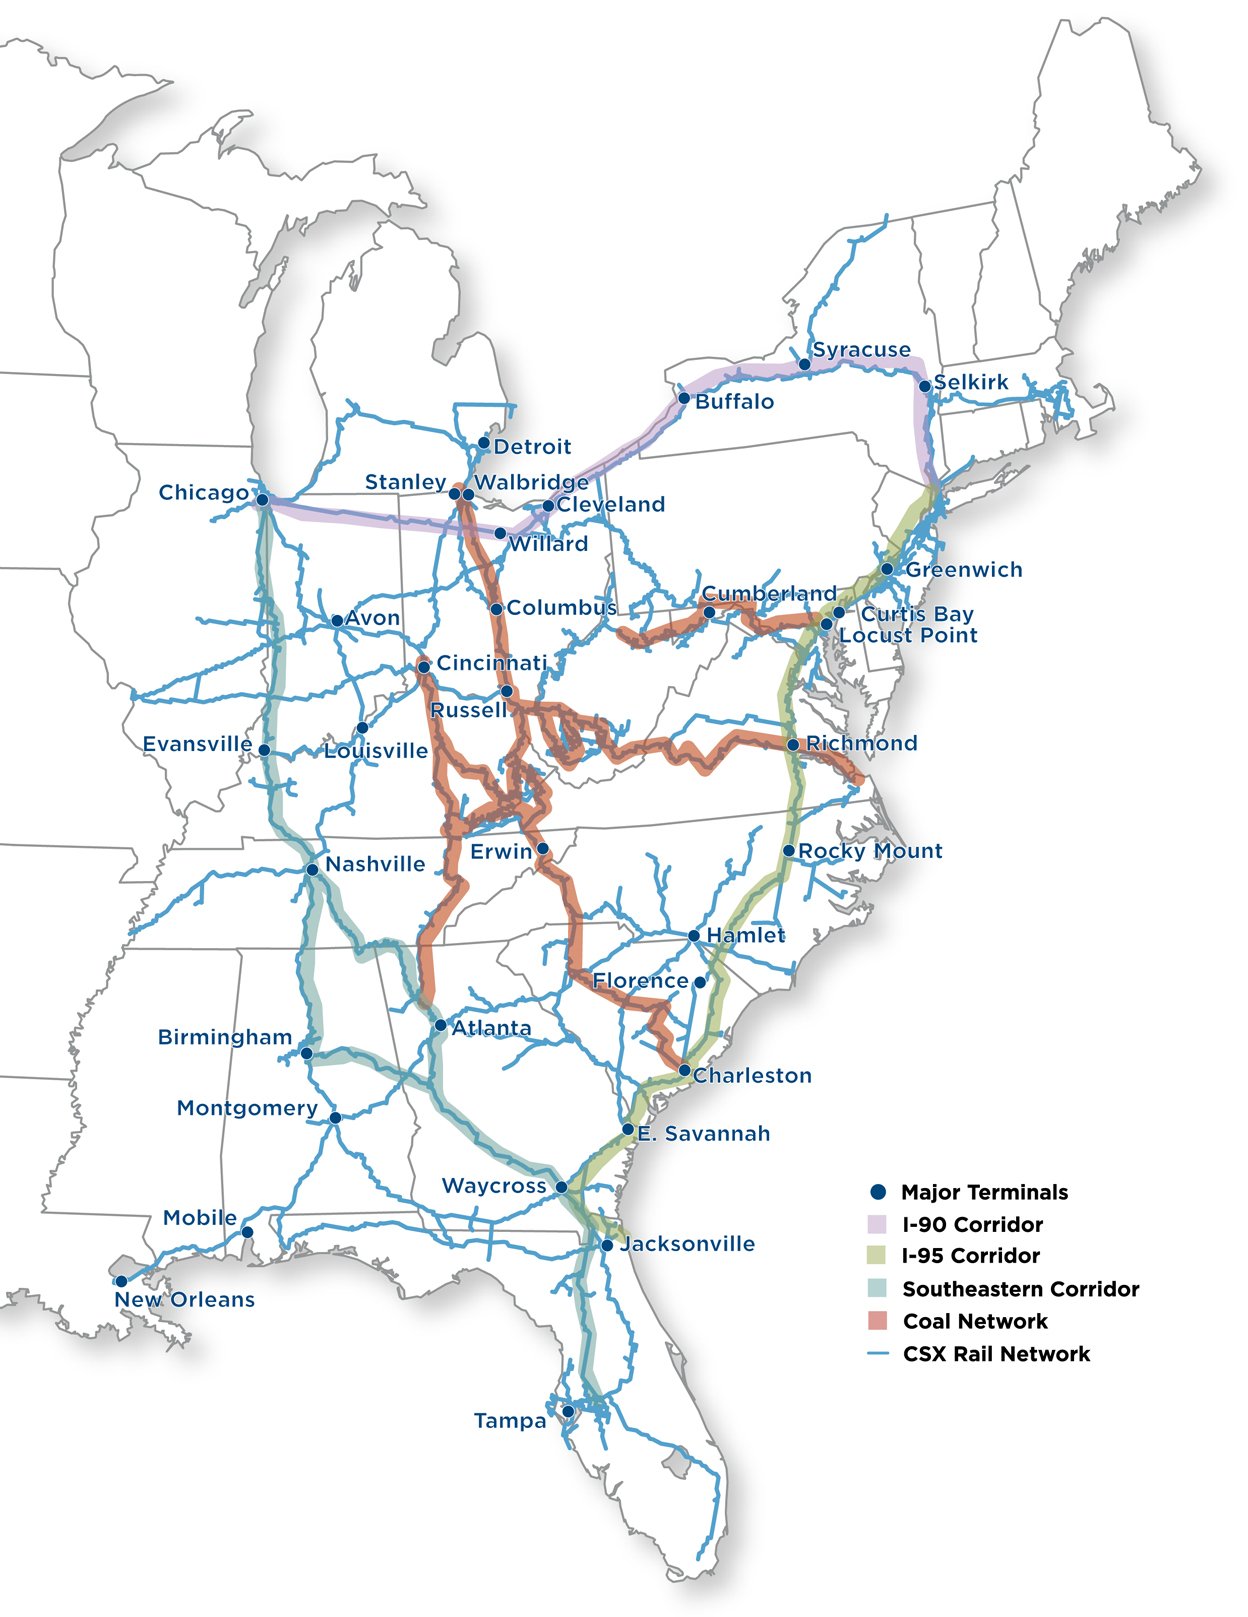
CSX, based in Jacksonville, Florida, is a premier transportation company. It provides rail, intermodal and rail-to-truck transload services and solutions to customers across a broad array of markets, including energy, industrial, construction, agricultural, and consumer products. For more than 185 years, CSX has played a critical role in the nation’s economic expansion and industrial development. Its network connects every major metropolitan area in the eastern United States, where nearly two-thirds of the nation’s population resides. It also links more than 240 short-line railroads and more than 70 ocean, river and lake ports with major population centers and small farming towns alike. More information about CSX Corporation and its subsidiaries is available at www.csx.com. Like us on Facebook (http://www.facebook.com/OfficialCSX) and follow us on Twitter (http://twitter.com/CSX).
Forward-looking Statements
This information and other statements by the company may contain forward-looking statements within the meaning of the Private Securities Litigation Reform Act with respect to, among other items: projections and estimates of earnings, revenues, margins, volumes, rates, cost-savings, expenses, taxes, liquidity, capital expenditures, dividends, share repurchases or other financial items, statements of management's plans, strategies and objectives for future operations, and management's expectations as to future performance and operations and the time by which objectives will be achieved, statements concerning proposed new services, and statements regarding future economic, industry or market conditions or performance. Forward-looking statements are typically identified by words or phrases such as “will,” “should,” “believe,” “expect,” “anticipate,” “project,” “estimate,” “preliminary” and similar expressions. Forward-looking statements speak only as of the date they are made, and the company undertakes no obligation to update or revise any forward-looking statement. If the company updates any forward-looking statement, no inference should be drawn that the company will make additional updates with respect to that statement or any other forward-looking statements.
Forward-looking statements are subject to a number of risks and uncertainties, and actual performance or results could differ materially from that anticipated by any forward-looking statements. Factors that may cause actual results to differ materially from those contemplated by any forward- looking statements include, among others; (i) the company's success in implementing its financial and operational initiatives; (ii) changes in domestic or international economic, political or business conditions, including those affecting the transportation industry (such as the impact of industry competition, conditions, performance and consolidation); (iii) legislative or regulatory changes; (iv) the inherent business risks associated with safety and security; (v) the outcome of claims and litigation involving or affecting the company; (vi) natural events such as severe weather conditions or pandemic health crises; and (vii) the inherent uncertainty associated with projecting economic and business conditions.
Other important assumptions and factors that could cause actual results to differ materially from those in the forward-looking statements are specified in the company's SEC reports, accessible on the SEC's website at www.sec.gov and the company's website at www.csx.com.
CONSOLIDATED INCOME STATEMENTS (Unaudited)
(Dollars in millions, except per share amounts)
|
| | | | | | | | | | | |
| | Quarters Ended |
| | Mar. 28, 2014 | Mar. 29, 2013 | $ Change | % Change |
| Revenue | $ | 3,012 |
| $ | 2,963 |
| $ | 49 |
| 2 | % |
| Expense | | | | |
| Labor and Fringe | 814 |
| 767 |
| (47 | ) | (6 | ) |
| Materials, Supplies and Other | 629 |
| 507 |
| (122 | ) | (24 | ) |
| Fuel | 446 |
| 444 |
| (2 | ) | — |
|
| Depreciation | 283 |
| 270 |
| (13 | ) | (5 | ) |
| Equipment and Other Rents | 101 |
| 95 |
| (6 | ) | (6 | ) |
| Total Expense | 2,273 |
| 2,083 |
| (190 | ) | (9 | ) |
| | | | | |
| Operating Income | 739 |
| 880 |
| (141 | ) | (16 | ) |
| | | | | |
| Interest Expense | (140 | ) | (147 | ) | 7 |
| 5 |
|
| Other Income - Net | 7 |
| (3 | ) | 10 |
| 333 |
|
| Earnings Before Income Taxes | 606 |
| 730 |
| (124 | ) | (17 | ) |
| | | | | |
Income Tax Expense (a) | (208 | ) | (268 | ) | 60 |
| 22 |
|
| Net Earnings | $ | 398 |
| $ | 462 |
| $ | (64 | ) | (14 | )% |
| | | | | |
| Operating Ratio | 75.5 | % | 70.3 | % | | |
| | | | | |
| Per Common Share | | | | |
| Net Earnings Per Share, Assuming Dilution | $ | 0.40 |
| $ | 0.45 |
| $ | (0.05 | ) | (11 | )% |
| | | | | |
Average Shares Outstanding, Assuming Dilution (millions) | 1,008 |
| 1,023 |
| | |
| | | | | |
| Cash Dividends Paid Per Common Share | $ | 0.15 |
| $ | 0.14 |
| | |
| | | | | |
| | | | | |
CONDENSED CONSOLIDATED BALANCE SHEETS
(Dollars in millions)
|
| | | | | | |
| | (Unaudited) | |
| | Mar. 28, 2014 | Dec. 27, 2013 |
| | | |
| ASSETS |
| | | |
| Cash and Cash Equivalents | $ | 475 |
| $ | 592 |
|
| Short-term Investments | 248 |
| 487 |
|
| Other Current Assets | 1,566 |
| 1,523 |
|
| Properties - Net | 27,494 |
| 27,291 |
|
| Investment in Affiliates and Other Companies | 1,314 |
| 1,298 |
|
| Other Long-term Assets | 583 |
| 591 |
|
| Total Assets | $ | 31,680 |
| $ | 31,782 |
|
| | | |
| | | |
| LIABILITIES AND SHAREHOLDERS' EQUITY |
| | | |
| Current Maturities of Long-term Debt | $ | 325 |
| $ | 533 |
|
| Other Current Liabilities | 1,887 |
| 1,891 |
|
| Long-term Debt | 9,021 |
| 9,022 |
|
| Deferred Income Taxes | 8,658 |
| 8,662 |
|
| Other Long-term Liabilities | 1,144 |
| 1,170 |
|
| Total Liabilities | 21,035 |
| 21,278 |
|
| | | |
| Total Shareholders' Equity | 10,645 |
| 10,504 |
|
| Total Liabilities and Shareholders' Equity | $ | 31,680 |
| $ | 31,782 |
|
CONDENSED CONSOLIDATED CASH FLOW STATEMENTS (Unaudited)
(Dollars in millions)
|
| | | | | | |
| | Quarters Ended |
| | Mar. 28, 2014 | Mar. 29, 2013 |
| OPERATING ACTIVITIES | | |
| Net Earnings | $ | 398 |
| $ | 462 |
|
| Depreciation | 283 |
| 270 |
|
| Deferred Income Taxes | (1 | ) | 82 |
|
| Gains on Property Dispositions | (1 | ) | (30 | ) |
| Other Operating Activities - Net | (80 | ) | (53 | ) |
| Net Cash Provided by Operating Activities | 599 |
| 731 |
|
| | | |
| INVESTING ACTIVITIES | | |
| Property Additions | (475 | ) | (491 | ) |
| Purchase of Short-term Investments | (165 | ) | (290 | ) |
| Proceeds from Sales of Short-term Investments | 409 |
| 534 |
|
| Other Investing Activities | 4 |
| (18 | ) |
| Net Cash Used in Investing Activities | (227 | ) | (265 | ) |
| | | |
| FINANCING ACTIVITIES | | |
| Long-term Debt Repaid | (209 | ) | (413 | ) |
| Dividends Paid | (151 | ) | (143 | ) |
Shares Repurchased (b) | (127 | ) | — |
|
| Other Financing Activities - Net | (2 | ) | 11 |
|
| Net Cash Used in Financing Activities | (489 | ) | (545 | ) |
| | | |
| Net Decrease in Cash and Cash Equivalents | (117 | ) | (79 | ) |
| | | |
| CASH AND CASH EQUIVALENTS | | |
| Cash and Cash Equivalents at Beginning of Period | 592 |
| 784 |
|
| Cash and Cash Equivalents at End of Period | $ | 475 |
| $ | 705 |
|
NOTES TO CONSOLIDATED FINANCIAL STATEMENTS (Unaudited)
Income Statement
| |
| a) | Income Tax Expense: During the first quarter of 2014, the Company recorded an income tax benefit of $21 million, or $0.02 per share, primarily as a result of Indiana legislation which reduced the future corporate income tax rate. |
Cash Flow Statement
| |
| b) | Share Repurchases: There were 5 million shares repurchased for $127 million during the first quarter of 2014 while no shares were repurchased during the first quarter of 2013. |
|
| | | | | | | | | | | | | | | | | | | | | | | | | | | |
VOLUME AND REVENUE (Unaudited) |
| Volume (Thousands of units); Revenue (Dollars in millions); Revenue Per Unit (Dollars) |
| | |
Quarters Ended March 28, 2014 and March 29, 2013(a) |
| | | | | | | | | |
| | Volume | | | Revenue | | | Revenue Per Unit | |
| | 2014 | 2013 | % Change | | 2014 | 2013 | % Change | | 2014 | 2013 | % Change |
| Agricultural | | | | | | | | | | | | | | |
| Agricultural Products | 106 |
| 95 |
| 12 | % | | | $ | 284 |
| $ | 241 |
| 18 | % | | | $ | 2,679 |
| $ | 2,537 |
| 6 | % | |
| Phosphates and Fertilizers | 83 |
| 84 |
| (1 | ) | | | 134 |
| 144 |
| (7 | ) | | | 1,614 |
| 1,714 |
| (6 | ) | |
| Food and Consumer | 23 |
| 24 |
| (4 | ) | | | 65 |
| 68 |
| (4 | ) | | | 2,826 |
| 2,833 |
| — |
| |
| Industrial | | | | | | | | | | | | | | |
| Chemicals | 146 |
| 130 |
| 12 |
| | | 516 |
| 468 |
| 10 |
| | | 3,534 |
| 3,600 |
| (2 | ) | |
| Automotive | 98 |
| 105 |
| (7 | ) | | | 275 |
| 293 |
| (6 | ) | | | 2,806 |
| 2,790 |
| 1 |
| |
| Metals | 65 |
| 66 |
| (2 | ) | | | 165 |
| 161 |
| 2 |
| | | 2,538 |
| 2,439 |
| 4 |
| |
| Housing and Construction | | | | | | | | | | | | | | |
| Forest Products | 74 |
| 73 |
| 1 |
| | | 194 |
| 189 |
| 3 |
| | | 2,622 |
| 2,589 |
| 1 |
| |
| Minerals | 54 |
| 57 |
| (5 | ) | | | 95 |
| 96 |
| (1 | ) | | | 1,759 |
| 1,684 |
| 4 |
| |
| Waste and Equipment | 31 |
| 32 |
| (3 | ) | | | 59 |
| 57 |
| 4 |
| | | 1,903 |
| 1,781 |
| 7 |
| |
| Total Merchandise | 680 |
| 666 |
| 2 |
| | | 1,787 |
| 1,717 |
| 4 |
| | | 2,628 |
| 2,578 |
| 2 |
| |
| | | | | | | | | | | | | | | |
| Coal | 293 |
| 297 |
| (1 | ) | | | 662 |
| 726 |
| (9 | ) | | | 2,259 |
| 2,444 |
| (8 | ) | |
| | | | | | | | | | | | | | | |
| Intermodal | 647 |
| 615 |
| 5 |
| | | 421 |
| 404 |
| 4 |
| | | 651 |
| 657 |
| (1 | ) | |
| | | | | | | | | | | | | | | |
| Other | — |
| — |
| — |
| | | 142 |
| 116 |
| 22 |
| | | — |
| — |
| — |
| |
| | | |
|
| | | | | | | | | | | |
| Total | 1,620 |
| 1,578 |
| 3 | % | | | $ | 3,012 |
| $ | 2,963 |
| 2 | % | | | $ | 1,859 |
| $ | 1,878 |
| (1 | )% | |
(a) Previously reported 2013 other revenue, total revenue and total revenue per unit have been revised as disclosed in CSX's most recent annual report on Form 10-K.
Volume and Revenue
Volume increased 3% year over year as growth in merchandise and intermodal more than offset lower coal volume. Total revenue increased by 2% year over year driven by this volume growth and pricing gains across most markets. Challenging operating conditions resulting from severe winter weather negatively impacted volume in most markets.
Merchandise
Agricultural Sector
Agricultural Products - Volume growth was driven by increased shipments of grain and ethanol. Grain shipments increased due to a strong corn and soybean crop when compared to the prior year crop, which was negatively impacted by a drought in the Midwest. Ethanol shipments increased due to lower corn prices which incented producers to increase both production and exports.
Phosphates and Fertilizers - Volume declined as winter weather impacted shipments of fertilizer into the Midwest. This decline was partially offset by an increase in phosphate rock shipments as capacity at a key customer location returned to normal levels.
Food and Consumer - Volume declined due to lower shipments of refrigerated products, rice and beans. The decline in refrigerated products was driven by the severe weather impacting the Chicago interchange. Rice shipments were lower as customers used lower priced corn as a substitute, while bean shipments declined due to a smaller harvest and higher prices for U.S. beans on the world market.
Industrial Sector
Chemicals - Volume growth was driven by an increase in energy-related shipments that included crude oil and liquefied petroleum gas (LPG). The rise in crude oil shipments to east coast refineries was due to increased supply of low cost crude from shale drilling activity.
Automotive - North American light vehicle production increased in the quarter, but rail shipments declined due to network disruptions caused by the severe winter weather.
Metals - Volume declined due to the severe weather and lower semi-finished steel products driven by a temporary shutdown of a customer’s facility. These declines were partially offset by growth in steel plate shipments that support energy-related markets.
Housing and Construction Sector
Forest Products - Volume growth was led by an increase in building products and pulp board shipments used to produce packaging materials. Building products increased due to the continued recovery of the residential housing market. Pulp board shipments grew due to inventory replenishments that resulted from reduced production late last year.
Minerals - Volume declined in aggregates (which include crushed stone, sand and gravel) due to impacts of the severe weather. This decline was partially offset by growth in salt shipments due to increased application of road salt.
Waste and Equipment - Waste volume declined year-over-year as the severe weather disruptions impacted municipal and construction waste shipments. This decline was partially offset by increased movements of private railcars from storage locations due to car supply issues resulting from the severe weather.
Coal
Coal volume slightly declined due to a decrease in shipments of export coal as a result of softening global market conditions. This decline was partially offset by an increase in domestic coal which was driven by competitive gains in the utility market and stronger northern utility demand as a result of the severe weather.
Intermodal
Domestic volume growth was driven by continued success with highway-to-rail conversions and strong demand for intermodal service offerings. International volume increased due to growth with our customers in global container shipments moving to inland destinations.
Other
Other revenue increased primarily due to higher revenue from customers who did not meet minimum contractual volumes.
EXPENSE
Expenses in the first quarter 2014 increased $190 million from the prior year's first quarter. Significant variances are described below.
Labor and Fringe expense increased $47 million due to the following:
| |
• | Labor costs increased $35 million due to weather disruptions that resulted in increased overtime by operating employees. |
| |
| • | Inflation increased expenses $14 million. |
| |
| • | Other expenses decreased $2 million as lower other expenses more than offset the increase in volume-related costs. |
Materials, Supplies and Other expense increased $122 million due to the following:
| |
• | In the prior year, the Company recognized gains of $49 million related to the recognition of a deferred gain from a 2011 sale of an operating rail corridor as well as a closure agreement reached on a prior conveyance of a formerly-owned company. No gains were recognized in the current year. |
| |
| • | Utilities, materials and foreign locomotive costs were $35 million higher in response to weather disruptions. |
| |
| • | Inflation and other costs increased expenses $26 million. |
| |
| • | Train accident costs were $12 million higher due to derailments which is reflected in the increase in the FRA train accident frequency rate. |
Fuel expense increased $2 million due to the combined impact of efficiency losses from weather disruptions and higher volume of $22 million. This was partially offset by a $20 million reduction from lower price. (See Fuel Statistics table below).
|
| | | | | | | | | | |
| FUEL STATISTICS |
| | | |
| | | Quarters Ended |
| (Dollars and Gallons In Millions, Except Price per Gallon) | | Mar. 28, 2014 | Mar. 29, 2013(a) | Change |
Estimated Locomotive Fuel Consumption (Gallons) | | 130.1 |
| 125.3 |
| (4.8 | ) |
Price per Gallon (Dollars) | | $ | 3.14 |
| $ | 3.30 |
| $ | 0.16 |
|
| Total Locomotive Fuel Expense | | $ | 408 |
| $ | 413 |
| $ | 5 |
|
| Other | | 38 |
| 31 |
| (7 | ) |
| Total Fuel Expense | | $ | 446 |
| $ | 444 |
| $ | (2 | ) |
(a) Prior periods price per gallon, total locomotive fuel expense and other have been reclassified to conform to current presentation.
|
| | | | | | | | |
EMPLOYEE COUNTS (Estimated) |
| | | | | | |
| | 2014 | | 2013 | | Change |
| January | 31,410 |
| | 31,043 |
| | 367 |
|
| February | 31,076 |
| | 31,058 |
| | 18 |
|
| March | 31,040 |
| | 30,928 |
| | 112 |
|
| | | | | | |
| Average | 31,175 |
| | 31,010 |
| | 165 |
|
OPERATING STATISTICS (Estimated)
|
| | | | | | | |
| | | Quarters Ended |
| | | Mar. 28, 2014 | Mar. 29, 2013 | % Variance |
Coal (Millions of Tons) | | | | |
| Domestic | | | | |
| Utility | | 17.7 |
| 16.2 |
| 9 | % |
| Coke, Iron Ore and Other | | 4.8 |
| 4.7 |
| 2 |
|
| Total Domestic | | 22.5 |
| 20.9 |
| 8 |
|
| Export | | | |
|
| Metallurgical | | 6.2 |
| 7.0 |
| (11 | ) |
| Thermal | | 4.3 |
| 5.3 |
| (19 | ) |
| Total Export | | 10.5 |
| 12.3 |
| (15 | ) |
| | | | | |
| Total Coal | | 33.0 |
| 33.2 |
| (1 | )% |
| | | | | |
Revenue Ton-Miles (Billions) | | | | |
| Merchandise | | 35.2 |
| 33.3 |
| 6 | % |
| Coal | | 16.0 |
| 16.3 |
| (2 | ) |
| Intermodal | | 6.3 |
| 5.9 |
| 7 |
|
| Total | | 57.5 |
| 55.5 |
| 4 | % |
| | | | | |
Gross Ton-Miles (Billions) | | | | |
| Total Gross Ton-Miles | | 104.0 |
| 102.2 |
| 2 | % |
| (Excludes locomotive gross ton-miles) | | | | |
| | | | | |
| Safety and Service Measurements | | | | |
| FRA Personal Injury Frequency Index | | 0.96 |
| 0.76 |
| (26 | )% |
| (Number of FRA-reportable injuries per 200,000 man-hours) | | | | |
| | | | | |
| FRA Train Accident Rate | | 2.35 |
| 1.81 |
| (30 | )% |
| (Number of FRA-reportable train accidents per million train miles) | | | | |
| | | | | |
| On-Time Train Originations | | 63 | % | 91 | % | (31 | )% |
| On-Time Destination Arrivals | | 51 | % | 85 | % | (40 | )% |
| | | | | |
Train Velocity (Miles per hour) | | 20.6 |
| 23.4 |
| (12 | )% |
Dwell (Hours) | | 26.8 |
| 22.2 |
| (21 | )% |
| | | | | |
Cars-On-Line (a) | | 202,319 |
| 183,223 |
| (10 | )% |
| | | | |
|
| Resources | | | | |
| Route Miles | | 20,772 |
| 20,839 |
| — | % |
Locomotives (Owned and long-term leased) | | 4,261 |
| 4,192 |
| 2 | % |
Freight Cars (Owned and long-term leased) | | 67,707 |
| 69,057 |
| (2 | )% |
Containers (Owned and long-term leased) | | 17,512 |
| 18,136 |
| (3 | )% |
(a) Cars-on-line increased approximately 14,000 or 7.5% in 2014 due to a calculation error correction made by the American Association of Railroads in February 2014. This error impacted the industry cars-on-line since 2011. Previously reported amounts have not been adjusted to reflect this correction.