CSX Corporation Announces Record Second-Quarter Results, Reaffirms Guidance and Increases Capital Investments
Highlights:
| |
| • | Leveraged strong growth environment to produce all-time quarterly records for revenue, operating income, and earnings per share |
| |
| • | Full-year modest earnings growth still expected for 2014, with double-digit earnings growth and margin expansion expected to resume in 2015 |
| |
| • | Increasing 2014 investment by approximately $100 million to $2.4 billion to support sustainable growth |
JACKSONVILLE, Fla. - July 15, 2014 - CSX Corporation (NYSE: CSX) today announced second-quarter net earnings of $529 million, or $0.53 per share, up from $521 million, or $0.51 per share in the same quarter of 2013.
For the quarter, revenue increased 7 percent to an all-time record $3.2 billion on volume growth of 8 percent, with strength across CSX’s major markets. The higher revenues helped deliver record operating income of nearly $1 billion and an operating ratio of 69.3 percent.
“To propel service and capture growth opportunities, CSX is adding front-line personnel and making targeted investments in infrastructure and freight cars to efficiently grow our business and create competitive advantages for our customers,” said Michael J. Ward, chairman, president and chief executive officer. “With the broad-based economic momentum we are seeing, the core earning strength of this company is improving and driving value for shareholders.”
In addition to the positive economic environment, secular growth trends in the intermodal and oil and gas markets are contributing to CSX’s expectation for modest full-year earnings growth in 2014. As it capitalizes on these growth opportunities and continues to invest in its service product, the company remains confident in its ability to sustain double-digit earnings growth and margin expansion for its shareholders beginning in 2015. The company also expects to sustain a mid-60s operating ratio longer-term.
These expectations are the foundation for the increase in this year’s capital investment of approximately $100 million. The increase further enhances key infrastructure and adds freight cars to help drive long-term growth.
|
| | | |
| Table of Contents | The accompanying unaudited | CSX CORPORATION | CONTACTS: |
| | financial information should be | 500 Water Street, C900 | |
| read in conjunction with the | Jacksonville, FL 32202 | INVESTOR RELATIONS |
| Company’s most recent | www.csx.com | David Baggs |
| Annual Report on Form 10-K, | | (904) 359-4812 |
| | Quarterly Reports on Form | | MEDIA |
| | 10-Q, and any Current | | Melanie Cost |
| | Reports on Form 8-K. | | (904) 359-1702 |
CSX executives will conduct a quarterly earnings conference call with the investment community on July 16, 2014, at 8:30 a.m. Eastern time. Investors, media and the public may listen to the conference call by dialing 1-888-EARN-CSX (888-327-6279) and asking for the CSX earnings call. Callers outside the U.S., dial 1-773-756-0199. Participants should dial in 10 minutes prior to the call. In conjunction with the call, a live webcast will be accessible and presentation materials will be posted on the company's website at http://investors.csx.com. Following the earnings call, an internet replay of the presentation will be archived on the company website.
This earnings announcement, as well as additional detailed financial information, is contained in the CSX Quarterly Financial Report available on the company’s website at http://investors.csx.com and on Form 8-K with the Securities and Exchange Commission.
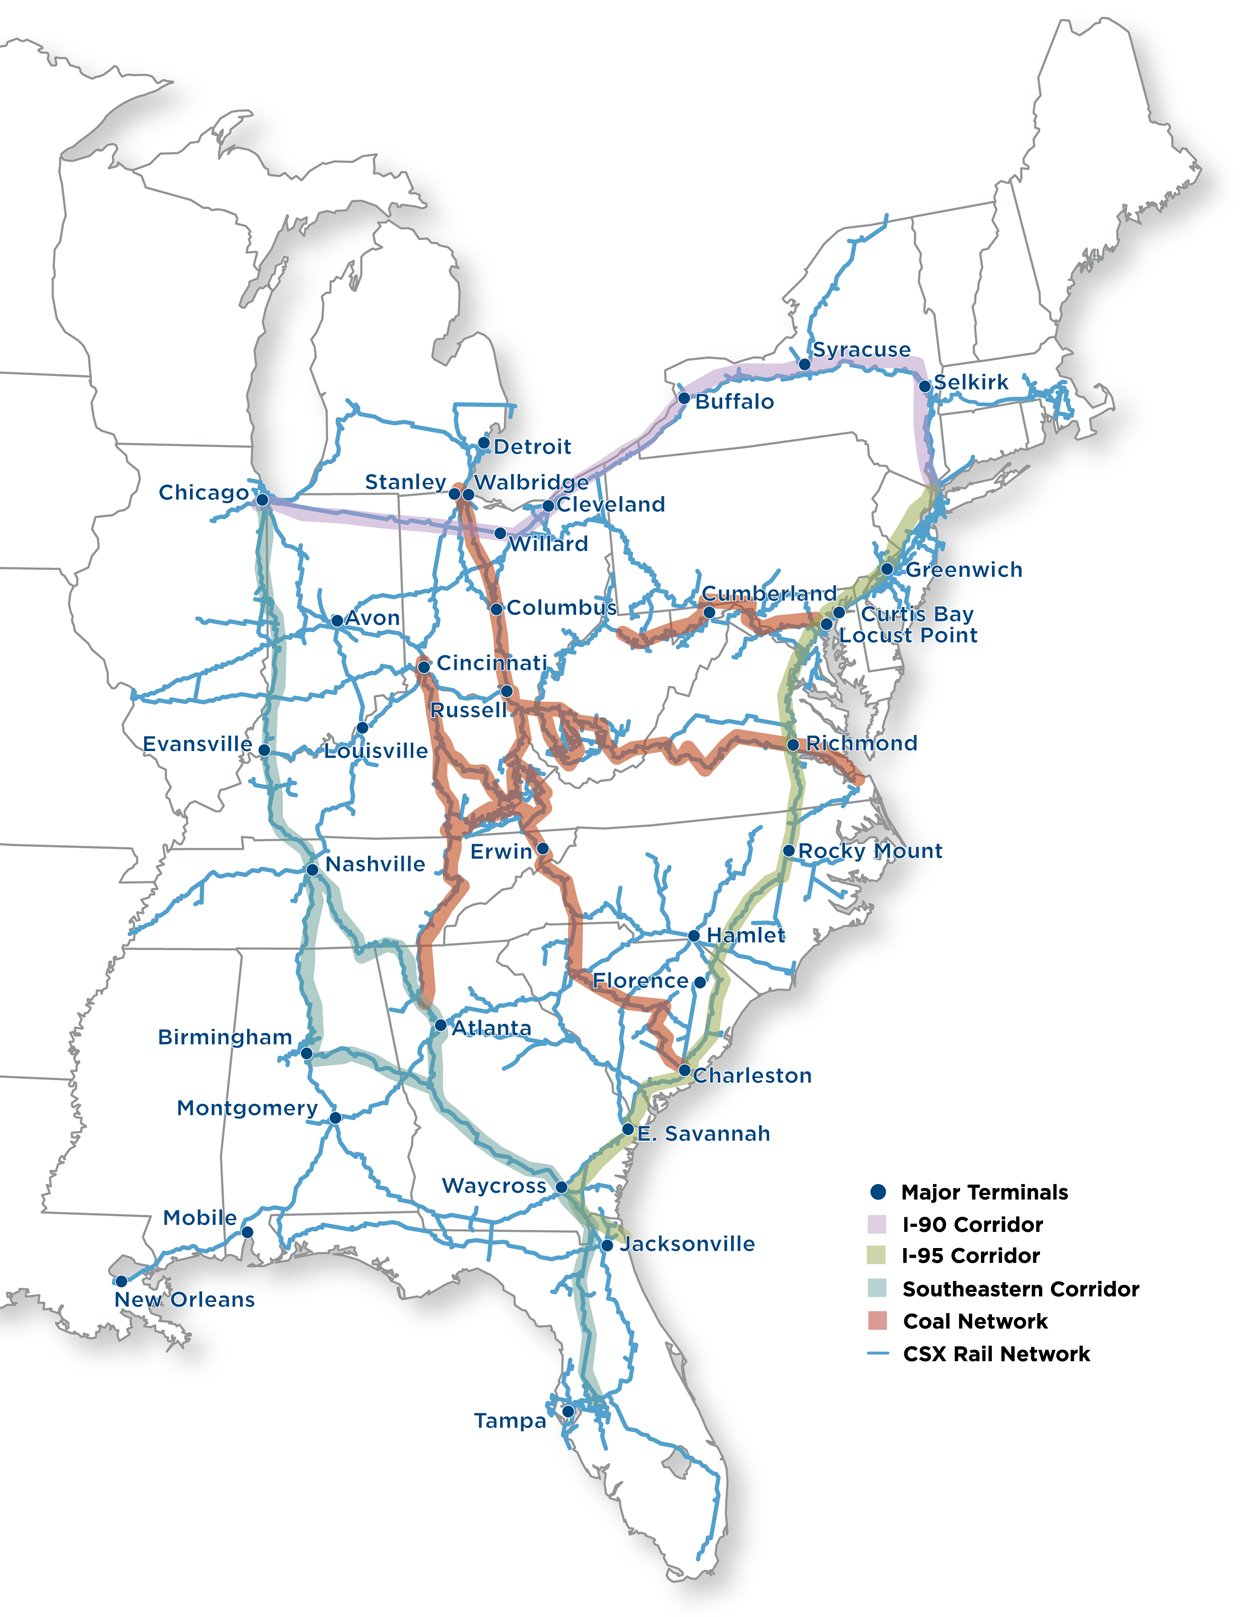
CSX, based in Jacksonville, Florida, is a premier transportation company. It provides rail, intermodal and rail-to-truck transload services and solutions to customers across a broad array of markets, including energy, industrial, construction, agricultural, and consumer products. For more than 185 years, CSX has played a critical role in the nation’s economic expansion and industrial development. Its network connects every major metropolitan area in the eastern United States, where nearly two-thirds of the nation’s population resides. It also links more than 240 short-line railroads and more than 70 ocean, river and lake ports with major population centers and small farming towns alike. More information about CSX Corporation and its subsidiaries is available at www.csx.com. Like us on Facebook (http://www.facebook.com/OfficialCSX) and follow us on Twitter (http://twitter.com/CSX).
Forward-looking Statements
This information and other statements by the company may contain forward-looking statements within the meaning of the Private Securities Litigation Reform Act with respect to, among other items: projections and estimates of earnings, revenues, margins, volumes, rates, cost-savings, expenses, taxes, liquidity, capital expenditures, dividends, share repurchases or other financial items, statements of management's plans, strategies and objectives for future operations, and management's expectations as to future performance and operations and the time by which objectives will be achieved, statements concerning proposed new services, and statements regarding future economic, industry or market conditions or performance. Forward-looking statements are typically identified by words or phrases such as “will,” “should,” “believe,” “expect,” “anticipate,” “project,” “estimate,” “preliminary” and similar expressions. Forward-looking statements speak only as of the date they are made, and the company undertakes no obligation to update or revise any forward-looking statement. If the company updates any forward-looking statement, no inference should be drawn that the company will make additional updates with respect to that statement or any other forward-looking statements.
Forward-looking statements are subject to a number of risks and uncertainties, and actual performance or results could differ materially from that anticipated by any forward-looking statements. Factors that may cause actual results to differ materially from those contemplated by any forward-looking statements include, among others; (i) the company's success in implementing its financial and operational initiatives; (ii) changes in domestic or international economic, political or business conditions, including those affecting the transportation industry (such as the impact of industry competition, conditions, performance and consolidation); (iii) legislative or regulatory changes; (iv) the inherent business risks associated with safety and security; (v) the outcome of claims and litigation involving or affecting the company; (vi) natural events such as severe weather conditions or pandemic health crises; and (vii) the inherent uncertainty associated with projecting economic and business conditions.
Other important assumptions and factors that could cause actual results to differ materially from those in the forward-looking statements are specified in the company's SEC reports, accessible on the SEC's website at www.sec.gov and the company's website at www.csx.com.
CONSOLIDATED INCOME STATEMENTS (Unaudited)
(Dollars in millions, except per share amounts)
|
| | | | | | | | | | | | | | | | | | | | | | | |
| | Quarters Ended | | Six Months Ended |
| | Jun. 27, 2014 | Jun. 28, 2013(a) | $ Change | % Change | | Jun. 27, 2014 | Jun. 28, 2013(a) | $ Change | % Change |
| | | | | | | | | | |
| Revenue | $ | 3,244 |
| $ | 3,046 |
| $ | 198 |
| 7 | % | | $ | 6,256 |
| $ | 6,009 |
| $ | 247 |
| 4 | % |
| Expense | | | | | | | | | |
| Labor and Fringe | 809 |
| 777 |
| (32 | ) | (4 | ) | | 1,623 |
| 1,544 |
| (79 | ) | (5 | ) |
| Materials, Supplies and Other | 621 |
| 560 |
| (61 | ) | (11 | ) | | 1,250 |
| 1,067 |
| (183 | ) | (17 | ) |
| Fuel | 416 |
| 397 |
| (19 | ) | (5 | ) | | 862 |
| 841 |
| (21 | ) | (2 | ) |
| Depreciation | 287 |
| 276 |
| (11 | ) | (4 | ) | | 570 |
| 546 |
| (24 | ) | (4 | ) |
| Equipment and Other Rents | 114 |
| 96 |
| (18 | ) | (19 | ) | | 215 |
| 191 |
| (24 | ) | (13 | ) |
| Total Expense | 2,247 |
| 2,106 |
| (141 | ) | (7 | ) | | 4,520 |
| 4,189 |
| (331 | ) | (8 | ) |
| | | | | | | | | | |
| Operating Income | 997 |
| 940 |
| 57 |
| 6 |
| | 1,736 |
| 1,820 |
| (84 | ) | (5 | ) |
| | | | | | | | | | |
| Interest Expense | (135 | ) | (140 | ) | 5 |
| 4 |
| | (275 | ) | (287 | ) | 12 |
| 4 |
|
Other (Expense) Income - Net (b) | (12 | ) | 9 |
| (21 | ) | (233 | ) | | (5 | ) | 6 |
| (11 | ) | (183 | ) |
| Earnings Before Income Taxes | 850 |
| 809 |
| 41 |
| 5 |
| | 1,456 |
| 1,539 |
| (83 | ) | (5 | ) |
| | | | | | | | | | |
Income Tax Expense (c) | (321 | ) | (288 | ) | (33 | ) | (11 | ) | | (529 | ) | (556 | ) | 27 |
| 5 |
|
| Net Earnings | $ | 529 |
| $ | 521 |
| $ | 8 |
| 2 | % | | $ | 927 |
| $ | 983 |
| $ | (56 | ) | (6 | )% |
| | | | | | | | | | |
| Operating Ratio | 69.3 | % | 69.1 | % | | | | 72.3 | % | 69.7 | % | | |
| | | | | | | | | | |
| Per Common Share | | | | | | | | | |
| Net Earnings Per Share, Assuming Dilution | $ | 0.53 |
| $ | 0.51 |
| $ | 0.02 |
| 4 | % | | $ | 0.92 |
| $ | 0.96 |
| $ | (0.04 | ) | (4 | )% |
| | | | | | | | | | |
Average Shares Outstanding, Assuming Dilution (millions) | 1,003 |
| 1,023 |
| | | | 1,006 |
| 1,023 |
| | |
| | | | | | | | | | |
| Cash Dividends Paid Per Common Share | $ | 0.16 |
| $ | 0.15 |
| | | | $ | 0.31 |
| $ | 0.29 |
| | |
| | | | | | | | | | |
| | | | | | | | | | |
CONDENSED CONSOLIDATED BALANCE SHEETS
(Dollars in millions)
|
| | | | | | |
| | (Unaudited) | |
| | Jun. 27, 2014 | Dec. 27, 2013 |
| ASSETS |
| | | |
| Cash and Cash Equivalents | $ | 573 |
| $ | 592 |
|
| Short-term Investments | 216 |
| 487 |
|
| Other Current Assets | 1,583 |
| 1,523 |
|
| Properties - Net | 27,685 |
| 27,291 |
|
| Investment in Affiliates and Other Companies | 1,331 |
| 1,298 |
|
| Other Long-term Assets | 587 |
| 591 |
|
| Total Assets | $ | 31,975 |
| $ | 31,782 |
|
| | | |
| | | |
| LIABILITIES AND SHAREHOLDERS' EQUITY |
| | | |
| Current Maturities of Long-term Debt | $ | 899 |
| $ | 533 |
|
| Other Current Liabilities | 1,898 |
| 1,891 |
|
| Long-term Debt | 8,410 |
| 9,022 |
|
| Deferred Income Taxes | 8,728 |
| 8,662 |
|
| Other Long-term Liabilities | 1,136 |
| 1,170 |
|
| Total Liabilities | 21,071 |
| 21,278 |
|
| | | |
| Total Shareholders' Equity | 10,904 |
| 10,504 |
|
| Total Liabilities and Shareholders' Equity | $ | 31,975 |
| $ | 31,782 |
|
CONDENSED CONSOLIDATED CASH FLOW STATEMENTS (Unaudited)
(Dollars in millions)
|
| | | | | | |
| | Six Months Ended |
| | Jun. 27, 2014 | Jun. 28, 2013(a) |
| OPERATING ACTIVITIES | | |
| Net Earnings | $ | 927 |
| $ | 983 |
|
| Depreciation | 570 |
| 546 |
|
| Deferred Income Taxes | 86 |
| 172 |
|
| Gains on Property Dispositions | (4 | ) | (67 | ) |
| Other Operating Activities - Net | (134 | ) | (55 | ) |
| Net Cash Provided by Operating Activities | 1,445 |
| 1,579 |
|
| | | |
| INVESTING ACTIVITIES | | |
| Property Additions | (956 | ) | (1,085 | ) |
| Purchase of Short-term Investments | (360 | ) | (690 | ) |
| Proceeds from Sales of Short-term Investments | 646 |
| 904 |
|
| Other Investing Activities | 20 |
| (50 | ) |
| Net Cash Used in Investing Activities | (650 | ) | (921 | ) |
| | | |
| FINANCING ACTIVITIES | | |
| Long-term Debt Repaid | (244 | ) | (455 | ) |
| Dividends Paid | (311 | ) | (296 | ) |
Shares Repurchased (d) | (257 | ) | (95 | ) |
| Other Financing Activities - Net | (2 | ) | 18 |
|
| Net Cash Used in Financing Activities | (814 | ) | (828 | ) |
| | | |
| Net Decrease in Cash and Cash Equivalents | (19 | ) | (170 | ) |
| | | |
| CASH AND CASH EQUIVALENTS | | |
| Cash and Cash Equivalents at Beginning of Period | 592 |
| 784 |
|
| Cash and Cash Equivalents at End of Period | $ | 573 |
| $ | 614 |
|
NOTES TO CONSOLIDATED FINANCIAL STATEMENTS (Unaudited)
| |
| a) | Prior period revision: Previously reported 2013 quarterly results have been revised as disclosed in CSX's most recent annual report on Form 10-K, resulting in decreases to prior year second quarter revenue of $23 million and earnings per share of $0.01. |
Income Statement
| |
| b) | Other (Expense) Income - Net: In the second quarter of 2014, miscellaneous expense included environmental cleanup costs related to non-operating activities. |
|
| | | | | | | | | | | | | | | | | | | |
| | Quarters Ended | | Six Months Ended |
| (Dollars in millions) | Jun. 27, 2014 | Jun. 28, 2013 | $ Change | | Jun. 27, 2014 | Jun. 28, 2013 | $ Change |
| Interest Income | $ | 1 |
| $ | 1 |
| $ | — |
| | $ | 2 |
| $ | 3 |
| $ | (1 | ) |
| Income from Real Estate Operations | 5 |
| 7 |
| (2 | ) | | 11 |
| 13 |
| (2 | ) |
| Miscellaneous Expense | (18 | ) | 1 |
| (19 | ) | | (18 | ) | (10 | ) | (8 | ) |
| Total Other (Expense) Income - Net | $ | (12 | ) | $ | 9 |
| $ | (21 | ) | | $ | (5 | ) | $ | 6 |
| $ | (11 | ) |
| |
| c) | Income Tax Expense: While there were no tax adjustments in the second quarter of 2014, during prior year second quarter, the Company recorded an income tax benefit of $17 million, or $0.02 per share, as a result of a deferred tax adjustment, the resolution of certain tax matters and a change in state tax legislation. |
Cash Flow Statement
| |
| d) | Share repurchases: There were nine million shares repurchased for $257 million and four million shares repurchased for $95 million during the six months of 2014 and 2013, respectively. |
|
| | | | | | | | | | | | | | | | | | | | | | | | | | | |
VOLUME AND REVENUE (Unaudited)(a) |
| Volume (Thousands of units); Revenue (Dollars in millions); Revenue Per Unit (Dollars) |
| | |
| Quarters Ended June 27, 2014 and June 28, 2013 |
| | | | | | | | | |
| | Volume | | | Revenue | | | Revenue Per Unit | |
| | 2014 | 2013 | % Change | | 2014 | 2013 | % Change | | 2014 | 2013 | % Change |
| Agricultural | | | | | | | | | | | | | | |
| Agricultural Products | 105 |
| 95 |
| 11 | % | | | $ | 285 |
| $ | 248 |
| 15 | % | | | $ | 2,714 |
| $ | 2,611 |
| 4 | % | |
| Phosphates and Fertilizers | 86 |
| 86 |
| — |
| | | 143 |
| 135 |
| 6 |
| | | 1,663 |
| 1,570 |
| 6 |
| |
| Food and Consumer | 25 |
| 25 |
| — |
| | | 70 |
| 69 |
| 1 |
| | | 2,800 |
| 2,760 |
| 1 |
| |
| Industrial | | | | | | | | | | | | | | |
| Chemicals | 157 |
| 133 |
| 18 |
| | | 556 |
| 476 |
| 17 |
| | | 3,541 |
| 3,579 |
| (1 | ) | |
| Automotive | 114 |
| 113 |
| 1 |
| | | 321 |
| 318 |
| 1 |
| | | 2,816 |
| 2,814 |
| — |
| |
| Metals | 74 |
| 66 |
| 12 |
| | | 184 |
| 163 |
| 13 |
| | | 2,486 |
| 2,470 |
| 1 |
| |
| Housing and Construction | | | | | | | | | | | | | | |
| Forest Products | 79 |
| 74 |
| 7 |
| | | 210 |
| 195 |
| 8 |
| | | 2,658 |
| 2,635 |
| 1 |
| |
| Minerals | 80 |
| 75 |
| 7 |
| | | 123 |
| 115 |
| 7 |
| | | 1,538 |
| 1,533 |
| — |
| |
| Waste and Equipment | 40 |
| 35 |
| 14 |
| | | 79 |
| 63 |
| 25 |
| | | 1,975 |
| 1,800 |
| 10 |
| |
| Total Merchandise | 760 |
| 702 |
| 8 |
| | | 1,971 |
| 1,782 |
| 11 |
| | | 2,593 |
| 2,538 |
| 2 |
| |
| | | | | | | | | | | | | | | |
| Coal | 330 |
| 310 |
| 6 |
| | | 744 |
| 770 |
| (3 | ) | | | 2,255 |
| 2,484 |
| (9 | ) | |
| | | | | | | | | | | | | | | |
| Intermodal | 691 |
| 644 |
| 7 |
| | | 449 |
| 425 |
| 6 |
| | | 650 |
| 660 |
| (2 | ) | |
| | | | | | | | | | | | | | | |
| Other | — |
| — |
| — |
| | | 80 |
| 69 |
| 16 |
| | | — |
| — |
| — |
| |
| | | |
|
| | | | | | | | | | | |
| Total | 1,781 |
| 1,656 |
| 8 | % | | | $ | 3,244 |
| $ | 3,046 |
| 7 | % | | | $ | 1,821 |
| $ | 1,839 |
| (1 | )% | |
| | | | | | | | | | | | | | | |
| Six Months Ended June 27, 2014 and June 28, 2013 |
| | | | | | | | | | | | | | | |
| | Volume | | | Revenue | | | Revenue Per Unit | |
| | 2014 | 2013 | % Change | | 2014 | 2013 | % Change | | 2014 | 2013 | % Change |
| Agricultural | | | | | | | | | | | | | | |
| Agricultural Products | 211 |
| 190 |
| 11 | % | | | $ | 569 |
| $ | 489 |
| 16 | % | | | $ | 2,697 |
| $ | 2,574 |
| 5 | % | |
| Phosphates and Fertilizers | 169 |
| 170 |
| (1 | ) | | | 277 |
| 279 |
| (1 | ) | | | 1,639 |
| 1,641 |
| — |
| |
| Food and Consumer | 48 |
| 49 |
| (2 | ) | | | 135 |
| 137 |
| (1 | ) | | | 2,813 |
| 2,796 |
| 1 |
| |
| Industrial | | | | | | | | | | | | | | |
| Chemicals | 303 |
| 263 |
| 15 |
| | | 1,072 |
| 944 |
| 14 |
| | | 3,538 |
| 3,589 |
| (1 | ) | |
| Automotive | 212 |
| 218 |
| (3 | ) | | | 596 |
| 611 |
| (2 | ) | | | 2,811 |
| 2,803 |
| — |
| |
| Metals | 139 |
| 132 |
| 5 |
| | | 349 |
| 324 |
| 8 |
| | | 2,511 |
| 2,455 |
| 2 |
| |
| Housing and Construction | | | | | | | | | | | | | | |
| Forest Products | 153 |
| 147 |
| 4 |
| | | 404 |
| 384 |
| 5 |
| | | 2,641 |
| 2,612 |
| 1 |
| |
| Minerals | 134 |
| 132 |
| 2 |
| | | 218 |
| 211 |
| 3 |
| | | 1,627 |
| 1,598 |
| 2 |
| |
| Waste and Equipment | 71 |
| 67 |
| 6 |
| | | 138 |
| 120 |
| 15 |
| | | 1,944 |
| 1,791 |
| 9 |
| |
| Total Merchandise | 1,440 |
| 1,368 |
| 5 |
| | | 3,758 |
| 3,499 |
| 7 |
| | | 2,610 |
| 2,558 |
| 2 |
| |
| | | | | | | | | | | | | | | |
| Coal | 623 |
| 607 |
| 3 |
| | | 1,406 |
| 1,496 |
| (6 | ) | | | 2,257 |
| 2,465 |
| (8 | ) | |
| | | | | | | | | | | | | | | |
| Intermodal | 1,338 |
| 1,259 |
| 6 |
| | | 870 |
| 829 |
| 5 |
| | | 650 |
| 658 |
| (1 | ) | |
| | | | | | | | | | | | | | | |
| Other | — |
| — |
| — |
| | | 222 |
| 185 |
| 20 |
| | | — |
| — |
| — |
| |
| | | | | | | | | | | | | | | |
| Total | 3,401 |
| 3,234 |
| 5 | % | | | $ | 6,256 |
| $ | 6,009 |
| 4 | % | | | $ | 1,839 |
| $ | 1,858 |
| (1 | )% | |
(a) Previously reported 2013 other revenue, total revenue and total revenue per unit have been revised as disclosed in CSX's most recent annual report on Form 10-K.
VOLUME AND REVENUE
Volume increased 8% year over year with growth across most markets. Revenue increased by 7% year over year driven by this broad-based volume growth.
Merchandise
Agricultural Sector
Agricultural Products - Volume growth was driven by increased shipments of export grain and ethanol. A combined record corn and soybean crop has reduced U.S. grain prices resulting in higher export grain shipments and has increased ethanol production.
Phosphates and Fertilizers - Volume was flat year over year as growth in finished fertilizer products was offset by lower phosphate rock shipments. Growth in fertilizers was driven by the recovery from the severe winter weather that delayed the planting season and fertilizer application, while phosphate rock declined due to maintenance at a customer’s facility.
Food and Consumer - Volume was flat as growth in alcoholic beverage shipments was offset by lower rice shipments. Beverage shipments increased due to a customer’s gain in market share as well as inventory accumulation for the summer season. Rice declined as customers substituted lower-priced corn.
Industrial Sector
Chemicals - Volume growth was driven by an increase in energy-related shipments that included crude oil, liquefied petroleum gas (LPG) and frac sand. The rise in crude oil shipments to east coast refineries was due to increased supply of low cost crude from shale drilling activity.
Automotive - Automotive volume increased as North American light vehicle production grew, but rail equipment shortages due to network performance tempered this growth.
Metals - Volume growth was driven by an increase in sheet steel shipments due to growth in automotive production and competitive gains.
Housing and Construction Sector
Forest Products - Volume growth was led by an increase in building products and pulp board shipments. Building products increased year over year due to the continued recovery in the residential housing market as well as the recovery from shipping delays earlier this year. Pulp board shipments also rebounded from earlier delays and increased due to modal conversions.
Minerals - Volume increased year over year due to growth in aggregates (which include crushed stone, sand and gravel) and salt. Growth in aggregates was driven by the continued recovery in construction activity and shipping delays earlier this year caused by network performance. Strength in salt shipments was driven by inventory replenishment as a result of the increased application during the severe winter weather.
Waste and Equipment - Volume increased year over year due to growth in municipal solid waste shipments from a new service offering to a customer location.
Coal
Coal volume increased due to higher shipments of domestic coal attributable to marketplace gains and utilities replenishing stockpiles. This growth was partially offset by a decrease in export coal as a result of softening global market conditions.
Intermodal
Domestic volume growth was driven by continued success with highway-to-rail conversions and strong demand. International volume also increased due to growth with customers in global container shipments moving to inland destinations.
EXPENSE
Expenses in the second quarter 2014 increased $141 million from the prior year's second quarter. Significant variances are described below.
Labor and Fringe expense increased $32 million due to the following:
| |
| • | Volume-related costs were $25 million higher. |
| |
| • | Labor costs were $14 million higher due to overtime and relief crews associated with network performance. |
| |
| • | Inflation was $14 million higher. |
| |
| • | Other costs were $21 million lower primarily due to reduced pension costs and incentive compensation costs that reflect lower expected award payments. |
Materials, Supplies and Other expense increased $61 million due to the following:
| |
| • | No real estate gains were recognized in the current year, whereas, in the prior year, the Company realized gains of $36 million. |
| |
| • | Volume-related costs rose $19 million primarily due to higher volume and resource levels. |
| |
| • | Inflation was $10 million higher. |
| |
| • | Costs for locomotives from other railroads were $9 million higher due to efforts to improve network performance. |
| |
| • | Various other costs decreased $13 million during the quarter. |
Fuel expense was $19 million higher as increased volume was partially offset by lower price and improved efficiency (See Fuel Statistics table below).
Depreciation expense increased $11 million due to a larger asset base.
Equipment and Other Rents expense was $18 million higher due to increased car hire costs of $9 million related to network performance and $3 million due to greater volume as well as $6 million from inflation.
|
| | | | | | | | | | | | | | | | | | | | |
| FUEL STATISTICS |
| | | | | | | |
| | | Quarters Ended | | Six Months Ended |
| (Dollars and Gallons In Millions, Except Price per Gallon) | | Jun. 27, 2014 | Jun. 28, 2013(a) | Change | | Jun. 27, 2014 | Jun. 28, 2013(a) | Change |
Estimated Locomotive Fuel Consumption (Gallons) | | 126.7 |
| 118.8 |
| (7.9 | ) | | 256.8 |
| 244.1 |
| (12.7 | ) |
Price per Gallon (Dollars) | | $ | 3.06 |
| $ | 3.12 |
| $ | 0.06 |
| | $ | 3.10 |
| $ | 3.21 |
| $ | 0.11 |
|
| Total Locomotive Fuel Expense | | $ | 388 |
| $ | 371 |
| $ | (17 | ) | | $ | 796 |
| $ | 784 |
| $ | (12 | ) |
| Other | | 28 |
| 26 |
| (2 | ) | | 66 |
| 57 |
| (9 | ) |
| Total Fuel Expense | | $ | 416 |
| $ | 397 |
| $ | (19 | ) | | $ | 862 |
| $ | 841 |
| $ | (21 | ) |
(a) Prior periods price per gallon, total locomotive fuel expense and other have been reclassified to conform to current presentation.
|
| | | | | | | | |
EMPLOYEE COUNTS (Estimated) |
| | | | | | |
| | 2014 | | 2013 | | Change |
| April | 31,334 |
| | 31,190 |
| | 144 |
|
| May | 31,368 |
| | 31,309 |
| | 59 |
|
| June | 31,438 |
| | 31,374 |
| | 64 |
|
| | | | | | |
| Average | 31,380 |
| | 31,291 |
| | 89 |
|
OPERATING STATISTICS (Estimated)
|
| | | | | | | | | | | | | | |
| | | Quarters Ended | | Six Months Ended |
| | | Jun. 27, 2014 | Jun. 28, 2013 | Improvement / (Deterioration) | | Jun. 27, 2014 | Jun. 28, 2013 | Improvement / (Deterioration) |
Coal (Millions of Tons) | | | | | | | | |
| Domestic | | | | | | | | |
| Utility | | 21.0 |
| 17.0 |
| 24 | % | | 38.7 |
| 33.2 |
| 17 | % |
| Coke, Iron Ore and Other | | 6.2 |
| 6.4 |
| (3 | ) | | 11.0 |
| 11.1 |
| (1 | ) |
| Total Domestic | | 27.2 |
| 23.4 |
| 16 |
| | 49.7 |
| 44.3 |
| 12 |
|
| Export | | | |
| | | | |
| Metallurgical | | 5.8 |
| 6.4 |
| (9 | ) | | 12.0 |
| 13.4 |
| (10 | ) |
| Thermal | | 4.5 |
| 5.1 |
| (12 | ) | | 8.8 |
| 10.4 |
| (15 | ) |
| Total Export | | 10.3 |
| 11.5 |
| (10 | ) | | 20.8 |
| 23.8 |
| (13 | ) |
| | | | | | | | | |
| Total Coal | | 37.5 |
| 34.9 |
| 7 | % | | 70.5 |
| 68.1 |
| 4 | % |
| | | | | | | | | |
Revenue Ton-Miles (Billions) | | | | | | | | |
| Merchandise | | 38.3 |
| 34.1 |
| 12 | % | | 73.6 |
| 67.4 |
| 9 | % |
| Coal | | 18.3 |
| 16.9 |
| 8 |
| | 34.6 |
| 33.2 |
| 4 |
|
| Intermodal | | 6.9 |
| 6.3 |
| 10 |
| | 13.3 |
| 12.2 |
| 9 |
|
| Total | | 63.5 |
| 57.3 |
| 11 | % | | 121.5 |
| 112.8 |
| 8 | % |
| | | | | | | | | |
Gross Ton-Miles (Billions) | | | | | | | | |
| Total Gross Ton-Miles | | 114.9 |
| 105.5 |
| 9 | % | | 219.6 |
| 207.7 |
| 6 | % |
| (Excludes locomotive gross ton-miles) | | | | | | | | |
| | | | | | | | | |
| Safety and Service Measurements | | | | | | | | |
| FRA Personal Injury Frequency Index | | 0.90 |
| 1.00 |
| 10 | % | | 0.93 |
| 0.90 |
| (3 | )% |
| (Number of FRA-reportable injuries per 200,000 man-hours) | | | | | | | | |
| FRA Train Accident Rate | | 2.07 |
| 2.18 |
| 5 | % | | 2.26 |
| 1.98 |
| (14 | )% |
| (Number of FRA-reportable train accidents per million train miles) | | | | | | | | |
| | | | | | | | | |
| On-Time Originations | | 56 | % | 91 | % | (38 | )% | | 59 | % | 91 | % | (35 | )% |
| On-Time Arrivals | | 42 | % | 82 | % | (49 | )% | | 46 | % | 84 | % | (45 | )% |
| | | | | | | | | |
Train Velocity (Miles per hour) | | 19.3 |
| 23.0 |
| (16 | )% | | 19.9 |
| 23.3 |
| (15 | )% |
Dwell (Hours) | | 25.9 |
| 21.9 |
| (18 | )% | | 26.3 |
| 22.1 |
| (19 | )% |
| | | | | | | | | |
Cars-On-Line (a) | | 207,141 |
| 181,929 |
| (14 | )% | | 202,005 |
| 182,572 |
| (11 | )% |
| | | | |
| | | |
|
| Resources | | | | Increase / (Decrease) | | | | |
| Route Miles | | 20,771 |
| 20,864 |
| — | % | | | |
|
Locomotives (Owned and long-term leased) | | 4,259 |
| 4,212 |
| 1 | % | | | |
|
Freight Cars (Owned and long-term leased) | | 67,381 |
| 68,983 |
| (2 | )% | | | |
|
Containers (Owned and long-term leased) | | 18,249 |
| 17,965 |
| 2 | % | | | | |
(a) Cars-on-line increased approximately 14,000 or 7.5% in 2014 due to a calculation error correction made by the American Association of Railroads in February 2014. This error impacted the industry cars-on-line since 2011. Previously reported amounts have not been adjusted to reflect this correction.