CSX Corporation Announces
Record Fourth-Quarter and Full-Year Results
Highlights:
| |
| • | Record fourth-quarter and full-year results for revenue, operating income, net earnings and earnings per share |
| |
| • | For 2015, the company expects double-digit earnings per share growth and margin expansion, as it progresses toward a mid-60s operating ratio longer term |
JACKSONVILLE, Fla. - January 13, 2015 - CSX Corporation (NYSE: CSX) today announced record fourth-quarter 2014 net earnings of $491 million, a 15 percent increase from $426 million for the same period last year. The company also generated record fourth-quarter earnings per share of $0.49, up 17 percent from $0.42 per share in 2013.
“CSX is capturing broad-based market strength, completing strategic infrastructure projects and adding resources to further improve service performance and leverage growth opportunities,” said Michael J. Ward, chairman, president and chief executive officer. “Building on a foundation of strong safety and customer service, we expect to continue growing our intermodal and merchandise businesses faster than the economy, pricing above inflation, and driving efficient asset utilization.”
Fourth-quarter revenue increased 5 percent to $3.2 billion, with strength across merchandise, intermodal and coal. The timely addition of operating resources enhanced service through the fall peak shipping season and supported volume growth. As a result, operating income increased 11 percent to $901 million, and the operating ratio improved 140 basis points to 71.8 percent.
For the full-year, CSX produced new all-time records for revenue of $12.7 billion, operating income of $3.6 billion, net earnings of $1.9 billion and earnings per share of $1.92. At the same time, the operating ratio remained relatively stable at 71.5 percent.
Looking to 2015, CSX expects continued strong growth across its diverse business mix and is poised for sustainable business expansion. The company continues to expect to generate double-digit growth in earnings per share and margin expansion in 2015, progressing toward a mid-60s operating ratio longer term.
CSX executives will conduct a quarterly earnings conference call with the investment community on January 14, 2015, at 8:30 a.m. Eastern time. Investors, media and the public may listen to the conference call by dialing 1-888-EARN-CSX (888-327-6279) and asking for the CSX earnings call. Callers outside the U.S., dial 1-773-756-0199. Participants should dial in 10 minutes prior to the call. In conjunction with the call, a live webcast will be accessible and presentation materials will be posted on the company's website at http://investors.csx.com. Following the earnings call, an internet replay of the presentation will be archived on the company website.
This earnings announcement, as well as additional detailed financial information, is contained in the CSX Quarterly Financial Report available on the company’s website at http://investors.csx.com and on Form 8-K with the Securities and Exchange Commission.
|
| | | |
| Table of Contents | The accompanying unaudited | CSX CORPORATION | CONTACTS: |
| | financial information should be | 500 Water Street, C900 | |
| read in conjunction with the | Jacksonville, FL 32202 | INVESTOR RELATIONS |
| Company’s most recent | www.csx.com | David Baggs |
| Annual Report on Form 10-K, | | (904) 359-4812 |
| | Quarterly Reports on Form | | MEDIA |
| | 10-Q, and any Current | | Melanie Cost |
| | Reports on Form 8-K. | | (904) 359-1702 |
CSX also uses social media channels to communicate information about the company. Although our social media channels are not intended to be the primary method of disclosure for material information, it is possible that certain information we post on social media could be deemed to be material. Therefore, we encourage investors, the media, and others interested in our company to review the information we post on the social media channels listed below. This list may be updated from time to time.
http://twitter.com/CSX
http://www.slideshare.net/HowTomorrowMoves
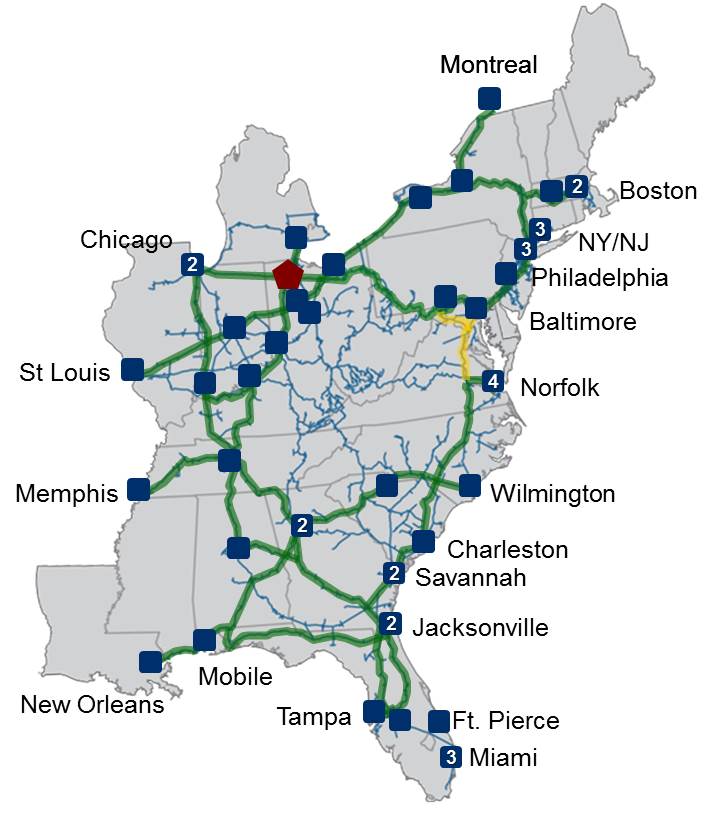
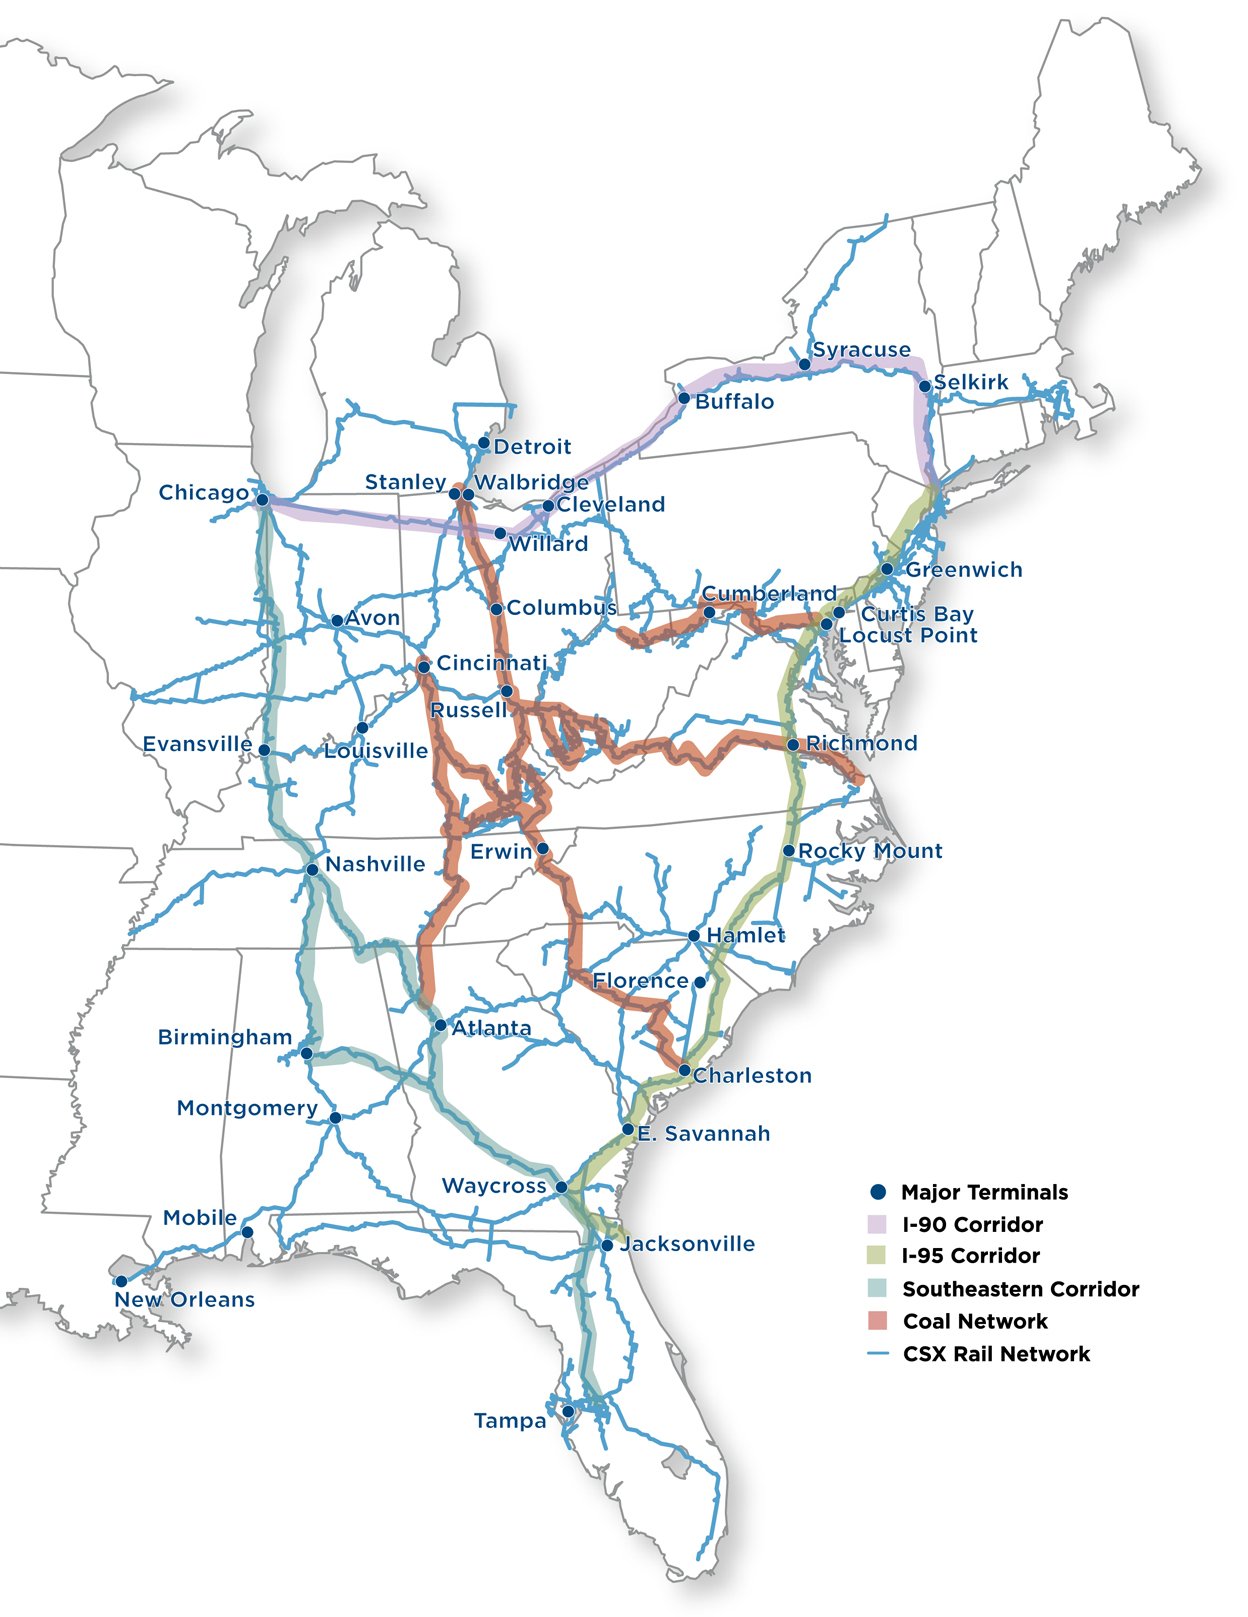
CSX, based in Jacksonville, Florida, is a premier transportation company. It provides rail, intermodal and rail-to-truck transload services and solutions to customers across a broad array of markets, including energy, industrial, construction, agricultural, and consumer products. For more than 185 years, CSX has played a critical role in the nation’s economic expansion and industrial development. Its network connects every major metropolitan area in the eastern United States, where nearly two-thirds of the nation’s population resides. It also links more than 240 short-line railroads and more than 70 ocean, river and lake ports with major population centers and small farming towns alike. More information about CSX Corporation and its subsidiaries is available at www.csx.com.
Like us on Facebook (http://www.facebook.com/OfficialCSX) and follow us on Twitter (http://twitter.com/CSX).
Forward-looking Statements
This information and other statements by the company may contain forward-looking statements within the meaning of the Private Securities Litigation Reform Act with respect to, among other items: projections and estimates of earnings, revenues, margins, volumes, rates, cost-savings, expenses, taxes, liquidity, capital expenditures, dividends, share repurchases or other financial items, statements of management's plans, strategies and objectives for future operations, and management's expectations as to future performance and operations and the time by which objectives will be achieved, statements concerning proposed new services, and statements regarding future economic, industry or market conditions or performance. Forward-looking statements are typically identified by words or phrases such as “will,” “should,” “believe,” “expect,” “anticipate,” “project,” “estimate,” “preliminary” and similar expressions. Forward-looking statements speak only as of the date they are made, and the company undertakes no obligation to update or revise any forward-looking statement. If the company updates any forward-looking statement, no inference should be drawn that the company will make additional updates with respect to that statement or any other forward-looking statements.
Forward-looking statements are subject to a number of risks and uncertainties, and actual performance or results could differ materially from that anticipated by any forward-looking statements. Factors that may cause actual results to differ materially from those contemplated by any forward- looking statements include, among others; (i) the company's success in implementing its financial and operational initiatives; (ii) changes in domestic or international economic, political or business conditions, including those affecting the transportation industry (such as the impact of industry competition, conditions, performance and consolidation); (iii) legislative or regulatory changes; (iv) the inherent business risks associated with safety and security; (v) the outcome of claims and litigation involving or affecting the company; (vi) natural events such as severe weather conditions or pandemic health crises; and (vii) the inherent uncertainty associated with projecting economic and business conditions.
Other important assumptions and factors that could cause actual results to differ materially from those in the forward-looking statements are specified in the company's SEC reports, accessible on the SEC's website at www.sec.gov and the company's website at www.csx.com.
CONSOLIDATED INCOME STATEMENTS
(Dollars in millions, except per share amounts)
|
| | | | | | | | | | | | | | | | | | | | | | | |
| | (Unaudited) | | (Unaudited) | | | |
| | Quarters Ended | | Years Ended |
| | Dec. 26, 2014 | Dec. 27, 2013 | $ Change | % Change | | Dec. 26, 2014 | Dec. 27, 2013 | $ Change | % Change |
| | | | | | | | | | |
| Revenue | $ | 3,192 |
| $ | 3,032 |
| $ | 160 |
| 5 | % | | $ | 12,669 |
| $ | 12,026 |
| $ | 643 |
| 5 | % |
| Expense | | | | | | | | | |
| Labor and Fringe | 909 |
| 803 |
| (106 | ) | (13 | ) | | 3,377 |
| 3,138 |
| (239 | ) | (8 | ) |
| Materials, Supplies and Other | 624 |
| 632 |
| 8 |
| 1 |
| | 2,484 |
| 2,275 |
| (209 | ) | (9 | ) |
| Fuel | 361 |
| 408 |
| 47 |
| 12 |
| | 1,616 |
| 1,656 |
| 40 |
| 2 |
|
| Depreciation | 290 |
| 281 |
| (9 | ) | (3 | ) | | 1,151 |
| 1,104 |
| (47 | ) | (4 | ) |
| Equipment and Other Rents | 107 |
| 95 |
| (12 | ) | (13 | ) | | 428 |
| 380 |
| (48 | ) | (13 | ) |
| Total Expense | 2,291 |
| 2,219 |
| (72 | ) | (3 | ) | | 9,056 |
| 8,553 |
| (503 | ) | (6 | ) |
| | | | | | | | | | |
| Operating Income | 901 |
| 813 |
| 88 |
| 11 |
| | 3,613 |
| 3,473 |
| 140 |
| 4 |
|
| | | | | | | | | | |
| Interest Expense | (133 | ) | (139 | ) | 6 |
| 4 |
| | (545 | ) | (562 | ) | 17 |
| 3 |
|
| Other Income (Expense) - Net | 7 |
| — |
| 7 |
| — |
| | (24 | ) | 11 |
| (35 | ) | (318 | ) |
| Earnings Before Income Taxes | 775 |
| 674 |
| 101 |
| 15 |
| | 3,044 |
| 2,922 |
| 122 |
| 4 |
|
| | | | | | | | | | |
| Income Tax Expense | (284 | ) | (248 | ) | (36 | ) | (15 | ) | | (1,117 | ) | (1,058 | ) | (59 | ) | (6 | ) |
| Net Earnings | $ | 491 |
| $ | 426 |
| $ | 65 |
| 15 | % | | $ | 1,927 |
| $ | 1,864 |
| $ | 63 |
| 3 | % |
| | | | | | | | | | |
| Operating Ratio | 71.8 | % | 73.2 | % | | | | 71.5 | % | 71.1 | % | | |
| | | | | | | | | | |
| Per Common Share | | | | | | | | | |
| Net Earnings Per Share, Assuming Dilution | $ | 0.49 |
| $ | 0.42 |
| $ | 0.07 |
| 17 | % | | $ | 1.92 |
| $ | 1.83 |
| $ | 0.09 |
| 5 | % |
| | | | | | | | | | |
Average Shares Outstanding, Assuming Dilution (millions) | 995 |
| 1,013 |
| | | | 1,002 |
| 1,019 |
| | |
| | | | | | | | | | |
| Cash Dividends Paid Per Common Share | $ | 0.16 |
| $ | 0.15 |
| | | | $ | 0.63 |
| $ | 0.59 |
| | |
| | | | | | | | | | |
| | | | | | | | | | |
CONDENSED CONSOLIDATED BALANCE SHEETS
(Dollars in millions)
|
| | | | | | |
| | (Unaudited) | |
| | Dec. 26, 2014 | Dec. 27, 2013 |
| ASSETS |
| | | |
| Cash and Cash Equivalents | $ | 669 |
| $ | 592 |
|
| Short-term Investments | 292 |
| 487 |
|
| Other Current Assets | 1,611 |
| 1,523 |
|
| Properties - Net | 28,584 |
| 27,291 |
|
| Investment in Affiliates and Other Companies | 1,356 |
| 1,298 |
|
| Other Long-term Assets | 541 |
| 591 |
|
| Total Assets | $ | 33,053 |
| $ | 31,782 |
|
| | | |
| | | |
| LIABILITIES AND SHAREHOLDERS' EQUITY |
| | | |
| Current Maturities of Long-term Debt | $ | 228 |
| $ | 533 |
|
| Other Current Liabilities | 1,879 |
| 1,891 |
|
| Long-term Debt | 9,514 |
| 9,022 |
|
| Deferred Income Taxes | 8,858 |
| 8,662 |
|
| Other Long-term Liabilities | 1,398 |
| 1,170 |
|
| Total Liabilities | 21,877 |
| 21,278 |
|
| | | |
| Total Shareholders' Equity | 11,176 |
| 10,504 |
|
| Total Liabilities and Shareholders' Equity | $ | 33,053 |
| $ | 31,782 |
|
CONDENSED CONSOLIDATED CASH FLOW STATEMENTS
(Dollars in millions)
|
| | | | | | |
| | (Unaudited) | |
| | Years Ended |
| | Dec. 26, 2014 | Dec. 27, 2013 |
| OPERATING ACTIVITIES | | |
| Net Earnings | $ | 1,927 |
| $ | 1,864 |
|
| Depreciation | 1,151 |
| 1,104 |
|
| Deferred Income Taxes | 298 |
| 300 |
|
| Gains on Property Dispositions | (11 | ) | (70 | ) |
| Other Operating Activities - Net | (22 | ) | 69 |
|
| Net Cash Provided by Operating Activities | 3,343 |
| 3,267 |
|
| | | |
| INVESTING ACTIVITIES | | |
| Property Additions | (2,449 | ) | (2,313 | ) |
| Purchase of Short-term Investments | (1,433 | ) | (1,256 | ) |
| Proceeds from Sales of Short-term Investments | 1,674 |
| 1,401 |
|
| Proceeds from Property Dispositions | 62 |
| 53 |
|
| Other Investing Activities | (37 | ) | (112 | ) |
| Net Cash Used in Investing Activities | (2,183 | ) | (2,227 | ) |
| | | |
| FINANCING ACTIVITIES | | |
| Long-term Debt Issued | 1,000 |
| 500 |
|
| Long-term Debt Repaid | (933 | ) | (780 | ) |
| Dividends Paid | (629 | ) | (600 | ) |
Shares Repurchased (a) | (517 | ) | (353 | ) |
| Other Financing Activities - Net | (4 | ) | 1 |
|
| Net Cash Used in Financing Activities | (1,083 | ) | (1,232 | ) |
| | | |
| Net Increase (Decrease) in Cash and Cash Equivalents | 77 |
| (192 | ) |
| | | |
| CASH AND CASH EQUIVALENTS | | |
| Cash and Cash Equivalents at Beginning of Period | 592 |
| 784 |
|
| Cash and Cash Equivalents at End of Period | $ | 669 |
| $ | 592 |
|
| |
| a) | Shares Repurchased: There were 17 million shares repurchased for $517 million and 14 million shares repurchased for $353 million during 2014 and 2013, respectively. |
|
| | | | | | | | | | | | | | | | | | | | | | | | | | | |
VOLUME AND REVENUE (Unaudited) |
| Volume (Thousands of units); Revenue (Dollars in millions); Revenue Per Unit (Dollars) |
| | |
| Quarters Ended December 26, 2014 and December 27, 2013 |
| | | | | | | | | |
| | Volume | | | Revenue | | | Revenue Per Unit | |
| | 2014 | 2013 | % Change | | 2014 | 2013 | % Change | | 2014 | 2013 | % Change |
| Agricultural | | | | | | | | | | | | | | |
| Agricultural Products | 110 |
| 113 |
| (3 | )% | | | $ | 301 |
| $ | 301 |
| — | % | | | $ | 2,736 |
| $ | 2,664 |
| 3 | % | |
| Phosphates and Fertilizers | 79 |
| 77 |
| 3 |
| | | 130 |
| 124 |
| 5 |
| | | 1,646 |
| 1,610 |
| 2 |
| |
| Food and Consumer | 23 |
| 24 |
| (4 | ) | | | 66 |
| 68 |
| (3 | ) | | | 2,870 |
| 2,833 |
| 1 |
| |
| Industrial | | | | | | | | | | | | | | |
| Chemicals | 158 |
| 137 |
| 15 |
| | | 548 |
| 483 |
| 13 |
| | | 3,468 |
| 3,526 |
| (2 | ) | |
| Automotive | 114 |
| 113 |
| 1 |
| | | 312 |
| 320 |
| (3 | ) | | | 2,737 |
| 2,832 |
| (3 | ) | |
| Metals | 66 |
| 63 |
| 5 |
| | | 169 |
| 156 |
| 8 |
| | | 2,561 |
| 2,476 |
| 3 |
| |
| Housing and Construction | | | | | | | | | | | | | | |
| Forest Products | 77 |
| 74 |
| 4 |
| | | 206 |
| 192 |
| 7 |
| | | 2,675 |
| 2,595 |
| 3 |
| |
| Minerals | 76 |
| 67 |
| 13 |
| | | 114 |
| 107 |
| 7 |
| | | 1,500 |
| 1,597 |
| (6 | ) | |
| Waste and Equipment | 41 |
| 39 |
| 5 |
| | | 77 |
| 68 |
| 13 |
| | | 1,878 |
| 1,744 |
| 8 |
| |
| Total Merchandise | 744 |
| 707 |
| 5 |
| | | 1,923 |
| 1,819 |
| 6 |
| | | 2,585 |
| 2,573 |
| — |
| |
| | | | | | | | | | | | | | | |
| Coal | 320 |
| 289 |
| 11 |
| | | 722 |
| 679 |
| 6 |
| | | 2,256 |
| 2,349 |
| (4 | ) | |
| | | | | | | | | | | | | | | |
| Intermodal | 699 |
| 666 |
| 5 |
| | | 465 |
| 437 |
| 6 |
| | | 665 |
| 656 |
| 1 |
| |
| | | | | | | | | | | | | | | |
| Other | — |
| — |
| — |
| | | 82 |
| 97 |
| (15 | ) | | | — |
| — |
| — |
| |
| | | | | | | | | | | | | | | |
| Total | 1,763 |
| 1,662 |
| 6 | % | | | $ | 3,192 |
| $ | 3,032 |
| 5 | % | | | $ | 1,811 |
| $ | 1,824 |
| (1 | )% | |
| | | | | | | | | | | | | | | |
| Years Ended December 26, 2014 and December 27, 2013 |
| | | | | | | | | | | | | | | |
| | Volume | | | Revenue | | | Revenue Per Unit | |
| | 2014 | 2013 | % Change | | 2014 | 2013 | % Change | | 2014 | 2013 | % Change |
| Agricultural | | | | | | | | | | | | | | |
| Agricultural Products | 419 |
| 390 |
| 7 | % | | | $ | 1,130 |
| $ | 1,013 |
| 12 | % | | | $ | 2,697 |
| $ | 2,597 |
| 4 | % | |
| Phosphates and Fertilizers | 330 |
| 327 |
| 1 |
| | | 534 |
| 527 |
| 1 |
| | | 1,618 |
| 1,612 |
| — |
| |
| Food and Consumer | 94 |
| 96 |
| (2 | ) | | | 265 |
| 269 |
| (1 | ) | | | 2,819 |
| 2,802 |
| 1 |
| |
| Industrial | | | | | | | | | | | | | | |
| Chemicals | 620 |
| 532 |
| 17 |
| | | 2,178 |
| 1,896 |
| 15 |
| | | 3,513 |
| 3,564 |
| (1 | ) | |
| Automotive | 435 |
| 432 |
| 1 |
| | | 1,213 |
| 1,217 |
| — |
| | | 2,789 |
| 2,817 |
| (1 | ) | |
| Metals | 276 |
| 262 |
| 5 |
| | | 701 |
| 644 |
| 9 |
| | | 2,540 |
| 2,458 |
| 3 |
| |
| Housing and Construction | | | | | | | | | | | | | | |
| Forest Products | 307 |
| 298 |
| 3 |
| | | 819 |
| 775 |
| 6 |
| | | 2,668 |
| 2,601 |
| 3 |
| |
| Minerals | 293 |
| 275 |
| 7 |
| | | 459 |
| 432 |
| 6 |
| | | 1,567 |
| 1,571 |
| — |
| |
| Waste and Equipment | 158 |
| 150 |
| 5 |
| | | 309 |
| 264 |
| 17 |
| | | 1,956 |
| 1,760 |
| 11 |
| |
| Total Merchandise | 2,932 |
| 2,762 |
| 6 |
| | | 7,608 |
| 7,037 |
| 8 |
| | | 2,595 |
| 2,548 |
| 2 |
| |
| | | | | | | | | | | | | | | |
| Coal | 1,262 |
| 1,195 |
| 6 |
| | | 2,849 |
| 2,895 |
| (2 | ) | | | 2,258 |
| 2,423 |
| (7 | ) | |
| | | | | | | | | | | | | | | |
| Intermodal | 2,728 |
| 2,582 |
| 6 |
| | | 1,790 |
| 1,697 |
| 5 |
| | | 656 |
| 657 |
| — |
| |
| | | | | | | | | | | | | | | |
| Other | — |
| — |
| — |
| | | 422 |
| 397 |
| 6 |
| | | — |
| — |
| — |
| |
| | | | | | | | | | | | | | | |
Total | 6,922 |
| 6,539 |
| 6 | % | | | $ | 12,669 |
| $ | 12,026 |
| 5 | % | | | $ | 1,830 |
| $ | 1,839 |
| — | % | |
VOLUME AND REVENUE
Revenue increased 5% from the prior year's fourth quarter primarily driven by the 6% increase in volume from growth across most markets.
|
| | |
Same Store Sales Pricing Year-Over-Year Change |
| | % Change |
| All-In | 0.7 | |
| Merchandise and Intermodal | 2.7 | |
Same store sales is defined as shipments with the same customer, commodity and car type, and the same origin and destination.
While revenue per unit was down slightly reflecting lower fuel recoveries, same store sales pricing increased as gains in merchandise and intermodal were partially offset by a decline in coal. Declines in coal pricing are due to continued rate pressure in the export markets and the impact of fixed/variable contracts in the domestic utility market where volume is increasing.
MERCHANDISE
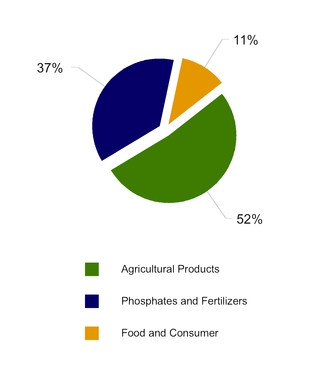
Agricultural Sector
|
| | | | | | | | | | | | | | | | | | | | | | | | |
| Volume (Thousands of units); Revenue (Dollars in millions); Revenue Per Unit (Dollars) |
| Volume | | | Revenue | | | Revenue Per Unit | |
| 2014 | 2013 | % Change | | 2014 | 2013 | % Change | | 2014 | 2013 | % Change |
| 212 |
| 214 |
| (1 | ) | | | $ | 497 |
| $ | 493 |
| 1 | | | $ | 2,344 |
| $ | 2,304 |
| 2 | |
Agricultural Products - Volume declined due to lower shipments of export grain and soybeans driven by market losses and resource constraints.
Phosphates and Fertilizers - Volume growth was driven by an increase in phosphate rock, which increased as a result of capacity at a customer facility returning to normal levels, and potash shipments, which increased due to an extended shipping season during the mild winter in the quarter as well as the continued recovery from production and shipping delays earlier in 2014.
Food and Consumer - Volume declined primarily due to lower shipments of appliances resulting from production changes at a customer location. These declines were partially offset by growth in alcoholic beverage shipments due to a customer’s gain in market share.
Industrial Sector
|
| | | | | | | | | | | | | | | | | | | | | | | | |
Volume (Thousands of units); Revenue (Dollars in millions); Revenue Per Unit (Dollars)
|
| Volume | | | Revenue | | | Revenue Per Unit | |
| 2014 | 2013 | % Change | | 2014 | 2013 | % Change | | 2014 | 2013 | % Change |
| 338 |
| 313 |
| 8 | | | $ | 1,029 |
| $ | 959 |
| 7 | | | $ | 3,044 |
| $ | 3,064 |
| (1 | ) | |
Chemicals - Volume growth was driven by an increase in energy-related shipments that included crude oil, LPG and frac sand. The rise in crude oil shipments to east coast refineries was due to increased supply of crude oil from domestic shale drilling activity.
Automotive - Volume increased in finished vehicle shipments as North American light vehicle production grew. This growth was partially offset by customer transportation modal changes.
Metals - Volume growth was driven by an increase in sheet steel shipments due to higher automotive production and market gains.
Housing and Construction Sector
|
| | | | | | | | | | | | | | | | | | | | | | | |
| Volume (Thousands of units); Revenue (Dollars in millions); Revenue Per Unit (Dollars) |
| Volume | | | Revenue | | | Revenue Per Unit | |
| 2014 | 2013 | % Change | | 2014 | 2013 | % Change | | 2014 | 2013 | % Change |
| 194 |
| 180 |
| 8 | | | $ | 397 |
| $ | 367 |
| 8 | | | $ | 2,046 |
| $ | 2,039 |
| — | |
Forest Products - Volume increased due to higher shipments of building products driven by the continued recovery in the residential housing market and pulpboard growth resulting from modal conversions and higher export shipments.
Minerals - Volume increased due to growth in aggregates (which includes crushed stone, sand and gravel) driven by the continued recovery in construction activity and the mild winter weather during the quarter.
Waste and Equipment - Volume increased due to growth in municipal solid waste shipments from a new service offering to a customer location. This growth was partially offset by lower industrial waste shipments due to the completion of a one-time remediation project.
COAL
|
| | | | | | | | | | | | | | | | | | | | | | | | |
| Volume (Thousands of units); Revenue (Dollars in millions); Revenue Per Unit (Dollars) |
| Volume | | | Revenue | | | Revenue Per Unit | |
| 2014 | 2013 | % Change | | 2014 | 2013 | % Change | | 2014 | 2013 | % Change |
| 320 |
| 289 |
| 11 | | | $ | 722 |
| $ | 679 |
| 6 | | | $ | 2,256 |
| $ | 2,349 |
| (4 | ) | |
| | | | | | | | | | | | | | |
Domestic Utility Coal - Volume increased 22% driven by utilities replenishing stockpiles ahead of winter heating season and market gain.
Domestic Coke, Iron Ore and Other - Volume increased 16% driven by stronger iron ore shipments associated with a new customer facility and stronger lake shipments.
Export Metallurgical Coal - Volume was up slightly on increased production from Southern Appalachian producers and increased demand for cheaper, high-volatility coals for steel production.
Export Thermal Coal - Volume declined 20% as global market conditions continued to weaken.
|
| | | | | | | | | | | | | | |
| | | Quarters Ended | | Years Ended |
| | | Dec. 26, 2014 | Dec. 27, 2013 | % Change | | Dec. 26, 2014 | Dec. 27, 2013 | % Change |
| (Millions of Tons) | | | | | | | | |
| Domestic | | | | | | | | |
| Utility | | 19.0 |
| 15.6 |
| 22 | % | | 77.8 |
| 66.1 |
| 18 | % |
| Coke, Iron Ore and Other | | 7.8 |
| 6.7 |
| 16 |
| | 26.1 |
| 24.1 |
| 8 |
|
| Total Domestic | | 26.8 |
| 22.3 |
| 20 |
| | 103.9 |
| 90.2 |
| 15 |
|
| Export | | | | | | | | |
| Metallurgical | | 5.9 |
| 5.7 |
| 4 |
| | 23.4 |
| 24.9 |
| (6 | ) |
| Thermal | | 3.6 |
| 4.5 |
| (20 | ) | | 15.6 |
| 19.1 |
| (18 | ) |
| Total Export | | 9.5 |
| 10.2 |
| (7 | ) | | 39.0 |
| 44.0 |
| (11 | ) |
| | | | | | | | | |
| Total Coal | | 36.3 |
| 32.5 |
| 12 | % | | 142.9 |
| 134.2 |
| 6 | % |
INTERMODAL
|
| | | | | | | | | | | | | | | | | | | | | | | |
| Volume (Thousands of units); Revenue (Dollars in millions); Revenue Per Unit (Dollars) |
| Volume | | | Revenue | | | Revenue Per Unit | |
| 2014 | 2013 | % Change | | 2014 | 2013 | % Change | | 2014 | 2013 | % Change |
| 699 |
| 666 |
| 5 | | | $ | 465 |
| $ | 437 |
| 6 | | | $ | 665 |
| $ | 656 |
| 1 | |
Domestic - Domestic volume increased 9% as a result of growth with existing customers and continued success with highway-to-rail conversions.
International - International volume increased 1% due to growth in global container shipments moving to inland destinations, partially offset by market losses.
Note: Multiple terminals in a market are designated with a number
FUEL SURCHARGE
|
| | | | | | | | | | | | | | | | | | | |
| | Quarters Ended | | Years Ended |
| (Dollars in millions) | Dec. 26, 2014 | Dec. 27, 2013 | $ Change | | Dec. 26, 2014 | Dec. 27, 2013 | $ Change |
Fuel Surcharge Revenue (a) | $ | 284 |
| $ | 292 |
| $ | (8 | ) | | $ | 1,184 |
| $ | 1,150 |
| $ | 34 |
|
Fuel Lag Benefit (b) | $ | 23 |
| $ | 7 |
| $ | 16 |
| | $ | 27 |
| $ | 9 |
| $ | 18 |
|
(a) Fuel surcharge revenue is included in the individual markets detailed within the volume and revenue discussions above.
(b) Fuel lag is the difference between highway diesel prices in the quarter and the prices used for fuel surcharge, which are generally on a two month lag.
EXPENSE
Expenses increased 3% or $72 million from the prior year's fourth quarter. The increase was primarily driven by higher labor and fringe expense partially offset by lower fuel costs. Significant variances are described below.
LABOR AND FRINGE
| |
| • | During the fourth quarter, the Company initiated a management workforce reduction program which resulted in an initial charge of $39 million for the quarter. |
| |
| • | Volume-related costs were $21 million higher primarily due to increased workforce levels to help capture strong customer demand. |
| |
| • | Inflation resulted in $21 million additional cost, driven mainly by union wage inflation. |
| |
| • | Labor costs were $15 million higher due to an amended locomotive maintenance agreement in mid-2014 where CSX now provides oversight of the labor force. Outside service costs shifted from materials, supplies and other to labor and fringe and overall expense is neutral for the quarter. |
| |
| • | Other costs were $10 million higher primarily due to higher incentive compensation costs, partially offset by reduced pension and post-retirement benefit costs. |
|
| | | | | | | | |
EMPLOYEE COUNTS (Estimated) |
| | | | | | |
| | 2014 | | 2013 | | Change |
| October | 31,795 |
| | 31,455 |
| | 340 |
|
| November | 32,063 |
| | 31,492 |
| | 571 |
|
| December | 32,178 |
| | 31,413 |
| | 765 |
|
| | | | | | |
| Average | 32,012 |
| | 31,453 |
| | 559 |
|
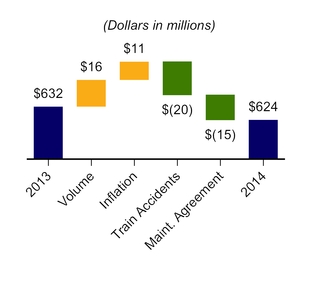
MATERIALS, SUPPLIES AND OTHER
| |
| • | Volume-related costs rose $16 million to help capture strong customer demand. |
| |
| • | Inflation resulted in $11 million additional cost. |
| |
| • | Train accidents and other costs were $20 million lower primarily due to prior year train accident costs that did not repeat in the current period. |
| |
| • | The amended locomotive maintenance agreement shifted $15 million to labor and fringe as referenced above. |
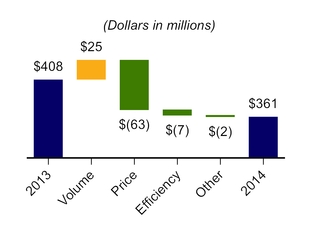
FUEL
| |
| • | Volume-related costs were $25 million higher. |
| |
| • | Lower price (see chart below) decreased expense by $63 million. |
| |
| • | Improved efficiency reduced expense by $7 million. |
| |
| • | Other fuel savings of $2 million were due to lower non-locomotive fuel costs. |
|
| | | | | | | | | | | | | | | | | | | | |
| | | | | | | |
| | | Quarters Ended | | Years Ended |
| (Dollars and Gallons In Millions, Except Price per Gallon) | | Dec. 26, 2014 | Dec. 27, 2013 | Fav / (Unfav) | | Dec. 26, 2014 | Dec. 27, 2013 | Fav / (Unfav) |
Estimated Locomotive Fuel Consumption (Gallons) | | 128.2 |
| 122.6 |
| (5.6 | ) | | 507.3 |
| 481.9 |
| (25.4 | ) |
Price per Gallon (Dollars) | | $ | 2.61 |
| $ | 3.10 |
| $ | 0.49 |
| | $ | 2.95 |
| $ | 3.17 |
| $ | 0.22 |
|
| Total Locomotive Fuel Expense | | $ | 335 |
| $ | 380 |
| $ | 45 |
| | $ | 1,498 |
| $ | 1,529 |
| $ | 31 |
|
| Other | | 26 |
| 28 |
| 2 |
| | 118 |
| 127 |
| 9 |
|
| Total Fuel Expense | | $ | 361 |
| $ | 408 |
| $ | 47 |
| | $ | 1,616 |
| $ | 1,656 |
| $ | 40 |
|
DEPRECIATION
Depreciation expense increased $9 million primarily due to a larger asset base partially offset by lower depreciation rates resulting from a periodic review of asset useful lives.
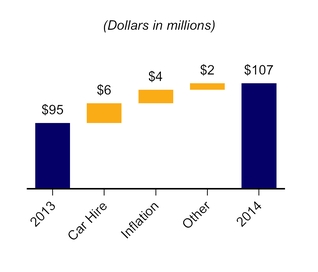
EQUIPMENT AND OTHER RENTS
| |
| • | Car hire costs were $6 million higher due to volume and longer car cycle times. |
| |
| • | Inflation resulted in $4 million additional cost related to rates on automotive, intermodal and coal cars. |
| |
| • | Other costs rose $2 million. |
OPERATING STATISTICS (Estimated)
TON MILES
|
| | | | | | | | | | | | | | |
| | | Quarters Ended | | Years Ended |
| | | Dec. 26, 2014 | Dec. 27, 2013 | Improvement / (Deterioration) | | Dec. 26, 2014 | Dec. 27, 2013 | Improvement / (Deterioration) |
Revenue Ton-Miles (Billions) | | | | | | | | |
| Merchandise | | 37.7 |
| 36.4 |
| 4 | % | | 148.4 |
| 137 |
| 8 | % |
| Coal | | 17.5 |
| 15.2 |
| 15 |
| | 69.1 |
| 64.6 |
| 7 |
|
| Intermodal | | 6.9 |
| 6.4 |
| 8 |
| | 27.0 |
| 25.0 |
| 8 |
|
| Total | | 62.1 |
| 58.0 |
| 7 | % | | 244.5 |
| 226.6 |
| 8 | % |
| | | | | | | | | |
Gross Ton-Miles (Billions) | | | |
| | | |
|
| Total Gross Ton-Miles | | 113.5 |
| 106.8 |
| 6 | % | | 444.8 |
| 417.2 |
| 7 | % |
| (Excludes locomotive gross ton-miles) | |
| |
| |
|
|
|
SAFETY AND SERVICE
CSX remains an industry leader in employee safety. The FRA reportable personal injury frequency index improved 8 percent year over year to 0.81, and the reported FRA train accident frequency rate improved 15 percent to 1.8. Safety programs continue to focus on avoiding catastrophic events and minimizing the impact on the communities we serve.
Despite significant volume growth, CSX’s operations were stable and the company expects service to gradually improve to superior levels with the addition of strategic infrastructure investments, locomotives and operating employees coming online. While on-time originations decreased year over year to 52 percent and on-time arrivals declined to 43 percent, both were consistent with third quarter levels. Year over year, average train velocity declined to 20.4 miles per hour, and dwell worsened to 26.3 hours although both remain stable since last quarter.
|
| | | | | | | | | | | | | | |
| | | Quarters Ended | | Years Ended |
| | | Dec. 26, 2014 | Dec. 27, 2013 | Improvement / (Deterioration) | | Dec. 26, 2014 | Dec. 27, 2013 | Improvement / (Deterioration) |
| Safety and Service Measurements | | | | | | | | |
| FRA Personal Injury Frequency Index | | 0.81 |
| 0.88 |
| 8 | % | | 0.95 |
| 0.90 |
| (6 | )% |
| (Number of FRA-reportable injuries per 200,000 man-hours) | | | |
| | | |
|
| FRA Train Accident Rate | | 1.80 |
| 2.12 |
| 15 | % | | 2.22 |
| 1.98 |
| (12 | )% |
| (Number of FRA-reportable train accidents per million train miles) | |
|
|
| |
|
|
|
| | | | | | | | | |
| On-Time Originations | | 52 | % | 85 | % | (39 | )% | | 56 | % | 89 | % | (37 | )% |
| On-Time Arrivals | | 43 | % | 76 | % | (43 | )% | | 45 | % | 81 | % | (44 | )% |
| | |
| |
| |
|
|
|
Train Velocity (Miles per hour) | | 20.4 |
| 22.9 |
| (11 | )% | | 20.1 |
| 23.2 |
| (13 | )% |
Dwell (Hours) | | 26.3 |
| 23.0 |
| (14 | )% | | 26.3 |
| 22.2 |
| (18 | )% |
| | | | | | | | | |
Cars-On-Line (a) | | 204,766 |
| 181,927 |
| (13 | )% | | 203,699 |
| 182,266 |
| (12 | )% |
| | | | | | | | | |