CSX Corporation Announces All-Time Record
Quarterly Financial Results
Highlights:
| |
| • | Quarterly operating income more than $1 billion for the first time in company history |
| |
| • | All-time record operating ratio of 66.8 percent |
| |
| • | Improving service measurements and industry-leading safety results |
JACKSONVILLE, Fla. - July 14, 2015 - CSX Corporation (NYSE: CSX) announced financial results for the second quarter of 2015, including net earnings of $553 million, or an all-time record $0.56 per share, an increase from $529 million, or $0.53 per share, in the second quarter of 2014.
Revenue declined 6 percent, as pricing gains were more than offset by the impact of lower fuel recovery, a 1 percent volume decline and changing business mix. At the same time, continued low fuel prices and savings from efficiency initiatives reduced expenses by 9 percent. As a result, CSX delivered record operating income of more than $1 billion for the quarter and a record-low operating ratio of 66.8 percent.
“While we saw challenges in a number of markets, CSX employees delivered an even safer, more reliable and more differentiated service product this quarter,” said Michael J. Ward, chairman and chief executive officer. “We expect the momentum in network performance we saw in the second quarter to accelerate, continuing to create value for our customers and shareholders.”
CSX expects to deliver mid-to-high single digit earnings per share growth for 2015, although the upper end of that range has become more challenging given the current energy environment. With low natural gas prices and high inventory levels continuing to reduce utility coal demand, CSX now expects domestic coal volume to decline by approximately 10 percent for 2015 and the outlook for export coal volume remains approximately 30 million tons for the year. The company also expects meaningful margin expansion as it progresses towards a full-year operating ratio in the mid-60s longer term.
CSX executives will conduct a quarterly earnings conference call with the investment community on July 15, 2015, from 8:30 a.m. to 9:30 a.m. Eastern time. Investors, media and the public may listen to the conference call by dialing 1-888-EARN-CSX (888-327-6279) and asking for the CSX earnings call. Callers outside the U.S., dial 1-773-756-0199. Participants should dial in 10 minutes prior to the call. In conjunction with the call, a live webcast will be accessible and presentation materials will be posted on the company's website at http://investors.csx.com. Following the earnings call, an internet replay of the presentation will be archived on the company website.
This earnings announcement, as well as additional detailed financial information, is contained in the CSX Quarterly Financial Report available through the company’s website at http://investors.csx.com and on Form 8-K with the Securities and Exchange Commission.
|
| | | |
| Table of Contents | The accompanying unaudited | CSX CORPORATION | CONTACTS: |
| | financial information should be | 500 Water Street, C900 | |
| read in conjunction with the | Jacksonville, FL 32202 | INVESTOR RELATIONS |
| Company’s most recent | www.csx.com | David Baggs |
| Annual Report on Form 10-K, | | (904) 359-4812 |
| | Quarterly Reports on Form | | MEDIA |
| | 10-Q, and any Current | | Melanie Cost |
| | Reports on Form 8-K. | | (904) 359-1702 |
About CSX and its Disclosures
CSX, based in Jacksonville, Florida, is a premier transportation company. It provides rail, intermodal and rail-to-truck transload services and solutions to customers across a broad array of markets, including energy, industrial, construction, agricultural, and consumer products. For nearly 190 years, CSX has played a critical role in the nation's economic expansion and industrial development. Its network connects every major metropolitan area in the eastern United States, where nearly two-thirds of the nation's population resides. It also links more than 240 short-line railroads and more than 70 ocean, river and lake ports with major population centers and farming towns alike.
This announcement, as well as additional financial information, is available on the company's website at http://investors.csx.com. CSX also uses social media channels to communicate information about the company. Although social media channels are not intended to be the primary method of disclosure for material information, it is possible that certain information CSX posts on social media could be deemed to be material.
Therefore, we encourage investors, the media, and others interested in the company to review the information we post on Twitter (http://twitter.com/CSX) and on Slideshare (http://www.slideshare.net/HowTomorrowMoves). The social media channels used by CSX may be updated from time to time.
More information about CSX Corporation and its subsidiaries is available at www.csx.com and on Facebook (http://www.facebook.com/OfficialCSX).
Forward-looking Statements
This information and other statements by the company may contain forward-looking statements within the meaning of the Private Securities Litigation Reform Act with respect to, among other items: projections and estimates of earnings, revenues, margins, volumes, rates, cost-savings, expenses, taxes, liquidity, capital expenditures, dividends, share repurchases or other financial items, statements of management's plans, strategies and objectives for future operations, and management's expectations as to future performance and operations and the time by which objectives will be achieved, statements concerning proposed new services, and statements regarding future economic, industry or market conditions or performance. Forward-looking statements are typically identified by words or phrases such as “will,” “should,” “believe,” “expect,” “anticipate,” “project,” “estimate,” “preliminary” and similar expressions. Forward-looking statements speak only as of the date they are made, and the company undertakes no obligation to update or revise any forward-looking statement. If the company updates any forward-looking statement, no inference should be drawn that the company will make additional updates with respect to that statement or any other forward-looking statements.
Forward-looking statements are subject to a number of risks and uncertainties, and actual performance or results could differ materially from that anticipated by any forward-looking statements. Factors that may cause actual results to differ materially from those contemplated by any forward- looking statements include, among others; (i) the company's success in implementing its financial and operational initiatives; (ii) changes in domestic or international economic, political or business conditions, including those affecting the transportation industry (such as the impact of industry competition, conditions, performance and consolidation); (iii) legislative or regulatory changes; (iv) the inherent business risks associated with safety and security; (v) the outcome of claims and litigation involving or affecting the company; (vi) natural events such as severe weather conditions or pandemic health crises; and (vii) the inherent uncertainty associated with projecting economic and business conditions.
Other important assumptions and factors that could cause actual results to differ materially from those in the forward-looking statements are specified in the company's SEC reports, accessible on the SEC's website at www.sec.gov and the company's website at www.csx.com.
CONSOLIDATED INCOME STATEMENTS (Unaudited)
(Dollars in millions, except per share amounts)
|
| | | | | | | | | | | | | | | | | | | | | | | |
| | Quarters Ended | | Six Months Ended |
| | Jun. 26, 2015 | Jun. 27, 2014 | $ Change | % Change | | Jun. 26, 2015 | Jun. 27, 2014 | $ Change | % Change |
| | | | | | | | | | |
| Revenue | $ | 3,064 |
| $ | 3,244 |
| $ | (180 | ) | (6 | )% | | $ | 6,091 |
| $ | 6,256 |
| $ | (165 | ) | (3 | )% |
| Expense | | | | | | | | | |
| Labor and Fringe | 825 |
| 809 |
| (16 | ) | (2 | ) | | 1,704 |
| 1,623 |
| (81 | ) | (5 | ) |
| Materials, Supplies and Other | 559 |
| 621 |
| 62 |
| 10 |
| | 1,186 |
| 1,250 |
| 64 |
| 5 |
|
| Fuel | 263 |
| 416 |
| 153 |
| 37 |
| | 533 |
| 862 |
| 329 |
| 38 |
|
| Depreciation | 299 |
| 287 |
| (12 | ) | (4 | ) | | 594 |
| 570 |
| (24 | ) | (4 | ) |
| Equipment and Other Rents | 101 |
| 114 |
| 13 |
| 11 |
| | 214 |
| 215 |
| 1 |
| — |
|
| Total Expense | 2,047 |
| 2,247 |
| 200 |
| 9 |
| | 4,231 |
| 4,520 |
| 289 |
| 6 |
|
| | | | | | | | | | |
| Operating Income | 1,017 |
| 997 |
| 20 |
| 2 |
| | 1,860 |
| 1,736 |
| 124 |
| 7 |
|
| | | | | | | | | | |
| Interest Expense | (134 | ) | (135 | ) | 1 |
| 1 |
| | (268 | ) | (275 | ) | 7 |
| 3 |
|
Other Income (Expense) - Net (a) | 4 |
| (12 | ) | 16 |
| 133 |
| | 6 |
| (5 | ) | 11 |
| 220 |
|
| Earnings Before Income Taxes | 887 |
| 850 |
| 37 |
| 4 |
| | 1,598 |
| 1,456 |
| 142 |
| 10 |
|
| | | | | | | | | | |
| Income Tax Expense | (334 | ) | (321 | ) | (13 | ) | (4 | ) | | (603 | ) | (529 | ) | (74 | ) | (14 | ) |
| Net Earnings | $ | 553 |
| $ | 529 |
| $ | 24 |
| 5 | % | | $ | 995 |
| $ | 927 |
| $ | 68 |
| 7 | % |
| | | | | | | | | | |
| Operating Ratio | 66.8 | % | 69.3 | % | | | | 69.5 | % | 72.3 | % | | |
| | | | | | | | | | |
| Per Common Share | | | | | | | | | |
| Net Earnings Per Share, Assuming Dilution | $ | 0.56 |
| $ | 0.53 |
| $ | 0.03 |
| 6 | % | | $ | 1.00 |
| $ | 0.92 |
| $ | 0.08 |
| 9 | % |
| | | | | | | | | | |
Average Shares Outstanding, Assuming Dilution (millions) | 989 |
| 1,003 |
| | | | 990 |
| 1,006 |
| | |
| | | | | | | | | | |
| Cash Dividends Paid Per Common Share | $ | 0.18 |
| $ | 0.16 |
| | | | $ | 0.34 |
| $ | 0.31 |
| | |
| | | | | | | | | | |
| | | | | | | | | | |
CONDENSED CONSOLIDATED BALANCE SHEETS
(Dollars in millions)
|
| | | | | | |
| | (Unaudited) | |
| | Jun. 26, 2015 | Dec. 26, 2014 |
| ASSETS |
| | | |
| Cash and Cash Equivalents | $ | 438 |
| $ | 669 |
|
| Short-term Investments | 680 |
| 292 |
|
| Other Current Assets | 1,551 |
| 1,611 |
|
| Properties - Net | 29,250 |
| 28,584 |
|
| Investment in Affiliates and Other Companies | 1,366 |
| 1,356 |
|
| Other Long-term Assets | 492 |
| 541 |
|
| Total Assets | $ | 33,777 |
| $ | 33,053 |
|
| | | |
| | | |
| LIABILITIES AND SHAREHOLDERS' EQUITY |
| | | |
| Current Maturities of Long-term Debt | $ | 18 |
| $ | 228 |
|
| Other Current Liabilities | 1,760 |
| 1,879 |
|
| Long-term Debt | 10,107 |
| 9,514 |
|
| Deferred Income Taxes | 8,897 |
| 8,858 |
|
| Other Long-term Liabilities | 1,418 |
| 1,398 |
|
| Total Liabilities | 22,200 |
| 21,877 |
|
| | | |
| Total Shareholders' Equity | 11,577 |
| 11,176 |
|
| Total Liabilities and Shareholders' Equity | $ | 33,777 |
| $ | 33,053 |
|
CONDENSED CONSOLIDATED CASH FLOW STATEMENTS (Unaudited)
(Dollars in millions)
|
| | | | | | |
| | Six Months Ended |
| | Jun. 26, 2015 | Jun. 27, 2014 |
| OPERATING ACTIVITIES | | |
| Net Earnings | $ | 995 |
| $ | 927 |
|
| Depreciation | 594 |
| 570 |
|
| Deferred Income Taxes | 33 |
| 86 |
|
| Gains on Property Dispositions | (19 | ) | (4 | ) |
| Other Operating Activities - Net | (21 | ) | (134 | ) |
| Net Cash Provided by Operating Activities | 1,582 |
| 1,445 |
|
| | | |
| INVESTING ACTIVITIES | | |
| Property Additions | (1,288 | ) | (956 | ) |
| Purchase of Short-term Investments | (775 | ) | (360 | ) |
| Proceeds from Sales of Short-term Investments | 390 |
| 646 |
|
| Other Investing Activities | 99 |
| 20 |
|
| Net Cash Used in Investing Activities | (1,574 | ) | (650 | ) |
| | | |
| FINANCING ACTIVITIES | | |
| Long-term Debt Issued | 600 |
| — |
|
| Long-term Debt Repaid | (210 | ) | (244 | ) |
| Dividends Paid | (336 | ) | (311 | ) |
Shares Repurchased (b) | (284 | ) | (257 | ) |
| Other Financing Activities - Net | (9 | ) | (2 | ) |
| Net Cash Used in Financing Activities | (239 | ) | (814 | ) |
| | | |
| Net Decrease in Cash and Cash Equivalents | (231 | ) | (19 | ) |
| | | |
| CASH AND CASH EQUIVALENTS | | |
| Cash and Cash Equivalents at Beginning of Period | 669 |
| 592 |
|
| Cash and Cash Equivalents at End of Period | $ | 438 |
| $ | 573 |
|
NOTES TO CONSOLIDATED FINANCIAL STATEMENTS (Unaudited)
Income Statement
| |
| a) | Other Income (Expense) - Net: During the second quarter, other income increased $16 million primarily as a result of a prior year environmental cleanup cost related to non-operating activities that did not repeat in the current quarter. |
Cash Flow Statement
| |
| b) | Shares repurchased: During the second quarter and six months ended of 2015 and 2014, the Company repurchased the following number of shares: |
|
| | | | | | | | | | | | | |
| | Quarters Ended | | Six Months Ended |
| | Jun. 26, 2015 | Jun. 27, 2014 | | Jun. 26, 2015 | Jun. 27, 2014 |
Shares Repurchased (Millions) | 4 |
| 4 |
| | 8 |
| 9 |
|
Cost of Shares (Dollars in millions) | $ | 157 |
| $ | 130 |
| | $ | 284 |
| $ | 257 |
|
|
| | | | | | | | | | | | | | | | | | | | | | | | | | | |
VOLUME AND REVENUE (Unaudited) |
| Volume (Thousands of units); Revenue (Dollars in millions); Revenue Per Unit (Dollars) |
| | |
| Quarters Ended June 26, 2015 and June 27, 2014 |
| | | | | | | | | |
| | Volume | | | Revenue | | | Revenue Per Unit | |
| | 2015 | 2014 | % Change | | 2015 | 2014 | % Change | | 2015 | 2014 | % Change |
| Agricultural | | | | | | | | | | | | | | |
| Agricultural Products | 101 |
| 105 |
| (4 | )% | | | $ | 266 |
| $ | 285 |
| (7 | )% | | | $ | 2,634 |
| $ | 2,714 |
| (3 | )% | |
| Phosphates and Fertilizers | 78 |
| 86 |
| (9 | ) | | | 122 |
| 143 |
| (15 | ) | | | 1,564 |
| 1,663 |
| (6 | ) | |
| Food and Consumer | 24 |
| 25 |
| (4 | ) | | | 68 |
| 70 |
| (3 | ) | | | 2,833 |
| 2,800 |
| 1 |
| |
| Industrial | | | | | | | | | | | | | | |
| Chemicals | 158 |
| 157 |
| 1 |
| | | 530 |
| 556 |
| (5 | ) | | | 3,354 |
| 3,541 |
| (5 | ) | |
| Automotive | 120 |
| 114 |
| 5 |
| | | 313 |
| 321 |
| (2 | ) | | | 2,608 |
| 2,816 |
| (7 | ) | |
| Metals | 61 |
| 74 |
| (18 | ) | | | 156 |
| 184 |
| (15 | ) | | | 2,557 |
| 2,486 |
| 3 |
| |
| Housing and Construction | | | | | | | | | | | | | | |
| Forest Products | 74 |
| 79 |
| (6 | ) | | | 202 |
| 210 |
| (4 | ) | | | 2,730 |
| 2,658 |
| 3 |
| |
| Minerals | 84 |
| 80 |
| 5 |
| | | 123 |
| 123 |
| — |
| | | 1,464 |
| 1,538 |
| (5 | ) | |
| Waste and Equipment | 41 |
| 40 |
| 3 |
| | | 78 |
| 79 |
| (1 | ) | | | 1,902 |
| 1,975 |
| (4 | ) | |
| Total Merchandise | 741 |
| 760 |
| (3 | ) | | | 1,858 |
| 1,971 |
| (6 | ) | | | 2,507 |
| 2,593 |
| (3 | ) | |
| | | | | | | | | | | | | | | |
| Coal | 295 |
| 330 |
| (11 | ) | | | 630 |
| 744 |
| (15 | ) | | | 2,136 |
| 2,255 |
| (5 | ) | |
| | | | | | | | | | | | | | | |
| Intermodal | 723 |
| 691 |
| 5 |
| | | 450 |
| 449 |
| — |
| | | 622 |
| 650 |
| (4 | ) | |
| | | | | | | | | | | | | | | |
| Other | — |
| — |
| — |
| | | 126 |
| 80 |
| 58 |
| | | — |
| — |
| — |
| |
| | | | | | | | | | | | | | | |
| Total | 1,759 |
| 1,781 |
| (1 | )% | | | $ | 3,064 |
| $ | 3,244 |
| (6 | )% | | | $ | 1,742 |
| $ | 1,821 |
| (4 | )% | |
| | | | | | | | | | | | | | | |
| Six Months Ended June 26, 2015 and June 27, 2014 |
| | | | | | | | | |
| | Volume | | | Revenue | | | Revenue Per Unit | |
| | 2015 | 2014 | % Change | | 2015 | 2014 | % Change | | 2015 | 2014 | % Change |
| Agricultural | | | | | | | | | | | | | | |
| Agricultural Products | 210 |
| 211 |
| — | % | | | $ | 557 |
| $ | 569 |
| (2 | )% | | | $ | 2,652 |
| $ | 2,697 |
| (2 | )% | |
| Phosphates and Fertilizers | 156 |
| 169 |
| (8 | ) | | | 258 |
| 277 |
| (7 | ) | | | 1,654 |
| 1,639 |
| 1 |
| |
| Food and Consumer | 47 |
| 48 |
| (2 | ) | | | 132 |
| 135 |
| (2 | ) | | | 2,809 |
| 2,813 |
| — |
| |
| Industrial | | | | | | | | | | | | | | |
| Chemicals | 313 |
| 303 |
| 3 |
| | | 1,064 |
| 1,072 |
| (1 | ) | | | 3,399 |
| 3,538 |
| (4 | ) | |
| Automotive | 221 |
| 212 |
| 4 |
| | | 580 |
| 596 |
| (3 | ) | | | 2,624 |
| 2,811 |
| (7 | ) | |
| Metals | 122 |
| 139 |
| (12 | ) | | | 310 |
| 349 |
| (11 | ) | | | 2,541 |
| 2,511 |
| 1 |
| |
| Housing and Construction | | | | | | | | | | | | | | |
| Forest Products | 147 |
| 153 |
| (4 | ) | | | 400 |
| 404 |
| (1 | ) | | | 2,721 |
| 2,641 |
| 3 |
| |
| Minerals | 144 |
| 134 |
| 7 |
| | | 226 |
| 218 |
| 4 |
| | | 1,569 |
| 1,627 |
| (4 | ) | |
| Waste and Equipment | 72 |
| 71 |
| 1 |
| | | 140 |
| 138 |
| 1 |
| | | 1,944 |
| 1,944 |
| — |
| |
| Total Merchandise | 1,432 |
| 1,440 |
| (1 | ) | | | 3,667 |
| 3,758 |
| (2 | ) | | | 2,561 |
| 2,610 |
| (2 | ) | |
| | | | | | | | | | | | | | | |
| Coal | 584 |
| 623 |
| (6 | ) | | | 1,268 |
| 1,406 |
| (10 | ) | | | 2,171 |
| 2,257 |
| (4 | ) | |
| | | | | | | | | | | | | | | |
| Intermodal | 1,378 |
| 1,338 |
| 3 |
| | | 865 |
| 870 |
| (1 | ) | | | 628 |
| 650 |
| (3 | ) | |
| | | | | | | | | | | | | | | |
| Other | — |
| — |
| — |
| | | 291 |
| 222 |
| 31 |
| | | — |
| — |
| — |
| |
| | | | | | | | | | | | | | | |
| Total | 3,394 |
| 3,401 |
| — | % | | | $ | 6,091 |
| $ | 6,256 |
| (3 | )% | | | $ | 1,795 |
| $ | 1,839 |
| (2 | )% | |
VOLUME AND REVENUE
Revenue declined $180 million to $3.1 billion from the prior year's second quarter reflecting lower fuel surcharge recoveries of $183 million. Excluding this impact, revenue was relatively flat as continued pricing gains were offset with a slight volume decline and negative portfolio mix.
|
| | | | | |
Same Store Sales Pricing Year-Over-Year Change for the Quarters Ended |
| | Mar. 27, 2015 | Jun. 26, 2015 | |
All-In (a) | 2.0 | % | 3.5 | % | |
| Merchandise and Intermodal | 3.4 | % | 3.9 | % | |
| | | | |
| (a) First quarter 2015 all-in same store sales pricing was corrected to 2.0% from 1.6% due to a calculation error. | |
Same store sales is defined as shipments with the same customer, commodity and car type, and the same origin and destination.
Revenue per unit was down 4% primarily due to lower fuel recovery. Excluding fuel, pricing gains were offset by negative mix. Same store sales increased with stronger pricing across all major markets. Coal pricing this quarter reflects positive domestic results, including a lower volume base on fixed/variable contracts. This was partially offset by export coal pricing, which is lower on a full quarter basis than last year's levels.
MERCHANDISE
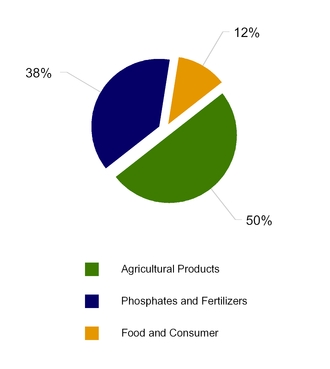
Agricultural Sector
|
| | | | | | | | | | | | | | | | | | | | | | | | | | |
| Volume (Thousands of units); Revenue (Dollars in millions); Revenue Per Unit (Dollars) |
| Volume | | | Revenue | | | Revenue Per Unit | |
| 2015 | 2014 | % Change | | 2015 | 2014 | % Change | | 2015 | 2014 | % Change |
| 203 |
| 216 |
| (6 | ) | | | $ | 456 |
| $ | 498 |
| (8 | ) | | | $ | 2,246 |
| $ | 2,306 |
| (3 | ) | |
Agricultural Products - Volume decline was driven by decreased ethanol shipments due to over-supply in the eastern ethanol markets. Declines were partially offset by strength in the feed grain market from the continued effects of the prior strong harvest.
Phosphates and Fertilizers - Volume is down reflecting continued weak international demand, partially due to the strong dollar, and weak domestic demand, due to lower commodity prices. This coupled with sufficient inventories held domestic production low and reduced shipments.
Food and Consumer - Volume is down as a result of weakness in the canned goods market reflecting changing consumer preferences. In addition, fresh food shipments declined due to drought conditions negatively impacting the West Coast crop.
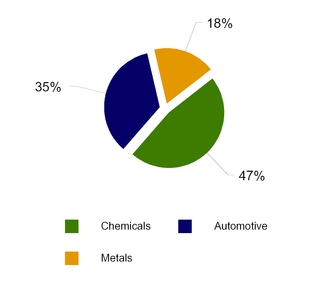
Industrial Sector
|
| | | | | | | | | | | | | | | | | | | | | | | | | | |
| Volume (Thousands of units); Revenue (Dollars in millions); Revenue Per Unit (Dollars) |
| Volume | | | Revenue | | | Revenue Per Unit | |
| 2015 | 2014 | % Change | | 2015 | 2014 | % Change | | 2015 | 2014 | % Change |
| 339 |
| 345 |
| (2 | ) | | | $ | 999 |
| $ | 1,061 |
| (6 | ) | | | $ | 2,947 |
| $ | 3,075 |
| (4 | ) | |
Chemicals - Volume increased slightly due to energy-related markets, where gains in LPG and modest crude oil growth were mostly offset by frac sand declines, reflecting reduced drilling activity for natural gas this year.
Automotive - Finished vehicle volume grew as North American light vehicle production increased.
Metals - Volume declined due to a strong U.S. dollar, which encouraged higher imports, and lower domestic demand predominantly within the energy sector.
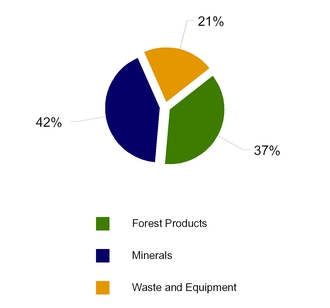
Housing and Construction Sector
|
| | | | | | | | | | | | | | | | | | | | | | | | | |
| Volume (Thousands of units); Revenue (Dollars in millions); Revenue Per Unit (Dollars) |
| Volume | | | Revenue | | | Revenue Per Unit | |
| 2015 | 2014 | % Change | | 2015 | 2014 | % Change | | 2015 | 2014 | % Change |
| 199 |
| 199 |
| — | | | $ | 403 |
| $ | 412 |
| (2 | ) | | | $ | 2,025 |
| $ | 2,070 |
| (2 | ) | |
Forest Products - Volume declines driven by reduction in demand for paper products, particularly printing paper due to electronic substitution, and high inventories of building products available to satisfy new construction.
Minerals - Growth in aggregates, which includes crushed stone, sand, and gravel, resulted from more infrastructure development projects in CSX’s territory.
Waste and Equipment - Volume increased as a result of new rail consumer waste business and increased shipments of newly manufactured railcars.
COAL
|
| | | | | | | | | | | | | | | | | | | | | | | | | | |
| Volume (Thousands of units); Revenue (Dollars in millions); Revenue Per Unit (Dollars) |
| Volume | | | Revenue | | | Revenue Per Unit | |
| 2015 | 2014 | % Change | | 2015 | 2014 | % Change | | 2015 | 2014 | % Change |
| 295 |
| 330 |
| (11 | ) | | | $ | 630 |
| $ | 744 |
| (15 | ) | | | $ | 2,136 |
| $ | 2,255 |
| (5 | ) | |
| | | | | | | | | | | | | | |
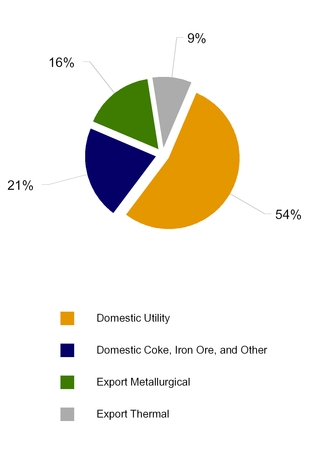
Domestic Utility Coal - Volume declined primarily due to low natural gas prices favoring increased natural gas power generation and higher overall stockpiles.
Domestic Coke, Iron Ore and Other - Volume increased as a result of iron ore shipments associated with a new customer facility and continued stronger river coal shipments.
Export Coal - Metallurgical and thermal coal volume was down as global market conditions remained weak due to global oversupply and the strength of the U.S. dollar.
|
| | | | | | | | | | | | | | |
| | | Quarters Ended | | Six Months Ended |
| | | Jun. 26, 2015 | Jun. 27, 2014 | % Change | | Jun. 26, 2015 | Jun. 27, 2014 | % Change |
| (Millions of Tons) | | | | | | | | |
| Domestic | | | | | | | | |
| Utility | | 18.2 |
| 21.0 |
| (13 | )% | | 35.8 |
| 38.7 |
| (7 | )% |
| Coke, Iron Ore and Other | | 7.1 |
| 6.2 |
| 15 |
| | 12.4 |
| 11.0 |
| 13 |
|
| Total Domestic | | 25.3 |
| 27.2 |
| (7 | ) | | 48.2 |
| 49.7 |
| (3 | ) |
| Export | | | | | | | | |
| Metallurgical | | 5.2 |
| 5.8 |
| (10 | ) | | 11.0 |
| 12.0 |
| (8 | ) |
| Thermal | | 3.2 |
| 4.5 |
| (29 | ) | | 7.2 |
| 8.8 |
| (18 | ) |
| Total Export | | 8.4 |
| 10.3 |
| (18 | ) | | 18.2 |
| 20.8 |
| (13 | ) |
| | | | | | | | | |
| Total Coal | | 33.7 |
| 37.5 |
| (10 | )% | | 66.4 |
| 70.5 |
| (6 | )% |
INTERMODAL
|
| | | | | | | | | | | | | | | | | | | | | | | | |
| Volume (Thousands of units); Revenue (Dollars in millions); Revenue Per Unit (Dollars) |
| Volume | | | Revenue | | | Revenue Per Unit | |
| 2015 | 2014 | % Change | | 2015 | 2014 | % Change | | 2015 | 2014 | % Change |
| 723 |
| 691 |
| 5 | | | $ | 450 |
| $ | 449 |
| — | | | $ | 622 |
| $ | 650 |
| (4 | ) | |
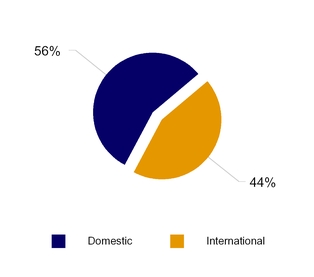
Domestic - Domestic volume increased 9%, driven by continued success with CSX’s highway-to-rail (H2R) conversion program, growth with existing customers and new service offerings.
International - International volume declined 1% as the continued recovery from West Coast port disruptions was more than offset by competitive losses.
OTHER REVENUE
Other revenue increased $46 million versus the prior year primarily due to changes in the required in-transit reserve. Prior year revenue was negatively impacted by the in-transit reserve by $21 million, while the current year revenue was positively impacted by $19 million as a result of improved network performance. In addition, incidental revenue increased by $13 million, partially offset by a decline of $7 million in revenue recognized from customers who did not meet minimum contractual volumes.
FUEL SURCHARGE
Fuel surcharge revenue is included in the individual markets detailed within the volume and revenue explanations above. Fuel lag is the difference between highway diesel prices in the quarter and the prices used for fuel surcharge, which are generally on a two month lag.
|
| | | | | | | | | | | | | | | | | | | |
| | Quarters Ended | | Six Months Ended |
| (Dollars in millions) | Jun. 26, 2015 | Jun. 27, 2014 | $ Change | | Jun. 26, 2015 | Jun. 27, 2014 | $ Change |
| Fuel Surcharge Revenue | $ | 134 |
| $ | 317 |
| $ | (183 | ) | | $ | 325 |
| $ | 597 |
| $ | (272 | ) |
| Fuel Lag (Expense) Benefit | $ | (1 | ) | $ | 4 |
| $ | (5 | ) | | $ | 36 |
| $ | (5 | ) | $ | 41 |
|
EXPENSE
Expenses of $2.0 billion decreased $200 million or 9% year over year primarily driven by lower fuel costs of $153 million. Also included in the quarter were efficiency savings and lower volume-related costs. Variances are described below.
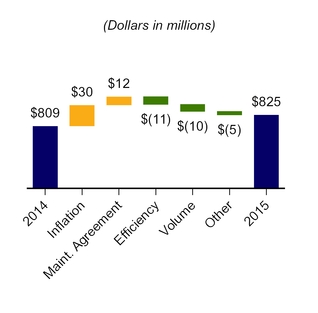
LABOR AND FRINGE
| |
| • | Inflation resulted in $30 million of additional cost driven by union and management wages partially offset by reduced health and welfare costs. |
| |
| • | Labor costs were $12 million higher due to an amended locomotive maintenance agreement in mid-2014 where CSX now provides oversight of the labor force. As a result, outside service costs shifted from materials, supplies and other to labor and fringe, but overall expense for this change is neutral for the quarter. |
| |
| • | Efficiency savings of $11 million were primarily due to reduced management headcount as a result of the Q4 2014 restructuring initiative and reduced overtime across operating functions. |
| |
| • | Volume-related costs were $10 million lower. |
| |
| • | Other costs decreased $5 million primarily related to lower incentive compensation. |
|
| | | | | | | | |
EMPLOYEE COUNTS (Estimated) |
| | | | | | |
| | 2015 | | 2014 | | Change |
| April | 32,286 |
| | 31,334 |
| | 952 |
|
| May | 32,124 |
| | 31,368 |
| | 756 |
|
| June | 31,745 |
| | 31,437 |
| | 308 |
|
| Average | 32,052 |
| | 31,380 |
| | 672 |
|
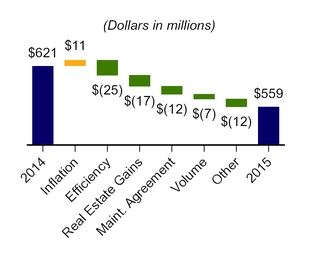
MATERIALS, SUPPLIES AND OTHER
| |
| • | Inflation resulted in $11 million of additional cost. |
| |
| • | Efficiency savings of $25 million were driven by general and administrative initiatives as well as a reduction in operating support costs. |
| |
| • | A gain of $17 million was recognized on the sale of an operating rail corridor. |
| |
| • | The amended locomotive maintenance agreement shifted $12 million to labor and fringe as referenced above. |
| |
| • | Volume-related costs were $7 million lower. |
| |
| • | Other costs decreased $12 million primarily due to prior year train accident costs that did not repeat in the current period. |
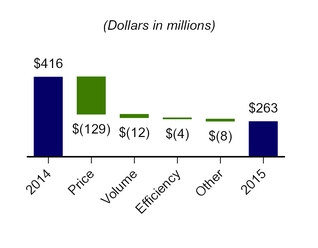
FUEL
| |
| • | Locomotive fuel price decreased 35% and reduced expense by $129 million. |
| |
| • | Volume-related costs were $12 million lower. |
| |
| • | Locomotive fuel reduction technology and improved processes helped drive $4 million of efficiency. |
| |
| • | Other fuel savings of $8 million were primarily due to lower non-locomotive fuel costs. |
|
| | | | | | | | | | | | | | | | | | | | |
| | | | | | | |
| | | Quarters Ended | | Six Months Ended |
| (Dollars and Gallons In Millions, Except Price per Gallon) | | Jun. 26, 2015 | Jun. 27, 2014 | Fav / (Unfav) | | Jun. 26, 2015 | Jun. 27, 2014 | Fav / (Unfav) |
Estimated Locomotive Fuel Consumption (Gallons) | | 122.1 |
| 126.7 |
| 4.6 |
| | 254.0 |
| 256.8 |
| 2.8 |
|
Price per Gallon (Dollars) | | $ | 1.99 |
| $ | 3.06 |
| $ | 1.07 |
| | $ | 1.92 |
| $ | 3.10 |
| $ | 1.18 |
|
| Total Locomotive Fuel Expense | | $ | 243 |
| $ | 388 |
| $ | 145 |
| | $ | 488 |
| $ | 796 |
| $ | 308 |
|
| Other | | 20 |
| 28 |
| 8 |
| | 45 |
| 66 |
| 21 |
|
| Total Fuel Expense | | $ | 263 |
| $ | 416 |
| $ | 153 |
| | $ | 533 |
| $ | 862 |
| $ | 329 |
|
DEPRECIATION
Depreciation expense increased $12 million due to a larger asset base.
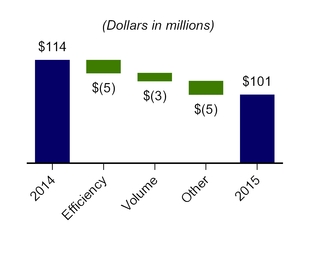
EQUIPMENT AND OTHER RENTS
| |
| • | Efficiency savings of $5 million were due to improved car cycle times. |
| |
| • | Volume-related costs were $3 million lower. |
| |
| • | Other net costs decreased $5 million. |
OPERATING STATISTICS (Estimated)
TON MILES
|
| | | | | | | | | | | | | | |
| | | Quarters Ended | | Six Months Ended |
| | | Jun. 26, 2015 | Jun. 27, 2014 | Improvement / (Deterioration) | | Jun. 26, 2015 | Jun. 27, 2014 | Improvement / (Deterioration) |
Revenue Ton-Miles (Billions) | | | | | | | | |
| Merchandise | | 36.8 |
| 38.0 |
| (3 | )% | | 72.8 |
| 73.3 |
| (1 | )% |
| Coal | | 15.8 |
| 18.0 |
| (12 | ) | | 31.9 |
| 34.3 |
| (7 | ) |
| Intermodal | | 7.4 |
| 6.9 |
| 7 |
| | 14.2 |
| 13.3 |
| 7 |
|
| Total | | 60.0 |
| 62.9 |
| (5 | )% | | 118.9 |
| 120.9 |
| (2 | )% |
| | | | | | | | | |
Gross Ton-Miles (Billions) | | | |
| | | | |
| Total Gross Ton-Miles | | 111.0 |
| 114.2 |
| (3 | )% | | 218.3 |
| 219.0 |
| — | % |
| (Excludes locomotive gross ton-miles) | |
| |
| | | | |
SAFETY AND SERVICE
CSX remains an industry leader in key safety measures. The FRA reportable personal injury frequency index improved 22 percent year over year to 0.75, and the reported FRA train accident frequency rate improved 17 percent to 1.81. These results highlight the Company’s commitment to safety and focus on avoidance of catastrophic events.
CSX’s operating performance has improved significantly in the second quarter. On-time originations increased 18 percent year over year to 66 percent, and on-time arrivals increased to 48 percent, a 14 percent increase year over year. Average train velocity was 20.3 miles per hour, a 5 percent improvement from last year. Terminal dwell was 25.0 hours, a 3 percent improvement from last year, and is continuously improving as the year progresses. The Company expects to sustain or improve this level of performance while driving continued service gains and productivity savings. Productivity gains will result from the improved fluidity and the Company’s continued focus on increasing train length.
|
| | | | | | | | | | | | | | |
| | | Quarters Ended | | Six Months Ended |
| | | Jun. 26, 2015 | Jun. 27, 2014 | Improvement / (Deterioration) | | Jun. 26, 2015 | Jun. 27, 2014 | Improvement / (Deterioration) |
| Safety and Service Measurements | | | | | | | | |
| FRA Personal Injury Frequency Index | | 0.75 |
| 0.96 |
| 22 | % | | 0.76 |
| 0.96 |
| 21 | % |
| (Number of FRA-reportable injuries per 200,000 man-hours) | | | |
| | | | |
| FRA Train Accident Rate | | 1.81 |
| 2.17 |
| 17 | % | | 1.94 |
| 2.35 |
| 17 | % |
| (Number of FRA-reportable train accidents per million train miles) | |
|
|
| | | | |
| | | | | | | | | |
| On-Time Originations | | 66 | % | 56 | % | 18 | % | | 58 | % | 59 | % | (2 | )% |
| On-Time Arrivals | | 48 | % | 42 | % | 14 | % | | 45 | % | 46 | % | (2 | )% |
| | |
| |
| | | | |
Train Velocity (Miles per hour) | | 20.3 |
| 19.3 |
| 5 | % | | 20.2 |
| 19.9 |
| 2 | % |
Dwell (Hours) | | 25.0 |
| 25.9 |
| 3 | % | | 26.3 |
| 26.3 |
| — | % |
| | | | | | | | | |
| Cars-On-Line | | 205,239 |
| 207,141 |
| 1 | % | | 207,088 |
| 202,005 |
| (3 | )% |
| | | | | | | | | |