CSX Corporation Announces Fourth-Quarter and
Full-Year 2016 Earnings
Highlights:
| |
| • | CSX generated record full-year efficiency savings of nearly $430 million in 2016 |
| |
| • | Improved service levels drove strong pricing to support reinvestment in the business |
| |
| • | For the second consecutive year, the company delivered a sub-70 operating ratio |
JACKSONVILLE, Fla. - January 17, 2017 - CSX Corporation (Nasdaq: CSX) today announced fourth quarter 2016 net earnings of $458 million, or $0.49 per share, versus $466 million, or $0.48 per share, in the same period of last year. The fourth quarter of 2016 included an operating property sale and a debt refinancing charge, both of which were $0.08 per share and offset each other in the quarter. In addition, the fourth quarter included an extra accounting week resulting from the company’s 52/53 week fiscal reporting calendar, which benefitted earnings per share by $0.03 per share.
Including the extra week, fourth quarter revenue increased 9 percent and expenses increased 2 percent. Operating income for the quarter was $1 billion, which included the $115 million gain from the property sale and the $62 million benefit from the extra week.
For the full year 2016, the industry continued to face headwinds from low global commodity prices and strength of the U.S. dollar. In this environment, CSX generated $11.1 billion in revenue as volume declined 5 percent overall with a 21 percent decline in the company’s coal business. Even with these ongoing challenges, CSX delivered earnings per share of $1.81, operating income of $3.4 billion and an operating ratio of 69.4 percent.
“In an environment where the company lost almost $470 million of coal revenue and experienced weakness across most of its markets, CSX delivered nearly $430 million of productivity savings in 2016, while improving customer service,” said Michael J. Ward, chairman and chief executive officer. “With business conditions gradually improving and the ongoing transformation into the CSX of Tomorrow, we will continue to deliver sustainable shareholder value.”
The CSX of Tomorrow strategy drives profitable growth in its merchandise and intermodal markets as the company progresses towards a mid-60s operating ratio longer-term.
|
| | | |
| Table of Contents | The accompanying unaudited | CSX CORPORATION | CONTACTS: |
| | financial information should be | 500 Water Street, C900 | |
| read in conjunction with the | Jacksonville, FL 32202 | INVESTOR RELATIONS |
| Company’s most recent | www.csx.com | David Baggs |
| Annual Report on Form 10-K, | | (904) 359-4812 |
| | Quarterly Reports on Form | | MEDIA |
| | 10-Q, and any Current | | Lauren Rueger |
| | Reports on Form 8-K. | | (904) 366-4211 |
CSX executives will conduct a quarterly earnings conference call with the investment community on January 18, 2017, from 8:30 a.m. to 9:30 a.m. Eastern time. Investors, media and the public may listen to the conference call by dialing 1-888-EARN-CSX (888-327-6279) and asking for the CSX earnings call. Callers outside the U.S., dial 1-773-756-0199. Participants should dial in 10 minutes prior to the call. In conjunction with the call, a live webcast will be accessible and presentation materials will be posted on the company's website at http://investors.csx.com. Following the earnings call, an internet replay of the presentation will be archived on the company's website.
This earnings announcement, as well as additional detailed financial information, is contained in the CSX Quarterly Financial Report available through the company’s website at http://investors.csx.com and on Form 8-K with the Securities and Exchange Commission.
About CSX and its Disclosures
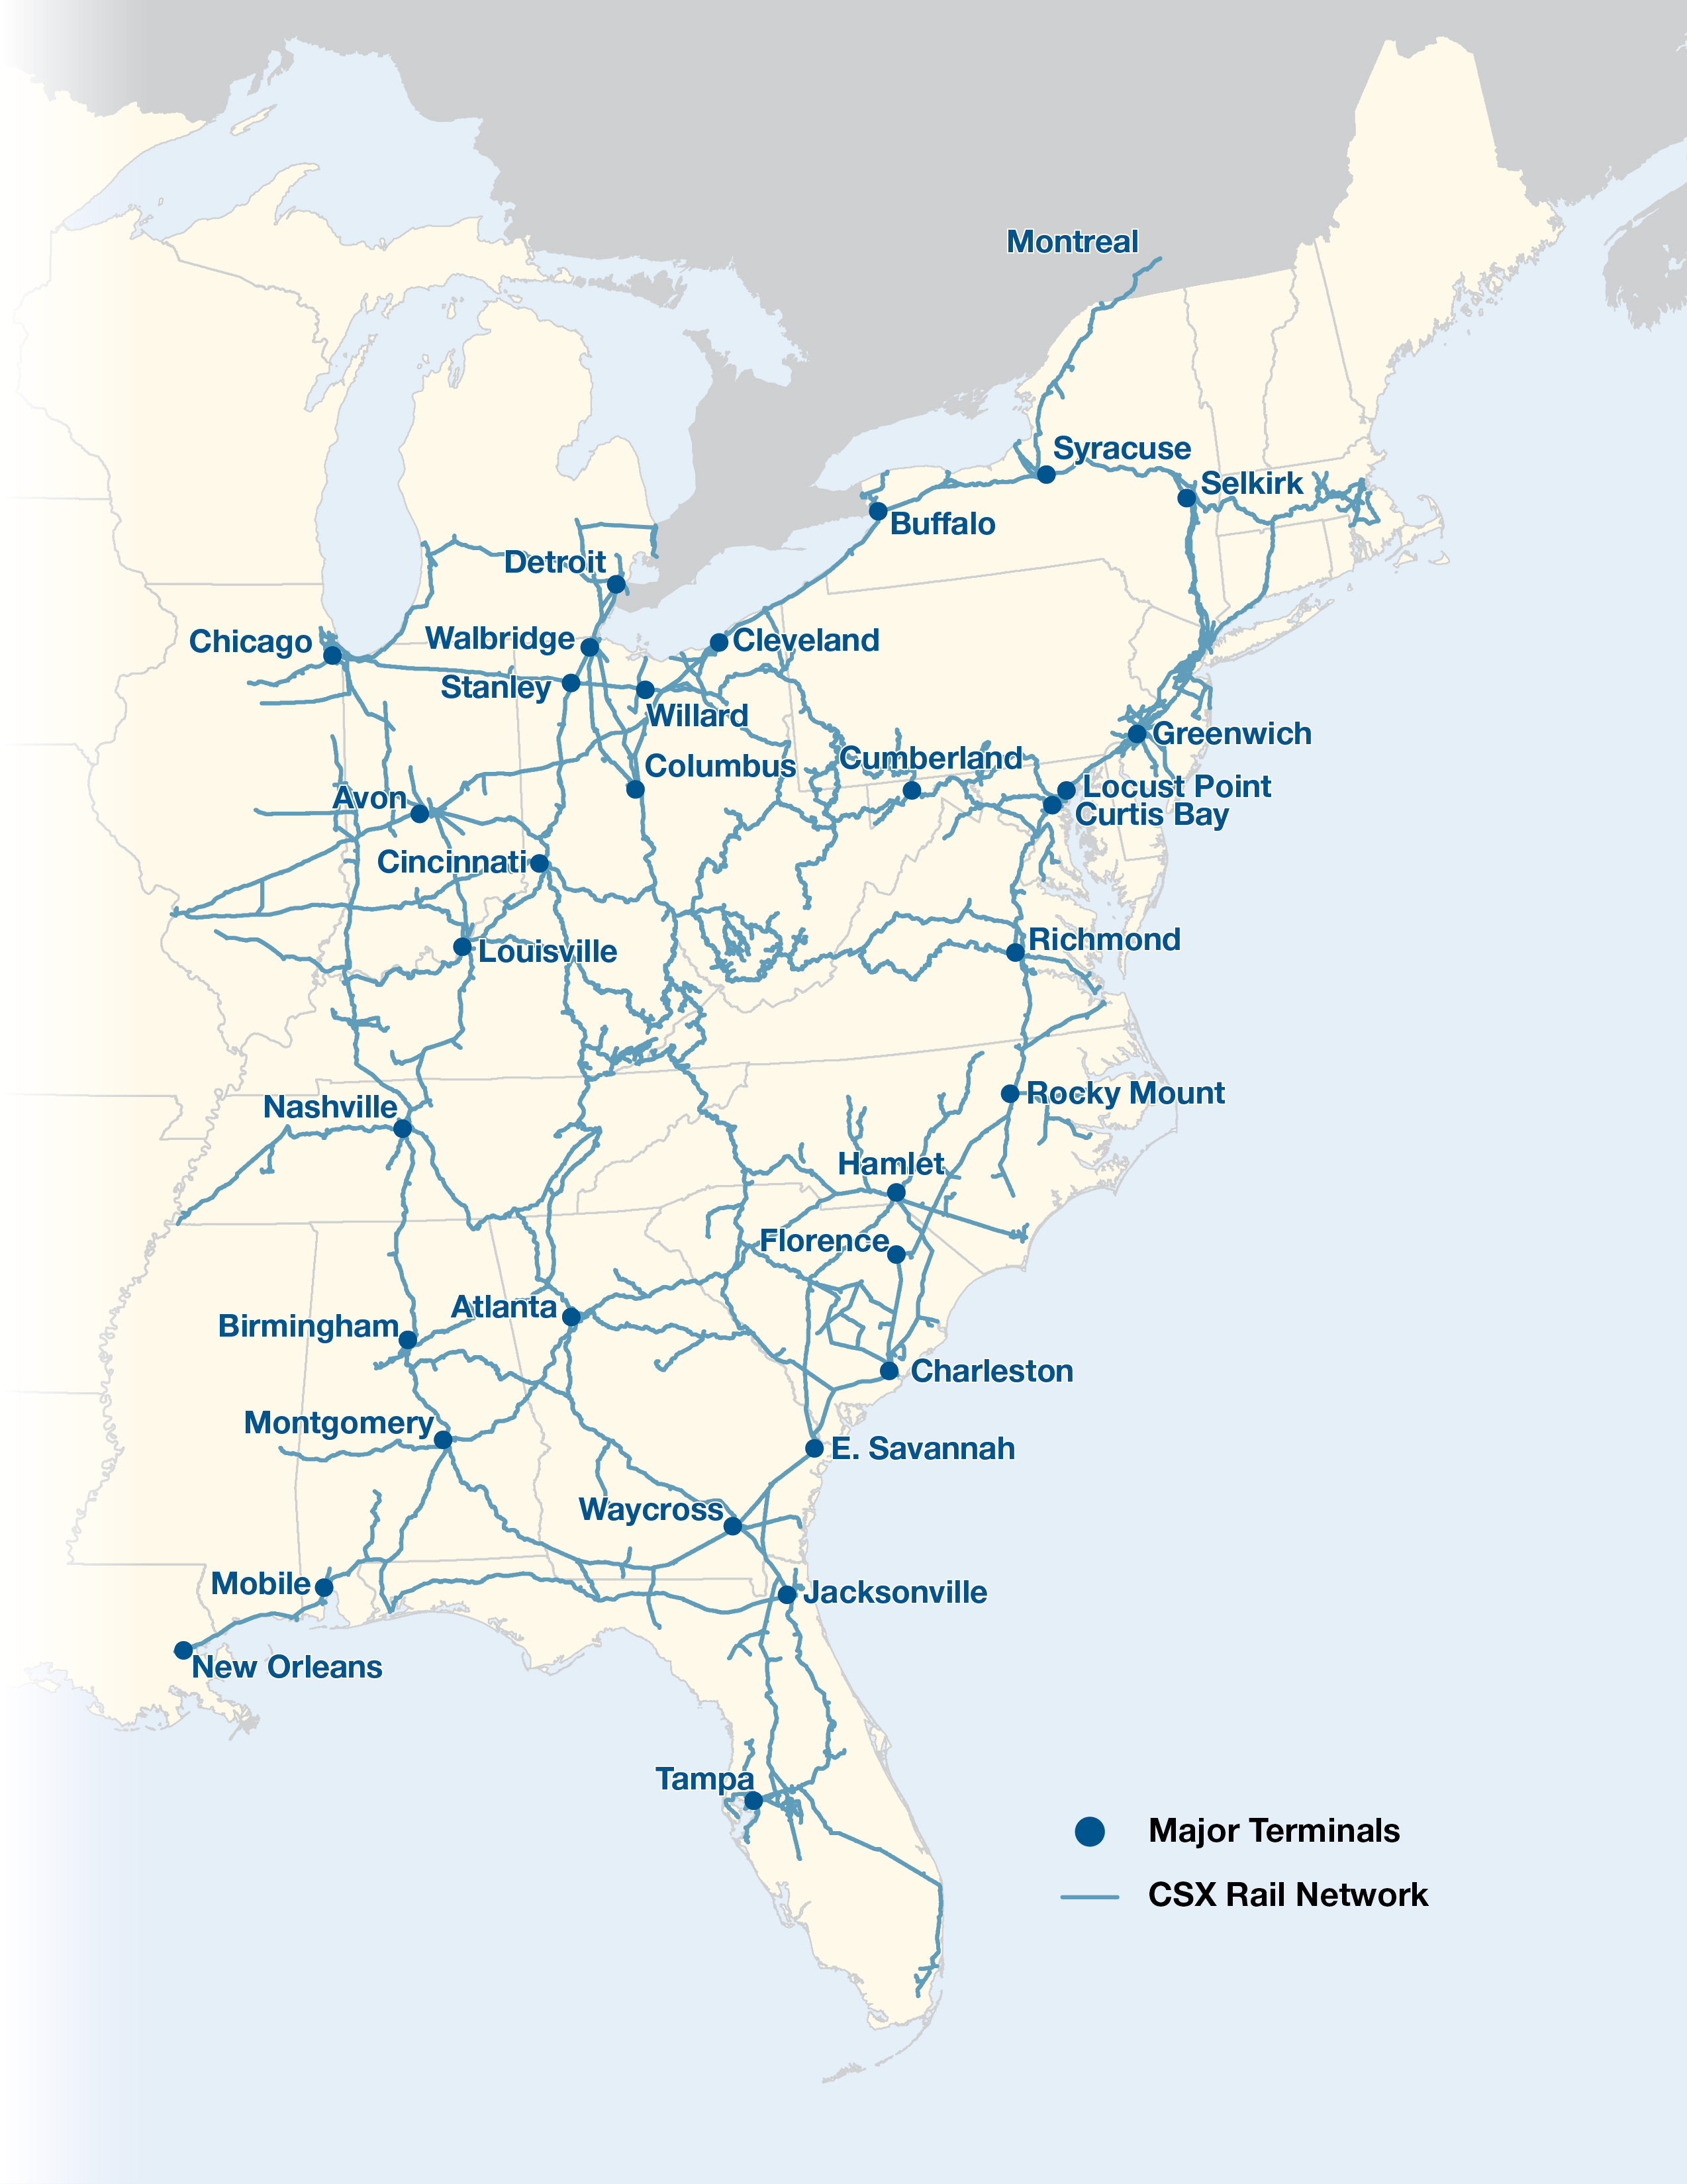
CSX, based in Jacksonville, Florida, is a premier transportation company. It provides rail, intermodal and rail-to-truck transload services and solutions to customers across a broad array of markets, including energy, industrial, construction, agricultural, and consumer products. For nearly 190 years, CSX has played a critical role in the nation's economic expansion and industrial development. Its network connects every major metropolitan area in the eastern United States, where nearly two-thirds of the nation's population resides. It also links more than 240 short-line railroads and more than 70 ocean, river and lake ports with major population centers and farming towns alike.
This announcement, as well as additional financial information, is available on the company's website at http://investors.csx.com. CSX also uses social media channels to communicate information about the company. Although social media channels are not intended to be the primary method of disclosure for material information, it is possible that certain information CSX posts on social media could be deemed to be material. Therefore, we encourage investors, the media, and others interested in the company to review the information we post on Twitter (http://twitter.com/CSX) and on SlideShare (http://www.slideshare.net/HowTomorrowMoves). The social media channels used by CSX may be updated from time to time.
More information about CSX Corporation and its subsidiaries is available at www.csx.com and on Facebook (http://www.facebook.com/OfficialCSX).
Forward-looking Statements
This information and other statements by the company may contain forward-looking statements within the meaning of the Private Securities Litigation Reform Act with respect to, among other items: projections and estimates of earnings, revenues, margins, volumes, rates, cost-savings, expenses, taxes, liquidity, capital expenditures, dividends, share repurchases or other financial items, statements of management's plans, strategies and objectives for future operations, and management's expectations as to future performance and operations and the time by which objectives will be achieved, statements concerning proposed new services, and statements regarding future economic, industry or market conditions or performance. Forward-looking statements are typically identified by words or phrases such as “will,” “should,” “believe,” “expect,” “anticipate,” “project,” “estimate,” “preliminary” and similar expressions. Forward-looking statements speak only as of the date they are made, and the company undertakes no obligation to update or revise any forward-looking statement. If the company updates any forward-looking statement, no inference should be drawn that the company will make additional updates with respect to that statement or any other forward-looking statements.
Forward-looking statements are subject to a number of risks and uncertainties, and actual performance or results could differ materially from that anticipated by any forward-looking statements. Factors that may cause actual results to differ materially from those contemplated by any forward- looking statements include, among others; (i) the company's success in implementing its financial and operational initiatives; (ii) changes in domestic or international economic, political or business conditions, including those affecting the transportation industry (such as the impact of industry competition, conditions, performance and consolidation); (iii) legislative or regulatory changes; (iv) the inherent business risks associated with safety and security; (v) the outcome of claims and litigation involving or affecting the company; (vi) natural events such as severe weather conditions or pandemic health crises; and (vii) the inherent uncertainty associated with projecting economic and business conditions.
Other important assumptions and factors that could cause actual results to differ materially from those in the forward-looking statements are specified in the company's SEC reports, accessible on the SEC's website at www.sec.gov and the company's website at www.csx.com.
CONSOLIDATED INCOME STATEMENTS (a)
(Dollars in millions, except per share amounts)
|
| | | | | | | | | | | | | | | | | | | | | | | |
| | (Unaudited) | | (Unaudited) | | | |
| | Quarters Ended | | Years Ended |
| | Dec. 30, 2016 | Dec. 25, 2015 | $ Change | % Change | | Dec. 30, 2016 | Dec. 25, 2015 | $ Change | % Change |
| | | | | | | | | | |
| Revenue | $ | 3,037 |
| $ | 2,781 |
| $ | 256 |
| 9 | % | | $ | 11,069 |
| $ | 11,811 |
| $ | (742 | ) | (6 | )% |
| Expense | | | | | | | | | |
| Labor and Fringe | 852 |
| 799 |
| (53 | ) | (7 | ) | | 3,159 |
| 3,290 |
| 131 |
| 4 |
|
| Materials, Supplies and Other | 493 |
| 570 |
| 77 |
| 14 |
| | 2,069 |
| 2,336 |
| 267 |
| 11 |
|
| Fuel | 217 |
| 201 |
| (16 | ) | (8 | ) | | 713 |
| 957 |
| 244 |
| 25 |
|
| Depreciation | 348 |
| 312 |
| (36 | ) | (12 | ) | | 1,301 |
| 1,208 |
| (93 | ) | (8 | ) |
| Equipment and Other Rents | 123 |
| 108 |
| (15 | ) | (14 | ) | | 438 |
| 436 |
| (2 | ) | — |
|
| Total Expense | 2,033 |
| 1,990 |
| (43 | ) | (2 | ) | | 7,680 |
| 8,227 |
| 547 |
| 7 |
|
| | | | | | | | | | |
| Operating Income | 1,004 |
| 791 |
| 213 |
| 27 |
| | 3,389 |
| 3,584 |
| (195 | ) | (5 | ) |
| | | | | | | | | | |
Interest Expense (b) | (156 | ) | (140 | ) | (16 | ) | (11 | ) | | (579 | ) | (544 | ) | (35 | ) | (6 | ) |
Debt Repurchase Expense (c) | (115 | ) | — |
| (115 | ) | — |
| | (115 | ) | — |
| (115 | ) | — |
|
Other Income - Net (d) | 18 |
| 90 |
| (72 | ) | (80 | ) | | 46 |
| 98 |
| (52 | ) | (53 | ) |
| Earnings Before Income Taxes | 751 |
| 741 |
| 10 |
| 1 |
| | 2,741 |
| 3,138 |
| (397 | ) | (13 | ) |
| | | | | | | | | | |
Income Tax Expense (e) | (293 | ) | (275 | ) | (18 | ) | (7 | ) | | (1,027 | ) | (1,170 | ) | 143 |
| 12 |
|
| Net Earnings | $ | 458 |
| $ | 466 |
| $ | (8 | ) | (2 | )% | | $ | 1,714 |
| $ | 1,968 |
| $ | (254 | ) | (13 | )% |
| | | | | | | | | | |
| Operating Ratio | 67.0 | % | 71.6 | % | | | | 69.4 | % | 69.7 | % | | |
| | | | | | | | | | |
| Per Common Share | | | | | | | | | |
| Net Earnings Per Share, Assuming Dilution | $ | 0.49 |
| $ | 0.48 |
| $ | 0.01 |
| 2 | % | | $ | 1.81 |
| $ | 2.00 |
| $ | (0.19 | ) | (10 | )% |
| | | | | | | | | | |
Average Shares Outstanding, Assuming Dilution (millions) | 935 |
| 973 |
| | | | 948 |
| 984 |
| | |
| | | | | | | | | | |
| Cash Dividends Paid Per Common Share | $ | 0.18 |
| $ | 0.18 |
| | | | $ | 0.72 |
| $ | 0.70 |
| | |
| | | | | | | | | | |
| | | | | | | | | | |
CONDENSED CONSOLIDATED BALANCE SHEETS
(Dollars in millions)
|
| | | | | | |
| | (Unaudited) | |
| | Dec. 30, 2016 | Dec. 25, 2015 |
| ASSETS |
| | | |
| Cash and Cash Equivalents | $ | 603 |
| $ | 628 |
|
| Short-term Investments | 417 |
| 810 |
|
| Other Current Assets | 1,467 |
| 1,402 |
|
| Properties - Net | 31,150 |
| 30,174 |
|
| Investment in Affiliates and Other Companies | 1,459 |
| 1,394 |
|
| Other Long-term Assets | 318 |
| 337 |
|
| Total Assets | $ | 35,414 |
| $ | 34,745 |
|
| | | |
| | | |
| LIABILITIES AND SHAREHOLDERS' EQUITY |
| | | |
| Current Maturities of Long-term Debt | $ | 331 |
| $ | 20 |
|
| Other Current Liabilities | 1,709 |
| 1,932 |
|
| Long-term Debt | 10,962 |
| 10,515 |
|
| Deferred Income Taxes | 9,596 |
| 9,179 |
|
| Other Long-term Liabilities | 1,122 |
| 1,431 |
|
| Total Liabilities | 23,720 |
| 23,077 |
|
| | | |
| Total Shareholders' Equity | 11,694 |
| 11,668 |
|
| Total Liabilities and Shareholders' Equity | $ | 35,414 |
| $ | 34,745 |
|
Certain prior year data has been reclassified to conform to the current presentation.
CONDENSED CONSOLIDATED CASH FLOW STATEMENTS
(Dollars in millions)
|
| | | | | | |
| | (Unaudited) | |
| | Years Ended |
| | Dec. 30, 2016 | Dec. 25, 2015 |
| OPERATING ACTIVITIES | | |
| Net Earnings | $ | 1,714 |
| $ | 1,968 |
|
| Depreciation | 1,301 |
| 1,208 |
|
| Deferred Income Taxes | 405 |
| 456 |
|
| Contributions to Qualified Pension Plans | (250 | ) | — |
|
| Gains on Property Dispositions | (128 | ) | (90 | ) |
| Other Operating Activities - Net | (1 | ) | (172 | ) |
| Net Cash Provided by Operating Activities | 3,041 |
| 3,370 |
|
| | | |
| INVESTING ACTIVITIES | | |
| Property Additions | (2,398 | ) | (2,562 | ) |
| Purchase of Short-term Investments | (929 | ) | (1,739 | ) |
| Proceeds from Sales of Short-term Investments | 1,325 |
| 1,225 |
|
| Proceeds from Property Dispositions | 195 |
| 147 |
|
| Other Investing Activities | 9 |
| 37 |
|
| Net Cash Used in Investing Activities | (1,798 | ) | (2,892 | ) |
| | | |
| FINANCING ACTIVITIES | | |
| Long-term Debt Issued | 2,200 |
| 1,200 |
|
| Long-term Debt Repaid | (1,419 | ) | (229 | ) |
| Dividends Paid | (680 | ) | (686 | ) |
Shares Repurchased (f) | (1,056 | ) | (804 | ) |
Other Financing Activities - Net (g) | (313 | ) | — |
|
| Net Cash Used in Financing Activities | (1,268 | ) | (519 | ) |
| | | |
| Net Decrease in Cash and Cash Equivalents | (25 | ) | (41 | ) |
| | | |
| CASH AND CASH EQUIVALENTS | | |
| Cash and Cash Equivalents at Beginning of Period | 628 |
| 669 |
|
| Cash and Cash Equivalents at End of Period | $ | 603 |
| $ | 628 |
|
| | | |
NOTES TO CONSOLIDATED FINANCIAL STATEMENTS (Unaudited)
Income Statement
| |
| a) | Fiscal year: CSX follows a 52/53 week fiscal reporting calendar. The fourth quarter of 2016 includes an extra week, making the fourth quarter 14 weeks and the year 53 weeks. All information is presented on a 14-week or 53-week basis, under Generally Accepted Accounting Principles ("GAAP"), unless otherwise noted. Certain non-GAAP financial measures used to manage the company's business that fall within the meaning of Securities and Exchange Commission Regulation G and Regulation S-K Item 10(e) may provide users of the financial information with additional meaningful comparisons to prior reported results. In an effort to provide financial statement users with comparable information, CSX has provided certain revenue and volume related information on pages 8-12 which excludes the extra week but shows equal duration of 13 weeks for the quarter and 52 weeks for the year. These non-GAAP measures should not be considered a substitute for GAAP measures. |
| |
| b) | Interest Expense: During the fourth quarter of 2016, interest expense increased as a result of a higher average debt balance partially offset by a lower average interest rate. Also included in interest expense is $11 million of additional interest cost related to the extra week in 2016. |
| |
| c) | Debt Repurchase Expense: During the fourth quarter of 2016, the Company recorded $115 million of debt repurchase expense, or $0.08 cents per share, due to the repurchase of certain notes that were expected to mature in 2017, 2018 and 2019. |
| |
| d) | Other Income - Net: During the prior year quarter, the Company recorded $80 million of earnings due to a gain on sale of a non-operating property and other related income. |
| |
| e) | Income Tax Expense: During the fourth quarter of 2016, the Company recorded an income tax expense adjustment of $10 million, or $0.01 cents per share, as a result of a change in the apportionment of state income taxes. Also included in income tax expense is $19 million related to the extra week of earnings. |
Cash Flow Statement
| |
| f) | Shares repurchased: During the fourth quarter and years ended 2016 and 2015, the Company repurchased the following number of shares: |
|
| | | | | | | | | | | | | |
| | Quarters Ended | | Years Ended |
| | Dec. 30, 2016 | Dec. 25, 2015 | | Dec. 30, 2016 | Dec. 25, 2015 |
Shares Repurchased (Millions) | 8 |
| 9 |
| | 38 |
| 26 |
|
Cost of Shares (Dollars in millions) | $ | 278 |
| $ | 258 |
| | $ | 1,056 |
| $ | 804 |
|
| |
| g) | Other Financing Activities - Net: Includes payments of $307 million for locomotives which were purchased using seller financing in 2015. |
|
| | | | | | | | | | | | | | | | | | | | | | | | | | | |
VOLUME AND REVENUE (Unaudited) |
| Volume (Thousands of units); Revenue (Dollars in millions); Revenue Per Unit (Dollars) |
| |
| GAAP (includes extra week in 2016) |
| |
Quarters Ended December 30, 2016 (14 weeks) and December 25, 2015 (13 weeks) |
| | | | | | | | | |
| | Volume | | | Revenue | | | Revenue Per Unit | |
| | 2016 | 2015 | % Change | | 2016 | 2015 | % Change | | 2016 | 2015 | % Change |
| Agricultural | | | | | | | | | | | | | | |
Agricultural and Food Products (a) | 131 |
| 125 |
| 5 | % | | | $ | 361 |
| $ | 335 |
| 8 | % | | | $ | 2,756 |
| $ | 2,680 |
| 3 | % | |
Fertilizers (a) | 80 |
| 74 |
| 8 |
| | | 118 |
| 120 |
| (2 | ) | | | 1,475 |
| 1,622 |
| (9 | ) | |
| Industrial | | | | | | | | | | | | | | |
Chemicals (a) | 180 |
| 176 |
| 2 |
| | | 569 |
| 548 |
| 4 |
| | | 3,161 |
| 3,114 |
| 2 |
| |
| Automotive | 133 |
| 120 |
| 11 |
| | | 354 |
| 308 |
| 15 |
| | | 2,662 |
| 2,567 |
| 4 |
| |
Metals and Equipment (a) | 63 |
| 65 |
| (3 | ) | | | 173 |
| 168 |
| 3 |
| | | 2,746 |
| 2,585 |
| 6 |
| |
| Housing and Construction | | | | | | | | | | | | | | |
Minerals (a) | 80 |
| 78 |
| 3 |
| | | 119 |
| 113 |
| 5 |
| | | 1,488 |
| 1,449 |
| 3 |
| |
| Forest Products | 70 |
| 70 |
| — |
| | | 201 |
| 193 |
| 4 |
| | | 2,871 |
| 2,757 |
| 4 |
| |
| Total Merchandise | 737 |
| 708 |
| 4 |
| | | 1,895 |
| 1,785 |
| 6 |
| | | 2,571 |
| 2,521 |
| 2 |
| |
| | | | | | | | | | | | | | | |
| Coal | 236 |
| 218 |
| 8 |
| | | 551 |
| 449 |
| 23 |
| | | 2,335 |
| 2,060 |
| 13 |
| |
| | | | | | | | | | | | | | | |
| Intermodal | 758 |
| 729 |
| 4 |
| | | 477 |
| 446 |
| 7 |
| | | 629 |
| 612 |
| 3 |
| |
| | | | | | | | | | | | | | | |
| Other | — |
| — |
| — |
| | | 114 |
| 101 |
| 13 |
| | | — |
| — |
| — |
| |
| | | | | | | | | | | | | | | |
| Total | 1,731 |
| 1,655 |
| 5 | % | | | $ | 3,037 |
| $ | 2,781 |
| 9 | % | | | $ | 1,754 |
| $ | 1,680 |
| 4 | % | |
| | | | | | | | | | | | | | | |
Years Ended December 30, 2016 (53 weeks) and December 25, 2015 (52 weeks) |
| | | | | | | | | |
| | Volume | | | Revenue | | | Revenue Per Unit | |
| | 2016 | 2015 | % Change | | 2016 | 2015 | % Change | | 2016 | 2015 | % Change |
| Agricultural | | | | | | | | | | | | | | |
Agricultural and Food Products (a) | 477 |
| 503 |
| (5 | )% | | | $ | 1,286 |
| $ | 1,345 |
| (4 | )% | | | $ | 2,696 |
| $ | 2,674 |
| 1 | % | |
Fertilizers (a) | 300 |
| 301 |
| — |
| | | 463 |
| 489 |
| (5 | ) | | | 1,543 |
| 1,625 |
| (5 | ) | |
| Industrial | | | | | | | | | | | | | | |
Chemicals (a) | 700 |
| 726 |
| (4 | ) | | | 2,191 |
| 2,284 |
| (4 | ) | | | 3,130 |
| 3,146 |
| (1 | ) | |
| Automotive | 482 |
| 450 |
| 7 |
| | | 1,261 |
| 1,175 |
| 7 |
| | | 2,616 |
| 2,611 |
| — |
| |
Metals and Equipment (a) | 259 |
| 284 |
| (9 | ) | | | 704 |
| 723 |
| (3 | ) | | | 2,718 |
| 2,546 |
| 7 |
| |
| Housing and Construction | | | | | | | | | | | | | | |
Minerals (a) | 310 |
| 306 |
| 1 |
| | | 464 |
| 459 |
| 1 |
| | | 1,497 |
| 1,500 |
| — |
| |
| Forest Products | 274 |
| 290 |
| (6 | ) | | | 773 |
| 796 |
| (3 | ) | | | 2,821 |
| 2,745 |
| 3 |
| |
| Total Merchandise | 2,802 |
| 2,860 |
| (2 | ) | | | 7,142 |
| 7,271 |
| (2 | ) | | | 2,549 |
| 2,542 |
| — |
| |
| | | | | | | | | | | | | | | |
| Coal | 838 |
| 1,063 |
| (21 | ) | | | 1,833 |
| 2,300 |
| (20 | ) | | | 2,187 |
| 2,164 |
| 1 |
| |
| | | | | | | | | | | | | | | |
| Intermodal | 2,811 |
| 2,838 |
| (1 | ) | | | 1,726 |
| 1,762 |
| (2 | ) | | | 614 |
| 621 |
| (1 | ) | |
| | | | | | | | | | | | | | | |
| Other | — |
| — |
| — |
| | | 368 |
| 478 |
| (23 | ) | | | — |
| — |
| — |
| |
| | | | | | | | | | | | | | | |
| Total | 6,451 |
| 6,761 |
| (5 | )% | | | $ | 11,069 |
| $ | 11,811 |
| (6 | )% | | | $ | 1,716 |
| $ | 1,747 |
| (2 | )% | |
(a) In order to better align markets with the Company's business strategy, changes were made to the categorization of certain lines of business during the third quarter 2016. Prior periods have been reclassified to conform to the current presentation and are posted on the Company's website at csx.com under the investors section.
| |
| • | Agricultural and Food Products includes the combination of the previous Agricultural Products and Food and Consumer markets. |
| |
| • | Fertilizers was previously named Phosphates and Fertilizers. |
| |
| • | Metals and Equipment includes the Equipment portion of the previous Waste and Equipment market. |
| |
| • | Chemicals includes the Waste portion of the previous Waste and Equipment market. Chemicals also includes fly ash for remediation purposes (a form of waste) which was previously included within the Minerals market. |
|
| | | | | | | | | | | | | | | | | | | | | | | | | | | |
VOLUME AND REVENUE (Unaudited) |
| Volume (Thousands of units); Revenue (Dollars in millions); Revenue Per Unit (Dollars) |
| |
| COMPARABLE NON-GAAP (excludes extra week in 2016) |
| |
Quarters Ended December 23, 2016 (13 weeks) and December 25, 2015 (13 weeks) |
| | | | | | | | | |
| | Volume | | | Revenue | | | Revenue Per Unit | |
| | 2016 | 2015 | % Change | | 2016 | 2015 | % Change | | 2016 | 2015 | % Change |
| Agricultural | | | | | | | | | | | | | | |
Agricultural and Food Products (a) | 123 |
| 125 |
| (2 | )% | | | $ | 339 |
| $ | 335 |
| 1 | % | | | $ | 2,756 |
| $ | 2,680 |
| 3 | % | |
Fertilizers (a) | 74 |
| 74 |
| — |
| | | 111 |
| 120 |
| (8 | ) | | | 1,500 |
| 1,622 |
| (8 | ) | |
| Industrial | | | | | | | | | | | | | | |
Chemicals (a) | 168 |
| 176 |
| (5 | ) | | | 529 |
| 548 |
| (3 | ) | | | 3,149 |
| 3,114 |
| 1 |
| |
| Automotive | 127 |
| 120 |
| 6 |
| | | 336 |
| 308 |
| 9 |
| | | 2,646 |
| 2,567 |
| 3 |
| |
Metals and Equipment (a) | 59 |
| 65 |
| (9 | ) | | | 162 |
| 168 |
| (4 | ) | | | 2,746 |
| 2,585 |
| 6 |
| |
| Housing and Construction | | | | | | | | | | | | | | |
Minerals (a) | 77 |
| 78 |
| (1 | ) | | | 113 |
| 113 |
| — |
| | | 1,468 |
| 1,449 |
| 1 |
| |
| Forest Products | 65 |
| 70 |
| (7 | ) | | | 186 |
| 193 |
| (4 | ) | | | 2,862 |
| 2,757 |
| 4 |
| |
| Total Merchandise | 693 |
| 708 |
| (2 | ) | | | 1,776 |
| 1,785 |
| (1 | ) | | | 2,563 |
| 2,521 |
| 2 |
| |
| | | | | | | | | | | | | | | |
| Coal | 224 |
| 218 |
| 3 |
| | | 520 |
| 449 |
| 16 |
| | | 2,321 |
| 2,060 |
| 13 |
| |
| | | | | | | | | | | | | | | |
| Intermodal | 715 |
| 729 |
| (2 | ) | | | 451 |
| 446 |
| 1 |
| | | 631 |
| 612 |
| 3 |
| |
| | | | | | | | | | | | | | | |
| Other | — |
| — |
| — |
| | | 112 |
| 101 |
| 11 |
| | | — |
| — |
| — |
| |
| | | | | | | | | | | | | | | |
| Total | 1,632 |
| 1,655 |
| (1 | )% | | | $ | 2,859 |
| $ | 2,781 |
| 3 | % | | | $ | 1,752 |
| $ | 1,680 |
| 4 | % | |
| | | | | | | | | | | | | | | |
Years Ended December 23, 2016 (52 weeks) and December 25, 2015 (52 weeks) |
| | | | | | | | | |
| | Volume | | | Revenue | | | Revenue Per Unit | |
| | 2016 | 2015 | % Change | | 2016 | 2015 | % Change | | 2016 | 2015 | % Change |
| Agricultural | | | | | | | | | | | | | | |
Agricultural and Food Products (a) | 469 |
| 503 |
| (7 | )% | | | $ | 1,264 |
| $ | 1,345 |
| (6 | )% | | | $ | 2,695 |
| $ | 2,674 |
| 1 | % | |
Fertilizers (a) | 294 |
| 301 |
| (2 | ) | | | 456 |
| 489 |
| (7 | ) | | | 1,551 |
| 1,625 |
| (5 | ) | |
| Industrial | | | | | | | | | | | | | | |
Chemicals (a) | 688 |
| 726 |
| (5 | ) | | | 2,151 |
| 2,284 |
| (6 | ) | | | 3,126 |
| 3,146 |
| (1 | ) | |
| Automotive | 476 |
| 450 |
| 6 |
| | | 1,243 |
| 1,175 |
| 6 |
| | | 2,611 |
| 2,611 |
| — |
| |
Metals and Equipment (a) | 255 |
| 284 |
| (10 | ) | | | 693 |
| 723 |
| (4 | ) | | | 2,718 |
| 2,546 |
| 7 |
| |
| Housing and Construction | | | | | | | | | | | | | | |
Minerals (a) | 307 |
| 306 |
| — |
| | | 458 |
| 459 |
| — |
| | | 1,492 |
| 1,500 |
| (1 | ) | |
| Forest Products | 269 |
| 290 |
| (7 | ) | | | 758 |
| 796 |
| (5 | ) | | | 2,818 |
| 2,745 |
| 3 |
| |
| Total Merchandise | 2,758 |
| 2,860 |
| (4 | ) | | | 7,023 |
| 7,271 |
| (3 | ) | | | 2,546 |
| 2,542 |
| — |
| |
| | | | | | | | | | | | | | | |
| Coal | 826 |
| 1,063 |
| (22 | ) | | | 1,802 |
| 2,300 |
| (22 | ) | | | 2,182 |
| 2,164 |
| 1 |
| |
| | | | | | | | | | | | | | | |
| Intermodal | 2,768 |
| 2,838 |
| (2 | ) | | | 1,700 |
| 1,762 |
| (4 | ) | | | 614 |
| 621 |
| (1 | ) | |
| | | | | | | | | | | | | | | |
| Other | — |
| — |
| — |
| | | 366 |
| 478 |
| (23 | ) | | | — |
| — |
| — |
| |
| | | | | | | | | | | | | | | |
| Total | 6,352 |
| 6,761 |
| (6 | )% | | | $ | 10,891 |
| $ | 11,811 |
| (8 | )% | | | $ | 1,715 |
| $ | 1,747 |
| (2 | )% | |
(a) In order to better align markets with the Company's business strategy, changes were made to the categorization of certain lines of business during the third quarter 2016. Prior periods have been reclassified to conform to the current presentation and are posted on the Company's website at csx.com under the investors section.
| |
| • | Agricultural and Food Products includes the combination of the previous Agricultural Products and Food and Consumer markets. |
| |
| • | Fertilizers was previously named Phosphates and Fertilizers. |
| |
| • | Metals and Equipment includes the Equipment portion of the previous Waste and Equipment market. |
| |
| • | Chemicals includes the Waste portion of the previous Waste and Equipment market. Chemicals also includes fly ash for remediation purposes (a form of waste) which was previously included within the Minerals market. |
VOLUME AND REVENUE
On a GAAP basis, revenue increased $256 million to $3.0 billion from the prior year’s fourth quarter due to the $178 million impact of an extra week of volume in 2016, pricing gains and positive mix, which were modestly offset by lower fuel surcharge.
|
| | | |
Same Store Sales Pricing Year-Over-Year Change |
| | % Change | |
| All-In | 2.8 | % | |
| Merchandise and Intermodal | 3.2 | % | |
Same store sales is defined as customer shipments with the same commodity and car type, and the same origin and destination.
Revenue per unit was up 4% as a result of pricing gains and positive mix in the quarter, modestly offset by lower fuel recoveries. Same store sales pricing increased across all major markets (coal, merchandise and intermodal).
FUEL SURCHARGE
Fuel surcharge revenue is included in the individual markets. Fuel lag is the estimated difference between highway diesel prices in the quarter and the prices used for fuel surcharge, which are generally on a two month lag.
|
| | | | | | | | | | | | | | | | | | | |
| | Quarters Ended | | Years Ended |
| (Dollars in millions) | Dec. 30, 2016 | Dec. 25, 2015 | $ Change | | Dec. 30, 2016 | Dec. 25, 2015 | $ Change |
| Fuel Surcharge Revenue | $ | 76 |
| $ | 86 |
| $ | (10 | ) | | $ | 229 |
| $ | 538 |
| $ | (309 | ) |
| Fuel Lag (Expense) Benefit | $ | (5 | ) | $ | 8 |
| $ | (13 | ) | | $ | 3 |
| $ | 63 |
| $ | (60 | ) |
In an effort to provide financial statement users with comparable information, the comparable 13-week periods of equal duration outlined in the volume and revenue table on page 8 are discussed below. These non-GAAP measures should not be considered a substitute for GAAP measures.
MERCHANDISE (Comparable Non-GAAP, excludes extra week)
Agricultural Sector
|
| | | | | | | | | | | | | | | | | | | | | | | | | | |
| Volume (Thousands of units); Revenue (Dollars in millions); Revenue Per Unit (Dollars) |
| Volume | | | Revenue | | | Revenue Per Unit | |
| 2016 | 2015 | % Change | | 2016 | 2015 | % Change | | 2016 | 2015 | % Change |
| 197 |
| 199 |
| (1 | ) | | | $ | 450 |
| $ | 455 |
| (1 | ) | | | $ | 2,284 |
| $ | 2,286 |
| — |
| |
% of Carloads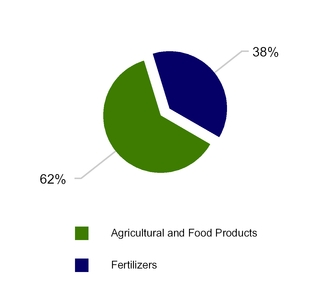
Agricultural and Food Products - Volume declined modestly as gains in export grain shipments, reflecting the strong U.S. soybean harvest and South American production challenges, were offset by a strong Southeastern crop which limited demand for grain via rail from the Midwest to that region.
Fertilizers - Volume was flat; operational efficiency moving phosphate rock allowed for additional rail conversion of traffic that would otherwise move by truck. This growth was offset by reduced nitrogen demand as buyers expect further commodity price deterioration.
MERCHANDISE (Comparable Non-GAAP, excludes extra week) cont'd
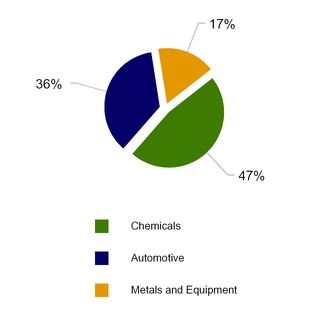
Industrial Sector
|
| | | | | | | | | | | | | | | | | | | | | | | | |
| Volume (Thousands of units); Revenue (Dollars in millions); Revenue Per Unit (Dollars) |
| Volume | | | Revenue | | | Revenue Per Unit | |
| 2016 | 2015 | % Change | | 2016 | 2015 | % Change | | 2016 | 2015 | % Change |
| 354 |
| 361 |
| (2 | ) | | | $ | 1,027 |
| $ | 1,024 |
| — | | | $ | 2,901 |
| $ | 2,837 |
| 2 | |
Chemicals - Volume fell, reflecting sustained challenges in the crude-by-rail market. These declines were partially offset by the continued ramp-up of a fly ash remediation project and modestly improved liquefied petroleum gas and frac sand volume.
Automotive - Volume increased with the success of particular customers as the market continued to see modest North American Light Vehicle Production and sales growth. Movement of trucks and SUV’s continued to outpace passenger cars, which was consistent with consumer buying patterns.
Metals and Equipment - Volume was down due to the continued impact of steel mill closures brought on by persistent, above-average import steel levels, resulting from the strong U.S. dollar. Additionally, the prior year’s fourth quarter benefitted from several energy-related pipe projects which did not repeat.
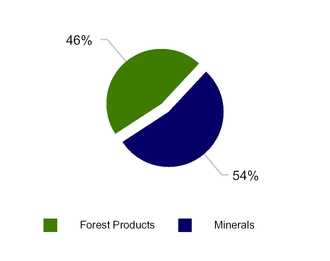
Housing and Construction Sector
|
| | | | | | | | | | | | | | | | | | | | | | | | | |
| Volume (Thousands of units); Revenue (Dollars in millions); Revenue Per Unit (Dollars) |
| Volume | | | Revenue | | | Revenue Per Unit | |
| 2016 | 2015 | % Change | | 2016 | 2015 | % Change | | 2016 | 2015 | % Change |
| 142 |
| 148 |
| (4 | ) | | | $ | 299 |
| $ | 306 |
| (2 | ) | | | $ | 2,106 |
| $ | 2,068 |
| 2 | |
Minerals - Volume was down slightly due to aggregates shipments returning to normalized levels. This was caused after mild weather conditions in the prior year extended the shipping season in the Mid-Atlantic region.
Forest Products - Volume declined, primarily in paper products, as U.S. dollar strength challenged exports, electronic substitution continued to drive lower demand and industry consolidation, and aggressive truck pricing displaced some rail moves.
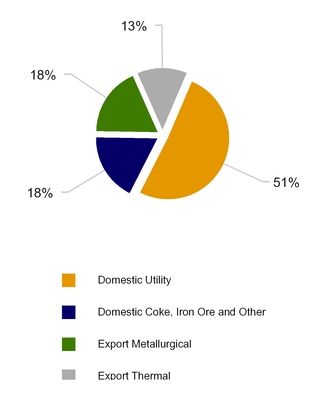
COAL (Comparable Non-GAAP, excludes extra week)
|
| | | | | | | | | | | | | | | | | | | | | | | |
| Volume (Thousands of units); Revenue (Dollars in millions); Revenue Per Unit (Dollars) |
| Volume | | | Revenue | | | Revenue Per Unit | |
| 2016 | 2015 | % Change | | 2016 | 2015 | % Change | | 2016 | 2015 | % Change |
| 224 |
| 218 |
| 3 | | | $ | 520 |
| $ | 449 |
| 16 | | | $ | 2,321 |
| $ | 2,060 |
| 13 | |
| | | | | | | | | | | | | | |
Domestic Utility Coal - Although higher natural gas prices improved coal-fired utility competitiveness, volume declined modestly as utilities continued to burn through inflated stockpiles during the fall shoulder period.
Domestic Coke, Iron Ore and Other - Volume decreases reflected the continued weak domestic integrated steel market.
Export Coal - Both metallurgical and thermal volume increased as U.S. producers capitalized on Chinese production curtailments earlier in the year.
|
| | | | | | | | | | | | | | | | | |
| | Quarters Ended (GAAP) | Non-GAAP | | Years Ended (GAAP) (b) | Non-GAAP |
| | Dec. 30, 2016 (14 weeks) | Dec. 25, 2015 (13 weeks)(b) | % Change | 2016 (13 weeks)(a) | | Dec. 30, 2016 (53 weeks) | Dec. 25, 2015 (52 weeks) | % Change | 2016 (52 weeks)(a) |
| (Millions of Tons) | | | | | | | | | |
| Domestic | | | | | | | | | |
| Utility | 14.0 |
| 13.5 |
| 4 | % | 13.2 |
| | 50.6 |
| 65.7 |
| (23 | )% | 49.8 |
|
| Coke, Iron Ore and Other | 5.0 |
| 5.4 |
| (7 | ) | 4.7 |
| | 19.3 |
| 24.4 |
| (21 | ) | 19.0 |
|
| Total Domestic | 19.0 |
| 18.9 |
| 1 |
| 17.9 |
| | 69.9 |
| 90.1 |
| (22 | ) | 68.8 |
|
| Export | | | | | | | | | |
| Metallurgical | 4.7 |
| 3.5 |
| 34 |
| 4.5 |
| | 17.6 |
| 18.7 |
| (6 | ) | 17.4 |
|
| Thermal | 3.4 |
| 2.5 |
| 36 |
| 3.3 |
| | 8.1 |
| 11.6 |
| (30 | ) | 8.0 |
|
| Total Export | 8.1 |
| 6.0 |
| 35 |
| 7.8 |
| | 25.7 |
| 30.3 |
| (15 | ) | 25.4 |
|
| | | | | | | | | | |
| Total Coal | 27.1 |
| 24.9 |
| 9 | % | 25.7 |
| | 95.6 |
| 120.4 |
| (21 | )% | 94.2 |
|
(a) In an effort to provide financial statement users with comparable information, the 2016 13 and 52-week periods are presented above. These are non-GAAP financial measures and should not be considered a substitute for GAAP measures.
(b) Coal tonnage was corrected by an immaterial amount of 2% or less for the prior three quarters of the current year and 2015.
INTERMODAL (Comparable Non-GAAP, excludes extra week)
|
| | | | | | | | | | | | | | | | | | | | | | | | |
| Volume (Thousands of units); Revenue (Dollars in millions); Revenue Per Unit (Dollars) |
| Volume | | | Revenue | | | Revenue Per Unit | |
| 2016 | 2015 | % Change | | 2016 | 2015 | % Change | | 2016 | 2015 | % Change |
| 715 |
| 729 |
| (2 | ) | | | $ | 451 |
| $ | 446 |
| 1 | | | $ | 631 |
| $ | 612 |
| 3 | |
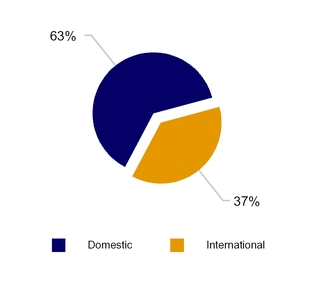
Domestic - Volumes declined one percent as the loss of competitive short-haul traffic more than offset ongoing success with CSX’s highway-to-rail initiative and new service offerings.
International - Volume fell three percent as a result of a prior competitive account loss. The remaining international portfolio grew despite an over-supplied seaborne market.
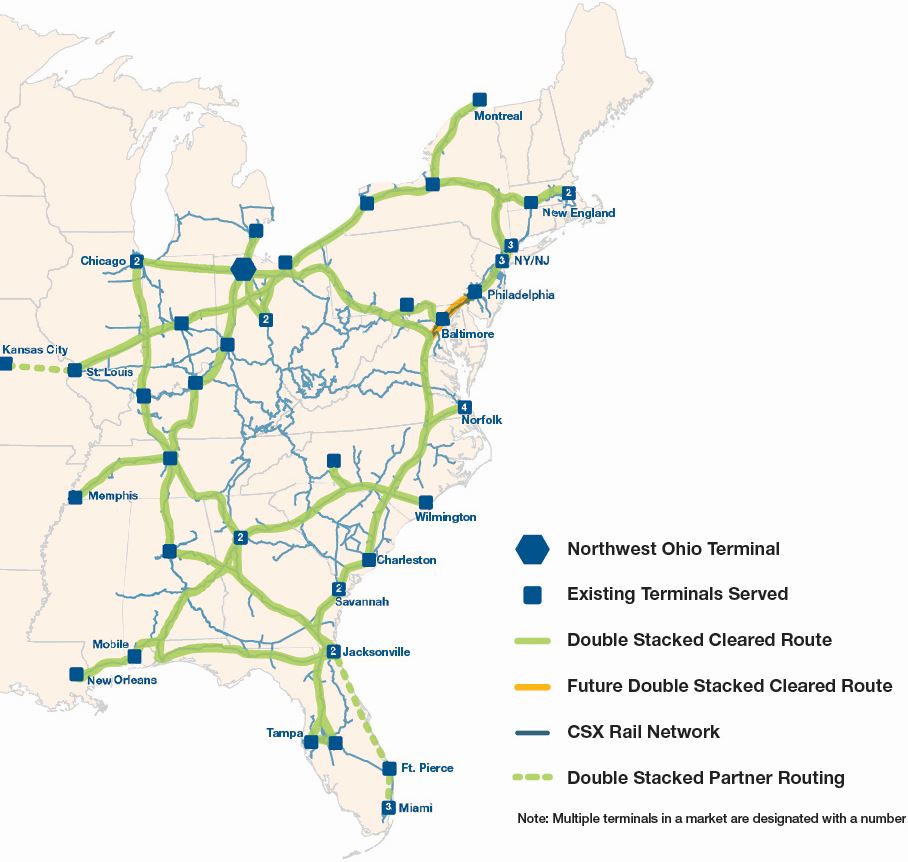
Intermodal Network
EXPENSE
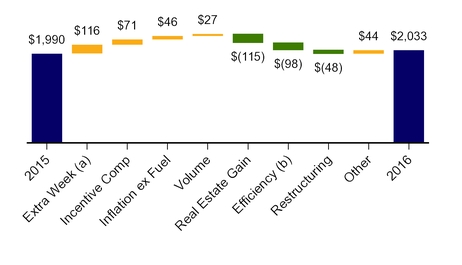
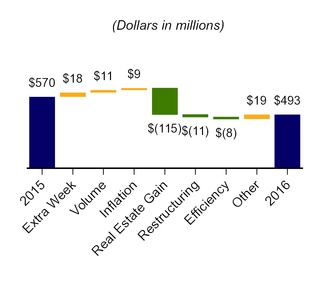
Expenses of $2 billion increased $43 million, or 2 percent year over year, primarily driven by the impact of an extra week of expense in the fourth quarter of 2016 and higher incentive compensation, offset by a gain on sale of an operating property and increased efficiency savings.
EXPENSE
(Dollars in millions)
(a) The extra week includes estimated incremental expenses incurred for the week of December 24 - December 30, 2016.
(b) Full year efficiency gains amount to $427 million reflecting fourth quarter savings of $98 million and revised efficiency of $329 million for the prior three quarters of 2016. Changes to prior period efficiency gains relate to a few items including updated estimates of gross ton miles.
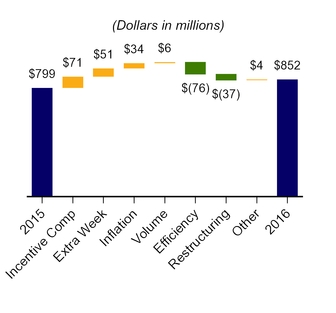
LABOR AND FRINGE
| |
| • | Incentive compensation was $71 million higher reflecting the expected award payouts on existing plans. |
| |
| • | The extra week resulted in $51 million of additional cost. |
| |
| • | Inflation resulted in $34 million of additional cost driven primarily by increased health and welfare costs. |
| |
| • | Despite a one percent decrease in comparable 13-week total carloads, increased auto and coal crew costs and labor expenses at a company-owned export coal pier drove expense $6 million higher. |
| |
| • | Efficiency savings of $76 million were driven by lower T&E and operating support costs, primarily as a result of structural changes. |
| |
| • | Restructuring costs decreased $37 million primarily due to 2015 workforce reduction initiative costs that did not repeat in the current period. |
| |
| • | Other costs increased $4 million. |
|
| | | | | |
EMPLOYEE COUNTS (Estimated) |
| | | | | | |
| | 2016 | | 2015 | | Change |
| October | 26,848 | | 29,974 | | (3,126) |
| November | 26,827 | | 29,927 | | (3,100) |
| December | 26,628 | | 29,424 | | (2,796) |
| Average | 26,768 | | 29,775 | | (3,007) |
MATERIALS, SUPPLIES AND OTHER
| |
| • | The extra week resulted in $18 million of additional cost. |
| |
| • | Despite a one percent decrease in comparable 13-week total carloads, increased terminal and pier expenses attributable to export coal and auto volumes drove expense $11 million higher. |
| |
| • | Inflation resulted in $9 million of additional cost. |
| |
| • | A gain of $115 million was related to the sale of an operating property and other related income. |
| |
| • | Restructuring costs decreased $11 million due to prior year asset impairment charges on operating facilities that did not repeat in the current period. |
| |
| • | Efficiency savings of $8 million were primarily related to lower operating support costs driven by structural changes. |
| |
| • | Other costs increased $19 million primarily due to increased environmental costs. |
| |
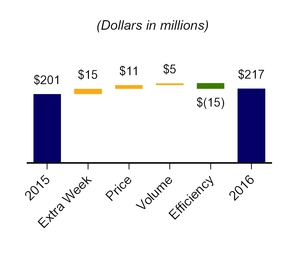
| • | The extra week resulted in $15 million of additional cost. |
| |
| • | A seven percent price increase drove $11 million in additional fuel expense. |
| |
| • | Despite a one percent decrease in comparable 13-week total volume, increased gross ton-miles primarily attributable to coal drove expense $5 million higher. |
| |
| • | Efficiency savings of $15 million were primarily related to locomotive fuel reduction technology and process improvement. |
|
| | | | | | | | | | | | | | | | | | | | |
| | | | | | | |
| | | Quarters Ended | | Years Ended |
| (Dollars and Gallons in Millions, Except Price per Gallon) | | Dec. 30, 2016 | Dec. 25, 2015 | Fav / (Unfav) | | Dec. 30, 2016 | Dec. 25, 2015 | Fav / (Unfav) |
Estimated Locomotive Fuel Consumption (Gallons) | | 117.9 |
| 116.8 |
| (1.1 | ) | | 437.4 |
| 487.5 |
| 50.1 |
|
Price per Gallon (Dollars) | | $ | 1.69 |
| $ | 1.58 |
| $ | (0.11 | ) | | $ | 1.48 |
| $ | 1.80 |
| $ | 0.32 |
|
| Total Locomotive Fuel Expense | | $ | 199 |
| $ | 185 |
| $ | (14 | ) | | $ | 647 |
| $ | 878 |
| $ | 231 |
|
| Other | | 18 |
| 16 |
| (2 | ) | | 66 |
| 79 |
| 13 |
|
| Total Fuel Expense | | $ | 217 |
| $ | 201 |
| $ | (16 | ) | | $ | 713 |
| $ | 957 |
| $ | 244 |
|
DEPRECIATION
Depreciation expense increased $36 million primarily due to a $25 million impact of the extra week and a larger asset base.
EQUIPMENT AND OTHER RENTS
| |
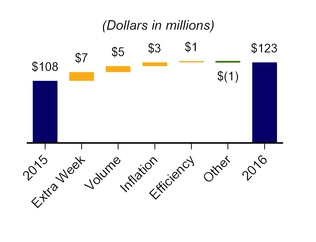
| • | The extra week resulted in $7 million of additional cost. |
| |
| • | Volume-related costs were $5 million higher due to growth in automotive volume. |
| |
| • | Inflation resulted in $3 million of additional cost due to higher rates on automotive freight cars. |
| |
| • | Efficiency losses were $1 million. |
| |
| • | Other costs decreased $1 million. |
OPERATING STATISTICS (Estimated)
TON MILES
|
| | | | | | | | | | | | | | |
| | | Quarters Ended | | Years Ended |
| | | Dec. 30, 2016 | Dec. 25, 2015 | Improvement / (Deterioration) | | Dec. 30, 2016 | Dec. 25, 2015 | Improvement / (Deterioration) |
Revenue Ton-Miles (Billions) | | | | | | | | |
| Merchandise | | 36.5 |
| 35.8 |
| 2 | % | | 137.8 |
| 144.9 |
| (5 | )% |
| Coal | | 14.3 |
| 11.2 |
| 28 |
| | 48.1 |
| 56.5 |
| (15 | ) |
| Intermodal | | 7.7 |
| 7.1 |
| 8 |
| | 27.9 |
| 28.2 |
| (1 | ) |
| Total | | 58.5 |
| 54.1 |
| 8 | % | | 213.8 |
| 229.6 |
| (7 | )% |
| | | | | | | | | |
Gross Ton-Miles (Billions) | | | |
| | | | |
| Total Gross Ton-Miles | | 110.1 |
| 102.4 |
| 8 | % | | 403.6 |
| 426.1 |
| (5 | )% |
| (Excludes locomotive gross ton-miles) | |
| |
| | | | |
SAFETY AND SERVICE
CSX’s FRA reportable personal injury frequency index of 1.01 for the quarter was 13 percent favorable year-over-year. The FRA train accident frequency rate of 2.89 for the quarter improved 1 percent from the prior year on a 14 percent decline in train accidents. The Company remains committed to ongoing improvement, with a focus on avoiding catastrophic events.
Operating performance remained stable in the fourth quarter. On-time originations were 83 percent, a 5 percent improvement year-over-year, and on-time arrivals were 63 percent, a 3 percent increase year-over-year. Average train velocity of 20.3 miles per hours and terminal dwell of 26.2 hours were slightly unfavorable when compared to the prior year. The Company expects to sustain or improve this level of performance while continuing to drive productivity and resource efficiency.
|
| | | | | | | | | | | | | | |
| | | Quarters Ended | | Years Ended |
| | | Dec. 30, 2016 | Dec. 25, 2015 | Improvement / (Deterioration) | | Dec. 30, 2016 | Dec. 25, 2015 | Improvement / (Deterioration) |
| Safety and Service Measurements | | | | | | | | |
| FRA Personal Injury Frequency Index | | 1.01 |
| 1.16 |
| 13 | % | | 1.02 |
| 0.94 |
| (9 | )% |
| (Number of FRA-reportable injuries per 200,000 man-hours) | | | |
| | | | |
| FRA Train Accident Rate | | 2.89 |
| 2.93 |
| 1 | % | | 2.62 |
| 2.61 |
| — | % |
| (Number of FRA-reportable train accidents per million train miles) | |
|
|
| | | | |
| | | | | | | | | |
| On-Time Originations | | 83 | % | 79 | % | 5 | % | | 84 | % | 67 | % | 25 | % |
| On-Time Arrivals | | 63 | % | 61 | % | 3 | % | | 65 | % | 51 | % | 27 | % |
| | |
| |
| | | | |
Train Velocity (Miles per hour) | | 20.3 |
| 21.1 |
| (4 | )% | | 20.8 |
| 20.5 |
| 1 | % |
Dwell (Hours) | | 26.2 |
| 25.4 |
| (3 | )% | | 25.7 |
| 25.8 |
| — | % |
| | | | | | | | | |
| Cars-On-Line | | 210,478 |
| 206,088 |
| (2 | )% | | 207,943 |
| 206,078 |
| (1 | )% |
| | | | | | | | | |
Certain operating statistics are estimated and can continue to be updated as actuals settle.