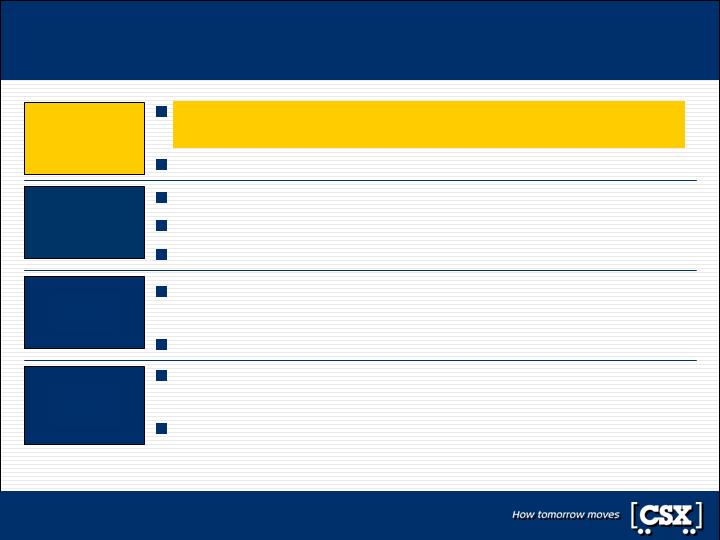
The Facts are…
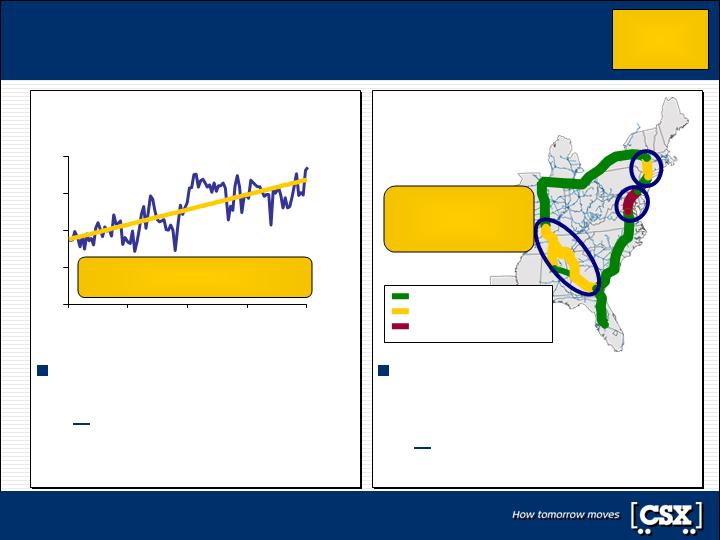
Board presided over the transformation of CSX into a highly focused rail entity, delivering
the most significant stock appreciation in the industry over the last 1, 2, 3, 4 and 5 years.
Board implemented a governance structure that ranks in the top 1% of all transportation
companies; CSX is the only rail with 100% performance-earned incentive compensation.
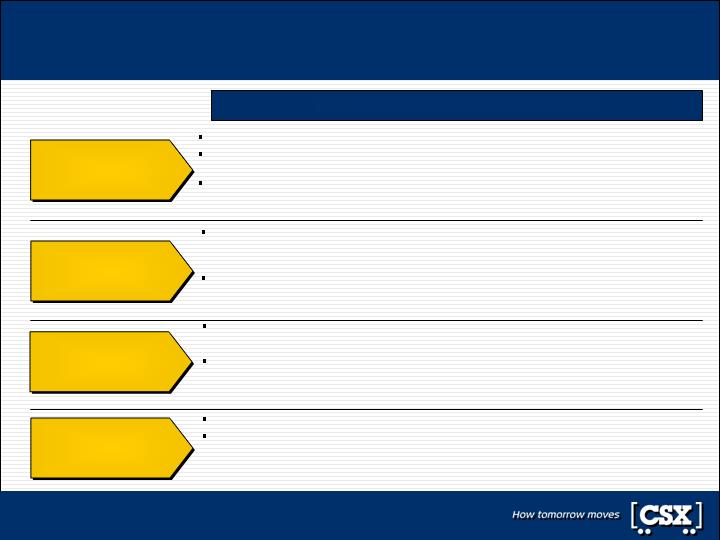
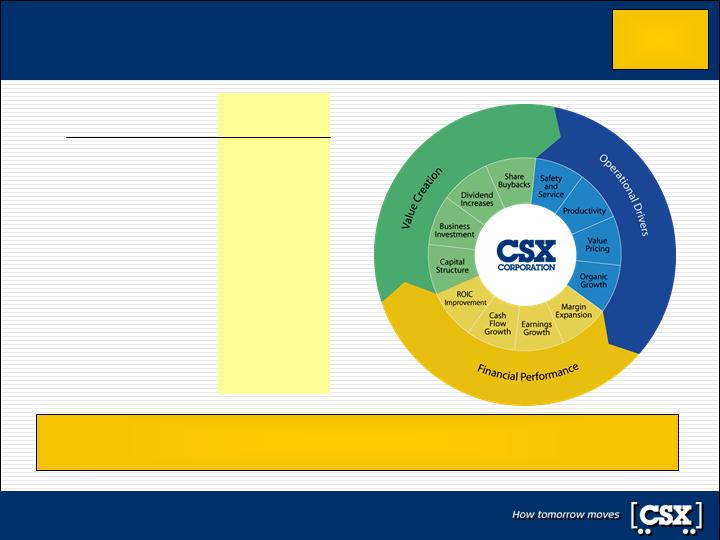
CSX Board delivers superior performance and leading governance
CSX’s Board has
transformed CSX into
an industry leader
CSX is on target
to become the best
railroad in N. America
TCI Group has flawed
ideas that could destroy
shareholder value
TCI Group’s
nominees raise
red flags
6
The facts are…
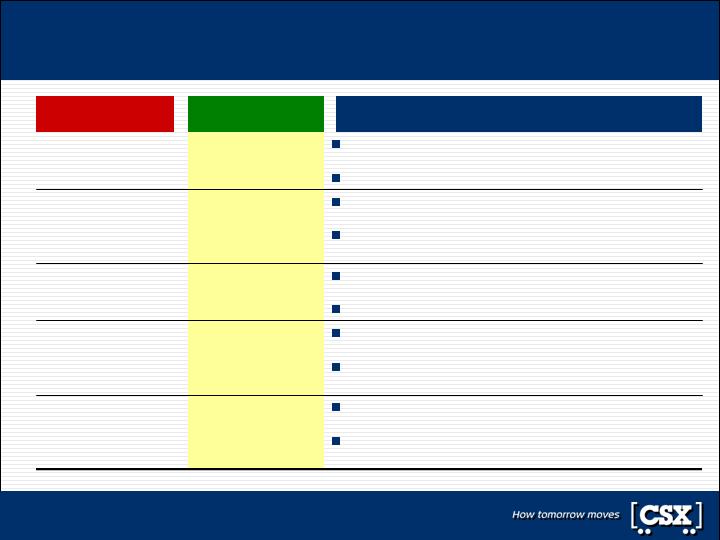
CSX Board delivers results; TCI Group delivers rhetoric
CSX is an industry leader with proven plans to continue delivering for shareholders.
Management has outlined the most aggressive long-term guidance in the industry, with
$400M+ of productivity savings and margins better than any U.S. railroad by 2010.
CSX Board drives unprecedented results and unmatched guidance
TCI Group’s demands to date include a leveraged buyout significantly below current stock
price, destroying CSX’s credit rating for a 20% annual buyback of CSX stock, raising
customer prices 7% annually for the next decade, and freezing expansion capital.
Now, the TCI Group is relying on misrepresentations and misleading analyses to promote
its nominees and its agenda.
TCI Group’s proposals would put CSX’s future at risk
Three of TCI Group’s nominees have no U.S. public board experience.
TCI Group’s nominees’ experience includes histories of bankruptcy, poor performance,
abysmal safety records, and conflicts of interest.
Two dissident, short-sighted shareholders are seeking a voting block of five and effective
control of CSX.
TCI Group has a poor track record, limited experience, and no coherent plan for CSX
The facts are…
CSX has grown
operating income
faster than CN
Expense and
margin gaps with
CN are narrowing
Investment Grade
is in CSX’s
best interest
CSX public targets
are most
aggressive in
the industry
CSX performance
drove leading
stock appreciation
The Truth
More than a third of CN’s growth since 1998 was due
to acquisitions and inflation (not true operating gains).
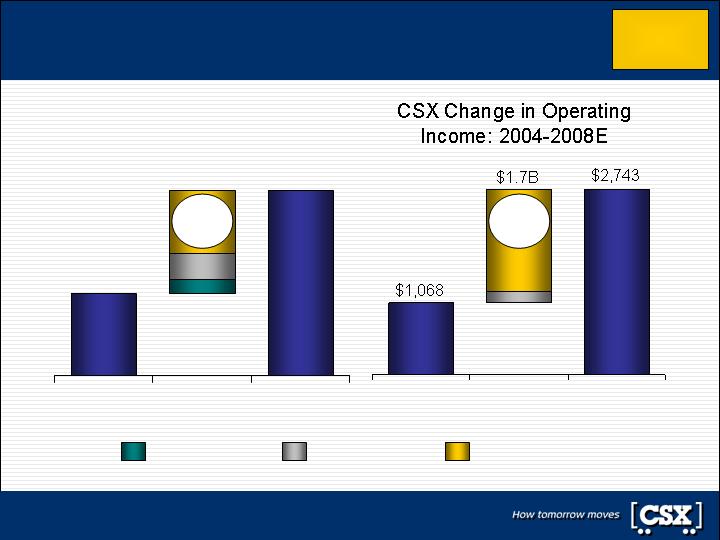
CSX on track to increase operating income by $1.7B
in just four years (outpacing CN’s C$1.6B over nine).
CN is a model of
income growth
CSX’s margin improved by 1,240 basis points since
2004, while CN margins have been essentially flat.
Expense gap has narrowed from 11% to 8% after
properly adjusting for the foreign currency translation.
The gap to CN
is widening
Extra $3B of debt today results in Junk Bond status,
increased cost of capital & only 2% EPS accretion.
CSX would lose financial flexibility, access to capital.
Junk Bond status
would create value
for CSX
CSX has targeted a low-70’s operating ratio by 2010,
with $400M+ of productivity savings from 2008-10.
Detailed plans to achieve targets have been
publicly communicated.
CSX has no public
targets to improve
operations
Price, productivity and yield management drive
unmatched margin expansion.
Industry-best shareholder returns over 1,2,3,4,5 years.
Industry-wide
factors drove
stock increase
TCI Group Claim
7
The facts are…
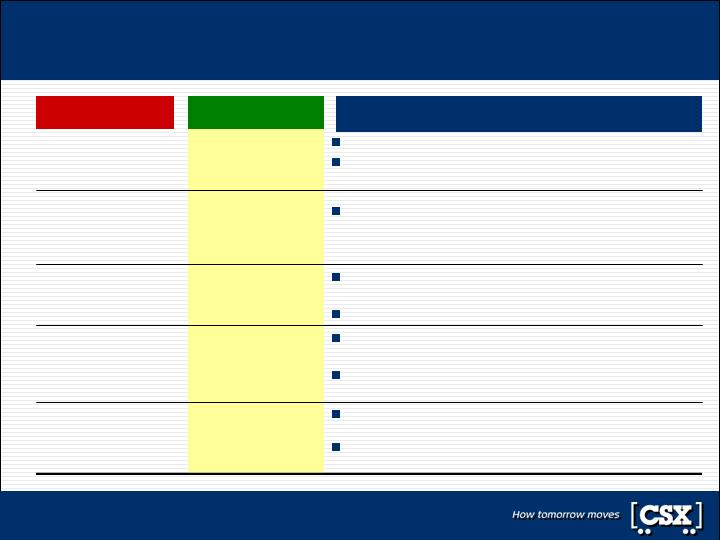
TCI Group uses bad math, flawed assumptions, half truths
The facts are…
CSX’s labor
efficiency per RTM
is better than NS
CSX pricing at
parity with NS and
increasing faster
CSX is top-tier in
customer service
Using meaningful
comparisons, CSX
is an industry
leader
Management
driving strong price
& productivity gains
The Truth
CSX does not count training as “hours worked,”
making comparison with NS invalid on this measure.
CSX labor cost per true unit of work is ~20% less than
NS, with further labor productivity initiatives in place.
CSX employees
are not as
efficient as NS
CSX’s longer average haul yields higher prices per
carload; adjusted price per RTM is at parity.
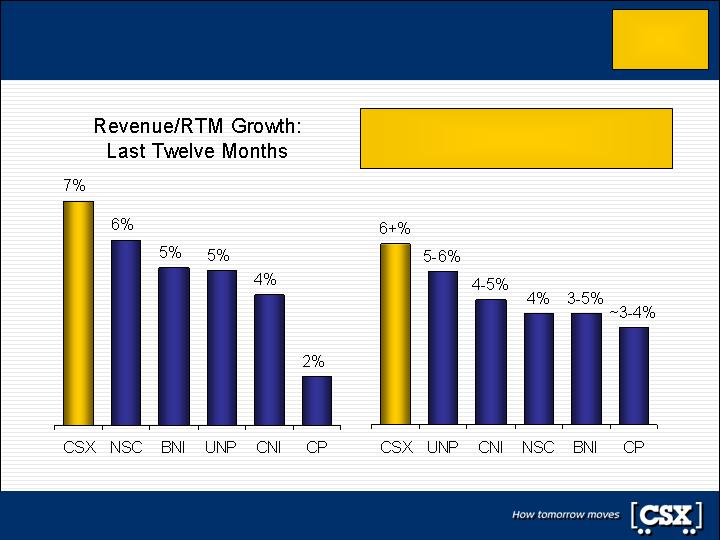
CSX pricing gains exceeded NS by over 300 bps in
‘07, with 6+% guidance in ‘08 versus only 4% at NS.
CSX prices at a
discount to NS
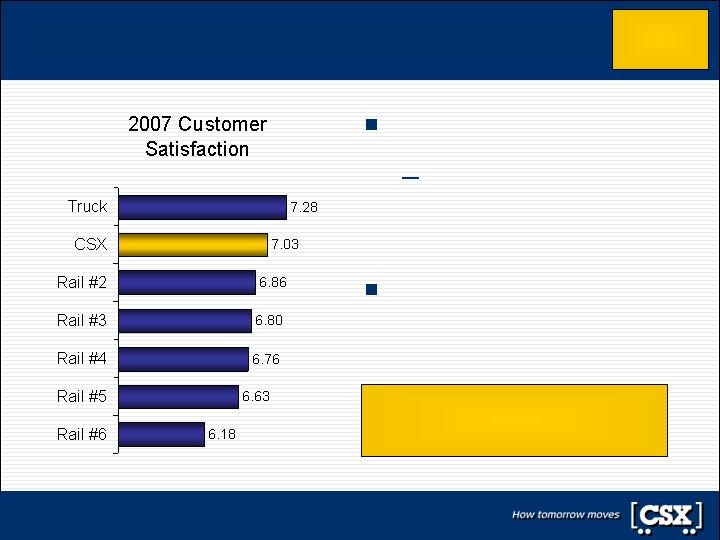
Third-party survey of 2,200 customers shows
CSX is #1 in total customer satisfaction.
On-time performance approaching all-time highs.
CSX is a poor
performer in
customer service
CSX is an industry leader in cost control per revenue
ton mile, price gains, customer service and
employee safety.
CSX is an industry
laggard on key
operational metrics
Productivity gains have exceeded $500M since 2003.
Price gains have been industry-leading due to strong
service and operational improvements.
CSX improvement
is from price with
no productivity
TCI Group Claim
8
The facts are…
TCI Group uses bad math, flawed assumptions, half truths
The facts are…
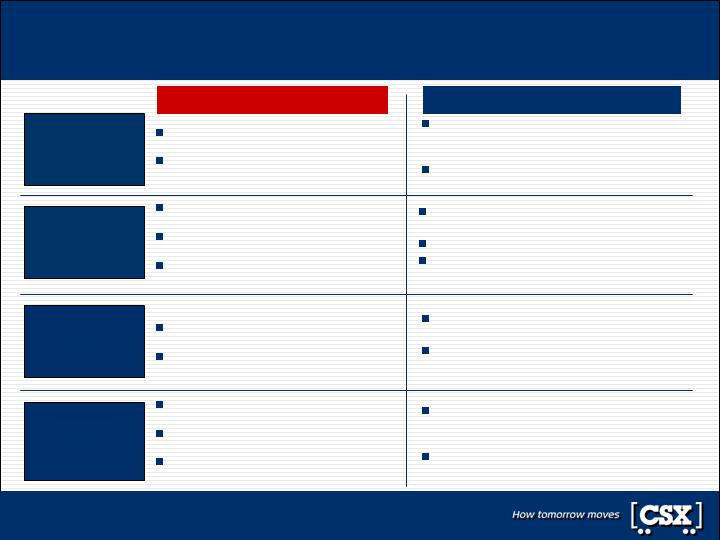
TCI Group Question
Productivity
Opportunity
Pricing
Performance
Capital
Allocation &
Structure
Corporate
Governance
9
Is this board capable of holding
management accountable?
Is this board working for shareholders
or for management?
Why does CSX lag peers on nearly
every operational metric?
Why does CSX have barely half the
profitability of CN?
Why doesn’t management have public
targets to improve operations?
Why does CSX price at a deep
discount to competitor NS?
Is there a smarter way to price?
Is the capital expenditure budget
economically justifiable?
How can we be comfortable that
management will be disciplined?
What is the right capital structure for a
business as strong as CSX?
The facts are…
TCI Group’s questions are answered by CSX’s performance
CSX Board of Directors is creating industry
leading shareholder value and continues to
raise the bar
Governance rating score of 99% is top tier
of industry
CSX is a leader in safety, service
and productivity
CSX margin tied for second; closing in on CN
Performance targets are transparent
and aggressive
CSX is an industry price leader, with the
most aggressive pricing guidance
Pricing process and discipline is
industry-leading
Disciplined capital spending in line with
peers and generating industry leading
shareholder returns
Aggressive, investment grade capital
structure

Corporate Governance
The facts are…
TCI Group’s questions are answered by CSX’s performance
CSX Board of Directors is creating industry leading
shareholder value and continues to raise the bar
Governance rating score of 99% is top tier of industry
Corporate
Governance
Productivity
Opportunity
Pricing
Performance
Capital
Allocation &
Structure
CSX is a leader in safety, service and productivity
CSX margin tied for second; closing in on CN
Performance targets are transparent and aggressive
CSX is an industry price leader, with the most
aggressive pricing guidance
Pricing process and discipline is industry-leading
Disciplined capital spending in line with peers and
generating industry leading shareholder returns
Aggressive, investment grade capital structure
11
The facts are...
CSX Board delivering superior shareholder value
Proven record of delivering value to shareholders
Superior stock performance, investing for long-term growth, nearly tripled
dividends, targeting nearly $6 billion of buybacks between 2006 and 2009
Presiding over fastest growing company in an attractive industry
Leads industry in safety, service and financial improvement
Recognized among industry leaders in safety and service
Knowledge and expertise in place to continue strong improvement
Diverse background already in place for presiding over dynamic business
Corporate governance practices recognized among best-in-class
Constructive tension between Board and management in place to drive value
The CSX Board has a proven track record
and is a market leader in corporate governance
Corporate
Governance
12
The facts are...
CSX is the leader in shareholder value creation
Total Shareholder Return
219%
203%
97%
28%
6%
CP
23%
150%
158%
177%
219%
314%
4 Years
56%
157%
215%
264%
285%
323%
5 Years
20%
124%
88%
86%
110%
218%
3 Years
7%
52%
15%
17%
26%
88%
2 Years
(7%)
23%
10%
7%
13%
40%
1 Year
S&P
500
UP
NS
CN
BNSF
CSX
Current returns as of 4/25/08.
In sharp contrast to TCI Group’s claim, CSX significantly
leads the industry in current shareholder returns
Corporate
Governance
13
Economics policy expert and former president of Johns
Hopkins University. Former Chairman and President
of the W.K. Kellogg Foundation.
Board experience includes Fortune 500 companies
in the transportation, energy and banking industries.
“Philanthropist”
William
Richardson
Career spans private equity and CEO of a major
business services provider. Board experience
includes Fortune 500 companies in the transportation,
aerospace, financial services and banking industries.
Former Vice
Chairman,
Cendant
Robert
Kunisch
Key role in airline deregulation and is a transportation and
economic policy expert. Former chair of business and public
policy department at Wharton School of Business.
Board experience includes Fortune 500 companies
in the transportation, banking, technology,
agricultural and food products industries.
“Business School
Professor”
Elizabeth
Bailey
The whole truth…
TCI Group
says…
Board
Member
The facts are...
Incumbent directors have broad experience base
Corporate
Governance
14
The facts are...
Incumbent directors have broad experience base
CEO of a major commercial development firm—substantial
infrastructure expertise in the eastern U.S. building
for industries, including ethanol, real estate development,
and building products, which are critical to
CSX’s business strategies.
“Jacksonville
Contractor”
Steven
Halverson
Medical, healthcare and social policy expert as well as
former Chairman of the National Medical Association.
Board experience includes Fortune 500
companies in the transportation, energy,
banking, healthcare, and food products industries.
“Doctor”
Frank
Royal
The whole truth…
TCI Group
says…
Board
Member
CSX Board members have significant transportation experience,
blue chip business experience, and governance and policy expertise
Corporate
Governance
15
The facts are…
Qualifications of TCI Group nominees raise questions
Chaired a publicly traded company sold through a distressed sale,
and has a career characterized by buyouts and leverage.
Former Director CN
& Former Chairman
Illinois Central
Gil
Lamphere
Led Northwest Airlines into bankruptcy and
sold more than 75% of his shares in the months
immediately leading up to the bankruptcy filing.
Former Chairman
Northwest Airlines
Gary
Wilson
Transitional CEO as Conrail was converted to a switching operator.
As Managing Director of London Underground, performance is
down sharply and need for government funding is up 600%.
No U.S. public board experience.
Former CEO
Conrail
Tim
O’Toole
Led Brazilian railroad a fraction of CSX’s size with an abysmal
safety record. No U.S. public board experience.
Former CEO ALL
(Brazil)
Alex
Behring
Demands for CSX, if implemented, could have impaired
shareholder value. Made statements raising significant regulatory
concerns in Washington. No U.S. public board experience, and
resigned from a UK board amid allegations of conflict of interest.
Creates
shareholder value
Chris
Hohn
The whole truth…
TCI Group
says…
Board
Member
Corporate
Governance
The choice between director slates is clear
16
The facts are…
TCI Group’s questions are answered by CSX’s performance
CSX Board of Directors is creating industry leading
shareholder value and continues to raise the bar
Governance rating score of 99% is top tier of industry
Corporate
Governance
Productivity
Opportunity
Pricing
Performance
Capital
Allocation &
Structure
CSX is a leader in safety, service and productivity
CSX margin tied for second; closing in on CN
Performance targets are transparent and aggressive
CSX is an industry price leader, with the most
aggressive pricing guidance
Pricing process and discipline is industry-leading
Disciplined capital spending in line with peers and
generating industry leading shareholder returns
Aggressive, investment grade capital structure
17
The facts are...
CSX’s Board is a leader in governance
CSX has a presiding independent director with delineated duties
Consistent with prevailing practice in the United States
CSX has a strong independent board
CEO is the only management director, with eleven outside directors
Best practices already in place at CSX
Key Board committees are comprised solely of independent directors
Election of entire Board is conducted annually
Majority election of Board in uncontested elections is required
No supermajority vote required
Ability of 15% of shareholders to call a special meeting
Executive severance payments capped at 2.99 times annual compensation
No poison pill
All incentive compensation is performance-earned
Corporate
Governance
CSX corporate governance ranks in top 1% of transportation companies
18
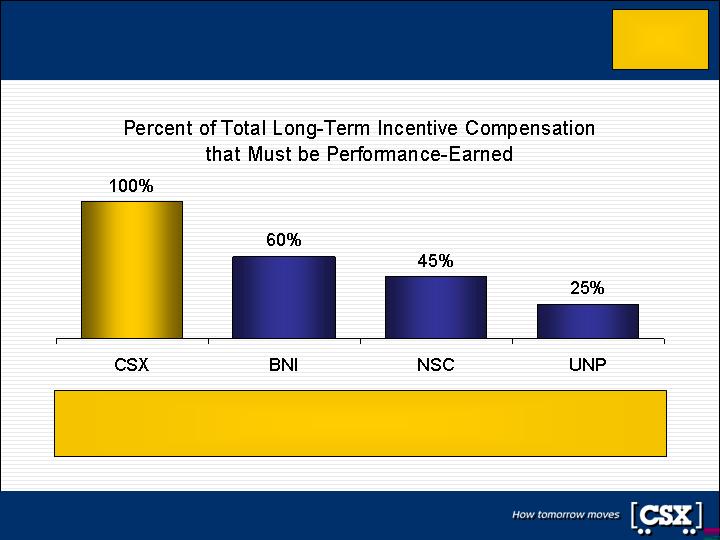
The facts are...
CSX incentive pay is entirely performance-earned
CSX is the only major railroad at which annual and
long-term incentive plans are both 100% performance-earned
Corporate
Governance
Source: 2008 Railroad Proxy Statements. Performance-earned excludes time-based stock options and restricted stock.
19
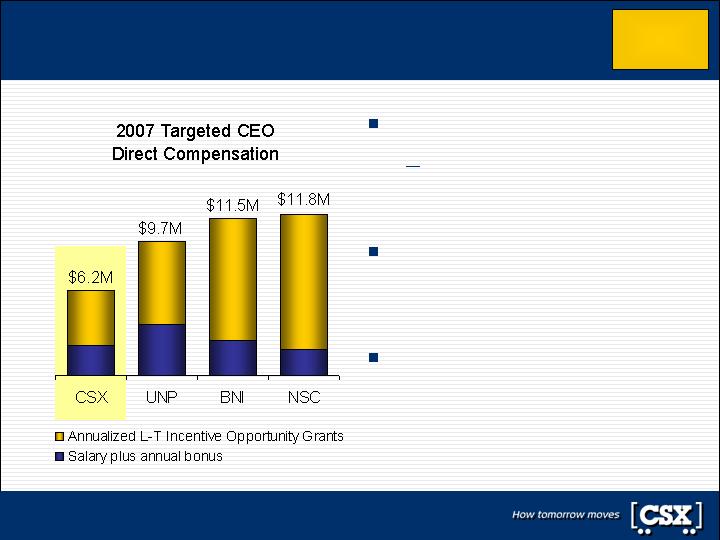
The facts are...
CSX targeted CEO pay is lowest of all U.S. rails
All of CSX’s CEO incentive pay is
performance-earned
Vesting of grants does not
occur unless performance
standards are met
CSX unmatched stock price
appreciation is a result of the most
impressive turnaround story of any
railroad since 2003
If other railroads had CSX’s stock
performance, CSX’s CEO would
have been the lowest paid U.S.
rail CEO from 2003-07
Source: 2004-2008 Railroad Proxy Statements.
CSX stock performance through 4/25/08.
Corporate
Governance
20

Productivity Opportunity
The facts are…
TCI Group’s questions are answered by CSX’s performance
CSX Board of Directors is creating industry leading
shareholder value and continues to raise the bar
Governance rating score of 99% is top tier of industry
Corporate
Governance
Productivity
Opportunity
Pricing
Performance
Capital
Allocation &
Structure
CSX is a leader in safety, service and productivity
CSX margin tied for second; closing in on CN
Performance targets are transparent and aggressive
CSX is an industry price leader, with the most
aggressive pricing guidance
Pricing process and discipline is industry-leading
Disciplined capital spending in line with peers and
generating industry leading shareholder returns
Aggressive, investment grade capital structure
22
The facts are...
CSX is a leader in safety, service and productivity
Safety: CSX is among industry leaders in safety and
train accident prevention
Service/Customer Satisfaction: CSX is now
top-tier in customer satisfaction measures as a
result of dramatic service improvements
Cost productivity: CSX has delivered $500M in
productivity savings since 2003, with at least an
additional $400M in productivity targeted through 2010
Productivity
Opportunity
23
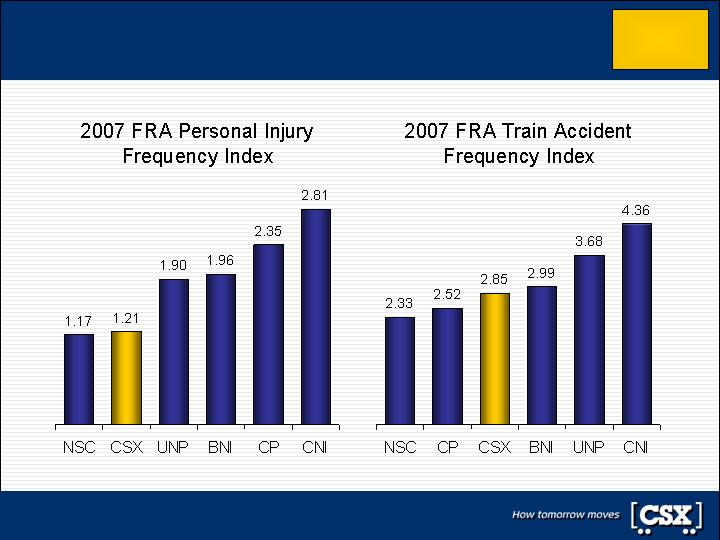
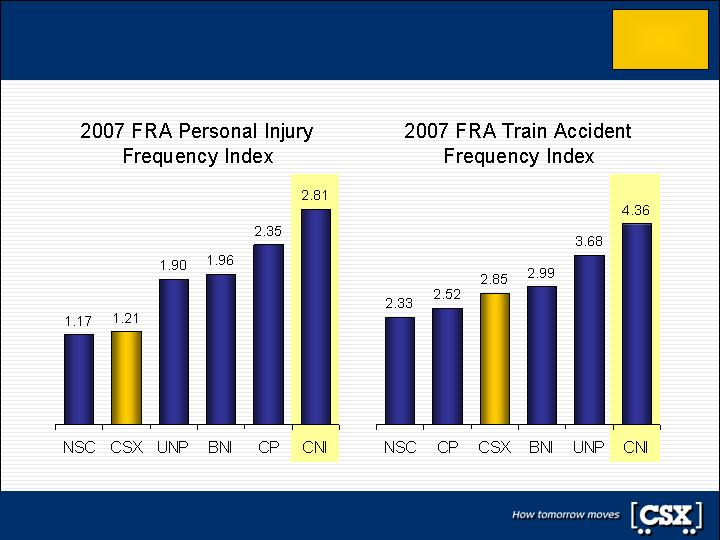
The facts are...
CSX is among industry leaders in safety
Productivity
Opportunity
Source: 2007 Federal Railroad Administration data
24

Safety: CSX is among industry leaders in safety and
train accident prevention
Service/Customer Satisfaction: CSX is now
top-tier in customer satisfaction measures as a
result of dramatic service improvements
Cost productivity: CSX has delivered $500M in
productivity savings since 2003, with at least an
additional $400M in productivity targeted through 2010
The facts are...
CSX is a leader in safety, service and productivity
Productivity
Opportunity
25
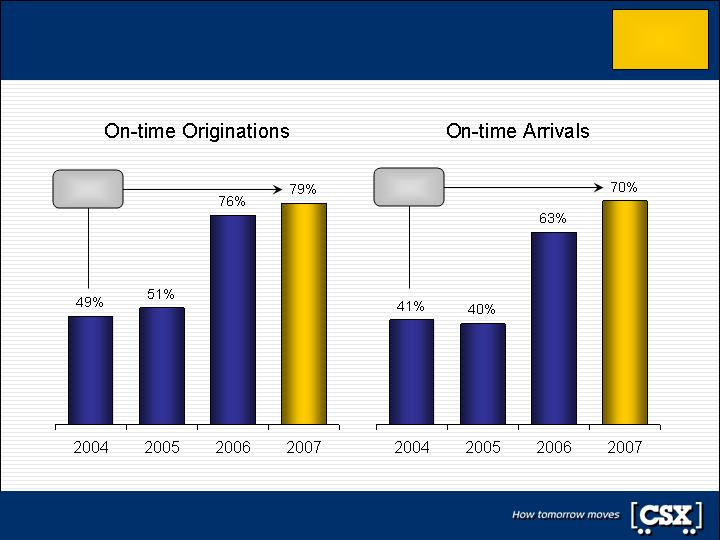
The facts are...
CSX’s service performance is dramatically improved
61%
Increase
71%
Increase
Productivity
Opportunity
26
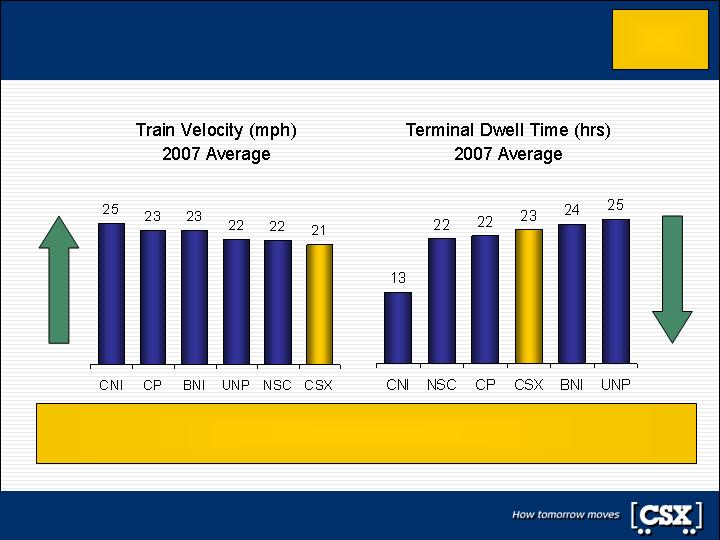
The facts are…
Velocity and dwell are not meaningfully comparable
Source: Original data published by American Association of Railroads (AAR) and CN website.
AAR states that velocity and dwell “cannot meaningfully be compared” due to
differences in mix, length of haul, methodology, etc. Yet, TCI Group did just that.
Better
Better
Productivity
Opportunity
27
The facts are...
CSX velocity by train type ahead of competitor NS
Source: Original data published by American Association of Railroads (AAR)
Productivity
Opportunity
Full Year 2007 AAR Velocity
(4%)
21.6
20.8
Total
(2%)
20.5
20.0
All Other
+ 7%
15.6
16.7
Coal
+ 4%
22.0
22.8
Auto
+ 5%
18.3
19.3
Grain
+ 6%
27.7
29.4
Intermodal
Difference
NS
CSX
28
Total velocity statistics are not
meaningfully comparable
across all railroads, primarily
due to train type mix
AAR publishes velocity by
train types to control for mix
—
CSX has higher velocity
than close competitor
NS in nearly all train types
—
NS total velocity is higher
than CSX only due to a
higher mix of faster
Intermodal traffic
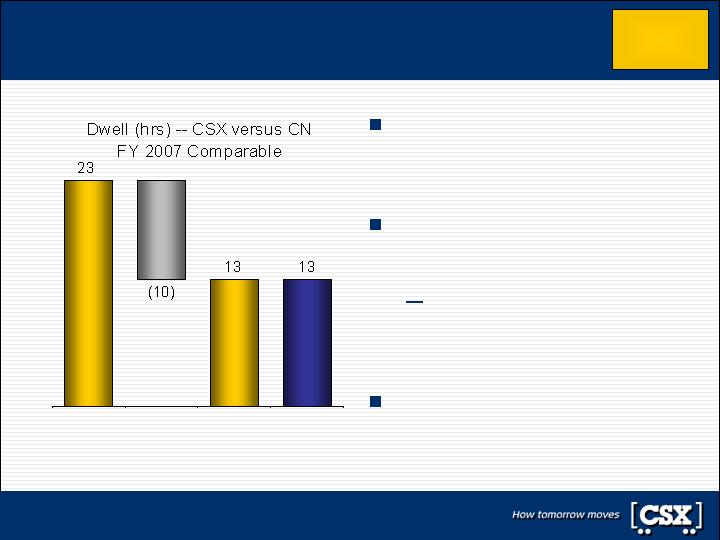
The facts are...
CSX dwell is on par with industry-leading CN
Dwell is the average time a
car resides at a terminal
location, expressed in hours
Cars that do not stop at
terminals (“through trains”)
are excluded from AAR dwell
However, CN includes
through trains in their
published dwell figure
On a comparable basis, CSX
dwell is on par with CN
CSX Dwell
(Reported)
Adj. for
through
trains
CSX
Adjusted
Dwell
CN
Dwell
Note: CSX analysis adjusts CSX’s AAR-reported Dwell to include through trains; CN Dwell from CN company website.
Productivity
Opportunity
29
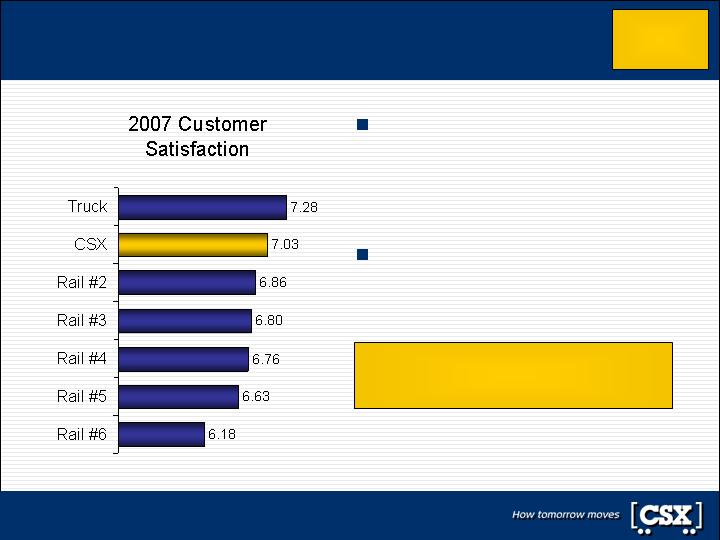
The facts are...
CSX is the industry leader in customer service
Customer satisfaction rankings
are based on independent
third-party survey with over
2,200 responses
Correlates to internal operating
measure gains
Source: Survey of CSX customers by a leading independent third-party surveyor
Productivity
Opportunity
Industry-leading service supports
industry-leading price gains
30
Safety: CSX is among industry leaders in safety and
train accident prevention
Service/Customer Satisfaction: CSX is now
top-tier in customer satisfaction measures as a
result of dramatic service improvements
Cost productivity: CSX has delivered $500M in
productivity savings since 2003, with at least an
additional $400M in productivity targeted through 2010
The facts are...
CSX is a leader in safety, service and productivity
Productivity
Opportunity
31
Productivity at CSX is defined as cost containment
CSX has achieved $500M+ of productivity since 2003
Disciplined approach will drive another $400M+ targeted through 2010
TCI Group claims CSX can achieve $2.2B of “productivity” over 5 years
The reality is, $1.8B of this “productivity” simply represents volume growth that is
economically dependant
The remaining $400M, or $80M annually, could be characterized as cost savings, but are
based on flawed and misleading assumptions and are not valid
The correct analysis targets $135M+ annually over the next three years,
but in very different areas than the TCI Group have identified
The facts are...
Discipline is key to aggressive productivity targets
CSX has clear and specific productivity initiatives
Network
Efficiency
Labor
Productivity
Locomotive
Fleet Mgmt.
Car Fleet
Utilization
Fuel
Efficiency
CSX’s plan targets $135M+ of real productivity annually
vs. the TCI Group’s foundationless lower targets
Productivity
Opportunity
32
The facts are...
TCI Group’s productivity analysis is flawed
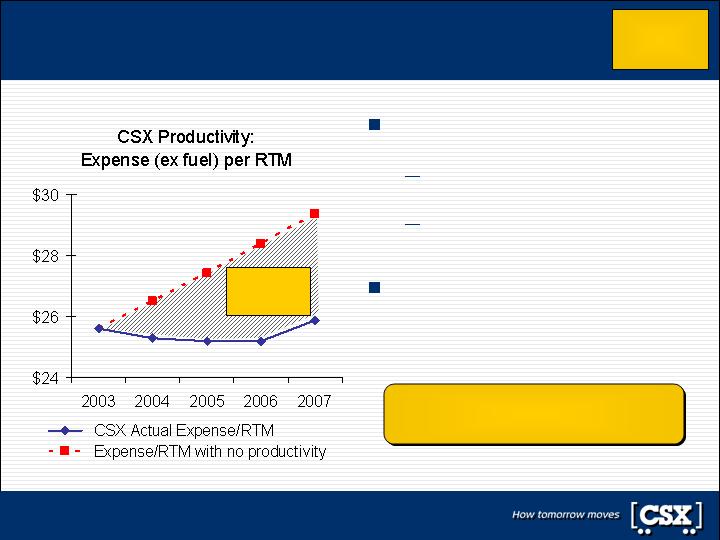
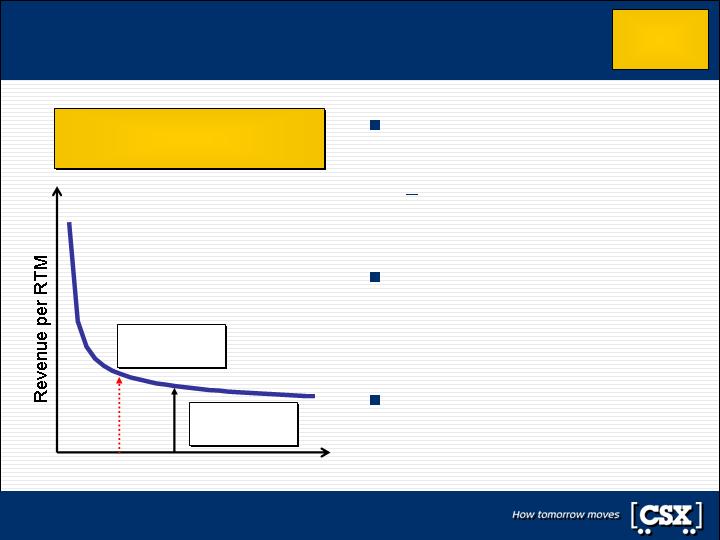
Productivity is appropriately
measured on a workload basis
Revenue ton miles (RTM)–not
carloads—define workload
RTM’s include both tons
carried and length of haul
TCI Group inappropriately
measured productivity on a
per carload basis
Note: Dashed line assumes inflation growth of 3.5% (based on AAR’s ALL-LF index 2004-07) and no productivity.
$500M of productivity since 2003
$400M+ more planned through 2010
Productivity
Opportunity
CSX
Productivity
Gains
33
The facts are...
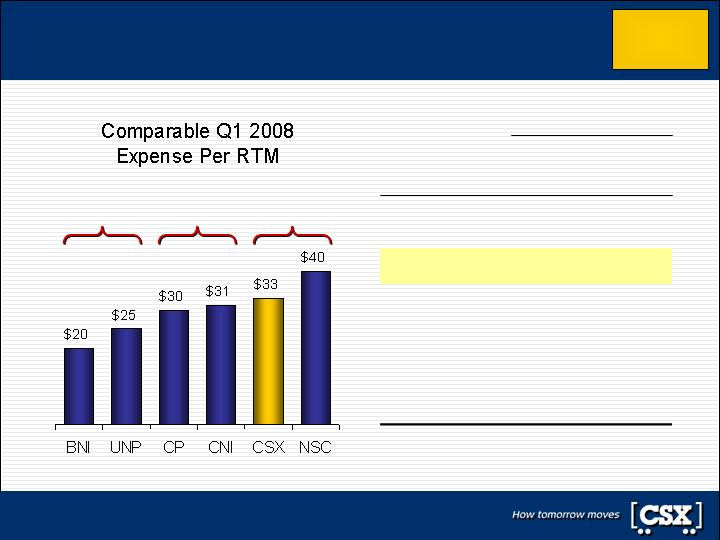
CSX among industry leaders in cost control
1Q04–1Q08 CAGR
4.9%
1.4%
2.3%
2.2%
0.5%
0.1%
Excluding
Fuel
8.7%
6
NSC
6.8%
5
BNI
6.6%
4
UNP
5.4%
3
CNI
3.9%
2
CSX
3.6%
1
CP
Expense
per RTM
Rank/Company
Note: See GAAP Reconciliation for CSX data; peer comparisons based on railroad financial reports and CSX Analysis.
Western
Rails
Eastern
Rails
Canadian
Rails
Productivity
Opportunity
34
The facts are...
CSX is number one after proper currency adjustment
Strengthening Canadian dollar
distorts comparability between
U.S. and Canadian rails
Using a fixed exchange rate to
U.S. dollars only compensates for
part of the issue
CN & CP translate U.S. dollar-
denominated expenses to
Canadian dollars
With a stronger Canadian
dollar, the translation of U.S.
dollar-denominated
expenses into Canadian
dollars understates expense
growth at CN & CP
Note: See GAAP Reconciliation for CSX data; peer comparisons based on railroad financial reports and CSX Analysis.
Adjusted CN & CP results sourced from CN/CP financial statements and CSX analysis.
1Q04–1Q08 CAGR
4.9%
5.5%
1.4%
2.3%
3.1%
0.5%
Adjusted,
Excluding
Fuel
8.7%
6
NSC
8.2%
5
CNI
6.8%
4
BNI
6.6%
3
UNP
6.0%
2
CP
3.9%
1
CSX
Adjusted
Expense
per RTM
Rank/Company
Productivity
Opportunity
35
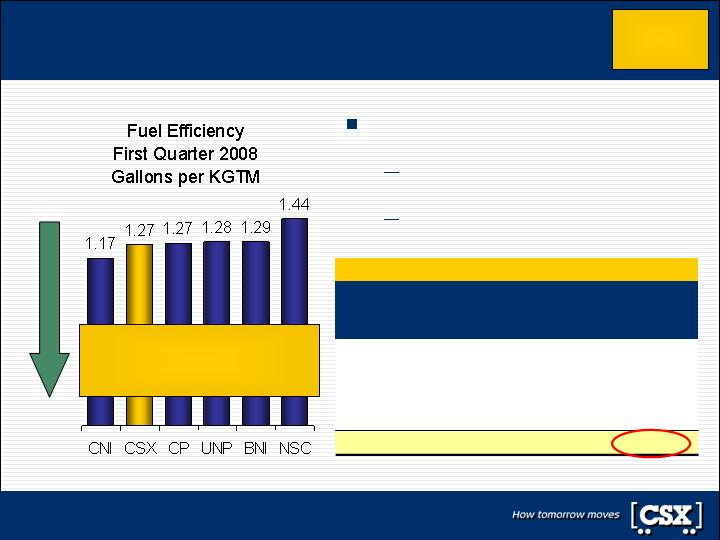
The facts are...
CSX is a leader in fuel efficiency
CN average length of haul is at least
800 miles – one-third longer than CSX
Math shows that TCI Group’s 600
mile average haul for CN is wrong
Longer hauls are more fuel
efficient
Better
Source: Railroad financial reports and CSX analysis. CN length of haul based on CN financial reports. KGTM is
thousand gross ton miles.
CSX’s fuel efficiency is 1.05
for 800-900 mile moves…
10% better than CN
CN Average Length of Haul Estimate
4,744k
1,324k
3,059k
361k
Units
850 miles
64
184.2
Total
1,640 miles
15
32.6
Intermodal
565 miles
80
137.8
Merchandise
/Auto
365 miles
Approx.
Average
Haul
13.8
KRTM
105
Est.
Tons/
Unit
Coal
Market
Productivity
Opportunity
36
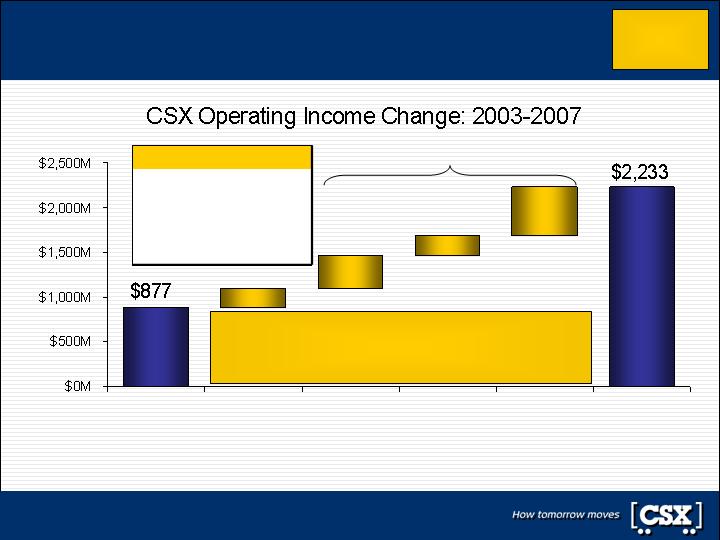
The facts are…
Management drives price, volume and productivity
2003
Comparable
Operating
Income
2007
Comparable
Operating
Income
Net
Inflation
Real
Pricing
Volume
Productivity
28%
Real Pricing
16%
Volume
40%
16%
Net Inflation
Productivity
Sources of Income Growth
Sustained, industry leading price above inflation.
Volume is up 7% on RTM basis with favorable mix.
Productivity has exceeded $500M.
Note: Inflation assumed at 3.5% based on AAR’s ALL-LF index. Real pricing based on “same store sales” price gains less
inflation and net impact from fuel price. See GAAP Reconciliation for CSX data.
Management Action
Productivity
Opportunity
37
The facts are…
TCI Group’s questions are answered by CSX’s performance
CSX Board of Directors is creating industry leading
shareholder value and continues to raise the bar
Governance rating score of 99% is top tier of industry
Corporate
Governance
Productivity
Opportunity
Pricing
Performance
Capital
Allocation &
Structure
CSX is a leader in safety, service and productivity
CSX margin tied for second; closing in on CN
Performance targets are transparent and aggressive
CSX is an industry price leader, with the most
aggressive pricing guidance
Pricing process and discipline is industry-leading
Disciplined capital spending in line with peers and
generating industry leading shareholder returns
Aggressive, investment grade capital structure
38
The facts are...
CSX safety, service, productivity gains outpacing CN
CSX margin difference to CN is closing rapidly
CN’s Q1 2008 margin is 30 bps below Q1 2004
CSX has improved by 1,240 bps over this period
CSX is closing the expense gap with CN
CN expense growth artificially low due to currency
translation impact
CN lags the industry in safety and customer service,
which are key CSX long-term strategies to create
shareholder value
Productivity
Opportunity
39
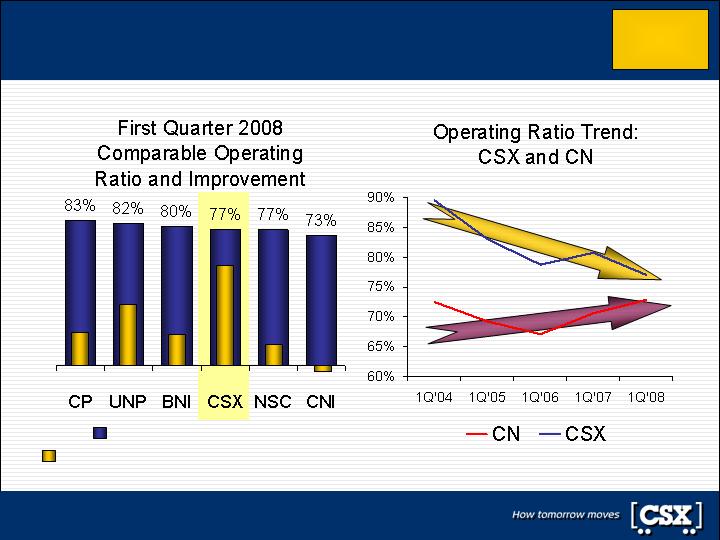
The facts are...
CSX is among industry leaders in operating ratio
420
760
410
1,240
270
(30)
Note: See GAAP Reconciliation for CSX data; peer comparisons based on First Call data
Q1 2008 Operating Ratio
Q1 2008 vs. Q1 2004 Improvement (bps)
Productivity
Opportunity
40
The facts are...
CSX safety, service, productivity gains outpacing CN
Productivity
Opportunity
CSX margin difference to CN is closing rapidly
CN’s Q1 2008 margin is 30 bps below Q1 2004
CSX has improved by 1,240 bps over this period
CSX is closing the expense gap with CN
CN expense growth artificially low due to currency
translation impact
CN lags the industry in safety and customer service,
which are key CSX long-term strategies to create
shareholder value
41
The facts are...
CSX is closing the cost gap with CN
CN’s results over time must be adjusted for the favorable impact from
translation of U.S. dollar-denominated expenses into Canadian dollars
11% Gap
8%
Gap
Note: Analysis assumes fixed 2007 exchange rate to USD. Adjusted CN results sourced from CN Financial
statements and CSX analysis. See Appendix for details.
Productivity
Opportunity
TCI Group analysis
ignores translation impact
42
The facts are...
CSX safety, service, productivity gains outpacing CN
Productivity
Opportunity
CSX margin difference to CN is closing rapidly
CN’s Q1 2008 margin is 30 bps below Q1 2004
CSX has improved by 1,240 bps over this period
CSX is closing the expense gap with CN
CN expense growth artificially low due to currency
translation impact
CN lags the industry in safety and customer service,
which are key CSX long-term strategies to create
shareholder value
43
The facts are...
CN ranks last in safety over the last 12 months
Productivity
Opportunity
Source: 2007 Federal Railroad Administration Data
44
The facts about CSX's performance…
CSX’s service is improving while CN declines
CSX’s customer satisfaction
ratings are industry-leading
On-time performance,
dwell and velocity all
show strong improvement
for CSX
According to a recent Morgan
Stanley survey, 37% of CN’s
customers report
deteriorating service
Productivity
Opportunity
Source: Customer Satisfaction survey is of CSX customers by a leading independent third-party surveyor. Morgan
Stanley Research by William Greene, 18 April 2008.
CSX’s long-term strategy is to
create price sustainability through
superior customer service
45
The facts are...
CSX’s superior service drives margin expansion
CSX is the leader in service, price and margin expansion
(30 bps)
31%
1240 bps
50%
Q1 ’08 vs.
Q1 ‘04
(180 bps)
4%
160 bps
8%
FY ‘07 vs.
FY ‘06
Margin
Expansion
Revenue per
Unit Growth
Margin
Expansion
Revenue per
Unit Growth
CN
CSX
CSX’s relentless pursuit of excellence in customer service
drives pricing power and margin expansion
Note: CN’s results over time have been adjusted for the currency translation impact of the stronger Canadian dollar on
U.S. dollar-denominated revenues. Operating Margin based on First Call data. See GAAP Reconciliation for CSX data.
Productivity
Opportunity
46
The facts are...
CSX gained more in four years than CN did in nine
2004
Operating
Income
2008E
Operating
Income
Four-Year
Improvement
Acquisitions
Net Inflation
True Gains
Note: CSX Analysis of CN reported financials uses 3.0% inflation rate for ‘98-’07 and 3.5% from 2004-08 (based on AAR’s
ALL-LF Index). CSX 2008E based on latest Analyst Consensus as of May 9, 2008. See GAAP Reconciliation for CSX data.
$1.5B
Productivity
Opportunity
1998
Operating
Income
2007
Operating
Income
Nine-Year
Improvement
CN Change in Operating
Income: 1998-2007
C$2,876
C$1.6B
C$1,281
C$1.0B
47
The facts are…
TCI Group’s questions are answered by CSX’s performance
CSX Board of Directors is creating industry leading
shareholder value and continues to raise the bar
Governance rating score of 99% is top tier of industry
Corporate
Governance
Productivity
Opportunity
Pricing
Performance
Capital
Allocation &
Structure
CSX is a leader in safety, service and productivity
CSX margin tied for second; closing in on CN
Performance targets are transparent and aggressive
CSX is an industry price leader, with the most
aggressive pricing guidance
Pricing process and discipline is industry-leading
Disciplined capital spending in line with peers and
generating industry leading shareholder returns
Aggressive, investment grade capital structure
48
The facts are...
CSX has transparent and aggressive guidance
Exceed $1B
in 2010
Free Cash Flow
Before Dividends
Low 70’s
By 2010
Operating Ratio
18%–21%
CAGR
Earnings Per Share
13%–15%
CAGR
Operating Income
2008–2010
Targets
Note: Compound annual growth rates are off comparable 2007 results; EPS targets are stated before share buybacks
CSX has raised guidance three times since 2005—from “Mid-high 70’s”
Operating Ratio down to “Low 70’s” Operating Ratio target
Productivity
Opportunity
49

The facts are...
CSX targets an additional $400M+ through 2010
Total Service Integration (TSI) takes
operating performance to the next level
Utilizes capacity and efficiency to
support growth
Aligns customer needs with
operating capabilities
2008
2009-10
2011+
Process Improvement Teams
have developed a pipeline of
initiatives to meet $400M+
productivity target by 2010
Despite TCI Group claims, CSX has specific productivity targets
and is actively pursuing new opportunities
Productivity
Opportunity
50
The facts are...
Detailed initiatives to deliver the $400M+ of savings
Implementing on-board fuel saving systems
Effective deployment of new fuel efficient locomotives
Fuel Efficiency
Utilization gains through reduced dwell
Improved reclaim and settlement reduces cost
Car Fleet Utilization
Utilization gains with advanced planning tools,
distributed power and TSI
Driving maintenance efficiency and reliability
Locomotive Fleet
Management
Technology drives terminal and customer efficiency
Driving infrastructure maintenance productivity with
process and technology
Labor Productivity
Continuous focus on plan efficiency through design
TSI building reliable and productive service products
Network Efficiency/
Total Service Integration
Strategies for achieving targets
Key Focus Area
Process improvement teams have continuously delivered on
clear productivity targets and have a pipeline of specific initiatives
Productivity
Opportunity
51
The facts are...
Productivity targets include locomotives
TCI Group says CSX and NS
should have the same
locomotive maintenance cost
However, CSX has 25%
more KGTM’s; thus,
locomotive maintenance
costs are largely in line
CSX already has plans in
place to generate productivity
through improved locomotive
maintenance
Source: 2006 R1, excluding lease and depreciation expense. KGTM’s based on CSX and NS 2006 financial reports.
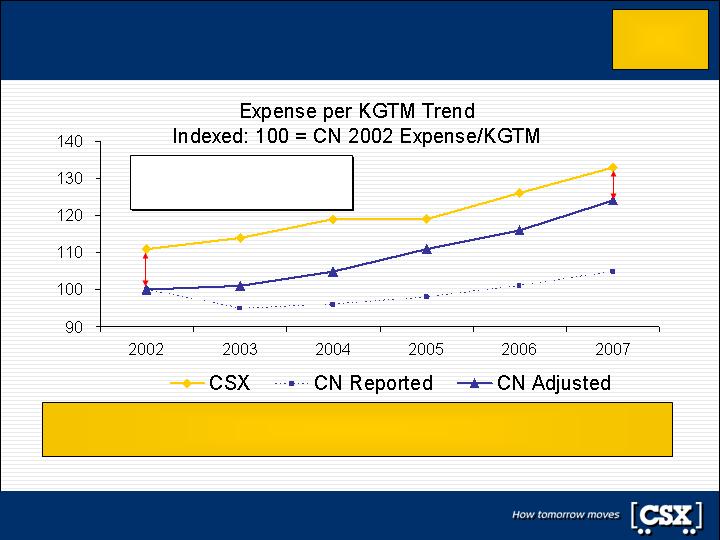
Equal costs per KGTM represent a $35M opportunity for CSX
The best measure of locomotive
productivity is Expense/KGTM
9%
$0.82
$0.89
Expense/KGTM
474
$424M
$0.83
CSX
35%
$315M
Loco Expense
23%
12%
%
384
$0.74
NS
KGTM’s
“TCI Group Math”
The “correct math”
yields a 9% cost gap
Productivity
Opportunity
52
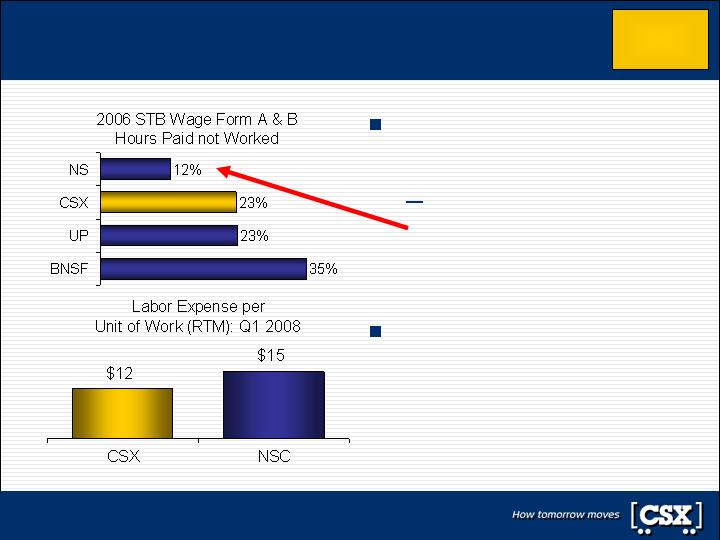
The facts are...
TCI Group’s labor opportunities are overstated
CSX is in line with the
rail industry for hours paid
not worked
NS uniquely counts
training as “hours
worked,” making their
statistic not comparable
CSX remains focused on
labor productivity, but spends
20% less per unit of work
(RTM) on labor expense
than NS
Source: STB Wage Form A&B, Q1 2008 company financial reports.
Productivity
Opportunity
53

Pricing Performance

The facts are…
TCI Group’s questions are answered by CSX’s performance
CSX Board of Directors is creating industry leading
shareholder value and continues to raise the bar
Governance rating score of 99% is top tier of industry
Corporate
Governance
Productivity
Opportunity
Pricing
Performance
Capital
Allocation &
Structure
CSX is a leader in safety, service and productivity
CSX margin tied for second; closing in on CN
Performance targets are transparent and aggressive
CSX is an industry price leader, with the most
aggressive pricing guidance
Pricing process and discipline is industry-leading
Disciplined capital spending in line with peers and
generating industry leading shareholder returns
Aggressive, investment grade capital structure
55
The facts are...
CSX is an industry leader in pricing for value
CSX “pure price” guidance for 2008
is the highest in the industry
Note: Peer comparisons based on First Call data. CN & CP adjusted for translation impact of Canadian dollar on U.S.
dollar-denominated revenues. Price guidance given by rail executives on analyst calls. LTM is Q207-Q108 vs. Q206-Q107.
Pricing
Performance
56
The facts are...
CSX pricing in line given longer hauls versus NS
Revenue per RTM is non-linear,
declines with longer hauls
Length of Haul (Miles)
NS
Average Haul
CSX
Average Haul
CSX’s average length of haul
is ~10% longer than NS with a
broader network reach
Recovery of pick-up and drop-off
costs results in declining revenue
per RTM for longer hauls
Adjusting for length of haul and
equipment privatization, CSX’s
revenue per RTM is
comparable to NS
Third-party analysis confirms
CSX’s pricing strategy is
focused and effective
Pricing
Performance
57
The facts are...
CSX pricing gains outpacing NS on any measure
3 pts
4%
7%
4 pts
4%
8%
Total
(2 pts)
8%
6%
(3 pts)
2%
(1%)
Intermodal
3 pts
5%
8%
4 pts
6%
10%
Merchandise/
Auto
6 pts
2%
8%
8 pts
3%
11%
Coal
CSX
vs. NS
NS
CSX
CSX
vs. NS
NS
CSX
2007 vs. 2006
Revenue per RTM
2007 vs. 2006
Revenue per Unit
Measuring on either a revenue per unit or per RTM basis,
CSX beat NS in 2007 and has more aggressive guidance in 2008.
Pricing
Performance
58
The facts are…
TCI Group’s questions are answered by CSX’s performance
CSX Board of Directors is creating industry leading
shareholder value and continues to raise the bar
Governance rating score of 99% is top tier of industry
Corporate
Governance
Productivity
Opportunity
Pricing
Performance
Capital
Allocation &
Structure
CSX is a leader in safety, service and productivity
CSX margin tied for second; closing in on CN
Performance targets are transparent and aggressive
CSX is an industry price leader, with the most
aggressive pricing guidance
Pricing process and discipline is industry-leading
Disciplined capital spending in line with peers and
generating industry leading shareholder returns
Aggressive, investment grade capital structure
59

The facts are...
CSX uses capacity pricing to manage demand
Capacity-based pricing has been in place for years
Pricing in some markets is set on an ongoing basis to help optimize
network capacity, balance freight and enhance profits
For example, CSX Intermodal continuously modifies
prices across its entire market of owned equipment
CSX charges up to 50% more in periods of peak demand to help
optimize capacity and maximize profits
CSX uses an auction process when demand for
specific car types significantly exceeds supply
CSX’s pricing process and discipline is industry leading
Pricing
Performance
60

Capital Allocation & Structure
The facts are…
TCI Group’s questions are answered by CSX’s performance
CSX Board of Directors is creating industry leading
shareholder value and continues to raise the bar
Governance rating score of 99% is top tier of industry
Corporate
Governance
Productivity
Opportunity
Pricing
Performance
Capital
Allocation &
Structure
CSX is a leader in safety, service and productivity
CSX margin tied for second; closing in on CN
Performance targets are transparent and aggressive
CSX is an industry price leader, with the most
aggressive pricing guidance
Pricing process and discipline is industry-leading
Disciplined capital spending in line with peers and
generating industry leading shareholder returns
Aggressive, investment grade capital structure
62
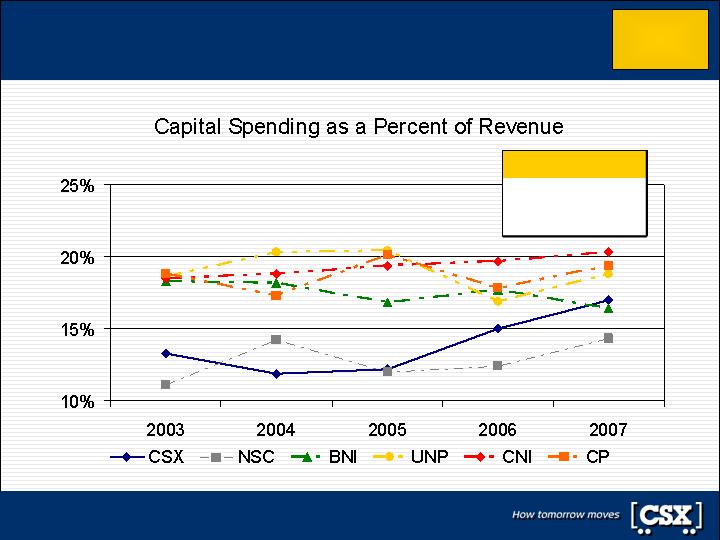
The facts are...
Disciplined capital spending is on par with peers
17%
14%
CSX
Industry
5-Year Average
Capital
Allocation &
Structure
Note: Capital spending based on CSX analysis.
63
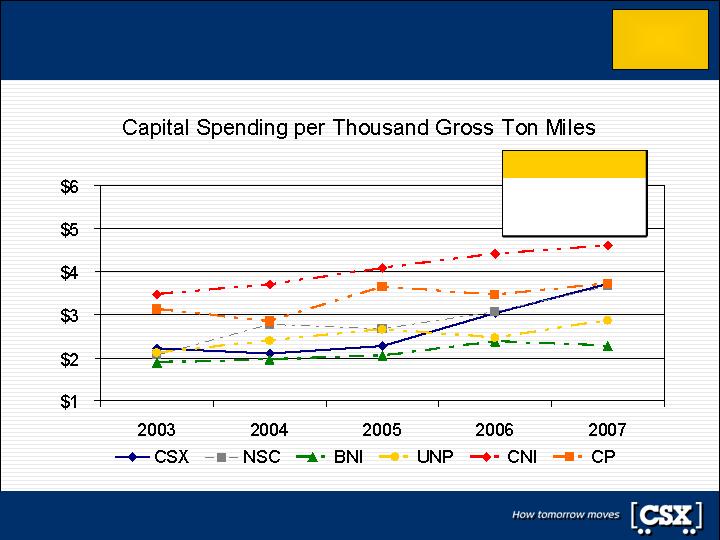
The facts are...
Disciplined capital spending is on par with peers
$2.97
$2.67
CSX
Industry
5-Year Average
Capital
Allocation &
Structure
Note: Capital spending based on CSX analysis.
64
The facts are...
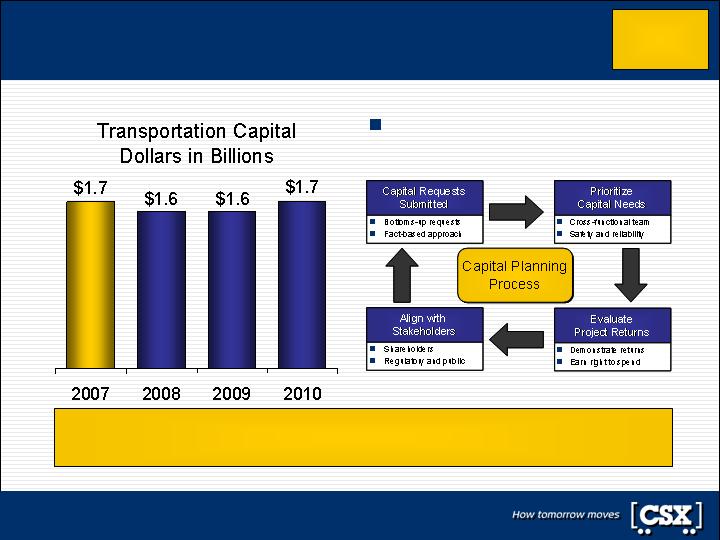
Transparent capital plan aims to maximize returns
Note: Excludes Katrina-related capital. 2007 includes $200M of locomotive refinancing.
Capital plans are consistent
with strategic objectives
Disciplined capital analysis aims to
maximize investment returns on replacement cost basis
Capital
Allocation &
Structure
65

The facts are...
Capital plan based on economics, scientific modeling
Open-top Hoppers
Multilevels
Gondolas
Covered Hoppers
Other
Reinvestment
Hurdle Rate
Returns by Car Type
Investment decisions on equipment
are guided by economic analysis
Cars must meet reinvestment hurdle
rate to merit replacement
Locomotives must deliver
asset productivity
Freight Car Reinvestment Profile
Track Defect Rate by
Accumulated Tonnage
Accumulated Tonnage
Inflection point based on
industry research
Infrastructure investments are dictated
by proactive, scientific modeling
Track replacement technology
improves safety and service
Capital
Allocation &
Structure
66
Strategic investments address
Intermodal needs, volume
shifts and bottlenecks
Detailed economic
modeling drives decisions
CSX strategic capital spending
helps drive operating results
Network velocity most
improved of all Class I rails
since 2004
The facts are...
Economics, operating gains drive capital investment
Average Velocity
Waycross to Atlanta: Key Growth Lane
Miles per Hour
10
15
20
25
30
Jan-06
Jul-06
Jan-07
Jul-07
Jan-08
Strategic investment made in 2006.
Velocity up 30% since that time.
Adequate Capacity
Approaching Capacity
Capacity Constrained
2010 Projected Capacity
Growth in
strategic lanes
requires investment
Capital
Allocation &
Structure
67
The facts are…
TCI Group’s questions are answered by CSX’s performance
CSX Board of Directors is creating industry leading
shareholder value and continues to raise the bar
Governance rating score of 99% is top tier of industry
Corporate
Governance
Productivity
Opportunity
Pricing
Performance
Capital
Allocation &
Structure
CSX is a leader in safety, service and productivity
CSX margin tied for second; closing in on CN
Performance targets are transparent and aggressive
CSX is an industry price leader, with the most
aggressive pricing guidance
Pricing process and discipline is industry-leading
Disciplined capital spending in line with peers and
generating industry leading shareholder returns
Aggressive, investment grade capital structure
68
The facts are...
CSX is currently at lowest long-term cost of capital
Access
Costs
Distress
Costs
Equity
Risk
Risk-Free
Rate
AAA
High Yield
BBB-
Cost of Capital
Debt Tax
Shield
Capital
Allocation &
Structure
69
The facts are...
Investment banks agree with CSX analysis
BBB-
Investment Bank 4
BBB-
Investment Bank 5
BBB-
CSX Analysis
BBB-
Investment Bank 3
BBB/BBB-
Investment Bank 2
BBB
Investment Bank 1
CSX
Lowest Cost
of Capital
Every investment bank
advising CSX recommended
a target capital structure with
debt levels at Investment
Grade
Targets lowest cost of
capital
Balances cost of capital
with financial flexibility
and market access
Capital
Allocation &
Structure
70
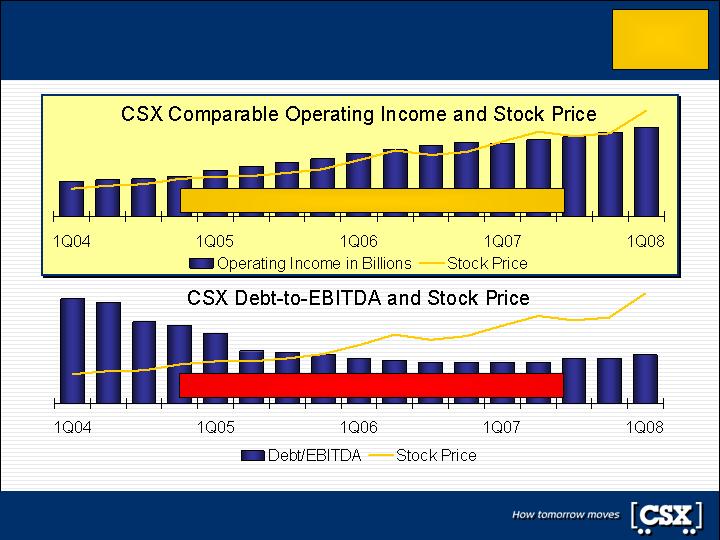
The facts are...
Lasting value comes from operations, not leverage
Note: Debt-to-EBITDA and Operating Income are expressed on a rolling twelve month basis
CSX leverage and stock price negatively correlated
Capital
Allocation &
Structure
CSX income and stock price 97% correlated
71
The facts are...
Driving value through balanced capital deployment
Capital
Investment
Investing $5B through
2010 to support
long-term growth
Share
Buybacks
Repurchased nearly
$3B since 2006
Targeting another $3B
by year-end 2009
Dividends
Nearly tripled the
quarterly dividend
since 2005
. . . While maintaining an investment grade profile
Growing Free Cash Flow and
Improving Return on Invested Capital . . .
Capital
Allocation &
Structure
72
The facts are...
TCI Group’s ideas restrict financial flexibility
Analysis shows EPS accretion of only 2% by bringing
CSX below Investment Grade to buy back shares1
TCI Group inaccurately suggests that taking CSX below
Investment Grade would create significant shareholder value
Additionally, incremental leverage to below Investment
Grade for CSX:
Increases the risk of distress
Destroys prudent financial flexibility and regular, uninterrupted
access to capital markets
Abandons long-term capital policy for short-term speculation
CSX drives value through balanced strategic capital deployment
Capital
Allocation &
Structure
1 See appendix for EPS accretion analysis.
73
The facts are...
CSX must maintain financial flexibility
The rail value proposition is strong even in the face of
an economic downturn, however…
Financial flexibility for major adverse events is critical,
especially in a weak economic environment
Natural disasters or acts of terrorism
Incidents with significant loss of life and property damage
Exploitative local litigation for minor incidents
CSX has an ongoing need for financial flexibility
and uninterrupted access to debt capital markets
Capital
Allocation &
Structure
74
The facts are…
TCI Group’s questions are answered by CSX’s performance
CSX Board of Directors is creating industry leading
shareholder value and continues to raise the bar
Governance rating score of 99% is top tier of industry
Corporate
Governance
Productivity
Opportunity
Pricing
Performance
Capital
Allocation &
Structure
CSX is a leader in safety, service and productivity
CSX margin tied for second; closing in on CN
Performance targets are transparent and aggressive
CSX is an industry price leader, with the most
aggressive pricing guidance
Pricing process and discipline is industry-leading
Disciplined capital spending in line with peers and
generating industry leading shareholder returns
Aggressive, investment grade capital structure
75

GAAP Reconciliation

GAAP Reconciliation Disclosure
CSX reports its financial results in accordance with generally accepted accounting principles
(“GAAP”). However, management believes that certain non-GAAP financial measures used to
manage the company’s business that fall within the meaning of Regulation G (Disclosure of Non-
GAAP Financial Measures) by the SEC may provide users of the financial information with additional
meaningful comparisons to prior reported results.
CSX has provided operating income, ratio and earnings per share adjusted for certain items, which
are non-GAAP financial measures. The company’s management evaluates its business and makes
certain operating decisions (e.g., budgeting, forecasting, employee compensation, asset
management and resource allocation) using these adjusted numbers
Likewise, this information facilitates comparisons to financial results that are directly associated with
ongoing business operations as well as provides comparable historical information. Lastly, earnings
forecasts prepared by stock analysts and other third parties generally exclude the effects of items
that are difficult to predict or measure in advance and are not directly related to CSX’s ongoing
operations. A reconciliation between GAAP and the non-GAAP measure is provided. These non-
GAAP measures should not be considered a substitute for GAAP measures.
77
GAAP Reconciliation to comparable results
77.0%
77.7%
79.3%
81.9%
86.7%
88.4%
87.2%
Comparable Operating Ratio
$ 624
$ 2,233
$ 1,981
$ 1,556
$ 1,068
$ 877
$ 1,010
Comparable Operating Income
-
-
-
-
-
108
-
Plus Additional Loss on Sale
-
-
-
-
-
232
-
Plus Provision for Casualty
Claims
-
-
-
-
71
22
-
Plus Restructuring Charge
(2)
(27)
(168)
-
-
-
-
Less Pretax Gain on
Insurance Recoveries
2,087
7,770
7,417
7,062
7,043
7,058
6,906
Operating Expense
$ 2,713
$ 10,030
$ 9,566
$ 8,618
$ 8,040
$ 7,573
$ 7,916
Operating Revenue
Q108
2007
2006
2005
2004
2003
2002
Dollars in millions
78

Appendix
Canadian National expenses adjusted for repatriation of
U.S.-Dollar denominated costs (page 41)
$5,483M
$5,244M
$4,841M
$4,477M
$4,065M
$3,946M
Adjusted
Expense
(USD)
$15.76
347.9
$5,891M
$870M
$5,021M
2007
$14.86
353.0
$5,634M
$735M
$4,899M
2006
$14.12
342.9
$5,201M
$585M
$4,616M
2005
$13.45
332.8
$4,810M
$430M
$4,380M
2004
$12.96
313.6
$4,367M
$260M
$4,107M
2003
$12.77
309.1
$4,240M
—
$4,240M
2002
Adjusted
Expense/
KGTM
KGTM
Adjusted
Expense
(C$)
Adjustment
(in C$)
Reported
Expense
(C$)
Year
Note: Reported expense from First Call. Exchange rate constant at $1.0744 C$/USD (FY 2007 average).
Repatriation impact from CN Financial Statements and CSX Analysis.
80
CN true gains in operating income were C$1.0 billion over
nine years (slide 46)
Calculated
$982M
True Gains
$2,876M
2007 Op
Income
CN press releases indicate C$478 million in
additional annual revenue from the acquisitions.
Actual operating margin in 2004 for these
companies post-acquisition was 35% per CN 2004
annual report
$167M
Great Lakes
& BC Rail
Represents 2 times the first half 2001 WC
operating income per the June 30, 2001 10Q,
translated to Canadian Dollars
$56M
Wisconsin
Central
Acquisitions:
Inflation of 3.0% is the industry's CAGR inflation
(1998-2007) as measured by the AAR's ALL-LF
Index (costs excluding fuel)
$390M
$1,175M
$1,556M
Inflation
Source: CN 2000 Annual Report, p. 12.
Includes consolidation of Illinois Central assuming
acquisition on 1/1/98.
Excludes 1998 Special Charge of C$590 million.
$1,281M
$3,856M
$5,137M
1998 Op
Income
Comments
Operating
Income
Expense
Revenue
81
CSX true gains in operating income are expected to be
$1.5 billion over four years (page 46)
Calculated
$1,517M
True Gains
Current Analyst Consensus
$2,743M
2008
Estimated
Op Income
Inflation of 3.5% is the industry's CAGR inflation
(2004-2007) as measured by the AAR's ALL-LF
Index (costs excluding fuel)
$158M
$1,029M
$1,186M
Inflation
Source: GAAP Reconciliation
$1,068M
$6,972M
$8,040M
2004
Comparable
Op Income
Comments
Operating
Income
Expense
Revenue
82
Additional $3 billion of debt (1x EBITDA) results in only
2% EPS accretion (page 72)
2%
Implied EPS Accretion (%)
$0.07
Implied EPS Accretion ($)
$3.05
Pro Forma Basic EPS
352.9
Adjusted Shares Outstanding after Share Repurchase
$1,078
Adjusted Earnings for Share Repurchases ($MM)
$2.98
Implied Basic EPS
404.7
Shares Outstanding on 4/25/08
$1,209
2007 Earnings ($MM)
13%
Percent of Shares Purchased
$61.94
Purchase Price (4/25/08)
$3,205
New Capital Raised for Share Repurchase = 1x EBITDA ($MM)
83

Proxy Statement Disclosure
84
Important Information
In connection with the 2008 annual meeting of shareholders, CSX Corporation ("CSX") has filed with the SEC and
mailed to shareholders a definitive Proxy Statement dated April 25, 2008. Security holders are strongly advised to read
the definitive Proxy Statement because it contains important information. Security holders may obtain a free copy of the
definitive Proxy Statement and any other documents filed by CSX with the SEC at the SEC’s website at www.sec.gov.
The definitive Proxy Statement and these other documents may also be obtained for free from CSX by directing a
request to CSX Corporation, Attn: Investor Relations, David Baggs, 500 Water Street C110, Jacksonville, FL 32202.
CSX, its directors, director nominee and certain named executive officers and employees may be deemed to be
participants in the solicitation of CSX’s security holders in connection with its 2008 Annual Meeting. Security holders
may obtain information regarding the names, affiliations and interests of such individuals in CSX’s definitive Proxy
Statement and its May 15, 2008 letter to shareholders filed with the SEC as definitive additional soliciting materials.

Forward-Looking Disclosure
This presentation and other statements by the company contain forward-looking statements within the meaning of the
Private Securities Litigation Reform Act with respect to, among other items: projections and estimates of earnings,
revenues, cost-savings, expenses, or other financial items; statements of management’s plans, strategies and
objectives for future operation, and management’s expectations as to future performance and operations and the time
by which objectives will be achieved; statements concerning proposed new products and services; and statements
regarding future economic, industry or market conditions or performance. Forward-looking statements are typically
identified by words or phrases such as “believe,” “expect,” “anticipate,” “project,” “estimate,” and similar expressions.
Forward-looking statements speak only as of the date they are made, and the company undertakes no obligation to
update or revise any forward-looking statement. If the company does update any forward-looking statement, no
inference should be drawn that the company will make additional updates with respect to that statement or any other
forward-looking statements.
Forward-looking statements are subject to a number of risks and uncertainties, and actual performance or results could
differ materially from that anticipated by these forward-looking statements. Factors that may cause actual results to
differ materially from those contemplated by these forward-looking statements include, among others: (i) the company’s
success in implementing its financial and operational initiatives; (ii) changes in domestic or international economic or
business conditions, including those affecting the rail industry (such as the impact of industry competition, conditions,
performance and consolidation); (iii) legislative or regulatory changes; (iv) the inherent business risks associated with
safety and security; and (v) the outcome of claims and litigation involving or affecting the company. Other important
assumptions and factors that could cause actual results to differ materially from those in the forward-looking statements
are specified in the company’s SEC reports, accessible on the SEC’s website at www.sec.gov and the company’s
website at www.csx.com.
85