UNITED STATES
SECURITIES AND EXCHANGE COMMISSION
Washington, D.C. 20549
FORM N-CSR
CERTIFIED SHAREHOLDER REPORT OF REGISTERED
MANAGEMENT INVESTMENT COMPANIES
Investment Company Act file number 811-2890
Fidelity Phillips Street Trust
(Exact name of registrant as specified in charter)
82 Devonshire St., Boston, Massachusetts 02109
(Address of principal executive offices) (Zip code)
Eric D. Roiter, Secretary
82 Devonshire St.
Boston, Massachusetts 02109
(Name and address of agent for service)
Registrant's telephone number, including area code: 617-563-7000
Date of fiscal year end: | November 30 |
| |
Date of reporting period: | November 30, 2005 |
Item 1. Reports to Stockholders
| | Annual Report
November 30, 2005
|


| Contents | | | | |
| |
| Chairman’s Message | | 3 | | Ned Johnson’s message to shareholders. |
| Shareholder Expense | | 4 | | An example of shareholder expenses. |
| Example | | | | |
| Investment Changes/ | | 5 | | A summary of major shifts in the fund’s |
| Performance | | | | investments over the past six months. |
| Investments | | 6 | | A complete list of the fund’s |
| | | | | investments. |
| Financial Statements | | 20 | | Statements of assets and liabilities, |
| | | | | operations, and changes in net assets, |
| | | | | as well as financial highlights. |
| Notes | | 24 | | Notes to the financial statements. |
| Report of Independent | | 28 | | |
| Registered Public | | | | |
| Accounting Firm | | | | |
| Trustees and Officers | | 29 | | |
| Board Approval of | | 40 | | |
| Investment Advisory | | | | |
| Contracts and Management | | | | |
| Fees | | | | |
| | To view a fund’s proxy voting guidelines and proxy voting record for the 12 month period
ended June 30, visit www.fidelity.com/proxyvotingresults or visit the Securities and Exchange
Commission’s (SEC) web site at www.sec.gov. You may also call 1-800-544-8544 to request a free
copy of the proxy voting guidelines.
Standard & Poor’s, S&P and S&P 500 are registered service marks of The McGraw Hill Companies, Inc.
and have been licensed for use by Fidelity Distributors Corporation.
Other third party marks appearing herein are the property of their respective owners.
All other marks appearing herein are registered or unregistered trademarks or service marks
of FMR Corp. or an affiliated company.
|
| | This report and the financial statements contained herein are submitted for the general
information of the shareholders of the fund. This report is not authorized for distribution to
prospective investors in the fund unless preceded or accompanied by an effective prospectus.
A fund files its complete schedule of portfolio holdings with the SEC for the first and third
quarters of each fiscal year on Form N Q. Forms N Q are available on the SEC’s web site at
http://www.sec.gov. A fund’s Forms N Q may be reviewed and copied at the SEC’s Public Reference
Room in Washington, DC. Information regarding the operation of the SEC’s Public Reference
Room may be obtained by calling 1-800-SEC-0330. For a complete list of a fund’s portfolio
holdings, view the most recent quarterly holdings report, semiannual report, or annual report
on Fidelity’s web site at http://www.fidelity.com/holdings.
NOT FDIC INSURED · MAY LOSE VALUE · NO BANK GUARANTEE
Neither the fund nor Fidelity Distributors Corporation is a bank.
|
Annual Report 2
Chairman’s Message
(photograph of Edward C. Johnson 3d)
Dear Shareholder:
During the past year or so, much has been reported about the mutual fund industry, and much of it has been more critical than I believe is warranted. Allegations that some companies have been less than forthright with their shareholders have cast a shadow on the entire industry. I continue to find these reports disturbing, and assert that they do not create an accurate picture of the industry overall. Therefore, I would like to remind every one where Fidelity stands on these issues. I will say two things specifically regarding allegations that some mutual fund companies were in violation of the Securities and Exchange Commission’s forward pricing rules or were involved in so called “market timing” activities.
First, Fidelity has no agreements that permit customers who buy fund shares after 4 p.m. to obtain the 4 p.m. price. This is not a new policy. This is not to say that some one could not deceive the company through fraudulent acts. However, we are extremely diligent in preventing fraud from occurring in this manner and in every other. But I underscore again that Fidelity has no so called “agreements” that sanction illegal practices.
Second, Fidelity continues to stand on record, as we have for years, in opposition to predatory short term trading that adversely affects shareholders in a mutual fund. Back in the 1980s, we initiated a fee which is returned to the fund and, therefore, to investors to discourage this activity. Further, we took the lead several years ago in developing a Fair Value Pricing Policy to prevent market timing on foreign securities in our funds. I am confident we will find other ways to make it more difficult for predatory traders to operate. However, this will only be achieved through close cooperation among regulators, legislators and the industry.
Yes, there have been unfortunate instances of unethical and illegal activity within the mutual fund industry from time to time. That is true of any industry. When this occurs, confessed or convicted offenders should be dealt with appropriately. But we are still concerned about the risk of over regulation and the quick application of simplistic solutions to intricate problems. Every system can be improved, and we support and applaud well thought out improvements by regulators, legislators and industry representatives that achieve the common goal of building and protecting the value of investors’ holdings.
For nearly 60 years, Fidelity has worked very hard to improve its products and service to justify your trust. When our family founded this company in 1946, we had only a few hundred customers. Today, we serve more than 18 million customers including individual investors and participants in retirement plans across America.
Let me close by saying that we do not take your trust in us for granted, and we realize that we must always work to improve all aspects of our service to you. In turn, we urge you to continue your active participation with your financial matters, so that your interests can be well served.
Best regards,
/s/ Edward C. Johnson 3d
Edward C. Johnson 3d
3 Annual Report
Shareholder Expense Example
As a shareholder of the Fund, you incur two types of costs: (1) transaction costs, and (2) ongoing costs, including management fees and other Fund expenses. This Example is intended to help you understand your ongoing costs (in dollars) of investing in the Fund and to compare these costs with the ongoing costs of investing in other mutual funds. The Example is based on an investment of $1,000 invested at the beginning of the period and held for the entire period (June 1, 2005 to November 30, 2005).
The first line of the table below provides information about actual account values and actual expenses. You may use the information in this line, together with the amount you invested, to estimate the expenses that you paid over the period. Simply divide your account value by $1,000.00 (for example, an $8,600 account value divided by $1,000.00 = 8.6), then multiply the result by the number in the first line under the heading entitled “Expenses Paid During Period” to estimate the expenses you paid on your account during this period. A small balance maintenance fee of $12.00 that is charged once a year may apply for certain accounts with a value of less than $2,000. This fee is not included in the table below. If it was, the estimate of expenses you paid during the period would be higher, and your ending account value lower, by this amount.
Hypothetical Example for Comparison Purposes
The second line of the table below provides information about hypothetical account values and hypothetical expenses based on the Fund’s actual expense ratio and an assumed rate of return of 5% per year before expenses, which is not the Fund’s actual return. The hypothetical account values and expenses may not be used to estimate the actual ending account balance or expenses you paid for the period. You may use this information to compare the ongoing costs of investing in the Fund and other funds. To do so, compare this 5% hypothetical example with the 5% hypothetical examples that appear in the share holder reports of the other funds. A small balance maintenance fee of $12.00 that is charged once a year may apply for certain accounts with a value of less than $2,000. This fee is not included in the table below. If it was, the estimate of expenses you paid during the period would be higher, and your ending account value lower, by this amount.
Please note that the expenses shown in the table are meant to highlight your ongoing costs only and do not reflect any transaction costs. Therefore, the second line of the table is useful in comparing ongoing costs only, and will not help you determine the relative total costs of owning different funds.
| | | | | | | | | | | Expenses Paid |
| | | | | Beginning | | Ending | | During Period* |
| | | | | Account Value | | Account Value | | June 1, 2005 to |
| | | | | June 1, 2005 | | November 30, 2005 | | November 30, 2005 |
| Actual | | $ | | 1,000.00 | | $ | | 1,016.20 | $ | 2.17 |
| Hypothetical (5% return per year | | | | | | | | | | |
| before expenses) | | $ | | 1,000.00 | | $ | | 1,022.91 | $ | 2.18 |
* Expenses are equal to the Fund’s annualized expense ratio of .43%; multiplied by the average account value over the period, multiplied by 183/365 (to reflect the one half year period).
| Investment Changes/Performance |
| |
| Maturity Diversification | | | | | | |
| Days | | % of fund’s | | % of fund’s | | % of fund’s |
| | | investments | | investments | | investments |
| | | 11/30/05 | | 5/31/05 | | 11/30/04 |
| 0 – 30 | | 66.0 | | 60.9 | | 53.5 |
| 31 – 90 | | 28.2 | | 31.6 | | 36.2 |
| 91 – 180 | | 2.1 | | 6.7 | | 10.2 |
| 181 – 397 | | 3.7 | | 0.8 | | 0.1 |
Weighted Average Maturity | | | | | | |
| | | 11/30/05 | | 5/31/05 | | 11/30/04 |
| Cash Reserves | | 34 Days | | 33 Days | | 40 Days |
| All Taxable Money Market | | | | | | |
| Funds Average* | | 37 Days | | 35 Days | | 40 Days |

| Current and Historical Seven Day Yields | | | | | | |
| | | 11/29/05 | | 8/30/05 | | 5/31/05 | | 3/1/05 | | 11/30/04 |
| Cash Reserves | | 3.70% | | 3.20% | | 2.71% | | 2.13% | | 1.61% |
Yield refers to the income paid by the fund over a given period. Yields for money market funds are usually for seven day periods, as they are here, though they are expressed as annual percentage rates. Past performance is no guarantee of future results. Yield will vary and it is possible to lose money by investing in the fund.
*Source: iMoneyNet, Inc.
5 Annual Report
Investments November 30, 2005
Showing Percentage of Net Assets
Corporate Bonds 0.7%
| Due | | Annualized Yield at | | Principal Amount | | Value (Note 1) |
| Date | | Time of Purchase | | (000s) | | (000s) |
| AOL Time Warner, Inc. | | | | | | | | | | |
| 4/15/06 | | 4.03% | | $ | | 38,117 | | $ | | 38,380 |
| 4/15/06 | | 4.14 | | | | 18,405 | | | | 18,525 |
| British Telecommunications PLC | | | | | | | | | | |
| 12/15/05 | | 3.38 | | | | 26,731 | | | | 26,774 |
| 12/15/05 | | 3.39 | | | | 39,870 | | | | 39,935 |
| 12/15/05 | | 3.40 | | | | 7,010 | | | | 7,021 |
| 12/15/05 | | 3.43 | | | | 28,065 | | | | 28,110 |
| 12/15/05 | | 3.51 | | | | 7,124 | | | | 7,135 |
| 12/15/05 | | 3.71 | | | | 30,680 | | | | 30,727 |
| 12/15/05 | | 3.78 | | | | 5,190 | | | | 5,198 |
| Comcast Cable Communications, Inc. | | | | | | | | | | |
| 1/30/06 | | 3.91 | | | | 24,980 | | | | 25,070 |
| 1/30/06 | | 4.43 | | | | 13,005 | | | | 13,043 |
| 1/30/06 | | 4.47 | | | | 7,180 | | | | 7,200 |
| Continental Cablevision, Inc. | | | | | | | | | | |
| 5/15/06 | | 4.70 | | | | 46,155 | | | | 46,889 |
| France Telecom SA | | | | | | | | | | |
| 3/1/06 | | 3.37 | | | | 3,535 | | | | 3,566 |
| 3/1/06 | | 3.41 | | | | 10,650 | | | | 10,745 |
| 3/1/06 | | 3.43 | | | | 10,485 | | | | 10,576 |
| 3/1/06 | | 3.45 | | | | 6,080 | | | | 6,132 |
| 3/1/06 | | 3.54 | | | | 13,570 | | | | 13,686 |
| 3/1/06 | | 3.55 | | | | 20,560 | | | | 20,734 |
| 3/1/06 | | 3.56 | | | | 25,699 | | | | 25,917 |
| 3/1/06 | | 3.59 | | | | 5,435 | | | | 5,481 |
| 3/1/06 | | 3.61 | | | | 2,825 | | | | 2,848 |
| Morgan Stanley | | | | | | | | | | |
| 4/15/06 | | 3.90 | | | | 33,016 | | | | 33,259 |
| TCI Communications, Inc. | | | | | | | | | | |
| 2/15/06 | | 4.51 | | | | 10,045 | | | | 10,089 |
| TOTAL CORPORATE BONDS | | | | | | | | | | 437,040 |
| |
| Certificates of Deposit 27.8% | | | | | | | | |
| |
| Domestic Certificates Of Deposit – 0.1% | | | | | | | | |
| Huntington National Bank, Columbus | | | | | | | | | | |
| 3/23/06 | | 4.31 | | | | 61,000 | | | | 61,000 |
| London Branch, Eurodollar, Foreign Banks – 13.3% | | | | | | | | |
| Barclays PLC | | | | | | | | | | |
| 12/2/05 | | 4.05 | | | | 2,050,000 | | | | 2,050,002 |
See accompanying notes which are an integral part of the financial statements.
| Certificates of Deposit continued | | | | | | | | |
| Due | | Annualized Yield at | | Principal Amount | | Value (Note 1) |
| Date | | Time of Purchase | | (000s) | | (000s) |
| London Branch, Eurodollar, Foreign Banks – continued | | | | | | | | |
| Barclays PLC – continued | | | | | | | | | | |
| 2/7/06 | | 4.26% | | $ | | 390,000 | | $ | | 390,000 |
| Calyon | | | | | | | | | | |
| 3/31/06 | | 3.88 | | | | 200,000 | | | | 200,000 |
| 7/17/06 | | 4.00 | | | | 100,000 | | | | 100,000 |
| 7/18/06 | | 4.00 | | | | 250,000 | | | | 250,000 |
| 10/4/06 | | 4.40 | | | | 250,000 | | | | 250,000 |
| Credit Agricole SA | | | | | | | | | | |
| 7/17/06 | | 4.00 | | | | 200,000 | | | | 200,000 |
| 7/18/06 | | 4.00 | | | | 100,000 | | | | 100,000 |
| 7/19/06 | | 4.00 | | | | 250,000 | | | | 250,000 |
| Credit Industriel et Commercial | | | | | | | | | | |
| 2/6/06 | | 4.25 | | | | 600,000 | | | | 600,000 |
| 4/20/06 | | 3.95 | | | | 250,000 | | | | 250,000 |
| 11/7/06 | | 4.76 | | | | 500,000 | | | | 500,000 |
| Credit Suisse Group | | | | | | | | | | |
| 1/25/06 | | 4.26 | | | | 250,000 | | | | 250,000 |
| Deutsche Bank AG | | | | | | | | | | |
| 12/13/05 | | 4.03 | | | | 1,210,000 | | | | 1,210,000 |
| Hypo Real Estate Bank International | | | | | | | | | | |
| 12/2/05 | | 4.14 (f) | | | | 36,000 | | | | 36,000 |
| 12/30/05 | | 4.26 (f) | | | | 108,000 | | | | 108,000 |
| Northern Rock PLC | | | | | | | | | | |
| 1/31/06 | | 4.30 | | | | 100,000 | | | | 100,000 |
| Royal Bank of Scotland PLC | | | | | | | | | | |
| 1/31/06 | | 4.29 | | | | 485,000 | | | | 485,000 |
| Societe Generale | | | | | | | | | | |
| 12/22/05 | | 3.00 | | | | 95,000 | | | | 95,000 |
| 8/18/06 | | 4.25 | | | | 250,000 | | | | 250,000 |
| Unicredito Italiano Spa | | | | | | | | | | |
| 1/25/06 | | 4.26 | | | | 750,000 | | | | 750,000 |
| 2/8/06 | | 4.28 | | | | 140,000 | | | | 139,999 |
| | | | | | | | | | | 8,564,001 |
| New York Branch, Yankee Dollar, Foreign Banks – 14.4% | | | | | | | | |
| Bank of Tokyo-Mitsubishi Ltd. | | | | | | | | | | |
| 12/1/05 | | 4.05 | | | | 200,000 | | | | 200,000 |
| 12/7/05 | | 4.06 | | | | 605,000 | | | | 605,000 |
| 12/8/05 | | 4.06 | | | | 605,000 | | | | 605,000 |
| 1/27/06 | | 4.34 (c) | | | | 700,000 | | | | 700,000 |
| 1/30/06 | | 4.30 | | | | 470,000 | | | | 470,000 |
See accompanying notes which are an integral part of the financial statements.
| Investments continued | | | | | | | | | | |
| |
| Certificates of Deposit continued | | | | | | | | |
| Due | | Annualized Yield at | | Principal Amount | | Value (Note 1) |
| Date | | Time of Purchase | | (000s) | | (000s) |
| New York Branch, Yankee Dollar, Foreign Banks – continued | | | | |
| Barclays Bank PLC | | | | | | | | | | |
| 12/2/05 | | 3.71% | | $ | | 170,000 | | $ | | 170,000 |
| Canadian Imperial Bank of Commerce | | | | | | | | | | |
| 12/15/05 | | 4.18 (d) | | | | 500,000 | | | | 500,000 |
| 12/23/05 | | 4.21 (c)(d) | | | | 500,000 | | | | 500,000 |
| Credit Industriel et Commercial | | | | | | | | | | |
| 2/13/06 | | 4.00 | | | | 115,000 | | | | 115,000 |
| 6/28/06 | | 4.27 | | | | 250,000 | | | | 250,000 |
| Credit Suisse First Boston New York Branch | | | | | | | | |
| 12/19/05 | | 4.14 (d) | | | | 325,000 | | | | 325,000 |
| 12/28/05 | | 3.93 (d) | | | | 500,000 | | | | 500,000 |
| 1/19/06 | | 4.14 (d) | | | | 375,000 | | | | 375,000 |
| DEPFA BANK PLC | | | | | | | | | | |
| 2/1/06 | | 4.30 | | | | 160,000 | | | | 160,000 |
| Deutsche Bank AG | | | | | | | | | | |
| 12/5/05 | | 3.73 (d) | | | | 390,000 | | | | 390,000 |
| Eurohypo AG | | | | | | | | | | |
| 1/30/06 | | 4.02 (a) | | | | 115,000 | | | | 115,000 |
| 1/31/06 | | 4.02 (a) | | | | 235,000 | | | | 235,000 |
| 3/28/06 | | 4.08 (a) | | | | 234,000 | | | | 234,000 |
| Mizuho Corporate Bank Ltd. | | | | | | | | | | |
| 12/8/05 | | 4.08 | | | | 715,000 | | | | 715,000 |
| Royal Bank of Scotland PLC | | | | | | | | | | |
| 1/31/06 | | 4.28 | | | | 550,000 | | | | 550,000 |
| Skandinaviska Enskilda Banken AB | | | | | | | | | | |
| 1/6/06 | | 4.05 (d) | | | | 730,000 | | | | 729,935 |
| Toronto-Dominion Bank | | | | | | | | | | |
| 4/7/06 | | 3.86 | | | | 200,000 | | | | 200,000 |
| 4/18/06 | | 3.92 | | | | 100,000 | | | | 100,000 |
| Unicredito Italiano Spa | | | | | | | | | | |
| 2/13/06 | | 4.28 (d) | | | | 480,000 | | | | 479,968 |
| | | | | | | | | | | 9,223,903 |
| |
| TOTAL CERTIFICATES OF DEPOSIT | | | | | | | | 17,848,904 |
See accompanying notes which are an integral part of the financial statements.
| Commercial Paper 21.2% | | | | | | | | | | |
| Due | | Annualized Yield at | | Principal Amount | | Value (Note 1) |
| Date | | Time of Purchase | | (000s) | | (000s) |
| Barclays U.S. Funding Corp. | | | | | | | | | | |
| 1/24/06 | | 4.24% | | $ | | 450,000 | | $ | | 447,162 |
| Bavaria TRR Corp. | | | | | | | | | | |
| 12/14/05 | | 4.15 | | | | 131,019 | | | | 130,823 |
| Bradford & Bingley PLC | | | | | | | | | | |
| 1/30/06 | | 4.32 | | | | 60,000 | | | | 59,571 |
| Capital One Multi-Asset Execution Trust | | | | | | | | | | |
| 1/18/06 | | 4.24 | | | | 25,000 | | | | 24,860 |
| 1/24/06 | | 4.28 | | | | 50,000 | | | | 49,681 |
| 2/2/06 | | 4.25 | | | | 60,000 | | | | 59,559 |
| 2/16/06 | | 4.34 | | | | 50,000 | | | | 49,541 |
| Charta LLC | | | | | | | | | | |
| 12/5/05 | | 4.02 | | | | 35,335 | | | | 35,319 |
| 12/7/05 | | 4.02 | | | | 85,000 | | | | 84,943 |
| 1/18/06 | | 4.25 | | | | 100,000 | | | | 99,437 |
| 1/20/06 | | 4.25 | | | | 60,000 | | | | 59,648 |
| 2/9/06 | | 4.32 | | | | 130,000 | | | | 128,918 |
| Citibank Credit Card Master Trust I (Dakota Certificate Program) | | | | | | |
| 12/5/05 | | 4.05 | | | | 75,000 | | | | 74,966 |
| 12/9/05 | | 4.06 | | | | 50,000 | | | | 49,955 |
| 1/17/06 | | 4.25 | | | | 100,000 | | | | 99,449 |
| 1/19/06 | | 4.27 | | | | 70,000 | | | | 69,596 |
| 2/1/06 | | 4.28 | | | | 160,000 | | | | 158,830 |
| Citigroup Funding, Inc. | | | | | | | | | | |
| 1/23/06 | | 4.28 | | | | 45,000 | | | | 44,718 |
| 1/24/06 | | 4.28 | | | | 70,000 | | | | 69,554 |
| 1/25/06 | | 4.28 | | | | 45,000 | | | | 44,708 |
| 1/26/06 | | 4.30 | | | | 85,000 | | | | 84,435 |
| 1/31/06 | | 4.30 | | | | 150,000 | | | | 148,915 |
| Countrywide Financial Corp. | | | | | | | | | | |
| 12/12/05 | | 4.12 | | | | 100,000 | | | | 99,875 |
| 12/13/05 | | 4.12 | | | | 165,000 | | | | 164,775 |
| 1/27/06 | | 4.33 | | | | 235,000 | | | | 233,400 |
| DaimlerChrysler NA Holding Corp. | | | | | | | | | | |
| 12/1/05 | | 4.20 | | | | 65,000 | | | | 65,000 |
| 12/5/05 | | 4.19 | | | | 35,000 | | | | 34,984 |
| 12/15/05 | | 4.25 | | | | 112,000 | | | | 111,816 |
| 12/22/05 | | 4.30 | | | | 58,000 | | | | 57,855 |
| 12/23/05 | | 4.30 | | | | 114,000 | | | | 113,702 |
| 12/28/05 | | 4.40 | | | | 64,000 | | | | 63,790 |
| Emerald (MBNA Credit Card Master Note Trust) | | | | | | | | |
| 12/2/05 | | 4.02 | | | | 11,000 | | | | 10,999 |
See accompanying notes which are an integral part of the financial statements.
| Investments continued | | | | | | | | | | |
| |
| |
| Commercial Paper continued | | | | | | | | |
| Due | | Annualized Yield at | | Principal Amount | | Value (Note 1) |
| Date | | Time of Purchase | | (000s) | | (000s) |
| Emerald (MBNA Credit Card Master Note Trust) – continued | | | | | | | | |
| 12/7/05 | | 3.99% | | $ | | 99,998 | | $ | | 99,932 |
| 12/21/05 | | 4.00 | | | | 160,000 | | | | 159,648 |
| 1/19/06 | | 4.22 | | | | 112,492 | | | | 111,852 |
| 1/24/06 | | 4.26 | | | | 65,000 | | | | 64,589 |
| 1/25/06 | | 4.27 | | | | 166,252 | | | | 165,178 |
| 1/26/06 | | 4.28 | | | | 94,000 | | | | 93,380 |
| 2/1/06 | | 4.30 | | | | 93,700 | | | | 93,012 |
| FCAR Owner Trust | | | | | | | | | | |
| 12/12/05 | | 4.02 | | | | 121,800 | | | | 121,651 |
| 12/13/05 | | 4.04 | | | | 250,000 | | | | 249,665 |
| 12/14/05 | | 4.05 | | | | 150,000 | | | | 149,782 |
| Federated Retail Holdings, Inc. | | | | | | | | | | |
| 12/5/05 | | 4.13 | | | | 115,000 | | | | 114,947 |
| 12/19/05 | | 4.18 | | | | 36,000 | | | | 35,925 |
| 12/20/05 | | 4.20 | | | | 14,000 | | | | 13,969 |
| 1/5/06 | | 4.27 | | | | 34,628 | | | | 34,485 |
| 1/9/06 | | 4.30 | | | | 36,000 | | | | 35,833 |
| 1/26/06 | | 4.37 | | | | 18,500 | | | | 18,375 |
| Fortune Brands, Inc. | | | | | | | | | | |
| 12/5/05 | | 4.09 | | | | 24,000 | | | | 23,989 |
| 12/5/05 | | 4.11 | | | | 35,000 | | | | 34,984 |
| 12/19/05 | | 4.02 | | | | 100,000 | | | | 99,801 |
| 1/9/06 | | 4.30 | | | | 57,500 | | | | 57,235 |
| 1/10/06 | | 4.32 | | | | 15,000 | | | | 14,929 |
| 1/17/06 | | 4.34 | | | | 37,000 | | | | 36,792 |
| 1/23/06 | | 4.30 | | | | 213,000 | | | | 211,667 |
| 1/24/06 | | 4.30 | | | | 36,000 | | | | 35,770 |
| 1/30/06 | | 4.36 | | | | 70,000 | | | | 69,496 |
| 2/1/06 | | 4.35 | | | | 43,000 | | | | 42,681 |
| Giro Funding US Corp. | | | | | | | | | | |
| 12/1/05 | | 4.06 | | | | 40,000 | | | | 40,000 |
| Jupiter Securitization Corp. | | | | | | | | | | |
| 1/27/06 | | 4.28 | | | | 125,901 | | | | 125,054 |
| Kellogg Co. | | | | | | | | | | |
| 12/2/05 | | 4.12 | | | | 36,000 | | | | 35,996 |
| 12/13/05 | | 4.11 | | | | 36,000 | | | | 35,951 |
| Market Street Funding Corp. | | | | | | | | | | |
| 12/5/05 | | 4.03 | | | | 196,012 | | | | 195,925 |
| Michigan Gen. Oblig. | | | | | | | | | | |
| 10/11/06 | | 4.64 | | | | 108,000 | | | | 108,000 |
See accompanying notes which are an integral part of the financial statements.
| Commercial Paper continued | | | | | | | | |
| Due | | Annualized Yield at | | Principal Amount | | Value (Note 1) |
| Date | | Time of Purchase | | (000s) | | (000s) |
| Motown Notes Program | | | | | | | | | | |
| 12/2/05 | | 4.07% | | $ | | 21,000 | | $ | | 20,998 |
| 12/7/05 | | 3.81 | | | | 122,100 | | | | 122,023 |
| 12/12/05 | | 3.85 | | | | 85,000 | | | | 84,901 |
| 12/19/05 | | 3.99 | | | | 95,000 | | | | 94,812 |
| 2/1/06 | | 4.28 | | | | 40,000 | | | | 39,709 |
| 2/2/06 | | 4.28 | | | | 276,300 | | | | 274,255 |
| 2/3/06 | | 4.27 | | | | 132,000 | | | | 131,007 |
| 2/6/06 | | 4.29 | | | | 87,000 | | | | 86,313 |
| 2/6/06 | | 4.31 | | | | 72,000 | | | | 71,429 |
| 2/8/06 | | 4.31 | | | | 120,600 | | | | 119,613 |
| Newcastle (Discover Card Master Trust) | | | | | | | | | | |
| 12/12/05 | | 4.05 | | | | 9,570 | | | | 9,558 |
| Paradigm Funding LLC | | | | | | | | | | |
| 1/17/06 | | 4.25 | | | | 39,864 | | | | 39,644 |
| 1/20/06 | | 4.25 | | | | 15,000 | | | | 14,912 |
| 1/24/06 | | 4.25 | | | | 160,000 | | | | 158,987 |
| 1/30/06 | | 4.28 | | | | 100,000 | | | | 99,292 |
| 1/31/06 | | 4.30 | | | | 151,250 | | | | 150,156 |
| Park Granada LLC | | | | | | | | | | |
| 12/6/05 | | 4.08 | | | | 162,857 | | | | 162,765 |
| 12/7/05 | | 3.78 | | | | 60,000 | | | | 59,963 |
| 12/7/05 | | 4.08 | | | | 414,000 | | | | 413,718 |
| 12/9/05 | | 3.99 | | | | 100,000 | | | | 99,912 |
| 1/23/06 | | 4.20 | | | | 196,136 | | | | 194,936 |
| 1/24/06 | | 4.20 | | | | 162,000 | | | | 160,990 |
| 1/24/06 | | 4.22 | | | | 110,000 | | | | 109,311 |
| 1/25/06 | | 4.22 | | | | 150,000 | | | | 149,042 |
| 1/25/06 | | 4.23 | | | | 205,000 | | | | 203,689 |
| 1/26/06 | | 4.22 | | | | 145,000 | | | | 144,057 |
| 1/26/06 | | 4.23 | | | | 30,000 | | | | 29,805 |
| 1/27/06 | | 4.23 | | | | 50,000 | | | | 49,669 |
| 1/30/06 | | 4.23 | | | | 25,000 | | | | 24,826 |
| 1/30/06 | | 4.24 | | | | 115,000 | | | | 114,196 |
| Park Sienna LLC | | | | | | | | | | |
| 12/6/05 | | 4.09 | | | | 100,000 | | | | 99,943 |
| 12/7/05 | | 4.09 | | | | 268,000 | | | | 267,817 |
| 12/8/05 | | 4.09 | | | | 200,000 | | | | 199,841 |
| Sheffield Receivables Corp. | | | | | | | | | | |
| 12/9/05 | | 4.02 | | | | 130,000 | | | | 129,884 |
See accompanying notes which are an integral part of the financial statements.
11 Annual Report
| Investments continued | | | | | | | | | | |
| |
| |
| Commercial Paper continued | | | | | | | | |
| Due | | Annualized Yield at | | Principal Amount | | Value (Note 1) |
| Date | | Time of Purchase | | (000s) | | (000s) |
| Strand Capital LLC | | | | | | | | | | |
| 1/11/06 | | 4.13% | | $ | | 43,000 | | $ | | 42,800 |
| 1/17/06 | | 3.91 | | | | 155,000 | | | | 154,219 |
| 1/18/06 | | 3.91 | | | | 70,000 | | | | 69,640 |
| 1/18/06 | | 3.92 | | | | 10,000 | | | | 9,948 |
| 1/18/06 | | 4.22 | | | | 65,000 | | | | 64,638 |
| 2/1/06 | | 3.94 | | | | 50,000 | | | | 49,666 |
| 2/2/06 | | 4.29 | | | | 45,000 | | | | 44,665 |
| 3/14/06 | | 4.26 | | | | 130,000 | | | | 128,445 |
| Stratford Receivables Co. LLC | | | | | | | | | | |
| 12/5/05 | | 4.04 | | | | 110,000 | | | | 109,951 |
| 12/6/05 | | 4.02 | | | | 20,000 | | | | 19,989 |
| 12/7/05 | | 4.04 | | | | 235,789 | | | | 235,631 |
| 12/7/05 | | 4.06 | | | | 10,000 | | | | 9,993 |
| 12/7/05 | | 4.09 | | | | 60,000 | | | | 59,959 |
| 12/8/05 | | 4.02 | | | | 100,000 | | | | 99,922 |
| 12/8/05 | | 4.05 | | | | 150,000 | | | | 149,882 |
| 12/9/05 | | 4.02 | | | | 140,000 | | | | 139,876 |
| 12/9/05 | | 4.05 | | | | 20,000 | | | | 19,982 |
| 12/12/05 | | 4.05 | | | | 150,000 | | | | 149,815 |
| 12/12/05 | | 4.07 | | | | 161,962 | | | | 161,762 |
| 12/12/05 | | 4.10 | | | | 49,831 | | | | 49,769 |
| 12/12/05 | | 4.11 | | | | 150,861 | | | | 150,672 |
| 12/13/05 | | 4.04 | | | | 50,000 | | | | 49,933 |
| 12/15/05 | | 4.12 | | | | 227,212 | | | | 226,850 |
| 12/16/05 | | 4.12 | | | | 47,164 | | | | 47,083 |
| 1/17/06 | | 4.24 | | | | 363,431 | | | | 361,437 |
| 1/18/06 | | 4.28 | | | | 202,477 | | | | 201,330 |
| 1/19/06 | | 4.26 | | | | 50,211 | | | | 49,922 |
| 1/19/06 | | 4.28 | | | | 173,430 | | | | 172,427 |
| 1/19/06 | | 4.63 | | | | 80,000 | | | | 79,542 |
| 1/20/06 | | 4.25 | | | | 174,000 | | | | 172,981 |
| 1/24/06 | | 4.29 | | | | 140,000 | | | | 139,106 |
| 1/25/06 | | 4.28 | | | | 216,132 | | | | 214,729 |
| 2/1/06 | | 4.25 | | | | 70,031 | | | | 69,524 |
| TOTAL COMMERCIAL PAPER | | | | | | | | 13,599,338 |
See accompanying notes which are an integral part of the financial statements.
| Bank Notes 0.1% | | | | | | | | | | |
| Due | | Annualized Yield at | | Principal Amount | | Value (Note 1) |
| Date | | Time of Purchase | | (000s) | | (000s) |
| M&I Marshall & Ilsley Bank | | | | | | | | | | |
| 12/15/05 | | 4.15% (d) | | $ | | 58,000 | | $ | | 58,000 |
| |
| Master Notes 2.4% | | | | | | | | | | |
| |
| Bear Stearns Companies, Inc. | | | | | | | | | | |
| 12/15/05 | | 4.17 (f) | | | | 234,000 | | | | 234,000 |
| Goldman Sachs Group, Inc. | | | | | | | | | | |
| 12/6/05 | | 4.15 (d)(f) | | | | 263,000 | | | | 263,000 |
| 12/10/05 | | 4.16 (d)(f) | | | | 161,000 | | | | 161,000 |
| 12/22/05 | | 4.23 (d)(f) | | | | 480,000 | | | | 480,000 |
| 2/13/06 | | 4.38 (d)(f) | | | | 367,000 | | | | 367,000 |
| TOTAL MASTER NOTES | | | | | | | | | | 1,505,000 |
| |
| Medium Term Notes 22.7% | | | | | | | | |
| |
| AIG Matched Funding Corp. | | | | | | | | | | |
| 12/15/05 | | 3.89 (d) | | | | 350,000 | | | | 350,000 |
| 1/3/06 | | 4.06 (d) | | | | 305,000 | | | | 305,000 |
| 1/11/06 | | 4.13 (d) | | | | 305,000 | | | | 305,000 |
| 1/23/06 | | 4.02 (d) | | | | 335,000 | | | | 335,000 |
| Allstate Life Global Funding II | | | | | | | | | | |
| 12/8/05 | | 4.11 (b)(d) | | | | 65,000 | | | | 65,000 |
| 12/15/05 | | 4.14 (b)(d) | | | | 45,000 | | | | 45,000 |
| 12/15/05 | | 4.15 (b)(d) | | | | 70,000 | | | | 70,000 |
| 12/28/05 | | 4.19 (b)(d) | | | | 48,000 | | | | 48,000 |
| American Express Credit Corp. | | | | | | | | | | |
| 12/5/05 | | 4.17 (d) | | | | 68,000 | | | | 68,041 |
| 12/20/05 | | 4.21 (b)(d) | | | | 170,000 | | | | 169,974 |
| ASIF Global Financing XXX | | | | | | | | | | |
| 12/23/05 | | 4.16 (b)(d) | | | | 275,000 | | | | 275,000 |
| Australia & New Zealand Banking Group Ltd. | | | | | | | | |
| 12/23/05 | | 4.15 (b)(d) | | | | 200,000 | | | | 200,000 |
| Bayerische Landesbank Girozentrale | | | | | | | | | | |
| 1/17/06 | | 4.13 (d) | | | | 500,000 | | | | 500,000 |
| 2/20/06 | | 4.38 (d) | | | | 445,000 | | | | 445,000 |
| BellSouth Telecommunications | | | | | | | | | | |
| 12/5/05 | | 3.82 (d) | | | | 85,000 | | | | 85,000 |
| BMW U.S. Capital LLC | | | | | | | | | | |
| 12/15/05 | | 4.09 (d) | | | | 84,000 | | | | 84,000 |
See accompanying notes which are an integral part of the financial statements.
13 Annual Report
| Investments continued | | | | | | | | | | |
| |
| Medium Term Notes continued | | | | | | | | |
| Due | | Annualized Yield at | | Principal Amount | | Value (Note 1) |
| Date | | Time of Purchase | | (000s) | | (000s) |
| Commonwealth Bank of Australia | | | | | | | | | | |
| 12/28/05 | | 4.16% (d) | | $ | | 163,000 | | $ | | 163,000 |
| Cullinan Finance Corp. | | | | | | | | | | |
| 12/25/05 | | 4.13 (b)(d) | | | | 90,000 | | | | 89,991 |
| Descartes Funding Trust | | | | | | | | | | |
| 12/15/05 | | 4.12 (d) | | | | 100,000 | | | | 100,000 |
| Eli Lilly Services, Inc. | | | | | | | | | | |
| 12/1/05 | | 4.06 (b)(d) | | | | 140,000 | | | | 140,000 |
| GE Capital Assurance Co. | | | | | | | | | | |
| 12/1/05 | | 4.17 (d)(f) | | | | 155,000 | | | | 155,000 |
| General Electric Capital Corp. | | | | | | | | | | |
| 12/7/05 | | 4.08 (d) | | | | 680,000 | | | | 680,000 |
| 12/9/05 | | 4.19 (d) | | | | 487,400 | | | | 487,494 |
| 12/19/05 | | 4.24 (d) | | | | 596,500 | | | | 596,603 |
| HBOS Treasury Services PLC | | | | | | | | | | |
| 12/28/05 | | 4.01 (d) | | | | 530,000 | | | | 530,000 |
| 2/20/06 | | 4.44 (b)(d) | | | | 50,000 | | | | 50,016 |
| HSBC Finance Corp. | | | | | | | | | | |
| 12/28/05 | | 4.18 (d) | | | | 222,000 | | | | 222,000 |
| HSBC USA, Inc. | | | | | | | | | | |
| 12/15/05 | | 4.19 (d) | | | | 175,000 | | | | 175,000 |
| HSH Nordbank AG | | | | | | | | | | |
| 12/23/05 | | 4.17 (b)(d) | | | | 237,000 | | | | 237,000 |
| ING USA Annuity & Life Insurance Co. | | | | | | | | | | |
| 12/28/05 | | 4.04 (d)(f) | | | | 123,000 | | | | 123,000 |
| MBIA Global Funding LLC | | | | | | | | | | |
| 1/17/06 | | 4.11 (b)(d) | | | | 99,000 | | | | 99,000 |
| Merrill Lynch & Co., Inc. | | | | | | | | | | |
| 12/5/05 | | 4.12 (d) | | | | 141,000 | | | | 141,146 |
| 12/15/05 | | 4.10 (d) | | | | 350,000 | | | | 350,000 |
| Metropolitan Life Insurance Co. | | | | | | | | | | |
| 12/6/05 | | 4.08 (b)(d) | | | | 160,292 | | | | 160,292 |
| Morgan Stanley | | | | | | | | | | |
| 12/1/05 | | 4.14 (d) | | | | 70,000 | | | | 70,000 |
| 12/5/05 | | 4.12 (d) | | | | 110,000 | | | | 110,000 |
| 12/15/05 | | 4.15 (d) | | | | 169,000 | | | | 169,000 |
| 12/28/05 | | 4.24 (d) | | | | 320,000 | | | | 320,009 |
| Pacific Life Global Funding | | | | | | | | | | |
| 12/5/05 | | 4.11 (b)(d) | | | | 60,000 | | | | 60,000 |
| 12/13/05 | | 4.14 (d) | | | | 30,000 | | | | 30,000 |
See accompanying notes which are an integral part of the financial statements.
| Medium Term Notes continued | | | | | | |
| Due | | Annualized Yield at | | Principal Amount | | Value (Note 1) |
| Date | | Time of Purchase | | (000s) | | (000s) |
| RACERS | | | | | | | | |
| 12/22/05 | | 4.17% (b)(d) | $ | 480,000 | | $ | | 480,000 |
| Royal Bank of Canada | | | | | | | | |
| 12/12/05 | | 4.13 (d) | | 55,000 | | | | 55,000 |
| Royal Bank of Scotland PLC | | | | | | | | |
| 12/21/05 | | 4.13 (b)(d) | | 500,000 | | | | 500,000 |
| SBC Communications, Inc. | | | | | | | | |
| 6/5/06 | | 3.96 (b) | | 153,395 | | | | 153,675 |
| Security Life of Denver Insurance Co. | | | | | | | | |
| 2/28/06 | | 4.49 (d)(f) | | 85,000 | | | | 85,000 |
| SLM Corp. | | | | | | | | |
| 12/1/05 | | 4.14 (b)(d) | | 300,000 | | | | 300,000 |
| SunTrust Bank, Georgia | | | | | | | | |
| 12/12/05 | | 3.78 (d) | | 125,000 | | | | 124,997 |
| Travelers Insurance Co. | | | | | | | | |
| 2/17/06 | | 4.45 (d)(f) | | 75,000 | | | | 75,000 |
| 2/20/06 | | 4.46 (d)(f) | | 35,000 | | | | 35,000 |
| Verizon Global Funding Corp. | | | | | | | | |
| 12/15/05 | | 3.98 (d) | | 1,136,000 | | | | 1,136,001 |
| Wachovia Asset Securitization Issuance LLC | | | | | | |
| 12/28/05 | | 4.18 (b)(d) | | 83,414 | | | | 83,414 |
| Washington Mutual Bank FA | | | | | | | | |
| 12/15/05 | | 4.12 (d) | | 94,000 | | | | 94,000 |
| Washington Mutual Bank, California | | | | | | | | |
| 12/20/05 | | 3.87 (d) | | 328,000 | | | | 328,000 |
| 12/28/05 | | 3.94 (d) | | 405,000 | | | | 404,987 |
| 1/27/06 | | 4.20 (d) | | 480,000 | | | | 480,000 |
| 2/6/06 | | 4.26 (d) | | 300,000 | | | | 300,000 |
| Wells Fargo & Co. | | | | | | | | |
| 12/2/05 | | 4.14 (d) | | 215,000 | | | | 215,000 |
| 12/15/05 | | 4.11 (d) | | 500,000 | | | | 500,000 |
| WestLB AG | | | | | | | | |
| 12/12/05 | | 4.11 (b)(d) | | 241,000 | | | | 241,000 |
| 12/30/05 | | 4.02 (b)(d) | | 265,000 | | | | 265,000 |
| Westpac Banking Corp. | | | | | | | | |
| 12/12/05 | | 3.84 (d) | | 100,000 | | | | 100,000 |
| TOTAL MEDIUM TERM NOTES | | | | | | 14,564,640 |
See accompanying notes which are an integral part of the financial statements.
15 Annual Report
| Investments continued | | | | | | | | | | |
| |
| |
| Short Term Notes 2.1% | | | | | | | | | | |
| Due | | Annualized Yield at | | Principal Amount | | Value (Note 1) |
| Date | | Time of Purchase | | (000s) | | (000s) |
| Hartford Life Insurance Co. | | | | | | | | | | |
| 12/1/05 | | 4.02% (d)(f) | | $ | | 40,000 | | $ | | 40,000 |
| Jackson National Life Insurance Co. | | | | | | | | | | |
| 1/2/06 | | 4.19 (d)(f) | | | | 130,000 | | | | 130,000 |
| Metropolitan Life Insurance Co. | | | | | | | | | | |
| 12/28/05 | | 4.27 (b)(d) | | | | 85,000 | | | | 85,000 |
| 1/2/06 | | 4.19 (d)(f) | | | | 175,000 | | | | 175,000 |
| 2/1/06 | | 4.41 (d)(f) | | | | 65,000 | | | | 65,000 |
| Monumental Life Insurance Co. | | | | | | | | | | |
| 12/1/05 | | 4.23 (d)(f) | | | | 92,000 | | | | 92,000 |
| 12/1/05 | | 4.26 (d)(f) | | | | 65,000 | | | | 65,000 |
| 2/1/06 | | 4.45 (d)(f) | | | | 65,000 | | | | 65,000 |
| New York Life Insurance Co. | | | | | | | | | | |
| 12/31/05 | | 4.15 (d)(f) | | | | 425,000 | | | | 425,000 |
| Transamerica Occidental Life Insurance Co. | | | | | | | | |
| 2/1/06 | | 4.42 (d)(f) | | | | 200,000 | | | | 200,000 |
| Travelers Insurance Co. | | | | | | | | | | |
| 1/2/06 | | 4.15 (d)(f) | | | | 5,000 | | | | 5,000 |
| TOTAL SHORT TERM NOTES | | | | | | | | | | 1,347,000 |
| |
| Repurchase Agreements 25.5% | | | | | | | | |
| | | | | | | Maturity | | | | |
| | | | | | | Amount (000s) | | | | |
| In a joint trading account (Collateralized by U.S. Government | | | | | | |
| Obligations dated 11/30/05 due 12/1/05 At 4.05%) | | | | $ 2,207,660 | | | | 2,207,412 |
| With: | | | | | | | | | | |
| Banc of America Securities LLC At 4.11%, dated 11/30/05 | | | | | | |
| due 12/1/05 (Collateralized by Mortgage Loan | | | | | | | | |
| Obligations valued at $1,869,000,001, 0% – 7.46%, | | | | | | | | |
| 12/6/05 – 3/15/46) | | | | | | 1,780,203 | | | | 1,780,000 |
| Barclays Capital, Inc. At 4.17%, dated 11/30/05 due | | | | | | | | |
| 12/1/05 (Collateralized by Equity Securities valued at | | | | | | | | |
| $143,850,001) | | | | | | 137,016 | | | | 137,000 |
| Bear Stearns & Co. At: | | | | | | | | | | |
| 4.12%, dated 11/30/05 due 12/1/05 (Collateralized by | | | | | | |
| Mortgage Loan Obligations valued at $306,002,645, | | | | | | |
| 0% – 8%, 8/15/09 – 2/28/43) | | | | 300,034 | | | | 300,000 |
| 4.19%, dated 11/30/05 due 12/1/05 (Collateralized by | | | | | | |
| Mortgage Loan Obligations valued at $306,932,644, | | | | | | |
| 0% – 7.04%, 10/20/10 – 3/20/50) | | | | 300,035 | | | | 300,000 |
See accompanying notes which are an integral part of the financial statements.
Annual Report 16
| Repurchase Agreements continued | | | | | | |
| | | Maturity | | | | Value (Note 1) |
| | | Amount (000s) | | | | (000s) |
| |
| With: – continued | | | | | | |
| Citigroup Global Markets, Inc. At 4.12%, dated 11/30/05 | | | | | | |
| due 12/1/05 (Collateralized by Mortgage Loan | | | | | | |
| Obligations valued at $765,000,001, 3.5% – 9.46%, | | | | | | |
| 10/15/08 – 12/25/35) | | $ 750,086 | | $ | | 750,000 |
| CS First Boston Corp. At 4.03%, dated 11/1/05 due | | | | | | |
| 12/1/05 (Collateralized by Mortgage Loan Obligations | | | | | | |
| valued at $827,256,138, 4.5% – 7.5%, 1/1/34 - | | | | | | |
| 11/1/35) | | 810,714 | | | | 808,000 |
| Deutsche Bank Securities, Inc. At 4.19%, dated 11/30/05 | | | | | | |
| due 12/1/05 (Collateralized by Mortgage Loan | | | | | | |
| Obligations valued at $647,850,001, 0% – 6%, 1/25/23 | | | | | | |
| – 7/25/45) | | 617,072 | | | | 617,000 |
| Goldman Sachs & Co. At 4.16%, dated: | | | | | | |
| 11/21/05 due 12/19/05: | | | | | | |
| (Collateralized by Corporate Obligations valued at | | | | | | |
| $997,500,001, 0% – 13.5%, 2/1/06 - | | | | | | |
| 12/1/49) (d)(e) | | 953,074 | | | | 950,000 |
| (Collateralized by Mortgage Loan Obligations valued at | | | | | | |
| $781,823,576, 0% – 24.36%, 3/22/07 - | | | | | | |
| 10/25/44) (d)(e) | | 749,417 | | | | 747,000 |
| 11/30/05 due 12/1/05 (Collateralized by Mortgage | | | | | | |
| Loan Obligations valued at $230,798,789, 4.34% - | | | | | | |
| 9.15%, 10/15/09 – 9/25/43) | | 226,026 | | | | 226,000 |
| J.P. Morgan Securities, Inc. At: | | | | | | |
| 4.13%, dated 11/2/05 due 12/14/05 (Collateralized by | | | | | | |
| Corporate Obligations valued at $694,378,187, 3.63% | | | | | | |
| – 10.25%, 1/15/06 – 4/1/37) | | 662,175 | | | | 659,000 |
| 4.16%, dated 11/30/05 due 12/1/05 (Collateralized by | | | | | | |
| Corporate Obligations valued at $525,001,799, 1.63% | | | | | | |
| – 10.5%, 12/15/05 – 7/15/37) | | 500,058 | | | | 500,000 |
| Lehman Brothers, Inc. At: | | | | | | |
| 4.12%, dated 11/30/05 due 12/1/05 (Collateralized by | | | | | | |
| Mortgage Loan Obligations valued at $547,530,536, | | | | | | |
| 0% – 7.44%, 7/25/08 – 2/25/45) | | 524,060 | | | | 524,000 |
| 4.14%, dated 11/30/05 due 12/1/05 (Collateralized by | | | | | | |
| Mortgage Loan Obligations valued at $105,000,289, | | | | | | |
| 4.28% – 6.76%, 10/25/27 – 2/10/36) | | 100,012 | | | | 100,000 |
| 4.18%, dated 11/30/05 due 12/1/05 (Collateralized by | | | | | | |
| Equity Securities valued at $182,711,661) | | 174,020 | | | | 174,000 |
| Merrill Lynch, Pierce, Fenner & Smith At: | | | | | | |
| 4.11%, dated 11/30/05 due 12/1/05 (Collateralized by | | | | | | |
| Commercial Paper Obligations valued at | | | | | | |
| $306,004,898, 0%, 12/13/05 – 3/8/06) | | 300,034 | | | | 300,000 |
See accompanying notes which are an integral part of the financial statements.
17 Annual Report
| Investments continued | | | | | | |
| |
| Repurchase Agreements continued | | | | | | |
| | | Maturity | | | | Value (Note 1) |
| | | Amount (000s) | | | | (000s) |
| With: – continued | | | | | | |
| 4.16%, dated 11/30/05 due 12/1/05 (Collateralized by | | | | | | |
| Equity Securities valued at $1,575,003,316) | | $ 1,500,173 | | | | $ 1,500,000 |
| 4.2%, dated 10/25/05 due 1/23/06 (Collateralized by | | | | | | |
| Corporate Obligations valued at $840,680,255, 0% - | | | | | | |
| 13.75%, 3/1/06 – 9/15/35) (d)(e) | | 808,400 | | | | 800,000 |
| Morgan Stanley & Co. At: | | | | | | |
| 4.13%, dated 11/2/05 due 12/14/05: | | | | | | |
| (Collateralized by Corporate Obligations valued at | | | | | | |
| $315,676,381, 3.86% – 15.41%, 8/15/06 - | | | | | | |
| 6/25/35) | | 301,446 | | | | 300,000 |
| (Collateralized by Mortgage Loan Obligations valued at | | | | | | |
| $259,755,199, 0.36% – 13.65%, 12/15/10 - | | | | | | |
| 5/24/43) | | 247,185 | | | | 246,000 |
| 4.14%, dated 11/30/05 due 12/1/05 (Collateralized by | | | | | | |
| Mortgage Loan Obligations valued at $1,364,630,952, | | | | | | |
| 0% – 9.04%, 12/29/05 – 1/24/45) | | 1,300,150 | | | | 1,300,000 |
| 4.21%, dated 11/30/05 due 12/1/05 (Collateralized by | | | | | | |
| Equity Securities valued at $203,700,022) | | 194,023 | | | | 194,000 |
| Wachovia Securities, Inc. At 4.13%, dated 11/30/05 due | | | | | | |
| 12/1/05 (Collateralized by Mortgage Loan Obligations | | | | | | |
| valued at $976,191,429, 0.1% 7.95%, 4/10/07 | | | | | | |
| 6/10/48) | | 957,110 | | | | 957,000 |
| TOTAL REPURCHASE AGREEMENTS | | | | | | 16,376,412 |
| |
| TOTAL INVESTMENT PORTFOLIO 102.5% | | | | | | |
| (Cost $65,736,334) | | | | | | 65,736,334 |
| |
| NET OTHER ASSETS – (2.5)% | | | | | | (1,632,600) |
| NET ASSETS 100% | | | | | | $ 64,103,734 |
| Security Type Abbreviation |
| CP COMMERCIAL PAPER |
Legend
(a) Debt obligation initially issued at one
coupon which converts to a higher
coupon at a specified date. The rate
shown is the rate at period end.
|
(b) Security exempt from registration under
Rule 144A of the Securities Act of 1933.
These securities may be resold in
transactions exempt from registration,
normally to qualified institutional buyers.
At the period end, the value of these
securities amounted to $3,817,362,000
or 6.0% of net assets.
(c) Security or a portion of the security
purchased on a delayed delivery or
when-issued basis.
|
See accompanying notes which are an integral part of the financial statements.
Annual Report 18
(d) The coupon rate shown on floating or
adjustable rate securities represents the
rate at period end. The due dates on
these types of securities reflect the next
interest rate reset date or, when
applicable, the final maturity date.
(e) The maturity amount is based on the
rate at period end.
(f) Restricted securities – Investment in
securities not registered under the
Securities Act of 1933 (excluding 144A
issues). At the end of the period, the value
of restricted securities (excluding 144A
issues) amounted to $3,384,000,000 or
5.3% of net assets.
|
Additional information on each holding is as follows:
| | | Acquisition | | | | Cost |
| Security | | Date | | | | (000s) |
| Bear Stearns | | | | | | |
| Companies, Inc. | | | | | | |
| 4.17%, 12/15/05 | | 11/14/05 | | $ | | 234,000 |
| GE Capital | | | | | | |
| Assurance Co. | | 4/1/05 | | | | |
| 4.17%, 12/1/05 | | 7/28/05 | | $ | | 155,000 |
| Goldman Sachs | | | | | | |
| Group, Inc.: | | | | | | |
| 4.15%, 12/6/05 | | 10/6/05 | | $ | | 263,000 |
| 4.16%, 12/10/05 | | 11/10/05 | | $ | | 161,000 |
| 4.23%, 12/22/05 | | 11/22/05 | | $ | | 480,000 |
| 4.38%, 2/13/06 | | 8/11/04 | | $ | | 367,000 |
| Hartford Life | | | | | | |
| Insurance Co. | | | | | | |
| 4.02%, 12/1/05 | | 12/16/03 | | $ | | 40,000 |
| Hypo Real Estate | | | | | | |
| Bank International: | | | | | | |
| 4.14%, 12/2/05 | | 10/31/05 | | $ | | 36,000 |
| 4.26%, 12/30/05 | | 11/22/05 | | $ | | 108,000 |
| ING USA Annuity & | | | | | | |
| Life Insurance Co. | | | | | | |
| 4.04%, 12/28/05 | | 6/23/05 | | $ | | 123,000 |
| Jackson National | | | | | | |
| Life Insurance Co. | | | | | | |
| 4.19%, 1/2/06 | | 3/31/03 | | $ | | 130,000 |
| Metropolitan Life | | | | | | |
| Insurance Co.: | | | | | | |
| 4.19%, 1/2/06 | | 3/26/02 | | $ | | 175,000 |
| 4.41%, 2/1/06 | | 2/24/03 | | $ | | 65,000 |
| Monumental Life | | | | | | |
| Insurance Co.: | | 7/31/98 - | | | | |
| 4.23%, 12/1/05 | | 9/17/98 | | $ | | 92,000 |
| 4.26%, 12/1/05 | | 3/12/99 | | $ | | 65,000 |
| 4.45%, 2/1/06 | | 2/1/00 | | $ | | 65,000 |
| New York Life | | | | | | |
| Insurance Co. | | 2/28/02 - | | | | |
| 4.15%, 12/31/05 | | 12/19/02 | | $ | | 425,000 |
| Security Life | | | | | | |
| of Denver | | | | | | |
| Insurance Co. | | | | | | |
| 4.49%, 2/28/06 | | 8/26/05 | | $ | | 85,000 |
| Transamerica | | | | | | |
| Occidental Life | | | | | | |
| Insurance Co. | | | | | | |
| 4.42%, 2/1/06 | | 4/28/00 | | $ | | 200,000 |
| Travelers | | | | | | |
| Insurance Co.: | | | | | | |
| 4.15%, 1/2/06 | | 4/1/05 | | $ | | 5,000 |
| 4.45%, 2/17/06 | | 5/17/05 | | $ | | 75,000 |
| 4.46%, 2/20/06 | | 8/18/05 | | $ | | 35,000 |
Income Tax Information
At November 30, 2005, the fund had a capital loss carryforward of approximately $4,393,000 of which $848,000, $2,303,000 and $1,242,000 will expire on November 30, 2011, 2012 and 2013, respectively.
A total of 1.17% of the dividends distributed during the fiscal year was derived from interest on U.S. Government securities which is generally exempt from state income tax (unaudited). The fund will notify shareholders in January 2006 of amounts for use in preparing 2005 income tax returns.
See accompanying notes which are an integral part of the financial statements.
19 Annual Report
| Financial Statements | | | | | | | | |
| |
| |
| Statement of Assets and Liabilities | | | | | | | | |
| Amounts in thousands (except per share amount) | | | | | | November 30, 2005 |
| |
| Assets | | | | | | | | |
| Investment in securities, at value | | | | | | | | |
| (including repurchase agreements of $16,376,412) | | | | | | | | |
| See accompanying schedule: | | | | | | | | |
| Unaffiliated issuers (cost $65,736,334) | | | | | | $ | | 65,736,334 |
| Cash | | | | | | | | 1,963 |
| Receivable for investments sold | | | | | | | | 17,725 |
| Receivable for fund shares sold | | | | | | | | 552,826 |
| Interest receivable | | | | | | | | 169,413 |
| Prepaid expenses | | | | | | | | 321 |
| Other affiliated receivables | | | | | | | | 138 |
| Total assets | | | | | | | | 66,478,720 |
| |
| Liabilities | | | | | | | | |
| Payable for investments purchased | | | | | | | | |
| Regular delivery | | $ | | 485,000 | | | | |
| Delayed delivery | | | | 1,200,000 | | | | |
| Payable for fund shares redeemed | | | | 642,221 | | | | |
| Distributions payable | | | | 2,206 | | | | |
| Accrued management fee | | | | 11,452 | | | | |
| Other affiliated payables | | | | 12,578 | | | | |
| Other payables and accrued expenses | | | | 21,529 | | | | |
| Total liabilities | | | | | | | | 2,374,986 |
| |
| Net Assets | | | | | | $ | | 64,103,734 |
| Net Assets consist of: | | | | | | | | |
| Paid in capital | | | | | | $ | | 64,106,505 |
| Undistributed net investment income | | | | | | | | 1,622 |
| Accumulated undistributed net realized gain (loss) on | | | | | | | | |
| investments | | | | | | | | (4,393) |
| Net Assets, for 64,105,574 shares outstanding | | | | | | $ | | 64,103,734 |
| Net Asset Value, offering price and redemption price per | | | | | | |
| share ($64,103,734 ÷ 64,105,574 shares) | | | | | | $ | | 1.00 |
See accompanying notes which are an integral part of the financial statements.
| Statement of Operations | | | | | | |
| Amounts in thousands | | | | Year ended November 30, 2005 |
| |
| Investment Income | | | | | | |
| Interest (including $21 from affiliated interfund lending) | | | | $ | | 1,883,826 |
| |
| Expenses | | | | | | |
| Management fee | | $ | | 119,460 | | |
| Transfer agent fees | | | | 130,023 | | |
| Accounting fees and expenses | | | | 2,009 | | |
| Independent trustees’ compensation | | | | 270 | | |
| Appreciation in deferred trustee compensation account | | | | 18 | | |
| Custodian fees and expenses | | | | 739 | | |
| Registration fees | | | | 1,657 | | |
| Audit | | | | 395 | | |
| Legal | | | | 164 | | |
| Miscellaneous | | | | 375 | | |
| Total expenses before reductions | | | | 255,110 | | |
| Expense reductions | | | | (320) | | 254,790 |
| |
| Net investment income | | | | | | 1,629,036 |
| Realized and Unrealized Gain (Loss | | | | | | |
| Net realized gain (loss) on: | | | | | | |
| Investment securities: | | | | | | |
| Unaffiliated issuers | | | | | | (1,242) |
| Net increase in net assets resulting from operations | | | | $ | | 1,627,794 |
See accompanying notes which are an integral part of the financial statements.
21 Annual Report
| Financial Statements continued | | | | | | | | |
| |
| Statement of Changes in Net Assets | | | | | | | | |
| | | | | Year ended | | | | Year ended |
| | | | | November 30, | | | | November 30, |
| Amounts in thousands | | | | 2005 | | | | 2004 |
| Increase (Decrease) in Net Assets | | | | | | | | |
| Operations | | | | | | | | |
| Net investment income | | $ | | 1,629,036 | | $ | | 538,159 |
| Net realized gain (loss) | | | | (1,242) | | | | (2,281) |
| Net increase in net assets resulting | | | | | | | | |
| from operations | | | | 1,627,794 | | | | 535,878 |
| Distributions to shareholders from net investment income . | | | | (1,629,187) | | | | (538,000) |
| Share transactions at net asset value of $1.00 per share | | | | | | | | |
| Proceeds from sales of shares | | | | 155,149,679 | | | | 124,088,633 |
| Reinvestment of distributions | | | | 1,610,584 | | | | 532,074 |
| Cost of shares redeemed | | | | (148,953,413) | | | | (123,099,833) |
| Net increase (decrease) in net assets and shares | | | | | | | | |
| resulting from share transactions | | | | 7,806,850 | | | | 1,520,874 |
| Total increase (decrease) in net assets | | | | 7,805,457 | | | | 1,518,752 |
| |
| Net Assets | | | | | | | | |
| Beginning of period | | | | 56,298,277 | | | | 54,779,525 |
| End of period (including undistributed net investment | | | | | | | | |
| income of $1,622 and undistributed net investment | | | | | | | | |
| income of $2,923, respectively) | | $ | | 64,103,734 | | $ | | 56,298,277 |
See accompanying notes which are an integral part of the financial statements.
| Financial Highlights | | | | | | | | | | | | | | | | | | | | |
| |
| Years ended November 30, | | | | 2005 | | | | 2004 | | | | 2003 | | | | 2002 | | | | 2001 |
| Selected Per Share Data | | | | | | | | | | | | | | | | | | | | |
| Net asset value, | | | | | | | | | | | | | | | | | | | | |
| beginning of period | | $ | | 1.00 | | $ | | 1.00 | | $ | | 1.00 | | $ | | 1.00 | | $ | | 1.00 |
| Income from Investment | | | | | | | | | | | | | | | | | | | | |
| Operations | | | | | | | | | | | | | | | | | | | | |
| Net investment income | | | | 027 | | | | .010 | | | | .009 | | | | .017 | | | | .044 |
| Distributions from net investment | | | | | | | | | | | | | | | | | | | | |
| income | | | | (.027) | | | | (.010) | | | | (.009) | | | | (.017) | | | | (.044) |
| Net asset value, | | | | | | | | | | | | | | | | | | | | |
| end of period | | $ | | 1.00 | | $ | | 1.00 | | $ | | 1.00 | | $ | | 1.00 | | $ | | 1.00 |
| Total ReturnA | | | | 2.75% | | | | .98% | | | | .93% | | | | 1.69% | | | | 4.46% |
| Ratios to Average Net AssetsB | | | | | | | | | | | | | | | | | | | | |
| Expenses before reductions | | | | 43% | | | | .42% | | | | .40% | | | | .39% | | | | .39% |
| Expenses net of fee waivers, | | | | | | | | | | | | | | | | | | | | |
| if any | | | | 43% | | | | .42% | | | | .40% | | | | .39% | | | | .39% |
| Expenses net of all reductions | | | | .43% | | | | .42% | | | | .40% | | | | .39% | | | | .39% |
| Net investment income | | | | 2.74% | | | | .98% | | | | .93% | | | | 1.67% | | | | 4.27% |
| Supplemental Data | | | | | | | | | | | | | | | | | | | | |
| Net assets, end of period | | | | | | | | | | | | | | | | | | | | |
| (in millions) | | $ | | 64,104 | | $ | | 56,298 | | $ | | 54,780 | | $ | | 57,050 | | $ | | 56,504 |
A Total returns would have been lower had certain expenses not been reduced during the periods shown.
B Expense ratios reflect operating expenses of the fund. Expenses before reductions do not reflect amounts reimbursed by the investment adviser or
reductions from brokerage service arrangements or other expense offset arrangements and do not represent the amount paid by the fund during
periods when reimbursements or reductions occur. Expenses net of fee waivers reflect expenses after reimbursement by the investment adviser but
prior to reductions from brokerage service arrangements or other expense offset arrangements. Expenses net of all reductions represent the net
expenses paid by the fund.
|
See accompanying notes which are an integral part of the financial statements.
23 Annual Report
Notes to Financial Statements
For the period ended November 30, 2005
(Amounts in thousands except ratios)
1. Significant Accounting Policies.
Fidelity Cash Reserves (the fund) is a fund of Fidelity Phillips Street Trust (the trust) and is authorized to issue an unlimited number of shares. The trust is registered under the Investment Company Act of 1940, as amended (the 1940 Act), as an open end management investment company organized as a Delaware statutory trust. The financial statements have been prepared in conformity with accounting principles generally accepted in the United States of America, which require management to make certain estimates and assumptions at the date of the financial statements. The following summa rizes the significant accounting policies of the fund:
Security Valuation. Net asset value per share is calculated as of the close of business of the New York Stock Exchange, normally 4:00 p.m. Eastern time. As permitted by com pliance with certain conditions under Rule 2a 7 of the 1940 Act, securities are valued at amortized cost, which approximates value.
Investment Transactions and Income. Security transactions are accounted for as of trade date. Gains and losses on securities sold are determined on the basis of identified cost. Interest income is accrued as earned. Interest income includes coupon interest and amortization of premium and accretion of discount on debt securities.
Expenses. Most expenses of the trust can be directly attributed to a fund. Expenses which cannot be directly attributed are apportioned among each fund in the trust.
Deferred Trustee Compensation. Under a Deferred Compensation Plan (the Plan), independent Trustees must defer receipt of a portion of, and may elect to defer receipt of an additional portion of, their annual compensation. Deferred amounts are treated as though equivalent dollar amounts had been invested in shares of the fund or are invested in a cross section of other Fidelity money marketfunds, and are marked to market. Deferred amounts remain in the fund until distributed in accordance with the Plan.
Income Tax Information and Distributions to Shareholders. Each year, the fund intends to qualify as a regulated investment company by distributing all of its taxable income and realized gains under Subchapter M of the Internal Revenue Code. As a result, no provision for income taxes is required in the accompanying financial statements.
Dividends are declared daily and paid monthly from net investment income. Distribu tions from realized gains, if any, are recorded on the ex dividend date. Income and capital gain distributions are determined in accordance with income tax regulations, which may differ from generally accepted accounting principles. In addition, the fund will claim a portion of the payment made to redeeming shareholders as a distribution for income tax purposes.
1. Significant Accounting Policies continued
| | |
| Income Tax Information and Distributions to Shareholders continued |
Capital accounts within the financial statements are adjusted for permanent book tax differences. These adjustments have no impact on net assets or the results of operations. Temporary book tax differences will reverse in a subsequent period.
Book tax differences are primarily due to deferred trustees compensation and capital loss carryforwards.
The tax basis components of distributable earnings and the federal tax cost as of period end were as follows:
| Unrealized appreciation | | $ | | — | | | | |
| Unrealized depreciation | | | | — | | | | |
| Net unrealized appreciation (depreciation) | | | | — | | | | |
| Undistributed ordinary income | | | | 2,556 | | | | |
| Capital loss carryforward | | | | (4,393) | | | | |
| |
| Cost for federal income tax purposes | | $ | | 65,736,334 | | | | |
| |
The tax character of distributions paid was as follows:
| | | | |
| | | | | November 30, 2005 | | | | November 30, 2004 |
| Ordinary Income | | $ | | 1,629,187 | | $ | | 538,000 |
| |
| 2. Operating Policies. | | | | | | | | |
Repurchase Agreements. Fidelity Management & Research Company (FMR) has received an Exemptive Order from the Securities and Exchange Commission (the SEC) which permits the fund and other affiliated entities of FMR to transfer uninvested cash balances into joint trading accounts which are then invested in repurchase agreements. The fund may also invest directly with institutions in repurchase agreements. Repurchase agreements are collateralized by government or non government securities. Collateral is held in segregated accounts with custodian banks and may be obtained in the event of a default of the counterparty. The fund monitors, on a daily basis, the value of the collateral to ensure it is at least equal to the principal amount of the repurchase agreement (including accrued interest). In the event of a default by the counterparty, realization of the collateral proceeds could be delayed, during which time the value of the collateral may decline.
Delayed Delivery Transactions and When Issued Securities. The fund may purchase or sell securities on a delayed delivery or when issued basis. Payment and delivery may take place after the customary settlement period for that security. The price of the underlying securities and the date when the securities will be delivered and paid for are fixed at the time the transaction is negotiated. During the time a delayed delivery sell is outstanding, the contract is marked to market daily and equivalent deliverable
25 Annual Report
Notes to Financial Statements continued
| | |
(Amounts in thousands except ratios)
| | |
2. Operating Policies continued
| | |
| Delayed Delivery Transactions and When Issued Securities continued |
securities are held for the transaction. The value of the securities purchased on a delayed delivery or when issued basis are identified as such in the fund’s Schedule of Investments. The fund may receive compensation for interest forgone in the purchase of a delayed delivery or when issued security. With respect to purchase commitments, the fund identifies securities as segregated in its records with a value at least equal to the amount of the commitment. Losses may arise due to changes in the value of the underly ing securities or if the counterparty does not perform under the contract’s terms, or if the issuer does not issue the securities due to political, economic, or other factors.
Restricted Securities. The fund may invest in securities that are subject to legal or contractual restrictions on resale. These securities generally may be resold in transac tions exempt from registration or to the public if the securities are registered. Disposal of these securities may involve time consuming negotiations and expense, and prompt sale at an acceptable price may be difficult. Information regarding restricted securities is included at the end of the fund’s Schedule of Investments.
3. Fees and Other Transactions with Affiliates.
Management Fee. FMR and its affiliates provide the fund with investment man agement related services for which the fund pays a monthly management fee. The management fee is calculated on the basis of a group fee rate plus a total income based component. The group fee rate averaged .12% during the period. The group fee rate is based upon the average net assets of all the mutual funds advised by FMR. The group fee rate decreases as assets under management increase and increases as assets under management decrease. The total income based component is calculated according to a graduated schedule providing for different rates based on the fund’s gross annualized yield. The rate increases as the fund’s gross yield increases.
During the period the income based portion of this fee was $45,938 or an annual rate of .08% of the fund’s average net assets. For the period, the fund’s total annual management fee rate was .20% of the fund’s average net assets.
Transfer Agent Fees. Fidelity Service Company, Inc. (FSC), an affiliate of FMR, is the fund’s transfer, dividend disbursing and shareholder servicing agent. FSC receives account fees and asset based fees that vary according to account size and type of account. FSC pays for typesetting, printing and mailing of shareholder reports, except proxy statements. For the period, the transfer agent fees were equivalent to an annual rate of .22% of average net assets.
Accounting Fees. FSC maintains the fund’s accounting records. The fee is based on the level of average net assets for the month.
3. Fees and Other Transactions with Affiliates continued
Interfund Lending Program. Pursuant to an Exemptive Order issued by the SEC, the fund, along with other registered investment companies having management contracts with FMR, may participate in an interfund lending program. This program provides an alternative credit facility allowing the funds to borrow from, or lend money to, other participating affiliated funds. At period end, there were no interfund loans outstanding. The fund’s activity in this program during the period for which loans were outstanding was as follows:
| | | | | Average Daily | | Weighted Average | | | | Interest |
| Borrower or Lender | | | | Loan Balance | | Interest Rate | | Interest Earned | | Expense |
| Lender | | $ | | 9,008 | | 2.96% | | | $ | 21 | | — |
| |
| 4. Expense Reductions. | | | | | | | | |
Through arrangements with the fund’s custodian and transfer agent, credits realized as a result of uninvested cash balances were used to reduce the fund’s expenses. During the period, these credits reduced the fund’s custody and transfer agent expenses by $66 and $254, respectively.
The fund’s organizational documents provide former and current trustees and officers with a limited indemnification against liabilities arising in connection with the perfor mance of their duties to the fund. In the normal course of business, the fund may also enter into contracts that provide general indemnifications. The fund’s maximum exposure under these arrangements is unknown as this would be dependent on future claims that may be made against the fund. The risk of material loss from such claims is considered remote.
27 Annual Report
Report of Independent Registered Public Accounting Firm
To the Trustees of Fidelity Phillips Street Trust and the Shareholders of Fidelity Cash Reserves:
In our opinion, the accompanying statement of assets and liabilities, including the sched ule of investments, and the related statements of operations and of changes in net assets and the financial highlights present fairly, in all material respects, the financial position of Fidelity Cash Reserves (a fund of Fidelity Phillips Street Trust) at November 30, 2005 and the results of its operations, the changes in its net assets and the financial highlights for the periods indicated, in conformity with accounting principles generally accepted in the United States of America. These financial statements and financial highlights (hereafter referred to as “financial statements”) are the responsibility of the Fidelity Cash Reserves’s management; our responsibility is to express an opinion on these financial statements based on our audits. We conducted our audits of these financial statements in accordance with the standards of the Public Company Accounting Oversight Board (United States). Those standards require that we plan and perform the audit to obtain reasonable assur ance about whether the financial statements are free of material misstatement. An audit includes examining, on a test basis, evidence supporting the amounts and disclosures in the financial statements, assessing the accounting principles used and significant esti mates made by management, and evaluating the overall financial statement presentation. We believe that our audits, which included confirmation of securities at November 30, 2005 by correspondence with the custodian and brokers, provide a reasonable basis for our opinion.
/s/ PricewaterhouseCoopers LLP
PricewaterhouseCoopers LLP
Boston, Massachusetts
January 9, 2006
|
Trustees and Officers
The Trustees, Members of the Advisory Board, and executive officers of the trust and funds, as applicable, are listed below. The Board of Trustees governs each fund and is responsible for protecting the interests of shareholders. The Trustees are experienced executives who meet periodically throughout the year to oversee each fund’s activities, review contractual arrangements with companies that provide services to each fund, and review each fund’s performance. Except for William O. McCoy, each of the Trustees oversees 326 funds advised by FMR or an affiliate. Mr. McCoy oversees 328 funds advised by FMR or an affiliate.
The Trustees hold office without limit in time except that (a) any Trustee may resign; (b) any Trustee may be removed by written instrument, signed by at least two thirds of the number of Trustees prior to such removal; (c) any Trustee who requests to be retired or who has become incapacitated by illness or injury may be retired by written instru ment signed by a majority of the other Trustees; and (d) any Trustee may be removed at any special meeting of shareholders by a two thirds vote of the outstanding voting securities of the trust. Each Trustee who is not an interested person (as defined in the 1940 Act) (Independent Trustee), shall retire not later than the last day of the calendar year in which his or her 72nd birthday occurs. The Independent Trustees may waive this mandatory retirement age policy with respect to individual Trustees. The executive officers and Advisory Board Members hold office without limit in time, except that any officer and Advisory Board Member may resign or may be removed by a vote of a majority of the Trustees at any regular meeting or any special meeting of the Trustees. Except as indicated, each individual has held the office shown or other offices in the same company for the past five years.
The fund’s Statement of Additional Information (SAI) includes more information about the Trustees. To request a free copy, please call Fidelity at 1-877-208-0098.
Correspondence intended for each Trustee who is an interested person may be sent to Fidelity Investments, 82 Devonshire Street, Boston, Massachusetts 02109.
| | Name, Age; Principal Occupation
Edward C. Johnson 3d (75)
|
Year of Election or Appointment: 1992
Mr. Johnson is Chairman of the Board of Trustees. Mr. Johnson serves as Chief Executive Officer, Chairman, and a Director of FMR Corp.; a Director and Chairman of the Board and of the Executive Committee of FMR; Chairman and a Director of Fidelity Management & Research (Far East) Inc.; Chairman and a Director of Fidelity Investments Money Management, Inc.; and Chairman (2001 present) and a Director (2000 present) of FMR Co., Inc.
29 Annual Report
Trustees and Officers - continued
| | Name, Age; Principal Occupation
Stephen P. Jonas (52)
|
Year of Election or Appointment: 2005
Mr. Jonas is Senior Vice President of Cash Reserves (2005 present). He also serves as Senior Vice President of other Fidelity funds (2005 present). Mr. Jonas is Executive Director of FMR (2005 present). Previously, Mr. Jonas served as President of Fidelity Enterprise Opera tions and Risk Services (2004 2005), Chief Administrative Officer (2002 2004), and Chief Financial Officer of FMR Co. (1998 2000). Mr. Jonas has been with Fidelity Investments since 1987 and has held various financial and management positions including Chief Financial Officer of FMR. In addition, he serves on the Boards of Boston Ballet (2003 present) and Simmons College (2003 present).
Year of Election or Appointment: 2003
Mr. Reynolds is a Director (2003 present) and Chief Operating Officer (2002 present) of FMR Corp. He also serves on the Board at Fidelity Investments Canada, Ltd. (2000 present). Previously, Mr. Reynolds served as President of Fidelity Investments Institutional Retirement Group (1996 2000).
* Trustees have been determined to be “Interested Trustees” by virtue of, among other things, their affiliation with the trust or various entities under common control with FMR.
Correspondence intended for each Independent Trustee (that is, the Trustees other than the Interested Trustees) may be sent to Fidelity Investments, P.O. Box 55235, Boston, Massachusetts 02205 5235.
| | Name, Age; Principal Occupation
Dennis J. Dirks (57)
|
Year of Election or Appointment: 2005
Prior to his retirement in May 2003, Mr. Dirks was Chief Operating Officer and a member of the Board of The Depository Trust & Clearing Corporation (DTCC) (1999 2003). He also served as President, Chief Operating Officer, and Board member of The Depository Trust Company (DTC) (1999 2003) and President and Board member of the National Securities Clearing Corporation (NSCC) (1999 2003). In addition, Mr. Dirks served as Chief Executive Officer and Board member of the Government Securities Clearing Corporation (2001 2003) and Chief Executive Officer and Board member of the Mortgage Backed Securities Clearing Corporation (2001 2003). Mr. Dirks also serves as a Trustee of Manhattan College (2005 present).
Year of Election or Appointment: 1997
Dr. Gates is Chairman of the Independent Trustees (2006 present). Dr. Gates is President of Texas A&M University (2002 present). He was Director of the Central Intelligence Agency (CIA) from 1991 to 1993. From 1989 to 1991, Dr. Gates served as Assistant to the President of the United States and Deputy National Security Advisor. Dr. Gates is a Director of NACCO Industries, Inc. (mining and manufacturing), Parker Drilling Co., Inc. (drilling and rental tools for the energy industry, 2001 present), and Brinker International (restaurant management, 2003 present). Previously, Dr. Gates served as a Director of LucasVarity PLC (automotive components and diesel engines), a Director of TRW Inc. (automotive, space, defense, and information technology), and Dean of the George Bush School of Government and Public Service at Texas A&M University (1999 2001). Dr. Gates also is a Trustee of the Forum for International Policy.
31 Annual Report
Trustees and Officers - continued
| | Name, Age; Principal Occupation
George H. Heilmeier (69)
|
Year of Election or Appointment: 2004
Dr. Heilmeier is Chairman Emeritus of Telcordia Technologies (commu nication software and systems), where prior to his retirement, he served as company Chairman and Chief Executive Officer. He currently serves on the Boards of Directors of The Mitre Corporation (systems engineer ing and information technology support for the government), and HRL Laboratories (private research and development, 2004 present). He is Chairman of the General Motors Science & Technology Advisory Board and a Life Fellow of the Institute of Electrical and Electronics Engineers (IEEE) (2000 present). Dr. Heilmeier is a member of the Defense Science Board and the National Security Agency Advisory Board. He is also a member of the National Academy of Engineering, the American Acad emy of Arts and Sciences, and the Board of Overseers of the School of Engineering and Applied Science of the University of Pennsylvania. Previously, Dr. Heilmeier served as a Director of TRW Inc. (automotive, space, defense, and information technology, 1992 2002), Compaq (1994 2002), Automatic Data Processing, Inc. (ADP) (technology based business outsourcing, 1995 2002), INET Technologies Inc. (telecommu nications network surveillance, 2001 2004), and Teletech Holdings (customer management services). He is the recipient of the 2005 Kyoto Prize in Advanced Technology for his invention of the liquid display.
Year of Election or Appointment: 2001
Prior to Ms. Knowles’ retirement in June 2000, she served as Executive Vice President and Chief Financial Officer of Atlantic Richfield Company (ARCO) (diversified energy, 1996 2000). From 1993 to 1996, she was a Senior Vice President of ARCO and President of ARCO Transportation Company. She served as a Director of ARCO from 1996 to 1998. She currently serves as a Director of Phelps Dodge Corporation (copper mining and manufacturing) and McKesson Corporation (healthcare ser vice, 2002 present). Ms. Knowles is a Trustee of the Brookings Institution and the Catalina Island Conservancy and also serves as a member of the Advisory Board for the School of Engineering of the University of Southern California.
Name, Age; Principal Occupation
Ned C. Lautenbach (61)
|
Year of Election or Appointment: 2000
Mr. Lautenbach has been a partner of Clayton, Dubilier & Rice, Inc. (private equity investment firm) since September 1998. Previously, Mr. Lautenbach was with the International Business Machines Corpora tion (IBM) from 1968 until his retirement in 1998. Mr. Lautenbach serves as a Director of Italtel Holding S.p.A. (telecommunications (Milan, Italy), 2004 present) and Eaton Corporation (diversified industrial) as well as the Philharmonic Center for the Arts in Naples, Florida. He also is a member of the Board of Trustees of Fairfield University (2005 present), as well as a member of the Council on Foreign Relations.
Year of Election or Appointment: 1997
Prior to his retirement in December 1994, Mr. McCoy was Vice Chair man of the Board of BellSouth Corporation (telecommunications) and President of BellSouth Enterprises. He is currently a Director of Liberty Corporation (holding company), Duke Realty Corporation (real estate), and Progress Energy, Inc. (electric utility). He is also a partner of Frank lin Street Partners (private investment management firm) and a member of the Research Triangle Foundation Board. In addition, Mr. McCoy served as the Interim Chancellor (1999 2000) and a member of the Board of Visitors for the University of North Carolina at Chapel Hill and currently serves on the Board of Directors of the University of North Carolina Health Care System and the Board of Visitors of the Kenan Flagler Business School (University of North Carolina at Chapel Hill). He also served as Vice President of Finance for the University of North Carolina (16 school system).
Year of Election or Appointment: 2005
Ms. Small is a member (2000 present) and Chairperson (2002 present) of the Investment Committee, and a member (2002 present) of the Board of Trustees of Smith College. Previously, she served as Chief Investment Officer (1999 2000), Director of Global Equity Investments (1996 1999), and a member of the Board of Directors of Scudder, Stevens & Clark (1990 1997) and Scudder Kemper Investments (1997 1998). In addition, Ms. Small served as Co Chair (2000 2003) of the Annual Fund for the Fletcher School of Law and Diplomacy.
33 Annual Report
Trustees and Officers - continued
| | Name, Age; Principal Occupation
William S. Stavropoulos (66)
|
Year of Election or Appointment: 2002
Mr. Stavropoulos is Chairman of the Board (2000 present) and a Member of the Board of Directors of The Dow Chemical Company. Since joining The Dow Chemical Company in 1967, Mr. Stavropoulos served in numerous senior management positions, including President (1993 2000; 2002 2003), CEO (1995 2000; 2002 2004), and Chairman of the Executive Committee (2000 2004). Currently, he is a Director of NCR Corporation (data warehousing and technology solutions), BellSouth Corporation (telecommunications), Chemical Financial Corporation, Maersk Inc. (industrial conglomerate, 2002 present), and Metalmark Capital (private equity investment firm, 2005 present). He also serves as a member of the Board of Trustees of the American Enterprise Institute for Public Policy Research. In addition, Mr. Stavropoulos is a member of The Business Council, J.P. Morgan International Council and the University of Notre Dame Advisory Council for the College of Science.
Year of Election or Appointment: 2005
Prior to his retirement in 2001, Mr. Wolfe was Chairman and Chief Executive Officer of Hershey Foods Corporation (1993 2001). He cur rently serves as a member of the boards of Adelphia Communications Corporation (2003 present), Bausch & Lomb, Inc., and Revlon Inc. (2004 present).
Advisory Board Members and Executive Officers:
Correspondence intended for Mr. Gamper may be sent to Fidelity Investments, P.O. Box 55235, Boston, Massachusetts 02205 5235. Correspondence intended for each executive officer and Mr. Lynch may be sent to Fidelity Investments, 82 Devonshire Street, Boston, Massachusetts 02109.
| | Name, Age; Principal Occupation
Albert R. Gamper, Jr. (63)
|
Year of Election or Appointment: 2005
Member of the Advisory Board of Fidelity Phillips Street Trust. Mr. Gamper also serves as a trustee (2006 present) or member of the Advisory Board (2005 present) of other investment companies advised by FMR. Prior to his retirement in December 2004, Mr. Gamper served as Chairman of the Board of CIT Group Inc. (commercial finance). During his tenure with CIT Group Inc. Mr. Gamper served in numerous senior management positions, including Chairman (1987 1989; 1999 2001; 2002 2004), Chief Executive Officer (1987 2004), and President (1989 2002). He currently serves as a member of the Board of Directors of Public Service Enterprise Group (utilities, 2001 present), Chairman of the Board of Governors, Rutgers University (2004 present), and Chairman of the Board of Saint Barnabas Health Care System.
Year of Election or Appointment: 2003
Member of the Advisory Board of Fidelity Phillips Street Trust. Vice Chairman and a Director of FMR, and Vice Chairman (2001 present) and a Director (2000 present) of FMR Co., Inc. Previously, Mr. Lynch served as a Trustee of the Fidelity funds (1990 2003). In addition, he serves as a Trustee of Boston College, Massachusetts Eye & Ear Infirmary, Historic Deerfield, John F. Kennedy Library, and the Museum of Fine Arts of Boston.
Year of Election or Appointment: 2005
Vice President of Cash Reserves. Mr. Donovan also serves as Vice President of Fidelity’s High Income Funds (2005 present), Fidelity’s Fixed Income Funds (2005 present), certain Asset Allocation Funds (2005 present), and certain Balanced Funds (2005 present). Mr. Donovan also serves as Executive Vice President of FMR (2005 present) and FMRC (2005 present). Previously, Mr. Donovan served as Vice President and Director of Fidelity’s International Equity Trading group (1998 2005).
35 Annual Report
Trustees and Officers - continued
| | Name, Age; Principal Occupation
Charles S. Morrison (44)
|
Year of Election or Appointment: 2005
Vice President of Cash Reserves. Mr. Morrison also serves as Vice President of Fidelity’s Money Market Funds (2005 present) and certain Asset Allocation Funds (2002 present). Previously, he served as Vice President of Fidelity’s Bond Funds (2002 2005) and certain Balanced Funds (2002 2005). He served as Vice President (2002 2005) and Bond Group Leader (2002 2005) of Fidelity Investments Fixed Income Division. Mr. Morrison is also Vice President of FIMM (2002 present) and FMR (2002 present). Mr. Morrison joined Fidelity Investments in 1987 as a Corporate Bond Analyst in the Fixed Income Research Division.
Year of Election or Appointment: 2002
Vice President of Cash Reserves. Mr. Murphy also serves as Vice President of Fidelity’s Money Market Funds (2002 present), certain Asset Allocation Funds (2003 present), Fidelity’s Investment Grade Bond Funds (2005 present), and Fidelity’s Balanced Funds (2005 present). He serves as Senior Vice President (2000 present) and Head (2004 present) of the Fidelity Investments Fixed Income Division. Mr. Murphy is also a Senior Vice President of FIMM (2003 present) and a Vice President of FMR (2000 present). Previously, Mr. Murphy served as Money Market Group Leader (2002 2004), Bond Group Leader (2000 2002), and Vice Presi dent of Fidelity’s Taxable Bond Funds (2000 2002) and Fidelity’s Muni cipal Bond Funds (2001 2002). Mr. Murphy joined Fidelity Investments in 1989 as a portfolio manager in the Bond Group.
Year of Election or Appointment: 2004
Vice President of Cash Reserves. Mr. Litterst also serves as Vice President of other funds advised by FMR. Prior to assuming his current responsibi lities, Mr. Litterst managed a variety of Fidelity funds.
Year of Election or Appointment: 1998
Secretary of Cash Reserves. He also serves as Secretary of other Fidelity funds; Vice President, General Counsel, and Secretary of FMR Co., Inc. (2001 present) and FMR; Assistant Secretary of Fidelity Management & Research (U.K.) Inc. (2001 present), Fidelity Management & Research (Far East) Inc. (2001 present), and Fidelity Investments Money Manage ment, Inc. (2001 present). Mr. Roiter is an Adjunct Member, Faculty of Law, at Boston College Law School (2003 present). Previously, Mr. Roiter served as Vice President and Secretary of Fidelity Distributors Corpora tion (FDC) (1998 2005).
Name, Age; Principal Occupation
|
Year of Election or Appointment: 2003
Assistant Secretary of Cash Reserves. Mr. Fross also serves as Assistant Secretary of other Fidelity funds (2003 present), Vice President and Secretary of FDC (2005 present), and is an employee of FMR.
Year of Election or Appointment: 2004
President, Treasurer, and Anti Money Laundering (AML) officer of Cash Reserves. Ms. Reynolds also serves as President, Treasurer, and AML officer of other Fidelity funds (2004) and is a Vice President (2003) and an employee (2002) of FMR. Before joining Fidelity Investments, Ms. Reynolds worked at PricewaterhouseCoopers LLP (PwC) (1980 2002), where she was most recently an audit partner with PwC’s investment management practice.
Year of Election or Appointment: 2005
Chief Financial Officer of Cash Reserves. Mr. Murphy also serves as Chief Financial Officer of other Fidelity funds (2005 present). He also serves as Senior Vice President of Fidelity Pricing and Cash Manage ment Services Group (FPCMS).
Kenneth A. Rathgeber (58)
|
Year of Election or Appointment: 2004
Chief Compliance Officer of Cash Reserves. Mr. Rathgeber also serves as Chief Compliance Officer of other Fidelity funds (2004) and Execu tive Vice President of Risk Oversight for Fidelity Investments (2002). Previously, he served as Executive Vice President and Chief Operating Officer for Fidelity Investments Institutional Services Company, Inc. (1998 2002).
37 Annual Report
Trustees and Officers - continued
| | Name, Age; Principal Occupation
John R. Hebble (47)
|
Year of Election or Appointment: 2003
Deputy Treasurer of Cash Reserves. Mr. Hebble also serves as Deputy Treasurer of other Fidelity funds (2003), and is an employee of FMR. Before joining Fidelity Investments, Mr. Hebble worked at Deutsche Asset Management where he served as Director of Fund Accounting (2002 2003) and Assistant Treasurer of the Scudder Funds (1998 2003).
Year of Election or Appointment: 2005
Deputy Treasurer of Cash Reserves. Mr. Mehrmann also serves as Deputy Treasurer of other Fidelity funds (2005 present) and is an employee of FMR. Previously, Mr. Mehrmann served as Vice President of Fidelity Investments Institutional Services Group (FIIS)/Fidelity Investments Institutional Operations Corporation, Inc. (FIIOC) Client Services (1998 2004).
| | Kimberley H. Monasterio (41)
|
Year of Election or Appointment: 2004
Deputy Treasurer of Cash Reserves. Ms. Monasterio also serves as Deputy Treasurer of other Fidelity funds (2004) and is an employee of FMR (2004). Before joining Fidelity Investments, Ms. Monasterio served as Treasurer (2000 2004) and Chief Financial Officer (2002 2004) of the Franklin Templeton Funds and Senior Vice President of Franklin Templeton Services, LLC (2000 2004).
Year of Election or Appointment: 2005
Deputy Treasurer of Cash Reserves. Mr. Robins also serves as Deputy Treasurer of other Fidelity funds (2005 present) and is an employee of FMR (2004 present). Before joining Fidelity Investments, Mr. Robins worked at KPMG LLP, where he was a partner in KPMG’s department of professional practice (2002 2004) and a Senior Manager (1999 2000). In addition, Mr. Robins served as Assistant Chief Accountant, United States Securities and Exchange Commission (2000 2002).
Year of Election or Appointment: 2005
Assistant Treasurer of Cash Reserves. Mr. Byrnes also serves as Assistant Treasurer of other Fidelity funds (2005 present) and is an employee of FMR (2005 present). Previously, Mr. Byrnes served as Vice President of FPCMS (2003 2005). Before joining Fidelity Investments, Mr. Byrnes worked at Deutsche Asset Management where he served as Vice Presi dent of the Investment Operations Group (2000 2003).
Name, Age; Principal Occupation
John H. Costello (59)
|
Year of Election or Appointment: 1986
Assistant Treasurer of Cash Reserves. Mr. Costello also serves as Assis tant Treasurer of other Fidelity funds and is an employee of FMR.
Year of Election or Appointment: 2004
Assistant Treasurer of Cash Reserves. Mr. Lydecker also serves as Assis tant Treasurer of other Fidelity funds (2004) and is an employee of FMR.
Year of Election or Appointment: 2002
Assistant Treasurer of Cash Reserves. Mr. Osterheld also serves as Assis tant Treasurer of other Fidelity funds (2002) and is an employee of FMR.
Year of Election or Appointment: 2005
Assistant Treasurer of Cash Reserves. Mr. Ryan also serves as Assistant Treasurer of other Fidelity funds (2005 present) and is an employee of FMR (2005 present). Previously, Mr. Ryan served as Vice President of Fund Reporting in FPCMS (1999 2005).
Year of Election or Appointment: 2005
Assistant Treasurer of Cash Reserves. Mr. Schiavone also serves as Assistant Treasurer of other Fidelity funds (2005 present) and is an employee of FMR (2005 present). Before joining Fidelity Investments, Mr. Schiavone worked at Deutsche Asset Management, where he most recently served as Assistant Treasurer (2003 2005) of the Scudder Funds and Vice President and Head of Fund Reporting (1996 2003).
39 Annual Report
Board Approval of Investment Advisory Contracts and Management Fees
Cash Reserves
Each year, typically in June, the Board of Trustees, including the independent Trustees (together, the Board), votes on the renewal of the management contract and sub advisory agreements (together, the Advisory Contracts) for the fund. The Board, assisted by the advice of fund counsel and independent Trustees’ counsel, requests and considers a broad range of information throughout the year.
The Board meets regularly each month except August and takes into account throughout the year matters bearing on Advisory Contracts. The Board, acting directly and through its separate committees, considers at each of its meetings factors that are relevant to the annual renewal of the fund’s Advisory Contracts, including the services and support provided to the fund and its shareholders by Fidelity. At the time of the renewal, the Board had 11 standing committees, each composed of independent Trustees with varying backgrounds, to which the Board has assigned specific subject matter responsibilities in order to enhance effective decision making by the Board. Each committee has adopted a written charter outlining the structure and purposes of the committee. One such com mittee, the Fixed Income Contract Committee, meets periodically during the first six months of each year and as necessary to consider matters specifically related to the annual renewal of Advisory Contracts. The committee requests and receives information on, and makes recommendations to the independent Trustees concerning, the approval and annual review of the Advisory Contracts.
At its June 2005 meeting, the Board of Trustees, including the independent Trustees, unanimously determined to renew the Advisory Contracts for the fund. In reaching its determination, the Board considered all factors it believed relevant, including (1) the nature, extent, and quality of the services to be provided to the fund and its shareholders by Fidelity (including the investment performance of the fund); (2) the competitiveness of the management fee and total expenses of the fund; (3) the total costs of the services to be provided by and the profits to be realized by the investment adviser and its affiliates from the relationship with the fund; (4) the extent to which economies of scale would be realized as the fund grows; and (5) whether fee levels reflect these economies of scale, if any, for the benefit of fund shareholders.
In determining whether to renew the Advisory Contracts for the fund, the Board ulti mately reached a determination, with the assistance of fund counsel and independent Trustees’ counsel, that the renewal of the Advisory Contracts and the compensation to be received by Fidelity under the management contract is consistent with Fidelity’s fidu ciary duty under applicable law. In addition to evaluating the specific factors noted above, the Board, in reaching its determination, is aware that shareholders in the fund have a broad range of investment choices available to them, including a wide choice among mutual funds offered by competitors to Fidelity, and that the fund’s shareholders, with the opportunity to review and weigh the disclosure provided by the fund in its
prospectus and other public disclosures, have chosen to invest in this fund, managed by Fidelity.
Nature, Extent, and Quality of Services Provided by Fidelity. The Board consid ered staffing within the investment adviser, FMR, and the sub advisers (together, the Investment Advisers), including the background of the fund’s portfolio manager and the fund’s investment objective and discipline. The independent Trustees also had discus sions with senior management of Fidelity’s investment operations and investment groups. The Board considered the structure of the portfolio manager compensation program and whether this structure provides appropriate incentives.
Fidelity Resources Dedicated to Investment Management and Support Services. The Board reviewed the size, education, and experience of the Investment Advisers’ invest ment staff, their use of technology, and the Investment Advisers’ approach to recruiting, training, and retaining portfolio managers and other research, advisory, and manage ment personnel. The Board considered Fidelity’s extensive global research capabilities that enable the Investment Advisers to aggregate data from various sources in an effort to produce positive investment results. The Board noted that Fidelity’s analysts have access to a variety of technological tools that enable them to perform both fundamental and quantitative analysis and to specialize in various disciplines. The Board also considered that Fidelity’s portfolio managers and analysts have access to daily portfolio attribution that allows for monitoring of a fund’s portfolio, as well as an electronic communication system that provides immediate real time access to research concerning issuers and credit enhancers.
Shareholder and Administrative Services. The Board considered the nature, extent, quality, and cost of administrative, distribution, and shareholder services performed by the Investment Advisers and their affiliates under the Advisory Contracts and under separate agreements covering transfer agency and pricing and bookkeeping services for the fund. The Board also considered the nature and extent of the Investment Advisers’ supervision of third party service providers, principally custodians and subcustodians. The Board also considered the resources devoted to, and the record of compliance with, the fund’s compliance policies and procedures.
The Board noted that the growth of fund assets across the complex allows Fidelity to reinvest in the development of services designed to enhance the value or convenience of the Fidelity funds as investment vehicles. These services include 24 hour access to account information and market information through phone representatives and over the Internet, and investor education materials and asset allocation tools.
Investment in a Large Fund Family. The Board considered the benefits to shareholders of investing in a Fidelity fund, including the benefits of investing in a fund that is part of a large family of funds offering a variety of investment disciplines and providing for a large variety of mutual fund investor services. For example, fund shareholders are offered the
41 Annual Report
Board Approval of Investment Advisory Contracts and Management Fees continued
privilege of exchanging shares of the fund for shares of other Fidelity funds, as set forth in the fund’s prospectus, without paying a sales charge. The Board noted that, since the last Advisory Contract renewals in June 2004, Fidelity has taken a number of actions that benefited particular funds, including (i) voluntarily deciding in 2004 to stop using “soft” commission dollars to pay for market data and, instead, to pay for that data out of its own resources, (ii) contractually agreeing to impose management fee reductions and expense limitations on its five Spartan stock index funds and its stock index fund available through variable insurance products, (iii) contractually agreeing to eliminate the management fees on the Fidelity Freedom Funds and the Fidelity Advisor Freedom Funds, (iv) contractually agreeing to reduce the management fees on most of its investment grade taxable bond funds, and (v) contractually agreeing to impose expense limitations on its retail and Spartan investment grade taxable bond funds.
Investment Performance. The Board considered whether the fund has operated within its investment objective, as well as its record of compliance with its investment restric tions. It also reviewed the fund’s absolute investment performance, as well as the fund’s relative investment performance measured against a peer group of mutual funds deemed appropriate by the Board over multiple periods. The following charts considered by the Board show, over the one , three , and five year periods ended December 31, 2004, the fund’s returns and a range of returns of a peer group of mutual funds identified by Lipper Inc. as having an investment objective similar to that of the fund. The box within each chart shows the 25th percentile return (bottom of box) and the 75th percentile return (top of box) of the Lipper peer group. The percentage beaten number noted below each chart corresponds to the percentile box and represents the percentage of funds in the Lipper peer group whose performance was equal to or lower than that of the fund.

Annual Report 42
The Board noted that the relative investment performance of the fund has compared favorably to its Lipper peer group over time.
Based on its review, and giving particular weight to the nature and quality of the resources dedicated by the Investment Advisers to maintain and improve relative performance, the Board concluded that the nature, extent, and quality of the services provided by Fidelity will benefit the fund’s shareholders, particularly in light of the Board’s view that the fund’s shareholders benefit from investing in a fund that is part of a large family of funds offering a variety of investment disciplines and services.
Competitiveness of Management Fee and Total Fund Expenses. The Board considered the fund’s management fee and total expenses compared to “mapped groups” of competitive funds and classes. Fidelity creates “mapped groups” by combining similar Lipper investment objective categories that have comparable management fee charac teristics. Combining Lipper investment objective categories aids the Board’s manage ment fee and total expense comparisons by broadening the competitive group used for comparison and by reducing the number of universes to which various Fidelity funds are compared.
The Board considered two proprietary management fee comparisons for the 12 month periods shown in the chart below. The group of Lipper funds used by the Board for management fee comparisons is referred to below as the “Total Mapped Group” and, for the reasons explained above, is broader than the Lipper peer group used by the Board for performance comparisons. The Total Mapped Group comparison focuses on a fund’s standing relative to the total universe of comparable funds available to investors, in terms of gross management fees before expense reimbursements or caps. “TMG %” represents the percentage of funds in the Total Mapped Group that had management fees that were lower than the fund’s. For example, a TMG % of 5% would mean that 95% of the funds in the Total Mapped Group had higher management fees than the fund. The “Asset Size Peer Group” (ASPG) comparison focuses on a fund’s standing relative to non Fidelity funds similar in size to the fund within the Total Mapped Group. The ASPG represents at least 15% of the funds in the Total Mapped Group with comparable asset size and management fee characteristics, subject to a minimum of 50 funds (or all funds in the Total Mapped Group if fewer than 50). Additional information, such as the ASPG quartile (“quadrant”) in which the fund’s management fee ranked, is also included in the chart and considered by the Board. The Board also recognized that the income based component of the fund’s management fee varies depending on the level of the fund’s monthly gross income, providing for higher fees at higher income levels, and for lower fees at lower income levels.
43 Annual Report
Board Approval of Investment Advisory Contracts and Management Fees continued
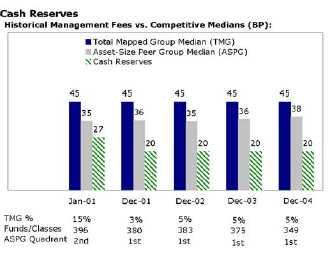
The Board noted that the fund’s management fee ranked below the median of its Total Mapped Group and below the median of its ASPG for 2004. Based on its review, the Board concluded that the fund’s management fee was fair and reasonable in light of the ser vices that the fund receives and the other factors considered.
In its review of the fund’s total expenses, the Board considered the fund’s management fee as well as other fund expenses, such as transfer agent fees, pricing and bookkeeping fees, and custodial, legal, and audit fees. The Board also noted the effects of any waivers and reimbursements on fees and expenses. As part of its review, the Board also consid ered current and historical total expenses of the fund compared to competitive fund median expenses. The fund is compared to those funds and classes in the Total Mapped Group (used by the Board for management fee comparisons) that have a similar sales load structure.
The Board noted that the fund’s total expenses ranked below its competitive median for 2004.
In its review of total expenses, the Board also considered Fidelity fee structures and other information on clients that FMR and its affiliates service in other competitive markets, such as other mutual funds advised or subadvised by FMR or its affiliates, pension plan clients, and other institutional clients.
Based on its review, the Board concluded that the fund’s total expenses were reasonable in light of the services that the fund and its shareholders receive and the other factors considered.
Costs of the Services and Profitability. The Board considered the revenues earned and the expenses incurred by Fidelity in conducting the business of developing, market ing, distributing, managing, administering and servicing the fund and its shareholders. The Board also considered the level of Fidelity’s profits in respect of all the Fidelity funds.
On an annual basis, FMR presents to the Board Fidelity’s profitability for the fund. Fidelity calculates the profitability for each fund, as well as aggregate profitability for groups of Fidelity funds and all Fidelity funds, using a series of detailed revenue and cost allocation methodologies which originate with the audited books and records of Fidelity. The Audit Committee of the Board reviews any significant changes from the prior year’s methodologies.
PricewaterhouseCoopers LLP (PwC), independent registered accounting firm and auditor to Fidelity and certain Fidelity funds, has been engaged annually by the Board as part of the Board’s assessment of the results of Fidelity’s profitability analysis. PwC’s engagement includes the review and assessment of Fidelity’s methodologies used in determining the revenues and expenses attributable to Fidelity’s mutual fund business, and completion of agreed upon procedures surrounding the mathematical accuracy of fund profitability and its conformity to allocation methodologies. After considering PwC’s reports issued under the engagement and information provided by Fidelity, the Board believes that while other allocation methods may also be reasonable, Fidelity’s profitabil ity methodologies are reasonable in all material respects.
The Board has also reviewed Fidelity’s non fund businesses and any fall out benefits related to the mutual fund business as well as cases where Fidelity’s affiliates may benefit from or be related to the fund’s business. In addition, a special committee of the Board reviewed services provided to Fidelity by its affiliates and determined that the fees that Fidelity paid for such services were reasonable.
The Board considered the costs of the services provided by and the profits realized by Fidelity in connection with the operation of the fund and determined that the amount of profit is a fair entrepreneurial profit for the management of the fund.
Economies of Scale. The Board considered whether there have been economies of scale in respect of the management of the Fidelity funds, whether the Fidelity funds (including the fund) have appropriately benefited from any such economies of scale, and whether there is potential for realization of any further economies of scale. The Board considered the extent to which the fund will benefit from economies of scale through increased services to the fund, through waivers or reimbursements, or through fee or expense reductions, including reductions that occur through operation of the transfer agent agreement. The transfer agent fee varies in part based on the number of accounts in the fund. If the number of accounts decreases or the average account size increases, the overall transfer agent fee rate decreases.
45 Annual Report
Board Approval of Investment Advisory Contracts and Management Fees continued
The Board recognized that the fund’s management contract incorporates a “group fee” structure, which provides for lower fee rates as total fund assets under FMR’s manage ment increase, and for higher fee rates as total fund assets under FMR’s management decrease. The Board considered that the group fee is designed to deliver the benefits of economies of scale to fund shareholders when total fund assets increase, even if assets of any particular fund are unchanged or have declined, because some portion of Fidelity’s costs are attributable to services provided to all Fidelity funds, and all funds benefit if those costs can be allocated among more assets. The Board concluded that, given the group fee structure, fund shareholders will achieve a certain level of economies of scale as assets under FMR’s management increase at the fund complex level, regardless of whether Fidelity achieves any such economies of scale.
The Board further concluded that any potential economies of scale are being shared between fund shareholders and Fidelity in an appropriate manner.
Additional Information Requested by the Board. In order to develop fully the factual basis for consideration of the Advisory Contracts, the Board requested additional information regarding (i) Fidelity’s fund profitability methodology, including additional detail on various cost allocations; (ii) fall out benefits to Fidelity; and (iii) compensation of portfolio managers and research analysts.
Based on its evaluation of all of the conclusions noted above, and after considering all material factors, the Board ultimately concluded that the existing advisory fee structures are fair and reasonable, and that the fund’s existing Advisory Contracts should be renewed.
Managing Your Investments
Fidelity offers several ways to conveniently manage your personal investments via your telephone or PC. You can access your account information, conduct trades and research your investments 24 hours a day.
By Phone
Fidelity Automated Service Telephone provides a single toll free number to access account balances, positions, quotes and trading. It’s easy to navigate the service, and on your first call, the system will help you create a personal identification number (PIN) for security.


By PC
Fidelity’s web site on the Internet provides a wide range of information, including daily financial news, fund performance, interactive planning tools and news about Fidelity products and services.

* When you call the quotes line, please remember that a fund’s yield and return will vary and, except for money market funds, share price will also vary. This means that you may have a gain or loss when you sell your shares. There is no assurance that money market funds will be able to maintain a stable $1 share price; an investment in a money market fund is not insured or guar anteed by the U.S. government. Total returns are historical and include changes in share price, reinvestment of dividends and capital gains, and the effects of any sales charges.
47 Annual Report
| | Investment Adviser
Fidelity Management & Research Company
Boston, MA
Investment Sub Adviser
Fidelity Investments
Money Management, Inc.
Fidelity International Investment Advisors
Fidelity International Investment Advisors
(U.K.) Limited
General Distributor
Fidelity Distributors Corporation
Boston, MA
Transfer and Service Agent
Fidelity Service Company, Inc.
Boston, MA
Custodian
The Bank of New York
New York, NY
|
| The Fidelity Telephone Connection |
| Mutual Fund 24-Hour Service |
| Exchanges/Redemptions | | |
| and Account Assistance | | 1-800-544-6666 |
| Product Information | | 1-800-544-6666 |
| Retirement Accounts | | 1-800-544-4774 |
| (8 a.m. - 9 p.m.) | | |
| TDD Service | | 1-800-544-0118 |
| for the deaf and hearing impaired |
| (9 a.m. - 9 p.m. Eastern time) |
| Fidelity Automated Service | | |
| Telephone (FAST® ) (automated phone logo) | | 1-800-544-5555 |
| (automated phone logo) Automated line for quickest service |
CAS-UANN-0106
1.786705.102
|

Fidelity®
U.S. Government Reserves
|
| | Annual Report
November 30, 2005
|


| Contents | | | | |
| |
| Chairman’s Message | | 4 | | Ned Johnson’s message to shareholders. |
| Shareholder Expense | | 5 | | An example of shareholder expenses. |
| Example | | | | |
| Investment Changes/ | | 6 | | A summary of major shifts in the fund’s |
| Performance | | | | investments over the past six months. |
| Investments | | 7 | | A complete list of the fund’s investments. |
| Financial Statements | | 9 | | Statements of assets and liabilities, |
| | | | | operations, and changes in net assets, |
| | | | | as well as financial highlights. |
| Notes | | 13 | | Notes to the financial statements. |
| Report of Independent | | 16 | | |
| Registered Public | | | | |
| Accounting Firm | | | | |
| Trustees and Officers | | 17 | | |
| Board Approval of | | 28 | | |
| Investment Advisory | | | | |
| Contracts and | | | | |
| Management Fees | | | | |
To view a fund’s proxy voting guidelines and proxy voting record for the 12 month period
ended June 30, visit www.fidelity.com/proxyvotingresults or visit the Securities and Exchange
Commission’s (SEC) web site at www.sec.gov. You may also call 1-800-544-8544 to request a free
copy of the proxy voting guidelines.
Standard & Poor’s, S&P and S&P 500 are registered service marks of The McGraw Hill Companies,
Inc. and have been licensed for use by Fidelity Distributors Corporation.
Other third party marks appearing herein are the property of their respective owners.
All other marks appearing herein are registered or unregistered trademarks or service marks
of FMR Corp. or an affiliated company.
|
Annual Report 2
This report and the financial statements contained herein are submitted for the general
information of the shareholders of the fund. This report is not authorized for distribution to
prospective investors in the fund unless preceded or accompanied by an effective prospectus.
A fund files its complete schedule of portfolio holdings with the SEC for the first and third
quarters of each fiscal year on Form N Q. Forms N Q are available on the SEC’s web site at
http://www.sec.gov. A fund’s Forms N Q may be reviewed and copied at the SEC’s Public Reference
Room in Washington, DC. Information regarding the operation of the SEC’s Public Reference
Room may be obtained by calling 1-800-SEC-0330. For a complete list of a fund’s portfolio
holdings, view the most recent quarterly holdings report, semiannual report, or annual report
on Fidelity’s web site at http://www.fidelity.com/holdings.
NOT FDIC INSURED · MAY LOSE VALUE · NO BANK GUARANTEE
Neither the fund nor Fidelity Distributors Corporation is a bank.
|
3 Annual Report
Chairman’s Message
(photograph of Edward C. Johnson 3d)
Dear Shareholder:
During the past year or so, much has been reported about the mutual fund industry, and much of it has been more critical than I believe is warranted. Allegations that some companies have been less than forthright with their shareholders have cast a shadow on the entire industry. I continue to find these reports disturbing, and assert that they do not create an accurate picture of the industry overall. Therefore, I would like to remind every one where Fidelity stands on these issues. I will say two things specifically regarding allegations that some mutual fund companies were in violation of the Securities and Exchange Commission’s forward pricing rules or were involved in so called “market timing” activities.
First, Fidelity has no agreements that permit customers who buy fund shares after 4 p.m. to obtain the 4 p.m. price. This is not a new policy. This is not to say that some one could not deceive the company through fraudulent acts. However, we are extremely diligent in preventing fraud from occurring in this manner and in every other. But I underscore again that Fidelity has no so called “agreements” that sanction illegal practices.
Second, Fidelity continues to stand on record, as we have for years, in opposition to predatory short term trading that adversely affects shareholders in a mutual fund. Back in the 1980s, we initiated a fee which is returned to the fund and, therefore, to investors to discourage this activity. Further, we took the lead several years ago in developing a Fair Value Pricing Policy to prevent market timing on foreign securities in our funds. I am confident we will find other ways to make it more difficult for predatory traders to operate. However, this will only be achieved through close cooperation among regulators, legislators and the industry.
Yes, there have been unfortunate instances of unethical and illegal activity within the mutual fund industry from time to time. That is true of any industry. When this occurs, confessed or convicted offenders should be dealt with appropriately. But we are still concerned about the risk of over regulation and the quick application of simplistic solutions to intricate problems. Every system can be improved, and we support and applaud well thought out improvements by regulators, legislators and industry representatives that achieve the common goal of building and protecting the value of investors’ holdings.
For nearly 60 years, Fidelity has worked very hard to improve its products and service to justify your trust. When our family founded this company in 1946, we had only a few hundred customers. Today, we serve more than 18 million customers including individual investors and participants in retirement plans across America.
Let me close by saying that we do not take your trust in us for granted, and we realize that we must always work to improve all aspects of our service to you. In turn, we urge you to continue your active participation with your financial matters, so that your interests can be well served.
Best regards,
/s/ Edward C. Johnson 3d
Edward C. Johnson 3d
Annual Report 4
Shareholder Expense Example
As a shareholder of the Fund, you incur two types of costs: (1) transaction costs, and (2) ongoing costs, including management fees and other Fund expenses. This Example is intended to help you understand your ongoing costs (in dollars) of investing in the Fund and to compare these costs with the ongoing costs of investing in other mutual funds. The Example is based on an investment of $1,000 invested at the beginning of the period and held for the entire period (June 1, 2005 to November 30, 2005).
The first line of the table below provides information about actual account values and actual expenses. You may use the information in this line, together with the amount you invested, to estimate the expenses that you paid over the period. Simply divide your account value by $1,000.00 (for example, an $8,600 account value divided by $1,000.00 = 8.6), then multiply the result by the number in the first line under the heading entitled “Expenses Paid During Period” to estimate the expenses you paid on your account during this period. A small balance maintenance fee of $12.00 that is charged once a year may apply for certain accounts with a value of less than $2,000. This fee is not included in the table below. If it was, the estimate of expenses you paid during the period would be higher, and your ending account value lower, by this amount.
Hypothetical Example for Comparison Purposes
The second line of the table below provides information about hypothetical account values and hypothetical expenses based on the Fund’s actual expense ratio and an assumed rate of return of 5% per year before expenses, which is not the Fund’s actual return. The hypothetical account values and expenses may not be used to estimate the actual ending account balance or expenses you paid for the period. You may use this information to compare the ongoing costs of investing in the Fund and other funds. To do so, compare this 5% hypothetical example with the 5% hypothetical examples that appear in the share holder reports of the other funds. A small balance maintenance fee of $12.00 that is charged once a year may apply for certain accounts with a value of less than $2,000. This fee is not included in the table below. If it was, the estimate of expenses you paid during the period would be higher, and your ending account value lower, by this amount.
Please note that the expenses shown in the table are meant to highlight your ongoing costs only and do not reflect any transaction costs. Therefore, the second line of the table is useful in comparing ongoing costs only, and will not help you determine the relative total costs of owning different funds.
| | | | | | | | | | | Expenses Paid |
| | | | | Beginning | | | | Ending | | During Period* |
| | | | | Account Value | | | | Account Value | | June 1, 2005 to |
| | | | | June 1, 2005 | | | | November 30, 2005 | | November 30, 2005 |
| Actual | | $ | | 1,000.00 | | | | 1,016.30 | $ | 1.77 |
| Hypothetical (5% return per year | | | | | | | | | | |
| before expenses) | | $ | | 1,000.00 | | $ | | 1,023.31 | $ | 1.78 |
* Expenses are equal to the Fund’s annualized expense ratio of .35%; multiplied by the average account value over the period, multiplied by 183/365 (to reflect the one half year period).
5 Annual Report
| Investment Changes/Performance |
| |
| Maturity Diversification | | | | | | |
| Days | | % of fund’s | | % of fund’s | | % of fund’s |
| | | investments | | investments | | investments |
| | | 11/30/05 | | 5/31/05 | | 11/30/04 |
| 0 – 30 | | 90.2 | | 80.7 | | 63.6 |
| 31 – 90 | | 4.7 | | 17.6 | | 20.1 |
| 91 – 180 | | 2.2 | | 1.7 | | 16.3 |
| 181 – 397 | | 2.9 | | 0.0 | | 0.0 |
Weighted Average Maturity | | | | | | |
| | | 11/30/05 | | 5/31/05 | | 11/30/04 |
| Fidelity U.S. Government Reserves | | 18 Days | | 18 Days | | 42 Days |
| Government Retail Money Market | | | | | | |
| Funds Average* | | 34 Days | | 34 Days | | 41 Days |

| Current and Historical Seven Day Yields | | | | | | |
| | | 11/29/05 | | 8/30/05 | | 5/31/05 | | 3/1/05 | | 11/30/04 |
| Fidelity U.S. Government | | | | | | | | | | |
| Reserves | | 3.68% | | 3.23% | | 2.73% | | 2.18% | | 1.69% |
Yield refers to the income paid by the fund over a given period. Yields for money market funds are usually for seven day periods, as they are here, though they are expressed as annual percentage rates. Past performance is no guarantee of future results. Yield will vary and it is possible to lose money by investing in the fund.
*Source: iMoneyNet, Inc.
Annual Report 6
Investments November 30, 2005
Showing Percentage of Net Assets
Federal Agencies 21.9%
| Due | | Annualized Yield at | | Principal Amount | | Value (Note 1) |
| Date | | Time of Purchase | | (000s) | | (000s) |
| Fannie Mae – 13.5% | | | | | | | | | | |
| Agency Coupons – 12.3% | | | | | | | | | | |
| 12/21/05 | | 3.80% (a) | | $ | | 115,000 | | $ | | 114,935 |
| 12/22/05 | | 3.79 (a) | | | | 135,000 | | | | 134,912 |
| 2/22/06 | | 4.27 (a) | | | | 60,000 | | | | 59,982 |
| | | | | | | | | | | 309,829 |
| |
| Discount Notes – 1.2% | | | | | | | | | | |
| 3/1/06 | | 3.73 | | | | 24,720 | | | | 24,494 |
| 3/1/06 | | 3.74 | | | | 6,810 | | | | 6,748 |
| | | | | | | | | | | 31,242 |
| |
| | | | | | | | | | | 341,071 |
| Federal Home Loan Bank – 3.1% | | | | | | | | | | |
| Agency Coupons – 3.1% | | | | | | | | | | |
| 12/13/05 | | 3.73 (a) | | | | 56,000 | | | | 55,976 |
| 2/2/06 | | 4.15 (a) | | | | 23,000 | | | | 22,989 |
| | | | | | | | | | | 78,965 |
| |
| Freddie Mac – 5.3% | | | | | | | | | | |
| Discount Notes – 5.3% | | | | | | | | | | |
| 2/28/06 | | 3.72 | | | | 36,255 | | | | 35,928 |
| 3/7/06 | | 3.78 | | | | 25,000 | | | | 24,753 |
| 7/25/06 | | 4.01 | | | | 24,200 | | | | 23,589 |
| 9/27/06 | | 4.26 | | | | 25,000 | | | | 24,149 |
| 9/29/06 | | 4.51 | | | | 15,000 | | | | 14,455 |
| 10/17/06 | | 4.53 | | | | 11,095 | | | | 10,667 |
| | | | | | | | | | | 133,541 |
| |
| TOTAL FEDERAL AGENCIES | | | | | | | | | | 553,577 |
See accompanying notes which are an integral part of the financial statements.
| Investments continued | | | | | | |
| |
| |
| Repurchase Agreements 78.2% | | | | | | |
| | | | | Maturity | | Value (Note 1) |
| | | | | Amount (000s) | | (000s) |
| In a joint trading account (Collateralized by U.S. Government | | | | | | |
| Obligations dated 11/30/05 due 12/1/05 At 4.05%) (b) | | . $ 1,816,602 | | $ | | 1,816,398 |
| With Morgan Stanley & Co., Inc. At: | | | | | | |
| 3.9%, dated 9/22/05 due 12/22/05 (Collateralized by | | | | | | |
| Mortgage Loan Obligations valued at $70,619,217, | | | | | | |
| 4.18% – 4.23%, 8/1/33 – 6/1/42) | | 69,680 | | | | 69,000 |
| 4.03%, dated 11/4/05 due 12/8/05 (Collateralized by | | | | | | |
| Mortgage Loan Obligations valued at $95,182,423, | | | | | | |
| 4.18% – 4.23%, 8/1/33 – 6/1/42) | | 93,354 | | | | 93,000 |
| TOTAL REPURCHASE AGREEMENTS | | | | | | 1,978,398 |
| |
| TOTAL INVESTMENT PORTFOLIO 100.1% | | | | | | |
| (Cost $2,531,975) | | | | | | 2,531,975 |
| |
| NET OTHER ASSETS – (0.1)% | | | | | | (1,594) |
| NET ASSETS 100% | | | | $ | | 2,530,381 |
Legend
(a) The coupon rate shown on floating or
adjustable rate securities represents the
rate at period end. The due dates on
these types of securities reflect the next
interest rate reset date or, when
applicable, the final maturity date.
(b) Additional information on each
counterparty to the repurchase
agreement is as follows:
|
| Repurchase Agreement/ | | | | Value |
| Counterparty | | | | (000s) |
| $1,816,398,000 due | | | | |
| 12/1/05 at 4.05% | | | | |
| |
| Bank of America, | | | | |
| National Association | | $ | | 392,176 |
| Barclays Capital Inc. | | | | 392,176 |
| BNP Paribas Securities | | | | |
| Corp. | | | | 65,363 |
| Countrywide Securities | | | | |
| Corporation | | | | 261,450 |
| Credit Suisse First Boston | | | | |
| LLC | | | | 196,088 |
| Repurchase Agreement/ | | | | Value |
| Counterparty | | | | (000s) |
| Greenwich Capital | | | | |
| Markets, Inc. | | $ | | 65,363 |
| Morgan Stanley & Co. | | | | |
| Incorporated. | | | | 51,607 |
| Societe Generale, New | | | | |
| York Branch | | | | 261,450 |
| WestLB AG | | | | 130,725 |
| | | $ | | 1,816,398 |
Income Tax Information
At November 30, 2005, the fund had a capital loss carryforward of approximately $218,000 of which $9,000, $189,000 and $20,000 will expire on November 30, 2010, 2012 and 2013, respectively. A total of 9.36% of the dividends distributed during the fiscal year was derived from interest on U.S. Government securities which is generally exempt from state income tax (unaudited). The fund will notify shareholders in January 2006 of amounts for use in preparing 2005 income tax returns.
See accompanying notes which are an integral part of the financial statements.
Annual Report 8
| Financial Statements | | | | | | | | |
| |
| |
| Statement of Assets and Liabilities | | | | | | | | |
| Amounts in thousands (except per share amount) | | | | | | November 30, 2005 |
| |
| Assets | | | | | | | | |
| Investment in securities, at value | | | | | | | | |
| (including repurchase agreements of $1,978,398) | | | | | | | | |
| See accompanying schedule: | | | | | | | | |
| Unaffiliated issuers (cost $2,531,975) | | | | | | $ | | 2,531,975 |
| Receivable for fund shares sold | | | | | | | | 3,803 |
| Interest receivable | | | | | | | | 3,465 |
| Prepaid expenses | | | | | | | | 12 |
| Total assets | | | | | | | | 2,539,255 |
| |
| Liabilities | | | | | | | | |
| Payable for fund shares redeemed | | $ | | 8,025 | | | | |
| Distributions payable | | | | 66 | | | | |
| Accrued management fee | | | | 453 | | | | |
| Other affiliated payables | | | | 300 | | | | |
| Other payables and accrued expenses | | | | 30 | | | | |
| Total liabilities | | | | | | | | 8,874 |
| |
| Net Assets | | | | | | $ | | 2,530,381 |
| Net Assets consist of: | | | | | | | | |
| Paid in capital | | | | | | $ | | 2,530,188 |
| Undistributed net investment income | | | | | | | | 85 |
| Accumulated undistributed net realized gain (loss) on | | | | | | | | |
| investments | | | | | | | | 108 |
| Net Assets, for 2,530,562 shares outstanding | | | | | | $ | | 2,530,381 |
| Net Asset Value, offering price and redemption price per | | | | | | |
| share ($2,530,381 ÷ 2,530,562 shares) | | | | | | $ | | 1.00 |
See accompanying notes which are an integral part of the financial statements.
9 Annual Report
| Financial Statements continued | | | | | | |
| |
| |
| Statement of Operations | | | | | | |
| Amounts in thousands | | | | Year ended November 30, 2005 |
| |
| Investment Income | | | | | | |
| Interest | | | | $ | | 72,048 |
| |
| Expenses | | | | | | |
| Management fee | | $ | | 4,661 | | |
| Transfer agent fees | | | | 3,109 | | |
| Accounting fees and expenses | | | | 212 | | |
| Independent trustees’ compensation | | | | 11 | | |
| Custodian fees and expenses | | | | 10 | | |
| Registration fees | | | | 94 | | |
| Audit | | | | 48 | | |
| Legal | | | | 6 | | |
| Miscellaneous | | | | 22 | | |
| Total expenses before reductions | | | | 8,173 | | |
| Expense reductions | | | | (85) | | 8,088 |
| |
| Net investment income | | | | | | 63,960 |
| Realized and Unrealized Gain (Loss) | | | | | | |
| Net realized gain (loss) on: | | | | | | |
| Investment securities: | | | | | | |
| Unaffiliated issuers | | | | | | (20) |
| Net increase in net assets resulting from operations | | | | $ | | 63,940 |
See accompanying notes which are an integral part of the financial statements.
| Statement of Changes in Net Assets | | | | | | | | | | |
| | | | | | | Year ended | | | | Year ended |
| | | | | | | November 30, | | | | November 30, |
| Amounts in thousands | | | | | | 2005 | | | | 2004 |
| Increase (Decrease) in Net Assets | | | | | | | | | | |
| Operations | | | | | | | | | | |
| Net investment income | | | | $ | | 63,960 | | $ | | 21,997 |
| Net realized gain (loss) | | | | | | (20) | | | | (188) |
| Net increase in net assets resulting | | | | | | | | | | |
| from operations | | | | | | 63,940 | | | | 21,809 |
| Distributions to shareholders from net investment income | | . | | | | (64,022) | | | | (21,935) |
| Share transactions at net asset value of $1.00 per share | | | | | | | | | | |
| Proceeds from sales of shares | | | | | | 2,381,878 | | | | 1,827,726 |
| Reinvestment of distributions | | | | | | 63,380 | | | | 21,707 |
| Cost of shares redeemed | | | | | | (2,192,263) | | | | (1,833,484) |
| Net increase (decrease) in net assets and shares | | | | | | | | | | |
| resulting from share transactions | | | | | | 252,995 | | | | 15,949 |
| Total increase (decrease) in net assets | | | | | | 252,913 | | | | 15,823 |
| |
| Net Assets | | | | | | | | | | |
| Beginning of period | | | | | | 2,277,468 | | | | 2,261,645 |
| End of period (including undistributed net investment | | | | | | | | | | |
| income of $85 and undistributed net investment | | | | | | | | | | |
| income of $759, respectively) | | | | $ | | 2,530,381 | | $ | | 2,277,468 |
See accompanying notes which are an integral part of the financial statements.
11 Annual Report
| Financial Highlights | | | | | | | | | | | | | | | | | | | | |
| |
| Years ended November 30, | | | | 2005 | | | | 2004 | | | | 2003 | | | | 2002 | | | | 2001 |
| Selected Per Share Data | | | | | | | | | | | | | | | | | | | | |
| Net asset value, | | | | | | | | | | | | | | | | | | | | |
| beginning of period | | $ | | 1.00 | | $ | | 1.00 | | $ | | 1.00 | | $ | | 1.00 | | $ | | 1.00 |
| Income from Investment | | | | | | | | | | | | | | | | | | | | |
| Operations | | | | | | | | | | | | | | | | | | | | |
| Net investment income | | | | 027 | | | | .010 | | | | .009 | | | | .017 | | | | .044 |
| Distributions from net | | | | | | | | | | | | | | | | | | | | |
| investment income | | | | (.027) | | | | (.010) | | | | (.009) | | | | (.017) | | | | (.044) |
| Net asset value, | | | | | | | | | | | | | | | | | | | | |
| end of period | | $ | | 1.00 | | $ | | 1.00 | | $ | | 1.00 | | $ | | 1.00 | | $ | | 1.00 |
| Total ReturnA | | | | 2.76% | | | | 1.00% | | | | .94% | | | | 1.71% | | | | 4.46% |
| Ratios to Average Net AssetsB | | | | | | | | | | | | | | | | | | | | |
| Expenses before reductions | | | | 35% | | | | .35% | | | | .35% | | | | .34% | | | | .36% |
| Expenses net of fee waivers, | | | | | | | | | | | | | | | | | | | | |
| if any | | | | 35% | | | | .35% | | | | .35% | | | | .34% | | | | .36% |
| Expenses net of all reductions | | | | .35% | | | | .35% | | | | .35% | | | | .34% | | | | .36% |
| Net investment income | | | | 2.74% | | | | 1.01% | | | | .94% | | | | 1.69% | | | | 4.15% |
| Supplemental Data | | | | | | | | | | | | | | | | | | | | |
| Net assets, end of period | | | | | | | | | | | | | | | | | | | | |
| (in millions) | | $ | | 2,530 | | $ | | 2,277 | | $ | | 2,262 | | $ | | 2,560 | | $ | | 2,355 |
A Total returns would have been lower had certain expenses not been reduced during the periods shown.
B Expense ratios reflect operating expenses of the fund. Expenses before reductions do not reflect amounts reimbursed by the investment adviser or
reductions from brokerage service arrangements or other expense offset arrangements and do not represent the amount paid by the fund during
periods when reimbursements or reductions occur. Expenses net of fee waivers reflect expenses after reimbursement by the investment adviser but
prior to reductions from brokerage service arrangements or other expense offset arrangements. Expenses net of all reductions represent the net
expenses paid by the fund.
|
See accompanying notes which are an integral part of the financial statements.
Notes to Financial Statements
For the period ended November 30, 2005
(Amounts in thousands except ratios)
|
1. Significant Accounting Policies.
Fidelity U.S. Government Reserves (the fund) is a fund of Fidelity Phillips Street Trust (the trust) and is authorized to issue an unlimited number of shares. The trust is regis tered under the Investment Company Act of 1940, as amended (the 1940 Act), as an open end management investment company organized as a Delaware statutory trust. The financial statements have been prepared in conformity with accounting principles generally accepted in the United States of America, which require management to make certain estimates and assumptions at the date of the financial statements. The following summarizes the significant accounting policies of the fund:
Security Valuation. Net asset value per share is calculated as of the close of business of the New York Stock Exchange, normally 4:00 p.m. Eastern time. As permitted by com pliance with certain conditions under Rule 2a 7 of the 1940 Act, securities are valued at amortized cost, which approximates value.
Investment Transactions and Income. Security transactions are accounted for as of trade date. Gains and losses on securities sold are determined on the basis of identified cost. Interest income is accrued as earned. Interest income includes coupon interest and amortization of premium and accretion of discount on debt securities.
Expenses. Most expenses of the trust can be directly attributed to a fund. Expenses which cannot be directly attributed are apportioned among each fund in the trust.
Income Tax Information and Distributions to Shareholders. Each year, the fund intends to qualify as a regulated investment company by distributing all of its taxable income and realized gains under Subchapter M of the Internal Revenue Code. As a result, no provision for income taxes is required in the accompanying financial statements.
Dividends are declared daily and paid monthly from net investment income. Distribu tions from realized gains, if any, are recorded on the ex dividend date. Income and capital gain distributions are determined in accordance with income tax regulations, which may differ from generally accepted accounting principles. In addition, the fund will claim a portion of the payment made to redeeming shareholders as a distribution for income tax purposes.
Capital accounts within the financial statements are adjusted for permanent book tax differences. These adjustments have no impact on net assets or the results of operations. Temporary book tax differences will reverse in a subsequent period.
Book tax differences are primarily due to deferred trustees compensation and capital loss carryforwards.
13 Annual Report
Notes to Financial Statements continued
(Amounts in thousands except ratios)
1. Significant Accounting Policies continued
Income Tax Information and Distributions to Shareholders
The tax basis components of distributable earnings and the federal tax cost as of period end were as follows:
| Unrealized appreciation | | $ | | — | | | | |
| Unrealized depreciation | | | | — | | | | |
| Net unrealized appreciation (depreciation) | | | | — | | | | |
| Undistributed ordinary income | | | | 417 | | | | |
| Capital loss carryforward | | | | (218) | | | | |
| |
| Cost for federal income tax purposes | | $ | | 2,531,975 | | | | |
| |
The tax character of distributions paid was as follows:
| | | | |
| |
| | | | | November 30, 2005 | | | | November 30, 2004 |
| Ordinary Income | | $ | | 64,022 | | $ | | 21,935 |
| |
| 2. Operating Policies. | | | | | | | | |
Repurchase Agreements. Fidelity Management & Research Company (FMR) has received an Exemptive Order from the Securities and Exchange Commission (the SEC) which permits the fund and other affiliated entities of FMR to transfer uninvested cash balances into joint trading accounts which are then invested in repurchase agreements. The fund may also invest directly with institutions in repurchase agreements. Repur chase agreements are collateralized by government or non government securities. Collateral is held in segregated accounts with custodian banks and may be obtained in the event of a default of the counterparty. The fund monitors, on a daily basis, the value of the collateral to ensure it is at least equal to the principal amount of the repurchase agreement (including accrued interest). In the event of a default by the counterparty, realization of the collateral proceeds could be delayed, during which time the value of the collateral may decline.
3. Fees and Other Transactions with Affiliates.
Management Fee. FMR and its affiliates provide the fund with investment man agement related services for which the fund pays a monthly management fee. The management fee is calculated on the basis of a group fee rate plus a total income based component. The group fee rate averaged .12% during the period. The group fee rate is based upon the average net assets of all the mutual funds advised by FMR. The group fee rate decreases as assets under management increase and increases as assets under
3. Fees and Other Transactions with Affiliates continued
|
| Management Fee continued | | |
management decrease. The total income based component is calculated according to a graduated schedule providing for different rates based on the fund’s gross annualized yield. The rate increases as the fund’s gross yield increases.
During the period the income based portion of this fee was $1,779 or an annual rate of .08% of the fund’s average net assets. For the period, the fund’s total annual management fee rate was .20% of the fund’s average net assets.
Transfer Agent Fees. Fidelity Service Company, Inc. (FSC), an affiliate of FMR, is the fund’s transfer, dividend disbursing and shareholder servicing agent. FSC receives account fees and asset based fees that vary according to account size and type of account. FSC pays for typesetting, printing and mailing of shareholder reports, except proxy statements. For the period, the transfer agent fees were equivalent to an annual rate of .13% of average net assets.
Accounting Fees. FSC maintains the fund’s accounting records. The fee is based on the level of average net assets for the month.
Through arrangements with the fund’s custodian and transfer agent, credits realized as a result of uninvested cash balances were used to reduce the fund’s expenses. During the period, these credits reduced the fund’s custody and transfer agent expenses by $1 and $84, respectively.
The fund’s organizational documents provide former and current trustees and officers with a limited indemnification against liabilities arising in connection with the perfor mance of their duties to the fund. In the normal course of business, the fund may also enter into contracts that provide general indemnifications. The fund’s maximum exposure under these arrangements is unknown as this would be dependent on future claims that may be made against the fund. The risk of material loss from such claims is considered remote.
15 Annual Report
Report of Independent Registered Public Accounting Firm
To the Trustees of Fidelity Phillips Street Trust and the Shareholders of Fidelity U.S. Government Reserves:
In our opinion, the accompanying statement of assets and liabilities, including the sched ule of investments, and the related statements of operations and of changes in net assets and the financial highlights present fairly, in all material respects, the financial position of Fidelity U.S. Government Reserves (a fund of Fidelity Phillips Street Trust) at November 30, 2005 and the results of its operations, the changes in its net assets and the financial highlights for the periods indicated, in conformity with accounting principles generally accepted in the United States of America. These financial statements and financial highlights (hereafter referred to as “financial statements”) are the responsibility of the Fidelity U.S. Government Reserves’s management; our responsibility is to express an opinion on these financial statements based on our audits. We conducted our audits of these financial statements in accordance with the standards of the Public Company Accounting Oversight Board (United States). Those standards require that we plan and perform the audit to obtain reasonable assurance about whether the financial statements are free of material misstatement. An audit includes examining, on a test basis, evidence supporting the amounts and disclosures in the financial statements, assessing the accounting principles used and significant estimates made by management, and evalu ating the overall financial statement presentation. We believe that our audits, which included confirmation of securities at November 30, 2005 by correspondence with the custodian and brokers, provide a reasonable basis for our opinion.
/s/ PricewaterhouseCoopers LLP
PricewaterhouseCoopers LLP
Boston, Massachusetts
January 9, 2006
|
Trustees and Officers
The Trustees, Members of the Advisory Board, and executive officers of the trust and funds, as applicable, are listed below. The Board of Trustees governs each fund and is responsible for protecting the interests of shareholders. The Trustees are experienced executives who meet periodically throughout the year to oversee each fund’s activities, review contractual arrangements with companies that provide services to each fund, and review each fund’s performance. Except for William O. McCoy, each of the Trustees oversees 326 funds advised by FMR or an affiliate. Mr. McCoy oversees 328 funds advised by FMR or an affiliate.
The Trustees hold office without limit in time except that (a) any Trustee may resign; (b) any Trustee may be removed by written instrument, signed by at least two thirds of the number of Trustees prior to such removal; (c) any Trustee who requests to be retired or who has become incapacitated by illness or injury may be retired by written instru ment signed by a majority of the other Trustees; and (d) any Trustee may be removed at any special meeting of shareholders by a two thirds vote of the outstanding voting securities of the trust. Each Trustee who is not an interested person (as defined in the 1940 Act) (Independent Trustee), shall retire not later than the last day of the calendar year in which his or her 72nd birthday occurs. The Independent Trustees may waive this mandatory retirement age policy with respect to individual Trustees. The executive officers and Advisory Board Members hold office without limit in time, except that any officer and Advisory Board Member may resign or may be removed by a vote of a majority of the Trustees at any regular meeting or any special meeting of the Trustees. Except as indicated, each individual has held the office shown or other offices in the same company for the past five years.
The fund’s Statement of Additional Information (SAI) includes more information about the Trustees. To request a free copy, please call Fidelity at 1-877-208-0098.
Correspondence intended for each Trustee who is an interested person may be sent to Fidelity Investments, 82 Devonshire Street, Boston, Massachusetts 02109.
| | Name, Age; Principal Occupation
Edward C. Johnson 3d (75)
|
Year of Election or Appointment: 1992
Mr. Johnson is Chairman of the Board of Trustees. Mr. Johnson serves as Chief Executive Officer, Chairman, and a Director of FMR Corp.; a Director and Chairman of the Board and of the Executive Committee of FMR; Chairman and a Director of Fidelity Management & Research (Far East) Inc.; Chairman and a Director of Fidelity Investments Money Management, Inc.; and Chairman (2001 present) and a Director (2000 present) of FMR Co., Inc.
17 Annual Report
Trustees and Officers - continued
| | Name, Age; Principal Occupation
Stephen P. Jonas (52)
|
Year of Election or Appointment: 2005
Mr. Jonas is Senior Vice President of U.S. Government Reserves (2005 present). He also serves as Senior Vice President of other Fidelity funds (2005 present). Mr. Jonas is Executive Director of FMR (2005 present). Previously, Mr. Jonas served as President of Fidelity Enterprise Operations and Risk Services (2004 2005), Chief Adminis trative Officer (2002 2004), and Chief Financial Officer of FMR Co. (1998 2000). Mr. Jonas has been with Fidelity Investments since 1987 and has held various financial and management positions including Chief Financial Officer of FMR. In addition, he serves on the Boards of Boston Ballet (2003 present) and Simmons College (2003 present).
Year of Election or Appointment: 2003
Mr. Reynolds is a Director (2003 present) and Chief Operating Officer (2002 present) of FMR Corp. He also serves on the Board at Fidelity Investments Canada, Ltd. (2000 present). Previously, Mr. Reynolds served as President of Fidelity Investments Institutional Retirement Group (1996 2000).
* Trustees have been determined to be “Interested Trustees” by virtue of, among other things, their affiliation with the trust or various entities under common control with FMR.
Correspondence intended for each Independent Trustee (that is, the Trustees other than the Interested Trustees) may be sent to Fidelity Investments, P.O. Box 55235, Boston, Massachusetts 02205 5235.
| | Name, Age; Principal Occupation
Dennis J. Dirks (57)
|
Year of Election or Appointment: 2005
Prior to his retirement in May 2003, Mr. Dirks was Chief Operating Officer and a member of the Board of The Depository Trust & Clearing Corporation (DTCC) (1999 2003). He also served as President, Chief Operating Officer, and Board member of The Depository Trust Company (DTC) (1999 2003) and President and Board member of the National Securities Clearing Corporation (NSCC) (1999 2003). In addition, Mr. Dirks served as Chief Executive Officer and Board member of the Government Securities Clearing Corporation (2001 2003) and Chief Executive Officer and Board member of the Mortgage Backed Securities Clearing Corporation (2001 2003). Mr. Dirks also serves as a Trustee of Manhattan College (2005 present).
Year of Election or Appointment: 1997
Dr. Gates is Chairman of the Independent Trustees (2006 present). Dr. Gates is President of Texas A&M University (2002 present). He was Director of the Central Intelligence Agency (CIA) from 1991 to 1993. From 1989 to 1991, Dr. Gates served as Assistant to the President of the United States and Deputy National Security Advisor. Dr. Gates is a Director of NACCO Industries, Inc. (mining and manufacturing), Parker Drilling Co., Inc. (drilling and rental tools for the energy industry, 2001 present), and Brinker International (restaurant management, 2003 present). Previously, Dr. Gates served as a Director of LucasVarity PLC (automotive components and diesel engines), a Director of TRW Inc. (automotive, space, defense, and information technology), and Dean of the George Bush School of Government and Public Service at Texas A&M University (1999 2001). Dr. Gates also is a Trustee of the Forum for International Policy.
19 Annual Report
Trustees and Officers - continued
| | Name, Age; Principal Occupation
George H. Heilmeier (69)
|
Year of Election or Appointment: 2004
Dr. Heilmeier is Chairman Emeritus of Telcordia Technologies (commu nication software and systems), where prior to his retirement, he served as company Chairman and Chief Executive Officer. He currently serves on the Boards of Directors of The Mitre Corporation (systems engineer ing and information technology support for the government), and HRL Laboratories (private research and development, 2004 present). He is Chairman of the General Motors Science & Technology Advisory Board and a Life Fellow of the Institute of Electrical and Electronics Engineers (IEEE) (2000 present). Dr. Heilmeier is a member of the Defense Science Board and the National Security Agency Advisory Board. He is also a member of the National Academy of Engineering, the American Acad emy of Arts and Sciences, and the Board of Overseers of the School of Engineering and Applied Science of the University of Pennsylvania. Previously, Dr. Heilmeier served as a Director of TRW Inc. (automotive, space, defense, and information technology, 1992 2002), Compaq (1994 2002), Automatic Data Processing, Inc. (ADP) (technology based business outsourcing, 1995 2002), INET Technologies Inc. (telecommu nications network surveillance, 2001 2004), and Teletech Holdings (customer management services). He is the recipient of the 2005 Kyoto Prize in Advanced Technology for his invention of the liquid display.
Year of Election or Appointment: 2001
Prior to Ms. Knowles’ retirement in June 2000, she served as Executive Vice President and Chief Financial Officer of Atlantic Richfield Company (ARCO) (diversified energy, 1996 2000). From 1993 to 1996, she was a Senior Vice President of ARCO and President of ARCO Transportation Company. She served as a Director of ARCO from 1996 to 1998. She currently serves as a Director of Phelps Dodge Corporation (copper mining and manufacturing) and McKesson Corporation (healthcare service, 2002 present). Ms. Knowles is a Trustee of the Brookings Institu tion and the Catalina Island Conservancy and also serves as a member of the Advisory Board for the School of Engineering of the University of Southern California.
Name, Age; Principal Occupation
Ned C. Lautenbach (61)
|
Year of Election or Appointment: 2000
Mr. Lautenbach has been a partner of Clayton, Dubilier & Rice, Inc. (private equity investment firm) since September 1998. Previously, Mr. Lautenbach was with the International Business Machines Corpora tion (IBM) from 1968 until his retirement in 1998. Mr. Lautenbach serves as a Director of Italtel Holding S.p.A. (telecommunications (Milan, Italy), 2004 present) and Eaton Corporation (diversified industrial) as well as the Philharmonic Center for the Arts in Naples, Florida. He also is a member of the Board of Trustees of Fairfield University (2005 present), as well as a member of the Council on Foreign Relations.
Year of Election or Appointment: 1997
Prior to his retirement in December 1994, Mr. McCoy was Vice Chair man of the Board of BellSouth Corporation (telecommunications) and President of BellSouth Enterprises. He is currently a Director of Liberty Corporation (holding company), Duke Realty Corporation (real estate), and Progress Energy, Inc. (electric utility). He is also a partner of Frank lin Street Partners (private investment management firm) and a member of the Research Triangle Foundation Board. In addition, Mr. McCoy served as the Interim Chancellor (1999 2000) and a member of the Board of Visitors for the University of North Carolina at Chapel Hill and currently serves on the Board of Directors of the University of North Carolina Health Care System and the Board of Visitors of the Kenan Flagler Business School (University of North Carolina at Chapel Hill). He also served as Vice President of Finance for the University of North Carolina (16 school system).
Year of Election or Appointment: 2005
Ms. Small is a member (2000 present) and Chairperson (2002 present) of the Investment Committee, and a member (2002 present) of the Board of Trustees of Smith College. Previously, she served as Chief Investment Officer (1999 2000), Director of Global Equity Investments (1996 1999), and a member of the Board of Directors of Scudder, Stevens & Clark (1990 1997) and Scudder Kemper Investments (1997 1998). In addition, Ms. Small served as Co Chair (2000 2003) of the Annual Fund for the Fletcher School of Law and Diplomacy.
21 Annual Report
Trustees and Officers - continued
| | Name, Age; Principal Occupation
William S. Stavropoulos (66)
|
Year of Election or Appointment: 2002
Mr. Stavropoulos is Chairman of the Board (2000 present) and a Member of the Board of Directors of The Dow Chemical Company. Since joining The Dow Chemical Company in 1967, Mr. Stavropoulos served in numerous senior management positions, including President (1993 2000; 2002 2003), CEO (1995 2000; 2002 2004), and Chairman of the Executive Committee (2000 2004). Currently, he is a Director of NCR Corporation (data warehousing and technology solutions), BellSouth Corporation (telecommunications), Chemical Financial Corporation, Maersk Inc. (industrial conglomerate, 2002 present), and Metalmark Capital (private equity investment firm, 2005 present). He also serves as a member of the Board of Trustees of the American Enterprise Institute for Public Policy Research. In addition, Mr. Stavropoulos is a member of The Business Council, J.P. Morgan International Council and the University of Notre Dame Advisory Council for the College of Science.
Year of Election or Appointment: 2005
Prior to his retirement in 2001, Mr. Wolfe was Chairman and Chief Executive Officer of Hershey Foods Corporation (1993 2001). He cur rently serves as a member of the boards of Adelphia Communications Corporation (2003 present), Bausch & Lomb, Inc., and Revlon Inc. (2004 present).
Advisory Board Members and Executive Officers:
Correspondence intended for Mr. Gamper may be sent to Fidelity Investments, P.O. Box 55235, Boston, Massachusetts 02205 5235. Correspondence intended for each executive officer and Mr. Lynch may be sent to Fidelity Investments, 82 Devonshire Street, Boston, Massachusetts 02109.
| | Name, Age; Principal Occupation
Albert R. Gamper, Jr. (63)
|
Year of Election or Appointment: 2005
Member of the Advisory Board of Fidelity Phillips Street Trust. Mr. Gamper also serves as a trustee (2006 present) or member of the Advisory Board (2005 present) of other investment companies advised by FMR. Prior to his retirement in December 2004, Mr. Gamper served as Chairman of the Board of CIT Group Inc. (commercial finance). During his tenure with CIT Group Inc. Mr. Gamper served in numerous senior management positions, including Chairman (1987 1989; 1999 2001; 2002 2004), Chief Executive Officer (1987 2004), and President (1989 2002). He currently serves as a member of the Board of Directors of Public Service Enterprise Group (utilities, 2001 present), Chairman of the Board of Governors, Rutgers University (2004 present), and Chairman of the Board of Saint Barnabas Health Care System.
Year of Election or Appointment: 2003
Member of the Advisory Board of Fidelity Phillips Street Trust. Vice Chairman and a Director of FMR, and Vice Chairman (2001 present) and a Director (2000 present) of FMR Co., Inc. Previously, Mr. Lynch served as a Trustee of the Fidelity funds (1990 2003). In addition, he serves as a Trustee of Boston College, Massachusetts Eye & Ear Infirmary, Historic Deerfield, John F. Kennedy Library, and the Museum of Fine Arts of Boston.
Year of Election or Appointment: 2005
Vice President of U.S. Government Reserves. Mr. Donovan also serves as Vice President of Fidelity’s High Income Funds (2005 present), Fidelity’s Fixed Income Funds (2005 present), certain Asset Allocation Funds (2005 present), and certain Balanced Funds (2005 present). Mr. Donovan also serves as Executive Vice President of FMR (2005 present) and FMRC (2005 present). Previously, Mr. Donovan served as Vice President and Director of Fidelity’s International Equity Trading group (1998 2005).
23 Annual Report
Trustees and Officers - continued
| | Name, Age; Principal Occupation
Charles S. Morrison (44)
|
Year of Election or Appointment: 2005
Vice President of U.S. Government Reserves. Mr. Morrison also serves as Vice President of Fidelity’s Money Market Funds (2005 present) and certain Asset Allocation Funds (2002 present). Previously, he served as Vice President of Fidelity’s Bond Funds (2002 2005) and certain Bal anced Funds (2002 2005). He served as Vice President (2002 2005) and Bond Group Leader (2002 2005) of Fidelity Investments Fixed Income Division. Mr. Morrison is also Vice President of FIMM
(2002 present) and FMR (2002 present). Mr. Morrison joined Fidelity Investments in 1987 as a Corporate Bond Analyst in the Fixed Income Research Division.
Year of Election or Appointment: 2002
Vice President of U.S. Government Reserves. Mr. Murphy also serves as Vice President of Fidelity’s Money Market Funds (2002 present), certain Asset Allocation Funds (2003 present), Fidelity’s Investment Grade Bond Funds (2005 present), and Fidelity’s Balanced Funds (2005 present). He serves as Senior Vice President (2000 present) and Head (2004 present) of the Fidelity Investments Fixed Income Division. Mr. Murphy is also a Senior Vice President of FIMM (2003 present) and a Vice President of FMR (2000 present). Previously, Mr. Murphy served as Money Market Group Leader (2002 2004), Bond Group Leader (2000 2002), and Vice President of Fidelity’s Taxable Bond Funds (2000 2002) and Fidelity’s Municipal Bond Funds (2001 2002). Mr. Murphy joined Fidelity Invest ments in 1989 as a portfolio manager in the Bond Group.
Year of Election or Appointment: 2003
Vice President of U.S. Government Reserves. Mr. Huyck also serves as Vice President of other funds advised by FMR. Prior to assuming his current responsibilities, Mr. Huyck worked as a trader and manager.
Year of Election or Appointment: 1998
Secretary of U.S. Government Reserves. He also serves as Secretary of other Fidelity funds; Vice President, General Counsel, and Secretary of FMR Co., Inc. (2001 present) and FMR; Assistant Secretary of Fidelity Management & Research (U.K.) Inc. (2001 present), Fidelity Manage ment & Research (Far East) Inc. (2001 present), and Fidelity Investments Money Management, Inc. (2001 present). Mr. Roiter is an Adjunct Member, Faculty of Law, at Boston College Law School (2003 present). Previously, Mr. Roiter served as Vice President and Secretary of Fidelity Distributors Corporation (FDC) (1998 2005).
Name, Age; Principal Occupation
|
Year of Election or Appointment: 2003
Assistant Secretary of U.S. Government Reserves. Mr. Fross also serves as Assistant Secretary of other Fidelity funds (2003 present), Vice Presi dent and Secretary of FDC (2005 present), and is an employee of FMR.
Year of Election or Appointment: 2004
President, Treasurer, and Anti Money Laundering (AML) officer of Cash Reserves and U.S. Government Reserves. Ms. Reynolds also serves as President, Treasurer, and AML officer of other Fidelity funds (2004) and is a Vice President (2003) and an employee (2002) of FMR. Before joining Fidelity Investments, Ms. Reynolds worked at Pricewaterhouse Coopers LLP (PwC) (1980 2002), where she was most recently an audit partner with PwC’s investment management practice.
Year of Election or Appointment: 2005
Chief Financial Officer of U.S. Government Reserves. Mr. Murphy also serves as Chief Financial Officer of other Fidelity funds (2005 present). He also serves as Senior Vice President of Fidelity Pricing and Cash Management Services Group (FPCMS).
Kenneth A. Rathgeber (58)
|
Year of Election or Appointment: 2004
Chief Compliance Officer of U.S. Government Reserves. Mr. Rathgeber also serves as Chief Compliance Officer of other Fidelity funds (2004) and Executive Vice President of Risk Oversight for Fidelity Investments (2002). Previously, he served as Executive Vice President and Chief Operating Officer for Fidelity Investments Institutional Services Company, Inc. (1998 2002).
25 Annual Report
Trustees and Officers - continued
| | Name, Age; Principal Occupation
John R. Hebble (47)
|
Year of Election or Appointment: 2003
Deputy Treasurer of U.S. Government Reserves. Mr. Hebble also serves as Deputy Treasurer of other Fidelity funds (2003), and is an employee of FMR. Before joining Fidelity Investments, Mr. Hebble worked at Deutsche Asset Management where he served as Director of Fund Accounting (2002 2003) and Assistant Treasurer of the Scudder Funds (1998 2003).
Year of Election or Appointment: 2005
Deputy Treasurer of U.S. Government Reserves. Mr. Mehrmann also serves as Deputy Treasurer of other Fidelity funds (2005 present) and is an employee of FMR. Previously, Mr. Mehrmann served as Vice Presi dent of Fidelity Investments Institutional Services Group (FIIS)/Fidelity Investments Institutional Operations Corporation, Inc. (FIIOC) Client Services (1998 2004).
| | Kimberley H. Monasterio (41)
|
Year of Election or Appointment: 2004
Deputy Treasurer of U.S. Government Reserves. Ms. Monasterio also serves as Deputy Treasurer of other Fidelity funds (2004) and is an employee of FMR (2004). Before joining Fidelity Investments, Ms. Monasterio served as Treasurer (2000 2004) and Chief Financial Officer (2002 2004) of the Franklin Templeton Funds and Senior Vice President of Franklin Templeton Services, LLC (2000 2004).
Year of Election or Appointment: 2005
Deputy Treasurer of U.S. Government Reserves. Mr. Robins also serves as Deputy Treasurer of other Fidelity funds (2005 present) and is an employee of FMR (2004 present). Before joining Fidelity Investments, Mr. Robins worked at KPMG LLP, where he was a partner in KPMG’s department of professional practice (2002 2004) and a Senior Man ager (1999 2000). In addition, Mr. Robins served as Assistant Chief Accountant, United States Securities and Exchange Commission (2000 2002).
Year of Election or Appointment: 2005
Assistant Treasurer of U.S. Government Reserves. Mr. Byrnes also serves as Assistant Treasurer of other Fidelity funds (2005 present) and is an employee of FMR (2005 present). Previously, Mr. Byrnes served as Vice President of FPCMS (2003 2005). Before joining Fidelity Investments, Mr. Byrnes worked at Deutsche Asset Management where he served as Vice President of the Investment Operations Group (2000 2003).
Name, Age; Principal Occupation
John H. Costello (59)
|
Year of Election or Appointment: 1986
Assistant Treasurer of U.S. Government Reserves. Mr. Costello also serves as Assistant Treasurer of other Fidelity funds and is an employee of FMR.
Year of Election or Appointment: 2004
Assistant Treasurer of U.S. Government Reserves. Mr. Lydecker also serves as Assistant Treasurer of other Fidelity funds (2004) and is an employee of FMR.
Year of Election or Appointment: 2002
Assistant Treasurer of U.S. Government Reserves. Mr. Osterheld also serves as Assistant Treasurer of other Fidelity funds (2002) and is an employee of FMR.
Year of Election or Appointment: 2005
Assistant Treasurer of U.S. Government Reserves. Mr. Ryan also serves as Assistant Treasurer of other Fidelity funds (2005 present) and is an employee of FMR (2005 present). Previously, Mr. Ryan served as Vice President of Fund Reporting in FPCMS (1999 2005).
Year of Election or Appointment: 2005
Assistant Treasurer of U.S. Government Reserves. Mr. Schiavone also serves as Assistant Treasurer of other Fidelity funds (2005 present) and is an employee of FMR (2005 present). Before joining Fidelity Invest ments, Mr. Schiavone worked at Deutsche Asset Management, where he most recently served as Assistant Treasurer (2003 2005) of the Scudder Funds and Vice President and Head of Fund Reporting (1996 2003).
27 Annual Report
Board Approval of Investment Advisory Contracts and Management Fees
U.S. Government Reserves
Each year, typically in June, the Board of Trustees, including the independent Trustees (together, the Board), votes on the renewal of the management contract and sub advisory agreements (together, the Advisory Contracts) for the fund. The Board, assisted by the advice of fund counsel and independent Trustees’ counsel, requests and considers a broad range of information throughout the year.
The Board meets regularly each month except August and takes into account throughout the year matters bearing on Advisory Contracts. The Board, acting directly and through its separate committees, considers at each of its meetings factors that are relevant to the annual renewal of the fund’s Advisory Contracts, including the services and support provided to the fund and its shareholders by Fidelity. At the time of the renewal, the Board had 11 standing committees, each composed of independent Trustees with varying backgrounds, to which the Board has assigned specific subject matter responsibilities in order to enhance effective decision making by the Board. Each committee has adopted a written charter outlining the structure and purposes of the committee. One such com mittee, the Fixed Income Contract Committee, meets periodically during the first six months of each year and as necessary to consider matters specifically related to the annual renewal of Advisory Contracts. The committee requests and receives information on, and makes recommendations to the independent Trustees concerning, the approval and annual review of the Advisory Contracts.
At its June 2005 meeting, the Board of Trustees, including the independent Trustees, unanimously determined to renew the Advisory Contracts for the fund. In reaching its determination, the Board considered all factors it believed relevant, including (1) the nature, extent, and quality of the services to be provided to the fund and its shareholders by Fidelity (including the investment performance of the fund); (2) the competitiveness of the management fee and total expenses of the fund; (3) the total costs of the services to be provided by and the profits to be realized by the investment adviser and its affiliates from the relationship with the fund; (4) the extent to which economies of scale would be realized as the fund grows; and (5) whether fee levels reflect these economies of scale, if any, for the benefit of fund shareholders.
In determining whether to renew the Advisory Contracts for the fund, the Board ulti mately reached a determination, with the assistance of fund counsel and independent Trustees’ counsel, that the renewal of the Advisory Contracts and the compensation to be received by Fidelity under the management contract is consistent with Fidelity’s fidu ciary duty under applicable law. In addition to evaluating the specific factors noted above, the Board, in reaching its determination, is aware that shareholders in the fund have a broad range of investment choices available to them, including a wide choice among mutual funds offered by competitors to Fidelity, and that the fund’s shareholders, with the opportunity to review and weigh the disclosure provided by the fund in its
prospectus and other public disclosures, have chosen to invest in this fund, managed by Fidelity.
Nature, Extent, and Quality of Services Provided by Fidelity. The Board consid ered staffing within the investment adviser, FMR, and the sub advisers (together, the Investment Advisers), including the background of the fund’s portfolio manager and the fund’s investment objective and discipline. The independent Trustees also had discus sions with senior management of Fidelity’s investment operations and investment groups. The Board considered the structure of the portfolio manager compensation program and whether this structure provides appropriate incentives.
Fidelity Resources Dedicated to Investment Management and Support Services. The Board reviewed the size, education, and experience of the Investment Advisers’ invest ment staff, their use of technology, and the Investment Advisers’ approach to recruiting, training, and retaining portfolio managers and other research, advisory, and manage ment personnel. The Board considered Fidelity’s extensive global research capabilities that enable the Investment Advisers to aggregate data from various sources in an effort to produce positive investment results. The Board noted that Fidelity’s analysts have access to a variety of technological tools that enable them to perform both fundamental and quantitative analysis and to specialize in various disciplines. The Board also considered that Fidelity’s portfolio managers and analysts have access to daily portfolio attribution that allows for monitoring of a fund’s portfolio, as well as an electronic communication system that provides immediate real time access to research concerning issuers and credit enhancers.
Shareholder and Administrative Services. The Board considered the nature, extent, quality, and cost of administrative, distribution, and shareholder services performed by the Investment Advisers and their affiliates under the Advisory Contracts and under separate agreements covering transfer agency and pricing and bookkeeping services for the fund. The Board also considered the nature and extent of the Investment Advisers’ supervision of third party service providers, principally custodians and subcustodians. The Board also considered the resources devoted to, and the record of compliance with, the fund’s compliance policies and procedures.
The Board noted that the growth of fund assets across the complex allows Fidelity to reinvest in the development of services designed to enhance the value or convenience of the Fidelity funds as investment vehicles. These services include 24 hour access to account information and market information through phone representatives and over the Internet, and investor education materials and asset allocation tools.
Investment in a Large Fund Family. The Board considered the benefits to shareholders of investing in a Fidelity fund, including the benefits of investing in a fund that is part of a large family of funds offering a variety of investment disciplines and providing for a large variety of mutual fund investor services. For example, fund shareholders are offered the
29 Annual Report
Board Approval of Investment Advisory Contracts and Management Fees continued
privilege of exchanging shares of the fund for shares of other Fidelity funds, as set forth in the fund’s prospectus, without paying a sales charge. The Board noted that, since the last Advisory Contract renewals in June 2004, Fidelity has taken a number of actions that benefited particular funds, including (i) voluntarily deciding in 2004 to stop using “soft” commission dollars to pay for market data and, instead, to pay for that data out of its own resources, (ii) contractually agreeing to impose management fee reductions and expense limitations on its five Spartan stock index funds and its stock index fund available through variable insurance products, (iii) contractually agreeing to eliminate the management fees on the Fidelity Freedom Funds and the Fidelity Advisor Freedom Funds, (iv) contractually agreeing to reduce the management fees on most of its investment grade taxable bond funds, and (v) contractually agreeing to impose expense limitations on its retail and Spartan investment grade taxable bond funds.
Investment Performance. The Board considered whether the fund has operated within its investment objective, as well as its record of compliance with its investment restric tions. It also reviewed the fund’s absolute investment performance, as well as the fund’s relative investment performance measured against a peer group of mutual funds deemed appropriate by the Board over multiple periods. The following charts considered by the Board show, over the one , three , and five year periods ended December 31, 2004, the fund’s returns and a range of returns of a peer group of mutual funds identified by Lipper Inc. as having an investment objective similar to that of the fund. The box within each chart shows the 25th percentile return (bottom of box) and the 75th percentile return (top of box) of the Lipper peer group. The percentage beaten number noted below each chart corresponds to the percentile box and represents the percentage of funds in the Lipper peer group whose performance was equal to or lower than that of the fund.

Annual Report 30
The Board noted that the relative investment performance of the fund has compared favorably to its Lipper peer group over time.
Based on its review, and giving particular weight to the nature and quality of the resources dedicated by the Investment Advisers to maintain and improve relative performance, the Board concluded that the nature, extent, and quality of the services provided by Fidelity will benefit the fund’s shareholders, particularly in light of the Board’s view that the fund’s shareholders benefit from investing in a fund that is part of a large family of funds offering a variety of investment disciplines and services.
Competitiveness of Management Fee and Total Fund Expenses. The Board considered the fund’s management fee and total expenses compared to “mapped groups” of competitive funds and classes. Fidelity creates “mapped groups” by combining similar Lipper investment objective categories that have comparable management fee charac teristics. Combining Lipper investment objective categories aids the Board’s manage ment fee and total expense comparisons by broadening the competitive group used for comparison and by reducing the number of universes to which various Fidelity funds are compared.
The Board considered two proprietary management fee comparisons for the 12 month periods shown in the chart below. The group of Lipper funds used by the Board for management fee comparisons is referred to below as the “Total Mapped Group” and, for the reasons explained above, is broader than the Lipper peer group used by the Board for performance comparisons. The Total Mapped Group comparison focuses on a fund’s standing relative to the total universe of comparable funds available to investors, in terms of gross management fees before expense reimbursements or caps. “TMG %” represents the percentage of funds in the Total Mapped Group that had management fees that were lower than the fund’s. For example, a TMG % of 5% would mean that 95% of the funds in the Total Mapped Group had higher management fees than the fund. The “Asset Size Peer Group” (ASPG) comparison focuses on a fund’s standing relative to non Fidelity funds similar in size to the fund within the Total Mapped Group. The ASPG represents at least 15% of the funds in the Total Mapped Group with comparable asset size and management fee characteristics, subject to a minimum of 50 funds (or all funds in the Total Mapped Group if fewer than 50). Additional information, such as the ASPG quartile (“quadrant”) in which the fund’s management fee ranked, is also included in the chart and considered by the Board. The Board also recognized that the income based component of the fund’s management fee varies depending on the level of the fund’s monthly gross income, providing for higher fees at higher income levels, and for lower fees at lower income levels.
31 Annual Report
Board Approval of Investment Advisory Contracts and Management Fees continued

The Board noted that the fund’s management fee ranked below the median of its Total Mapped Group and below the median of its ASPG for 2004. Based on its review, the Board concluded that the fund’s management fee was fair and reasonable in light of the ser vices that the fund receives and the other factors considered.
In its review of the fund’s total expenses, the Board considered the fund’s management fee as well as other fund expenses, such as transfer agent fees, pricing and bookkeeping fees, and custodial, legal, and audit fees. The Board also noted the effects of any waivers and reimbursements on fees and expenses. As part of its review, the Board also consid ered current and historical total expenses of the fund compared to competitive fund median expenses. The fund is compared to those funds and classes in the Total Mapped Group (used by the Board for management fee comparisons) that have a similar sales load structure.
The Board noted that the fund’s total expenses ranked below its competitive median for 2004.
In its review of total expenses, the Board also considered Fidelity fee structures and other information on clients that FMR and its affiliates service in other competitive markets, such as other mutual funds advised or subadvised by FMR or its affiliates, pension plan clients, and other institutional clients.
Based on its review, the Board concluded that the fund’s total expenses were reasonable in light of the services that the fund and its shareholders receive and the other factors considered.
Costs of the Services and Profitability. The Board considered the revenues earned and the expenses incurred by Fidelity in conducting the business of developing, market ing, distributing, managing, administering and servicing the fund and its shareholders. The Board also considered the level of Fidelity’s profits in respect of all the Fidelity funds.
On an annual basis, FMR presents to the Board Fidelity’s profitability for the fund. Fidelity calculates the profitability for each fund, as well as aggregate profitability for groups of Fidelity funds and all Fidelity funds, using a series of detailed revenue and cost allocation methodologies which originate with the audited books and records of Fidelity. The Audit Committee of the Board reviews any significant changes from the prior year’s methodologies.
PricewaterhouseCoopers LLP (PwC), independent registered accounting firm and auditor to Fidelity and certain Fidelity funds, has been engaged annually by the Board as part of the Board’s assessment of the results of Fidelity’s profitability analysis. PwC’s engagement includes the review and assessment of Fidelity’s methodologies used in determining the revenues and expenses attributable to Fidelity’s mutual fund business, and completion of agreed upon procedures surrounding the mathematical accuracy of fund profitability and its conformity to allocation methodologies. After considering PwC’s reports issued under the engagement and information provided by Fidelity, the Board believes that while other allocation methods may also be reasonable, Fidelity’s profitabil ity methodologies are reasonable in all material respects.
The Board has also reviewed Fidelity’s non fund businesses and any fall out benefits related to the mutual fund business as well as cases where Fidelity’s affiliates may benefit from or be related to the fund’s business. In addition, a special committee of the Board reviewed services provided to Fidelity by its affiliates and determined that the fees that Fidelity paid for such services were reasonable.
The Board considered the costs of the services provided by and the profits realized by Fidelity in connection with the operation of the fund and determined that the amount of profit is a fair entrepreneurial profit for the management of the fund.
Economies of Scale. The Board considered whether there have been economies of scale in respect of the management of the Fidelity funds, whether the Fidelity funds (including the fund) have appropriately benefited from any such economies of scale, and whether there is potential for realization of any further economies of scale. The Board considered the extent to which the fund will benefit from economies of scale through increased services to the fund, through waivers or reimbursements, or through fee or expense reductions, including reductions that occur through operation of the transfer agent agreement. The transfer agent fee varies in part based on the number of accounts in the fund. If the number of accounts decreases or the average account size increases, the overall transfer agent fee rate decreases.
33 Annual Report
Board Approval of Investment Advisory Contracts and Management Fees continued
The Board recognized that the fund’s management contract incorporates a “group fee” structure, which provides for lower fee rates as total fund assets under FMR’s manage ment increase, and for higher fee rates as total fund assets under FMR’s management decrease. The Board considered that the group fee is designed to deliver the benefits of economies of scale to fund shareholders when total fund assets increase, even if assets of any particular fund are unchanged or have declined, because some portion of Fidelity’s costs are attributable to services provided to all Fidelity funds, and all funds benefit if those costs can be allocated among more assets. The Board concluded that, given the group fee structure, fund shareholders will achieve a certain level of economies of scale as assets under FMR’s management increase at the fund complex level, regardless of whether Fidelity achieves any such economies of scale.
The Board further concluded that any potential economies of scale are being shared between fund shareholders and Fidelity in an appropriate manner.
Additional Information Requested by the Board. In order to develop fully the factual basis for consideration of the Advisory Contracts, the Board requested additional information regarding (i) Fidelity’s fund profitability methodology, including additional detail on various cost allocations; (ii) fall out benefits to Fidelity; and (iii) compensation of portfolio managers and research analysts.
Based on its evaluation of all of the conclusions noted above, and after considering all material factors, the Board ultimately concluded that the existing advisory fee structures are fair and reasonable, and that the fund’s existing Advisory Contracts should be renewed.
Managing Your Investments
Fidelity offers several ways to conveniently manage your personal investments via your telephone or PC. You can access your account information, conduct trades and research your investments 24 hours a day.
By Phone
Fidelity Automated Service Telephone provides a single toll free number to access account balances, positions, quotes and trading. It’s easy to navigate the service, and on your first call, the system will help you create a personal identification number (PIN) for security.


By PC
Fidelity’s web site on the Internet provides a wide range of information, including daily financial news, fund performance, interactive planning tools and news about Fidelity products and services.

* When you call the quotes line, please remember that a fund’s yield and return will vary and, except for money market funds, share price will also vary. This means that you may have a gain or loss when you sell your shares. There is no assurance that money market funds will be able to maintain a stable $1 share price; an investment in a money market fund is not insured or guar anteed by the U.S. government. Total returns are historical and include changes in share price, reinvestment of dividends and capital gains, and the effects of any sales charges.
35 Annual Report
To Visit Fidelity
For directions and hours,
please call 1-800-544-9797.
Arizona
7001 West Ray Road
Chandler, AZ
7373 N. Scottsdale Road
Scottsdale, AZ
California
815 East Birch Street
Brea, CA
1411 Chapin Avenue
Burlingame, CA
851 East Hamilton Avenue
Campbell, CA
19200 Von Karman Avenue
Irvine, CA
601 Larkspur Landing Circle
Larkspur, CA
10100 Santa Monica Blvd.
Los Angeles, CA
27101 Puerta Real
Mission Viejo, CA
73 575 El Paseo
Palm Desert, CA
251 University Avenue
Palo Alto, CA
123 South Lake Avenue
Pasadena, CA
16995 Bernardo Ctr. Drive
Rancho Bernardo, CA
1740 Arden Way
Sacramento, CA
7676 Hazard Center Drive
San Diego, CA
8 Montgomery Street
San Francisco, CA
3793 State Street
Santa Barbara, CA
21701 Hawthorne Boulevard
Torrance, CA
2001 North Main Street
Walnut Creek, CA
6300 Canoga Avenue
Woodland Hills, CA
|
Colorado
1625 Broadway
Denver, CO
9185 East Westview Road
Littleton, CO
Connecticut
48 West Putnam Avenue
Greenwich, CT
265 Church Street
New Haven, CT
300 Atlantic Street
Stamford, CT
29 South Main Street
West Hartford, CT
Delaware
222 Delaware Avenue
Wilmington, DE
Florida
4400 N. Federal Highway
Boca Raton, FL
121 Alhambra Plaza
Coral Gables, FL
2948 N. Federal Highway
Ft. Lauderdale, FL
1907 West State Road 434
Longwood, FL
8880 Tamiami Trail, North
Naples, FL
3550 Tamiami Trail, South
Sarasota, FL
1502 N. Westshore Blvd.
Tampa, FL
2465 State Road 7
Wellington, FL
3501 PGA Boulevard
West Palm Beach, FL
Georgia
3445 Peachtree Road, N.E.
Atlanta, GA
1000 Abernathy Road
Atlanta, GA
Illinois
One North LaSalle Street
Chicago, IL
875 North Michigan Ave.
Chicago, IL
1415 West 22nd Street
Oak Brook, IL
|
1700 East Golf Road
Schaumburg, IL
3232 Lake Avenue
Wilmette, IL
Indiana
4729 East 82nd Street
Indianapolis, IN
Kansas
5400 College Boulevard
Overland Park, KS
Maine
Three Canal Plaza
Portland, ME
Maryland
7315 Wisconsin Avenue
Bethesda, MD
One W. Pennsylvania Ave.
Towson, MD
Massachusetts
801 Boylston Street
Boston, MA
155 Congress Street
Boston, MA
300 Granite Street
Braintree, MA
44 Mall Road
Burlington, MA
405 Cochituate Road
Framingham, MA
416 Belmont Street
Worcester, MA
Michigan
500 E. Eisenhower Pkwy.
Ann Arbor, MI
280 Old N. Woodward Ave.
Birmingham, MI
43420 Grand River Avenue
Novi, MI
29155 Northwestern Hwy.
Southfield, MI
Minnesota
7600 France Avenue South
Edina, MN
Missouri
8885 Ladue Road
Ladue, MO
|
Annual Report 36
Nevada
2225 Village Walk Drive
Henderson, NV
New Jersey
150 Essex Street
Millburn, NJ
56 South Street
Morristown, NJ
396 Route 17, North
Paramus, NJ
3518 Route 1 North
Princeton, NJ
530 Highway 35
Shrewsbury, NJ
New York
1055 Franklin Avenue
Garden City, NY
37 West Jericho Turnpike
Huntington Station, NY
1271 Avenue of the Americas
New York, NY
61 Broadway
New York, NY
350 Park Avenue
New York, NY
200 Fifth Avenue
New York, NY
733 Third Avenue
New York, NY
11 Penn Plaza
New York, NY
2070 Broadway
New York, NY
1075 Northern Blvd.
Roslyn, NY
North Carolina
4611 Sharon Road
Charlotte, NC
Ohio
3805 Edwards Road
Cincinnati, OH
1324 Polaris Parkway
Columbus, OH
28699 Chagrin Boulevard
Woodmere Village, OH
Oregon
16850 SW 72nd Avenue
Tigard, OR
|
Pennsylvania
600 West DeKalb Pike
King of Prussia, PA
1735 Market Street
Philadelphia, PA
12001 Perry Highway
Wexford, PA
Rhode Island
47 Providence Place
Providence, RI
Tennessee
6150 Poplar Avenue
Memphis, TN
Texas
10000 Research Boulevard
Austin, TX
4001 Northwest Parkway
Dallas, TX
12532 Memorial Drive
Houston, TX
2701 Drexel Drive
Houston, TX
6500 N. MacArthur Blvd.
Irving, TX
6005 West Park Boulevard
Plano, TX
14100 San Pedro
San Antonio, TX
1576 East Southlake Blvd.
Southlake, TX
19740 IH 45 North
Spring, TX
Utah
215 South State Street
Salt Lake City, UT
Virginia
1861 International Drive
McLean, VA
Washington
411 108th Avenue, N.E.
Bellevue, WA
1518 6th Avenue
Seattle, WA
Washington, DC
1900 K Street, N.W.
Washington, DC
Wisconsin
595 North Barker Road
Brookfield, WI
|
Fidelity Brokerage Services, Inc., 100 Summer St., Boston, MA 02110 Member NYSE/SIPC
37 Annual Report
37
To Write Fidelity
We’ll give your correspondence immediate attention and send you written confirmation upon completion of your request.

(such as changing name, address, bank, etc.)
Fidelity Investments
P.O. Box 770001
Cincinnati, OH 45277-0002
|

| | Buying shares
Fidelity Investments
P.O. Box 770001
Cincinnati, OH 45277-0003
Overnight Express
Fidelity Investments
Attn: Distribution Services
100 Crosby Parkway KC1H
Covington, KY 41015
Selling shares
Fidelity Investments
P.O. Box 770001
Cincinnati, OH 45277-0035
Overnight Express
Fidelity Investments
Attn: Distribution Services
100 Crosby Parkway KC1H
Covington, KY 41015
General Correspondence
Fidelity Investments
P.O. Box 500
Merrimack, NH 03054-0500
|

| | Buying shares
Fidelity Investments
P.O. Box 770001
Cincinnati, OH 45277-0003
Selling shares
Fidelity Investments
P.O. Box 770001
Cincinnati, OH 45277-0035
Overnight Express
Fidelity Investments
Attn: Distribution Services
100 Crosby Parkway KC1H
Covington, KY 41015
General Correspondence
Fidelity Investments
P.O. Box 500
Merrimack, NH 03054-0500
|
Annual Report 38
39 Annual Report
Investment Adviser
Fidelity Management & Research Company
Boston, MA
Investment Sub Adviser
Fidelity Investments
Money Management, Inc.
Fidelity International Investment Advisors
Fidelity International Investment Advisors
(U.K.) Limited
General Distributor
Fidelity Distributors Corporation
Boston, MA
Transfer and Service Agent
Fidelity Service Company, Inc.
Boston, MA
Custodian
JPMorgan Chase Bank
New York, NY
|
| The Fidelity Telephone Connection |
| Mutual Fund 24-Hour Service |
| Exchanges/Redemptions | | |
| and Account Assistance | | 1-800-544-6666 |
| Product Information | | 1-800-544-6666 |
| Retirement Accounts | | 1-800-544-4774 |
| (8 a.m. - 9 p.m.) | | |
| TDD Service | | 1-800-544-0118 |
| for the deaf and hearing impaired |
| (9 a.m. - 9 p.m. Eastern time) |
| Fidelity Automated Service |
| Telephone (FAST®) (automated phone logo) | | 1-800-544-5555 |
| (automated phone logo) Automated line for quickest service |
FUS-UANN-0106
1.786716.102
|

Item 2. Code of Ethics
As of the end of the period, November 30, 2005, Fidelity Phillips Street Trust (the trust) has adopted a code of ethics, as defined in Item 2 of Form N-CSR, that applies to its President and Treasurer and its Chief Financial Officer. A copy of the code of ethics is filed as an exhibit to this Form N-CSR.
Item 3. Audit Committee Financial Expert
The Board of Trustees of the trust has determined that Marie L. Knowles is an audit committee financial expert, as defined in Item 3 of Form N-CSR. Ms. Knowles is independent for purposes of Item 3 of Form N-CSR.
Item 4. Principal Accountant Fees and Services
(a) Audit Fees.
For the fiscal years ended November 30, 2005 and November 30, 2004, the aggregate Audit Fees billed by PricewaterhouseCoopers LLP (PwC) for professional services rendered for the audits of the financial statements, or services that are normally provided in connection with statutory and regulatory filings or engagements for those fiscal years, for the Fidelity Cash Reserves and Fidelity U.S. Government Reserves (the funds) and for all funds in the Fidelity Group of Funds are shown in the table below.
Fund | 2005A | 2004A |
Fidelity Cash Reserves | $244,000 | $194,000 |
Fidelity U.S. Government Reserves | $39,000 | $32,000 |
All funds in the Fidelity Group of Funds audited by PwC | $12,100,000 | $10,600,000 |
A | Aggregate amounts may reflect rounding. |
(b) Audit-Related Fees.
In each of the fiscal years ended November 30, 2005 and November 30, 2004 the aggregate Audit-Related Fees billed by PwC for services rendered for assurance and related services to each fund that are reasonably related to the performance of the audit or review of the fund's financial statements, but not reported as Audit Fees, are shown in the table below.
Fund | 2005A | 2004A |
Fidelity Cash Reserves | $0 | $0 |
Fidelity U.S. Government Reserves | $0 | $0 |
A | Aggregate amounts may reflect rounding. |
In each of the fiscal years ended November 30, 2005 and November 30, 2004, the aggregate Audit-Related Fees that were billed by PwC that were required to be approved by the Audit Committee for services rendered on behalf of Fidelity Management & Research Company (FMR) and entities controlling, controlled by, or under common control with FMR (not including any sub-adviser whose role is primarily portfolio management and is subcontracted with or overseen by another investment adviser) that provide ongoing services to the funds ("Fund Service Providers") for assurance and related services that relate directly to the operations and financial reporting of each fund that are reasonably related to the performance of the audit or review of the fund's financial statements, but not reported as Audit Fees, are shown in the table below.
Billed By | 2005A | 2004A |
PwC | $0 | $0 |
A | Aggregate amounts may reflect rounding. |
Fees included in the audit-related category comprise assurance and related services (e.g., due diligence services) that are traditionally performed by the independent registered public accounting firm. These audit-related services include due diligence related to mergers and acquisitions, accounting consultations and audits in connection with acquisitions, internal control reviews, attest services that are not required by statute or regulation and consultation concerning financial accounting and reporting standards.
(c) Tax Fees.
In each of the fiscal years ended November 30, 2005 and November 30, 2004, the aggregate Tax Fees billed by PwC for professional services rendered for tax compliance, tax advice, and tax planning for each fund is shown in the table below.
Fund | 2005A | 2004A |
Fidelity Cash Reserves | $1,700 | $1,600 |
Fidelity U.S. Government Reserves | $1,700 | $1,600 |
A | Aggregate amounts may reflect rounding. |
In each of the fiscal years ended November 30, 2005 and November 30, 2004, the aggregate Tax Fees billed by PwC that were required to be approved by the Audit Committee for professional services rendered on behalf of the Fund Service Providers for tax compliance, tax advice, and tax planning that relate directly to the operations and financial reporting of each fund is shown in the table below.
Billed By | 2005A | 2004A |
PwC | $0 | $0 |
A | Aggregate amounts may reflect rounding. |
Fees included in the Tax Fees category comprise all services performed by professional staff in the independent registered public accounting firm's tax division except those services related to the audit. Typically, this category would include fees for tax compliance, tax planning, and tax advice. Tax compliance, tax advice, and tax planning services include preparation of original and amended tax returns, claims for refund and tax payment-planning services, assistance with tax audits and appeals, tax advice related to mergers and acquisitions and requests for rulings or technical advice from taxing authorities.
(d) All Other Fees.
In each of the fiscal years ended November 30, 2005 and November 30, 2004, the aggregate Other Fees billed by PwC for all other non-audit services rendered to the funds is shown in the table below.
Fund | 2005A | 2004A |
Fidelity Cash Reserves | $45,100 | $40,800 |
Fidelity U.S. Government Reserves | $2,900 | $2,700 |
A | Aggregate amounts may reflect rounding. |
In each of the fiscal years ended November 30, 2005 and November 30, 2004, the aggregate Other Fees billed by PwC that were required to be approved by the Audit Committee for all other non-audit services rendered on behalf of the Fund Service Providers that relate directly to the operations and financial reporting of each fund is shown in the table below.
Billed By | 2005A | 2004A |
PwC | $170,000 | $540,000 |
A | Aggregate amounts may reflect rounding. |
Fees included in the All Other Fees category include services related to internal control reviews, strategy and other consulting, financial information systems design and implementation, consulting on other information systems, and other tax services unrelated to the fund.
(e) (1) | Audit Committee Pre-Approval Policies and Procedures: |
The trust's Audit Committee must pre-approve all audit and non-audit services provided by the independent registered public accounting firm relating to the operations or financial reporting of the funds. Prior to the commencement of any audit or non-audit services to a fund, the Audit Committee reviews the services to determine whether they are appropriate and permissible under applicable law.
The trust's Audit Committee has adopted policies and procedures to, among other purposes, provide a framework for the Committee's consideration of non-audit services by the audit firms that audit the Fidelity funds. The policies and procedures require that any non-audit service provided by a fund audit firm to a Fidelity Fund and any non-audit service provided by a fund auditor to a Fund Service Provider that relates directly to the operations and financial reporting of a Fidelity fund (Covered Service) are subject to approval by the Audit Committee before such service is provided. Non-audit services provided by a fund audit firm for a Fund Service Provider that do not relate directly to the operations and financial reporting of a Fidelity fund (Non-Covered Service) but that are expected to exceed $50,000 are also subject to pre-approval by the Audit Committee.
All Covered Services, as well as Non-Covered Services that are expected to exceed $50,000, must be approved in advance of provision of the service either: (i) by formal resolution of the Audit Committee, or (ii) by oral or written approval of the service by the Chair of the Audit Committee (or if the Chair is unavailable, such other member of the Audit Committee as may be designated by the Chair to act in the Chair's absence). The approval contemplated by (ii) above is permitted where the Treasurer determines that action on such an engagement is necessary before the next meeting of the Audit Committee. Neither pre-approval nor advance notice of Non-Covered Service engagements for which fees are not expected to exceed $50,000 is required; such engagements are to be reported to the Audit Committee monthly.
(e) (2) | Services approved pursuant to paragraph (c)(7)(i)(C) of Rule 2-01 of Regulation S-X: |
Audit-Related Fees:
There were no amounts that were approved by the Audit Committee pursuant to the de minimis exception for the fiscal years ended November 30, 2005 and November 30, 2004 on behalf of each fund.
There were no amounts that were required to be approved by the Audit Committee pursuant to the de minimis exception for the fiscal years ended November 30, 2005 and November 30, 2004 on behalf of the Fund Service Providers that relate directly to the operations and financial reporting of each fund.
Tax Fees:
There were no amounts that were approved by the Audit Committee pursuant to the de minimis exception for the fiscal years ended November 30, 2005 and November 30, 2004 on behalf of each fund.
There were no amounts that were required to be approved by the Audit Committee pursuant to the de minimis exception for the fiscal years ended November 30, 2005 and November 30, 2004 on behalf of the Fund Service Providers that relate directly to the operations and financial reporting of each fund.
All Other Fees:
There were no amounts that were approved by the Audit Committee pursuant to the de minimis exception for the fiscal years ended November 30, 2005 and November 30, 2004 on behalf of each fund.
There were no amounts that were required to be approved by the Audit Committee pursuant to the de minimis exception for the fiscal years ended November 30, 2005 and November 30, 2004 on behalf of the Fund Service Providers that relate directly to the operations and financial reporting of each fund.
(f) Not applicable.
(g) For the fiscal years ended November 30, 2005 and November 30, 2004, the aggregate fees billed by PwC of $3,700,000A and $2,750,000A for non-audit services rendered on behalf of the funds, FMR (not including any sub-adviser whose role is primarily portfolio management and is subcontracted with or overseen by another investment adviser) and Fund Service Providers relating to Covered Services and Non-Covered Services are shown in the table below.
| 2005A | 2004A |
Covered Services | $200,000 | $600,000 |
Non-Covered Services | $3,500,000 | $2,150,000 |
A | Aggregate amounts may reflect rounding. |
(h) The trust's Audit Committee has considered Non-Covered Services that were not pre-approved that were provided by PwC to Fund Service Providers to be compatible with maintaining the independence of PwC in its audit of the funds, taking into account representations from PwC, in accordance with Independence Standards Board Standard No.1, regarding its independence from the funds and their related entities.
Item 5. Audit Committee of Listed Registrants
Not applicable.
Item 6. Schedule of Investments
Not applicable.
Item 7. Disclosure of Proxy Voting Policies and Procedures for Closed-End Management Investment Companies
Not applicable.
Item 8. Portfolio Managers of Closed-End Management Investment Companies
Not applicable.
Item 9. Purchase of Equity Securities by Closed-End Management Investment Company and Affiliated Purchasers
Not applicable.
Item 10. Submission of Matters to a Vote of Security Holders
There were no material changes to the procedures by which shareholders may recommend nominees to the trust's Board of Trustees.
Item 11. Controls and Procedures
(a)(i) The President and Treasurer and the Chief Financial Officer have concluded that the trust's disclosure controls and procedures (as defined in Rule 30a-3(c) under the Investment Company Act) provide reasonable assurances that material information relating to the trust is made known to them by the appropriate persons, based on their evaluation of these controls and procedures as of a date within 90 days of the filing date of this report.
(a)(ii) There was no change in the trust's internal control over financial reporting (as defined in Rule 30a-3(d) under the Investment Company Act) that occurred during the second fiscal quarter of the period covered by this report that has materially affected, or is reasonably likely to materially affect, the trust's internal control over financial reporting.
Item 12. Exhibits
(a) | (1) | Code of Ethics pursuant to Item 2 of Form N-CSR is filed and attached hereto as EX-99.CODE ETH. |
(a) | (2) | Certification pursuant to Rule 30a-2(a) under the Investment Company Act of 1940 (17 CFR 270.30a-2(a)) is filed and attached hereto as Exhibit 99.CERT. |
(a) | (3) | Not applicable. |
(b) | | Certification pursuant to Rule 30a-2(b) under the Investment Company Act of 1940 (17 CFR 270.30a-2(b)) is furnished and attached hereto as Exhibit 99.906CERT. |
SIGNATURES
Pursuant to the requirements of the Securities Exchange Act of 1934 and the Investment Company Act of 1940, the registrant has duly caused this report to be signed on its behalf by the undersigned, thereunto duly authorized.
Fidelity Phillips Street Trust
By: | /s/Christine Reynolds |
| Christine Reynolds |
| President and Treasurer |
| |
Date: | January 20, 2006 |
Pursuant to the requirements of the Securities Exchange Act of 1934 and the Investment Company Act of 1940, this report has been signed below by the following persons on behalf of the registrant and in the capacities and on the dates indicated.
By: | /s/Christine Reynolds |
| Christine Reynolds |
| President and Treasurer |
| |
Date: | January 20, 2006 |
By: | /s/Paul M. Murphy |
| Paul M. Murphy |
| Chief Financial Officer |
| |
Date: | January 20, 2006 |