Exhibit 99.1

Dear Investor,
Given your interest in OMNIQ, we thought the attached market study compiled by Yoram Hofman, our Chief Technology Officer at HTS, would be of interest .
The study analyzes publicly available information and provides the Company’s view of the near-term market potential for the License Plate Reading market, specifically the security, traffic management, enforcement, secure access and parking verticals. As summarized below, Mr. Hofman projects a market opportunity of approximately $1.5 billion for the two year period of 2021 and 2022:
| Vertical | | 2020 and 2021 Market Opportunity | |
| Security | | $ | 411 | M |
| Traffic Management | | $ | 282 | M |
| Enforcement | | $ | 387 | M |
| Secure Access | | $ | 90 | M |
| Parking | | $ | 377 | M |
| TOTAL | | $ | 1,547 | M |
The study also addresses specific needs within each market that OMNIQ currently supports with its broadening base of patented, industry-leading, AI solutions. Importantly, the market size estimate does not include the potential AI-Machine Vision applications for supply chain and manufacturing such as yard management, tire recognition and other machine object recognition applications.
OMNIQ is excited about the market opportunity and management is focused on capturing a growing share. The Company has a growing list of installations around the globe including orders from several major airports, such as: JFK, Newark, Kansas City, Greater Rochester and Dallas Fort Worth. We thank you for your interest and look forward to continuing to share with you OMNIQ’s progress.
About Yoram Hofman, CTO
Yoram Hofman has over 40 years of experience in the development of commercial and military systems, specializing in image processing technologies. He founded HTS and is a pioneer in the implementation of Neural Networks, a branch of Artificial Intelligence that imitates the human brain for Machine Learning and object recognition. HTS has deployed License Plate Reading (LPR) systems in over 15,000 lanes worldwide, revolutionizing automation of many market verticals. Previously, Mr. Hofman was involved in air-to-ground infrared tracking systems at Hughes Aircraft and Rafael, Tactical simulators in Elbit, medical analysis systems at Elscint, and testing in National Semiconductors.
Mr. Hofman holds B.A. and M.Sc. degrees in Computer Science from the Technion in Israel.
| | Sincerely |
| | |
| | /S/ Shai Lustgarten |
| | CEO and President |


LPR Market Analysis
March 2020
Yoram Hofman, CTO, OMNIQ/HTS
Table of Contents
| 1. | Introduction | 3 |
| | 1.1. | Overview | 3 |
| | 1.2. | Objectives | 3 |
| 2. | References | 4 |
| | 2.1. | Related Documents | 4 |
| | 2.2. | External documents | 4 |
| | 2.3. | Definitions of frequently used abbreviations: | 4 |
| 3. | The Markets | 5 |
| | 3.1. | Markets currently using LPR | 5 |
| 4. | Market size | 6 |
| | 4.1.1. | External studies | 6 |
| | 4.1.2. | Sources | 6 |
| | 4.1.3. | Analysis | 7 |
| | 4.1.3.1. | Assumptions: | 7 |
| | 4.2. | Analysis by Vertical | 8 |
| | 4.2.1. | Security systems | 8 |
| | 4.2.2. | Traffic management systems | 10 |
| | 4.2.3. | Enforcement systems | 12 |
| | 4.2.4. | Secure access | 13 |
| | 4.2.5. | Parking | 14 |
| | 4.2.6. | Market analysis summary | 15 |
| | 4.2.7. | Discussion | 15 |
| | 4.2.8. | References | 16 |
| Company Confidential - Do not duplicate or distribute without written permission from OMNIQ/HTS | Page: 2 |
1. Introduction
1.1. Overview
This document provides an analysis of the U.S. market for License Plate Recognition (LPR), also known as Automated Number Plate Recognition (ANPR).
1.2. Objectives
The objectives of the market analysis include:
| | ● | Summarize the market potential for LPR-based systems for the following verticals: parking, public safety, law enforcement, and related others. |
| | ● | Review and survey existing and potential markets |
| | ● | Focus on U.S. market |
| | ● | Focus on HTS verticals |
| Company Confidential - Do not duplicate or distribute without written permission from OMNIQ/HTS | Page: 3 |
2. References
2.1. Related Documents
2.2. External documents
All references are listed in chapter 5.
2.3. Definitions of frequently used abbreviations:
| | ● | ANPR - Automated Number Plate Recognition |
| | ● | CAGR – Compound annual growth rate |
| | ● | HOV – High Occupancy Vehicle |
| | ● | HTS – Hi-Tech Solutions |
| | ● | LPR – License Plate Recognition |
| | ● | NA – Not applicable |
| | ● | OCR – Optical Character Recognition |
| | ● | OEM – original equipment manufacturer |
| | ● | SW – Software |
| | ● | TBD – To be determined |
| Company Confidential - Do not duplicate or distribute without written permission from OMNIQ/HTS | Page: 4 |
3. The Markets
3.1. Markets currently using LPR
The following table summarizes LPR based markets in various verticals, and provides HTS current ability to support these markets via our portfolio of offerings.
| Market | | Vertical | | HTS Technology | | Current HTS offering |
Security Systems | | Airports | | Lane monitoring
Long and short term parking
Mobile systems | | 100% |
| | | Border Crossings | | Lane monitoring | | 100% |
| | | Surveillance | | Lane monitoring | | 100% |
| | | Schools safety | | Lane monitoring | | 100% |
| | | Misc. applications | | Lane monitoring | | 50% |
| Traffic Management | | Tolling | | Lane monitoring
Access control | | 100% |
| | | Congestion analysis | | Lane monitoring | | 0% |
| | | Trucking | | Weigh stations | | 100% |
| | | Yard and Warehouse management | | Monitoring | | 0% |
| | | Misc. applications | | Monitoring | | 50% |
| Enforcement | | Speed Enforcement | | | | 0% |
| | | Red light enforcement | | | | 0% |
| | | Police vehicles(mobile) | | | | 0% |
| | | Toll/HOV violations | | Occupant counting | | 10% (preliminary design) |
| | | Bus Lane violations | | | | 0% |
| | | Congestion charge | | | | 0% |
| Secure Access | | Gated Communities (USA) | | Access control | | 50% |
| | | Public/commercial | | Access control | | 50% |
| Parking | | High end | | Parking systems | | 100% |
| | | Low end | | Short term parking | | 100% |
| | | Mobile enforcement | | Mobile systems | | 0% |
| | | Handheld enforcement | | Cell phones, Readers | | 0% |
| | | Valet Parking | | Lane monitoring & damage inspection | | 100% |
| Company Confidential - Do not duplicate or distribute without written permission from OMNIQ/HTS | Page: 5 |
4. Market size
4.1.1. External studies
According to MarketsandMarkets analysis:
“The automatic number plate recognition (ANPR) system market in 2016 was valued at USD 1.78 Billion and is expected to reach USD 3.57 Billion by 2023, at a Compound annual growth rate (CAGR) of 9.74% between 2017 and 2023. The base year considered for the study is 2016 and the forecast period is between 2017 and 2023”.
USA is ~50% of the market, so the next two years (2021-2022) can be forecasted to a combined two-year value of $2.9 Billion USD.
Another analysis by QYResearch (published 2019) provides a similar forecast:
“The global Automatic License Plate Recognition (ALPR/ANPR) Cameras market was valued at US$400 million in 2018 and is expected to reach US$809.3 million by the end of 2025, growing at a CAGR of 10.61% during 2019-2025”.
The U.S. market is, according to this analysis, estimated at US$1.5 Billion and US$1.66 Billion for the years 2021 and 2022 respectively, or US$3.16 Billion combined.
Both studies reach a similar estimate of the LPR based markets in the U.S. at ~US$1.5 Billion per year, or ~US$3 Billion combined for the years 2021 and 2022.
4.1.2. Sources
The following analysis did not use data from the above mentioned market reports. The majority of the assumptions and prices are based on the author’s judgement, which are based on more than 25 years in the LPR business.
Relevant references the author used to estimate the market size of the verticals, are included in the tables and detailed in the references listed in chapter 5.
| Company Confidential - Do not duplicate or distribute without written permission from OMNIQ/HTS | Page: 6 |
4.1.3. Analysis
The analysis in this chapter estimates the total business, per each vertical for two years (2021-2022).
4.1.3.1. Assumptions:
The assumptions are specified in the following tables for each line item.
Average industry sale prices are assumed as follows:
| | ● | Open road high speed system: $6K (includes overhead of lane controller: $1K); installation per lane: $5k |
| | ● | Slow lane/Gated lane system: $4K (includes overhead of lane controller: $0.5K); installation per lane: $3k |
| | ● | Mobile systems: $25K (Airports) |
| | ● | SeePatrol: $6K (Airports) |
| | ● | Back office: $50K-$250K - depending on the scope |
| | ● | Installation per site: $50K-$250K - depending on the complexity |
| Company Confidential - Do not duplicate or distribute without written permission from OMNIQ/HTS | Page: 7 |
4.2. Analysis by Vertical
4.2.1. Security systems
| Vertical | | Assumption | | # Sites in 2 years | | LPR systems per sites | | Sale per system
[K$] | | Total sales
[M$] | | Total [M$] |
| Airports | | a. 40 Busiest US airports (ref 1) b. Smaller USA airports c. Total airports ~5000 (ref 2) | | 40 100 0 | | 2 mobile 2 patrol 25 lanes (2 cameras, 0.25LC) Installation per lane Installation per site Back office per site 0 mobile 0 patrol 15 lanes (2 cameras, 0.5LC) Installation per lane (15 lanes) Installation per site Back office per site | | 25 6 4 3 200 200 25 6 3 3 50 100 | | 2.0 0.5 4 3 8.0 8.0 0 0 4.5 4.5 5.0 10 | | } } }=25.5 } } } } } }=24.0 } } } Total:$49.5M |
| | | | | | | | | | | | | |
| Border Crossings | | a. USA Mexico (ref 3) b. USA Canada (ref 4) | | 330 Lanes (48 sites) 100 Lanes (13 sites) | | 1 lane (6 cameras, 1LC) Installation per lane Installation per site Back office 1 lane (6 cameras, 1LC) Installation per lane Installation per site Back office | | 30 5 150 150 30 5 150 150 | | 9.9 1.7 7.2 7.2 3.0 0.5 2.0 2.0 | | } } }=26.0 } } }= 7.5 } } Total: $33.5M |
| Company Confidential - Do not duplicate or distribute without written permission from OMNIQ/HTS | Page: 8 |
| Vertical | | Assumption | | # units in 2 years | | LPR systems costs | | Sale per system [K$] | | Total sales [M$] | | Total [M$] |
| Surveillance | | a. Highway and streets b. Shopping centers, public areas, government areas | | 10,000 lanes (100 sites) 6,000 lanes (100 sites) | | Open road lanes Installation per lane Installation per site Back office 1 lane Installation per lane Installation per site Back office | | 6 5 150 250 4 3 150 250 | | 60 50 15 25 24 18 15 25 | | } }=150 } } } }=82 } } Total: $232M |
| | | | | | | | | | | | | |
School safety | | a. Schools (ref 7 – 14,000 total US) b. Universities (ref 8 – 5,300 total US) | | 1,000 lanes 300 schools 1,000 lanes 200 universities | | Gate + installation Server, interface Gate + installation Server, interface | | 8 60 8 80 | | 8 18 8 16 | | } }=26 } }=24 Total: $50M |
| | | | | | | | | | | | | |
Misc. security applications | | a. Under carriage | | 300 lanes | | 1 lane Installation per lane | | 4 3 | | 1.2 0.9 | | } }=$2.1M |
| | | | | | | | | | | | | |
| Total | | Security total | | | | | | | | | | $367M |
| Company Confidential - Do not duplicate or distribute without written permission from OMNIQ/HTS | Page: 9 |
4.2.2. Traffic management systems
| Vertical | | Assumption | | # units in 2 years | | LPR systems costs | | Sale per system [K$] | | Total sales [M$] | | Total [M$] |
| Tolling | | 1. Toll stations with LPR (ref 9 – 6000 miles in USA) 2. Toll violations open road | | 3,000 lanes (80 roads) 2000 lanes (100 roads) | | 1 lane @ toll booth Installation per lane Installation per road Back office Open road lanes Installation per lane Installation per roads Back office | | 6 3 150 150 6 5 150 150 | | 18 12 12 12 12 10 15 15 | | } }=56 } } } }=52 } } Total: $108M |
| | | | | | | | | | | | | |
Congestion Analysis Programs | | 1. Mobile systems for monitoring highways(20 companies, 20 readers per company) | | 400 readers 20 servers | | 1 system (camera, LC) 1 server application | | 10 50 | | 4 1 | | }=4.0 }=1.0 Total: $5.0M$ |
| | | | | | | | | | | | | |
| Trucking | | 1. DOT weigh station systems (20 states, 15 sites) Ref: 10 (680 USA weigh stations in 2017) | | 200 lanes 200 stations | | Reader system (LPR, DOT, OV) Installation Weigh station server | | 40 20 150 | | 8 4 30 | | }=12 }=30 Total: $42M |
| | | | | | | | | | | | | |
| Yard and Warehouse management | | 1. Yards and enclosed areas 2. Warehouses (ref 11: 430,000 warehouses in USA; 20,000 are large warehouses) | | 1,000 lanes 100 sites 1,000 lanes 200 sites | | Per lane: 4 cameras, 1LC Installation per lane Installation per site Back office Per lane: 4 cameras, 1LC Installation per lane Installation per site Back office | | 8 2 150 150 8 2 50 50 | | 8 2 15 15 8 2 10 10 | | } }=40 } } } }=30 } } Total: $70M |
| Company Confidential - Do not duplicate or distribute without written permission from OMNIQ/HTS | Page: 10 |
| Vertical | | Assumption | | # units in 2 years | | LPR systems costs | | Sale per system [K$] | | Total sales [M$] | | Total [M$] |
| Miscellaneous applications | | 1. Gas stations 2. Ports 3. Misc. projects | | 1,000 lanes 200 sites 20 lanes 500 lanes 100 sites | | Per lane: 2 cameras Installation per lane Back office Per lane (8 cameras, 4 BC read) Back office Per lane: 2 cameras Installation per lane Back office | | 4 3 50 50 50 4 3 50 | | 4 3 10 1 1 2 1.5 0.5 | | } }=22 } } }= 2 } }= 3 } Total: $27M |
| | | | | | | | | | | | | |
| Total | | Traffic management total | | | | | | | | | | $252M |
| Company Confidential - Do not duplicate or distribute without written permission from OMNIQ/HTS | Page: 11 |
4.2.3. Enforcement systems
| Vertical | | Assumption | | # units in 2 years | | LPR systems costs | | Sale per system [K$] | | Total sales [M$] | | Total [M$] |
| Speed Enforcement | | (Ref 12): 138 communities in 2015 Each community: 10 lanes | | 1,500 lanes 150 sites | | Open road lanes Installation per lane Back office per site | | 6 5 90 | | 9 7.5 13.5 | | } }= 30 } |
| | | | | | | | | | | | | |
| Red light enforcement | | (Ref 12): 550 communities in 2015, Each community: 10 lanes 200 new communities | | 3,000 lanes 200 new sites | | Open road lanes Installation per lane Back office per site | | 8 5 80 | | 24 15 16 | | } }= 54 } |
| | | | | | | | | | | | | |
| Police vehicle (mobile) | | 20,000 agencies, 20% using LPR(ref 12 and 13) | | 3000 new units 200 new centers | | Mobile system + Installation Centers | | 30 100 | | 90 20 | | } }= 110 |
| | | | | | | | | | | | | |
| HOV violations | | HOV -50 facilities, 10 systems per facility (Ref: internal HOV study) | | 500 | | 1 HOV lane side system Installation per lane Center installation per facility | | 100 10 200 | | 50 5 10 | | } }= 65 } |
| | | | | | | | | | | | | |
| Bus Lane violations | | 20 LPR units per bus lane | | 2,000 lanes 100 bus lanes | | Open road lanes Installation per lane Back office per site | | 6 5 150 | | 12 10 15 | | } }= 37 } |
| | | | | | | | | | | | | |
| Congestion charge | | 5 large cities – 300 units (e.g., London: 1,500 units) 30 small cities (80 units) | | 3,900 units 35 centers | | Open road lanes Installation per lane Back office per site | | 6 5 200 | | 23.4 19.5 7.0 | | } }= 50 } |
| | | | | | | | | | | | | |
Total | | Enforcement total | | | | | | | | | | $346M |
| Company Confidential - Do not duplicate or distribute without written permission from OMNIQ/HTS | Page: 12 |
4.2.4. Secure access
| Vertical | | Assumption | | # units in 2 years | | LPR systems costs | | Sale per system [K$] | | Total sales [M$] | | Total [M$] |
| Gated Community (US) | | Ref 15: estimate of 30,000 communities 5% will add LPR in 2 years 2 lanes per community Total 3,000 lanes | | 3,000 | | Gates lanes + installation | | 10 | | 30 | | }=30 |
| | | | | | | | | | | | | |
Public/ commercial | | Gross figure: 100,000 lanes Assume 5% in 2 years | | 5,000 | | Gates lanes + installation | | 10 | | 50 | | }=50 |
| | | | | | | | | | | | | |
| Total | | Secure Access Total | | | | | | | | | | $80M |
| Company Confidential - Do not duplicate or distribute without written permission from OMNIQ/HTS | Page: 13 |
4.2.5. Parking
| Vertical | | Assumption | | # units in 2 years | | LPR systems costs | | Sale per system [K$] | | Total sales [M$] | | Total [M$] |
| High End | | 40,000 car parks in US(ref. 16) 10% are high end = 4,000 10% will add lanes in 2 years Avg.= 10 lanes per car park. Total lanes: 4,000 | | 4,000 lanes 400 car parks | | LPR system Installation Car park server, readers | | 5 4 150 | | 20 16 60 | | } }=36 }=60 Total: 96 |
| | | | | | | | | | | | | |
| Low End | | 40,000 car parks in US(ref. 16) 90% are low end 5% will add lanes in 2 years Avg.= 5 lanes per car park. Total lanes: 9,000 | | 9,000 lanes 1,800 car parks | | LPR system Car park server, readers | | 5 4 50 | | 45 36 90 | | } }= 81 }=90 Total: 171 |
| | | | | | | | | | | | | |
| Parking Enforcement Mobile | | Gross estimate: 1000 mobile systems for parking enforcement | | 1000 100 centers | | Mobile car LPR system, installation Center server | | 20 100 | | 20 10 | | }=20 }=10 Total: 30 |
| | | | | | | | | | | | | |
Parking Enforcement Handheld | | Gross estimate: 2000 handheld systems for parking enforcement | | 2000 200 centers | | Handheld device with LPR | | 6 100 | | 12 20 | | }=12 }=20 Total: 32 |
| | | | | | | | | | | | | |
Valet Parking | | Estimate: 200 lanes in 100 centers (in Casinos, shopping centers, etc) | | 200 lanes 100 sites | | Per lane: 6 cameras, 1LC Installation per lane Back office | | 10 5 50 | | 2 1 5 | | } }= 8 } |
| | | | | | | | | | | | | |
| Total | | Parking Total | | | | | | | | | | Total: $337M |
| Company Confidential - Do not duplicate or distribute without written permission from OMNIQ/HTS | Page: 14 |
4.2.6. Market analysis summary
The following table summarizes information provided in the previous pages.
Servicing for the equipment, estimated as an average of 6% per year, is added to the sales on the right column. It includes the income of maintenance costs and warranty, assuming that the previous installed equipment is beyond the warranty timeframe.
| # | | Vertical | | Est. 2-year revenue excluding services | | | Est. 2-year revenue including service fees @ 6% per year | |
| 1 | | Security | | $ | 367 | M | | $ | 411 | M |
| 2 | | Traffic management | | $ | 252 | M | | $ | 282 | M |
| 3 | | Enforcement | | $ | 346 | M | | $ | 387 | M |
| 4 | | Secure access | | $ | 80 | M | | $ | 90 | M |
| 5 | | Parking | | $ | 337 | M | | $ | 377 | M |
| Total | | $ | 1,382 | M | | $ | 1,547 | M |
The following graph summarizes the estimated U.S. LPR-based business (2021-2022):
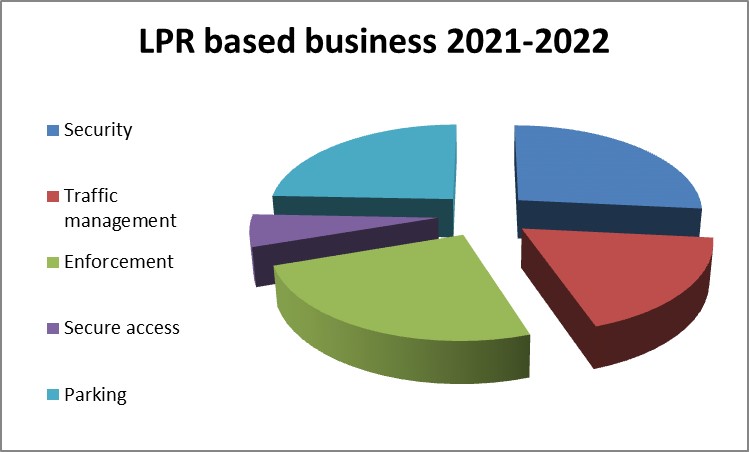
4.2.7. Discussion
As demonstrated in the graph above, we estimate the U.S. LPR market for the years 2021 and 2022 at US$1.547 Billion dollars. The two analyst studies we present earlier in this document forecast market levels almost double our estimate. We believe this signifies the tremendous potential for the LPR market, and OMNIQ/HTS is focused on capturing a large share of this market.
| Company Confidential - Do not duplicate or distribute without written permission from OMNIQ/HTS | Page: 15 |
4.2.8. References
| 1. | Top 100 USA airportshttp://www.fi-aeroweb.com/Top-100-US-Airports.html |
| 2. | Total USA airportshttps://www.statista.com/statistics/183496/number-of-airports-in-the-united-states-since-1990/ |
| 3. | USA Mexico border crossingshttps://en.wikipedia.org/wiki/Mexico%E2%80%93United_States_border |
| 4. | USA Canada border crossingshttps://www.canadaduientrylaw.com/border-crossings.php |
| 5. | Video Surveillance Market by System (Analog, & IP), Offering (Hardware, Software, & Service), Vertical (Commercial, Infrastructure, Military & Defense, Residential, Public Facility, & Industrial), and Geography - Global Forecast to 2023 |
| 6. | Toll roads in USAhttps://en.wikipedia.org/wiki/Toll_roads_in_the_United_States |
| 7. | Number of USA schools:https://www.edweek.org/ew/issues/education-statistics/index.html |
| 8. | Number of universities USA:https://www.educationunlimited.com/blog/how-many-universities-colleges-are-in-the-us/ |
| 9. | Toll roads stats:https://www.fhwa.dot.gov/policyinformation/tollpage/2015/factsheet.cfm |
| 10. | Weigh stations:https://ops.fhwa.dot.gov/publications/fhwahop09051/sec02.htm |
| 11. | Warehouses:https://www.reonomy.com/properties/warehouse/us/1 |
| 12. | System Analysis of Automated Speed Enforcement Implementation (NHTSA research, 2016) |
| 13. | USA law enforcement agencies – 17, 985 agencieshttps://en.wikipedia.org/wiki/Law_enforcement_in_the_United_States |
| 14. | Automated License Plate Recognition (ALPR) Use by Law Enforcement: Policy and Operational Guide, Summary (2012) – average 19% using LPR in 2012https://www.ncjrs.gov/pdffiles1/nij/grants/239605.pdf |
| 15. | Gated communities in the US: (2017) in the 90s there were 20,000 gated communities in the USA https://papers.ssrn.com/sol3/papers.cfm?abstract_id=3074678 |
| 16. | Car parks:https://pando.com/2014/01/30/the-future-of-the-100-billion-parking-industry/ |
| Company Confidential - Do not duplicate or distribute without written permission from OMNIQ/HTS | Page: 16 |