The performance data quoted represent past performance; past performance does not guarantee future results. Investment return and principal value will fluctuate so your shares, when redeemed, may be worth more or less than their original cost. Please obtain the performance data for the most recent month end by calling 800 523-1918 or visiting our Web site at www.delawareinvestments.com/performance. Current performance may be lower or higher than the performance data quoted.
A rise or fall in interest rates can have a significant impact on bond prices and the net asset value (NAV) of the Fund. Funds that invest in bonds can lose their value as interest rates rise, and an investor can lose principal.
Returns reflect the reinvestment of all distributions and any applicable sales charges as noted in the following paragraphs.
Performance for Class B and C shares, excluding sales charges, assumes either that contingent deferred sales charges did not apply or that the investment was not redeemed.
An expense limitation was in effect for all classes during the periods shown in the Fund performance chart above and in the Performance of a $10,000 Investment chart on page 7. Performance would have been lower had the expense limitation not been in effect. The current expenses for each class are listed on the chart on the next page.
The Fund offers Class A, B, C, R, and Institutional Class shares. Class A shares are sold with a maximum front-end sales charge of up to 4.50%, and have an annual distribution and service fee of up to 0.30% of average daily net assets, but such a fee is currently subject to a contractual cap of 0.25% of average daily net assets through Nov. 30, 2008.
Class B shares may only be purchased through dividend reinvestment and certain permitted exchanges, as described in the prospectus. Please see the prospectus for additional information on Class B purchase and sales charges. Class B shares have a contingent deferred sales charge that declines from
Performance summaries
Delaware Corporate Bond Fund
4.00% to zero depending on the period of time the shares are held. Class B shares will automatically convert to Class A shares on a quarterly basis approximately eight years after purchase. They are also subject to an annual distribution and service fee of up to 1.00% of average daily net assets. Please see the prospectus for additional information on Class B purchase and sales charges.
Lifetime performance figures for Class B shares reflect conversion to Class A shares after eight years.
Class C shares are sold with a contingent deferred sales charge of 1.00% if redeemed during the first 12 months. They are also subject to an annual distribution and service fee of 1.00% of average daily net assets.
Please see the fee table in the prospectus and your financial professional for a more complete explanation of sales charges.
The average annual total returns for the 1-year, 3-year, 5-year, and lifetime (since June 2, 2003) periods ended July 31, 2008, for Delaware Corporate Bond Fund Class R shares were -0.21%, +2.06%, +4.34%, and +3.28%, respectively.
Class R shares were first made available June 2, 2003, and are available only for certain retirement plan products. They are sold without a sales charge and have an annual distribution and service fee of up to 0.60% of average daily net assets, but such fee is currently subject to a contractual cap of 0.50% of average daily net assets through Nov. 30, 2008.
The average annual total returns for the 1-year, 3-year, 5-year, and lifetime periods ended July 31, 2008, for Delaware Corporate Bond Fund Institutional Class shares were +0.10%, +2.58%, +4.86%, and +6.03%, respectively.
Institutional Class shares were first made available Sept. 15, 1998, and are available without sales or asset-based distribution charges only to certain eligible institutional accounts.
The performance table on the previous page and the graph on the next page do not reflect the deduction of taxes the shareholder would pay on Fund distributions or redemptions of Fund shares.
The Fund may be affected by economic conditions that may hinder a company’s ability to make interest and principal payments on its debt.
High yielding noninvestment grade bonds (junk bonds) involve higher risk than investment grade bonds. Adverse conditions may affect the issuer’s ability to pay interest and principal on these securities.
This Fund will be affected primarily by declines in bond prices, which can be caused by an adverse change in interest rates, adverse economic conditions, or poor performance from specific industries or bond issuers.
The Fund’s expense ratios, as described in the most recent prospectus, are disclosed in the table below. Management has contracted to reimburse expenses and/or waive its management fees from Dec. 1, 2007, through Nov. 30, 2008. Please see the most recent prospectus for additional information on the fee waivers.
| Fund expense ratios | | | | | | | | | | | | | | | |
| | | Class A | | | Class B | | | Class C | | | Class R | | | Institutional Class |
| Total annual operating expenses | | | | | | | | | | | | | |
| (without fee waivers) | | 1.06 | % | | 1.76 | % | | 1.76 | % | | 1.36 | % | | 0.76 | % |
| Net expense ratio | | | | | | | | | | | | | | | |
| (including fee waivers, if any)* | | 0.90 | % | | 1.65 | % | | 1.65 | % | | 1.15 | % | | 0.65 | % |
| * | | The applicable fee waivers are discussed in the text on pages 5 and 6. |
6
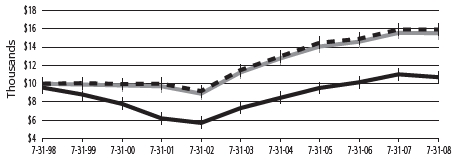
Performance of a $10,000 investment
Average annual total returns from Sept. 15, 1998, through July 31, 2008
| For period beginning Sept. 15, 1998, through July 31, 2008 | | Starting value | | Ending value |
| | Lehman Brothers U.S. Credit Index | | | $10,000 | | | $17,349 |
| | Lehman Brothers U.S. Corporate Investment Grade Index | | | $10,000 | | | $16,875 |
| | Delaware Corporate Bond Fund — Class A Shares | | | $9,550 | | | $16,620 |
The chart assumes $10,000 invested in the Fund on Sept. 15, 1998, and includes the effect of a 4.50% front-end sales charge and the reinvestment of all distributions. Please see pages 5 and 6 for additional details on these fees.
Performance of other Fund classes will vary due to different charges and expenses.
The chart also assumes $10,000 invested in the Lehman Brothers U.S. Corporate Investment Grade Index and Lehman Brothers U.S. Credit Index as of Sept. 15, 1998. The Lehman Brothers U.S. Corporate Investment Grade Index is composed of U.S. dollar–denominated, investment grade, SEC-registered corporate bonds issued by industrial, utility, and financial companies. The Lehman Brothers U.S. Credit Index measures the total return performance of nonconvertible, investment grade domestic corporate bonds and SEC-registered foreign issues. All bonds have at least one year to maturity.
Effective June 1, 2008, the Fund changed its benchmark index from the Lehman Brothers U.S. Credit Index to the Lehman Brothers U.S. Corporate Investment Grade Index. The Fund´s portfolio managers believe that the Fund´s new benchmark is more consistent with how the Fund is managed and better tracks the Fund’s performance.
An index is unmanaged and does not reflect the costs of operating a mutual fund, such as the costs of buying, selling, and holding securities. You cannot invest directly in an index.
Past performance is not a guarantee of future results.
The chart does not reflect the deduction of taxes the shareholders would pay on Fund distributions or redemptions of Fund shares.
7
| Performance summaries | |
| Delaware Extended Duration Bond Fund | July 31, 2008 |
The performance data quoted represent past performance; past performance does not guarantee future results. Investment return and principal value will fluctuate so your shares, when redeemed, may be worth more or less than their original cost. Please obtain the performance data for the most recent month end by calling 800 523-1918 or visiting our Web site at www.delawareinvestments. com/performance. Current performance may be lower or higher than the performance data quoted.
You should consider the investment objectives, risks, charges, and expenses of the investment company carefully before investing. The Delaware Extended Duration Bond Fund prospectus contains this and other important information about the investment company. Please request a prospectus through your financial advisor or by calling 800 523-1918 or visiting our Web site at www.delawareinvestments.com. Read the prospectus carefully before you invest or send money.
A rise or fall in interest rates can have a significant impact on bond prices and the net asset value (NAV) of the Fund. Funds that invest in bonds can lose their value as interest rates rise, and an investor can lose principal.
| Fund performance | | Average annual total returns through July 31, 2008 | |
| | 1 year | | 3 years | | 5 years | | Lifetime | |
| Class A (Est. Sept. 15, 1998) | | | | | | | | | |
| Excluding sales charge | | +0.83% | | +1.51% | | +5.61% | | +6.32% | |
| Including sales charge | | -3.75% | | -0.04% | | +4.65% | | +5.82% | |
| Class B (Est. Sept. 15, 1998) | | | | | | | | | |
| Excluding sales charge | | +0.08% | | +0.75% | | +4.79% | | +5.66% | |
| Including sales charge | | -3.74% | | +0.10% | | +4.56% | | +5.66% | |
| Class C (Est. Sept. 15, 1998) | | | | | | | | | |
| Excluding sales charge | | +0.08% | | +0.81% | | +4.83% | | +5.55% | |
| Including sales charge | | -0.88% | | +0.81% | | +4.83% | | +5.55% | |
Returns reflect the reinvestment of all distributions and any applicable sales charges as noted in the following paragraphs.
Performance for Class B and C shares, excluding sales charges, assumes either that contingent deferred sales charges did not apply or that the investment was not redeemed.
An expense limitation was in effect for all classes during the periods shown in the Fund performance chart above and in the Performance of a $10,000 Investment chart on page 10. Performance would have been lower had the expense limitation not been in effect. The current expenses for each class are listed on the chart on the next page.
The Fund offers Class A, B, C, R, and Institutional Class shares. Class A shares are sold with a maximum front-end sales charge of up to 4.50%, and have an annual distribution and service fee of up to 0.30% of average daily net assets, but such a fee is currently subject to a contractual cap of 0.25% of average daily net assets through Nov. 30, 2008.
Class B shares may only be purchased through dividend reinvestment and certain permitted exchanges, as described in the prospectus. Please see the prospectus for additional information on Class B purchase and sales charges. Class B shares have a contingent deferred sales charge that declines from 4.00% to zero depending on the period of
8
time the shares are held. Class B shares will automatically convert to Class A shares on a quarterly basis approximately eight years after purchase. They are also subject to an annual distribution and service fee of up to 1.00% of average daily net assets. Please see the prospectus for additional information on Class B purchase and sales charges.
Lifetime performance figures for Class B shares reflect conversion to Class A shares after eight years.
Class C shares are sold with a contingent deferred sales charge of 1.00% if redeemed during the first 12 months. They are also subject to an annual distribution and service fee of 1.00% of average daily net assets.
Please see the fee table in the prospectus and your financial professional for a more complete explanation of sales charges.
The average annual total returns for the 1-year and lifetime (since Oct. 1, 2005) periods ended July 31, 2008, for Delaware Extended Duration Bond Fund Class R shares were +0.39% and +1.50%, respectively.
Class R shares were first made available Oct. 1, 2005, and are available only for certain retirement plan products. They are sold without a sales charge and have an annual distribution and service fee of up to 0.60% of average daily net assets, but such fee is currently subject to a contractual cap of 0.50% of average daily net assets through Nov. 30, 2008.
The average annual total returns for the 1-year, 3-year, 5-year, and lifetime periods ended July 31, 2008, for Delaware Extended Duration Bond Fund Institutional Class shares were +1.09%, +1.76%, +5.85%, and +6.57%, respectively.
Institutional Class shares were first made available Sept. 15, 1998, and are available without sales or asset-based distribution charges only to certain eligible institutional accounts.
The performance table on the previous page and the graph on the next page do not reflect the deduction of taxes the shareholder would pay on Fund distributions or redemptions of Fund shares.
The Fund may be affected by economic conditions which may hinder a company’s ability to make interest and principal payments on its debt.
High yielding noninvestment grade bonds (junk bonds) involve higher risk than investment grade bonds. Adverse conditions may affect the issuer’s ability to pay interest and principal on these securities.
This Fund will be affected primarily by declines in bond prices, which can be caused by an adverse change in interest rates, adverse economic conditions, or poor performance from specific industries or bond issuers.
The Fund’s expense ratios, as described in the most recent prospectus, are disclosed in the table below. Management has contracted to reimburse expenses and/or waive its management fees from Dec. 1, 2007, through Nov. 30, 2008. Please see the most recent prospectus for additional information on the fee waivers.
| Fund expense ratios | | | | | | | | | | | | | | | |
| | | Class A | | | Class B | | | Class C | | | Class R | | | Institutional Class |
| Total annual operating expenses | | | | | | | | | | | | | | | |
| (without fee waivers) | | 1.20 | % | | 1.90 | % | | 1.90 | % | | 1.50 | % | | 0.90 | % |
| Net expense ratio | | | | | | | | | | | | | | | |
| (including fee waivers, if any)* | | 0.90 | % | | 1.65 | % | | 1.65 | % | | 1.15 | % | | 0.65 | % |
*The applicable fee waivers are discussed in the text on page 8 and 9. |
9
Performance summaries
Delaware Extended Duration Bond Fund
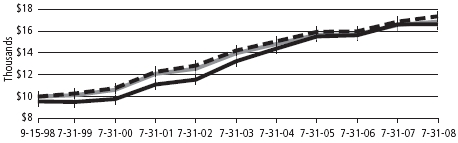
Performance of a $10,000 investment
Average annual total returns from Sept. 15, 1998, through July 31, 2008
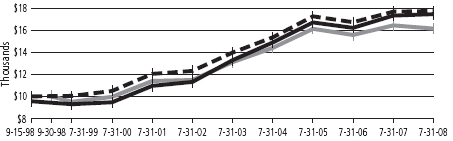
| For period beginning Sept. 15, 1998, through July 31, 2008 | | Starting value | | Ending value |
| | Lehman Brothers U.S. Long Credit Index | | | $10,000 | | | $17,745 |
| | Delaware Extended Duration Bond Fund — Class A Shares | | | $9,550 | | | $17,468 |
| | Lehman Brothers Long U.S. Corporate Index | | | $10,000 | | | $16,150 |
The chart assumes $10,000 invested in the Fund on Sept. 15, 1998, and includes the effect of a 4.50% front-end sales charge and the reinvestment of all distributions. Please see pages 8 and 9 for additional details on these fees.
Performance of other Fund classes will vary due to different charges and expenses.
The chart also assumes $10,000 invested in the Lehman Brothers Long U.S. Corporate Index as of Sept. 30, 1998, and the Lehman Brothers U.S. Long Credit Index as of Sept. 15, 1998. The Lehman Brothers Long U.S. Corporate Index is composed of U.S. dollar–denominated, investment grade, SEC-registered corporate bonds issued by industrial, utility, and financial companies. The Lehman Brothers U.S. Long Credit Index measures the total return performance of nonconvertible, investment grade domestic corporate bonds and SEC-registered foreign issues. All bonds have at least 10 years to maturity.
Effective June 1, 2008, the Fund changed its benchmark index from the Lehman Brothers U.S. Long Credit Index to the Lehman Brothers Long U.S. Corporate Index. The Fund´s portfolio managers believe that the Fund´s new benchmark is more consistent with how the Fund is managed and better tracks the Fund’s performance.
An index is unmanaged and does not reflect the costs of operating a mutual fund, such as the costs of buying, selling, and holding securities. You cannot invest directly in an index.
Past performance is not a guarantee of future results.
The chart does not reflect the deduction of taxes the shareholders would pay on Fund distributions or redemptions of Fund shares.
10
Disclosure of Fund expenses
For the period February 1, 2008 to July 31, 2008
As a shareholder of a Fund, you incur two types of costs: (1) transaction costs, including sales charges (loads) on purchase payments, reinvested dividends, or other distributions; redemption fees; and exchange fees; and (2) ongoing costs, including management fees; distribution and/or service (12b-1) fees; and other Fund expenses. These following examples are intended to help you understand your ongoing costs (in dollars) of investing in a Fund and to compare these costs with the ongoing costs of investing in other mutual funds.
The examples are based on an investment of $1,000 invested at the beginning of the period and held for the entire period February 1, 2008 to July 31, 2008.
Actual expenses
The first section of the tables shown, “Actual Fund Return,” provides information about actual account values and actual expenses. You may use the information in this section of the table, together with the amount you invested, to estimate the expenses that you paid over the period. Simply divide your account value by $1,000 (for example, an $8,600 account value divided by $1,000 = 8.6), then multiply the result by the number in the first section under the heading entitled “Expenses Paid During Period” to estimate the expenses you paid on your account during this period.
Hypothetical example for comparison purposes
The second section of the tables shown, “Hypothetical 5% Return,” provides information about hypothetical account values and hypothetical expenses based on the Funds’ actual expense ratios and an assumed rate of return of 5% per year before expenses, which is not the Funds’ actual return. The hypothetical account values and expenses may not be used to estimate the actual ending account balance or expenses you paid for the period. You may use this information to compare the ongoing costs of investing in each Fund and other funds. To do so, compare this 5% hypothetical example with the 5% hypothetical examples that appear in the shareholder reports of the other funds.
Please note that the expenses shown in the tables are meant to highlight your ongoing costs only and do not reflect any transactional costs, such as sales charges (loads), redemption fees, or exchange fees. Therefore, the second section of each table is useful in comparing ongoing costs only, and will not help you determine the relative total costs of owning different funds. In addition, if these transactional costs were included, your costs would have been higher. The Funds’ expenses shown in the tables reflect fee waivers in effect. The expenses shown in each table assume reinvestment of all dividends and distributions.
12
Delaware Corporate Bond Fund
Expense analysis of an investment of $1,000
| | Beginning | | Ending | | | | | Expenses |
| | Account | | Account Value | | Annualized | | Paid During Period |
| | 2/1/08 | | 7/31/08 | | Expense Ratio | | 2/1/08 to 7/31/08* |
| Actual Fund return | | | | | | | | | | | | | | |
| Class A | | $ | 1,000.00 | | $ | 970.10 | | 0.90 | % | | | $ | 4.41 | |
| Class B | | | 1,000.00 | | | 964.70 | | 1.65 | % | | | | 8.06 | |
| Class C | | | 1,000.00 | | | 966.50 | | 1.65 | % | | | | 8.07 | |
| Class R | | | 1,000.00 | | | 968.90 | | 1.15 | % | | | | 5.63 | |
| Institutional Class | | | 1,000.00 | | | 969.50 | | 0.65 | % | | | | 3.18 | |
| Hypothetical 5% return (5% return before expenses) | | | | | | | | |
| Class A | | $ | 1,000.00 | | $ | 1,020.39 | | 0.90 | % | | | $ | 4.52 | |
| Class B | | | 1,000.00 | | | 1,016.66 | | 1.65 | % | | | | 8.27 | |
| Class C | | | 1,000.00 | | | 1,016.66 | | 1.65 | % | | | | 8.27 | |
| Class R | | | 1,000.00 | | | 1,019.14 | | 1.15 | % | | | | 5.77 | |
| Institutional Class | | | 1,000.00 | | | 1,021.63 | | 0.65 | % | | | | 3.27 | |
Delaware Extended Duration Bond Fund
Expense analysis of an investment of $1,000
| | Beginning | | Ending | | | | | Expenses |
| | Account | | Account Value | | Annualized | | Paid During Period |
| | 2/1/08 | | 7/31/08 | | Expense Ratio | | 2/1/08 to 7/31/08* |
| Actual Fund return | | | | | | | | | | | | | | |
| Class A | | $ | 1,000.00 | | $ | 963.00 | | 0.90 | % | | | $ | 4.39 | |
| Class B | | | 1,000.00 | | | 959.30 | | 1.65 | % | | | | 8.04 | |
| Class C | | | 1,000.00 | | | 961.10 | | 1.65 | % | | | | 8.05 | |
| Class R | | | 1,000.00 | | | 961.80 | | 1.15 | % | | | | 5.61 | |
| Institutional Class | | | 1,000.00 | | | 964.20 | | 0.65 | % | | | | 3.17 | |
| Hypothetical 5% return (5% return before expenses) | | | | | | | | |
| Class A | | $ | 1,000.00 | | $ | 1,020.39 | | 0.90 | % | | | $ | 4.52 | |
| Class B | | | 1,000.00 | | | 1,016.66 | | 1.65 | % | | | | 8.27 | |
| Class C | | | 1,000.00 | | | 1,016.66 | | 1.65 | % | | | | 8.27 | |
| Class R | | | 1,000.00 | | | 1,019.14 | | 1.15 | % | | | | 5.77 | |
| Institutional Class | | | 1,000.00 | | | 1,021.63 | | 0.65 | % | | | | 3.27 | |
*“Expenses Paid During Period” are equal to the Funds’ annualized expense ratios, multiplied by the average account value over the period, multiplied by 182/366 (to reflect the one-half year period).
13
| Sector allocation and credit quality breakdown |
| Delaware Corporate Bond Fund | As of July 31, 2008 |
Sector designations may be different than the sector designations presented in other Fund materials. The sector designations may also represent the investment manager’s internal sector classifications, which may result in the sector designations for one Fund being different than another Fund’s sector designations.
| Sector | | Percentage of net assets |
| Agency Collateralized Mortgage Obligations | | | 0.20% | |
| Agency Mortgage-Backed Security | | | 0.19% | |
| Collateralized Debt Obligation | | | 0.02% | |
| Commercial Mortgage-Backed Securities | | | 2.80% | |
| Corporate Bonds | | | 82.22% | |
| Banking | | | 11.68% | |
| Basic Industry | | | 6.42% | |
| Brokerage | | | 3.59% | |
| Capital Goods | | | 2.43% | |
| Communications | | | 14.77% | |
| Consumer Cyclical | | | 4.57% | |
| Consumer Non-Cyclical | | | 10.97% | |
| Electric | | | 6.34% | |
| Energy | | | 6.13% | |
| Finance Companies | | | 3.33% | |
| Insurance | | | 6.35% | |
| Natural Gas | | | 2.13% | |
| Real Estate | | | 0.89% | |
| Technology | | | 0.99% | |
| Transportation | | | 1.63% | |
| Municipal Bonds | | | 1.11% | |
| Non-Agency Asset-Backed Securities | | | 2.16% | |
| Non-Agency Collateralized Mortgage Obligations | | | 1.09% | |
| Regional Agency | | | 0.28% | |
| Senior Secured Loans | | | 1.44% | |
| Sovereign Debt | | | 1.90% | |
| Supranational Banks | | | 0.75% | |
| U.S. Treasury Obligations | | | 0.95% | |
| Common Stock | | | 0.00% | |
| Preferred Stock | | | 2.02% | |
| Warrants | | | 0.00% | |
14
| Sector | | Percentage of net assets |
| Repurchase Agreements | | | 0.17 | % | |
| Securities Lending Collateral | | | 3.81 | % | |
| Total Value of Securities | | | 101.11 | % | |
| Obligation to Return Securities Lending Collateral | | | (3.81 | %) | |
| Receivables and Other Assets Net of Liabilities | | | 2.70 | % | |
| Total Net Assets | | | 100.00 | % | |
| | |
| Credit Quality Breakdown (as a % of fixed income investments) | | | | | |
| AAA | | | 12.27 | % | |
| AA | | | 11.01 | % | |
| A | | | 37.60 | % | |
| BBB | | | 31.21 | % | |
| BB | | | 4.93 | % | |
| B | | | 2.96 | % | |
| Not Rated | | | 0.02 | % | |
| Total | | | 100.00 | % | |
15
| Sector allocation and credit quality breakdown |
| Delaware Extended Duration Bond Fund | As of July 31, 2008 |
Sector designations may be different than the sector designations presented in other Fund materials. The sector designations may also represent the investment manager’s internal sector classifications, which may result in the sector designations for one Fund being different than another Fund’s sector designations.
| Sector | | Percentage of net assets |
| Agency Collateralized Mortgage Obligations | | | 1.83 | % | |
| Commercial Mortgage-Backed Securities | | | 2.30 | % | |
| Corporate Bonds | | | 84.10 | % | |
| Banking | | | 11.92 | % | |
| Basic Industry | | | 6.95 | % | |
| Brokerage | | | 3.53 | % | |
| Capital Goods | | | 0.22 | % | |
| Communications | | | 12.64 | % | |
| Consumer Cyclical | | | 6.19 | % | |
| Consumer Non-Cyclical | | | 10.22 | % | |
| Electric | | | 9.18 | % | |
| Energy | | | 7.74 | % | |
| Finance Companies | | | 2.88 | % | |
| Insurance | | | 8.02 | % | |
| Natural Gas | | | 1.85 | % | |
| Real Estate | | | 0.47 | % | |
| Technology | | | 0.75 | % | |
| Transportation | | | 1.54 | % | |
| Municipal Bonds | | | 1.10 | % | |
| Non-Agency Asset-Backed Securities | | | 1.76 | % | |
| Senior Secured Loans | | | 1.61 | % | |
| Sovereign Debt | | | 0.61 | % | |
| Supranational Bank | | | 0.20 | % | |
| U.S. Treasury Obligation | | | 0.65 | % | |
| Preferred Stock | | | 2.19 | % | |
| Warrants | | | 0.00 | % | |
| Securities Lending Collateral | | | 3.04 | % | |
| Total Value of Securities | | | 99.39 | % | |
| Obligation to Return Securities Lending Collateral | | | (3.04 | %) | |
| Receivables and Other Assets Net of Liabilities | | | 3.65 | % | |
| Total Net Assets | | | 100.00 | % | |
16
| Credit Quality Breakdown (as a % of fixed income investments) | | Percentage of net assets |
| AAA | | | 13.40 | % | |
| AA | | | 9.36 | % | |
| A | | | 40.71 | % | |
| BBB | | | 27.43 | % | |
| BB | | | 5.85 | % | |
| B | | | 3.25 | % | |
| Total | | | 100.00 | % | |
17
| Statements of net assets | |
| Delaware Corporate Bond Fund | July 31, 2008 |
| Principal amount° | | Value (U.S. $) |
| Agency Collateralized Mortgage Obligations – 0.20% | | | | | |
| ¥Fannie Mae REMIC | | | | | | |
| Series 2005-67 EY 5.50% 8/25/25 | USD | | 615,000 | | $ | 576,412 |
| ¥GNMA Series 2003-5 B 4.486% 10/16/25 | | 540,000 | | | 539,494 |
| Total Agency Collateralized Mortgage | | | | | | |
| Obligations (cost $1,149,330) | | | | | | 1,115,906 |
| |
| Agency Mortgage-Backed Security – 0.19% | | | | | | |
| ¥Fannie Mae S.F. 30 yr 5.50% 9/1/36 | | | 1,093,047 | | | 1,074,420 |
| Total Agency Mortgage-Backed Security | | | | | | |
| (cost $1,078,189) | | | | | | 1,074,420 |
| |
| @=#Collateralized Debt Obligation – 0.02% | | | | | | |
| Travelers Funding CBO | | | | | | |
| Series 1A A2 144A 6.35% 2/18/14 | | | 116,610 | | | 116,587 |
| Total Collateralized Debt Obligation | | | | | | |
| (cost $119,015) | | | | | | 116,587 |
| |
| Commercial Mortgage-Backed Securities – 2.80% | | | | | |
| ŸBank of America Commercial Mortgage | | | | | | |
| Series 2004-3 A5 5.316% 6/10/39 | | | 1,490,000 | | | 1,477,613 |
| Series 2005-6 AM 5.181% 9/10/47 | | | 675,000 | | | 619,299 |
| Series 2006-3 A4 5.889% 7/10/44 | | | 1,075,000 | | | 1,034,207 |
| Series 2007-3 A4 5.658% 5/10/17 | | | 1,230,000 | | | 1,136,290 |
| #Bear Stearns Commercial Mortgage | | | | | | |
| Securities Series 2004-ESA E 144A | | | | | | |
| 5.064% 5/14/16 | | | 1,105,000 | | | 1,119,627 |
| Ÿ#Credit Suisse First Boston Mortgage | | | | | | |
| Securities Series 2001-SPGA A2 144A | | | | | | |
| 6.515% 8/13/18 | | | 2,395,000 | | | 2,455,606 |
| JPMorgan Chase Commercial | | | | | | |
| Mortgage Securities | | | | | | |
| Series 2002-C2 A2 5.05% 12/12/34 | | | 800,000 | | | 778,595 |
| Series 2006-LDP9 A2 5.134% 5/15/47 | | | 2,400,000 | | | 2,195,981 |
| #Merrill Lynch Mortgage Investors | | | | | | |
| Series 1998-C3 G 144A 6.00% 12/15/30 | | 1,200,000 | | | 691,168 |
| #Merrill Lynch Mortgage Trust | | | | | | |
| Series 2002-MW1 J 144A | | | | | | |
| 5.695% 7/12/34 | | | 325,000 | | | 236,124 |
18
| | | Principal amount° | | Value (U.S. $) |
| Commercial Mortgage-Backed Securities (continued) | | | | | | |
| ŸMorgan Stanley Capital I | | | | | | |
| #Series 1999-FNV1 G 144A 6.12% 3/15/31 | USD | | 510,000 | | $ | 501,772 |
| Series 2007-T27 A4 5.65% 6/11/42 | | | 1,500,000 | | | 1,388,973 |
| #Tower 144A | | | | | | |
| Series 2004-2A A 4.232% 12/15/14 | | | 935,000 | | | 920,732 |
| Series 2006-1 B 5.588% 2/15/36 | | | 510,000 | | | 491,018 |
| Series 2006-1 C 5.707% 2/15/36 | | | 785,000 | | | 733,174 |
| Total Commercial Mortgage-Backed Securities | | | | | | |
| (cost $16,853,082) | | | | | | 15,780,179 |
| |
| Corporate Bonds – 82.22% | | | | | | |
| Banking – 11.68% | | | | | | |
| American Express Centurion Bank | | | | | | |
| 5.55% 10/17/12 | | | 3,155,000 | | | 3,073,393 |
| Bank of America | | | | | | |
| 4.90% 5/1/13 | | | 1,400,000 | | | 1,357,321 |
| 5.65% 5/1/18 | | | 7,205,000 | | | 6,737,806 |
| Bank of New York Mellon 4.50% 4/1/13 | | | 8,660,000 | | | 8,341,709 |
| *BB&T Capital Trust I 5.85% 8/18/35 | | | 4,981,000 | | | 3,619,479 |
| Branch Banking & Trust 5.625% 9/15/16 | | | 2,100,000 | | | 1,880,800 |
| #CoBank ACB 144A 7.875% 4/16/18 | | | 2,060,000 | | | 2,008,974 |
| JPMorgan Chase 6.40% 5/15/38 | | | 1,235,000 | | | 1,141,927 |
| JPMorgan Chase Capital XXV 6.80% 10/1/37 | | | 5,035,000 | | | 4,266,387 |
| Mellon Bank 5.45% 4/1/16 | | | 2,015,000 | | | 1,966,086 |
| #National Australia Bank 144A 5.35% 6/12/13 | | | 5,820,000 | | | 5,820,064 |
| PNC Bank 6.875% 4/1/18 | | | 4,385,000 | | | 4,330,841 |
| @ÕŸPopular North America 3.191% 4/6/09 | | | 845,000 | | | 828,722 |
| @ÕPopular North America Capital Trust I | | | | | | |
| 6.564% 9/15/34 | | | 1,500,000 | | | 973,484 |
| Silicon Valley Bank | | | | | | |
| 5.70% 6/1/12 | | | 2,320,000 | | | 2,140,483 |
| 6.05% 6/1/17 | | | 1,870,000 | | | 1,598,158 |
| Sovereign Bancorp 4.80% 9/1/10 | | | 1,670,000 | | | 1,469,324 |
| U.S. Bank | | | | | | |
| 4.80% 4/15/15 | | | 2,400,000 | | | 2,323,807 |
| 4.95% 10/30/14 | | | 1,520,000 | | | 1,503,294 |
| ŸUSB Capital IX 6.189% 4/15/49 | | | 2,120,000 | | | 1,484,833 |
19
Statements of net assets
Delaware Corporate Bond Fund
| | | | Principal amount° | | Value (U.S. $) |
| Corporate Bonds (continued) | | | | | |
| Banking (continued) | | | | | |
| Washington Mutual | | | | | |
| *5.25% 9/15/17 | USD | | 1,215,000 | | $ 766,680 |
| 5.50% 8/24/11 | | | 2,627,000 | | 1,813,789 |
| Wells Fargo 5.625% 12/11/17 | | | 2,250,000 | | 2,148,219 |
| ·Wells Fargo Capital XIII 7.70% 12/29/49 | | | 4,450,000 | | 4,220,288 |
| | | | | | 65,815,868 |
| Basic Industry – 6.42% | | | | | |
| #ArcelorMittal 144A 6.125% 6/1/18 | | | 5,700,000 | | 5,483,645 |
| du Pont (EI) deNemours 6.00% 7/15/18 | | | 7,825,000 | | 7,933,258 |
| *#Evraz Group 144A 9.50% 4/24/18 | | | 1,491,000 | | 1,444,481 |
| Freeport McMoRan Copper & Gold | | | | | |
| 8.25% 4/1/15 | | | 1,375,000 | | 1,435,266 |
| 8.375% 4/1/17 | | | 1,800,000 | | 1,888,407 |
| *Georgia-Pacific 9.50% 12/1/11 | | | 45,000 | | 45,563 |
| #GTL Trade Finance 144A 7.25% 10/20/17 | | | 1,200,000 | | 1,196,950 |
| Lubrizol 4.625% 10/1/09 | | | 3,490,000 | | 3,471,639 |
| #Nine Dragons Paper Holdings 144A | | | | | |
| 7.875% 4/29/13 | | | 1,190,000 | | 1,168,118 |
| #Norske Skogindustrier 144A | | | | | |
| 7.125% 10/15/33 | | | 2,265,000 | | 1,347,675 |
| Rio Tinto Finance USA 6.50% 7/15/18 | | | 5,800,000 | | 5,826,663 |
| #Sappi Papier Holding 144A 6.75% 6/15/12 | | | 2,910,000 | | 2,626,534 |
| #Severstal 144A 9.75% 7/29/13 | | | 1,400,000 | | 1,407,700 |
| #Steel Dynamics 144A 7.75% 4/15/16 | | | 925,000 | | 915,750 |
| | | | | | 36,191,649 |
| Brokerage – 3.59% | | | | | |
| AMVESCAP 4.50% 12/15/09 | | | 1,435,000 | | 1,387,889 |
| Goldman Sachs Group | | | | | |
| 6.15% 4/1/18 | | | 7,514,000 | | 7,251,182 |
| 6.75% 10/1/37 | | | 2,167,000 | | 1,920,941 |
| Jefferies Group 6.45% 6/8/27 | | | 2,705,000 | | 2,097,195 |
| Lazard Group 6.85% 6/15/17 | | | 1,240,000 | | 1,082,451 |
| Lehman Brothers Holdings | | | | | |
| 5.625% 1/24/13 | | | 3,360,000 | | 3,144,211 |
| 6.875% 7/17/37 | | | 4,050,000 | | 3,365,631 |
| | | | | | 20,249,500 |
20
| | | | Principal amount° | | Value (U.S. $) |
| Corporate Bonds (continued) | | | | | |
| Capital Goods – 2.43% | | | | | |
| *NXP BV Funding 9.50% 10/15/15 | USD | | 1,620,000 | | $ 1,125,900 |
| Textron 6.50% 6/1/12 | | | 3,085,000 | | 3,244,963 |
| Tyco Electronics Group | | | | | |
| 5.95% 1/15/14 | | | 6,205,000 | | 6,159,890 |
| 6.55% 10/1/17 | | | 3,180,000 | | 3,148,232 |
| | | | | | 13,678,985 |
| Communications – 14.77% | | | | | |
| AT&T 6.40% 5/15/38 | | | 3,260,000 | | 3,113,548 |
| AT&T Wireless 8.125% 5/1/12 | | | 7,750,000 | | 8,510,873 |
| #Charter Communications Operating 144A | | | | | |
| 10.875% 9/15/14 | | | 895,000 | | 935,275 |
| Comcast | | | | | |
| 5.875% 2/15/18 | | | 4,285,000 | | 4,133,350 |
| 6.30% 11/15/17 | | | 3,250,000 | | 3,232,505 |
| #DirecTV Holdings 144A 7.625% 5/15/16 | | | 1,200,000 | | 1,197,000 |
| France Telecom 7.75% 3/1/11 | | | 7,315,000 | | 7,794,872 |
| WInmarsat Finance 10.375% 11/15/12 | | | 1,550,000 | | 1,565,500 |
| Nortel Networks | | | | | |
| ·7.041% 7/15/11 | | | 720,000 | | 682,200 |
| *10.75% 7/15/16 | | | 620,000 | | 610,700 |
| Qwest 7.50% 10/1/14 | | | 1,490,000 | | 1,374,525 |
| Rogers Communications 7.50% 8/15/38 | | | 5,345,000 | | 5,382,468 |
| Sprint Capital 8.375% 3/15/12 | | | 1,550,000 | | 1,524,041 |
| Telecom Italia Capital | | | | | |
| 4.00% 1/15/10 | | | 2,325,000 | | 2,290,867 |
| 7.721% 6/4/38 | | | 3,430,000 | | 3,386,123 |
| Telefonica Emisiones 5.984% 6/20/11 | | | 1,450,000 | | 1,468,396 |
| Thomson Reuters | | | | | |
| 5.95% 7/15/13 | | | 3,010,000 | | 3,044,744 |
| *6.50% 7/15/18 | | | 4,045,000 | | 4,057,709 |
| Time Warner Cable 7.30% 7/1/38 | | | 2,900,000 | | 2,908,149 |
| Verizon Communications 5.55% 2/15/16 | | | 14,115,000 | 13,746,091 |
| Viacom | | | | | |
| ·3.126% 6/16/09 | | | 1,025,000 | | 1,018,376 |
| 5.75% 4/30/11 | | | 975,000 | | 966,462 |
| *#Vimpelcom 144A 9.125% 4/30/18 | | | 2,450,000 | | 2,399,996 |
| #Vivendi 144A 6.625% 4/4/18 | | | 4,360,000 | | 4,259,131 |
21
Statements of net assets
Delaware Corporate Bond Fund
| | | | Principal amount° | | Value (U.S. $) |
| Corporate Bonds (continued) | | | | | |
| Communications (continued) | | | | | |
| Vodafone Group | | | | | |
| 5.375% 1/30/15 | USD | | 1,795,000 | | $ 1,730,209 |
| *5.625% 2/27/17 | | | 2,000,000 | | 1,923,628 |
| | | | | | 83,256,738 |
| Consumer Cyclical – 4.57% | | | | | |
| CVS Caremark | | | | | |
| 4.875% 9/15/14 | | | 1,519,000 | | 1,461,442 |
| 5.75% 6/1/17 | | | 4,341,000 | | 4,251,098 |
| ·DaimlerChrysler North America | | | | | |
| 3.234% 8/3/09 | | | 1,810,000 | | 1,796,041 |
| Disney (Walt) 7.55% 7/15/93 | | | 1,565,000 | | 1,737,416 |
| #Galaxy Entertainment Finance 144A | | | | | |
| 9.875% 12/15/12 | | | 800,000 | | 776,000 |
| General Motors | | | | | |
| 6.85% 10/15/08 | | | 2,170,000 | | 2,137,450 |
| *8.375% 7/15/33 | | | 635,000 | | 315,913 |
| GMAC 6.875% 8/28/12 | | | 1,795,000 | | 1,127,425 |
| John Deere Capital 4.95% 12/17/12 | | | 2,800,000 | | 2,816,447 |
| Johnson Controls 5.25% 1/15/11 | | | 3,000,000 | | 3,040,530 |
| Lear 8.75% 12/1/16 | | | 790,000 | | 628,050 |
| *Neiman Marcus Group 10.375% 10/15/15 | | | 690,000 | | 679,650 |
| *Tenneco 8.625% 11/15/14 | | | 450,000 | | 380,250 |
| VF 5.95% 11/1/17 | | | 2,054,000 | | 2,024,433 |
| Wal-Mart Stores 5.25% 9/1/35 | | | 3,000,000 | | 2,570,679 |
| | | | | | 25,742,824 |
| Consumer Non-Cyclical – 10.97% | | | | | |
| #AmBev International Finance 144A | | | | | |
| 9.50% 7/24/17 | BRL | | 3,200,000 | | 1,677,428 |
| Amgen 5.85% 6/1/17 | USD | | 3,785,000 | | 3,796,268 |
| AstraZeneca 5.90% 9/15/17 | | | 1,980,000 | | 2,039,459 |
| Covidien International Finance | | | | | |
| 5.45% 10/15/12 | | | 1,020,000 | | 1,016,216 |
| 6.00% 10/15/17 | | | 5,711,000 | | 5,723,993 |
| Delhaize America 9.00% 4/15/31 | | | 1,971,000 | | 2,270,424 |
| Diageo Capital 5.75% 10/23/17 | | | 5,385,000 | | 5,266,309 |
| #Dr Pepper Snapple Group 144A | | | | | |
| 6.82% 5/1/18 | | | 6,235,000 | | 6,280,360 |
| GlaxoSmithKline Capital 5.65% 5/15/18 | | | 6,200,000 | | 6,210,906 |
22
| | | | Principal amount° | | Value (U.S. $) |
| Corporate Bonds (continued) | | | | | |
| Consumer Non-Cyclical (continued) | | | | | |
| HCA 9.25% 11/15/16 | USD | | 895,000 | | $ 924,088 |
| Kellogg 5.125% 12/3/12 | | | 1,523,000 | | 1,541,143 |
| Kraft Foods 6.125% 2/1/18 | | | 2,714,000 | | 2,656,789 |
| Kroger 6.75% 4/15/12 | | | 5,542,000 | | 5,806,437 |
| Quest Diagnostics 5.45% 11/1/15 | | | 4,644,000 | | 4,427,543 |
| Schering-Plough | | | | | |
| 5.55% 12/1/13 | | | 1,000,000 | | 1,006,866 |
| 6.00% 9/15/17 | | | 1,950,000 | | 1,928,872 |
| #Seminole Indian Tribe of Florida 144A | | | | | |
| 7.804% 10/1/20 | | | 1,000,000 | | 966,660 |
| Wyeth 5.50% 2/1/14 | | | 8,185,000 | | 8,291,019 |
| | | | | | 61,830,780 |
| Electric – 6.34% | | | | | |
| Baltimore Gas & Electric 6.125% 7/1/13 | | | 1,750,000 | | 1,774,015 |
| Columbus Southern Power 6.05% 5/1/18 | | | 3,710,000 | | 3,694,496 |
| Commonwealth Edison 6.15% 9/15/17 | | | 1,069,000 | | 1,068,472 |
| Connecticut Light & Power 5.65% 5/1/18 | | | 2,050,000 | | 2,020,275 |
| Detroit Edison 5.60% 6/15/18 | | | 2,075,000 | | 2,053,806 |
| Dominion Resources 6.40% 6/15/18 | | | 3,600,000 | | 3,663,864 |
| Florida Power 6.40% 6/15/38 | | | 3,685,000 | | 3,718,548 |
| Illinois Power 6.125% 11/15/17 | | | 2,454,000 | | 2,340,110 |
| #Ipalco Enterprises 144A 7.25% 4/1/16 | | | 300,000 | | 302,250 |
| #Korea Southern Power 144A 5.375% 4/18/13 | | 630,000 | | 617,084 |
| NRG Energy 7.375% 2/1/16 | | | 670,000 | | 651,575 |
| Pacific Gas & Electric 4.80% 3/1/14 | | | 2,600,000 | | 2,531,043 |
| PECO Energy 5.35% 3/1/18 | | | 4,170,000 | | 4,088,534 |
| #Power Contract Financing 144A | | | | | |
| 6.256% 2/1/10 | | | 991,883 | | 1,004,099 |
| @#Power Receivables Finance 144A | | | | | |
| 6.29% 1/1/12 | | | 124,058 | | 127,092 |
| #TAQA Abu Dhabi National Energy 144A | | | | | |
| 7.25% 8/1/18 | | | 560,000 | | 570,296 |
| #Texas Competitive Electric Holdings 144A | | | | | |
| 10.25% 11/1/15 | | | 1,145,000 | | 1,150,725 |
| *Union Electric 6.70% 2/1/19 | | | 1,480,000 | | 1,495,966 |
| Virginia Electric Power 5.95% 9/15/17 | | | 1,500,000 | | 1,512,896 |
| #West Penn Power 144A 5.95% 12/15/17 | | | 1,340,000 | | 1,329,844 |
| | | | | | 35,714,990 |
23
Statements of net assets
Delaware Corporate Bond Fund
| | | | Principal amount° | | Value (U.S. $) |
| Corporate Bonds (continued) | | | | | |
| Energy – 6.13% | | | | | |
| Dynegy Holdings 7.75% 6/1/19 | USD | | 575,000 | | $ 531,875 |
| #Enbridge Energy Partners 144A | | | | | |
| 6.50% 4/15/18 | | | 6,380,000 | | 6,353,868 |
| 7.50% 4/15/38 | | | 2,280,000 | | 2,348,489 |
| #MarkWest Energy Partners 144A | | | | | |
| 8.75% 4/15/18 | | | 1,215,000 | | 1,215,000 |
| Petro-Canada 6.05% 5/15/18 | | | 5,135,000 | | 5,046,878 |
| #Plains All American Pipeline 144A | | | | | |
| 6.50% 5/1/18 | | | 4,395,000 | | 4,352,254 |
| #Ras Laffan Liquefied Natural Gas III 144A | | | | | |
| 5.832% 9/30/16 | | | 1,630,000 | | 1,591,299 |
| SEACOR SMIT Holdings 7.20% 9/15/09 | | | 2,115,000 | | 2,164,882 |
| Sibneft 10.75% 1/15/09 | | | 500,000 | | 512,500 |
| Suncor Energy 6.10% 6/1/18 | | | 2,795,000 | | 2,803,715 |
| #Transcontinental Gas Pipeline 144A | | | | | |
| 6.05% 6/15/18 | | | 2,935,000 | | 2,894,644 |
| Weatherford International | | | | | |
| 6.00% 3/15/18 | | | 3,685,000 | | 3,643,772 |
| 6.35% 6/15/17 | | | 1,060,000 | | 1,073,855 |
| | | | | | 34,533,031 |
| Finance Companies – 3.33% | | | | | |
| American Express 7.00% 3/19/18 | | | 1,600,000 | | 1,593,979 |
| Capmark Financial Group 6.30% 5/10/17 | | | 2,938,000 | | 1,727,714 |
| General Electric Capital 5.875% 1/14/38 | | | 1,355,000 | | 1,220,833 |
| ·#ILFC E-Capital Trust II 144A 6.25% 12/21/65 | | 2,335,000 | | 1,916,442 |
| International Lease Finance | | | | | |
| 5.35% 3/1/12 | | | 2,775,000 | | 2,419,670 |
| 5.875% 5/1/13 | | | 1,800,000 | | 1,532,630 |
| 6.375% 3/25/13 | | | 3,830,000 | | 3,314,033 |
| #Mantis Reef 144A 4.799% 11/3/09 | | | 2,140,000 | | 2,096,571 |
| #Nuveen Investments 144A 10.50% 11/15/15 | | 720,000 | | 651,600 |
| ·#Xstrata Finance 144A 3.035% 11/13/09 | | | 2,345,000 | | 2,293,619 |
| | | | | | 18,767,091 |
| Insurance – 6.35% | | | | | |
| *·#American International Group 144A | | | | | |
| 8.175% 5/15/58 | | | 1,647,000 | | 1,479,382 |
| #Berkshire Hathaway Finance 144A | | | | | |
| 5.40% 5/15/18 | | | 2,795,000 | | 2,753,360 |
24
| | | | Principal amount° | | Value (U.S. $) |
| Corporate Bonds (continued) | | | | | |
| Insurance (continued) | | | | | |
| ·Hartford Financial Services Group | | | | | |
| 8.125% 6/15/38 | USD | | 6,540,000 | | $ 6,290,774 |
| @#Max USA Holdings 144A 7.20% 4/14/17 | | | 2,082,000 | | 2,110,494 |
| ·#MetLife Capital Trust X 144A 9.25% 4/8/38 | | | 5,400,000 | | 5,492,027 |
| @ÕMontpelier Re Holdings 6.125% 8/15/13 | | | 1,035,000 | | 1,012,733 |
| @·w#Stingray Pass Through Trust 144A | | | | | |
| 5.902% 1/12/15 | | | 2,300,000 | | 345,000 |
| @·w#Twin Reefs Pass Through Trust 144A | | | | | |
| 3.459% 12/31/49 | | | 3,100,000 | | 313,875 |
| UnitedHealth Group | | | | | |
| 5.50% 11/15/12 | | | 2,102,000 | | 2,066,138 |
| 5.80% 3/15/36 | | | 3,145,000 | | 2,490,308 |
| Unitrin 6.00% 5/15/17 | | | 3,774,000 | | 3,133,960 |
| WellPoint | | | | | |
| 5.00% 1/15/11 | | | 3,730,000 | | 3,692,148 |
| 5.00% 12/15/14 | | | 3,088,000 | | 2,879,279 |
| ·#White Mountains Re Group 144A | | | | | |
| 7.506% 5/29/49 | | | 2,220,000 | | 1,695,811 |
| | | | | | 35,755,289 |
| Natural Gas – 2.13% | | | | | |
| *CenterPoint Energy Resources | | | | | |
| 6.125% 11/1/17 | | | 3,043,000 | | 2,969,232 |
| Enterprise Products Operating | | | | | |
| 6.50% 1/31/19 | | | 2,286,000 | | 2,302,370 |
| *·8.375% 8/1/66 | | | 1,510,000 | | 1,477,399 |
| *Kinder Morgan Energy Partners | | | | | |
| 6.95% 1/15/38 | | | 4,020,000 | | 3,977,533 |
| Valero Energy 6.125% 6/15/17 | | | 1,332,000 | | 1,281,525 |
| | | | | | 12,008,059 |
| Real Estate – 0.89% | | | | | |
| iStar Financial | | | | | |
| 5.15% 3/1/12 | | | 900,000 | | 652,993 |
| 5.875% 3/15/16 | | | 1,274,000 | | 854,761 |
| Regency Centers 5.875% 6/15/17 | | | 2,569,000 | | 2,370,719 |
| ·#USB Realty 144A 6.091% 12/22/49 | | | 1,800,000 | | 1,170,902 |
| | | | | | 5,049,375 |
25
Statements of net assets
Delaware Corporate Bond Fund
| | | | Principal amount° | | Value (U.S. $) |
| Corporate Bonds (continued) | | | | | |
| Technology – 0.99% | | | | | |
| Oracle 5.75% 4/15/18 | USD | | 3,880,000 | | $ 3,878,157 |
| Sungard Data Systems | | | | | |
| 9.125% 8/15/13 | | | 550,000 | | 565,125 |
| 10.25% 8/15/15 | | | 214,000 | | 218,280 |
| Xerox 5.50% 5/15/12 | | | 955,000 | | 939,039 |
| | | | | | 5,600,601 |
| Transportation – 1.63% | | | | | |
| Burlington North Santa Fe | | | | | |
| 5.65% 5/1/17 | | | 1,802,000 | | 1,752,845 |
| 5.75% 3/15/18 | | | 4,401,000 | | 4,303,937 |
| #DP World 144A 6.85% 7/2/37 | | | 1,490,000 | | 1,252,796 |
| Norfolk Southern 5.75% 4/1/18 | | | 1,800,000 | | 1,761,858 |
| =wUnited Air Lines 1992 Pass Through Trust | | | | | |
| 8.70% 10/7/08 | | | 374,608 | | 112,382 |
| | | | | | 9,183,818 |
| Total Corporate Bonds (cost $484,889,538) | | | | | 463,378,598 |
| |
| Municipal Bonds – 1.11% | | | | | |
| Massachusetts Bay Transportation Authority | | | | | |
| 5.00% 7/1/19 | | | 395,000 | | 426,019 |
| North Texas Tollway Authority Refunding | | | | | |
| (First Tier) Series A | | | | | |
| 5.50% 1/1/18 | | | 315,000 | | 335,711 |
| 6.00% 1/1/19 | | | 160,000 | | 174,782 |
| 6.00% 1/1/20 | | | 790,000 | | 853,650 |
| University of Texas Financing Authority | | | | | |
| Refunding Series A 5.25% 8/15/18 | | | 395,000 | | 437,245 |
| West Virginia Economic Development | | | | | |
| Authority Excess Lottery Revenue | | | | | |
| 5.37% 7/1/20 (MBIA) | | | 290,000 | | 274,375 |
| West Virginia Tobacco Settlement | | | | | |
| Finance Authority Asset-Backed | | | | | |
| Series A 7.467% 6/1/47 | | | 4,190,000 | | 3,728,724 |
| Total Municipal Bonds (cost $6,695,853) | | | | | 6,230,506 |
26
| | | | Principal amount° | | Value (U.S. $) |
| Non-Agency Asset-Backed Securities – 2.16% | | | | | |
| Capital One Multi-Asset Execution Trust | | | | | |
| Series 2007-A7 A7 5.75% 7/15/20 | USD | | 1,275,000 | | $ 1,214,161 |
| Caterpillar Financial Asset Trust | | | | | |
| Series 2007-A A3A 5.34% 6/25/12 | | | 480,000 | | 487,610 |
| Series 2008-A A3 4.94% 4/25/14 | | | 720,000 | | 723,709 |
| Citibank Credit Card Issuance Trust | | | | | |
| Series 2007-A3 A3 6.15% 6/15/39 | | | 3,155,000 | | 3,060,778 |
| CNH Equipment Trust Series 2008-A A3 | | | | | |
| 4.12% 5/15/12 | | | 445,000 | | 445,123 |
| Discover Card Master Trust Execution Note | | | | |
| Series 2007-A1 A1 5.65% 3/16/20 | | | 2,180,000 | | 2,034,326 |
| #Dunkin Securitization Series 2006-1 A2 | | | | | |
| 144A 5.779% 6/20/31 | | | 425,000 | | 346,153 |
| Hyundai Auto Receivables Trust | | | | | |
| Series 2007-A A3A 5.04% 1/17/12 | | | 480,000 | | 489,277 |
| @·#MASTR Specialized Loan Trust | | | | | |
| Series 2005-2 A2 144A 5.006% 7/25/35 | | 425,454 | | 376,527 |
| Mid-State Trust | | | | | |
| Series 11 A1 4.864% 7/15/38 | | | 191,074 | | 173,835 |
| Series 2004-1 A 6.005% 8/15/37 | | | 227,381 | | 221,986 |
| Series 2005-1 A 5.745% 1/15/40 | | | 265,954 | | 241,271 |
| RSB Bondco Series 2007-A A2 5.72% 4/1/18 | | 1,085,000 | | 1,095,147 |
| @ÕStructured Asset Securities | | | | | |
| Series 2001-SB1 A2 3.375% 8/25/31 | | | 535,144 | | 440,395 |
| World Omni Auto Receivables Trust | | | | | |
| Series 2008-A A3A 3.94% 10/15/2012 | | | 800,000 | | 799,311 |
| Total Non-Agency Asset-Backed Securities | | | | |
| (cost $12,649,969) | | | | | 12,149,609 |
| |
| Non-Agency Collateralized Mortgage Obligations – 1.09% | | |
| Countrywide Alternative Loan Trust | | | | | |
| Series 2006-2CB A3 5.50% 3/25/36 | | | 837,395 | | 780,727 |
| @Õ·First Horizon Alternative Mortgage Securities | | | | |
| Series 2006-FA2 B1 5.978% 5/25/36 | | | 1,913,884 | | 427,530 |
| @Õ·MASTR Adjustable Rate Mortgages Trust | | | | | |
| Series 2005-1 B1 5.565% 3/25/35 | | | 1,562,214 | | 1,066,677 |
27
Statements of net assets
Delaware Corporate Bond Fund
| | | Principal amount° | | Value (U.S. $) |
| Non-Agency Collateralized Mortgage Obligations (continued) | | |
| ·Wells Fargo Mortgage-Backed Securities Trust | | | | |
| Series 2006-AR6 7A1 5.111% 3/25/36 | USD | 3,053,232 | | $ 2,581,617 |
| Series 2006-AR12 1A2 6.025% 9/25/36 | | 787,646 | | 662,271 |
| Series 2006-AR14 2A4 6.085% 10/25/36 | | 899,040 | | 645,206 |
| Total Non-Agency Collateralized Mortgage | | | | |
| Obligations (cost $8,926,596) | | | | 6,164,028 |
| |
| Regional Agency – 0.28% | | | | |
| Australia | | | | |
| Queensland Treasury 6.00% 10/14/15 | AUD | 1,756,000 | | 1,580,614 |
| Total Regional Agency (cost $1,327,363) | | | | 1,580,614 |
| |
| «Senior Secured Loans – 1.44% | | | | |
| Bausch & Lomb | | | | |
| Parent Term Loan 6.051% 4/11/15 | USD | 1,110,884 | | 1,082,489 |
| Term DD 6.051% 4/11/15 | | 279,116 | | 271,982 |
| Ford Motor Term B 5.46% 11/29/13 | | 1,605,177 | | 1,269,655 |
| Lyondell Chemical Term U2 7.00% 12/30/15 | | 1,310,212 | | 1,094,027 |
| MetroPCS Wireless Term B 5.096% 2/20/14 | | 1,587,879 | | 1,516,433 |
| PTS Acquisition Term B 5.051% 4/10/14 | | 1,587,970 | | 1,399,398 |
| Texas Competitive Electric Holdings Term B2 | | | | |
| 6.199% 10/10/14 | | 1,595,980 | | 1,503,142 |
| Total Senior Secured Loans (cost $8,723,483) | | | | 8,137,126 |
| |
| Sovereign Debt – 1.90%D | | | | |
| Argentina – 0.09% | | | | |
| Republic of Argentina 8.28% 12/31/33 | | 629,998 | | 489,823 |
| | | | | 489,823 |
| Germany – 0.82% | | | | |
| Bundesobligation 4.25% 10/12/12 | EUR | 2,954,700 | | 4,601,237 |
| | | | | 4,601,237 |
| Indonesia – 0.29% | | | | |
| Republic of Indonesia | | | | |
| 8.50% 10/12/35 | USD | 310,000 | | 330,850 |
| 11.00% 12/15/12 | IDR | 11,748,000,000 | | 1,272,679 |
| | | | | 1,603,529 |
28
| | | | Principal amount° | | Value (U.S. $) |
| Sovereign Debt (continued) | | | | | |
| Mexico – 0.10% | | | | | |
| Mexican Bonos 8.00% 12/17/15 | MXN | | 6,109,000 | | $ 578,727 |
| | | | | | 578,727 |
| Philippines – 0.08% | | | | | |
| *Philippines Government 6.375% 1/15/32 | USD | | 490,000 | | 475,913 |
| | | | | | 475,913 |
| United Kingdom – 0.52% | | | | | |
| U.K. Treasury 8.00% 9/27/13 | GBP | | 1,296,000 | | 2,938,778 |
| | | | | | 2,938,778 |
| Total Sovereign Debt (cost $10,667,219) | | | | | 10,688,007 |
| |
| Supranational Banks – 0.75% | | | | | |
| European Investment Bank | | | | | |
| 11.25% 2/14/13 | BRL | | 1,600,000 | | 1,012,737 |
| Inter-American Development Bank | | | | | |
| 5.75% 6/15/11 | AUD | | 1,574,000 | | 1,433,449 |
| International Bank for Reconstruction & | | | | | |
| Development 7.50% 7/30/14 | NZD | | 2,390,000 | | 1,811,043 |
| Total Supranational Banks (cost $4,113,903) | | | | | 4,257,229 |
| |
| U.S. Treasury Obligation – 0.95% | | | | | |
| *U.S. Treasury Notes 3.875% 5/15/18 | USD | | 5,380,000 | | 5,335,448 |
| Total U.S. Treasury Obligation (cost $5,291,123) | | | | 5,335,448 |
| |
| | | | Number of shares | | |
| Common Stock – 0.00% | | | | | |
| *Masco | | | 281 | | 4,633 |
| *†UAL | | | 50 | | 416 |
| Total Common Stock (cost $2,229) | | | | | 5,049 |
| |
| ·Preferred Stock – 2.02% | | | | | |
| Bank of America 8.00% | | | 2,455,000 | | 2,268,368 |
| JPMorgan Chase 7.90% | | | 5,555,000 | | 5,153,573 |
| PNC Fiinancial Services Group 8.25% | | | 4,100,000 | | 3,956,500 |
| Total Preferred Stock (cost $12,007,314) | | | | | 11,378,441 |
29
Statements of net assets
Delaware Corporate Bond Fund
| | | | Number of shares | | Value (U.S. $) | |
| Warrants – 0.00% | | | | | | |
| †#Solutia144A, exercise price $7.59, | | | | | | |
| expiration date 7/15/09 | | | 1,590 | | $ 0 | |
| Total Warrant (cost $135,295) | | | | | 0 | |
| | |
| | | | Principal amount° | | |
| Repurchase Agreements** – 0.17% | | | | | | |
| Bank of America 2.04%, dated 7/31/08, | | | | | | |
| to be repurchased on 8/1/08, repurchase | | | | | |
| price $275,047 (collateralized by | | | | | | |
| U.S. Government obligations, | | | | | | |
| 4.00% 9/30/09; with market | | | | | | |
| value $280,909) | USD | | 275,000 | | 275,000 | |
| | |
| BNP Paribas 2.06%, dated 7/31/08, | | | | | | |
| to be repurchased on 8/1/08, repurchase | | | | | |
| price $694,119 (collateralized by U.S. | | | | | | |
| Government obligations, 4.00%; | | | | | | |
| 7/30/09 - 9/30/09; with market | | | | | | |
| value $708,744) | | | 694,000 | | 694,000 | |
| Total Repurchase Agreements (cost $969,000) | | | | 969,000 | |
| | |
| Total Value of Securities Before Securities | | | | | | |
| Lending Collateral – 97.30% (cost $575,598,501) | | | | 548,360,747 | |
| | |
| | | | Number of shares | | | |
| Securities Lending Collateral*** – 3.81% | | | | | | |
| Investment Companies | | | | | | |
| Mellon GSL DBT II Collateral Fund | | | 21,451,942 | | 21,451,942 | |
| Total Securities Lending Collateral (cost $21,451,942) | | | | 21,451,942 | |
| | |
| Total Value of Securities – 101.11% | | | | | | |
| (cost $597,050,443) | | | | 569,812,689 | © |
| Obligation to Return Securities | | | | | | |
| Lending Collateral*** – (3.81%) | | | | | (21,451,942 | ) |
| Receivables Net of Liabilities and | | | | | | |
| Other Assets – 2.70% | | | | | 15,204,462 | |
30
| |
| Net Assets Applicable to 107,595,835 | | |
| Shares Outstanding – 100.00% | $563,565,209 | |
| Net Asset Value – Delaware Corporate Bond Fund | | |
| Class A ($268,658,954 / 51,284,346 Shares) | | $5.24 | |
| Net Asset Value – Delaware Corporate Bond Fund | | |
| Class B ($15,524,910 / 2,965,737 Shares) | | $5.23 | |
| Net Asset Value – Delaware Corporate Bond Fund | | |
| Class C ($62,211,064 / 11,871,670 Shares) | | $5.24 | |
| Net Asset Value – Delaware Corporate Bond Fund | | |
| Class R ($11,972,858 / 2,284,357 Shares) | | $5.24 | |
| Net Asset Value – Delaware Corporate Bond Fund | | |
| Institutional Class ($205,197,423 / 39,189,725 Shares) | | $5.24 | |
| | |
| Components of Net Assets at July 31, 2008: | | |
| Shares of beneficial interest | | |
| (unlimited authorization - no par) | $612,027,121 | |
| Distribution in excess of net investment income | (2,034,617 | ) |
| Accumulated net realized loss on investments | (20,399,706 | ) |
| Net unrealized depreciation of investments | | |
| and foreign currencies | (26,027,589 | ) |
| Total net assets | $563,565,209 | |
° Principal amount shown is stated in the currency in which each security is denominated.
AUD – Australian Dollar
BRL – Brazilian Real
EUR – European Monetary Unit
GBP – British Pound Sterling
JPY– Japanese Yen
IDR – Indonesia Rupiah
MXN – Mexican Peso
NOK – Norwegian Kroner
NZD – New Zealand Dollar
RUB – Russian Ruble
USD – United States Dollar
31
Statements of net assets
Delaware Corporate Bond Fund
| | |
| ¥ | Fully or partially pledged as collateral for financial futures contracts. |
| |
| · | Variable rate security. The rate shown is the rate as of July 31, 2008. |
| |
| W | Step coupon bond. Indicates security that has a zero coupon that remains in effect until a predetermined date at which time the stated interest rate becomes effective. |
| |
| = | Security is being fair valued in accordance with the Fund’s fair valuation policy. At July 31, 2008, the aggregate amount of fair valued securities was $228,969, which represented 0.04% of the Fund’s net assets. See Note 1 in “Notes to financial statements.” |
| |
| @ | Illiquid security. At July 31, 2008, the aggregate amount of illiquid securities was $8,139,116 which represented 1.44% of the Fund’s net assets. See Note 13 in “Notes to financial statements.” |
| |
| # | Security exempt from registration under Rule 144A of the Securities Act of 1933, as amended. At July 31, 2008, the aggregate amount of Rule 144A securities was $97,329,052 which represented 17.27% of the Fund’s net assets. See Note 13 in “Notes to financial statements.” |
| |
| w | Pass Through Agreement. Security represents the contractual right to receive a proportionate amount of underlying payments due to the counterparty pursuant to various agreements related to the rescheduling of obligations and the exchange of certain notes. |
| |
| † | Non income producing security. |
| |
| « | Senior Secured Loans generally pay interest at rates which are periodically redetermined by reference to a base lending rate plus a premium. These base lending rates are generally: (i) the prime rate offered by one or more United States banks, (ii) the lending rate offered by one or more European banks such as the London Inter-Bank Offered Rate (LIBOR), and (iii) the certificate of deposit rate. Senior Secured Loans may be subject to restrictions on resale. |
| |
| D | Securities have been classified by country of origin. |
| |
| * | Fully or partially on loan. |
| |
| ** | See Note 1 in “Notes to financial statements.” |
| |
| *** | See Note 12 in “Notes to financial statements.” |
| |
| © | Includes $21,137,446 of securities loaned. |
32
| | |
| Õ | Restricted Security. These investments are in securities not registered under the Securities Act of 1933, as amended, and have certain restrictions on resale which may limit their liquidity. At July 31, 2008, the aggregate amount of the restricted securities was $4,749,541 or 0.84% of the Fund’s net assets. Further details on these holdings appear below and in Note 13 in “Notes to financial statements.” |
| | Date of | | | | |
| Investment | | Acquisition | | Cost | | Value |
| First Horizon Alternative Mortgage Securities | | | | | |
| Series 2006-FA2 B1 5.978% 5/25/36 | 8/2/06 | | $ 1,860,281 | | $ 427,530 |
| MASTR Adjustable Rate Mortgages Trust | | | | | |
| Series 2005-1 B1 5.565% 3/25/35 | 11/28/06 | | 1,548,117 | | 1,066,677 |
| Montpelier Re Holdings 6.125% 8/15/13 | 11/9/05 | | 979,119 | | 1,012,733 |
| Popular North America 3.191% 4/6/09 | 4/3/06 | | 845,000 | | 828,722 |
| Popular North America Capital Trust I 6.564% 9/15/34 | 9/19/04 | | 1,549,083 | | 973,484 |
| Structured Asset Securities Series 2001-SB1 A2 | | | | | |
| 3.375% 8/25/31 | 12/7/04 | | 504,707 | | 440,395 |
| Total | | | | | $ 4,749,541 |
Summary of Abbreviations:
CBO — Collateralized Bond Obligation
CDS — Credit Default Swap
GNMA — Government National Mortgage Association
MASTR — Mortgage Asset Securitization Transactions, Inc.
MBIA — Insured by the Municipal Bond Insurance Association
RSB — Rate Stabilization Bond
REMIC — Real Estate Mortgage Investment Conduit
yr — year
| Net Asset Value and Offering Price Per Share – | |
| Delaware Corporate Bond Fund | |
| Net asset value Class A (A) | $5.24 |
| Sales charge (4.50% of offering price) (B) | 0.25 |
| Offering price | $5.49 |
| (A) | | Net asset value per share, as illustrated, is the amount which would be paid upon redemption or repurchase of shares. |
| |
| (B) | | See the current prospectus for purchases of $100,000 or more. |
33
Statements of net assets
Delaware Corporate Bond Fund
The following foreign currency exchange contracts, financial futures contracts, and swap contracts were outstanding at July 31, 2008:
Foreign Currency Exchange Contracts1
| | | | | | | | | | | Unrealized |
| Contracts to | | | | | | | | Appreciation |
| Receive (Deliver) | | | In Exchange For | | Settlement Date | | (Depreciation) |
| AUD | (2,349,147 | ) | | USD | 2,271,460 | | | 9/30/08 | | | $77,978 | |
| EUR | (2,952,049 | ) | | USD | 4,613,786 | | | 9/30/08 | | | 25,225 | |
| GBP | (1,371,635 | ) | | USD | 2,730,924 | | | 9/30/08 | | | 25,120 | |
| JPY | 554,509,834 | | | USD | (5,193,523 | ) | | 8/29/08 | | | (45,002 | ) |
| MXN | 274,800 | | | USD | (26,782 | ) | | 9/30/08 | | | 337 | |
| NOK | 3,624,717 | | | USD | (702,192 | ) | | 9/30/08 | | | 751 | |
| RUB | 18,603,144 | | | USD | (800,221 | ) | | 8/29/08 | | | (7,276 | ) |
| | | | | | | | | | | | $77,133 | |
Financial Futures Contracts2
| | | | | | | | | | | Unrealized |
| | | Notional Cost | | | | | | | Appreciation |
| Contracts to Buy (Sell) | | | (Proceeds) | | Notional Value | | Expiration Date | | (Depreciation) |
| 15 Long Gilt Bond | | $ 3,153,947 | | | $ 3,191,974 | | | 9/30/08 | | $ 38,027 | |
| 100 U.S. Treasury 5 yr Notes | | 11,092,421 | | | 11,133,594 | | | 9/30/08 | | 41,173 | |
| (363) U.S. Treasury 10 yr Notes | | (41,874,807 | ) | | (41,682,609 | ) | | 9/30/08 | | 192,198 | |
| 305 U.S. Treasury Long Bond | | 35,718,902 | | | 35,227,500 | | | 9/30/08 | | (491,402 | ) |
| | | | | | | | | | | $(220,004 | ) |
34
| |
| Swap Contracts3 |
| Credit Default Swap Contracts |
| | | | | Annual | | | | Unrealized |
| Swap Counterparty & | | | | Protection | | | | Appreciation |
| Referenced Obligation | | | Notional Value | | Payments | | Termination Date | | (Depreciation) |
| Protection Purchased: | | | | | | | | | |
| Citigroup Global Markets | | | | | | | | | |
| CenturyTel 5 yr CDS | | $1,615,000 | | 1.71% | | 9/20/13 | | $ (5,281 | ) |
| Goldman Sachs | | | | | | | | | |
| Kraft Foods 10 yr CDS | | 2,600,000 | | 0.77% | | 12/20/17 | | 26,445 | |
| JPMorgan Chase Bank | | | | | | | | | |
| Embarq 7 yr CDS | | 2,125,000 | | 0.77% | | 9/20/14 | | 185,814 | |
| Lehman Brothers | | | | | | | | | |
| Gannett 6 yr CDS | | 400,000 | | 3.15% | | 9/20/14 | | (115 | ) |
| Gannett 7 yr CDS | | 1,430,000 | | 0.88% | | 9/20/14 | | 153,942 | |
| Home Depot 5 yr CDS | | 2,114,500 | | 0.50% | | 9/20/12 | | 64,455 | |
| New York Times 7 yr CDS | | 1,430,000 | | 0.75% | | 9/20/14 | | 190,882 | |
| Sara Lee 7 yr CDS | | 1,430,000 | | 0.60% | | 9/20/14 | | 7,119 | |
| Target 5 yr CDS | | 1,970,000 | | 0.57% | | 12/20/12 | | 3,556 | |
| Washington Mutual | | | | | | | | | |
| 4 yr CDS | | 2,071,000 | | 0.85% | | 9/20/11 | | 515,285 | |
| 10 yr CDS | | 1,190,000 | | 3.15% | | 12/20/17 | | 252,469 | |
| | | | | | | | | $1,394,571 | |
| Protection Sold: | | | | | | | | | |
| Citigroup Global Markets | | | | | | | | | |
| Plains American CDS | | $1,395,000 | | 1.33% | | 9/20/13 | | $ 6,690 | |
| Total | | | | | | | | $1,401,261 | |
The use of foreign currency exchange contracts, financial futures contracts and swap contracts involves elements of market risk and risks in excess of the amounts recognized in the financial statements. The notional values presented above represent the Fund’s total exposure in such contracts, whereas only the net unrealized appreciation (depreciation) is reflected in the Fund’s net assets.
1See Note 8 in “Notes to financial statements.”
2See Note 9 in “Notes to financial statements.”
3See Note 11 in “Notes to financial statements.”
See accompanying notes
35
| Statements of net assets | |
| Delaware Extended Duration Bond Fund | July 31, 2008 |
| | | | Principal amount° | | Value (U.S. $) |
| Agency Collateralized Mortgage Obligations – 1.83% | | | | |
| Freddie Mac Reference REMIC | | | | | |
| Series R002 ZA 5.50% 6/15/35 | USD | | 660,211 | | $ 590,417 |
| ¥Series R008 ZA 6.00% 7/15/36 | | | 3,082,782 | | 2,852,801 |
| Freddie Mac REMIC | | | | | |
| Series 3344 ME 5.50% 7/15/37 | | | 665,000 | | 628,973 |
| Total Agency Collateralized Mortgage | | | | | |
| Obligations (cost $4,166,118) | | | | | 4,072,191 |
| |
| Commercial Mortgage-Backed Securities – 2.30% | | | | |
| ·Bank of America Commercial Mortgage | | | | | |
| Series 2004-3 A5 5.316% 6/10/39 | | | 665,000 | | 659,472 |
| Series 2005-6 AM 5.181% 9/10/47 | | | 315,000 | | 289,006 |
| Series 2007-3 A4 5.658% 6/10/49 | | | 545,000 | | 503,478 |
| Bear Stearns Commercial Mortgage Securities | | | | |
| #Series 2004-ESA E 144A 5.064% 5/14/16 | | 260,000 | | 263,442 |
| ·Series 2007-T28 A4 5.742% 9/11/42 | | | 740,000 | | 682,893 |
| ·#Credit Suisse First Boston Mortgage Securities | | | | |
| Series 2001-SPGA A2 144A 6.515% 8/13/18 | | 610,000 | | 625,436 |
| JPMorgan Chase Commercial Mortgage Securities | | | | |
| Series 2006-LDP9 A2 5.134% 5/15/47 | | | 750,000 | | 686,244 |
| #Merrill Lynch Mortgage Investors | | | | | |
| Series 1998-C3 G 144A 6.00% 12/15/30 | | | 500,000 | | 287,987 |
| Merrill Lynch Mortgage Trust | | | | | |
| #Series 2002-MW1 J 144A 5.695% 7/12/34 | | 110,000 | | 79,919 |
| Series 2005-CIP1 A2 4.96% 7/12/38 | | | 50,000 | | 49,707 |
| ·Morgan Stanley Capital I | | | | | |
| #Series 1999-FNV1 G 144A 6.12% 3/15/31 | | 155,000 | | 152,499 |
| Series 2007-T27 A4 5.65% 6/11/42 | | | 715,000 | | 662,077 |
| #Tower Series 2004-2A A 144A | | | | | |
| 4.232% 12/15/14 | | | 195,000 | | 192,024 |
| Total Commercial Mortgage-Backed | | | | | |
| Securities (cost $5,540,553) | | | | | 5,134,184 |
| |
| Corporate Bonds – 84.10% | | | | | |
| Banking – 11.92% | | | | | |
| Bank of America | | | | | |
| 5.65% 5/1/18 | | | 3,105,000 | | 2,903,662 |
| BB&T Capital Trust I 5.85% 8/18/35 | | | 1,300,000 | | 944,654 |
36
| | | | Principal amount° | | Value (U.S. $) |
| Corporate Bonds (continued) | | | | | |
| Banking (continued) | | | | | |
| BB&T Capital Trust II 6.75% 6/7/36 | USD | | 2,903,000 | | $ 2,355,724 |
| #CoBank ACB 144A 7.875% 4/16/18 | | | 935,000 | | 911,840 |
| JPMorgan Chase 6.40% 5/15/38 | | | 550,000 | | 508,550 |
| JPMorgan Chase Capital XXV 6.80% 10/1/37 | | | 3,855,000 | | 3,266,519 |
| Mellon Bank 5.45% 4/1/16 | | | 1,695,000 | | 1,653,854 |
| *PNC Bank 6.875% 4/1/18 | | | 4,065,000 | | 4,014,794 |
| Õ@Popular North America Capital Trust I | | | | | |
| 6.564% 9/15/34 | | | 708,000 | | 459,484 |
| Silicon Valley Bank | | | | | |
| 5.70% 6/1/12 | | | 1,150,000 | | 1,061,015 |
| 6.05% 6/1/17 | | | 805,000 | | 687,977 |
| ·USB Capital IX 6.189% 4/15/49 | | | 2,925,000 | | 2,048,650 |
| Washington Mutual 5.25% 9/15/17 | | | 530,000 | | 334,436 |
| Wells Fargo 5.625% 12/11/17 | | | 3,350,000 | | 3,198,459 |
| ·Wells Fargo Capital XIII 7.70% 12/29/49 | | | 2,335,000 | | 2,214,465 |
| | | | | | 26,564,083 |
| Basic Industry – 6.95% | | | | | |
| #ArcelorMittal 144A 6.125% 6/1/18 | | | 3,650,000 | | 3,511,457 |
| du Pont (EI) deNemours 6.00% 7/15/18 | | | 3,085,000 | | 3,127,681 |
| *#Evraz Group 144A 9.50% 4/24/18 | | | 667,000 | | 646,190 |
| Freeport McMoRan Copper & Gold | | | | | |
| 8.25% 4/1/15 | | | 625,000 | | 652,394 |
| 8.375% 4/1/17 | | | 800,000 | | 839,292 |
| Georgia-Pacific 9.50% 12/1/11 | | | 250,000 | | 253,125 |
| #GTL Trade Finance 144A 7.25% 10/20/17 | | | 540,000 | | 538,627 |
| #Nine Dragons Paper Holdings 144A | | | | | |
| 7.875% 4/29/13 | | | 530,000 | | 520,254 |
| #Norske Skogindustrier 144A 7.125% 10/15/33 | | | 1,055,000 | | 627,725 |
| Rio Tinto Finance USA 6.50% 7/15/18 | | | 2,600,000 | | 2,611,952 |
| #Sappi Papier Holding 144A 6.75% 6/15/12 | | | 1,320,000 | | 1,191,417 |
| #Severstal 144A 9.75% 7/29/13 | | | 553,000 | | 556,042 |
| #Steel Dynamics 144A 7.75% 4/15/16 | | | 420,000 | | 415,800 |
| | | | | | 15,491,956 |
| Brokerage – 3.53% | | | | | |
| Goldman Sachs Group | | | | | |
| 6.15% 4/1/18 | | | 1,540,000 | | 1,486,135 |
| 6.75% 10/1/37 | | | 3,284,000 | | 2,911,109 |
| Jefferies Group 6.45% 6/8/27 | | | 1,185,000 | | 918,734 |
37
Statements of net assets
Delaware Extended Duration Bond Fund
| | | | Principal amount° | | Value (U.S. $) |
| Corporate Bonds (continued) | | | | | |
| Brokerage (continued) | | | | | |
| Lazard Group 6.85% 6/15/17 | USD | | 565,000 | | $ 493,213 |
| Lehman Brothers Holdings | | | | | |
| 6.50% 7/19/17 | | | 580,000 | | 524,381 |
| 6.875% 7/17/37 | | | 1,865,000 | | 1,549,853 |
| | | | | | 7,883,425 |
| Capital Goods – 0.22% | | | | | |
| *NXP BV Funding 9.50% 10/15/15 | | | 715,000 | | 496,925 |
| | | | | | 496,925 |
| Communications – 12.64% | | | | | |
| AT&T 6.40% 5/15/38 | | | 5,000,000 | | 4,775,379 |
| #Charter Communications Operating 144A | | | | | |
| 10.875% 9/15/14 | | | 405,000 | | 423,225 |
| Comcast | | | | | |
| 6.40% 5/15/38 | | | 1,815,000 | | 1,655,930 |
| 6.95% 8/15/37 | | | 1,767,000 | | 1,707,010 |
| #DirecTV Holdings 144A 7.625% 5/15/16 | | | 525,000 | | 523,688 |
| WInmarsat Finance 10.375% 11/15/12 | | | 700,000 | | 707,000 |
| News America 6.40% 12/15/35 | | | 850,000 | | 789,960 |
| Nortel Networks | | | | | |
| ·7.041% 7/15/11 | | | 320,000 | | 303,200 |
| 10.75% 7/15/16 | | | 290,000 | | 285,650 |
| Qwest 7.50% 10/1/14 | | | 625,000 | | 576,563 |
| Rogers Communications 7.50% 8/15/38 | | | 2,085,000 | | 2,099,616 |
| Sprint Capital 8.375% 3/15/12 | | | 675,000 | | 663,695 |
| Telecom Italia Capital 7.721% 6/4/38 | | | 2,970,000 | | 2,932,008 |
| Thomson Reuters 6.50% 7/15/18 | | | 1,765,000 | | 1,770,546 |
| Time Warner Cable 7.30% 7/1/38 | | | 1,310,000 | | 1,313,681 |
| Verizon Communications | | | | | |
| 5.55% 2/15/16 | | | 1,000,000 | | 973,864 |
| 6.90% 4/15/38 | | | 1,400,000 | | 1,392,625 |
| #Vimpelcom 144A 9.125% 4/30/18 | | | 1,120,000 | | 1,097,141 |
| #Vivendi 144A 6.625% 4/4/18 | | | 3,970,000 | | 3,878,154 |
| Windstream 8.125% 8/1/13 | | | 305,000 | | 309,575 |
| | | | | | 28,178,510 |
| Consumer Cyclical – 6.19% | | | | | |
| CVS Caremark | | | | | |
| 5.75% 6/1/17 | | | 1,000,000 | | 979,290 |
| 6.25% 6/1/27 | | | 1,800,000 | | 1,740,915 |
| Disney (Walt) 7.55% 7/15/93 | | | 1,920,000 | | 2,131,526 |
38
| | | | Principal amount° | | Value (U.S. $) |
| Corporate Bonds (continued) | | | | | |
| Consumer Cyclical (continued) | | | | | |
| #Galaxy Entertainment Finance 144A | | | | | |
| 9.875% 12/15/12 | USD | | 325,000 | | $ 315,250 |
| General Motors | | | | | |
| 6.85% 10/15/08 | | | 945,000 | | 930,825 |
| *8.375% 7/15/33 | | | 290,000 | | 144,275 |
| GMAC 6.875% 8/28/12 | | | 805,000 | | 505,614 |
| Johnson Controls 6.00% 1/15/36 | | | 1,355,000 | | 1,192,886 |
| Lear 8.75% 12/1/16 | | | 300,000 | | 238,500 |
| McDonald’s 6.30% 3/1/38 | | | 2,400,000 | | 2,366,602 |
| *Neiman Marcus Group 10.375% 10/15/15 | | | 310,000 | | 305,350 |
| Tenneco 8.625% 11/15/14 | | | 200,000 | | 169,000 |
| VF 5.95% 11/1/17 | | | 925,000 | | 911,685 |
| Wal-Mart Stores 5.25% 9/1/35 | | | 2,175,000 | | 1,863,742 |
| | | | | | 13,795,460 |
| Consumer Non-Cyclical – 10.22% | | | | | |
| #AmBev International Finance 144A | | | | | |
| 9.50% 7/24/17 | BRL | | 1,500,000 | | 786,294 |
| AstraZeneca 6.45% 9/15/37 | USD | | 3,300,000 | | 3,387,265 |
| Covidien International Finance 6.55% 10/15/37 | | | 3,687,000 | | 3,592,550 |
| Delhaize America 9.00% 4/15/31 | | | 780,000 | | 898,494 |
| Diageo Capital 5.75% 10/23/17 | | | 1,410,000 | | 1,378,922 |
| #Dr Pepper Snapple Group 144A 6.82% 5/1/18 | | | 2,990,000 | | 3,011,752 |
| GlaxoSmithKline Capital 6.375% 5/15/38 | | | 3,230,000 | | 3,225,300 |
| HCA 9.25% 11/15/16 | | | 405,000 | | 418,163 |
| Kimberly-Clark 6.625% 8/1/37 | | | 1,250,000 | | 1,297,824 |
| Schering-Plough 6.55% 9/15/37 | | | 2,750,000 | | 2,619,364 |
| #Seminole Indian Tribe of Florida 144A | | | | | |
| 7.804% 10/1/20 | | | 425,000 | | 410,831 |
| Wyeth 5.95% 4/1/37 | | | 1,855,000 | | 1,760,955 |
| | | | | | 22,787,714 |
| Electric – 9.18% | | | | | |
| Columbus Southern Power 6.05% 5/1/18 | | | 3,260,000 | | 3,246,376 |
| Connecticut Light & Power | | | | | |
| 5.65% 5/1/18 | | | 915,000 | | 901,733 |
| 6.35% 6/1/36 | | | 2,320,000 | | 2,237,422 |
| Detroit Edison 5.60% 6/15/18 | | | 1,500,000 | | 1,484,679 |
| Dominion Resources 6.40% 6/15/18 | | | 1,595,000 | | 1,623,295 |
| Florida Power 6.40% 6/15/38 | | | 3,245,000 | | 3,274,541 |
| Illinois Power 6.125% 11/15/17 | | | 1,000,000 | | 953,590 |
39
Statements of net assets
Delaware Extended Duration Bond Fund
| | | | Principal amount° | | Value (U.S. $) |
| Corporate Bonds (continued) | | | | | |
| Electric (continued) | | | | | |
| #Ipalco Enterprises 144A 7.25% 4/1/16 | USD | | 135,000 | | $ 136,013 |
| NRG Energy 7.375% 2/1/16 | | | 280,000 | | 272,300 |
| PacifiCorp 5.75% 4/1/37 | | | 3,250,000 | | 2,953,776 |
| PECO Energy 5.35% 3/1/18 | | | 1,920,000 | | 1,882,491 |
| PSI Energy 8.85% 1/15/22 | | | 230,000 | | 277,811 |
| #TAQA Abu Dhabi National Energy 144A | | | | | |
| 7.25% 8/1/18 | | | 221,000 | | 225,063 |
| #Texas Competitive Electric Holdings 144A | | | | | |
| 10.25% 11/1/15 | | | 500,000 | | 502,500 |
| #West Penn Power 144A 5.95% 12/15/17 | | | 490,000 | | 486,286 |
| | | | | | 20,457,876 |
| Energy – 7.74% | | | | | |
| CenterPoint Energy Resources 6.00% 5/15/18 | | 1,300,000 | | 1,239,263 |
| ConocoPhillips 5.90% 5/15/38 | | | 890,000 | | 870,960 |
| Dynegy Holdings 7.75% 6/1/19 | | | 230,000 | | 212,750 |
| #Enbridge Energy Partners 144A 7.50% 4/15/38 | | 2,215,000 | | 2,281,536 |
| #MarkWest Energy Partners 144A 8.75% 4/15/18 | | 555,000 | | 555,000 |
| Nexen 6.40% 5/15/37 | | | 2,515,000 | | 2,337,327 |
| Petro-Canada 5.35% 7/15/33 | | | 2,465,000 | | 2,017,884 |
| Plains All American Pipeline 6.65% 1/15/37 | | | 1,120,000 | | 1,025,099 |
| SEACOR SMIT Holdings 7.20% 9/15/09 | | | 240,000 | | 245,660 |
| Suncor Energy | | | | | |
| 6.50% 6/15/38 | | | 815,000 | | 783,737 |
| 6.85% 6/1/39 | | | 1,425,000 | | 1,450,472 |
| #Transcontinental Gas Pipeline 144A | | | | | |
| 6.05% 6/15/18 | | | 1,305,000 | | 1,287,056 |
| Weatherford International | | | | | |
| 6.00% 3/15/18 | | | 740,000 | | 731,721 |
| 6.80% 6/15/37 | | | 1,820,000 | | 1,823,231 |
| 7.00% 3/15/38 | | | 400,000 | | 402,211 |
| | | | | | 17,263,907 |
| Finance Companies – 2.88% | | | | | |
| Capmark Financial Group 6.30% 5/10/17 | | | 435,000 | | 255,805 |
| FTI Consulting 7.75% 10/1/16 | | | 270,000 | | 277,425 |
| General Electric Capital 6.75% 3/15/32 | | | 4,000,000 | | 4,025,536 |
| ·#ILFC E-Capital Trust II 144A 6.25% 12/21/65 | | 1,045,000 | | 857,680 |
| International Lease Finance 6.625% 11/15/13 | | 800,000 | | 717,048 |
| #Nuveen Investments 144A 10.50% 11/15/15 | | 315,000 | | 285,075 |
| | | | | | 6,418,569 |
40
| | | | Principal amount° | | Value (U.S. $) |
| Corporate Bonds (continued) | | | | | |
| Insurance – 8.02% | | | | | |
| ·#American International Group 144A | | | | | |
| 8.175% 5/15/58 | USD | | 730,000 | | $ 655,706 |
| #Berkshire Hathaway Finance 144A | | | | | |
| 5.40% 5/15/18 | | | 3,835,000 | | 3,777,865 |
| ·Hartford Financial Services Group | | | | | |
| 8.125% 6/15/38 | | | 2,890,000 | | 2,779,868 |
| @#Max USA Holdings 144A 7.20% 4/14/17 | | | 870,000 | | 881,907 |
| ·#MetLife Capital Trust X 144A 9.25% 4/8/38 | | | 2,600,000 | | 2,644,309 |
| #Mutual of Omaha Insurance 144A | | | | | |
| 6.80% 6/15/36 | | | 1,290,000 | | 1,173,107 |
| Prudential Financial 6.625% 12/1/37 | | | 1,495,000 | | 1,392,986 |
| @w#Stingray Pass Through Trust 144A | | | | | |
| 5.902% 1/12/15 | | | 1,200,000 | | 180,000 |
| UnitedHealth Group 5.80% 3/15/36 | | | 1,800,000 | | 1,425,296 |
| Unitrin 6.00% 5/15/17 | | | 1,725,000 | | 1,432,454 |
| WellPoint 5.85% 1/15/36 | | | 845,000 | | 693,323 |
| ·#White Mountains Re Group 144A | | | | | |
| 7.506% 5/29/49 | | | 1,105,000 | | 844,086 |
| | | | | | 17,880,907 |
| Natural Gas – 1.85% | | | | | |
| Boston Gas 6.95% 12/1/23 | | | 200,000 | | 198,087 |
| Enterprise Products Operating | | | | | |
| 6.50% 1/31/19 | | | 670,000 | | 674,798 |
| *·8.375% 8/1/66 | | | 730,000 | | 714,239 |
| Kinder Morgan Energy Partners | | | | | |
| 6.95% 1/15/38 | | | 1,780,000 | | 1,761,196 |
| Valero Energy 6.625% 6/15/37 | | | 870,000 | | 775,395 |
| | | | | | 4,123,715 |
| Real Estate – 0.47% | | | | | |
| Regency Centers 5.875% 6/15/17 | | | 1,140,000 | | 1,052,013 |
| | | | | | 1,052,013 |
| Technology – 0.75% | | | | | |
| Oracle 5.75% 4/15/18 | | | 1,300,000 | | 1,299,382 |
| Sungard Data Systems | | | | | |
| 9.125% 8/15/13 | | | 275,000 | | 282,563 |
| 10.25% 8/15/15 | | | 86,000 | | 87,720 |
| | | | | | 1,669,665 |
41
Statements of net assets
Delaware Extended Duration Bond Fund
| | | Principal amount° | | Value (U.S. $) |
| Corporate Bonds (continued) | | | | | | |
| Transportation – 1.54% | | | | | | |
| Burlington North Santa Fe 6.15% 5/1/37 | USD | | 1,400,000 | | $ | 1,296,340 |
| #DP World 144A 6.85% 7/2/37 | | | 670,000 | | | 563,338 |
| Norfolk Southern | | | | | | |
| 5.75% 4/1/18 | | | 755,000 | | | 739,002 |
| 7.05% 5/1/37 | | | 790,000 | | | 826,918 |
| | | | | | | 3,425,598 |
| Total Corporate Bonds (cost $196,482,921) | | | | | | 187,490,323 |
| |
| Municipal Bonds – 1.10% | | | | | | |
| North Texas Tollway Authority Refunding (First Tier) | | | | | |
| 5.50% 1/1/18 | | | 150,000 | | | 159,863 |
| 6.00% 1/1/19 | | | 75,000 | | | 81,929 |
| 6.00% 1/1/20 | | | 370,000 | | | 399,810 |
| West Virginia Economic Development Authority | | | | | |
| Excess Lottery Revenue 5.37% 7/1/20 (MBIA) | | 60,000 | | | 56,767 |
| West Virginia Tobacco Settlement | | | | | | |
| Finance Authority Asset-Backed | | | | | | |
| Series A 7.467% 6/1/47 | | | 1,975,000 | | | 1,757,572 |
| Total Municipal Bonds (cost $2,670,877) | | | | | | 2,455,941 |
| |
| Non-Agency Asset-Backed Securities – 1.76% | | | | | | |
| Capital One Multi-Asset Execution Trust | | | | | | |
| Series 2007-A7 A7 5.75% 7/15/20 | | | 550,000 | | | 523,756 |
| Citibank Credit Card Issuance Trust | | | | | | |
| Series 2007-A3 A3 6.15% 6/15/39 | | | 1,505,000 | | | 1,460,055 |
| CNH Equipment Trust | | | | | | |
| Series 2008-A A3 4.12% 5/15/12 | | | 200,000 | | | 200,055 |
| Discover Card Master Trust Execution Note | | | | | | |
| �� Series 2007-A1 A1 5.65% 3/16/20 | | | 960,000 | | | 895,850 |
| #Dunkin Securitization | | | | | | |
| Series 2006-1 A2 144A 5.779% 6/20/31 | | | 190,000 | | | 154,751 |
| Mid-State Trust | | | | | | |
| Series 11 A1 4.864% 7/15/38 | | | 51,863 | | | 47,184 |
| Series 2005-1 A 5.745% 1/15/40 | | | 131,294 | | | 119,108 |
| RSB Bondco Series 2007-A A2 5.72% 4/1/18 | | 510,000 | | | 514,769 |
| Total Non-Agency Asset-Backed Securities | | | | | | |
| (cost $4,093,741) | | | | | | 3,915,528 |
42
| | | | Principal amount° | | Value (U.S. $) |
| «Senior Secured Loans – 1.61% | | | | | | |
| Bausch & Lomb | | | | | | |
| Parent Term Loan 6.051% 4/11/15 | USD | | 487,510 | | $ | 475,049 |
| Term DD 6.051% 4/11/15 | | | 122,490 | | | 119,359 |
| Ford Motor Term B 5.46% 11/29/13 | | | 730,267 | | | 577,623 |
| Lyondell Chemical Term U2 7.00% 12/30/15 | | | 558,600 | | | 466,431 |
| MetroPCS Wireless Term B 5.096% 2/20/14 | | | 694,697 | | | 663,439 |
| PTS Acquisition Term B 5.051% 4/10/14 | | | 694,737 | | | 612,237 |
| Texas Competitive Electric Holdings Term B2 | | | | | | |
| 6.199% 10/10/14 | | | 723,178 | | | 681,111 |
| Total Senior Secured Loans (cost $3,859,480) | | | | | | 3,595,249 |
| |
| Sovereign Debt – 0.61%D | | | | | | |
| Argentina – 0.09% | | | | | | |
| Republic of Argentina 8.28% 12/31/33 | | | 278,653 | | | 216,653 |
| | | | | | | 216,653 |
| Indonesia – 0.32% | | | | | | |
| Republic of Indonesia | | | | | | |
| 8.50% 10/12/35 | | | 120,000 | | | 128,071 |
| 11.00% 12/15/12 | IDR | | 5,393,000,000 | | | 584,232 |
| | | | | | | 712,303 |
| Mexico – 0.11% | | | | | | |
| Mexican Bonos 8.00% 12/17/15 | MXN | | 2,604,000 | | | 246,686 |
| | | | | | | 246,686 |
| Philippines – 0.09% | | | | | | |
| *Philippines Government 6.375% 1/15/32 | USD | | 200,000 | | | 194,250 |
| | | | | | | 194,250 |
| Total Sovereign Debt (cost $1,427,388) | | | | | | 1,369,892 |
| |
| Supranational Bank – 0.20% | | | | | | |
| European Investment Bank 11.25% 2/14/13 | BRL | | 700,000 | | | 443,072 |
| Total Supranational Bank (cost $389,180) | | | | | | 443,072 |
| |
| U.S. Treasury Obligation – 0.65% | | | | | | |
| *^U.S. Treasury Strip Principal 4.654% 5/15/37 | USD | | 5,500,000 | | | 1,447,936 |
| Total U.S. Treasury Obligation | | | | | | |
| (cost $1,450,515) | | | | | | 1,447,936 |
43
Statements of net assets
Delaware Extended Duration Bond Fund
| | Number of shares | | Value (U.S. $) | |
| · Preferred Stock – 2.19% | | | | | |
| Bank of America 8.00% | 1,080,000 | | $ | 997,897 | |
| JPMorgan Chase 7.90% | 2,510,000 | | | 2,328,617 | |
| PNC Financial Services Group 8.25% | 1,615,000 | | | 1,558,475 | |
| Total Preferred Stock (cost $5,162,984) | | | | 4,884,989 | |
| |
| Warrant – 0.00% | | | | | |
| †#Solutia144A, exercise price $7.59, | | | | | |
| expiration date 7/15/09 | 550 | | | 0 | |
| Total Warrant (cost $46,787) | | | | 0 | |
| |
| Total Value of Securities Before Securities | | | | | |
| Lending Collateral – 96.35% (cost $225,290,544) | | | | 214,809,305 | |
| |
| Securities Lending Collateral** – 3.04% | | | | | |
| Investment Companies | | | | | |
| Mellon GSL DBT II Collateral Fund | 6,769,658 | | | 6,769,658 | |
| Total Securities Lending Collateral | | | | | |
| (cost $6,769,658) | | | | 6,769,658 | |
| |
| Total Value of Securities – 99.39% | | | | | |
| (cost $232,060,202) | | | | 221,578,963 | © |
| Obligation to Return Securities | | | | | |
| Lending Collateral** – (3.04%) | | | | (6,769,658 | ) |
| Receivables and Other Assets | | | | | |
| Net of Liabilities – 3.65% | | | | 8,127,333 | |
| Net Assets Applicable to 42,803,548 | | | | | |
| Shares Outstanding – 100.00% | | | $ | 222,936,638 | |
44
| | | |
| Net Asset Value – Delaware Extended Duration Bond Fund | | |
| Class A ($163,371,501 / 31,357,909 Shares) | | $5.21 | |
| Net Asset Value – Delaware Extended Duration Bond Fund | | |
| Class B ($4,718,176 / 907,123 Shares) | | $5.20 | |
| Net Asset Value – Delaware Extended Duration Bond Fund | | |
| Class C ($17,975,725 / 3,451,366 Shares) | | $5.21 | |
| Net Asset Value – Delaware Extended Duration Bond Fund | | |
| Class R ($377,132 / 72,335 Shares) | | $5.21 | |
| Net Asset Value – Delaware Extended Duration Bond Fund | | |
| Institutional Class ($36,494,104 / 7,014,815 Shares) | | $5.20 | |
| |
| Components of Net Assets at July 31, 2008: | | |
| Shares of beneficial interest (unlimited authorization – no par) | $246,898,511 | |
| Undistributed net investment income | 581,993 | |
| Accumulated net realized loss on investments | (14,863,214 | ) |
| Net unrealized depreciation of investments | | |
| and foreign currencies | (9,680,652 | ) |
| Total net assets | $222,936,638 | |
° Principal amount shown is stated in the currency in which each security is denominated.
AUD — Australian Dollar
BRL — Brazilian Real
GBP — British Pound Sterling
IDR — Indonesia Rupiah
JPY — Japanese Yen
MXN — Mexican Peso
NOK — Norwegian Kroner
RUB — Russian Ruble
USD — United States Dollar
45
Statements of net assets
Delaware Extended Duration Bond Fund
| | |
| ¥ | Fully or partially pledged as collateral for financial futures contracts. |
| | |
| · | Variable rate security. The rate shown is the rate as of July 31, 2008. |
| | |
| # | Security exempt from registration under Rule 144A of the Securities Act of 1933, as amended. At July 31, 2008, the aggregate amount of Rule 144A securities was $38,458,272, which represented 17.25% of the Fund’s net assets. See Note 13 in “Notes to financial statements.” |
| | |
| @ | Illiquid security. At July 31, 2008, the aggregate amount of illiquid securities was $1,521,391, which represented 0.68% of the Fund’s net assets. See Note 13 in “Notes to financial statements.” |
| | |
| W | Step coupon bond. Indicates security that has a zero coupon that remains in effect until a predetermined date at which time the stated interest rate becomes effective. |
| | |
| w | Pass Through Agreement. Security represents the contractual right to receive a proportionate amount of underlying payments due to the counterparty pursuant to various agreements related to the rescheduling of obligations and the exchange of certain notes. |
| | |
| ^ | Zero coupon security. The rate shown is the yield at the time of purchase. |
| | |
| † | Non income producing security. |
| | |
| « | Senior Secured Loans generally pay interest at rates which are periodically redetermined by reference to a base lending rate plus a premium. These base lending rates are generally: (i) the prime rate offered by one or more United States banks, (ii) the lending rate offered by one or more European banks such as the London Inter-Bank Offered Rate (LIBOR), and (iii) the certificate of deposit rate. Senior Secured Loans may be subject to restrictions on resale. |
| | |
| D | Securities have been classified by country of origin. |
| | |
| * | Fully or partially on loan. |
| | |
| ** | See Note 12 in “Notes to financial statements.” |
| | |
| © | Includes $6,607,294 of securities loaned. |
| | |
| Õ | Restricted Security. This investment is in a security not registered under the Securities Act of 1933, as amended, and has certain restrictions on resale which may limit its liquidity. At July 31, 2008, the amount of the restricted security was $459,484 or 0.21% of the Fund’s net assets. Further details on this holding appear below and in Note 13 in “Notes to financial statements.” |
| | Date of | | | | |
| Investment | | Acquisition | | Cost | | Value |
| Popular North America Capital Trust I 6.564% 9/15/34 | 10/4/06 | | $698,768 | | $459,484 |
46
| |
Summary of Abbreviations:
CDS — Credit Default Swap
MBIA — Insured by the Municipal Bond Insurance Association
RSB — Rate Stabilization Bond
REMIC — Real Estate Mortgage Investment Conduit
yr — year |
| Net Asset Value and Offering Price Per Share – | |
| Delaware Extended Duration Bond Fund | |
| Net asset value Class A (A) | $5.21 |
| Sales charge (4.50% of offering price) (B) | 0.25 |
| Offering price | $5.46 |
| (A) | | Net asset value per share, as illustrated, is the amount which would be paid upon redemption or repurchase of shares. |
| |
| (B) | | See the current prospectus for purchases of $100,000 or more. |
The following foreign currency exchange contracts, financial futures contracts, and swap contracts were outstanding at July 31, 2008:
Foreign Currency Exchange Contracts1
| | | | | | | | | | Unrealized |
| | | | | | | | | | Appreciation |
| Contracts to Receive | | In Exchange For | | Settlement Date | | (Depreciation) |
| AUD | 430,519 | | USD | (416,281 | ) | | 9/30/08 | | | $(14,290 | ) |
| GBP | 40,135 | | USD | (79,909 | ) | | 9/30/08 | | | (735 | ) |
| JPY | 275,349,418 | | USD | (2,578,915 | ) | | 8/29/08 | | | (22,347 | ) |
| MXN | 114,400 | | USD | (11,149 | ) | | 9/30/08 | | | 141 | |
| NOK | 2,330,425 | | USD | (451,458 | ) | | 9/30/08 | | | 482 | |
| RUB | 7,759,220 | | USD | (333,766 | ) | | 8/29/08 | | | (3,035 | ) |
| | | | | | | | | | | $(39,784 | ) |
Financial Futures Contracts2
| | | | | | | | | | | | | Unrealized |
| | | Notional Cost | | | | | | | | Appreciation |
| Contracts to Buy (Sell) | | | (Proceeds) | | Notional Value | | Expiration Date | | (Depreciation) |
| 6 Long Gilt Bond | | $ | 1,261,579 | | | $ | 1,276,790 | | | 9/30/08 | | $ | 15,211 |
| (225) U.S. Treasury 10 yr Notes | | | (25,997,646 | ) | | | (25,836,328 | ) | | 9/30/08 | | | 161,318 |
| 534 U.S. Treasury long Bond | | | 61,431,673 | | | | 61,677,000 | | | 9/30/08 | | | 245,327 |
| | | | | | | | | | | | | $ | 421,856 |
47
Statements of net assets
Delaware Extended Duration Bond Fund
| |
Swap Contracts3
Credit Default Swap Contracts |
| | | | | | Annual | | | | Unrealized |
| Swap Counterparty & | | | | | Protection | | | | Appreciation |
| Referenced Obligation | | Notional Value | | Payments | | Termination Date | | (Depreciation) |
| Protection Purchased: | | | | | | | | | | | |
| Citigroup Global Markets | | | | | | | | | | | |
| CenturyTel 5 yr CDS | $ | 725,000 | | | 1.71% | | 9/20/13 | | $ | (2,371 | ) |
| Goldman Sachs Group | | | | | | | | | | | |
| Kraft Foods 10 yr CDS | | 1,350,000 | | | 0.77% | | 12/20/17 | | | 13,731 | |
| JPMorgan Chase Bank | | | | | | | | | | | |
| Embarq 7 yr CDS | | 1,155,000 | | | 0.77% | | 9/20/14 | | | 100,995 | |
| Lehman Brothers | | | | | | | | | | | |
| Gannett 6 yr CDS | | 150,000 | | | 3.15% | | 9/20/14 | | | (43 | ) |
| Gannett 7 yr CDS | | 672,000 | | | 0.88% | | 9/20/14 | | | 72,342 | |
| Home Depot 5 yr CDS | | 900,000 | | | 0.50% | | 9/20/12 | | | 27,434 | |
| New York Times 7 yr CDS | | 672,000 | | | 0.75% | | 9/20/14 | | | 89,701 | |
| Sara Lee 7 yr CDS | | 672,000 | | | 0.60% | | 9/20/14 | | | 3,345 | |
| Target 5 yr CDS | | 900,000 | | | 0.57% | | 12/20/12 | | | 1,625 | |
| Washington Mutual 10 yr CDS | | 545,000 | | | 3.15% | | 12/20/17 | | | 115,627 | |
| | | | | | | | | | $ | 422,386 | |
| Protection Sold: | | | | | | | | | | | |
| Citigroup Global Markets | | | | | | | | | | | |
| Plains American CDS | $ | 645,000 | | | 1.33% | | 9/20/13 | | $ | 3,093 | |
| Total | | | | | | | | | $ | 425,479 | |
The use of foreign currency exchange contracts, financial futures contracts and swap contracts involves elements of market risk and risks in excess of the amounts recognized in the financial statements. The notional values presented above represent the Fund’s total exposure in such contracts, whereas only the net unrealized appreciation (depreciation) is reflected in the Fund’s net assets.
1See Note 8 in “Notes to financial statements.”
2See Note 9 in “Notes to financial statements.”
3See Note 11 in “Notes to financial statements.”
See accompanying notes
48
Statements of assets and liabilities
July 31, 2008
| | Delaware | | Delaware |
| | Corporate | | Extended |
| | Bond | | Duration Bond |
| | Fund | | Fund |
| Assets: | | | | | |
| Investments, at value | $ | 548,360,747 | | $ | 214,809,305 |
| Securities lending collateral | | 21,451,942 | | | 6,769,658 |
| Foreign currencies | | 257,709 | | | 36,064 |
| Cash | | — | | | 814,395 |
| Receivables for securities sold | | 22,895,604 | | | 10,372,476 |
| Credit default swap contracts, at value | | 1,401,261 | | | 425,479 |
| Dividends and interest receivable | | 8,244,700 | | | 3,232,730 |
| Receivable for fund shares sold | | 671,678 | | | 272,343 |
| Variation margin receivable on futures contracts | | — | | | 200,868 |
| Foreign currency contracts, at value | | 77,133 | | | — |
| Securities lending income receivable | | 9,131 | | | 4,745 |
| Total assets | | 603,369,905 | | | 236,938,063 |
| |
| Liabilities: | | | | | |
| Cash overdraft | | 283,665 | | | — |
| Payables for securities purchased | | 15,776,594 | | | 6,131,734 |
| Distributions payable | | 792,051 | | | 325,107 |
| Payable for fund shares purchased | | 871,983 | | | 476,267 |
| Obligation to return securities lending collateral | | 21,451,942 | | | 6,769,658 |
| Variation margin payable on futures contracts | | 28,674 | | | — |
| Accrued protection payments on credit default swaps | | 21,537 | | | 9,154 |
| Foreign currency contracts, at value | | — | | | 39,784 |
| Due to manager and affiliates | | 405,303 | | | 163,587 |
| Other accrued expenses | | 172,718 | | | 86,030 |
| Other liabilities | | 229 | | | 104 |
| Total liabilities | | 39,804,696 | | | 14,001,425 |
| |
| Total net assets | $ | 563,565,209 | | $ | 222,936,638 |
| |
| Investments, at cost | $ | 575,598,501 | | $ | 225,290,544 |
| Cost of investments held as collateral for loaned securities | | 21,451,942 | | | 6,769,658 |
| Foreign currencies, at cost | | 260,388 | | | 35,340 |
See accompanying notes
49
Statements of operations
Year Ended July 31, 2008
| | Delaware | | Delaware |
| | Corporate | | Extended |
| | Bond | | Duration Bond |
| | Fund | | Fund |
| Investment Income: | | | | | | | |
| Dividends | $ | 206,748 | | | $ | 72,829 | |
| Interest | | 35,762,142 | | | | 16,674,819 | |
| Foreign tax withheld | | (8,453 | ) | | | (3,934 | ) |
| | | 35,960,437 | | | | 16,743,714 | |
| Expenses: | | | | | | | |
| Management fees | | 2,973,122 | | | | 1,459,846 | |
| Distribution expense – Class A | | 879,609 | | | | 567,024 | |
| Distribution expense – Class B | | 195,709 | | | | 55,238 | |
| Distribution expense – Class C | | 691,916 | | | | 202,123 | |
| Distribution expense – Class R | | 98,769 | | | | 1,953 | |
| Dividend disbursing and transfer agent fees and expenses | | 1,053,788 | | | | 661,063 | |
| Accounting and administration expenses | | 239,800 | | | | 106,157 | |
| Reports and statements to shareholders | | 121,135 | | | | 54,264 | |
| Registration fees | | 111,353 | | | | 73,238 | |
| Legal fees | | 66,378 | | | | 24,760 | |
| Audit and tax | | 47,337 | | | | 26,462 | |
| Trustees’ fees | | 29,324 | | | | 13,100 | |
| Custodian fees | | 24,692 | | | | 31,572 | |
| Insurance fees | | 16,279 | | | | 7,507 | |
| Pricing fees | | 13,531 | | | | 12,629 | |
| Consulting fees | | 9,018 | | | | 3,676 | |
| Trustees’ expenses | | 3,293 | | | | 1,447 | |
| Dues and services | | 2,509 | | | | 1,314 | |
| Taxes (other than taxes on income) | | 11 | | | | 1,168 | |
| | | 6,577,573 | | | | 3,304,541 | |
| Less fees absorbed or waived | | (780,835 | ) | | | (726,794 | ) |
| Less waiver of distribution expenses – Class A | | (146,602 | ) | | | (94,504 | ) |
| Less waiver of distribution expenses – Class R | | (16,461 | ) | | | (325 | ) |
| Less expense paid indirectly | | (18,871 | ) | | | (17,054 | ) |
| Total operating expenses | | 5,614,804 | | | | 2,465,863 | |
| Net Investment Income | | 30,345,633 | | | | 14,277,851 | |
50
| | Delaware | | Delaware |
| | Corporate | | Extended |
| | Bond | | Duration Bond |
| | Fund | | Fund |
| Net Realized and Unrealized Gain (Loss) on | | | | | | | |
| Investments and Foreign Currencies: | | | | | | | |
| Net realized gain (loss) on: | | | | | | | |
| Investments | $ | (13,299,967 | ) | | $ | (6,967,480 | ) |
| Futures contracts | | 7,110,207 | | | | 3,736,258 | |
| Foreign currencies | | (1,836,786 | ) | | | 834,304 | |
| Swap contracts | | (948,859 | ) | | | (494,306 | ) |
| Written options | | (176,327 | ) | | | 356,880 | |
| Net realized loss | | (9,151,732 | ) | | | (2,534,344 | ) |
| Net change in unrealized appreciation/depreciation | | | | | | | |
| of investments and foreign currencies | | (20,405,268 | ) | | | (8,384,561 | ) |
| Net Realized and Unrealized Loss on | | | | | | | |
| Investments and Foreign Currencies | | (29,557,000 | ) | | | (10,918,905 | ) |
| |
| Net Increase in Net Assets Resulting | | | | | | | |
| from Operations | $ | 788,633 | | | $ | 3,358,946 | |
See accompanying notes
51
Statements of changes in net assets
Delaware Corporate Bond Fund
| | Year Ended |
| | 7/31/08 | | 7/31/07 |
| Increase (Decrease) in Net Assets from Operations: | | | | | | | |
| Net investment income | $ | 30,345,633 | | | $ | 31,203,231 | |
| Net realized gain (loss) on investments | | | | | | | |
| and foreign currencies | | (9,151,732 | ) | | | 2,533,685 | |
| Net change in unrealized appreciation/depreciation | | | | | | | |
| of investments and foreign currencies | | (20,405,268 | ) | | | 2,331,960 | |
| Net increase in net assets resulting | | | | | | | |
| from operations | | 788,633 | | | | 36,068,876 | |
| |
| Dividends and Distributions to Shareholders from: | | | | | | | |
| Net investment income: | | | | | | | |
| Class A | | (15,337,723 | ) | | | (15,544,055 | ) |
| Class B | | (880,057 | ) | | | (1,165,810 | ) |
| Class C | | (3,096,733 | ) | | | (2,857,050 | ) |
| Class R | | (818,201 | ) | | | (499,547 | ) |
| Institutional Class | | (11,026,837 | ) | | | (12,656,187 | ) |
| | | (31,159,551 | ) | | | (32,722,649 | ) |
| |
| Capital Share Transactions: | | | | | | | |
| Proceeds from shares sold: | | | | | | | |
| Class A | | 87,362,083 | | | | 122,985,721 | |
| Class B | | 610,894 | | | | 3,044,155 | |
| Class C | | 15,208,772 | | | | 30,400,058 | |
| Class R | | 11,821,022 | | | | 11,716,960 | |
| Institutional Class | | 87,203,927 | | | | 106,178,754 | |
| |
| Net asset value of shares issued upon reinvestment | | | | | | | |
| of dividends and distributions: | | | | | | | |
| Class A | | 11,493,897 | | | | 10,439,219 | |
| Class B | | 521,909 | | | | 718,643 | |
| Class C | | 2,444,005 | | | | 2,153,681 | |
| Class R | | 804,997 | | | | 483,965 | |
| Institutional Class | | 2,668,689 | | | | 7,378,176 | |
| | | 220,140,195 | | | | 295,499,332 | |
52
| | Year Ended |
| | 7/31/08 | | 7/31/07 |
| Capital Share Transactions (continued): | | | | | | | |
| Cost of shares repurchased: | | | | | | | |
| Class A | $ | (119,980,862 | ) | | $ | (86,050,676 | ) |
| Class B | | (7,398,706 | ) | | | (5,031,153 | ) |
| Class C | | (19,612,382 | ) | | | (13,165,928 | ) |
| Class R | | (15,652,690 | ) | | | (2,309,183 | ) |
| Institutional Class | | (54,633,953 | ) | | | (170,536,500 | ) |
| | | (217,278,593 | ) | | | (277,093,440 | ) |
| Increase in net assets derived from | | | | | | | |
| capital share transactions | | 2,861,602 | | | | 18,405,892 | |
| Net Increase (Decrease) in Net Assets | | (27,509,316 | ) | | | 21,752,119 | |
| |
| Net Assets: | | | | | | | |
| Beginning of year | | 591,074,525 | | | | 569,322,406 | |
| End of year | $ | 563,565,209 | | | $ | 591,074,525 | |
| |
| Distributions in excess of | | | | | | | |
| net investment income | $ | (2,034,617 | ) | | $ | (409,144 | ) |
See accompanying notes
53
Statements of changes in net assets
Delaware Extended Duration Bond Fund
| | Year Ended |
| | 7/31/08 | | 7/31/07 |
| Increase (Decrease) in Net Assets from Operations: | | | | | | | |
| Net investment income | $ | 14,277,851 | | | $ | 13,003,318 | |
| Net realized gain (loss) on investments | | | | | | | |
| and foreign currencies | | (2,534,344 | ) | | | (3,920,605 | ) |
| Net change in unrealized appreciation/depreciation | | | | | | | |
| of investments and foreign currencies | | (8,384,561 | ) | | | 1,915,606 | |
| Net increase in net assets resulting | | | | | | | |
| from operations | | 3,358,946 | | | | 10,998,319 | |
| |
| Dividends and Distributions to Shareholders from: | | | | | | | |
| Net investment income: | | | | | | | |
| Class A | | (10,366,627 | ) | | | (7,803,558 | ) |
| Class B | | (262,308 | ) | | | (319,547 | ) |
| Class C | | (958,162 | ) | | | (795,160 | ) |
| Class R | | (17,031 | ) | | | (6,461 | ) |
| Institutional Class | | (2,904,917 | ) | | | (4,649,402 | ) |
| | | (14,509,045 | ) | | | (13,574,128 | ) |
| |
| Capital Share Transactions: | | | | | | | |
| Proceeds from shares sold: | | | | | | | |
| Class A | | 91,491,995 | | | | 120,309,901 | |
| Class B | | 306,119 | | | | 945,017 | |
| Class C | | 4,205,200 | | | | 12,622,388 | |
| Class R | | 155,728 | | | | 240,519 | |
| Institutional Class | | 11,431,437 | | | | 36,248,261 | |
| |
| Net asset value of shares issued upon reinvestment | | | | | | | |
| of dividends and distributions: | | | | | | | |
| Class A | | 9,175,003 | | | | 6,363,572 | |
| Class B | | 179,665 | | | | 218,801 | |
| Class C | | 645,150 | | | | 543,347 | |
| Class R | | 16,832 | | | | 6,197 | |
| Institutional Class | | 1,562,271 | | | | 1,719,445 | |
| | | 119,169,400 | | | | 179,217,448 | |
54
| | Year Ended |
| | 7/31/08 | | 7/31/07 |
| Capital Share Transactions (continued): | | | | | | | |
| Cost of shares repurchased: | | | | | | | |
| Class A | $ | (109,591,451 | ) | | $ | (35,489,059 | ) |
| Class B | | (1,495,767 | ) | | | (1,635,344 | ) |
| Class C | | (6,151,131 | ) | | | (3,777,736 | ) |
| Class R | | (27,246 | ) | | | (7,053 | ) |
| Institutional Class | | (40,571,667 | ) | | | (41,881,893 | ) |
| | | (157,837,262 | ) | | | (82,791,085 | ) |
| Increase (decrease) in net assets derived from | | | | | | | |
| capital share transactions | | (38,667,862 | ) | | | 96,426,363 | |
| Net Increase (Decrease) in Net Assets | | (49,817,961 | ) | | | 93,850,554 | |
| |
| Net Assets: | | | | | | | |
| Beginning of year | | 272,754,599 | | | | 178,904,045 | |
| End of year | $ | 222,936,638 | | | $ | 272,754,599 | |
| |
| Undistributed (distributions in excess of) | | | | | | | |
| net investment income | $ | 581,993 | | | $ | (82,730 | ) |
See accompanying notes
55
Financial highlights
Delaware Corporate Bond Fund Class A
Selected data for each share of the Fund outstanding throughout each period were as follows:
| Net asset value, beginning of period |
| |
| Income (loss) from investment operations: |
| Net investment income1 |
| Net realized and unrealized gain (loss) on investments and foreign currencies |
| Total from investment operations |
| |
| Less dividends and distributions from: |
| Net investment income |
| Net realized gain on investments |
| Total dividends and distributions |
| |
| Net asset value, end of period |
| |
| Total return2 |
| |
| Ratios and supplemental data: |
| Net assets, end of period (000 omitted) |
| Ratio of expenses to average net assets |
| Ratio of expenses to average net assets |
| prior to fees waived and expense paid indirectly |
| Ratio of net investment income to average net assets |
| Ratio of net investment income to average net assets |
| prior to fees waived and expense paid indirectly |
| Portfolio turnover |
1 The average shares outstanding method has been applied for per share information. |
2 Total investment return is based on the change in net asset value of a share during the period and assumes reinvestment of dividends and distributions at net asset value and does not reflect the impact of a sales charge. Total investment return reflects waivers by the manager and distributor, as applicable. Performance would have been lower had the waivers not been in effect. |
See accompanying notes
56
| Year Ended | |
| 7/31/08 | | 7/31/07 | | 7/31/06 | | 7/31/05 | | 7/31/04 | |
| | $5.520 | | | $5.490 | | | $5.780 | | | $5.700 | | | $5.620 | | |
| | |
| | |
| 0.279 | | | 0.301 | | | 0.276 | | | 0.260 | | | 0.296 | | |
| (0.272 | ) | | 0.046 | | | (0.239 | ) | | 0.174 | | | 0.183 | | |
| 0.007 | | | 0.347 | | | 0.037 | | | 0.434 | | | 0.479 | | |
| | |
| | |
| (0.287 | ) | | (0.317 | ) | | (0.306 | ) | | (0.286 | ) | | (0.307 | ) | |
| — | | | — | | | (0.021 | ) | | (0.068 | ) | | (0.092 | ) | |
| (0.287 | ) | | (0.317 | ) | | (0.327 | ) | | (0.354 | ) | | (0.399 | ) | |
| | |
| | $5.240 | | | $5.520 | | | $5.490 | | | $5.780 | | | $5.700 | | |
| | |
| 0.04% | | | 6.35% | | | 0.70% | | | 7.76% | | | 8.65% | | |
| | |
| | |
| | $268,659 | | | $304,255 | | | $256,776 | | | $115,456 | | | $73,867 | | |
| 0.90% | | | 0.82% | | | 0.81% | | | 0.82% | | | 0.80% | | |
| | |
| 1.08% | | | 1.06% | | | 1.05% | | | 1.08% | | | 1.17% | | |
| 5.10% | | | 5.35% | | | 4.95% | | | 4.48% | | | 5.09% | | |
| | |
| 4.92% | | | 5.11% | | | 4.71% | | | 4.22% | | | 4.72% | | |
| 355% | | | 244% | | | 173% | | | 232% | | | 300% | | |
57
Financial highlights
Delaware Corporate Bond Fund Class B
Selected data for each share of the Fund outstanding throughout each period were as follows:
| Net asset value, beginning of period |
| |
| Income (loss) from investment operations: |
| Net investment income1 |
| Net realized and unrealized gain (loss) on investments and foreign currencies |
| Total from investment operations |
| |
| Less dividends and distributions from: |
| Net investment income |
| Net realized gain on investments |
| Total dividends and distributions |
| |
| Net asset value, end of period |
| |
| Total return2 |
| |
| Ratios and supplemental data: |
| Net assets, end of period (000 omitted) |
| Ratio of expenses to average net assets |
| Ratio of expenses to average net assets |
| prior to fees waived and expense paid indirectly |
| Ratio of net investment income to average net assets |
| Ratio of net investment income to average net assets |
| prior to fees waived and expense paid indirectly |
| Portfolio turnover |
1 The average shares outstanding method has been applied for per share information. |
2 Total investment return is based on the change in net asset value of a share during the period and assumes reinvestment of dividends and distributions at net asset value and does not reflect the impact of a sales charge. Total investment return reflects a waiver by the manager. Performance would have been lower had the waiver not been in effect. |
See accompanying notes
58
| Year Ended | |
| 7/31/08 | | 7/31/07 | | 7/31/06 | | 7/31/05 | | 7/31/04 | |
| | $5.520 | | | $5.480 | | | $5.770 | | | $5.700 | | | $5.620 | | |
| | |
| | |
| 0.238 | | | 0.259 | | | 0.234 | | | 0.216 | | | 0.253 | | |
| (0.283 | ) | | 0.055 | | | (0.239 | ) | | 0.164 | | | 0.183 | | |
| (0.045 | ) | | 0.314 | | | (0.005 | ) | | 0.380 | | | 0.436 | | |
| | |
| | |
| (0.245 | ) | | (0.274 | ) | | (0.264 | ) | | (0.242 | ) | | (0.264 | ) | |
| — | | | — | | | (0.021 | ) | | (0.068 | ) | | (0.092 | ) | |
| (0.245 | ) | | (0.274 | ) | | (0.285 | ) | | (0.310 | ) | | (0.356 | ) | |
| | |
| | $5.230 | | | $5.520 | | | $5.480 | | | $5.770 | | | $5.700 | | |
| | |
| (0.90% | ) | | 5.56% | | | 0.13% | | | 6.77% | | | 7.85% | | |
| | |
| | |
| | $15,525 | | | $22,694 | | | $23,792 | | | $23,963 | | | $20,510 | | |
| 1.65% | | | 1.57% | | | 1.56% | | | 1.57% | | | 1.55% | | |
| | |
| 1.78% | | | 1.76% | | | 1.75% | | | 1.78% | | | 1.87% | | |
| 4.35% | | | 4.60% | | | 4.20% | | | 3.73% | | | 4.33% | | |
| | |
| 4.22% | | | 4.41% | | | 4.01% | | | 3.52% | | | 4.01% | | |
| 355% | | | 244% | | | 173% | | | 232% | | | 300% | | |
59
Financial highlights
Delaware Corporate Bond Fund Class C
Selected data for each share of the Fund outstanding throughout each period were as follows:
| Net asset value, beginning of period |
| |
| Income (loss) from investment operations: |
| Net investment income1 |
| Net realized and unrealized gain (loss) on investments and foreign currencies |
| Total from investment operations |
| |
| Less dividends and distributions from: |
| Net investment income |
| Net realized gain on investments |
| Total dividends and distributions |
| |
| Net asset value, end of period |
| |
| Total return2 |
| |
| Ratios and supplemental data: |
| Net assets, end of period (000 omitted) |
| Ratio of expenses to average net assets |
| Ratio of expenses to average net assets |
| prior to fees waived and expense paid indirectly |
| Ratio of net investment income to average net assets |
| Ratio of net investment income to average net assets |
| prior to fees waived and expense paid indirectly |
| Portfolio turnover |
1 The average shares outstanding method has been applied for per share information. |
2 Total investment return is based on the change in net asset value of a share during the period and assumes reinvestment of dividends and distributions at net asset value and does not reflect the impact of a sales charge. Total investment return reflects a waiver by the manager. Performance would have been lower had the waiver not been in effect. |
See accompanying notes
60
| Year Ended | |
| 7/31/08 | | 7/31/07 | | 7/31/06 | | 7/31/05 | | 7/31/04 | |
| | $5.520 | | | $5.490 | | | $5.780 | | | $5.700 | | | $5.620 | | |
| | |
| | |
| 0.238 | | | 0.259 | | | 0.234 | | | 0.216 | | | 0.253 | | |
| (0.273 | ) | | 0.045 | | | (0.239 | ) | | 0.174 | | | 0.183 | | |
| (0.035 | ) | | 0.304 | | | (0.005 | ) | | 0.390 | | | 0.436 | | |
| | |
| | |
| (0.245 | ) | | (0.274 | ) | | (0.264 | ) | | (0.242 | ) | | (0.264 | ) | |
| — | | | — | | | (0.021 | ) | | (0.068 | ) | | (0.092 | ) | |
| (0.245 | ) | | (0.274 | ) | | (0.285 | ) | | (0.310 | ) | | (0.356 | ) | |
| | |
| | $5.240 | | | $5.520 | | | $5.490 | | | $5.780 | | | $5.700 | | |
| | |
| (0.71% | ) | | 5.55% | | | (0.05% | ) | | 6.95% | | | 7.86% | | |
| | |
| | |
| | $62,211 | | | $67,693 | | | $48,425 | | | $33,013 | | | $21,139 | | |
| 1.65% | | | 1.57% | | | 1.56% | | | 1.57% | | | 1.55% | | |
| | |
| 1.78% | | | 1.76% | | | 1.75% | | | 1.78% | | | 1.87% | | |
| 4.35% | | | 4.60% | | | 4.20% | | | 3.73% | | | 4.33% | | |
| | |
| 4.22% | | | 4.41% | | | 4.01% | | | 3.52% | | | 4.01% | | |
| 355% | | | 244% | | | 173% | | | 232% | | | 300% | | |
61
Financial highlights
Delaware Corporate Bond Fund Class R
Selected data for each share of the Fund outstanding throughout each period were as follows:
| Net asset value, beginning of period |
| |
| Income (loss) from investment operations: |
| Net investment income1 |
| Net realized and unrealized gain (loss) on investments and foreign currencies |
| Total from investment operations |
| |
| Less dividends and distributions from: |
| Net investment income |
| Net realized gain on investments |
| Total dividends and distributions |
| |
| Net asset value, end of period |
| |
| Total return2 |
| |
| Ratios and supplemental data: |
| Net assets, end of period (000 omitted) |
| Ratio of expenses to average net assets |
| Ratio of expenses to average net assets |
| prior to fees waived and expense paid indirectly |
| Ratio of net investment income to average net assets |
| Ratio of net investment income to average net assets |
| prior to fees waived and expense paid indirectly |
| Portfolio turnover |
1 The average shares outstanding method has been applied for per share information. |
2 Total investment return is based on the change in net asset value of a share during the period and assumes reinvestment of dividends and distributions at net asset value. Total investment return reflects waivers by the manager and distributor, as applicable. Performance would have been lower had the waivers not been in effect. |
See accompanying notes
62
| Year Ended | |
| 7/31/08 | | 7/31/07 | | 7/31/06 | | 7/31/05 | | 7/31/04 | |
| | $5.520 | | | $5.490 | | | $5.780 | | | $5.700 | | | $5.620 | | |
| | |
| | |
| 0.265 | | | 0.287 | | | 0.262 | | | 0.240 | | | 0.273 | | |
| (0.272 | ) | | 0.045 | | | (0.239 | ) | | 0.174 | | | 0.188 | | |
| (0.007 | ) | | 0.332 | | | 0.023 | | | 0.414 | | | 0.461 | | |
| | |
| | |
| (0.273 | ) | | (0.302 | ) | | (0.292 | ) | | (0.266 | ) | | (0.289 | ) | |
| — | | | — | | | (0.021 | ) | | (0.068 | ) | | (0.092 | ) | |
| (0.273 | ) | | (0.302 | ) | | (0.313 | ) | | (0.334 | ) | | (0.381 | ) | |
| | |
| | $5.240 | | | $5.520 | | | $5.490 | | | $5.780 | | | $5.700 | | |
| | |
| (0.21% | ) | | 6.07% | | | 0.45% | | | 7.38% | | | 8.33% | | |
| | |
| | |
| | $11,973 | | | $15,802 | | | $6,048 | | | $2,608 | | | $869 | | |
| 1.15% | | | 1.07% | | | 1.06% | | | 1.17% | | | 1.15% | | |
| | |
| 1.38% | | | 1.36% | | | 1.35% | | | 1.38% | | | 1.47% | | |
| 4.85% | | | 5.10% | | | 4.70% | | | 4.13% | | | 4.73% | | |
| | |
| 4.62% | | | 4.81% | | | 4.41% | | | 3.92% | | | 4.41% | | |
| 355% | | | 244% | | | 173% | | | 232% | | | 300% | | |
63
Financial highlights
Delaware Corporate Bond Fund Institutional Class
Selected data for each share of the Fund outstanding throughout each period were as follows:
| Net asset value, beginning of period |
| |
| Income (loss) from investment operations: |
| Net investment income1 |
| Net realized and unrealized gain (loss) on investments and foreign currencies |
| Total from investment operations |
| |
| Less dividends and distributions from: |
| Net investment income |
| Net realized gain on investments |
| Total dividends and distributions |
| |
| Net asset value, end of period |
| |
| Total return2 |
| |
| Ratios and supplemental data: |
| Net assets, end of period (000 omitted) |
| Ratio of expenses to average net assets |
| Ratio of expenses to average net assets |
| prior to fees waived and expense paid indirectly |
| Ratio of net investment income to average net assets |
| Ratio of net investment income to average net assets |
| prior to fees waived and expense paid indirectly |
| Portfolio turnover |
| 1 The average shares outstanding method has been applied for per share information. |
| 2 Total investment return is based on the change in net asset value of a share during the period and assumes reinvestment of dividends and distributions at net asset value. Total investment return reflects a waiver by the manager. Performance would have been lower had the waiver not been in effect. |
See accompanying notes
64
| Year Ended |
| | | 7/31/08 | | | 7/31/07 | | | 7/31/06 | | | 7/31/05 | | | 7/31/04 | | |
| | | $ 5.520 | | | $ 5.480 | | | $ 5.770 | | | $ 5.700 | | | $ 5.620 | | |
| | |
| | |
| | 0.293 | | | 0.315 | | | 0.289 | | | 0.274 | | | 0.310 | | |
| | (0.273 | ) | | 0.056 | | | (0.238 | ) | | 0.164 | | | 0.183 | | |
| | 0.020 | | | 0.371 | | | 0.051 | | | 0.438 | | | 0.493 | | |
| | |
| | |
| | (0.300 | ) | | (0.331 | ) | | (0.320 | ) | | (0.300 | ) | | (0.321 | ) | |
| | — | | | — | | | (0.021 | ) | | (0.068 | ) | | (0.092 | ) | |
| | (0.300 | ) | | (0.331 | ) | | (0.341 | ) | | (0.368 | ) | | (0.413 | ) | |
| | |
| | $ 5.240 | | | $ 5.520 | | | $ 5.480 | | | $ 5.770 | | | $ 5.700 | | |
| | |
| | 0.10% | | | 6.81% | | | 0.95% | | | 7.84% | | | 8.92% | | |
| | |
| | |
| $205,197 | | $180,631 | | $234,281 | | $201,895 | | $104,282 | | |
| | 0.65% | | | 0.57% | | | 0.56% | | | 0.57% | | | 0.55% | | |
| | |
| | 0.78% | | | 0.76% | | | 0.75% | | | 0.78% | | | 0.87% | | |
| | 5.35% | | | 5.60% | | | 5.20% | | | 4.73% | | | 5.33% | | |
| | |
| | 5.22% | | | 5.41% | | | 5.01% | | | 4.52% | | | 5.01% | | |
| | | 355% | | | 244% | | | 173% | | | 232% | | | 300% | | |
65
Financial highlights
Delaware Extended Duration Bond Fund Class A
Selected data for each share of the Fund outstanding throughout each period were as follows:
| Net asset value, beginning of period |
| |
| Income (loss) from investment operations: |
| Net investment income1 |
| Net realized and unrealized gain (loss) on investments and foreign currencies |
| Total from investment operations |
| |
| Less dividends and distributions from: |
| Net investment income |
| Net realized gain on investments |
| Total dividends and distributions |
| |
| Net asset value, end of period |
| |
| Total return2 |
| |
| Ratios and supplemental data: |
| Net assets, end of period (000 omitted) |
| Ratio of expenses to average net assets |
| Ratio of expenses to average net assets |
| prior to fees waived and expense paid indirectly |
| Ratio of net investment income to average net assets |
| Ratio of net investment income to average net assets |
| prior to fees waived and expense paid indirectly |
| Portfolio turnover |
| 1 The average shares outstanding method has been applied for per share information. |
| 2 Total investment return is based on the change in net asset value of a share during the period and assumes reinvestment of dividends and distributions at net asset value and does not reflect the impact of a sales charge. Total investment return reflects waivers by the manager and distributor, as applicable. Performance would have been lower had the waivers not been in effect. |
See accompanying notes
66
| Year Ended |
| | 7/31/08 | | | 7/31/07 | | | 7/31/06 | | | 7/31/05 | | | 7/31/04 | | |
| | | $ 5.460 | | | $ 5.410 | | | $ 5.940 | | | $ 5.770 | | | $ 5.550 | | |
| | |
| | |
| | 0.296 | | | 0.306 | | | 0.299 | | | 0.292 | | | 0.334 | | |
| | (0.245 | ) | | 0.065 | | | (0.468 | ) | | 0.390 | | | 0.322 | | |
| | 0.051 | | | 0.371 | | | (0.169 | ) | | 0.682 | | | 0.656 | | |
| | |
| | |
| | (0.301 | ) | | (0.321 | ) | | (0.309 | ) | | (0.312 | ) | | (0.339 | ) | |
| | — | | | — | | | (0.052 | ) | | (0.200 | ) | | (0.097 | ) | |
| | (0.301 | ) | | (0.321 | ) | | (0.361 | ) | | (0.512 | ) | | (0.436 | ) | |
| | |
| | $ 5.210 | | | $ 5.460 | | | $ 5.410 | | | $ 5.940 | | | $ 5.770 | | |
| | |
| | 0.83% | | | 6.82% | | | (2.89% | ) | | 12.17% | | | 11.99% | | |
| | |
| | |
| $163,372 | | $180,853 | | $92,132 | | $58,003 | | $19,439 | | |
| | 0.90% | | | 0.88% | | | 0.80% | | | 0.84% | | | 0.80% | | |
| | |
| | 1.23% | | | 1.20% | | | 1.22% | | | 1.31% | | | 1.30% | | |
| | 5.42% | | | 5.44% | | | 5.35% | | | 4.92% | | | 5.72% | | |
| | |
| | 5.09% | | | 5.12% | | | 4.93% | | | 4.45% | | | 5.22% | | |
| | 443% | | | 276% | | | 184% | | | 233% | | | 267% | | |
67
Financial highlights
Delaware Extended Duration Bond Fund Class B
Selected data for each share of the Fund outstanding throughout each period were as follows:
| Net asset value, beginning of period |
| |
| Income (loss) from investment operations: |
| Net investment income1 |
| Net realized and unrealized gain (loss) on investments and foreign currencies |
| Total from investment operations |
| |
| Less dividends and distributions from: |
| Net investment income |
| Net realized gain on investments |
| Total dividends and distributions |
| |
| Net asset value, end of period |
| |
| Total return2 |
| |
| Ratios and supplemental data: |
| Net assets, end of period (000 omitted) |
| Ratio of expenses to average net assets |
| Ratio of expenses to average net assets |
| prior to fees waived and expense paid indirectly |
| Ratio of net investment income to average net assets |
| Ratio of net investment income to average net assets |
| prior to fees waived and expense paid indirectly |
| Portfolio turnover |
| 1 The average shares outstanding method has been applied for per share information. |
| 2 Total investment return is based on the change in net asset value of a share during the period and assumes reinvestment of dividends and distributions at net asset value and does not reflect the impact of a sales charge. Total investment return reflects a waiver by the manager. Performance would have been lower had the waiver not been in effect. |
See accompanying notes
68
| Year Ended |
| | 7/31/08 | | | 7/31/07 | | | 7/31/06 | | | 7/31/05 | | | 7/31/04 | | |
| | | $ 5.450 | | | $ 5.410 | | | $ 5.930 | | | $ 5.760 | | | $ 5.550 | | |
| | |
| | |
| | 0.254 | | | 0.264 | | | 0.257 | | | 0.247 | | | 0.291 | | |
| | (0.244 | ) | | 0.054 | | | (0.458 | ) | | 0.391 | | | 0.312 | | |
| | 0.010 | | | 0.318 | | | (0.201 | ) | | 0.638 | | | 0.603 | | |
| | |
| | |
| | (0.260 | ) | | (0.278 | ) | | (0.267 | ) | | (0.268 | ) | | (0.296 | ) | |
| | — | | | — | | | (0.052 | ) | | (0.200 | ) | | (0.097 | ) | |
| | (0.260 | ) | | (0.278 | ) | | (0.319 | ) | | (0.468 | ) | | (0.393 | ) | |
| | |
| | $ 5.200 | | | $ 5.450 | | | $ 5.410 | | | $ 5.930 | | | $ 5.760 | | |
| | |
| | 0.08% | | | 5.84% | | | (3.45% | ) | | 11.35% | | | 10.98% | | |
| | |
| | |
| | $4,718 | | | $5,959 | | | $6,371 | | | $6,964 | | | $5,597 | | |
| | 1.65% | | | 1.63% | | | 1.55% | | | 1.59% | | | 1.55% | | |
| | |
| | 1.93% | | | 1.90% | | | 1.92% | | | 2.01% | | | 2.00% | | |
| | 4.67% | | | 4.69% | | | 4.60% | | | 4.17% | | | 4.97% | | |
| | |
| | 4.39% | | | 4.42% | | | 4.23% | | | 3.75% | | | 4.52% | | |
| | 443% | | | 276% | | | 184% | | | 233% | | | 267% | | |
69
Financial highlights
Delaware Extended Duration Bond Fund Class C
Selected data for each share of the Fund outstanding throughout each period were as follows:
| Net asset value, beginning of period |
| |
| Income (loss) from investment operations: |
| Net investment income1 |
| Net realized and unrealized gain (loss) on investments and foreign currencies |
| Total from investment operations |
| |
| Less dividends and distributions from: |
| Net investment income |
| Net realized gain on investments |
| Total dividends and distributions |
| |
| Net asset value, end of period |
| |
| Total return2 |
| |
| Ratios and supplemental data: |
| Net assets, end of period (000 omitted) |
| Ratio of expenses to average net assets |
| Ratio of expenses to average net assets |
| prior to fees waived and expense paid indirectly |
| Ratio of net investment income to average net assets |
| Ratio of net investment income to average net assets |
| prior to fees waived and expense paid indirectly |
| Portfolio turnover |
| 1 The average shares outstanding method has been applied for per share information. |
| 2 Total investment return is based on the change in net asset value of a share during the period and assumes reinvestment of dividends and distributions at net asset value and does not reflect the impact of a sales charge. Total investment return reflects a waiver by the manager. Performance would have been lower had the waiver not been in effect. |
See accompanying notes
70
| Year Ended |
| | 7/31/08 | | | 7/31/07 | | | 7/31/06 | | | 7/31/05 | | | 7/31/04 | | |
| | | $ 5.460 | | | $ 5.410 | | | $ 5.930 | | | $ 5.760 | | | $ 5.550 | | |
| | |
| | |
| | 0.254 | | | 0.264 | | | 0.257 | | | 0.248 | | | 0.291 | | |
| | (0.244 | ) | | 0.064 | | | (0.458 | ) | | 0.390 | | | 0.312 | | |
| | 0.010 | | | 0.328 | | | (0.201 | ) | | 0.638 | | | 0.603 | | |
| | |
| | |
| | (0.260 | ) | | (0.278 | ) | | (0.267 | ) | | (0.268 | ) | | (0.296 | ) | |
| | — | | | — | | | (0.052 | ) | | (0.200 | ) | | (0.097 | ) | |
| | (0.260 | ) | | (0.278 | ) | | (0.319 | ) | | (0.468 | ) | | (0.393 | ) | |
| | |
| | $ 5.210 | | | $ 5.460 | | | $ 5.410 | | | $ 5.930 | | | $ 5.760 | | |
| | |
| | 0.08% | | | 6.03% | | | (3.45% | ) | 11.35% | | 10.98% | | |
| | |
| | |
| $17,976 | | $20,156 | | $11,021 | | $8,196 | | $5,025 | | |
| | 1.65% | | | 1.63% | | | 1.55% | | | 1.59% | | | 1.55% | | |
| | |
| | 1.93% | | | 1.90% | | | 1.92% | | | 2.01% | | | 2.00% | | |
| | 4.67% | | | 4.69% | | | 4.60% | | | 4.17% | | | 4.97% | | |
| | |
| | 4.39% | | | 4.42% | | | 4.23% | | | 3.75% | | | 4.52% | | |
| | 443% | | | 276% | | | 184% | | | 233% | | | 267% | | |
71
Financial highlights
Delaware Extended Duration Bond Fund Class R
Selected data for each share of the Fund outstanding throughout each period were as follows:
| Net asset value, beginning of period |
| |
| Income (loss) from investment operations: |
| Net investment income2 |
| Net realized and unrealized gain (loss) on investments and foreign currencies |
| Total from investment operations |
| |
| Less dividends and distributions from: |
| Net investment income |
| Net realized gain on investments |
| Total dividends and distributions |
| |
| Net asset value, end of period |
| |
| Total return3 |
| |
| Ratios and supplemental data: |
| Net assets, end of period (000 omitted) |
| Ratio of expenses to average net assets |
| Ratio of expenses to average net assets |
| prior to fees waived and expense paid indirectly |
| Ratio of net investment income to average net assets |
| Ratio of net investment income to average net assets |
| prior to fees waived and expense paid indirectly |
| Portfolio turnover |
| 1 Date of commencement of operations; ratios have been annualized and total return has not been annualized. |
| 2 The average shares outstanding method has been applied for per share information. |
| 3 Total investment return is based on the change in net asset value of a share during the period and assumes reinvestment of dividends and distributions at net asset value. Total investment return reflects waivers by the manager and distributor. Performance would have been lower had the waivers not been in effect. |
| 4 Portfolio turnover is representative of the Fund for the entire year. |
See accompanying notes
72
| | | | | | | | | 10/1/051 | | |
| Year Ended | | to | | |
| | 7/31/08 | | | 7/31/07 | | | | 7/31/06 | | |
| | | $ 5.460 | | | $ 5.410 | | | | $ 5.820 | | |
| | |
| | |
| | 0.282 | | | 0.293 | | | | 0.236 | | |
| | (0.245 | ) | | 0.064 | | | | (0.391 | ) | |
| | 0.037 | | | 0.357 | | | | (0.155 | ) | |
| | |
| | |
| | (0.287 | ) | | (0.307 | ) | | | (0.203 | ) | |
| | — | | | — | | | | (0.052 | ) | |
| | (0.287 | ) | | (0.307 | ) | | | (0.255 | ) | |
| | |
| | $ 5.210 | | | $ 5.460 | | | | $ 5.410 | | |
| | |
| | 0.39% | | | 6.75% | | | | (2.67% | ) | |
| | |
| | |
| | $377 | | | $250 | | | | $23 | | |
| | 1.15% | | | 1.13% | | | | 1.05% | | |
| | |
| | 1.53% | | | 1.50% | | | | 1.52% | | |
| | 5.17% | | | 5.19% | | | | 5.12% | | |
| | |
| | 4.79% | | | 4.82% | | | | 4.65% | | |
| | 443% | | | 276% | | | | 184% | 4 | |
73
Financial highlights
Delaware Extended Duration Bond Fund Institutional Class
Selected data for each share of the Fund outstanding throughout each period were as follows:
| Net asset value, beginning of period |
| |
| Income (loss) from investment operations: |
| Net investment income1 |
| Net realized and unrealized gain (loss) on investments and foreign currencies |
| Total from investment operations |
| |
| Less dividends and distributions from: |
| Net investment income |
| Net realized gain on investments |
| Total dividends and distributions |
| |
| Net asset value, end of period |
| |
| Total return2 |
| |
| Ratios and supplemental data: |
| Net assets, end of period (000 omitted) |
| Ratio of expenses to average net assets |
| Ratio of expenses to average net assets |
| prior to fees waived and expense paid indirectly |
| Ratio of net investment income to average net assets |
| Ratio of net investment income to average net assets |
| prior to fees waived and expense paid indirectly |
| Portfolio turnover |
| 1 The average shares outstanding method has been applied for per share information. |
| 2 Total investment return is based on the change in net asset value of a share during the period and assumes reinvestment of dividends and distributions at net asset value. Total investment return reflects a waiver by the manager. Performance would have been lower had the waiver not been in effect. |
See accompanying notes
74
| Year Ended |
| | 7/31/08 | | | 7/31/07 | | | 7/31/06 | | | 7/31/05 | | | 7/31/04 | | |
| | | $ 5.450 | | | $ 5.410 | | | $ 5.930 | | | $ 5.760 | | | $ 5.550 | | |
| | |
| | |
| | 0.309 | | | 0.320 | | | 0.313 | | | 0.307 | | | 0.350 | | |
| | (0.244 | ) | | 0.055 | | | (0.458 | ) | | 0.391 | | | 0.312 | | |
| | 0.065 | | | 0.375 | | | (0.145 | ) | | 0.698 | | | 0.662 | | |
| | |
| | |
| | (0.315 | ) | | (0.335 | ) | | (0.323 | ) | | (0.328 | ) | | (0.355 | ) | |
| | — | | | — | | | (0.052 | ) | | (0.200 | ) | | (0.097 | ) | |
| | (0.315 | ) | | (0.335 | ) | | (0.375 | ) | | (0.528 | ) | | (0.452 | ) | |
| | |
| | $ 5.200 | | | $ 5.450 | | | $ 5.410 | | | $ 5.930 | | | $ 5.760 | | |
| | |
| | 1.09% | | | 6.90% | | | (2.48% | ) | 12.47% | | 12.10% | | |
| | |
| | |
| $36,494 | | $65,537 | | $69,357 | | $52,547 | | $40,545 | | |
| | 0.65% | | | 0.63% | | | 0.55% | | | 0.59% | | | 0.55% | | |
| | |
| | 0.93% | | | 0.90% | | | 0.92% | | | 1.01% | | | 1.00% | | |
| | 5.67% | | | 5.69% | | | 5.60% | | | 5.17% | | | 5.97% | | |
| | |
| | 5.39% | | | 5.42% | | | 5.23% | | | 4.75% | | | 5.52% | | |
| | 443% | | | 276% | | | 184% | | | 233% | | | 267% | | |
75
| Notes to financial statements | |
| Delaware Corporate Bond Fund and Delaware Extended Duration Bond Fund | July 31, 2008 |
Delaware Group® Income Funds (Trust) is organized as a Delaware statutory trust and offers four series: Delaware Corporate Bond Fund, Delaware Delchester Fund, Delaware Extended Duration Bond Fund and Delaware High-Yield Opportunities Fund. These financial statements and the related notes pertain to the Delaware Corporate Bond Fund and Delaware Extended Duration Bond Fund (each referred to as a Fund or collectively as the Funds). The Trust is an open-end investment company. The Funds are considered diversified under the Investment Company Act of 1940, as amended, and offer Class A, Class B, Class C, Class R and Institutional Class shares. Class A shares are sold with a maximum front-end sales charge of up to 4.50%. Class A share purchases of $1,000,000 or more will incur a contingent deferred sales charge (CDSC) of 1% if redeemed during the first year and 0.50% during the second year, provided that Delaware Distributors, L.P. (DDLP) paid a financial advisor a commission on the purchase of those shares. Class B shares may only be purchased through dividend reinvestment and certain permitted exchanges. Prior to June 1, 2007, Class B shares were sold with a CDSC that declined from 4% to zero depending upon the period of time the shares were held. Class B shares will automatically convert to Class A shares on a quarterly basis approximately eight years after purchase. Class C shares are sold with a CDSC of 1%, if redeemed during the first 12 months. Class R and Institutional Class shares are not subject to a sales charge and are offered for sale exclusively to certain eligible investors.
The investment objective of the Funds is to seek to provide investors with total return.
1. Significant Accounting Policies
The following accounting policies are in accordance with U.S. generally accepted accounting principles and are consistently followed by the Funds.
Security Valuation — Equity securities, except those traded on the Nasdaq Stock Markets, Inc. (Nasdaq), are valued at the last quoted sales price as of the time of the regular close of the New York Stock Exchange (NYSE) on the valuation date. Securities traded on the Nasdaq are valued in accordance with the Nasdaq Official Closing Price, which may not be the last sales price. If on a particular day an equity security does not trade, then the mean between the bid and asked prices will be used. Securities listed on a foreign exchange are valued at the last quoted sales price on valuation date. U.S. government and agency securities are valued at the mean between the bid and asked prices. Other long-term debt securities, credit default swap (CDS) contracts and interest rate swap contracts are valued by an independent pricing service or broker. To the extent current market prices are not available, the pricing service may take into account developments related to the specific security, as well as transactions in comparable securities. Short-term debt securities having less than 60 days to maturity are valued at amortized cost, which approximates market value. Securities lending collateral, which is invested in a collective investment vehicle (Collective Trust), is valued at unit value per share. Foreign currency exchange contracts and foreign forward cross currency exchange contracts are valued at the mean between the bid and
76
asked prices. Interpolated values are derived when the settlement date of the contract is an interim date for which quotations are not available. Financial futures contracts and options on futures contracts are valued at the daily quoted settlement prices. Exchange-traded options are valued at the last reported sale price or, if no sales are reported, at the mean between the last reported bid and asked prices. Generally, index swap contracts and other securities and assets for which market quotations are not readily available are valued at fair value as determined in good faith under the direction of each Fund’s Board of Trustees (Board). In determining whether market quotations are readily available or fair valuation will be used, various factors will be taken into consideration, such as market closures, or with respect to foreign securities, aftermarket trading or significant events after local market trading (e.g., government actions or pronouncements, trading volume or volatility on markets, exchanges among dealers, or news events).
In September 2006, the Financial Accounting Standards Board (FASB) issued FASB Statement No. 157 “Fair Value Measurements” (FAS 157). FAS 157 establishes a framework for measuring fair value in U.S. generally accepted accounting principles, clarifies the definition of fair value within that framework, and expands disclosures about the use of fair value measurements. FAS 157 is intended to increase consistency and comparability among fair value estimates used in financial reporting. FAS 157 is effective for fiscal years beginning after November 15, 2007. Management does not expect the adoption of FAS 157 to have a material impact on the amounts reported in the financial statements.
Federal Income Taxes — Each Fund intends to continue to qualify for federal income tax purposes as a regulated investment company under Subchapter M of the Internal Revenue Code of 1986, as amended, and make the requisite distributions to shareholders. Accordingly, no provision for federal income taxes has been made in the financial statements.
Effective January 31, 2008, the Funds adopted FASB Interpretation No. 48 “Accounting for Uncertainty in Income Taxes” (FIN 48). FIN 48 provides guidance for how uncertain tax positions should be recognized, measured, presented, and disclosed in the financial statements. FIN 48 requires the evaluation of tax positions taken or expected to be taken in the course of preparing each Fund’s tax returns to determine whether the tax positions are “more-likely-than-not” of being sustained by the applicable tax authority. Tax positions not deemed to meet the more-likely-than-not threshold would be recorded as a tax benefit or expense in the current year. The adoption of FIN 48 did not result in the recording of any tax benefit or expense in the current period.
Class Accounting — Investment income and common expenses are allocated to the various classes of each Fund on the basis of “settled shares” of each class in relation to the net assets of the Funds. Realized and unrealized gain (loss) on investments are allocated to the various classes of the Funds on the basis of daily net assets of each class. Distribution expenses relating to a specific class are charged directly to that class.
77
Notes to financial statements
Delaware Corporate Bond Fund and Delaware Extended Duration Bond Fund
1. Significant Accounting Policies (continued)
Repurchase Agreements — Each Fund may invest in a pooled cash account along with members of the Delaware Investments® Family of Funds pursuant to an exemptive order issued by the Securities and Exchange Commission. The aggregate daily balance of the pooled cash account is invested in repurchase agreements secured by obligations of the U.S. government. The respective collateral is held by each Fund’s custodian bank until the maturity of the respective repurchase agreements. Each repurchase agreement is at least 102% collateralized. However, in the event of default or bankruptcy by the counterparty to the agreement, realization of the collateral may be subject to legal proceedings. At July 31, 2008, the Delaware Extended Duration Bond Fund held no investments in repurchase agreements.
Foreign Currency Transactions — Transactions denominated in foreign currencies are recorded at the prevailing exchange rates on the valuation date. The value of all assets and liabilities denominated in foreign currencies is translated into U.S. dollars at the exchange rate of such currencies against the U.S. dollar daily. Transaction gains or losses resulting from changes in exchange rates during the reporting period or upon settlement of the foreign currency transaction are reported in operations for the current period. The Funds isolate that portion of realized gains and losses on investments in debt securities, which are due to changes in foreign exchange rates from that which are due to changes in market prices of debt securities. The Funds report certain foreign currency related transactions as components of realized gains (losses) for financial reporting purposes, whereas such components are treated as ordinary income (loss) for federal income tax purposes.
Use of Estimates — The preparation of financial statements in conformity with U.S. generally accepted accounting principles requires management to make estimates and assumptions that affect the reported amounts of assets and liabilities at the date of the financial statements and the reported amounts of revenues and expenses during the reporting period. Actual results could differ from those estimates.
Other — Expenses directly attributable to a Fund are charged directly to that Fund. Other expenses common to various funds within the Delaware Investments® Family of Funds are generally allocated amongst such funds on the basis of average net assets. Management fees and some other expenses are paid monthly. Security transactions are recorded on the date the securities are purchased or sold (trade date) for financial reporting purposes. Costs used in calculating realized gains and losses on the sale of investment securities are those of the specific securities sold. Dividend income is recorded on the ex-dividend date and interest income is recorded on the accrual basis. Discounts and premiums on non-convertible bonds are amortized to interest income over the lives of the respective securities. Realized gains (losses) on paydowns of mortgage- and asset-backed securities are classified as interest income. Withholding taxes on foreign interest have been recorded in accordance with the Funds’ understanding of the applicable country’s tax rules and rates. Each Fund declares dividends daily from net investment income and pays such dividends monthly and declares and pays distributions from net realized gain on investments, if any, annually.
78
The Funds receive earnings credits from its custodian when positive cash balances are maintained, which are used to offset custody fees. The expense paid under this arrangement is included in custodian fees on the statements of operations with the corresponding expense offset shown as “expense paid indirectly.”
| 2. | | Investment Management, Administration Agreements and Other Transactions with Affiliates |
In accordance with the terms of its respective investment management agreement, each Fund pays Delaware Management Company (DMC), a series of Delaware Management Business Trust and the investment manager, an annual fee, which is calculated based on each Fund’s average daily net assets as follows:
| | Delaware | | Delaware |
| | Corporate | | Extended Duration |
| | Bond Fund | | Bond Fund |
| On the first $500 million | 0.500% | | 0.550% |
| On the next $500 million | 0.475% | | 0.500% |
| On the next $1.5 billion | 0.450% | | 0.450% |
| In excess of $2.5 billion | 0.425% | | 0.425% |
DMC has contractually agreed to waive that portion, if any, of its management fee and reimburse the Funds to the extent necessary to ensure that total annual operating expenses, (excluding any 12b-1 plan expenses, taxes, interest, inverse floater program expenses, brokerage fees, certain insurance costs, and non-routine expenses or costs including, but not limited to, those relating to reorganizations, litigation, conducting shareholder meetings, and liquidations (collectively, “non-routine expenses”)), do not exceed 0.65% of each Fund’s respective average daily net assets through November 30, 2008. For purposes of these waivers and reimbursements, non-routine expenses may also include such additional costs and expenses, as may be agreed upon from time to by the Funds’ Board and DMC. These expense waivers and reimbursements apply only to expenses paid directly by the Funds.
Effective October 1, 2007, Delaware Service Company, Inc. (DSC), an affiliate of DMC, provides fund accounting and financial administration oversight services to the Funds. For these services, the Funds pay DSC fees based on the aggregate daily net assets of the Delaware Investments® Family of Funds at the following annual rate: 0.0050% of the first $30 billion; 0.0045% of the next $10 billion; 0.0040% of the next $10 billion; and 0.0025% of aggregate average daily net assets in excess of $50 billion. The fees payable to DSC under the service agreement described above are allocated among all Funds in the Delaware Investments® Family of Funds on a relative net asset value basis. Prior to October 1, 2007, DSC provided fund accounting and administrative services to the Funds and received a fee at an annual rate of 0.04% of average daily net assets. For the year ended July 31, 2008, Delaware Corporate Bond Fund and Delaware Extended Duration Bond Fund was charged $65,520 and $29,162, respectively, for these services.
79
Notes to financial statements
Delaware Corporate Bond Fund and Delaware Extended Duration Bond Fund
| 2. | | Investment Management, Administration Agreements and Other Transactions with Affiliates (continued) |
DSC also provides dividend disbursing and transfer agency services. Each Fund pays DSC a monthly fee based on the number of shareholder accounts for dividend disbursing and transfer agent services.
Pursuant to a distribution agreement and distribution plan, each Fund pays DDLP, the distributor and an affiliate of DMC, an annual distribution and service fee not to exceed 0.30% of the average daily net assets of the Class A shares, 1.00% of the average daily net assets of the Class B and C shares and 0.60% of the average daily net assets of Class R shares. Institutional Class shares pay no distribution and service expenses. DDLP has contracted to limit the Class A and Class R shares’ 12b-1 fee for each Fund through November 30, 2008 to no more than 0.25% and 0.50% of average daily net assets, respectively.
At July 31, 2008, each Fund had liabilities payable to affiliates as follows:
| | Delaware | | Delaware |
| | Corporate | | Extended Duration |
| | Bond Fund | | Bond Fund |
| Investment management fee payable to DMC | $170,040 | | $43,682 |
| Dividend disbursing, transfer agent and fund, accounting | | | |
| oversight fees and other expenses payable to DSC | 94,688 | | 59,261 |
| Distribution fees payable to DDLP | 128,742 | | 55,616 |
| Other expenses payable to DMC and affiliates* | 11,833 | | 5,028 |
| *DMC, as part of its administrative services, pays operating expenses on behalf of each Fund and is reimbursed on a periodic basis. Such expenses include items such as printing of shareholder reports, fees for audit, legal and tax services, registration fees and trustees’ fees. |
As provided in the investment management agreement, each Fund bears the cost of certain legal and tax services, including internal legal and tax services provided to the Funds by DMC and/or its affiliates’ employees. For the year ended July 31, 2008, the Delaware Corporate Bond Fund and the Delaware Extended Duration Bond Fund were charged $41,475 and $18,282, respectively, for internal legal and tax services provided by DMC and/or its affiliates’ employees.
For the year ended July 31, 2008, DDLP earned commissions on sales of Class A shares for each Fund as follows:
| Delaware | | Delaware |
| Corporate | | Extended Duration |
| Bond Fund | | Bond Fund |
| | $10,675 | | $9,006 |
80
For the year ended July 31, 2008, DDLP received gross CDSC commissions on redemption of each Fund’s Class A, Class B, and Class C shares, respectively, and these commissions were entirely used to offset up-front commissions previously paid by DDLP to broker-dealers on sales of those shares. The amounts received were as follows:
| | Delaware | | Delaware |
| | Corporate | | Extended Duration |
| | Bond Fund | | Bond Fund |
| Class A | $18,652 | | $4,941 |
| Class B | 27,317 | | 8,120 |
| Class C | 12,243 | | 5,429 |
Trustees’ fees include expenses accrued by the Funds for each Trustee’s retainer and meeting fees. Certain officers of DMC, DSC and DDLP are officers and/or Trustees of the Trust. These officers and Trustees are paid no compensation by the Funds.
3. Investments
For the year ended July 31, 2008, the Funds made purchases and sales of investments securities other than short-term investments as follows:
| | Delaware | | Delaware |
| | Corporate | | Extended Duration |
| | Bond Fund | | Bond Fund |
| Purchases other than U.S. government securities | $1,317,621,894 | | $692,877,505 |
| Purchases of U.S. government securities | 733,653,543 | | 444,477,665 |
| Sales other than U.S. government securities | 1,279,408,919 | | 694,310,807 |
| Sales of U.S. government securities | 765,148,761 | | 476,434,996 |
At July 31, 2008, the cost of investments and unrealized appreciation (depreciation) for federal income tax purposes for each Fund were as follows:
| | Delaware | | Delaware |
| | Corporate | | Extended Duration |
| | Bond Fund | | Bond Fund |
| Cost of investments. | $597,819,514 | | | $232,289,013 | |
| Aggregate unrealized appreciation | 1,947,430 | | | 575,942 | |
| Aggregate unrealized depreciation | (29,954,255 | ) | | (11,285,992 | ) |
| Net unrealized depreciation | $ (28,006,825 | ) | | $ (10,710,050 | ) |
81
Notes to financial statements
Delaware Corporate Bond Fund and Delaware Extended Duration Bond Fund
4. Dividend and Distribution Information
Income and long-term capital gain distributions are determined in accordance with federal income tax regulations, which may differ from U.S. generally accepted accounting principles. Additionally, distributions from net gains on foreign currency transactions and net short-term gains on sales of investment securities are treated as ordinary income for federal income tax purposes. The tax character of dividends and distributions paid during the years ended July 31, 2008 and 2007 was as follows:
| | Delaware | | Delaware |
| | Corporate | | Extended Duration |
| | Bond Fund | | Bond Fund |
| | Year Ended | | Year Ended |
| | 7/31/08 | | 7/31/07 | | 7/31/08 | | 7/31/07 |
| Ordinary income | $31,159,551 | | $32,722,649 | | $14,509,045 | | $13,574,128 |
5. Components of Net Assets on a Tax Basis
As of July 31, 2008, the components of net assets on a tax basis were as follows:
| | Delaware | | Delaware |
| | Corporate | | Extended Duration |
| | Bond Fund | | Bond Fund |
| Shares of beneficial interest | $612,027,121 | | | $246,898,511 | |
| Undistributed (Distributions in excess of) | | | | | |
| ordinary income | (262,014 | ) | | 968,067 | |
| Post-October losses | (16,430,114 | ) | | (7,611,219 | ) |
| Capital loss carryforwards | (3,414,227 | ) | | (6,616,539 | ) |
| Other temporary differences | (360,071 | ) | | (9,533 | ) |
| Unrealized depreciation on investments | | | | | |
| and foreign currencies | (27,995,486 | ) | | (10,692,649 | ) |
| Net assets | $563,565,209 | | | $222,936,638 | |
The differences between book basis and tax basis components of the net assets are primarily attributable to tax deferral of losses on wash sales, mark-to-market on financial futures contracts, mark-to-market on foreign currency contracts, tax deferral of losses on straddles, tax treatment of CDS contracts, and tax treatment of market discount and premium on debt instruments.
82
Post-October losses represent losses realized on investments from November 1, 2007 through July 31, 2008 that, in accordance with federal income tax regulations, the Funds have elected to defer and treat as having arisen in the following fiscal year.
For financial reporting purposes, capital accounts are adjusted to reflect the tax character of permanent book/tax differences. Reclassifications are primarily due to tax treatment of gain (loss) on foreign currency transactions, market discount and premium on certain debt instruments, paydowns of mortgage- and asset-backed securities and CDS contracts. Results of operations and net assets were not affected by these reclassifications. For the year ended July 31, 2008, the Funds recorded the following reclassifications:
| | Delaware | | Delaware |
| | Corporate | | Extended Duration |
| | Bond Fund | | Bond Fund |
| Undistributed (Distributions in excess of) | | | | | |
| net investment income | $(811,555 | ) | | $ 895,917 | |
| Accumulated net realized loss | 811,555 | | | (895,917 | ) |
For federal income tax purposes, capital loss carryforwards may be carried forward and applied against future capital gains. The Delaware Corporate Bond Fund utilized $ 2,143,887 in 2008. Capital loss carryforwards remaining at July 31, 2008 will expire as follows:
| Delaware | | Delaware |
| Corporate | | Extended Duration |
| Bond Fund | | Bond Fund |
| 2013 | $ | 11,910 | | | $ — | |
| 2014 | | 519,965 | | | 807,298 | |
| 2015 | | 2,882,352 | | | 2,899,754 | |
| 2016 | | — | | | 2,909,487 | |
| Total | $ | 3,414,227 | | | $6,616,539 | |
83
Notes to financial statements
Delaware Corporate Bond Fund and Delaware Extended Duration Bond Fund
6. Capital Shares
Transactions in capital shares were as follows:
| | Delaware | | Delaware |
| | Corporate | | Extended Duration |
| | Bond Fund | | Bond Fund |
| | Year Ended | | Year Ended |
| | 7/31/08 | | 7/31/07 | | 7/31/08 | | 7/31/07 |
| Shares sold: | | | | | | | | | | | |
| Class A | 15,906,531 | | | 21,758,056 | | | 16,697,987 | | | 21,316,320 | |
| Class B | 111,436 | | | 539,456 | | | 55,654 | | | 167,484 | |
| Class C | 2,762,281 | | | 5,385,401 | | | 768,966 | | | 2,231,784 | |
| Class R | 2,148,321 | | | 2,084,665 | | | 28,459 | | | 41,713 | |
| Institutional Class | 15,935,019 | | | 18,902,803 | | | 2,090,645 | | | 6,394,042 | |
| |
| Shares issued upon reinvestment of dividends and distributions: |
| Class A | 2,104,569 | | | 1,853,572 | | | 1,684,674 | | | 1,130,626 | |
| Class B | 95,483 | | | 127,659 | | | 33,023 | | | 38,843 | |
| Class C | 447,592 | | | 382,319 | | | 118,437 | | | 96,547 | |
| Class R | 147,161 | | | 85,905 | | | 3,095 | | | 1,106 | |
| Institutional Class | 489,733 | | | 1,308,784 | | | 285,849 | | | 306,077 | |
| | 40,148,126 | | | 52,428,620 | | | 21,766,789 | | | 31,724,542 | |
| Shares repurchased: | | | | | | | | | | | |
| Class A | (21,833,650 | ) | | (15,316,629 | ) | | (20,163,900 | ) | | (6,325,295 | ) |
| Class B | (1,354,649 | ) | | (893,536 | ) | | (275,051 | ) | | (290,788 | ) |
| Class C | (3,596,943 | ) | | (2,336,541 | ) | | (1,130,548 | ) | | (670,484 | ) |
| Class R | (2,872,153 | ) | | (412,037 | ) | | (4,972 | ) | | (1,256 | ) |
| Institutional Class | (9,971,956 | ) | | (30,212,152 | ) | | (7,387,687 | ) | | (7,499,501 | ) |
| | (39,629,351 | ) | | (49,170,895 | ) | | (28,962,158 | ) | | (14,787,324 | ) |
| Net increase (decrease) | 518,775 | | | 3,257,725 | | | (7,195,369 | ) | | 16,937,218 | |
84
For the years ended July 31, 2008 and 2007, Class B shares were converted to Class A shares as follows*:
| | | | Year Ended | | | | | | Year Ended | | |
| | | | 7/31/08 | | | | | | 7/31/07 | | |
| | Class B | | Class A | | | | Class B | | Class A | | |
| | Shares | | Shares | | Value | | Shares | | Shares | | Value |
| Delaware Corporate Bond | 181,945 | | 181,720 | | $990,408 | | 100,806 | | 100,788 | | $564,417 |
| Delaware Extended Duration | 53,478 | | 53,378 | | 287,169 | | 11,523 | | 11,509 | | 65,140 |
| *The respective amounts are included in Class B redemptions and Class A subscriptions in the table on previous page and the statements of changes in net assets. |
7. Line of Credit
Each Fund, along with certain other funds in the Delaware Investments® Family of Funds (Participants), participates in a $225,000,000 revolving line of credit facility to be used for temporary or emergency purposes as an additional source of liquidity to fund redemptions of investor shares. The Participants are charged an annual commitment fee, which is allocated across the Participants on the basis of each Fund’s allocation of the entire facility. The Participants may borrow up to a maximum of one third of their net assets under the agreement. The Funds had no amounts outstanding as of July 31, 2008, or at any time during the year then ended.
8. Foreign Currency Exchange Contracts
Each Fund may enter into foreign currency exchange contracts and foreign cross currency exchange contracts as a way of managing foreign exchange rate risk. Each Fund may enter into these contracts to fix the U.S. dollar value of a security that it has agreed to buy or sell for the period between the date the trade was entered into and the date the security is delivered and paid for. The Funds may also use these contracts to hedge the U.S. dollar value of securities it already owns that are denominated in foreign currencies. The change in value is recorded as an unrealized gain or loss. When the contract is closed, a realized gain or loss is recorded equal to the difference between the value of the contract at the time it was opened and the value at the time it was closed.
The use of foreign currency exchange contracts and foreign cross currency exchange contracts does not eliminate fluctuations in the underlying prices of the securities, but does establish a rate of exchange that can be achieved in the future. Although foreign currency exchange contracts limit the risk of loss due to a decline in the value of the hedged currency, they also limit any potential gain that might result should the value of the currency increase. In addition, the Funds could be exposed to risks if the counterparties to the contracts are unable to meet the terms of their contracts.
85
Notes to financial statements
Delaware Corporate Bond Fund and Delaware Extended Duration Bond Fund
9. Financial Futures Contracts
Each Fund may invest in financial futures contracts to hedge its existing portfolio securities against fluctuations in fair value caused by changes in prevailing market interest rates. Upon entering into a futures contract, each Fund deposits cash or pledges U.S. government securities to a broker, equal to the minimum “initial margin” requirements of the exchange on which the contract is traded. Subsequent payments are received from the broker or paid to the broker each day, based on the daily fluctuation in the market value of the contract. These receipts or payments are known as “variation margin” and are recorded daily by each Fund as unrealized gains or losses until the contracts are closed.
When the contracts are closed, each Fund records a realized gain or loss equal to the difference between the value of the contract at the time it was opened and the value at the time it was closed. Risks of entering into futures contracts include potential imperfect correlation between the futures contracts and the underlying securities and the possibility of an illiquid secondary market for these instruments.
10. Written Options
During the year ended July 31, 2008, the Funds entered into options contracts in accordance with its investment objectives. When each Fund writes an option, a premium is received and a liability is recorded and adjusted on a daily basis to reflect the current market value of the options written. Premiums received from writing options that expire unexercised are treated by each Fund on the expiration date as realized gains. The difference between the premium received and the amount paid on effecting a closing purchase transaction, including brokerage commissions, is treated as realized gain or loss. If a call option is exercised, the premium is added to the proceeds from the sale of the underlying security in determining whether each Fund has a realized gain or loss. If a put option is exercised, the premium reduces the cost basis of the securities purchased by the Funds. Each Fund, as writer of an option, bears the market risk of an unfavorable change in the price of the security underlying the written option.
Transactions in options written during the year ended July 31, 2008 for each Fund was as follows:
| | Delaware | | Delaware |
| | Corporate | | Extended Duration |
| | Bond Fund | | Bond Fund |
| | Number of | | | | | | Number of | | | | |
| | contracts | | Premiums | | contracts | | Premiums |
| Options outstanding at | | | | | | | | | | | | | | |
| July 31, 2007 | | — | | | $ | — | | | — | | | $ | — | |
| Options written | | 669 | | | | 361,575 | | | 813 | | | | 798,481 | |
| Options expired | | — | | | | — | | | (159 | ) | | | (126,300 | ) |
| Options terminated in closing | | | | | | | | | | | | | | |
| purchase transactions | | (669 | ) | | | (361,575 | ) | | (654 | ) | | | (672,181 | ) |
| Options outstanding at | | | | | | | | | | | | | | |
| July 31, 2008 | | — | | | $ | — | | | — | | | $ | — | |
86
11. Swap Contracts
Each Fund may enter into interest rate swap contracts, index swap contracts and CDS contracts in accordance with its investment objectives. The Funds may use interest rate swaps to adjust the Funds’ sensitivity to interest rates or to hedge against changes in interest rates. Index swaps may be used to gain exposure to markets that each Fund invests in, such as the corporate bond market. The Funds may also use index swaps as a substitute for futures or options contracts if such contracts are not directly available to the Funds on favorable terms. The Funds may enter into CDS contracts in order to hedge against a credit event, to enhance total return or to gain exposure to certain securities or markets.
An interest rate swap involves payments received by the Funds from another party based on a variable or floating interest rate, in return for making payments based on a fixed interest rate. An interest rate swap can also work in reverse with the Funds’ receiving payments based on a fixed interest rate and making payments based on a variable or floating interest rate. Interest rate swaps may be used to adjust the Funds’ sensitivity to interest rates or to hedge against changes in interest rates. Periodic payments on such contracts are accrued daily and recorded as unrealized appreciation/depreciation on swap contracts. Upon periodic payment/receipt or termination of the contract, such amounts are recorded as realized gains or losses on swap contracts.
Index swaps involve commitments to pay interest in exchange for a market-linked return based on a notional amount. To the extent the total return of the security, instrument or basket of instruments underlying the transaction exceeds the offsetting interest obligation, each Fund will receive a payment from the counterparty. To the extent the total return of the security, instrument or basket of instruments underlying the transaction falls short of the offsetting interest obligation, each Fund will make a payment to the counterparty. The change in value of swap contracts outstanding, if any, is recorded as unrealized appreciation or depreciation daily. A realized gain or loss is recorded on maturity or termination of the swap contract.
A CDS contract is a risk-transfer instrument through which one party (purchaser of protection) transfers to another party (seller of protection) the financial risk of a credit event (as defined in the CDS agreement), as it relates to a particular reference security or basket of securities (such as an index). In exchange for the protection offered by the seller of protection, the purchaser of protection agrees to pay the seller of protection a periodic amount at a stated rate that is applied to the notional amount of the CDS contract. In addition, an upfront payment may be made or received by the Fund in connection with an unwinding or assignment of a CDS contract. Upon the occurrence of a credit event, the seller of protection would pay the par (or other agreed-upon) value of the referenced security (or basket of securities) to the counterparty.
During the year ended July 31, 2008, the Funds entered into CDS contracts as a purchaser and seller of protection. Periodic payments (receipts) on such contracts are accrued daily and recorded as unrealized losses (gains) on swap contracts. Upon payment (receipt), such amounts are recorded as realized losses (gains) on swap contracts. Upfront payments made or received in connection with CDS contracts are amortized over the expected life of the CDS contracts as
87
Notes to financial statements
Delaware Corporate Bond Fund and Delaware Extended Duration Bond Fund
11. Swap Contracts (continued)
unrealized losses (gains) on swap contracts. The change in value of CDS contracts is recorded as unrealized appreciation or depreciation daily. A realized gain or loss is recorded upon a credit event (as defined in the CDS agreement) or the maturity or termination of the agreement.
CDSs may involve greater risks than if a Fund had invested in the referenced obligation directly. CDSs are subject to general market risk, liquidity risk, counterparty risk and credit risk. If the Funds enter into a CDS contract as a purchaser of protection and no credit event occurs, its exposure is limited to the periodic payments previously made to the counterparty.
Because there is no organized market for swap contracts, the value of open swaps may differ from that which would be realized in the event each Fund terminated its position in the agreement. Risks of entering into these agreements include the potential inability of the counterparty to meet the terms of the contracts. This type of risk is generally limited to the amount of favorable movements in the value of the underlying security, instrument, or basket of instruments, if any, at the day of default. Risks also arise from potential losses from adverse market movements and such losses could exceed the unrealized amounts.
12. Securities Lending
Each Fund, along with other funds in the Delaware Investments® Family of Funds, may lend its securities pursuant to a security lending agreement (Lending Agreement) with The Bank of New York Mellon (BNY Mellon). With respect to each loan, if the aggregate market value of the collateral held on any business day is less than the aggregate market value of the securities which are the subject of such loan, the borrower will be notified to provide additional collateral not less than the applicable collateral requirement. Cash collateral received is invested in a Collective Trust established by BNY Mellon for the purpose of investment on behalf of clients participating in its securities lending programs. The Collective Trust invests in fixed income securities, with a weighted average maturity not to exceed 90 days, rated in one of the top three tiers by Standard & Poor’s Ratings Group or Moody’s Investors Service, Inc. or repurchase agreements collateralized by such securities. The Funds can also accept U.S. government securities and letters of credit (non-cash collateral) in connection with securities loans. In the event of default or bankruptcy by the lending agent, realization and/or retention of the collateral may be subject to legal proceedings. In the event the borrower fails to return loaned securities and the collateral received is insufficient to cover the value of the loaned securities and provided such collateral shortfall is not the result of investment losses, the lending agent has agreed to pay the amount of the shortfall to the Funds, or at the discretion of the lending agent, replace the loaned securities. The Funds continue to record dividends or interest, as applicable, on the securities loaned and is subject to change in value of the securities loaned that may occur during the term of the loan. The Funds have the right under the Lending Agreement to recover the securities from the borrower on demand. With respect to security loans collateralized by U.S. Treasury obligations, the Funds receive a fee from the securities lending agent. With respect to security loans collateralized by cash collateral, the
88
earnings from the collateral investments are shared among the Funds, the security lending agent and the borrower. The Funds record securities lending income net of allocations to the security lending agent and the borrower.
At July 31, the value of securities on loan is presented below, for which the Funds received collateral, comprised of non-cash collateral, and cash collateral. Investments purchased with cash collateral are presented on the statements of net assets under the caption “Securities Lending Collateral.”
| | Delaware | | Delaware |
| | Corporate | | Extended Duration |
| | Bond Fund | | Bond Fund |
| Market value | | | $ | 21,137,446 | | | | $ | 6,607,294 | |
| Non-cash collateral | | | | 180,441 | | | | | — | |
| Cash collateral | | | | 21,451,942 | | | | | 6,769,658 | |
13. Credit and Market Risk
Some countries in which the Funds may invest require governmental approval for the repatriation of investment income, capital or the proceeds of sales of securities by foreign investors. In addition, if there is deterioration in a country’s balance of payments or for other reasons, a country may impose temporary restrictions on foreign capital remittances abroad.
The securities exchanges of certain foreign markets are substantially smaller, less liquid and more volatile than the major securities markets in the United States. Consequently, acquisition and disposition of securities by the Funds may be inhibited. In addition, a significant portion of the aggregate market value of equity securities listed on the major securities exchanges in emerging markets is held by a smaller number of investors. This may limit the number of shares available for acquisition or disposition by the Funds.
Each Fund may invest a portion of its assets in high yield fixed income securities, which carry ratings of BB or lower by Standard & Poor’s Rating Group and/or Ba or lower by Moody’s Investor Services, Inc. Investments in these higher yielding securities are generally accompanied by a greater degree of credit risk than higher rated securities. Additionally, lower rated securities may be more susceptible to adverse economic and competitive industry conditions than investment grade securities.
Each Fund invests in fixed income securities whose value is derived from an underlying pool of mortgages or consumer loans. The value of these securities is sensitive to changes in economic conditions, including delinquencies and/or defaults, and may be adversely affected by shifts in the market’s perception of the issuers and changes in interest rates. Investors receive principal and interest payments as the underlying mortgages and consumer loans are paid back. Prepayment of mortgages may shorten the stated maturity of the obligations and can result in a loss of premium, if any has been paid. Some of these securities are collateralized mortgage obligations (CMOs). CMOs are debt securities issued by U.S. government agencies or by financial institutions and
89
Notes to financial statements
Delaware Corporate Bond Fund and Delaware Extended Duration Bond Fund
13. Credit and Market Risk (continued)
other mortgage lenders, which are collateralized by a pool of mortgages held under an indenture. Prepayment of mortgages may shorten the stated maturity of the obligations and can result in a loss of premium, if any has been paid. Certain of these securities may be stripped (securities which provide only the principal or interest feature of the underlying security). The yield to maturity on an interest-only CMO is extremely sensitive not only to changes in prevailing interest rates, but also to the rate of principal payments (including prepayments) on the related underlying mortgage assets. A rapid rate of principal payments may have a material adverse effect on each Fund’s yield to maturity. If the underlying mortgage assets experience greater than anticipated prepayments of principal, each Fund may fail to fully recoup its initial investment in these securities even if the securities are rated in the highest rating categories.
Each Fund may invest up to 15% of its net assets in illiquid securities, which may include securities with contractual restrictions on resale, securities exempt from registration under Rule 144A of the Securities Act of 1933, as amended, and other securities which may not be readily marketable. The relative illiquidity of these securities may impair the Funds from disposing of them in a timely manner and at a fair price when it is necessary or desirable to do so. While maintaining oversight, the Funds’ Board has delegated to DMC the day-to-day functions of determining whether individual securities are liquid for purposes of each Fund’s limitation on investments in illiquid assets. Securities eligible for resale pursuant to Rule 144A, which are determined to be liquid, are not subject to the Funds’ 15% limit on investments in illiquid securities. Rule 144A and illiquid securities have been identified on the statement of net assets.
14. Contractual Obligations
The Funds enter into contracts in the normal course of business that contain a variety of indemnifications. The Funds’ maximum exposure under these arrangements is unknown. However, the Funds have not had prior claims or losses pursuant to theses contracts. Management has reviewed the Funds’ existing contracts and expects the risk of loss to be remote.
15. Subsequent Event
At July 31, 2008, the Delaware Corporate Bond Fund and Delaware Extended Duration Bond Fund had direct and indirect exposure to investments with Lehman Brothers Holdings Inc. (“Lehman”) or Lehman’s affiliates, including bonds, derivatives, and foreign currency exchange contracts for which Lehman or Lehman’s affiliates was the issuer or counterparty. On September 15, 2008, Lehman filed for Chapter 11 bankruptcy protection.
Delaware Corporate Bond Fund
With respect to direct exposure to Lehman, the Fund held bonds valued at approximately 1.16% of net assets as of July 31, 2008. With respect to indirect exposure, the Fund’s exposure (before collateral) through credit default swaps and foreign currency exchange contracts where Lehman or Lehman’s affiliate was counterparty was approximately 0.22% of net assets (which represents the net unrealized appreciation/depreciation on the Fund’s books) as of July 31, 2008. The Fund
90
received U.S. treasury securities as collateral from Lehman or Lehman’s affiliate for a significant portion of this indirect exposure.
As of September 12, 2008, approximately 0.03% and 0.34% of the Fund’s net assets were subject to the direct and indirect exposure of Lehman or Lehman’s affiliate (before collateral), respectively. The Fund received U.S. treasury securities as collateral from Lehman or Lehman’s affiliate for a significant portion of this indirect exposure.
Delaware Extended Duration Bond Fund
With respect to direct exposure to Lehman, the Fund held bonds valued at approximately 0.93% of net assets as of July 31, 2008. With respect to indirect exposure, the Fund’s exposure (before collateral) through credit default swaps and foreign currency exchange contracts where Lehman or Lehman’s affiliate was counterparty was approximately 0.12% of net assets (which represents the net unrealized appreciation/depreciation on the Fund’s books) as of July 31, 2008. The Fund received U.S. treasury securities as collateral from Lehman or Lehman’s affiliate for a significant portion of this indirect exposure.
As of September 12, 2008, approximately 0.04% and 0.22% of the Fund’s net assets were subject to the direct and indirect exposure of Lehman or Lehman’s affiliate (before collateral), respectively. The Fund received U.S. treasury securities as collateral from Lehman or Lehman’s affiliate for a significant portion of this indirect exposure.
16. Tax Information (Unaudited)
The information set forth below is for each Fund’s fiscal year as required by federal tax laws. Shareholders, however, must report distributions on a calendar year basis for income tax purposes, which may include distributions for portions of two fiscal years of a fund. Accordingly, the information needed by shareholders for income tax purposes will be sent to them in January of each year. Please consult your tax advisor for proper treatment of this information.
For the fiscal year ended July 31, 2008, each Fund designates distributions paid during the year as follows:
| | Delaware | | Delaware |
| | Corporate | | Extended Duration |
| | Bond Fund | | Bond Fund |
| (A) Ordinary Income Distributions (Tax Basis)* | | 100% | | 100% |
| Total Distributions (Tax Basis) | | 100% | | 100% |
(A) is based on a percentage of each Fund’s total distributions.
*For the fiscal year ended July 31, 2008, certain interest income paid by the Funds, determined to be Qualified Interest Income may be subject to relief from U.S. withholding for foreign shareholders, as provided by the American Jobs Creation Act of 2004. For the fiscal year ended July 31, 2008, the Delaware Corporate Bond Fund and the Delaware Extended Duration Bond Fund have designated a maximum distribution of $31,159,551 and $14,444,095 of Qualified Interest Income, respectively.
91
Report of independent
registered public accounting firm
To the Shareholders and Board of Trustees
Delaware Group® Income Funds — Delaware Corporate Bond Fund and
Delaware Extended Duration Bond Fund
We have audited the accompanying statements of net assets and statements of assets and liabilities of Delaware Corporate Bond Fund and Delaware Extended Duration Bond Fund (two of the series constituting Delaware Group Income Funds) (the “Funds”) as of July 31, 2008, and the related statements of operations for the year then ended, the statements of changes in net assets for each of the two years in the period then ended, and the financial highlights for each of the periods indicated therein. These financial statements and financial highlights are the responsibility of the Funds’ management. Our responsibility is to express an opinion on these financial statements and financial highlights based on our audits.
We conducted our audits in accordance with the standards of the Public Company Accounting Oversight Board (United States). Those standards require that we plan and perform the audit to obtain reasonable assurance about whether the financial statements and financial highlights are free of material misstatement. We were not engaged to perform an audit of the Fund’s internal control over financial reporting. Our audits included consideration of internal control over financial reporting as a basis for designing audit procedures that are appropriate in the circumstances, but not for the purpose of expressing an opinion on the effectiveness of the Fund’s internal control over financial reporting. Accordingly, we express no such opinion. An audit also includes examining, on a test basis, evidence supporting the amounts and disclosures in the financial statements and financial highlights, assessing the accounting principles used and significant estimates made by management, and evaluating the overall financial statement presentation. Our procedures included confirmation of securities owned as of July 31, 2008 by correspondence with the custodian and brokers or by other appropriate auditing procedures where replies from brokers were not received. We believe that our audits provide a reasonable basis for our opinion.
In our opinion, the financial statements and financial highlights referred to above present fairly, in all material respects, the financial position of the Delaware Corporate Bond Fund and the Delaware Extended Duration Bond Fund series of Delaware Group Income Funds at July 31, 2008, the results of their operations for the year then ended, the changes in their net assets for each of the two years in the period then ended, and their financial highlights for each of the periods indicated therein, in conformity with U.S. generally accepted accounting principles.

Philadelphia, Pennsylvania
September 18, 2008
92
Other Fund information
Delaware Corporate Bond Fund and Delaware Extended Duration Bond Fund
Board Consideration of Delaware Corporate Bond Fund and Delaware Extended Duration Bond Fund Investment Advisory Agreement
At a meeting held on May 20-22, 2008 (the “Annual Meeting”), the Board of Trustees, including a majority of disinterested or independent Trustees, approved the renewal of the Investment Advisory Agreements for the Delaware Corporate Bond Fund and Delaware Extended Duration Bond Fund (each a “Fund” and collectively, the “Funds”). In making its decision, the Board considered information furnished throughout the year at regular quarterly Board meetings, including reports detailing Fund performance, investment strategies and expenses, as well as information prepared specifically in connection with the renewal of the investment advisory contracts. Information furnished specifically in connection with the renewal of the Investment Advisory Agreement with Delaware Management Company (“DMC”) included materials provided by DMC and its affiliates (“Delaware Investments”) concerning, among other things, the nature, extent and quality of services provided to the Funds, the costs of such services to the Funds, economies of scale and the financial condition and profitability of Delaware Investments. In addition, in connection with the Meeting, the Board separately received and reviewed in February 2008 independent historical and comparative reports prepared by Lipper Inc. (“Lipper”), an independent statistical compilation organization. The Lipper reports compared each Fund’s investment performance and expenses with those of other comparable mutual funds. The independent Trustees reviewed such Lipper reports with Counsel to the Independent Trustees at the February 2008 Board Meeting, and discussed such reports further with such counsel earlier in the Annual Meeting. The Board requested and received certain information regarding management’s policy with respect to advisory fee levels and its philosophy with respect to breakpoints; the structure of portfolio manager compensation; the investment manager’s profitability; and any constraints or limitations on the availability of securities in certain investment styles which might inhibit DMC’s ability to invest fully in accordance with Fund policies.
In considering information relating to the approval of each Fund’s advisory agreements, the independent Trustees received assistance and advice from and met separately with independent counsel. Although the Trustees gave attention to all information furnished, the following discussion identifies under separate headings the primary factors taken into account by the Board in its contract renewal considerations.
Nature, Extent And Quality of Service. Consideration was given to the services provided by Delaware Investments to the Funds and their shareholders. In reviewing the nature, extent and quality of services, the Board emphasized reports furnished to it throughout the year at regular Board Meetings covering matters such as the relative performance of the Funds, compliance of portfolio managers with the investment policies, strategies and restrictions for the Funds, the compliance of management personnel with the Code of Ethics adopted throughout the Delaware Investments Family of Funds complex and the adherence to fair value pricing procedures as established by the Board. The Board noted that it was pleased with the current staffing of the Funds’ investment advisor and the emphasis placed on research in the investment
93
Other Fund information
Delaware Corporate Bond Fund and Delaware Extended Duration Bond Fund
Board Consideration of Delaware Corporate Bond Fund and Delaware Extended Duration Bond Fund Investment Advisory Agreement (continued)
process. Favorable consideration was given to DMC’s efforts to maintain, and in some instances increase, financial and human resources committed to fund matters. The Board also considered the transfer agent and shareholder services provided to Fund shareholders by Delaware Investments’ affiliate, Delaware Service Company, Inc. (“DSC”), noting DSC’s commitment to maintain a high level of service and the continuing expenditures by Delaware Investments to improve the delivery of shareholder services. Additionally, during 2007 management commenced the outsourcing of certain investment accounting functions that are expected to further improve the quality and cost of delivering investment accounting services to the Funds. The Board noted the extent of benefits provided to Fund shareholders for being part of the Delaware Investments Family of Funds, including each shareholder’s ability to exchange an investment in one Delaware fund for the same class of shares in another Delaware fund without a sales charge, the ability to reinvest Fund dividends into other Delaware funds and the privilege to combine holdings in other Delaware funds to obtain a reduced sales charge. The Board was satisfied with the nature, extent and quality of the overall services provided by Delaware Investments.
Investment Performance. The Board considered the investment performance of DMC and the Funds. The Board placed significant emphasis on the investment performance of the Funds in view of its importance to shareholders. Although the Board gave appropriate consideration to performance reports and discussions with portfolio managers at Investment Committee meetings throughout the year, the Board gave particular weight to the Lipper reports furnished for the Annual Meeting. The Lipper reports prepared for each Fund showed the investment performance of its Class A shares in comparison to a group of similar funds as selected by Lipper (the “Performance Universe”). A fund with the best performance ranked first, and a fund with the poorest, ranked last. The highest/best performing 25% of funds in the Performance Universe make up the first quartile; the next 25% - the second quartile; the next 25% - the third quartile; and the poorest/worst performing 25% of funds in the Performance Universe make up the fourth quartile. Comparative annualized performance for each Fund was shown for the past one-, three- and five-year periods ended December 31, 2007. The Board noted its objective that each Fund’s performance for the periods considered be at or above the median of its Performance Universe. The following paragraph summarizes the performance results for each Fund and the Board’s view of such performance.
Delaware Corporate Bond Fund — The Performance Universe for the Fund consisted of the Fund and all retail and institutional BBB-rated corporate debt funds as selected by Lipper. The Lipper report comparison showed that the Fund’s total return for the one-year period was in the third quartile of its Performance Universe. The report further showed that the Fund’s total return for the three- and five-year periods was in the second quartile. The Board noted that the Fund’s performance results were mixed but on an overall basis tended toward median, which was acceptable.
94
Delaware Extended Duration Bond Fund — The Performance Universe for the Fund consisted of the Fund and all retail and institutional BBB-rated corporate debt funds as selected by Lipper. The Lipper report comparison showed that the Fund’s total return for the one-year period was in the fourth quartile of its Performance Universe. The report further showed that the Fund’s total return for the three- and five-year periods was in the second quartile and first quartile, respectively. The Board noted that the Fund’s performance results were mixed but on an overall basis tended toward median, which was acceptable.
Comparative Expenses. The Board considered expense comparison data for the Delaware Investments Family of Funds. Management provided the Board with information on pricing levels and fee structures for the Funds as of October 31, 2007 and fiscal year end for each fund as of August 31, 2007. The Board focused particularly on the comparative analysis of the effective management fees and total expense ratios of each Fund and the effective management fees and expense ratios of a group of similar funds as selected by Lipper (the “Expense Group”). In reviewing comparative costs, each Fund’s contractual management fee and the actual management fee incurred by the Fund were compared with the contractual management fees (assuming all funds in the Expense Group were similar in size to the Fund) and actual management fees (as reported by each fund) of other funds within the Expense Group, taking into account any applicable breakpoints and fee waivers. Each Fund’s total expenses were also compared with those of its Expense Group. The Lipper total expenses, for comparative consistency, were shown by Lipper for Class A shares and compared total expenses including 12b-1 and non-12b-1 service fees. The Board also considered fees paid to Delaware Investments for non-management services. The Board noted its objective to limit each Fund’s total expense ratio to an acceptable range as compared to the median of the Expense Group. The following paragraph summarizes the expense results for each Fund and the Board’s view of such expenses.
Delaware Corporate Bond Fund — The expense comparisons for the Fund showed that its actual management fee and total expenses were in the quartile with the lowest expenses of its Expense Group. The Board was satisfied with the management fee and total expenses of the Fund in comparison to its Expense Group as shown in the Lipper report.
Delaware Extended Duration Bond Fund — The expense comparisons for the Fund showed that its actual management fee and total expenses were in the quartile with the second lowest expenses of its Expense Group. The Board was satisfied with the management fee and total expenses of the Fund in comparison to its Expense Group as shown in the Lipper report.
Management Profitability. The Board considered the level of profits realized by Delaware Investments in connection with the operation of the Funds. In this respect, the Board reviewed the Investment Management Profitability Analysis that addressed the overall profitability of Delaware Investments’ business in providing management and other services to each of the individual funds and the Delaware Investments Family of Funds as a whole. Specific attention was given to the methodology followed in allocating costs for the purpose of determining
95
Other Fund information
Delaware Corporate Bond Fund and Delaware Extended Duration Bond Fund
Board Consideration of Delaware Corporate Bond Fund and Delaware Extended Duration Bond Fund Investment Advisory Agreement (continued)
profitability. Management stated that the level of profits of Delaware Investments, to a certain extent, reflected operational cost savings and efficiencies initiated by Delaware Investments. The Board considered Delaware Investments’ efforts to improve services provided to fund shareholders and to meet additional regulatory and compliance requirements resulting from recent SEC initiatives. The Board also considered the extent to which Delaware Investments might derive ancillary benefits from fund operations, including the potential for procuring additional business as a result of the prestige and visibility associated with its role as service provider to the Delaware Investments Family of Funds and the benefits from allocation of fund brokerage to improve trading efficiencies. The Board found that the management fees were reasonable in light of the services rendered and the level of profitability of Delaware Investments.
Economies of Scale. The Trustees considered whether economies of scale are realized by Delaware Investments as each Fund’s assets increase and the extent to which any economies of scale are reflected in the level of management fees charged. The Trustees took into account the standardized advisory fee pricing and structure, approved by the Board and shareholders and again reviewed by the Board this year, which includes breakpoints. Breakpoints in the advisory fee occur when the advisory fee rate is reduced on assets in excess of specified levels. This inclusion of breakpoints results in a lower advisory fee than would otherwise be the case on all assets when the asset levels specified are exceeded. The Board noted that the fee under each Fund’s management contract fell within the standard structure. With respect to the Delaware Corporate Bond Fund, the Board also noted that the Fund’s assets exceeded the first breakpoint level. The Board believed that, given the extent to which economies of scale might be realized by the advisor and its affiliates, the schedule of fees under the Investment Advisory Agreement provides a sharing of benefits with the Fund and its shareholders. With respect to the Delaware Extended Duration Bond Fund, although the Fund has not reached a size at which it can take advantage of breakpoints, the Board recognized that the fee was structured so that when the Fund grows, economies of scale may be shared.
Fund management
Thomas H. Chow, CFA
Senior Vice President, Senior Portfolio Manager
Thomas H. Chow is a member of the firm’s taxable fixed income portfolio management team with primary responsibility for portfolio construction and strategic asset allocation. His experience includes significant exposure to asset liability management strategies and credit risk opportunities. Prior to joining Delaware Investments in 2001, he was a trader of high grade and high yield securities, and was involved in the portfolio management of collateralized bond obligations (CBOs) and insurance portfolios at SunAmerica/AIG from 1997 to 2001. Before that, he was an analyst, trader, and portfolio manager at Conseco Capital Management from 1989 to 1997. Chow received a bachelor’s degree in business analysis from Indiana University, and he is a Fellow of Life Management Institute.
96
Roger A. Early, CPA, CFA, CFP
Senior Vice President, Senior Portfolio Manager
Roger A. Early is a member of the firm’s taxable fixed income portfolio management team with primary responsibility for portfolio construction and strategic asset allocation. He rejoined Delaware Investments in March 2007. During his previous tenure at the firm, from 1994 to 2001, he was a senior portfolio manager in the same area, and he left Delaware Investments as head of its U.S. investment grade fixed income group. Early most recently worked at Chartwell Investment Partners, where he served as a senior portfolio manager in fixed income from 2003 to 2007. He also worked at Turner Investments from 2002 to 2003, where he served as chief investment officer for fixed income, and Rittenhouse Financial from 2001 to 2002. He started his career in Pittsburgh, leaving to join Delaware Investments in 1994 after 10 years at Federated Investors. Early earned his bachelor’s degree in economics from The Wharton School of the University of Pennsylvania and an MBA with concentrations in finance and accounting from the University of Pittsburgh, and he is a member of the CFA Society of Philadelphia.
Kevin P. Loome, CFA
Senior Vice President, Senior Portfolio Manager, Head of High Yield Investments
Kevin P. Loome is head of the High Yield fixed income team, responsible for portfolio construction and strategic asset allocation of all high yield fixed income assets. Prior to joining Delaware Investments in August 2007, Loome spent 11 years at T. Rowe Price, starting as an analyst and leaving the firm as a portfolio manager. He began his career with Morgan Stanley as a corporate finance analyst in the New York and London offices. Loome received his bachelor’s degree in commerce from the University of Virginia and earned an MBA from the Tuck School of Business at Dartmouth.
97
Board of trustees/directors and officers addendum
Delaware Investments® Family of Funds
A mutual fund is governed by a Board of Trustees/Directors (“Trustees”), which has oversight responsibility for the management of a fund’s business affairs. Trustees establish procedures and oversee and review the performance of the investment manager, the distributor, and others who perform services for the fund. The independent fund trustees, in particular, are advocates
| Name, Address, | | Position(s) | | Length of |
| and Birth Date | | Held with Fund(s) | | Time Served |
| Interested Trustees | | | | |
| | | | | |
| Patrick P. Coyne1 | | Chairman, President, | | Chairman and Trustee |
| 2005 Market Street | | Chief Executive Officer, | | since August 16, 2006 |
| Philadelphia, PA 19103 | | and Trustee | | |
| April 1963 | | | | President and |
| | | | | Chief Executive Officer |
| | | | | since August 1, 2006 |
| |
| |
| |
| |
| |
| |
| |
| |
| |
| |
| |
| |
| |
| Independent Trustees | | | | |
| | | | | |
| Thomas L. Bennett | | Trustee | | Since March 2005 |
| 2005 Market Street | | | | |
| Philadelphia, PA 19103 | | | | |
| October 1947 | | | | |
| | | | | |
| | | | | |
| | | | | |
| | | | | |
| | | | | |
| | | | | |
| | | | | |
| | | | | |
| | | | | |
| | | | | |
| | | | | |
1 Patrick P. Coyne is considered to be an “Interested Trustee” because he is an executive officer of the Fund’s(s’) investment advisor.
98
for shareholder interests. Each trustee has served in that capacity since he or she was elected to or appointed to the Board of Trustees, and will continue to serve until his or her retirement or the election of a new trustee in his or her place. The following is a list of the Trustees and Officers with certain background and related information.
| | Number of Portfolios in | | |
| Principal Occupation(s) | | Fund Complex Overseen | | Other Directorships |
| During Past 5 Years | | by Trustee or Officer | | Held by Trustee or Officer |
| | | | |
| | | | | |
| Patrick P. Coyne has served in | | 84 | | Director |
| various executive capacities | | | | Kaydon Corp. |
| at different times at | | | | |
| Delaware Investments.2 | | | | Board of Governors Member |
| | | | | Investment Company |
| | | | | Institute (ICI) |
| | | | | (2007–Present) |
| |
| |
| | | | | Member of Investment Committee |
| | | | | Cradle of Liberty Council, BSA |
| | | | | (November 2007–Present) |
| |
| |
| | | | | Finance Committee Member |
| | | | | St. John Vianney |
| | | | | Roman Catholic Church |
| | | | | (2007–Present) |
| | | | | |
| |
| | | | | |
| Private Investor | | 84 | | Director |
| (March 2004–Present) | | | | Bryn Mawr Bank Corp. (BMTC) |
| | | | | (April 2007–Present) |
| Investment Manager | | | | |
| Morgan Stanley & Co. | | | | Chairman of Investment |
| (January 1984–March 2004) | | | | Committee |
| | | | | The Haverford School |
| | | | | (2002–Present) |
| |
| | | | | Chairman of |
| | | | | Investment Committee |
| | | | | Pennsylvania Academy of |
| | | | | Fine Arts (2007–Present) |
| | | | Trustee (2004–Present) |
| | | | | |
2 Delaware Investments is the marketing name for Delaware Management Holdings, Inc. and its subsidiaries, including the Fund’s(s’) investment advisor, principal underwriter, and its transfer agent.
99
Board of trustees/directors and officers addendum
Delaware Investments® Family of Funds
| Name, Address, | | Position(s) | | Length of |
| and Birth Date | | Held with Fund(s) | | Time Served |
| Independent Trustees (continued) | | | | |
| | | | | |
| Thomas L. Bennett | | | | |
| (continued) | | | | |
| | | | | |
| | | | |
| | | | | |
| | | | | |
| John A. Fry | | Trustee | | Since January 2001 |
| 2005 Market Street | | | | |
| Philadelphia, PA 19103 | | | | |
| May 1960 | | | | |
| | | | | |
| | | | | |
| | | | |
| | | | | |
| Anthony D. Knerr | | Trustee | | Since April 1990 |
| 2005 Market Street | | | | |
| Philadelphia, PA 19103 | | | | |
| December 1938 | | | | |
| | | | |
| | | | | |
| Lucinda S. Landreth | | Trustee | | Since March 2005 |
| 2005 Market Street | | | | |
| Philadelphia, PA 19103 | | | | |
| June 1947 | | | | |
| Ann R. Leven | | Trustee | | Since October 1989 |
| 2005 Market Street | | | | |
| Philadelphia, PA 19103 | | | | |
| November 1940 | | | | |
| | | | | |
| Thomas F. Madison | | Trustee | | Since May 19973 |
| 2005 Market Street | | | | |
| Philadelphia, PA 19103 | | | | |
| February 1936 | | | | |
| | | | | |
| | | | |
| | | | | |
3 In 1997, several funds managed by Voyageur Fund Managers, Inc. (the “Voyageur Funds”) were incorporated into the Delaware Investments Family of Funds. Mr. Madison served as a director of the Voyageur Funds from 1993 until 1997.
100
| Number of Portfolios in | |
| Principal Occupation(s) | Fund Complex Overseen | Other Directorships |
| During Past 5 Years | by Trustee or Officer | Held by Trustee or Officer |
| |
| | | |
| | | Investment Committee |
| | | Member |
| | | Pennsylvania Horticultural |
| | | Society |
| | | (February 2006–Present) |
| |
| President | 84 | Director |
| Franklin & Marshall College | | Community Health Systems |
| (June 2002–Present) | | |
| | | Director |
| Executive Vice President | | Allied Barton |
| University of Pennsylvania | | Security Holdings |
| (April 1995–June 2002) | | |
| |
| Founder and | 84 | None |
| Managing Director | | |
| Anthony Knerr & Associates | | |
| (Strategic Consulting) | | |
| (1990–Present) | | |
| |
| Chief Investment Officer | 84 | None |
| Assurant, Inc. (Insurance) | | |
| (2002–2004) | | |
| |
| Consultant | 84 | Director and Audit |
| ARL Associates | | Committee Chair |
| (Financial Planning) | | Systemax, Inc. |
| (1983–Present) | | |
| |
| President and | 84 | Director and Chair of |
| Chief Executive Officer | | Compensation Committee, |
| MLM Partners, Inc. | | Governance Committee |
| (Small Business Investing | | Member |
| and Consulting) | | CenterPoint Energy |
| (January 1993–Present) | | |
| |
101
Board of trustees/directors and officers addendum
Delaware Investments® Family of Funds
| Name, Address, | Position(s) | Length of |
| and Birth Date | Held with Fund(s) | Time Served |
| Independent Trustees (continued) | | |
| |
| Thomas F. Madison | | |
| (continued) | | |
| |
| |
| |
| |
| |
| |
| |
| |
| |
| |
| |
| |
| |
| |
| |
| |
| |
| |
| |
| Janet L. Yeomans | Trustee | Since April 1999 |
| 2005 Market Street | | |
| Philadelphia, PA 19103 | | |
| July 1948 | | |
| |
| |
| |
| |
| J. Richard Zecher | Trustee | Since March 2005 |
| 2005 Market Street | | |
| Philadelphia, PA 19103 | | |
| July 1940 | | |
| |
| |
| |
| |
| |
| |
102
| | Number of Portfolios in | |
| Principal Occupation(s) | Fund Complex Overseen | Other Directorships |
| During Past 5 Years | by Trustee or Officer | Held by Trustee or Officer |
| |
| |
| | | Lead Director and Chair of |
| | | Audit and Governance |
| | | Committees, Member of |
| | | Compensation Committee |
| | Digital River, Inc. |
| | |
| | | Director and Chair of |
| | | Governance Committee, |
| | | Audit Committee |
| | | Member |
| �� | | Rimage Corporation |
| | |
| | Director and Chair of |
| | the Compensation Committee |
| | Spanlink Communications |
| | |
| | Lead Director and Chair of |
| | Compensation and |
| | Governance Committees |
| | Valmont Industries, Inc. |
| |
| Vice President and Treasurer | 84 | None |
| (January 2006–Present) | | |
| Vice President — Mergers & Acquisitions | | |
| (January 2003–January 2006), and | | |
| Vice President | | |
| (July 1995–January 2003) | | |
| 3M Corporation | | |
| |
| Founder | 84 | Director and Audit |
| Investor Analytics | | Committee Member |
| (Risk Management) | | Investor Analytics |
| (May 1999–Present) | | |
| | | Director and Audit |
| Founder | | Committee Member |
| Sutton Asset Management | | Oxigene, Inc. |
| (Hedge Fund) | | |
| (September 1996–Present) | | |
| |
103
Board of trustees/directors and officers addendum
Delaware Investments® Family of Funds
| Name, Address, | Position(s) | Length of |
| and Birth Date | Held with Fund(s) | Time Served |
| Officers | | |
| | | |
| David F. Connor | Vice President, | Vice President since |
| 2005 Market Street | Deputy General | September 2000 |
| Philadelphia, PA 19103 | Counsel, and Secretary | and Secretary since |
| December 1963 | | October 2005 |
| | | |
| |
| Daniel V. Geatens | Vice President | Treasurer |
| 2005 Market Street | and Treasurer | since October 25, 2007 |
| Philadelphia, PA 19103 | | |
| October 1972 | | |
| |
| David P. O’Connor | Senior Vice President, | Senior Vice President, |
| 2005 Market Street | General Counsel, | General Counsel, and |
| Philadelphia, PA 19103 | and Chief Legal Officer | Chief Legal Officer |
| February 1966 | | since October 2005 |
| |
| Richard Salus | Senior Vice President | Chief Financial Officer |
| 2005 Market Street | and Chief Financial Officer | since November 2006 |
| Philadelphia, PA 19103 | | |
| October 1963 | | |
| |
4 David F. Connor, Daniel V. Geatens, David P. O’Connor, and Richard Salus serve in similar capacities for the six portfolios of the Optimum Fund Trust, which have the same investment advisor, principal underwriter, and transfer agent as the registrant.
104
| | Number of Portfolios in | |
| Principal Occupation(s) | Fund Complex Overseen | Other Directorships |
| During Past 5 Years | by Trustee or Officer | Held by Trustee or Officer |
| |
| | | |
| David F. Connor has served as | 84 | None4 |
| Vice President and Deputy | | |
| General Counsel of | | |
| Delaware Investments | | |
| since 2000. | | |
| |
| Daniel V. Geatens has served | 84 | None4 |
| in various capacities at | | |
| different times at | | |
| Delaware Investments. | | |
| |
| David P. O’Connor has served in | 84 | None4 |
| various executive and legal | | |
| capacities at different times | | |
| at Delaware Investments. | | |
| |
| Richard Salus has served in | 84 | None4 |
| various executive capacities | | |
| at different times at | | |
| Delaware Investments. | | |
| |
The Statement of Additional Information for the Fund(s) includes additional information about the Trustees and Officers and is available, without charge, upon request by calling 800 523-1918.
105
About the organization
This annual report is for the information of Delaware Corporate Bond Fund and Delaware Extended Duration Bond Fund shareholders, but it may be used with prospective investors when preceded or accompanied by a current prospectus for Delaware Corporate Bond Fund and Delaware Extended Duration Bond Fund and the Delaware Investments® Fund profile for the most recently completed calendar quarter. These documents are available at www.delawareinvestments.com. The prospectus sets forth details about charges, expenses, investment objectives, and operating policies of the investment company. You should read the prospectus carefully before you invest. The figures in this report represent past results that are not a guarantee of future results. The return and principal value of an investment in the investment company will fluctuate so that shares, when redeemed, may be worth more or less than their original cost.
| Board of trustees | |
| | |
| Patrick P. Coyne | Ann R. Leven |
| Chairman, President, and | Consultant |
| Chief Executive Officer | ARL Associates |
| Delaware Investments Family of Funds | New York, NY |
| Philadelphia, PA | |
| | Thomas F. Madison |
| Thomas L. Bennett | President and Chief Executive Officer |
| Private Investor | MLM Partners, Inc. |
| Rosemont, PA | Minneapolis, MN |
| |
| John A. Fry | Janet L. Yeomans |
| President | Vice President and Treasurer |
| Franklin & Marshall College | 3M Corporation |
| Lancaster, PA | St. Paul, MN |
| |
| Anthony D. Knerr | J. Richard Zecher |
| Founder and Managing Director | Founder |
| Anthony Knerr & Associates | Investor Analytics |
| New York, NY | Scottsdale, AZ |
| |
| Lucinda S. Landreth | |
| Former Chief Investment Officer | |
| Assurant, Inc. | |
| Philadelphia, PA | |
106
| Affiliated officers | Contact information |
| | |
| David F. Connor | Investment manager |
| Vice President, Deputy General Counsel, and | Delaware Management Company, a series of |
| Secretary | Delaware Management Business Trust |
| Delaware Investments® Family of Funds | Philadelphia, PA |
| Philadelphia, PA | |
| | National distributor |
| Daniel V. Geatens | Delaware Distributors, L.P. |
| Vice President and Treasurer | Philadelphia, PA |
| Delaware Investments Family of Funds | |
| Philadelphia, PA | Shareholder servicing, dividend disbursing, |
| | and transfer agent |
| David P. O’Connor | Delaware Service Company, Inc. |
| Senior Vice President, General Counsel, | 2005 Market Street |
| and Chief Legal Officer | Philadelphia, PA 19103-7094 |
| Delaware Investments Family of Funds | |
| Philadelphia, PA | For shareholders |
| | 800 523-1918 |
| Richard Salus | |
| Senior Vice President and | For securities dealers and financial |
| Chief Financial Officer | institutions representatives only |
| Delaware Investments Family of Funds | 800 362-7500 |
| Philadelphia, PA | |
| | Web site |
| | www.delawareinvestments.com |
Delaware Investments is the marketing name of Delaware Management Holdings, Inc. and its subsidiaries.
Each Fund files its complete schedule of portfolio holdings with the Securities and Exchange Commission for the first and third quarters of each fiscal year on Form N-Q. Each Fund’s Forms N-Q, as well as a description of the policies and procedures that each Fund uses to determine how to vote proxies (if any) relating to portfolio securities are available without charge (i) upon request, by calling 800 523-1918; and (ii) on the Commission’s Web site at www.sec.gov. In addition, a description of the policies and procedures that each Fund uses to determine how to vote proxies (if any) relating to portfolio securities and each Fund’s Schedule of Investments are available without charge on each Fund’s Web site at www.delawareinvestments.com. Each Fund’s Forms N-Q may be reviewed and copied at the Commission’s Public Reference Room in Washington, D.C.; information on the operation of the Public Reference Room may be obtained by calling 800 SEC-0330.
Information (if any) regarding how each Fund voted proxies relating to portfolio securities during the most recently disclosed 12-month period ended June 30 is available without charge (i) through each Fund’s Web site at www.delawareinvestments.com; and (ii) on the Commission’s Web site at www.sec.gov.
107
Item 2. Code of Ethics
The registrant has adopted a code of ethics that applies to the registrant’s principal executive officer, principal financial officer, principal accounting officer or controller, or persons performing similar functions, regardless of whether these individuals are employed by the registrant or a third party. A copy of the registrant’s Code of Business Ethics has been posted on Delaware Investments’ internet website at www.delawareinvestments.com. Any amendments to the Code of Business Ethics, and information on any waiver from its provisions granted by the registrant, will also be posted on this website within five business days of such amendment or waiver and will remain on the website for at least 12 months.
Item 3. Audit Committee Financial Expert
The registrant’s Board of Trustees/Directors has determined that each member of the registrant’s Audit Committee is an audit committee financial expert, as defined below. For purposes of this item, an “audit committee financial expert” is a person who has the following attributes:
a. An understanding of generally accepted accounting principles and financial statements;
b. The ability to assess the general application of such principles in connection with the accounting for estimates, accruals, and reserves;
c. Experience preparing, auditing, analyzing, or evaluating financial statements that present a breadth and level of complexity of accounting issues that are generally comparable to the breadth and complexity of issues that can reasonably be expected to be raised by the registrant’s financial statements, or experience actively supervising one or more persons engaged in such activities;
d. An understanding of internal controls and procedures for financial reporting; and
e. An understanding of audit committee functions.
An “audit committee financial expert” shall have acquired such attributes through:
a. Education and experience as a principal financial officer, principal accounting officer, controller, public accountant, or auditor or experience in one or more positions that involve the performance of similar functions;
b. Experience actively supervising a principal financial officer, principal accounting officer, controller, public accountant, auditor, or person performing similar functions;
c. Experience overseeing or assessing the performance of companies or public accountants with respect to the preparation, auditing, or evaluation of financial statements; or
d. Other relevant experience.
The registrant’s Board of Trustees/Directors has also determined that each member of the registrant’s Audit Committee is independent. In order to be “independent” for purposes of this item, the Audit Committee member may not: (i) other than in his or her capacity as a member of the Board of Trustees/Directors or any committee thereof, accept directly or indirectly any consulting, advisory or other compensatory fee from the issuer; or (ii) be an “interested person” of the registrant as defined in Section 2(a)(19) of the Investment Company Act of 1940.
The names of the audit committee financial experts on the registrant’s Audit Committee are set forth below:
Thomas L. Bennett 1
Thomas F. Madison
Janet L. Yeomans 1
J. Richard Zecher
Item 4. Principal Accountant Fees and Services
(a) Audit fees.
The aggregate fees billed for services provided to the registrant by its independent auditors for the audit of the registrant’s annual financial statements and for services normally provided by the independent auditors in connection with statutory and regulatory filings or engagements were $80,700 for the fiscal year ended July 31, 2008.
_______________________
1 The instructions to Form N-CSR require disclosure on the relevant experience of persons who qualify as audit committee financial experts based on “other relevant experience.” The Board of Trustees/Directors has determined that Mr. Bennett qualifies as an audit committee financial expert by virtue of his education, Chartered Financial Analyst designation, and his experience as a credit analyst, portfolio manager and the manager of other credit analysts and portfolio managers. The Board of Trustees/Directors has determined that Ms. Yeomans qualifies as an audit committee financial expert by virtue of her education and experience as the Treasurer of a large global corporation.
The aggregate fees billed for services provided to the registrant by its independent auditors for the audit of the registrant’s annual financial statements and for services normally provided by the independent auditors in connection with statutory and regulatory filings or engagements were $79,200 for the fiscal year ended July 31, 2007.
(b) Audit-related fees.
The aggregate fees billed by the registrant’s independent auditors for services relating to the performance of the audit of the registrant’s financial statements and not reported under paragraph (a) of this Item were $0 for the fiscal year ended July 31, 2008.
The aggregate fees billed by the registrant’s independent auditors for services relating to the performance of the audit of the financial statements of the registrant’s investment adviser and other service providers under common control with the adviser and that relate directly to the operations or financial reporting of the registrant were $19,074 for the registrant’s fiscal year ended July 31, 2008. The percentage of these fees relating to services approved by the registrant’s Audit Committee pursuant to the de minimis exception from the pre-approval requirement in Rule 2-01(c)(7)(i)(C) of Regulation S-X was 0%. These audit-related services were as follows: issuance of report concerning transfer agent's system of internal accounting control pursuant to Rule 17Ad-13 of the Securities Exchange Act.
The aggregate fees billed by the registrant’s independent auditors for services relating to the performance of the audit of the registrant’s financial statements and not reported under paragraph (a) of this Item were $0 for the fiscal year ended July 31, 2007.
The aggregate fees billed by the registrant’s independent auditors for services relating to the performance of the audit of the financial statements of the registrant’s investment adviser and other service providers under common control with the adviser and that relate directly to the operations or financial reporting of the registrant were $19,074 for the registrant’s fiscal year ended July 31, 2007. The percentage of these fees relating to services approved by the registrant’s Audit Committee pursuant to the de minimis exception from the pre-approval requirement in Rule 2-01(c)(7)(i)(C) of Regulation S-X was 0%. These audit-related services were as follows: issuance of report concerning transfer agent's system of internal accounting control pursuant to Rule 17Ad-13 of the Securities Exchange Act.
(c) Tax fees.
The aggregate fees billed by the registrant’s independent auditors for tax-related services provided to the registrant were $25,000 for the fiscal year ended July 31, 2008. The percentage of these fees relating to services approved by the registrant’s Audit Committee pursuant to the de minimis exception from the pre-approval requirement in Rule 2-01(c)(7)(i)(C) of Regulation S-X was 0%. These tax-related services were as follows: review of income tax returns and review of annual excise distribution calculations.
The aggregate fees billed by the registrant’s independent auditors for tax-related services provided to the registrant’s investment adviser and other service providers under common control with the adviser and that relate directly to the operations or financial reporting of the registrant were $0 for the registrant’s fiscal year ended July 31, 2008.
The aggregate fees billed by the registrant’s independent auditors for tax-related services provided to the registrant were $26,700 for the fiscal year ended July 31, 2007. The percentage of these fees relating to services approved by the registrant’s Audit Committee pursuant to the de minimis exception from the pre-approval requirement in Rule 2-01(c)(7)(i)(C) of Regulation S-X was 0%. These tax-related services were as follows: review of income tax returns and review of annual excise distribution calculations.
The aggregate fees billed by the registrant’s independent auditors for tax-related services provided to the registrant’s adviser and other service providers under common control with the adviser and that relate directly to the operations or financial reporting of the registrant were $0 for the registrant’s fiscal year ended July 31, 2007.
(d) All other fees.
The aggregate fees billed for all services provided by the independent auditors to the registrant other than those set forth in paragraphs (a), (b) and (c) of this Item were $0 for the fiscal year ended July 31, 2008.
The aggregate fees billed for all services other than those set forth in paragraphs (b) and (c) of this Item provided by the registrant’s independent auditors to the registrant’s adviser and other service providers under common control with the adviser and that relate directly to the operations or financial reporting of the registrant were $0 for the registrant’s fiscal year ended July 31, 2008.
The aggregate fees billed for all services provided by the independent auditors to the registrant other than those set forth in paragraphs (a), (b) and (c) of this Item were $0 for the fiscal year ended July 31, 2007.
The aggregate fees billed for all services other than those set forth in paragraphs (b) and (c) of this Item provided by the registrant’s independent auditors to the registrant’s adviser and other service providers under common control with the adviser and that relate directly to the operations or financial reporting of the registrant were $0 for the registrant’s fiscal year ended July 31, 2007.
(e) The registrant’s Audit Committee has established pre-approval policies and procedures as permitted by Rule 2-01(c)(7)(i)(B) of Regulation S-X (the “Pre-Approval Policy”) with respect to services provided by the registrant’s independent auditors. Pursuant to the Pre-Approval Policy, the Audit Committee has pre-approved the services set forth in the table below with respect to the registrant up to the specified fee limits. Certain fee limits are based on aggregate fees to the registrant and other registrants within the Delaware Investments Family of Funds.
| Service | Range of Fees |
| Audit Services | |
| Statutory audits or financial audits for new Funds | up to $25,000 per Fund |
| Services associated with SEC registration statements (e.g., Form N-1A, Form N-14, etc.), periodic reports and other documents filed with the SEC or other documents issued in connection with securities offerings (e.g., comfort letters for closed-end Fund offerings, consents), and assistance in responding to SEC comment letters | up to $10,000 per Fund |
| Consultations by Fund management as to the accounting or disclosure treatment of transactions or events and/or the actual or potential impact of final or proposed rules, standards or interpretations by the SEC, FASB, or other regulatory or standard-setting bodies (Note: Under SEC rules, some consultations may be considered “audit-related services” rather than “audit services”) | up to $25,000 in the aggregate |
| Audit-Related Services | |
| Consultations by Fund management as to the accounting or disclosure treatment of transactions or events and /or the actual or potential impact of final or proposed rules, standards or interpretations by the SEC, FASB, or other regulatory or standard-setting bodies (Note: Under SEC rules, some consultations may be considered “audit services” rather than “audit-related services”) | up to $25,000 in the aggregate |
| Tax Services | |
| U.S. federal, state and local and international tax planning and advice (e.g., consulting on statutory, regulatory or administrative developments, evaluation of Funds’ tax compliance function, etc.) | up to $25,000 in the aggregate |
| U.S. federal, state and local tax compliance (e.g., excise distribution reviews, etc.) | up to $5,000 per Fund |
| Review of federal, state, local and international income, franchise and other tax returns | up to $5,000 per Fund |
Under the Pre-Approval Policy, the Audit Committee has also pre-approved the services set forth in the table below with respect to the registrant’s investment adviser and other entities controlling, controlled by or under common control with the investment adviser that provide ongoing services to the registrant (the “Control Affiliates”) up to the specified fee limit. This fee limit is based on aggregate fees to the investment adviser and its Control Affiliates.
| Service | Range of Fees |
| Non-Audit Services | |
| Services associated with periodic reports and other documents filed with the SEC and assistance in responding to SEC comment letters | up to $10,000 in the aggregate |
The Pre-Approval Policy requires the registrant’s independent auditors to report to the Audit Committee at each of its regular meetings regarding all services initiated since the last such report was rendered, including those services authorized by the Pre-Approval Policy.
(f) Not applicable.
(g) The aggregate non-audit fees billed by the registrant’s independent auditors for services rendered to the registrant and to its investment adviser and other service providers under common control with the adviser were $277,002 and $281,062 for the registrant’s fiscal years ended July 31, 2008 and July 31, 2007, respectively.
(h) In connection with its selection of the independent auditors, the registrant’s Audit Committee has considered the independent auditors’ provision of non-audit services to the registrant’s investment adviser and other service providers under common control with the adviser that were not required to be pre-approved pursuant to Rule 2-01(c)(7)(ii) of Regulation S-X. The Audit Committee has determined that the independent auditors’ provision of these services is compatible with maintaining the auditors’ independence.
Item 5. Audit Committee of Listed Registrants
Not applicable.
Item 6. Investments
(a) Included as part of report to shareholders filed under Item 1 of this Form N-CSR.
(b) Divestment of securities in accordance with Section 13(c) of the Investment Company Act of 1940.
Not applicable.
Item 7. Disclosure of Proxy Voting Policies and Procedures for Closed-End Management Investment Companies
Not applicable.
Item 8. Portfolio Managers of Closed-End Management Investment Companies
Not applicable.
Item 9. Purchases of Equity Securities by Closed-End Management Investment Company and Affiliated Purchasers
Not applicable.
Item 10. Submission of Matters to a Vote of Security Holders
Not applicable.
Item 11. Controls and Procedures
The registrant’s principal executive officer and principal financial officer have evaluated the registrant’s disclosure controls and procedures within 90 days of the filing of this report and have concluded that they are effective in providing reasonable assurance that the information required to be disclosed by the registrant in its reports or statements filed under the Securities Exchange Act of 1934 is recorded, processed, summarized and reported within the time periods specified in the rules and forms of the Securities and Exchange Commission.
There were no significant changes in the registrant’s internal control over financial reporting that occurred during the second fiscal quarter of the period covered by the report to stockholders included herein (i.e., the registrant’s fourth fiscal quarter) that have materially affected, or are reasonably likely to materially affect, the registrant’s internal control over financial reporting.
Item 12. Exhibits
| (a) | | (1) Code of Ethics |
| |
| | | Not applicable. |
| |
| | | (2) Certifications of Principal Executive Officer and Principal Financial Officer pursuant to Rule 30a-2 under the Investment Company Act of 1940 are attached hereto as Exhibit 99.CERT. |
| | | |
| | | (3) Written solicitations to purchase securities pursuant to Rule 23c-1 under the Securities Exchange Act of 1934. |
| | |
| | | Not applicable. |
| | |
| (b) | | Certifications pursuant to Section 906 of the Sarbanes-Oxley Act of 2002 are furnished herewith as Exhibit 99.906CERT. |
SIGNATURES
Pursuant to the requirements of the Securities Exchange Act of 1934 and the Investment Company Act of 1940, the registrant has duly caused this report to be signed on its behalf, by the undersigned, thereunto duly authorized.
Name of Registrant: DELAWARE GROUP® INCOME FUNDS
| PATRICK P. COYNE |
| By: | Patrick P. Coyne |
| Title: | Chief Executive Officer |
| Date: | October 8, 2008 |
Pursuant to the requirements of the Securities Exchange Act of 1934 and the Investment Company Act of 1940, this report has been signed below by the following persons on behalf of the registrant and in the capacities and on the dates indicated.
| PATRICK P. COYNE |
| By: | Patrick P. Coyne |
| Title: | Chief Executive Officer |
| Date: | October 8, 2008 |
| |
| RICHARD SALUS |
| By: | Richard Salus |
| Title: | Chief Financial Officer |
| Date: | October 8, 2008 |