Exhibit 99.1
Delta Air Lines Edward H. Bastian Delta Air Lines President and CEO of Northwest Airlines Credit Suisse Global Airline Conference December 2, 2008
Safe Harbor This presentation contains various projections and other forward-looking statements which represent Delta’s estimates or expectations regarding future events. All forward-looking statements involve a number of assumptions, risks and uncertainties, many of which are beyond control, that could cause the actual results to differ materially from the projected results. Factors which could cause such differences include, without limitation, business, economic, competitive, industry, regulatory, market and financial uncertainties and contingencies, as well as the “Risk Factors” discussed in Delta’s Form 10-Q filed with the SEC on October 16, 2008 and Form 10K filed with the SEC on February 15, 2008. Caution should be taken not to place undue reliance on Delta’s forward-looking statements, which represent Delta’s views only as of the date of this presentation, and which Delta has no current intention to update. In this presentation, we will discuss certain non-GAAP financial measures. You can find the reconciliations of those measures to comparable GAAP measures on our website at delta.com.
Delta – A Premier Global Airline Durable financial foundation and solid liquidity Delivered solid top line growth Maintained best-in-class cost structure despite capacity reductions Focused on preserving liquidity Well positioned to weather global economic crisis and volatile fuel prices Industry leader in managing domestic capacity Balanced, global network 74% of 2009 consumption benefits from decline in fuel prices $2 billion in expected annual synergies by 2012 from merger with Northwest Moving quickly to integrate Delta and Northwest Expanded codesharing brings immediate benefit to customers Single operating certificate expected by end of 2009 New leadership team in place
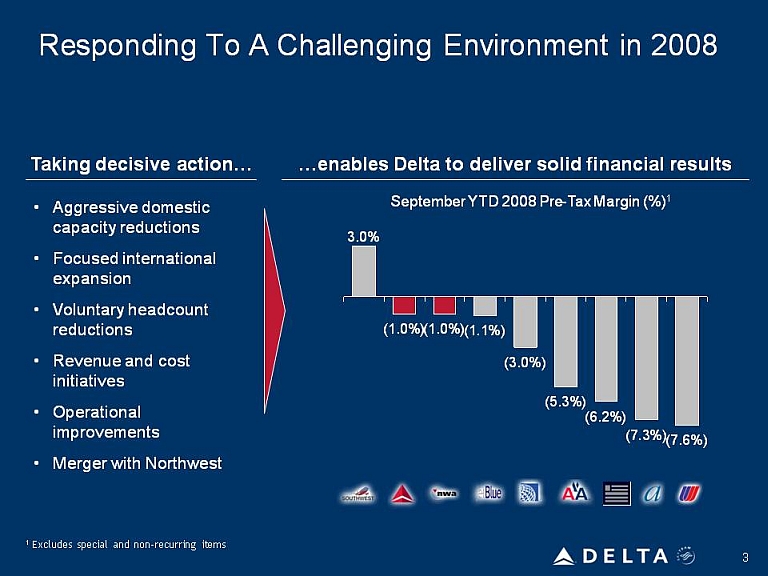
Responding To A Challenging Environment in 2008 Taking decisive action…•Aggressive domestic capacity reductions •Focused international expansion • Voluntary headcount reductions •Revenue and cost initiatives •Operational improvements • Merger with Northwest Enables Delta to deliver solid financial results September YTD 2008 Pre-Tax Margin (%)1 3.0% (1.0%) (1.0%) (1.1%) (3.0%) (5.3%) (6.2%) (7.3%) (7.6%) 1Excludes special and non-recurring items
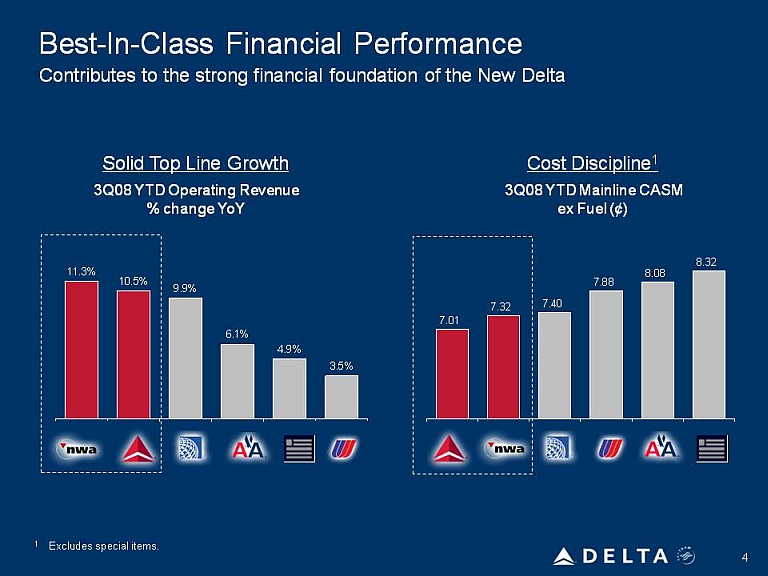
Best-In-Class Financial Performance Contributes to the strong financial foundation of the New Delta Solid Top Line Growth 3Q08 YTD Operating Revenue % change YoY Cost Discipline 1 3Q08 YTD Mainline CASM ex Fuel (¢)11.3% 10.5% 9.9% 6.1% 4.9% 3.5% 7.01 7.32 7.40 7.88 8.08 8.32
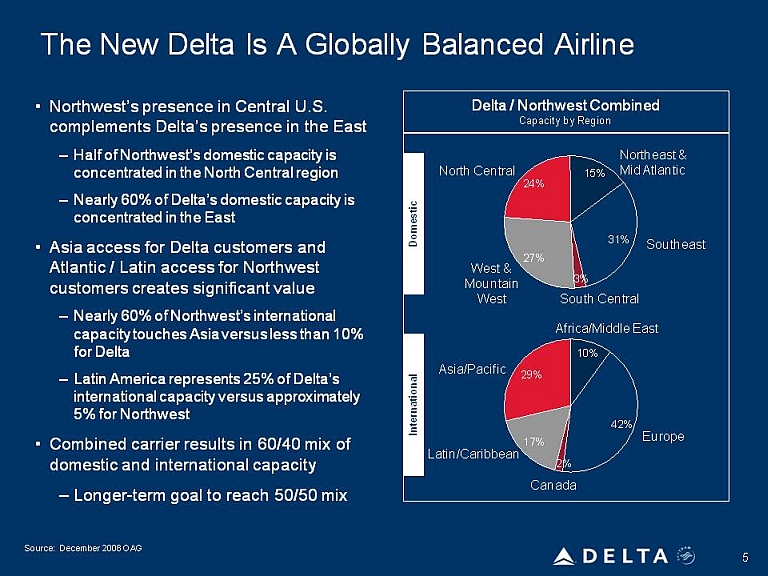
The New Delta Is A Globally Balanced Airline •Northwest’s presence in Central U.S. complements Delta’s presence in the East–Half of Northwest’s domestic capacity is concentrated in the North Central region–Nearly 60% of Delta’s domestic capacity is concentrated in the East Asia access for Delta customers and Atlantic / Latin access for Northwest customers creates significant value–Nearly 60% of Northwest’s international itthAilth10%capacity touches Asia versus less than 10% for Delta–Latin America represents 25% of Delta’s international capacity versus approximately 5%fNtht5% for Northwest •Combined carrier results in 60/40 mix of domestic and international capacity – Longer-term goal to reach 50/50 mix Delta / Northwest Combined Capacity by Region Northeast & 31%24%15%Mid Atlantic North CentralSoutheast27%3%West & Mountain West Southeast South Central Domestic national 10% 29% Asia/Pacific International 17% 2% 42% Canada Europe Latin/CaribbeanAfrica/Middle Ease
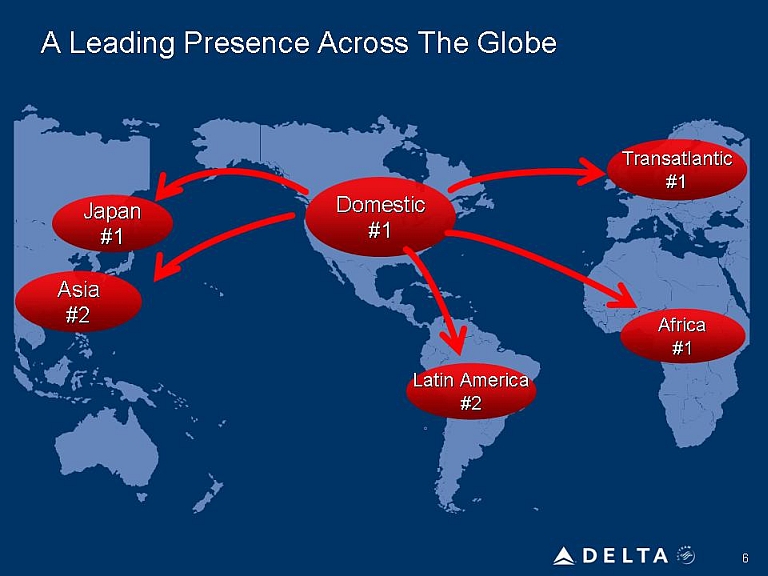
A Leading Presence Across The Globe
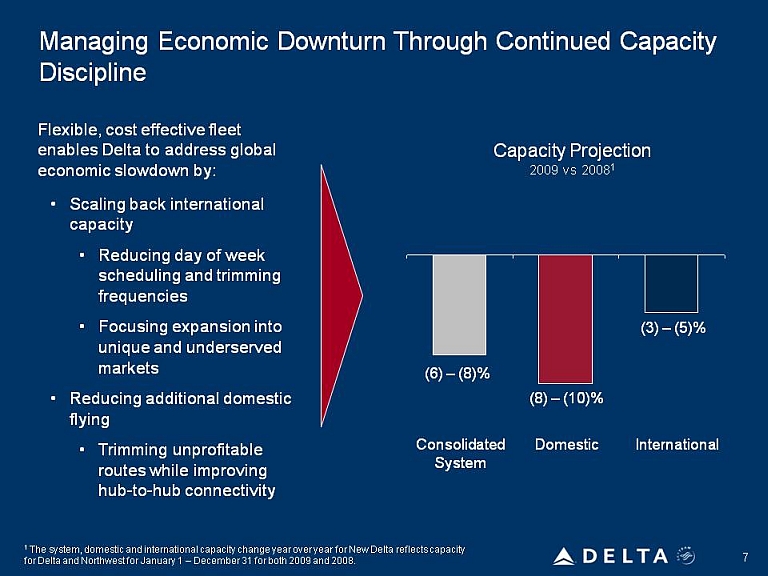
Managing Economic Downturn Through Continued Capacity Discipline Flexible, cost effective fleet enables Delta to address global economic slowdown by: •Scaling back international capacity (2) –(4)%•Reducing day of week scheduling and trimming frequencies • Focusing expansion into (6) –(8)% (7) –(9)% Focusing expansion into unique and underserved markets • Reducing additional domestic flying •Trimming unprofitable routes while improving hub-to-hub connectivity Domestic Consolidated System International 71The system, domestic and international capacity change year over year for New Delta reflects capacity for Delta and Northwest for January 1 –December 31 for both 2009 and 2008.
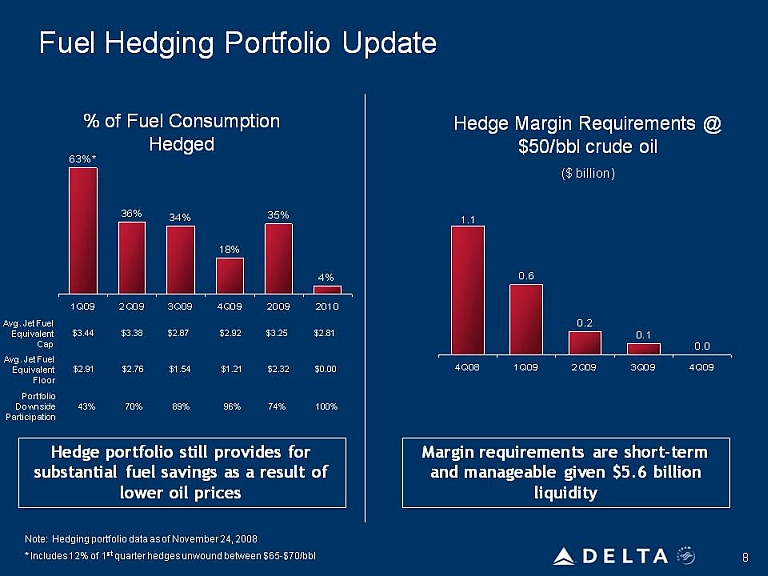
Fuel Hedging Portfolio Update % of Fuel Consumption Hedged 4%1Q092Q093Q094Q0920092010Avg. Jet Fuel Equivalent Cap$3.25$2.81$3.44$3.38$2.87$2.92Portfolio Downside 74% 100% 43% 70% 89% 96% Avg. Jet Fuel Equivalent Floor$2.32 $0.00 $2.91 $2.76 $1.54 $1.21 Participation Hedge portfolio still provides for substantial fuel savings as a result of lower oil prices lower oil prices 8Note: Hedging portfolio data as of November 24, 2008* Includes 12% of 1stquarter hedges unwound between $65-$70/bbl Hedge Margin Requirements @ $50/bbl crude oil ($ billion) Margin requirements are short-term and manageable given $5.6 billion liquidity 0.60.20.10.04Q081Q092Q093Q094Q09 1.1 63% 36% 34% 18% 35 % 4%
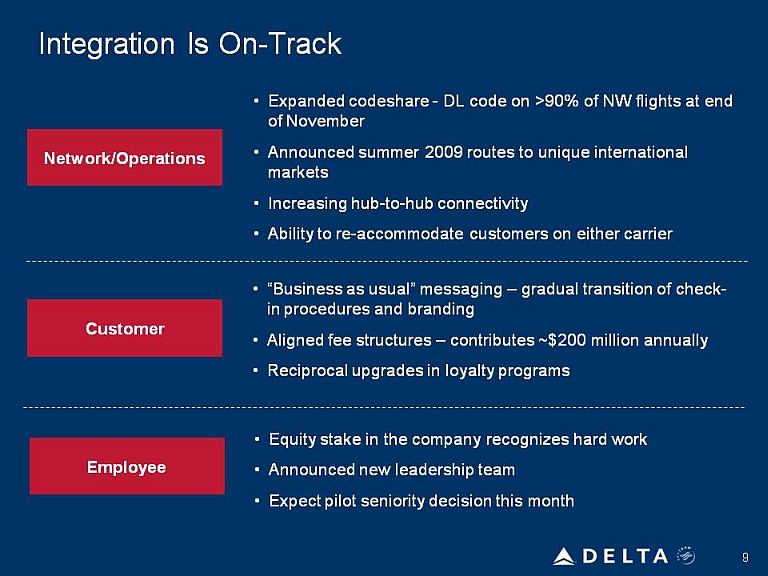
Integration Is On-Track Network/Operations Expanded codeshare - DL code on >90% of NW flights at end of November Announced summer 2009 routes to unique international markets Increasing hub-to-hub connectivity Ability to re-accommodate customers on either carrier Customer “Business as usual” messaging – gradual transition of check-in procedures and branding Aligned fee structures – contributes ~$200 million annually Reciprocal upgrades in loyalty programs Employee Equity stake in the company recognizes hard work Announced new leadership team Expect pilot seniority decision this month
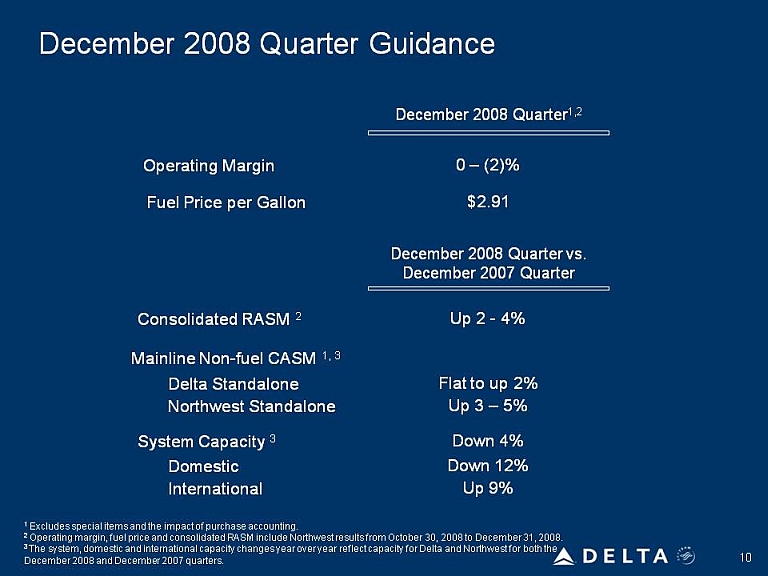
December 2008 Quarter Guidance Operating Margin Fuel Price per Gallon Consolidated RASM 2 Mainline Non-fuel CASM 1, 3 Delta Standalone Northwest Standalone System Capacity 3 Domestic International December 2008 Quarter1,2 0 – (2)% $2.91 December 2008 Quarter vs. December 2007 Quarter Up 2 - 4% Flat to up 2% Down 4% Down 12% Up 9% 1 Excludes special items and the impact of purchase accounting. 2 Operating margin, fuel price and consolidated RASM include Northwest results from October 30, 2008 to December 31, 2008. 3 The system, domestic and international capacity changes year over year reflect capacity for Delta and Northwest for both the December 2008 and December 2007 quarters.
Delta – A Premier Global Airline Strong financial foundation Solid top line growth and best-in-class cost structure Strong liquidity position Merger strengthens Delta’s hand Proactively addressing economic weakness Domestic capacity rationalization Diverse international portfolio mitigates risk Commitment to removing costs with capacity Moving quickly to integrate Northwest Network changes drive revenue synergies Delivering immediate benefits to customers Employees share in integration success
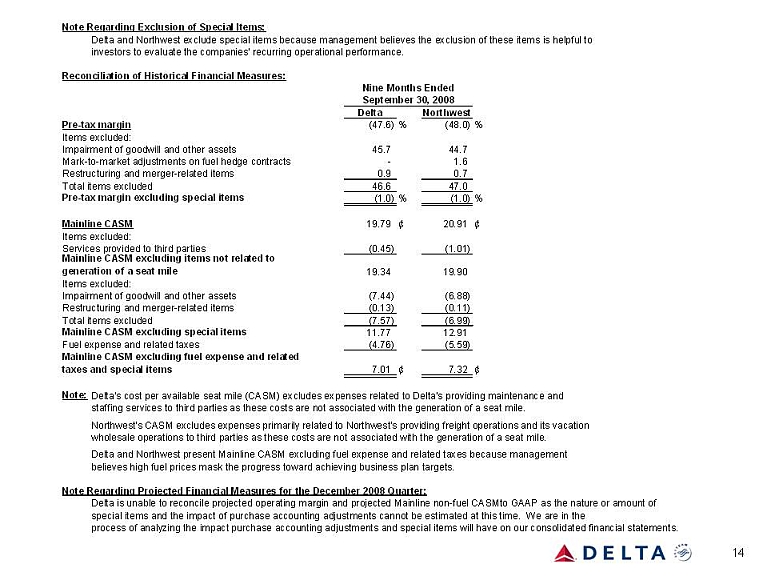
Note Regarding Exclusion of Special Items: Delta and Northwest exclude special items because management believes the exclusion of these items is helpful to investors to evaluate the companies' recurring operational performance. Reconciliation of Historical Financial Measures: Delta Northwest Pre-tax margin(47.6) %(48.0) %Items excluded: Impairment of goodwill and other assets45.7 44.7 Mark-to-market adjustments on fuel hedge contracts-1.6 Nine Months Ended September 30, 2008jgRestructuring and merger-related items0.9 0.7 Total items excluded46.6 47.0 Pre-tax margin excluding special items(1.0) %(1.0) %Mainline CASM19.79 ¢20.91 ¢Items excluded: Services provided to third parties (045)(101)Services provided to third parties(0.45) (1.01) 19.34 19.90 Items excluded: Impairment of goodwill and other assets(7.44) (6.88) Restructuring and merger-related items(0.13) (0.11) Total items excluded(7.57) (6.99) MiliCASMldiilit11771291Mainline CASM excluding items not related to generation of a seat mileMainline CASM excluding special items11.77 12.91 Fuel expense and related taxes(4.76) (5.59) 7.01 ¢7.32 ¢ Note: Delta's cost per available seat mile (CASM) excludes expenses related to Delta's providing maintenance and staffing services to third parties as these costs are not associated with the generation of a seat mile. Mainline CASM excluding fuel expense and related taxes and special items Northwest's CASM excludes expenses primarily related to Northwest's providing freight operations and its vacation wholesale operations to third parties as these costs are not associated with the generation of a seat mile.Delta and Northwest present Mainline CASM excluding fuel expense and related taxes because management believes high fuel prices mask the progress toward achieving business plan targets. Note Regarding Projected Financial Measures for the December 2008 Quarter: Delta is unable to reconcile projected operating margin and projected Mainline non-fuel CASM to GAAP as the nature or amount of special items and the impact of purchase accounting adjustments cannot be estimated at this time. We are in the process of analyzing the impact purchase accounting adjustments and special items will have on our consolidated financial statements.