Exhibit 99.1
Delta: One Great Airline2008 Investor Day December 9, 2008
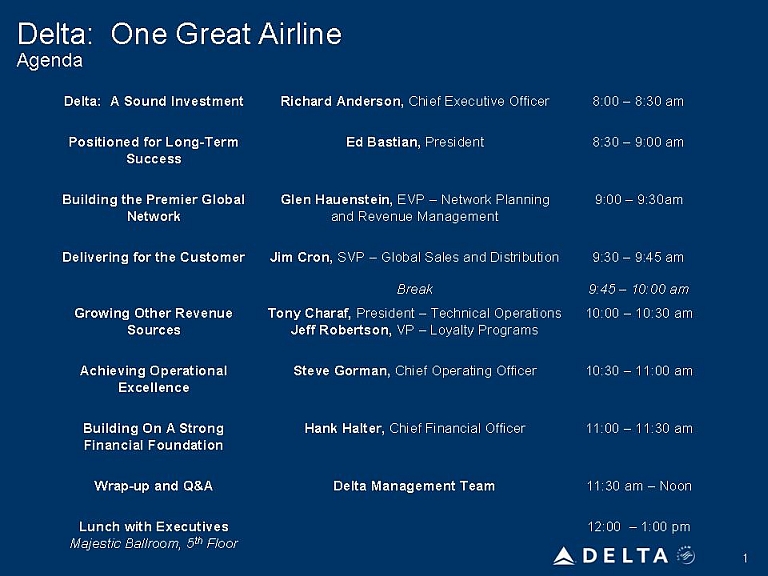
Delta: A Sound Investment Positioned for Long-Term Success Building the Premier Global Network Delivering for the Customer Growing Other Revenue Sources Achieving Operational Excellence Building On A Strong Financial Foundation Wrap-up and Q&A Lunch with Executives Majestic Ballroom, 5th Floor Richard Anderson, Chief Executive Officer Ed Bastian, President Glen Hauenstein, EVP – Network Planning and Revenue Management Jim Cron, SVP – Global Sales and Distribution Tony Charaf, President – Technical Operations Jeff Robertson, VP – Loyalty Programs Steve Gorman, Chief Operating Officer Hank Halter, Chief Financial Officer Delta Management Team 8:00 – 8:30 am 8:30 – 9:00 am 9:00 – 9:30am 9:30 – 9:45 am 9:45 – 10:00 am 10:00 – 10:30 am 10:30 – 11:00 am 11:00 – 11:30 am 11:30 am – Noon 12:00 – 1:00 pm
Safe Harbor This presentation contains various projections and other forward-looking statements which represent Delta’s estimates or expectations regarding future events. All forward-looking statements involve a number of assumptions, risks and uncertainties, many of which are beyond Delta’s control, that could cause the actual results to differ materially from the projected results. Factors which could cause such differences include, without limitation, business, economic, competitive, industry, regulatory, market and financial uncertainties and contingencies, as well as the “Risk Factors” discussed in Delta’s Form 10-Q filed with the SEC on October 16, 2008 and Form 10-K filed with the SEC on February 15, 2008. Caution should be taken not to place undue reliance on Delta’s forward-looking statements, which represent Delta’s views only as of the date of this presentation, and which Delta has no current intention to update. In this presentation, we will discuss certain non-GAAP financial measures. You can find the reconciliations of those measures to comparable GAAP measures on our website at delta.com.
Delta: A Sound Investment Richard H. Anderson Chief Executive Officer
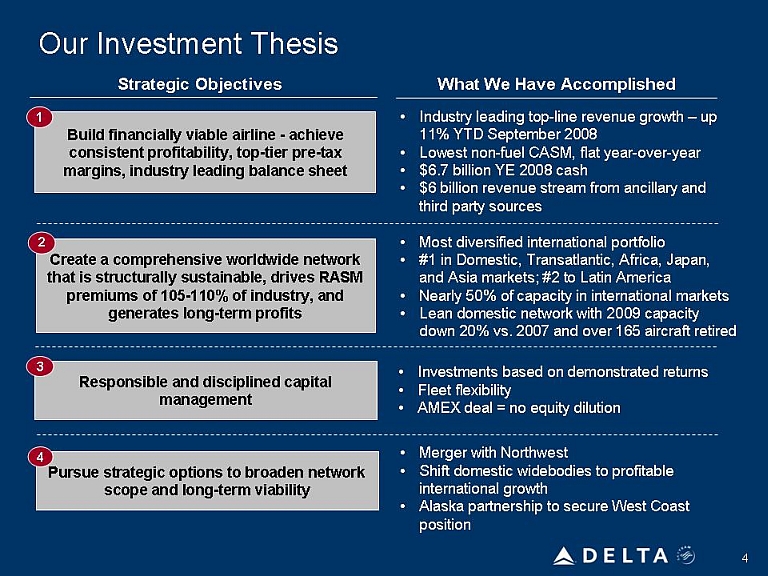
Our Investment Thesis Strategic Objectives Build financially viable airline - achieve consistent profitability, top-tier pre-tax margins, industry leading balance sheet Create a comprehensive worldwide network that is structurally sustainable, drives RASM premiums of 105-110% of industry, and generates long-term profits Responsible and disciplined capital management Pursue strategic options to broaden network scope and long-term viability What We Have Accomplished Industry leading top-line revenue growth – up 11% YTD September 2008 Lowest non-fuel CASM, flat year-over-year $6.7 billion YE 2008 cash $6 billion revenue stream from ancillary and third party sources Most diversified international portfolio #1 in Domestic, Transatlantic, Africa, Japan, and Asia markets; #2 to Latin America Nearly 50% of capacity in international markets Lean domestic network with 2009 capacity down 20% vs. 2007 and over 165 aircraft retired Investments based on demonstrated returns Fleet flexibility AMEX deal = no equity dilution Merger with Northwest Shift domestic widebodies to profitable international growth Alaska partnership to secure West Coast position
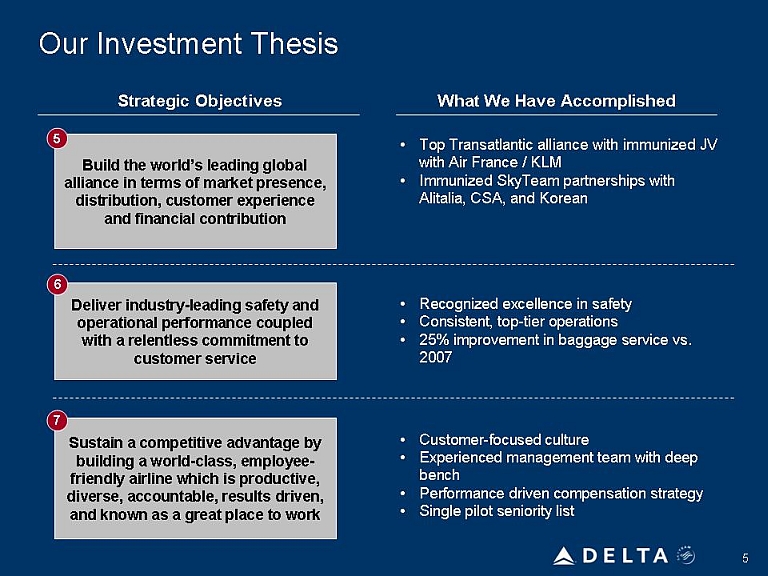
Our Investment Thesis Strategic Objectives Build the world’s leading global alliance in terms of market presence, distribution, customer experience and financial contribution Deliver industry-leading safety and operational performance coupled with a relentless commitment to customer service Sustain a competitive advantage by building a world-class, employee-friendly airline which is productive, diverse, accountable, results driven, and known as a great place to work What We Have Accomplished Top Transatlantic alliance with immunized JV with Air France / KLM Immunized SkyTeam partnerships with Alitalia, CSA, and Korean Recognized excellence in safety Consistent, top-tier operations 25% improvement in baggage service vs. 2007 Customer-focused culture Experienced management team with deep bench Performance driven compensation strategy Single pilot seniority list
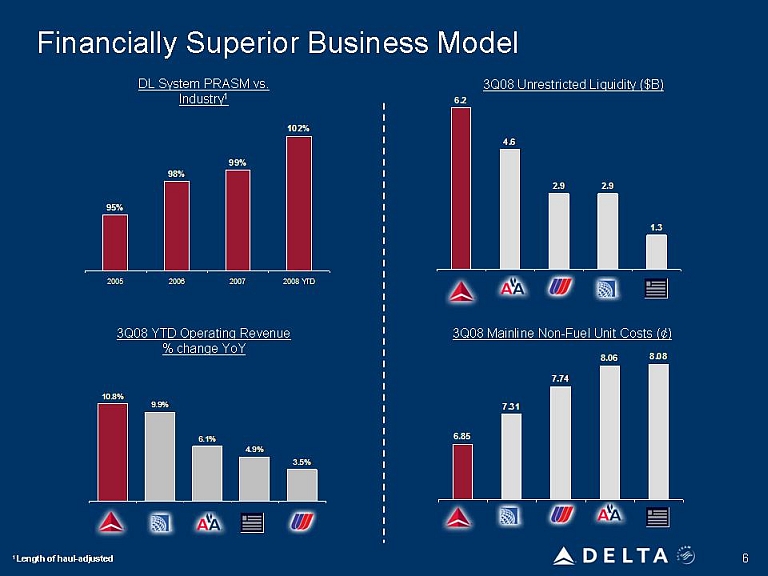
Financially Superior Business Model DL System PRASM vs. Industry1 3Q08 YTD Operating Revenue 3Q08 Unrestricted Liquidity ($B) 3Q08 Mainline Non-Fuel Unit Costs (¢) 95% 98% 99% 102% 2005 2006 2007 2008YTD 10.8% 9.9% 6.1% 4.9% 3.5% 6.2 4.6 2.9 2.9 1.3 6.85 7..31 7.74 8.06 8.08

The Leading Global Network Provides the scale to weather economic downturn Japan #1 Asia #1 Domestic #1 Latin America #2 Transatlantic #1 Africa #1
Delta: Positioned for Long-Term Success Ed Bastian President
Delta: Positioned For Long-Term Success Managing the current economic cycle Unlocking merger benefits Capitalizing on the value of the world’s largest airline Fuel price decline, capacity rationalization and merger synergies provides tools we need to manage economic downturn Moving with speed and efficiency to capture the $2 billion in annual synergies created by the merger Leveraging the structural opportunities from the expanded scale and scope of the premier global network
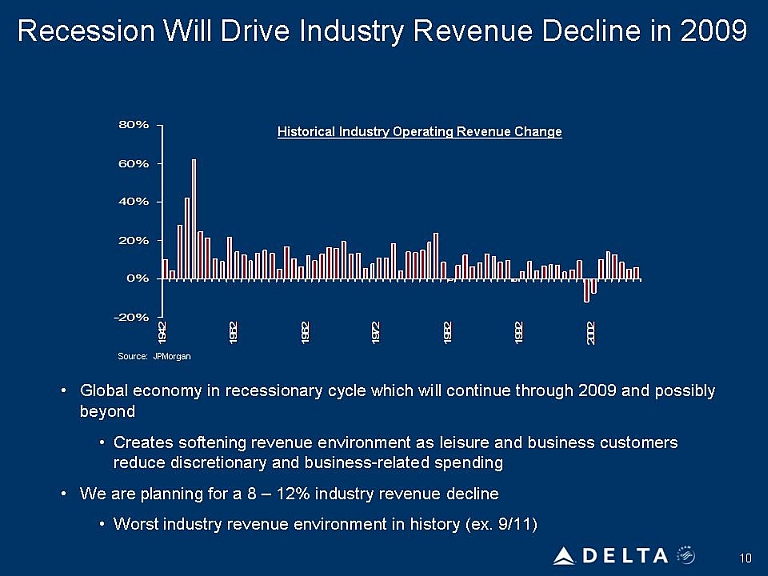
Recession Will Drive Industry Revenue Decline in 2009 Historical Industry Operating Revenue Change Global economy in recessionary cycle which will continue through 2009 and possibly beyond Creates softening revenue environment as leisure and business customers reduce discretionary and business-related spending We are planning for a 8 – 12% industry revenue decline Worst industry revenue environment in history (ex. 9/11) 80 5 60% 40% 20% 0% -20% 2002 1992 1982 1972 1962 1952 1942

Why Managing the Current Crisis Will Be Different Domestic Capacity Discipline Industry Domestic Capacity Change Unprecedented Fall in Fuel 2008 Crude Oil Prices ~14% decline in domestic capacity over two years Aircraft being retired or sold – not coming back into the system Capital markets closed to new entrants, limited aircraft financing $1 change in crude = $100 million for Delta Run rate benefit of change in crude from 2008 approximates $5 billion 10% 5% 0% -5% -10% 1978 1983 1988 1993 2003 2008 $30 $70 $110 $150
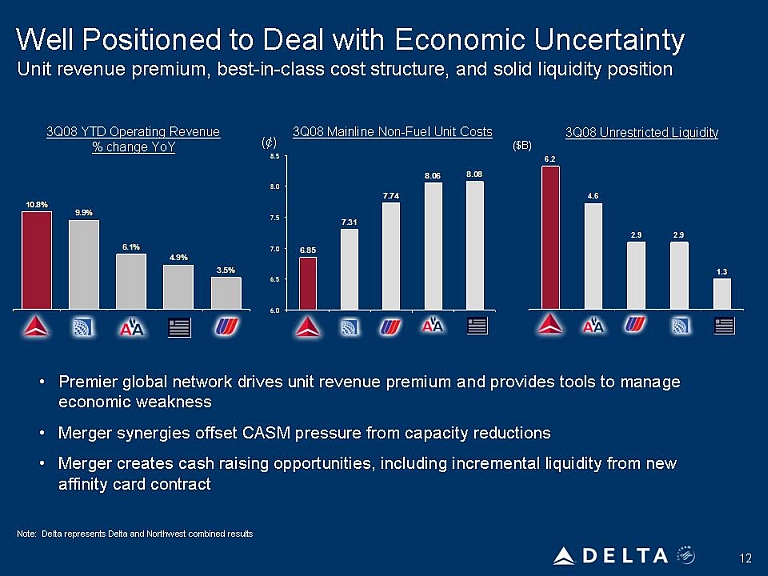
Well Positioned to Deal with Economic Uncertainty Unit revenue premium, best-in-class cost structure, and solid liquidity position % change YoY 3Q08 Mainline Non-Fuel Unit Costs 3Q08 Unrestricted Liquidity Premier global network drives unit revenue premium and provides tools to manage economic weakness Merger synergies offset CASM pressure from capacity reductions Merger creates cash raising opportunities, including incremental liquidity from new affinity card contract10.8% 9.9( 6.1% 4.9% 3.5% 6.85 7.31 7.74 8.06 8.08 6.2 4.6 2.9 2.9 1.3
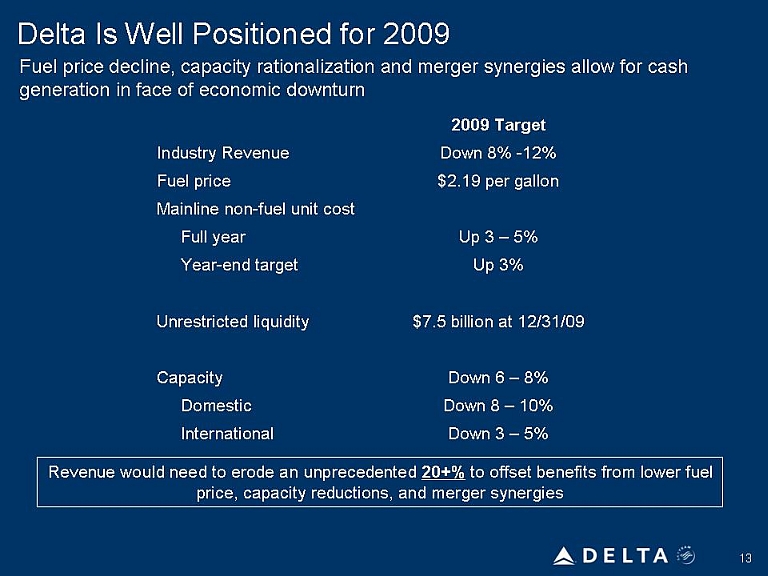
Delta Is Well Positioned for 2009 Fuel price decline, capacity rationalization and merger synergies allow for cash generation in face of economic downturn Industry Revenue Fuel price Mainline non-fuel unit cost Full year Year-end target Unrestricted liquidity Capacity Domestic International 2009 Target Down 8% -12% $2.19 per gallon Up 3 – 5% Up 3% $7.5 billion at 12/31/09 Down 6 – 8% Down 8 – 10% Down 3 – 5% Revenue would need to erode an unprecedented 20+% to offset benefits from lower fuel price, capacity reductions, and merger synergies
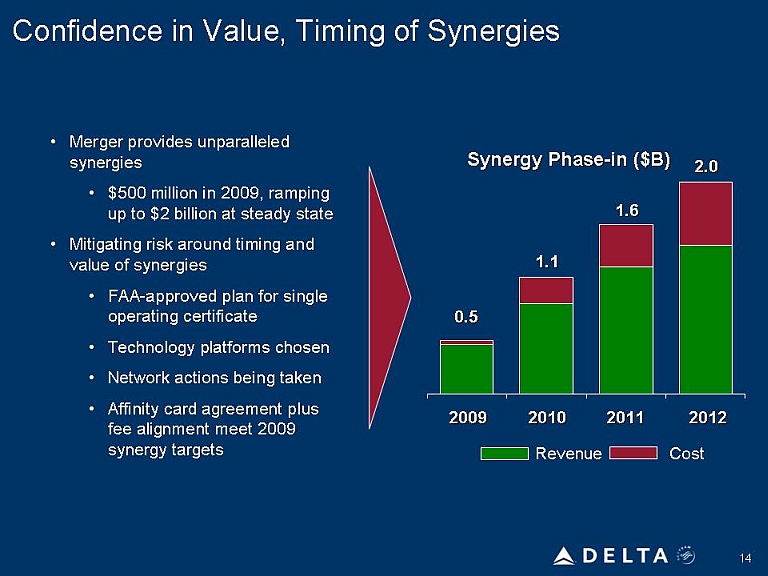
Confidence in Value, Timing of Synergies Merger provides unparalleled synergies $500 million in 2009, ramping up to $2 billion at steady state Mitigating risk around timing and value of synergies FAA-approved plan for single operating certificate Technology platforms chosen Network actions being takenAffinity card agreement plus fee alignment meet 2009 synergy targets Synergy Phase-in ($B) Revenue Cost 2009 2010 2011 2012 0.5 1.1 1.6 2.0
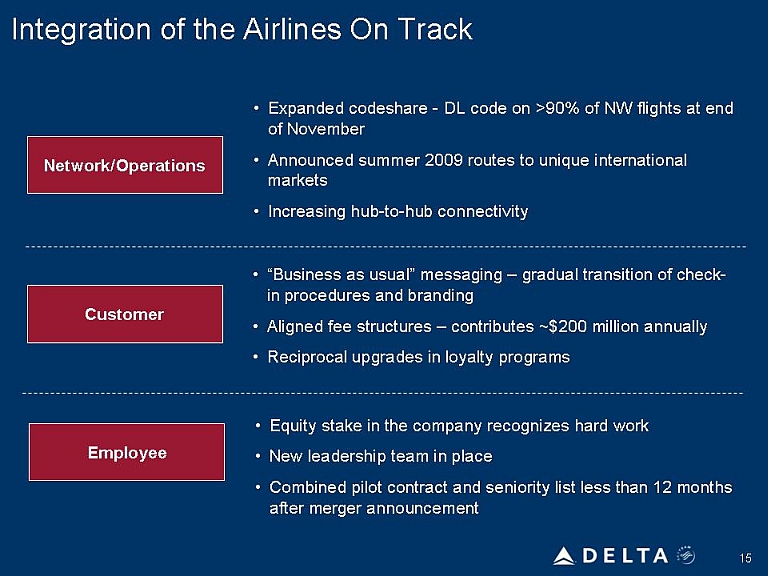
Integration of the Airlines On Track Network/Operations Customer Employee Expanded codeshare - DL code on >90% of NW flights at end of November Announced summer 2009 routes to unique international markets Increasing hub-to-hub connectivity Business as usual” messaging – gradual transition of check-in procedures and branding Aligned fee structures – contributes ~$200 million annually Reciprocal upgrades in loyalty programs Equity stake in the company recognizes hard work New leadership team in place Combined pilot contract and seniority list less than 12 months after merger announcement

Prioritizing Integration Activities That Drive Real Value to Customers, Employees, and Shareholders Targeting a reduction to $500 million in cash costs to integrate the airlines Technology ($175 million) Employees ($150 million)Product($100 million) Facilities ($75 million) Core platform and application decisions taken Combining Delta strengths in operating systems with Northwest strengths in commercial functionality Front-line employee training New uniformsEmployee transition costs Standardizing fleet with Delta livery Modifying interiors to Delta standard 757 cockpit alignment Consolidation of facilities at 170 airports Delta brand on all facilities and lounges

Capitalizing on the Power of the World’s Largest Airline Expanded scale and scope of the airline Unlocking value in the network Combining the best of both companies Establish industry leading co-brand partnership by pairing the largest loyalty program with the best affinity card issuer Enhanced potential of ancillary businesses (MRO, Delta Global Services, Delta Air Elite, etc.) Driving efficiency into the regional carrier portfolio – and other supply chain opportunities Taking the largest, fully-immunized transatlantic joint venture to the next level Fleet realignment provides means to meet network goals while significantly reducing need to invest in new aircraft Utilizing the best revenue tools across $30+ billion revenue base Enhancing top-tier operational performance by adopting best practices Forming the best management team from the two top performing airlines

American Express Agreement Generates $2 Billion in New Liquidity over Next Two Years Pairing the world’s largest loyalty program with the best marketer in the industry Best-in-class affinity card agreement Over $15 billion in value for next seven yearAgreement provides $1 billion in immediate liquidity Immediate purchase of SkyMiles Current contract enhancements generate additional $1 billion in revenue over 2009-2010 Leverages American Express unique capabilities Moving now de-risks program conversion American Express Delta Skymiles
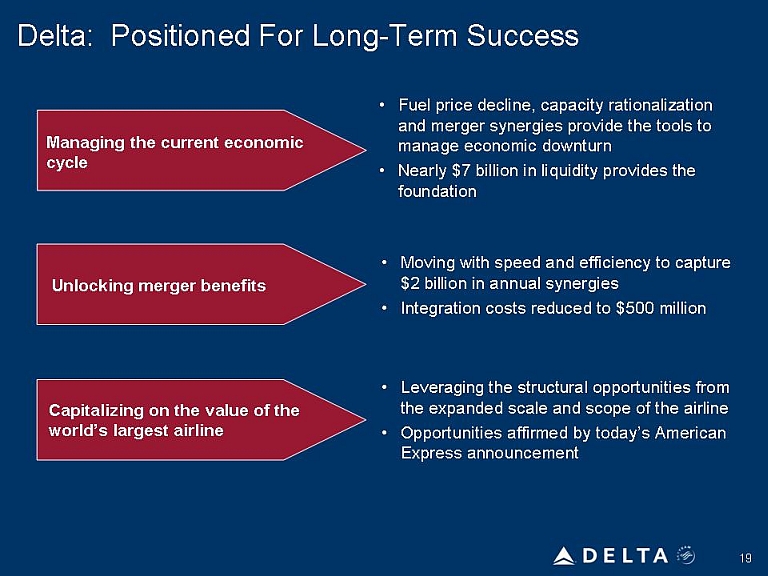
Delta: Positioned For Long-Term Success Managing the current economic cycle Unlocking merger benefits Capitalizing on the value of the world’s largest airline Fuel price decline, capacity rationalization and merger synergies provide the tools to manage economic downturn Nearly $7 billion in liquidity provides the foundation Moving with speed and efficiency to capture $2 billion in annual synergies Integration costs reduced to $500 million Leveraging the structural opportunities from the expanded scale and scope of the airline Opportunities affirmed by today’s American Express announcement

Delta: Building The Premier Global Network Glen Hauenstein EVP – Network Planning and Revenue Management

Delta Has Led The Industry In Revenue Momentum Domestic PRASM1 vs. the Industry Commitment to capacity discipline Right-sizing domestic network Fleet re-gauging Improved domestic product 1 Length of haul-adjusted PRASM for Delta and Northwest combined for all periods presented 94% 98% 100% 102% 2005020060200702008 YTD

The Leading Global Network Provides the scale to weather economic downturn Japan #1 Asia #1 Domestic #1 Latin America #2 Transatlantic #1 Africa #1

Network Diversity Mitigates Risk Creates a natural hedge against regional weakness Less Reliance On Domestic Markets1 International Mix By Region2 Reflects capacity mix for month of August for DL standalone 2005-2008 and DL+NW 2009-2010. Source: July 2009 OAGDomestic International ME/Africa/India Pacific Latin/Caribbean HeathrowW. Europe DL AA CO UA US

Commitment to Capacity Discipline Across The Network Reduce unprofitable capacity while growing network footprint Remove bottom 10% underperforming markets Growth in Africa/Middle East offsets reduction in Europe Re-gauging Pacific for improved profitability Realign Mexico/Caribbean with growth to unique, emerging markets in S. America CY09 Y/Y Capacity Change MMS of ASMs -6 to -8% System Domestic Int’l Atlantis Pacific Latin -8 to -10% -3 to 05% Europe Africa ME/India -6% =41% =7% -6 to -8% C/S America Caribbean Mexico =#% -6% - -10%
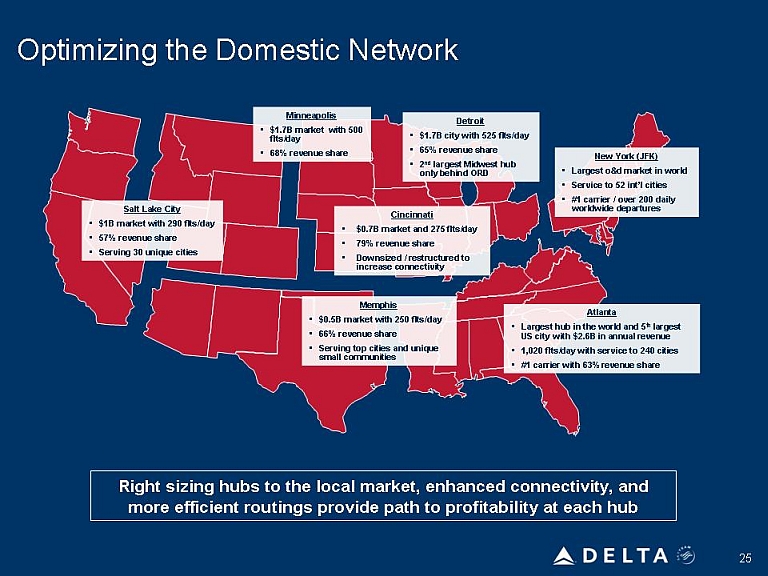
Optimizing the Domestic Network Salt Lake City $1B market with 290 flts/day 57% revenue share Serving 30 unique cities Minneapolis $1.7B market with 500 flts/day 68% revenue share Detroit$1.7B city with 525 flts/day 65% revenue share 2nd largest Midwest hub only behind ORD New York (JFK)Largest o&d market in world Service to 52 int’l cities #1 carrier / over 200 daily worldwide departures Cincinnati $0.7B market and 275 flts/day 79% revenue share Downsized / restructured to increase connectivity Memphis $0.5B market with 250 flts/day 66% revenue share Serving top cities and unique small communities Atlanta Largest hub in the world and 5th largest US city with $2.6B in annual revenue 1,020 flts/day with service to 240 cities #1 carrier with 63% revenue share Right sizing hubs to the local market, enhanced connectivity, and more efficient routings provide path to profitability at each hub

Full Transatlantic JV = Opportunity to Maximize Profits Value created from: Reducing capacity while keeping similar levels of service Powerful hubs drive most efficient routings Cross-fleeting to optimize gauge Creating the preferred alliance for high yielding corporate accounts$200M+ incremental profit opportunity (full ramp-up) SLC MSP DTW MEM CVG Atl JFK AMS CDS Delta Air France KLM
Most Powerful Domestic Network Combined With Most Powerful Asian Network Expanded ALK relationship facilitates development of West Coast Pacific gateway US Position North America cities US gateways to Asia Transpacific flights/day 1 3 2 4 271 182 154 148 10 60 4 2016 16 6 5 Beijing Seoul Busan Osaka Majoya Shanghai Taipei Hong Koing Manily Bankok Ho Chi Miknh Singapore Gaum Saipan HNL SEA PDX SLC SFO LAX MSP JFK DTW Atl
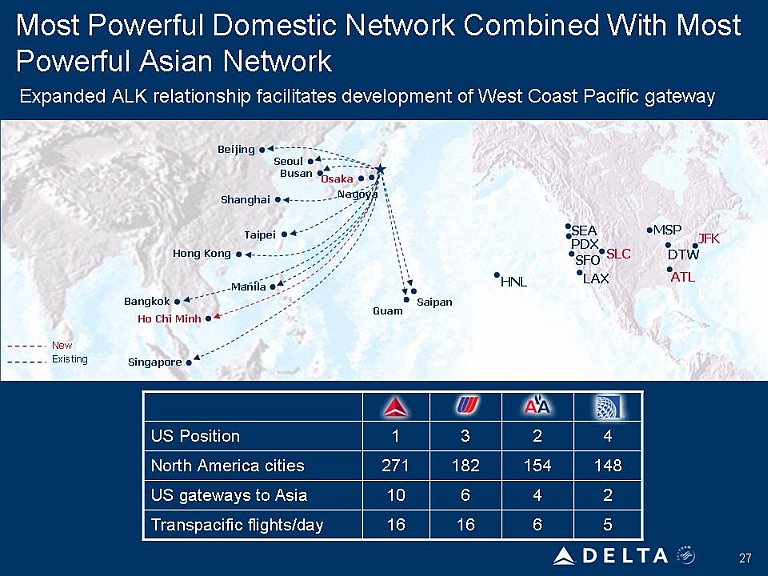
Most Powerful Domestic Network Combined With Most Powerful Asian Network Expanded ALK relationship facilitates development of West Coast Pacific gateway US Position North America cities US gateways to Asia Transpacific flights/day 1 3 2 4 271 182 154 148 10 60 4 2016 16 6 5 Beijing Seoul Busan Osaka Majoya Shanghai Taipei Hong Koing Manily Bankok Ho Chi Miknh Singapore Gaum Saipan HNL SEA PDX SLC SFO LAX MSP JFK DTW Atl
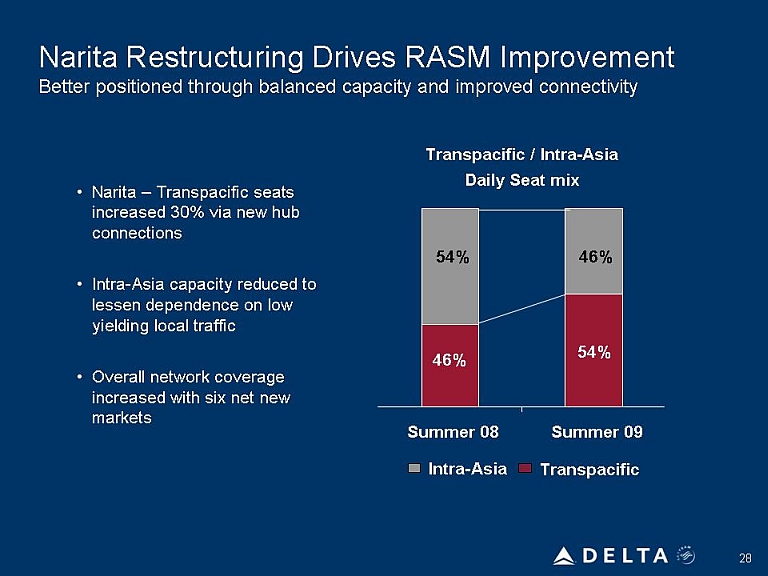
Narita Restructuring Drives RASM Improvement Better positioned through balanced capacity and improved connectivity Narita – Transpacific seats increased 30% via new hub connections Intra-Asia capacity reduced to lessen dependence on low yielding local traffic Overall network coverage increased with six net new markets Transpacific / Intra-Asia Daily Seat mix 54%46% 46% 54% Summer 09
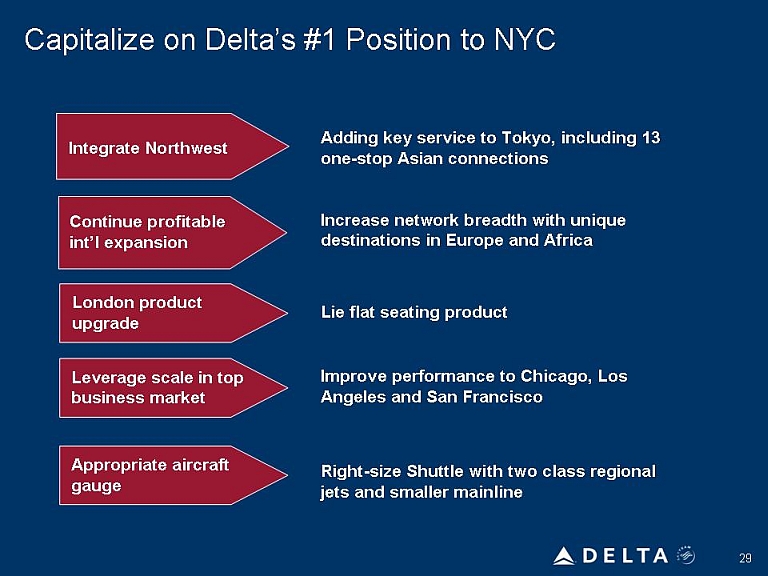
Capitalize on Delta’s #1 Position to NYC Integrate Northwest Continue profitable int’l expansion London product upgrade Appropriate aircraft gaugeAdding key service to Tokyo, including 13 one-stop Asian connections Increase network breadth with unique destinations in Europe and Africa Lie flat seating product Improve performance to Chicago, Los Angeles and San Francisco Right-size Shuttle with two class regional jets and smaller mainline
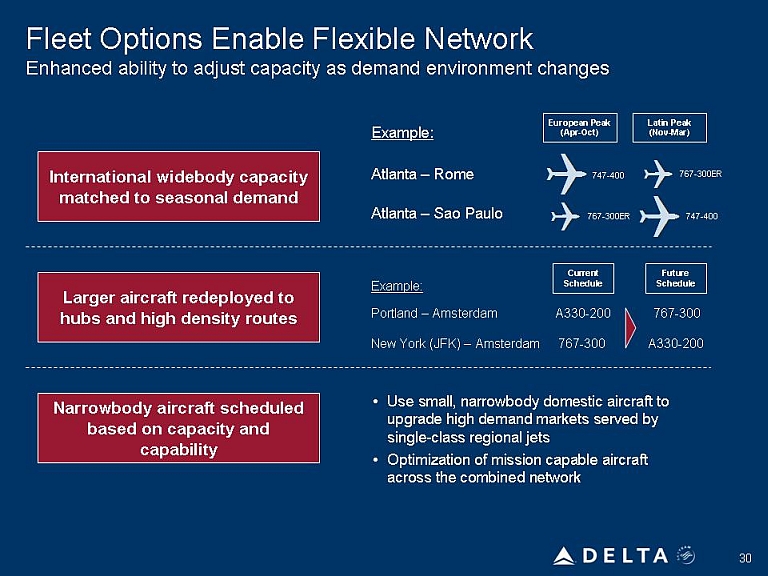
Fleet Options Enable Flexible Network Enhanced ability to adjust capacity as demand environment changes International widebody capacity matched to seasonal demand Larger aircraft redeployed to hubs and high density routes Narrowbody aircraft scheduled based on capacity and capability Example Atlanta – Sao PauloExample: Portland – Amsterdam A330-200 767-300 New York (JFK) – Amsterdam 767-300 A330-200 Current Schedule Use small, narrowbody domestic aircraft to upgrade high demand markets served by single-class regional jetsOptimization of mission capable aircraft across the combined network
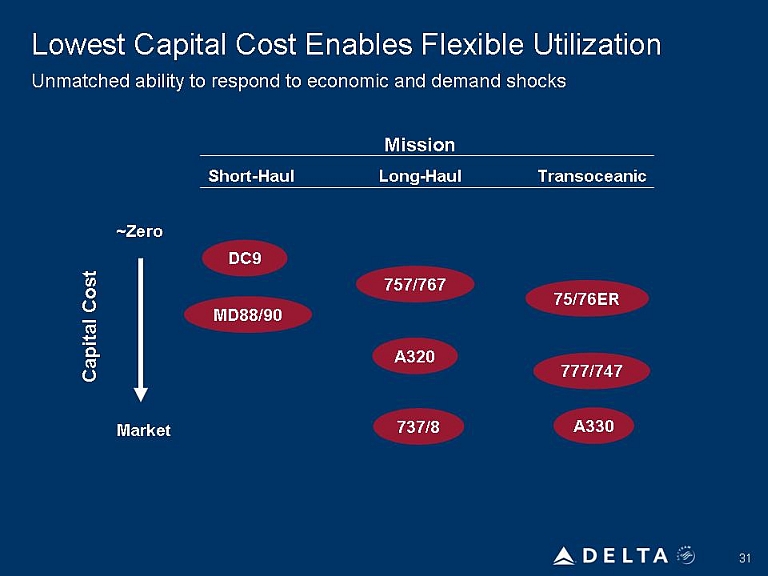
Lowest Capital Cost Enables Flexible Utilization Mission Short-Haul Long-Haul Transoceanic Capital Cost Market MD88/90 A320 737/8 777/747
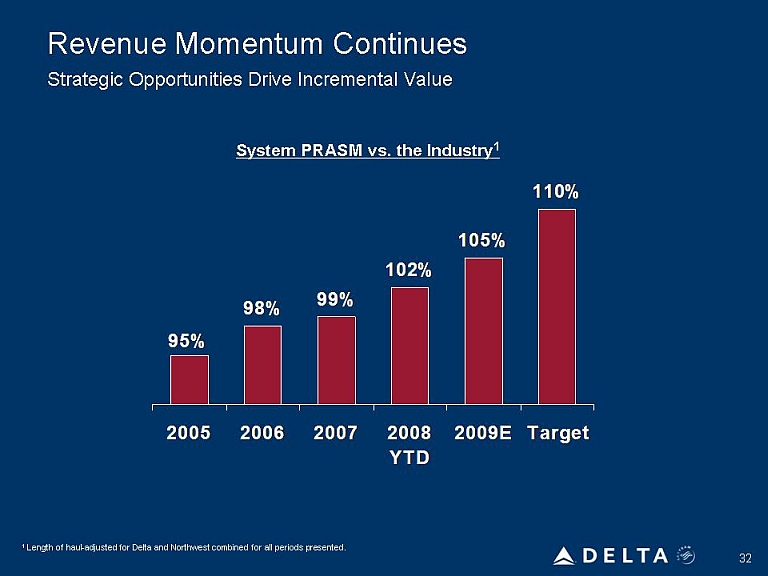
Revenue Momentum Continues Strategic Opportunities Drive Incremental Value System PRASM vs. the Industry1 1 Length of haul-adjusted for Delta and Northwest combined for all periods presented. 2005 2006 2007 2008 2009E Target YTD 95% 98% 99% 102% 105% 110%
Delta: Delivering for the Customer Jim Cron Senior Vice President – Global Sales and Distribution
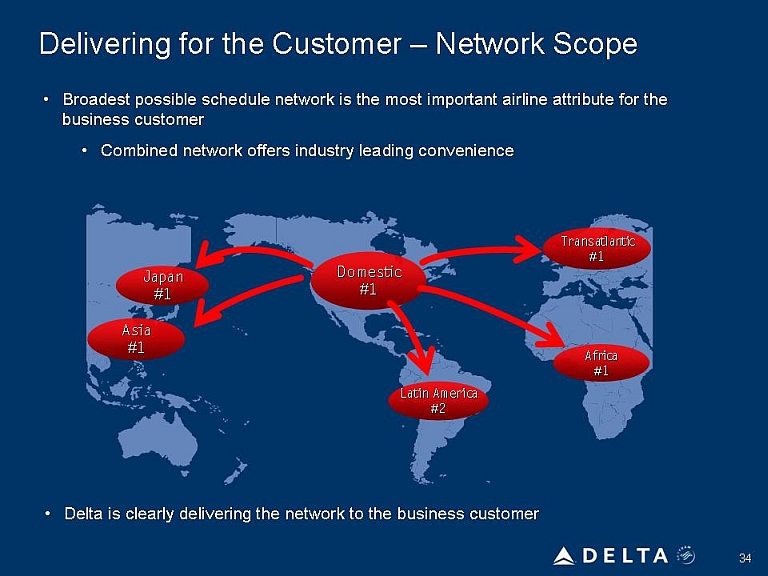
Delivering for the Customer – Network Scope Broadest possible schedule network is the most important airline attribute for the business customer Combined network offers industry leading convenience Delta is clearly delivering the network to the business customer Japan Domestic Latin AmericaA frica
Delivering for the Customer – Other Key Value Drivers Portfolio of hubs allows us to adjust capacity in response to economic challenges without sacrificing unique markets or critical time of day coverage Despite capacity reductions, new revenue generating markets continue to be launched (e.g. JFK-NRT, PIT-CDG) Competitive advantage in acquiring new business Delta delivering on other top business customer needsReliability High Value Differentiation Competitive customer amenity offering throughout the travel process Delta value proposition delivers strong revenue results
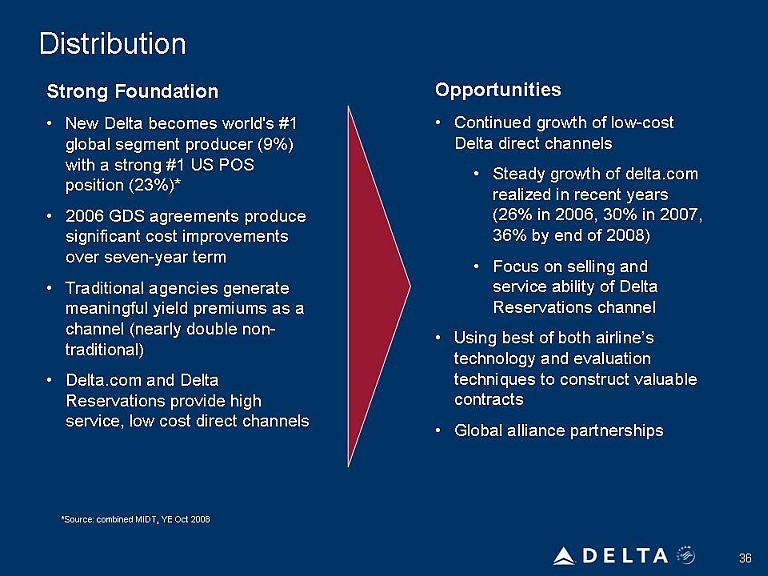
Distribution Strong Foundation New Delta becomes world's #1 global segment producer (9%) with a strong #1 US POS position (23%)* 2006 GDS agreements produce significant cost improvements over seven-year term Traditional agencies generate meaningful yield premiums as a channel (nearly double non-traditional)Delta.com and Delta Reservations provide high service, low cost direct channels Opportunities Continued growth of low-cost Delta direct channelsSteady growth of delta.com realized in recent years (26% in 2006, 30% in 2007, 36% by end of 2008) Focus on selling and service ability of Delta Reservations channel Using best of both airline’s technology and evaluation techniques to construct valuable contracts Global alliance partnerships
Delta: Growing Other Revenue Sources – TechOps Tony Charaf President – Technical Operations
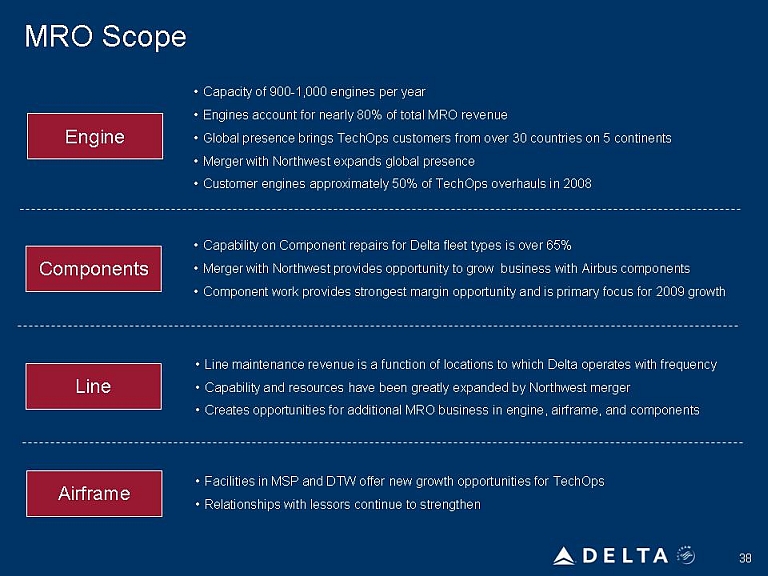
MRO Scope EngineComponentsAirframe Capacity of 900-1,000 engines per year Engines account for nearly 80% of total MRO revenue Global presence brings TechOps customers from over 30 countries on 5 continents Merger with Northwest expands global presence Customer engines approximately 50% of TechOps overhauls in 2008 Capability on Component repairs for Delta fleet types is over 65% Merger with Northwest provides opportunity to grow business with Airbus components Component work provides strongest margin opportunity and is primary focus for 2009 growth Line maintenance revenue is a function of locations to which Delta operates with frequency Capability and resources have been greatly expanded by Northwest merger Creates opportunities for additional MRO business in engine, airframe, and components Facilities in MSP and DTW offer new growth opportunities for TechOps Relationships with lessors continue to strengthen
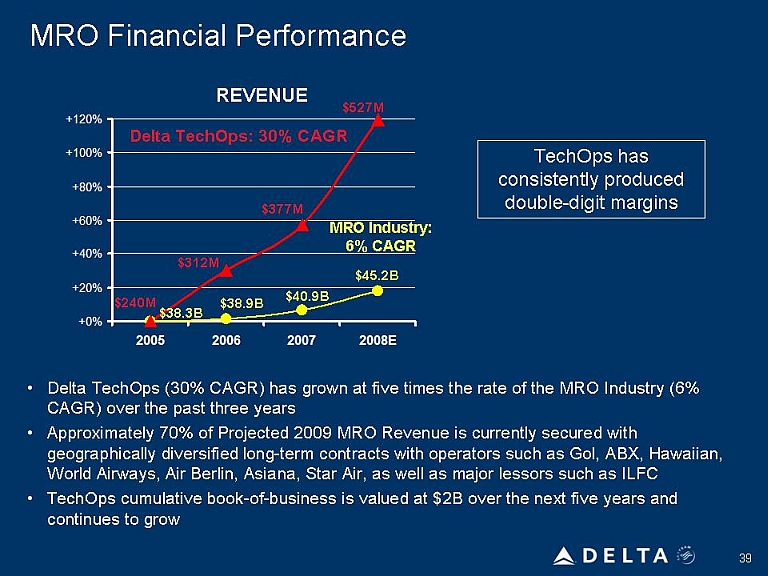
MRO Financial Performance Delta TechOps (30% CAGR) has grown at five times the rate of the MRO Industry (6% CAGR) over the past three years Approximately 70% of Projected 2009 MRO Revenue is currently secured with geographically diversified long-term contracts with operators such as Gol, ABX, Hawaiian, World Airways, Air Berlin, Asiana, Star Air, as well as major lessors such as ILFC TechOps cumulative book-of-business is valued at $2B over the next five years and continues to grow TechOps has consistently produced double-digit margins REVENUE Delta TechOps: 30% CAGR MRO Industry:$377M 312M
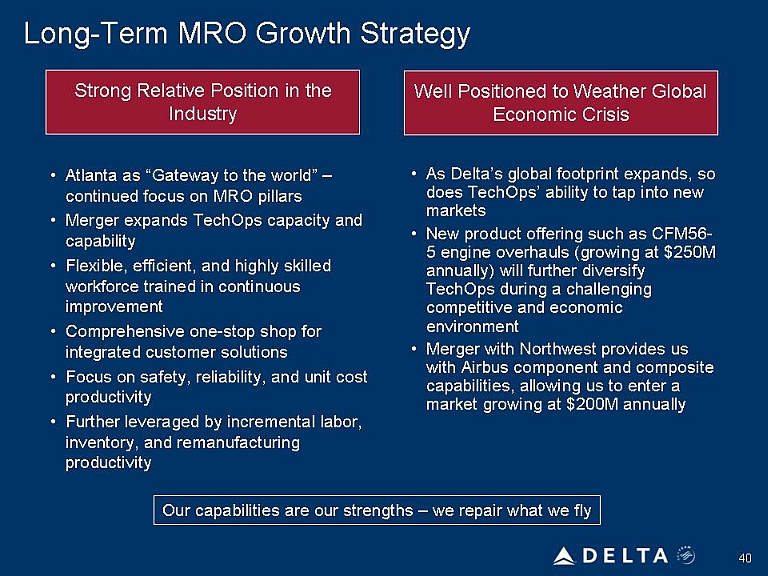
Long-Term MRO Growth Strategy Strong Relative Position in the Industry Well Positioned to Weather Global Economic Crisis Atlanta as “Gateway to the world” – continued focus on MRO pillars Merger expands TechOps capacity and capability Flexible, efficient, and highly skilled workforce trained in continuous improvement Comprehensive one-stop shop for integrated customer solutions Focus on safety, reliability, and unit cost productivity Further leveraged by incremental labor, inventory, and remanufacturing productivity As Delta’s global footprint expands, so does TechOps’ ability to tap into new markets New product offering such as CFM56-5 engine overhauls (growing at $250M annually) will further diversify TechOps during a challenging competitive and economic environment Merger with Northwest provides us with Airbus component and composite capabilities, allowing us to enter a market growing at $200M annually Our capabilities are our strengths – we repair what we fly
Delta: Growing Other Revenue Sources - SkyMiles Jeff Robertson Vice President – Loyalty Programs
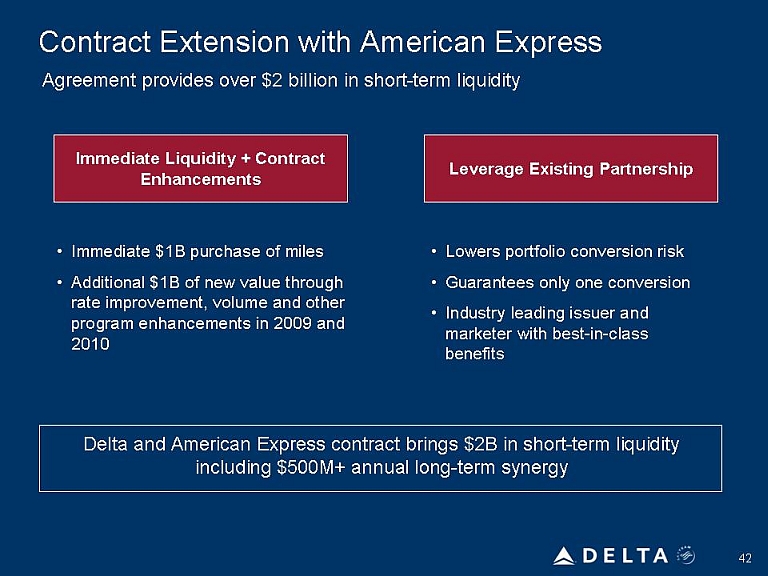
Contract Extension with American Express Agreement provides over $2 billion in short-term liquidity Immediate Liquidity + Contract Enhancements Leverage Existing Partnership Immediate $1B purchase of miles Additional $1B of new value through rate improvement, volume and other program enhancements in 2009 and 2010 Lowers portfolio conversion riskGuarantees only one conversion Industry leading issuer and marketer with best-in-class benefits
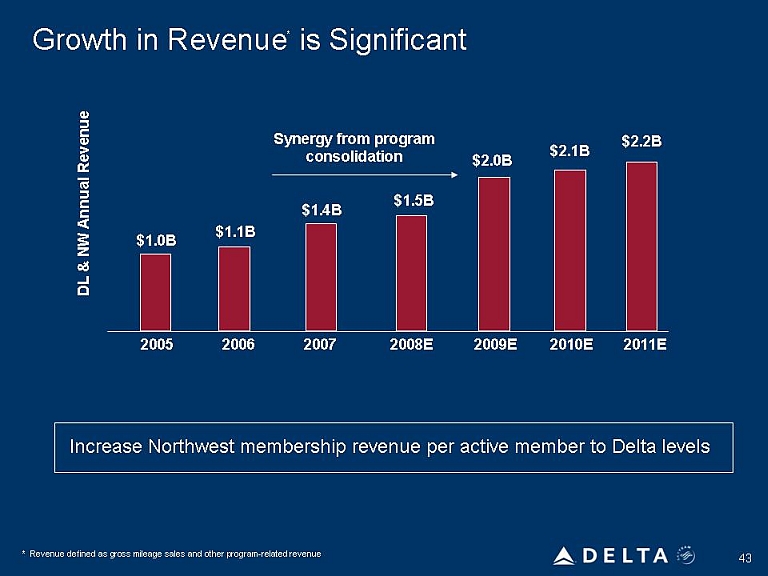
Growth in Revenue* is Significant DL & NW Annual Revenue Synergy from program consolidation * Revenue defined as gross mileage sales and other program-related revenue $1.4B $1.1B $1.5B $2.0B $2.1B $2.2B 2005 2006 200702008E 2009E 2010E 2011E
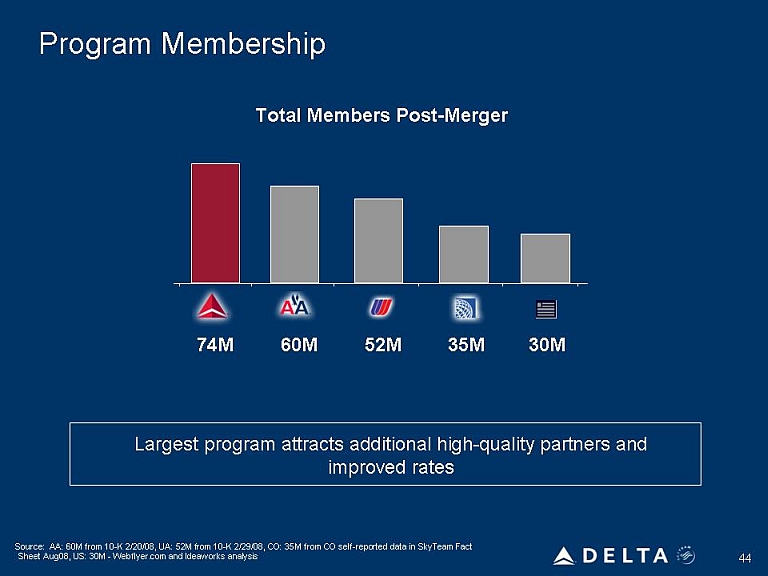
Program Membership Total Members Post-Merger Largest program attracts additional high-quality partners and improved rates Source: AA: 60M from 10-K 2/20/08, UA: 52M from 10-K 2/29/08, CO: 35M from CO self-reported data in SkyTeam Fact Sheet Aug08, US: 30M - Webflyer.com and Ideaworks analysis 74M 60M 52M 35M 30M

SkyMiles – A World-Class Loyalty Program Largest Loyalty Program Incremental Revenue Opportunities Best of Both Programs SkyMiles - #1 in total membership with 74M members, over 20% more than the #2 program Also # 1 in active membership and revenue Largest program attracts additional high-quality partners and improved rates New affinity card agreement Significant upside from increasing Northwest revenue per active member to Delta levels Single technology platform Best-in-class elite program and award options More ways to earn miles from a global network of choice and partnerships
Delta: Achieving Operational Excellence Steve Gorman Chief Operating Officer
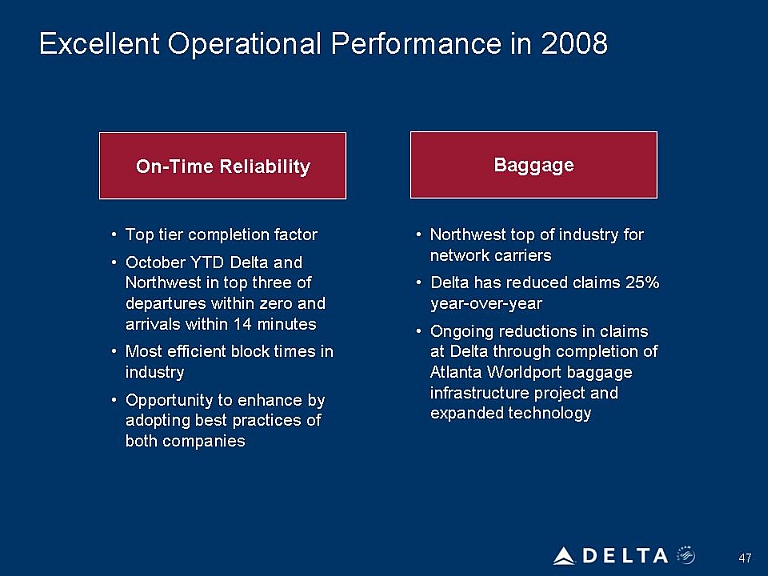
Excellent Operational Performance in 2008 On-Time Reliability Baggage Top tier completion factor October YTD Delta and Northwest in top three of departures within zero and arrivals within 14 minutes Most efficient block times in industry Opportunity to enhance by adopting best practices of both companies Northwest top of industry for network carriersDelta has reduced claims 25% year-over-year Ongoing reductions in claims at Delta through completion of Atlanta Worldport baggage infrastructure project and expanded technology
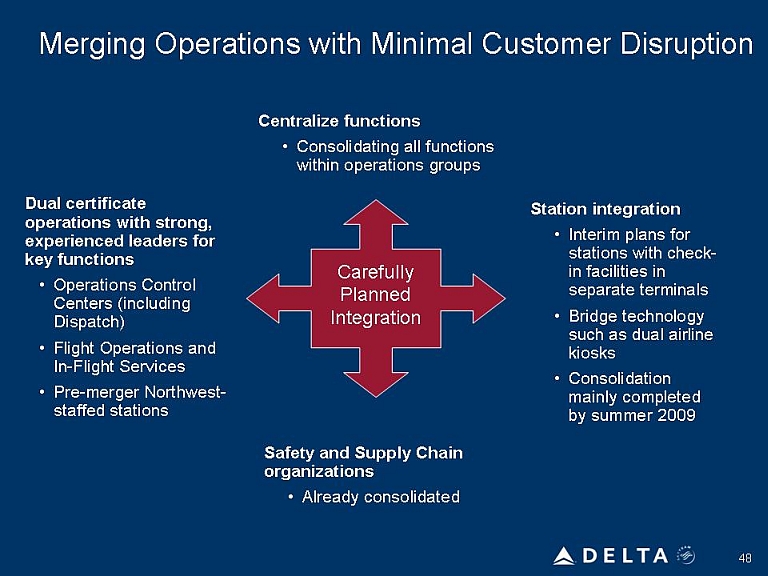
Merging Operations with Minimal Customer Disruption Centralize functions Consolidating all functions within operations groups Dual certificate operations with strong, experienced leaders for key functions Operations Control Centers (including Dispatch) Flight Operations and In-Flight Services Pre-merger Northwest-staffed stations Carefully Planned IntegrationSafety and Supply Chain organizations Already consolidated Station integration Interim plans for stations with check-in facilities in separate terminals Bridge technology such as dual airline kiosks Consolidation mainly completed by summer 2009
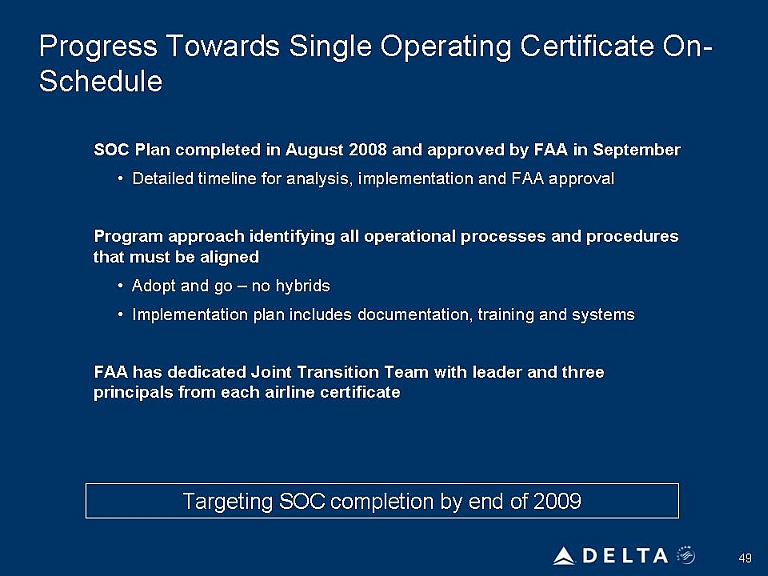
Progress Towards Single Operating Certificate On-Schedule SOC Plan completed in August 2008 and approved by FAA in SeptemberDetailed timeline for analysis, implementation and FAA approval Program approach identifying all operational processes and procedures that must be aligned Adopt and go – no hybrids Implementation plan includes documentation, training and systems FAA has dedicated Joint Transition Team with leader and three principals from each airline certificate Targeting SOC completion by end of 2009
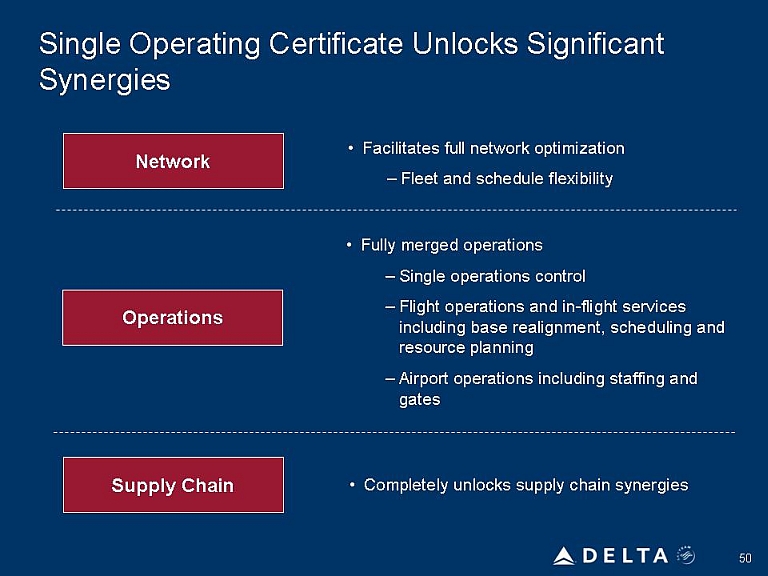
Single Operating Certificate Unlocks Significant Synergies Network Supply Chain Facilitates full network optimization Fleet and schedule flexibilityFully merged operations Single operations control Flight operations and in-flight services including base realignment, scheduling and resource planning Airport operations including staffing and gates
Delta: Building On A Strong Financial Foundation Hank Halter Chief Financial Officer

Building On A Strong Financial Foundation Enhancing a strong financial foundation Preserving and growing liquidity Best top line revenue growth Managing unit costs despite capacity reductions Ancillary and third party revenue opportunities Benefits of productivity initiativesMitigating fuel price risk Investing prudently – fleet rationalization minimizes need for massive re-fleeting strong operating cash flow Disciplined capex spending Manageable debt maturities
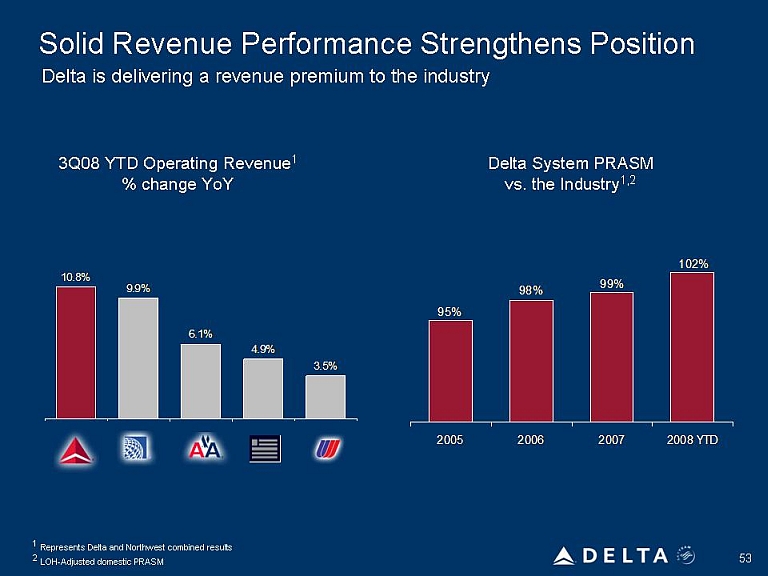
Solid Revenue Performance Strengthens Position Delta is delivering a revenue premium to the industry 3Q08 YTD Operating Revenue1 % change YoY Delta System PRASM 2 LOH-Adjusted domestic PRASM1 Represents Delta and Northwest combined results 10.8 9.906.104.903.56 95098099010202005 2006 200702008 YTDvs. the Industry1,2
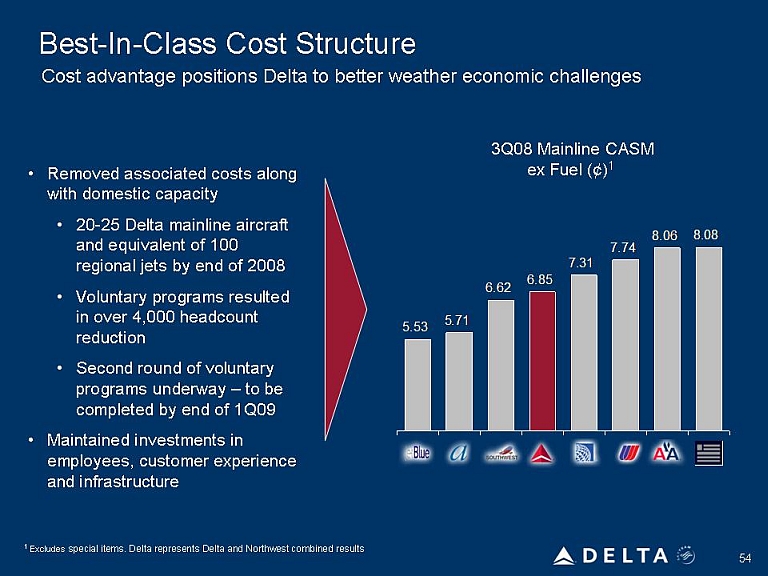
Best-In-Class Cost Structure Cost advantage positions Delta to better weather economic challenges Removed associated costs along with domestic capacity 20-25 Delta mainline aircraft and equivalent of 100 regional jets by end of 2008 Voluntary programs resulted in over 4,000 headcount reductionSecond round of voluntary programs underway – to be completed by end of 1Q09 Maintained investments in employees, customer experience and infrastructure 1 Excludes special items. Delta represents Delta and Northwest combined results1 Excludes special items. Delta represents Delta and Northwest combined results3Q08 Mainline CASM ex Fuel (¢)1 5.53 5.71 6.62 6.85 7.31 7 74 8.06 8.08
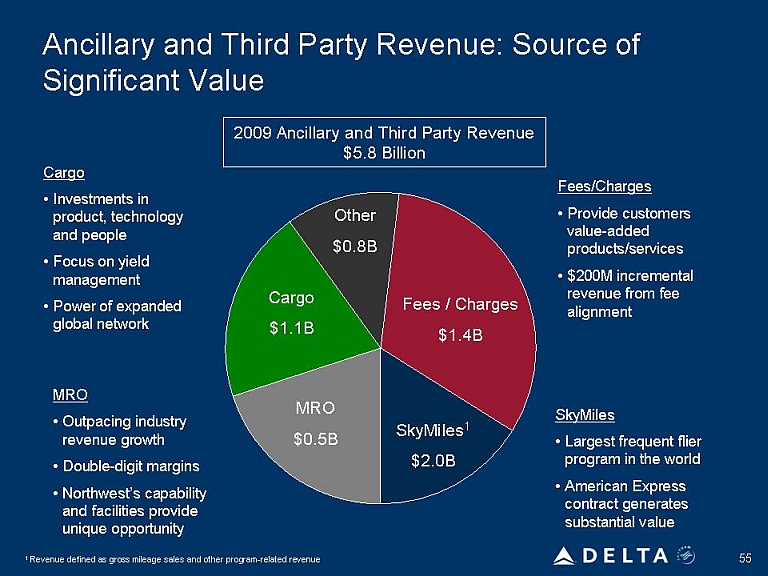
Ancillary and Third Party Revenue: Source of Significant Value Cargo Investments in product, technology and people Focus on yield management Power of expanded global networkMROOutpacing industry revenue growth Double-digit margins Northwest’s capability and facilities provide unique opportunity 1 Revenue defined as gross mileage sales and other program-related revenue 2009 Ancillary and Third Party Revenue $5.8 BillionFees/Charges Provide customers value-added products/services $200M incremental revenue from fee alignment SkyMiles Largest frequent flier program in the world American Express contract generates substantial value Other $0.8B Cargo $1.1BFees / Charges $1.4BSkyMiles1 $2.0B MRO$0.5B

Fuel Price Decline, Capacity Rationalization and Synergies Provide Upside to Manage Economic Downturn Annualized savings from $50 decline in crude price per barrel ($100 to $50) Savings from capacity reduction of 6 - 8% Merger synergies Total Impact ~$5 Billion~$1 Billion ~$0.5 Billion ~$6.5 Billion
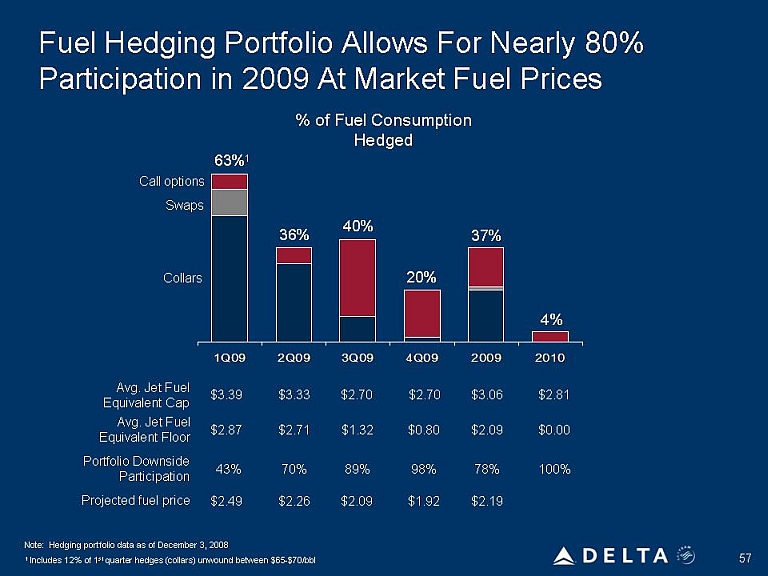
Fuel Hedging Portfolio Allows For Nearly 80% Participation in 2009 At Market Fuel Prices % of Fuel Consumption Hedged Call options SwapsCollarsProjected fuel pricePortfolio Downside ParticipationAvg. Jet Fuel Equivalent Floor Avg. Jet Fuel 3.39 3.33 2.70 2.70 3.06 2.81 2.87 2.71 1.32 0.80 2.09 0.00 43 70 89 98 78 100 2.49 2.26 2.09 1.92 2.19 Note: Hedging portfolio data as of December 3, 2008 1 Includes 12% of 1st quarter hedges (collars) unwound between $65-$70/bbl
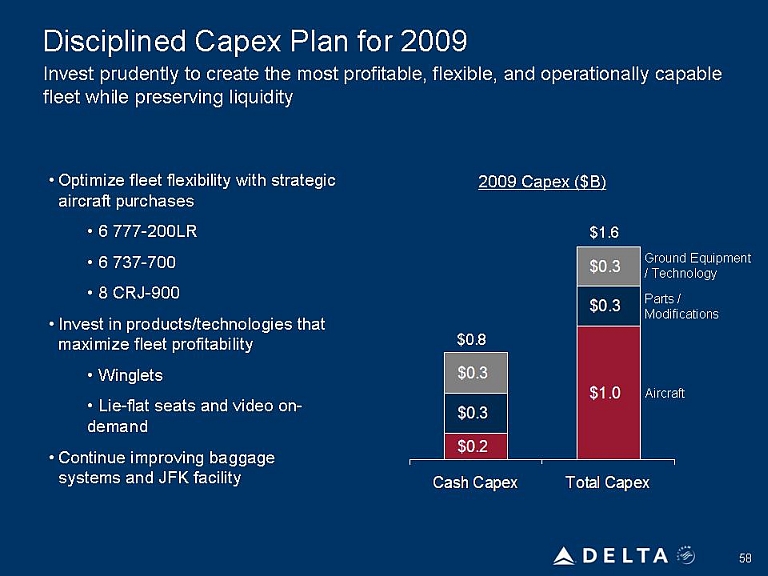
Disciplined Capex Plan for 2009 Invest prudently to create the most profitable, flexible, and operationally capable fleet while preserving liquidity Optimize fleet flexibility with strategic aircraft purchases 6 777-200LR 6 737-700 8 CRJ-900 Invest in products/technologies that maximize fleet profitability Winglets Lie-flat seats and video on- demand Continue improving baggage systems and JFK facility 2009 Capex ($B) Ground Equipment / Technology Parts / Modifications Aircraft 0.3 0.3 0.2 1.6 0.3 1.0
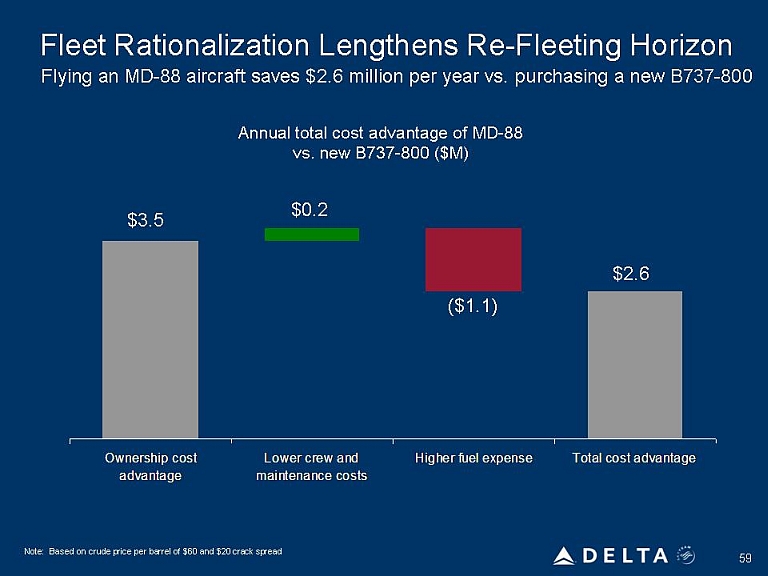
Fleet Rationalization Lengthens Re-Fleeting Horizon Flying an MD-88 aircraft saves $2.6 million per year vs. purchasing a new B737-800 Annual total cost advantage of MD-88 vs. new B737-800 ($M) Note: Based on crude price per barrel of $60 and $20 crack spread Ownership cost advantage lower crew and maintenance costs higher fuel expense total cost advantage
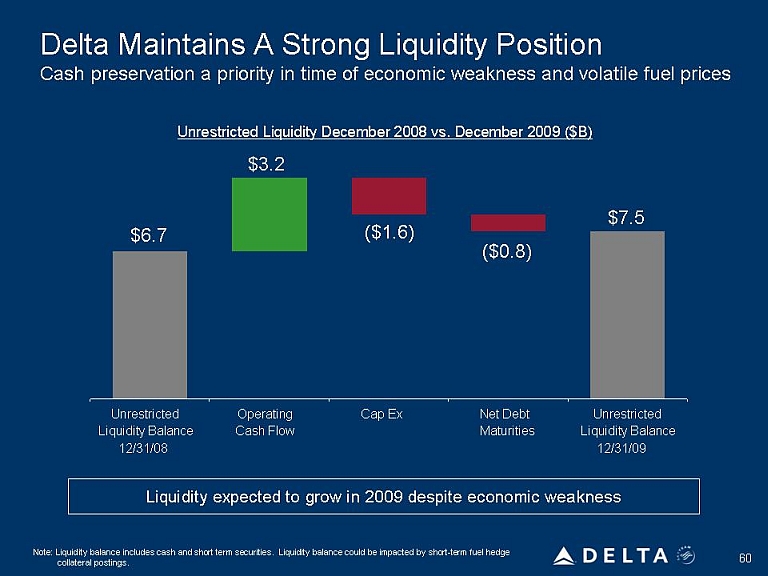
Delta Maintains A Strong Liquidity Position Cash preservation a priority in time of economic weakness and volatile fuel prices Unrestricted Liquidity December 2008 vs. December 2009 ($B) Liquidity expected to grow in 2009 despite economic weakness Note: Liquidity balance includes cash and short term securities. Liquidity balance could be impacted by short-term fuel hedge collateral postings.6.7 3.2 1.6 0.8 7.5 Unrestricted Liquidity Balance 12/31/08 Operating Cash Flow Cap Ex Net Debt Maturities Unrestricted Liquidity Balance 12/31/09
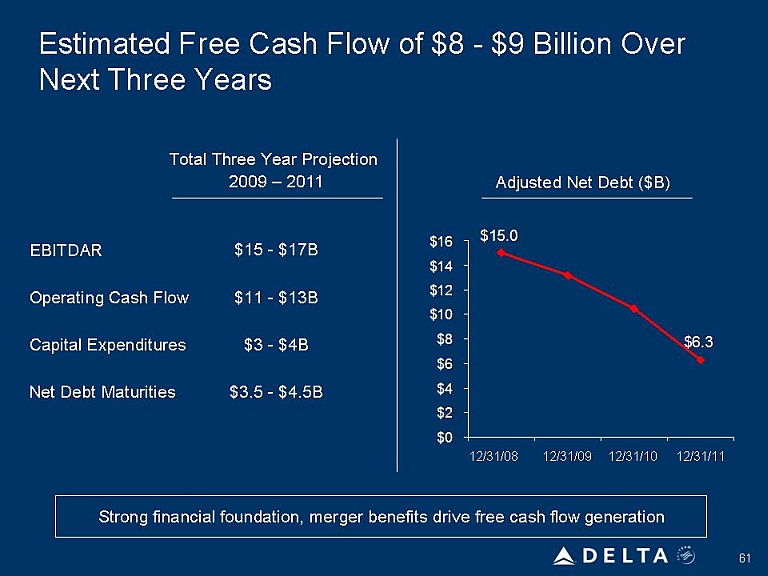
Estimated Free Cash Flow of $8 - $9 Billion Over Next Three Years Total Three Year Projection 2009 – 2011 Adjusted Net Debt ($B)EBITDAR Operating Cash Flow Capital Expenditures Net Debt Maturities Strong financial foundation, merger benefits drive free cash flow generation $15 - $17B $11 - $13B $11 - $13B $3.5 - $4.5B12/31/08 12/31/0912/31/10 3
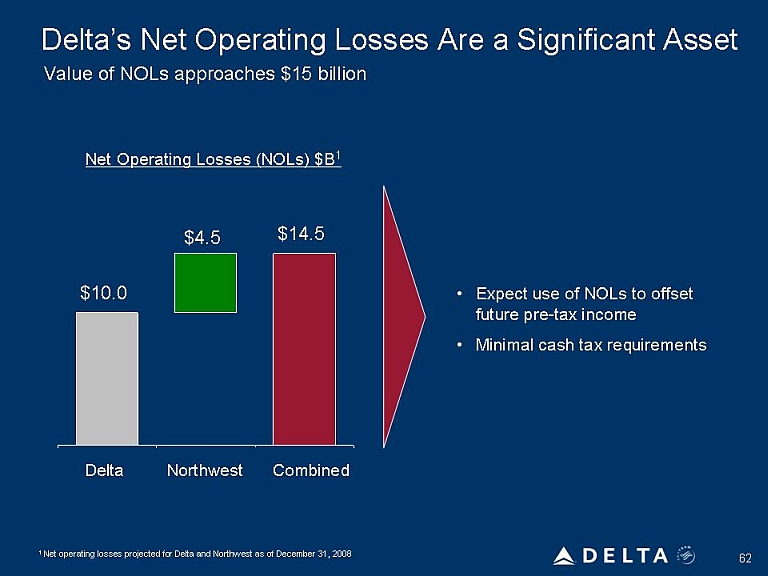
Delta’s Net Operating Losses Are a Significant Asset Value of NOLs approaches $15 billion Net Operating Losses (NOLs) $B1 Expect use of NOLs to offset future pre-tax income Minimal cash tax requirements 1 Net operating losses projected for Delta and Northwest as of December 31, 2008 10.0 4.5 14.5
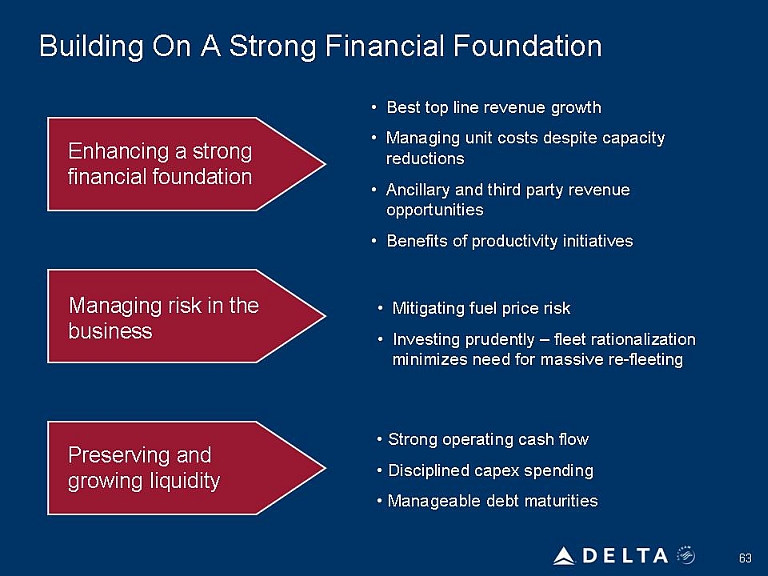
Building On A Strong Financial Foundation Enhancing a strong financial foundationManaging risk in the business Preserving and growing liquidity Best top line revenue growth Managing unit costs despite capacity reductions Ancillary and third party revenue opportunities Benefits of productivity initiatives Mitigating fuel price risk Investing prudently – fleet rationalization minimizes need for massive re-fleeting Strong operating cash flow Disciplined capex spending Manageable debt maturities
Delta: One Great Airline Solid balance sheet and liquidity position Durable financial foundation Financial and strategic benefits of consolidationPremier global network and leading alliances Engaged, committed workforceInvestments in customer service and operational improvements

Appendix A: Bankruptcy Claims Update
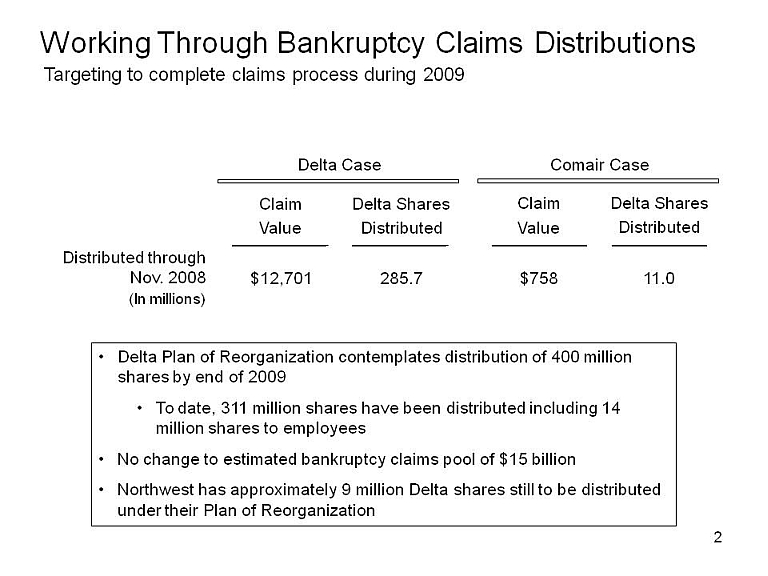
Working Through Bankruptcy Claims Distributions Targeting to complete claims process during 2009 Delta Plan of Reorganization contemplates distribution of 400 million shares by end of 2009 To date, 311 million shares have been distributed including 14 million shares to employees No change to estimated bankruptcy claims pool of $15 billion Northwest has approximately 9 million Delta shares still to be distributed under their Plan of ReorganizationDistributed through Nov. 2008 (In millions) Delta Case Comair Case Claim value Delta shares Distributed Claim value Delta Shares distributed 12,701,285.7,758,11.0

Appendix B: Unaudited Condensed Combined Financial Information
Unaudited Condensed Combined Financial InformationThe following Unaudited Combined Statements of Operations and Unaudited Condensed Combined Statement of Cash Flows have been developed from and should be read in conjunction with (1) the unaudited interim consolidated financial statements of Delta and Northwest contained in their respective Quarterly Reports on Form 10-Q for the quarterly periods ended September 30, 2008, June 30, 2008 and March 31, 2008 and (2) the audited consolidated financial statements of Delta and Northwest contained in their respective Annual Reports on Form 10-K for the fiscal year ended December 31, 2007. The Unaudited Combined Statements of Operations and Unaudited Condensed Combined Statement of Cash Flows are provided for illustrative purposes only and do not purport to represent the combined company's consolidated results of operations and cash flows for the dates presented, nor are these financial statements necessarily indicative of the combined company’s future consolidated results of operations and cash flows. The historical consolidated financial statements of Northwest have been adjusted to reflect certain reclassifications to conform with Delta’s financial statement presentation. Delta expects to incur significant costs and realize significant benefits associated with integrating the operations of Delta and Northwest. The Unaudited Combined Statements of Operations do not reflect any purchase accounting adjustments, costs of integration activities, benefits that may result from operating efficiencies or revenue synergies expected to result from the Merger.
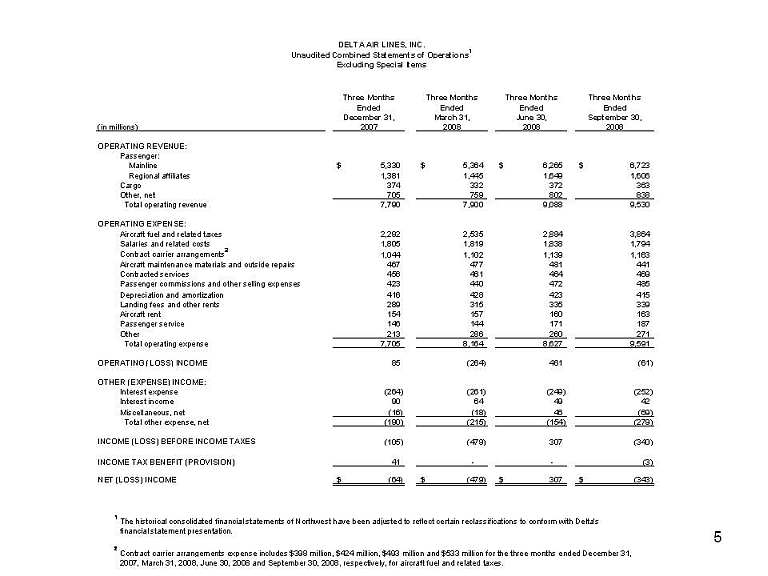
September 30, 2008 OPERATING REVENUE: Passenger: Mainline $ 5,330 $ 5,364 $ 6,265 $ 6,723 Regional affiliates 1,381 1,445 1,649 1,606 Cargo 374 332 372 363&# 160;Other, net 705 759 802 838
Total operating revenue 7,790 7,900 9,088 9,530 OPERATING EXPENSE: Aircraft fuel and related taxes 2,292 2,535 2,884 3,864
Salaries and related costs 1,805 1,819 1,838 1,794 Contract carrier arrangements2 1,044 1,102 1,139 1,163 Aircraft maintenance materials and outside repairs 467 477 481 441 Contracted services 456 461 464 469 Passenger commissions and other selling expenses 423 440 472 485 Depreciation and amortization 416 428 423 415 Landing fees and other rents 289 315 335 339 Aircraft rent 154 157 160 163 Passenger service 146 144 171 187 Other 213 286 260 271 Total operating expense 7,705 8,164 8,627 9,591 OPERATING (LOSS) INCOME 85 (264) 461 (61) OTHER (EXPENSE) INCOME: Interest expense (264) (261) (249) (252) Interest income 90 64 49 42 Miscellaneous, net (16) (18) 46 (69) Total other expense, net (190) (215) (154) (279)INCOME (LOSS) BEFORE INCOME TAXES (105) (479) 307 (340) INCOME TAX BENEFIT (PROVISION) 41 - - (3) NET (LOSS) INCOME $ (64) $ (479) $ 307 $ (343)
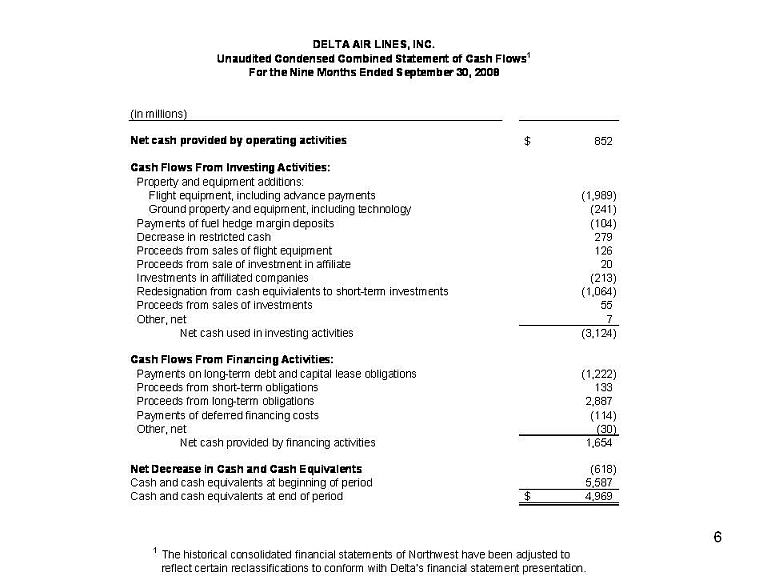
DELTA AIR LINES, INC. Unaudited Condensed Combined Statement of Cash Flows' For the Nine Months Ended September 30, 2008 (in millions) Net cash provided by operating activities $ 852 Cash Flows From Investing Activities: Property and equipment additions: Flight equipment, including advance payments (1,989) Ground property and equipment, including technology (241) Payments of fuel hedge margin deposits (104) Decrease in restricted cash 279
Proceeds from sales of flight equipment 126 Proceeds from sale of investment in affiliate 20
Investments in affiliated companies (213) Redesignation from cash equivialents to short-term investments (1,064) Proceeds from sales of investments 55 Other, net 7 Net cash used in investing activities (3,124) Cash Flows From Financing Activities: Payments on long-term debt and capital lease obligations (1,222) Proceeds from short-term obligations 133 Proceeds from long-term obligations 2,887 Payments of deferred financing costs (114) Other, net (30) Net cash provided by financing activities 1,654 Net Decrease in Cash and Cash Equivalents (618) Cash and cash equivalents at beginning of period 5,587 Cash and cash equivalents at end of period $ 4,969 ' The historical consolidated financial statements of Northwest have been adjusted to reflect certain reclassifications to conform with Delta’s financial statement presentation.
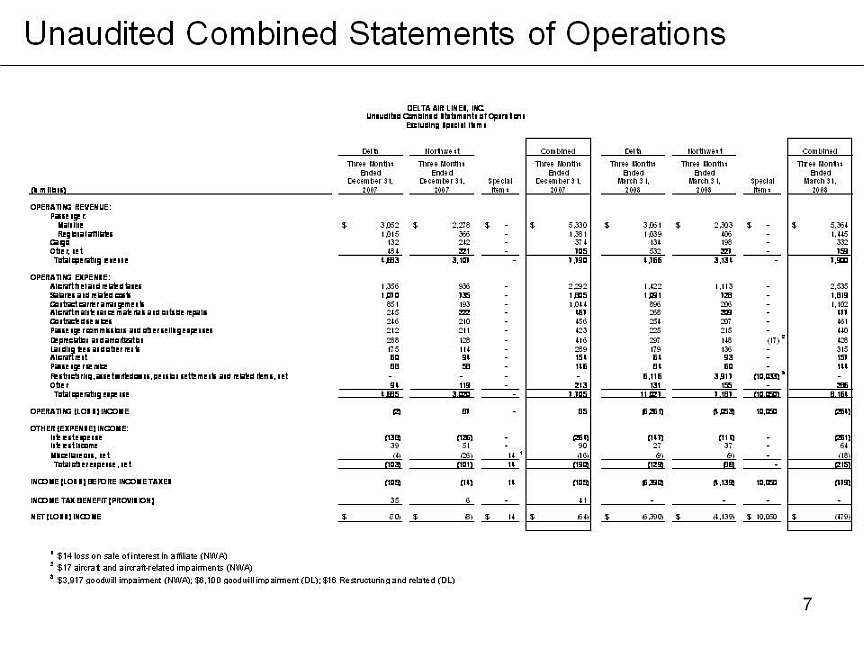
Unaudited Combined Statements of Operations DELTA AIR LINES, INC. Unaudited Combined Statements of Operations Excluding Special Items (in millions) Delta Northwest Special Items Combined Delta Northwest Special Items Combined Three Months Ended December 31, 2007 Three Months Ended December 31, 2007 Three Months Ended December 31, 2007 Three Months Ended March 31, 2008 Three Months Ended March 31, 2008 Three Months Ended March 31, 2008 OPERATING REVENUE: Passenger: Mainline $ 3,052 $ 2,27 8 $ - $ 5,330 $ 3,061 $ 2,303 $ - $ 5,364 Regional affiliates 1,015 366 - 1,381 1,039 406 - 1,445 Cargo 132 242 - - 374 134 198 - 332 Other, net 484 221 - 705 532 227 - 759 Total operating revenue 4,683 3,107 - 7,790 4,766 3,134 - 7,900 OPERATING EXPENSE: Aircraft fuel and related taxes 1,356 936 - 2,292 1,422 1,113 - 2,535 Salaries and related costs 1,070 735 - 1,805 1,091 728 - 1,819 Contract carrier arrangements 851 193 - 1,044 896 206 - 1,102 Aircraft maintenance materials and outside repairs 245 222 - 467 268 209 - 477 Contracted services 246 210 - 456 254 207 - 461 Passenger commissions and other selling expenses 212 211 - 423 225 215 - 440 Depreciation and amortization 288 128 - 416 297 148 (17) 2 428 Landing fees and other rents 175 114 - 289 179 136 - 315 Aircraft rent 60 94 - 154 64 93 - 157 Passenger service& #160; 88 58 - 146 84 60 - 144 Restructuring, asset writedowns, pension settlements and related items, net - - - - 6,116 3,917 (10,033) 3 - Other 94 119 - 213 131 155 - 286 Total operating expense 4,685 3,020 - 7,705 11,027 7,187 (10,050) 8,164 OPERATING (LOSS) INCOME (2) 87 - 85 (6,261) (4,053) 10,050 (264) OTHER (EXPENSE) INCOME: Interest expense (138) (126) - (264) (147) (114) - (261) Interest income 39 51 - 90 27 37 - 64 Miscellaneous, net (4) (26) 14 1 (16) (9) (9) - (18) Total other expense, net (103) (101) 14 (190) (129) (86) - (215) INCOME (LOSS) BEFORE INCOME TAXES (105) (14) 14 (105) (6,390) (4 ,139) 10,050 (479) INCOME TAX BENEFIT (PROVISION) 35 6 - 41 - - - - NET (LOSS) INCOME $ (70) $ (8) $ 14 $ (64) $ (6,390) $ (4,139) $ 10,050 $ (479) 1 $14 loss on sale of interest in affiliate (NWA) 2 $17 aircraft and aircraft-related impairments (NWA) 3 $3,917 goodwill impairment (NWA); $6,100 goodwill impairment (DL); $16 Restructuring and related (DL)
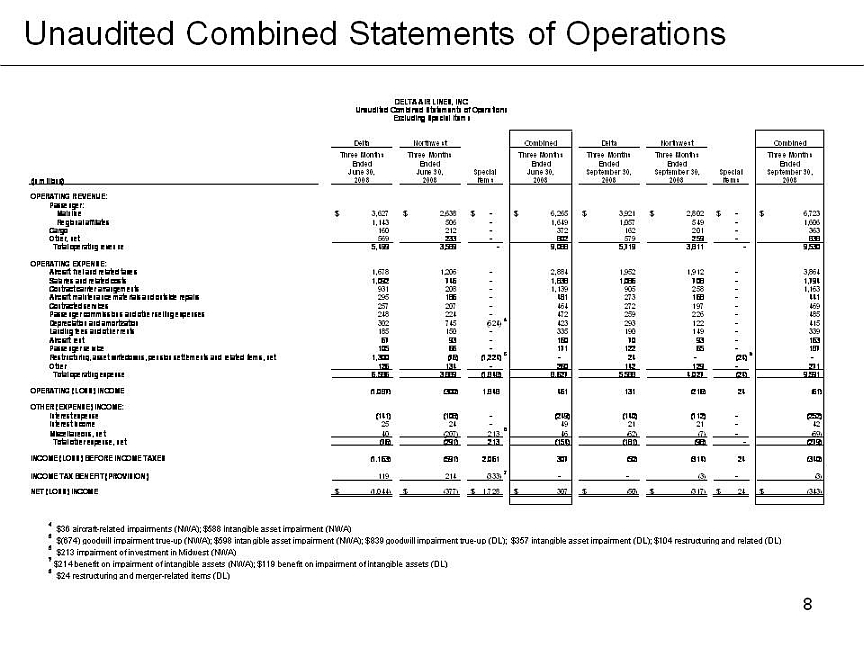
Combined Statements of OperationsOPERATING REVENUE: Passenger: Mainline $ 3,627 $ 2,638 ;$ - Regional affiliates 1,143 506 - Cargo 160 212 - Other, net 569 233 - Total operating revenue 5,499 3,589 - OPERATING EXPENSE: Aircraft fuel and related taxes 1,678 1,206 - Salaries and related costs 1,092 746 - Contract carrier arrangements 931 208 - Aircraft maintenance materials and outside repairs 295 186 - Contracted services 257 207 - Passenger commissions and other selling expenses 248 224 - Depreciation and amortization 302 745 (624) 4 Landing fees and other rents 185 150 - Aircraft rent 67 93 - Passenger service 105 66 - Restructuring, asset writedowns, pension settlements and related items, net 1,300 (76) (1,224) 5 Other 126 134 - Total operating expense 6,586 3,889 (1,848) OPERATING (LOSS) INCOME (1,087) (300) 1,848 OTHER (EXPENSE) INCOME: Interest expense (141) (108) - Interest income 25 24 - Miscellaneous, net 40 (207) 213 6 Total other expense, net (76) (291) 213 INCOME (LOSS) BEFORE INCOME TAXES (1,163) (591) 2,061 INCOME TAX BENEFIT (PROVISION) 119 214 (333)7 NET (LOSS) INCOME $ (1,044) $ (377) $ 1,728 DeltaNorthwest Three Months Three Months EndedEnded June 30,June 30,Special (in millions)2008 2008Items DeltaNorthwest Three MonthsThree Months EndedEndeSeptember 30,September 30,Special 20082008ItemsDELTA AIR LINES, INC. Unaudited Combined Statements of Operations Excluding Special Items DELTA AIR LINES, INC. Unaudited Combined Statements of Operations Excluding Special Items
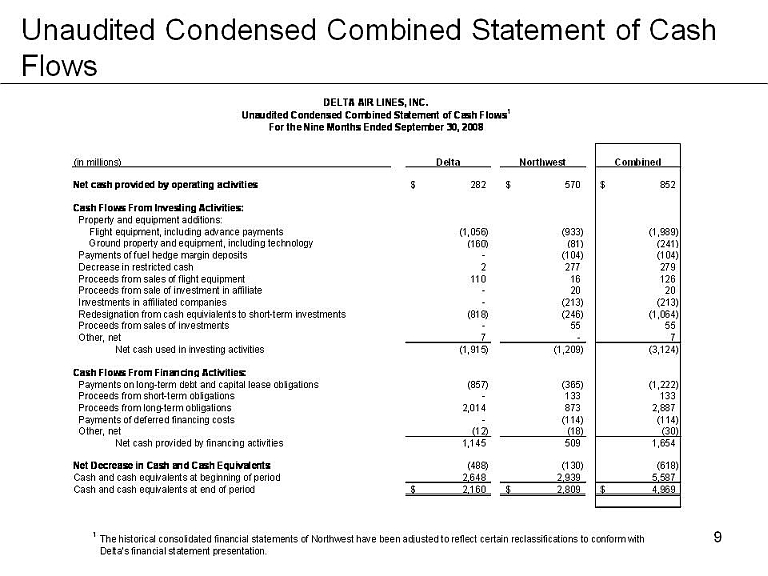
Unaudited Condensed Combined Statement of Cash Flows DELTA AIR LINES, INC. Unaudited Condensed Combined Statement of Cash Flows' For the Nine Months Ended September 30, 2008 DELTA AIR LINES, INC. Unaudited Condensed Combined Statement of Cash Flows' For the Nine Months Ended September 30, 2008 (in millions) Delta Northwest Net cash provided by operating activities $ 282 $ 570 Cash Flows From Investing Activities: Property and equipment additions: Flight equipment, including advance payments (1,056) (933) Ground property and equipment, including technology (160) (81) Payments of fuel hedge margin deposits - (104) Decrease in restricted cash 2 277 Proceeds from sales of flight equipment 110 16 Proceeds from sale of investment in affiliate - 20 Investments in affiliated companies - (213) Redesignation from cash equivialents to short-term investments (818) (246) Proceeds from sales of investments - 55 Other, net 7 - Net cash used in investing activities (1,915) (1,209) Cash Flows From Financing Activities: Payments on long-term debt and capital lease obligations (857) (365) Proceeds from short-term obligations - 133 Proceeds from long-term obligations 2,014 873 Payments of deferred financing costs - (114) Other, net (12) (18) Net cash provided by financing activities 1,145 509 Net Decrease in Cash and Cash Equivalents (488) (130) Cash and cash equivalents at beginning of period 2,648 2,939 Cash and cash equivalents at end of period $ 2,160 $ 2,809 Combined $852 (1,989) (241) (104) 279 126 20 (213) (1,064) 55 7 (3,124) (1,222) 133 2,887 (114) (30) 1,654 (618) 5,587 $4,969 ' The historical consolidated financial statements of Northwest have been adjusted to reflect certain reclassifications to conform withDelta’s financial statement presentation.
Appendix C: Non-GAAP Reconciliations
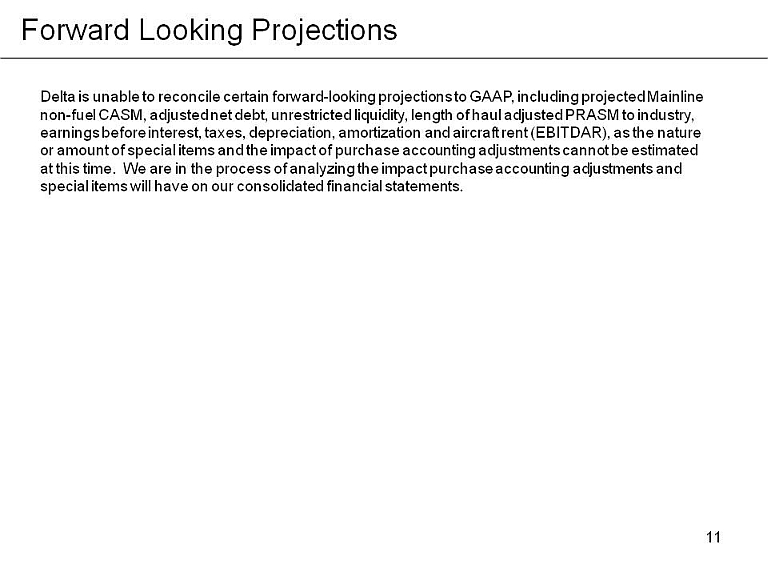
Forward Looking Projections Delta is unable to reconcile certain forward-looking projections to GAAP, including projected Mainline non-fuel CASM, adjusted net debt, unrestricted liquidity, length of haul adjusted PRASM to industry, earnings before interest, taxes, depreciation, amortization and aircraft rent (EBITDAR), as the nature or amount of special items and the impact of purchase accounting adjustments cannot be estimated at this time. We are in the process of analyzing the impact purchase accounting adjustments and special items will have on our consolidated financial statements.
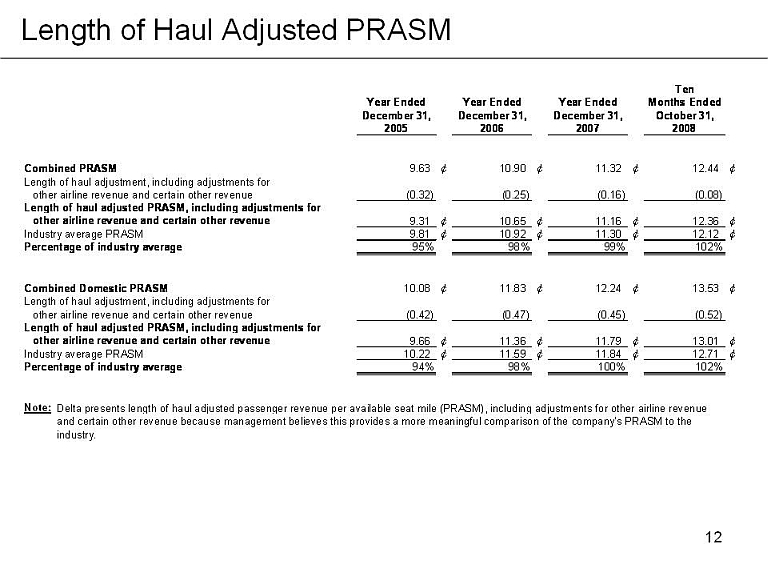
Length of Haul Adjusted PRASM
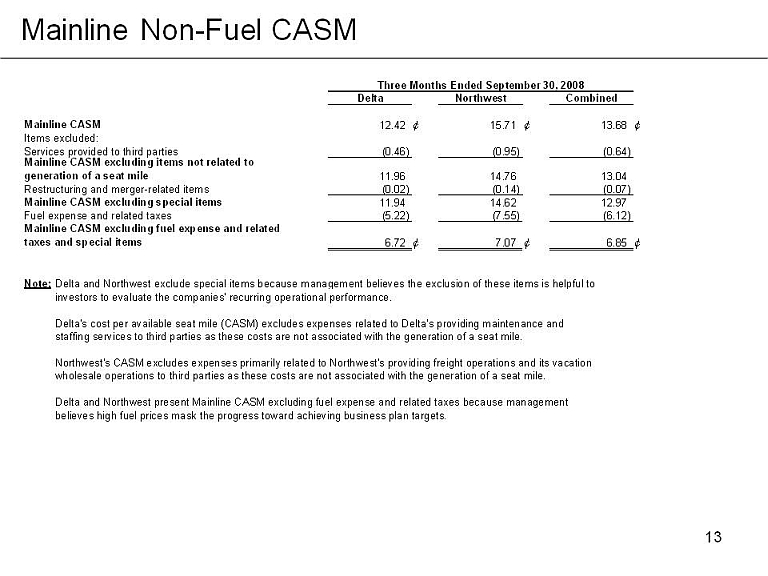
Mainline Non-Fuel CASM Delta and Northwest exclude special items because management believes the exclusion of these items is helpful to investors to evaluate the companies' recurring operational performance. Delta's cost per available seat mile (CASM) excludes expenses related to Delta's providing maintenance and staffing services to third parties as these costs are not associated with the generation of a seat mile. Northwest's CASM excludes expenses primarily related to Northwest's providing freight operations and its vacation wholesale operations to third parties as these costs are not associated with the generation of a seat mile. Delta and Northwest present Mainline CASM excluding fuel expense and related taxes because management believes high fuel prices mask the progress toward achieving business plan targets. Three Months Ended September 30, 2008 Delta Northwest Combined Mainline CASM 12.42 ¢ 15.71 ¢ 13.68 ¢ Items excluded: Services provided to third parties (0.46) (0.95) (0.64) Mainline CASM excluding items not related to generation of a seat mile 11.96 14.76 13.04 Restructuring and merger-related items (0.02) (0.14) (0.07) Mainline CASM excluding special items 11.94 14.62 12.97 Fuel expense and related taxes (5.22) (7.55) (6.12) Mainline CASM excluding fuel expense and related taxes and special items 6.72 ¢ 7.07 ¢ 6.85 ¢