Exhibit 99.1
Delta: One Great Airline Ed Bastain, President March 10, 2009

Safe Harbor
This presentation contains various projections and other forward-looking statements which represent Delta’s estimates or expectations regarding future events. All forward-looking statements involve a number of assumptions, risks and uncertainties, many of which are beyond Deltas control, that could cause the actual results to differ materially from the projected results. Factors which could cause such differences include, without limitation, business, economic, competitive, industry, regulatory, market and financial uncertainties and contingencies, as well as the “Risk Factors” discussed in Delta’s Form 10-K filed with the SEC on March 2, 2009. Caution should be taken not to place undue reliance on Deltas forward-looking statements, which represent Delta’s views only as of the date of this presentation, and which Delta has no current intention to update.
In this presentation, we will discuss certain non-GAAP financial measures. You can find the reconciliations of those measures to comparable GAAP measures on our website at delta.com.

Delta: One Great Airline Track Record Of Meeting Our Commitments •Top line growth, best-in-class costs and liquidity • Completed Northwest merger Industry-leading capacity discipline Solid Foundation For Long-Term Success • Strong financial foundation and liquidity • Unmatched $2 billion synergy opportunity from merger Building the world’s leading global network Managing The Current Economic Cycle Expecting profit for 2009 •Business generating strong free cash flow • Moving quickly to adjust international capacity
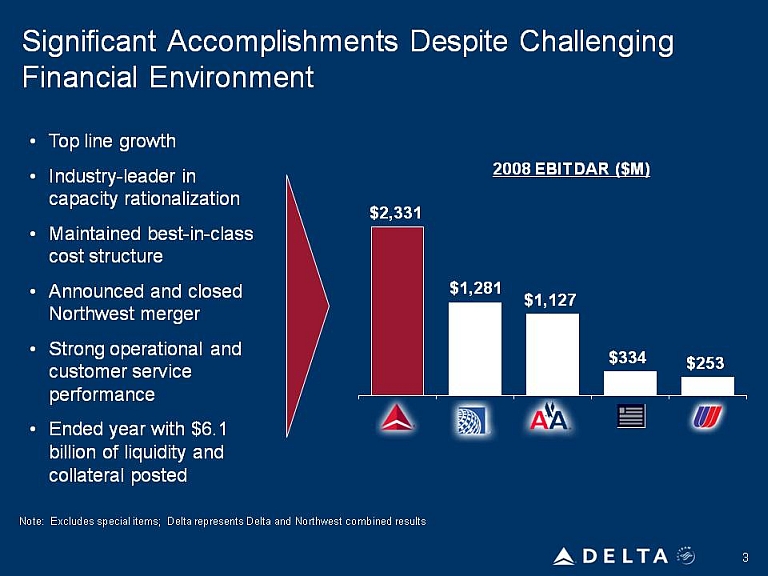
Significant Accomplishments Despite Challenging Financial Environment •Top line growth •Industry-leader in capacity rationalization • Maintained best-in-class cost structure •Announced and closed Northwest merger •Strong operational and customer service performance •Ended year with $6.1 billion of liquidity and collateral posted 2008 EBITDAR ($M) $2,331 $1,281 $1,127 $334 $253 Note: Excludes special items; Delta represents Delta and Northwest combined results

Business Has A Strong Financial Foundation 8.2% 7.1% 3.8% 3.6% 0.5% 2008 Operating Revenue % change YoY 2008 Mainline Non-Fuel Unit Costs (¢) 2008 Liquidity ($B ) 7.19 7.51 7.99 8.08 8.36 $6.1 $3.7 $3.0 $2.6 $1.8 •Premier global network drives unit revenue premium and provides tools to manage economic weakness •Merger synergies and strict cost discipline offset CASM pressure from capacity reductions •Free cash flow allows for further strengthening of the balance sheet Note: All figures exclude special items; Liquidity includes cash collateral posted with counterparties; Delta represents Delta and Northwest combined results
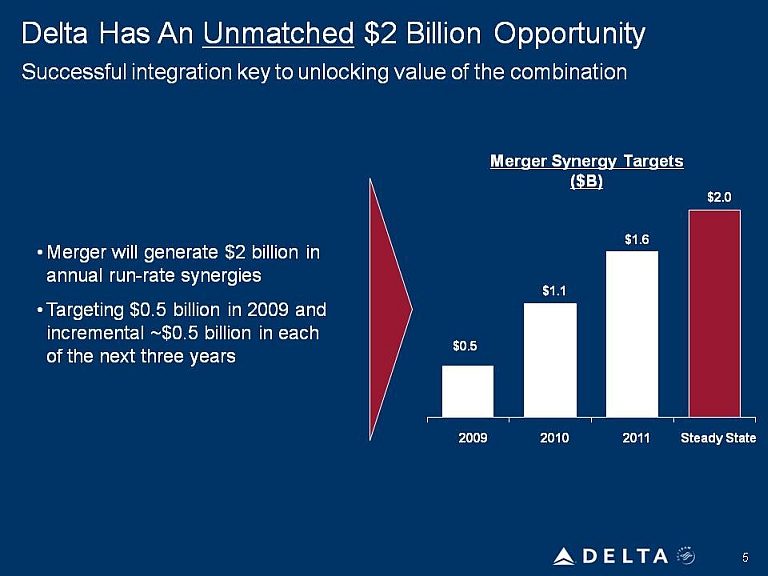
Delta Has An Unmatched$2 Billion Opportunity Successful integration key to unlocking value of the combination •Merger will generate $2 billion in annual run-rate synergies •Targeting $0.5 billion in 2009 and itl$05billiihincremental ~$0.5 billion in each of the next three years Merger Synergy Targets ($B) $0.5 $1.1 $1.6 $2.0 2009 2010 2011 Steady State

Integration Of The Airlines Is On Track Significant Progress in Four Months •24 Northwest aircraft painted in Delta livery •107 stations integrated and rebranded •Seniority and representation resolved for 25% of workforce •New American Express agreement •Customer-facing employees in Delta uniforms end of March •Customers able to link SkyMiles and WorldPerks accounts Key Milestones Ahead •Initial cross-fleeting starting in April •Onboard products harmonized by Summer 2009 •Resolve remaining employee representation and seniority integration issues by Summer 2009 •Frequent flyer programs integrated by Q4•Single operating certificate by end of 2009 •All domestic stations with Delta brand and 300 Northwest aircraft painted by year end •Technology cutover on track for early 2010
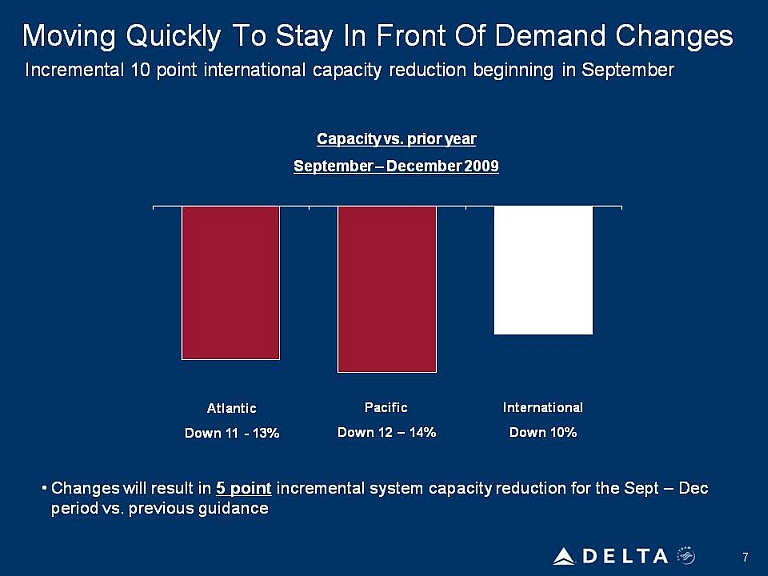
Moving Quickly To Stay In Front Of Demand Changes Incremental 10 point international capacity reduction beginning in September Capacity vs. prior year September –December 2009 Atlantic Down 11 – 13% Pacific Down 12 – 14% International Down 10% •Changes will result in 5 point incremental system capacity reduction for the Sept –Dec period vs. previous guidance
March Quarter In Line With Expectations March quarter 2009 January 27 guidance Operating margin (5) –(6)%(5) –(7)% Fuel Price $2.31 $2.34 Total liquidity $5.1 billion $5.3 billion March quarter 2009 vs. March quarter 2008Passenger unit revenue Down 10% Mainline non-fuel unit cost Up 8%Up 7 -9%System capacity Down 6%Down 5 -7% Domestic Down 10%Down 10 -12% International Flat Flat to up 2% Break-even Q1 pre-tax earnings with fuel at market prices
Out-of-Money Fuel Hedges Roll Off By End of Second Quarter % of Fuel Consumption Hedged Call options Swaps Collars 76% 75% 55% 35% 1Q09 2Q09 3Q09 4Q09 Projected Fuel Price Downside Participation $2.31 $2.03 $1.81 $1.69 32% 36% 74% 84% Current fuel prices, net of hedges, drive more than $5 billion in fuel savings from 2008 levels
Delta Has A Strong Liquidity Position Fuel price decline, capacity rationalization and merger synergies allow for cash generation in face of economic downturn Cash From Operations $3.2 B Capital Expenditures ($1.5B) Net Debt Maturities ($0.8B) Increase in Liquidity $0.9 B Total Liquidity $6.1 B $7.0 B 12/31/08 12/31/09 Note: Total Liquidity includes cash, short term investments and collateral posted with counterparties.
Delta: Positioned For Long-Term Success Strategic Objectives Enhance a strong •Preserve and grow liquidity financial foundation •Maintain best-in-class unit cost position Manage the business responsibly Capitalize on the value of the world’s largest airline •Commitment to capacity discipline •Disciplined capital management •Leverage flexible, cost efficient fleet •Move quickly to capture $2 billion in annual merger synergies
Delta: One Great Airline Durable financial foundation Solid balance sheet and liquidity position Financial and strategic benefits of consolidation Premier global network and leading alliances Investments in customer service and operational improvements Engaged, committed workforce
Non-GAAP Reconciliations Note: The following tables show reconciliations of certain financial measures. The reasons Delta uses these measures are described below. Because Delta completed its merger with Northwest Airlines on October 29, 2008,Delta’s financial results under generally accepted accounting principles ("GAAP") for 2008 and the December 2008 quarter include the results of Northwest Airlines for the period October 30, 2008 through December 31, 2008. Under GAAP, Delta does not include in its financial results the results of Northwest Airlines prior to the completion of thAdilDlt’fiilltdGAAPf2007dtildthe merger. Accordingly, Delta’s financial results under GAAP for 2007 do not include the results of Northwest Airlines for that period. This impacts the comparability of Delta’s financial statements under GAAP for 2008 and 2007 Delta presents its financial results in the tables on a “combined” basis. “Combined” basis means the company combines the financial results of Delta and Northwest as if the merger had occurred at the beginning of the applicable period. For example, Delta’s financial results on a combined basis for 2008 and 2007 include the financial results of Northwest Airlines for the entire periods. Delta believes presenting this financial information on a combined basis provides a more meaningful basis for comparing Delta’s year-over-year financial performance than the GAAP financial information. The guidance comparisons below assume the financial statements for the applicable periods were prepared on a combined basis, excluding special items.
Non-GAAP Reconciliations (continued) Delta excludes special items because management believes the exclusion of these items is helpful to investors to evaluate the company’s recurring operational performance. Delta excludes mark-to-market ("MTM") adjustments on fuel hedges settling in 2009 in order to more consistently reflect fuel expense for the respective period. Under normal hedge accounting, these MTM adjustments would be included within accumulated other comprehensive income and not impact the statement of operations the month of settlement. • Delta presents Mainline cost per available seat mile ("CASM") excluding fuel expense and related taxes because management believes the volatility in fuel prices mask the progress toward achieving business plan targets.• Combined Mainline CASM excludes transactions with third parties that are not associated with the generation of a seat mile. These transactions include expenses related to Delta’s providing maintenance services, staffing services and freight operations as well as Delta’s vacation wholesale operations. • EBITDAR has been presented as management believes it is helpful to investors in utilizing EBITDAR as a proxy for operating cash flow on a period over period basis.
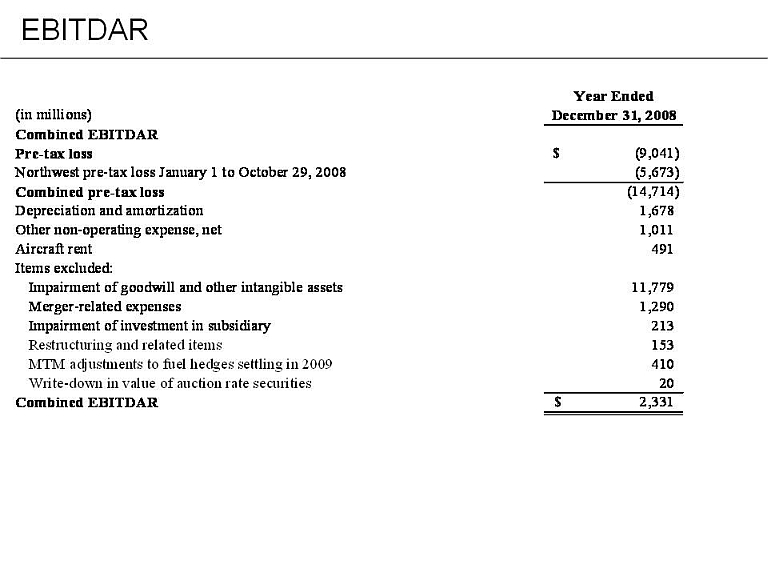
EBITDAR Year Ended(in millions)December 31, 2008Combined EBITDAR Pre-tax loss(9,041)$ Northwest pre-tax loss January 1 to October 29, 2008(5,673) Combined pre-tax loss(14,714) Depreciation and amortization 1,678 Other non-operating expense, net 1,011 Aiftt491Aircraft rent491 Items excluded: Impairment of goodwill and other intangible assets11,779 Merger-related expenses1,290 Impairmentofinvestmentinsubsidiary213Impairment of investment in subsidiary213 Restructuring and related items153 MTM adjustments to fuel hedges settling in 2009410 Write-down in value of auction rate securities20 Combined EBITDAR2,331$
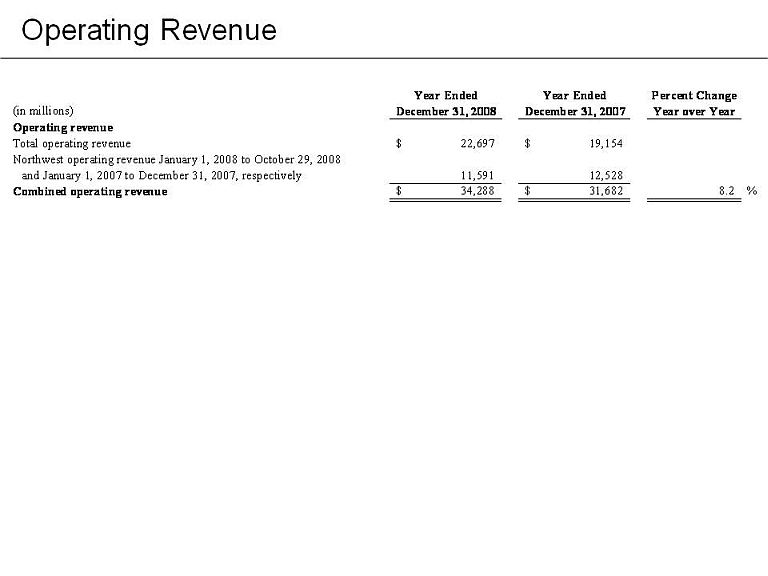
Operating Revenue Year Ended Year Ended Percent Change(in millions)December 31, 2008 December 31, 2007 Year over Year Operating revenue Total operating revenue22,697 $ 19,154 $ Northwest operating revenue January 1, 2008 to October 29, 2008 and January 1, 2007 to December 31, 2007, respectively 11,591 12,528 Combined operating revenue34,288 $ 31,682 $ 8.2%
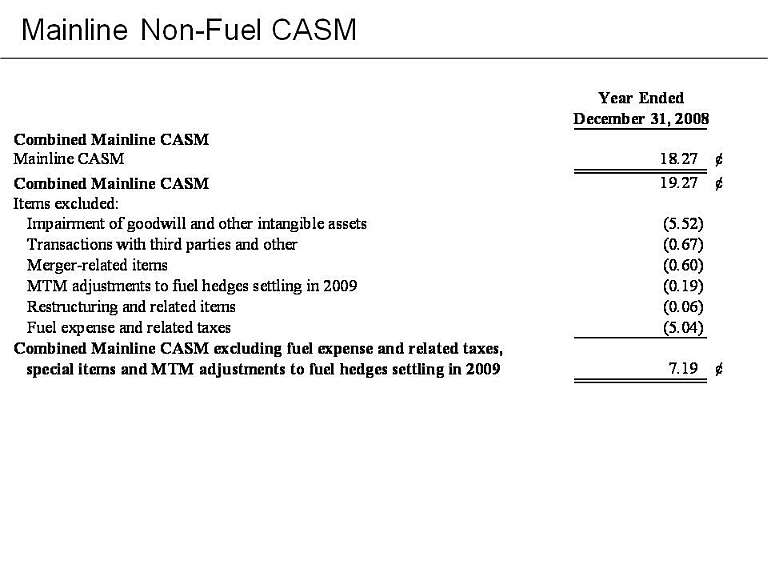
Mainline Non-Fuel CASM Year Ended December 31, 2008 Combined Mainline CASMMainlineCASM18.27¢Mainline CASM18.27 ¢ Combined Mainline CASM19.27 ¢ items excluded: Impairment of goodwill and other intangible assets(5.52) Transactions with third parties and other(067)Transactions with third parties and other(0.67) Merger-related items(0.60) MTM adjustments to fuel hedges settling in 2009(0.19) Restructuring and related items(0.06) Fuel expense and related taxes(504)Fuel expense and related taxes(5.04) Combined Mainline CASM excluding fuel expense and related taxes, special items and MTM adjustments to fuel hedges settling in 20097.19 ¢
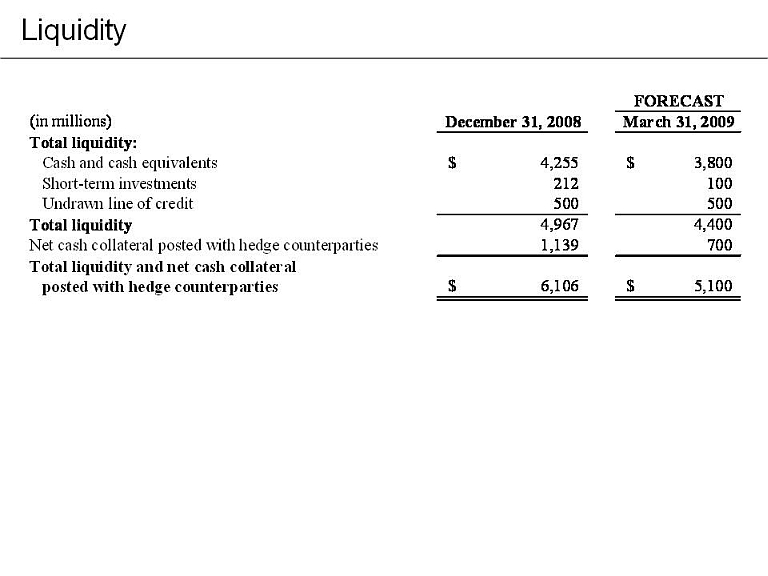
Liquidity (in millions)December 31, 2008March 31, 2009Total liquidity: Cash and cash equivalents 4,255 $ 3,800 $ Short term investments212 100 Short-term investments 212 100 Undrawn line of credit 500 500 Total liquidity4,967 4,400 Net cash collateral posted with hedge counterparties 1,139 700 Total liquidity and net cash collateral Total liquidity and net cash collateral posted with hedge counterparties 6,106 $ 5,100
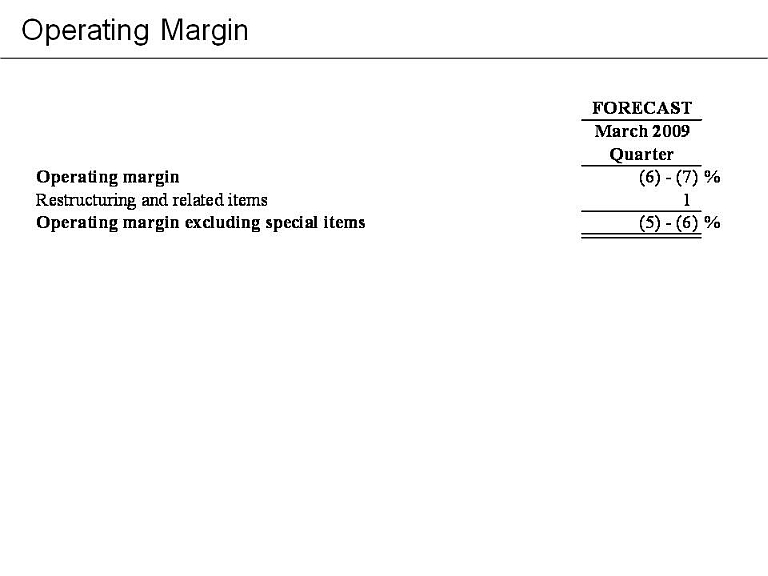
Operating Margin FORECAST March 2008 Quarter Operating margin(6)(7)%Operating margin(6) - (7)%Restructuring and related items1Operating margin excluding special items(5) - (6)%
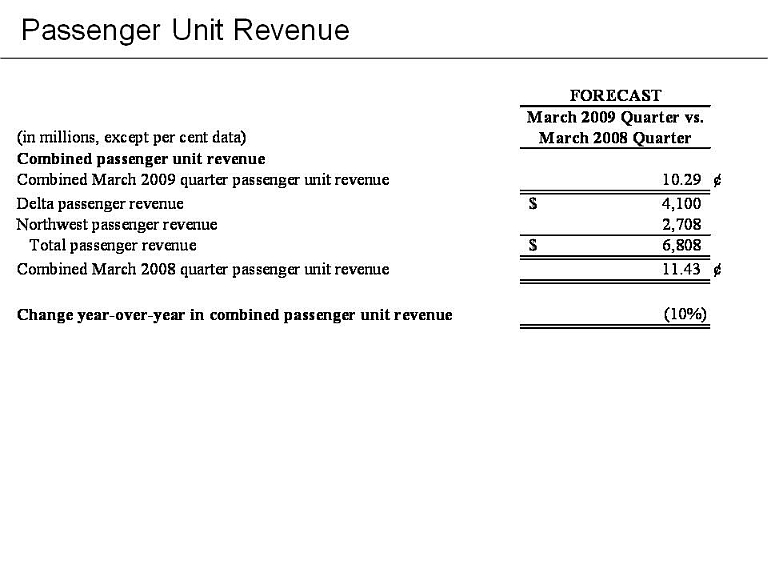
Passenger Unit Revenue FORECAST March 2009 Quarter vs.(in millions, except per cent data)March 2008 Quarter Combined passenger unit revenue Combined passenger unit revenue Combined March 2009 quarter passenger unit revenue10.29 ¢ Delta passenger revenue 4,100 $ Northwest passenger revenue 2,708 Totalpassengerrevenue6808$ Total passenger revenue6,808 $Combined March 2008 quarter passenger unit revenue11.43 ¢Change year-over-year in combined passenger unit revenue(10%)
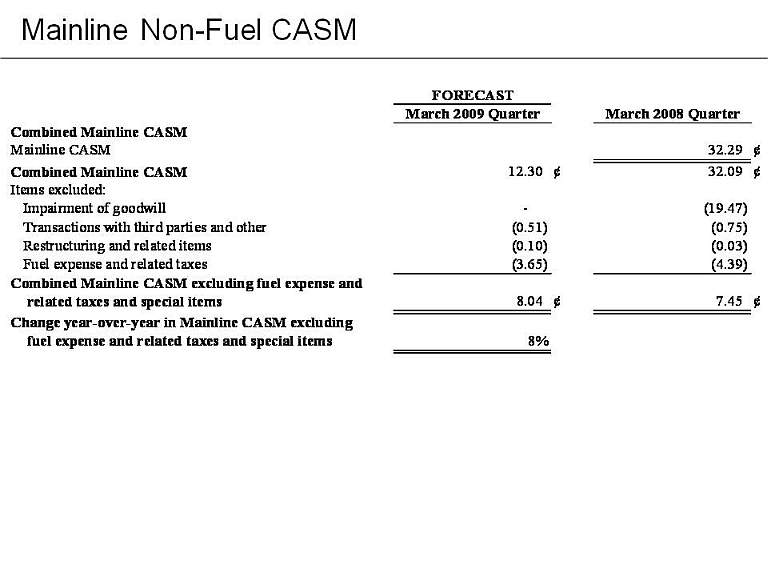
Mainline Non-Fuel CASM FORECAST March 2009 Quarter March 2008 Quarter Combined Mainline CASM Mainline CASM 32.29 ¢ Combined Mainline CASM 12.30 ¢ 32.09 ¢ Items excluded: Impairment of goodwill- (19.47) Transactions with third parties and other(0.51) (0.75) Restructuring and related items(010)(003)Restructuring and related items(0.10) (0.03) Fuel expense and related taxes(3.65) (4.39) Combined Mainline CASM excluding fuel expense and related taxes and special items 8.04¢ 7.45¢ Change year-over-year in Mainline CASM excluding fuel expense and related taxes and special items8%