Exhibit 99.1

Delta: Building A Better Airline
Raymond James Global Airline Conference
February 3, 2011

1
Safe Harbor
This presentation contains various projections and other forward-looking statements which
represent Delta’s estimates or expectations regarding future events. All forward-looking
statements involve a number of assumptions, risks and uncertainties, many of which are
beyond Delta’s control, that could cause the actual results to differ materially from the
projected results. Factors which could cause such differences include, without limitation,
business, economic, competitive, industry, regulatory, market and financial uncertainties
and contingencies, as well as the “Risk Factors” discussed in Delta’s Form 10-K for the year
ended December 31, 2009 and Quarterly Report on Form 10-Q for the quarterly period
ended September 30, 2010. Caution should be taken not to place undue reliance on
Delta’s forward-looking statements, which represent Delta’s views only as of the date of this
presentation, and which Delta has no current intention to update.
In this presentation, we will discuss certain non-GAAP financial measures. You can find the
reconciliations of those measures to comparable GAAP measures on our website at
delta.com.
reconciliations of those measures to comparable GAAP measures on our website at
delta.com.

2
Delta: Building A Better Airline
Higher revenues plus solid cost performance
drive $2.5 billion year-over-year improvement in
profitability for 2010
drive $2.5 billion year-over-year improvement in
profitability for 2010
Uniquely positioned for the
challenges of 2011
challenges of 2011
Strong free cash flow generation
Solid financial foundation and low cost structure,
coupled with lowered risk profile from completed
integration and positive labor relationship,
uniquely positions Delta in the industry
coupled with lowered risk profile from completed
integration and positive labor relationship,
uniquely positions Delta in the industry
A successful 2010
Strong operating cash flows with limited capital
requirements allow for sustainable free cash
flow generation
requirements allow for sustainable free cash
flow generation
3
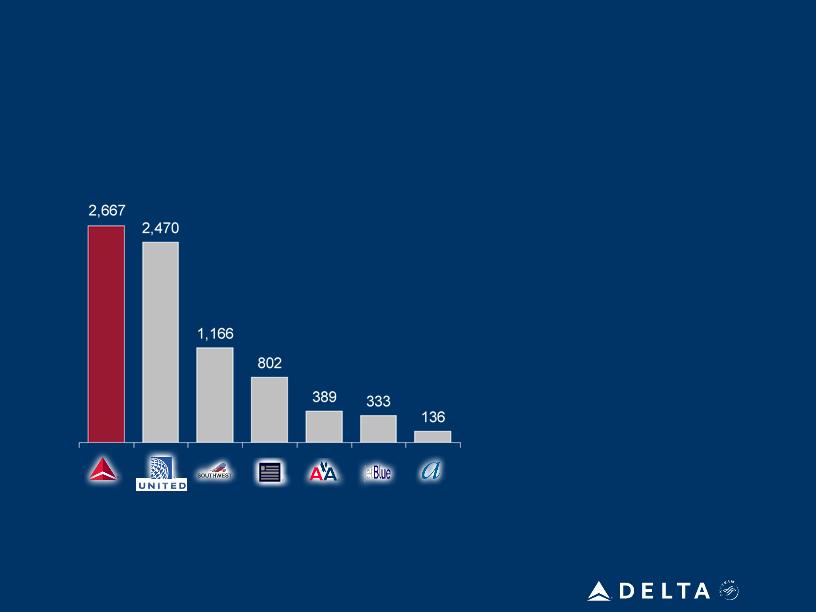
2010: Airlines Return to Profitability
2010 Operating Income ($M)
Note: All results exclude special items.
Delta’s industry-leading results are among the best in its history
In 2010, Delta:
• Improved pre-tax income by more
than $2.5 billion over 2009
than $2.5 billion over 2009
• Generated a 10% return on
invested capital
invested capital
• Increased unit revenues by 13%
• Maintained consolidated ex-fuel
unit costs at 2009 levels
unit costs at 2009 levels
• Reduced adjusted net debt by $2
billion to $15 billion
billion to $15 billion
• Successfully completed merger
integration
integration
EBIT
Margin
Margin
8.4%
5.6%
8.8%
1.8%
6.7%
9.6%
7.3%

4
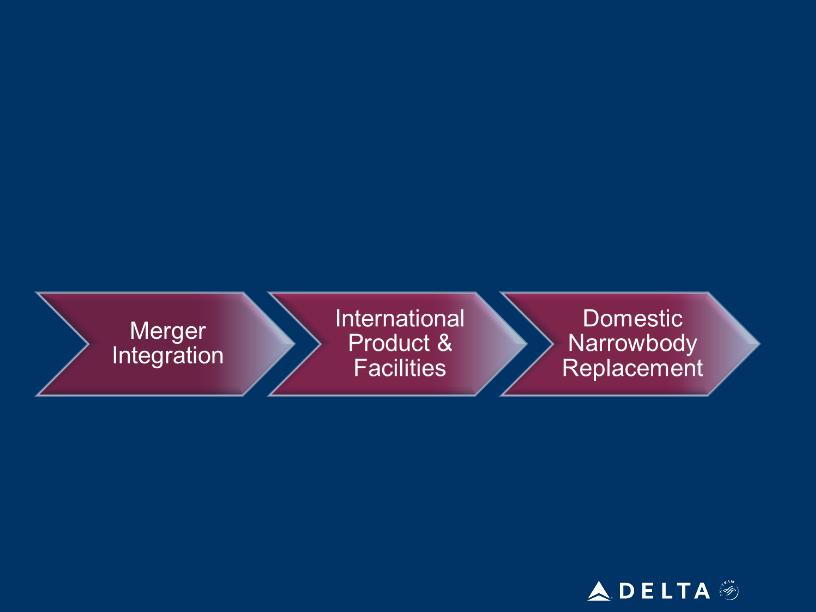
Clearing the Runway for 2011
With integration complete, Delta is positioned to
capture the longer-term efficiencies of the
merger
capture the longer-term efficiencies of the
merger
Revenue, capacity and fleet efficiency mitigate
the short-term impact of fuel price spike and
allow for margin improvement over the long-term
the short-term impact of fuel price spike and
allow for margin improvement over the long-term
Delta’s direct relationship with its employees
provides an unmatched strategic advantage,
with stable labor costs, no open collective
bargaining agreements, and unique flexibility
provides an unmatched strategic advantage,
with stable labor costs, no open collective
bargaining agreements, and unique flexibility
Merger Complete
Strong Employee Relations
Reducing risk across the business uniquely positions Delta in the industry
Stable Financial Foundation
On track to deliver a $7 billion net debt
reduction over a three-year period, with over
$2 billion already achieved
reduction over a three-year period, with over
$2 billion already achieved
Tools To Address Fuel Price
5
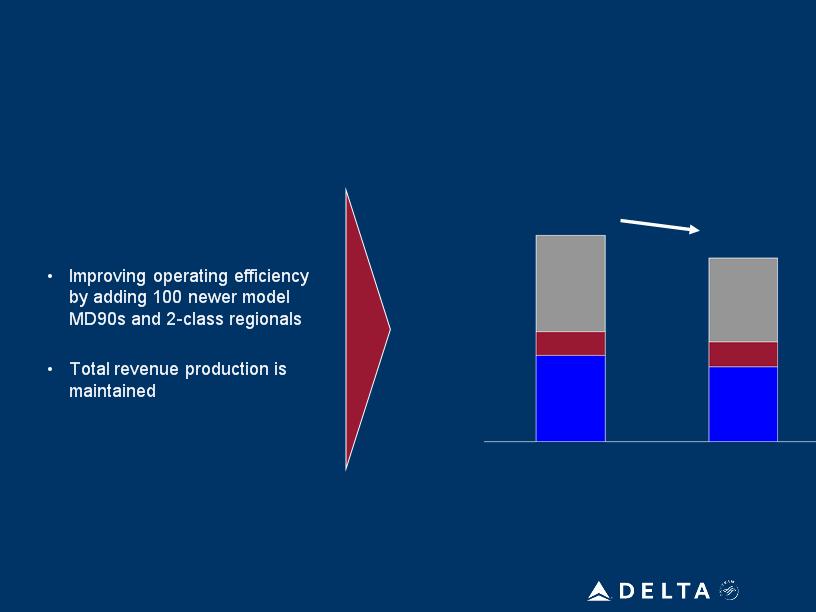
Building A More Efficient Airline
• Eliminating 250+ small-gauge
domestic aircraft, including
turboprops, 50-seat jets and
DC9s
domestic aircraft, including
turboprops, 50-seat jets and
DC9s
• $400 million operating income
benefit from lower aircraft
ownership costs, better fuel burn
and improved operating
efficiency
benefit from lower aircraft
ownership costs, better fuel burn
and improved operating
efficiency
Generating 2008 revenue levels with 165 fewer aircraft, improving margins
Delta’s Fleet
International
693
179
620
539
1,482
1,318
December
2007
December
2011
169
600
Domestic
Mainline
Mainline
Regional
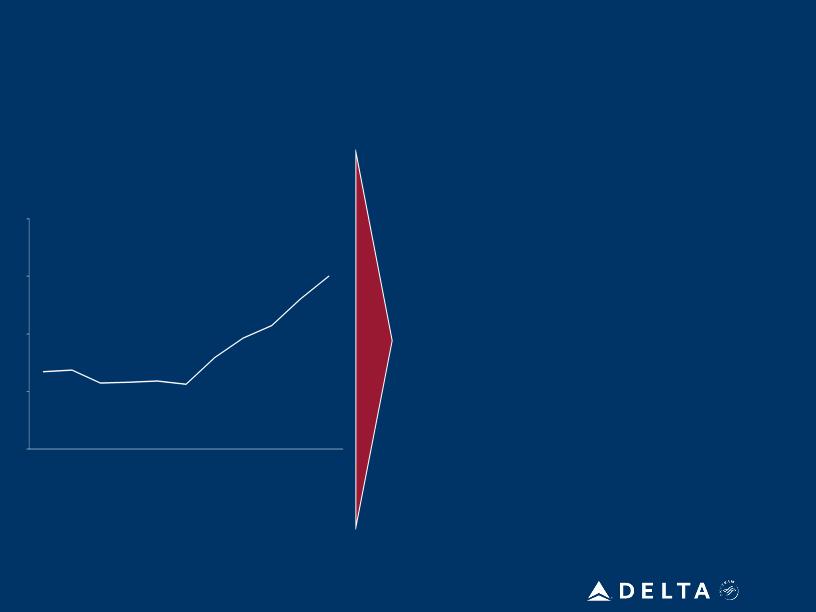
Fuel Price Run-up Is Call To Action
Fuel prices increased 20% over last 100 days
Jet Fuel Price per Gallon
Actions We Are Taking
• Accelerate aircraft retirements
• Retire DC9-50 fleet
• Retire 60 50-seat regional jets
• Retire Saab fleet
• Price tickets for the increased cost of fuel
• 4 domestic fare increases
• International fuel surcharges
• Reduce capacity plans
• March quarter reduced by 2 pts to up 3 -
5%
5%
• Revising full year plans to reflect new fuel
levels
levels
• Reduce capital spending to maintain expected
2011 free cash flow at $1.8 billion
2011 free cash flow at $1.8 billion
6
April - September
$2.30 - $2.35
$2.30 - $2.35
February $2.75
Apr 2010
Feb 2011
7
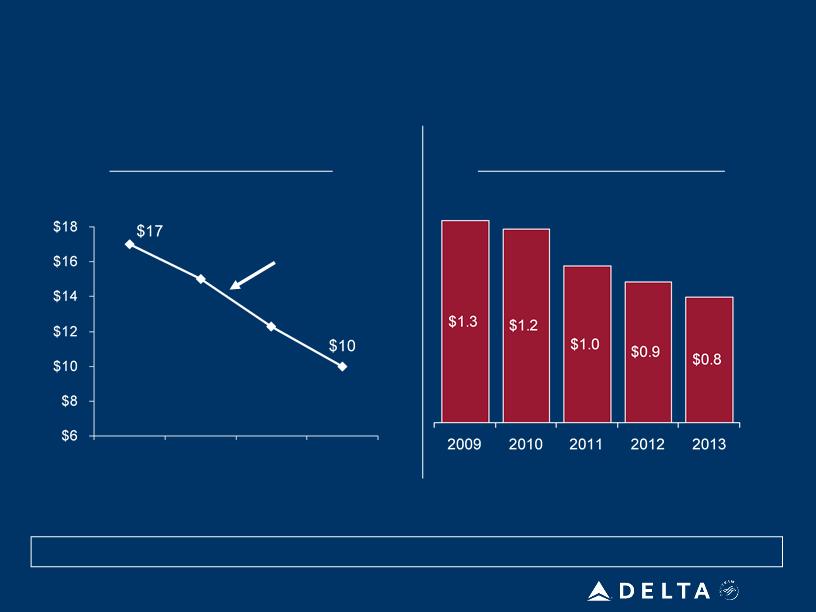
Commitment to Debt Reduction Remains Intact
Adjusted Net Debt ($B)
12/31/09
12/31/12
Strong cash generation, disciplined capital spending generate significant free cash
flows to delever the balance sheet
flows to delever the balance sheet
Net Interest Expense ($B)
3/31/11
$14.6 billion
$14.6 billion
Debt reduction drives $500 million in annual earnings improvement by 2013
Commitment To $1.3 Billion Annual CapEx
Annual Capital Spending Levels (billions)
Prudent capital management enables sustainable $2 billion+ annual free cash flows
8
2008 2009 2010 2011 2012 2013 2014+
$2.2 $1.3 $1.3 $1.3 $1.2 $1.4 $1.3

9
Path To Improving Shareholder Returns
10 - 12% operating margin
$5 billion EBITDAR
Minimize capital reinvestment
requirements
requirements
Use cash to delever the balance
sheet
sheet
Generate sustainable 10%+ return on invested capital
| Non-GAAP Financial Measures | ||||||||||
| We sometimes use information that is derived from our Condensed Consolidated Financial Statements, but that is not presented in accordance with accounting principles generally accepted in the U.S. (“GAAP”). Certain of this information is considered “non-GAAP financial measures” under the U.S. Securities and Exchange Commission rules. The non-GAAP financial measures should be considered in addition to results prepared in accordance with GAAP, but should not be considered a substitute for or superior to GAAP results. | ||||||||||
| Delta is unable to reconcile certain forward-looking projections to GAAP as the nature or amount of special items cannot be estimated at this time. | ||||||||||
| Delta excludes special items because management believes the exclusion of these items is helpful to investors to evaluate the company’s recurring operational performance. | ||||||||||
| Delta presents net investing activities because management believes this metric is helpful to investors to evaluate the company’s investing activities. | ||||||||||
| Delta uses adjusted total debt, including aircraft rent, in addition to long-term adjusted debt and capital leases, to present estimated financial obligations. Delta reduces adjusted total debt by cash, cash equivalents and short-term investments, resulting in adjusted net debt, to present the amount of additional assets needed to satisfy the debt. | ||||||||||
| Delta presents return on invested capital (ROIC) as management believes it is helpful to investors in assessing the company's ability to generate returns using its invested capital. ROIC represents operating income excluding special items divided by the sum of average market value of equity and average adjusted net debt. | ||||||||||
Delta presents free cash flow because management believes this metric is helpful to investors to evaluate the company’s ability to generate cash. | ||||||||||
| Pre-Tax Income | ||||||||
| Full Year | Full Year | |||||||
| (in millions) | 2010 | 2009 | ||||||
| Pre-tax income (loss) | $ | 608 | $ | (1,581 | ) | |||
| Items excluded: | ||||||||
| Restructuring and merger-related items | 450 | 407 | ||||||
| Loss on extinguishment of debt | 391 | 83 | ||||||
| Other | 10 | - | ||||||
| Pre-tax income (loss) excluding special items | $ | 1,459 | $ | (1,091 | ) | |||
| Operating Income & Margin | ||||
| Full Year | ||||
| (in billions) | 2010 | |||
| Operating income | $ | 2,217 | ||
| Item excluded: | ||||
| Restructuring and merger-related items | 450 | |||
| Operating income excluding special items | $ | 2,667 | ||
| Total operating revenue | $ | 31,755 | ||
| Operating margin excluding special items | 8.4% | |||
| Total capital expenditures | ||||||||
| Full Year | Full Year | |||||||
| (in billions) | 2009 | 2008 | ||||||
| Delta property and equipment additions (GAAP) | $ | 1.2 | $ | 1.5 | ||||
| Northwest property and equipment additions (GAAP) for the period from January 1 to October 29, 2008 | - | 1.1 | ||||||
| Other | 0.1 | (0.4 | ) | |||||
| Total capital expenditures | $ | 1.3 | $ | 2.2 | ||||
| Adjusted Net Debt & ROIC | ||||||||||||||||||||||||||||||||||||||||
| (in billions) | December 31, 2010 | September 30, 2010 | June 30, 2010 | March 31, 2010 | December 31, 2009 | |||||||||||||||||||||||||||||||||||
| Debt and capital lease obligations | $ | 15.3 | $ | 15.4 | $ | 15.8 | $ | 16.9 | $ | 17.2 | ||||||||||||||||||||||||||||||
| Plus: unamortized discount, net from purchase accounting and fresh start reporting | 0.6 | 0.7 | 1.0 | 1.1 | 1.1 | |||||||||||||||||||||||||||||||||||
| Adjusted debt and capital lease obligations | $ | 15.9 | $ | 16.1 | $ | 16.8 | $ | 18.0 | $ | 18.3 | ||||||||||||||||||||||||||||||
| Plus: 7x last twelve months' aircraft rent | 2.7 | 3.0 | 3.2 | 3.3 | 3.4 | |||||||||||||||||||||||||||||||||||
| Adjusted total debt | 18.6 | 19.1 | 20.0 | 21.3 | 21.7 | |||||||||||||||||||||||||||||||||||
| Less: cash, cash equivalents and short-term investments | (3.6 | ) | (3.9 | ) | (4.4 | ) | (4.9 | ) | (4.7 | ) | ||||||||||||||||||||||||||||||
| Adjusted net debt | $ | 15.0 | $ | 15.2 | $ | 15.6 | $ | 16.4 | $ | 17.0 | ||||||||||||||||||||||||||||||
| (in billions, except % return) | 2010 | |||||||||||||||||||||||||||||||||||||||
| Operating income | $ | 2.7 | ||||||||||||||||||||||||||||||||||||||
| Market value of equity (assuming $12.60/ share) | $ | 10.6 | ||||||||||||||||||||||||||||||||||||||
| Adjusted net debt | $ | 15.5 | ||||||||||||||||||||||||||||||||||||||
| Total invested capital | $ | 26.1 | ||||||||||||||||||||||||||||||||||||||
| Return on invested capital | 10 | % | ||||||||||||||||||||||||||||||||||||||