
Delta: Building a Better Airline
Deutsche Bank Aviation & Transportation Conference
September 13, 2011

1
1
Safe Harbor
This presentation contains various projections and other forward-looking statements which
represent Delta’s estimates or expectations regarding future events. All forward-looking
statements involve a number of assumptions, risks and uncertainties, many of which are
beyond Delta’s control, that could cause the actual results to differ materially from the
projected results. Factors which could cause such differences include, without limitation,
business, economic, competitive, industry, regulatory, market and financial uncertainties
and contingencies, as well as the “Risk Factors” discussed in Delta’s Form 10-K for the year
ended December 31, 2010. Caution should be taken not to place undue reliance on Delta’s
forward-looking statements, which represent Delta’s views only as of the date of this
presentation, and which Delta has no current intention to update.
In this presentation, we will discuss certain non-GAAP financial measures. You can find the
reconciliations of those measures to comparable GAAP measures on our website at
delta.com.
reconciliations of those measures to comparable GAAP measures on our website at
delta.com.

2
2
Delta: Building a Better Airline
Solid financial foundation allows Delta to be
profitable and free cash flow positive this year
despite $3 billion higher fuel price impact
profitable and free cash flow positive this year
despite $3 billion higher fuel price impact
Adjusting to the New Fuel
Environment
Environment
Strong operating cash flows with limited capital
expenditures allow for considerable free cash
flow generation and continued delevering of the
balance sheet
expenditures allow for considerable free cash
flow generation and continued delevering of the
balance sheet
Aligning revenue, capacity and cost structure
to build a sustainable business model at $3+
per gallon jet fuel
to build a sustainable business model at $3+
per gallon jet fuel
Position Delta for long-term
success
success
Solid Financial Foundation
3
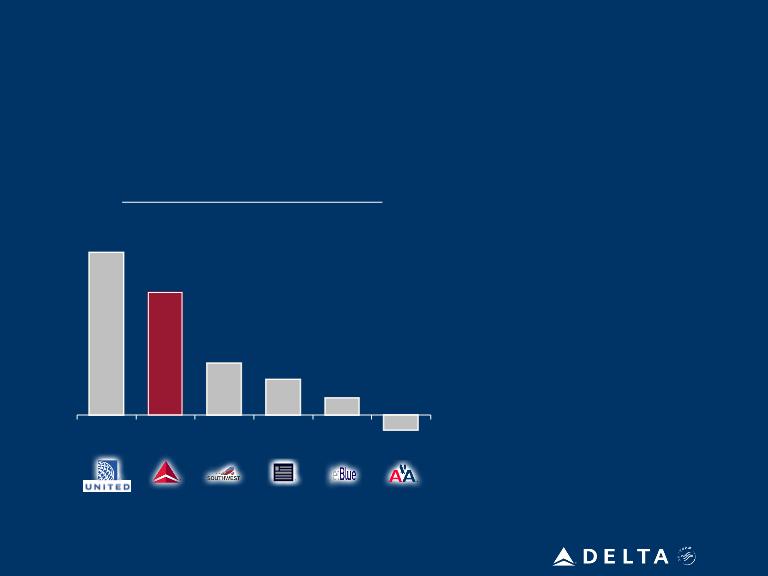
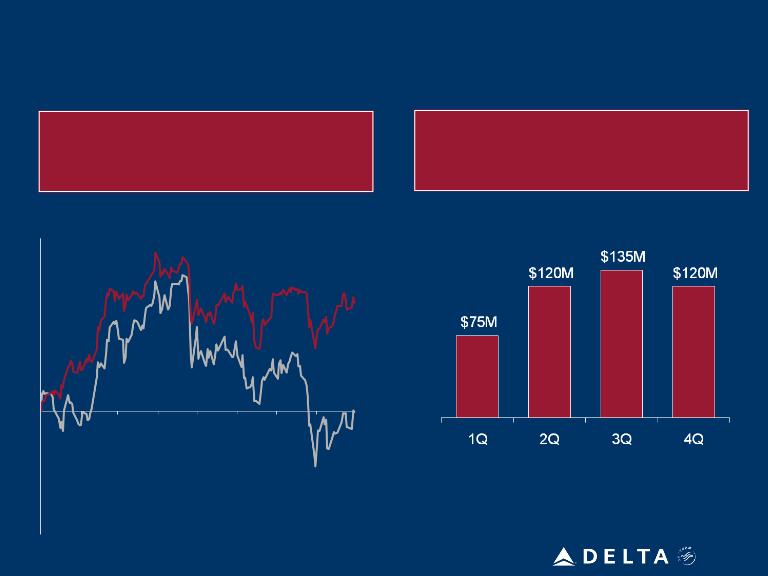
Results Show Delta’s Solid Financial Foundation
June Quarter 2011
Operating Income ($M)
June Quarter Highlights:
• Increased revenues by 12% and
generated a revenue premium to
the industry
generated a revenue premium to
the industry
• Revenue growth offset 70% of
cost pressures, including $1
billion higher fuel price impact
cost pressures, including $1
billion higher fuel price impact
• Generated $700M in free cash
flow
flow
• Reduced adjusted net debt to
$13.8B
$13.8B
• Generated 8.5% return on
invested capital for prior 12
months
invested capital for prior 12
months
$847
$636
$295
$183
$86
($78)
Profitable quarter despite $1 billion higher fuel expense
Note: All results exclude special items
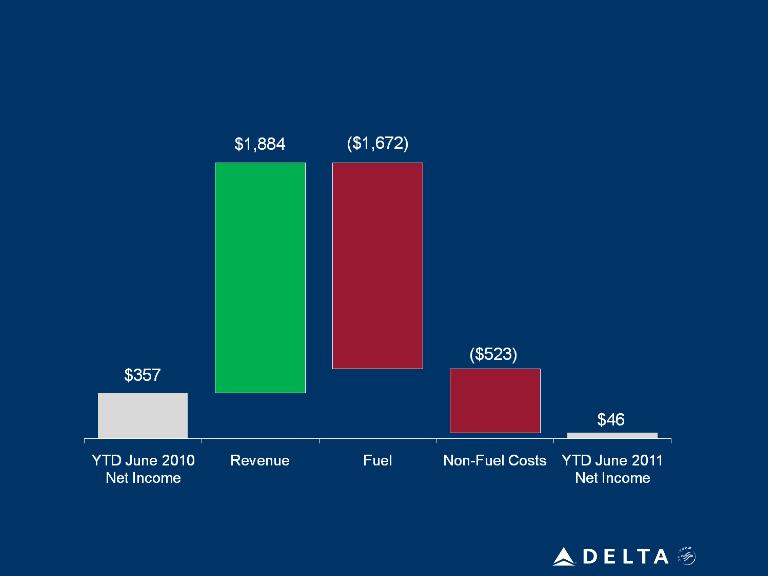
Revenues Are Covering Higher Fuel Costs
Focus on non-fuel cost growth
Note: All results exclude special items
4

5
September Quarter Better Than Expected
Revenues offsetting 80% of cost pressures, including $1 billion fuel price impact
Sept. Quarter Estimate | |||
Operating margin | 9 - 11% | ||
Fuel price per gallon | $3.07 | ||
Capital expenditures | $300 million | ||
Unrestricted liquidity (at 9/30/11) | $5.1 billion | ||
Sept. Quarter 2011 vs. Sept. Quarter 2010 | |||
Passenger unit revenue | Up 10.5% | ||
Consolidated unit costs, excluding fuel and profit sharing | Up 3 - 4% | ||
System capacity | Down 1% | ||
Domestic | Down 2 - 3% | ||
International | Up 1 - 2% | ||

6
Recalibrating the Business To High Fuel Prices
• Corporate contract gains and revenues from new
products and services, combined with solid demand
environment, drive revenue momentum
products and services, combined with solid demand
environment, drive revenue momentum
Higher Revenues
Reduce Capacity
Unit Cost Improvement
Disciplined Capital
Spending
Spending
• Targeting 2010 unit cost levels by resizing the
airline, reducing maintenance expense and
improving productivity
airline, reducing maintenance expense and
improving productivity
• Reducing fourth quarter capacity 4-5% year over
year, with a focus on markets where revenue has
not kept pace with higher fuel costs
year, with a focus on markets where revenue has
not kept pace with higher fuel costs
• Commitment to keeping annual capital
expenditures at $1.2B to $1.4B, including all
aircraft acquisitions
expenditures at $1.2B to $1.4B, including all
aircraft acquisitions
Actively managing through revenue, capacity and cost adjustments
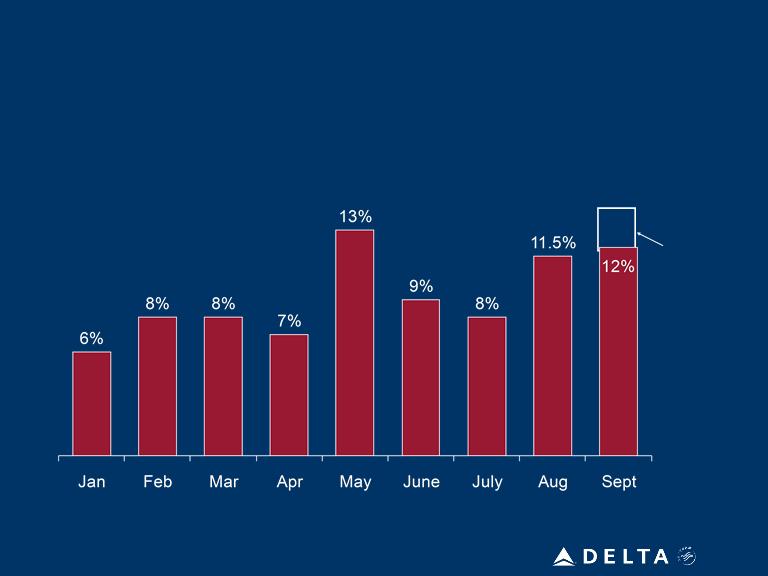
Building Solid Revenue Momentum
7
Revenue growth driven by corporate contract gains, revenues from new
products/services combined with solid demand environment
products/services combined with solid demand environment
Passenger Unit Revenue Change, 2011 vs. 2010
Sept. PRASM
impacted 3 pts
by prior year
adjustment
impacted 3 pts
by prior year
adjustment
15%
8
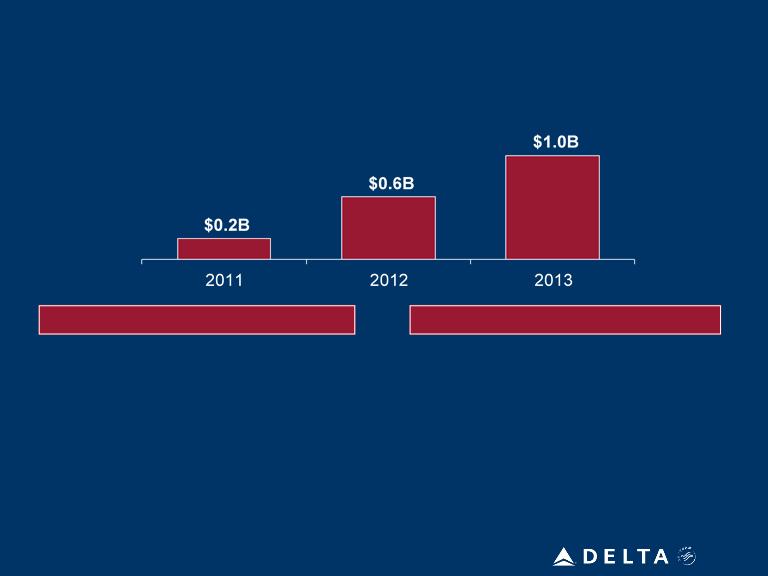
Targeting Merchandising Revenue of $1 Billion by 2013
Implemented
Upcoming
• Seat-related products, including Economy
Comfort and premium up-sell programs
Comfort and premium up-sell programs
• SkyPriority recognizes our highest-value
customers
customers
• Ancillary products to improve the travel
experience (e.g., hotels, SkyClub passes, Wi
-Fi)
experience (e.g., hotels, SkyClub passes, Wi
-Fi)
• Increased sophistication in revenue
management technology
management technology
• Complete flat-bed seat installations on
widebody fleet (2013)
widebody fleet (2013)
• State of the art international facilities in
Atlanta (2012) and JFK (2013)
Atlanta (2012) and JFK (2013)
• Revamped eCommerce platforms enable
revenue innovation (2012)
revenue innovation (2012)
• Enhance SkyMiles to reward the best
customers (2012)
customers (2012)
Revenue growth from new products/services and benefits of ongoing capital
investments
investments

9
Reducing Fourth Quarter Capacity by 4 - 5%
Reductions focused in markets where revenue not keeping pace with costs
Domestic | (1 - 3%) | • Reducing Memphis hub departures by 25% • Right-size domestic network for high fuel environment, continued progress on 140 aircraft retirements | |
Atlantic | (10 - 12%) | • Market cancellations and frequency reductions, in conjunction with JV partners | |
Latin | 3 - 5% | • Thinning of Caribbean markets for off-season, offset by build-up of Mexico and profitable deep South America flying | |
Pacific | (1 - 3%) | • Frequency reductions and downgauging of Haneda service | |
System | (4 - 5%) |
Region
YOY Capacity Change
Capacity Actions
Planning for 2012 capacity 2 - 3% lower than 2011
High Fuel Prices Are the New Norm For The Industry
10
22%
Hedging program producing 12¢ per gallon net benefit in 2011
Per
gallon
benefit
gallon
benefit
$0.12
$0.08
$0.13
$0.13
Fuel Hedge Benefits, net of premiums
Jan 2011
Price Change YTD-2011
While Jet Fuel Has Remained High
Despite WTI’s Recent Decline…
Despite WTI’s Recent Decline…
…Delta’s Hedges Forecast To Mitigate
$450 Million of Fuel Price Impact
$450 Million of Fuel Price Impact
Note: Fuel hedge benefits as of 9/7/11
Jet Fuel
WTI Crude Oil
Sept 2011
0%
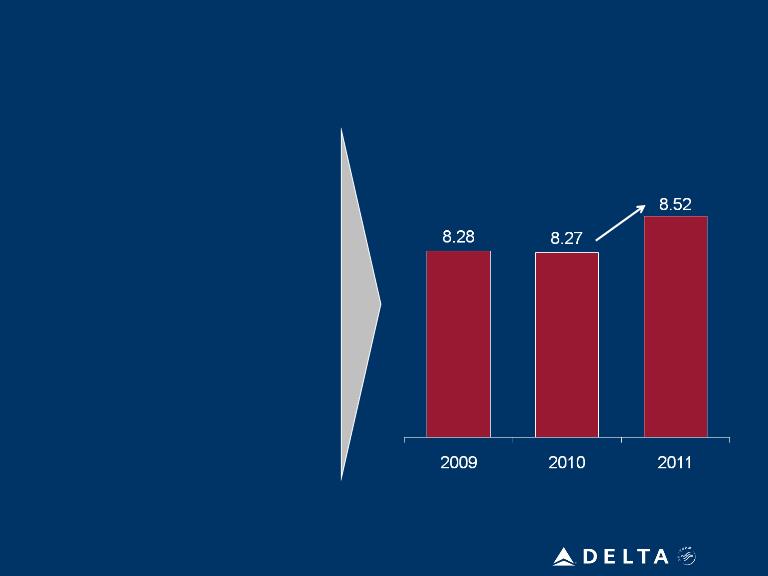
Non-Fuel Costs Must Be Reduced
11
Timing to sustain 2010 levels challenged by capacity reductions
• Current initiatives on track to bring
non-fuel unit costs to 2010 levels
by end of this year
non-fuel unit costs to 2010 levels
by end of this year
• Resizing the airline by
reducing headcount, fleet
and facilities
reducing headcount, fleet
and facilities
• Reducing maintenance
expense
expense
• Improving efficiency through
better operations and
technology-enabled
productivity
better operations and
technology-enabled
productivity
• Maintaining these levels will
require additional work in 2012
require additional work in 2012
• Unit costs will be pressured
by capacity reduction
by capacity reduction
Consolidated Non-Fuel Unit Costs
+3%
12
Disciplined Approach To Fleet Renewal
12
Order for 100 B737-900ER maintains financial and capacity discipline
• Modest capital expenditures keep company
on track to achieve $10B adjusted net debt
target in 2013
on track to achieve $10B adjusted net debt
target in 2013
• Capacity neutral as new aircraft replace
older technology 757, 767 and A320 aircraft
older technology 757, 767 and A320 aircraft
• Unit cost improvement from lower
maintenance expense and 15-20% better
fuel efficiency
maintenance expense and 15-20% better
fuel efficiency
• Committed long-term financing for a
substantial portion of purchase price
substantial portion of purchase price
• Aircraft will be cash flow positive and
earnings accretive from first year of
operation
earnings accretive from first year of
operation
• Order completes all near-term fleet renewal
needs
needs

International
Product &
Facilities
Product &
Facilities
Maintain Annual CapEx at $1.2 - $1.4 Billion
Merger
Integration
Domestic
Narrowbody
Replacement
Narrowbody
Replacement
2008 - 2010
2010 - 2013
2013 - beyond
Capital discipline underlies financial discipline
Annual Capital Spending Levels ($B)
2008
$2.2
2009
$1.3
2010
$1.3
2011
$1.2
2012
$1.2
2013
$1.4
2014
$1.4
13
14
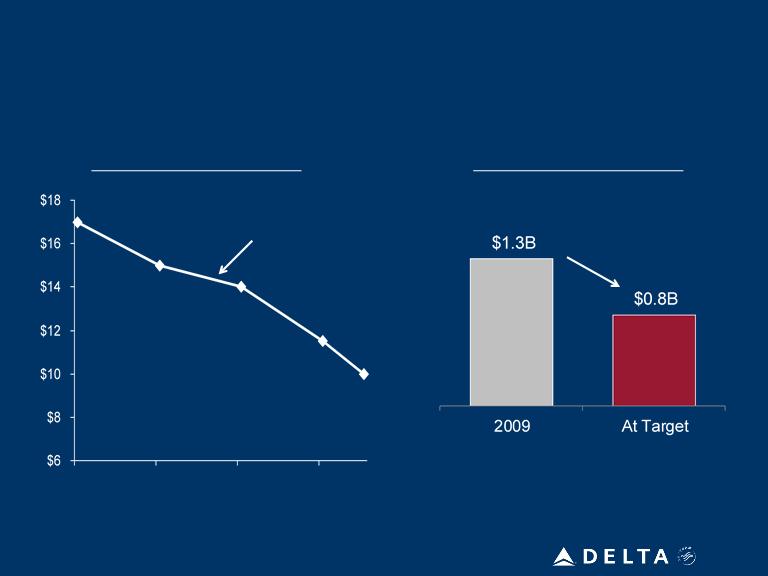
Commitment to Debt Reduction Remains Intact
Adjusted Net Debt
12/31/09
Mid-2013
$17B
$10B
Debt reduction de-risks business and improves profitability
Annual Interest Expense
6/30/11
$13.8B

15
15
Path To Improving Shareholder Returns
10 - 12% operating margin
$5 billion EBITDAR
Minimize capital reinvestment
requirements
requirements
Use cash to delever the balance
sheet
sheet
Generate sustainable 10%+ return on invested capital
| Non-GAAP Financial Measures | ||||||||||
| We sometimes use information that is derived from our Condensed Consolidated Financial Statements, but that is not presented in accordance with accounting principles generally accepted in the U.S. (“GAAP”). Certain of this information is considered “non-GAAP financial measures” under the U.S. Securities and Exchange Commission rules. The non-GAAP financial measures should be considered in addition to results prepared in accordance with GAAP, but should not be considered a substitute for or superior to GAAP results. | ||||||||||
| Delta is unable to reconcile certain forward-looking projections to GAAP, including projected consolidated unit cost, as the nature or amount of special items cannot be estimated at this time. | ||||||||||
| Delta excludes special items because management believes the exclusion of these items is helpful to investors to evaluate the company’s recurring operational performance. | ||||||||||
| Delta adjusts for mark-to-market ("MTM") adjustments for fuel hedges recorded in periods other than the settlement period in order to evaluate the company’s financial results related to operations in the period shown. | ||||||||||
| Delta presents free cash flow because management believes this metric is helpful to investors to evaluate the company’s ability to generate cash. | ||||||||||
| Delta uses adjusted total debt, including aircraft rent, in addition to long-term adjusted debt and capital leases, to present estimated financial obligations. Delta reduces adjusted total debt by cash, cash equivalents and short-term investments, resulting in adjusted net debt, to present the amount of additional assets needed to satisfy the debt. | ||||||||||
| Delta presents consolidated unit cost excluding ancillary businesses not associated with the generation of a seat mile. These businesses include aircraft maintenance and staffing services Delta provides to third parties and Delta’s vacation wholesale operations. | ||||||||||
| Delta excludes profit sharing expense from consolidated unit cost because management believes the exclusion of this item provides a more meaningful comparison of the company’s unit cost to the airline industry and prior year results. | ||||||||||
16
| Operating Income | |||||
| (in millions) | Three Months Ended June 30, 2011 | |||
| Operating income | $ | 481 | ||
| Items excluded: | ||||
| Restructuring and other items | 144 | |||
| MTM adjustments for fuel hedges recorded in periods other than the settlement period | 11 | |||
| Operating income excluding special items | $ | 636 | ||
17
| Free Cash Flow | ||||
| (in billions) | Three Months Ended June 30, 2011 | |||||||
| Net cash provided by operating activities (GAAP) | $ | 1.0 | ||||||
| Net cash used in investing activities (GAAP) | $ | (0.3 | ) | |||||
| Adjustments: | ||||||||
| Redemption of short-term investments | (0.2 | ) | ||||||
| Purchase of short-term investments | 0.2 | |||||||
| Cash used in investing | (0.3 | ) | ||||||
| Total free cash flow | $ | 0.7 | ||||||
18
| Adjusted Net Debt | |||||||
| (in billions) | June 30, 2011 | December 31, 2009 | ||||||||||||||
| Debt and capital lease obligations | $ | 14.7 | $ | 17.2 | ||||||||||||
| Plus: unamortized discount, net from purchase accounting and fresh start reporting | 0.6 | 1.1 | ||||||||||||||
| Adjusted debt and capital lease obligations | $ | 15.3 | $ | 18.3 | ||||||||||||
| Plus: 7x last twelve months' aircraft rent | 2.3 | 3.4 | ||||||||||||||
| Adjusted total debt | 17.6 | 21.7 | ||||||||||||||
| Less: cash, cash equivalents and short-term investments | (3.8 | ) | (4.7 | ) | ||||||||||||
| Adjusted net debt | $ | 13.8 | $ | 17.0 | ||||||||||||
19
| Net Income | ||||||
| Six Months Ended June 30, | ||||||||
| (in millions) | 2011 | 2010 | ||||||
| Net (loss) income | $ | (120 | ) | $ | 211 | |||
| Items excluded: | ||||||||
| Restructuring and other items | 151 | 136 | ||||||
| Loss on extinguishment of debt | 33 | - | ||||||
| MTM adjustments for fuel hedges recorded in periods other than the settlement period | (18 | ) | - | |||||
| Other | - | 10 | ||||||
| Net income excluding special items | $ | 46 | $ | 357 | ||||
20
| Fuel Hedge Gains | ||||||
| Three Months Ended | ||||||||
| (in millions) | June 30, 2011 | March 31, 2011 | ||||||
| Fuel hedge gains | $ | 107 | $ | 107 | ||||
| Item excluded: | ||||||||
| MTM adjustments for fuel hedges recorded in periods other than the settlement period | 11 | (29 | ) | |||||
| Fuel hedge gains adjusted for MTM adjustments for fuel hedges recorded in periods other than the settlement period | $ | 118 | $ | 78 | ||||
| Three Months Ended | ||||||||
| June 30, 2011 | March 31, 2011 | |||||||
| Fuel hedge gains per gallon | $ | 0.11 | $ | 0.11 | ||||
| Item excluded: | ||||||||
| MTM adjustments for fuel hedges recorded in periods other than the settlement period | 0.01 | (0.03 | ) | |||||
| Fuel hedge gains per gallon adjusted for MTM adjustments for fuel hedges recorded in periods other than the settlement period | $ | 0.12 | $ | 0.08 | ||||
21
| Unit Cost |
| Year Ended December 31, | ||||||||
| 2010 | 2009 | |||||||
| Unit cost | 12.69 | ¢ | 12.32 | ¢ | ||||
| Items excluded: | ||||||||
| Ancillary businesses | (0.28 | ) | (0.31 | ) | ||||
| Restructuring and other items | (0.19 | ) | (0.18 | ) | ||||
| Profit sharing | (0.13 | ) | - | |||||
| Aircraft fuel and related taxes | (3.82 | ) | (3.55 | ) | ||||
| Unit cost excluding fuel and special items | 8.27 | ¢ | 8.28 | ¢ | ||||
22
| Capital Expenditures | |||||
| Year Ended December 31, | ||||||||
| (in billions) | 2009 | 2008 | ||||||
| Delta property and equipment additions (GAAP) | $ | 1.2 | $ | 1.5 | ||||
| Northwest property and equipment additions (GAAP) for the period from January 1 to October 29, 2008 | - | 1.1 | ||||||
| Other | 0.1 | (0.4 | ) | |||||
| Total capital expenditures | $ | 1.3 | $ | 2.2 | ||||
23