Exhibit 99.1

Delta: Keep Climbing J.P. Morgan Aviation, Transportation & Defense Conference March 13, 2012
2 This presentation contains various projections and other forward - looking statements which represent Delta’s estimates or expectations regarding future events. All forward - looking statements involve a number of assumptions, risks and uncertainties, many of which are beyond Delta’s control, that could cause the actual results to differ materially from the projected results. Factors which could cause such differences include, without limitation, business, economic, competitive, industry, regulatory, market and financial uncertainties and contingencies, as well as the “Risk Factors” discussed in Delta’s SEC filings. Caution should be taken not to place undue reliance on Delta’s forward - looking statements, which represent Delta’s views only as of the date of this presentation, and which Delta has no current intention to update. In this presentation, we will discuss certain non - GAAP financial measures. You can find the reconciliations of those measures to comparable GAAP measures on our website at delta.com. Safe Harbor
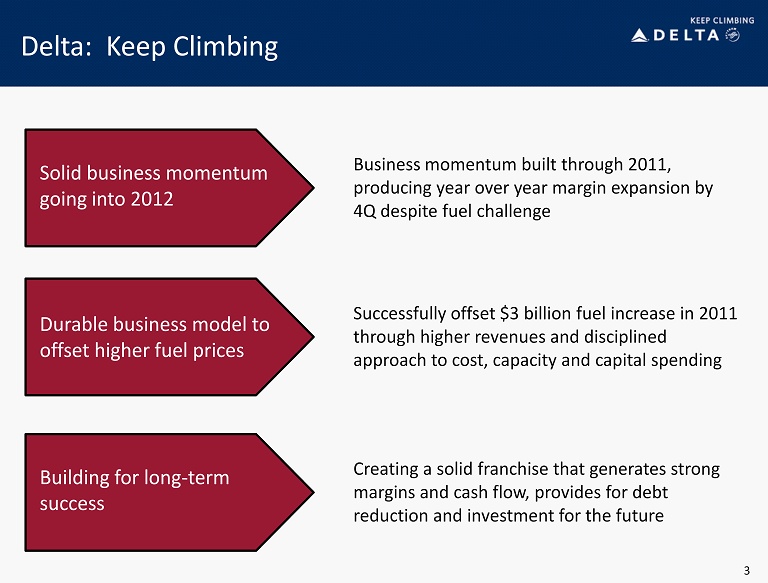
3 Delta: Keep Climbing Solid business momentum going into 2012 Durable business model to offset higher fuel prices Building for long - term success Creating a solid franchise that generates strong margins and cash flow, provides for debt reduction and investment for the future Successfully offset $3 billion fuel increase in 2011 through higher revenues and disciplined approach to cost, capacity and capital spending Business momentum built through 2011, producing year over year margin expansion by 4Q despite fuel challenge
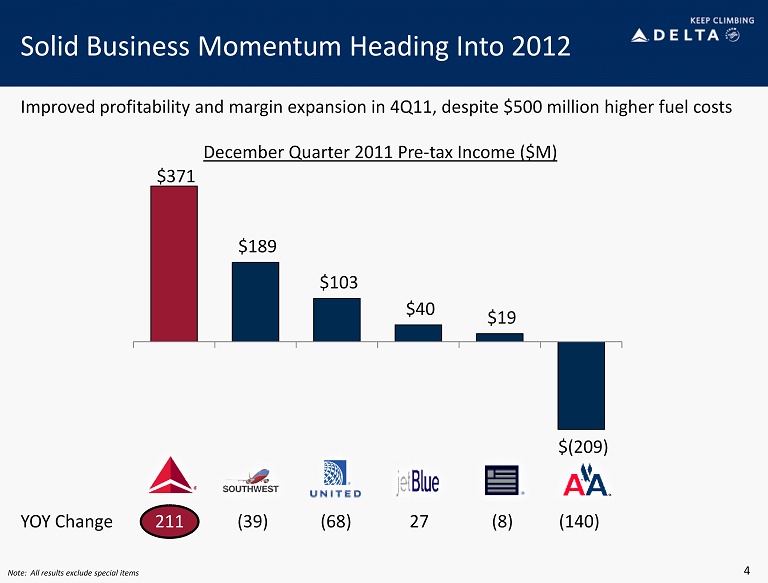
211 Solid Business Momentum Heading Into 2012 4 Note: All results exclude special items $371 $189 $103 $40 $19 $(209) YOY Change (140) (8) 27 (68) (39) Improved profitability and margin expansion in 4Q11, despite $500 million higher fuel costs December Quarter 2011 Pre - tax Income ($M)
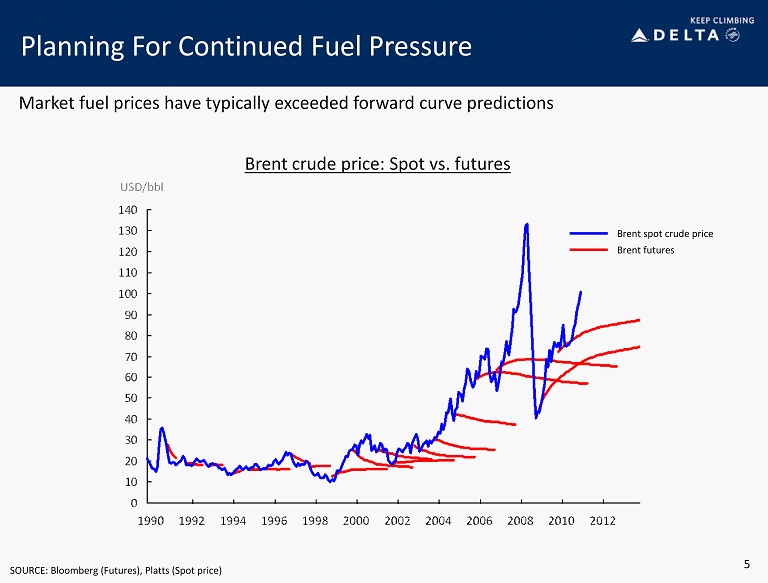
5 Planning For Continued Fuel Pressure SOURCE: Bloomberg (Futures), Platts (Spot price) Brent spot crude price Brent futures Brent crude price: Spot vs. futures Market fuel prices have typically exceeded forward curve predictions
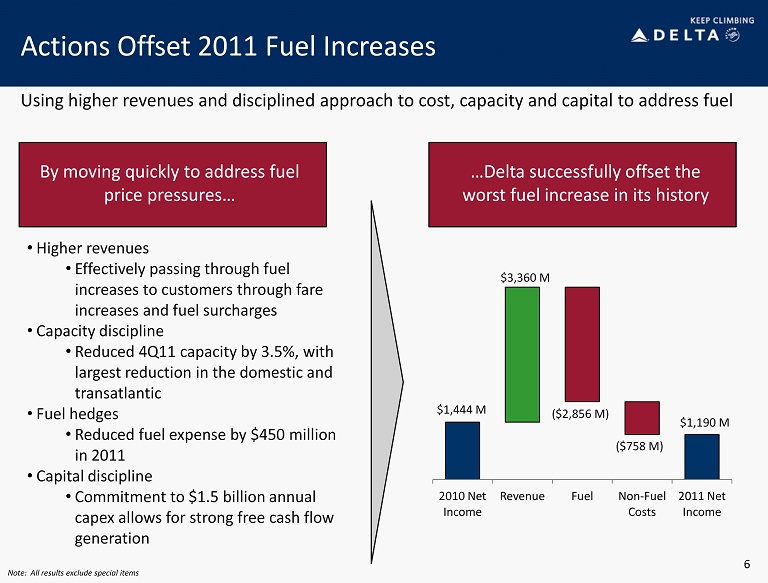
6 Actions Offset 2011 Fuel Increases By moving quickly to address fuel price pressures… …Delta successfully offset the worst fuel increase in its history • Higher revenues • Effectively passing through fuel increases to customers through fare increases and fuel surcharges • Capacity discipline • Reduced 4Q11 capacity by 3.5%, with largest reduction in the domestic and transatlantic • Fuel hedges • Reduced fuel expense by $450 million in 2011 • Capital discipline • Commitment to $1.5 billion annual capex allows for strong free cash flow generation 2010 Net Income Revenue Fuel Non - Fuel Costs 2011 Net Income $3,360 M ($2,856 M) ($758 M) $1,444 M $1,190 M Using higher revenues and disciplined approach to cost, capacity and capital to address fuel Note: All results exclude special items
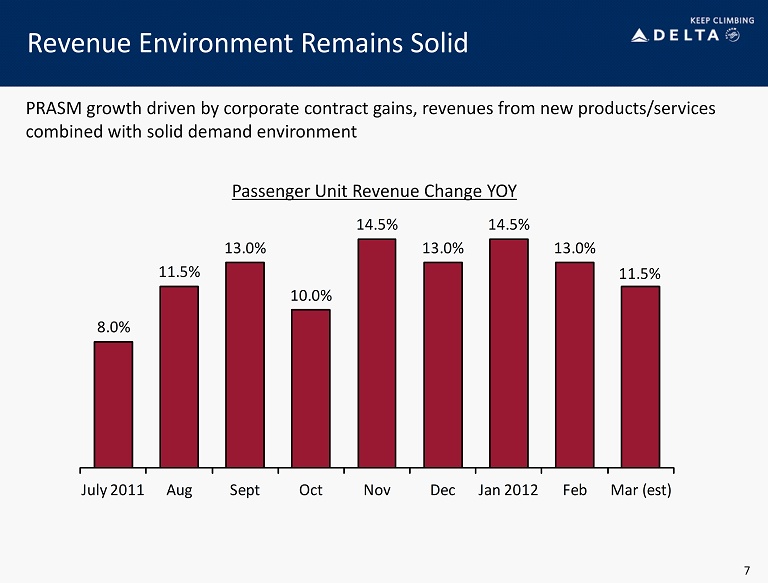
8.0% 11.5% 13.0% 10.0% 14.5% 13.0% 14.5% 13.0% 11.5% July 2011 Aug Sept Oct Nov Dec Jan 2012 Feb Mar (est) Revenue Environment Remains Solid 7 PRASM growth driven by corporate contract gains, revenues from new products/services combined with solid demand environment Passenger Unit Revenue Change YOY
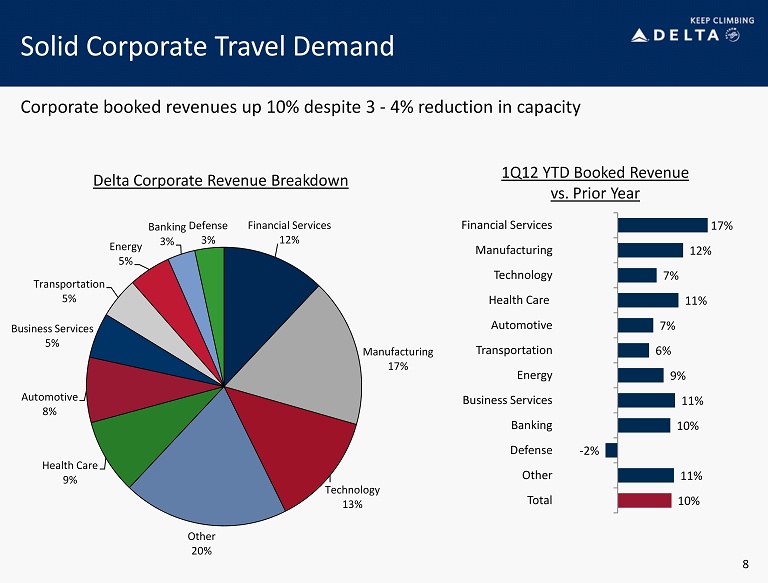
Solid Corporate Travel Demand 1Q12 YTD Booked Revenue vs. Prior Year Corporate booked revenues up 10% despite 3 - 4% reduction in capacity 8 Delta Corporate Revenue Breakdown Financial Services 12% Manufacturing 17% Technology 13% Other 20% Health Care 9% Automotive 8% Business Services 5% Transportation 5% Energy 5% Banking 3% Defense 3% 10% 11% - 2% 10% 11% 9% 6% 7% 11% 7% 12% 17% Total Other Defense Banking Business Services Energy Transportation Automotive Health Care Technology Manufacturing Financial Services
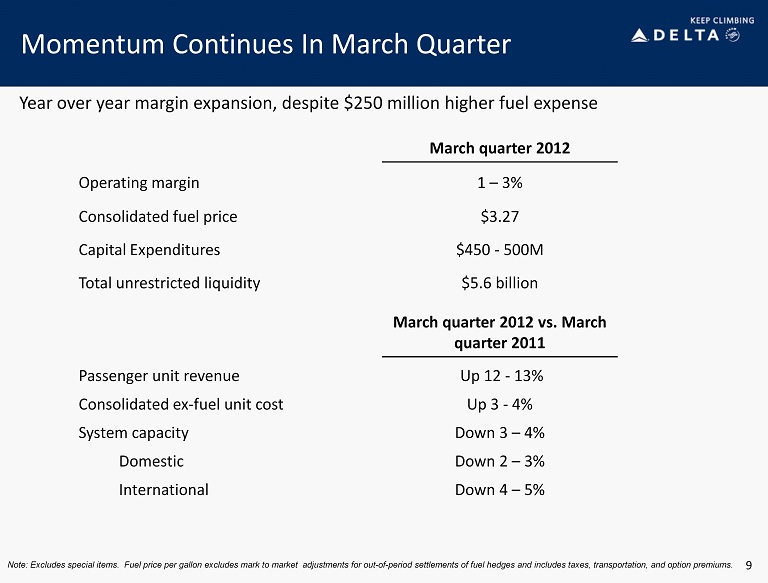
9 Momentum Continues In March Quarter March quarter 2012 Operating margin 1 – 3% Consolidated fuel price $3.27 Capital Expenditures $450 - 500M Total unrestricted liquidity $5.6 billion March quarter 2012 vs. March quarter 2011 Passenger unit revenue Up 12 - 13% Consolidated ex - fuel unit cost Up 3 - 4% System capacity Down 3 – 4% Domestic Down 2 – 3% International Down 4 – 5% Note: Excludes special items. Fuel price per gallon excludes mark to market adjustments for out - of - period settlements of fuel hedges and includes taxes, transportation, and option premiums. Year ove r year margin expansion, despite $ 250 million higher fuel expense
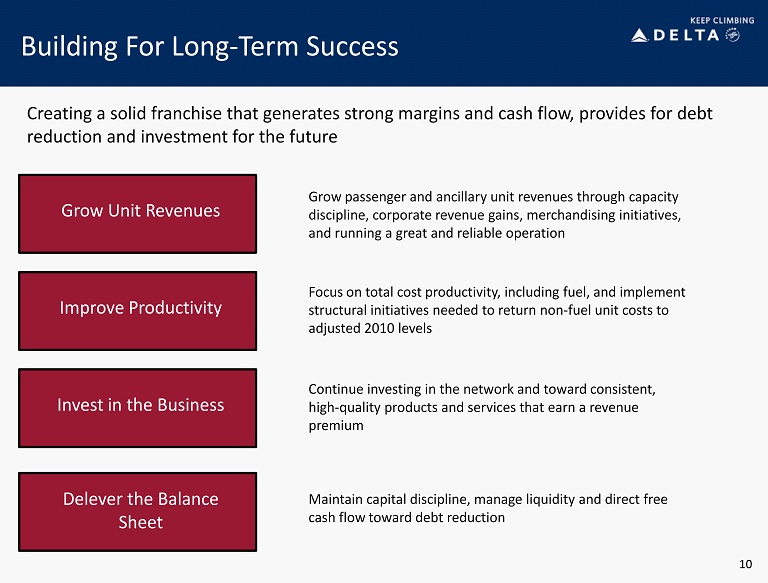
Building For Long - Term Success Grow Unit Revenues Improve Productivity Invest in the Business Delever the Balance Sheet Grow passenger and ancillary unit revenues through capacity discipline, corporate revenue gains, merchandising initiatives, and running a great and reliable operation Focus on total cost productivity, including fuel, and implement structural initiatives needed to return non - fuel unit costs to adjusted 2010 levels Continue investing in the network and toward consistent, high - quality products and services that earn a revenue premium Maintain capital discipline, manage liquidity and direct free cash flow toward debt reduction 10 Creating a solid franchise that generates strong margins and cash flow, provides for debt reduction and investment for the future
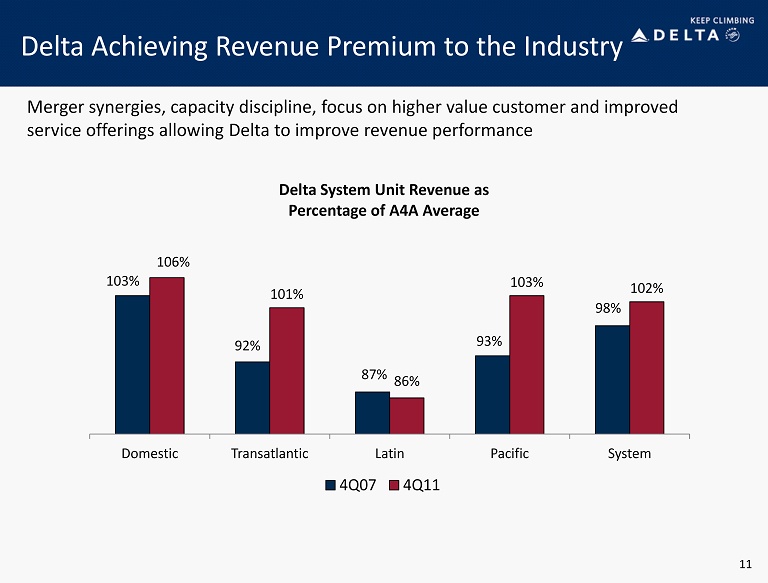
Delta Achieving Revenue Premium to the Industry 103% 92% 87% 93% 98% 106% 101% 86% 103% 102% Domestic Transatlantic Latin Pacific System 4Q07 4Q11 Delta System Unit Revenue as Percentage of A4A Average Merger synergies, capacity discipline, focus on higher value customer and improved service offerings allowing Delta to improve revenue performance 11
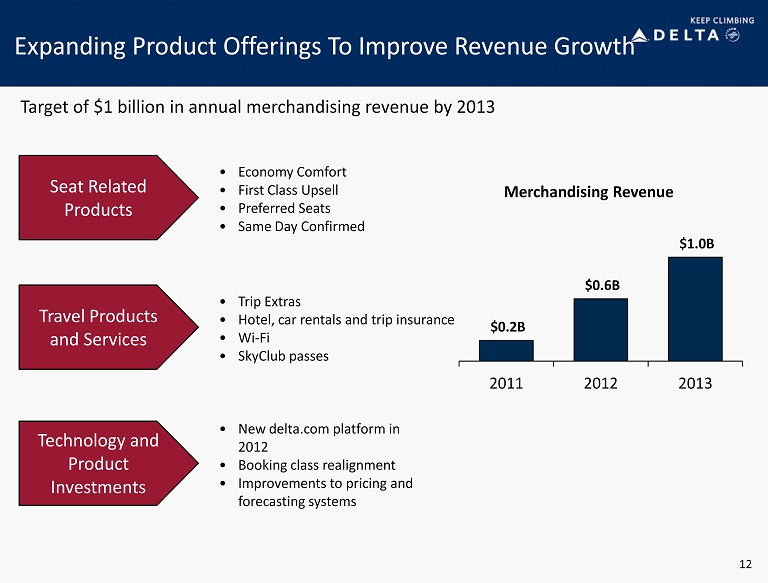
Expanding Product Offerings To Improve Revenue Growth Target of $1 billion in annual merchandising revenue by 2013 Seat Related Products • Economy Comfort • First Class Upsell • Preferred Seats • Same Day Confirmed Travel Products and Services Technology and Product Investments • Trip Extras • Hotel, car rentals and trip insurance • Wi - Fi • SkyClub passes • New delta.com platform in 2012 • Booking class realignment • Improvements to pricing and forecasting systems $0.2B $0.6B $1.0B 2011 2012 2013 Merchandising Revenue 12
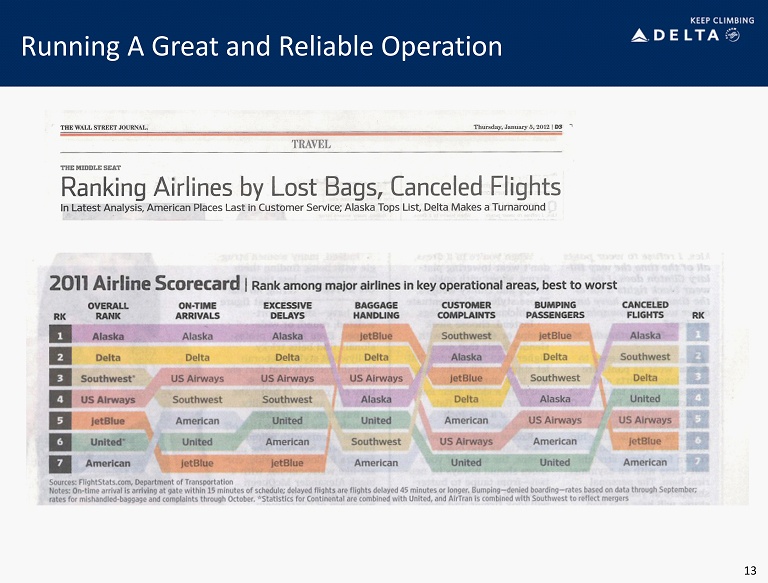
13 Running A Great and Reliable Operation
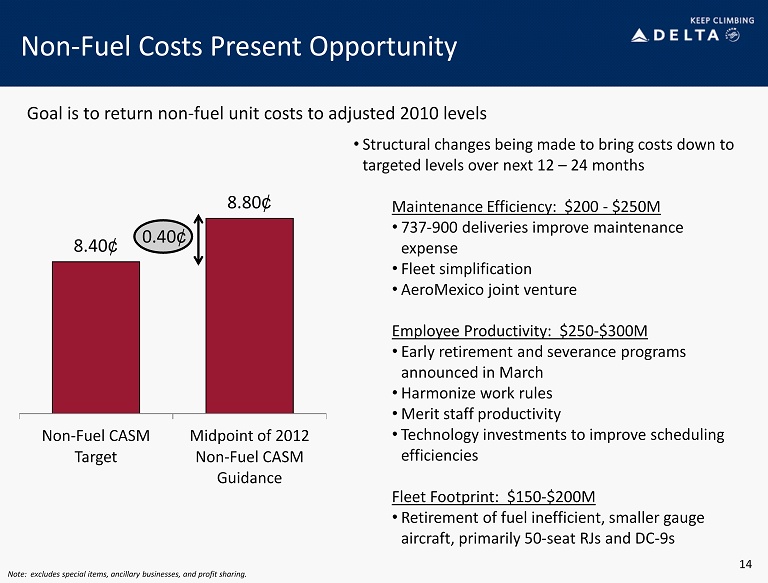
8.40 ¢ 8.80 ¢ Non - Fuel CASM Target Midpoint of 2012 Non - Fuel CASM Guidance Non - Fuel Costs Present Opportunity 0.40 ¢ • Structural changes being made to bring costs down to targeted levels over next 12 – 24 months Maintenance Efficiency: $200 - $250M • 737 - 900 deliveries improve maintenance expense • Fleet simplification • AeroMexico joint venture Employee Productivity: $250 - $300M • Early retirement and severance programs announced in March • Harmonize work rules • Merit staff productivity • Technology investments to improve scheduling efficiencies Fleet Footprint: $150 - $200M • Retirement of fuel inefficient, smaller gauge aircraft, primarily 50 - seat RJs and DC - 9s Goal is to return non - fuel unit costs to adjusted 2010 levels 14 Note: excludes special items, ancillary businesses, and profit sharing.
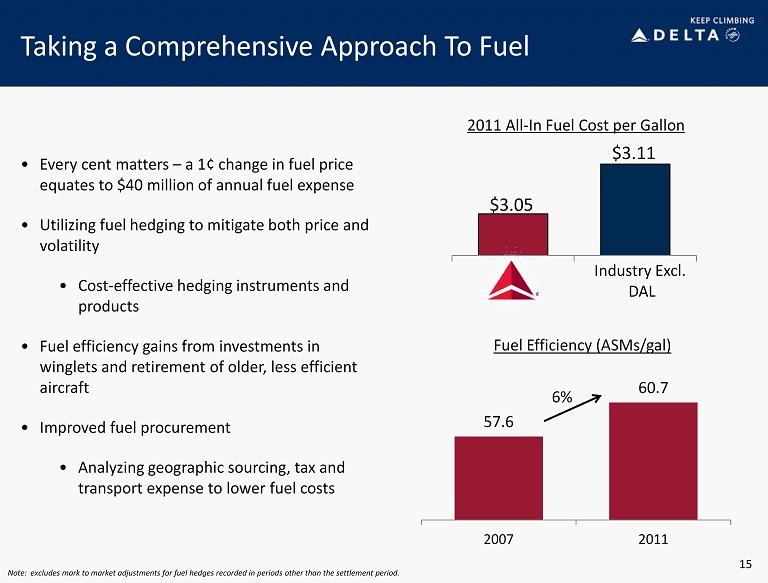
Taking a Comprehensive Approach To Fuel • Every cent matters – a 1¢ change in fuel price equates to $40 million of annual fuel expense • Utilizing fuel hedging to mitigate both price and volatility • Cost - effective hedging instruments and products • Fuel efficiency gains from investments in winglets and retirement of older, less efficient aircraft • Improved fuel procurement • Analyzing geographic sourcing, tax and transport expense to lower fuel costs 15 $3.05 $3.11 2011 All - In Fuel Cost per Gallon Industry Excl. DAL Note: excludes mark to market adjustments for fuel hedges recorded in periods other than the settlement period. 57.6 60.7 2007 2011 Fuel Efficiency (ASMs/gal) 6%
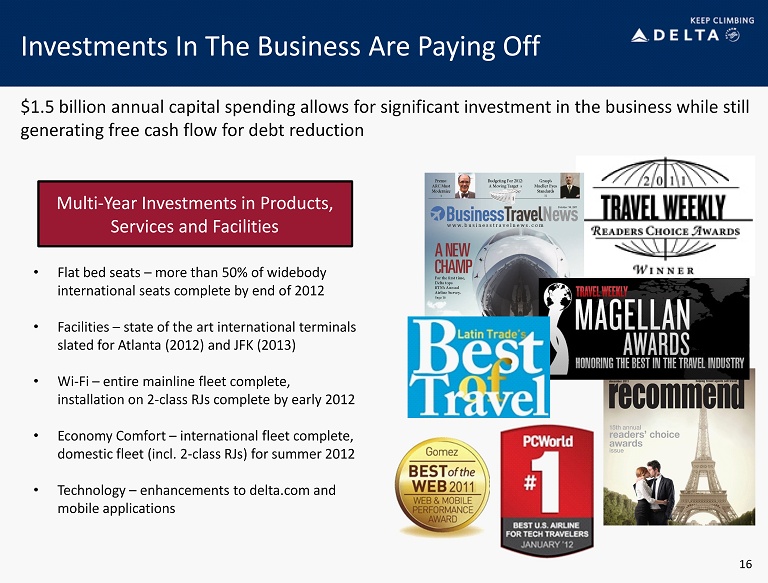
Investments In The Business Are Paying Off Multi - Year Investments in Products, Services and Facilities • Flat bed seats – more than 50% of widebody international seats complete by end of 2012 • Facilities – state of the art international terminals slated for Atlanta (2012) and JFK (2013) • Wi - Fi – entire mainline fleet complete, installation on 2 - class RJs complete by early 2012 • Economy Comfort – international fleet complete, domestic fleet (incl. 2 - class RJs) for summer 2012 • Technology – enhancements to delta.com and mobile applications 16 $1.5 billion annual capital spending allows for significant investment in the business while still generating free cash flow for debt reduction

Derisking the Business through Debt Reduction Solid Progress On Debt Reduction… $17B 3 /31/12 $ 12.2B $10B 17 On track to achieve $10 billion adjusted net debt target in the next 18 months $1.3B $1.0 B $0.8 2009 2012 At Target …Producing Interest Expense Savings and Enhanced Flexibility 2009 Mid - 2013

18 Delta: Keep Climbing Solid business momentum going into 2012 Durable business model to offset higher fuel prices Building for long - term success Creating a solid franchise that generates strong margins and cash flow, provides for debt reduction and investment for the future Successfully offset $3 billion fuel increase in 2011 through higher revenues and disciplined approach to cost, capacity and capital spending Business momentum built through 2011, producing year over year margin expansion by 4Q despite fuel challenge
19
Non-GAAP Financial Measures
Delta sometimes uses information that is derived from our Consolidated Financial Statements, but that is not presented in accordance with accounting principles generally accepted in the U.S. (“GAAP”). Certain of this information is considered “non-GAAP financial measures” under the U.S. Securities and Exchange Commission rules. The non-GAAP financial measures should be considered in addition to results prepared in accordance with GAAP, but should not be considered a substitute for or superior to GAAP results.
Delta is unable to reconcile certain forward-looking projections to GAAP for future periods as the nature or amount of special items cannot be estimated at this time.
Delta excludes special items because management believes the exclusion of these items is helpful to investors to evaluate the company’s recurring operational performance.
Delta adjusts for mark-to-market (MTM) adjustments for fuel hedges recorded in periods other than the settlement period in order to evaluate the company's financial results in the period shown.
Delta presents total non-fuel costs because management believes the volatility in fuel prices impacts the comparability of year-over-year financial performance.Delta uses adjusted total debt, including aircraft rent, in addition to long-term adjusted debt and capital leases, to present estimated financial obligations.
Delta reduces adjusted total debt by cash, cash equivalents and short-term investments, resulting in adjusted net debt, to present the amount of additional assets needed to satisfy the debt.
Pre-tax Income
| Three Months Ended | Three Months Ended | |||||
| (in millions) | December 31, 2011 | December 31, 2010 | ||||
| Pre-tax income | $ | 417 | $ | 21 | ||
| Items excluded: | ||||||
| Restructuring and other items | 88 | 108 | ||||
| Loss on extinguishment of debt | 30 | 31 | ||||
| MTM adjustments for fuel hedges recorded in periods other than the settlement period | (164 | ) | - | |||
| Pre-tax income excluding special items | $ | 371 | $ | 160 | ||
Fuel Hedges
| Full Year | |||
| (in millions) | 2011 | ||
| Fuel hedge gains | $ | 420 | |
| MTM adjustments for fuel hedges recorded in periods other than the settlement period | 26 | ||
| Fuel hedge gains, adjusted | $ | 446 | |
Net Income
| Full Year | Full Year | |||||
| (in millions) | 2011 | 2010 | ||||
| Net income | $ | 854 | $ | 593 | ||
| Items excluded: | ||||||
| Restructuring and other items | 242 | 450 | ||||
| Loss on extinguishment of debt | 68 | 391 | ||||
| MTM adjustments for fuel hedges recorded in periods other than the settlement period | 26 | - | ||||
| Other | - | 10 | ||||
| Net income excluding special items | $ | 1,190 | $ | 1,444 |
Fuel
| Full Year | Full Year | |||||
| (in millions) | 2011 | 2010 | ||||
| Aircraft fuel and related taxes | $ | 9,730 | $ | 7,594 | ||
| Aircraft fuel and related taxes included within contract carrier arrangements | 2,053 | 1,307 | ||||
| Total fuel expense | 11,783 | 8,901 | ||||
| Item excluded: | ||||||
| MTM adjustments for fuel hedges recorded in periods other than the settlement period | (26 | ) | - | |||
| Total fuel expense, adjusted | $ | 11,757 | $ | 8,901 | ||
Non-Fuel Costs
| Full Year | Full Year | |||||
| (in millions) | 2011 | 2010 | ||||
| Operating expense | $ | 33,140 | $ | 29,538 | ||
| Other expense, net | 1,206 | 1,609 | ||||
| Income tax (benefit) provision | (85 | ) | 15 | |||
| Items excluded: | ||||||
| Total fuel expense | (11,783 | ) | (8,901 | ) | ||
| Restructuring and other items | (242 | ) | (450 | ) | ||
| Loss on extinguishment of debt | (68 | ) | (391 | ) | ||
| Other | - | (10 | ) | |||
| Total non-fuel costs, adjusted | $ | 22,168 | $ | 21,410 | ||
Average Price Per Fuel Gallon
| Full Year | |||
| 2011 | |||
| Average price per fuel gallon including fuel expense incurred under contract carrier arrangements | $ | 3.06 | |
| MTM adjustments for fuel hedges recorded in periods other than the settlement period | (0.01 | ) | |
| Average price per fuel gallon, adjusted | $ | 3.05 | |
Adjusted Net Debt
| March 31, 2012 | ||||||||||||
| (in billions) | Projection | December 31, 2009 | ||||||||||
| Debt and capital lease obligations | $ | 13.3 | $ | 17.2 | ||||||||
| Plus: unamortized discount, net from purchase accounting and fresh start reporting | 0.6 | 1.1 | ||||||||||
| Adjusted debt and capital lease obligations | $ | 13.9 | $ | 18.3 | ||||||||
| Plus: 7x last twelve months' aircraft rent | 2.1 | 3.4 | ||||||||||
| Adjusted total debt | 16.0 | 21.7 | ||||||||||
| Less: cash, cash equivalents and short-term investments | (3.8 | ) | (4.7 | ) | ||||||||
| Adjusted net debt | $ | 12.2 | $ | 17.0 | ||||||||