Exhibit 99.1

This presentation contains various projections and other forward - looking statements which represent Delta’s estimates or expectations regarding future events. All forward - looking statements involve a number of assumptions, risks and uncertainties, many of which are beyond Delta’s control, that could cause the actual results to differ materially from the projected results. Factors which could cause such differences include, without limitation, business, economic, competitive, industry, regulatory, market and financial uncertainties and contingencies, as well as the “Risk Factors” discussed in Delta’s SEC filings. Caution should be taken not to place undue reliance on Delta’s forward - looking statements, which represent Delta’s views only as of the date of this presentation, and which Delta has no current intention to update. In this presentation, we will discuss certain non - GAAP financial measures. You can find the reconciliations of those measures to comparable GAAP measures on our website at delta.com. Safe Harbor 2
The Path Forward Richard Anderson Chief Executive Officer
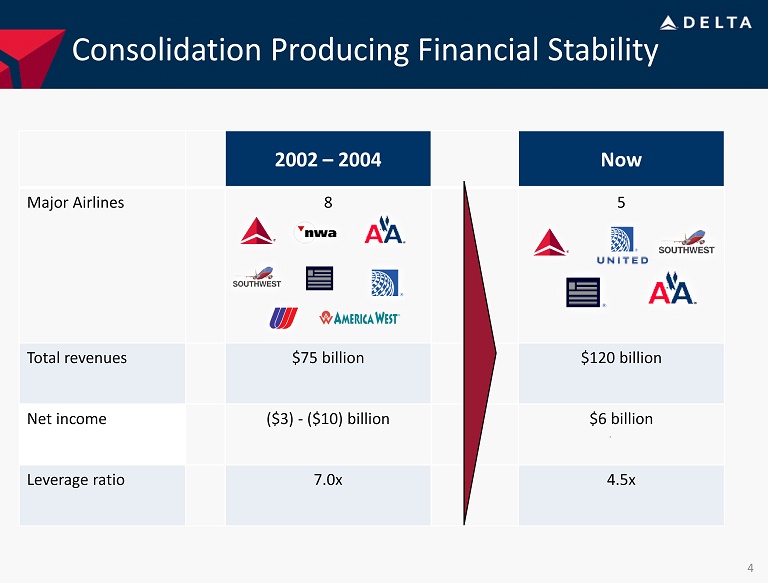
Consolidation Producing Financial Stability 2002 – 2004 Now Major Airlines 8 5 Total revenues $75 billion $120 billion Net income ($3) - ($10) billion $6 billion Leverage ratio 7.0 x 4.5x 4
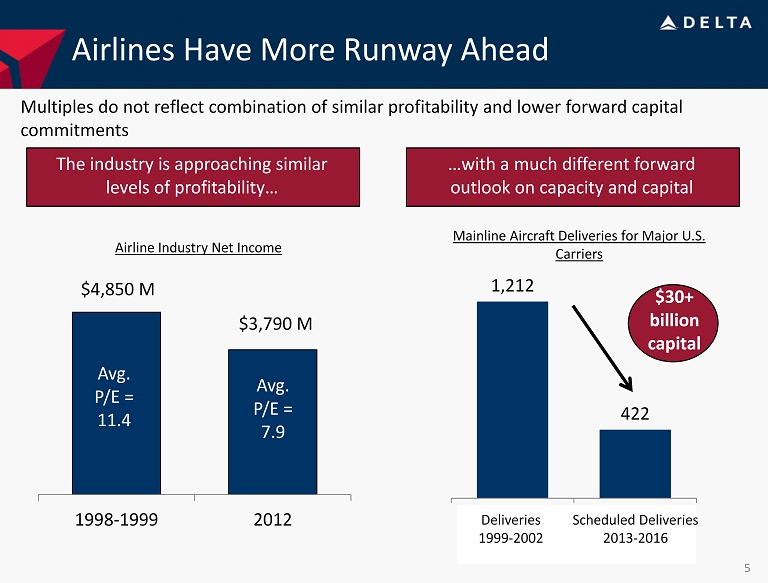
1,212 422 Deliveries 1999 - 2002 Scheduled Deliveries 2013 - 2016 Airlines Have More Runway Ahead Mainline Aircraft Deliveries for Major U.S. Carriers $30+ billion capital …with a much different forward outlook on capacity and capital The industry is approaching similar levels of profitability… Multiples do not reflect combination of similar profitability and lower forward capital commitments 5 Deliveries 1999 - 2002 Scheduled Deliveries 2013 - 2016 1998-1999 2012 $3,790 M $4,850 M Avg. P/E = 11.4 Avg. P/E = 7.9 Airline Industry Net Income
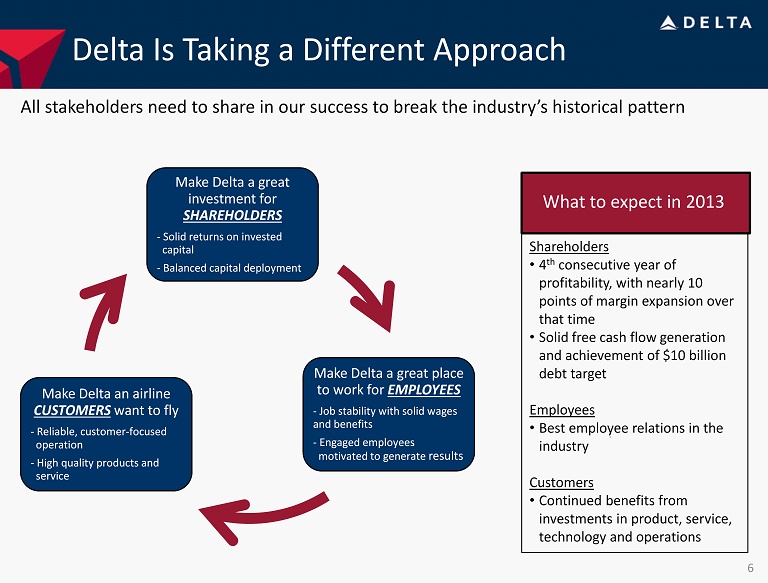
Delta Is Taking a Different Approach All stakeholders need to share in our success to break the industry’s historical pattern Make Delta a great investment for SHAREHOLDERS - Solid returns on invested capital - Balanced capital deployment Make Delta a great place to work for EMPLOYEES - Job stability with solid wages and benefits - Engaged employees motivated to generate results Make Delta an airline CUSTOMERS want to fly - Reliable, customer - focused operation - High quality products and service 6 Shareholders • 4 th consecutive year of profitability, with nearly 10 points of margin expansion over that time • Solid free cash flow generation and achievement of $10 billion debt target Employees • Best employee relations in the industry Customers • Continued benefits from investments in product, service, technology and operations What to expect in 2013
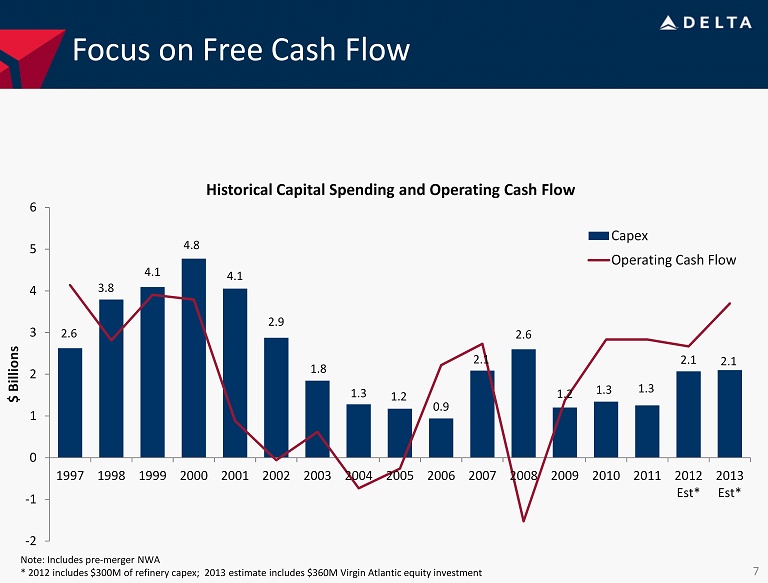
Focus on Free Cash Flow 2.6 3.8 4.1 4.8 4.1 2.9 1.8 1.3 1.2 0.9 2.1 2.6 1.2 1.3 1.3 2.1 2.1 -2 -1 0 1 2 3 4 5 6 1997 1998 1999 2000 2001 2002 2003 2004 2005 2006 2007 2008 2009 2010 2011 2012 Est* 2013 Est* $ Billions Capex Operating Cash Flow Historical Capital Spending and Operating Cash Flow 7 Note: Includes pre - merger NWA * 2012 includes $300M of refinery capex ; 2013 estimate includes $360M Virgin Atlantic equity investment
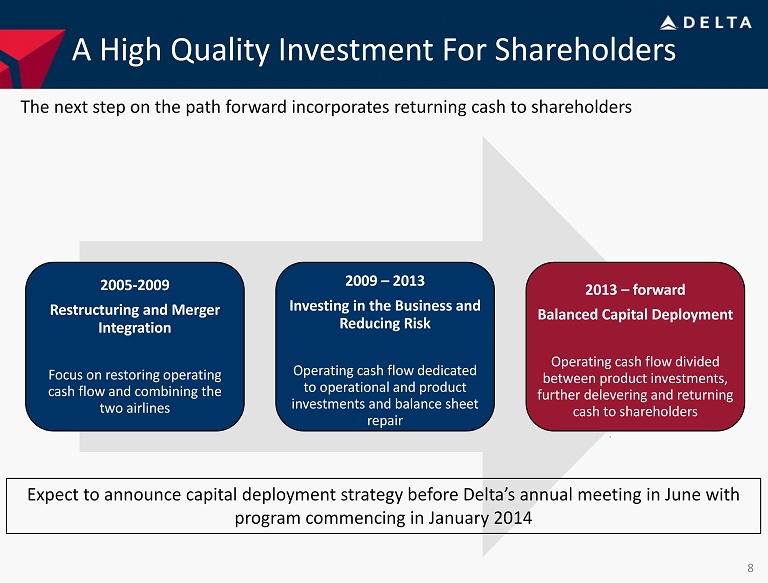
2005 - 2009 Restructuring and Merger Integration Focus on restoring operating cash flow and combining the two airlines 2009 – 2013 Investing in the Business and Reducing Risk Operating cash flow dedicated to operational and product investments and balance sheet repair 2013 – forward Balanced Capital Deployment Operating cash flow divided between product investments, further delevering and returning cash to shareholders A High Quality Investment For Shareholders 8 The next step on the path forward incorporates returning cash to shareholders Expect to announce capital deployment strategy before Delta’s annual meeting in June with program commencing in January 2014
Building On Our Success Ed Bastian President

Building On Our Success Our Plan Is Delivering Results Momentum To Continue In 2013 Taking Our Performance To the Next Level Leveraging scale and first - mover advantage and taking the next step forward to long - term, sustainable profitability and free cash flow generation Continued delivery of our plan, combined with further benefits from investments, create the platform for success in 2013 Strong execution led to a successful 2012 with solid earnings growth, operational improvements and increased customer satisfaction 10
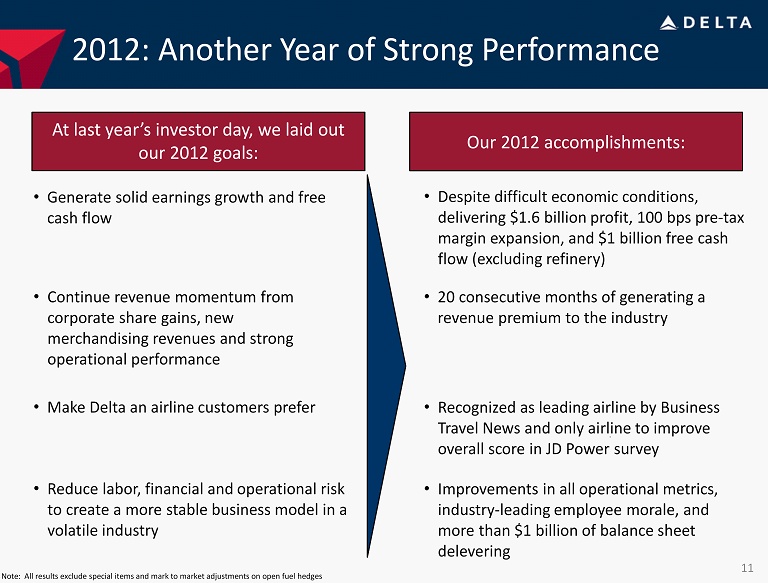
2012: Another Year of Strong Performance • Generate solid earnings growth and free cash flow • Continue revenue momentum from corporate share gains, new merchandising revenues and strong operational performance • Make Delta an airline customers prefer • Reduce labor, financial and operational risk to create a more stable business model in a volatile industry At last year’s investor day, we laid out our 2012 goals: Our 2012 accomplishments: • Despite difficult economic conditions, delivering $1.6 billion profit, 100 bps pre - tax margin expansion, and $1 billion free cash flow (excluding refinery) • 20 consecutive months of generating a revenue premium to the industry • Recognized as leading airline by Business Travel News and only airline to improve overall score in JD Power survey • Improvements in all operational metrics, industry - leading employee morale, and more than $1 billion of balance sheet delevering 11 Note: All results exclude special items and mark to market adjustments on open fuel hedges
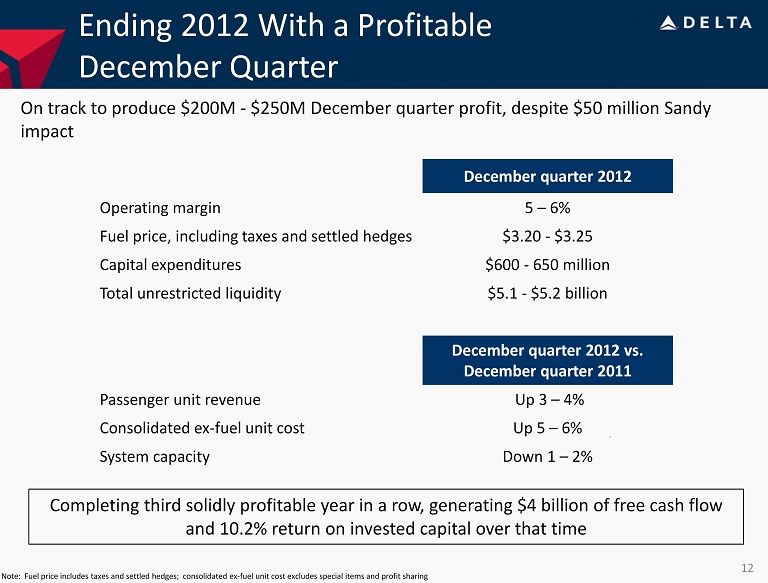
Ending 2012 With a Profitable December Quarter December quarter 2012 Operating margin 5 – 6% Fuel price, including taxes and settled hedges $3.20 - $3.25 Capital expenditures $600 - 650 million Total unrestricted liquidity $5.1 - $5.2 billion December quarter 2012 vs. December quarter 2011 Passenger unit revenue Up 3 – 4% Consolidated ex - fuel unit cost Up 5 – 6% System capacity Down 1 – 2% On track to produce $200M - $250M December quarter profit, despite $50 million Sandy impact 12 Completing third solidly profitable year in a row, generating $4 billion of free cash flow and 10.2% return on invested capital over that time Note: Fuel price includes taxes and settled hedges; consolidated ex - fuel unit cost excludes special items and profit sharing
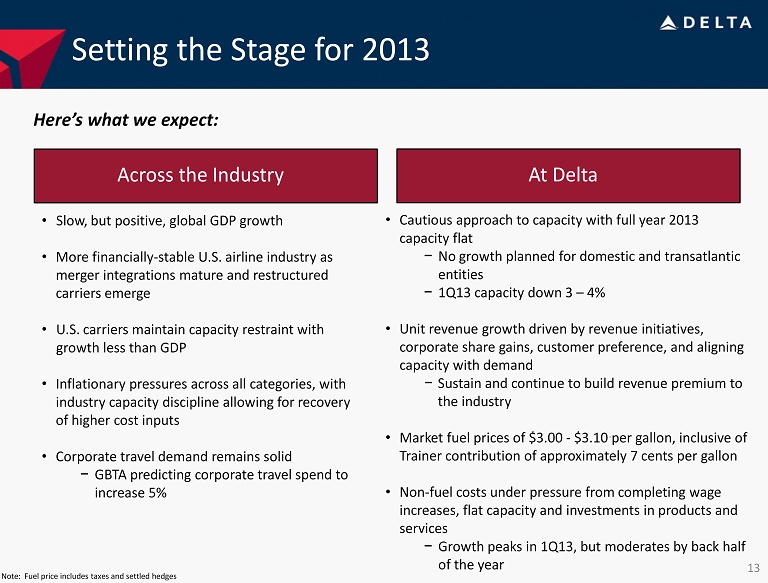
Setting the Stage for 2013 Across the Industry • Slow, but positive, global GDP growth • More financially - stable U.S. airline industry as merger integrations mature and restructured carriers emerge • U.S. carriers maintain capacity restraint with growth less than GDP • Inflationary pressures across all categories, with industry capacity discipline allowing for recovery of higher cost inputs • Corporate travel demand remains solid − GBTA predicting corporate travel spend to increase 5% • Cautious approach to capacity with full year 2013 capacity flat − No growth planned for domestic and transatlantic entities − 1Q13 capacity down 3 – 4% • Unit revenue growth driven by revenue initiatives, corporate share gains, customer preference, and aligning capacity with demand − Sustain and continue to build revenue premium to the industry • Market fuel prices of $3.00 - $3.10 per gallon, inclusive of Trainer contribution of approximately 7 cents per gallon • Non - fuel costs under pressure from completing wage increases, flat capacity and investments in products and services − Growth peaks in 1Q13, but moderates by back half of the year Here’s what we expect: At Delta 13 Note: Fuel price includes taxes and settled hedges
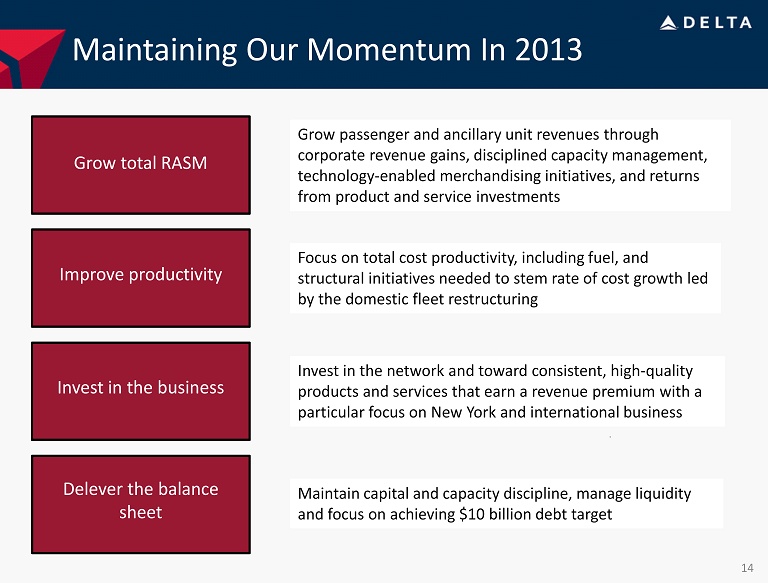
Maintaining Our Momentum In 2013 Grow total RASM Improve productivity Invest in the business Grow passenger and ancillary unit revenues through corporate revenue gains, disciplined capacity management, technology - enabled merchandising initiatives, and returns from product and service investments Focus on total cost productivity, including fuel, and structural initiatives needed to stem rate of cost growth led by the domestic fleet restructuring Invest in the network and toward consistent, high - quality products and services that earn a revenue premium with a particular focus on New York and international business Maintain capital and capacity discipline, manage liquidity and focus on achieving $10 billion debt target 14 Improve productivity Invest in the business Delever the balance sheet
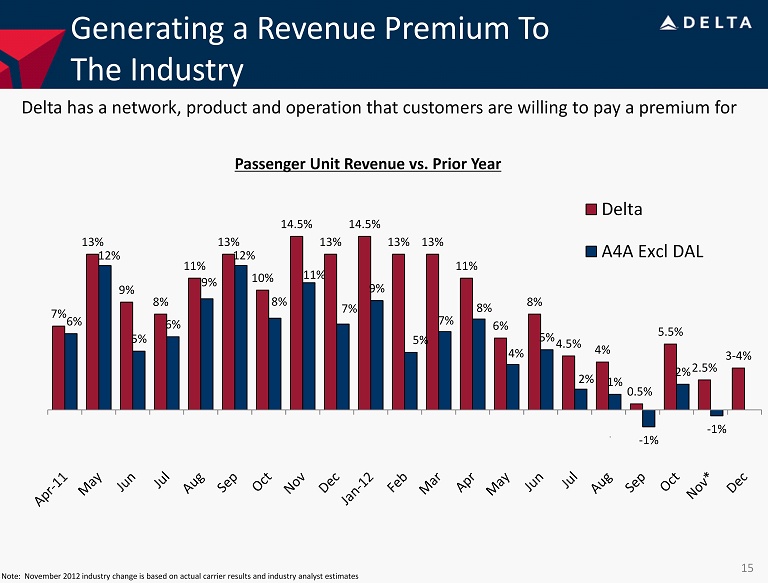
7% 13% 9% 8% 11% 13% 10% 14.5% 13% 14.5 % 13% 13% 11% 6% 8% 4.5% 4% 0.5% 5.5% 2.5% 3 - 4% 6% 12% 5% 6% 9% 12% 8% 11% 7% 9% 5% 7% 8% 4% 5% 2% 1% - 1% 2% - 1% Delta A4A Excl DAL Generating a Revenue Premium To The Industry Delta has a network, product and operation that customers are willing to pay a premium for Passenger Unit Revenue vs. Prior Year 15 Note: November 2012 industry change is based on actual carrier results and industry analyst estimates
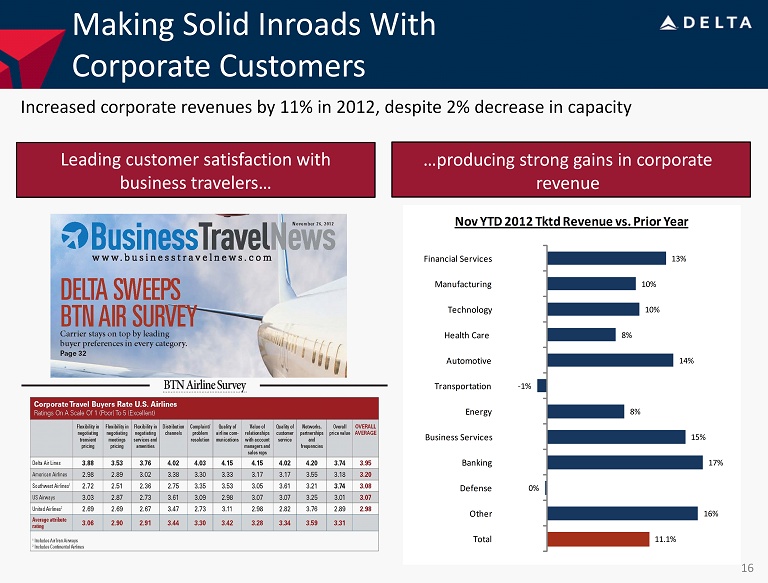
Making Solid Inroads With Corporate Customers Increased corporate revenues by 11% in 2012, despite 2% decrease in capacity A diverse base of corporate customers…. …and strong gains in corporate revenue 11.1% 16% 0% 17% 15% 8% - 1% 14% 8% 10% 10% 13% Total Other Defense Banking Business Services Energy Transportation Automotive Health Care Technology Manufacturing Financial Services Nov YTD 2012 Tktd Revenue vs. Prior Year Leading customer satisfaction with business travelers… …producing strong gains in corporate revenue 16
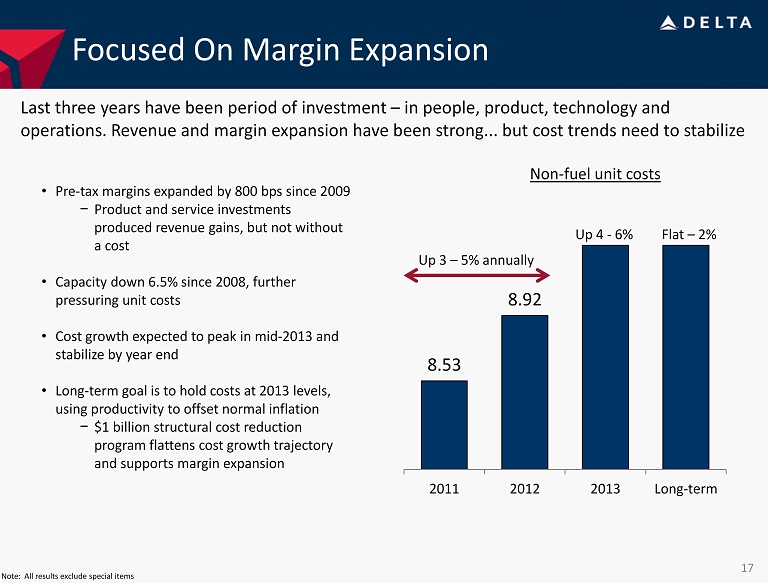
8.53 8.92 2011 2012 2013 Long-term Focused On Margin Expansion Last three years have been period of investment – in people, product, technology and operations. Revenue and margin expansion have been strong... but cost trends need to stabilize • Pre - tax margins expanded by 800 bps since 2009 − Product and service investments produced revenue gains, but not without a cost • Capacity down 6.5% since 2008, further pressuring unit costs • Cost growth expected to peak in mid - 2013 and stabilize by year end • Long - term goal is to hold costs at 2013 levels, using productivity to offset normal inflation − $1 billion structural cost reduction program flattens cost growth trajectory and supports margin expansion Non - fuel unit costs Up 3 – 5% annually Up 4 - 6% Flat – 2% 17 Note: All results exclude special items
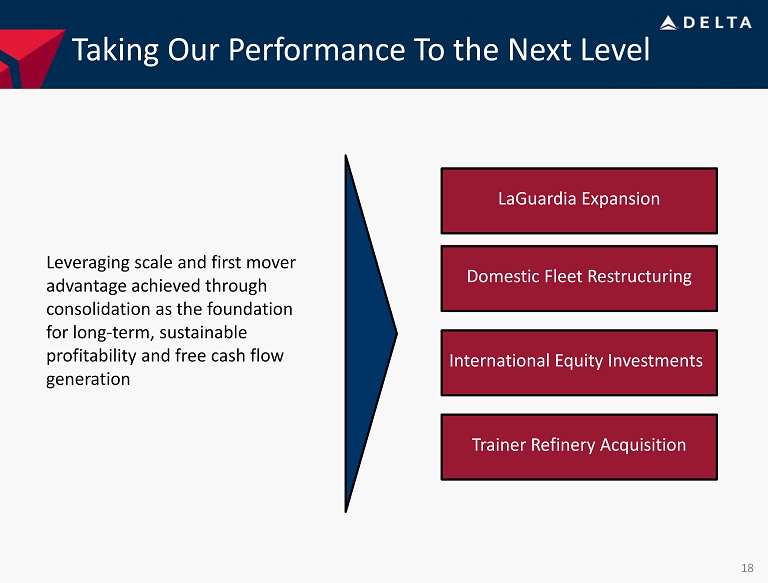
Taking Our Performance To the Next Level Leveraging scale and first mover advantage achieved through consolidation as the foundation for long - term, sustainable profitability and free cash flow generation LaGuardia Expansion Trainer Refinery Acquisition International Equity Investments Domestic Fleet Restructuring 18
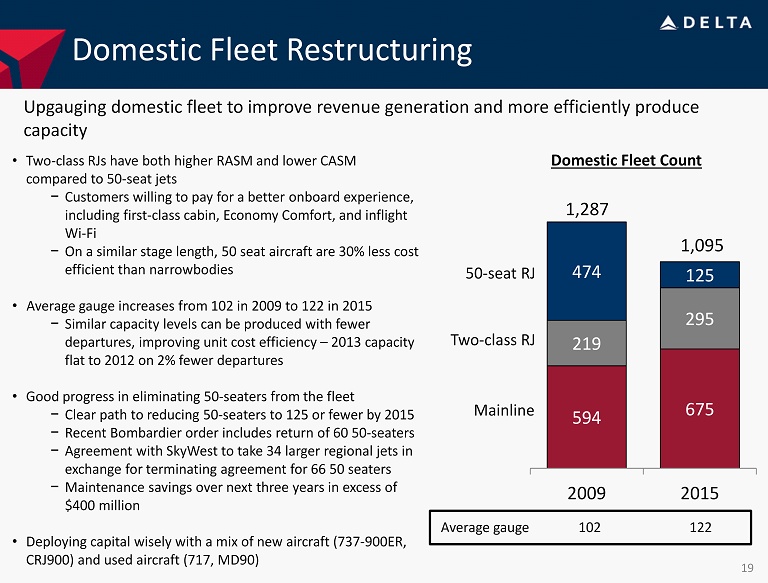
Domestic Fleet Restructuring Upgauging domestic fleet to improve revenue generation and more efficiently produce capacity Domestic Fleet Count • Two - class RJs have both higher RASM and lower CASM compared to 50 - seat jets − Customers willing to pay for a better onboard experience, including first - class cabin, Economy Comfort, and inflight Wi - Fi − On a similar stage length, 50 seat aircraft are 30% less cost efficient than narrowbodies • Average gauge increases from 102 in 2009 to 122 in 2015 − Similar capacity levels can be produced with fewer departures, improving unit cost efficiency – 2013 capacity flat to 2012 on 2% fewer departures • Good progress in eliminating 50 - seaters from the fleet − Clear path to reducing 50 - seaters to 125 or fewer by 2015 − Recent Bombardier order includes return of 60 50 - seaters − Agreement with SkyWest to take 34 larger regional jets in exchange for terminating agreement for 66 50 seaters − Maintenance savings over next three years in excess of $400 million • Deploying capital wisely with a mix of new aircraft (737 - 900ER, CRJ900) and used aircraft (717, MD90) 594 675 219 295 474 125 2009 2015 1,287 Mainline 50 - seat RJ Two - class RJ 19 1,095 Average gauge 102 122
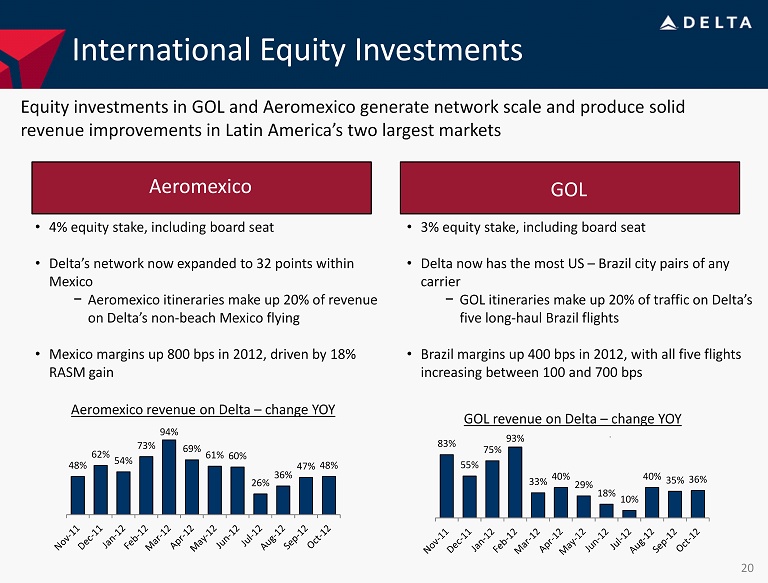
International Equity Investments Equity investments in GOL and Aeromexico generate network scale and produce solid revenue improvements in Latin America’s two largest markets • 3% equity stake, including board seat • Delta now has the most US – Brazil city pairs of any carrier − GOL itineraries make up 20% of traffic on Delta’s five long - haul Brazil flights • Brazil margins up 400 bps in 2012, with all five flights increasing between 100 and 700 bps • 4% equity stake, including board seat • Delta’s network now expanded to 32 points within Mexico − Aeromexico itineraries make up 20% of revenue on Delta’s non - beach Mexico flying • Mexico margins up 800 bps in 2012, driven by 18% RASM gain 83% 55% 75% 93% 33% 40% 29% 18% 10% 40% 35% 36% GOL revenue on Delta – change YOY 48% 62% 54% 73% 94% 69% 61% 60% 26% 36% 47% 48% Aeromexico revenue on Delta – change YOY Aeromexico GOL 20
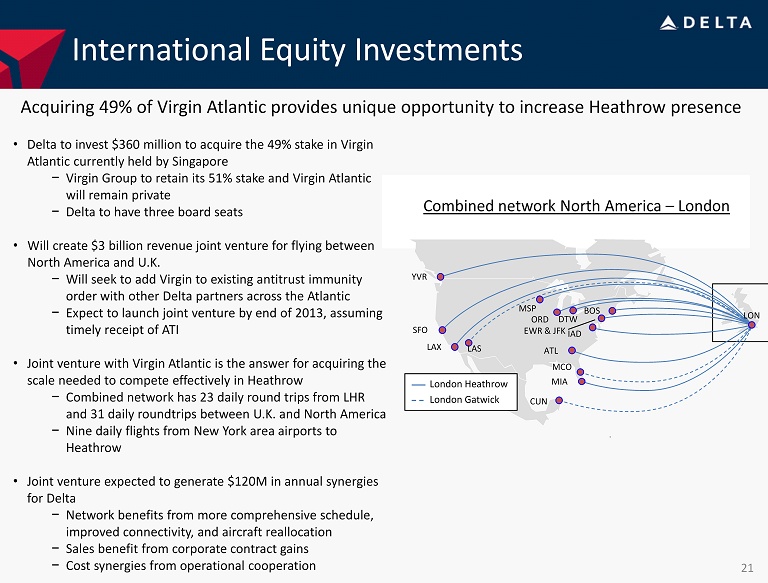
International Equity Investments Acquiring 49% of Virgin Atlantic provides unique opportunity to increase Heathrow presence • Delta to invest $360 million to acquire the 49% stake in Virgin Atlantic currently held by Singapore − Virgin Group to retain its 51% stake and Virgin Atlantic will remain private − Delta to have three board seats • Will create $3 billion revenue joint venture for flying between North America and U.K. − Will seek to add Virgin to existing antitrust immunity order with other Delta partners across the Atlantic − Expect to launch joint venture by end of 2013, assuming timely receipt of ATI • Joint venture with Virgin Atlantic is the answer for acquiring the scale needed to compete effectively in Heathrow − Combined network has 23 daily round trips from LHR and 31 daily roundtrips between U.K. and North America − Nine daily flights from New York area airports to Heathrow • Joint venture expected to generate $120M in annual synergies for Delta − Network benefits from more comprehensive schedule, improved connectivity, and aircraft reallocation − Sales benefit from corporate contract gains − Cost synergies from operational cooperation 21 Combined network North America – London London Heathrow London Gatwick LAX SFO YVR LAS ORD CUN MIA MCO IAD BOS EWR & JFK LON ATL MSP DTW
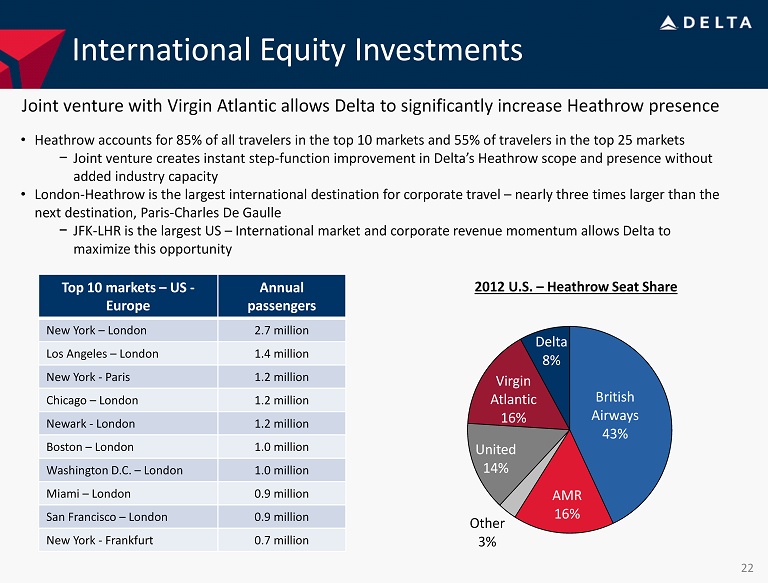
International Equity Investments Joint venture with Virgin Atlantic allows Delta to significantly increase Heathrow presence • Heathrow accounts for 85% of all travelers in the top 10 markets and 55% of travelers in the top 25 markets − Joint venture creates instant step - function improvement in Delta’s Heathrow scope and presence without added industry capacity • London - Heathrow is the largest international destination for corporate travel – nearly three times larger than the next destination, Paris - Charles De Gaulle − JFK - LHR is the largest US – International market and corporate revenue momentum allows Delta to maximize this opportunity Top 10 markets – US - Europe Annual passengers New York – London 2.7 million Los Angeles – London 1.4 million New York - Paris 1.2 million Chicago – London 1.2 million Newark - London 1.2 million Boston – London 1.0 million Washington D.C. – London 1.0 million Miami – London 0.9 million San Francisco – London 0.9 million New York - Frankfurt 0.7 million British Airways 43% AMR 16% Other 3% United 14% Virgin Atlantic 16% Delta 8% 2012 U.S. – Heathrow Seat Share 22
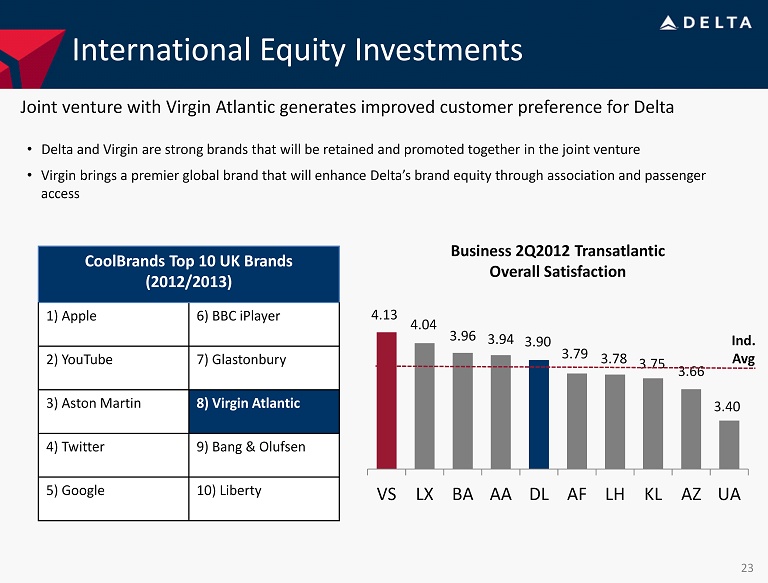
International Equity Investments Joint venture with Virgin Atlantic generates improved customer preference for Delta CoolBrands Top 10 UK Brands (2012/2013) 1) Apple 6) BBC iPlayer 2) YouTube 7) Glastonbury 3) Aston Martin 8) Virgin Atlantic 4) Twitter 9) Bang & Olufsen 5) Google 10) Liberty • Delta and Virgin are strong brands that will be retained and promoted together in the joint venture • Virgin brings a premier global brand that will enhance Delta’s brand equity through association and passenger access 23 4.13 4.04 3.96 3.94 3.90 3.79 3.78 3.75 3.66 3.40 VS LX BA AA DL AF LH KL AZ UA Business 2Q2012 Transatlantic Overall Satisfaction Ind. Avg
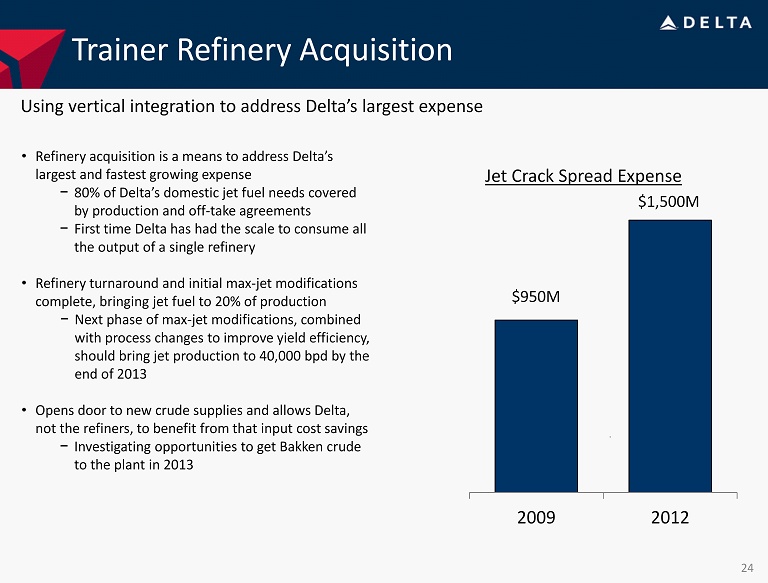
Using vertical integration to address Delta’s largest expense • Refinery acquisition is a means to address Delta’s largest and fastest growing expense − 80% of Delta’s domestic jet fuel needs covered by production and off - take agreements − First time Delta has had the scale to consume all the output of a single refinery • Refinery turnaround and initial max - jet modifications complete, bringing jet fuel to 20% of production − Next phase of max - jet modifications, combined with process changes to improve yield efficiency, should bring jet production to 40,000 bpd by the end of 2013 • Opens door to new crude supplies and allows Delta, not the refiners, to benefit from that input cost savings − Investigating opportunities to get Bakken crude to the plant in 2013 Trainer Refinery Acquisition 24 2009 2012 Jet Crack Spread Expense $950M $1,500M
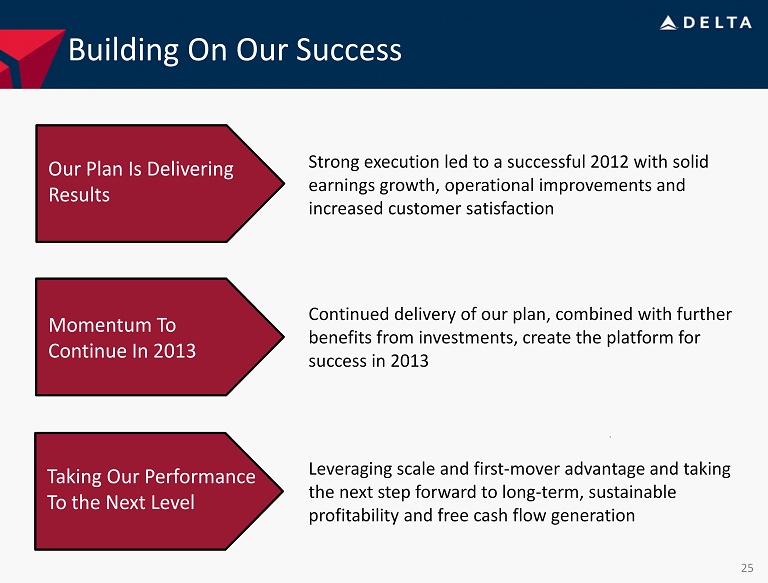
Building On Our Success Our Plan Is Delivering Results Momentum To Continue In 2013 Taking Our Performance To the Next Level Leveraging scale and first - mover advantage and taking the next step forward to long - term, sustainable profitability and free cash flow generation Continued delivery of our plan, combined with further benefits from investments, create the platform for success in 2013 Strong execution led to a successful 2012 with solid earnings growth, operational improvements and increased customer satisfaction 25

Running a Reliable, Customer - Focused Airline Steve Gorman Chief Operating Officer
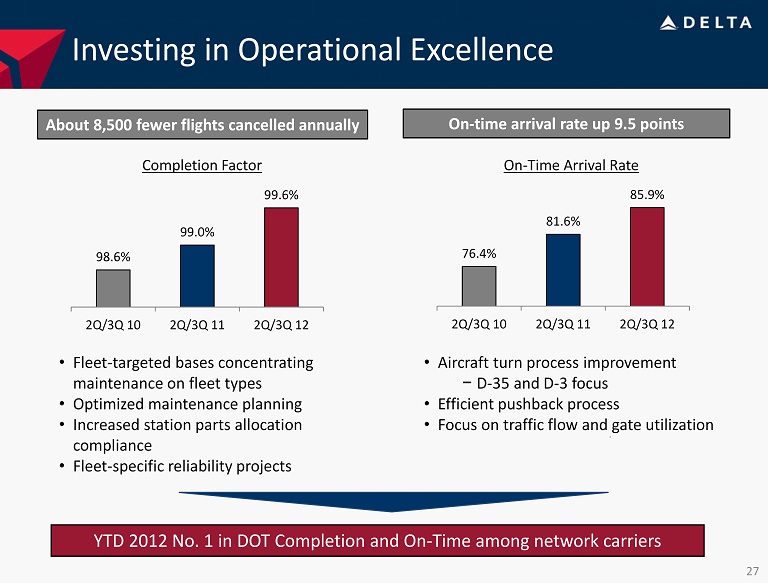
Investing in Operational Excellence • Fleet - targeted bases concentrating maintenance on fleet types • Optimized maintenance planning • Increased station parts allocation compliance • Fleet - specific reliability projects • Aircraft turn process improvement − D - 35 and D - 3 focus • Efficient pushback process • Focus on traffic flow and gate utilization About 8,500 fewer flights cancelled annually On - time arrival rate up 9.5 points YTD 2012 No. 1 in DOT Completion and On - Time among network carriers 76.4% 81.6% 85.9% 2Q/3Q 10 2Q/3Q 11 2Q/3Q 12 98.6% 99.0% 99.6% 2Q/3Q 10 2Q/3Q 11 2Q/3Q 12 On - Time Arrival Rate Completion Factor 27

Ongoing Improvement in Mishandled Bags • 66% reduction in claims over last six years • Leveraging airport infrastructure investments and scanning technology • Improved bag transfer process • Bags to claim No. 1 network carrier in DOT Missed Bag Ratio 36% reduction in mishandled bags (per 1,000 customers) 3.25 2.73 2.07 2Q/3Q 10 2Q/3Q 11 2Q/3Q 12 Mishandled Bags 28
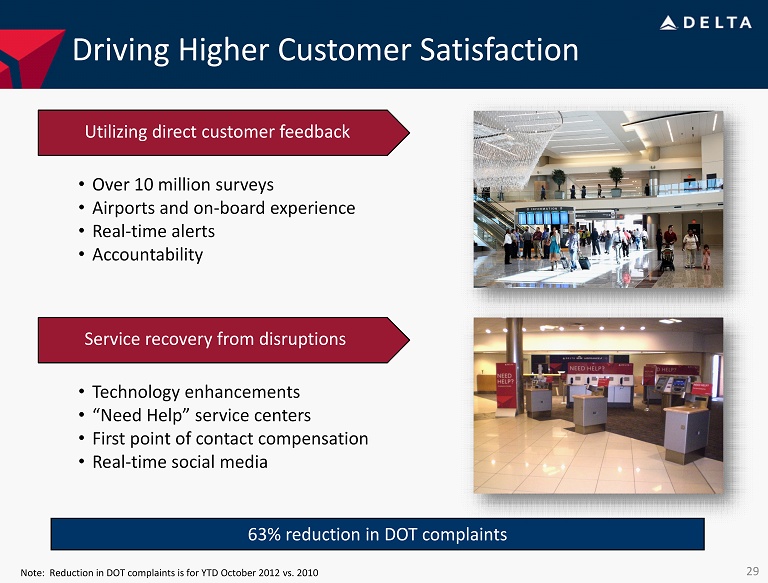
Driving Higher Customer Satisfaction 63% reduction in DOT complaints Utilizing direct customer feedback • Over 10 million surveys • Airports and on - board experience • Real - time alerts • Accountability Service recovery from disruptions • Technology enhancements • “Need Help” service centers • First point of contact compensation • Real - time social media 29 Note: Reduction in DOT complaints is for YTD October 2012 vs. 2010

Improving the Product Offering New and upgraded Delta Sky Clubs Refreshed Business Elite with Flat - Bed Seats Personal On - Demand Entertainment Sky Priority Economy Comfort Domestic First Class 30
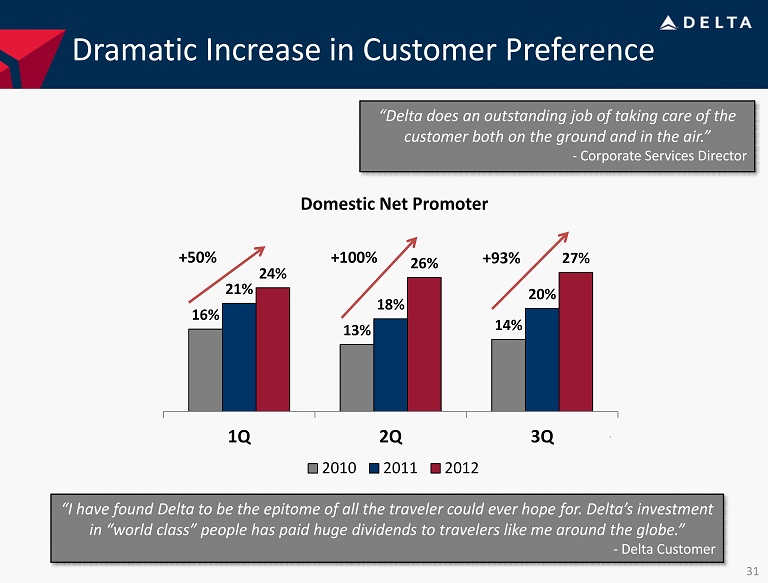
Dramatic Increase in Customer Preference 16% 13% 14% 21% 18% 20% 24% 26% 27% 1Q 2Q 3Q 2010 2011 2012 Domestic Net Promoter +50% +100% +93% “Delta does an outstanding job of taking care of the customer both on the ground and in the air.” - Corporate Services Director “I have found Delta to be the epitome of all the traveler could ever hope for. Delta’s investment in “world class” people has paid huge dividends to travelers like me around the globe.” - Delta Customer 31
Generating a Sustainable Revenue Premium Glen Hauenstein EVP Marketing, Network, Revenue Management and Alliances
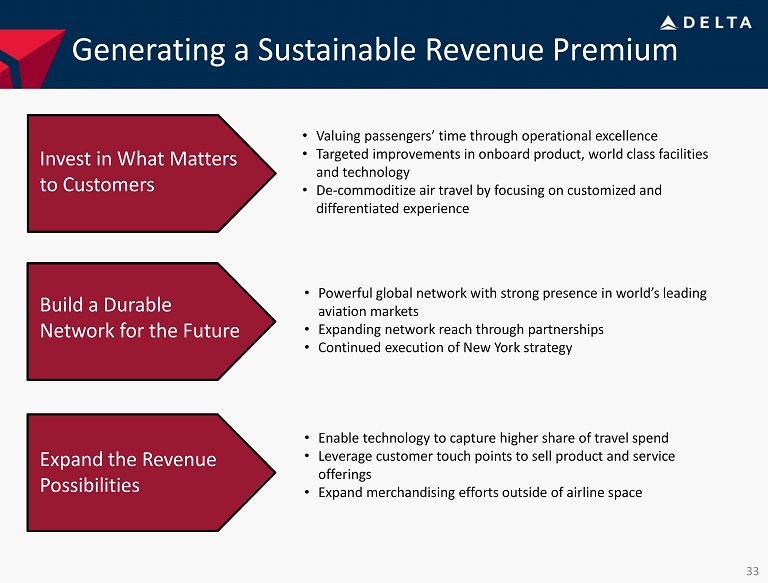
Generating a Sustainable Revenue Premium • Valuing passengers’ time through operational excellence • Targeted improvements in onboard product, world class facilities and technology • De - commoditize air travel by focusing on customized and differentiated experience • Powerful global network with strong presence in world’s leading aviation markets • Expanding network reach through partnerships • Continued execution of New York strategy • Enable technology to capture higher share of travel spend • Leverage customer touch points to sell product and service offerings • Expand merchandising efforts outside of airline space Invest in What Matters to Customers Build a Durable Network for the Future Expand the Revenue Possibilities 33
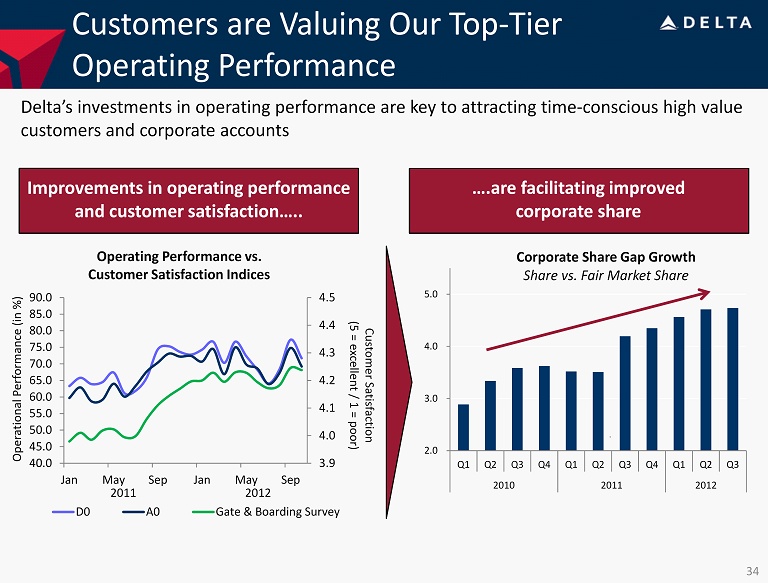
2.0 3.0 4.0 5.0 Q1 Q2 Q3 Q4 Q1 Q2 Q3 Q4 Q1 Q2 Q3 2010 2011 2012 Corporate Share Gap Growth Share vs. Fair Market Share Customers are Valuing Our Top - Tier Operating Performance Delta’s investments in operating performance are key to attracting time - conscious high value customers and corporate accounts 3.9 4.0 4.1 4.2 4.3 4.4 4.5 40.0 45.0 50.0 55.0 60.0 65.0 70.0 75.0 80.0 85.0 90.0 Jan May Sep Jan May Sep D0 A0 Gate & Boarding Survey Customer Satisfaction (5 = excellent / 1 = poor) Operational Performance (in %) 2011 2012 Operating Performance vs. Customer Satisfaction Indices Improvements in operating performance and customer satisfaction….. ….are facilitating improved corporate share 34
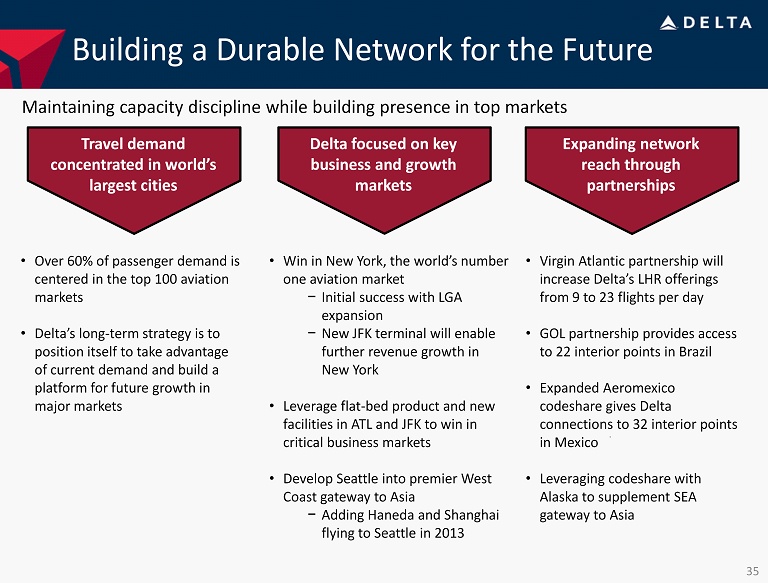
• Virgin Atlantic partnership will increase Delta’s LHR offerings from 9 to 23 flights per day • GOL partnership provides access to 22 interior points in Brazil • Expanded Aeromexico codeshare gives Delta connections to 32 interior points in Mexico • Leveraging codeshare with Alaska to supplement SEA gateway to Asia Building a Durable Network for the Future Maintaining capacity discipline while building presence in top markets Win in New York Delta focused on key business and growth markets Expand Network through Partnerships • Win in New York, the world’s number one aviation market − Initial success with LGA expansion − New JFK terminal will enable further revenue growth in New York • Leverage flat - bed product and new facilities in ATL and JFK to win in critical business markets • Develop Seattle into premier West Coast gateway to Asia − Adding Haneda and Shanghai flying to Seattle in 2013 Travel demand concentrated in world’s largest cities Expanding network reach through partnerships • Over 60% of passenger demand is centered in the top 100 aviation markets • Delta’s long - term strategy is to position itself to take advantage of current demand and build a platform for future growth in major markets 35
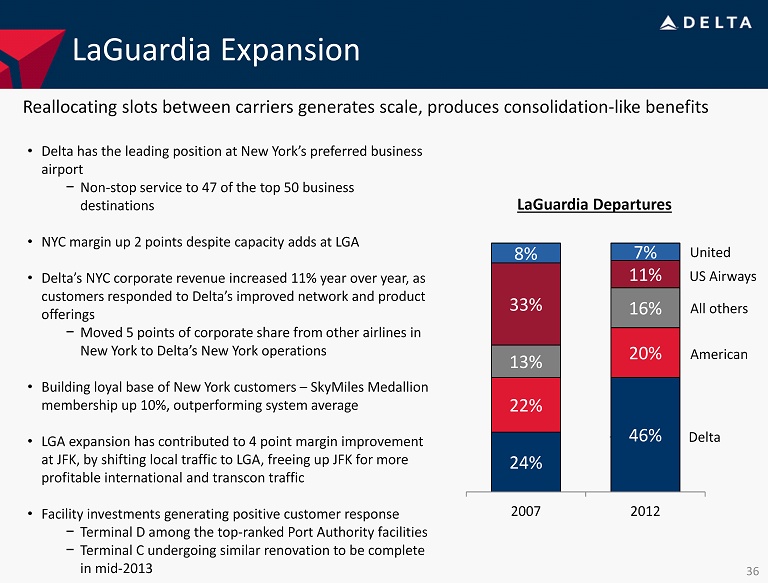
24% 46% 22% 20% 13% 16% 33% 11% 8% 7% 2007 2012 LaGuardia Departures LaGuardia Expansion Reallocating slots between carriers generates scale, produces consolidation - like benefits • Delta has the leading position at New York’s preferred business airport − Non - stop service to 47 of the top 50 business destinations • NYC margin up 2 points despite capacity adds at LGA • Delta’s NYC corporate revenue increased 11% year over year, as customers responded to Delta’s improved network and product offerings − Moved 5 points of corporate share from other airlines in New York to Delta’s New York operations • Building loyal base of New York customers – SkyMiles Medallion membership up 10%, outperforming system average • LGA expansion has contributed to 4 point margin improvement at JFK, by shifting local traffic to LGA, freeing up JFK for more profitable international and transcon traffic • Facility investments generating positive customer response − Terminal D among the top - ranked Port Authority facilities − Terminal C undergoing similar renovation to be complete in mid - 2013 Delta United US Airways All others American 36

7% 13% 9% 8% 11% 13% 10% 14.5% 13% 14.5 % 13% 13% 11% 6% 8% 4.5% 4% 0.5% 5.5% 2.5% 3 - 4% 6% 12% 5% 6% 9% 12% 8% 11% 7% 9% 5% 7% 8% 4% 5% 2% 1% - 1% 2% - 1% Delta A4A Excl DAL Generating a Revenue Premium To The Industry Delta has a network, product and operation that customers are willing to pay a premium for Passenger Unit Revenue vs. Prior Year 37 Note: November 2012 industry change is based on actual carrier results and industry analyst estimates
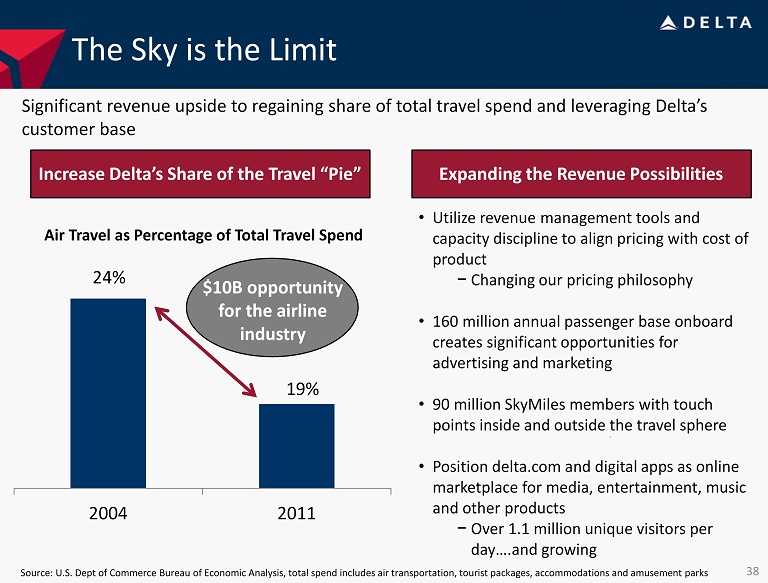
The Sky is the Limit 24% 19% 2004 2011 Air Travel as Percentage of Total Travel Spend Source: U.S. Dept of Commerce Bureau of Economic Analysis, total spend includes air transportation, tourist packages, accommo dat ions and amusement parks Significant revenue upside to regaining share of total travel spend and leveraging Delta’s customer base $10B opportunity for the airline industry Increase Delta’s Share of the Travel “Pie” Expanding the Revenue Possibilities • Utilize revenue management tools and capacity discipline to align pricing with cost of product − Changing our pricing philosophy • 160 million annual passenger base onboard creates significant opportunities for advertising and marketing • 90 million SkyMiles members with touch points inside and outside the travel sphere • Position delta.com and digital apps as online marketplace for media, entertainment, music and other products − Over 1.1 million unique visitors per day….and growing 38
Striking the Right Financial Balance Paul Jacobson Chief Financial Officer
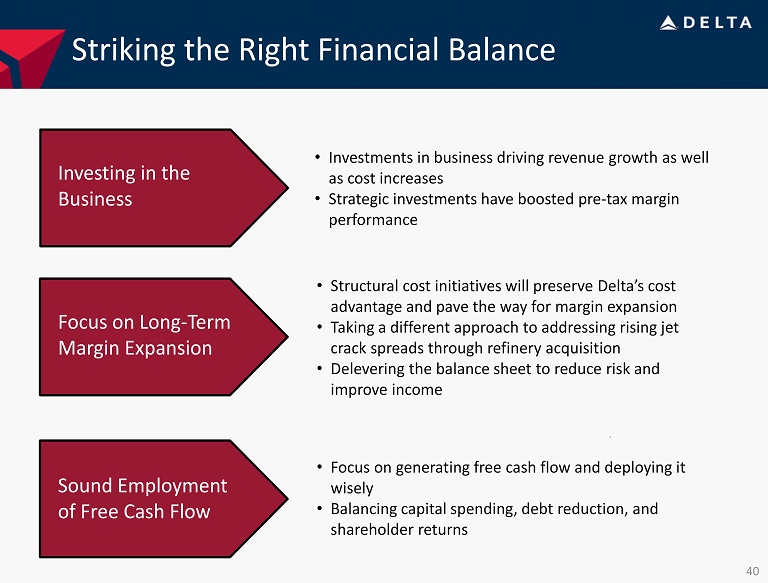
Striking the Right Financial Balance • Investments in business driving revenue growth as well as cost increases • Strategic investments have boosted pre - tax margin performance • Structural cost initiatives will preserve Delta’s cost advantage and pave the way for margin expansion • Taking a different approach to addressing rising jet crack spreads through refinery acquisition • Delevering the balance sheet to reduce risk and improve income • Focus on generating free cash flow and deploying it wisely • Balancing capital spending, debt reduction, and shareholder returns Investing in the Business Focus on Long - Term Margin Expansion Sound Employment of Free Cash Flow 40
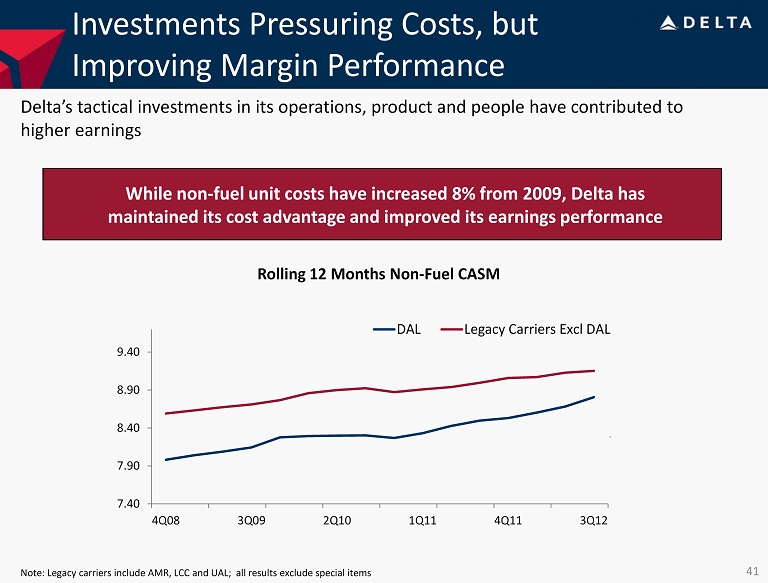
Investments Pressuring Costs, but Improving Margin Performance 7.40 7.90 8.40 8.90 9.40 4Q08 3Q09 2Q10 1Q11 4Q11 3Q12 DAL Legacy Carriers Excl DAL Rolling 12 Months Non - Fuel CASM While non - fuel unit costs have increased 8% from 2009, Delta has maintained its cost advantage and improved its earnings performance Delta’s tactical investments in its operations, product and people have contributed to higher earnings Note: Legacy carriers include AMR, LCC and UAL; all results exclude special items 41
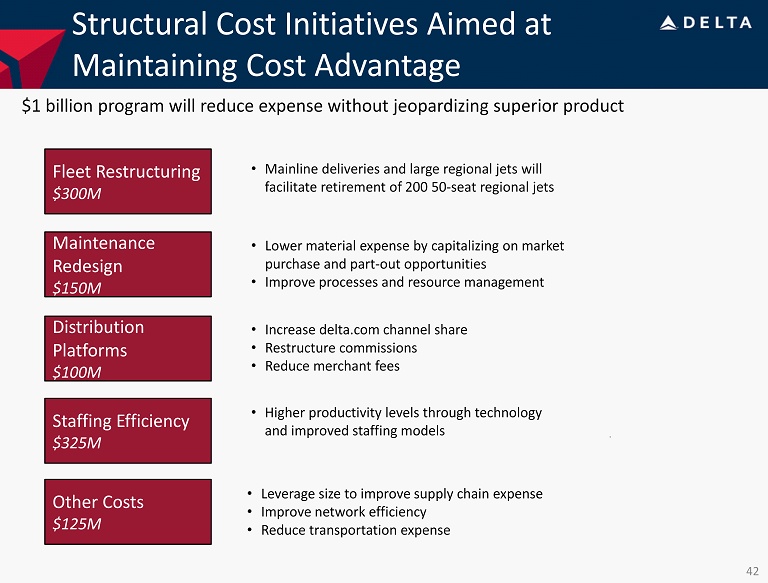
Structural Cost Initiatives Aimed at Maintaining Cost Advantage $1 billion program will reduce expense without jeopardizing superior product Fleet Restructuring $300M Maintenance Redesign $150M Distribution Platforms $100M Other Costs $125M • Mainline deliveries and large regional jets will facilitate retirement of 200 50 - seat regional jets • Lower material expense by capitalizing on market purchase and part - out opportunities • Improve processes and resource management • Increase delta.com channel share • Restructure commissions • Reduce merchant fees • Leverage size to improve supply chain expense • Improve network efficiency • Reduce transportation expense Staffing Efficiency $325M • Higher productivity levels through technology and improved staffing models 42
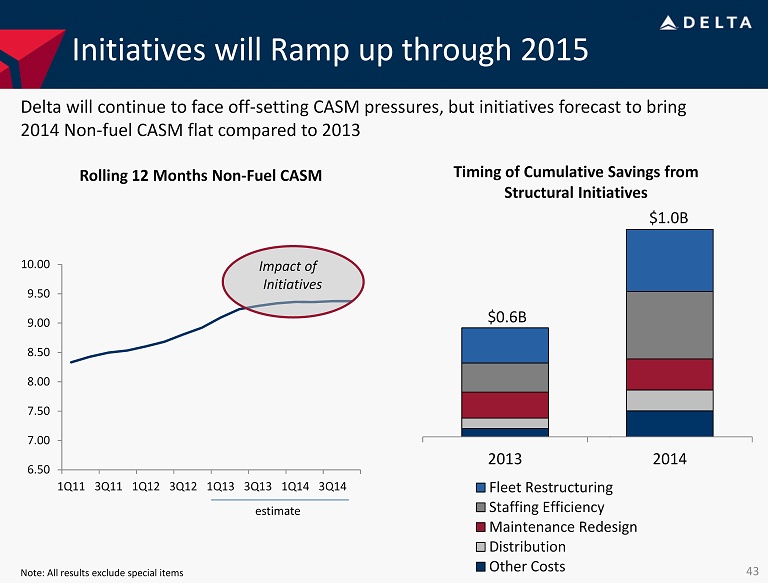
6.50 7.00 7.50 8.00 8.50 9.00 9.50 10.00 1Q11 3Q11 1Q12 3Q12 1Q13 3Q13 1Q14 3Q14 $0.6B $1.0B 2013 2014 Fleet Restructuring Staffing Efficiency Maintenance Redesign Distribution Other Costs Initiatives will Ramp up through 2015 Delta will continue to face off - setting CASM pressures, but initiatives forecast to bring 2014 Non - fuel CASM flat compared to 2013 Timing of Cumulative Savings from Structural Initiatives Rolling 12 Months Non - Fuel CASM Impact of Initiatives estimate 43 Note: All results exclude special items
Managing Fuel Expense to Reduce Risk Refinery Update Improved Fuel Management Unique approach to Delta’s number one input cost • Trainer refinery will produce a loss for the December quarter due to depressed gasoline crack spreads and Hurricane Sandy • Hurricane Sandy negatively impacted distribution out of refinery due to damage to infrastructure • Impact expected to mitigate by 1Q13 • Expect to achieve full run rate benefit of $300M (roughly 7 cents per gallon) in 2013 • Plant operations prior to Sandy would have produced $280 million of annual savings against 2012 crack spread • Fleet and operating investments contributing to 1% year - over - year improvement in fuel efficiency in 2012 • Refinery gives Delta leverage for fuel purchases, generating significant contractual savings • Exploring all opportunities for cost - effective crude oil sources, including domestic U.S. production 44
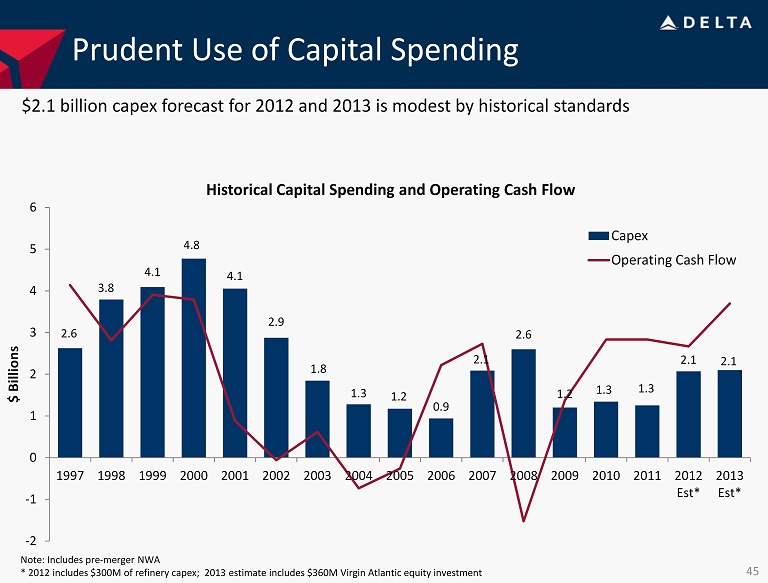
Prudent Use of Capital Spending $2.1 billion capex forecast for 2012 and 2013 is modest by historical standards 2.6 3.8 4.1 4.8 4.1 2.9 1.8 1.3 1.2 0.9 2.1 2.6 1.2 1.3 1.3 2.1 2.1 -2 -1 0 1 2 3 4 5 6 1997 1998 1999 2000 2001 2002 2003 2004 2005 2006 2007 2008 2009 2010 2011 2012 Est* 2013 Est* $ Billions Capex Operating Cash Flow Historical Capital Spending and Operating Cash Flow 45 Note: Includes pre - merger NWA * 2012 includes $300M of refinery capex ; 2013 estimate includes $360M Virgin Atlantic equity investment
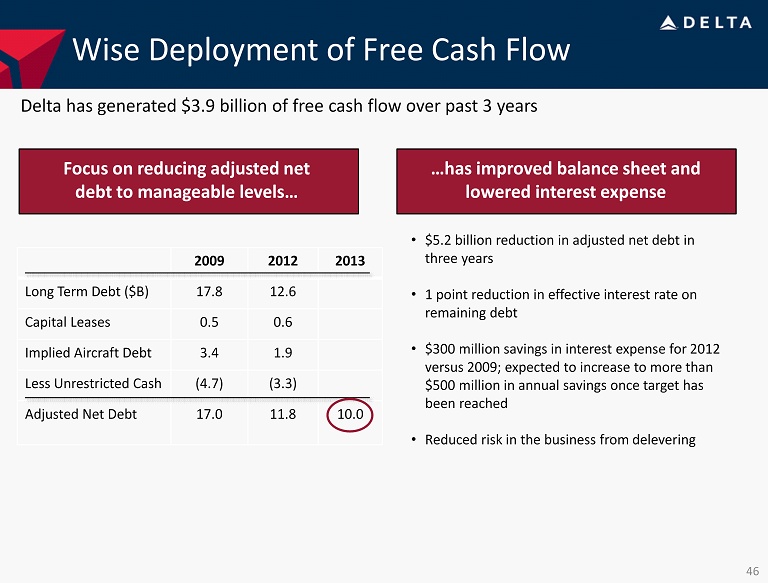
2009 2012 2013 Long Term Debt ($B) 17.8 12.6 Capital Leases 0.5 0.6 Implied Aircraft Debt 3.4 1.9 Less Unrestricted Cash (4.7) (3.3) Adjusted Net Debt 17.0 11.8 10.0 Wise Deployment of Free Cash Flow Focus on reducing adjusted net debt to manageable levels… Delta has generated $3.9 billion of free cash flow over past 3 years …has improved balance sheet and lowered interest expense • $5.2 billion reduction in adjusted net debt in three years • 1 point reduction in effective interest rate on remaining debt • $300 million savings in interest expense for 2012 versus 2009; expected to increase to more than $500 million in annual savings once target has been reached • Reduced risk in the business from delevering 46
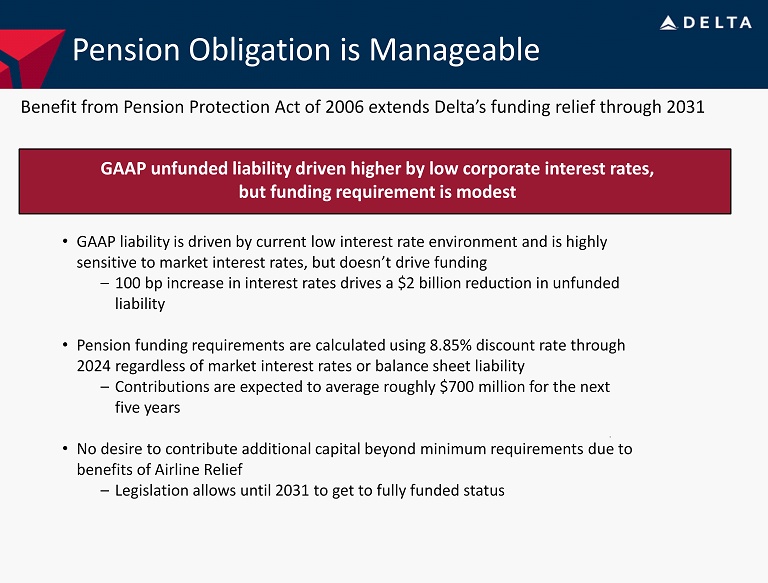
Pension Obligation is Manageable Benefit from Pension Protection Act of 2006 extends Delta’s funding relief through 2031 GAAP unfunded liability driven higher by low corporate interest rates, but funding requirement is modest • GAAP liability is driven by current low interest rate environment and is highly sensitive to market interest rates, but doesn’t drive funding – 100 bp increase in interest rates drives a $2 billion reduction in unfunded liability • Pension funding requirements are calculated using 8.85% discount rate through 2024 regardless of market interest rates or balance sheet liability – Contributions are expected to average roughly $700 million for the next five years • No desire to contribute additional capital beyond minimum requirements due to benefits of Airline Relief – Legislation allows until 2031 to get to fully funded status
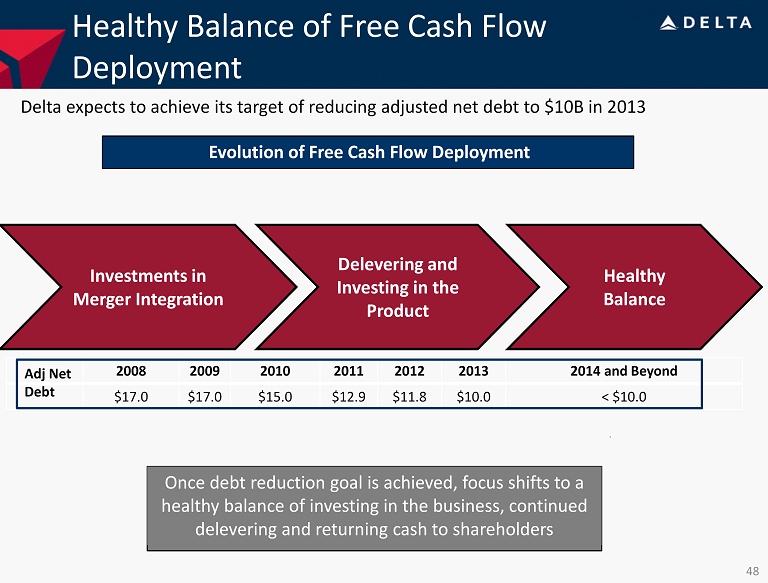
Healthy Balance of Free Cash Flow Deployment Delta expects to achieve its target of reducing adjusted net debt to $10B in 2013 Evolution of Free Cash Flow Deployment Investments in Merger Integration Delevering and Investing in the Product Healthy Balance Once debt reduction goal is achieved, focus shifts to a healthy balance of investing in the business, continued delevering and returning cash to shareholders 2008 2009 2010 2011 2012 2013 2014 and Beyond $17.0 $17.0 $15.0 $12.9 $11.8 $10.0 < $10.0 Adj Net Debt 48
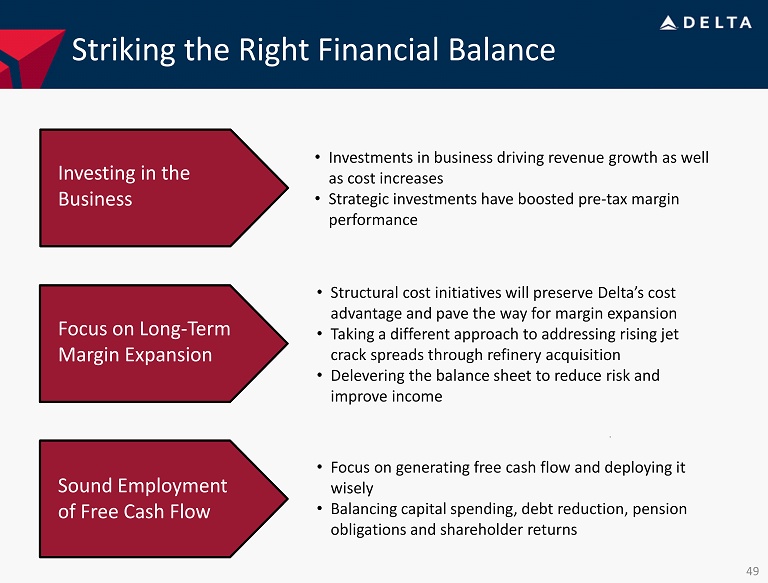
Striking the Right Financial Balance • Investments in business driving revenue growth as well as cost increases • Strategic investments have boosted pre - tax margin performance • Structural cost initiatives will preserve Delta’s cost advantage and pave the way for margin expansion • Taking a different approach to addressing rising jet crack spreads through refinery acquisition • Delevering the balance sheet to reduce risk and improve income • Focus on generating free cash flow and deploying it wisely • Balancing capital spending, debt reduction, pension obligations and shareholder returns Investing in the Business Focus on Long - Term Margin Expansion Sound Employment of Free Cash Flow 49
Non-GAAP Financial Measures
Delta sometimes uses information that is derived from our Consolidated Financial Statements, but that is not presented in accordance with accounting principles generally accepted in the U.S. (“GAAP”). Certain of this information is considered “non-GAAP financial measures” under the U.S. Securities and Exchange Commission rules. The non-GAAP financial measures may be considered in addition to results prepared in accordance with GAAP, but should not be considered a substitute for or superior to GAAP results.
Delta is unable to reconcile certain 2013 projections to GAAP, including projected non-fuel cost per available seat mile (CASM) and projected fuel price, as the nature or amount of special items cannot be estimated at this time.
Delta excludes special items because management believes the exclusion of these items is helpful to investors to evaluate the company’s recurring operational performance.
Delta adjusts for mark-to-market (MTM) adjustments for fuel hedges recorded in periods other than the settlement period in order to evaluate the company's financial results in the period shown.
Delta uses adjusted total debt, including aircraft rent, in addition to long-term adjusted debt and capital leases, to present estimated financial obligations. Delta reduces adjusted total debt by cash, cash equivalents and short-term investments, resulting in adjusted net debt, to present the amount of additional assets needed to satisfy the debt.
Delta presents CASM excluding fuel expense and related taxes because management believes the volatility in fuel prices impacts the comparability of year-over-year financial performance.
CASM excludes ancillary businesses not associated with the generation of a seat mile. These businesses include aircraft maintenance and staffing services Delta provides to third parties and Delta’s vacation wholesale operations.
Delta excludes profit sharing expense from CASM because management believes the exclusion of this item provides a more meaningful comparison of the company’s results to the airline industry and prior year results.
Delta presents free cash flow because management believes this metric is helpful to investors to evaluate the company’s ability to generate cash.
Delta presents net cash provided by operating activities because management adjusting for certain items is helpful to investors to evaluate the company’s operating activities.
Delta presents combined capital spending because management adjusting for certain items is helpful to investors to evaluate the company’s investing activities.
| Operating Cash Flow | | | | |
| | | | | |
| (in billions) | | Full Year 2012 Projection | | 2008 |
| Delta operating cash flow | | $ | 2.4 | | | $ | (1.7 | ) |
| SkyMiles used pursuant to advance purchase under AMEX agreement | | | 0.3 | | | | – | |
| Northwest operating cash flow | | | – | | | | 0.2 | |
| Net cash provided by operations, adjusted | | $ | 2.7 | | | $ | (1.5 | ) |
| Capital Spending | | | | |
| | | | | |
| (in billions) | | Full Year 2012 Projection | | Full Year
2008 |
| Delta capital expenditures (GAAP) | | $ | 2.0 | | | $ | 1.5 | |
| Northwest capital expenditures | | | – | | | | 1.1 | |
| Other | | | 0.1 | | | | – | |
| Total combined capital spending | | $ | 2.1 | | | $ | 2.6 | |
| Pre-Tax Income | | |
| | | |
| (in billions) | | Full Year 2012
Projection |
| Pre-tax income | | $ | 1.1 | |
| Items excluded: | | | | |
| MTM adjustments | | | (0.1 | ) |
| Restructuring and other items | | | 0.4 | |
| Loss on extinguishment of debt | | | 0.2 | |
| Pre-tax income excluding special items | | $ | 1.6 | |
| Pre-Tax Income | | |
| | | |
| | | Three Months Ended |
| | | December 31, 2012 |
| (in millions) | | Projection |
| Pre-tax income | | | $0 - $50 | |
| Items excluded: | | | | |
| Restructuring and other items | | | 100 | |
| Loss on extinguishment of debt | | | 100 | |
| Pre-tax income excluding special items | | | $200 - $250 | |
| Pre-Tax Margin |
| | | | | | | | | | | |
| | | Full Year 2012 Projection | | Full Year
2011 | | Full Year
2009 | | Full Year 2012 Projection vs. 2011 | | Full Year 2012 Projection vs. 2009 |
| Pre-tax margin | | | 3 | % | | | 2 | % | | | -6 | % | | | | | | | | |
| Item excluded: | | | | | | | | | | | | | | | | | | | | |
| Restructuring and other items | | | 1 | % | | | 1 | % | | | 2 | % | | | | | | | | |
| Pre-tax margin excluding special items | | | 4 | % | | | 3 | % | | | -4 | % | | | 1.0 | % | | | 8.1 | % |
| Free Cash Flow |
| | | | | | | | | | | | | |
| (in billions) | | Full Year 2012 Projection | | Full Year 2011 | | Full Year 2010 |
| Net cash provided by operating activities (GAAP) | | | | | | $ | 2.4 | | | | | | | $ | 2.8 | | | | | | | $ | 2.8 | |
| Net cash used in investing activities (GAAP) | | $ | (2.0 | ) | | | | | | $ | (1.5 | ) | | | | | | $ | (2.0 | ) | | | | |
| Adjustments: | | | | | | | | | | | | | | | | | | | | | | | | |
| Proceeds from sale of property and investments and other | | | – | | | | | | | | (0.7 | ) | | | | | | | – | | | | | |
| Purchase of short-term investments | | | – | | | | | | | | 1.0 | | | | | | | | 0.8 | | | | | |
| SkyMiles used pursuant to advance purchase under AMEX agreement | | | 0.3 | | | | | | | | – | | | | | | | | – | | | | | |
| Cash used in investing | | | | | | | (1.7 | ) | | | | | | | (1.2 | ) | | | | | | | (1.2 | ) |
| Total free cash flow | | | | | | $ | 0.7 | | | | | | | $ | 1.6 | | | | | | | $ | 1.6 | |
| Refinery and other | | | | | | | 0.3 | | | | | | | | | | | | | | | | | |
| Free cash flow excluding refinery | | | | | | $ | 1.0 | | | | | | | | | | | | | | | | | |
| Unit Cost |
| | | | | | | | | | | | | | | | | | | | | | |
| | | Full Year 2012 Projection | | | | Full Year 2011 | | | | LTM 3Q 2012 | | | | LTM 1Q 2011 | | | | LTM 4Q 2008 | | | |
| Unit Cost | | 14.91 | | ¢ | | 14.12 | | ¢ | | 14.68 | | ¢ | | 12.99 | | ¢ | | 19.40 | | ¢ | |
| Items excluded: | | | | | | | | | | | | | | | | | | | | | |
| Ancillary businesses | | (0.39 | ) | | | (0.37 | ) | | | (0.39 | ) | | | (0.29 | ) | | | (0.48 | ) | | |
| Profit sharing | | (0.16 | ) | | | (0.11 | ) | | | (0.17 | ) | | | (0.13 | ) | | | – | | | |
| Restructuring and other items | | (0.17 | ) | | | (0.10 | ) | | | (0.18 | ) | | | (0.17 | ) | | | (0.59 | ) | | |
| MTM adjustments for fuel hedges recorded in periods other than the settlement period | | 0.04 | | | | (0.01 | ) | | | 0.08 | | | | 0.01 | | | | (0.17 | ) | | |
| Impairment of goodwill and other assets | | – | | | | – | | | | – | | | | – | | | | (4.79 | ) | | |
| Aircraft fuel and related taxes | | (5.31 | ) | | | (5.00 | ) | | | (5.21 | ) | | | (4.08 | ) | | | (5.39 | ) | | |
| Non-Fuel Unit Cost excluding special items | | 8.92 | | ¢ | | 8.53 | | ¢ | | 8.81 | | ¢ | | 8.33 | | ¢ | | 7.98 | | ¢ | |
| Unit Cost |
| | | | |
| | Three Months Ended
December 31, 2012
Projection |
| Unit Cost | | | 11 - 12 | | % |
| Items excluded: | | | | | |
| Profit sharing | | | 1 | | % |
| MTM adjustments for fuel hedges recorded in periods other than the settlement period | | | (2 | ) | % |
| Aircraft fuel and related taxes | | | (5 | ) | % |
| Non-Fuel Unit Cost excluding special items | | | 5 to 6 | | % |
| Adjusted Net Debt |
| | | | | | | | | | | | | | | | | | | | | |
| (in billions) | | December 31, 2012 Projection | | December 31,
2011 | | December 31,
2010 | | December 31,
2009 | | December 31,
2008 |
| Debt and capital lease obligations | | $ | 12.7 | | | | | | | $ | 13.8 | | | | | | | $ | 15.3 | | | | | | | $ | 17.2 | | | | | | | $ | 16.6 | | | | | |
| Plus: unamortized discount, net from purchase accounting and fresh start reporting | | | 0.5 | | | | | | | | 0.6 | | | | | | | | 0.6 | | | | | | | | 1.1 | | | | | | | | 1.5 | | | | | |
| Adjusted debt and capital lease obligations | | | | | | $ | 13.2 | | | | | | | $ | 14.4 | | | | | | | $ | 15.9 | | | | | | | $ | 18.3 | | | | | | | $ | 18.1 | |
| Plus: 7x last twelve months' aircraft rent | | | | | | | 1.9 | | | | | | | | 2.1 | | | | | | | | 2.7 | | | | | | | | 3.4 | | | | | | | | 3.4 | |
| Adjusted total debt | | | | | | | 15.1 | | | | | | | | 16.5 | | | | | | | | 18.6 | | | | | | | | 21.7 | | | | | | | | 21.5 | |
| Less: cash, cash equivalents and short-term investments | | | | | | | (3.3 | ) | | | | | | | (3.6 | ) | | | | | | | (3.6 | ) | | | | | | | (4.7 | ) | | | | | | | (4.5 | ) |
| Adjusted net debt | | | | | | $ | 11.8 | | | | | | | $ | 12.9 | | | | | | | $ | 15.0 | | | | | | | $ | 17.0 | | | | | | | $ | 17.0 | |