Exhibit 99.1
Transformation Plan Edward H. Bastian October 19, 2005
2 This presentation contains various forward-looking statements which represent the company’s estimates or expectations regarding future events. All forward-looking statements involve a number of risks and uncertainties that could cause the actual results to differ materially from the projected results. Additional information is contained in Delta's Securities and Exchange Commission filings, including its Form 10-Q filed with the SEC on August 15, 2005 and its Forms 8-K filed subsequent to its Chapter 11 filing. Caution should be taken not to place undue reliance on Delta's forward-looking statements, which represent Delta's views only as of the date of this presentation, and which Delta has no current intention to update. In this presentation, we will discuss certain non-GAAP financial measures in talking about our company’s performance. You can find the reconciliation of those measures to comparable GAAP measures on our Investor Relations website at delta.com. Safe Harbor
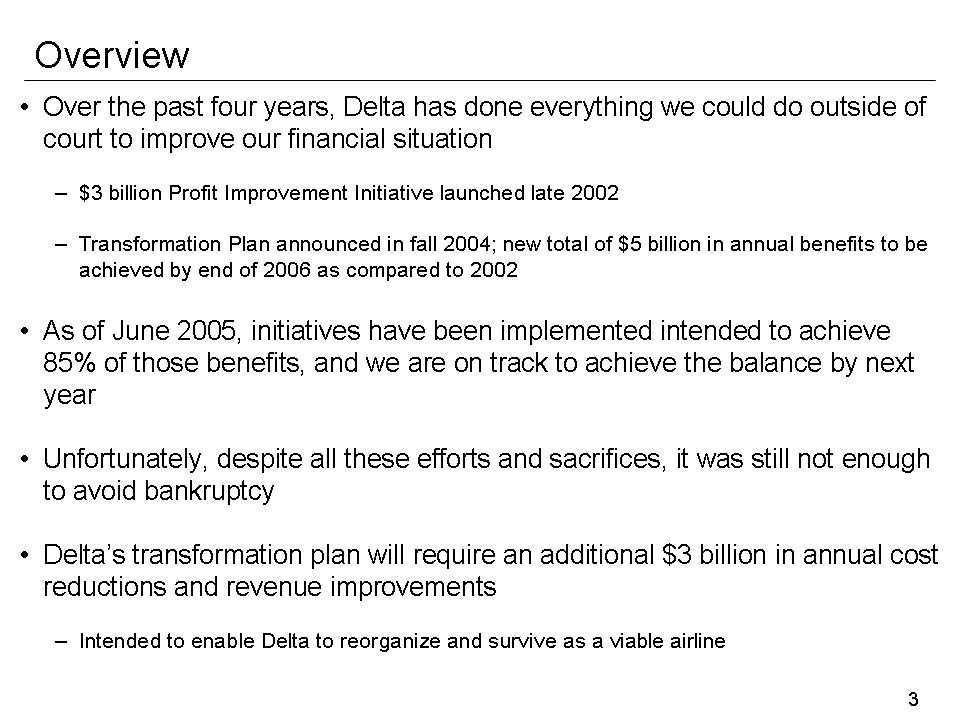
3 Overview • Over the past four years, Delta has done everything we could do outside of court to improve our financial situation-$3 billion Profit Improvement Initiative launched late 2002-Transformation Plan announced in fall 2004; new total of $5 billion in annual benefits to be achieved by end of 2006 as compared to 2002 • As of June 2005, initiatives have been implemented intended to achieve 85% of those benefits, and we are on track to achieve the balance by next year • Unfortunately, despite all these efforts and sacrifices, it was still not enough to avoid bankruptcy • Delta’s transformation plan will require an additional $3 billion in annual cost reductions and revenue improvements-Intended to enable Delta to reorganize and survive as a viable airline
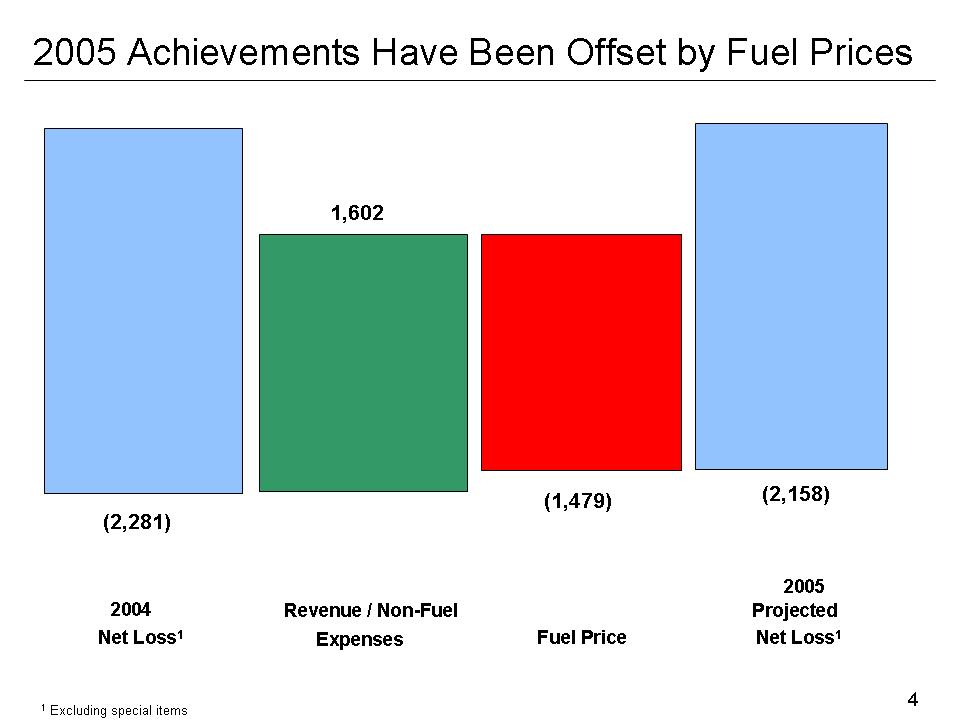
4 (2,281) 2005 Projected Net Loss1Revenue / Non-Fuel Expenses Fuel Price 2004 Net Loss1(1,479) 1,602 (2,158 )2005 Achievements Have Been Offset by Fuel Prices 1 Excluding special items
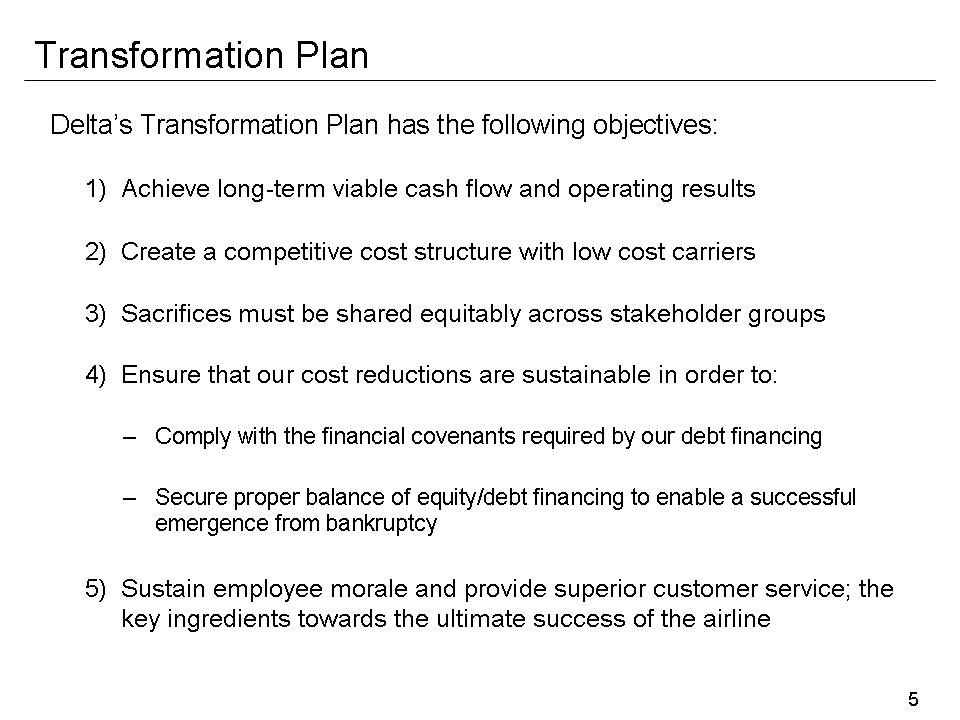
5 Transformation Plan Delta’s Transformation Plan has the following objectives:1) Achieve long-term viable cash flow and operating results 2) Create a competitive cost structure with low cost carriers 3) Sacrifices must be shared equitably across stakeholder groups 4) Ensure that our cost reductions are sustainable in order to: - Comply with the financial covenants required by our debt financing-Secure proper balance of equity/debt financing to enable a successful emergence from bankruptcy 5) Sustain employee morale and provide superior customer service; the key ingredients towards the ultimate success of the airline
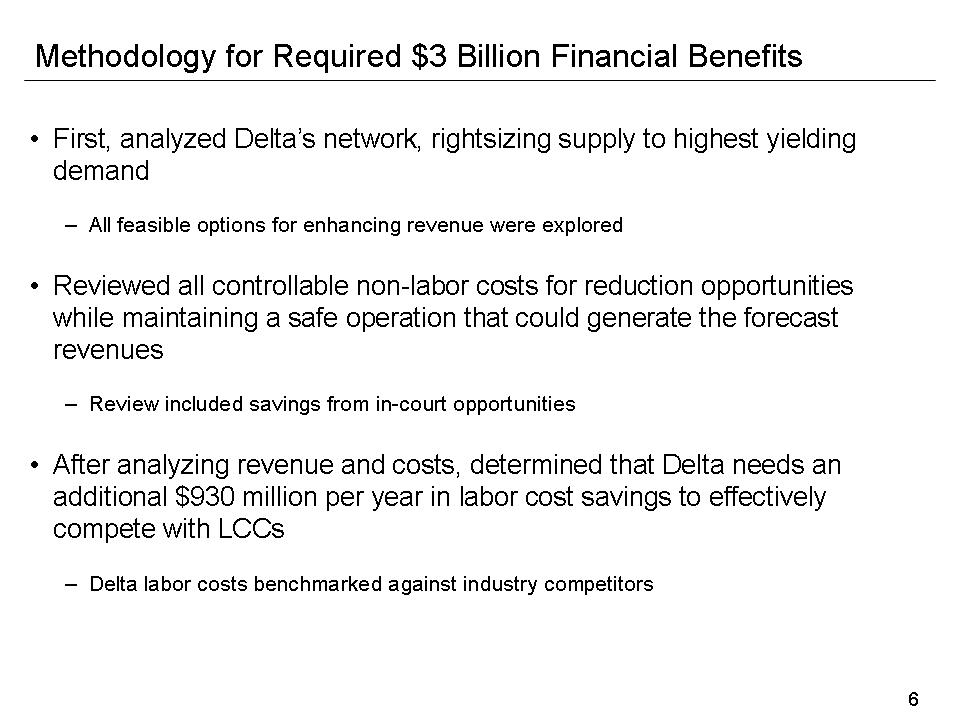
6 Methodology for Required $3 Billion Financial Benefits • First, analyzed Delta’s network, rightsizing supply to highest yielding demand-All feasible options for enhancing revenue were explored • Reviewed all controllable non-labor costs for reduction opportunities while maintaining a safe operation that could generate the forecast revenues-Review included savings from in-court opportunities • After analyzing revenue and costs, determined that Delta needs an additional $930 million per year in labor cost savings to effectively compete with LCCs-Delta labor costs benchmarked against industry competitors
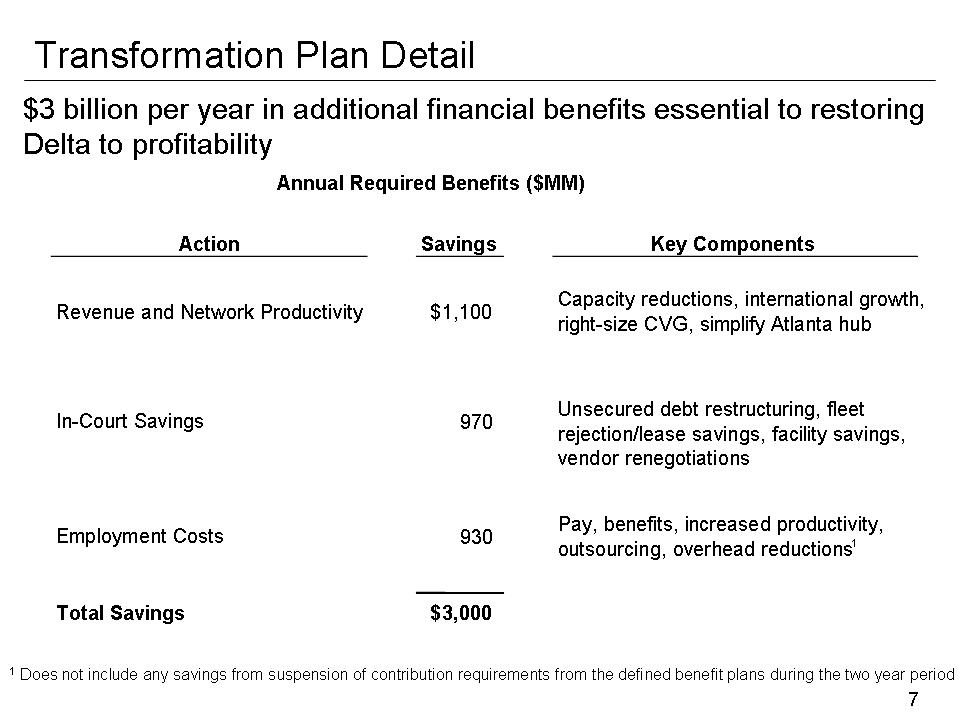
7 Transformation Plan Detail1Does not include any savings from suspension of contribution requirements from the defined benefit plans during the two year period$3 billion per year in additional financial benefits essential to restoring Delta to profitability1SavingsKey Components1,100$Capacity reductions, international growth, right-size CVG, simplify Atlanta hub970 Unsecured debt restructuring, fleet rejection/lease savings, facility savings, vendor renegotiations930 Pay, benefits, increased productivity, outsourcing, overhead reductions3,000$Annual Required Benefits ($MM)Action Total Savings Revenue and Network Productivity In-Court Savings Employment Costs
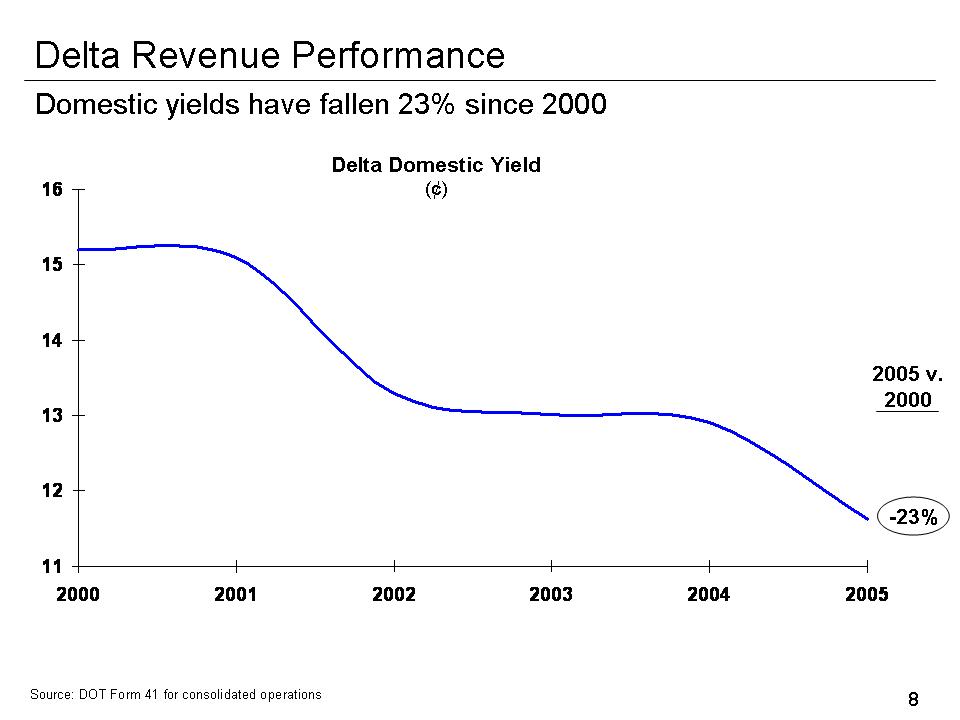
8 Delta Revenue Performance 11 12 13 14 15 16 2000 2001 2002 2003 2004 2005-23% Delta Domestic Yield(¢)Source: DOT Form 41 for consolidated operations Domestic yields have fallen 23% since 2000 2005 v.2000
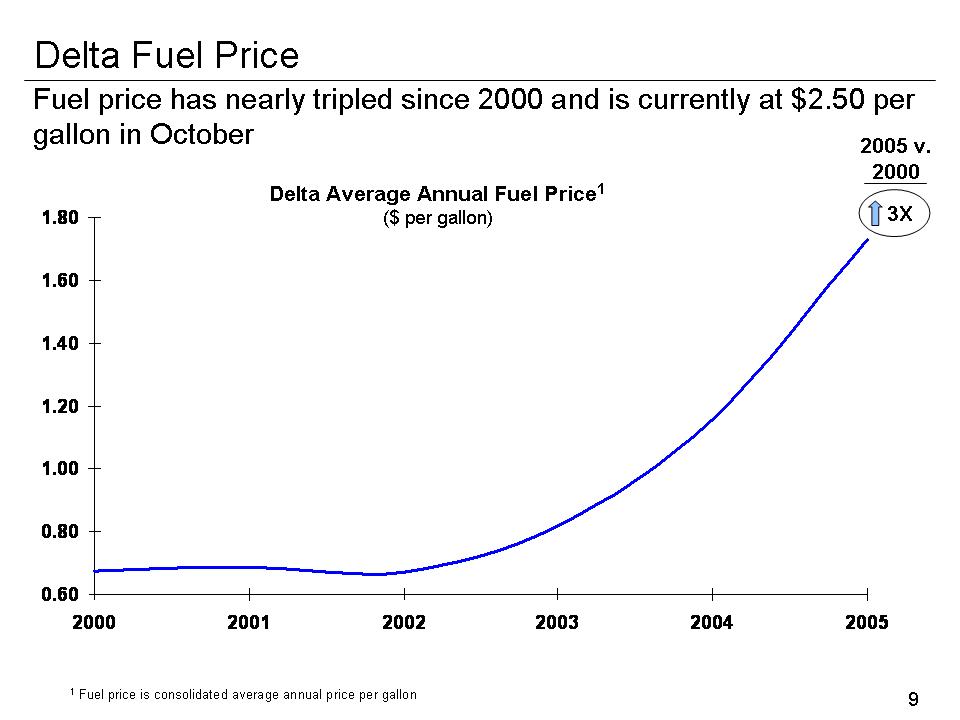
9 Delta Fuel Price 0.60 0.80 1.00 1.20 1.40 1.60 1.80 2000 2001 2002 2003 2004 2005 Delta Average Annual Fuel Price 1 ($ per gallon) 1 Fuel price is consolidated average annual price per gallon Fuel price has nearly tripled since 2000 and is currently at $2.50 per gallon in October 2005 v.2000 3X
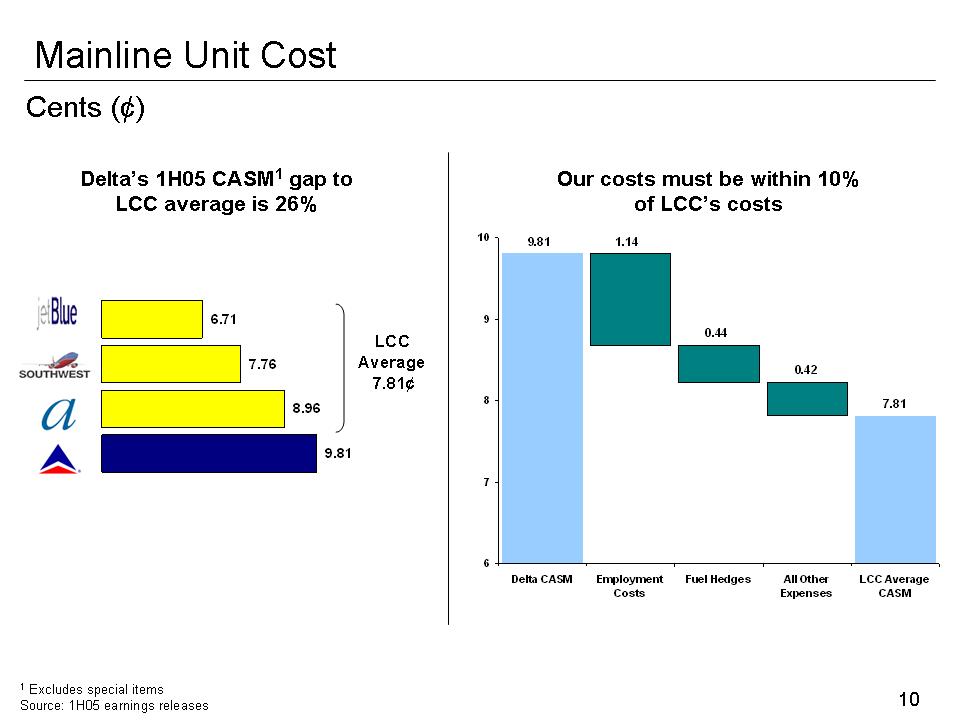
109.818.967.766.71Mainline Unit Cost LCC Average 7.81¢Cents (¢)Delta’s 1H05 CASM1gap to LCC average is 26% 1Excludes special items Source: 1H05 earnings releases Our costs must be within 10% of LCC’s costs 7.81 9.81 1.14 0.44 0.42 6 7 8 9 10Delta CASM Employment Cost Fuel Hedges All Other Expenses LCC Average CASM Jetblue southwest a
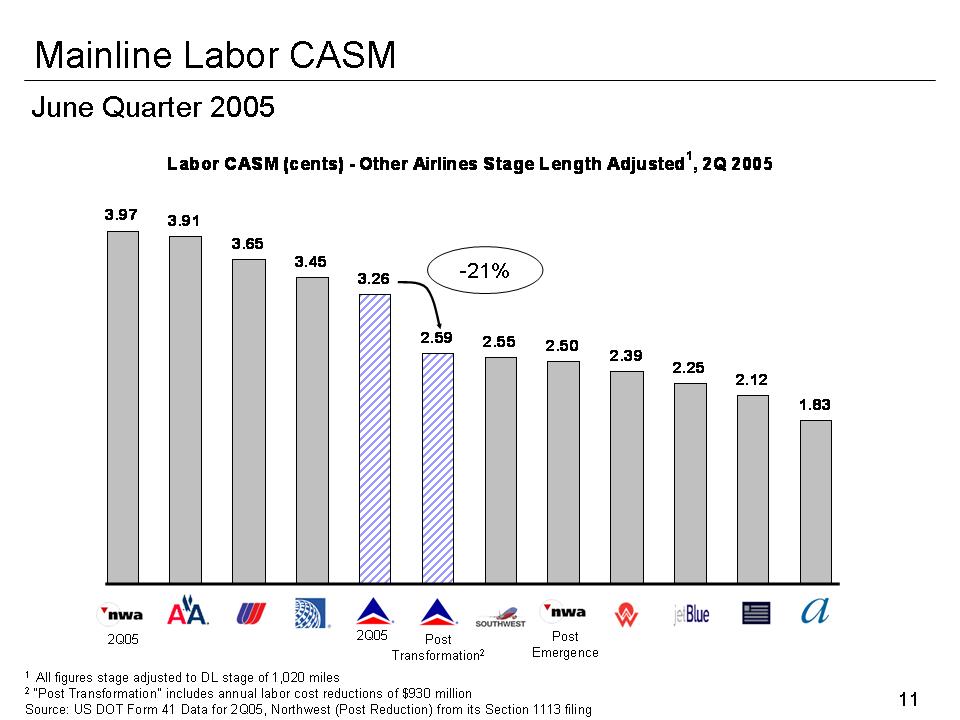
Labor CASM (cents) - Other Airlines Stage Length Adjusted 1, 2Q 2005 3.97 3.91 3.65 3.45 3.26 2.59 2.55 2.50 2.39 2.25 2.12 1.83 June Quarter 2005 Mainline Labor CASM-21%
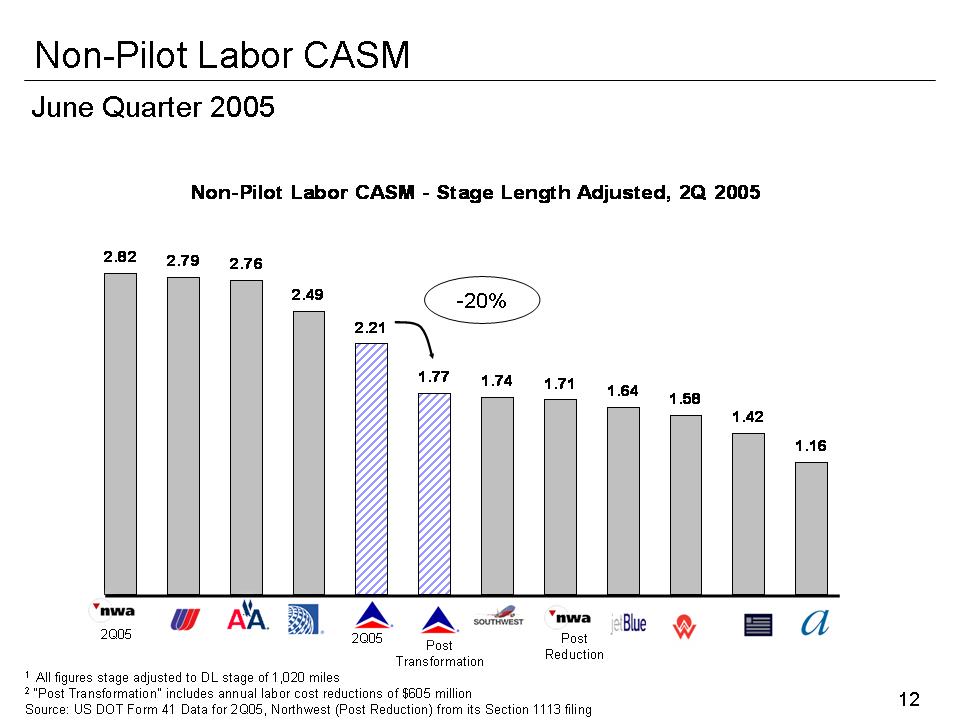
Non-Pilot Labor CASM - Stage Length Adjusted, 2Q 2005 2.82 2.79 2.76 2.49 2.21 1.77 1.74 1.71 1.64 1.58 1.42 1.16 June Quarter 2005 Non-Pilot Labor CASM-20%
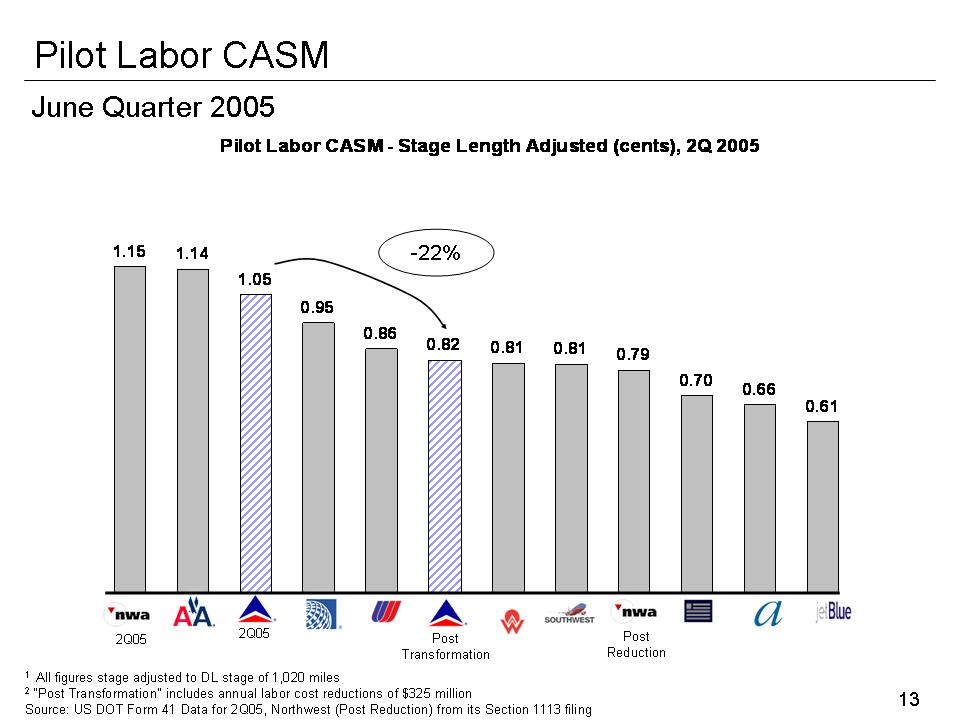
Pilot Labor CASM - Stage Length Adjusted (cents), 2Q 2005 1.15 1.14 1.05 0.95 0.86 0.82 0.81 0.81 0.79 0.70 0.66 0.61 June Quarter 2005 Pilot Labor CASM-22%
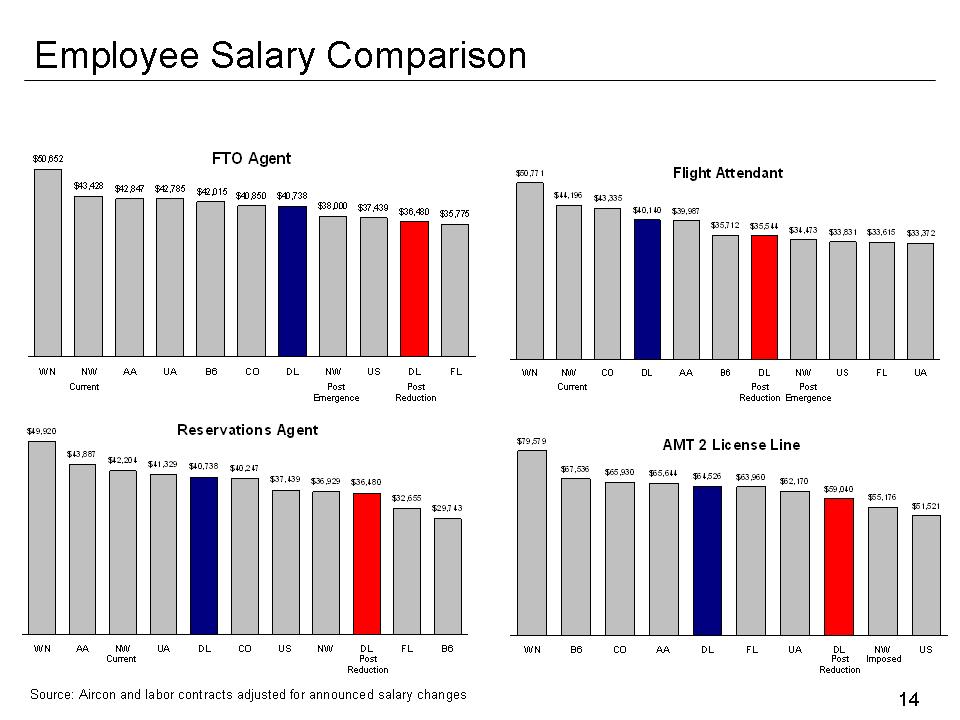
14 Employee Salary Comparison Source: Aircon and labor contracts adjusted for announced salary changes FTO Agent $50,652 $43,428 $42,847 $42,785 $42,015 $40,850 $40,738 $38,000 $37,439 $36,480 $35,775 WN NW AA UA B6 CO DL NW US DL FL Flight Attendant $50,771 $44,196 $43,335 $40,140 $39,987 $35,712 $35,544 $34,473 $33,831 $33,615 $33,372 WN NW CO DL AA B6 DL NW US FL UA Reservations Agent $49,920 $43,887 $42,204 $41,329 $40,738 $40,247 $37,439 $36,929 $36,480 $32,655 $29,743 WN AA NW UA DL CO US NW DL FL B6 AMT 2 License Line $79,579 $67,536 $65,930 $65,644 $64,526 $63,960 $62,170 $59,040 $55,176 $51,521 WN B6 CO AA DL FL UA DL NW US Current Current Post Emergence Post Emergence Post Reduction Current Imposed Post Reduction Post Reduction Post Reduction
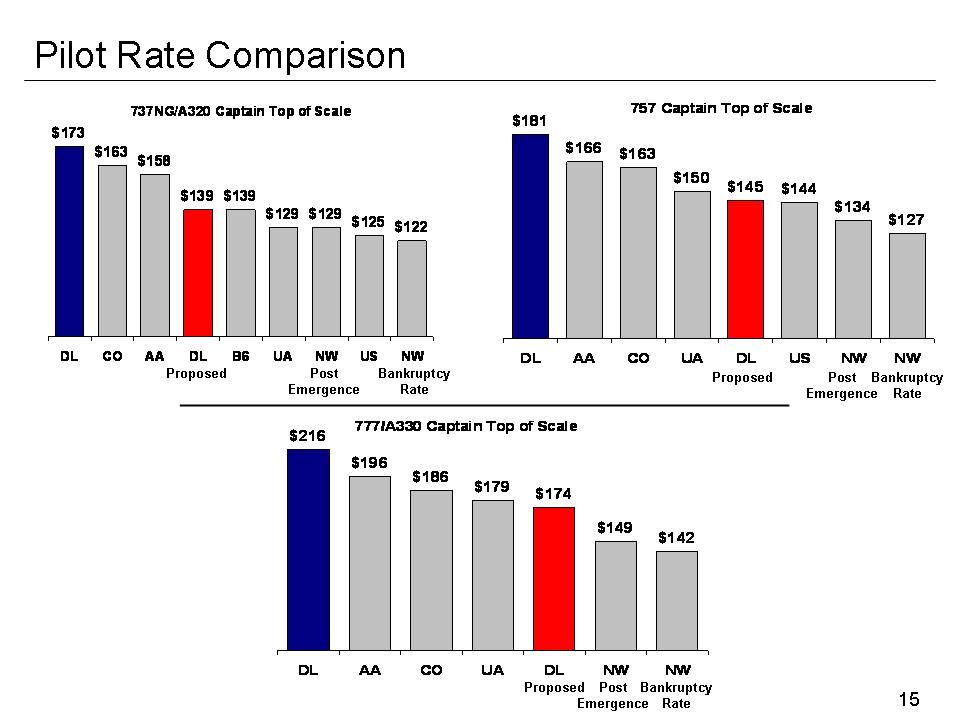
15 Pilot Rate Comparison Post Emergence Bankruptcy Rate Proposed Post Emergence Bankruptcy RateProposed737NG/A320 Captain Top of Scale $173 $163 $158 $139 $139 $129 $129 $125 $122 DL CO AA DL B6 UA NW US NW 757 Captain Top of Scale $181 $166 $163 $150 $145 $144 $134 $127 DL AA CO UA DL US NW NW 777/A330 Captain Top of Scale$216$196$186$179$174$149$142DLAACOUADLNWNWPost Emergence Bankruptcy Rate Proposed
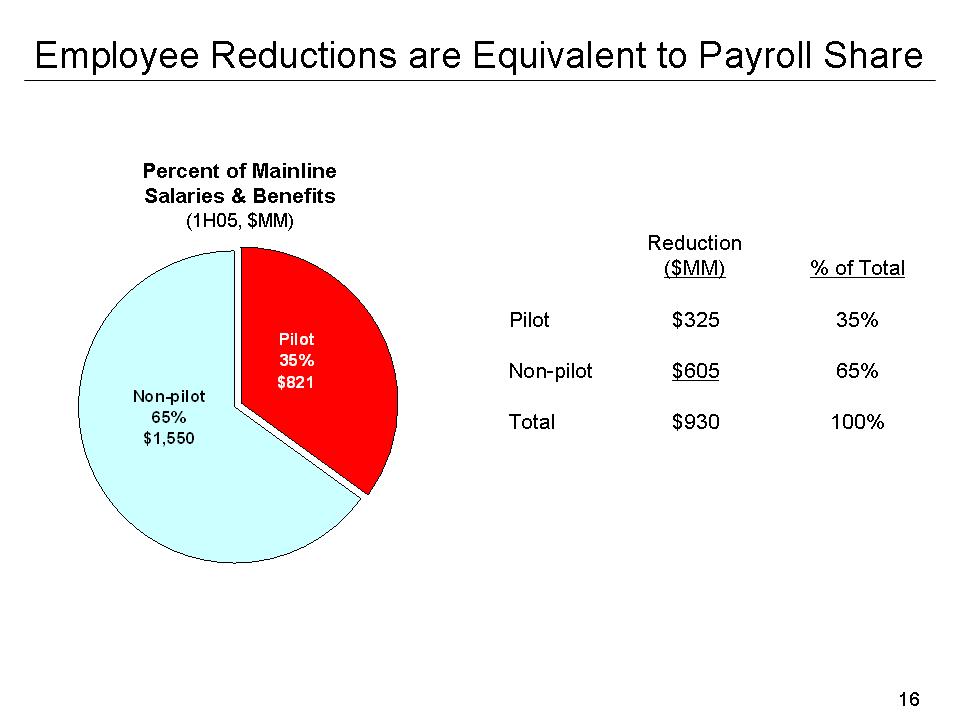
16 Employee Reductions are Equivalent to Payroll Share Pilot 35% $821 Non-pilot 65% $1,550 Reduction ($MM)% of Total Pilot $325 35% Non-pilot $605 65% Total $930 100% Percent of Mainline Salaries & Benefits(1H05, $MM)
17 Debtor-in-Possession Financing • Delta faced a near-term cash crisis prior to DIP financing • DIP financing of $2.2 billion has been secured-Led by General Electric, Morgan Stanley and American Express-Represents $1.2 billion of incremental liquidity after payoff of existing loans • In return for their commitment of fresh capital, Delta must comply with financial covenants-EBITDAR, minimum liquidity balances and capital spending limits • Financing will provide Delta the ability to restructure but needs to be conservatively managed
18 Timing is Critical • Operating losses must be stopped quickly -borrowed money cannot fund continued losses-Continued availability of DIP financing depends on meaningfully and promptly demonstrating our ability to turn the company around in short amount of time • Need to achieve necessary cost reductions in a timely manner clearly illustrated by unrelenting pressure of high crude oil and refining costs-October fuel forecast at $105 per barrel; fuel cost accounts for over 40% of Delta’s revenue for the month • Inevitable that there will be other unforeseen challenges to our Transformation Plan before we emerge from bankruptcy
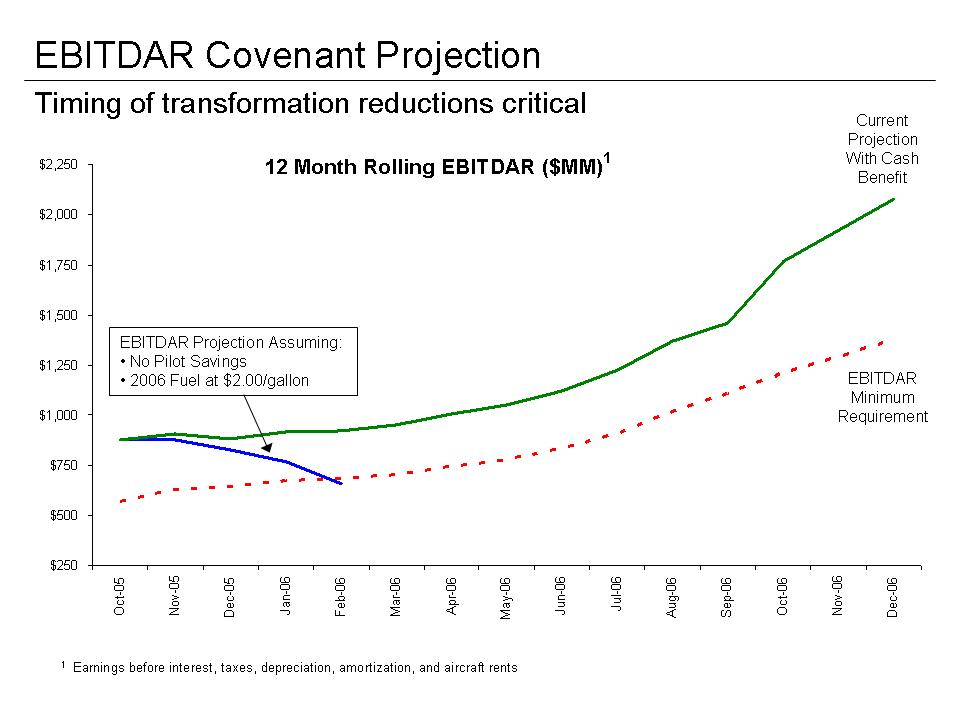
$250 $500 $750 $1,000 $1,250 $1,500 $1,750 $2,000 $2,250 Oct-05 Nov-05 Dec-05 Jan-06 Feb-06 Mar-06 Apr-06 May-06 Jun-06 Jul-06 Aug-06 Sep-06 Oct-06 Nov-06 Dec-06 EBITDAR Covenant Projection Timing of transformation reductions critical 12 Month Rolling EBITDAR ($MM)11 Earnings before interest, taxes, depreciation, amortization, and aircraft rents EBITDAR Minimum Requirement Current Projection With Cash Benefit EBITDAR Projection Assuming: • No Pilot Savings•2006 Fuel at $2.00/gallon
20 Summary • Delta has made tremendous progress to date in its bid to transform itself, but this progress has been masked by fuel price increases • $3 billion per year of new benefits in the Transformation Plan will be painful but are imperative to survive in today’s intensely competitive environment - Sacrifice will be equitable across stakeholder groups • While the current environment requires sacrifices, it is our only course of action - Time is of the essence • Our efforts today are intended to ensure a strong and secure tomorrow
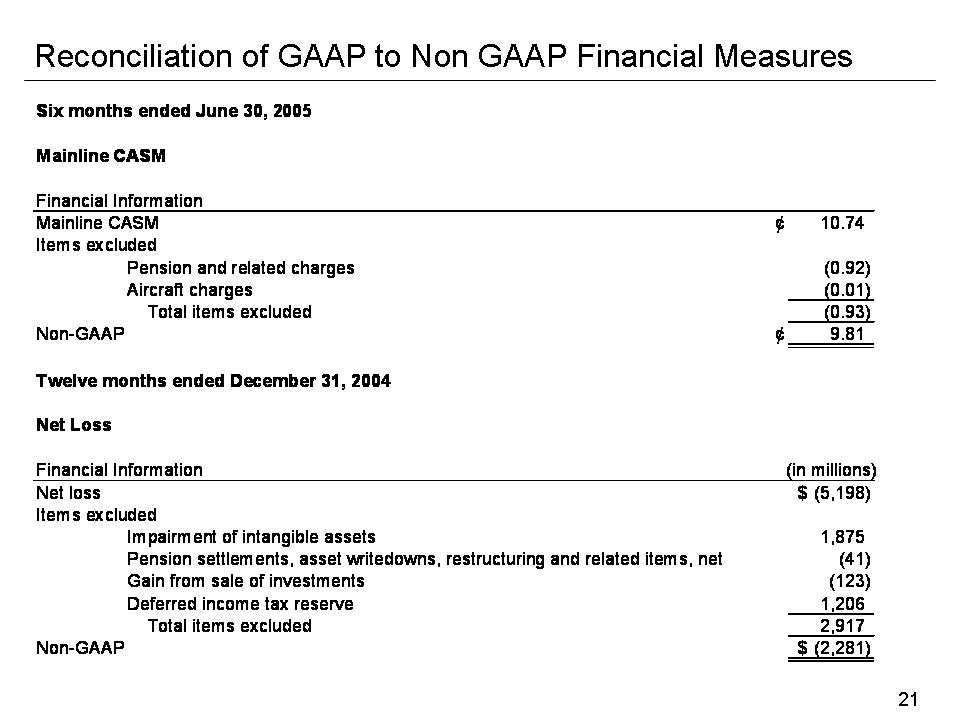
21 Reconciliation of GAAP to Non GAAP Financial Measures Six months ended June 30, 2005 Mainline CASM Financial Information Mainline CASM¢ 10.74 Items excluded Pension and related charges (0.92) Aircraft charges(0.01) Total items excluded (0.93) Non-GAAP ¢9.81 Twelve months ended December 31, 2004 Net Loss Financial Information(in millions)Net loss (5,198) $ Items excluded Impairment of intangible assets1,875 Pension settlements, asset writedowns, restructuring and related items, net(41) Gain from sale of investments(123) Deferred income tax reserve1,206 Total items excluded2,917 Non-GAAP (2,281) $