EXHIBIT 99.2
Delta Air Lines -Plan of Reorganization December 19, 2006
Safe Harbor This presentation contains various forward-looking statements which represent the company’s estimates or expectations regarding future events. All forward-looking statements involve a number of risks and uncertainties that could cause the actual results to differ materially from the projected results. Additional information is contained in Delta's Securities and Exchange Commission filings, including its Form 10-K filed with the SEC on March 27, 2006 and its Form 10-Q filed on November 9, 2006. Caution should be taken not to place undue reliance on Delta's forward-looking statements, which represent Delta's views only as of the date of this presentation, and which Delta has no current intention to update In this presentation, we will discuss certain non-GAAP financial measures in talking about our company’s performance. You can find the reconciliation of those measures to comparable GAAP measures in the appendix of this presentation. None of the statements contained herein are a solicitation of votes for or against any plan of reorganization. Any such solicitation shall only be made through a disclosure statement approved by Bankruptcy Court pursuant to section 1125 of the Bankruptcy Code.
Agenda • Opening Statement Jerry Grinstein • Transformation Overview Ed Bastian • Financial Plan Ed Bastian • Business Strategy Jim Whitehurst • Response to US Airways proposal Jerry Grinstein
Transformation Overview Ed Bastian Chief Financial Officer
Standalone Plan Creates Significant Value • In the past 15 months, Delta has delivered on its commitments-Created financial stability-Transformed business model • Plan of reorganization positions Delta as a strong competitor on a standalone basis • Performance achieved through best-in-class CASM performance, coupled with dramatic improvement in unit revenues • Result is a plan that creates substantial value for our creditors and future shareholders • The value of the standalone plan is far superior to that offered by US Airways-Delta’s Board of Directors has rejected the US Airways’ proposal
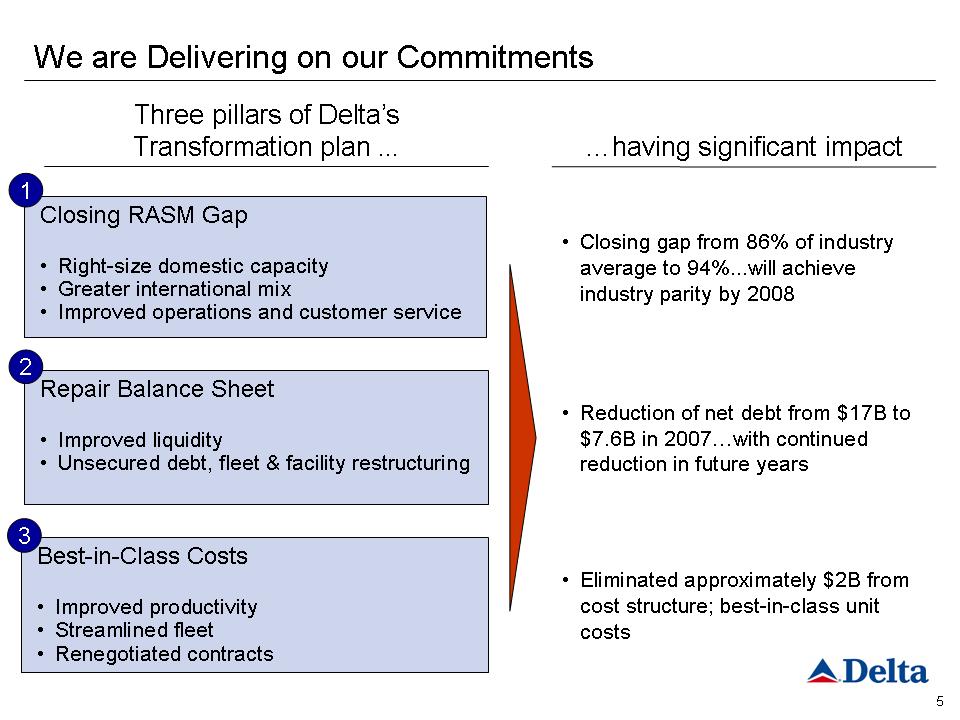
We are Delivering on our Commitments …having significant impact Three pillars of Delta’s Transformation plan ... Closing RASM Gap • Right-size domestic capacity • Greater international mix • Improved operations and customer service 1 Repair Balance Sheet • Improved liquidity • Unsecured debt, fleet & facility restructuring 2 Best-in-Class Costs • Improved productivity • Streamlined fleet • Renegotiated contracts 3 • Closing gap from 86% of industry average to 94%...will achieve industry parity by 2008 • Reduction of net debt from $17B to $7.6B in 2007…with continued reduction in future years • Eliminated approximately $2B from cost structure; best-in-class unit costs
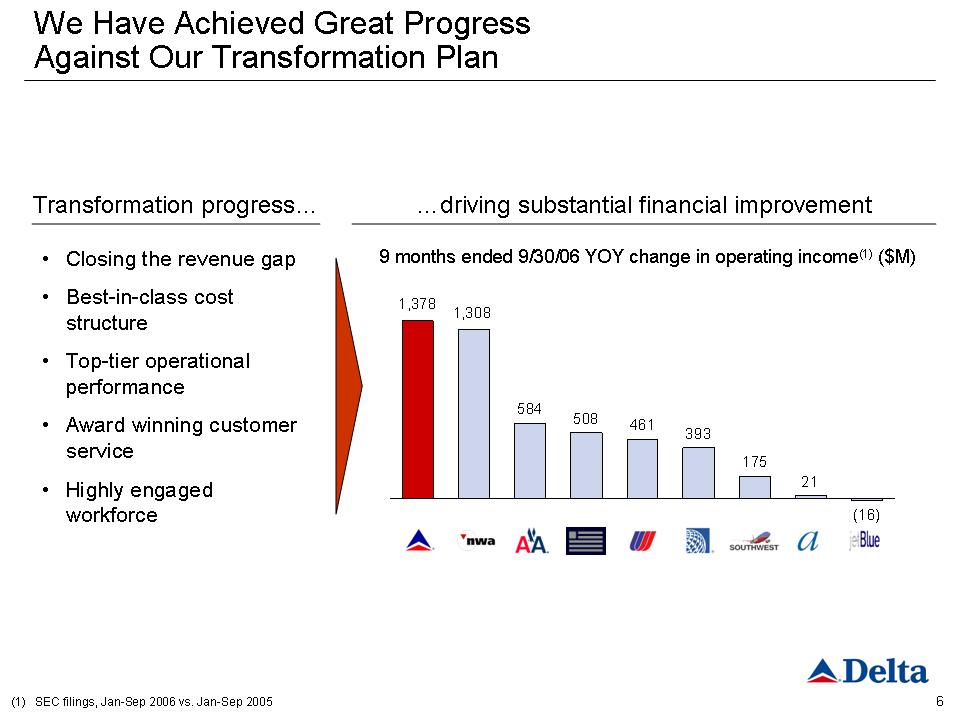
6 Transformation progress…• Closing the revenue gap • Best-in-class cost structure • Top-tier operational performance • Award winning customer service • Highly engaged workforce…driving substantial financial improvement9 months ended 9/30/06 YOY change in operating income(1)($M)We Have Achieved Great Progress Against Our Transformation Plan (1) SEC filings, Jan-Sep 2006 vs. Jan-Sep 2005 584 508 461 393 175 21 (16) 1,308 1,378
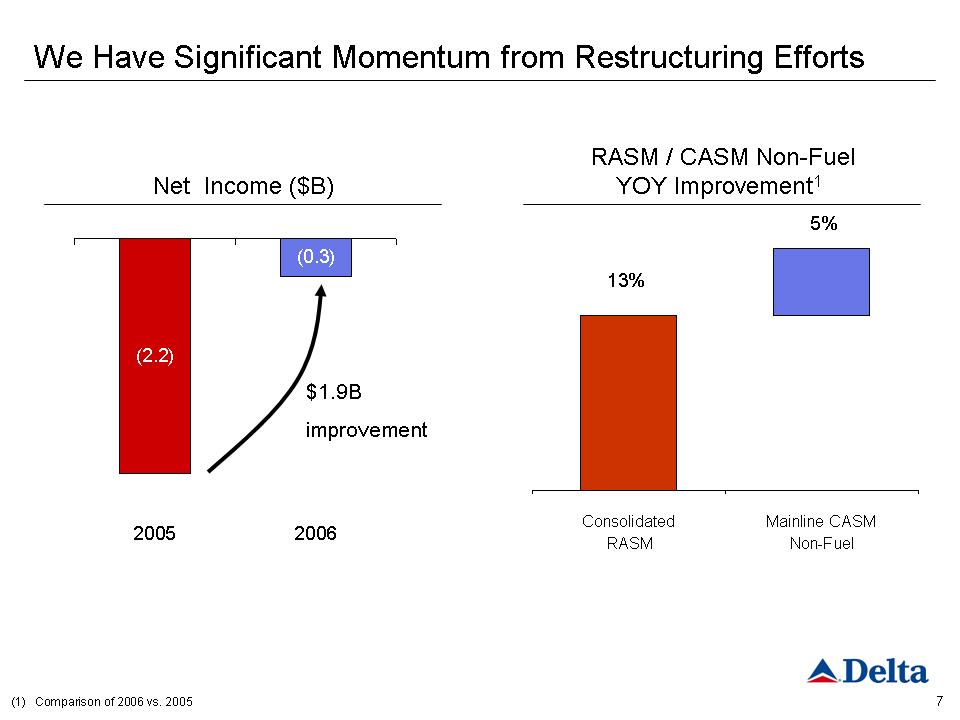
We Have Significant Momentum from Restructuring Efforts Net Income ($B)$1.9B improvement RASM / CASM Non-Fuel YOY Improvement1Consolidated RASM Mainline CASM Non-Fuel 13% 5% (1) Comparison of 2006 vs. 2005 (2.2) (0.3) 2005 2006
Financial Strategy Ed Bastian Chief Financial Officer
Positioning Delta for the Future • Achieving superior margins through best-in-class unit cost structure and continued revenue momentum • Strategy balances long-term operating growth with overall credit improvement-Overall debt reduction of 50% from pre-petition levels • Retains sufficient financial liquidity to weather industry volatility-Company’s operations produce sufficient cash flow to support overall debt levels and reinvest in the business • Continuing commitment to unlock shareholder value
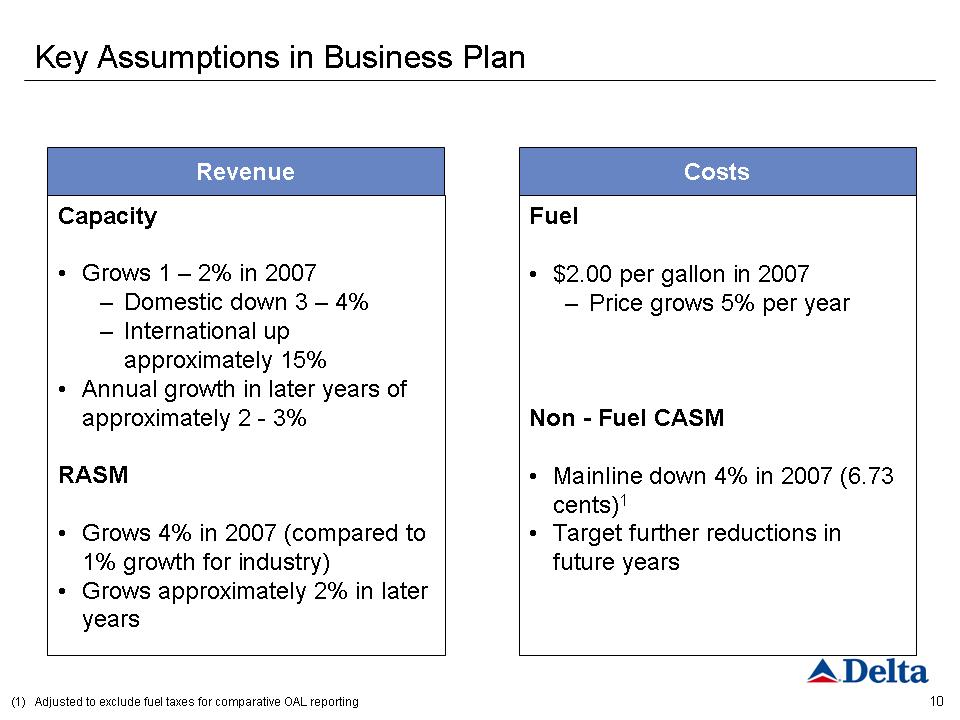
10 Key Assumptions in Business Plan (1) Adjusted to exclude fuel taxes for comparative OAL reporting Fuel • $2.00 per gallon in 2007-Price grows 5% per year Non -Fuel CASM • Mainline down 4% in 2007 (6.73 cents) 1 • Target further reductions in future years Costs Revenue Capacity • Grows 1 -2% in 2007-Domestic down 3 -4%-International up approximately 15% • Annual growth in later years of approximately 2 -3% RASM • Grows 4% in 2007 (compared to 1% growth for industry) • Grows approximately 2% in later years
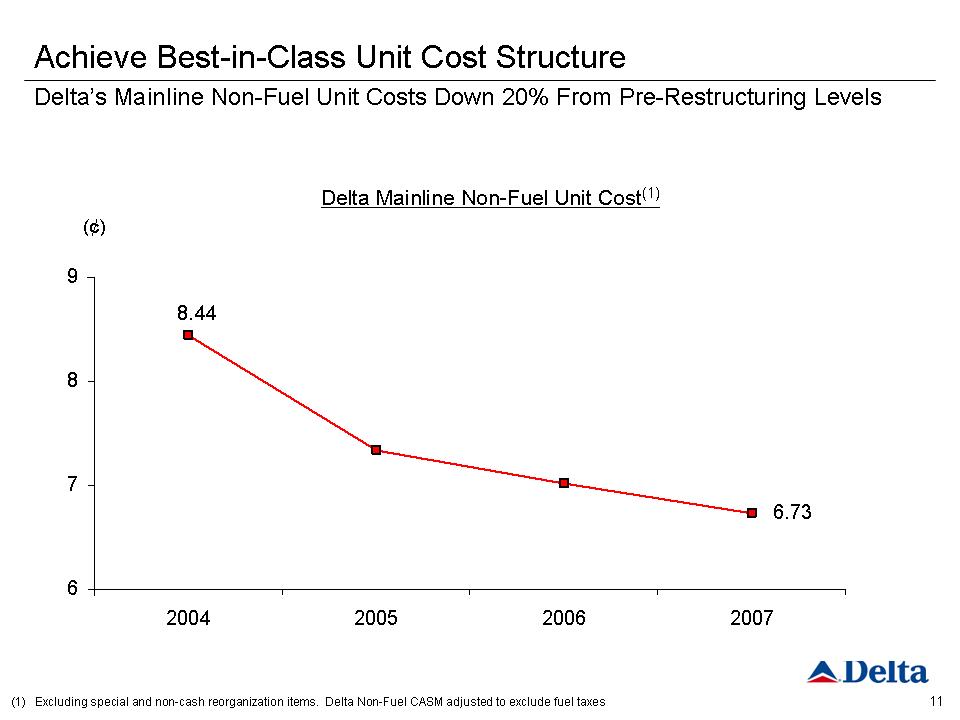
Achieve Best-in-Class Unit Cost Structure Delta’s Mainline Non-Fuel Unit Costs Down 20% From Pre-Restructuring Levels Delta Mainline Non-Fuel Unit Cost (1) (¢) (1) Excluding special and non-cash reorganization items. Delta Non-Fuel CASM adjusted to exclude fuel taxes 8.44 6.73 6 7 8 9 2004 2005 2006 2007
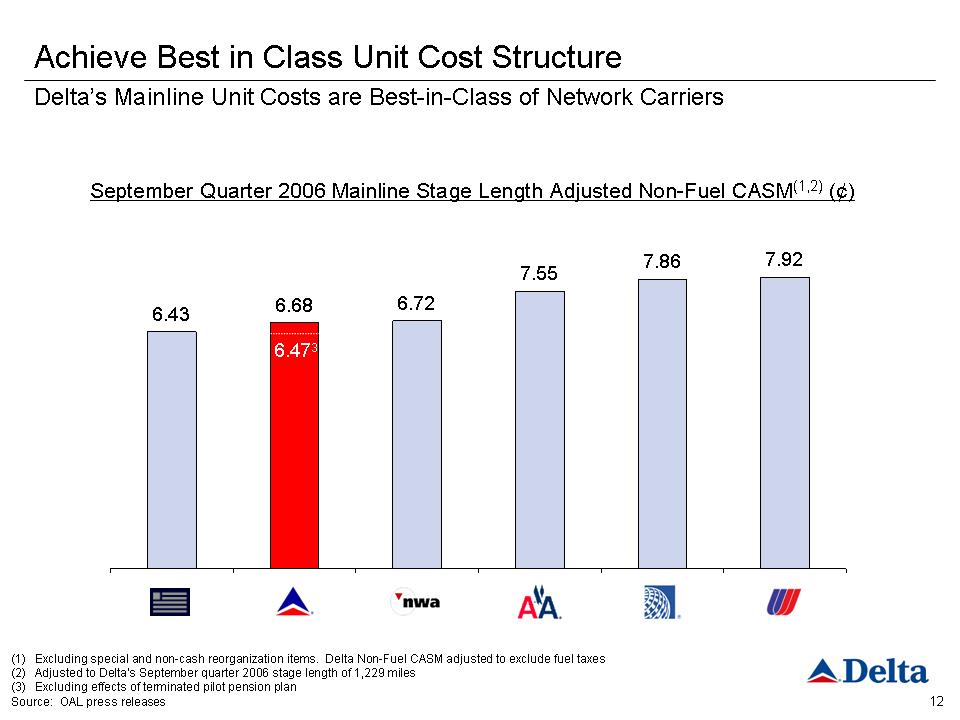
Achieve Best in Class Unit Cost Structure Delta’s Mainline Unit Costs are Best-in-Class of Network Carriers 6.43 6.68 6.72 7.55 7.86 7.92 September Quarter 2006 Mainline Stage Length Adjusted Non-Fuel CASM (1,2)(¢) (1)Excluding special and non-cash reorganization items. Delta Non-Fuel CASM adjusted to exclude fuel taxes (2) Adjusted to Delta’s September quarter 2006 stage length of 1,229 miles (3) Excluding effects of terminated pilot pension plan Source:OAL press releases
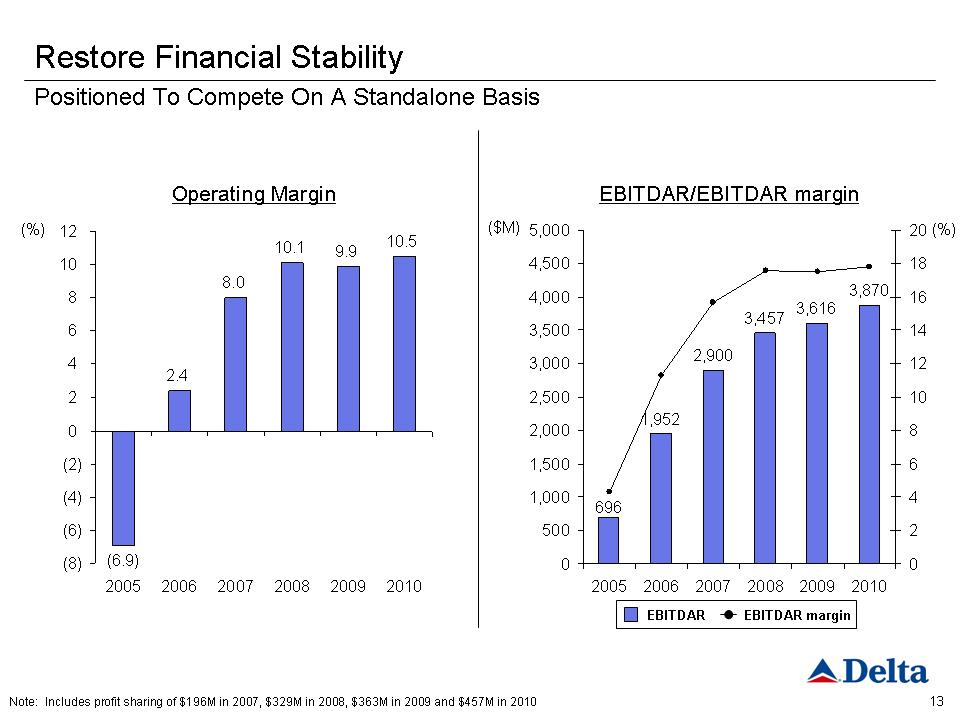
Restore Financial Stability Positioned To Compete On A Standalone Basis (6.9) 2.4 8.0 10.1 9.9 10.5 (8) (6) (4) (2) 0 2 4 6 8 10 12 2005 2006 200 72008 2009 2010 (%) Operating Margin 1,952 2,900 3,457 3,616 3,870 696 0 500 1,000 1,500 2,000 2,500 3,000 3,500 4,000 4,500 5,000 2005 2006 2007 2008 2009 2010 0 2 4 6 8 10 12 14 16 18 20 ($M) EBITDAR/EBITDAR margin (%) Note: Includes profit sharing of $196M in 2007, $329M in 2008, $363M in 2009 and $457M in 2010
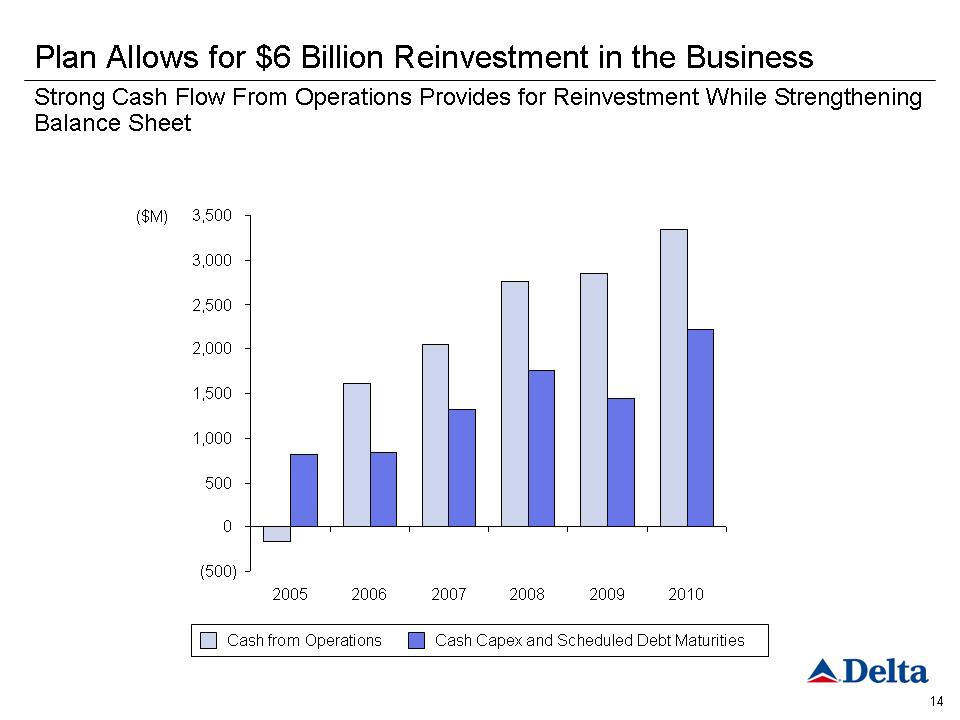
Plan Allows for $6 Billion Reinvestment in the Business Strong Cash Flow From Operations Provides for Reinvestment While Strengthening Balance Sheet (500) 0 500 1,000 1,500 2,000 2,500 3,000 3,500 2005 2006 2007 2008 2009 2010 ($M) Cash from Operations Cash Capex and Scheduled Debt Maturities
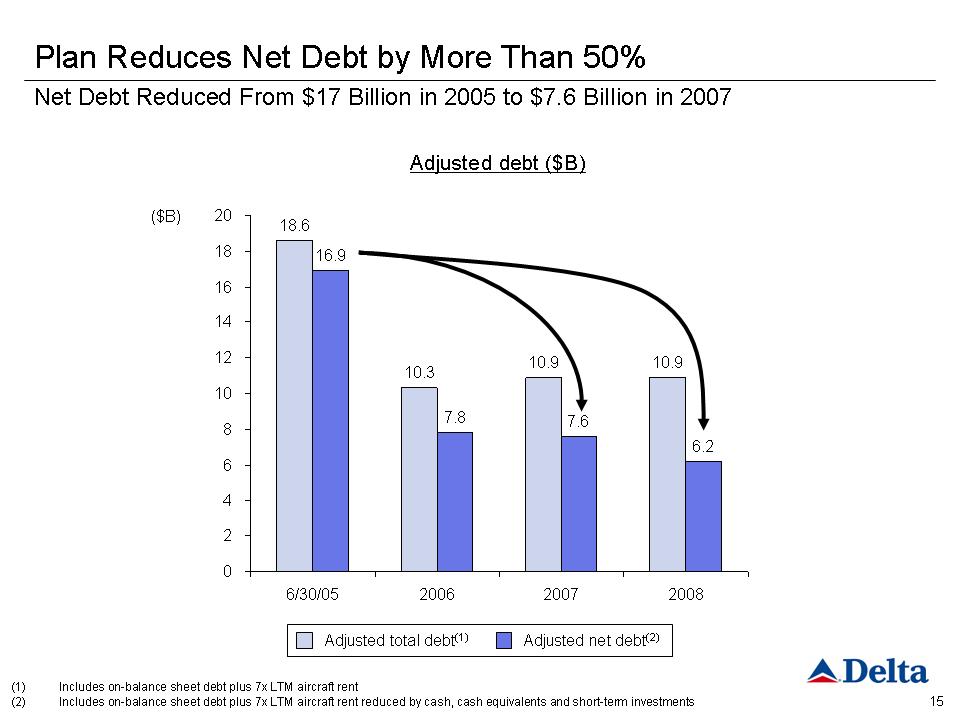
Plan Reduces Net Debt by More Than 50% 18.6 10.3 10.9 10.9 16.9 7.8 7.6 6.2 0 2 4 6 8 10 12 14 16 18 20 6/30/05 2006 2007 2008 ($B)Adjusted total debt (1) Adjusted net debt (2)(1)Includes on-balance sheet debt plus 7x LTM aircraft rent(2)Includes on-balance sheet debt plus 7x LTM aircraft rent reduced by cash, cash equivalents and short-term investments Net Debt Reduced From $17 Billion in 2005 to $7.6 Billion in 2007Adjusted debt ($B)
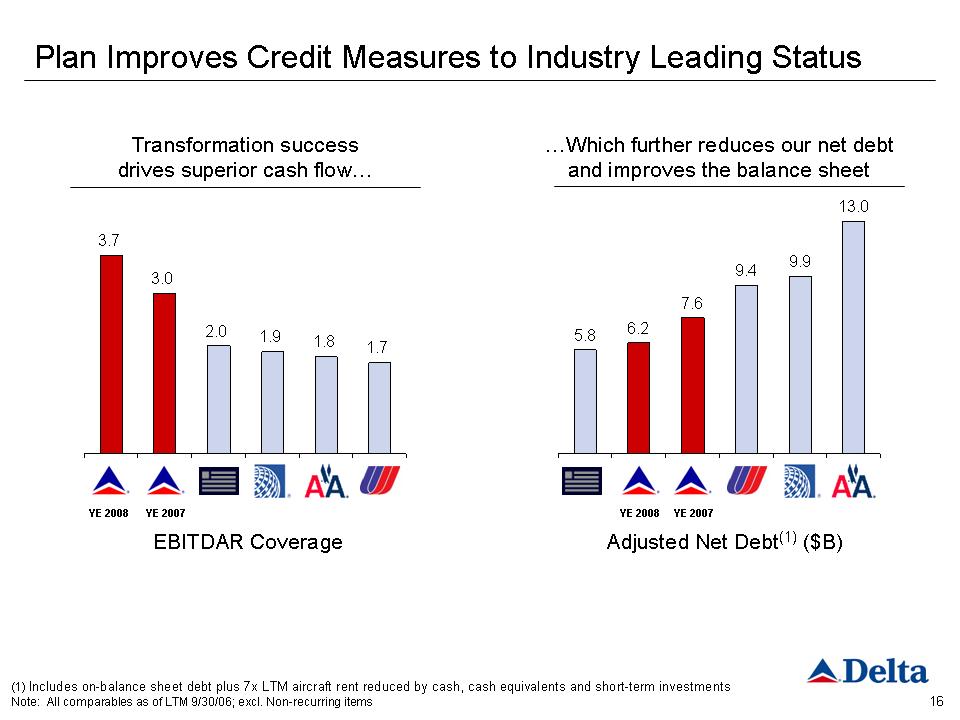
Plan Improves Credit Measures to Industry Leading Status 16YE 2007 3.7 3.0 2.0 1.9 1.8 1.7 5.8 6.2 7.6 9.4 9.9 13.0 (1) Includes on-balance sheet debt plus 7x LTM aircraft rent reduced by cash, cash equivalents and short-term investments Note All comparables as of LTM 9/30/06; excl. Non-recurring items YE 2008YE 2008 YE 2007EBITDAR Coverage Adjusted Net Debt(1)($B)…Which further reduces our net debt and improves the balance sheet Transformation success drives superior cash flow…
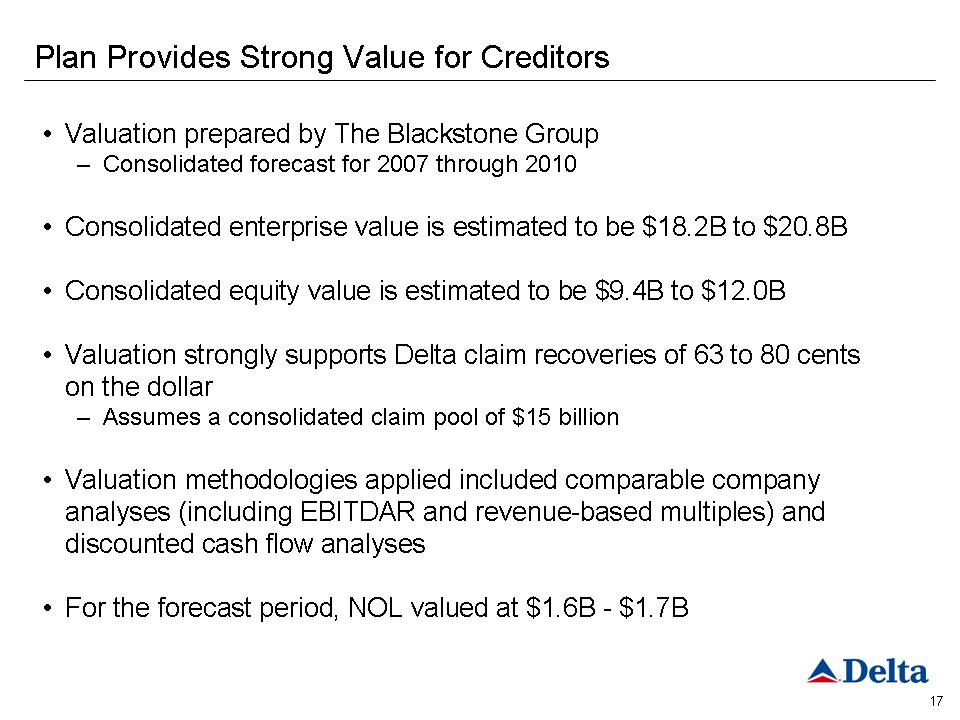
• Valuation prepared by The Blackstone Group-Consolidated forecast for 2007 through 2010 • Consolidated enterprise value is estimated to be $18.2B to $20.8B • Consolidated equity value is estimated to be $9.4B to $12.0B • Valuation strongly supports Delta claim recoveries of 63 to 80 cents on the dollar-Assumes a consolidated claim pool of $15 billion • Valuation methodologies applied included comparable company analyses (including EBITDAR and revenue-based multiples) and discounted cash flow analyses • For the forecast period, NOL valued at $1.6B -$1.7B Plan Provides Strong Value for Creditors
Delta on Track for Timely Emergence • Successful restructuring achieved-On track to emerge from Chapter 11 in Spring 2007 • Considerable momentum-Management team delivering on its commitments • Significant value has been created for all stakeholders-Confirmed by valuation and recovery
Business Strategy Jim Whitehurst Chief Operating Officer
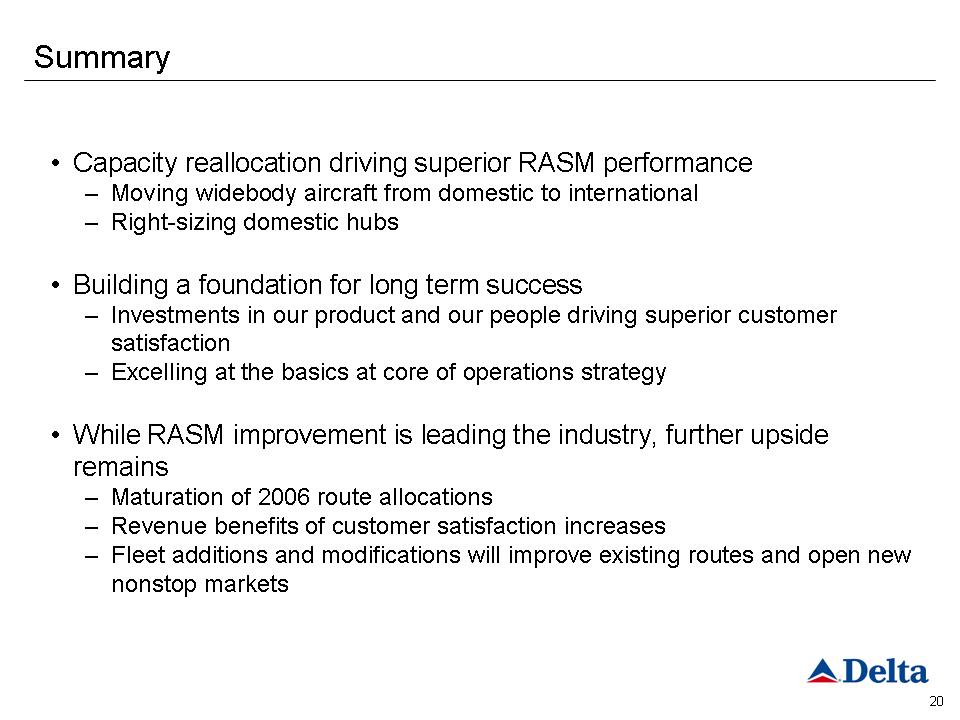
Summary • Capacity reallocation driving superior RASM performance-Moving wide body aircraft from domestic to international -Right-sizing domestic hubs • Building a foundation for long term success-Investments in our product and our people driving superior customer satisfaction-Excelling at the basics at core of operations strategy • While RASM improvement is leading the industry, further upside remains-Maturation of 2006 route allocations-Revenue benefits of customer satisfaction increases-Fleet additions and modifications will improve existing routes and open new nonstop markets
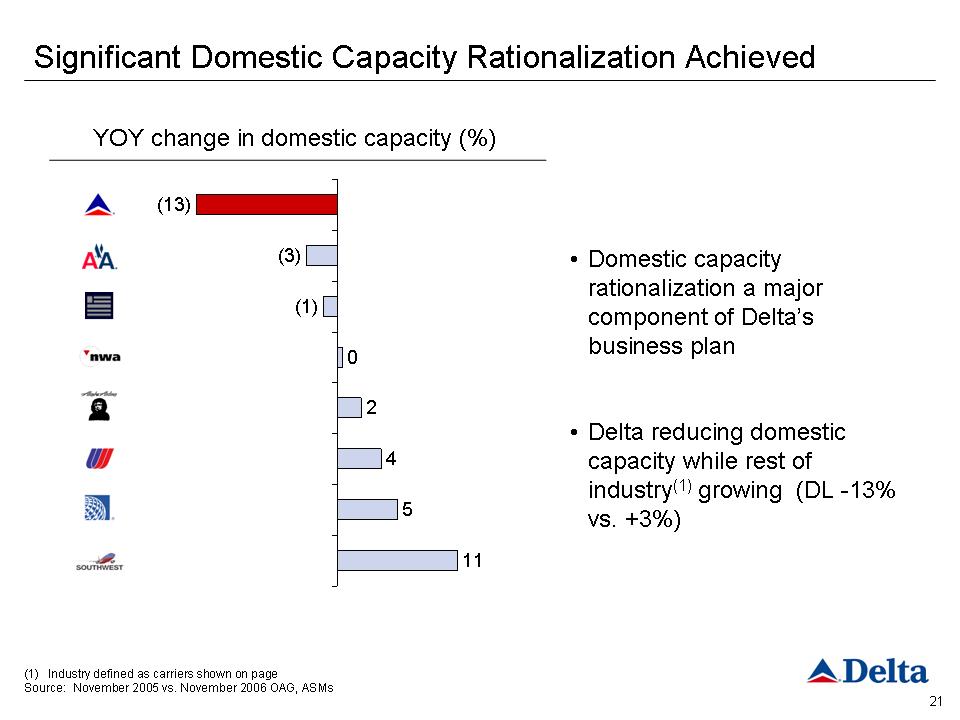
Significant Domestic Capacity Rationalization Achieved • Domestic capacity rationalization a major component of Delta’s business plan • Delta reducing domestic capacity while rest of industry (1) growing (DL -13% vs. +3%) YOY change in domestic capacity (%) (13) (3) (1) 0 2 4 5 11 (1) Industry defined as carriers shown on page Source: November 2005 vs. November 2006 OAG, ASMs
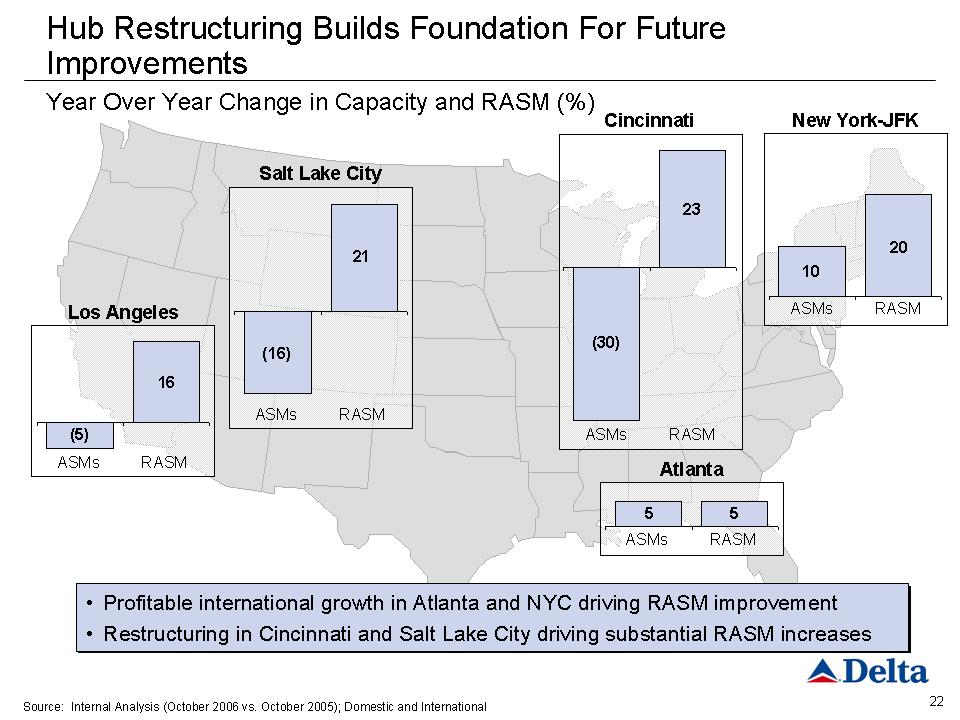
22 Hub Restructuring Builds Foundation For Future Improvements Year Over Year Change in Capacity and RASM (%) Source: Internal Analysis (October 2006 vs. October 2005); Domestic and International Atlanta • Profitable international growth in Atlanta and NYC driving RASM improvement • Restructuring in Cincinnati and Salt Lake City driving substantial RASM increases • Profitable international growth in Atlanta and NYC driving RASM improvement • Restructuring in Cincinnati and Salt Lake City driving substantial RASM increases Los Angeles ASMs RASM Salt Lake City ASMs RASM (5) 16 (16) 21 Cincinnati ASMs RASM (30) 23 New York-JFK ASMs RASM ASMs RASM 10 20 55
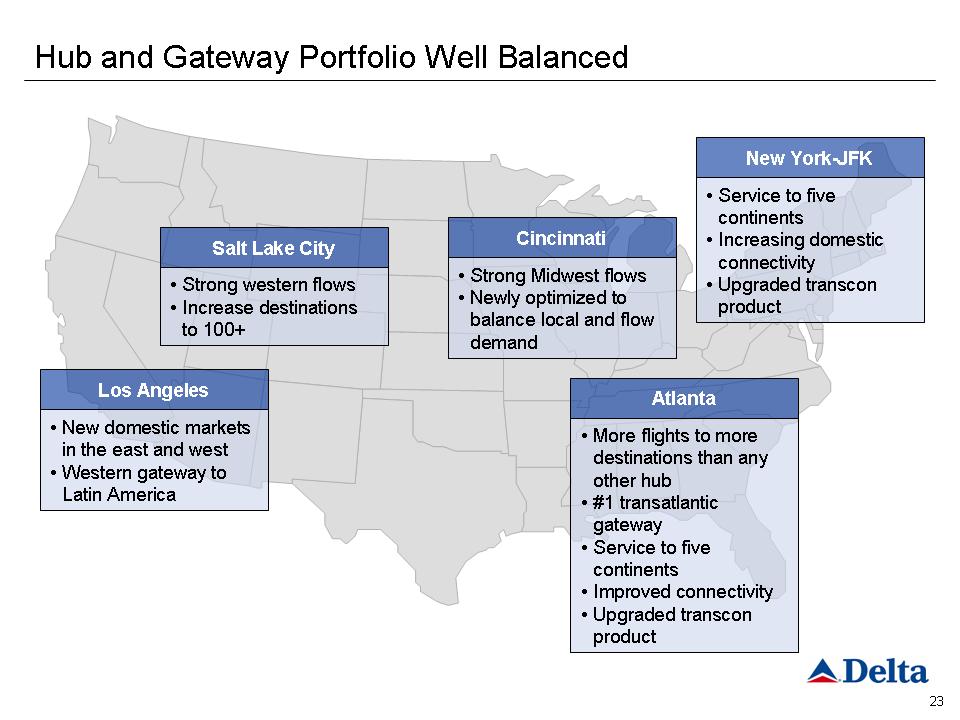
Hub and Gateway Portfolio Well Balanced Salt Lake City • Strong western flows • Increase destinations to 100+ Cincinnati • Strong Midwest flows • Newly optimized to balance local and flow demand New York-JFK •Service to five continents • Increasing domestic connectivity • Upgraded transcon product Los Angeles •New domestic markets in the east and west • Western gateway to Latin America Atlanta • More flights to more destinations than any other hub • #1 transatlantic gateway • Service to five continents • Improved connectivity • Upgraded transcon product
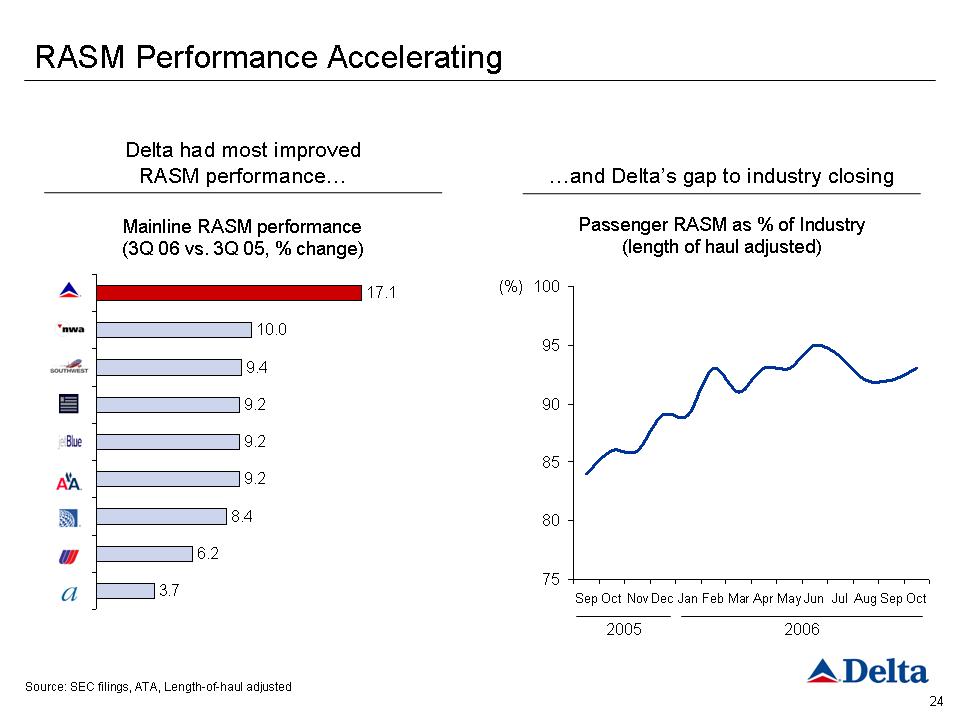
24 Delta had most improved RASM performance…Source: SEC filings, ATA, Length-of-haul adjusted RASM Performance Accelerating…and Delta’s gap to industry closing 2005 2006 Passenger RASM as % of Industry (length of haul adjusted)Mainline RASM performance (3Q 06 vs. 3Q 05, % change)17.1 10.0 9.4 9.2 9.2 9.2 8.4 6.2 3.7 75 80 85 90 95 100 Sep Oct Nov Dec Jan Feb Mar Apr May Jun Jul Aug Sep Oct(%)
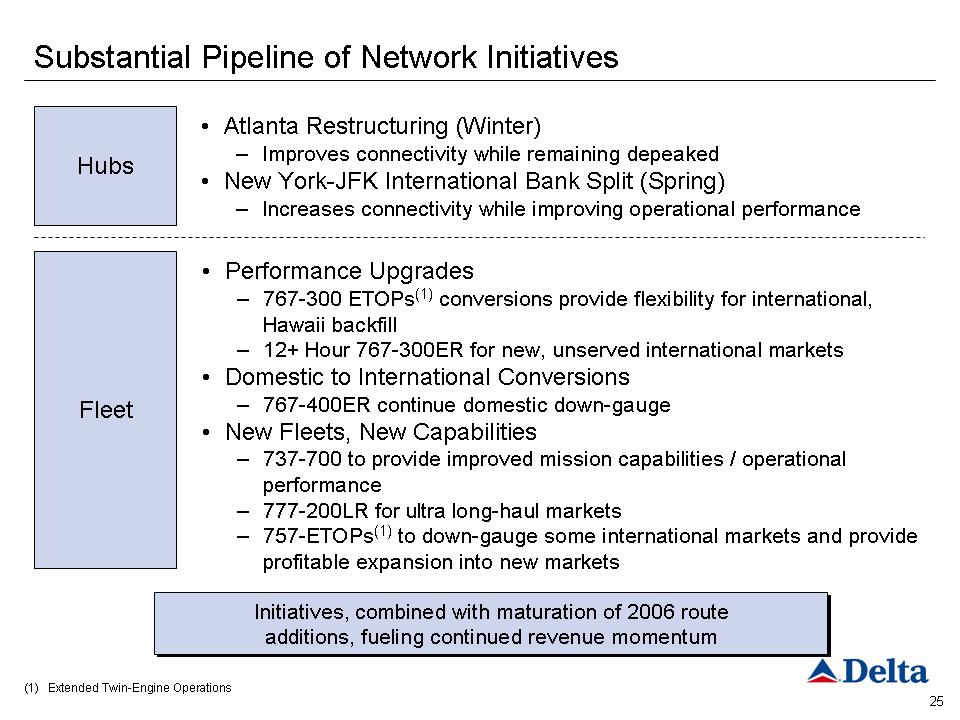
25 Substantial Pipeline of Network Initiatives • Atlanta Restructuring (Winter)-Improves connectivity while remaining depeaked • New York-JFK International Bank Split (Spring)-Increases connectivity while improving operational performance • Performance Upgrades-767-300 ETOPs (1)conversions provide flexibility for international, Hawaii backfill-12+ Hour 767-300ER for new, unserved international markets • Domestic to International Conversions-767-400ER continue domestic down-gauge • New Fleets, New Capabilities - 737-700 to provide improved mission capabilities / operational performance - 777-200LR for ultra long-haul markets - 757-ETOPs(1)to down-gauge some international markets and provide profitable expansion into new markets Hubs Fleet(1)Extended Twin-Engine Operations Initiatives, combined with maturation of 2006 route additions, fueling continued revenue momentum Initiatives, combined with maturation of 2006 route additions, fueling continued revenue momentum
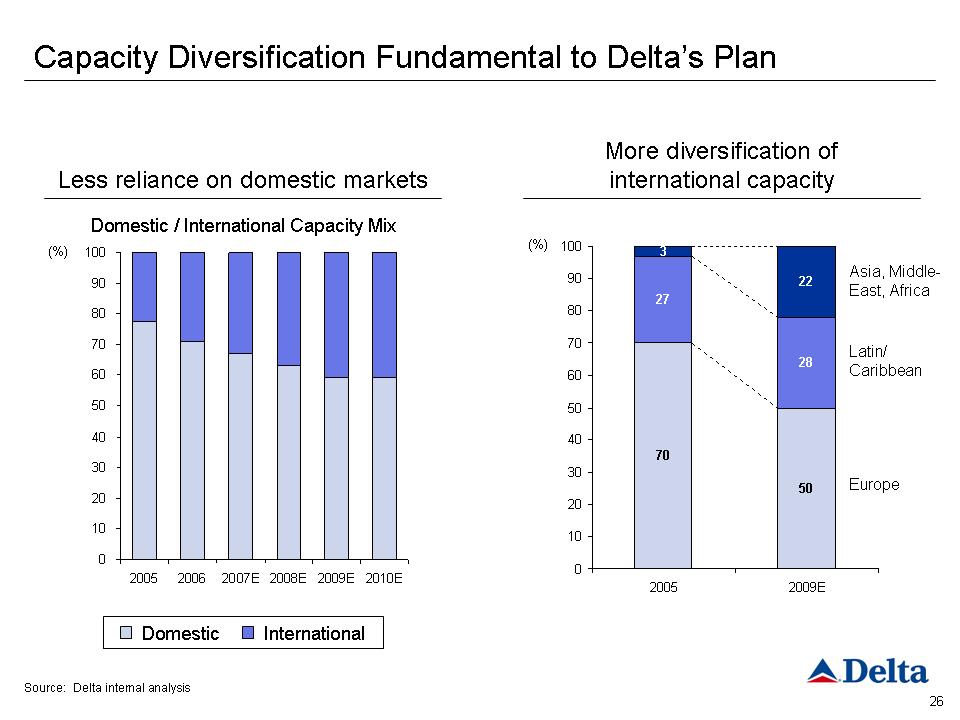
26 Capacity Diversification Fundamental to Delta’s Plan Domestic / International Capacity Mix Less reliance on domestic markets Europe Latin/Caribbean Asia, Middle-East, Africa 27% 3% 28% 22% 70% 50% More diversification of international capacity 0 10 20 30 40 50 60 70 80 90 100 2005 2006 2007E 2008E 2009E 2010E (%) International Domestic 70 50 27 28 32 20 10 20 30 40 50 60 70 80 90 100 2005 2009E (%)Source: Delta internal analysis

World of Profitable Growth Available to Delta 27 • Seeking China route authority • Launching Seoul in 2007 • 777-200LR opens new markets • New reach through expanded code shares Asia/Pacific • Atlanta superior gateway • New markets with Los Angeles gateway • NYC to Caribbean, Central and South America Latin America • First non-stop from North America to Mumbai • First mover advantage to Africa • Long-haul aircraft open Middle East Africa/Middle East/India • Domestic wide bodies funding profitable growth • 757ETOPs (1) opens new markets • First mover advantage to Eastern Europe Transatlantic (1)Extended Twin-Engine Operations
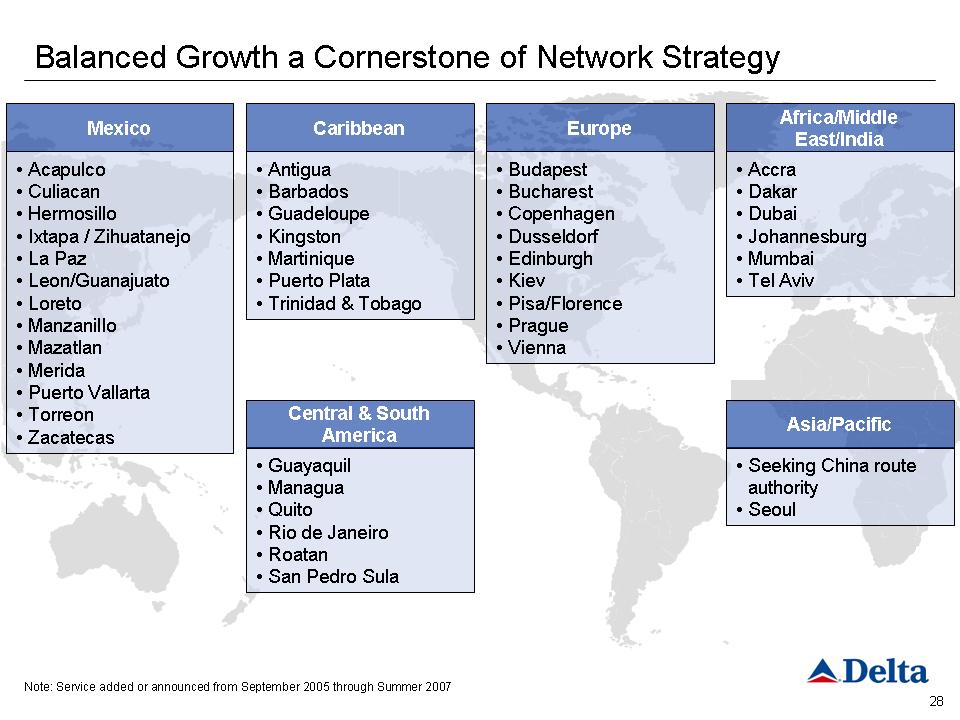
28 Balanced Growth a Cornerstone of Network Strategy Note: Service added or announced from September 2005 through Summer 2007 • Acapulco • Culiacan • Hermosillo • Ixtapa/ Zihuatanejo • La Paz • Leon/Guanajuato • Loreto • Manzanillo • Mazatlan • Merida • Puerto Vallarta • Torreon • ZacatecasMexico • Antigua • Barbados • Guadeloupe • Kingston • Martinique • Puerto Plata • Trinidad & TobagoCaribbean • Budapest • Bucharest • Copenhagen • Dusseldorf • Edinburgh • Kiev • Pisa/Florence • Prague • ViennaEurope • Accra • Dakar • Dubai • Johannesburg • Mumbai • Tel AvivAfrica/Middle East/India • Guayaquil • Managua • Quito • Rio de Janeiro • Roatan • San Pedro SulaCentral & South America • Seeking China route authority • SeoulAsia/Pacific
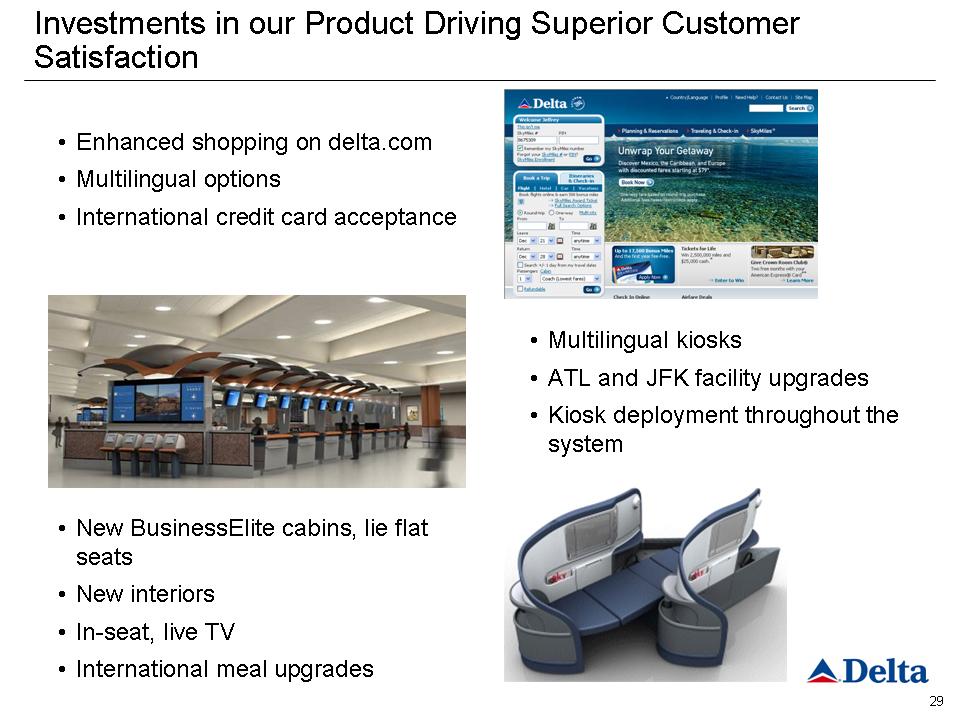
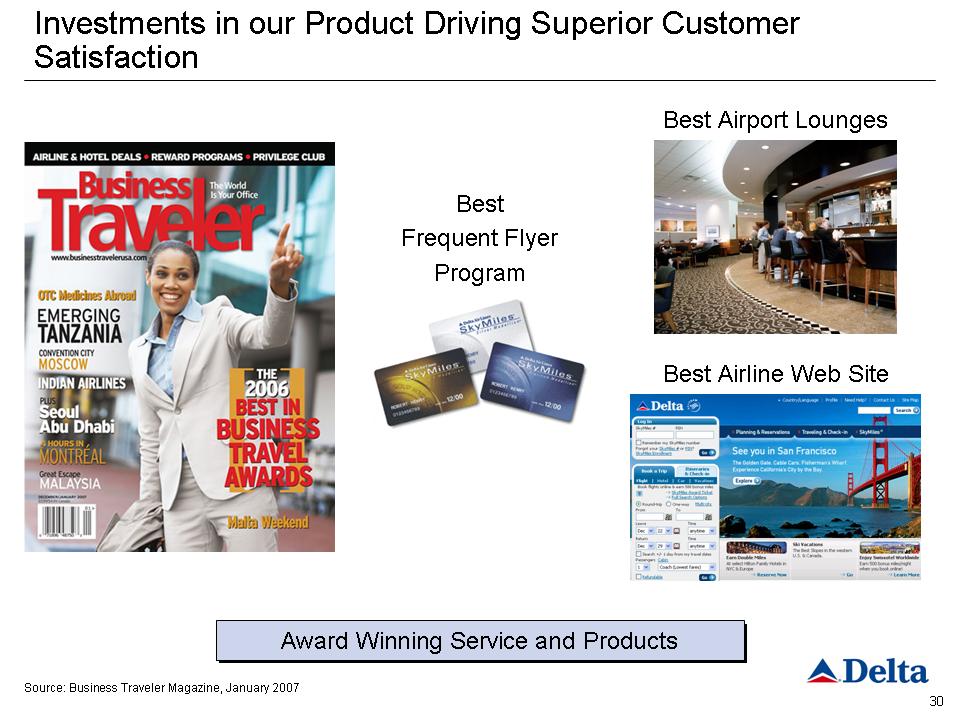
Investments in our Product Driving Superior Customer Satisfaction • Enhanced shopping on delta.com • Multilingual options • International credit card acceptance • Multilingual kiosks • ATL and JFK facility upgrades • Kiosk deployment throughout the system • New Business Elite cabins, lie flat seats • New interiors • In-seat, live TV • International meal upgrades
30 Best Airline Web Site Best Airport Lounges Source: Business Traveler Magazine, January 2007 Best Frequent Flyer Program Investments in our Product Driving Superior Customer Satisfaction Award Winning Service and Products Award Winning Service and Products
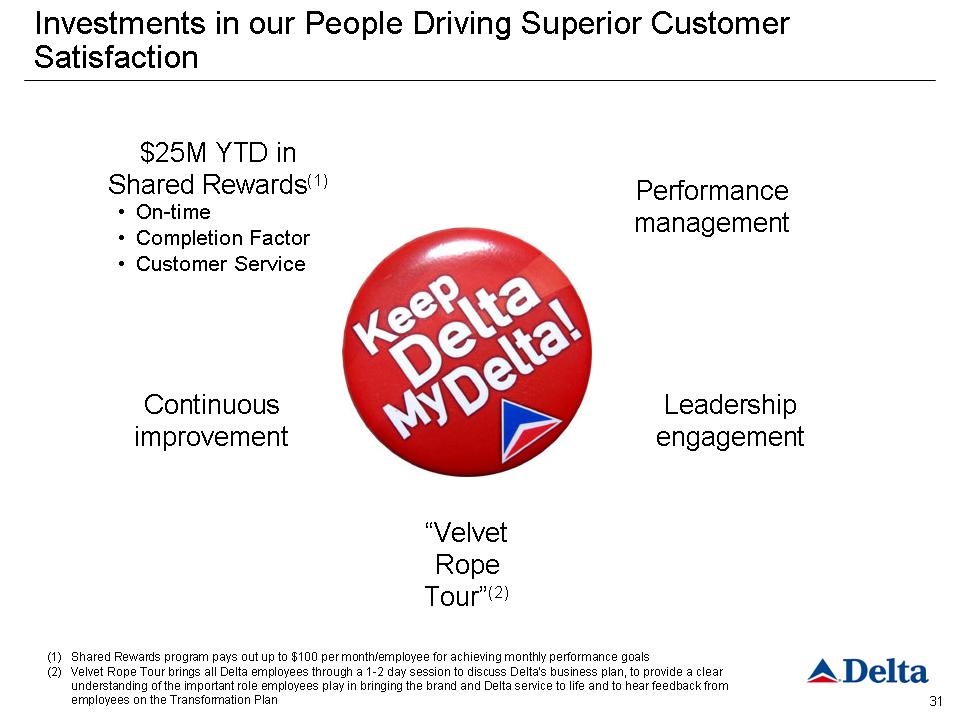
Investments in our People Driving Superior Customer Satisfaction Continuous improvement Leadership engagement(1)Shared Rewards program pays out up to $100 per month/employee for achieving monthly performance goals (2) Velvet Rope Tour brings all Delta employees through a 1-2 day session to discuss Delta’s business plan, to provide a clear understanding of the important role employees play in bringing the brand and Delta service to life and to hear feedback from employees on the Transformation Plan$25M YTD in Shared Rewards (1) • On-time • Completion Factor • Customer Service “Velvet Rope Tour” (2) Performance management
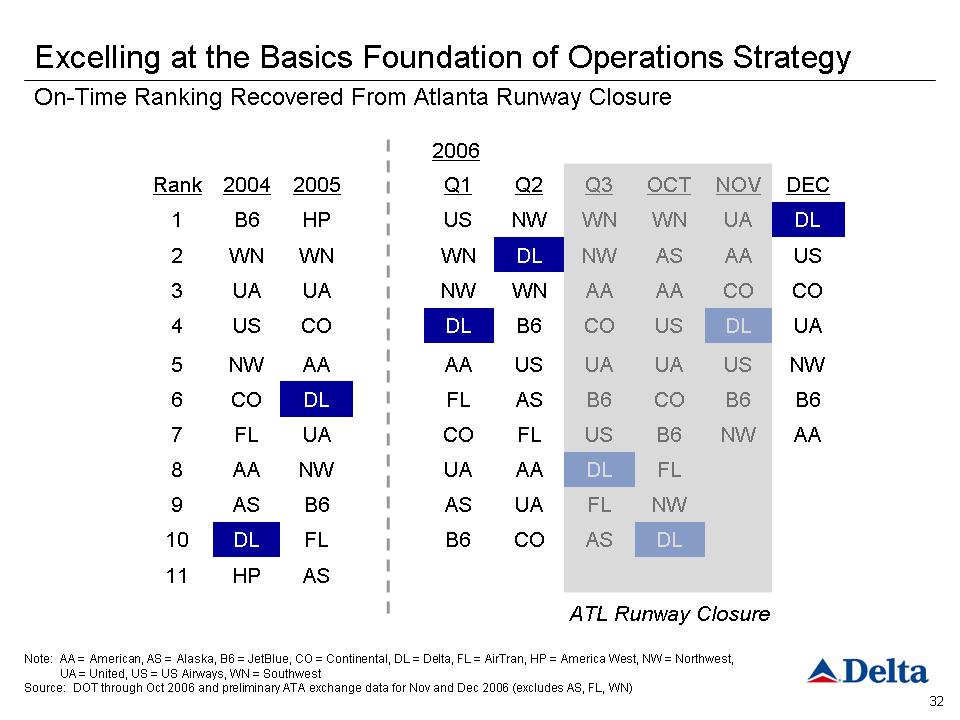
On-Time Ranking Recovered From Atlanta Runway Closure 2006 DL NW FL B6 CO UA US AA AS WN OC TN WB 6U SD LC OA AU AN OV AA B6 NW UA CO US DL DE CA SH P 11 AS CO B6 FL DL 10 FL UA AS B6 AS 9D LA AU AN WA A8 US FL CO UA FL 7B 6A SF LD LC O6 UA US AA AA NW 5C OB 6D LC OU S4 AA WN NW UA UA 3 NW DL WN WN WN 2 WN NW US HP B6 1Q 3Q 2Q 1 2005 2004 Rank ATL Runway Closure Excelling at the Basics Foundation of Operations Strategy
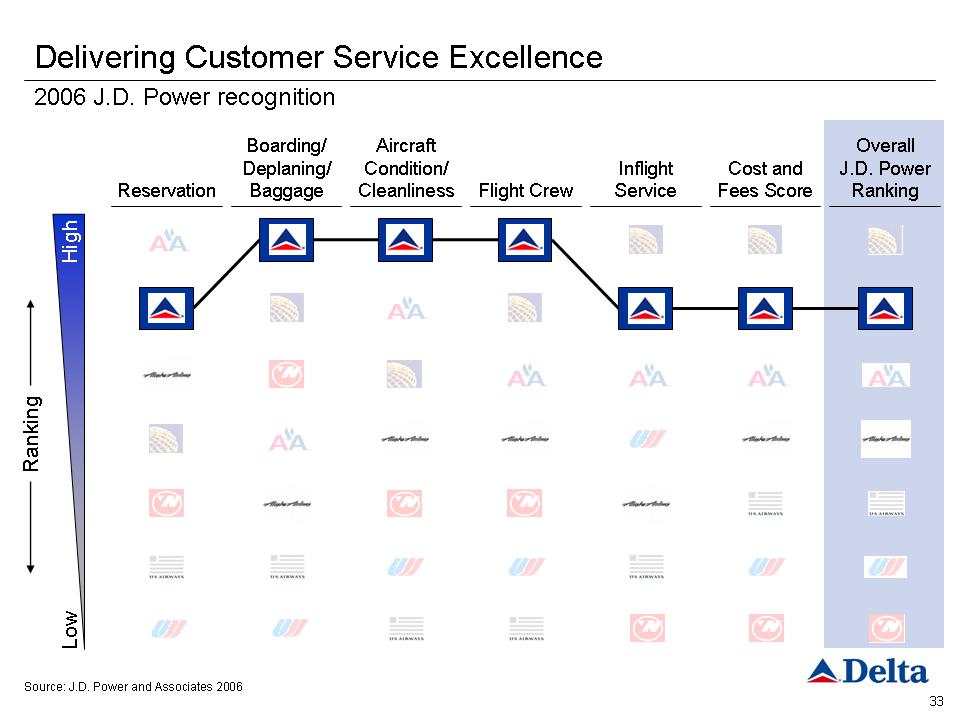
33 Source: J.D. Power and Associates 2006ReservationOverallJ.D. Power Ranking Cost and Fees Score Inflight Service Flight Crew Aircraft Condition/ Cleanliness Boarding/ Deplaning/ Baggage Low Ranking High Delivering Customer Service Excellence2006 J.D. Power recognition
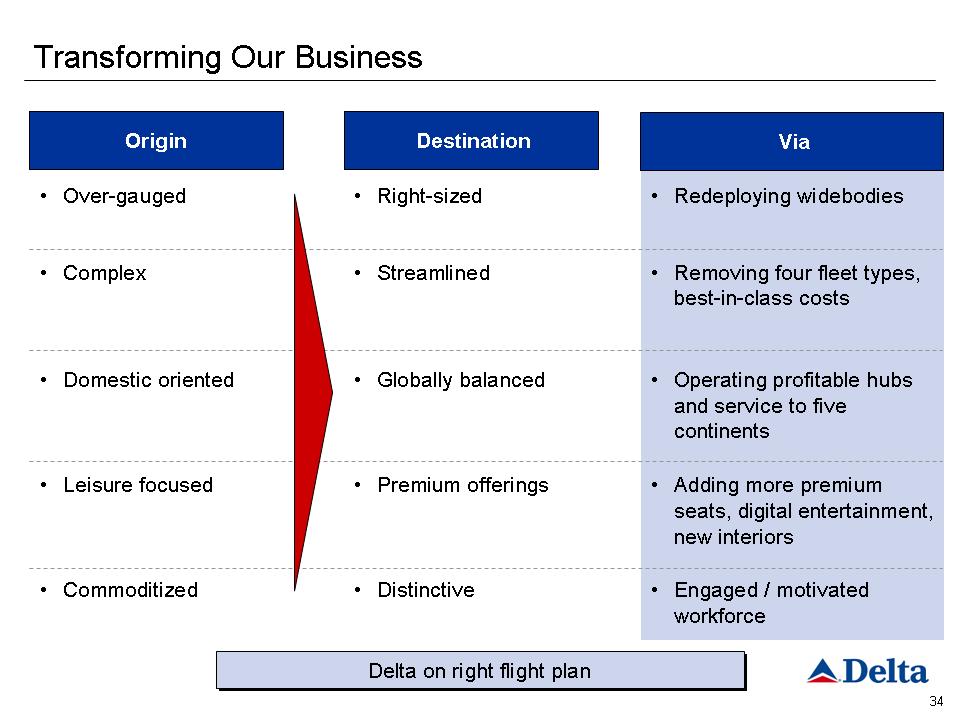
Transforming Our Business • Leisure focused • Right-sized Destination Origin Via • Redeploying widebodies • Removing four fleet types, best-in-class costs • Engaged / motivated workforce • Adding more premium seats, digital entertainment, new interiors • Operating profitable hubs and service to five continents • Domestic oriented • Complex • Commoditized • Over-gauged • Distinctive • Premium offerings • Globally balanced • Streamlined Delta on right flight plan Delta on right flight plan
Response to US Airways proposal Jerry Grinstein Chief Executive Officer
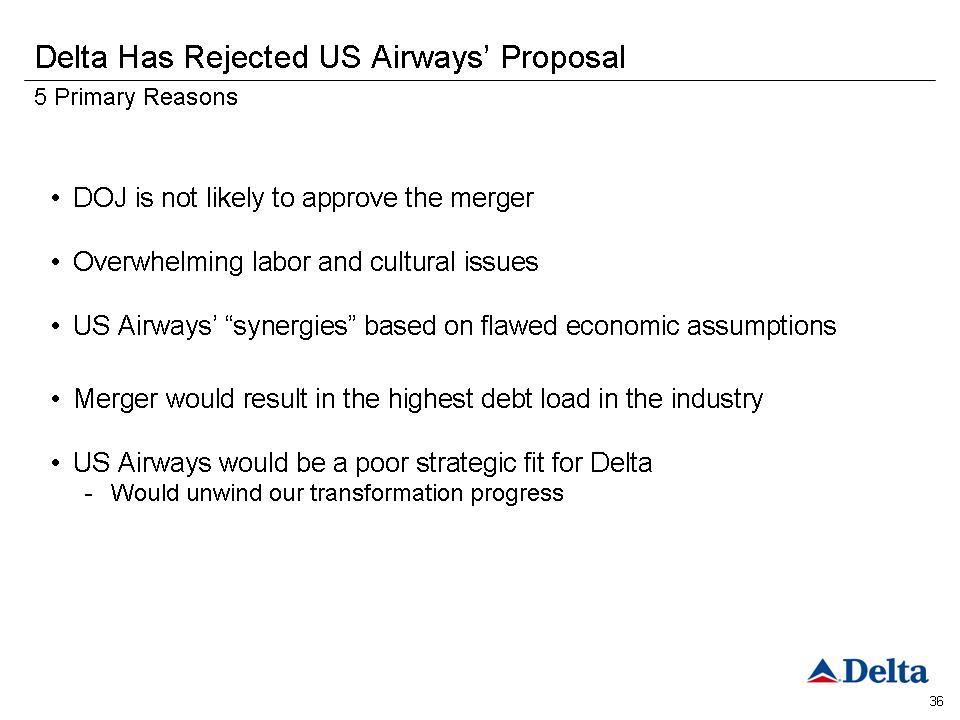
5 Primary Reasons Delta Has Rejected US Airways Proposal • DOJ is not likely to approve the merger • Overwhelming labor and cultural issues • US Airways’ “synergies” based on flawed economic assumptions • Merger would result in the highest debt load in the industry • US Airways would be a poor strategic fit for Delta-Would unwind our transformation progress
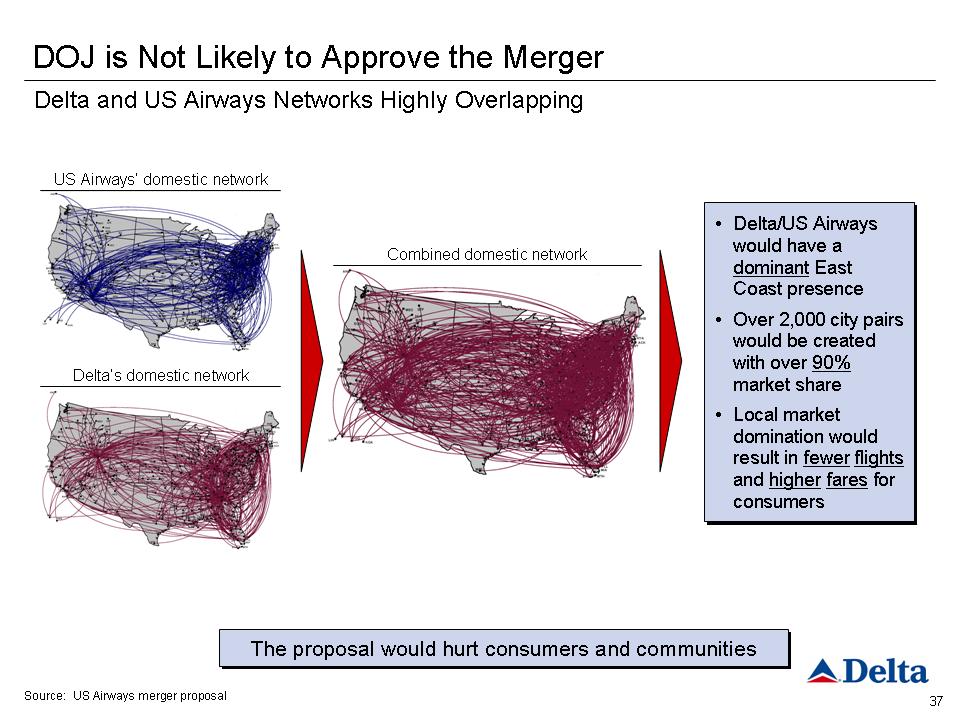
37 DOJ is Not Likely to Approve the Merger Source: US Airways merger proposal Combined domestic network Delta’s domestic network The proposal would hurt consumers and communities The proposal would hurt consumers and communities US Airways’ domestic network • Delta/US Airways would have a dominant East Coast presence • Over 2,000 city pairs would be created with over 90%market share • Local market domination would result in fewer flights and higher fares for consumers • Delta/US Airways would have a dominant East Coast presence • Over 2,000 city pairs would be created with over 90%market share • Local market domination would result in fewer flights and higher fares for consumers Delta and US Airways Networks Highly Overlapping
Overwhelming Labor and Cultural Issues • Labor issues present major obstacles in any airline merger...and this transaction presents overwhelming obstacles • US Airways’ labor strategy to keep employee costs below industry average is unrealistic and unsustainable • US Airways’ proposal to reduce Delta flying is prohibited by the Delta-ALPA pilot agreement-Delta pilot agreement protects “scheduled aircraft block hours” at pre-merger levels for Delta pilots-And our pilots have said this is not for sale • Employees firmly oppose this proposed merger
US Airways’ “Synergies” Based On Flawed Economic Assumptions • Network synergies overstated-Based on unrealistic cost reduction assumptions-Fail to account for fundamental improvement in Delta’s performance over the past twelve months • Cost synergies unrealistic-An inappropriate extrapolation of US Airways/America West integration estimates Many “synergies” would not be attained Many unaccounted for negative synergies would destroy value • Labor negative synergies would outweigh other cost synergies-Integration of wage scales, benefits, productivity-Underestimated transition costs • Many network negative synergies unaccounted for-Impact of competitive backfill into major markets vacated from the capacity reduction-Loss of airline alliance value-Impact of reduced customer service

Merger Would Result in the Highest Debt Load in the Industry Reverses Restructuring of Balance Sheet 8.1 11.1 12.4 13.5 18.1 18.6 23.2 Proposed US Airways /Delta Merge Delta 2005 American United Continental Delta Plan US Airways Adjusted Total Debt By Carrier (1) Adjusted total debt($B) (1)Includes on-balance sheet debt plus 7x LTM aircraft rent as of 9/30/06; Delta 2005 data as of 6/30/2005; Delta plan assumes 4/30/07 emergence Source: SEC filings, Company analysis
US Airways Would Be a Poor Strategic Fit for Delta Provides no “new”value • Highly overlapping networks create “synergies” by shrinking -therefore, combination does not offer new value to customers Unwinds progress made against Transformation • Reverses international revenue diversification strategy • Increases fleet complexity • Puts at risk the gains made in operational and customer service performance • Loads up the balance sheet with debt Does not create competitive advantage • Does not close existing gaps in each network (e.g. West Coast, Asia)•Combined entity would be left in a weak strategic position
Non-GAAP to GAAP Reconciliation
Non-GAAP to GAAP Reconciliations The following tables reconcile certain non-GAAP financial measures referred to in this Plan of Reorganization to GAAP. Delta excludes reorganization items, special items and fuel expense because the exclusion of these items is believed to be helpful to investors to evaluate recurring operational performance; the inclusion of these items is not representative of recurring operations and fuel costs have been extremely volatile.
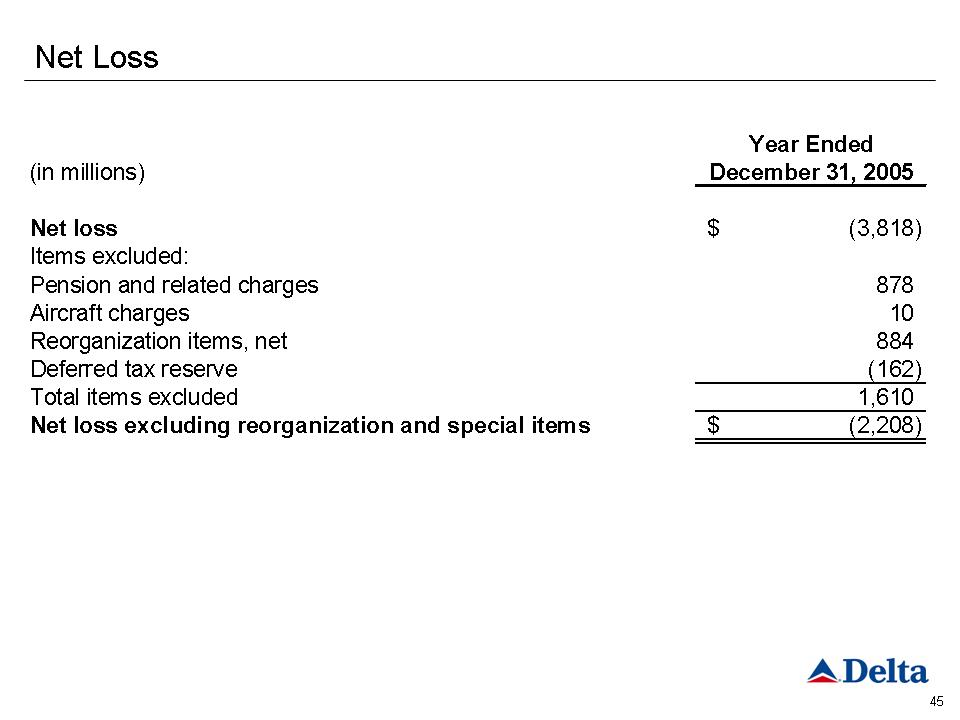
Net Loss Year Ended (in millions )December 31, 2005 Net loss (3,818) $ Items excluded: Pension and related charges 878 Aircraft charges 10 Reorganization items, net 884 Deferred tax reserve (162) Total items excluded 1,610 Net loss excluding reorganization and special items (2,208) $
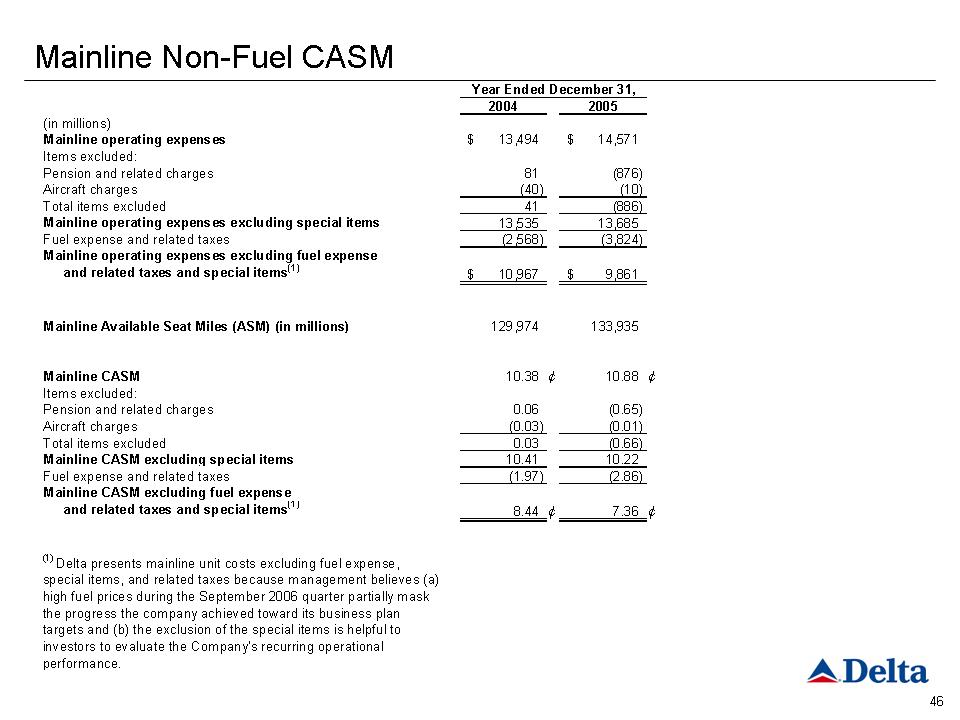
Mainline Non-Fuel CASM 2004 2005 (in millions) Mainline operating expenses 13,494 $ 14,571 $ Items excluded: Pension and related charges 81 (876) Aircraft charges(40) (10) Total items excluded 41 (886) Mainline operating expenses excluding special items 13,535 13,685 Fuel expense and related taxes (2,568) (3,824) Mainline operating expenses excluding fuel expense and related taxes and special items (1) 10,967 $ 9,861 $ Mainline Available Seat Miles (ASM) (in millions) 129,974 133,935 inline CASM1 0.38 ¢ 10.88 ¢ Items excluded: Pension and related charges 0.06 (0.65) Aircraft charges (0.03) (0.01) Total items excluded 0.03 (0.66) Mainline CASM excluding special items 10.41 10.22 Fuel expense and related taxes (1.97) (2.86) Mainline CASM excluding fuel expense and related taxes and special items (1) 8.44 ¢ 7.36 ¢ Year Ended December 31, (1) Delta presents mainline unit costs excluding fuel expense, special items, and related taxes because management believes (a) high fuel prices during the September 2006 quarter partially mask the progress the company achieved toward its business plan targets and (b) the exclusion of the special items is helpful to investors to evaluate the Company's recurring operational performance.
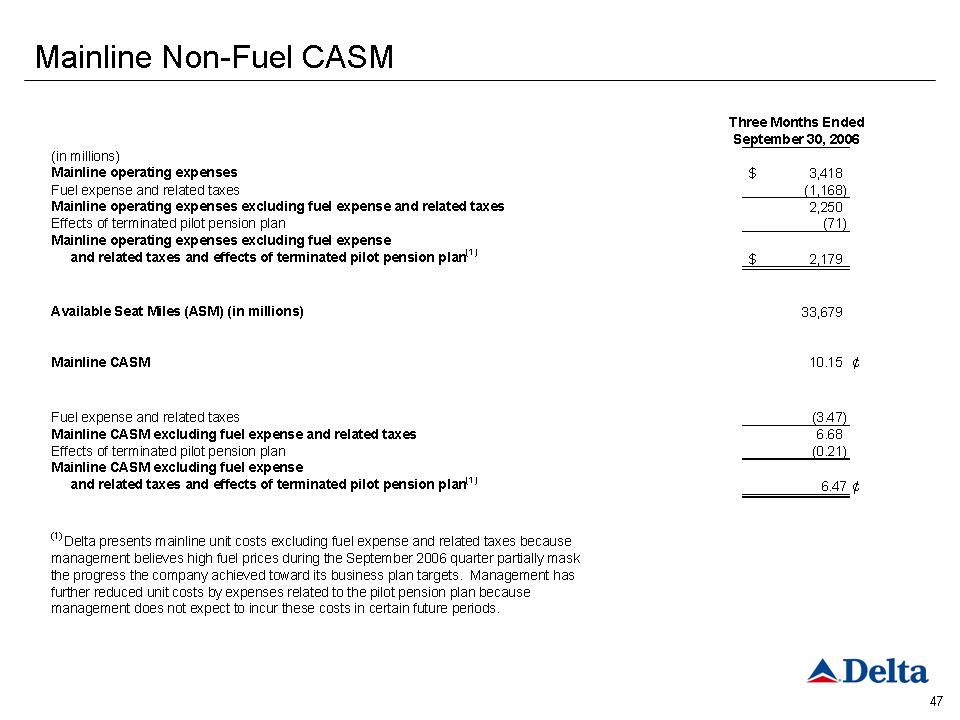
Mainline Non-Fuel CASM Three Months Ended September 30, 2006(in millions)Mainline operating expenses3,418 $ Fuel expense and related taxes(1,168) Mainline operating expenses excluding fuel expense and related taxes 2,250 Effects of terminated pilot pension plan (71) Mainline operating expenses excluding fuel expense and related taxes and effects of terminated pilot pension plan(1)2,179 $ Available Seat Miles (ASM) (in millions) 33,679 Mainline CASM10.15 ¢ Fuel expense and related taxes (3.47) Mainline CASM excluding fuel expense and related taxes 6.68 Effects of terminated pilot pension plan (0.21) Mainline CASM excluding fuel expense and related taxes and effects of terminated pilot pension plan (1) 6.47 ¢ (1) Delta presents mainline unit costs excluding fuel expense and related taxes because management believes high fuel prices during the September 2006 quarter partially mask the progress the company achieved toward its business plan targets. Management has further reduced unit costs by expenses related to the pilot pension plan because management does not expect to incur these costs in certain future periods.
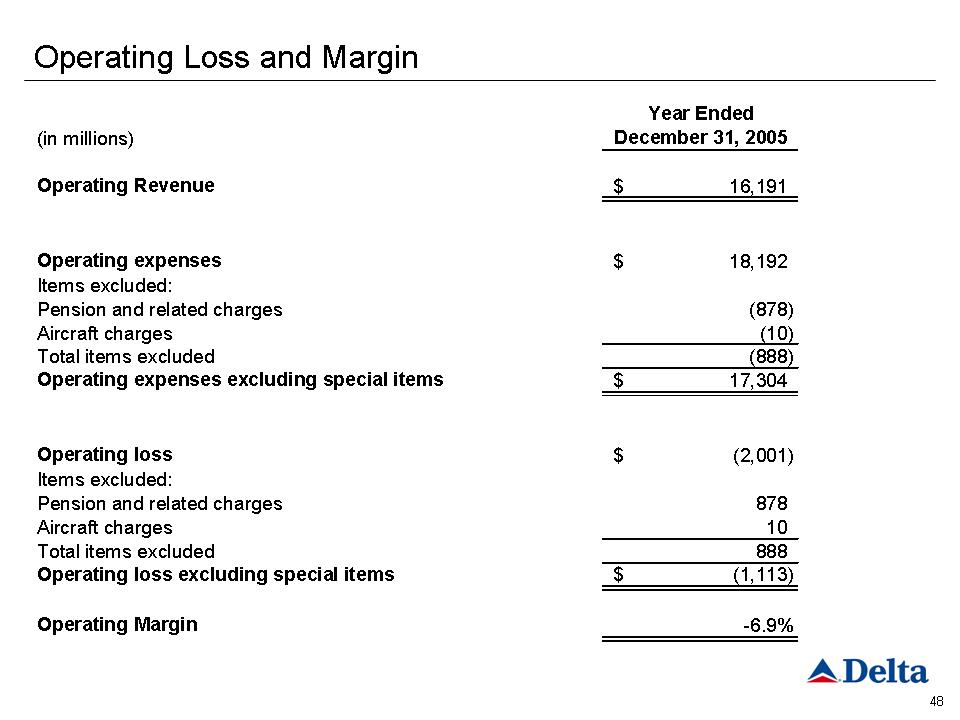
Operating Loss and Margin Year Ended(in millions) December 31, 2005 Operating Revenue 16,191 $ Operating expenses 18,192 $ Items excluded: Pension and related charges (878) Aircraft charges (10) Total items excluded (888) Operating expenses excluding special items 17,304 $ Operating loss (2,001) $ Items excluded: Pension and related charges 878 Aircraft charges 10 Total items excluded 888 Operating loss excluding special items (1,113) $ Operating Margin-6.9%
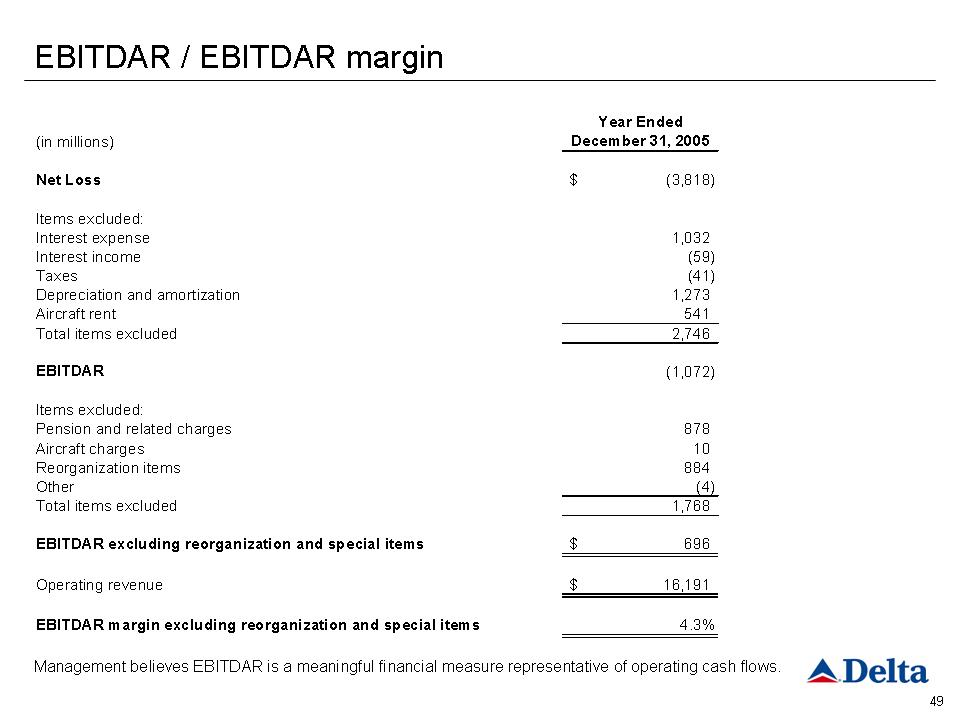
EBITDAR / EBITDAR margin Year Ended (in millions) December 31, 2005 Net Loss (3,818) $ Items excluded: Interest expense1,032 Interest income (59) Taxes (41) Depreciation and amortization 1,273 Aircraft rent 541 Total items excluded 2,746 EBITDAR (1,072) Items excluded: Pension and related charges 878 Aircraft charges 10 Reorganization items 884 Other (4) Total items excluded 1,768 EBITDAR excluding reorganization and special items 696 $ Operating revenue 16,191 $ EBITDAR margin excluding reorganization and special items 4.3%
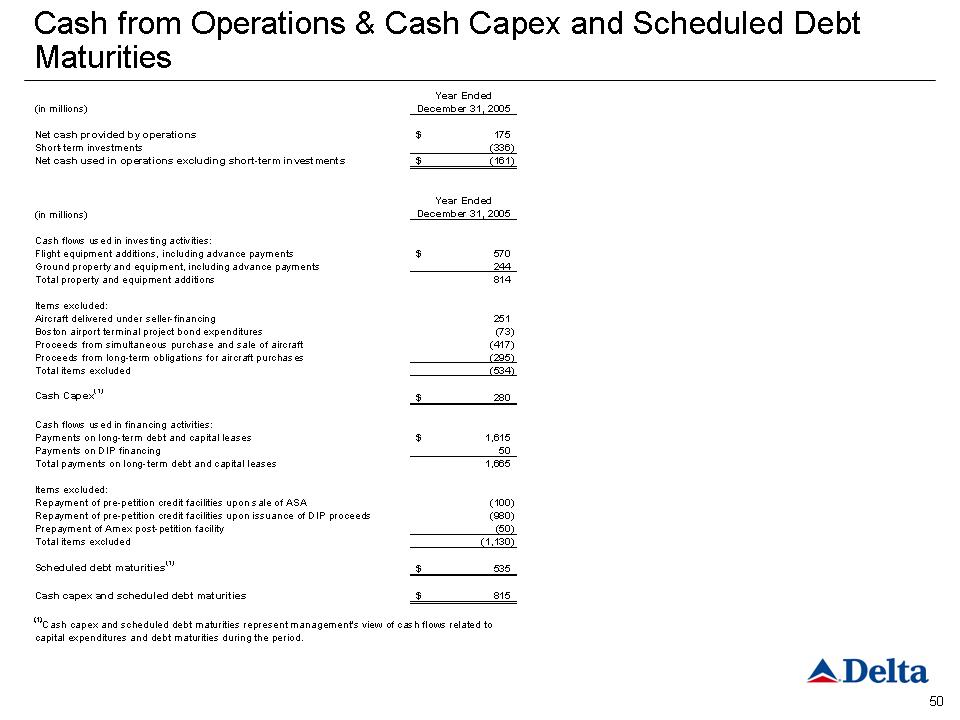
Cash from Operations & Cash Capex and Scheduled Debt Maturities Year Ended(in millions) December 31, 2005 Net cash provided by operations 175 $ Short-term investments (336) Net cash used in operations excluding short-term investments (161) $ Year Ended(in millions) December 31, 2005 Cash flows used in investing activities: Flight equipment additions, including advance payments 570 $ Ground property and equipment, including advance payments 244 Total property and equipment additions814 Items excluded: Aircraft delivered under seller-financing 251 Boston airport terminal project bond expenditures (73) Proceeds from simultaneous purchase and sale of aircraft (417) Proceeds from long-term obligations for aircraft purchases (295) Total items excluded (534) Cash Capex (1) 280 $ Cash flows used in financing activities: Payments on long-term debt and capital leases 1,615 $ Payments on DIP financing 50 Total payments on long-term debt and capital leases 1,665 Items excluded: Repayment of pre-petition credit facilities upon sale of ASA (100) Repayment of pre-petition credit facilities upon issuance of DIP proceeds (980) Prepayment of Amex post-petition facility (50) Total items excluded (1,130) Scheduled debt maturities (1) 535 $ Cash capex and scheduled debt maturities 815 $ (1)Cash capex and scheduled debt maturities represent management's view of cash flows related to capital expenditures and debt maturities during the period.
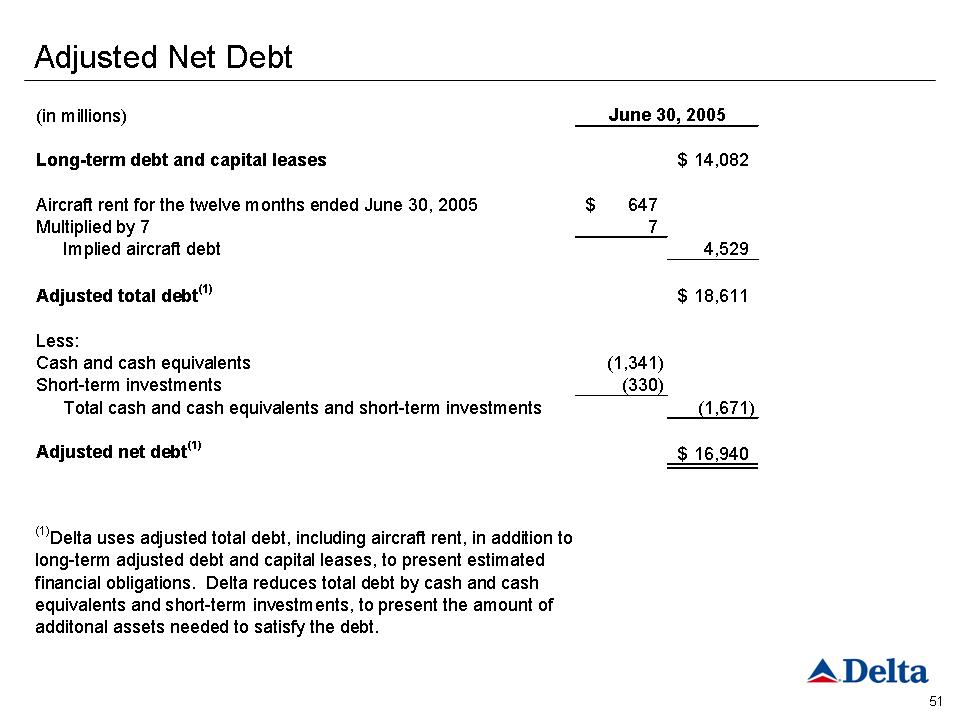
Adjusted Net Debt (in millions)Long-term debt and capital leases 14,082 $ Aircraft rent for the twelve months ended June 30, 2005 647 $ Multiplied by 77 Implied aircraft debt 4,529 Adjusted total debt (1) 18,611 $ Less: Cash and cash equivalents (1,341) Short-term investments (330) Total cash and cash equivalents and short-term investments (1,671) Adjusted net debt (1) 16,940 $ June 30, 2005 (1) Delta uses adjusted total debt, including aircraft rent, in addition to long-term adjusted debt and capital leases, to present estimated financial obligations. Delta reduces total debt by cash and cash equivalents and short-term investments, to present the amount of additional assets needed to satisfy the debt.
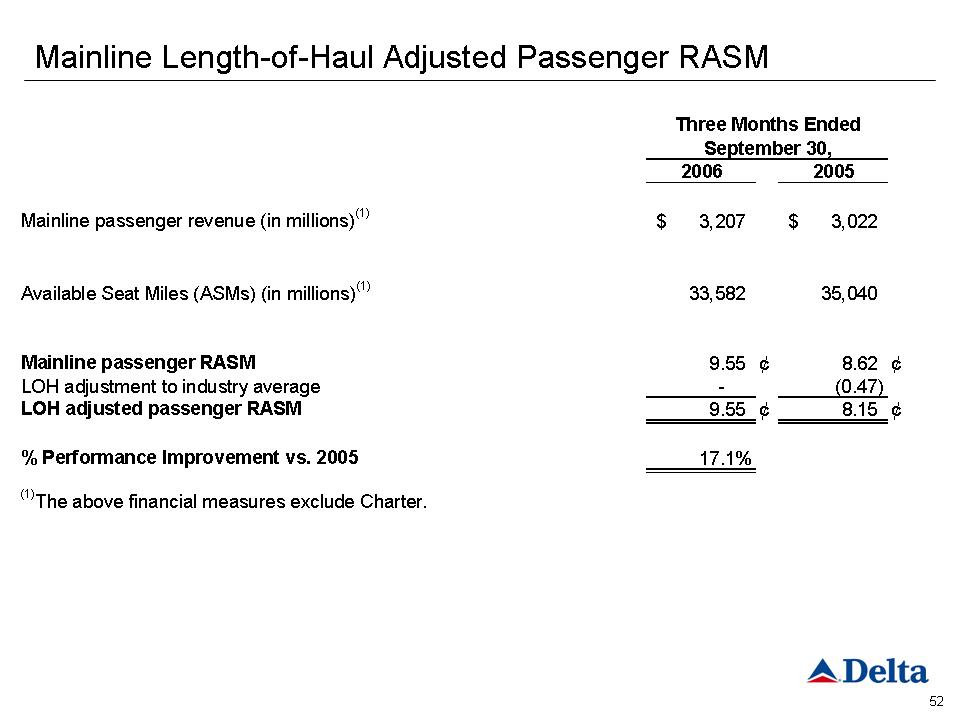
Mainline Length-of-Haul Adjusted Passenger RASM 20062005Mainline passenger revenue (in millions) (1) 3,207 $ 3,022 $ Available Seat Miles (ASMs) (in millions) (1) 33,582 35,040 Mainline passenger RASM 9.55 ¢ 8.62 ¢ LOH adjustment to industry average- (0.47) LOH adjusted passenger RASM 9.55 ¢ 8.15 ¢ % Performance Improvement vs. 200517.1% (1) The above financial measures exclude Charter. Three Months Ended September 30,
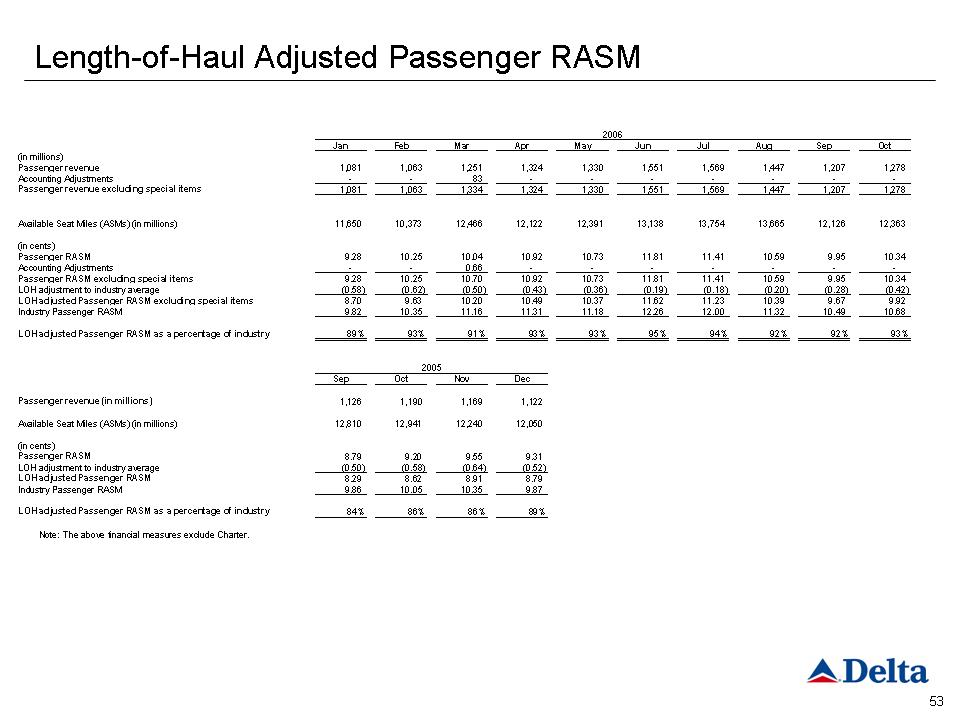
Length-of-Haul Adjusted Passenger RASM Jan Feb Mar Apr May Jun Jul Aug Sep Oct (in millions) Passenger revenue 1,081 1,063 1,251 1,324 1,330 1,551 1,569 1,447 1,207 1,278 Accounting Adjustments- - 83 - - - - - - - Passenger revenue excluding special item s1,081 1,063 1,334 ,324 1,330 1,551 1,569 1,447 1,207 1,278 Available Seat Miles (ASMs) (in millions)11,650 10,373 12,466 12,122 12,391 13,138 13,754 13,665 12,126 12,363 (in cents)Passenger RASM9.28 10.25 10.04 10.92 10.73 11.81 11.41 10.59 9.95 10.34 Accounting Adjustments- - 0.66 - - - - - - - Passenger RASM excluding special items 9.28 10.25 10.70 10.92 10.73 11.81 11.41 10.59 9.95 10.34 LOH adjustment to industry average (0.58) (0.62) (0.50) (0.43) (0.36) (0.19) (0.18) (0.20) (0.28) (0.42) LOH adjusted Passenger RASM excluding special items8.70 9.63 10.20 10.49 10.37 11.62 11.23 10.39 9.67 9.92 Industry Passenger RASM9.82 10.35 11.16 11.31 11.18 12.26 12.00 11.32 10.49 10.68 LOH adjusted Passenger RASM as a percentage of industry 89% 93% 91% 93% 93% 95% 94% 92% 92% 93% Sep Oct Nov Dec Passenger revenue (in millions) 1,126 1,190 1,169 1,122 Available Seat Miles (ASMs) (in millions) 12,810 12,941 12,240 12,050 (in cents) Passenger RASM 8.79 9.20 9.55 9.31 LOH adjustment to industry average (0.50) (0.58) (0.64) (0.52) LOH adjusted Passenger RASM 8.29 8.62 8.91 8.79 Industry Passenger RASM9.86 10.05 10.35 9.87 LOH adjusted Passenger RASM as a percentage of industry 84% 86% 86% 89% Note:The above financial measures exclude Charter.2005 2006