Delta: A Solid Flight Plan
2009 Investor Day
Safe Harbor
This presentation contains various projections and other forward-looking statements which represent Delta’s estimates or expectations regarding future events. All forward-looking statements involve a number of assumptions, risks and uncertainties, many of which are beyond Delta’s control, that could cause the actual results to differ materially from the projected results. Factors which could cause such differences include, without limitation, business, economic, competitive, industry, regulatory, market and financial uncertainties and contingencies, as well as the “Risk Factors” discussed in Delta’s Form 10-Q filed with the SEC on October 27, 2009. Caution should be taken not to place undue reliance on Delta’s forward-looking statements, which represent Delta’s views only as of the date of this presentation, and which Delta has no current intention to update.
In this presentation, we will discuss certain non-GAAP financial measures. You can find the reconciliations of those measures to comparable GAAP measures on our website at delta.com.
1
Delta: A Solid Flight Plan
Richard Anderson
Chief Executive Officer
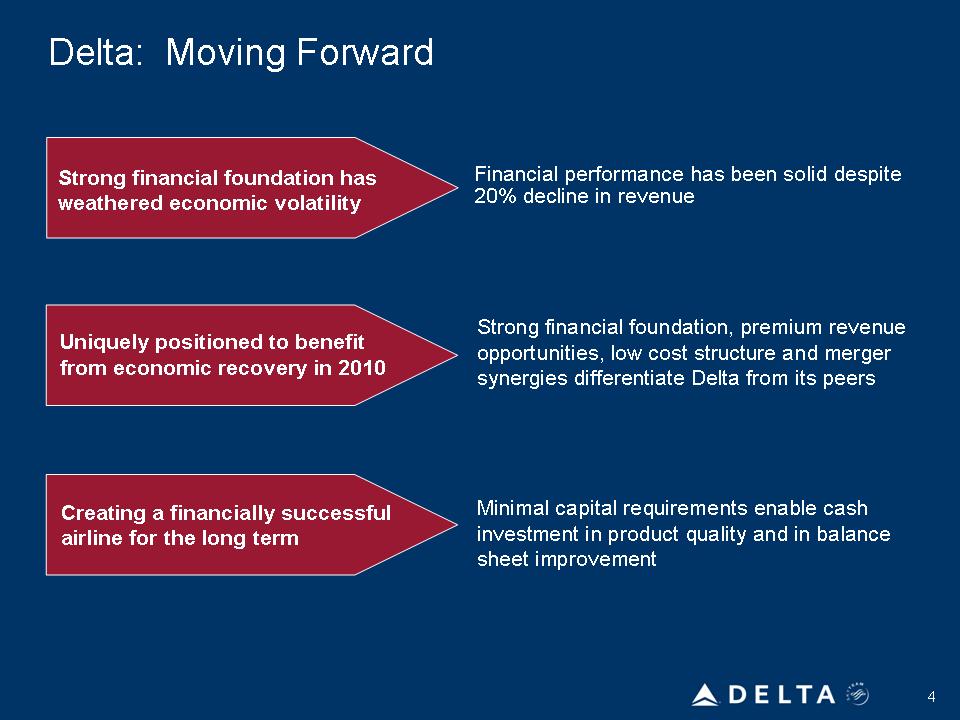
Delta: Moving Forward
Ed Bastian
President
Delta: Moving Forward
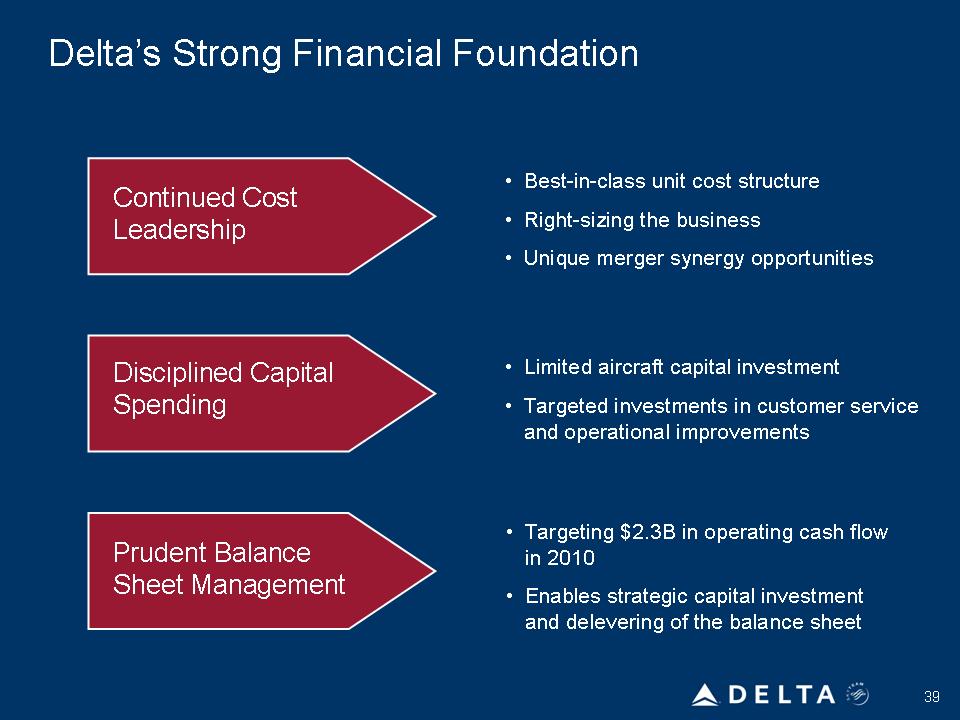
Uniquely positioned to benefit from economic recovery in 2010 Creating a financially successful airline for the long term Strong financial foundation has weathered economic volatility Financial performance has been solid despite 20% decline in revenue
Strong financial foundation, premium revenue opportunities, low cost structure and merger synergies differentiate Delta from its peers
Minimal capital requirements enable cash investment in product quality and in balance sheet improvement
4
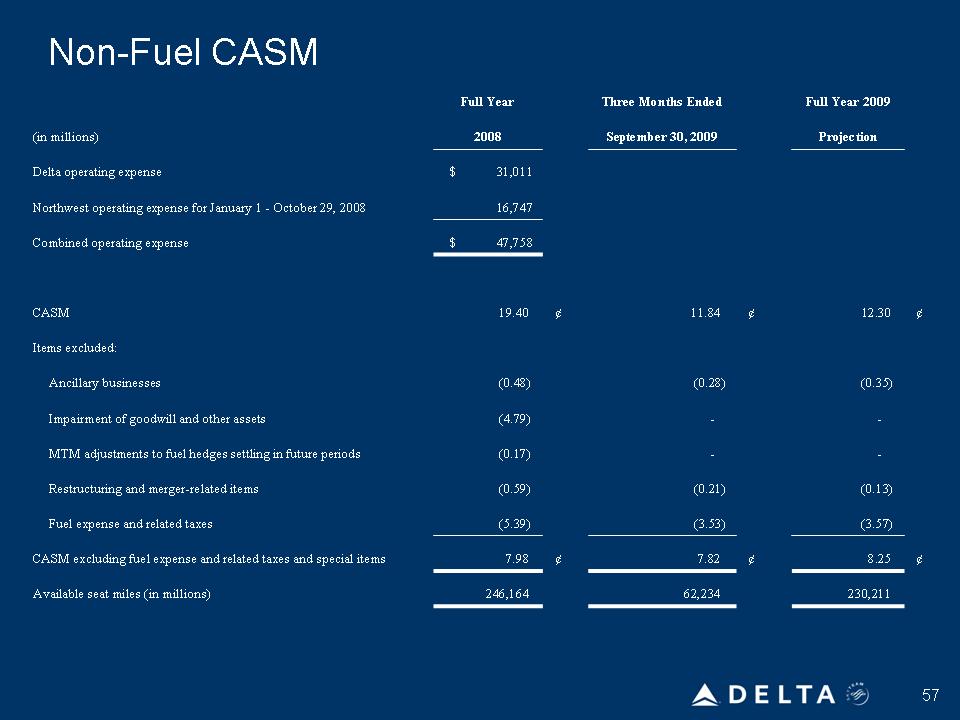
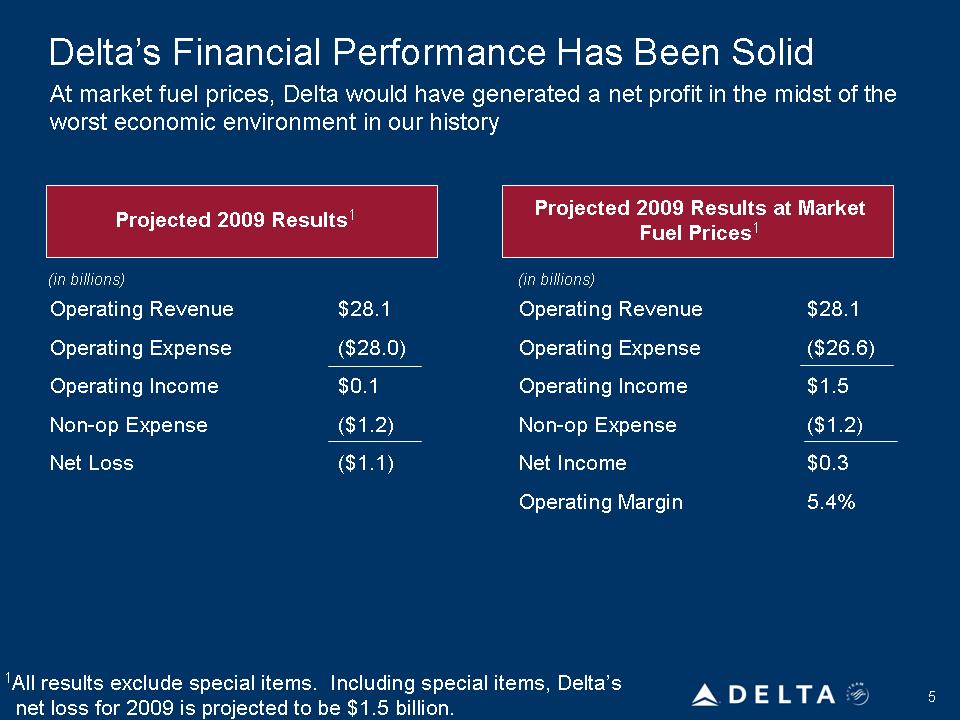
5
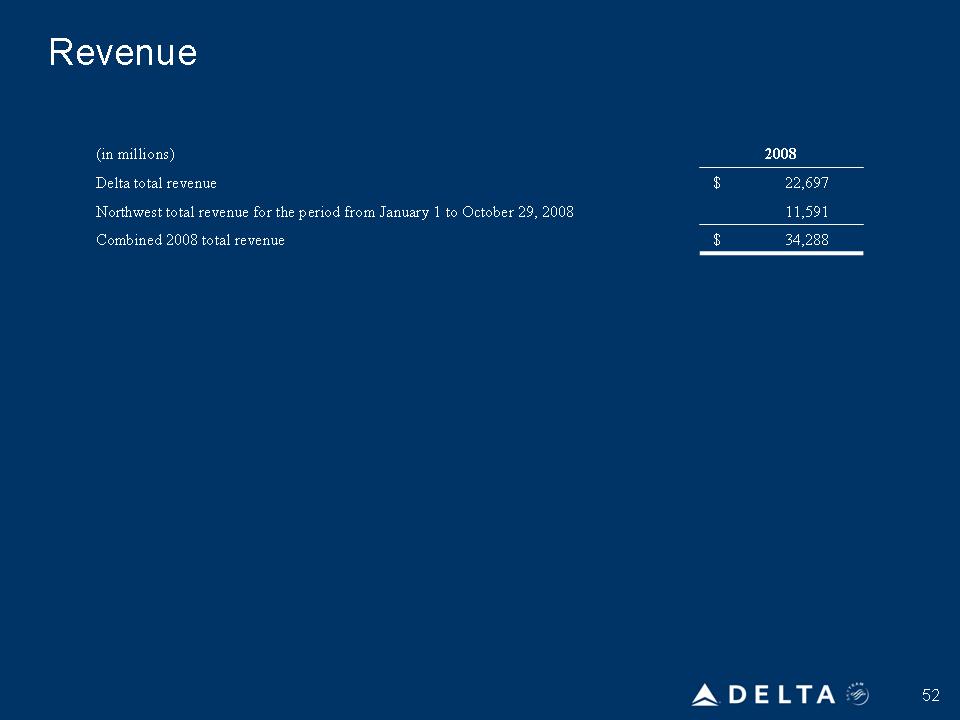
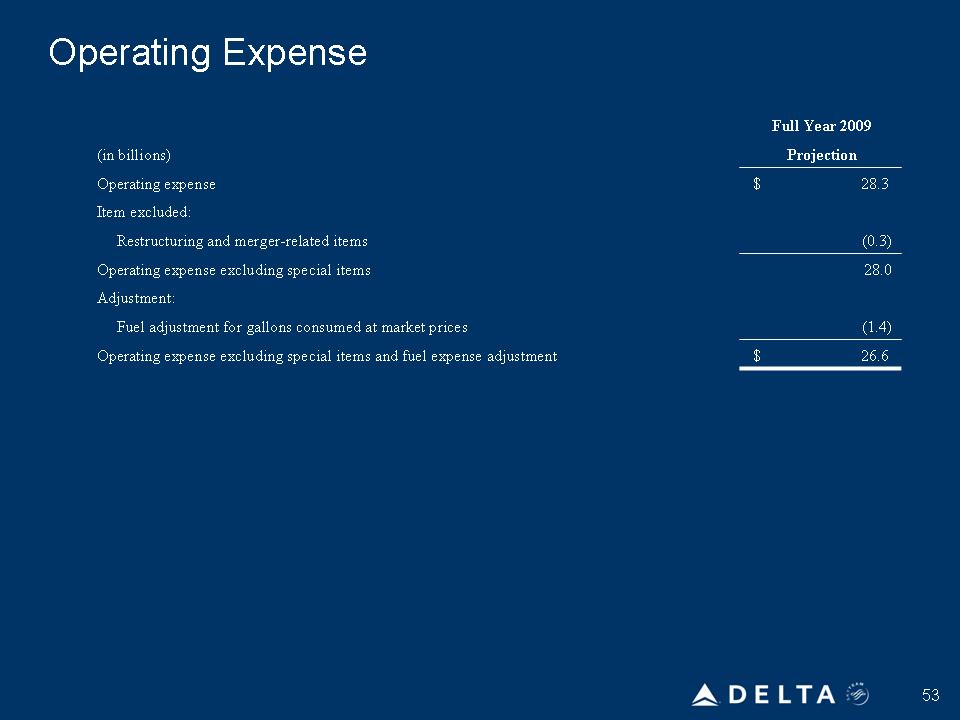
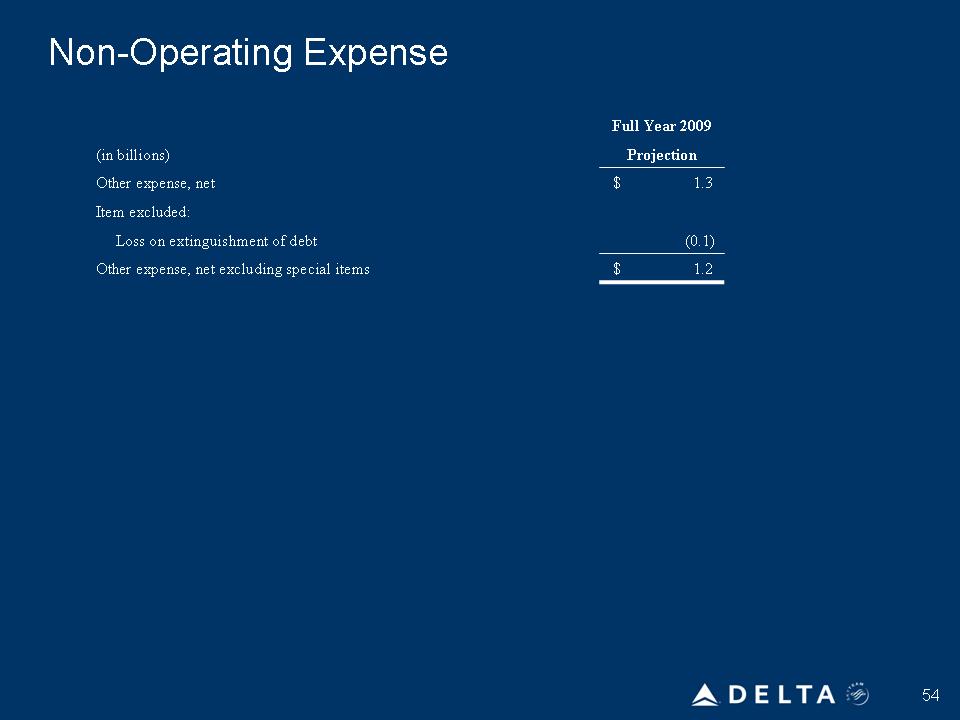
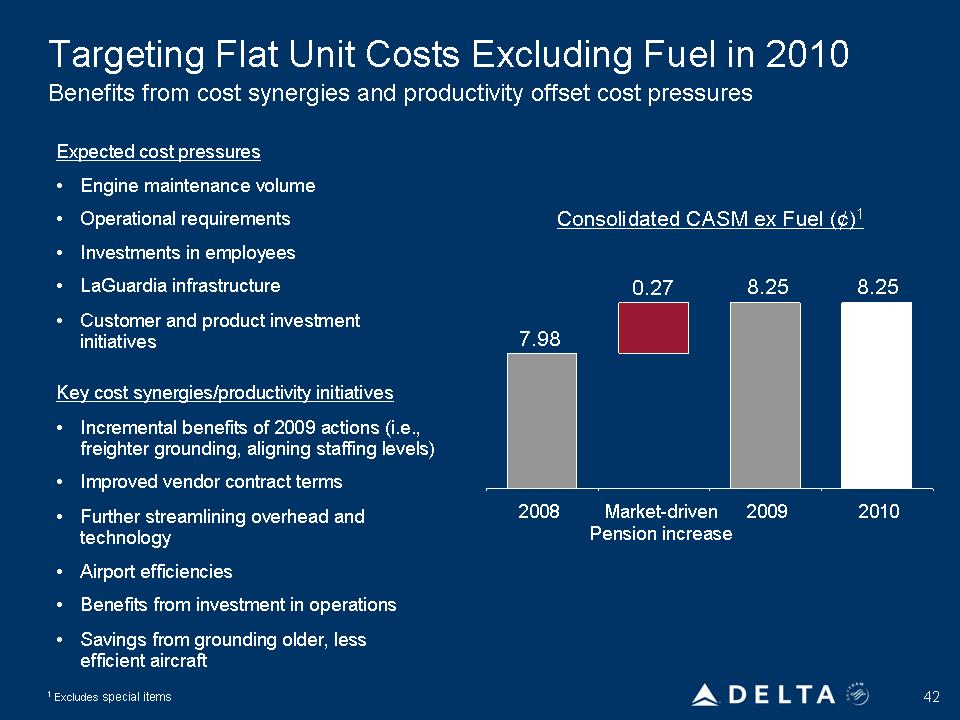
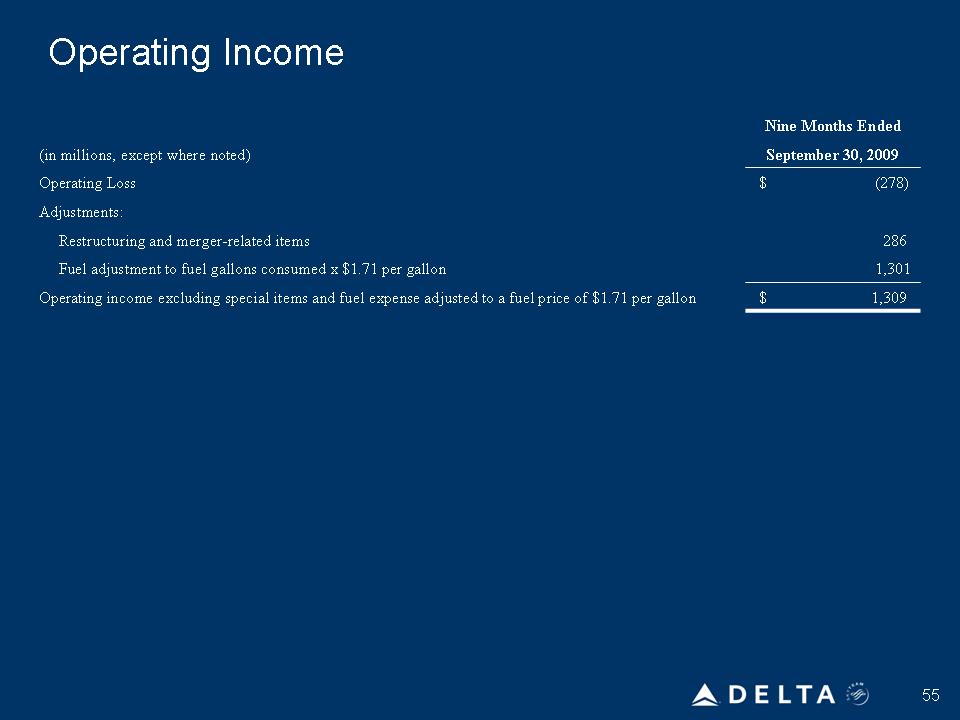
Delta’s Financial Performance Has Been Solid At market fuel prices, Delta would have generated a net profit in the midst of the worst economic environment in our history Operating Revenue $28.1 Operating Expense ($28.0)
Operating Income $0.1
Non-op Expense ($1.2)
Net Loss ($1.1)
Operating Revenue $28.1
Operating Expense ($26.6)
Operating Income $1.5
Non-op Expense ($1.2)
Net Income $0.3
Operating Margin 5.4%
Projected 2009 Results1 Projected 2009 Results at Market
Fuel Prices1 (in billions) (in billions)
1All results exclude special items. Including special items, Delta’s net loss for 2009 is projected to be $1.5 billion.
6
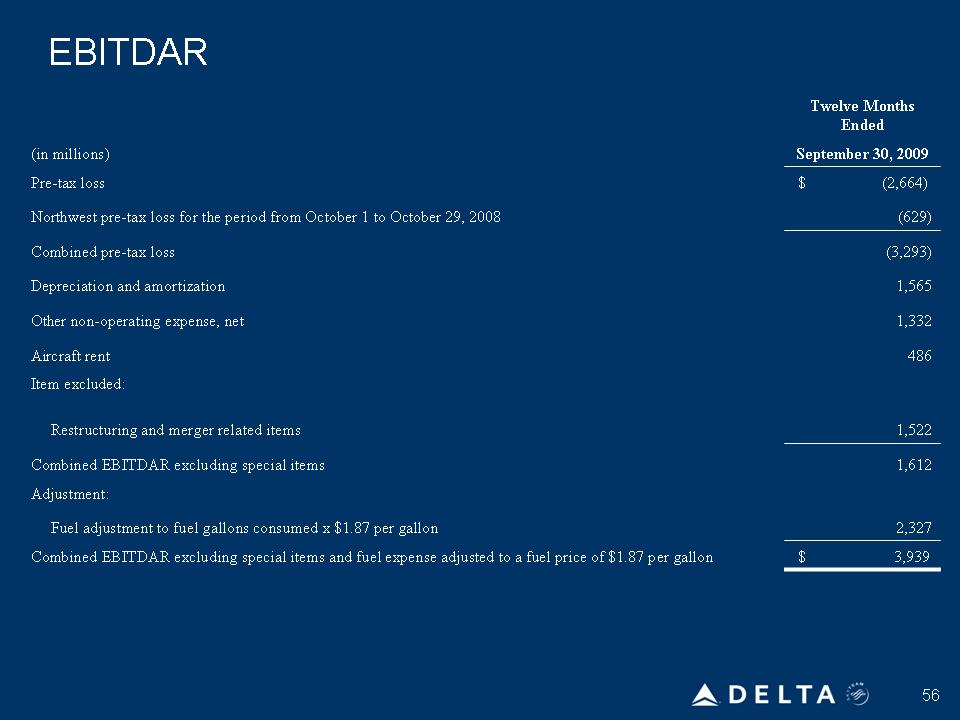
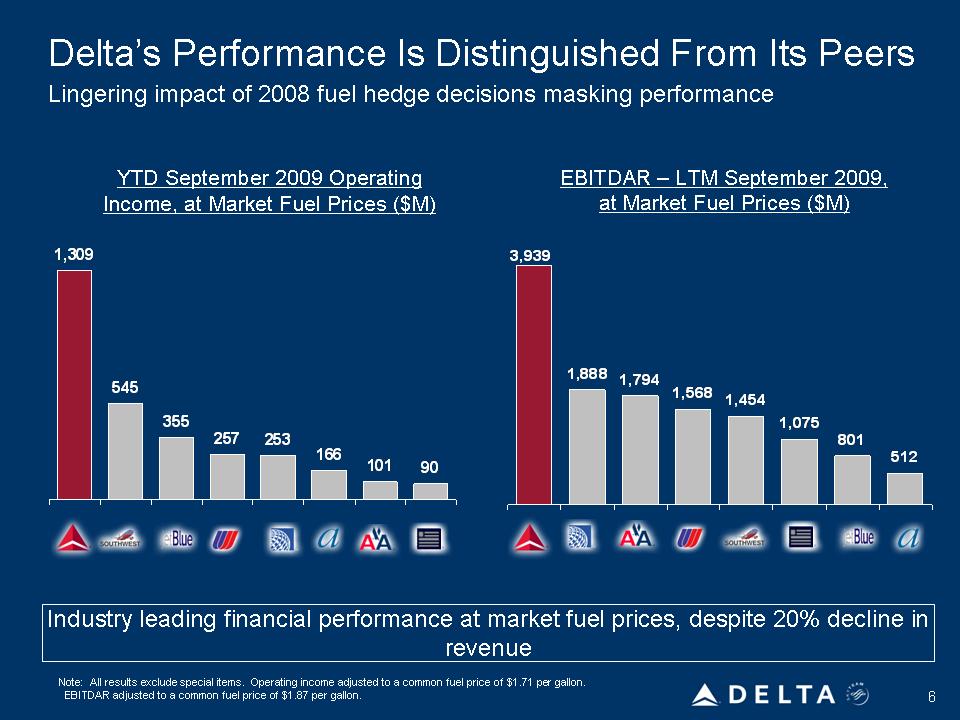
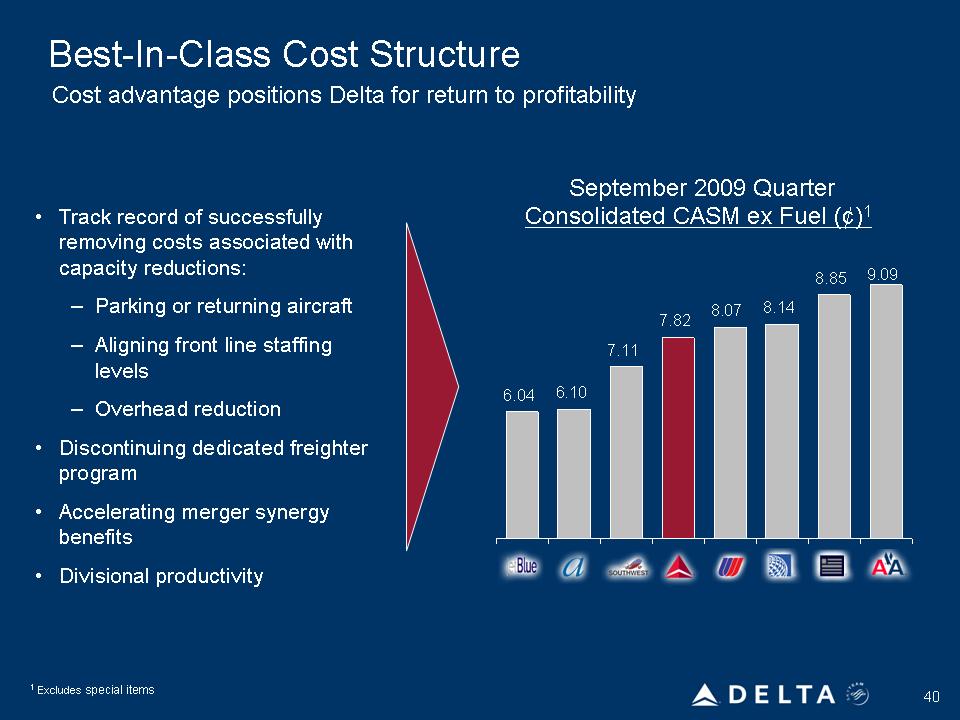
Delta’s Performance Is Distinguished From Its Peers 1,309 545 355 257 253 166 101 90 YTD September 2009 Operating Income, at Market Fuel Prices ($M) Note: All results exclude special items. Operating income adjusted to a common fuel price of $1.71 per gallon. EBITDAR adjusted to a common fuel price of $1.87 per gallon. Industry leading financial performance at market fuel prices, despite 20% decline in revenue EBITDAR – LTM September 2009, at Market Fuel Prices ($M) 1,888 1,794 1,568 1,454 1,075 801 512 3,939 Lingering impact of 2008 fuel hedge decisions masking performance
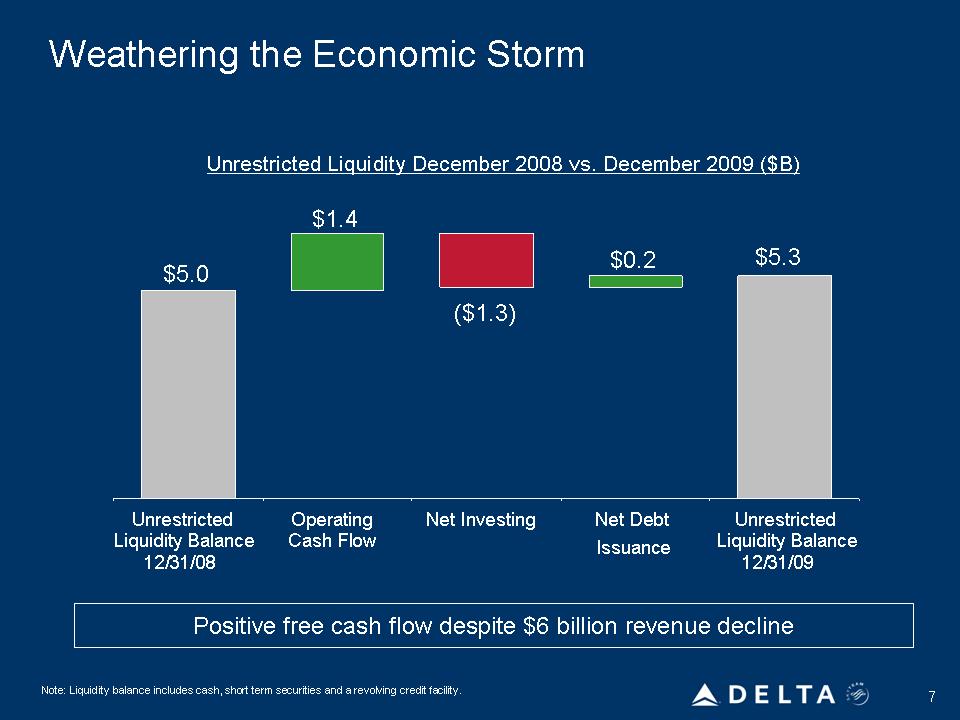
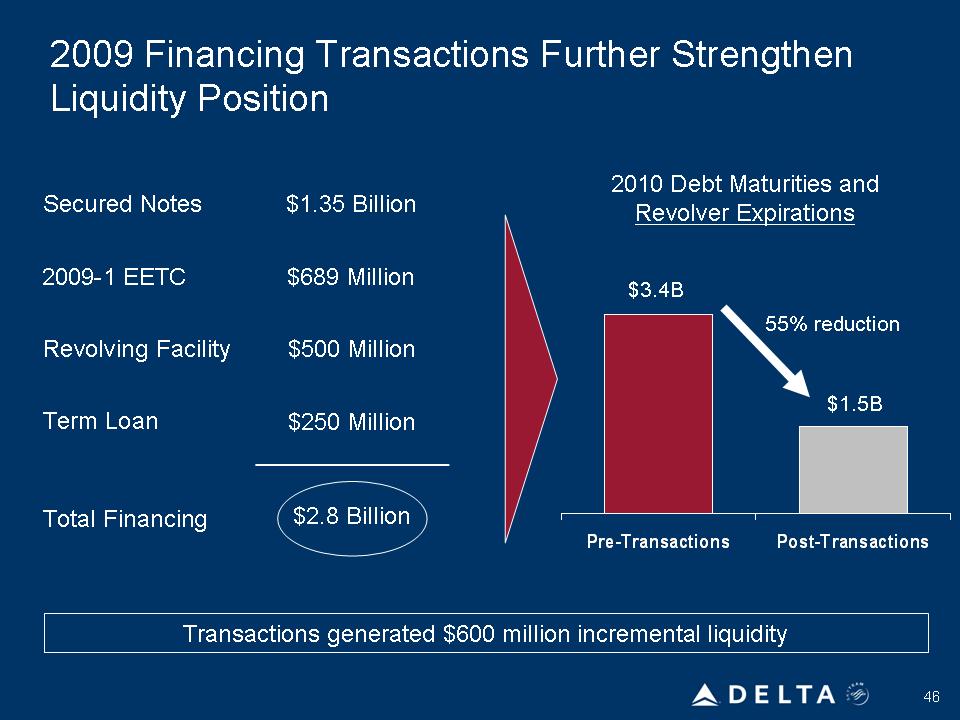
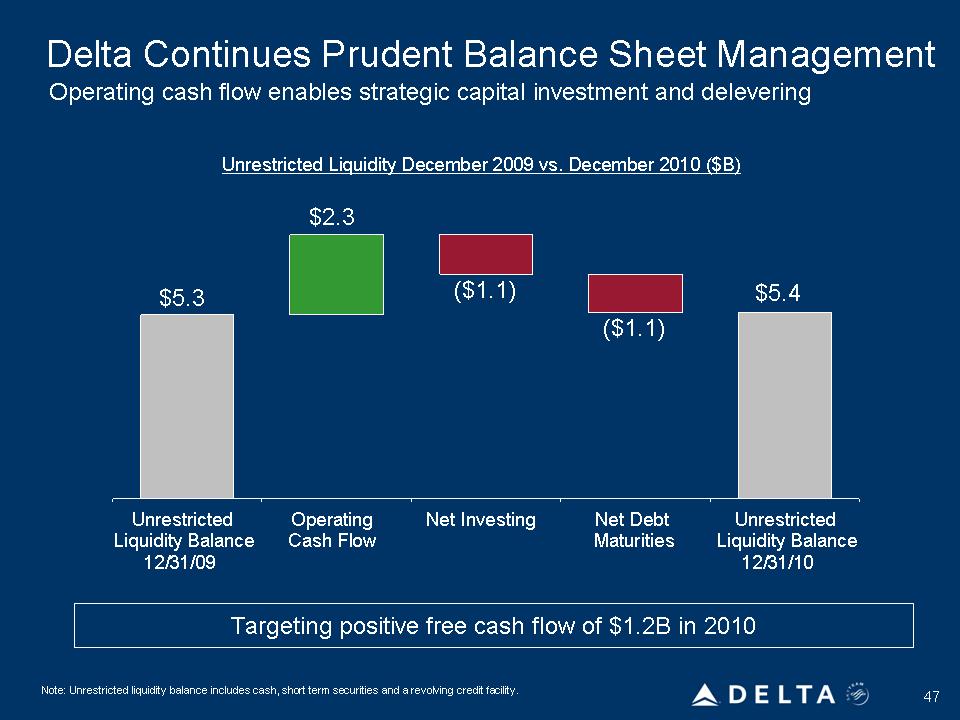
Weathering the Economic Storm Unrestricted Liquidity December 2008 vs. December 2009 ($B) $1.4 $0.2 $5.3 $5.0 ($1.3)
Unrestricted Operating Net Investing Net Debt Unrestricted Liquidity Balance Cash Flow Issuance Liquidity Balance 12/31/08 12/31/09
7 Note: Liquidity balance includes cash, short term securities and a revolving credit facility. Positive free cash flow despite $6 billion revenue decline
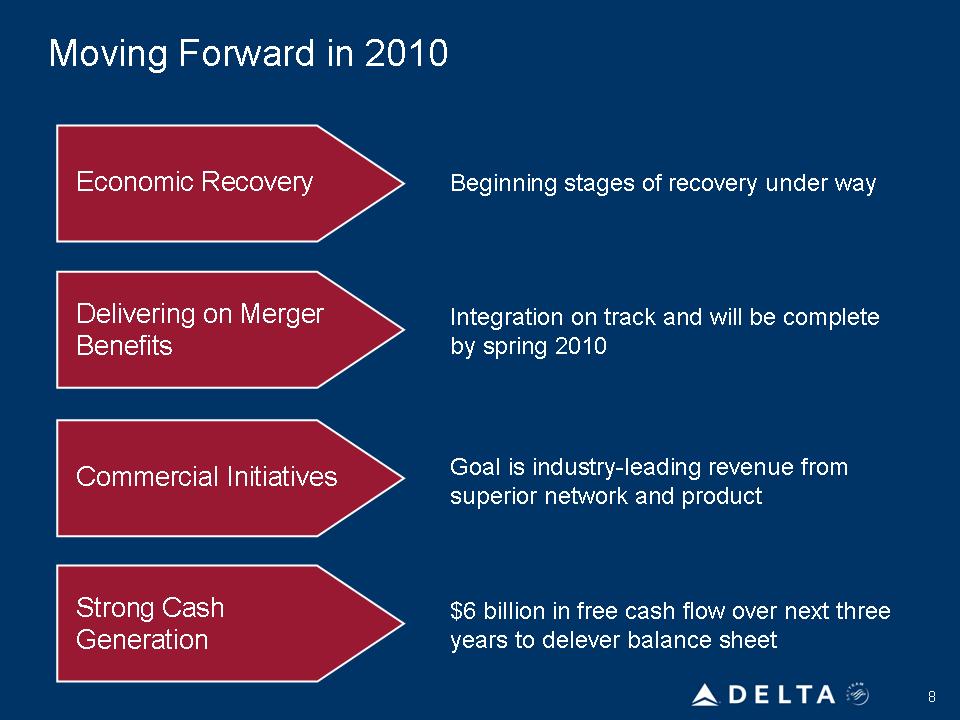
Moving Forward in 2010 Commercial Initiatives Economic Recovery Strong Cash Generation Delivering on Merger Benefits Beginning stages of recovery under way Integration on track and will be complete by spring 2010 Goal is industry-leading revenue from superior network and product $6 billion in free cash flow over next three years to delever balance sheet
Unit Revenue Decline Has Abated
Improvement driven by prior year comparisons, incremental capacity reductions and start of economic recovery
Passenger Unit Revenue – 2009 vs. 2008
Jan Feb Mar Apr May Jun Jul Aug Sep Oct Nov Dec
0%
(1%)
-5%
-10%
-15%
-20%
-25%
(23%)
9
Sequential RASM Improvement
Based on normal seasonal trends, December PRASM has experienced 16% sequential improvement
2009 Passenger RASM (cents)
10.88 10.80 10.80
10.61 10.58
16%
10.21
10.14
9.29
June July August September October November December Historical
Forecast December
Relationship 1
1 Based on the 2005-2007 relationship between summer and December unit revenues
10
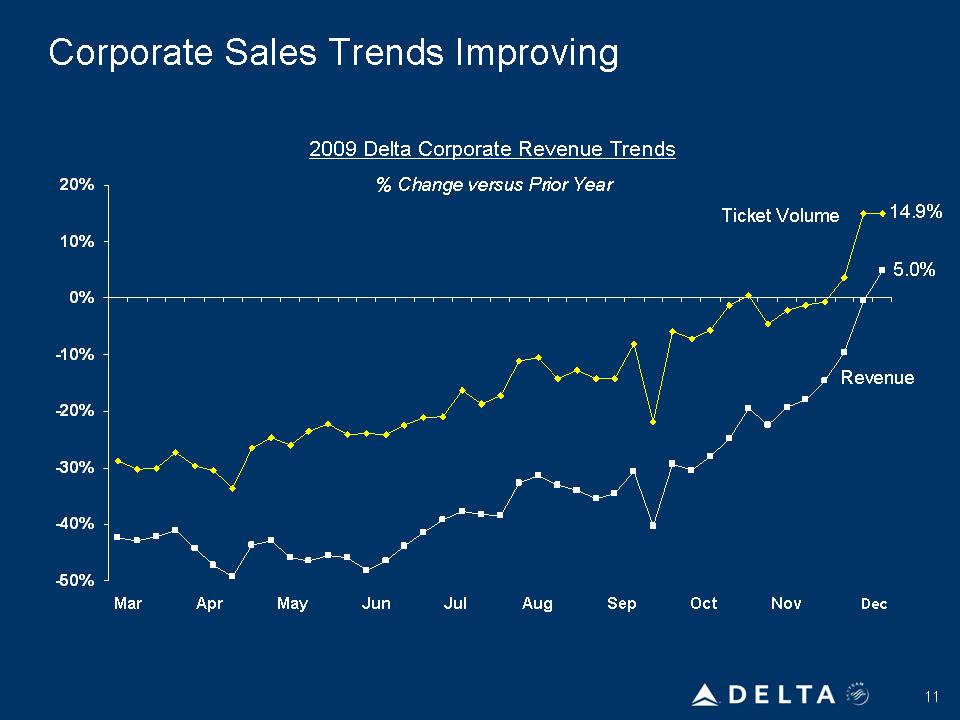
Corporate Sales Trends Improving
2009 Delta Corporate Revenue Trends
% Change versus Prior Year
-50%
-40%
-30%
-20%
-10%
0%
10%
20%
Ticket Volume
Revenue
Mar Apr May
Jun Jul
Aug
Sep
Oct Nov Dec
14.9%
5.0%
11
Revenue Strength Driving Improved December
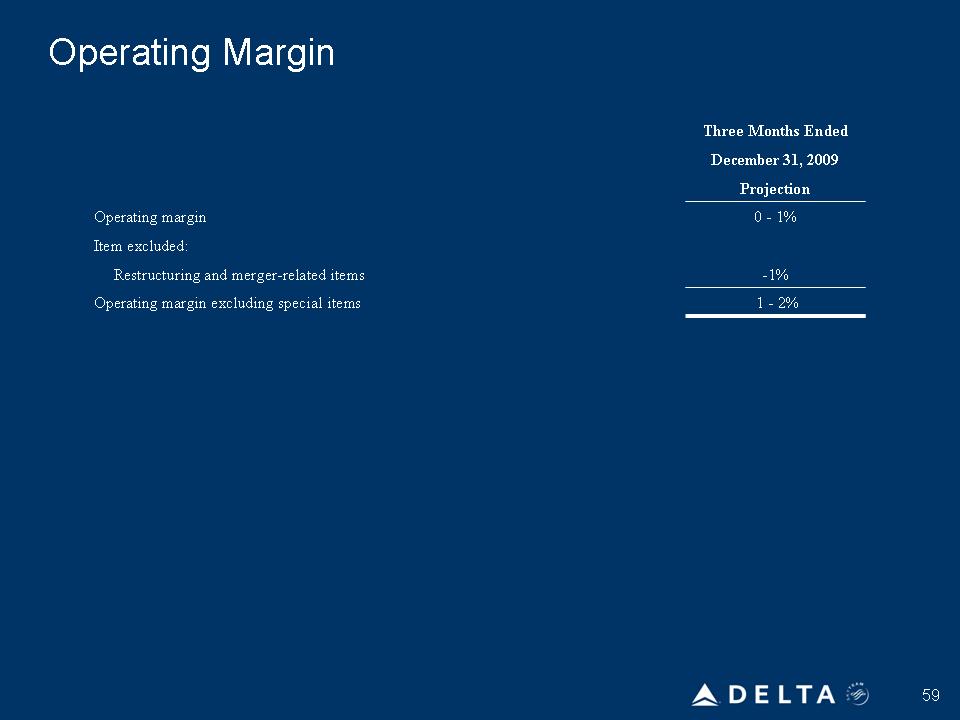
Quarter Expectations
December quarter 2009
Current projection
Operating margin1 1 – 2%
Total liquidity $5.3 billion
December quarter 2009
vs. December quarter 2008
Consolidated passenger unit revenue Down 5 – 6%
1 Excludes special items. Including special items, Delta’s operating margin for the
December quarter 2009 is projected to be 0-1%.
12Corporate Sales Trends Improving
13
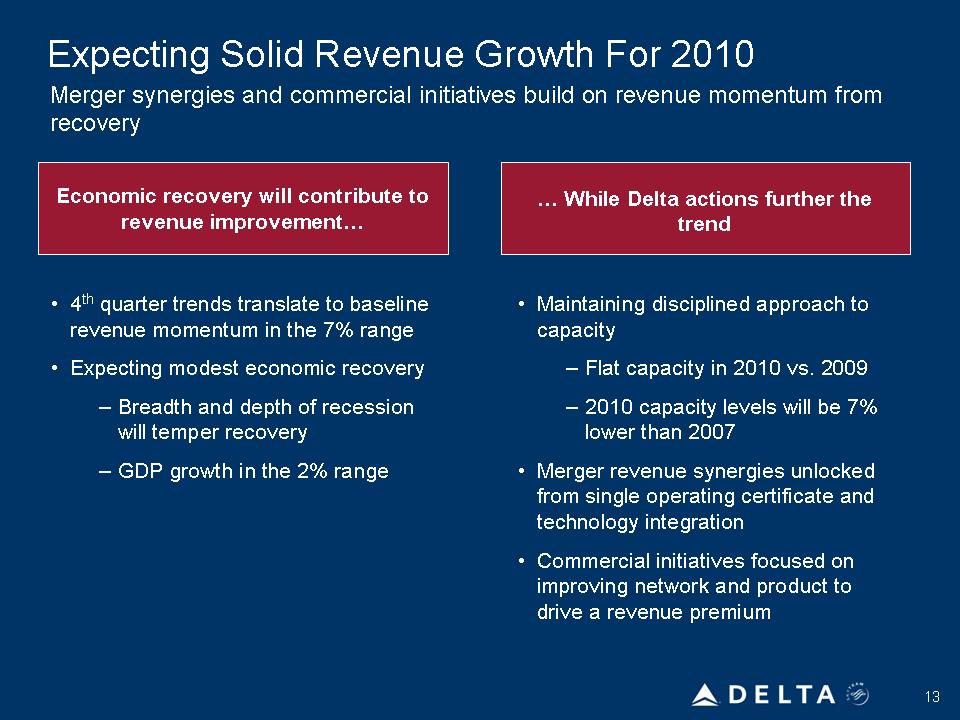
Expecting Solid Revenue Growth For 2010
•4th quarter trends translate to baseline revenue momentum in the 7% range
• Expecting modest economic recovery
– Breadth and depth of recession
will temper recovery
– GDP growth in the 2% range
Merger synergies and commercial initiatives build on revenue momentum from recovery
Economic recovery will contribute to revenue improvement…
… While Delta actions further the trend
• Maintaining disciplined approach to capacity
– Flat capacity in 2010 vs. 2009
– 2010 capacity levels will be 7% lower than 2007
• Merger revenue synergies unlocked from single operating certificate and technology integration
• Commercial initiatives focused on improving network and product to drive a revenue premium
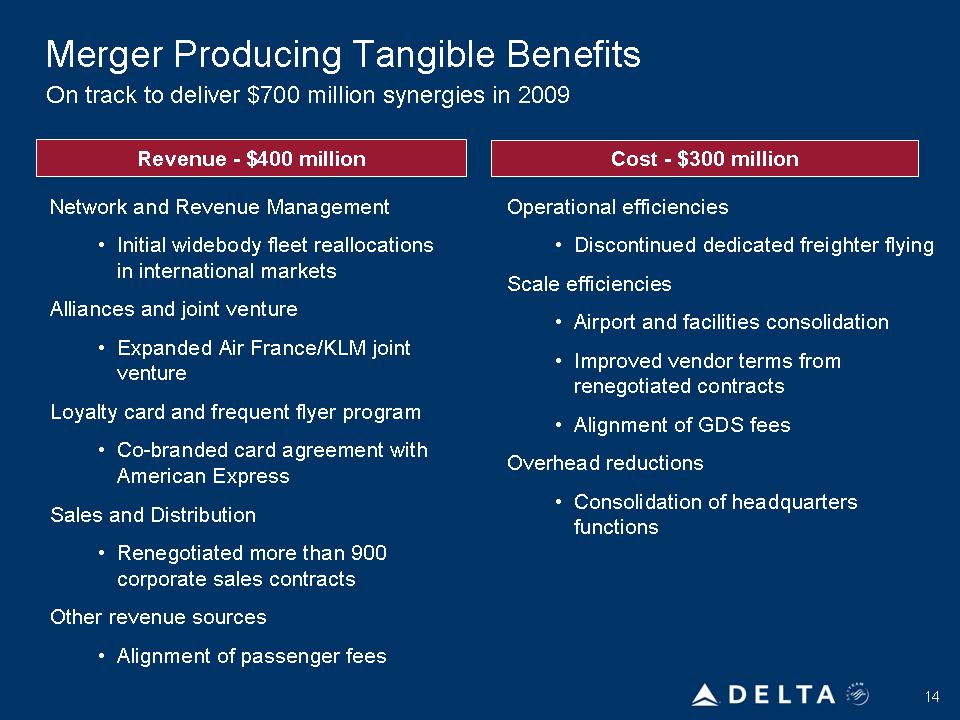
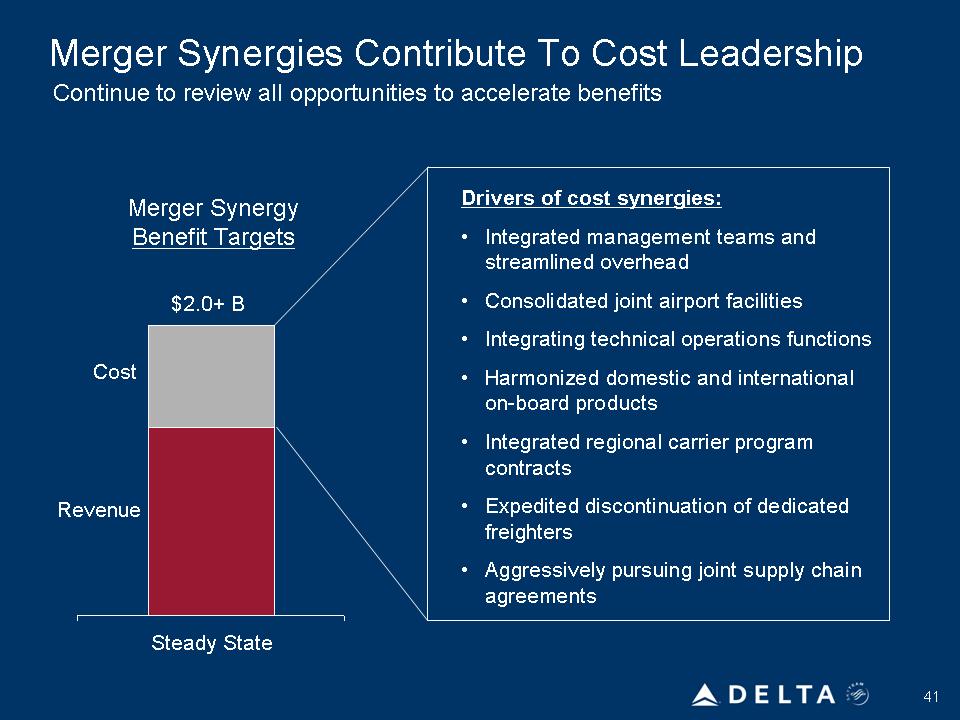
14 Merger Producing Tangible Benefits Revenue -$400 million Cost -$300 million Network and Revenue Management • Initial widebody fleet reallocations in international markets Alliances and joint venture • Expanded Air France/KLM joint venture Loyalty card and frequent flyer program • Co-branded card agreement with American Express Sales and Distribution • Renegotiated more than 900 corporate sales contracts Other revenue sources • Alignment of passenger fees Operational efficiencies • Discontinued dedicated freighter flying Scale efficiencies • Airport and facilities consolidation • Improved vendor terms from renegotiated contracts • Alignment of GDS fees Overhead reductions • Consolidation of headquarters functions On track to deliver $700 million synergies in 2009
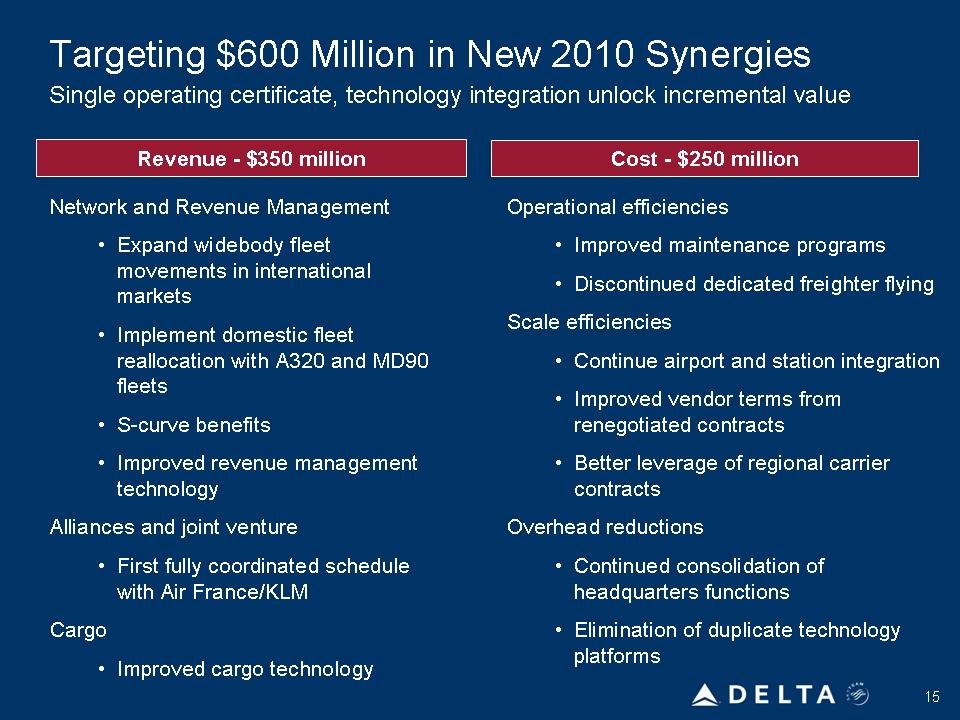
15 Targeting $600 Million in New 2010 Synergies Revenue -$350 million Cost -$250 million Network and Revenue Management • Expand widebody fleet movements in international markets • Implement domestic fleet reallocation with A320 and MD90 fleets • S-curve benefits • Improved revenue management technology Alliances and joint venture • First fully coordinated schedule with Air France/KLM Cargo • Improved cargo technology Operational efficiencies • Improved maintenance programs • Discontinued dedicated freighter flying Scale efficiencies • Continue airport and station integration • Improved vendor terms from renegotiated contracts • Better leverage of regional carrier contracts Overhead reductions • Continued consolidation of headquarters functions • Elimination of duplicate technology platforms Single operating certificate, technology integration unlock incremental value
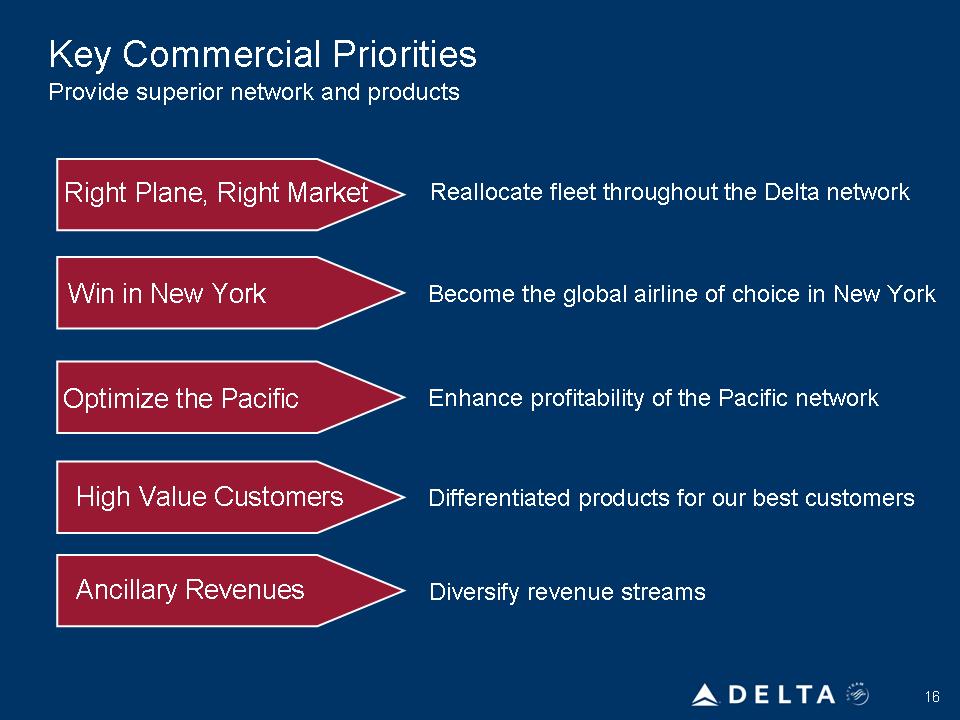
Key Commercial Priorities
Provide superior network and products
Optimize the Pacific
Right Plane, Right Market
High Value Customers
Win in New York
Ancillary Revenues
Reallocate fleet throughout the Delta network
Become the global airline of choice in New York
Enhance profitability of the Pacific network
Differentiated products for our best customers
Diversify revenue streams
16
Free Cash Flow Will Drive Balance Sheet Delevering
Strong operating cash flow, coupled with minimal capital requirements
Total Three Year Projection
2010 – 2012
Adjusted Net Debt ($B)
Operating Cash Flow $9 -$10 billion $16
$18 $16.3
Capital Expenditures $3 -$4 billion
$12
$14
Free Cash Flow ~$6 billion $10
$8
$6
12/31/09 12/31/12
$9.5
17
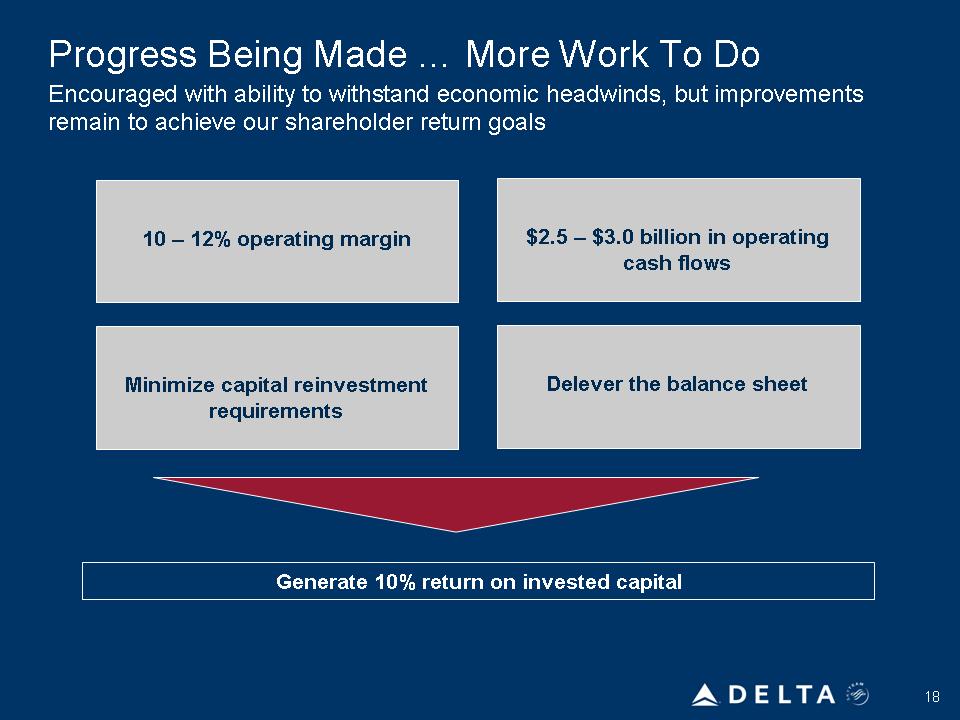
18 Progress Being Made … More Work To Do Encouraged with ability to withstand economic headwinds, but improvements remain to achieve our shareholder return goals 10 – 12% operating margin $2.5 – $3.0 billion in operating cash flows Minimize capital reinvestment requirements Delever the balance sheet Generate 10% return on invested capital
Delta: Generating A Revenue Premium
Glen Hauenstein
Executive Vice President – Network and Revenue
Management
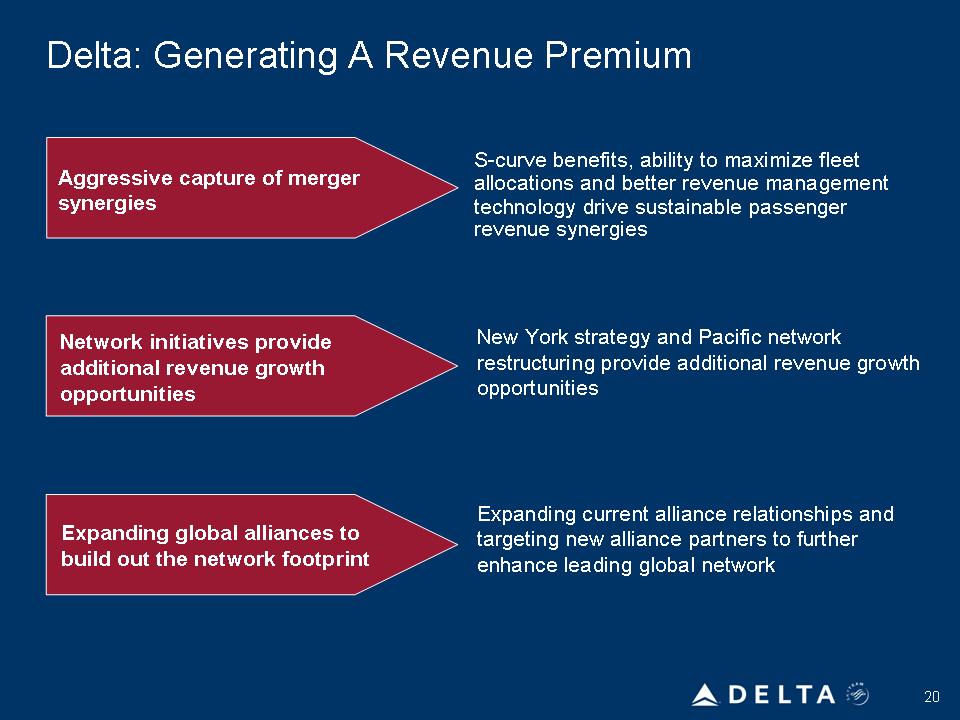
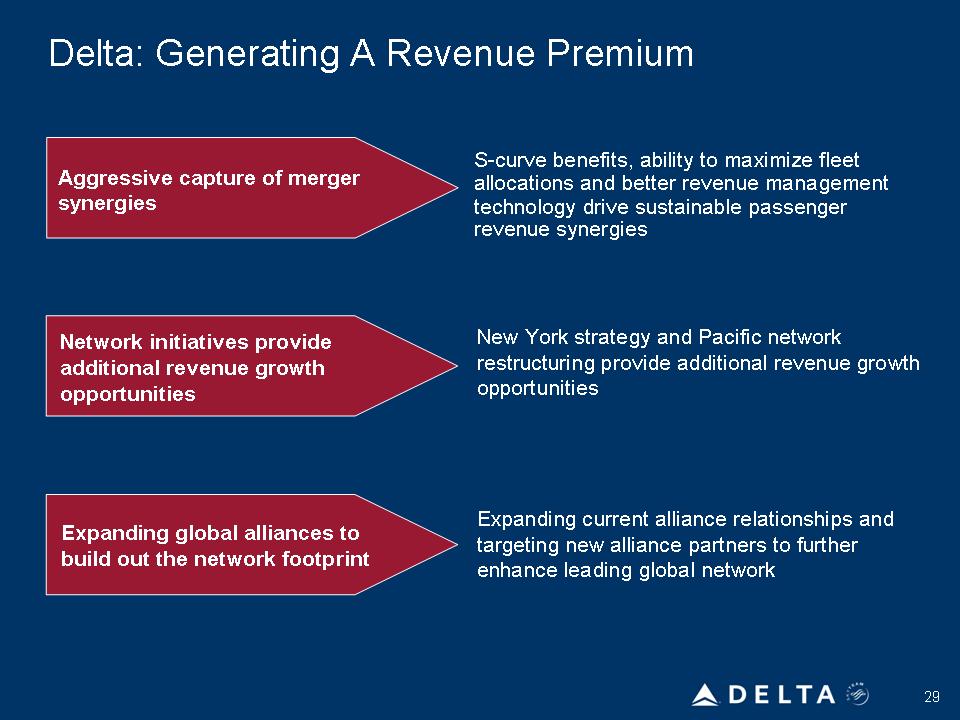
Delta: Generating A Revenue Premium Network initiatives provide additional revenue growth opportunities Aggressive capture of merger synergies Expanding global alliances to build out the network footprint S-curve benefits, ability to maximize fleet allocations and better revenue management technology drive sustainable passenger revenue synergies New York strategy and Pacific network restructuring provide additional revenue growth opportunities Expanding current alliance relationships and targeting new alliance partners to further enhance leading global network 20
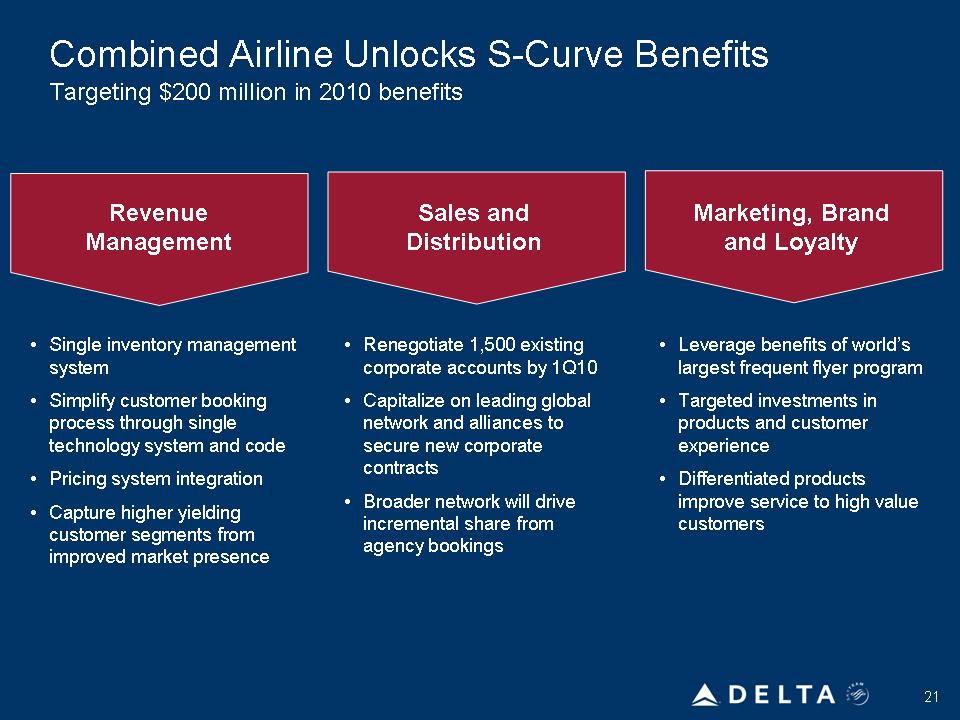
Combined Airline Unlocks S-Curve Benefits
Targeting $200 million in 2010 benefits
Revenue
Management
Sales and
Distribution Marketing, Brand and Loyalty
• Single inventory management system
• Simplify customer booking process through single technology system and code
• Pricing system integration
• Capture higher yielding customer segments from improved market presence
• Renegotiate 1,500 existing corporate accounts by 1Q10
• Leverage benefits of world’s largest frequent flyer program
• Capitalize on leading global network and alliances to secure new corporate
• Targeted investments in products and customer experience
• contracts Broader network will drive incremental share from
• Differentiated products improve service to high value customers agency bookings
22
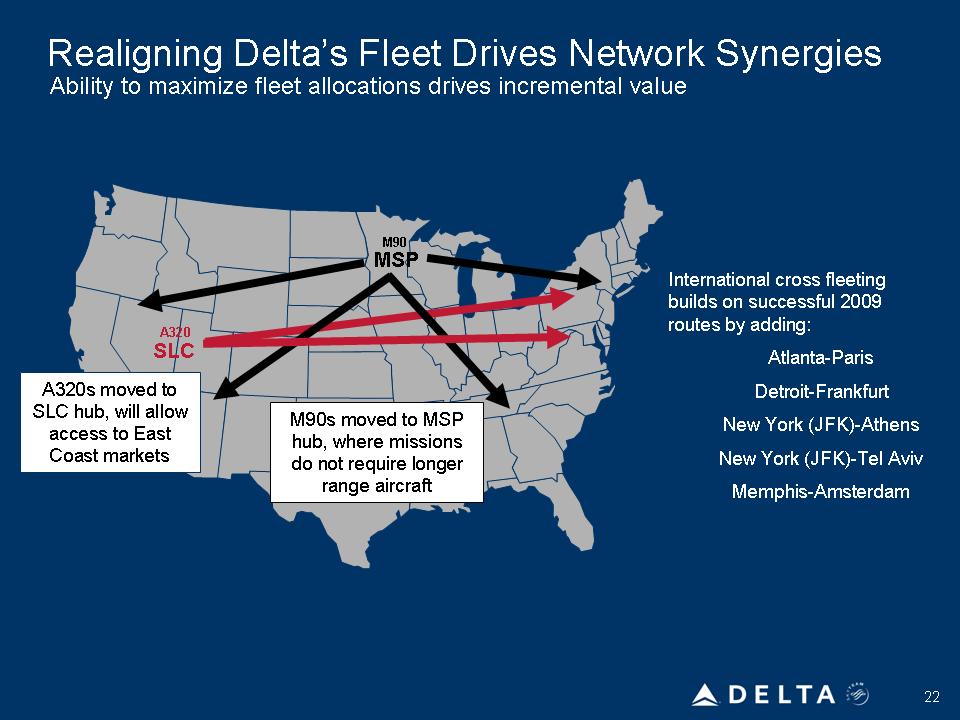
Realigning Delta’s Fleet Drives Network Synergies SLC MSP A320 M90 Ability to maximize fleet allocations drives incremental value A320s moved to SLC hub, will allow access to East Coast markets M90s moved to MSP hub, where missions do not require longer range aircraft International cross fleeting builds on successful 2009 routes by adding: Atlanta-Paris Detroit-Frankfurt New York (JFK)-Athens New York (JFK)-Tel Aviv Memphis-Amsterdam
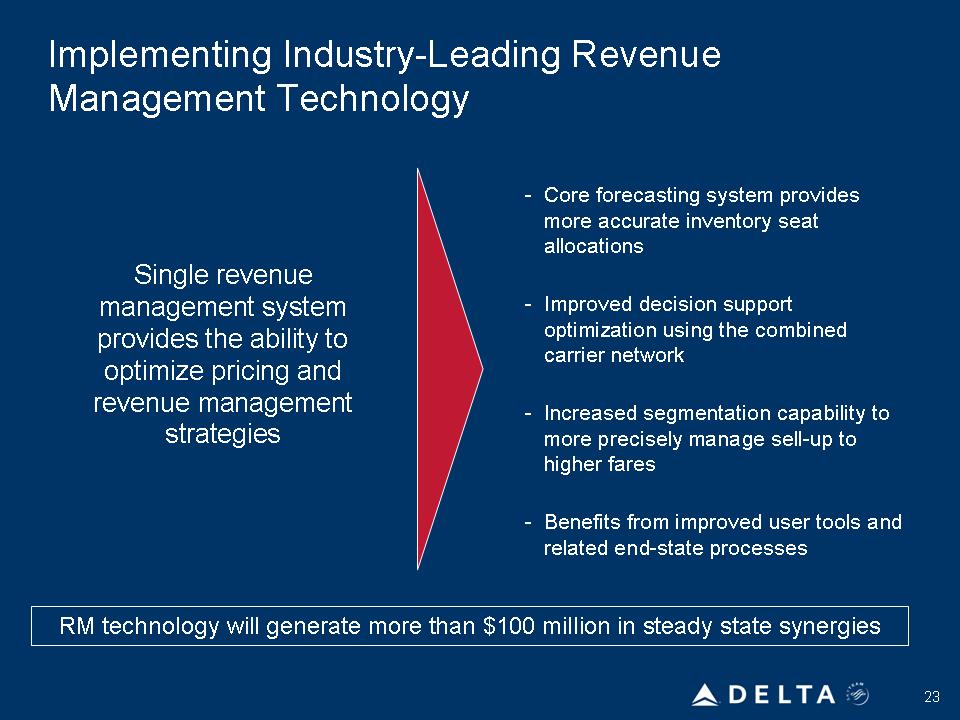
Implementing Industry-Leading Revenue Management Technology Single revenue management system provides the ability to optimize pricing and revenue management strategies -Core forecasting system provides more accurate inventory seat allocations -Improved decision support optimization using the combined carrier network -Increased segmentation capability to more precisely manage sell-up to higher fares -Benefits from improved user tools and related end-state processes RM technology will generate more than $100 million in steady state synergies
24
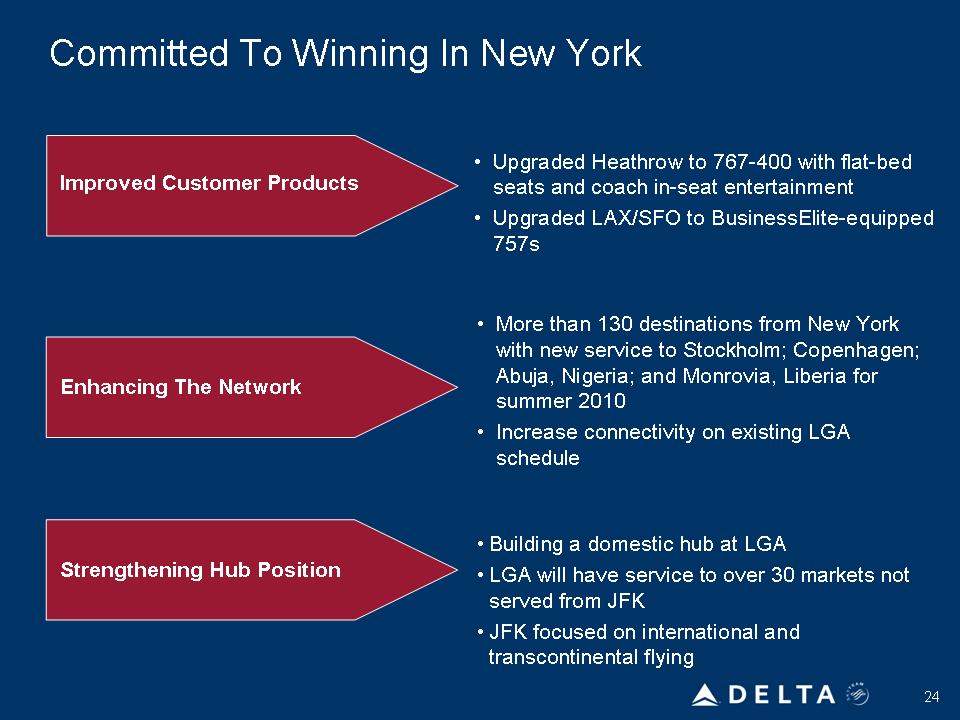
Committed To Winning In New York
• Upgraded Heathrow to 767-400 with flat-bed seats and coach in-seat entertainment
• Upgraded LAX/SFO to BusinessElite-equipped 757s Enhancing The Network
• More than 130 destinations from New York with new service to Stockholm; Copenhagen;
Abuja, Nigeria; and Monrovia, Liberia for summer 2010
• Increase connectivity on existing LGA schedule
• Building a domestic hub at LGA
• LGA will have service to over 30 markets not served from JFK
• JFK focused on international and transcontinental flying
Strengthening Hub Position
Improved Customer Products
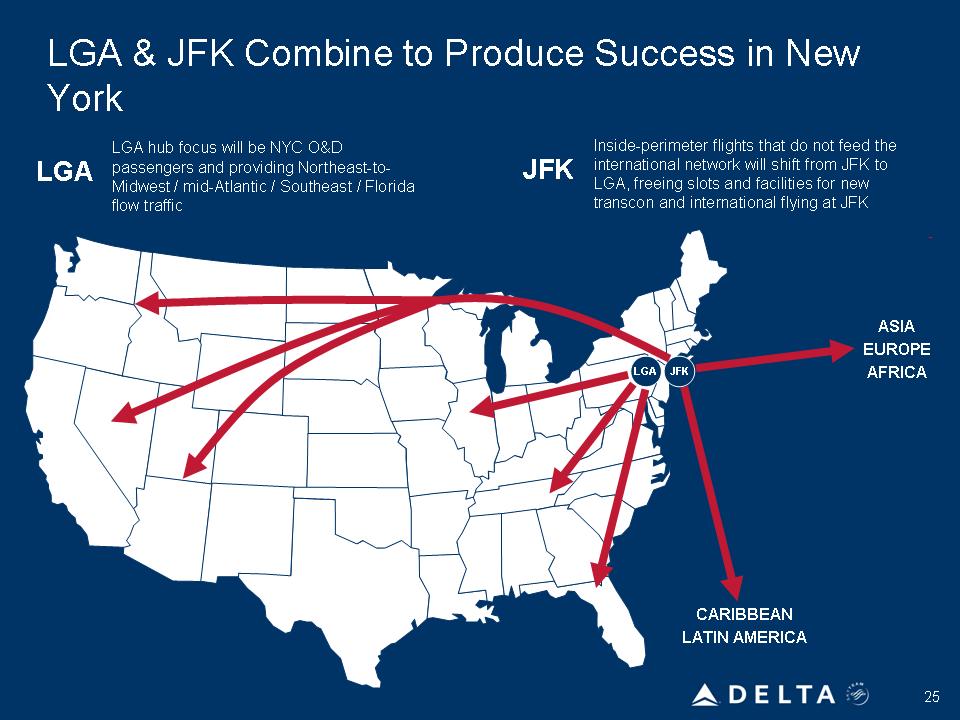
LGA & JFK Combine to Produce Success in New York
LGA hub focus will be NYC O&D Inside-perimeter flights that do not feed the
LGA passengers and providing Northeast-to-JFK international network will shift from JFK to Midwest / mid-Atlantic / Southeast / Florida LGA, freeing slots and facilities for new flow traffic transcon and international flying at JFK
2525LGA JFK
CARIBBEAN
LATIN AMERICA
ASIA
EUROPE
AFRICA
26
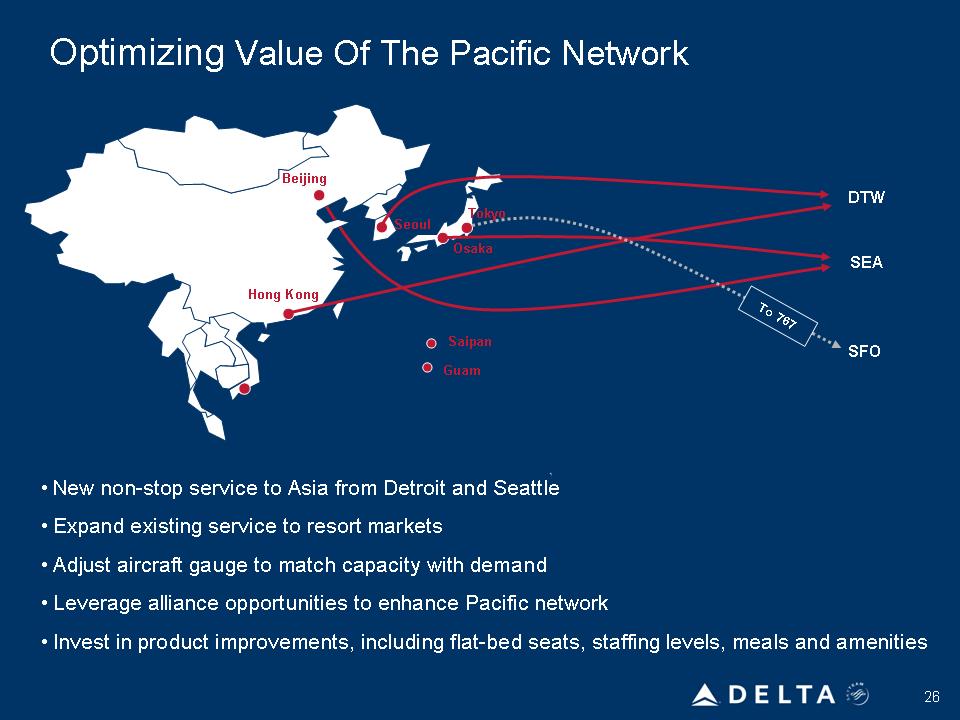
Optimizing Value Of The Pacific Network DTW Beijing Hong Kong Tokyo Osaka Saip Guam Seoul SEA SFO To767 • New non-stop service to Asia from Detroit and Seattle
• Expand existing service to resort markets
• Adjust aircraft gauge to match capacity with demand
• Leverage alliance opportunities to enhance Pacific network
• Invest in product improvements, including flat-bed seats, staffing levels, meals and amenities
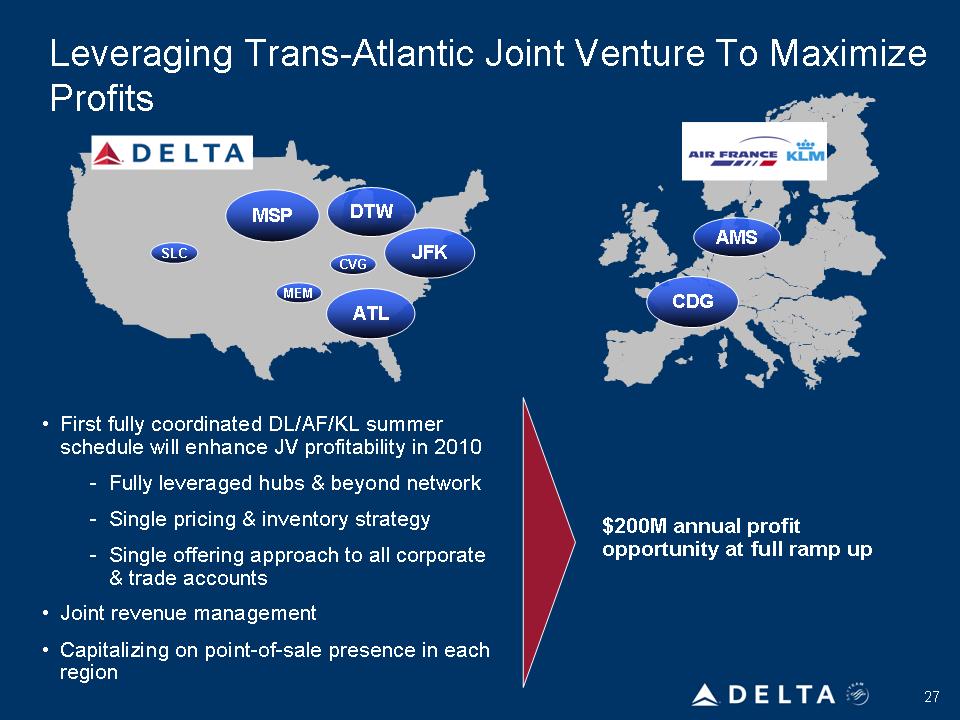
2727Leveraging Trans-Atlantic Joint Venture To Maximize Profits
JFK ATL CDG AMS DTWMSP MEM CVG SLC
• $200M annual profit opportunity at full ramp up
• First fully coordinated DL/AF/KL summer schedule will enhance JV profitability in 2010
-Fully leveraged hubs & beyond network
-Single pricing & inventory strategy
-Single offering approach to all corporate & trade accounts
• Joint revenue management
• Capitalizing on point-of-sale presence in each region
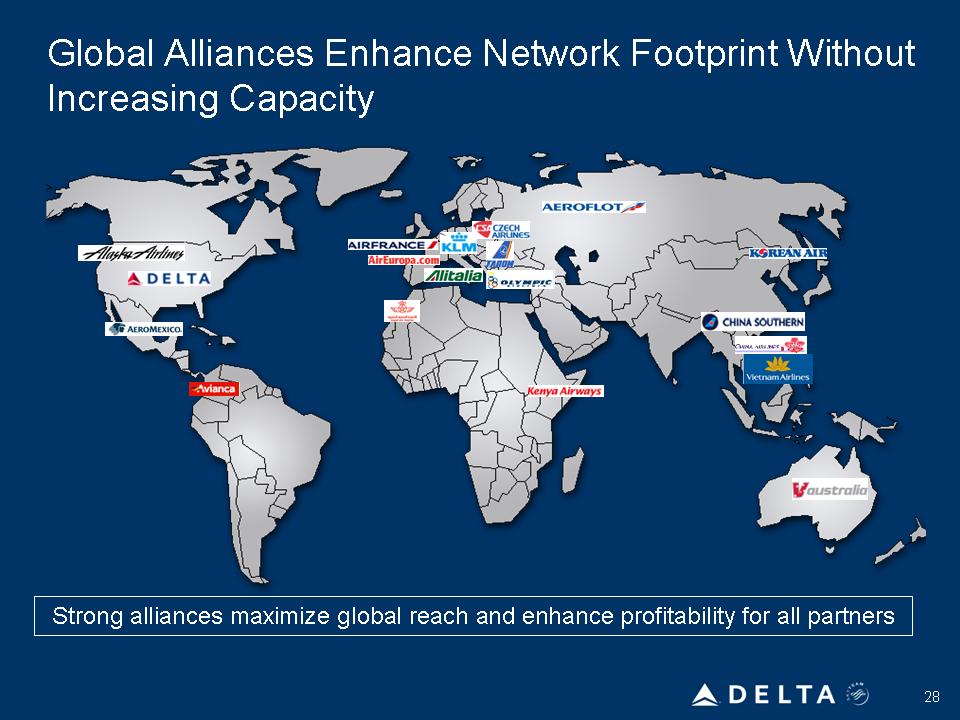
Global Alliances Enhance Network Footprint Without Increasing Capacity
28
Strong alliances maximize global reach and enhance profitability for all partners
Delta: Generating A Revenue Premium
Network initiatives provide additional revenue growth opportunities
Aggressive capture of merger synergies
Expanding global alliances to build out the network footprint
S-curve benefits, ability to maximize fleet allocations and better revenue management technology drive sustainable passenger revenue synergies
New York strategy and Pacific network restructuring provide additional revenue growth opportunities
Expanding current alliance relationships and targeting new alliance partners to further enhance leading global network
29
Delta: Labor Integration
Mike Campbell
Executive Vice President – HR and Labor Relations
Delta: Single Carrier Operations
Steve Gorman
Executive Vice President & Chief Operating Officer
32
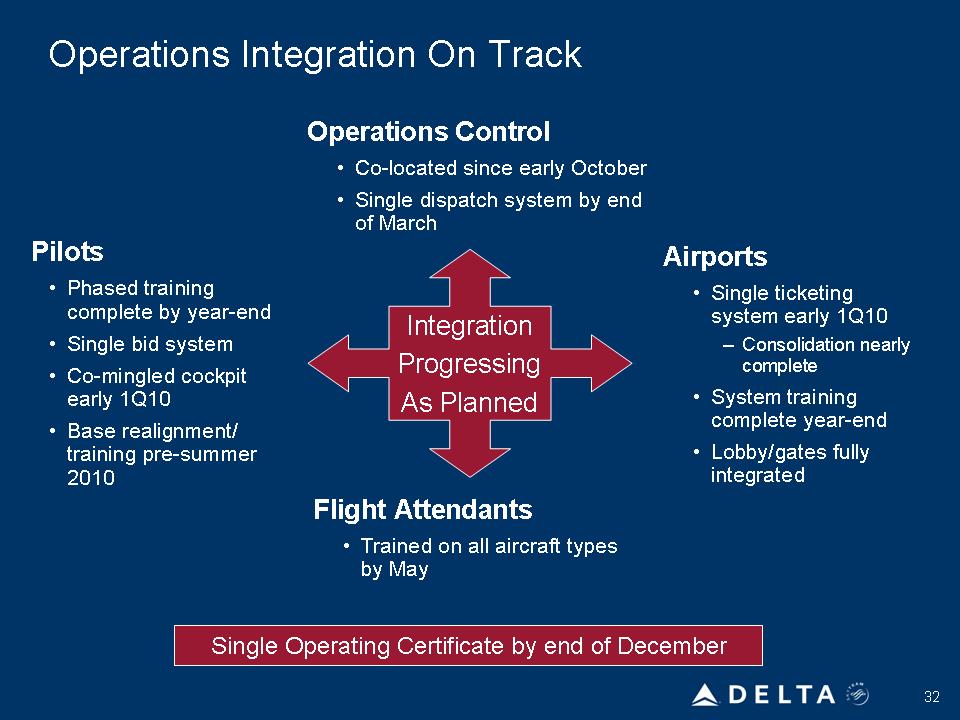
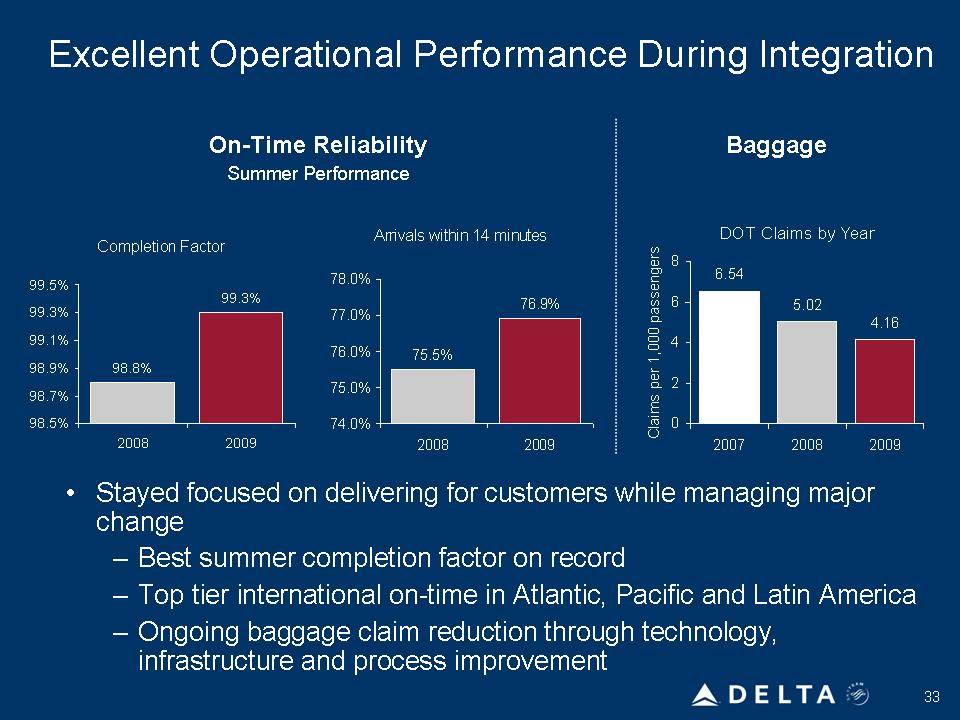
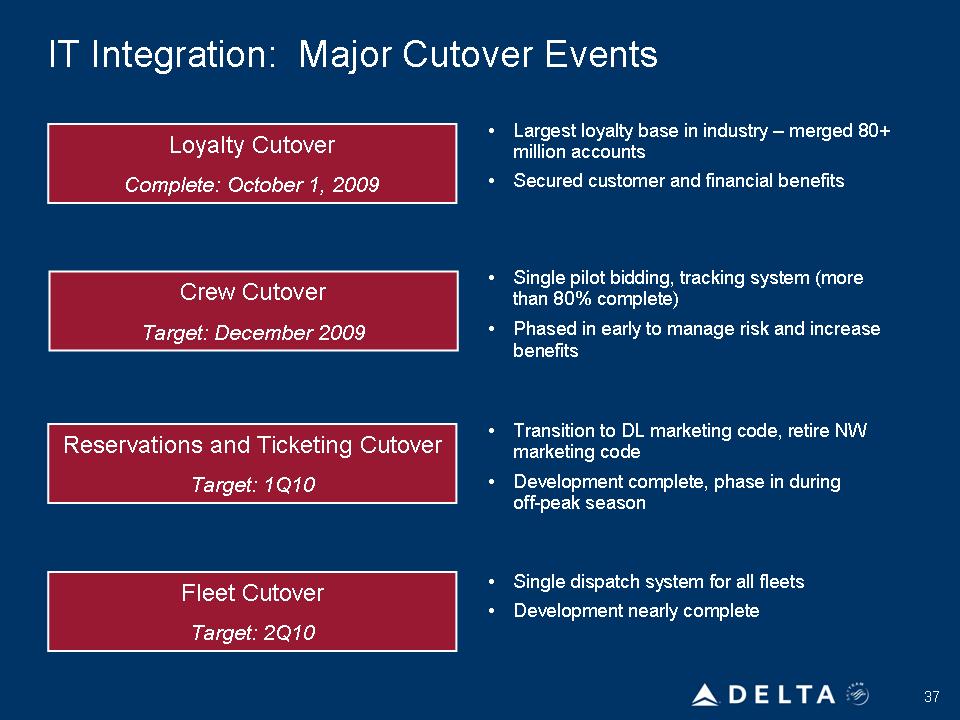
Operations Integration On Track Airports
• Single ticketing system early 1Q10
– Consolidation nearly complete
• System training complete year-end
• Lobby/gates fully integrated Pilots
• Phased training complete by year-end
• Single bid system
• Co-mingled cockpit early 1Q10
• Base realignment/ training pre-summer 2010
Integration
Progressing
As Planned
Flight Attendants
• Trained on all aircraft types by May Operations Control
• Co-located since early October
• Single dispatch system by end of March Single Operating Certificate by end of December