Exhibit 99.2
INSERT NEW IMAGE
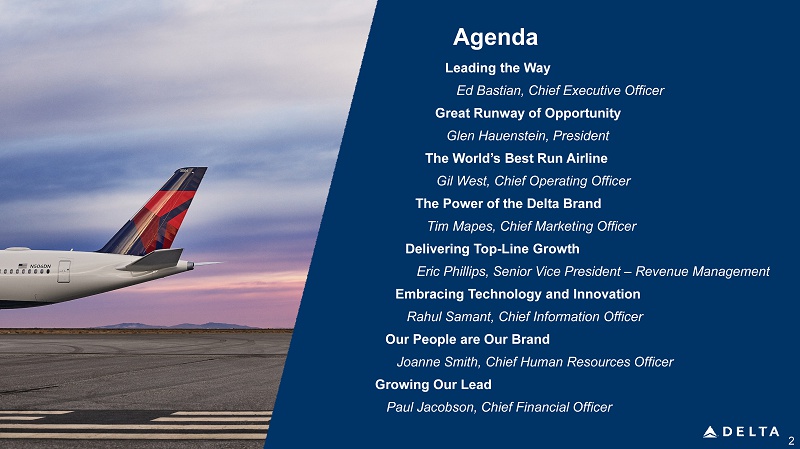
2 Leading the Way Ed Bastian, Chief Executive Officer Great Runway of Opportunity Glen Hauenstein, President The World’s Best Run Airline Gil West, Chief Operating Officer The Power of the Delta Brand Tim Mapes, Chief Marketing Officer Delivering Top - Line Growth Eric Phillips, Senior Vice President – Revenue Management Embracing Technology and Innovation Rahul Samant, Chief Information Officer Our People are Our Brand Joanne Smith, Chief Human Resources Officer Growing Our Lead Paul Jacobson, Chief Financial Officer Agenda
3 Safe Harbor Statements in this presentation that are not historical facts, including statements regarding our estimates, expectations, beliefs, intentions, projections or strategies for the future, may be "forward - looking statements" as defined in the Private Securities Litigation Re form Act of 1995. All forward - looking statements involve a number of risks and uncertainties that could cause actual results to differ materially from the estimates, expectations, beliefs, intentions, projections and strategies reflected in or suggested by the forward - looking statements. Thes e risks and uncertainties include, but are not limited to, the cost of aircraft fuel; the impact of fuel hedging activity including rebal anc ing our hedge portfolio, recording mark - to - market adjustments or posting collateral in connection with our fuel hedge contracts; the availability of airc raft fuel; the performance of our significant investments in airlines in other parts of the world; the possible effects of accidents involvi ng our aircraft; breaches or security lapses in our information technology systems; disruptions in our information technology infrastructure; our dependen ce on technology in our operations; the restrictions that financial covenants in our financing agreements could have on our financial and busines s o perations; labor issues; the effects of weather, natural disasters and seasonality on our business; the effects of an extended disruption in s erv ices provided by third party regional carriers; failure or inability of insurance to cover a significant liability at Monroe’s Trainer refinery; the im pact of environmental regulation on the Trainer refinery, including costs related to renewable fuel standard regulations; our ability to retain sen ior management and key employees; damage to our reputation and brand if we are exposed to significant adverse publicity through social media; the ef fec ts of terrorist attacks or geopolitical conflict; competitive conditions in the airline industry; interruptions or disruptions in service at maj or airports at which we operate; the effects of extensive government regulation on our business; the sensitivity of the airline industry to prolonged pe riods of stagnant or weak economic conditions; uncertainty in economic conditions and regulatory environment in the United Kingdom related to the exit of the United Kingdom from the European Union; and the effects of the rapid spread of contagious illnesses. Additional information concerning risks and uncertainties that could cause differences between actual results and forward - lookin g statements is contained in our Securities and Exchange Commission filings, including our Annual Report on Form 10 - K for the fiscal year ended December 31, 2017 and our Quarterly Report on Form 10 - Q for the period ended March 31, 2018. Caution should be taken not to place undue reliance on our forward - looking statements, which represent our views only as of December 13, 2018, and which we have no current intention to update.
LEADING THE WAY Ed Bastian Chief Executive Officer
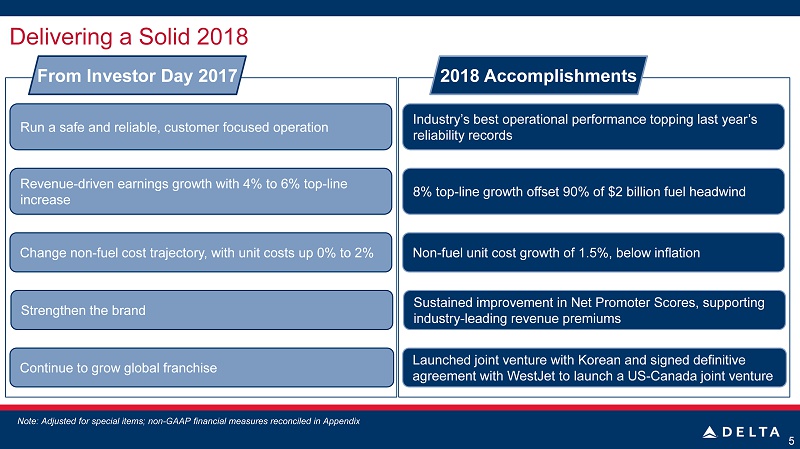
5 Delivering a Solid 2018 From Investor Day 2017 Run a safe and reliable, customer focused operation Revenue - driven earnings growth with 4% to 6% top - line increase Change non - fuel cost trajectory, with unit costs up 0% to 2% 2018 Accomplishments Continue to grow global franchise Industry’s best operational performance topping last year’s reliability records 8% top - line growth offset 90% of $2 billion fuel headwind Non - fuel unit cost growth of 1.5%, below inflation Launched joint venture with Korean and signed definitive agreement with WestJet to launch a US - Canada joint venture Strengthen the brand Sustained improvement in Net Promoter Scores, supporting industry - leading revenue premiums Note: Adjusted for special items; non - GAAP financial measures reconciled in Appendix
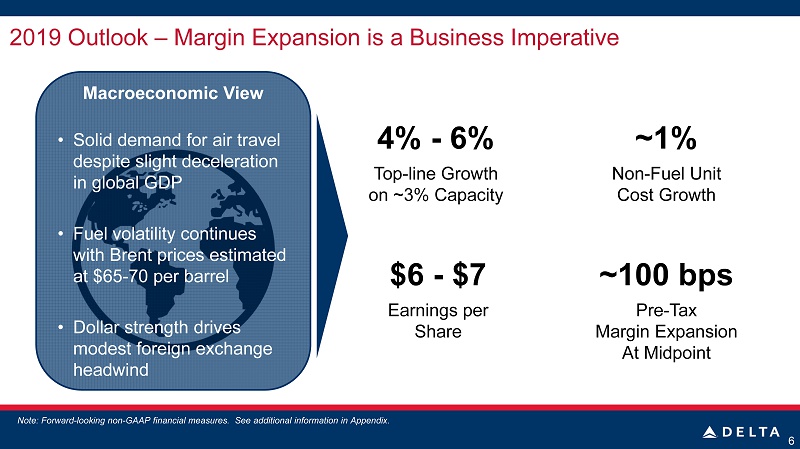
2019 Outlook – Margin Expansion is a Business Imperative 6 4% - 6% Top - line Growth on ~3% Capacity $6 - $7 Earnings per Share ~100 bps Pre - Tax Margin Expansion At Midpoint Macroeconomic View • Solid demand for air travel despite slight deceleration in global GDP • Fuel volatility continues with Brent prices estimated at $65 - 70 per barrel • Dollar strength drives modest foreign exchange headwind ~1% Non - Fuel Unit Cost Growth Note: Forward - looking non - GAAP financial measures. See additional information in Appendix.

Well Prepared to Manage Macro Risk Factors Fuel Volatility x Powerful brand enables strong fuel recapture x Maintaining capacity flexibility x Disciplined cost management Economic Slowdown x Structurally improved business model and industry x Investment - grade balance sheet x Increased revenue diversity Strong business model provides flexibility to manage macroeconomic challenges 7
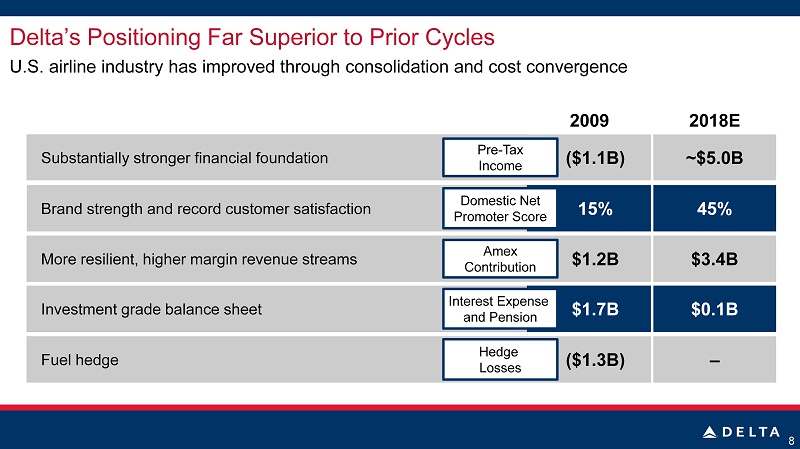
Delta’s Positioning Far Superior to Prior Cycles U.S. airline industry has improved through consolidation and cost convergence 8 15% $1.2B 45% $3.4B ($1.3B) – $1.7B $0.1B 2009 2018E Brand strength and record customer satisfaction More resilient, higher margin revenue streams Fuel hedge Investment grade balance sheet Interest Expense and Pension Domestic Net Promoter Score Amex Contribution Hedge Losses ($1.1B) ~$5.0B Substantially stronger financial foundation Pre - Tax Income
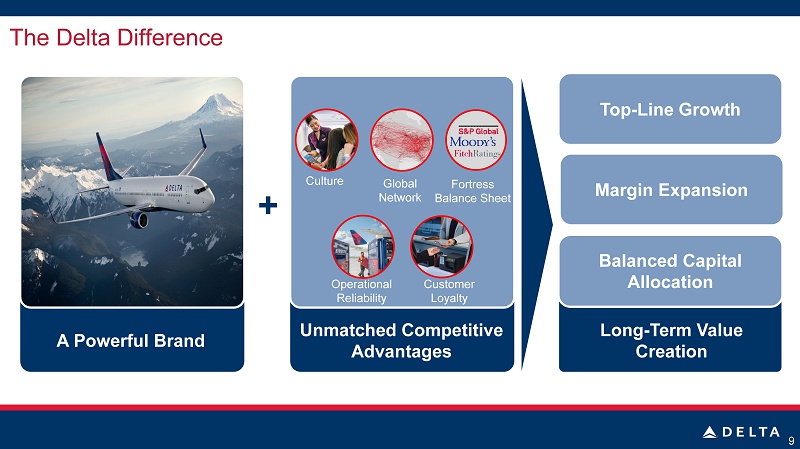
The Delta Difference 9 + A Powerful Brand Unmatched Competitive Advantages Long - Term Value Creation Top - Line Growth Margin Expansion Balanced Capital Allocation Culture Global Network Customer Loyalty Operational Reliability Fortress Balance Sheet
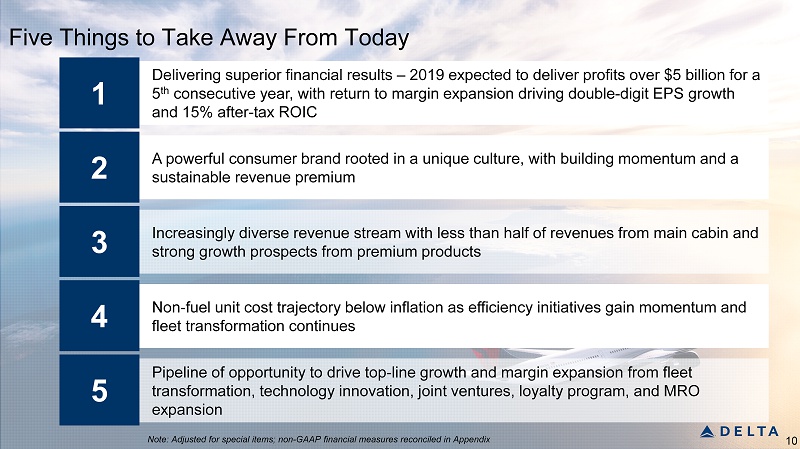
Five Things to Take Away From Today 10 A powerful consumer brand rooted in a unique culture, with building momentum and a sustainable revenue premium 2 Increasingly diverse revenue stream with less than half of revenues from main cabin and strong growth prospects from premium products 3 Non - fuel unit cost trajectory below inflation as efficiency initiatives gain momentum and fleet transformation continues 4 Pipeline of opportunity to drive top - line growth and margin expansion from fleet transformation, technology innovation, joint ventures, loyalty program, and MRO expansion Delivering superior financial results – 2019 expected to deliver profits over $5 billion for a 5 th consecutive year, with return to margin expansion driving double - digit EPS growth and 15% after - tax ROIC 5 1 Note: Adjusted for special items; non - GAAP financial measures reconciled in Appendix
GREAT RUNWAY OF OPPORTUNITY Glen Hauenstein President
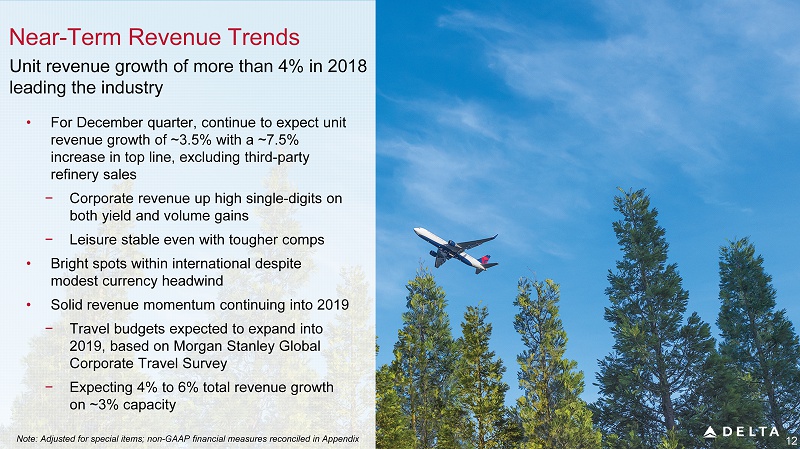
12 • For December quarter, continue to expect unit revenue growth of ~3.5% with a ~7.5% increase in top line , excluding third - party refinery sales − Corporate revenue up high single - digits on both yield and volume gains − Leisure stable even with tougher comps • Bright spots within international despite modest currency headwind • Solid revenue momentum continuing into 2019 − Travel budgets expected to expand into 2019, based on Morgan Stanley Global Corporate Travel Survey − Expecting 4% to 6% total revenue growth on ~3% capacity Unit revenue growth of more than 4% in 2018 leading the industry Near - Term Revenue Trends Note: Adjusted for special items; non - GAAP financial measures reconciled in Appendix
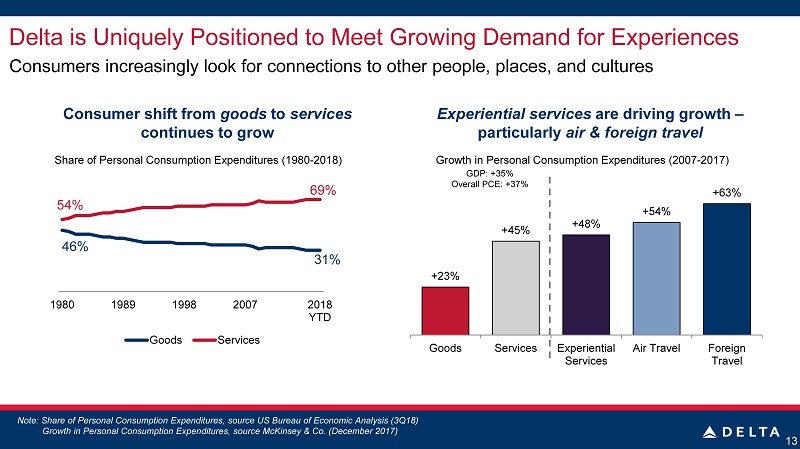
Delta is Uniquely Positioned to Meet Growing Demand for Experiences Consumers increasingly look for connections to other people, places, and cultures 13 +23% +45% +48% +54% +63% Goods Services Experiential Services Air Travel Foreign Travel Experiential services are driving growth – particularly air & foreign travel Growth in Personal Consumption Expenditures ( 2007 - 2017) GDP: +35% Overall PCE: +37% 46% 31% 54% 69% 1980 1989 1998 2007 2018 YTD Goods Services Consumer shift from goods to services continues to grow Share of Personal Consumption Expenditures ( 1980 - 2018) Note: Share of Personal Consumption Expenditures , source US Bureau of Economic Analysis (3Q18 ) Growth in Personal Consumption Expenditures, source McKinsey & Co. (December 2017)
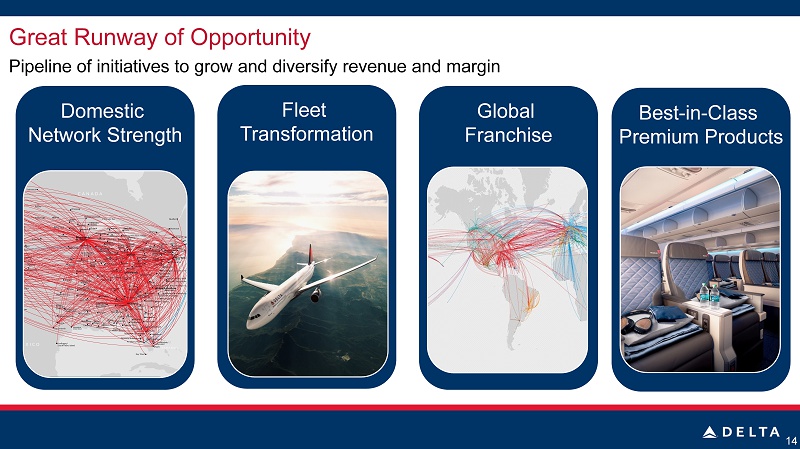
Global Franchise Domestic Network Strength Best - in - Class Premium Products Great Runway of Opportunity Pipeline of initiatives to grow and diversify revenue and margin 14 Fleet Transformation
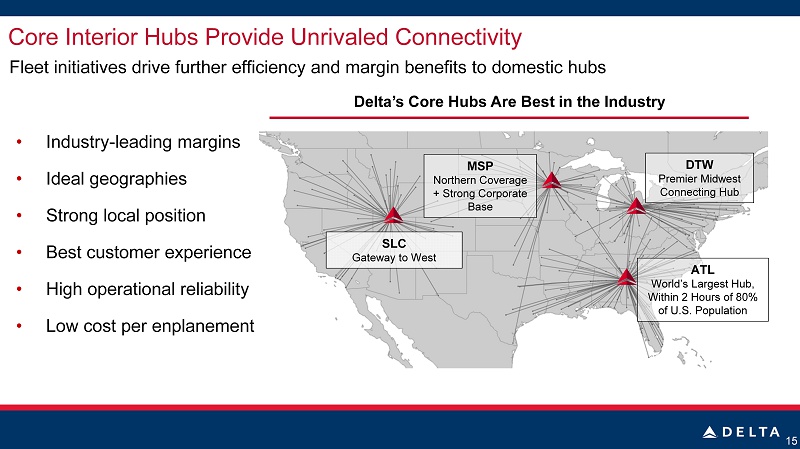
Delta’s Core Hubs Are Best in the Industry Core Interior Hubs Provide Unrivaled Connectivity 15 • Industry - leading margins • Ideal geographies • Strong local position • Best customer experience • High operational reliability • Low cost per enplanement SLC Gateway to West MSP Northern Coverage + Strong Corporate Base ATL World’s Largest Hub, Within 2 Hours of 80% of U.S. Population DTW Premier Midwest Connecting Hub Fleet initiatives drive further efficiency and margin benefits to domestic hubs
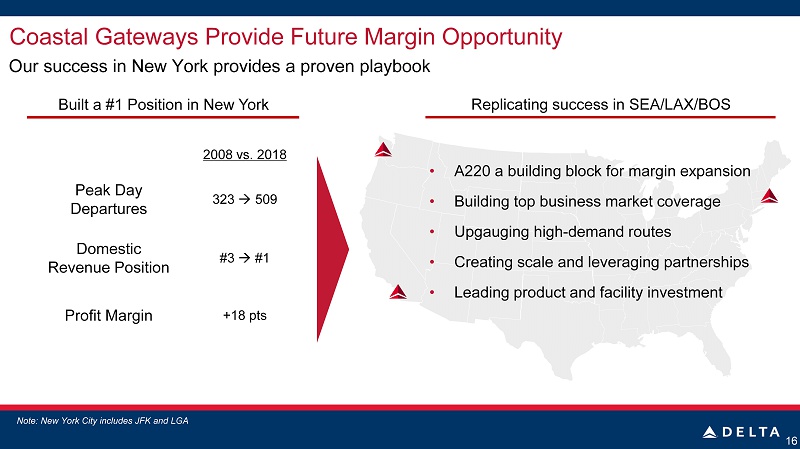
Coastal Gateways Provide Future Margin Opportunity 16 Note: New York City includes JFK and LGA Our success in New York provides a proven playbook Built a #1 Position in New York Replicating success in SEA/LAX /BOS 2008 vs. 2018 Peak Day Departures 323 509 Domestic Revenue Position #3 #1 Profit Margin +18 pts • A220 a building block for margin expansion • Building top business market coverage • Upgauging high - demand routes • Creating scale and leveraging partnerships • Leading product and facility investment
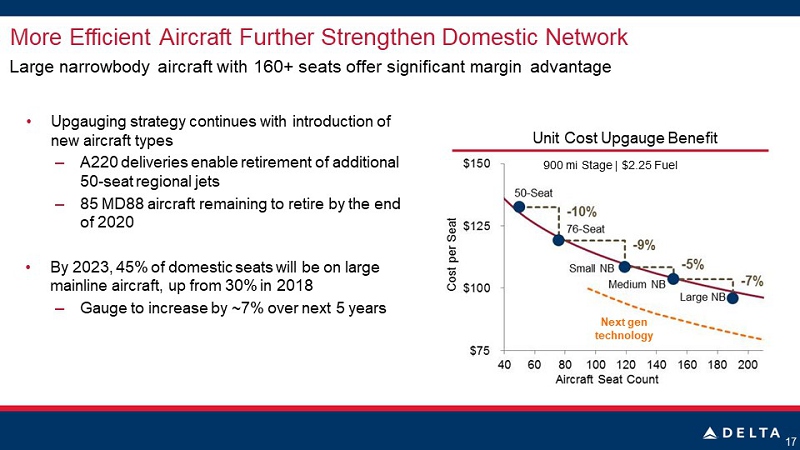
More Efficient Aircraft Further Strengthen Domestic Network Large narrowbody aircraft with 160+ seats offer significant margin advantage 17 • Upgauging strategy continues with introduction of new aircraft types – A220 deliveries enable retirement of additional 50 - seat regional jets – 85 MD88 aircraft remaining to retire by the end of 2020 • By 2023, 45% of domestic seats will be on large mainline aircraft, up from 30% in 2018 – Gauge to increase by ~7% over next 5 years Unit Cost Upgauge Benefit Next gen technology 900 mi Stage | $ 2.25 Fuel
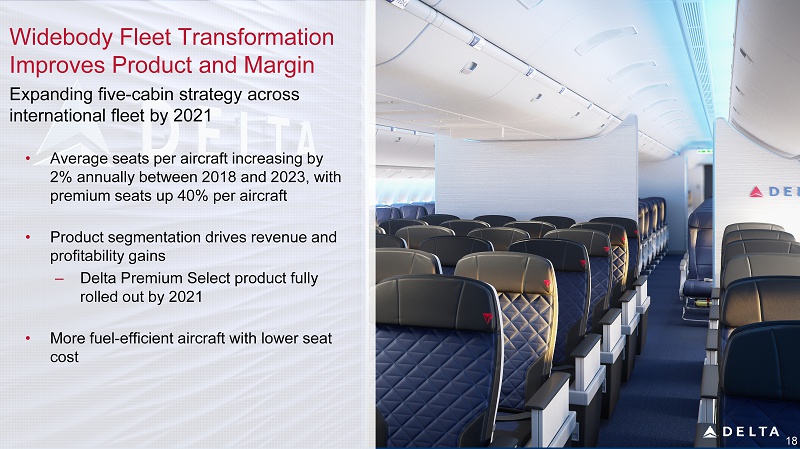
18 Widebody Fleet Transformation Improves Product and Margin Expanding five - cabin strategy across international fleet by 2021 • Average seats per aircraft increasing by 2% annually between 2018 and 2023, with premium seats up 40% per aircraft • Product segmentation drives revenue and profitability gains – Delta Premium Select product fully rolled out by 2021 • More fuel - efficient aircraft with lower seat cost

Upgauging Benefits Extend into Next Decade Order book allows for replacement of ~35% of mainline fleet by 2023 19 A321neo (194 seats) - 40% +50% +5 to +10 pts 767 - 300ER (215 seats ) Fuel Burn per Seat Narrowbody Upgauging Premium Seats A330 - 900 (281 seats ) - 22% +50% MD88 (149 seats) Margin Impact Regional Upgauging Widebody Upgauging CRJ - 900 (76 seats) A220 (109 seats) - 20% +12%
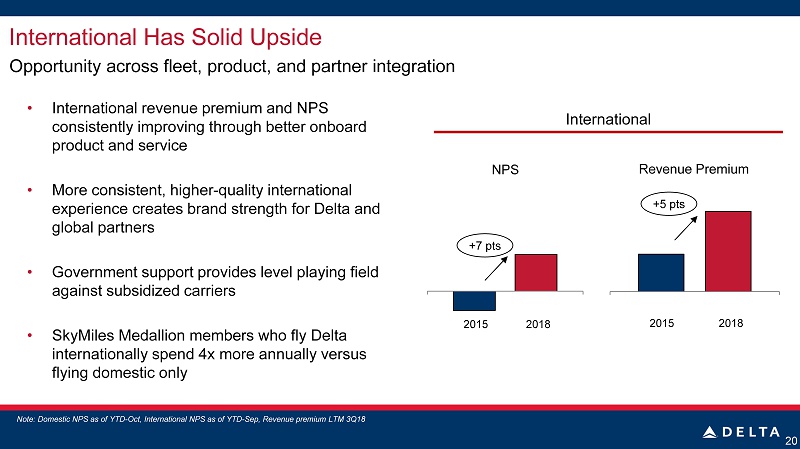
International Has Solid Upside 20 Opportunity across fleet, product, and partner integration • International revenue premium and NPS consistently improving through better onboard product and service • More consistent, higher - quality international experience creates brand strength for Delta and global partners • Government support provides level playing field against subsidized carriers • SkyMiles Medallion members who fly Delta internationally spend 4x more annually versus flying domestic only Note: Domestic NPS as of YTD - Oct, International NPS as of YTD - Sep, Revenue premium LTM 3Q18 +5 pts +7 pts 2015 2018 2015 2018 International Revenue Premium NPS
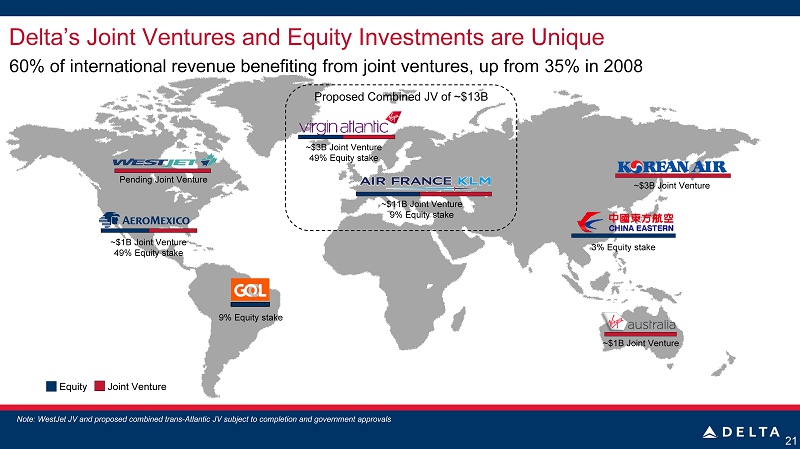
Delta’s Joint Ventures and Equity Investments are Unique 21 Note: WestJet JV and proposed combined trans - Atlantic JV subject to completion and government approvals ~$3B Joint Venture ~$1B Joint Venture ~$11B Joint Venture 9% Equity stake ~$3B Joint Venture 49% Equity stake Pending Joint Venture Equity Joint Venture ~$1B Joint Venture 49% Equity stake 9% Equity stake 3% Equity stake Proposed Combined JV of ~$13B 60% of international revenue benefiting from joint ventures, up from 35% in 2008
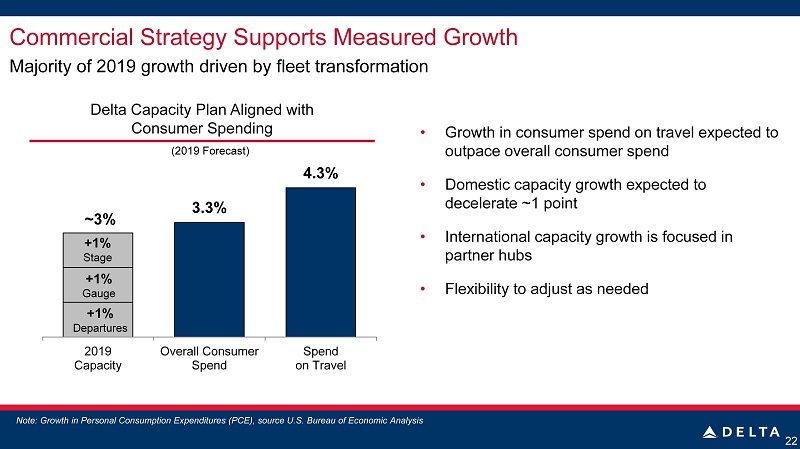
Commercial Strategy Supports Measured Growth 22 • Growth in consumer spend on travel expected to outpace overall consumer spend • Domestic capacity growth expected to decelerate ~1 point • International capacity growth is focused in partner hubs • Flexibility to adjust as needed Majority of 2019 growth driven by fleet transformation Delta Capacity Plan Aligned with Consumer Spending Note: Growth in Personal Consumption Expenditures ( PCE), source U.S. Bureau of Economic Analysis 3.3% 4.3% 2019 Capacity Overall Consumer Spend Spend on Travel +1% Stage +1% Gauge +1% Departures ~3% (2019 Forecast)
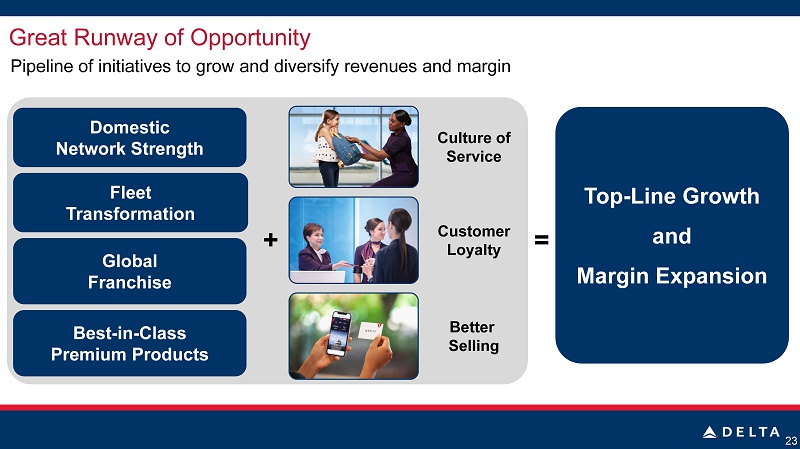
Great Runway of Opportunity 23 Pipeline of initiatives to grow and diversify revenues and margin = Fleet Transformation Best - in - Class Premium Products Domestic Network Strength Top - Line Growth and Margin Expansion + Culture of Service Better Selling Customer Loyalty Global Franchise
THE WORLD’S BEST RUN AIRLINE Gil West Chief Operating Officer
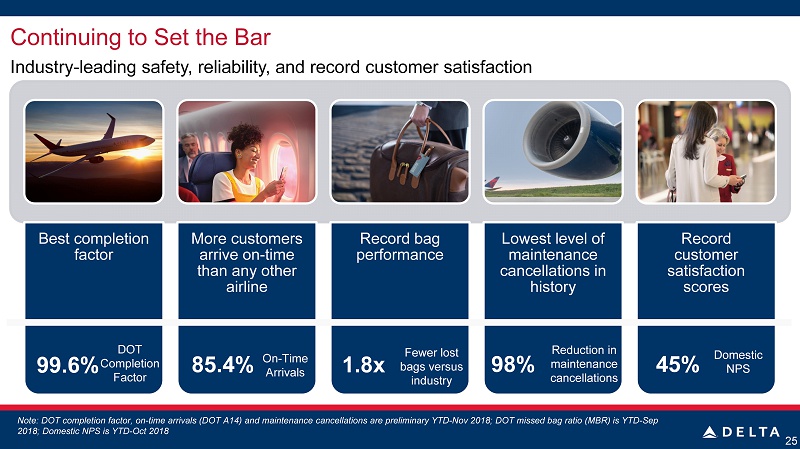
Continuing to Set the Bar 25 Industry - leading safety, reliability, and record customer satisfaction Best completion factor More customers arrive on - time than any other airline Record bag performance Lowest level of maintenance cancellations in history Record customer satisfaction scores 45% Domestic NPS 98% Reduction in maintenance cancellations 99.6% DOT Completion Factor 85.4% On - Time Arrivals 1.8x Fewer lost bags versus industry Note : DOT completion factor, on - time arrivals (DOT A14) and maintenance cancellations are preliminary YTD - Nov 2018; DOT missed bag rat io (MBR) is YTD - Sep 2018; Domestic NPS is YTD - Oct 2018
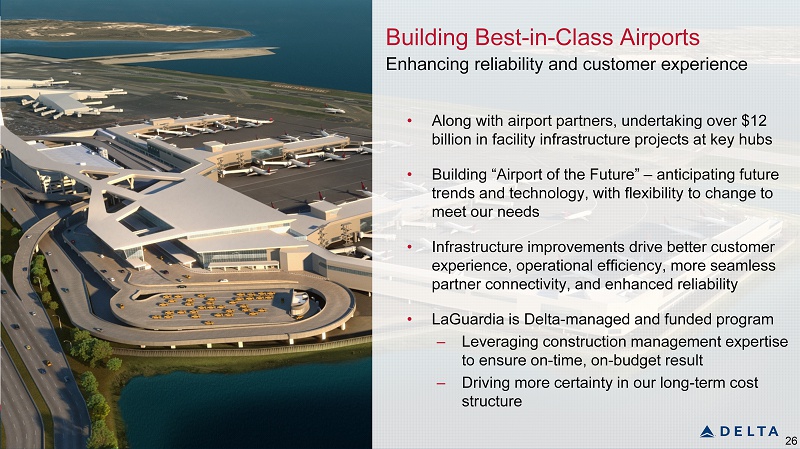
Building Best - in - Class Airports Enhancing reliability and customer experience • Along with airport partners, undertaking over $12 billion in facility infrastructure projects at key hubs • Building “Airport of the Future” – anticipating future trends and technology, with flexibility to change to meet our needs • Infrastructure improvements drive better customer experience, operational efficiency, more seamless partner connectivity, and enhanced reliability • LaGuardia is Delta - managed and funded program – Leveraging construction management expertise to ensure on - time, on - budget result – Driving more certainty in our long - term cost structure 26
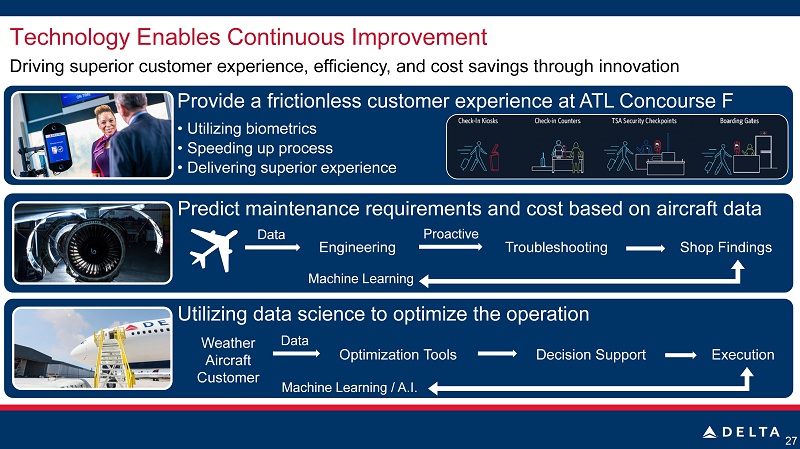
Technology Enables Continuous Improvement 27 Driving superior customer experience, efficiency, and cost savings through innovation Predict maintenance requirements and cost based on aircraft data Provide a frictionless customer experience at ATL Concourse F • Utilizing biometrics • Speeding up process • Delivering superior experience Utilizing data science to optimize the operation Engineering Troubleshooting Shop Findings Data Proactive Machine Learning Optimization Tools Decision Support Execution Data Machine Learning / A.I. Weather Aircraft Customer
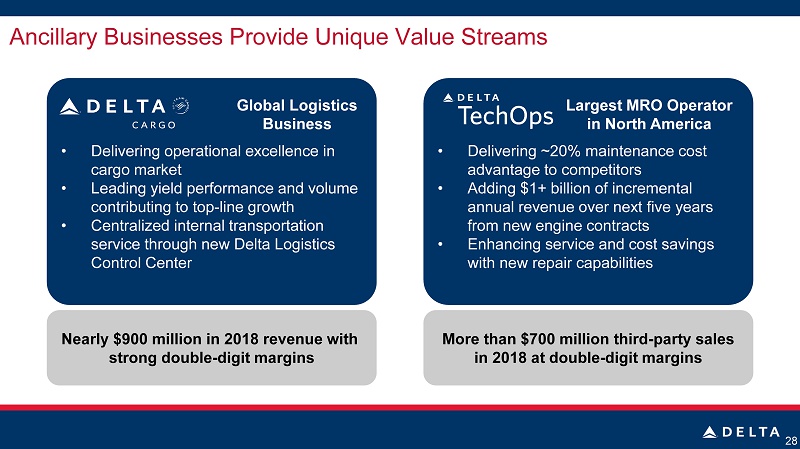
Ancillary Businesses Provide Unique Value Streams 28 Global Logistics Business Largest MRO Operator in North America Nearly $900 million in 2018 revenue with strong double - digit margins More than $700 million third - party sales in 2018 at double - digit margins • Delivering operational excellence in cargo market • Leading yield performance and volume contributing to top - line growth • Centralized internal transportation service through new Delta Logistics Control Center • Delivering ~20% maintenance cost advantage to competitors • Adding $1+ billion of incremental annual revenue over next five years from new engine contracts • Enhancing service and cost savings with new repair capabilities
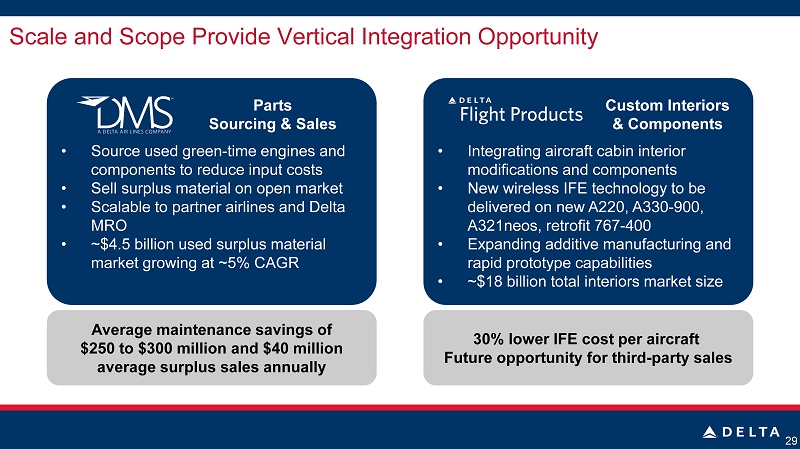
Scale and Scope Provide Vertical Integration Opportunity 29 Parts Sourcing & Sales Custom Interiors & Components Average maintenance savings of $250 to $300 million and $40 million average surplus sales annually 30% lower IFE cost per aircraft Future opportunity for third - party sales • Integrating aircraft cabin interior modifications and components • New wireless IFE technology to be delivered on new A220, A330 - 900, A321neos, retrofit 767 - 400 • Expanding additive manufacturing and rapid prototype capabilities • ~$18 billion total interiors market size • Source used green - time engines and components to reduce input costs • Sell surplus material on open market • Scalable to partner airlines and Delta MRO • ~$4.5 billion u sed surplus material market growing at ~5% CAGR
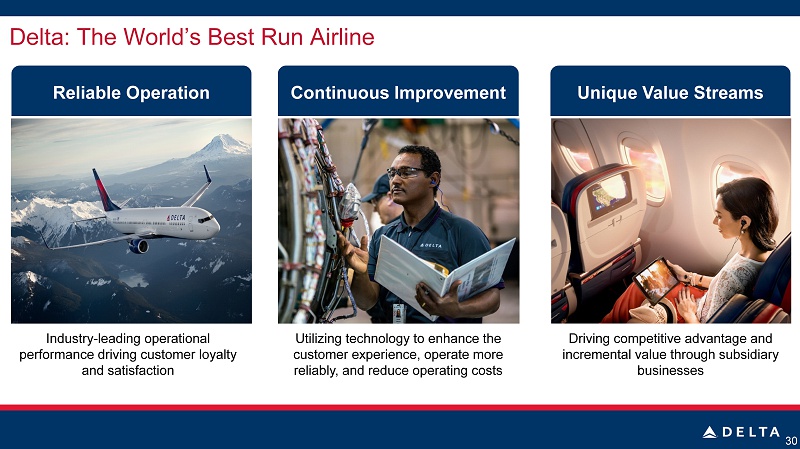
Delta: The World’s Best Run Airline 30 Industry - leading operational performance driving customer loyalty and satisfaction Utilizing technology to enhance the customer experience, operate more reliably, and reduce operating costs Driving competitive advantage and incremental value through subsidiary businesses Unique Value Streams Continuous Improvement Reliable Operation
THE POWER OF THE DELTA BRAND Tim Mapes Chief Marketing Officer
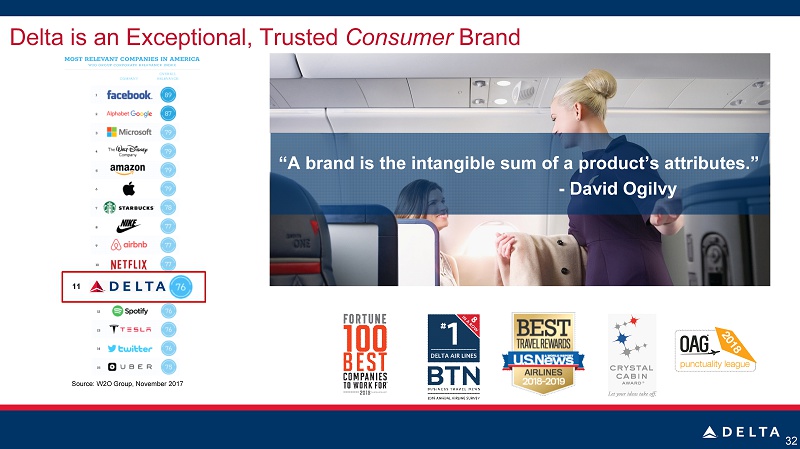
Delta is an Exceptional, Trusted Consumer Brand 32 “ A brand is the intangible sum of a product’s attributes.” - David Ogilvy Source: W2O Group, November 2017 11
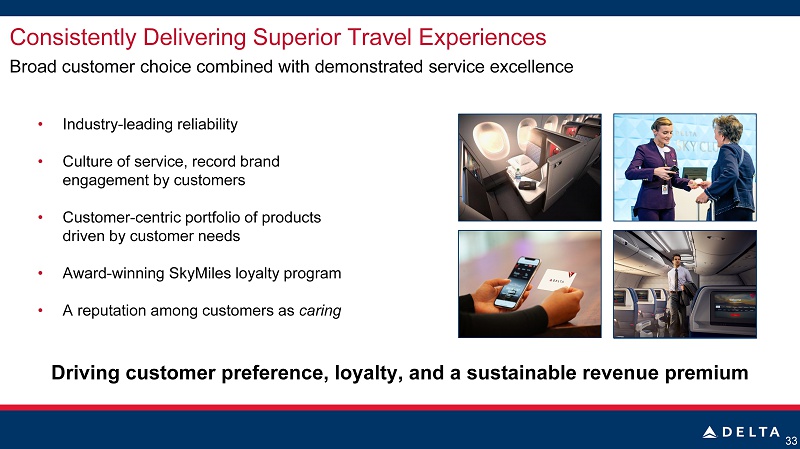
Consistently Delivering Superior Travel Experiences 33 • Industry - leading reliability • Culture of service, record brand engagement by customers • Customer - centric portfolio of products driven by customer needs • Award - winning SkyMiles loyalty program • A reputation among customers as caring Broad customer choice combined with demonstrated service excellence Driving customer preference, loyalty, and a sustainable revenue premium
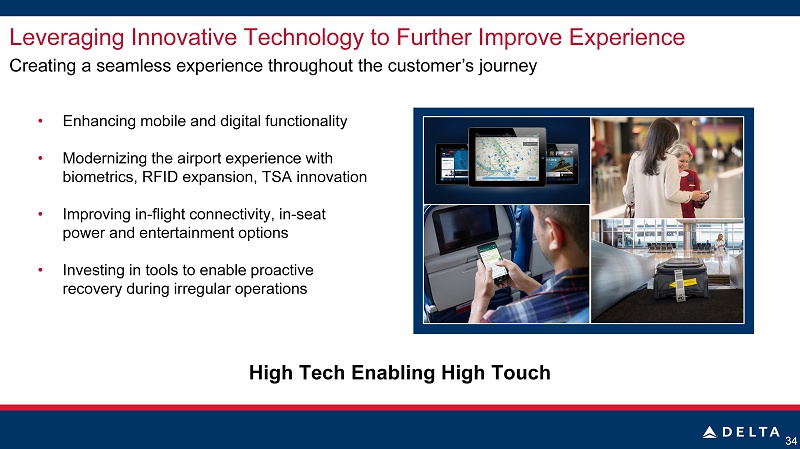
Leveraging Innovative Technology to Further Improve Experience 34 • Enhancing mobile and digital functionality • Modernizing the airport experience with biometrics, RFID expansion, TSA innovation • Improving in - flight connectivity, in - seat power and entertainment options • Investing in tools to enable proactive recovery during irregular operations Creating a seamless experience throughout the customer’s journey High Tech Enabling High Touch
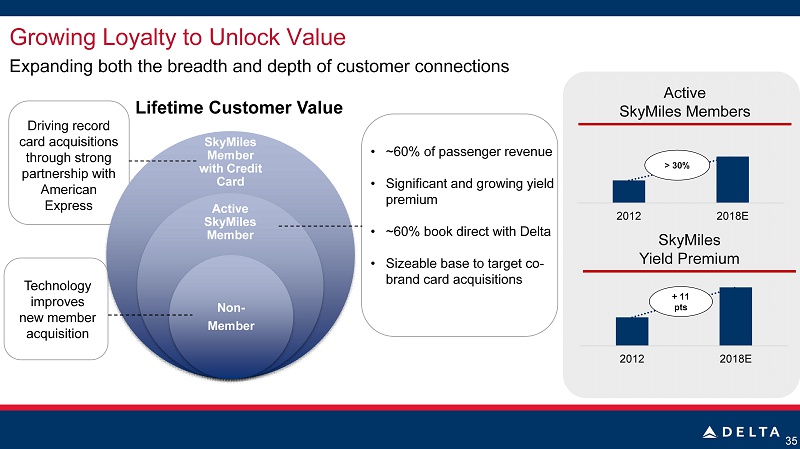
35 SkyMiles Member with Credit C ard Active SkyMiles Member Non - M ember 2012 2018E 2012 2018E Active SkyMiles Members > 30 % + 11 pts SkyMiles Yield Premium Lifetime Customer Value • ~60% of passenger revenue • Significant and growing yield premium • ~60% book direct with Delta • Sizeable base to target co - brand card acquisitions Driving record card acquisitions through strong partnership with American Express Technology improves new member acquisition Growing Loyalty to Unlock Value Expanding both the breadth and depth of customer connections
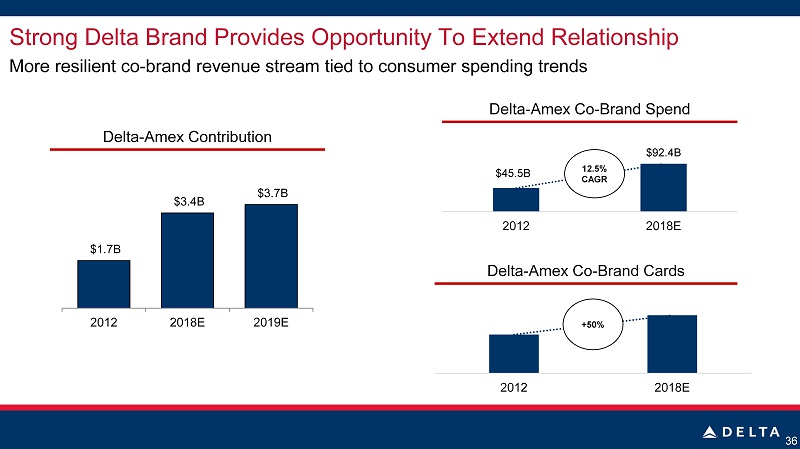
36 Delta - Amex Co - Brand Spend $45.5B $92.4B 2012 2018E Delta - Amex Co - Brand Cards 2012 2018E 12.5 % CAGR +50% Delta - Amex Contribution $1.7B $3.4B $3.7B 2012 2018E 2019E Strong Delta Brand Provides Opportunity To Extend Relationship More resilient co - brand revenue stream tied to consumer spending trends
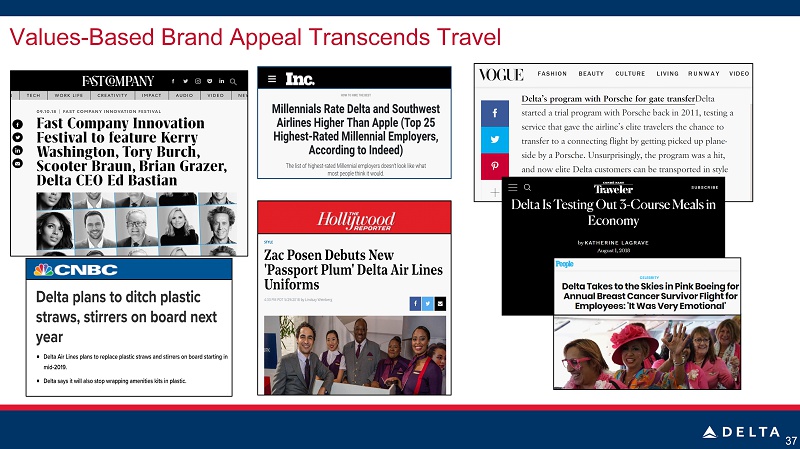
Values - Based Brand Appeal Transcends Travel 37
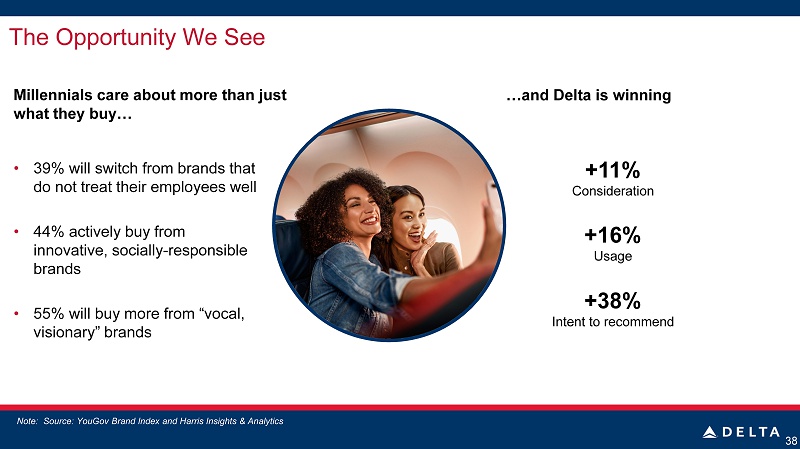
The Opportunity We See 38 Millennials care about more than just what they buy… Note: Source: YouGov Brand Index and Harris Insights & Analytics • 39% will switch from brands that do not treat their employees well • 44 % actively buy from innovative, socially - responsible brands • 55 % will buy more from “vocal, visionary” brands …and Delta is winning +11% Consideration +16% Usage +38% Intent to recommend
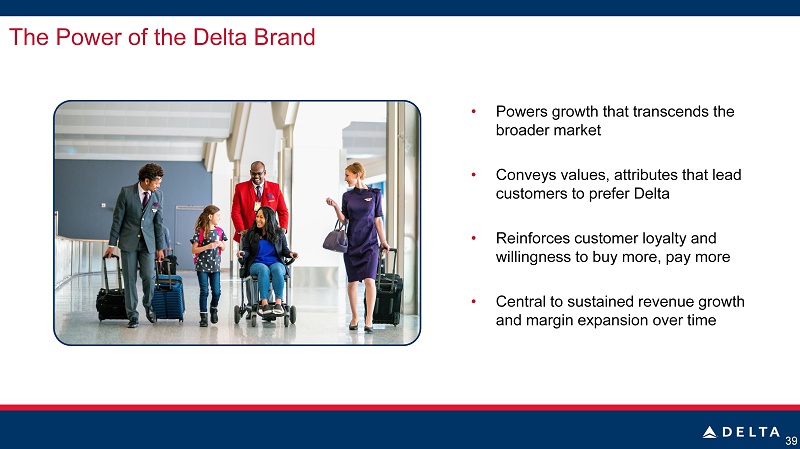
The Power of the Delta Brand 39 • Powers growth that transcends the broader market • Conveys values, attributes that lead customers to prefer Delta • Reinforces customer loyalty and willingness to buy more, pay more • Central to sustained revenue growth and margin expansion over time

DELIVERING TOP - LINE GROWTH Eric Phillips Senior Vice President – Revenue Management
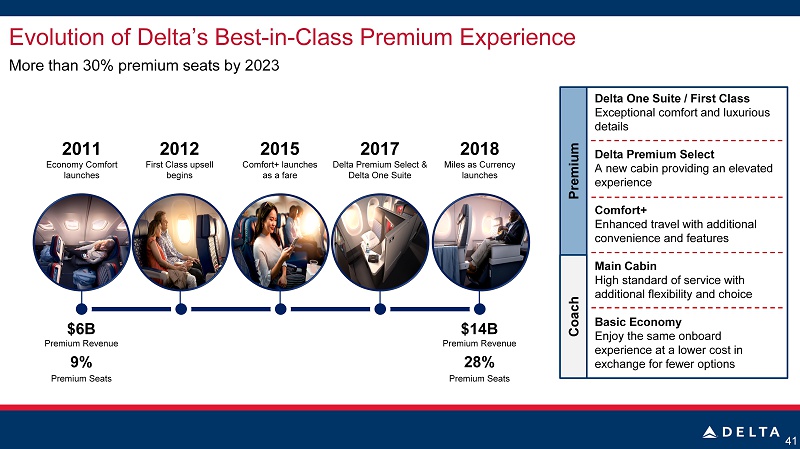
Evolution of Delta’s Best - in - Class Premium Experience 41 More than 30% premium seats by 2023 2011 Economy Comfort launches 2012 First Class upsell begins 2015 Comfort+ launches as a fare 2017 Delta Premium Select & Delta One Suite 2018 Miles as Currency launches $6B Premium Revenue 9% Premium Seats $14B Premium Revenue 28% Premium Seats Delta One Suite / First Class Exceptional comfort and luxurious details Delta Premium Select A new cabin providing an elevated experience Comfort + Enhanced travel with additional convenience and features Main Cabin High standard of service with additional flexibility and choice Basic Economy Enjoy the same onboard experience at a lower cost in exchange for fewer options Coach Premium
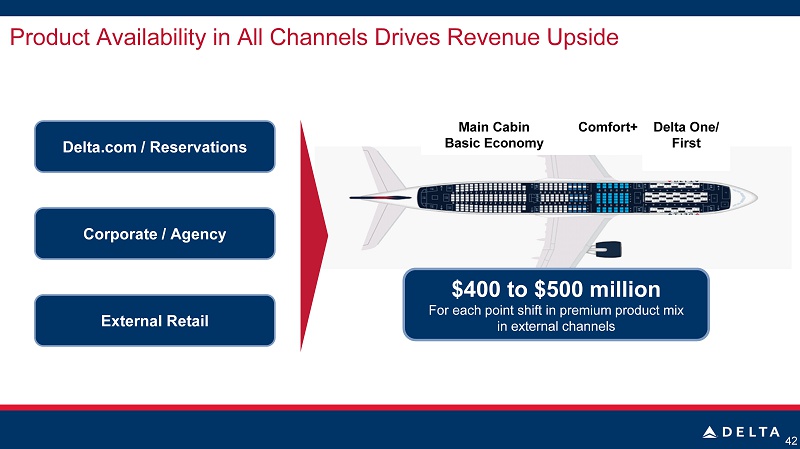
Product Availability in All Channels Drives Revenue Upside 42 $ 400 to $500 million For each point shift in premium product mix in external channels Comfort + Main Cabin Basic Economy External Retail Delta.com / Reservations Corporate / Agency Delta One/ First
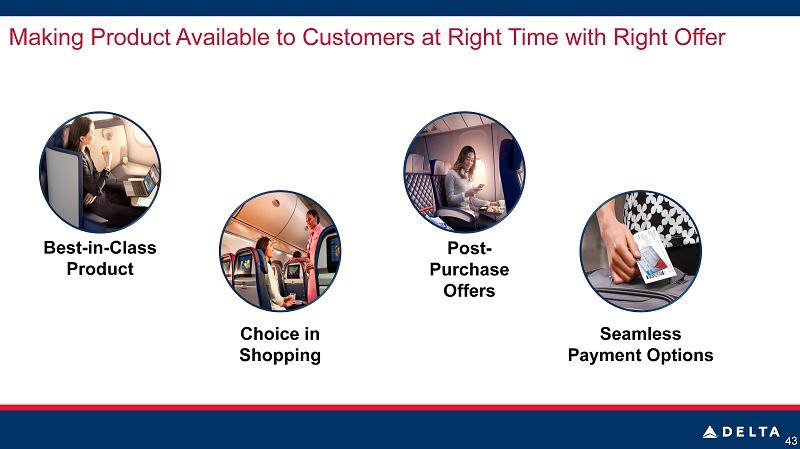
Making Product Available to Customers at Right Time with Right Offer 43 Best - in - Class Product Choice in Shopping Post - Purchase Offers Seamless Payment Options
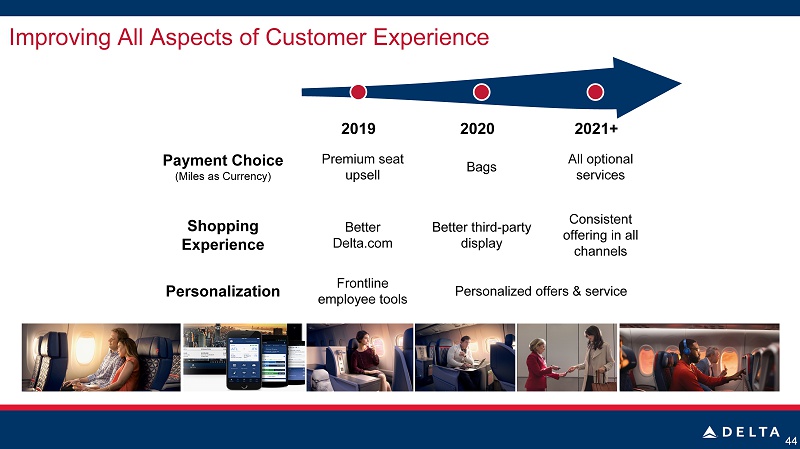
Improving All Aspects of Customer Experience 44 Payment Choice (Miles as Currency) Shopping Experience Personalization Premium seat upsell Bags All optional services Better Delta.com Better third - party display Consistent offering in all channels Frontline employee tools Personalized offers & service 2019 2020 2021+
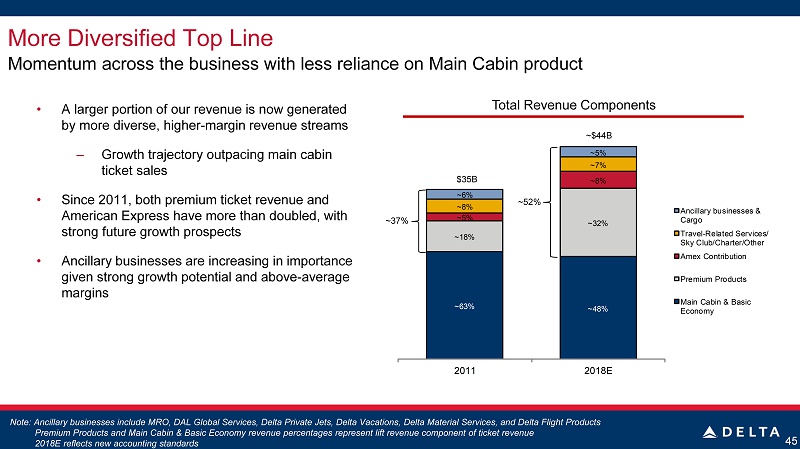
• A larger portion of our revenue is now generated by more diverse, higher - margin revenue streams – Growth trajectory outpacing main cabin ticket sales • Since 2011, both premium ticket revenue and American Express have more than doubled, with strong future growth prospects • Ancillary businesses are increasing in importance given strong growth potential and above - average margins More Diversified Top Line 45 Momentum across the business with less reliance on M ain Cabin product Note : Ancillary businesses include MRO, DAL Global Services, Delta Private Jets, Delta Vacations, Delta Material Services, and Delta Flight P rod ucts Premium Products and Main Cabin & Basic Economy revenue percentages represent lift revenue component of ticket revenu e 2018E reflects new accounting standards ~63% ~48% ~18% ~32% ~5% ~8% ~8% ~7% ~6% ~5% 2011 2018E Ancillary businesses & Cargo Travel-Related Services/ Sky Club/Charter/Other Amex Contribution Premium Products Main Cabin & Basic Economy Total Revenue Components ~37% ~52% $35B ~$44B
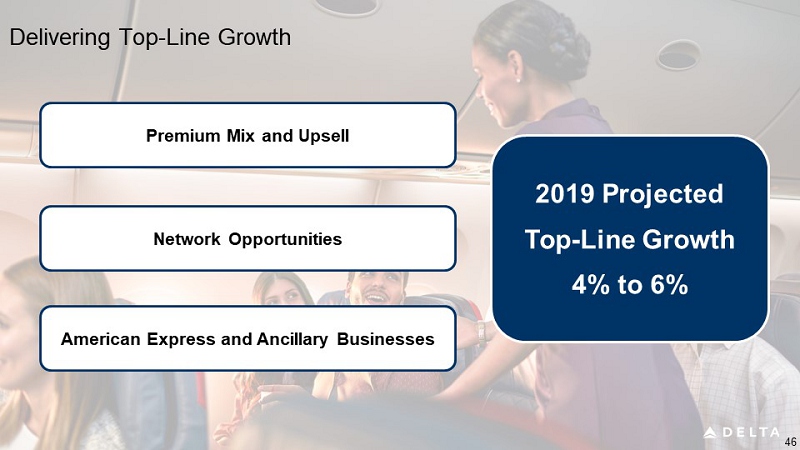
Delivering Top - Line Growth 2019 Projected Top - Line Growth 4% to 6% Network Opportunities Premium Mix and Upsell American Express and Ancillary Businesses 46
EMBRACING TECHNOLOGY AND INNOVATION Rahul Samant Chief Information Officer
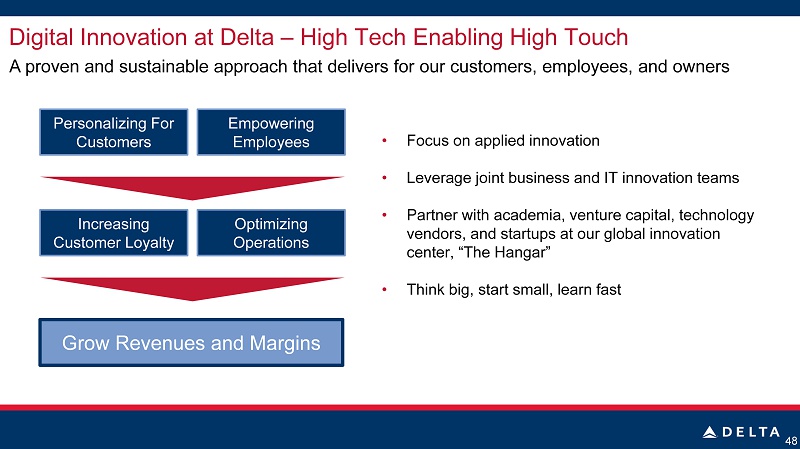
• Focus on applied innovation • Leverage joint business and IT innovation teams • Partner with academia, venture capital, technology vendors, and startups at our global innovation center, “The Hangar” • Think big, start small, learn fast 48 A proven and sustainable approach that delivers for our customers, employees, and owners Digital Innovation at Delta – High Tech Enabling High Touch Personalizing For Customers Grow Revenues and Margins Empowering Employees Optimizing Operations Increasing Customer Loyalty
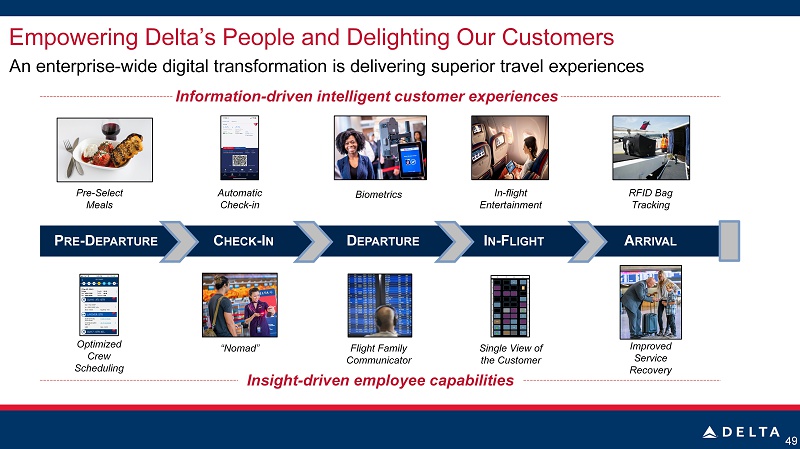
Optimized Crew Scheduling 49 Pre - Select Meals Automatic Check - in Biometrics In - flight Entertainment RFID Bag Tracking “Nomad” Flight Family Communicator Single View of the Customer Improved Service Recovery P RE - D EPARTURE C HECK - I N D EPARTURE I N - F LIGHT A RRIVAL Information - driven intelligent customer experiences Insight - driven employee capabilities An enterprise - wide digital transformation is delivering superior travel experiences Empowering Delta’s People and Delighting Our Customers
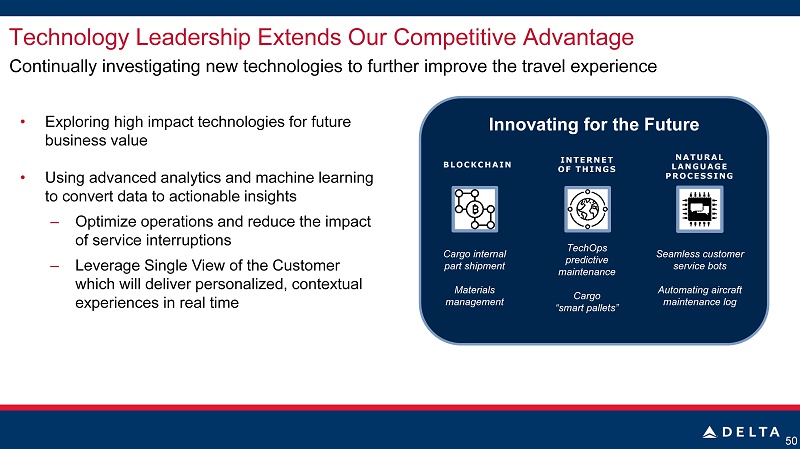
• Exploring high impact technologies for future business value • Using advanced analytics and machine learning to convert data to actionable insights – Optimize operations and reduce the impact of service interruptions – Leverage Single View of the Customer which will deliver personalized, contextual experiences in real time 50 Innovating for the Future NATURAL LANGUAGE PROCESSING Seamless customer service bots Automating aircraft maintenance log BLOCKCHAIN INTERNET OF THINGS Cargo internal p art shipment Materials management TechOps predictive maintenance Cargo “smart pallets” Technology Leadership Extends Our Competitive Advantage Continually investigating new technologies to further improve the travel experience

OUR PEOPLE ARE OUR BRAND Joanne Smith Chief Human Resources Officer
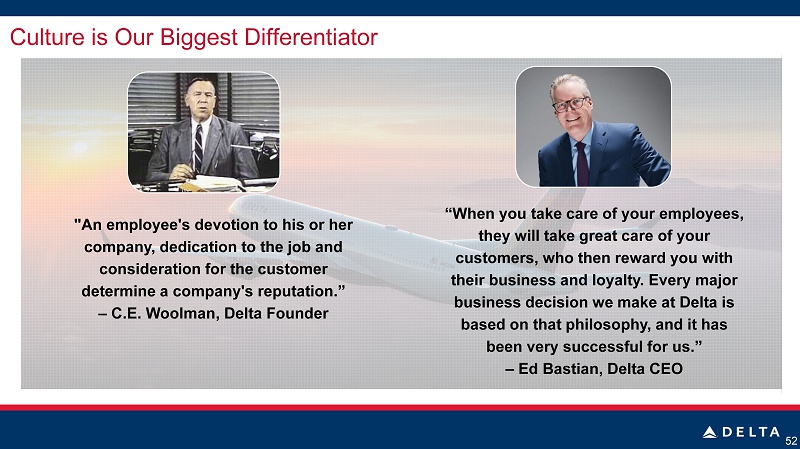
Culture is Our Biggest Differentiator 52 "An employee's devotion to his or her company, dedication to the job and consideration for the customer determine a company's reputation.” – C.E . Woolman, Delta Founder “When you take care of your employees, they will take great care of your customers, who then reward you with their business and loyalty. Every major business decision we make at Delta is based on that philosophy, and it has been very successful for us.” – Ed Bastian, Delta CEO
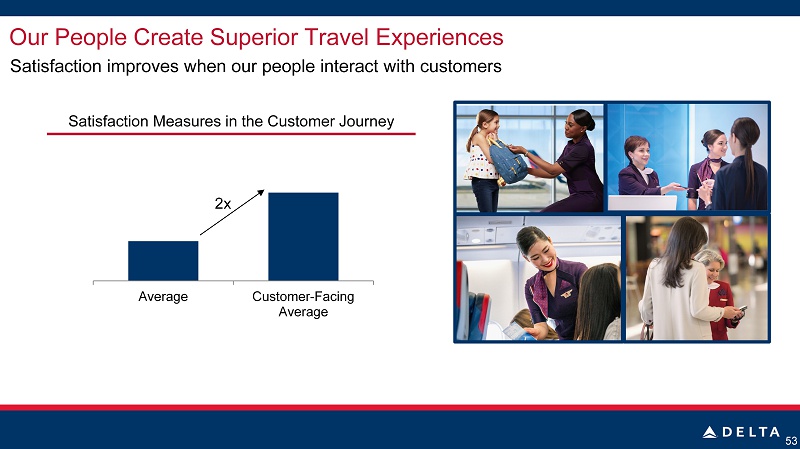
Our People Create Superior Travel Experiences 53 Satisfaction Measures in the Customer Journey Satisfaction improves when our people interact with customers Average Customer-Facing Average 2x
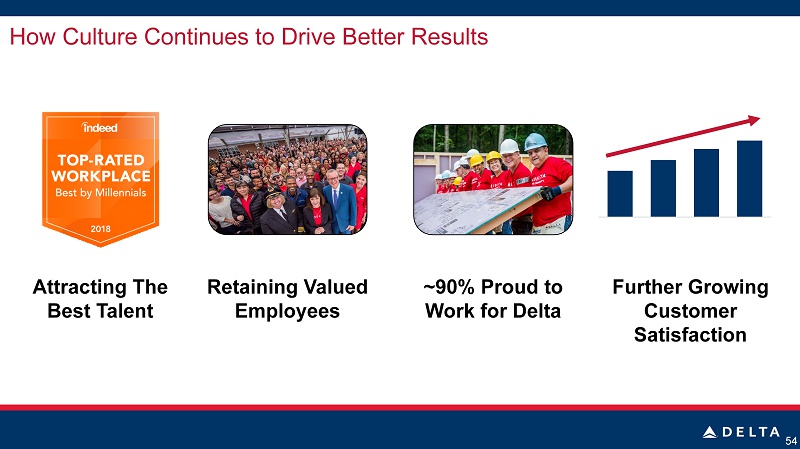
How Culture Continues to Drive Better Results 54 2012 2014 2016 2018 Attracting The Best Talent Retaining Valued Employees Further Growing Customer Satisfaction ~90 % Proud to Work for Delta
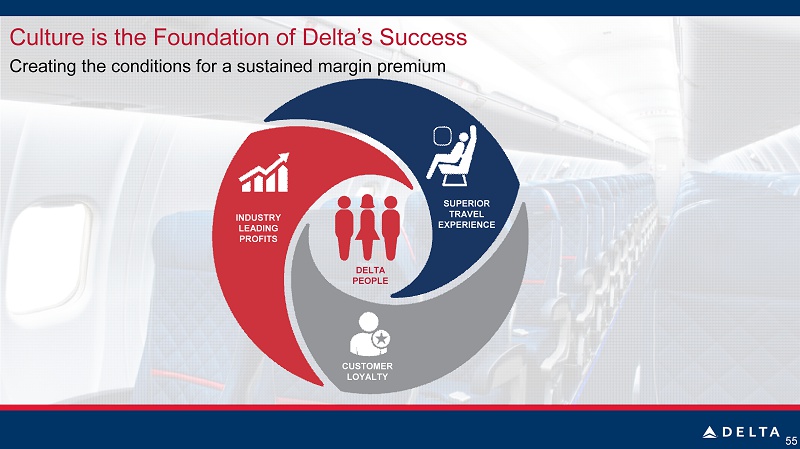
Culture is the Foundation of Delta’s Success Creating the conditions for a sustained margin premium 55 DELTA PEOPLE SUPERIOR TRAVEL EXPERIENCE INDUSTRY LEADING PROFITS CUSTOMER LOYALTY

GROWING OUR LEAD Paul Jacobson Chief Financial Officer
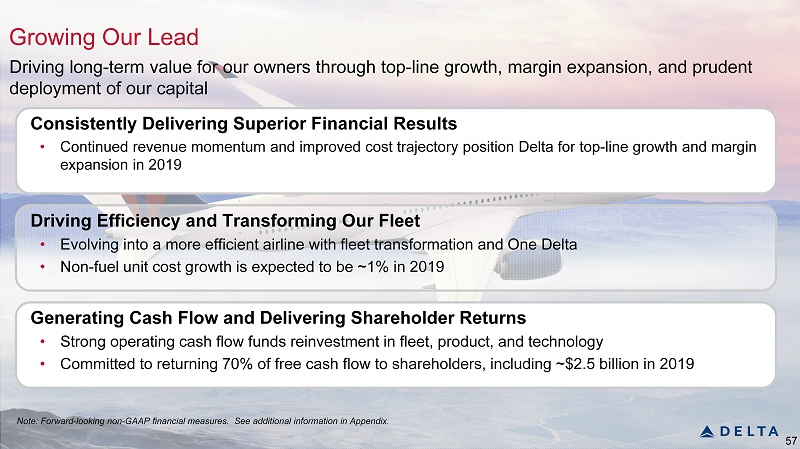
Growing Our Lead Driving long - term value for our owners through top - line growth, margin expansion, and prudent deployment of our capital Consistently Delivering Superior Financial Results • Continued revenue momentum and improved cost trajectory position Delta for top - line growth and margin expansion in 2019 Driving Efficiency and Transforming Our Fleet • Evolving into a more efficient airline with fleet transformation and One Delta • Non - fuel unit cost growth is expected to be ~1% in 2019 Generating Cash Flow and Delivering Shareholder Returns • Strong operating cash flow funds reinvestment in fleet , product, and technology • Committed to returning 70% of free cash flow to shareholders, including ~$2.5 billion in 2019 Note: Forward - looking non - GAAP financial measures. See additional information in Appendix. 57
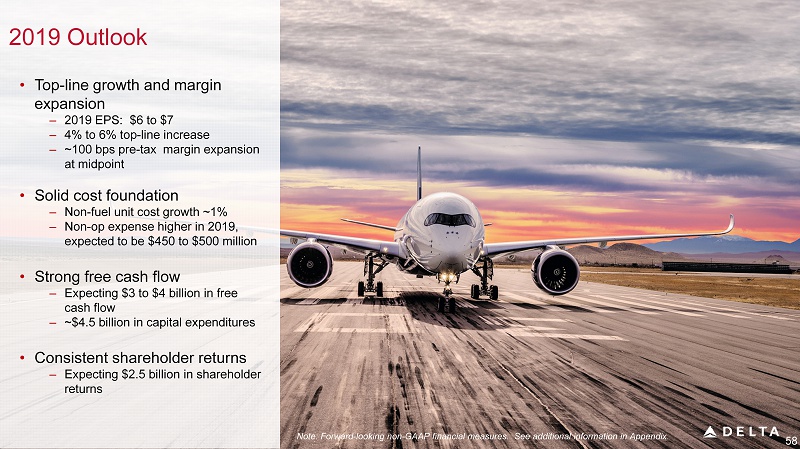
• Top - line growth and margin expansion ‒ 2019 EPS: $6 to $7 ‒ 4% to 6% top - line increase ‒ ~100 bps pre - tax margin expansion at midpoint • Solid cost foundation – Non - fuel unit cost growth ~1% ‒ Non - op expense higher in 2019, expected to be $450 to $500 million • Strong free cash flow ‒ Expecting $3 to $4 billion in free cash flow ‒ ~$4.5 billion in capital expenditures • Consistent shareholder returns ‒ Expecting $ 2.5 billion in shareholder returns 58 Note: Forward - looking non - GAAP financial measures. See additional information in Appendix. 2019 Outlook
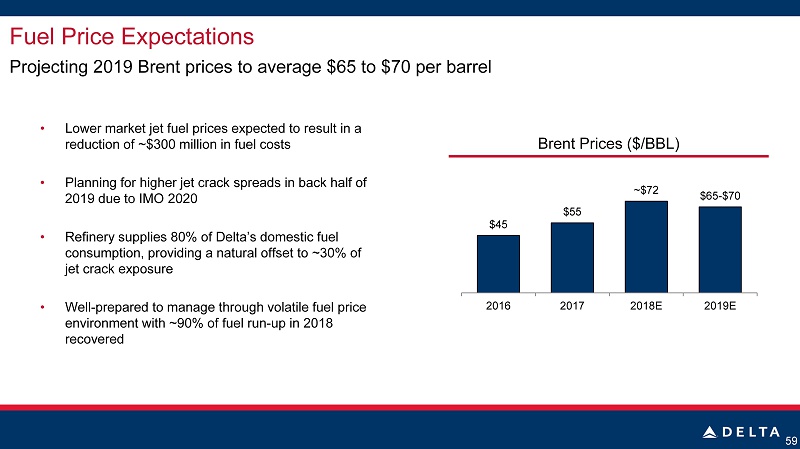
Fuel Price Expectations • Lower market jet fuel prices expected to result in a reduction of ~$300 million in fuel costs • Planning for higher jet crack spreads in back half of 2019 due to IMO 2020 • Refinery supplies 80% of Delta’s domestic fuel consumption, providing a natural offset to ~30% of jet crack exposure • Well - prepared to manage through volatile fuel price environment with ~90% of fuel run - up in 2018 recovered Brent Prices ($/BBL) 59 Projecting 2019 Brent prices to average $65 to $70 per barrel $45 $55 ~$ 72 $ 65 - $70 2016 2017 2018E 2019E
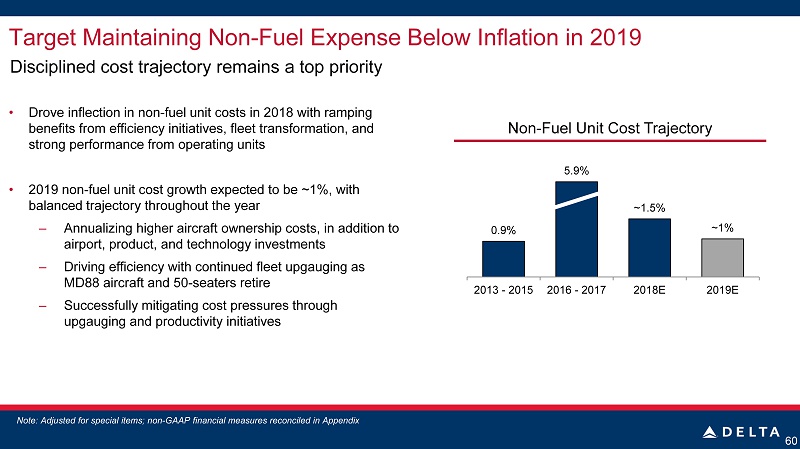
Target Maintaining Non - Fuel Expense Below Inflation in 2019 • Drove inflection in non - fuel unit costs in 2018 with ramping benefits from efficiency initiatives, fleet transformation, and strong performance from operating units • 2019 non - fuel unit cost growth expected to be ~1%, with balanced trajectory throughout the year – Annualizing higher aircraft ownership costs, in addition to airport, product, and technology investments – Driving efficiency with continued fleet upgauging as MD88 aircraft and 50 - seaters retire – Successfully mitigating cost pressures through upgauging and productivity initiatives Disciplined cost trajectory remains a top priority Note: Adjusted for special items; non - GAAP financial measures reconciled in Appendix 60 Non - Fuel Unit Cost Trajectory 0.9% 5.9% ~1.5 % ~1% 2013 - 2015 2016 - 2017 2018E 2019E
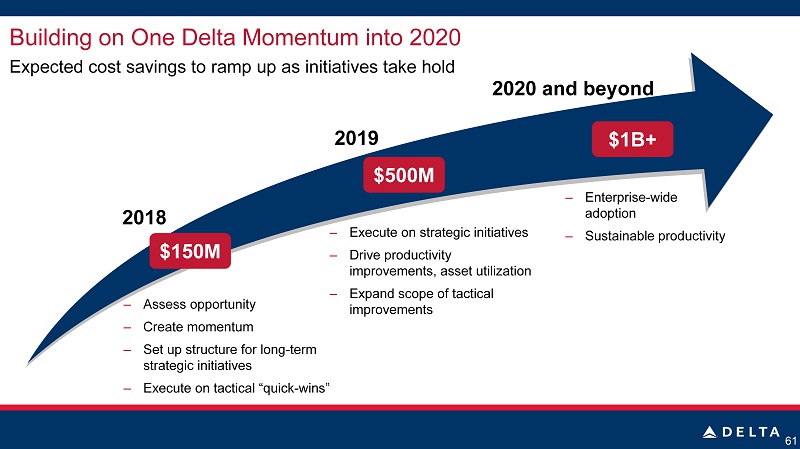
Building on One Delta Momentum into 2020 61 Expected cost savings to ramp up as initiatives take hold $150M $500M $1B+ 2018 2019 2020 and beyond – Assess opportunity – Create momentum – Set up structure for long - term strategic initiatives – Execute on tactical “quick - wins” – Execute on strategic initiatives – Drive productivity improvements, asset utilization – Expand scope of tactical improvements – Enterprise - wide adoption – Sustainable productivity
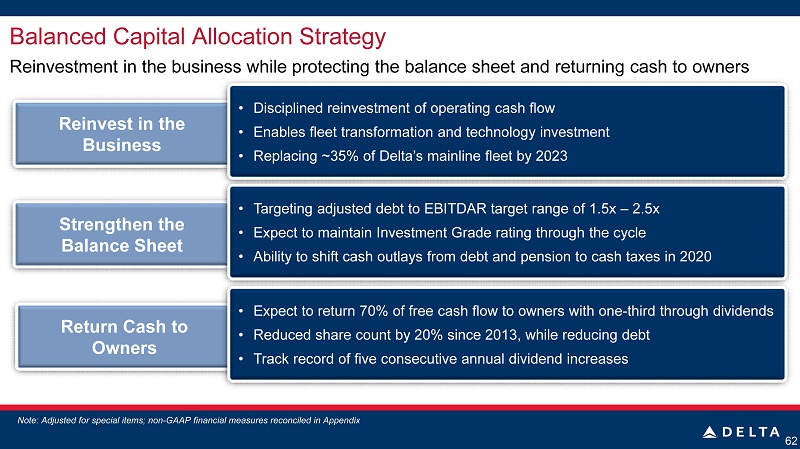
Balanced Capital Allocation Strategy 62 Reinvestment in the business while protecting the balance sheet and returning cash to owners XXXX revenue Reinvest in the Business • Disciplined reinvestment of operating cash flow • Enables fleet transformation and technology investment • Replacing ~35% of Delta’s mainline fleet by 2023 Return Cash to Owners • Expect to return 70 % of free cash flow to owners with one - third through dividends • Reduced share count by 20% since 2013, while reducing debt • Track record of five consecutive annual dividend increases Strengthen the Balance Sheet • Targeting adjusted debt to EBITDAR target range of 1.5x – 2.5x • Expect to maintain Investment Grade rating through the cycle • Ability to shift cash outlays from debt and pension to cash taxes in 2020 Note: Adjusted for special items; non - GAAP financial measures reconciled in Appendix
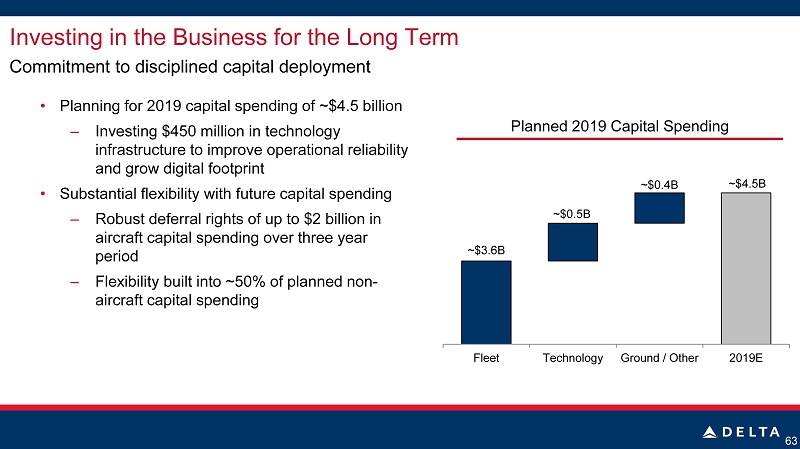
Investing in the Business for the Long Term • Planning for 2019 capital spending of ~$4.5 billion – Investing $450 million in technology infrastructure to improve operational reliability and grow digital footprint • Substantial flexibility with future capital spending – Robust deferral rights of up to $2 billion in aircraft capital spending over three year period – Flexibility built into ~50% of planned non - aircraft capital spending Commitment to disciplined capital deployment Planned 2019 Capital Spending 63 ~$ 3.6B ~$0.5B ~$0.4B ~$4.5B Fleet Technology Ground / Other 2019E
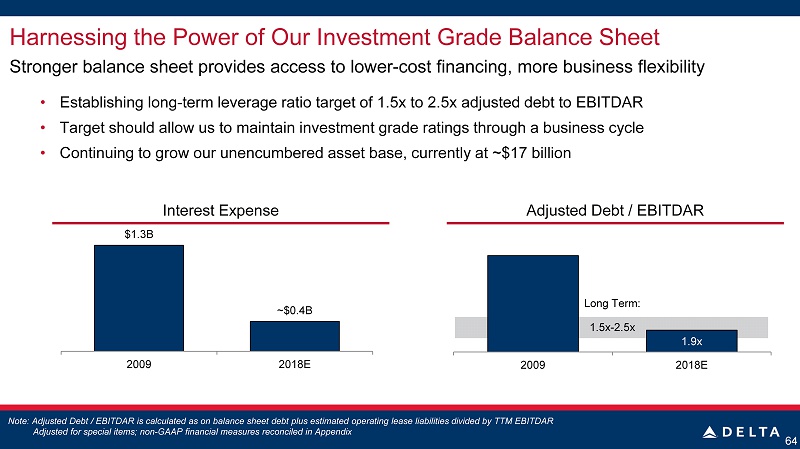
Adjusted Debt / EBITDAR Harnessing the Power of Our Investment Grade Balance Sheet • Establishing long - term leverage ratio target of 1.5x to 2.5x adjusted debt to EBITDAR • Target should allow us to maintain investment grade ratings through a business cycle • Continuing to grow our unencumbered asset base, currently at ~$17 billion Stronger balance sheet provides access to lower - cost financing, more business flexibility 64 Note: Adjusted Debt / EBITDAR is calculated as on balance sheet debt plus estimated operating lease liabilities divided by TTM EBITDAR Adjusted for special items; non - GAAP financial measures reconciled in Appendix $1.3B ~$ 0.4B 2009 2018E Interest Expense Long Term: 1.5x - 2.5x 1.9x 2009 2018E
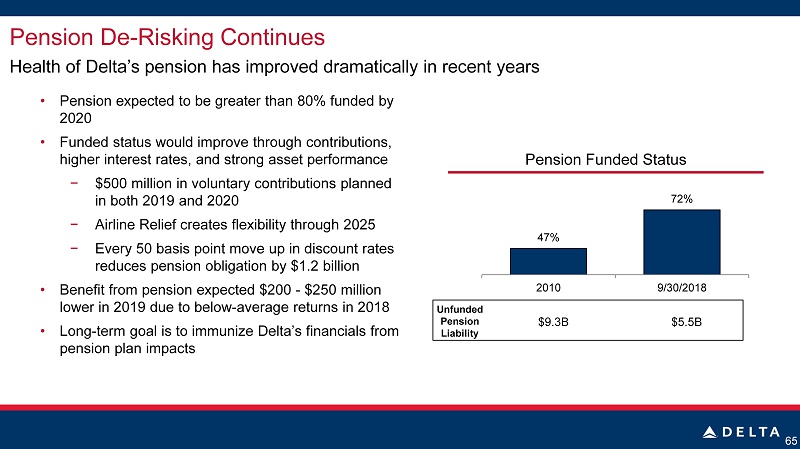
Pension De - Risking Continues • Pension expected to be greater than 80% funded by 2020 • Funded status would improve through contributions, higher interest rates, and strong asset performance − $ 500 million in voluntary contributions planned in both 2019 and 2020 − Airline Relief creates flexibility through 2025 − Every 50 basis point move up in discount rates reduces pension obligation by $1.2 billion • Benefit from pension expected $ 200 - $250 million lower in 2019 due to below - average returns in 2018 • Long - term goal is to immunize Delta’s financials from pension plan impacts Health of Delta’s pension has improved dramatically in recent years 65 Pension Funded Status Unfunded Pension Liability 47% 72% 2010 9/30/2018 $9.3B $5.5B
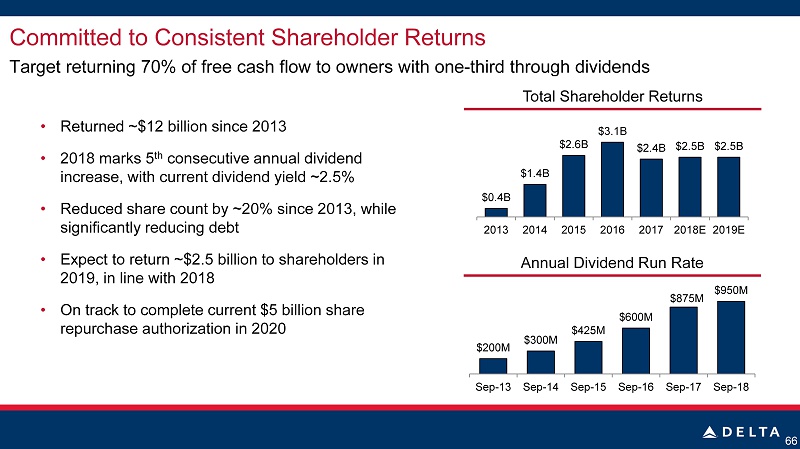
66 Committed to Consistent Shareholder Returns • Returned ~$12 billion since 2013 • 2018 marks 5 th consecutive annual dividend increase, with current dividend yield ~2.5% • Reduced share count by ~20 % since 2013, while significantly reducing debt • Expect to return ~$2.5 billion to shareholders in 2019, in line with 2018 • On track to complete current $5 billion share repurchase authorization in 2020 Target returning 70 % of free cash flow to owners with one - third through dividends Annual Dividend Run Rate $200M $300M $ 425M $ 600M $875M $950M Sep-13 Sep-14 Sep-15 Sep-16 Sep-17 Sep-18 Total Shareholder Returns $0.4B $1.4B $2.6B $3.1B $2.4B $2.5B $2.5B 2013 2014 2015 2016 2017 2018E 2019E
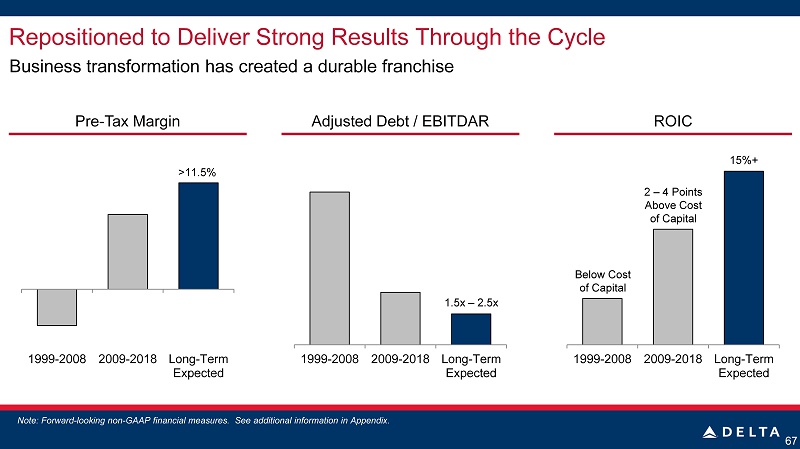
67 Repositioned to Deliver Strong Results Through the Cycle Business transformation has created a durable franchise Pre - Tax Margin Adjusted Debt / EBITDAR ROIC 1999-2008 2009-2018 Long-Term Expected 1999-2008 2009-2018 Long-Term Expected 15%+ 1999-2008 2009-2018 Long-Term Expected >11.5% 1.5x – 2.5x 2 – 4 Points Above Cost of Capital Below Cost of Capital Note: Forward - looking non - GAAP financial measures. See additional information in Appendix.
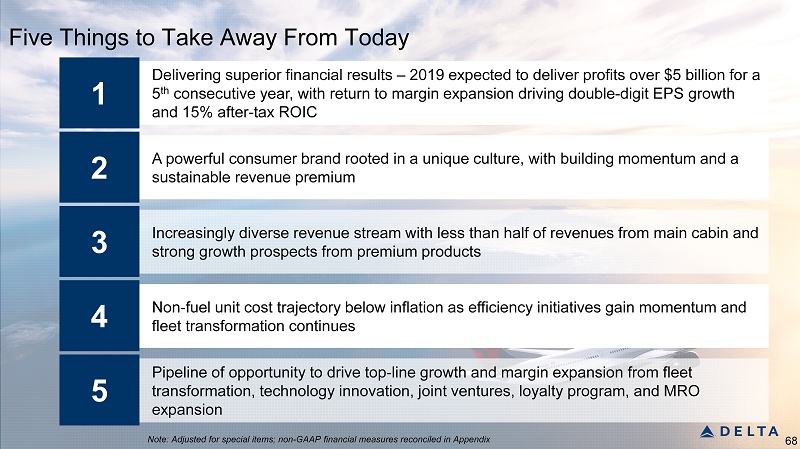
Five Things to Take Away From Today 68 A powerful consumer brand rooted in a unique culture, with building momentum and a sustainable revenue premium 2 Increasingly diverse revenue stream with less than half of revenues from main cabin and strong growth prospects from premium products 3 Non - fuel unit cost trajectory below inflation as efficiency initiatives gain momentum and fleet transformation continues 4 Pipeline of opportunity to drive top - line growth and margin expansion from fleet transformation, technology innovation, joint ventures, loyalty program, and MRO expansion Delivering superior financial results – 2019 expected to deliver profits over $5 billion for a 5 th consecutive year, with return to margin expansion driving double - digit EPS growth and 15% after - tax ROIC 5 1 Note: Adjusted for special items; non - GAAP financial measures reconciled in Appendix
69 Non - GAAP Reconciliations Non - GAAP Financial Measures The following tables show reconciliations of non-GAAP financial measures. The reasons Delta uses these measures are described below. Reconciliations may not calculate due to rounding. Delta sometimes uses information ("non-GAAP financial measures") that is derived from the Consolidated Financial Statements, but that is not presented in accordance with accounting principles generally accepted in the U.S. (“GAAP”). Under the U.S. Securities and Exchange Commission rules, non-GAAP financial measures may be considered in addition to results prepared in accordance with GAAP, but should not be considered a substitute for or superior to GAAP results. The tables below show reconciliations of non-GAAP financial measures used in this presentation to the most directly comparable GAAP financial measures. Forward Looking Projections. While we are able to reconcile forward looking non-GAAP financial measures related to 2018, we do not reconcile future period measures (i.e., beyond 2018) because mark-to- market ("MTM") adjustments and settlements will not be known until the end of the period and could be significant.
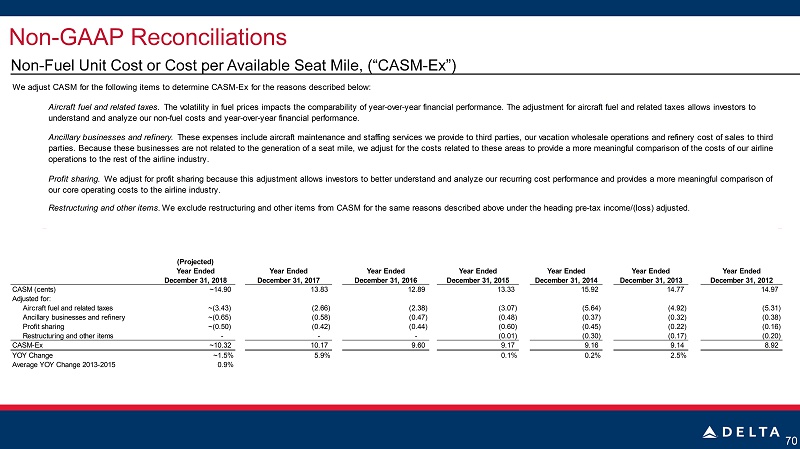
Non - GAAP Reconciliations Non - Fuel Unit Cost or Cost per Available Seat Mile, (“CASM - Ex”) We adjust CASM for the following items to determine CASM-Ex for the reasons described below: Aircraft fuel and related taxes. The volatility in fuel prices impacts the comparability of year-over-year financial performance. The adjustment for aircraft fuel and related taxes allows investors to understand and analyze our non-fuel costs and year-over-year financial performance. Ancillary businesses and refinery. These expenses include aircraft maintenance and staffing services we provide to third parties, our vacation wholesale operations and refinery cost of sales to third parties. Because these businesses are not related to the generation of a seat mile, we adjust for the costs related to these areas to provide a more meaningful comparison of the costs of our airline operations to the rest of the airline industry. Profit sharing. We adjust for profit sharing because this adjustment allows investors to better understand and analyze our recurring cost performance and provides a more meaningful comparison of our core operating costs to the airline industry. Restructuring and other items.We exclude restructuring and other items from CASM for the same reasons described above under the heading pre-tax income/(loss) adjusted. (Projected) Year Ended Year Ended Year Ended Year Ended Year Ended Year Ended Year Ended December 31, 2018 December 31, 2017 December 31, 2016 December 31, 2015 December 31, 2014 December 31, 2013 December 31, 2012 ~14.90 13.83 12.89 13.33 15.92 14.77 14.97 ~(3.43) (2.66) (2.38) (3.07) (5.64) (4.92) (5.31) ~(0.65) (0.58) (0.47) (0.48) (0.37) (0.32) (0.38) Profit sharing ~(0.50) (0.42) (0.44) (0.60) (0.45) (0.22) (0.16) Restructuring and other items - - - (0.01) (0.30) (0.17) (0.20) ~10.32 10.17 9.60 9.17 9.16 9.14 8.92 YOY Change ~1.5% 5.9% 0.1% 0.2% 2.5% Average YOY Change 2013-2015 0.9% CASM-Ex CASM (cents) Adjusted for: Aircraft fuel and related taxes Ancillary businesses and refinery 70
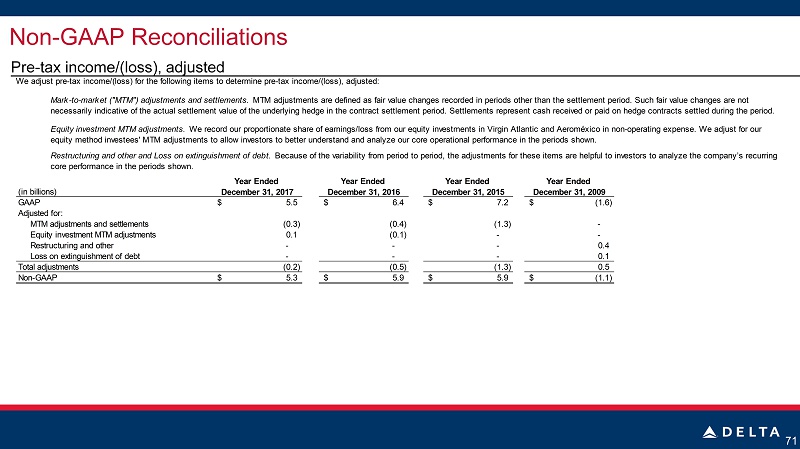
71 Non - GAAP Reconciliations Pre - tax income/(loss), adjusted Year Ended Year Ended Year Ended Year Ended December 31, 2017 December 31, 2016 December 31, 2015 December 31, 2009 5.5$ 6.4$ 7.2$ (1.6)$ (0.3) (0.4) (1.3) - 0.1 (0.1) - - Restructuring and other - - - 0.4 Loss on extinguishment of debt - - - 0.1 (0.2) (0.5) (1.3) 0.5 5.3$ 5.9$ 5.9$ (1.1)$ Total adjustments Non-GAAP GAAP Adjusted for: MTM adjustments and settlements Equity investment MTM adjustments (in billions) Restructuring and other and Loss on extinguishment of debt. Because of the variability from period to period, the adjustments for these items are helpful to investors to analyze the company’s recurring core performance in the periods shown. Mark-to-market ("MTM") adjustments and settlements. MTM adjustments are defined as fair value changes recorded in periods other than the settlement period. Such fair value changes are not necessarily indicative of the actual settlement value of the underlying hedge in the contract settlement period. Settlements represent cash received or paid on hedge contracts settled during the period. Equity investment MTM adjustments. We record our proportionate share of earnings/loss from our equity investments in Virgin Atlantic and Aeroméxico in non-operating expense. We adjust for our equity method investees' MTM adjustments to allow investors to better understand and analyze our core operational performance in the periods shown. We adjust pre-tax income/(loss) for the following items to determine pre-tax income/(loss), adjusted:
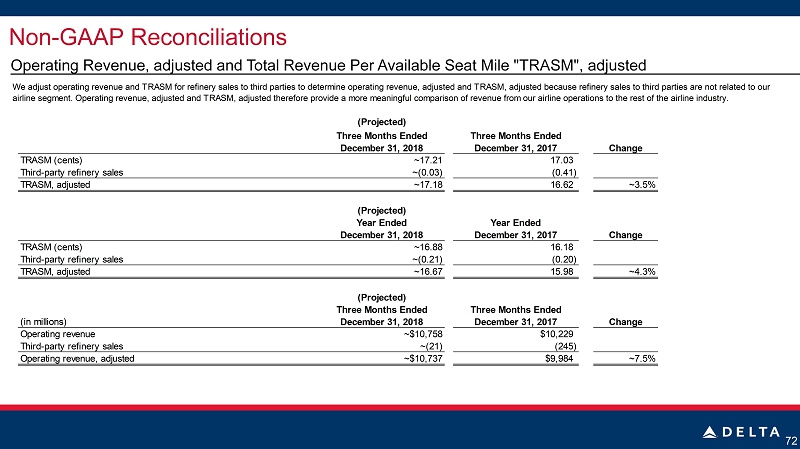
Non - GAAP Reconciliations Operating Revenue, adjusted and Total Revenue Per Available Seat Mile "TRASM", adjusted We adjust operating revenue and TRASM for refinery sales to third parties to determine operating revenue, adjusted and TRASM, adjusted because refinery sales to third parties are not related to our airline segment. Operating revenue, adjusted and TRASM, adjusted therefore provide a more meaningful comparison of revenue from our airline operations to the rest of the airline industry. (Projected) Three Months Ended Three Months Ended December 31, 2018 December 31, 2017 Change TRASM (cents) ~17.21 17.03 Third-party refinery sales ~(0.03) (0.41) TRASM, adjusted ~17.18 16.62 ~3.5% (Projected) Year Ended Year Ended December 31, 2018 December 31, 2017 Change TRASM (cents) ~16.88 16.18 Third-party refinery sales ~(0.21) (0.20) TRASM, adjusted ~16.67 15.98 ~4.3% (Projected) Three Months Ended Three Months Ended (in millions) December 31, 2018 December 31, 2017 Change Operating revenue ~$10,758 $10,229 Third-party refinery sales ~(21) (245) Operating revenue, adjusted ~$10,737 $9,984 ~7.5% 72
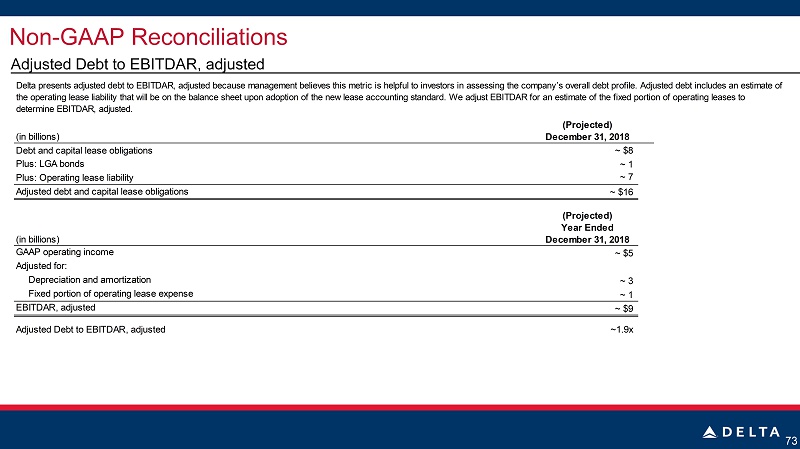
73 Non - GAAP Reconciliations Adjusted Debt to EBITDAR, adjusted Delta presents adjusted debt to EBITDAR, adjusted because management believes this metric is helpful to investors in assessing the company’s overall debt profile. Adjusted debt includes an estimate of the operating lease liability that will be on the balance sheet upon adoption of the new lease accounting standard. We adjust EBITDAR for an estimate of the fixed portion of operating leases to determine EBITDAR, adjusted. (Projected) December 31, 2018 ~ $8 Plus: LGA bonds ~ 1 Plus: Operating lease liability ~ 7 ~ $16 (Projected) Year Ended (in billions) December 31, 2018 GAAP operating income ~ $5 Adjusted for: Depreciation and amortization ~ 3 Fixed portion of operating lease expense ~ 1 EBITDAR, adjusted ~ $9 Adjusted Debt to EBITDAR, adjusted ~1.9x Adjusted debt and capital lease obligations (in billions) Debt and capital lease obligations