Exhibit 99.2

WELCOME .

Differentiated Durable 2024 Investor Day November 20, 2024

JULIE STEWART Vice President, Investor Relations & Corporate Development

Statements made in this presentation that are not historical facts, including statements regarding our estimates, expectations, beliefs, intentions, projections, goals, aspirations, commitments or strategies for the future, should be considered “forward - looking statements” under the Securities Act of 1933, as amended, the Securities Exchange Act of 1934, as amended, and the Private Securities Litigation Reform Act of 1995. Such statements are not guarantees or promised outcomes and should not be construed as such. All forward - looking statements involve a number of risks and uncertainties that could cause actual results to differ materially from the estimates, expectations, beliefs, intentions, projections, goals, aspirations, commitments and strategies reflected in or suggested by the forward - looking statements. These risks and uncertainties include, but are not limited to, the possible effects of serious accidents involving our aircraft or aircraft of our airline partners; breaches or lapses in the security of technology systems we use and rely on, which could compromise the data stored within them, as well as failure to comply with evolving global privacy and security regulatory obligations or adequately address increasing customer focus on privacy issues and data security; disruptions in our information technology infrastructure; our dependence on technology in our operations; increases in the cost of aircraft fuel; extended disruptions in the supply of aircraft fuel, including from Monroe Energy, LLC (“Monroe”), a wholly - owned subsidiary of Delta that operates the Trainer refinery; failure to receive the expected results or returns from our commercial relationships with airlines in other parts of the world and the investments we have in certain of those airlines; the effects of a significant disruption in the operations or performance of third parties on which we rely; failure to comply with the financial and other covenants in our financing agreements; labor issues; the effects on our business of seasonality and other factors beyond our control, such as changes in value in our equity investments, severe weather conditions, natural disasters or other environmental events, including from the impact of climate change; failure or inability of insurance to cover a significant liability at Monroe’s refinery; failure to comply with existing and future environmental regulations to which Monroe’s refinery operations are subject, including costs related to compliance with renewable fuel standard regulations; significant damage to our reputation and brand, including from exposure to significant adverse publicity or inability to achieve certain sustainability goals; our ability to retain senior management and other key employees, and to maintain our company culture; disease outbreaks, such as the COVID - 19 pandemic or similar public health threats, and measures implemented to combat them; the effects of terrorist attacks, geopolitical conflict or security events; competitive conditions in the airline industry; extended interruptions or disruptions in service at major airports at which we operate or significant problems associated with types of aircraft or engines we operate; the effects of extensive government regulation we are subject to; the impact of environmental regulation, including but not limited to regulation of hazardous substances, increased regulation to reduce emissions and other risks associated with climate change, and the cost of compliance with more stringent environmental regulations; and unfavorable economic or political conditions in the markets in which we operate or volatility in currency exchange rates. Additional information concerning risks and uncertainties that could cause differences between actual results and forward - looking statements is contained in our Securities and Exchange Commission (SEC) filings, including our Annual Report on Form 10 - K for the fiscal year ended December 31, 2023 and subsequent quarterly reports and other filings filed with the SEC from time to time. Caution should be taken not to place undue reliance on our forward - looking statements, which represent our views only as of the date of this presentation, and which we undertake no obligation to update except to the extent required by law. 4 SAFE HARBOR

Ed Bastian CEO 8:35 – 9:15 AM Glen Hauenstein President 9:15 – 9:55 AM Dan Janki EVP & CFO 9:55 – 10:25 AM BREAK 10:25 – 10:45 AM Q&A 10:45 – 11:45 AM TODAY’S AGENDA 5
ED BASTIAN Chief Executive Officer
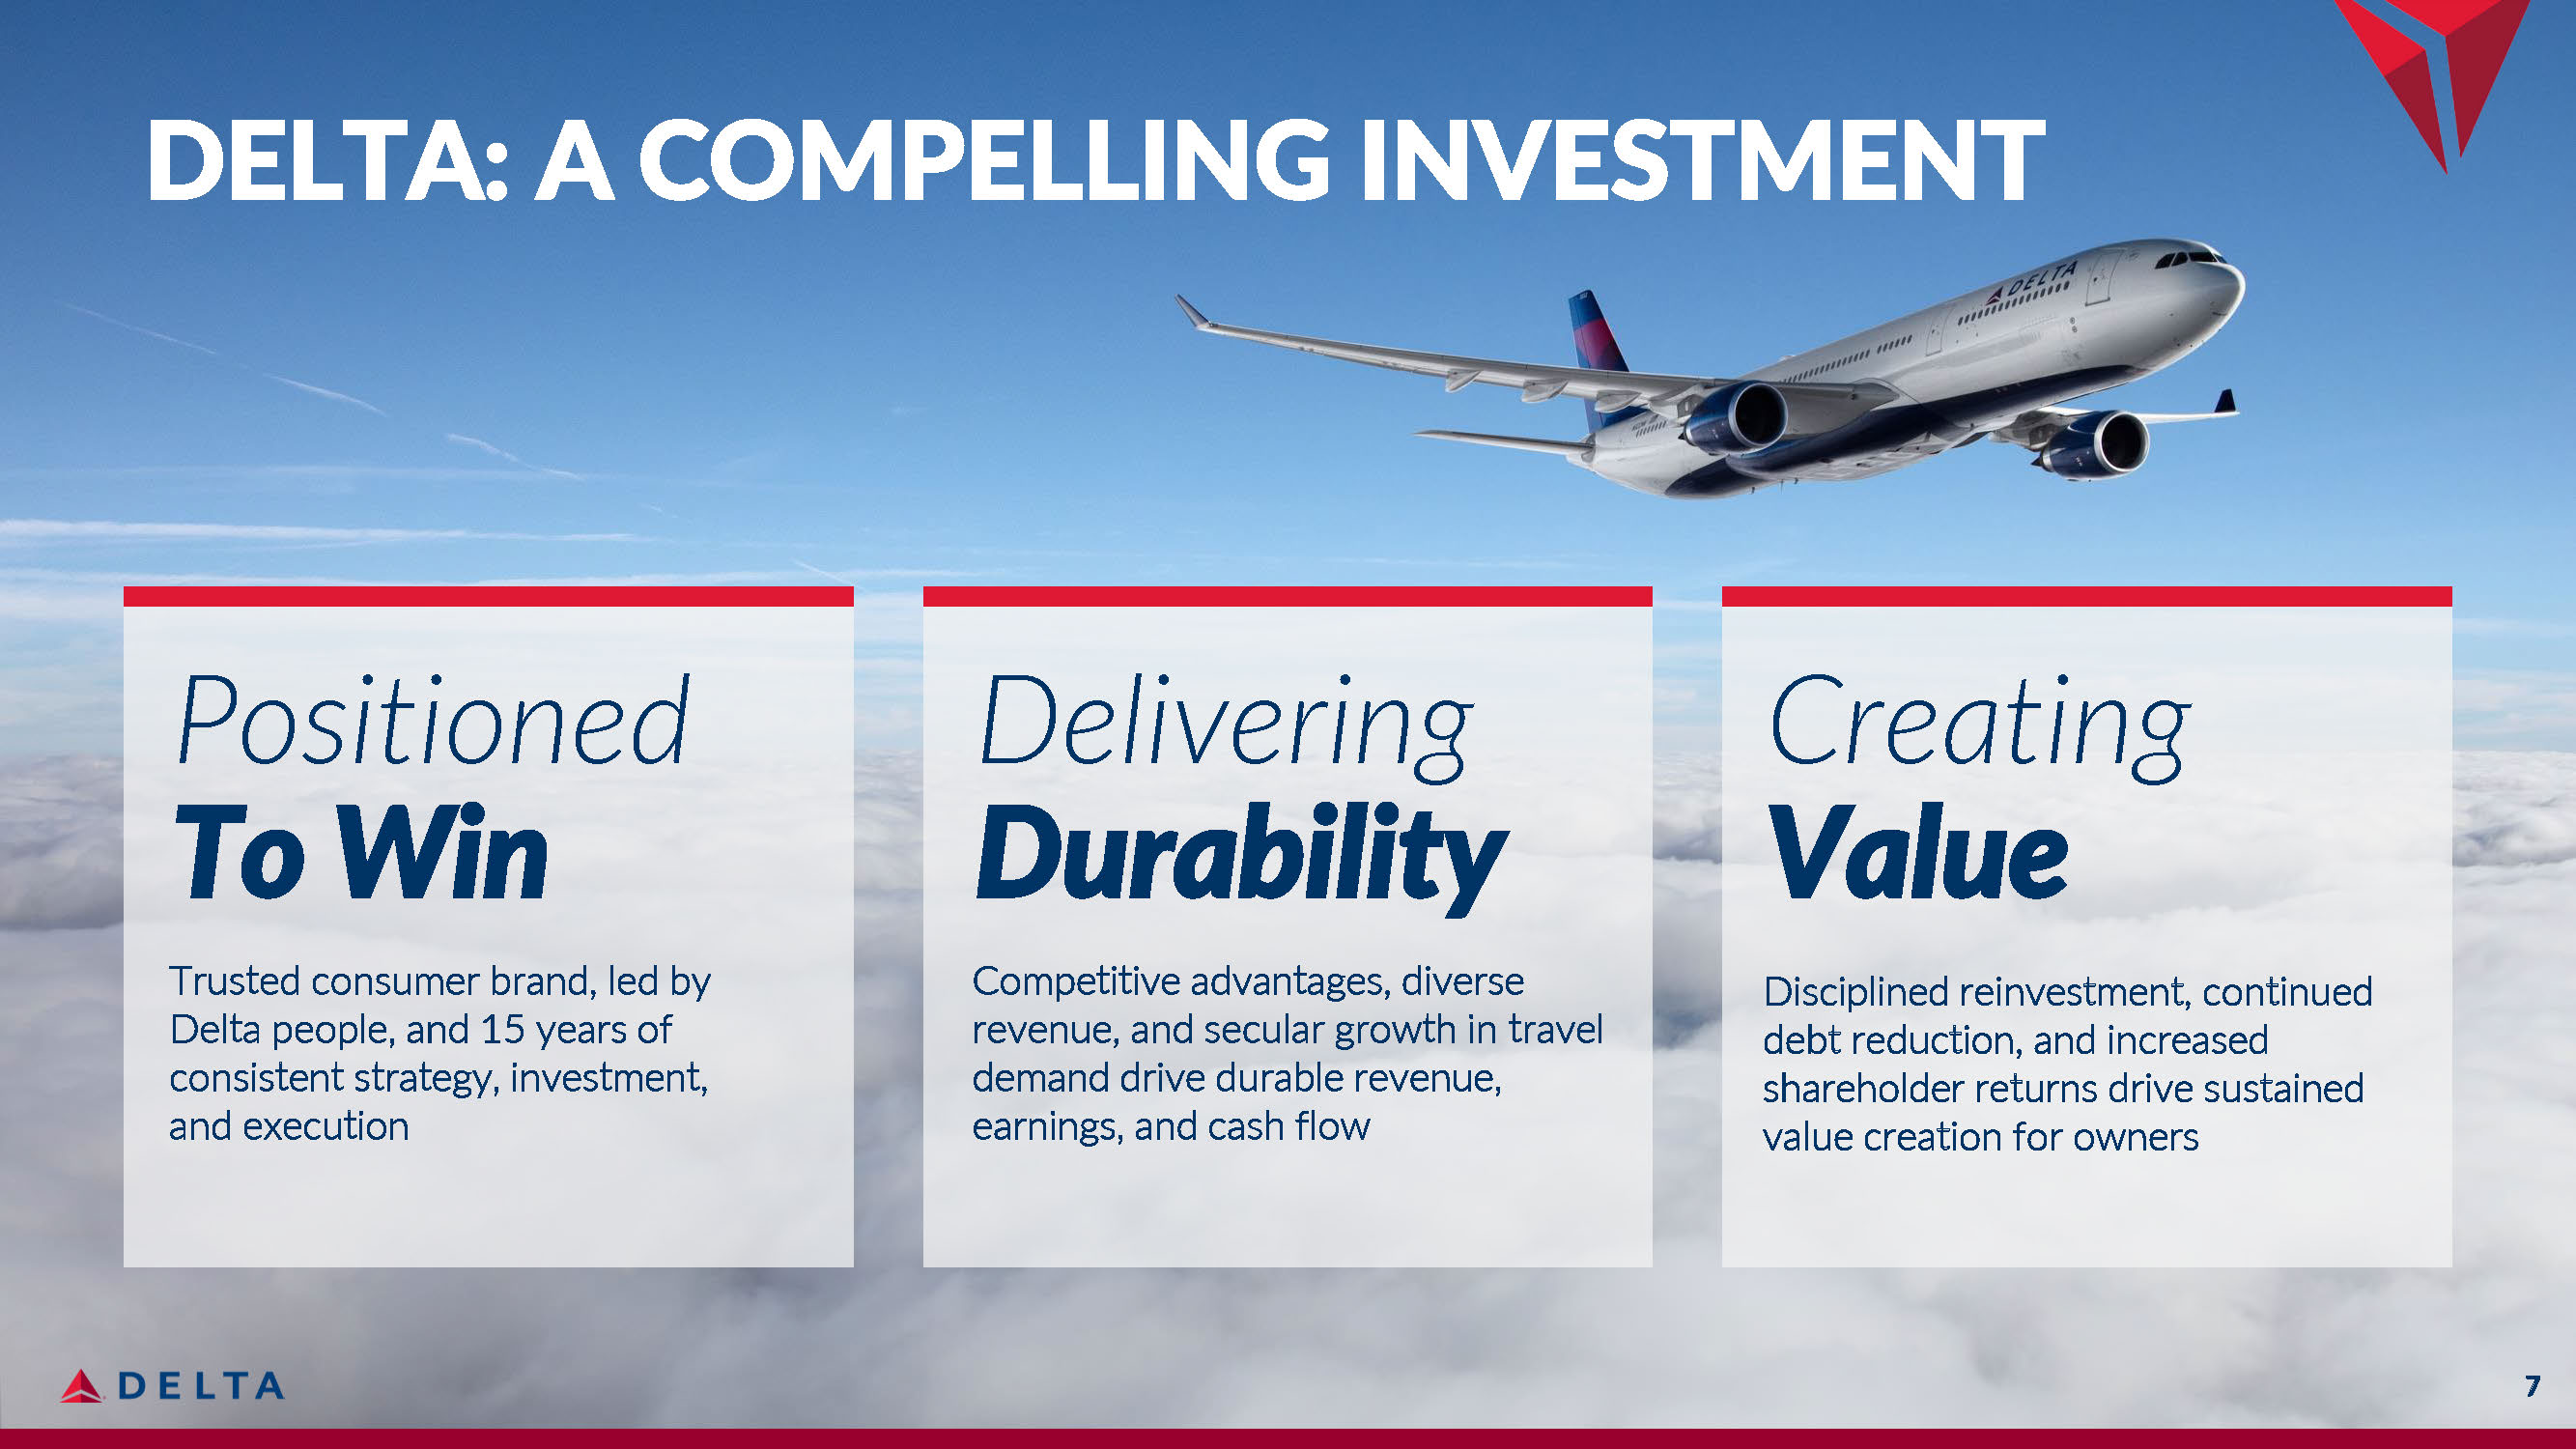
DELTA: A COMPELLING INVESTMENT Positioned To Win Trusted consumer brand, led by Delta people, and 15 years of consistent strategy, investment, and execution Delivering Durability Competitive advantages, diverse revenue, and secular growth in travel demand drive durable revenue, earnings, and cash flow Creating Value Disciplined reinvestment, continued debt reduction, and increased shareholder returns drive sustained value creation for owners 7
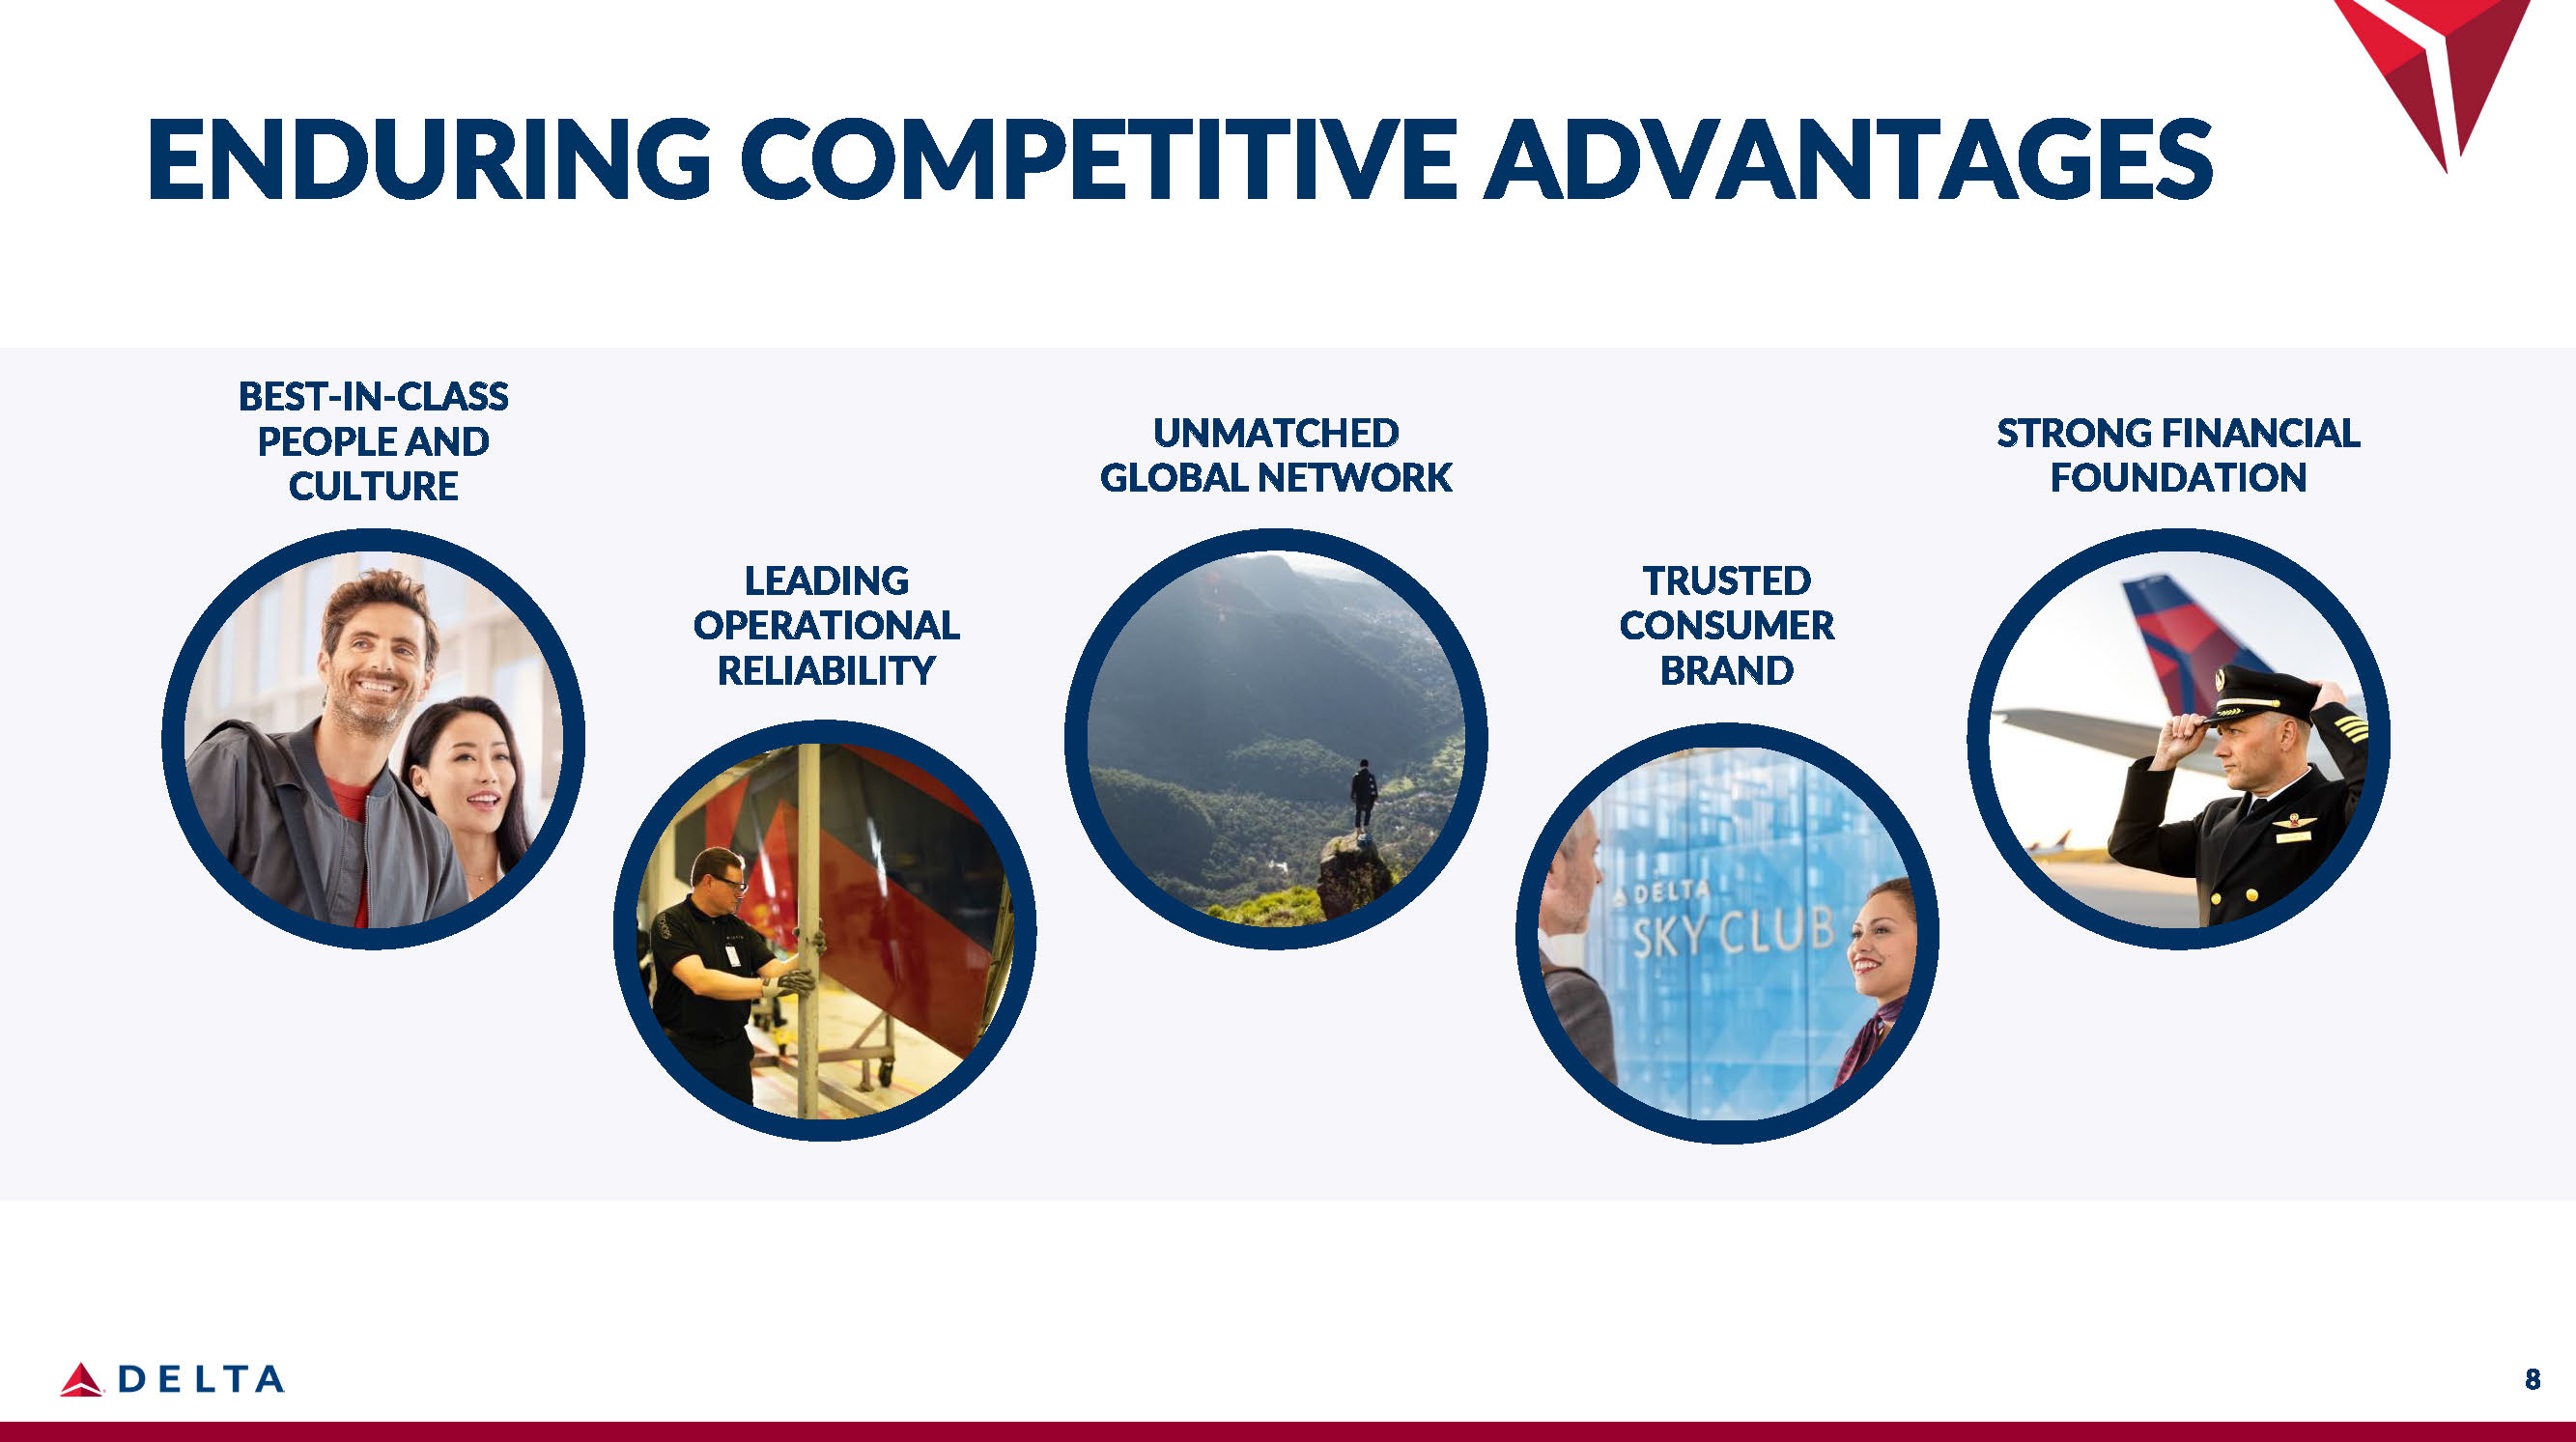
ENDURING COMPETITIVE ADVANTAGES BEST - IN - CLASS PEOPLE AND CULTURE LEADING OPERATIONAL RELIABILITY 8 TRUSTED CONSUMER BRAND STRONG FINANCIAL FOUNDATION UNMATCHED GLOBAL NETWORK
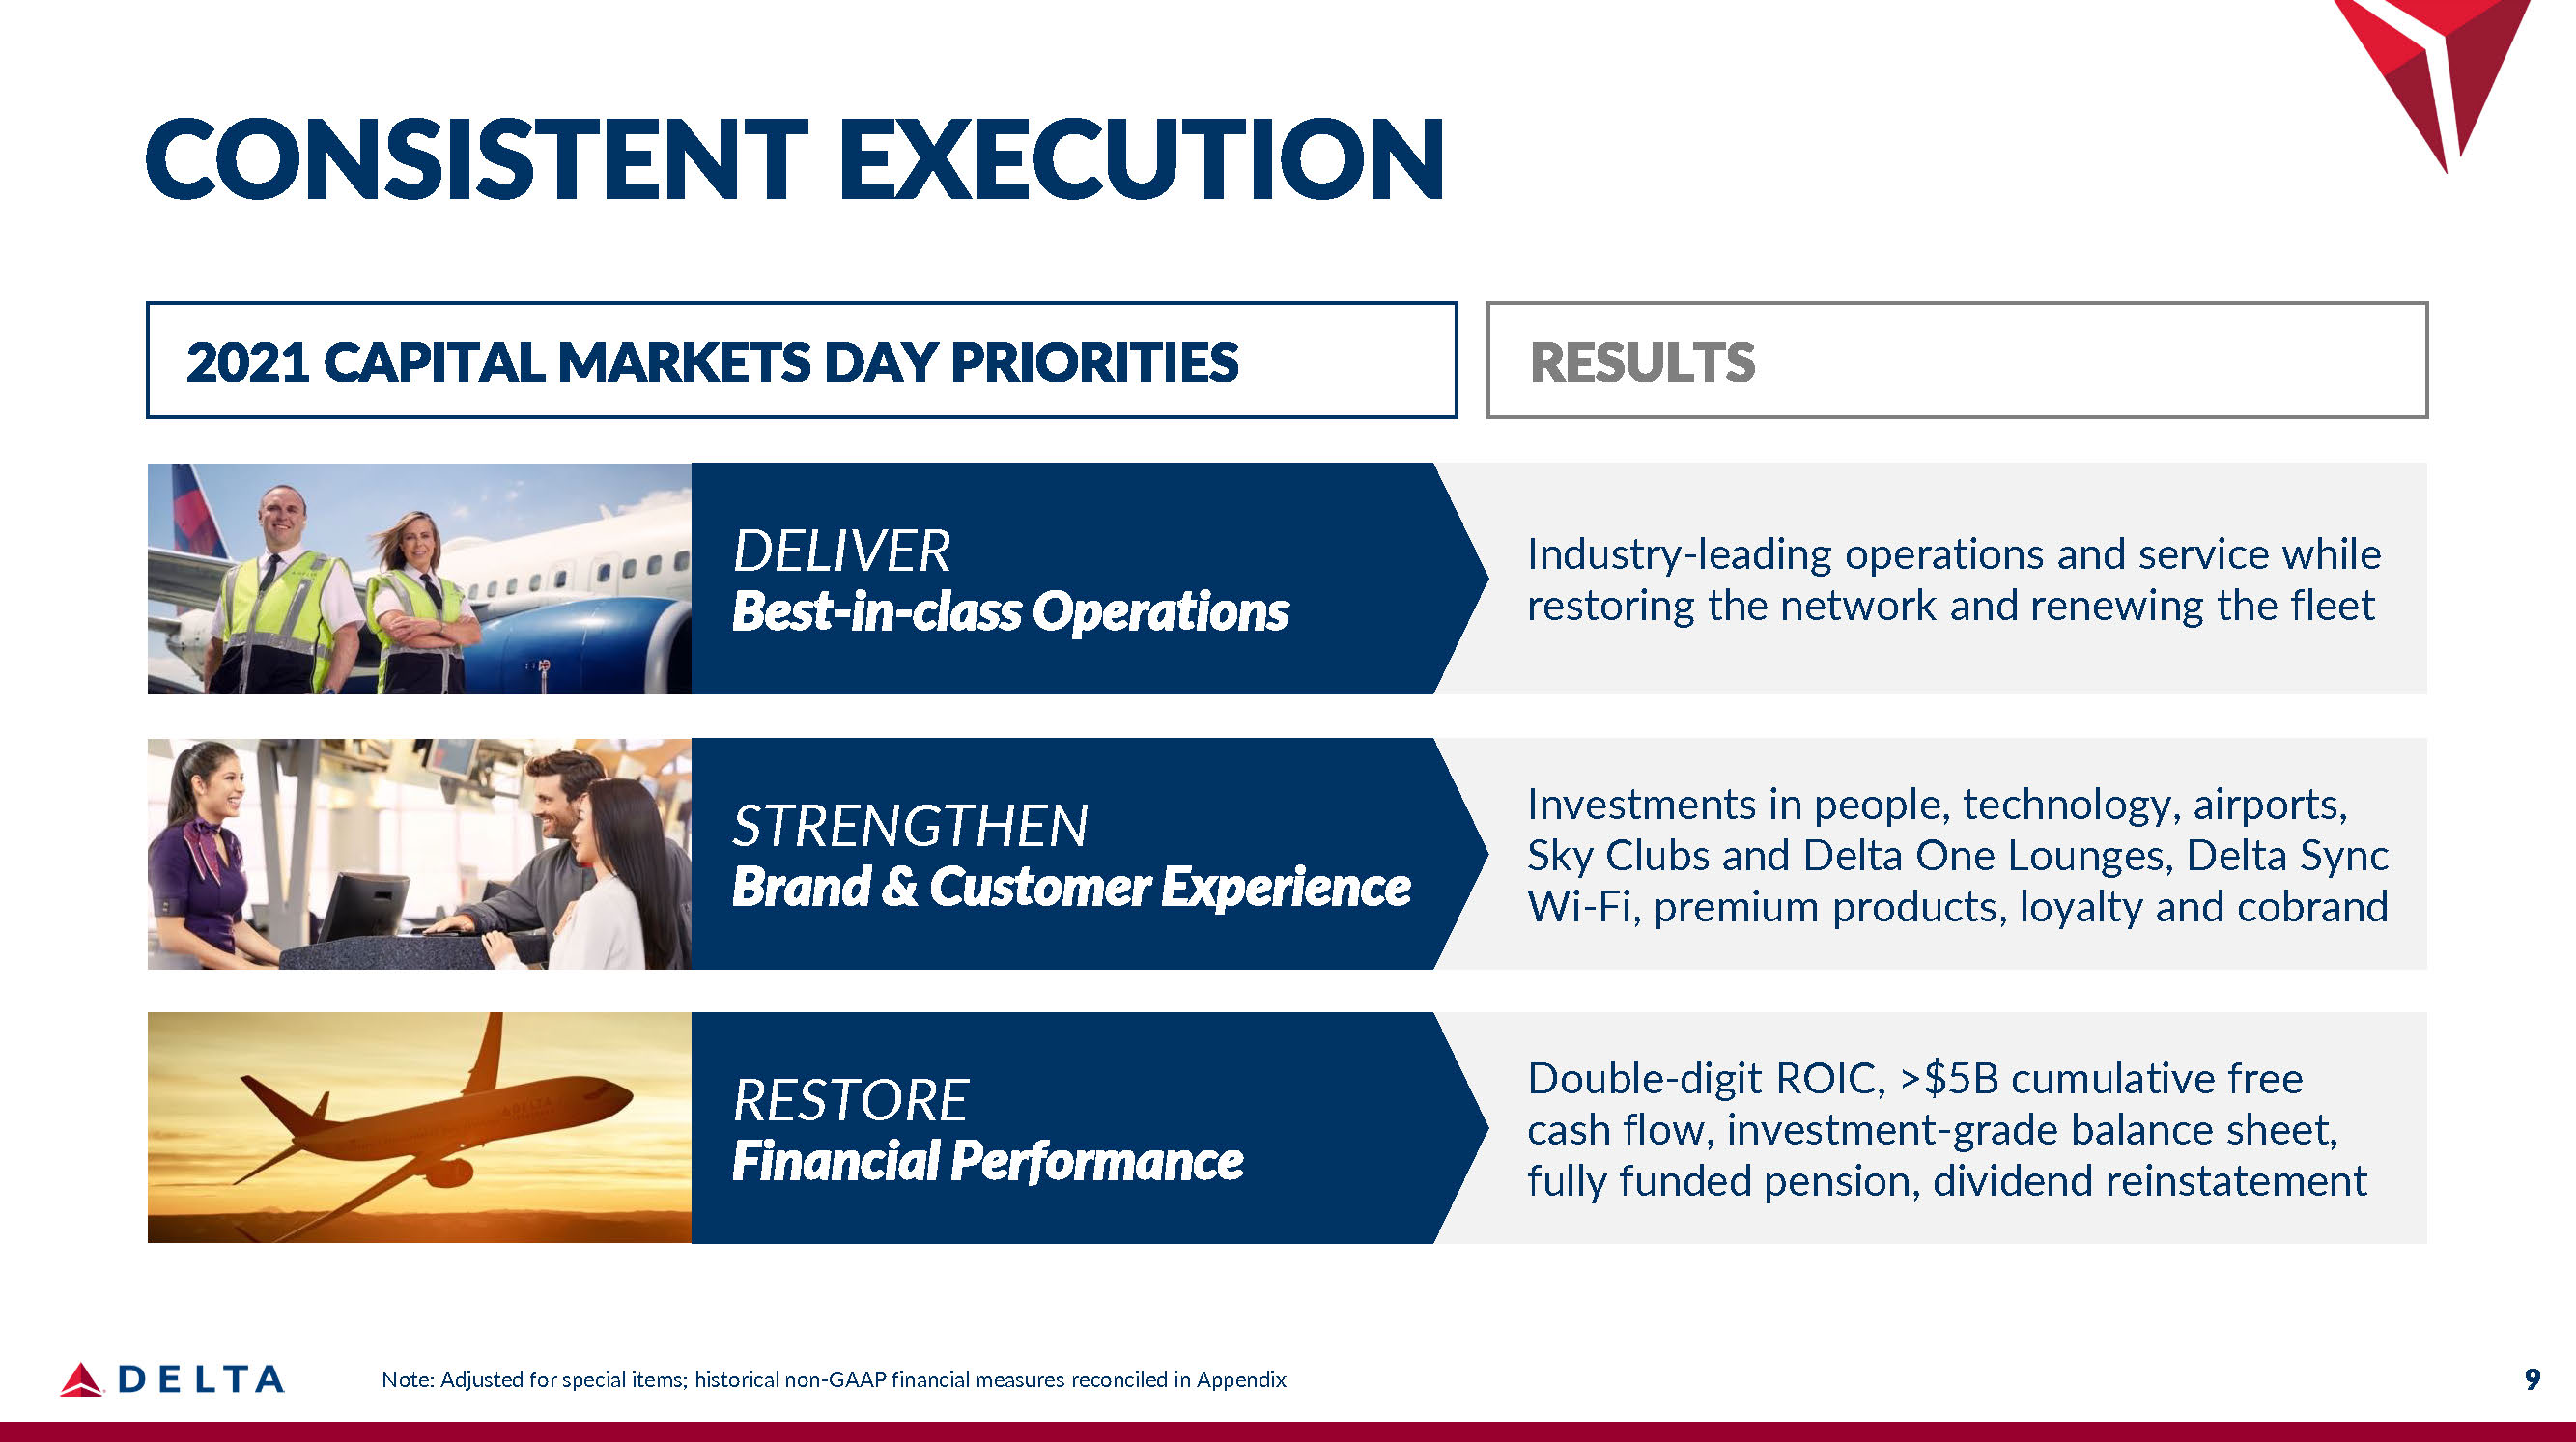
CONSISTENT EXECUTION Industry - leading operations and service while restoring the network and renewing the fleet 2021 CAPITAL MARKETS DAY PRIORITIES DELIVER Best - in - class Operations STRENGTHEN Brand & Customer Experience RESTORE Financial Performance Investments in people, technology, airports, Sky Clubs and Delta One Lounges, Delta Sync Wi - Fi, premium products, loyalty and cobrand Double - digit ROIC, >$5B cumulative free cash flow, investment - grade balance sheet, fully funded pension, dividend reinstatement RESULTS 9 Note: Adjusted for special items; historical non - GAAP financial measures reconciled in Appendix

DELTA’S BRAND TRANSCENDS THE INDUSTRY Powered by Delta’s people 10
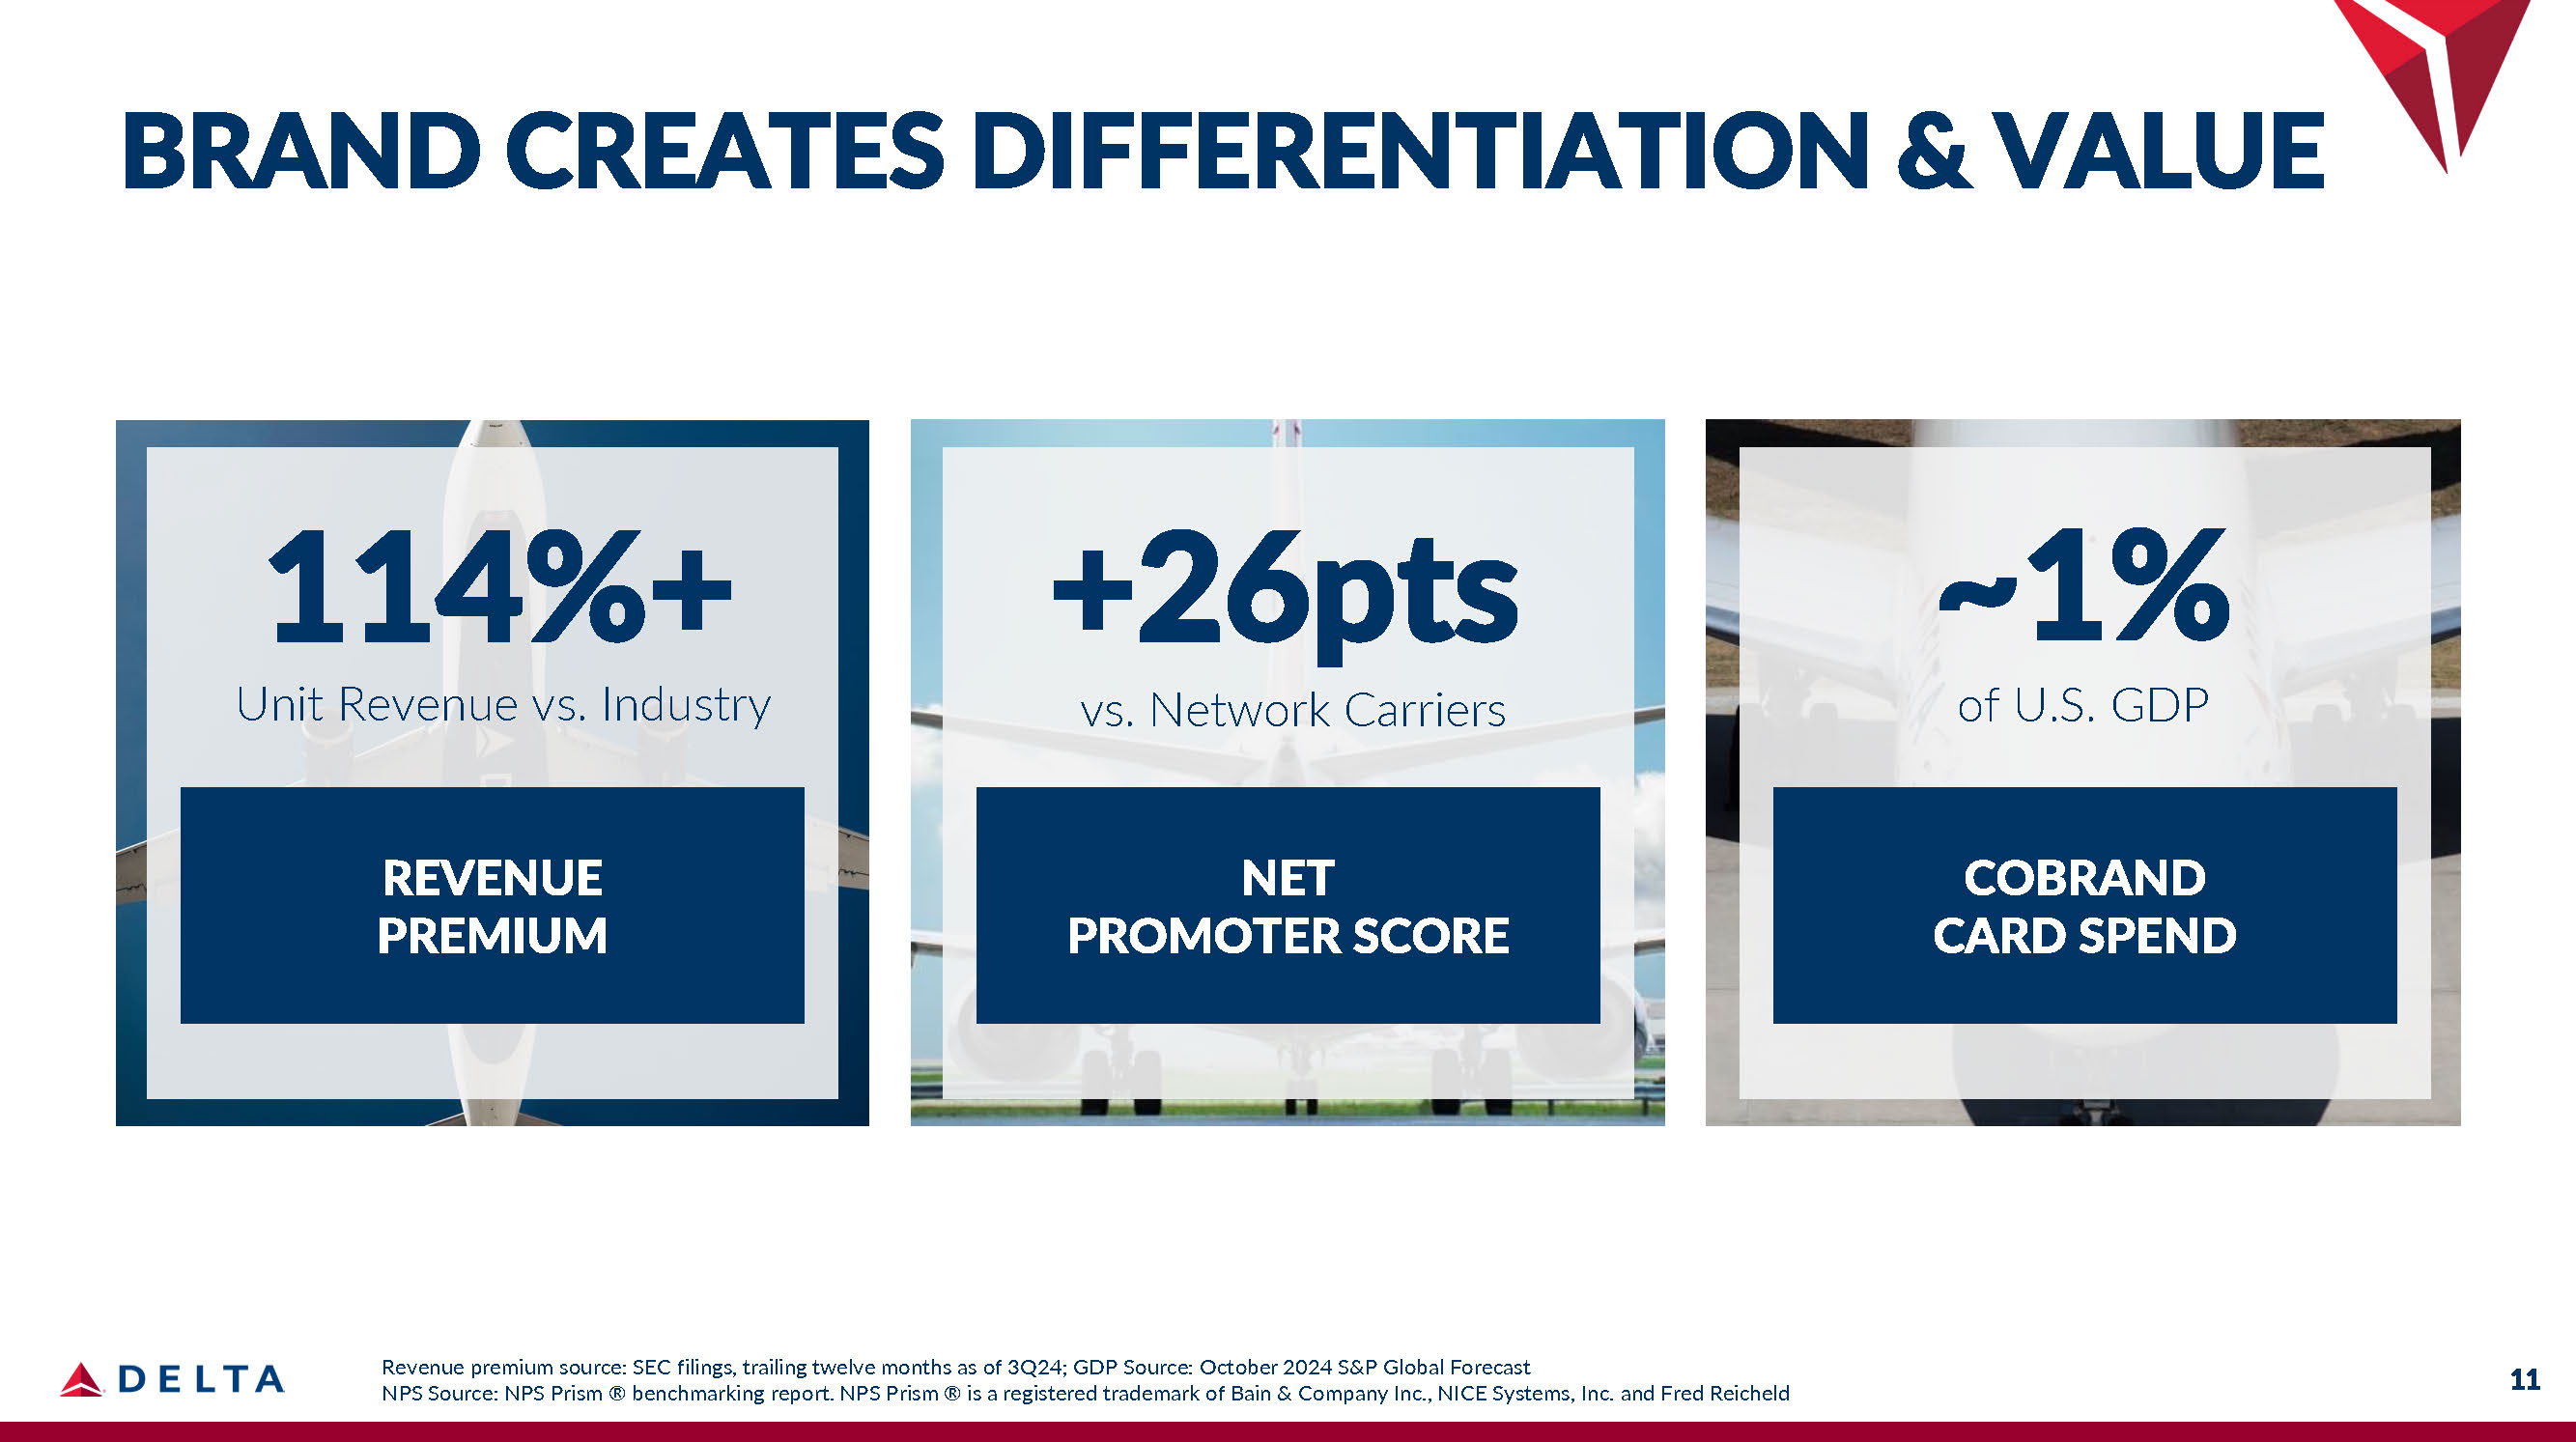
NET PROMOTER SCORE Revenue premium source: SEC filings, trailing twelve months as of 3Q24; GDP Source: October 2024 S&P Global Forecast NPS Source: NPS Prism ® benchmarking report. NPS Prism ® is a registered trademark of Bain & Company Inc., NICE Systems, Inc. and Fred Reicheld 11 REVENUE PREMIUM 114%+ Unit Revenue vs. Industry COBRAND CARD SPEND ~1% of U.S. GDP +26pts vs. Network Carriers BRAND CREATES DIFFERENTIATION & VALUE

An advantaged U.S. consumer in a resilient economy Secular growth in travel demand across generations as experiences prioritized Growing demand for premium, corporate, and international travel Accelerating pace of industry change supports improving financial returns EVOLVING CONSUMER AND INDUSTRY Delta is uniquely positioned to capitalize on secular consumer and travel trends 12
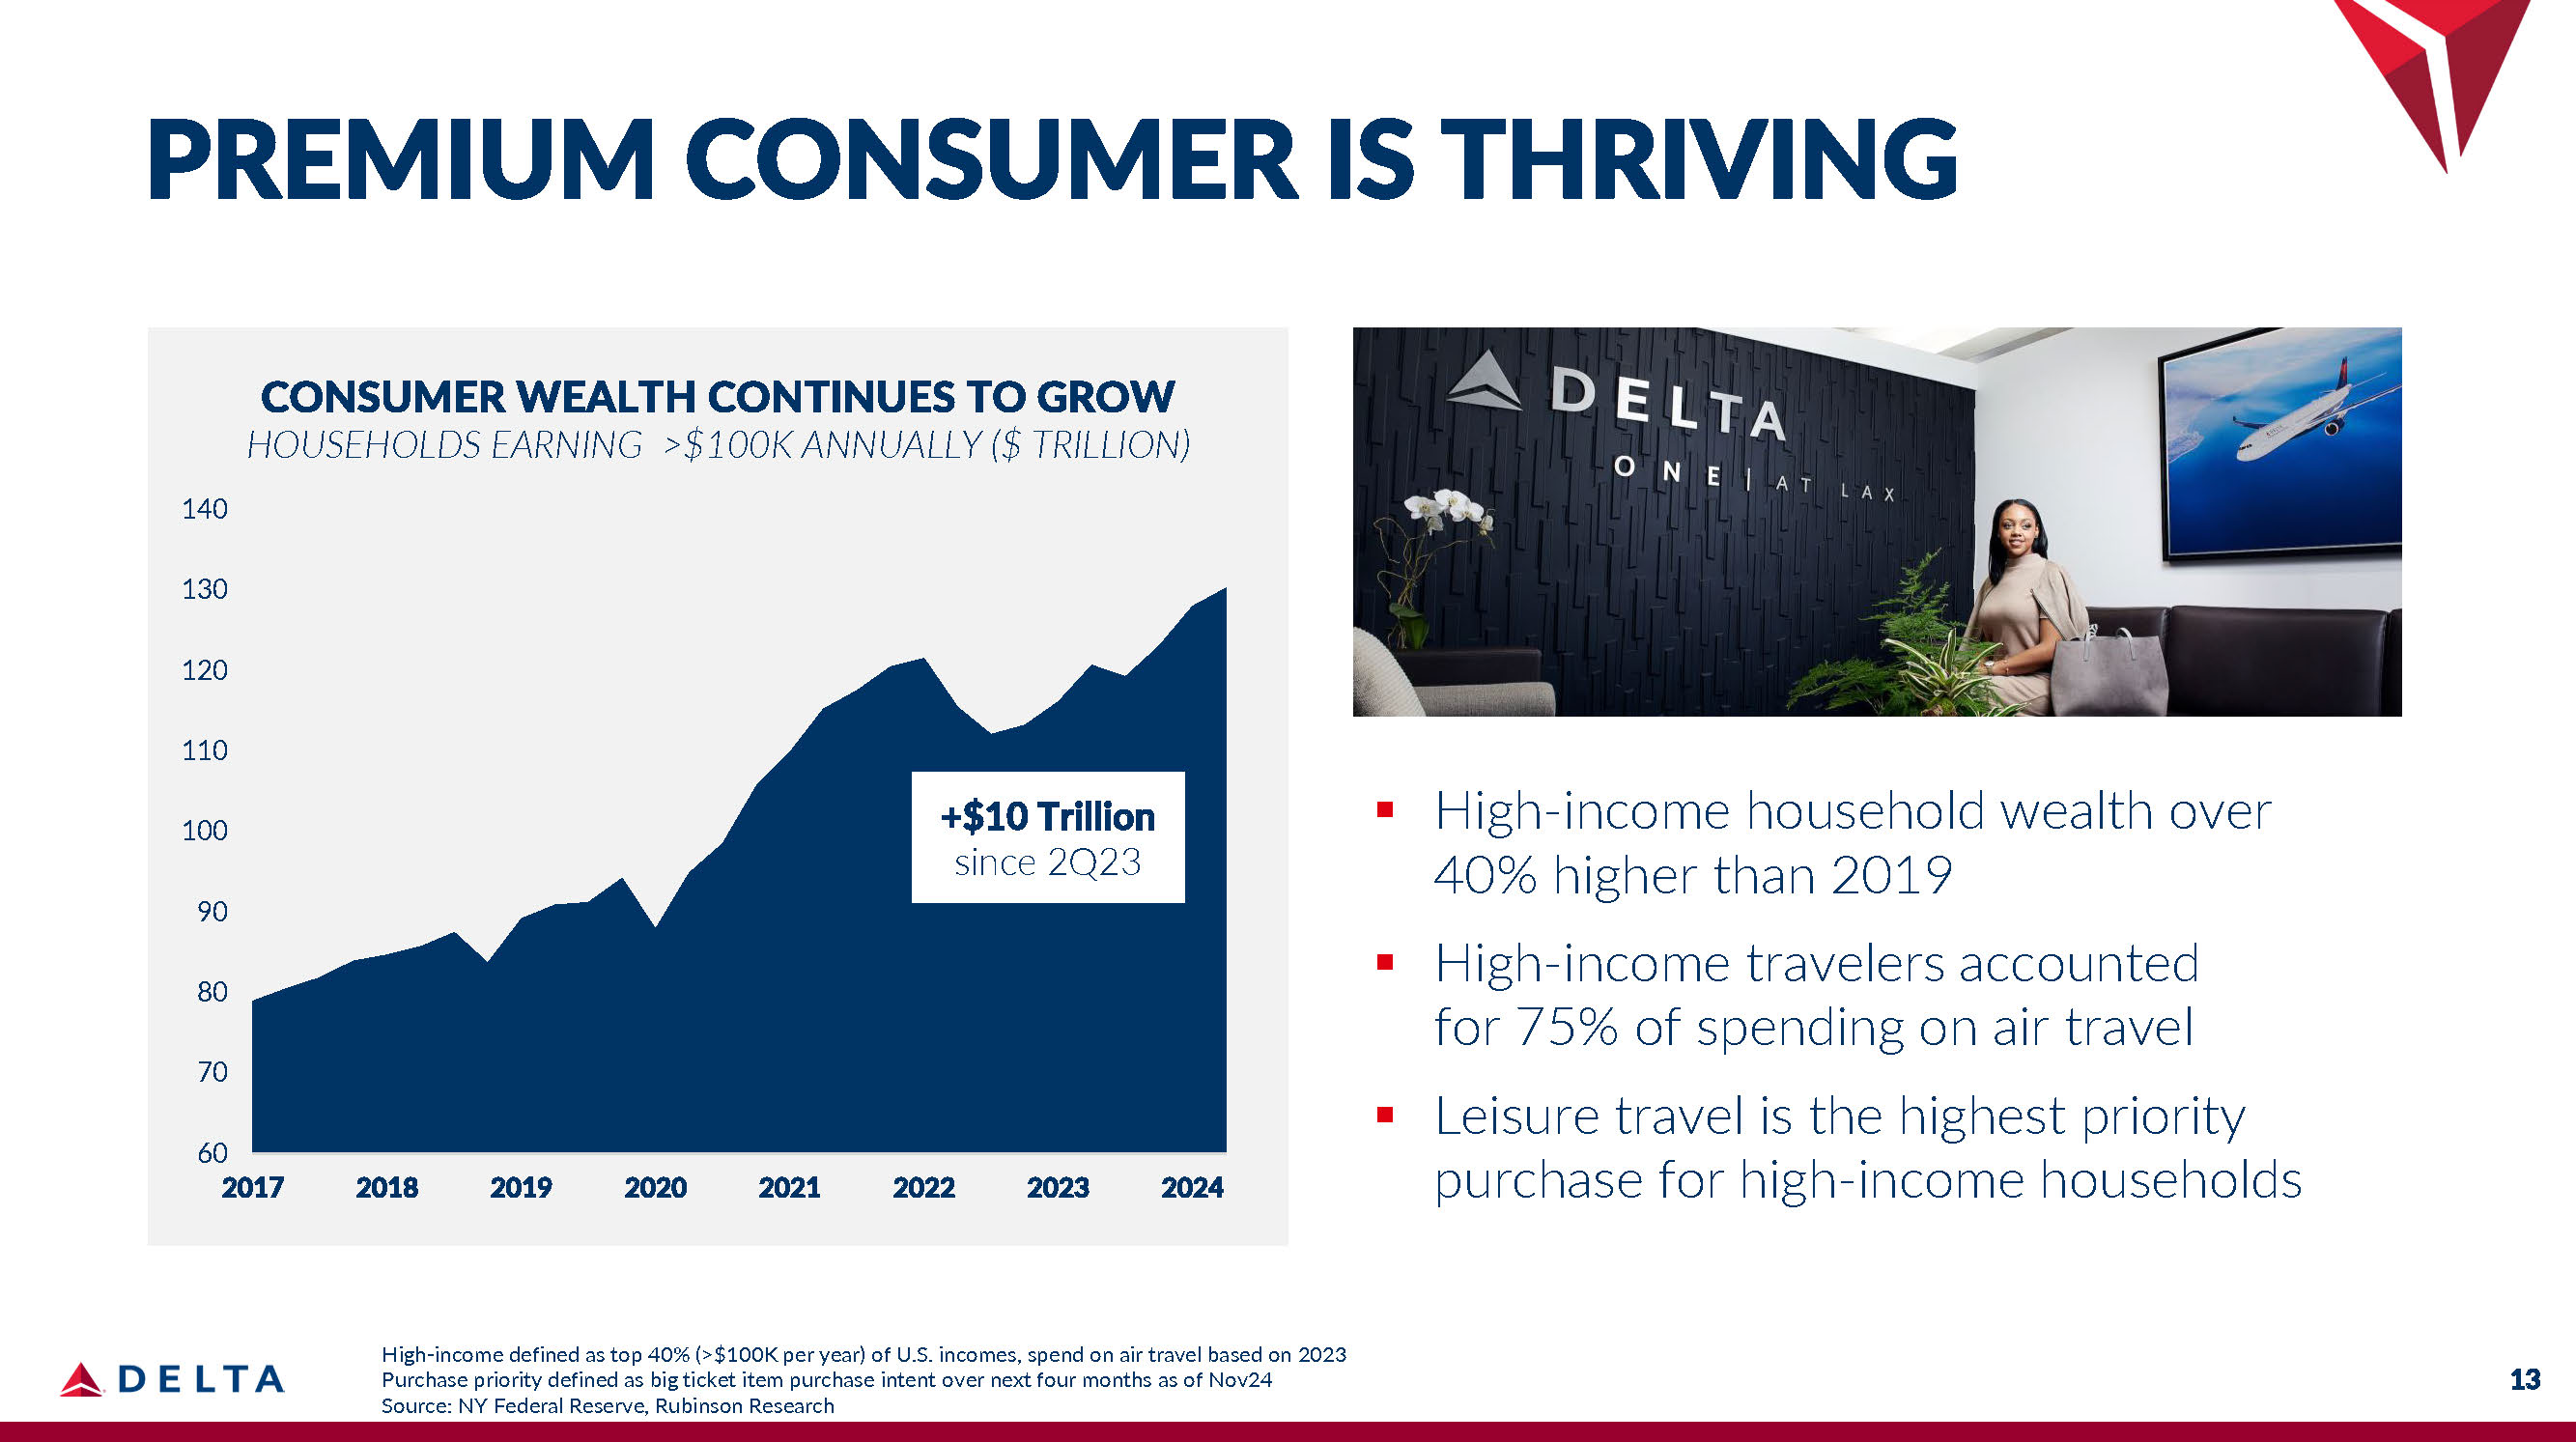
13 High - income defined as top 40% (>$100K per year) of U.S. incomes, spend on air travel based on 2023 Purchase priority defined as big ticket item purchase intent over next four months as of Nov24 140 130 120 110 100 90 80 70 60 2017 2018 2019 2020 2021 2022 2023 2024 CONSUMER WEALTH CONTINUES TO GROW HOUSEHOLDS EARNING >$100K ANNUALLY ($ TRILLION) +$10 Trillion since 2Q23 ▪ High - income household wealth over 40% higher than 2019 ▪ High - income travelers accounted for 75% of spending on air travel ▪ Leisure travel is the highest priority purchase for high - income households PREMIUM CONSUMER IS THRIVING Source: NY Federal Reserve, Rubinson Research

14 Source: Federal Reserve, Bureau of Labor Statistics, Rubinson Research, estimates for each generation when they were ages 28 - 43; Millennials (1981 - 1996), Gen X (1965 - 1980), Boomers (1946 - 1964), Skift Research Exploring Gen Z and Millennial Travel Habits Millennials 2024 Gen X 2008 Boomers 1992 +36% +20% HOUSEHOLD WEALTH BY GENERATION AT COMPARABLE AGES, INFLATION ADJ. $265k Millennials have more wealth than prior generations at the same age ▪ Air travel spend growth is outpacing total spend for all generations by 3 - 4 pts ▪ Millennials + Gen Z are the fastest growing customer segments ▪ Two - thirds of Millennials are willing to spend on luxury travel MILLENNIALS DRIVING PREMIUM GROWTH

Elevate the World’s Best Airline ▪ Operational excellence ▪ Technology transformation ▪ Advantaged network and fleet Deliver Sustained Value Creation ▪ Margin expansion ▪ Durable earnings and free cash flow ▪ Reduce leverage, increase returns Unlock the Value of a Trusted Brand ▪ Invest in experience and choice ▪ Grow loyalty to Delta’s brand ▪ Engage customers beyond the flight DELTA IS POSITIONED TO WIN 15
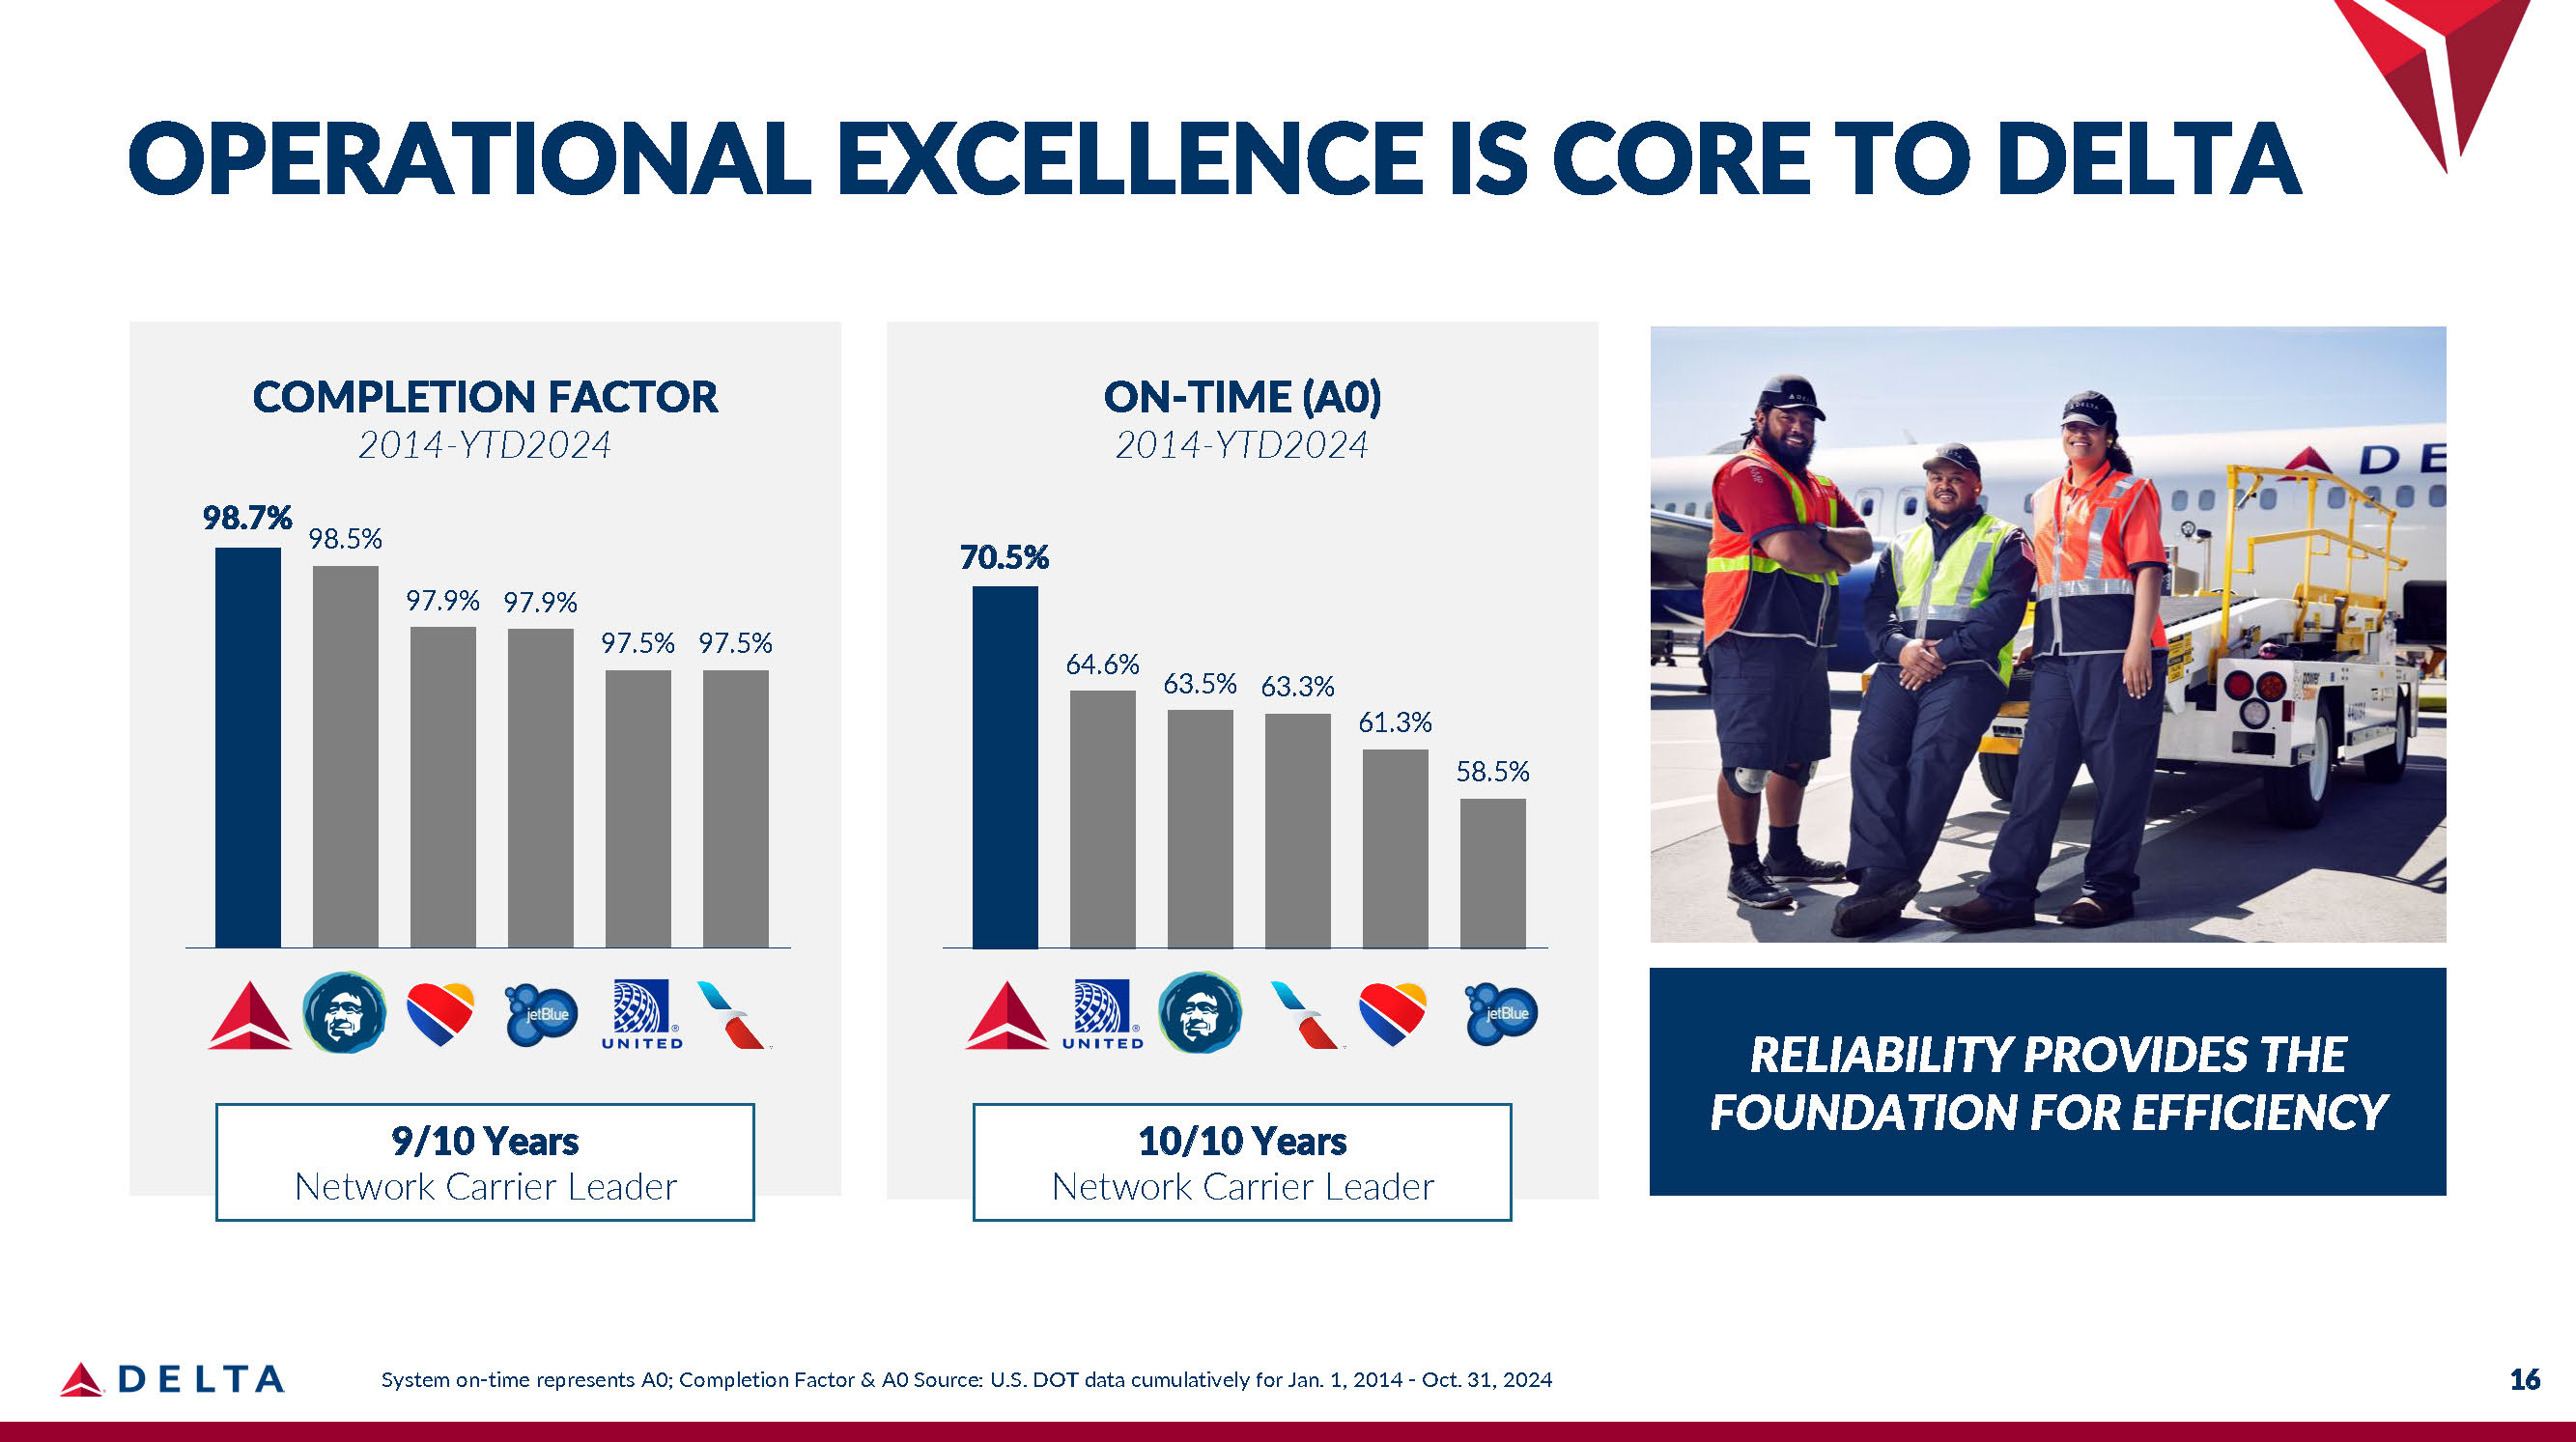
OPERATIONAL EXCELLENCE IS CORE TO DELTA RELIABILITY PROVIDES THE FOUNDATION FOR EFFICIENCY COMPLETION FACTOR 2014 - YTD2024 98.7% 98.5% 97.9% 97.9% 97.5% 97.5% ON - TIME (A0) 2014 - YTD2024 9/10 Years Network Carrier Leader 10/10 Years Network Carrier Leader 70.5% 16 System on - time represents A0; Completion Factor & A0 Source: U.S. DOT data cumulatively for Jan. 1, 2014 - Oct. 31, 2024 64.6% 63.5% 63.3% 61.3% 58.5%

TRANSFORMING THROUGH TECHNOLOGY Investments in cloud infrastructure enable acceleration MODERNIZED Platforms & Software More Reliable Operation, Efficiently Delivered 17 Connected Digital Experience for Customers Enhanced Capabilities to Drive Revenue Premium INTEGRATED Data & Analytics
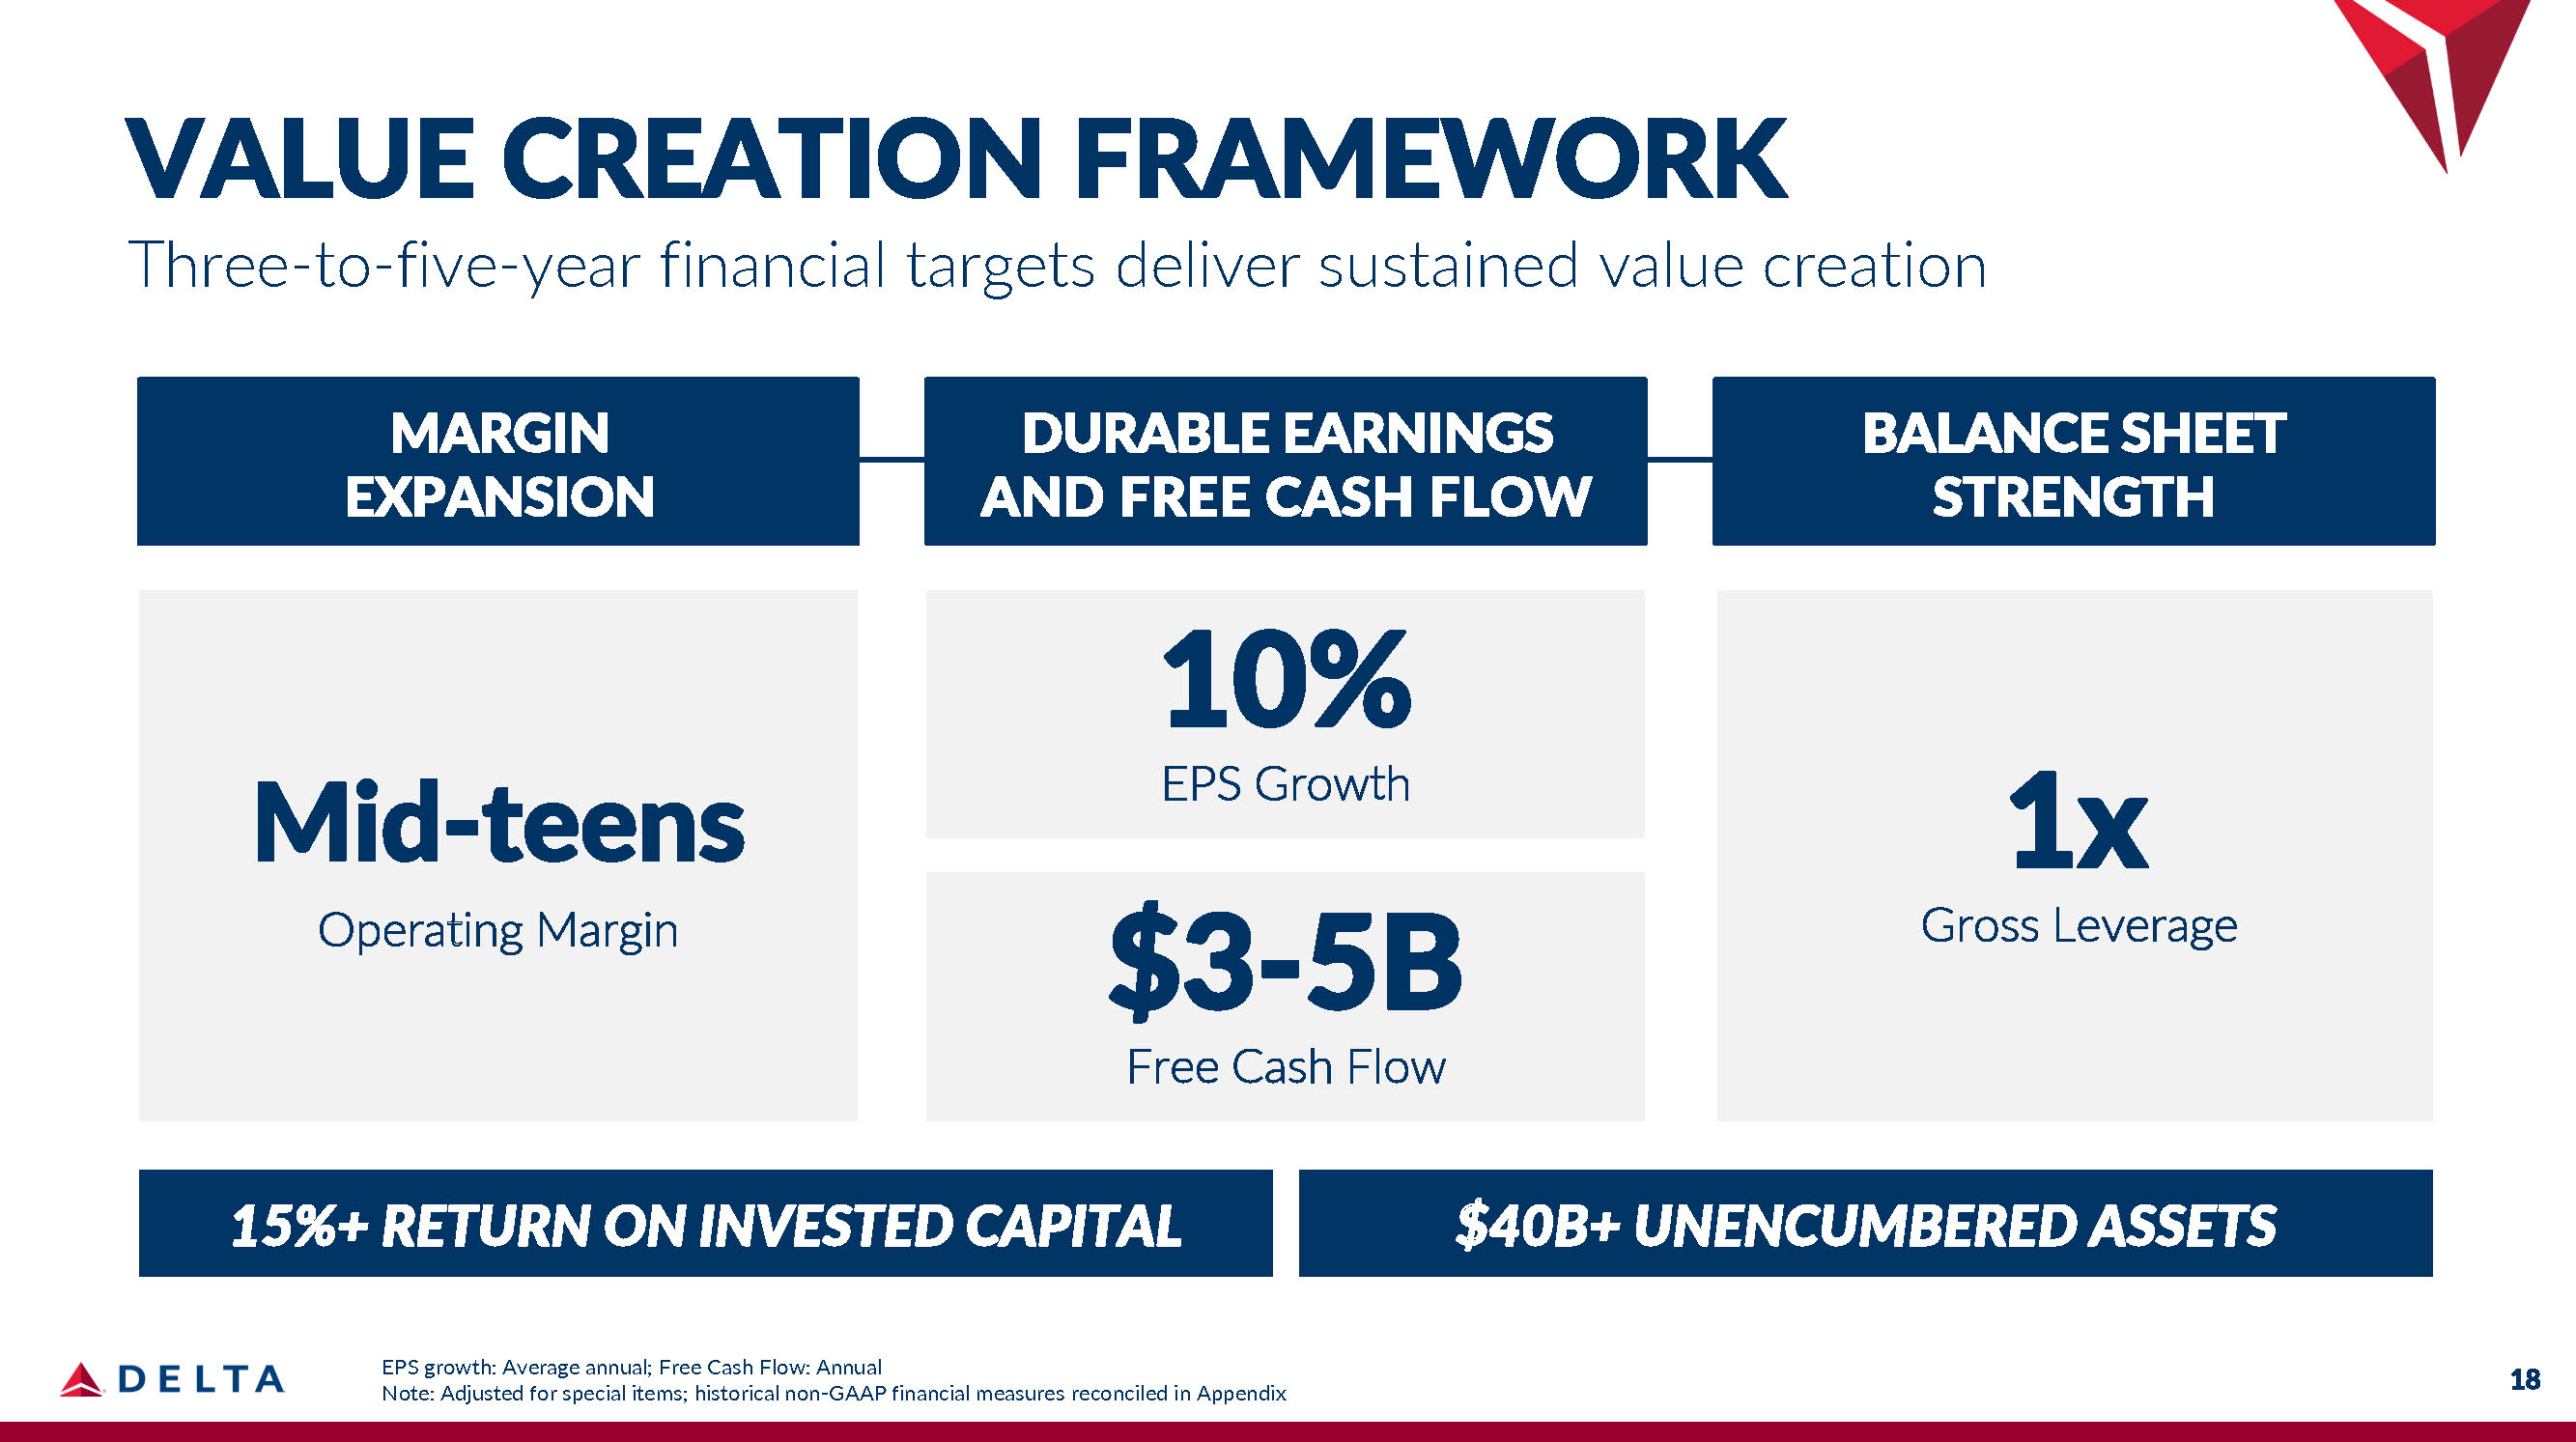
18 VALUE CREATION FRAMEWORK Three - to - five - year financial targets deliver sustained value creation MARGIN DURABLE EARNINGS BALANCE SHEET EXPANSION AND FREE CASH FLOW STRENGTH Note: Adjusted for special items; historical non - GAAP financial measures reconciled in Appendix Mid - teens Operating Margin 1x Gross Leverage 10% EPS Growth $3 - 5B Free Cash Flow EPS growth: Average annual; Free Cash Flow: Annual 15%+ RETURN ON INVESTED CAPITAL $40B+ UNENCUMBERED ASSETS
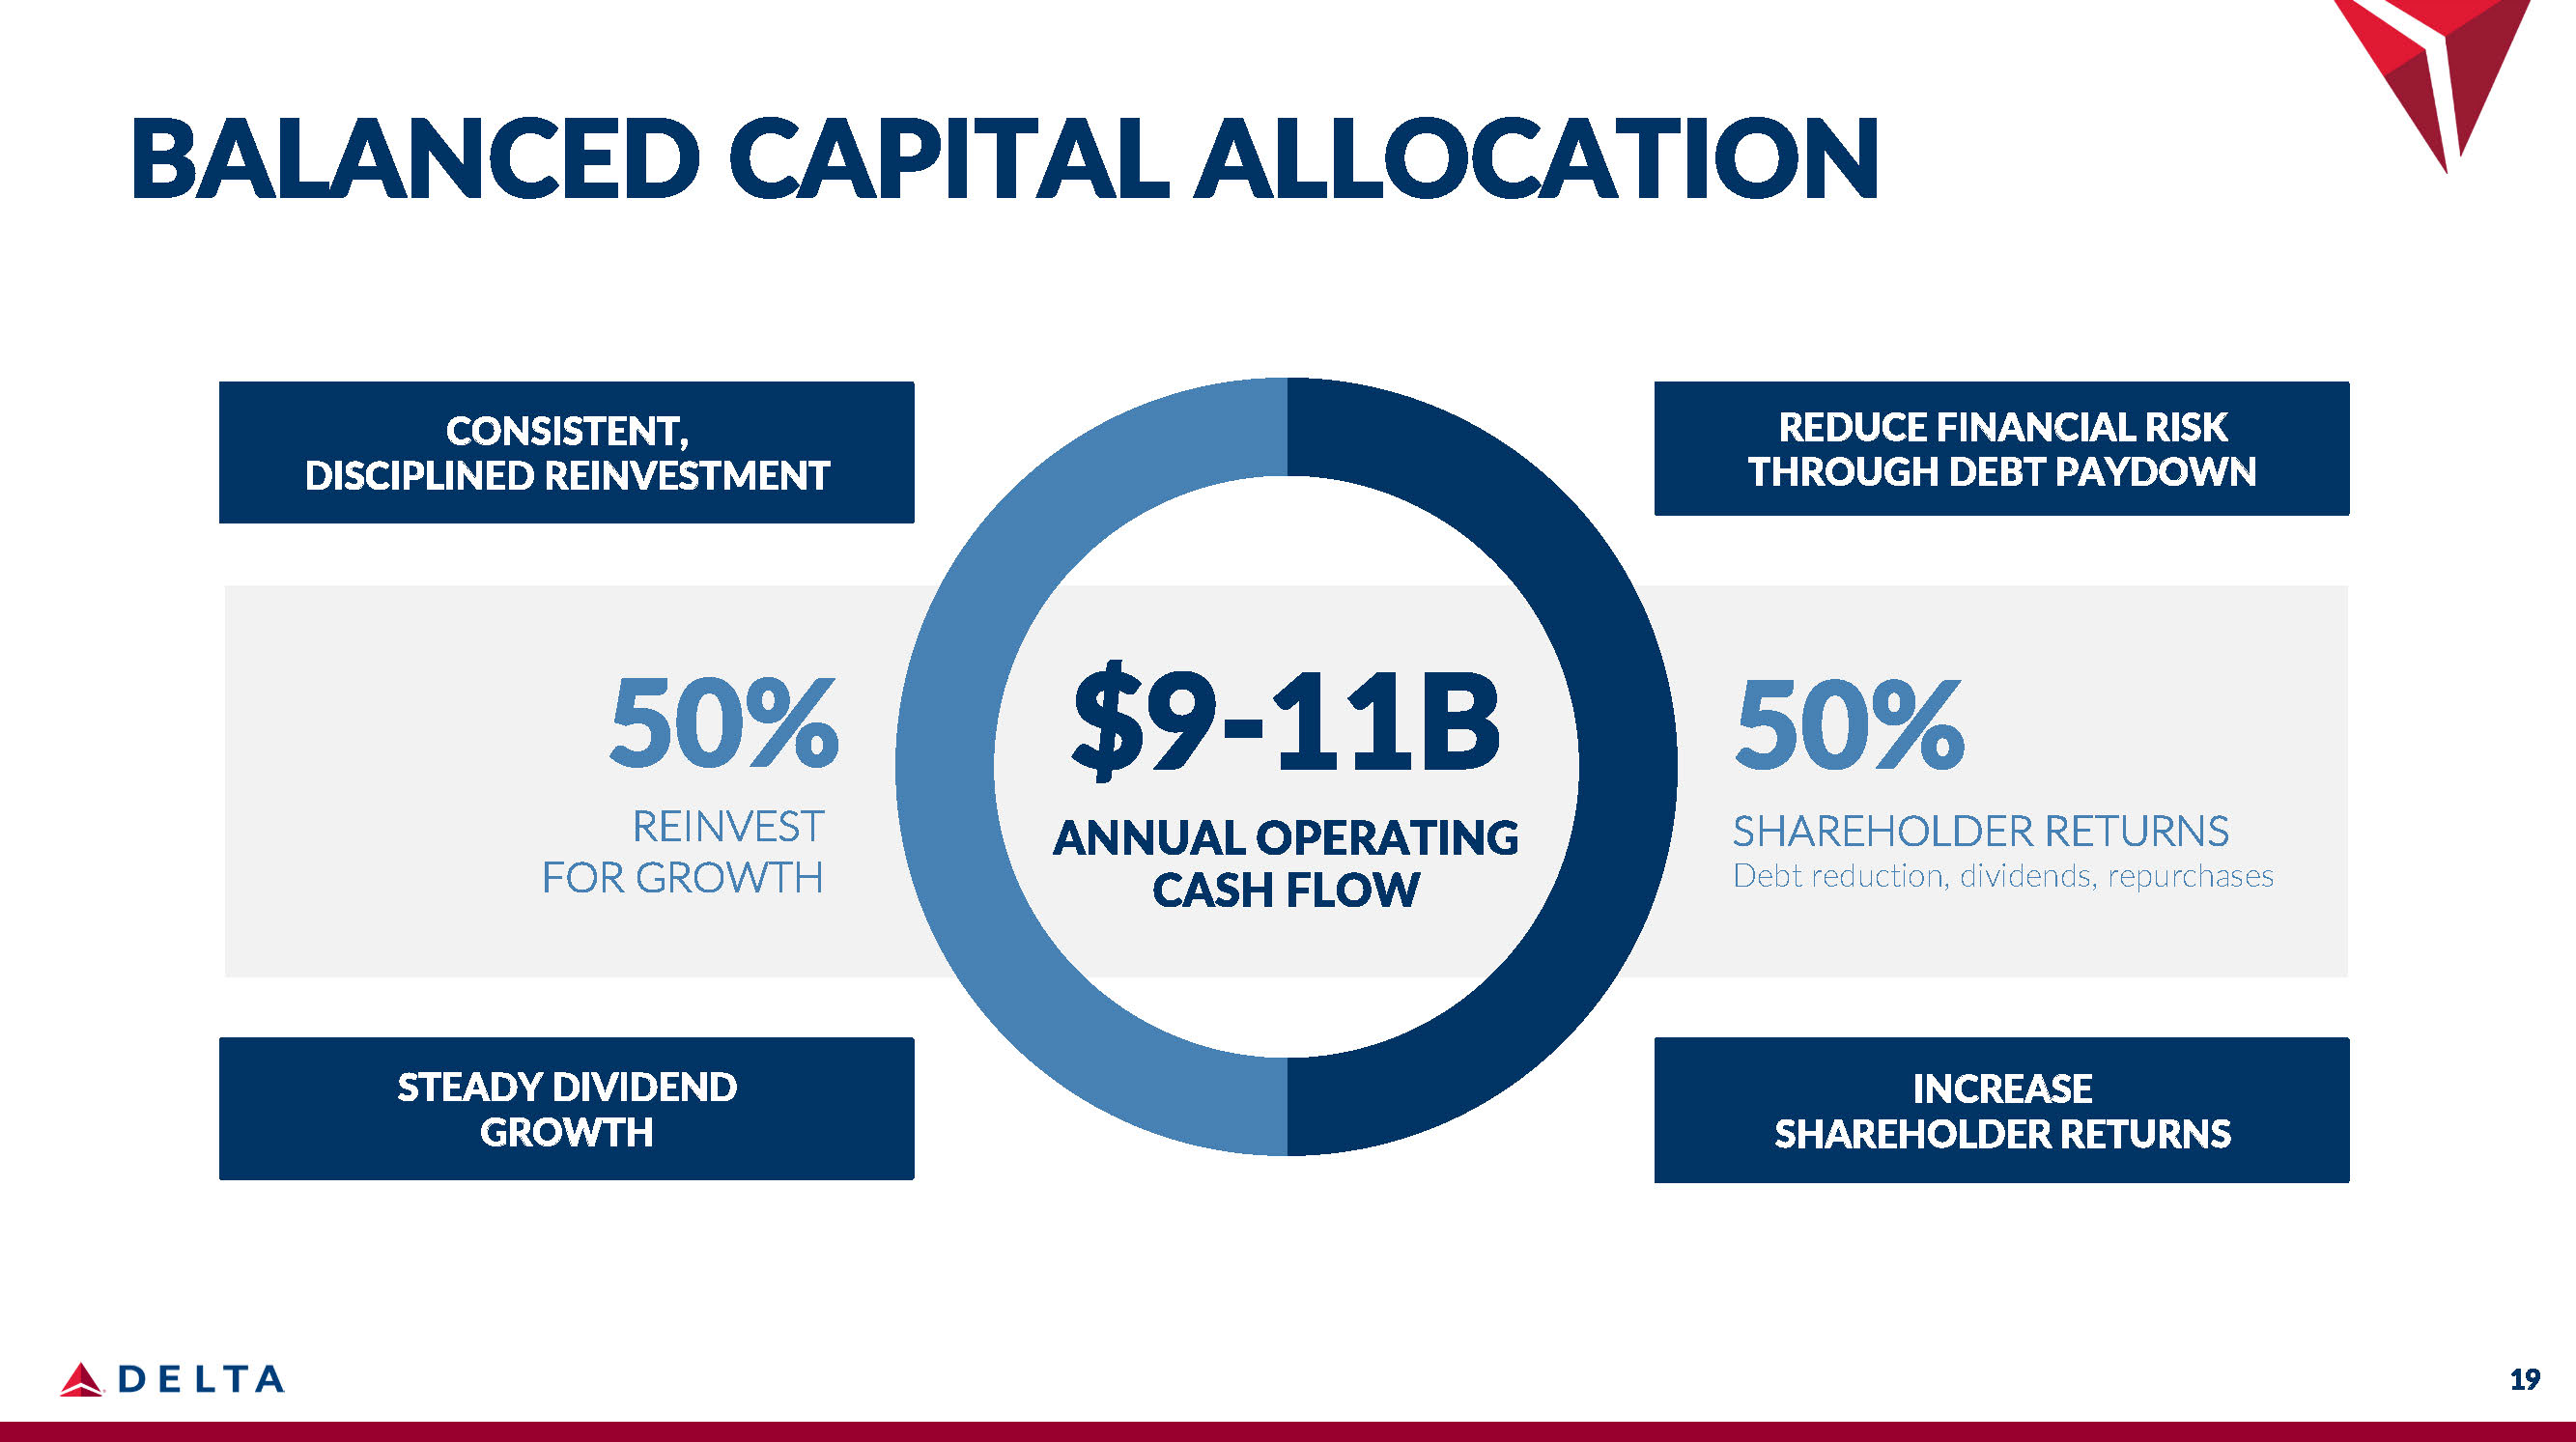
BALANCED CAPITAL ALLOCATION $9 - 11B ANNUAL OPERATING CASH FLOW 50% SHAREHOLDER RETURNS Debt reduction, dividends, repurchases 50% REINVEST FOR GROWTH CONSISTENT, DISCIPLINED REINVESTMENT REDUCE FINANCIAL RISK THROUGH DEBT PAYDOWN STEADY DIVIDEND GROWTH 19 INCREASE SHAREHOLDER RETURNS

DELTA IS DIFFERENTIATED & DURABLE Positioned To Win Delivering Durability Creating Value 20
GLEN HAUENSTEIN President
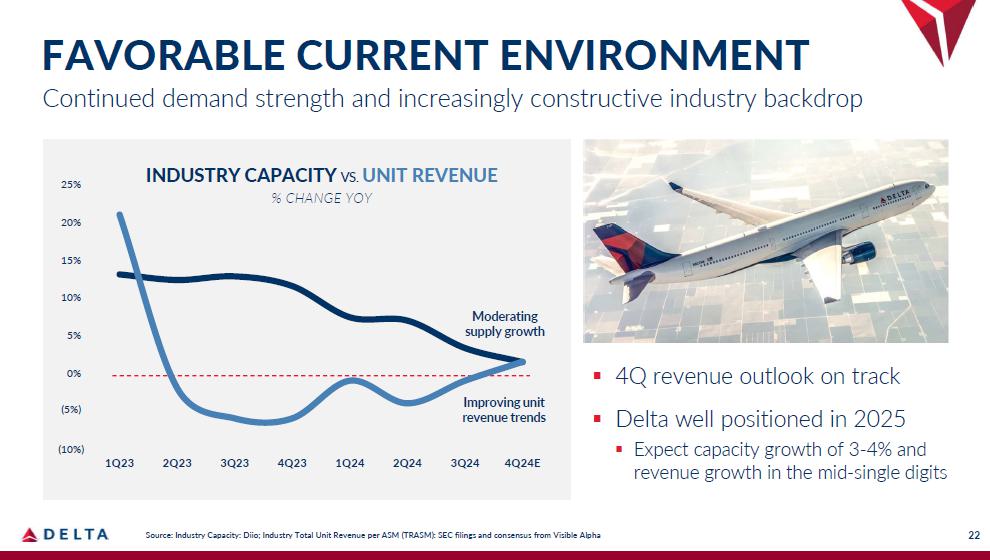
▪ 4Q revenue outlook on track ▪ Delta well positioned in 2025 ▪ Expect capacity growth of 3 - 4% and revenue growth in the mid - single digits - 10% - 5% 0% 5% 20% 15% 10% 25% 1Q23 2Q23 3Q23 4Q23 1Q24 2Q24 3Q24 4Q24E INDUSTRY CAPACITY VS. UNIT REVENUE % CHANGE YOY Moderating supply growth Improving unit revenue trends FAVORABLE CURRENT ENVIRONMENT Continued demand strength and increasingly constructive industry backdrop (5%) (10%) 22 Source: Industry Capacity: Diio; Industry Total Unit Revenue per ASM (TRASM): SEC filings and consensus from Visible Alpha
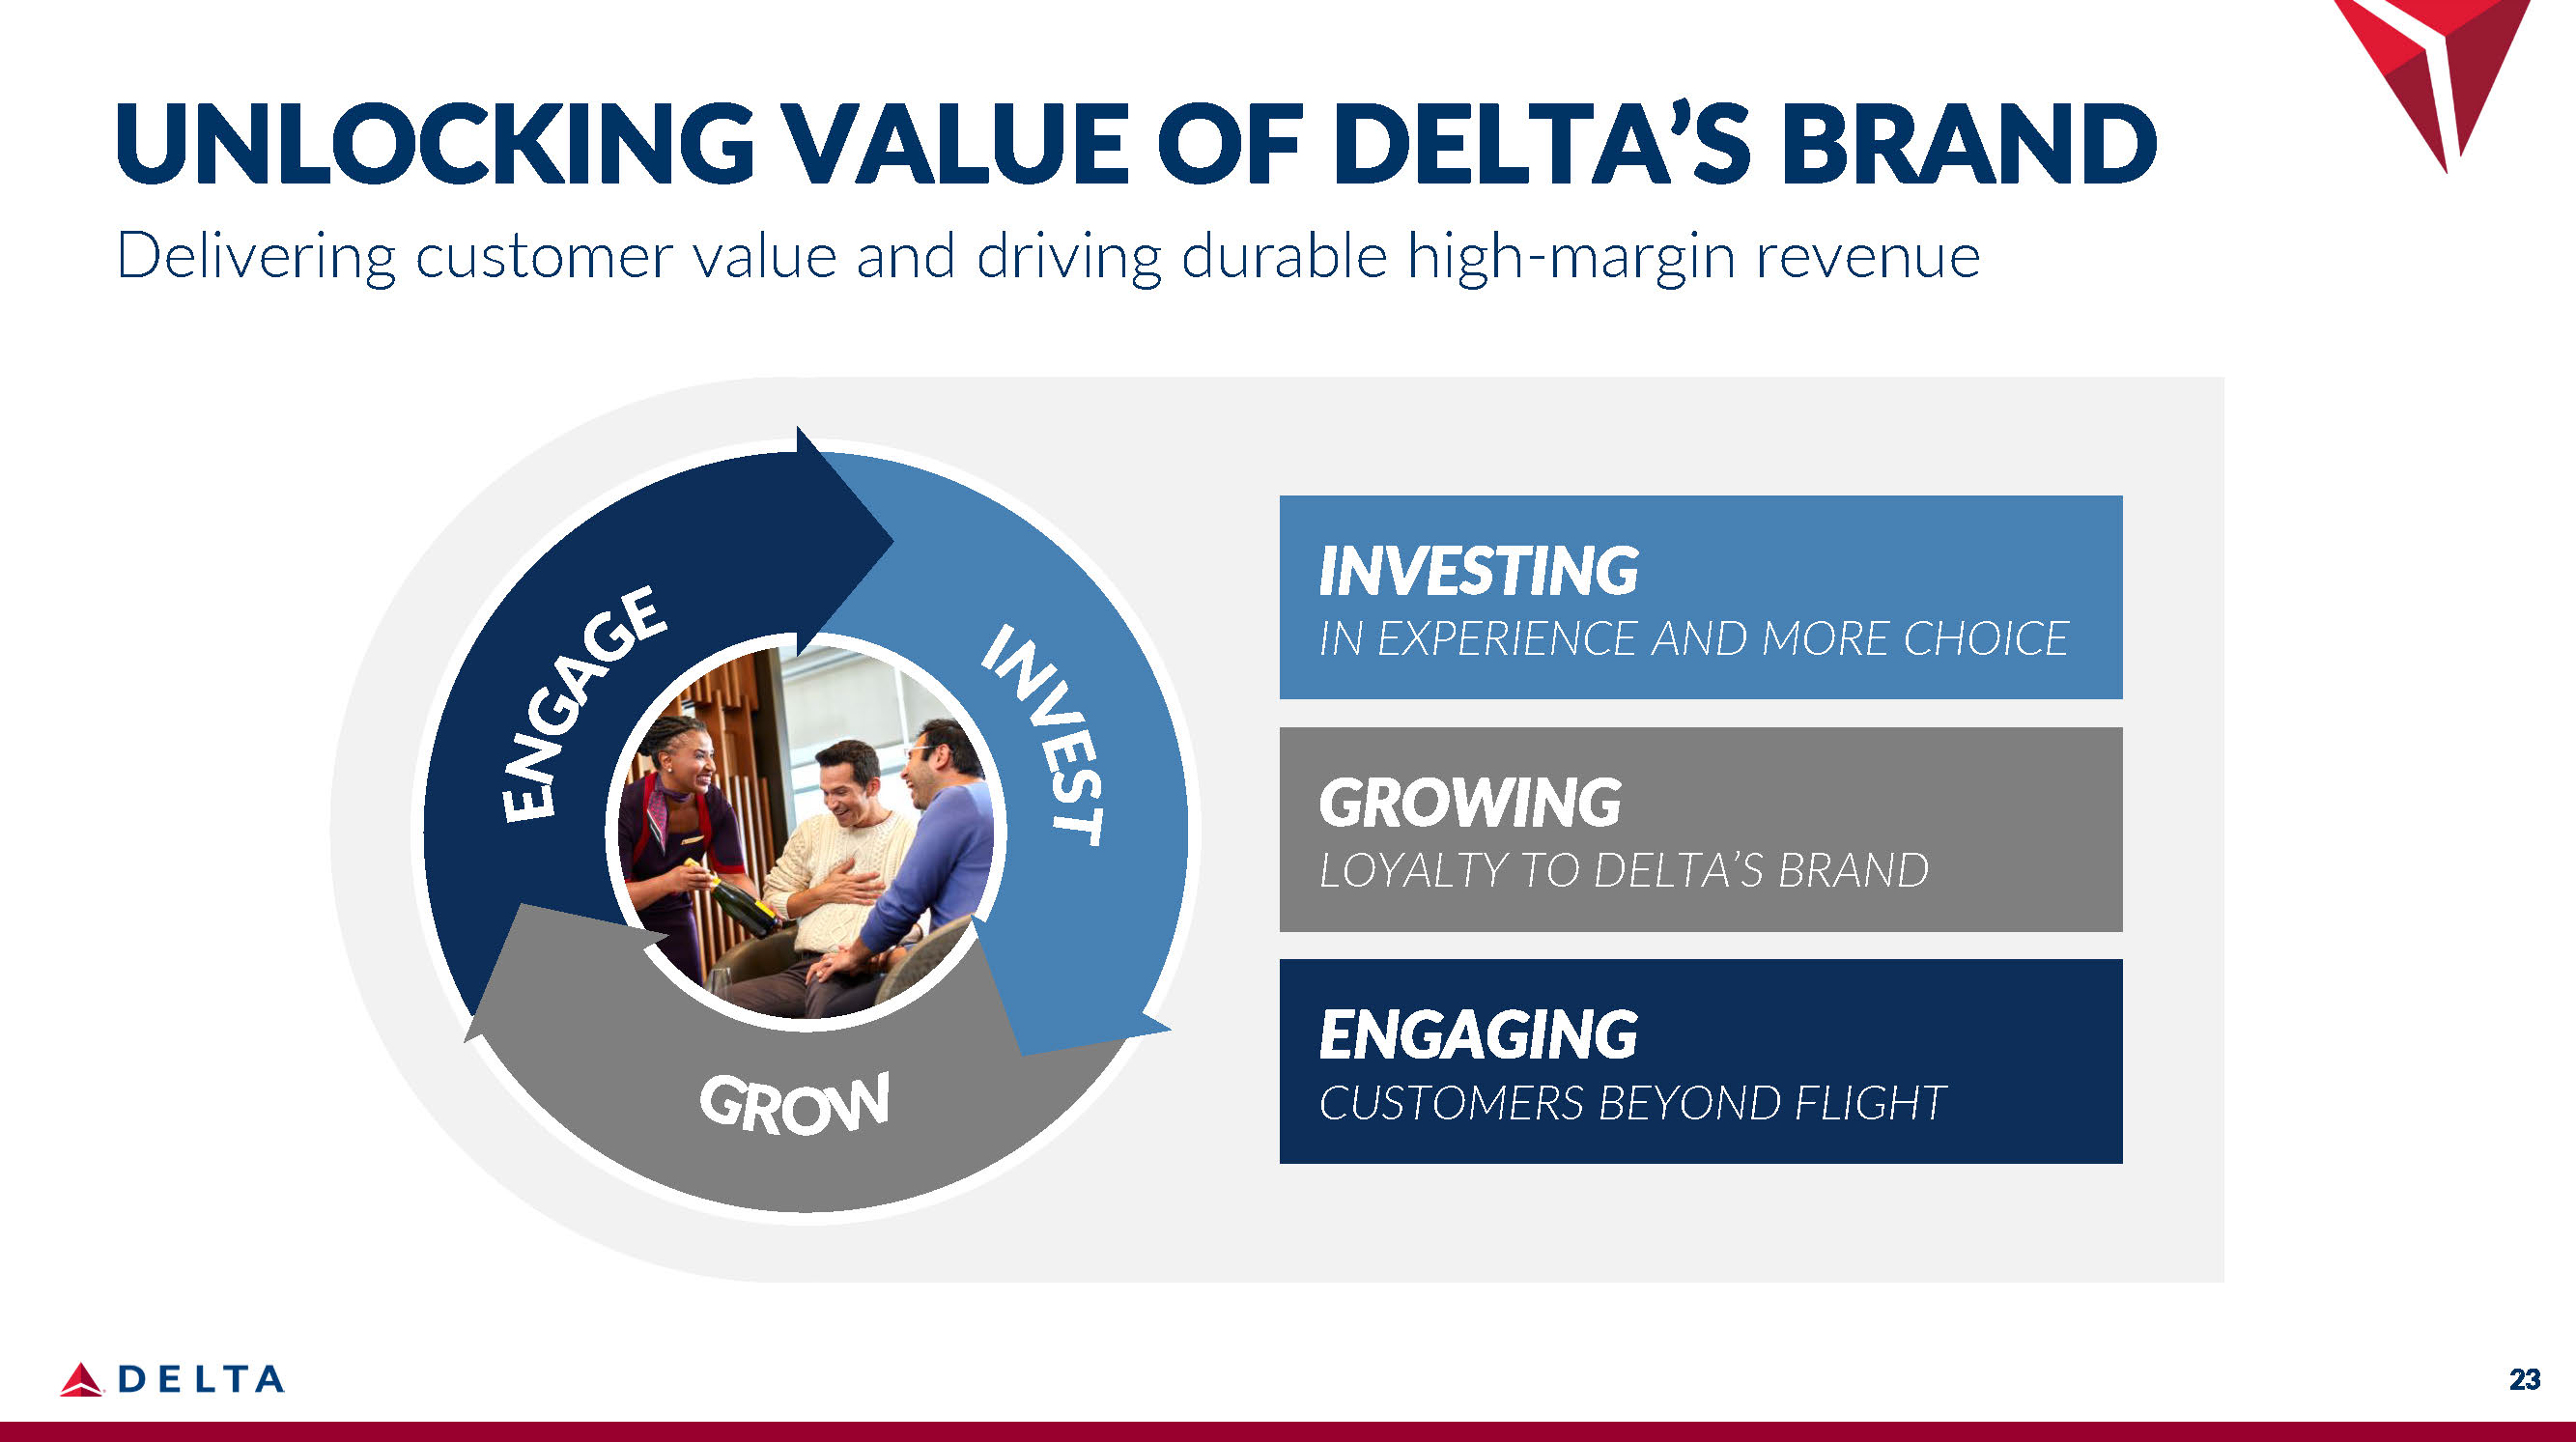
ENGAGING CUSTOMERS BEYOND FLIGHT INVESTING IN EXPERIENCE AND MORE CHOICE GROWING LOYALTY TO DELTA’S BRAND UNLOCKING VALUE OF DELTA’S BRAND Delivering customer value and driving durable high - margin revenue 23
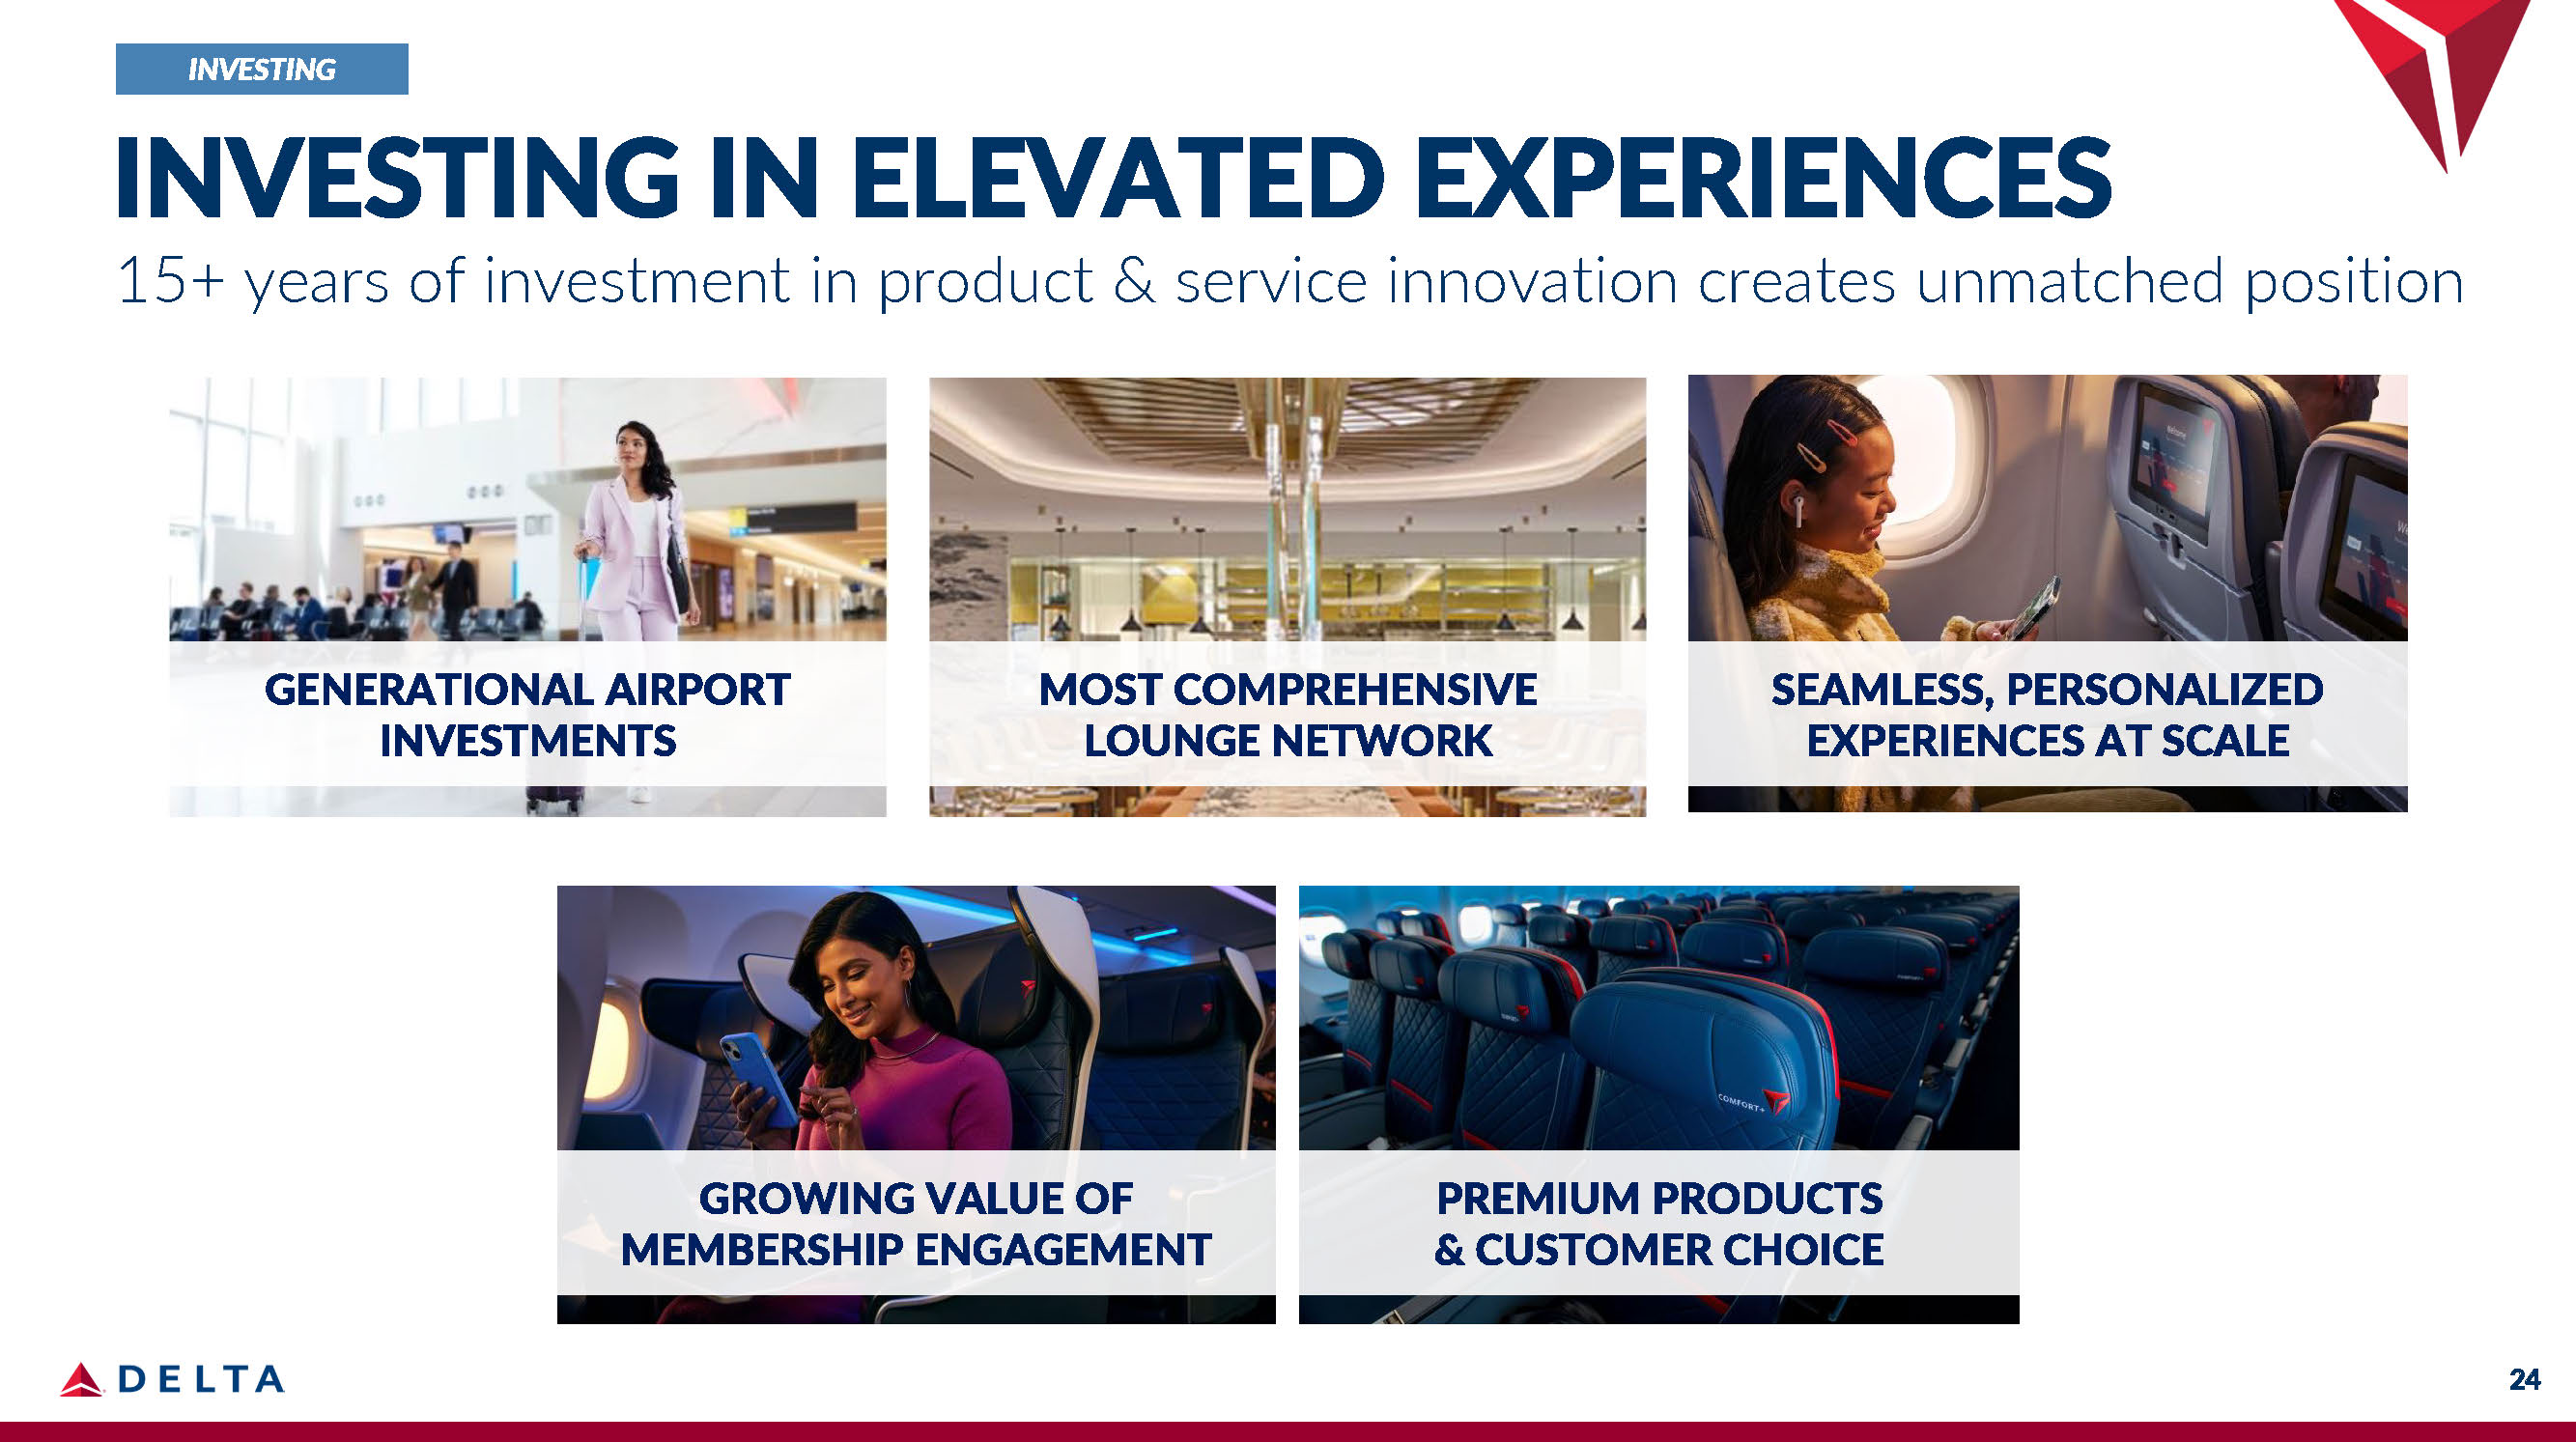
GENERATIONAL AIRPORT INVESTMENTS MOST COMPREHENSIVE LOUNGE NETWORK SEAMLESS, PERSONALIZED EXPERIENCES AT SCALE PREMIUM PRODUCTS & CUSTOMER CHOICE GROWING VALUE OF MEMBERSHIP ENGAGEMENT 24 INVESTING INVESTING IN ELEVATED EXPERIENCES 15+ years of investment in product & service innovation creates unmatched position

2010 and Before Premium seat mix ~10% ▪ Low paid load factor ▪ Used for upgrades 2011 - 2014 Premium seat mix ~20% ▪ Introduced branded fares ▪ Added upsell capabilities ▪ SkyMiles program shifted from miles to dollars spent 2015 - 2019 Premium seat mix >25% ▪ Expanded branded fares ▪ Added post - purchase ▪ Delta One and Delta Premium Select (DPS) ▪ Miles as currency 2022 - 2024 Premium seat mix ~30% ▪ Premium on 100% of flights ▪ DPS global expansion ▪ Delta Sync Wi - Fi ▪ Delta One Lounges and airport experience 85% Repurchase Rate by Frequent Flyers Premium Demand Growing Margins 15pts+ vs. Main Cabin 25 INVESTING DELTA’S PREMIUM PRODUCT JOURNEY
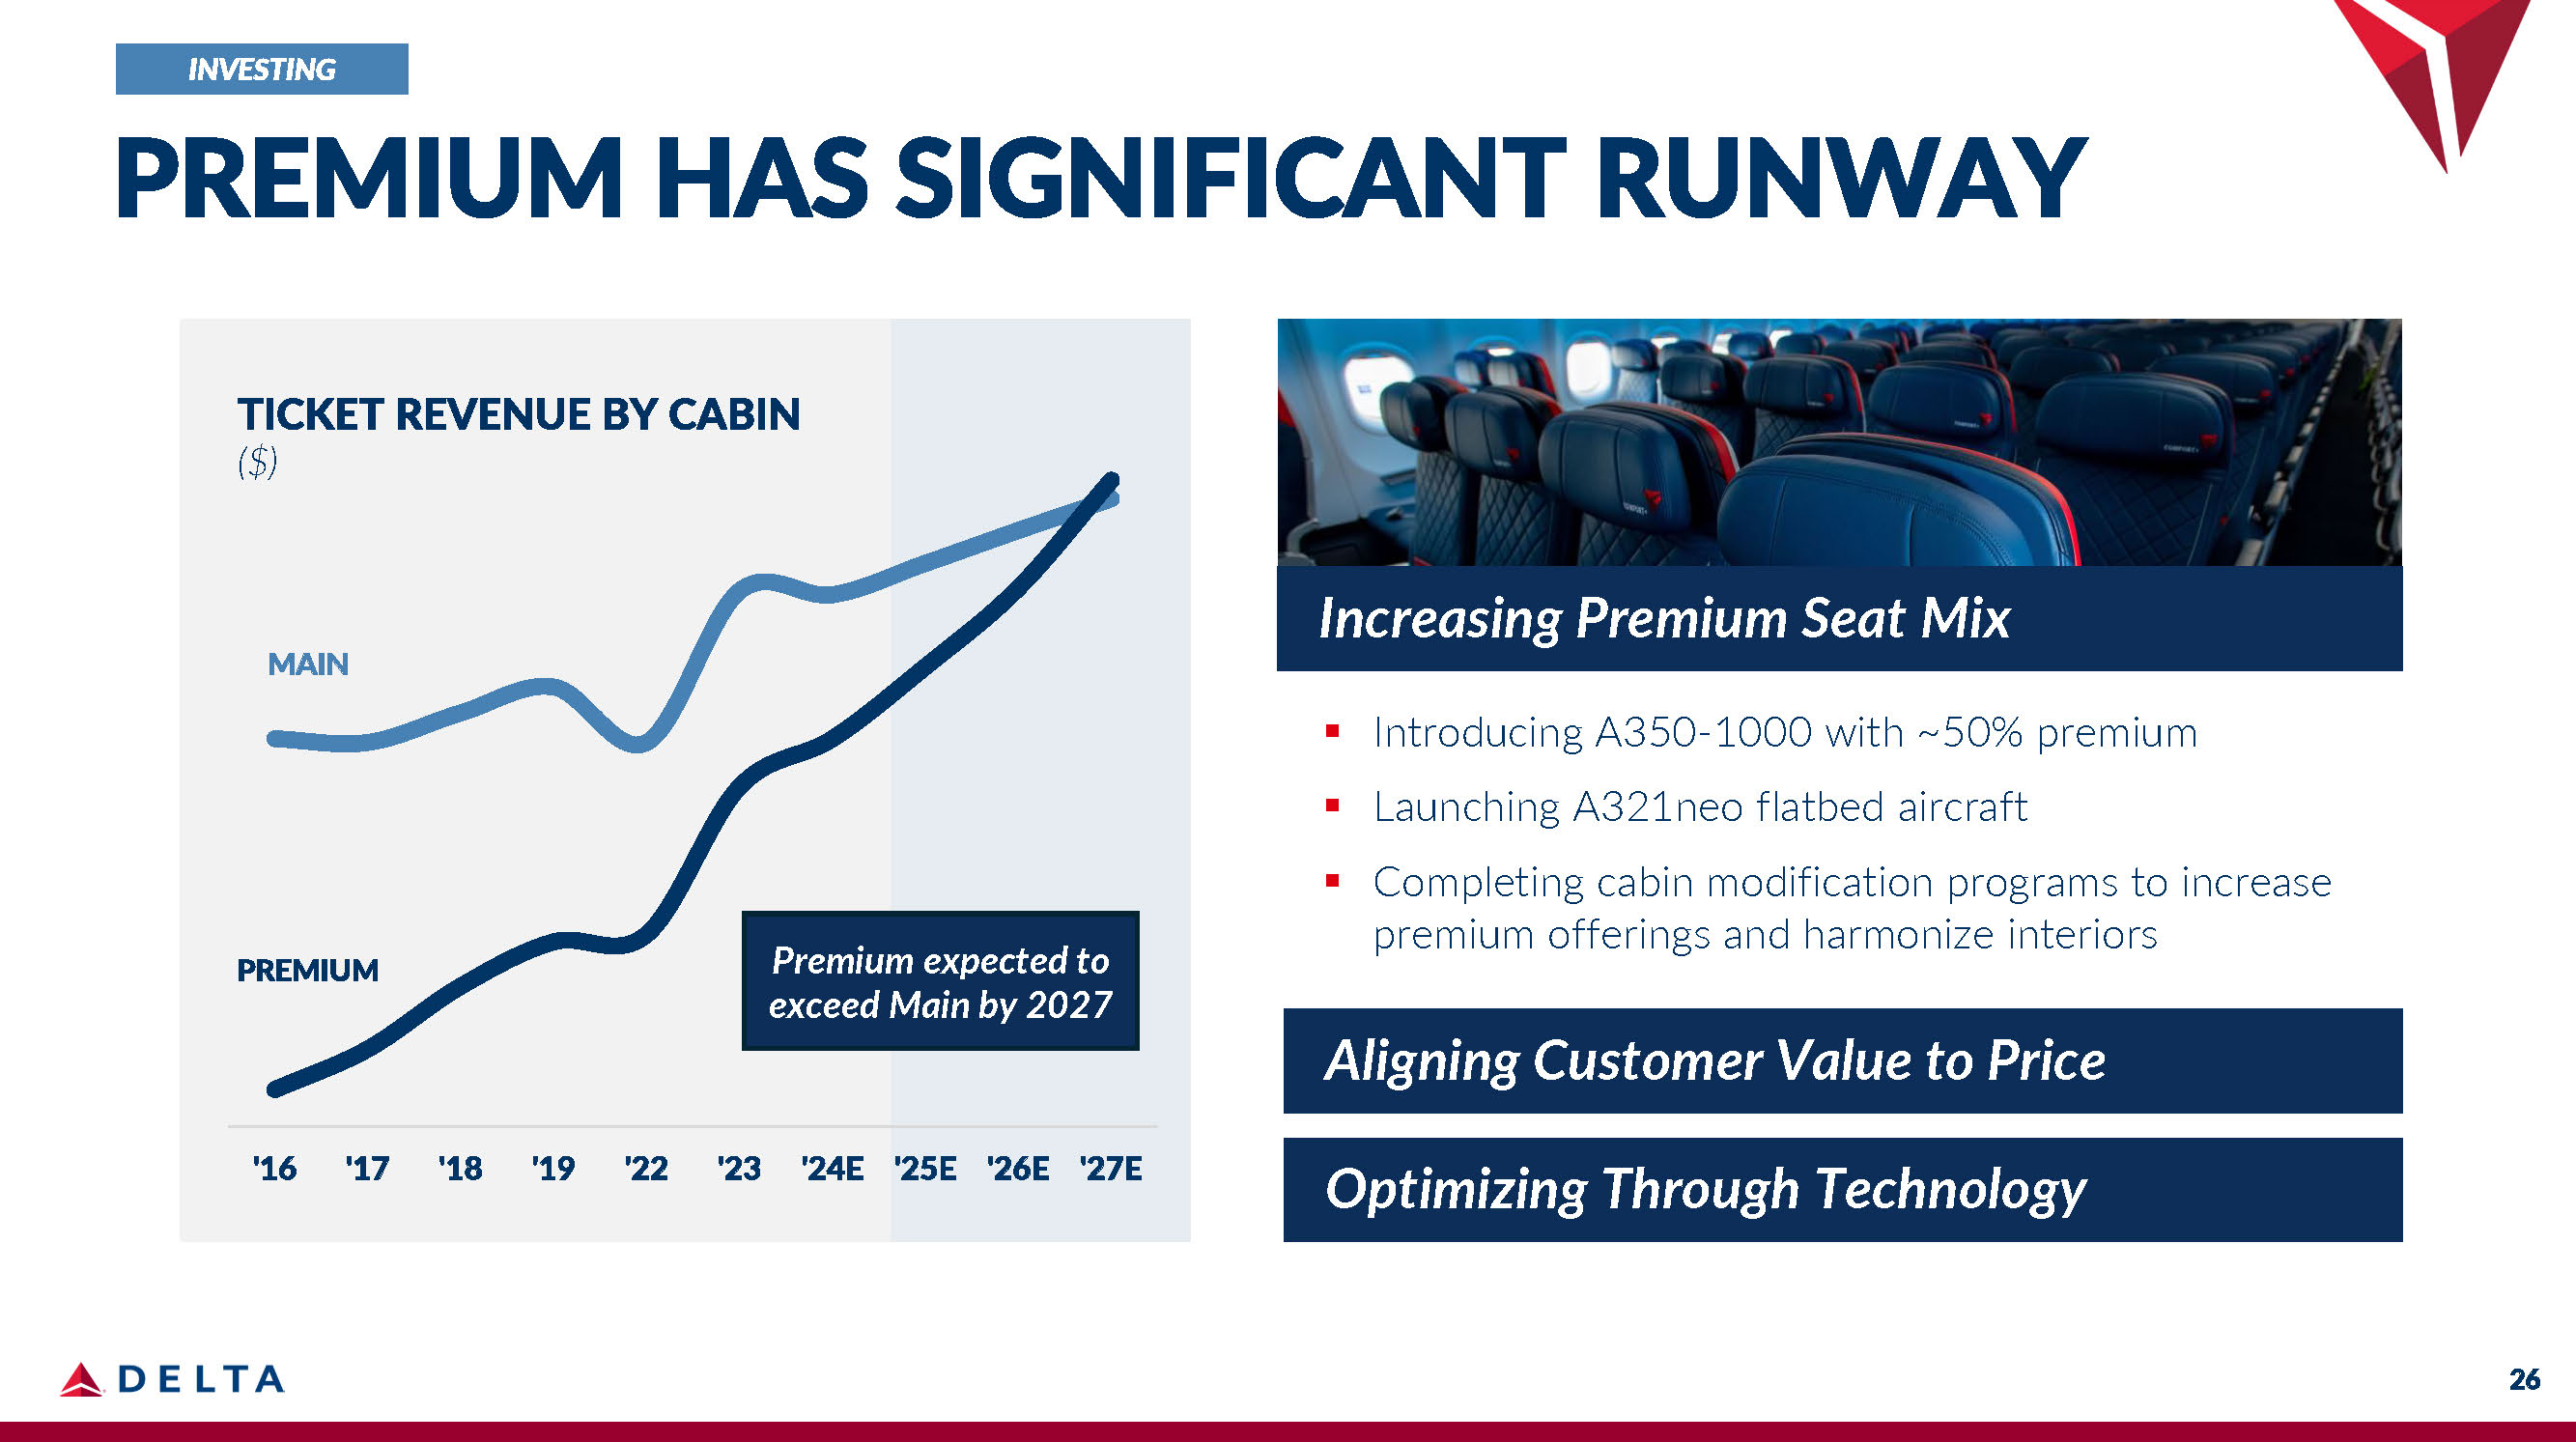
TICKET REVENUE BY CABIN ($) MAIN PREMIUM '16 '17 '18 '19 '22 '23 '24E '25E '26E '27E 26 Premium expected to exceed Main by 2027 ▪ Introducing A350 - 1000 with ~50% premium ▪ Launching A321neo flatbed aircraft ▪ Completing cabin modification programs to increase premium offerings and harmonize interiors Optimizing Through Technology Aligning Customer Value to Price Increasing Premium Seat Mix INVESTING PREMIUM HAS SIGNIFICANT RUNWAY
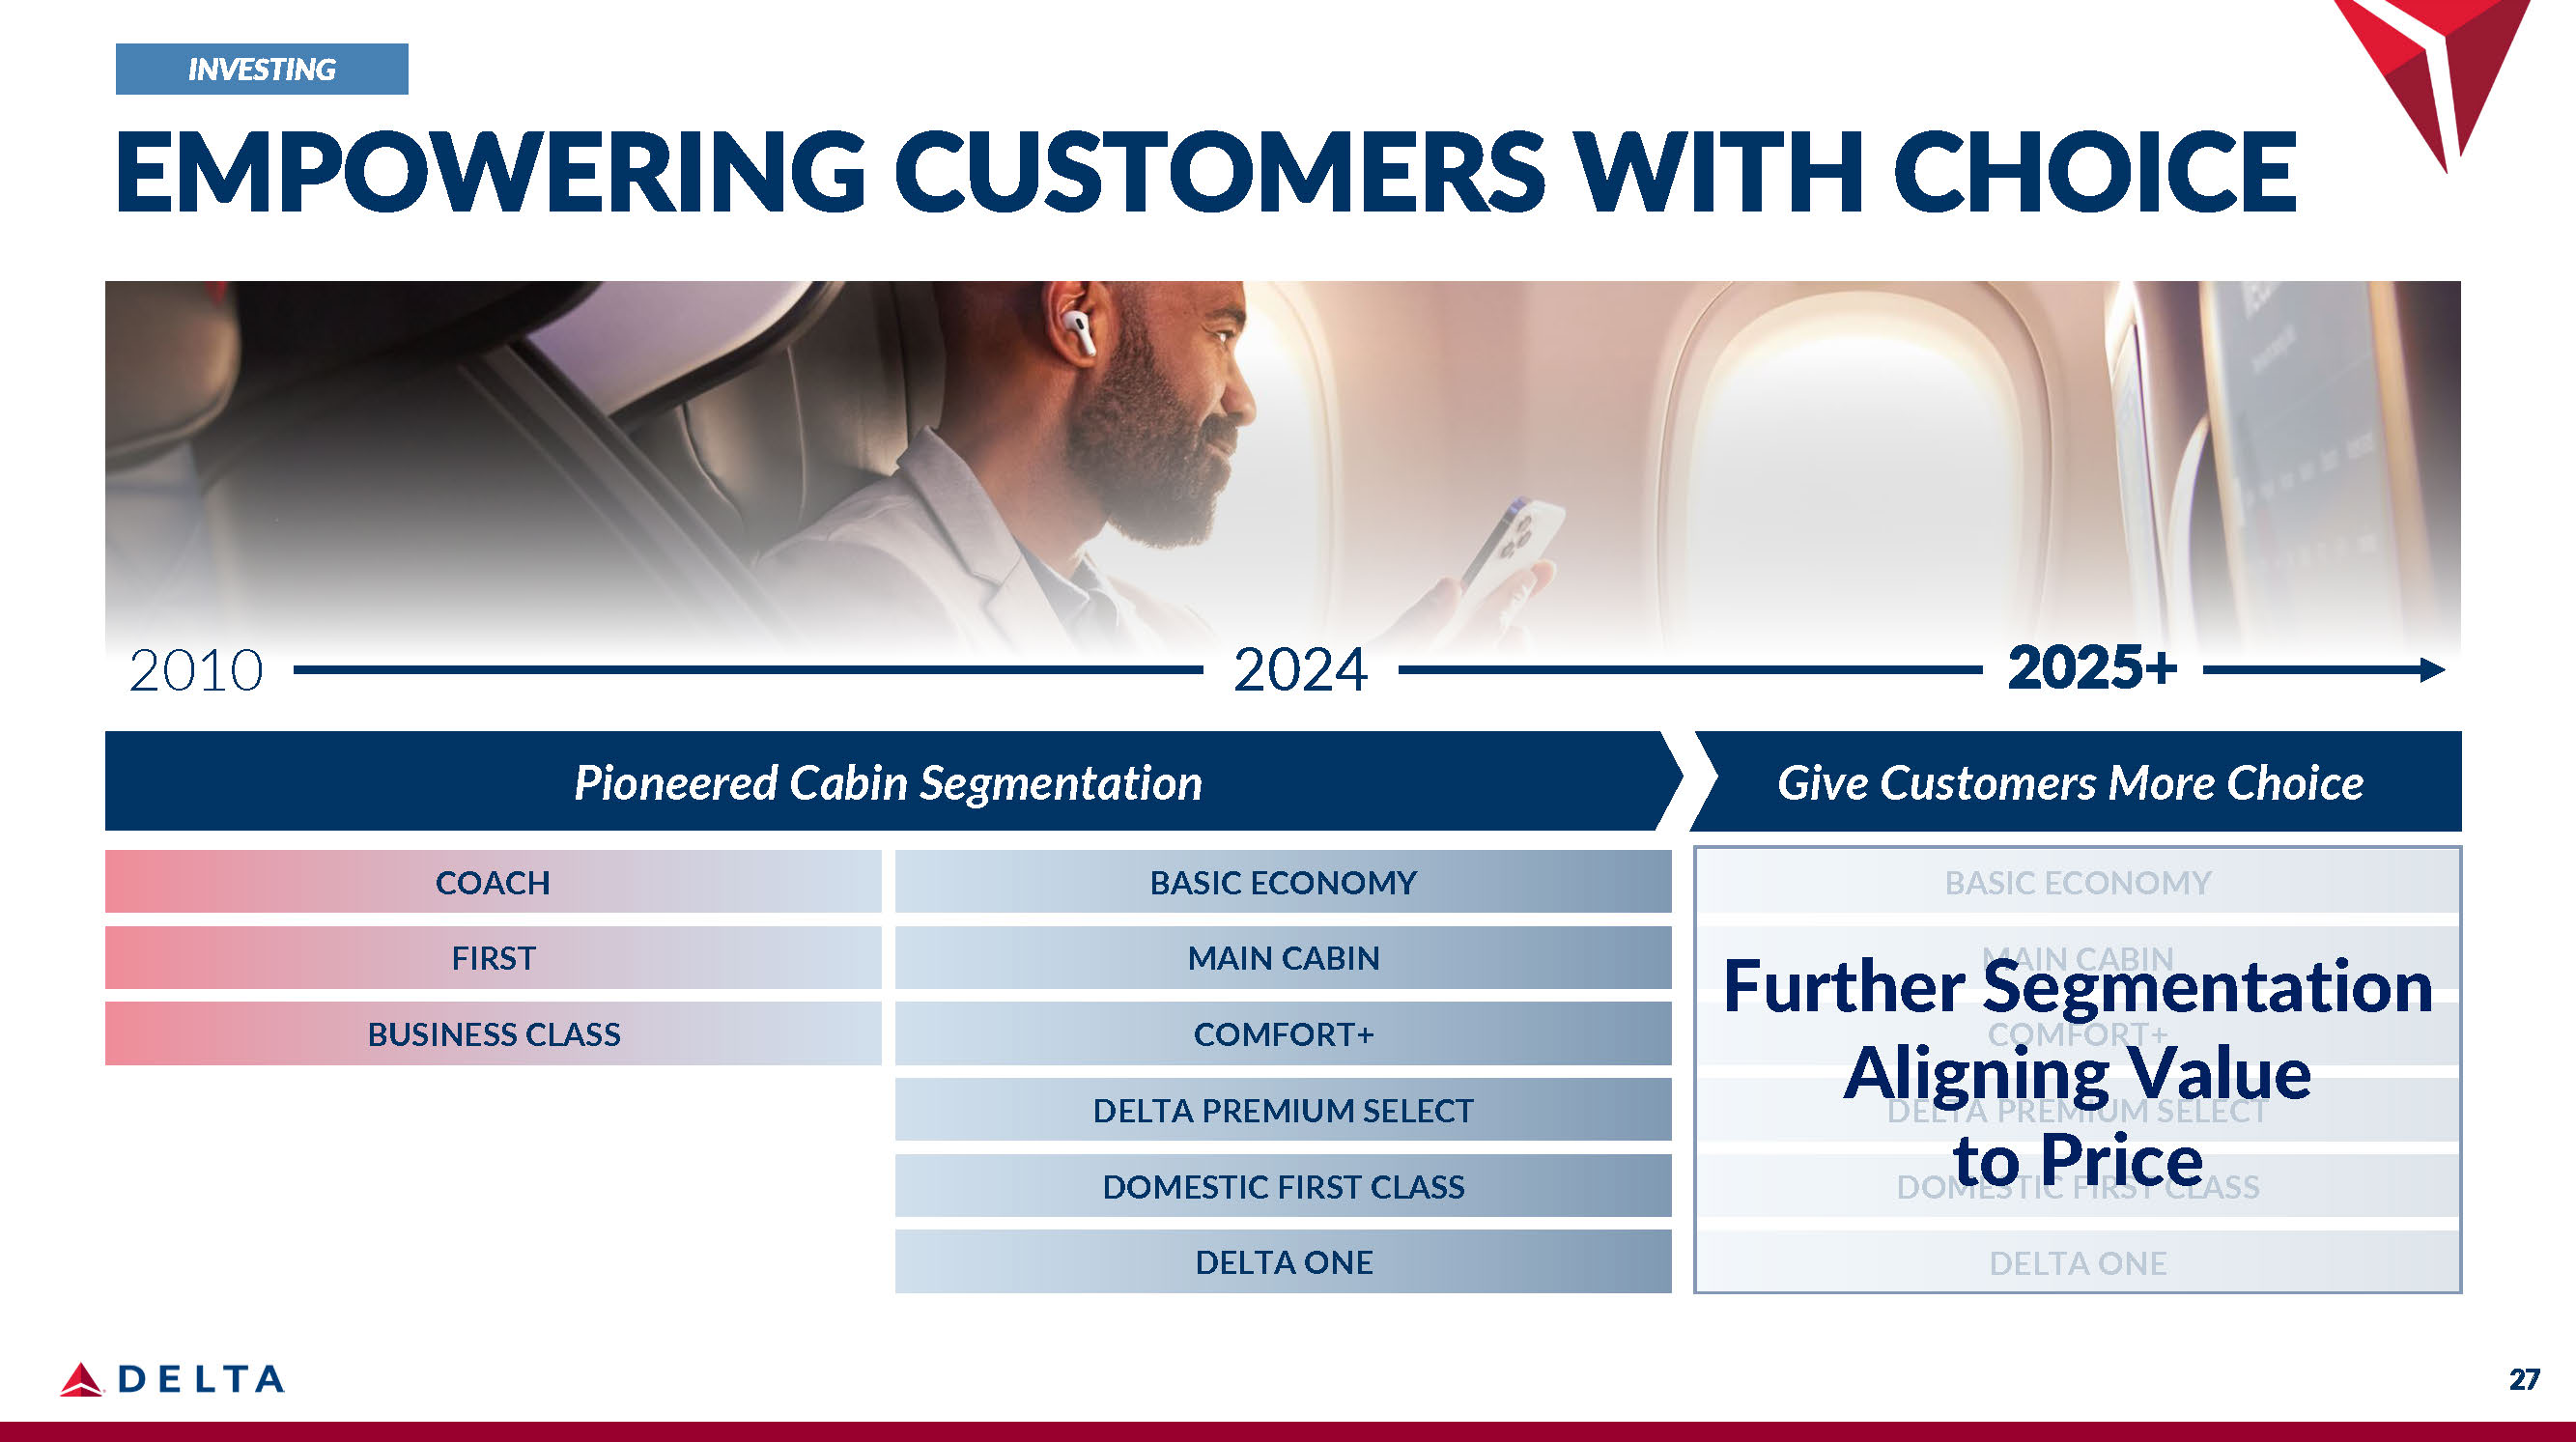
BASIC ECONOMY MAIN CABIN COMFORT+ DELTA PREMIUM SELECT DOMESTIC FIRST CLASS DELTA ONE Pioneered Cabin Segmentation Give Customers More Choice DELTA PREMIUM SELECT DOMESTIC FIRST CLASS DELTA ONE Further Segmentation Aligning Value to Price BASIC ECONOMY COACH MAIN CABIN FIRST COMFORT+ BUSINESS CLASS 2010 2024 2025+ INVESTING 27 EMPOWERING CUSTOMERS WITH CHOICE
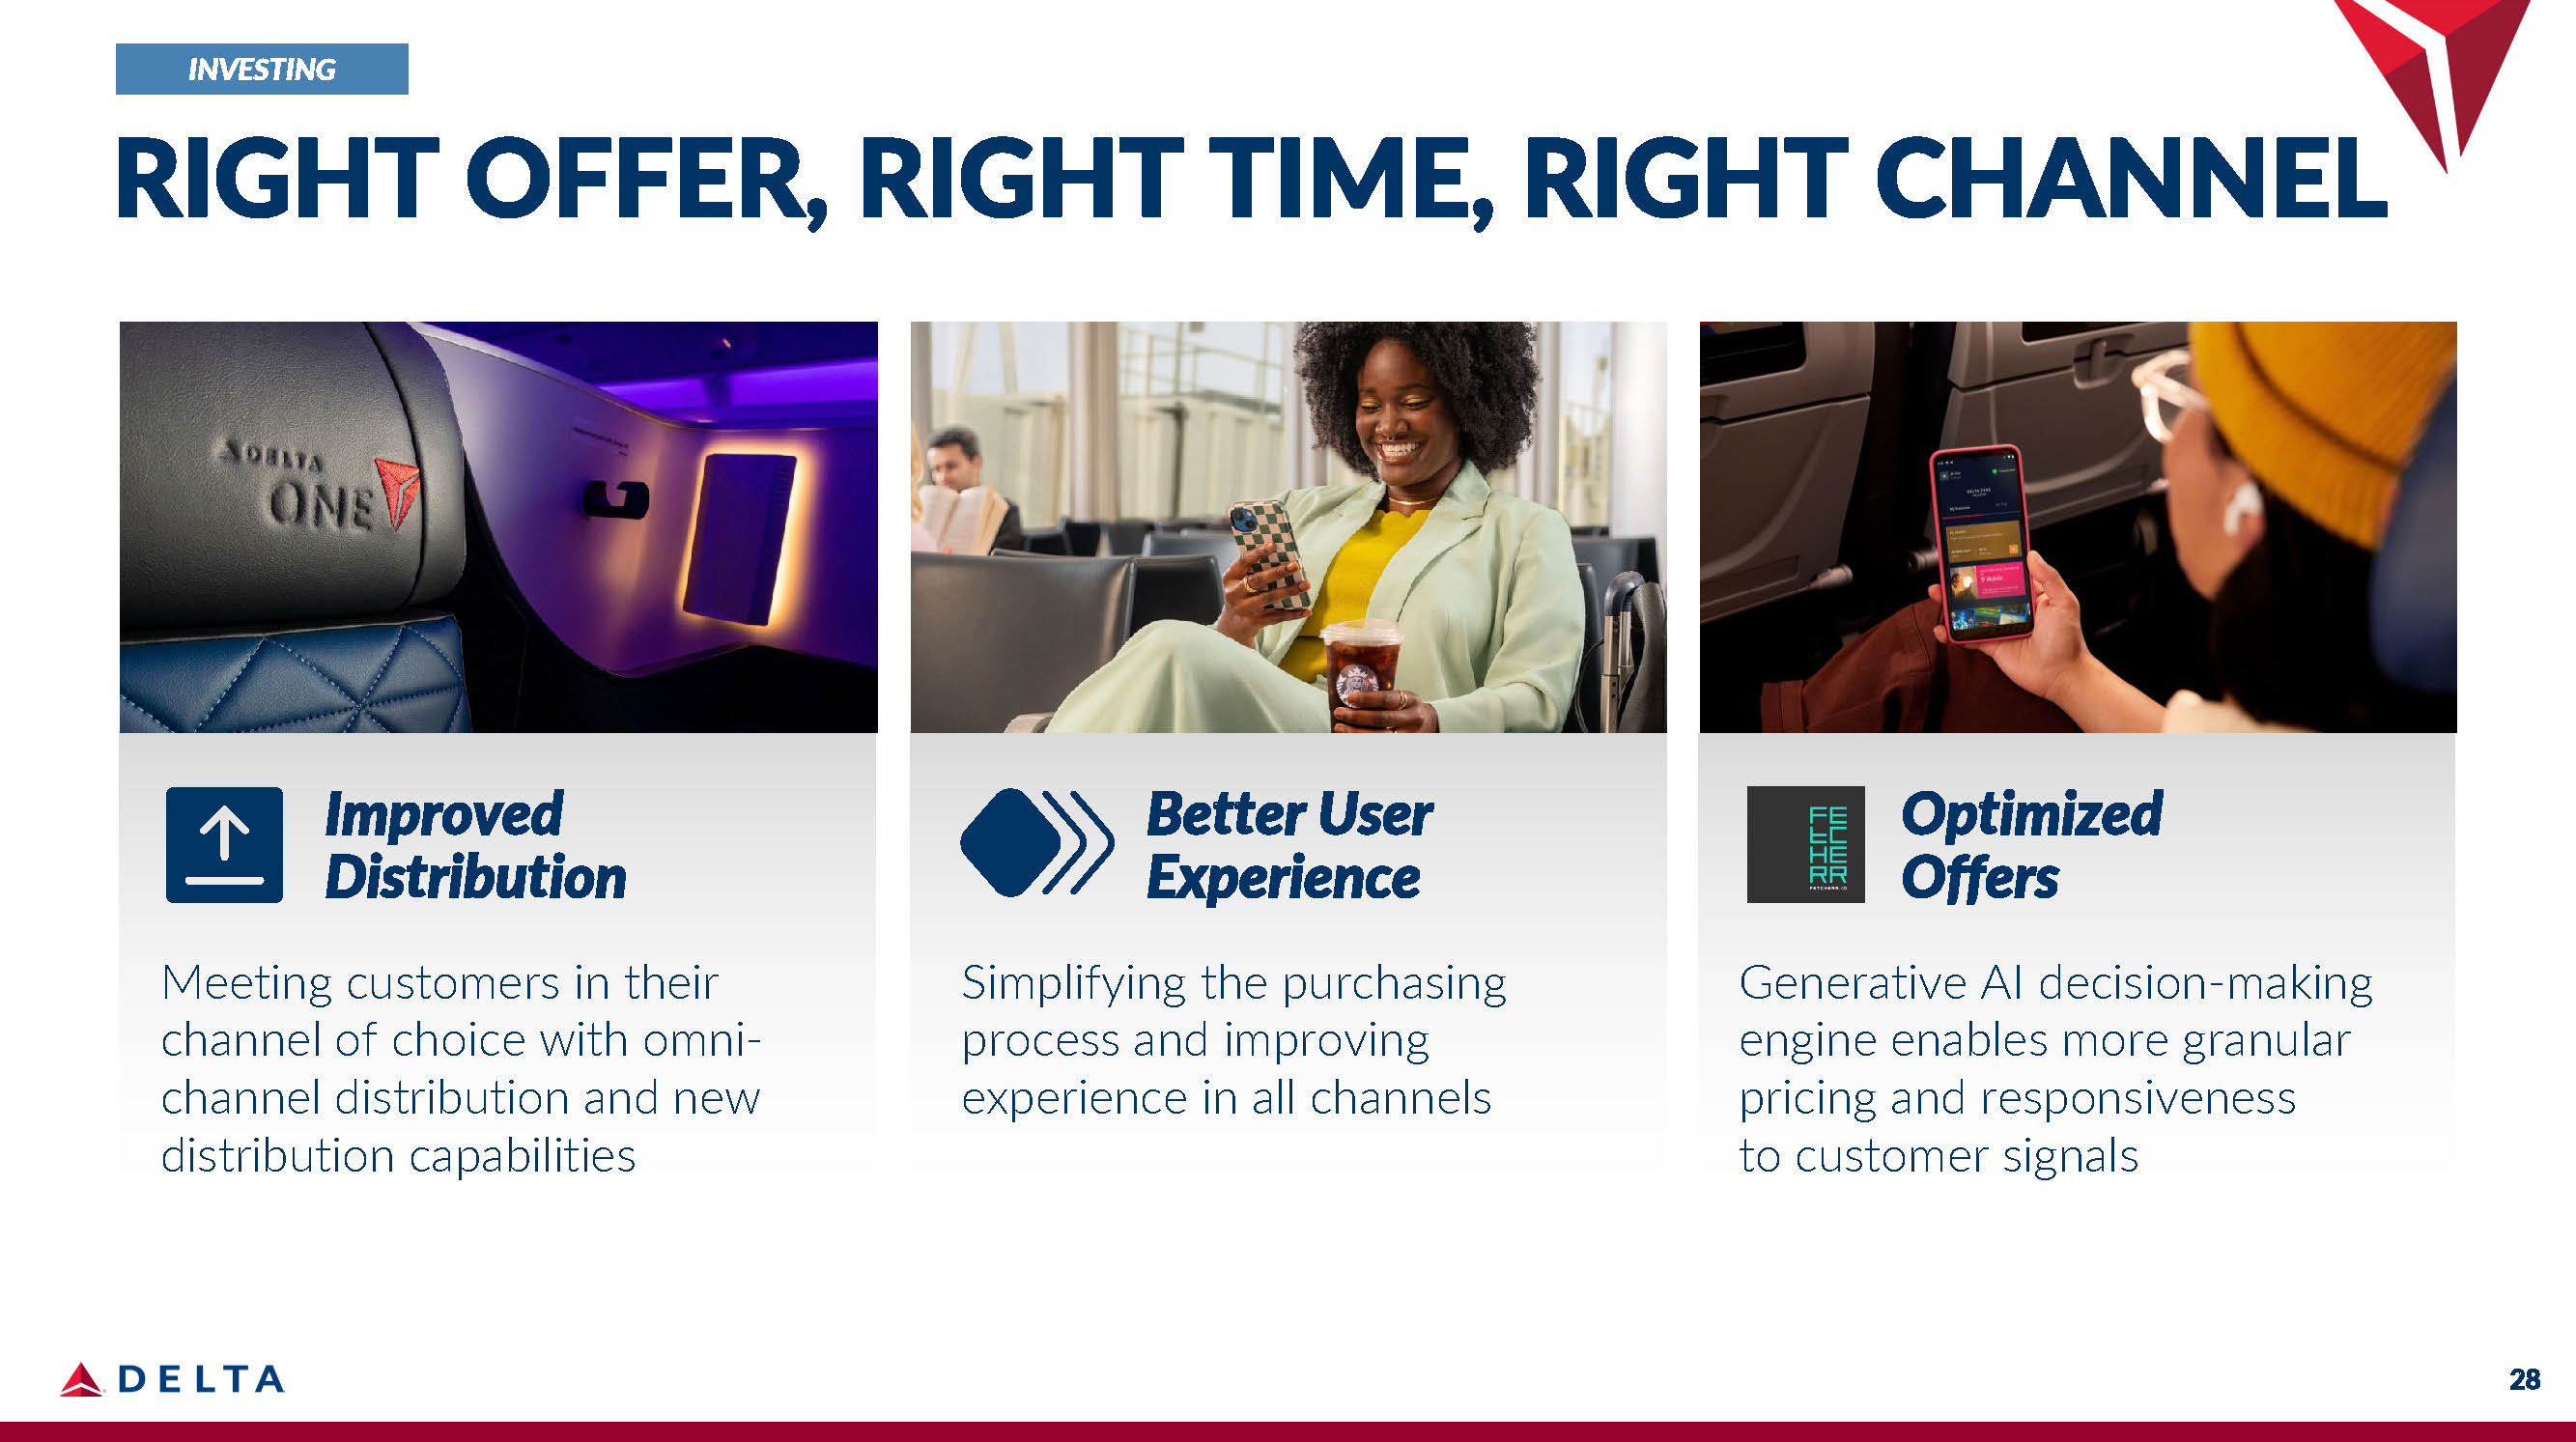
Improved Distribution Meeting customers in their channel of choice with omni - channel distribution and new distribution capabilities Optimized Offers Generative AI decision - making engine enables more granular pricing and responsiveness to customer signals Better User Experience Simplifying the purchasing process and improving experience in all channels INVESTING 28 RIGHT OFFER, RIGHT TIME, RIGHT CHANNEL
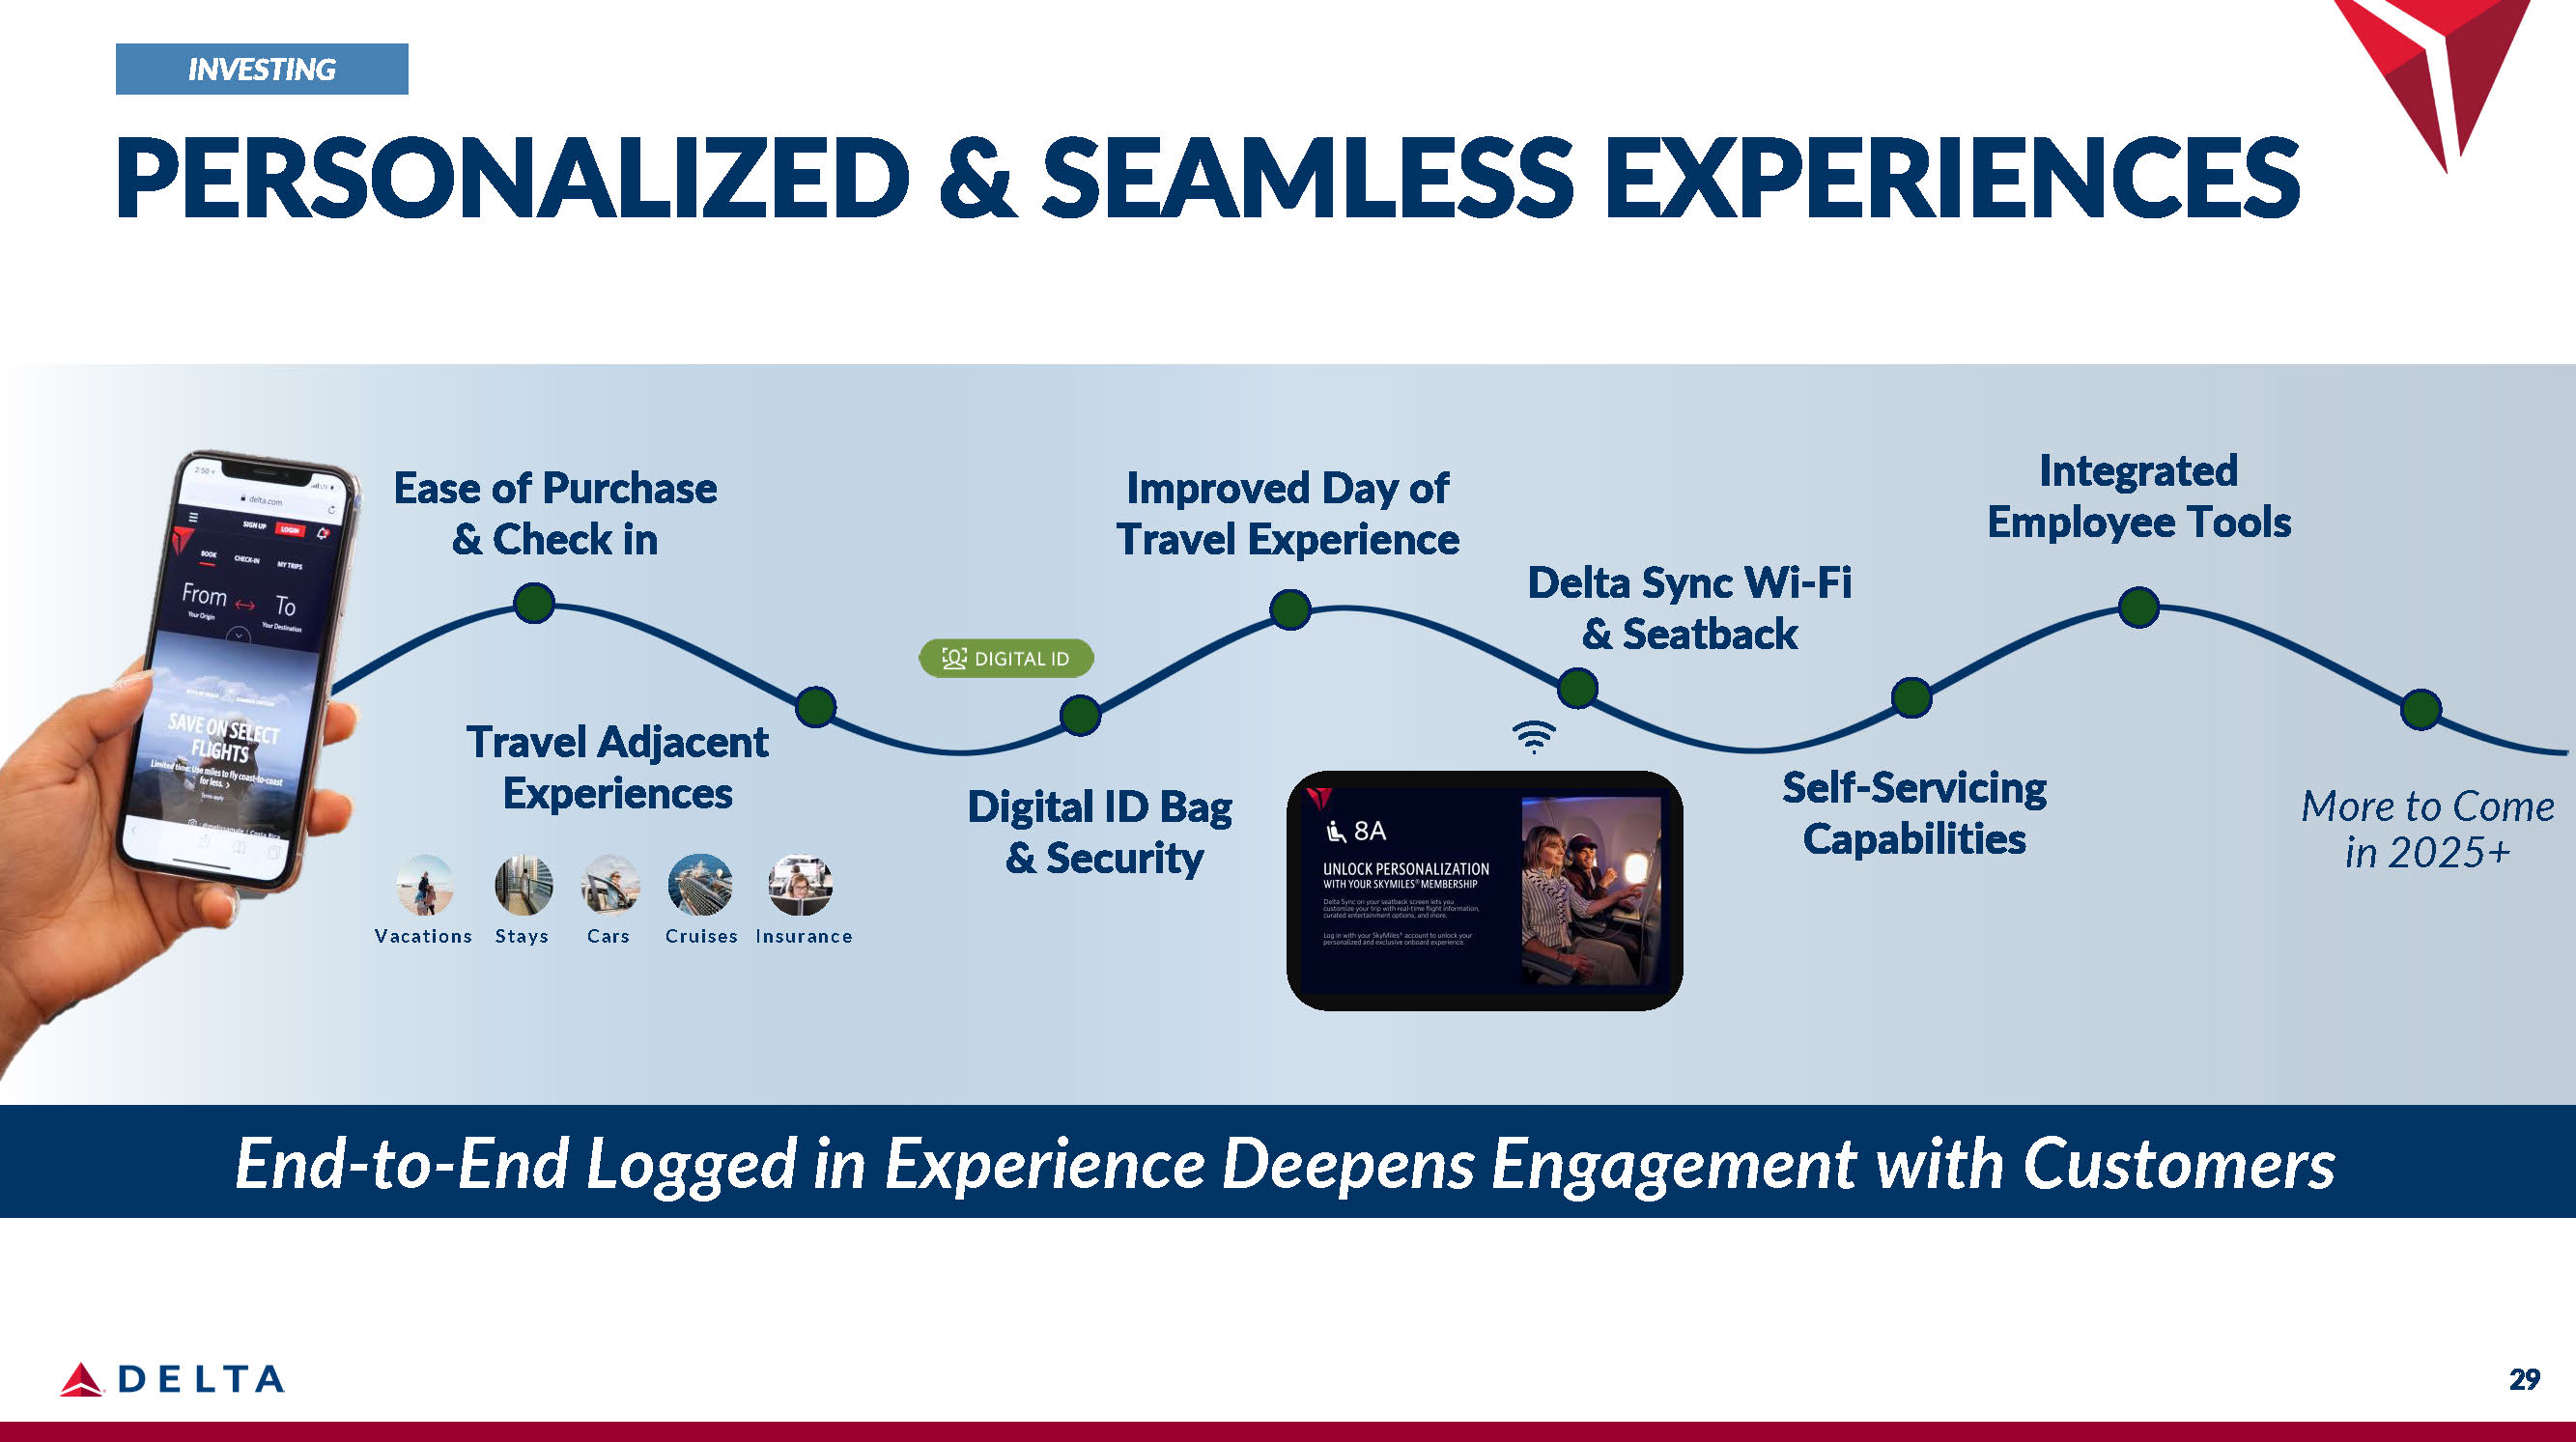
Ease of Purchase & Check in Digital ID Bag & Security Integrated Employee Tools Delta Sync Wi - Fi & Seatback More to Come in 2025+ Self - Servicing Capabilities Travel Adjacent Experiences Improved Day of Travel Experience End - to - End Logged in Experience Deepens Engagement with Customers Vacations Stays Cars Cruises Insurance INVESTING PERSONALIZED & SEAMLESS EXPERIENCES 29
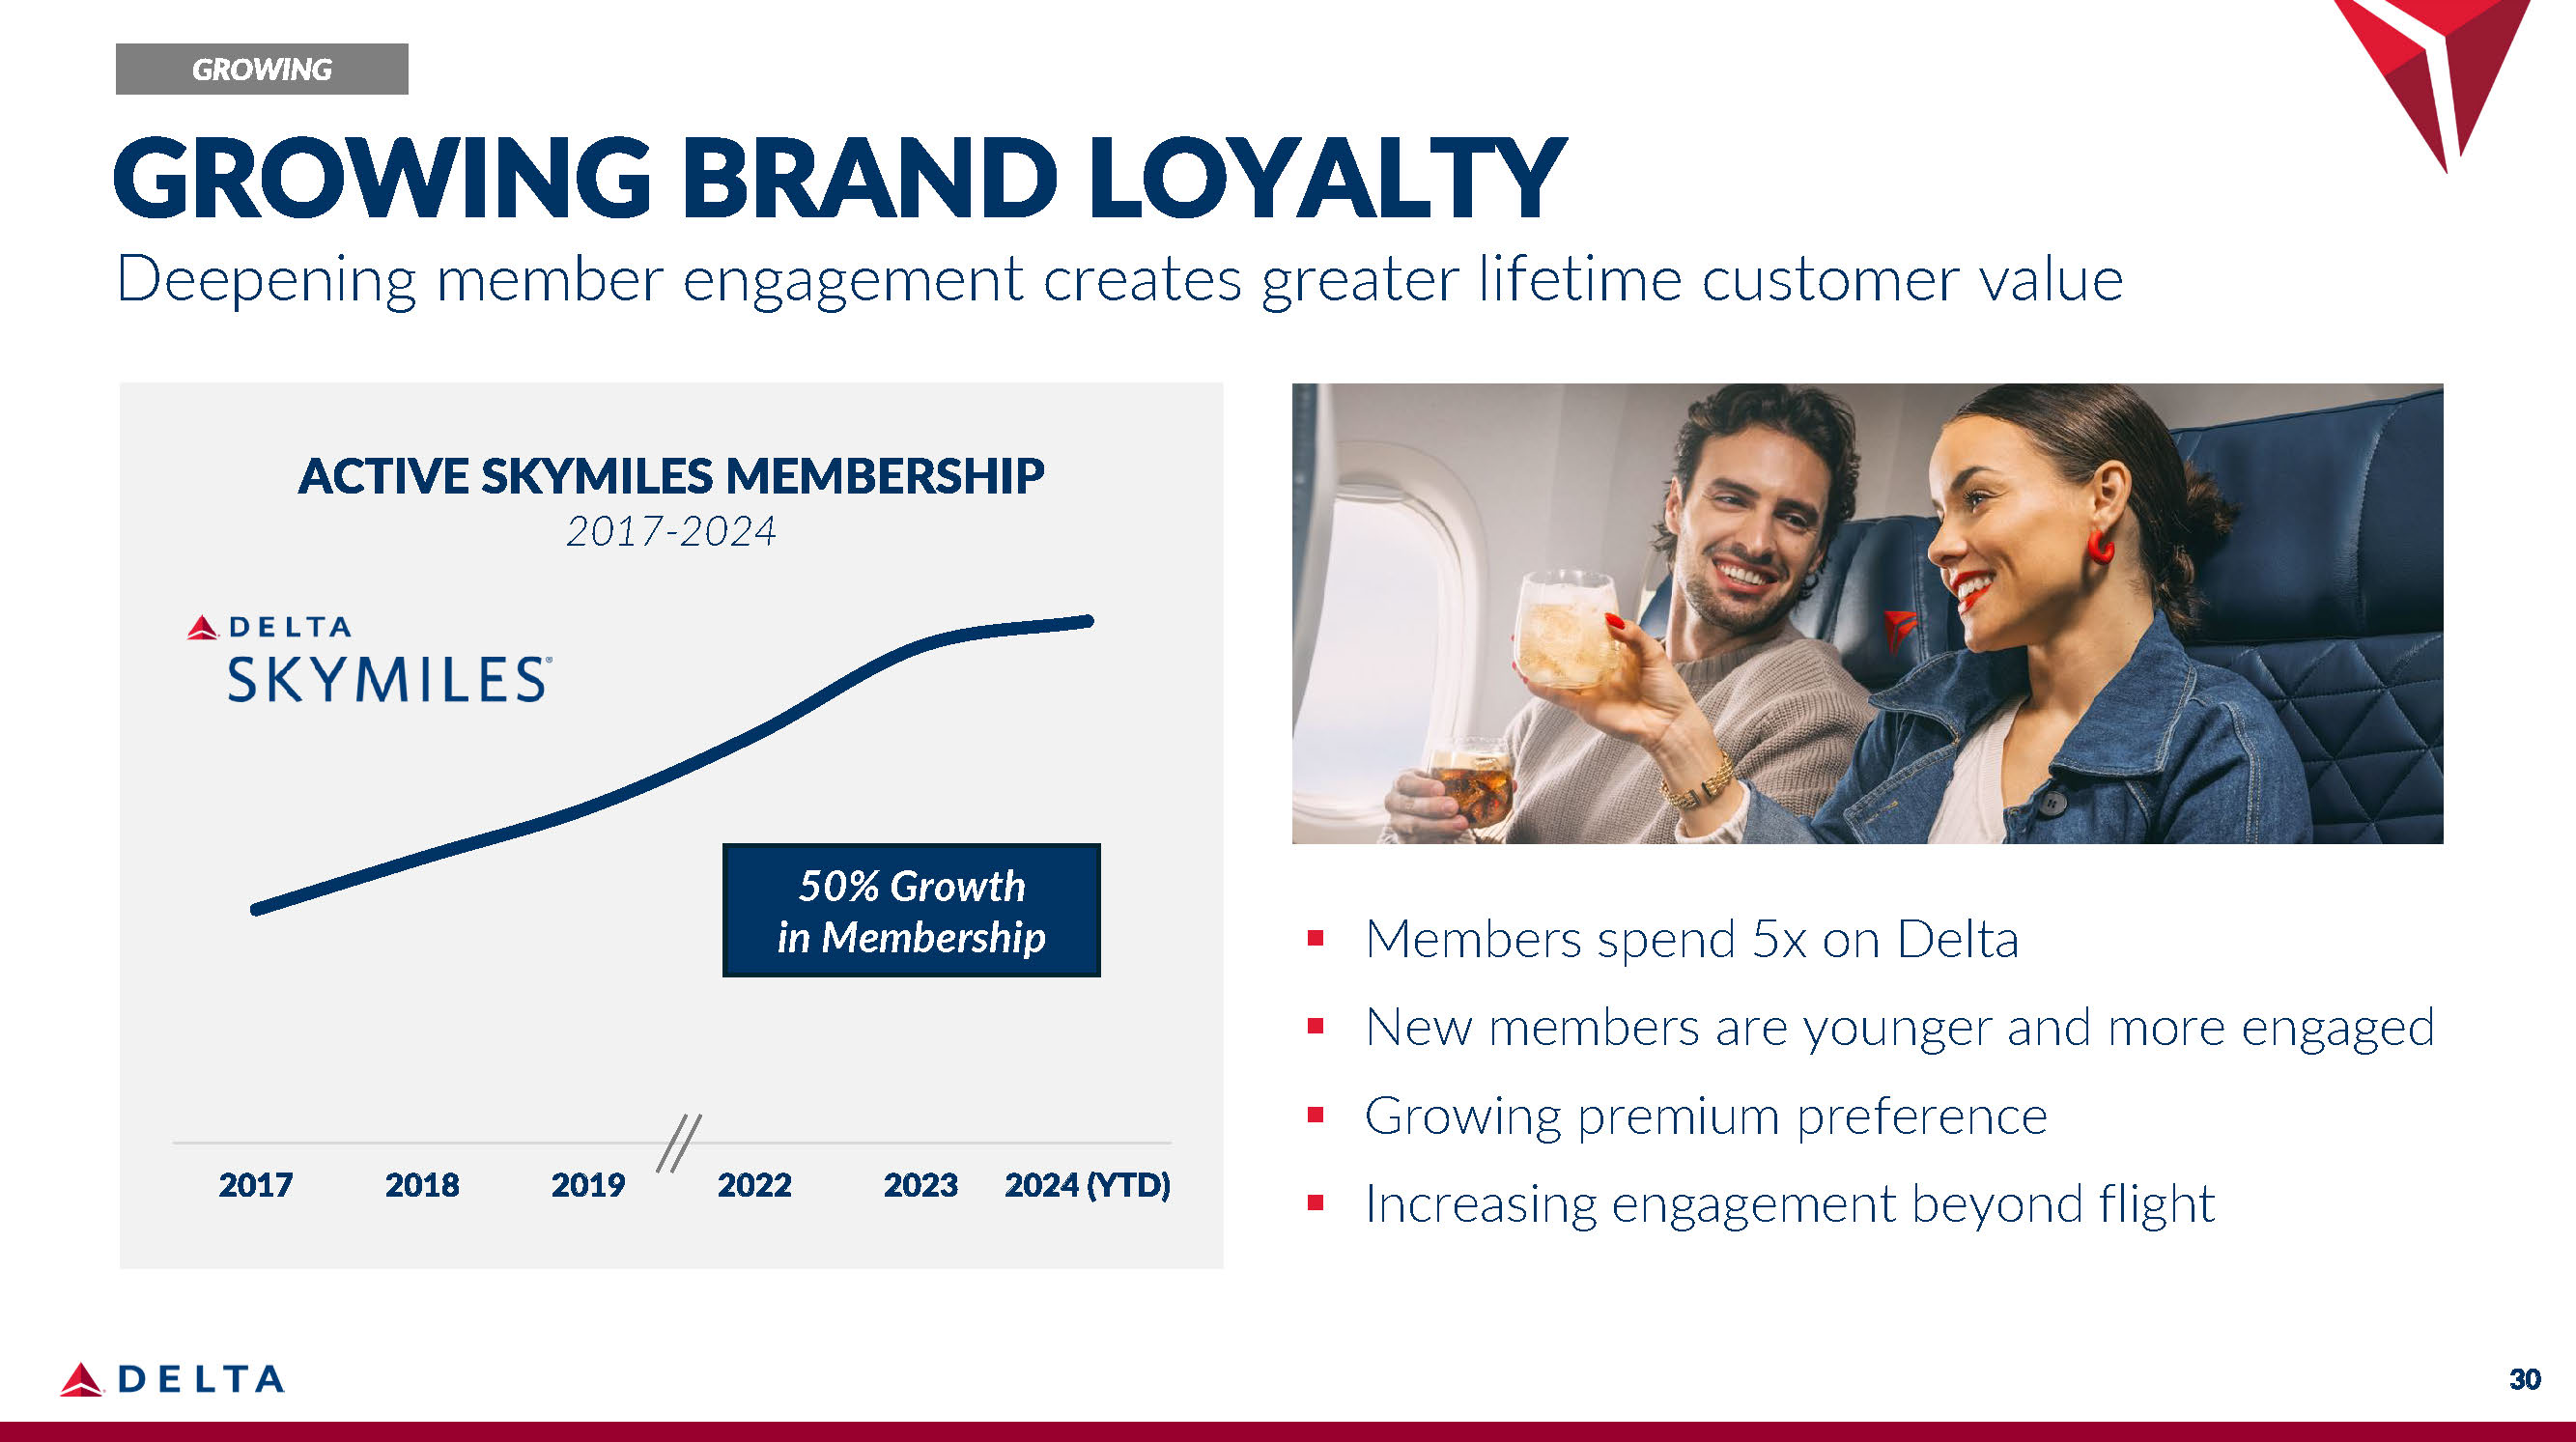
▪ Members spend 5x on Delta ▪ New members are younger and more engaged ▪ Growing premium preference ▪ Increasing engagement beyond flight 2017 2018 2019 2022 2023 2024 (YTD) ACTIVE SKYMILES MEMBERSHIP 2017 - 2024 50% Growth in Membership 30 GROWING GROWING BRAND LOYALTY Deepening member engagement creates greater lifetime customer value
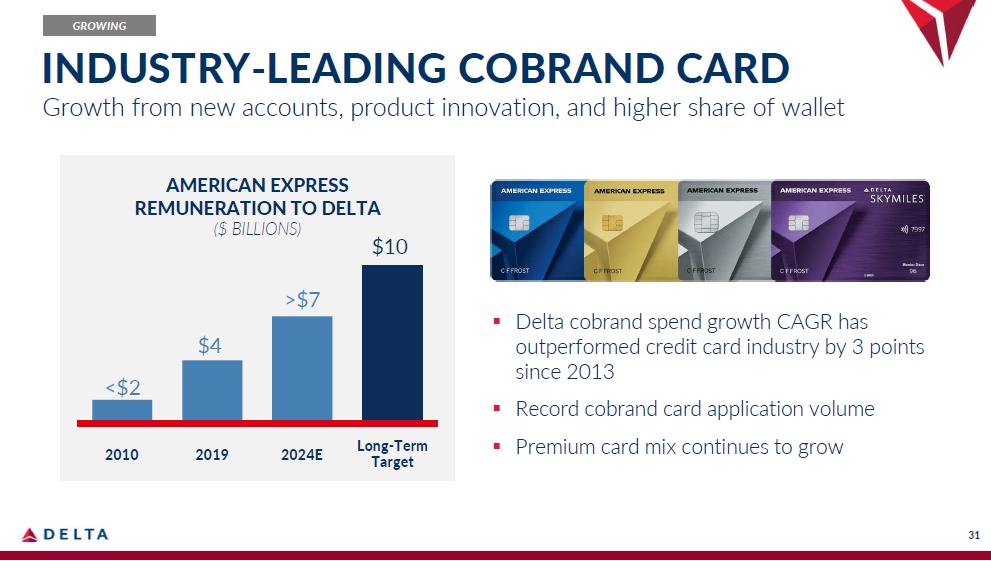
<$2 $4 AMERICAN EXPRESS REMUNERATION TO DELTA ($ BILLIONS) $10 >$7 2010 2019 2024E Long - term target ▪ Delta cobrand spend growth CAGR has outperformed credit card industry by 3 points since 2013 ▪ Record cobrand card application volume ▪ Premium card mix continues to grow GROWING 31 INDUSTRY - LEADING COBRAND CARD Growth from new accounts, product innovation, and higher share of wallet
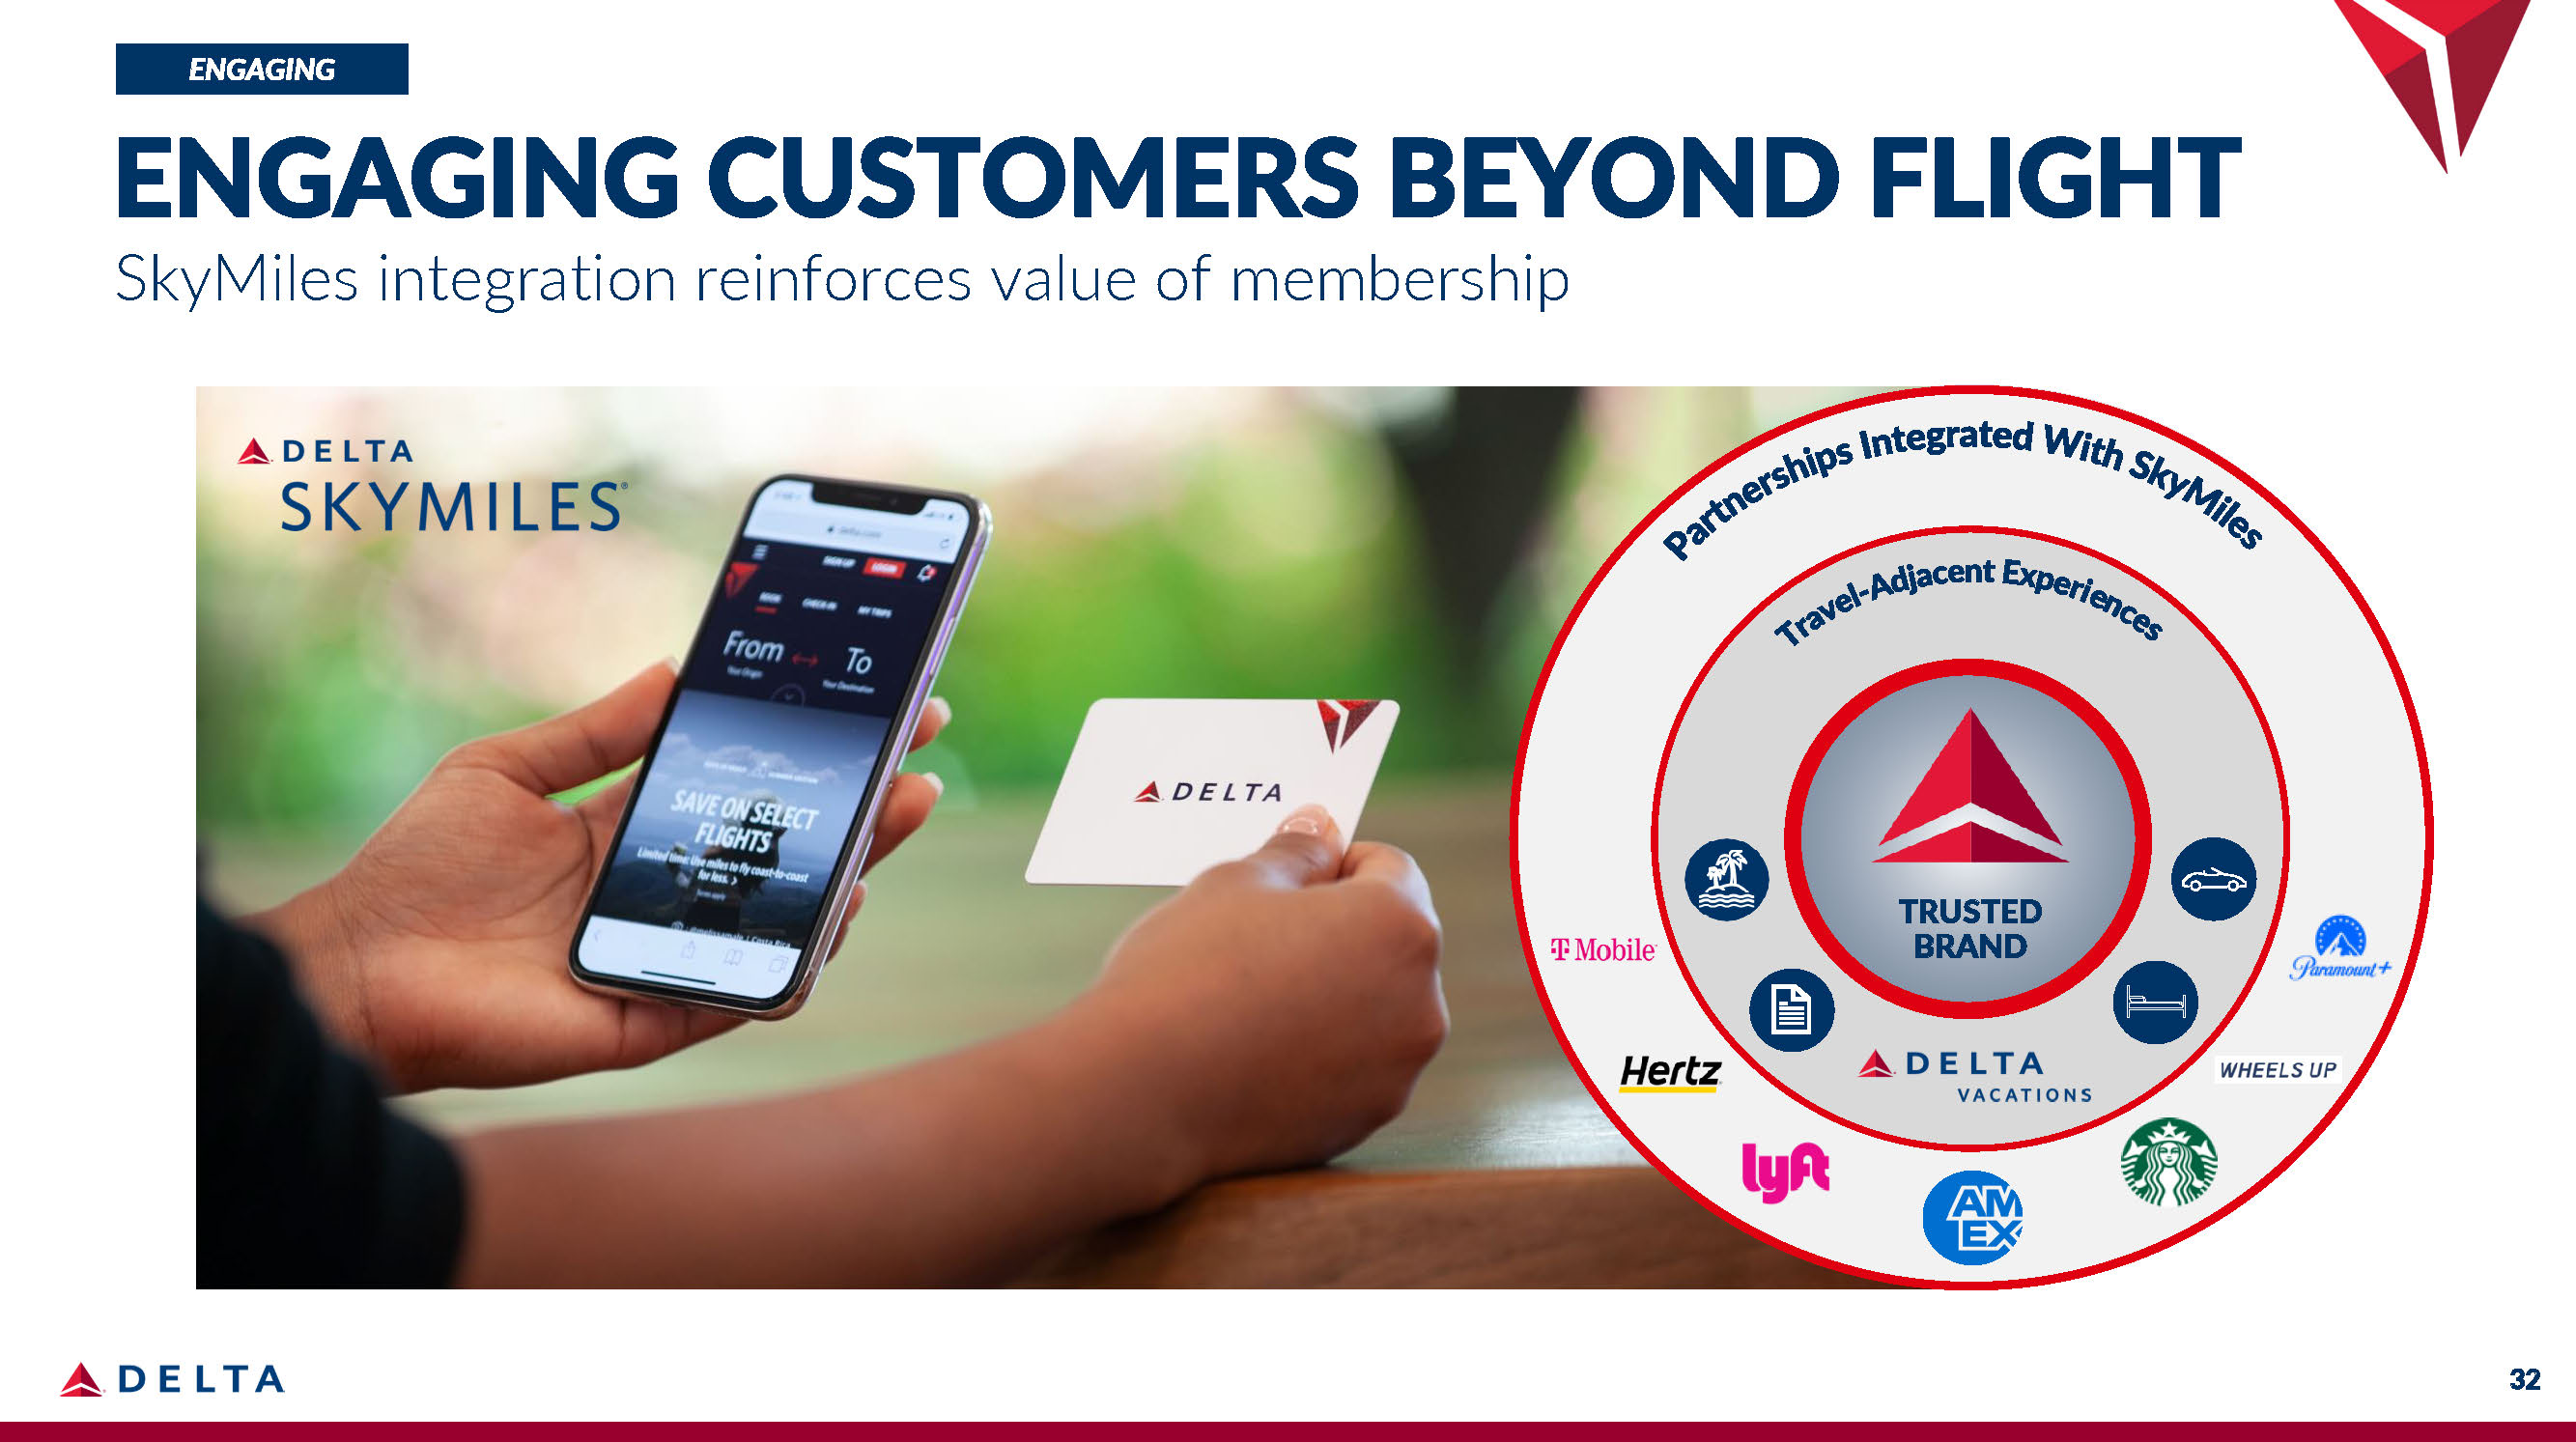
TRUSTED BRAND ENGAGING 32 ENGAGING CUSTOMERS BEYOND FLIGHT SkyMiles integration reinforces value of membership
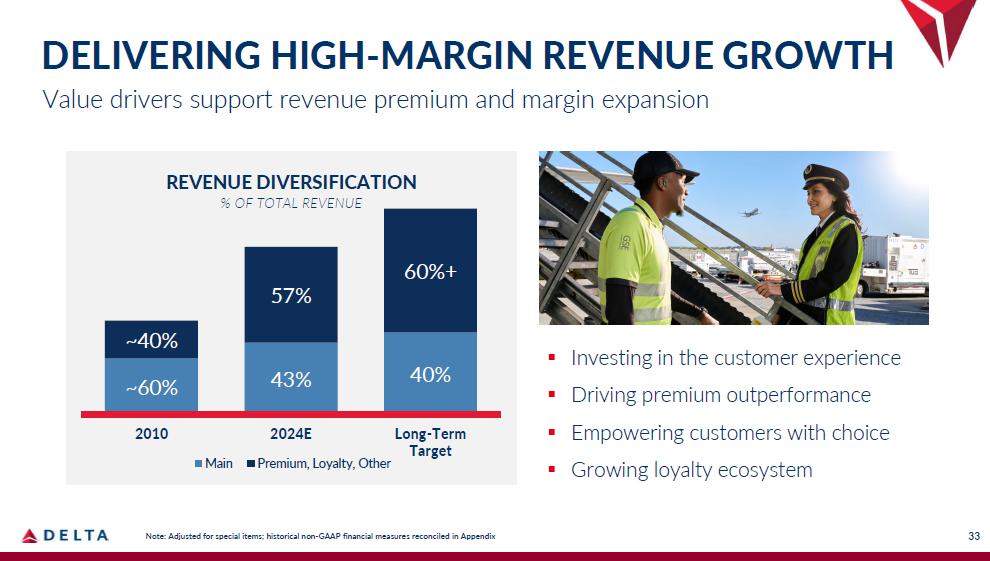
~60% 43% 40% ~40% 60%+ 57% 2010 Main 2024E Long - term Target Premium, Loyalty, Other REVENUE DIVERSIFICATION ▪ Investing in the customer experience ▪ Driving premium outperformance ▪ Empowering customers with choice ▪ Growing loyalty ecosystem DELIVERING HIGH - MARGIN REVENUE GROWTH Value drivers support revenue premium and margin expansion 33 Note: Adjusted for special items; historical non - GAAP financial measures reconciled in Appendix
DAN JANKI Executive Vice President & Chief Financial Officer

DIFFERENTIATED PERFORMANCE FREE CASH FLOW 2024E >$3B <$1B REST OF INDUSTRY (total) RETURN ON INVESTED CAPITAL 2024E 13% Mid - single digits REST OF INDUSTRY (avg) $5B CAPEX +5pts vs.WACC INVESTMENT - GRADE BALANCE SHEET $30 BILLION OF UNENCUMBERED ASSETS STEADY DIVIDEND GROWTH Source: Based on SEC filings and internal estimates for the December quarter, aligned to Delta’s definition Note: Adjusted for special items; historical non - GAAP financial measures reconciled in Appendix 35

CONSISTENT MARGIN OUTPERFORMANCE Rest of Industry OPERATING MARGIN AAL, ALK, UAL - 4% - 2% 14% 12% 10% 8% 16% 2018 2019 2022 2023 1H24 2H24E 6% 4% 2% 0% (2%) (4%) Structural Margin Premium ▪ Revenue diversity ▪ Industry - leading operation ▪ High - margin core hubs ▪ Corporate leadership ▪ Best - in - class partnerships Source: SEC filings and consensus from Visible Alpha Note: Adjusted for special items; historical non - GAAP financial measures reconciled in Appendix 36

VALUE CREATION FRAMEWORK Three - to - five - year financial targets deliver sustained value creation MARGIN DURABLE EARNINGS BALANCE SHEET EXPANSION AND FREE CASH FLOW STRENGTH EPS growth: Average annual; Free Cash Flow: Annual Note: Adjusted for special items; historical non - GAAP financial measures reconciled in Appendix 37 Mid - teens Operating Margin 1x Gross Leverage 10% EPS Growth $3 - 5B Free Cash Flow 15%+ RETURN ON INVESTED CAPITAL $40B+ UNENCUMBERED ASSETS

DELIVERING STEADY MARGIN EXPANSION 2024E Long - Term Target OPERATING MARGIN Mid - teens 11% Margin Expansion Drivers ▪ High - margin revenue growth ▪ Leveraging investments, normalizing maintenance, and accelerating technology ▪ Improving industry backdrop supports higher main cabin margins DURABLE EARNINGS & CASH BALANCE SHEET STRENGTH MARGIN EXPANSION 38 Note: Adjusted for special items; historical non - GAAP financial measures reconciled in Appendix
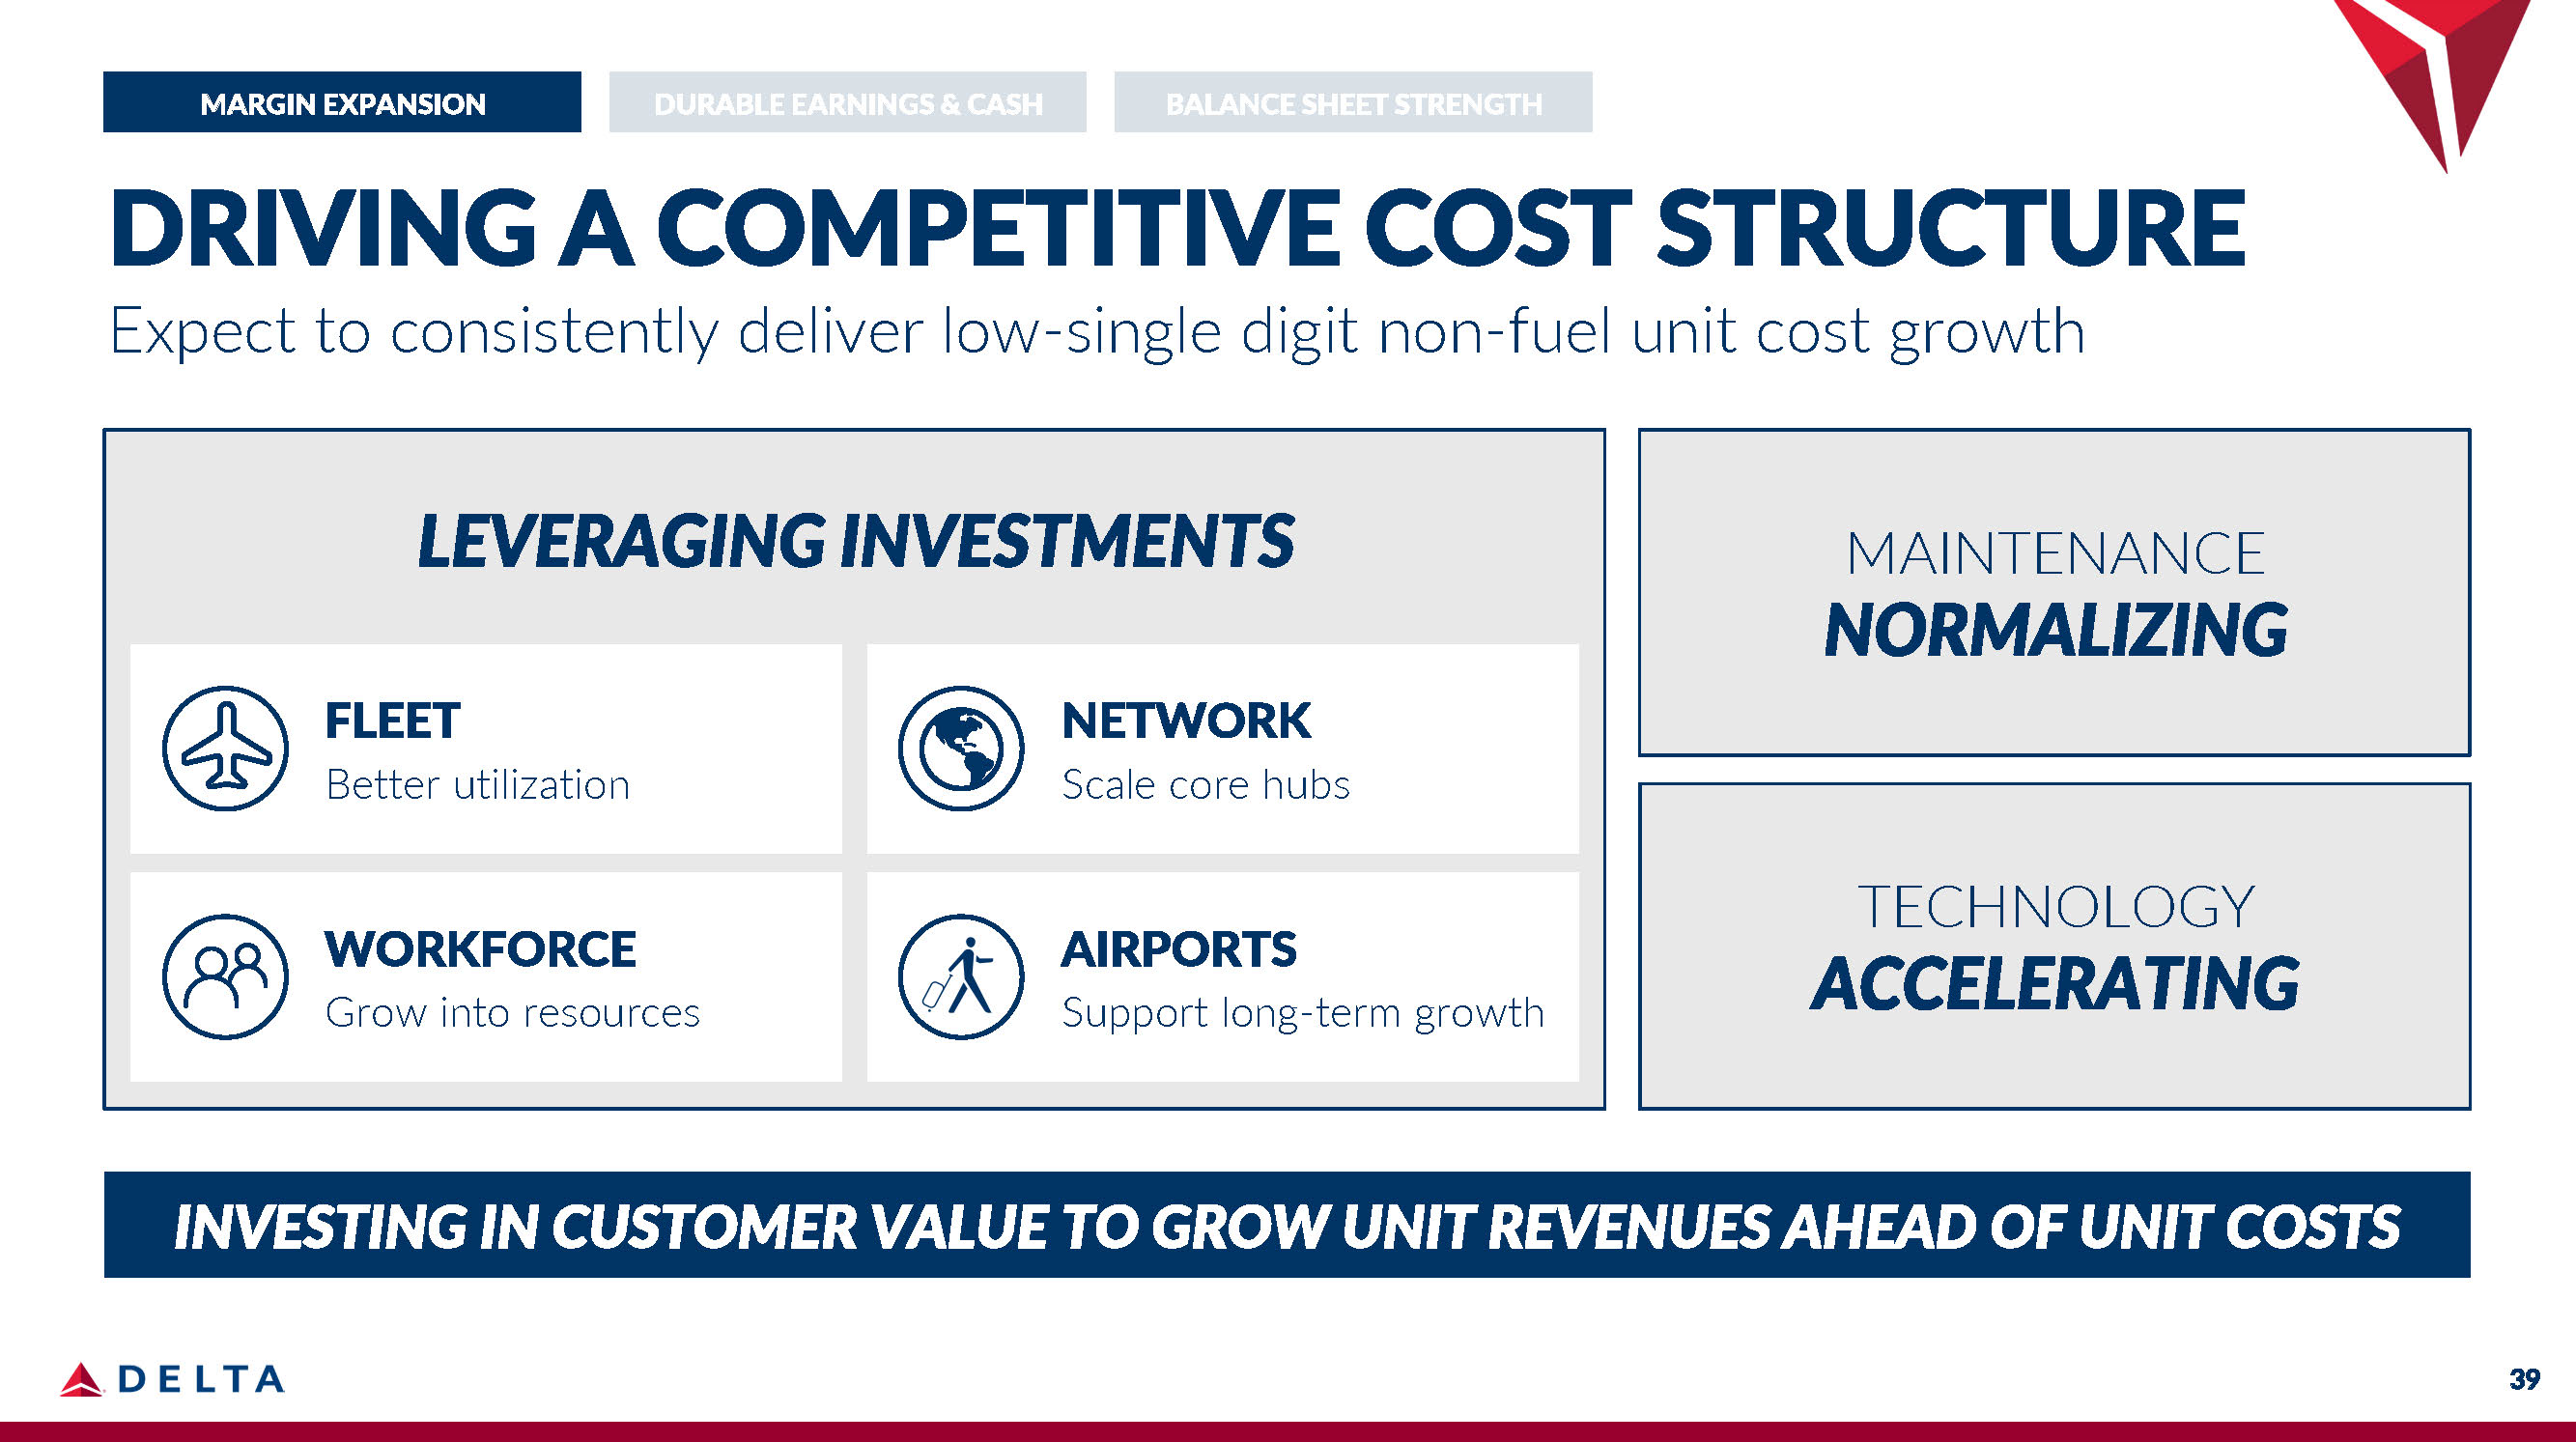
DRIVING A COMPETITIVE COST STRUCTURE Expect to consistently deliver low - single digit non - fuel unit cost growth INVESTING IN CUSTOMER VALUE TO GROW UNIT REVENUES AHEAD OF UNIT COSTS DURABLE EARNINGS & CASH BALANCE SHEET STRENGTH MARGIN EXPANSION MAINTENANCE NORMALIZING TECHNOLOGY ACCELERATING LEVERAGING INVESTMENTS FLEET Better utilization NETWORK Scale core hubs WORKFORCE Grow into resources AIRPORTS Support long - term growth 39
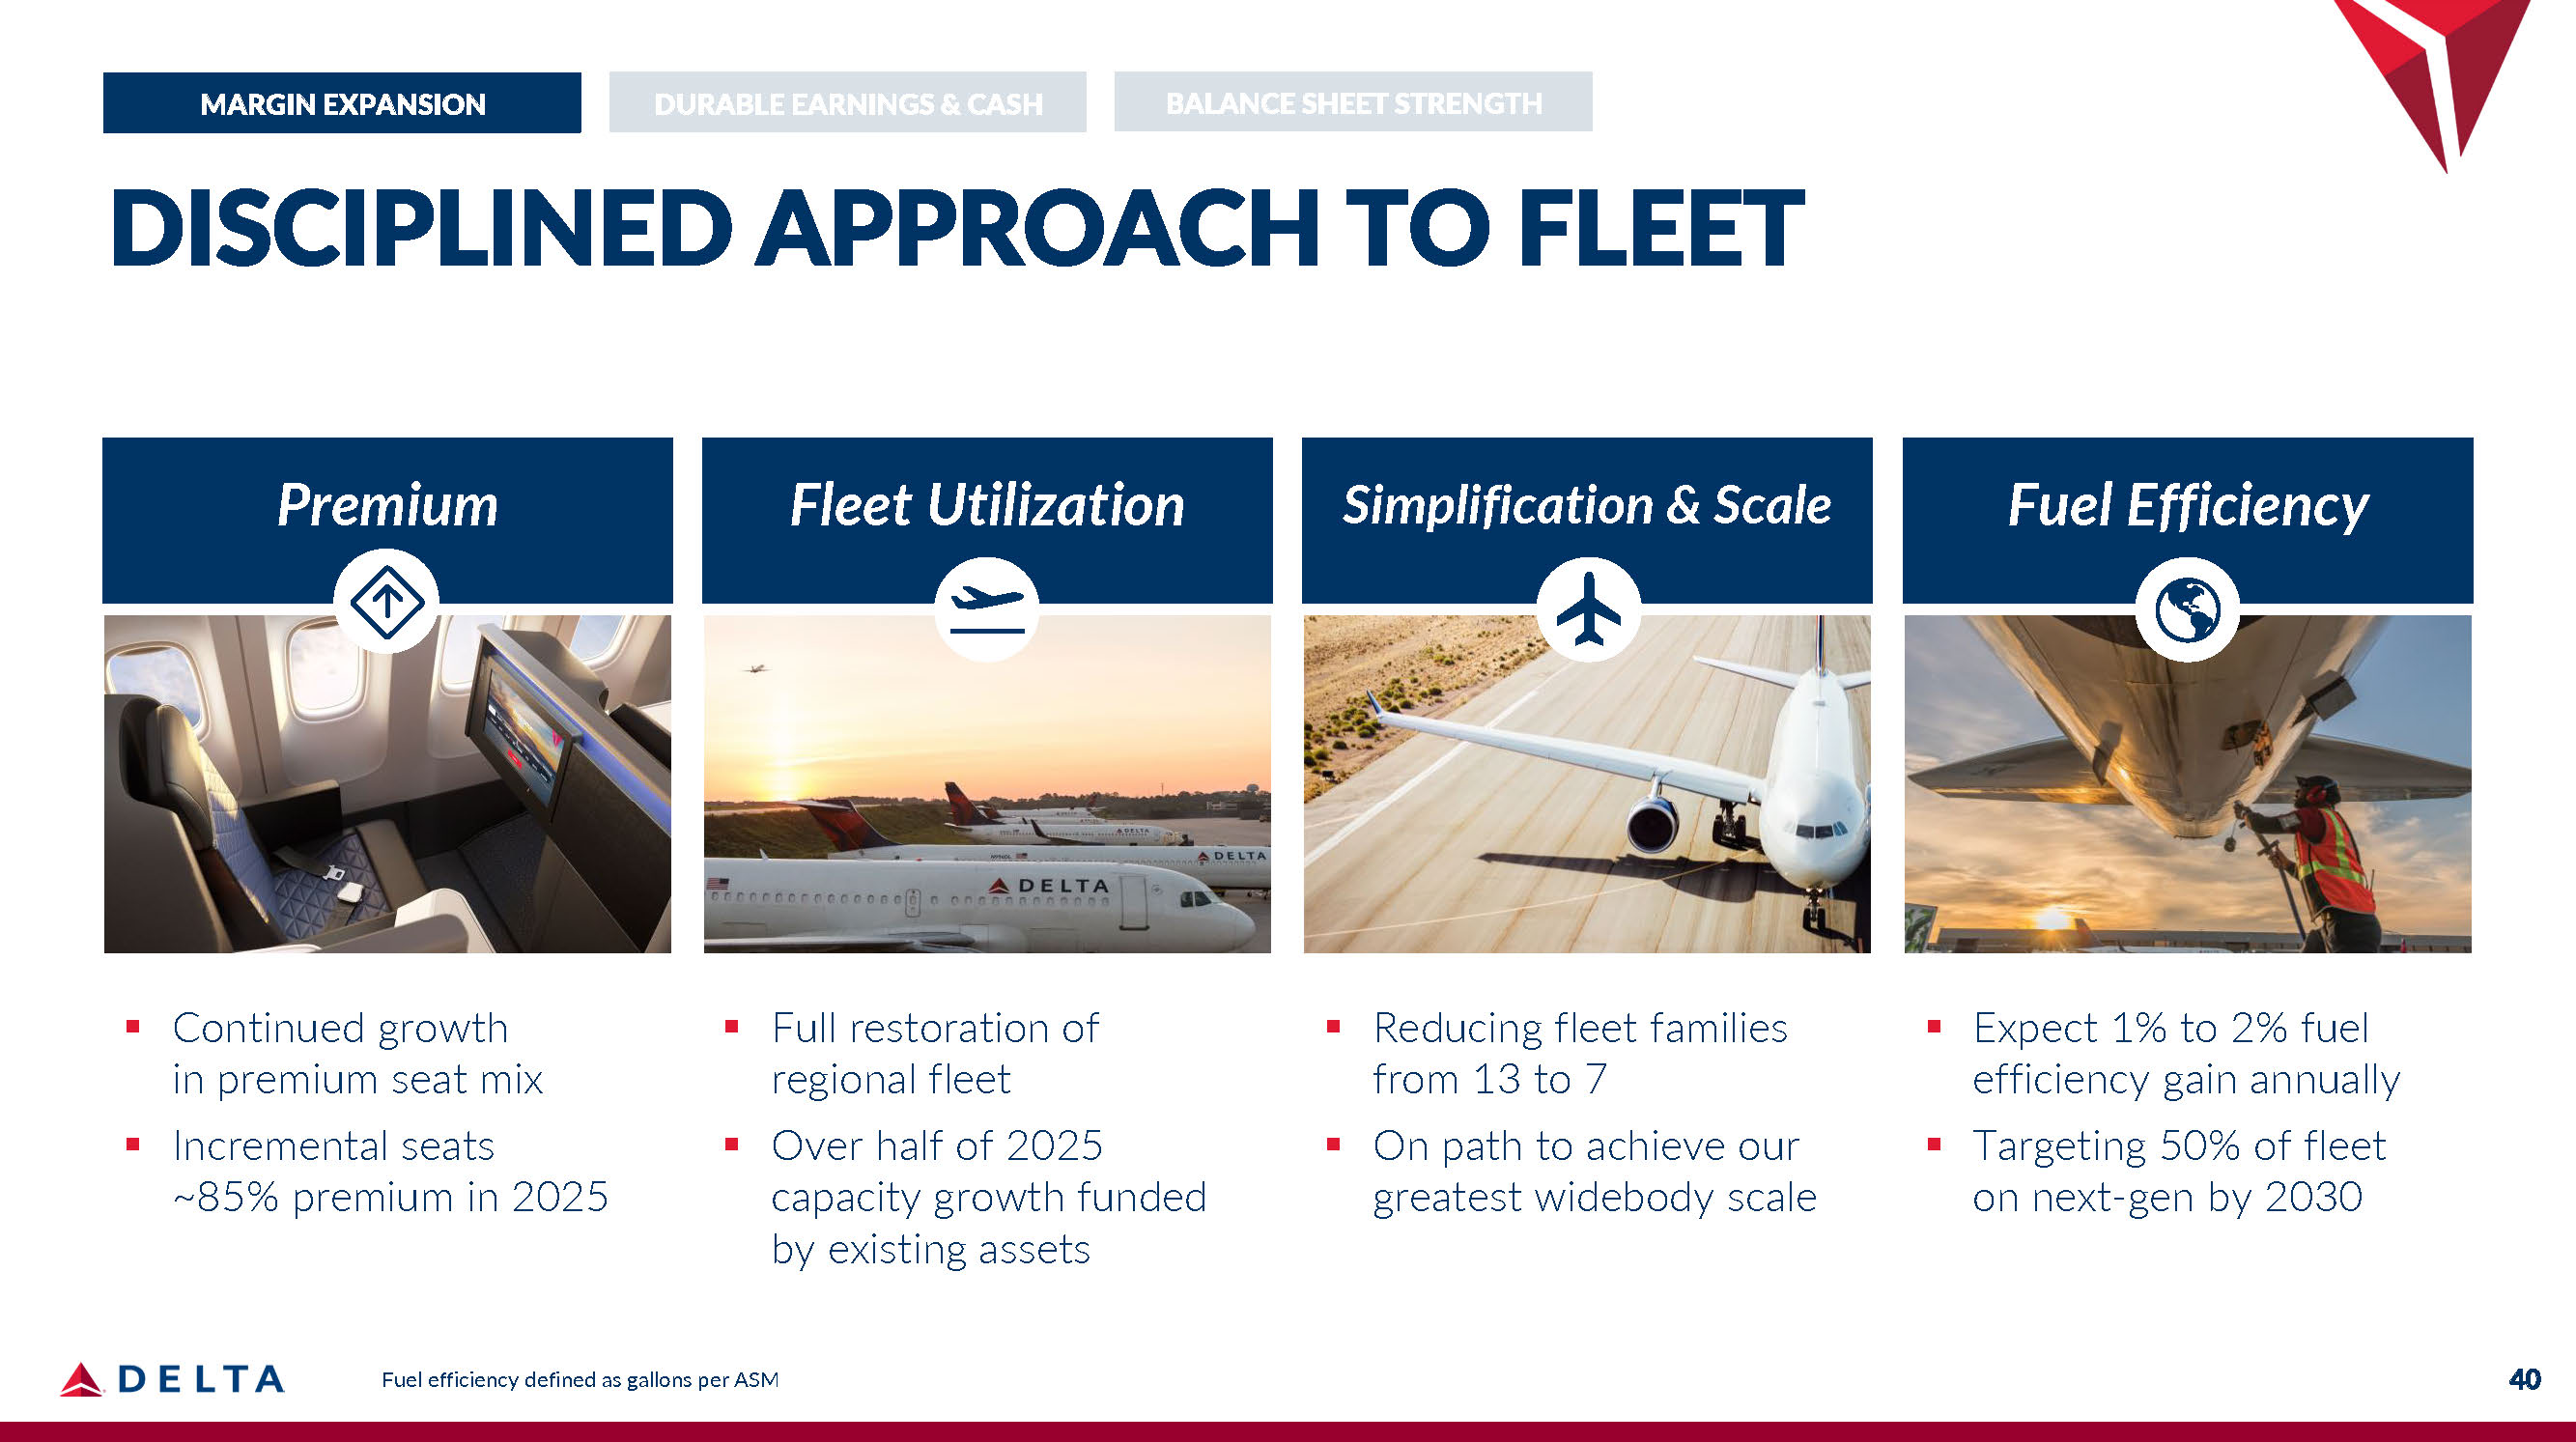
▪ Continued growth in premium seat mix ▪ Incremental seats ~85% premium in 2025 Premium ▪ Full restoration of regional fleet ▪ Over half of 2025 capacity growth funded by existing assets Fleet Utilization ▪ Reducing fleet families from 13 to 7 ▪ On path to achieve our greatest widebody scale Simplification & Scale ▪ Expect 1% to 2% fuel efficiency gain annually ▪ Targeting 50% of fleet on next - gen by 2030 Fuel Efficiency DURABLE EARNINGS & CASH BALANCE SHEET STRENGTH MARGIN EXPANSION 40 Fuel efficiency defined as gallons per ASM DISCIPLINED APPROACH TO FLEET
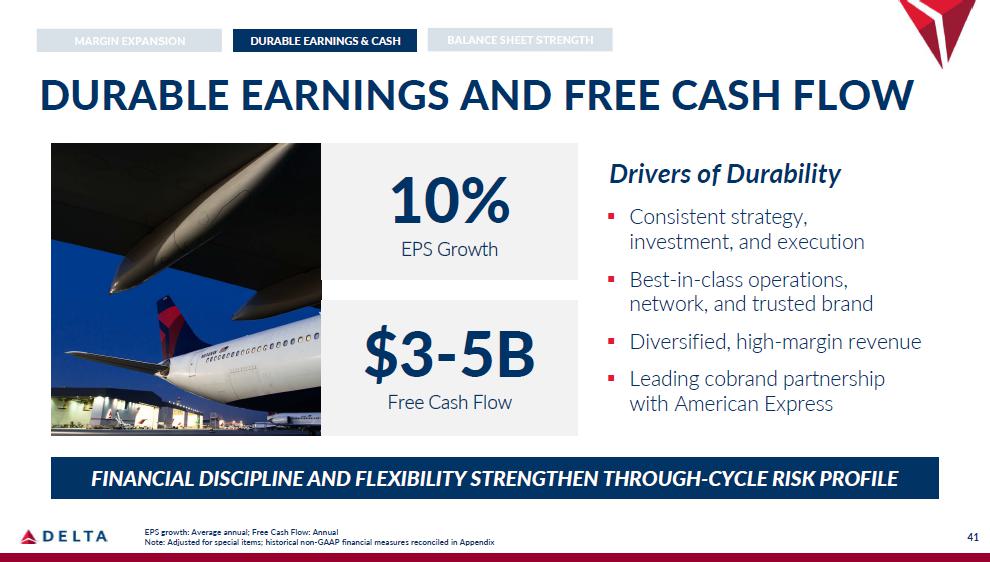
41 DURABLE EARNINGS AND FREE CASH FLOW ▪ Consistent strategy, investment, and execution ▪ Best - in - class operations, network, and trusted brand ▪ Diversified, high - margin revenue ▪ Leading cobrand partnership with American Express 10% EPS Growth $3 - 5B Free Cash Flow FINANCIAL DISCIPLINE AND FLEXIBILITY STRENGTHEN THROUGH CYCLE RISK PROFILE BALANCE SHEET STRENGTH DURABLE EARNINGS & CASH MARGIN EXPANSION Drivers of Durability Note: Adjusted for special items; historical non - GAAP financial measures reconciled in Appendix EPS growth: Average annual; Free Cash Flow: Annual
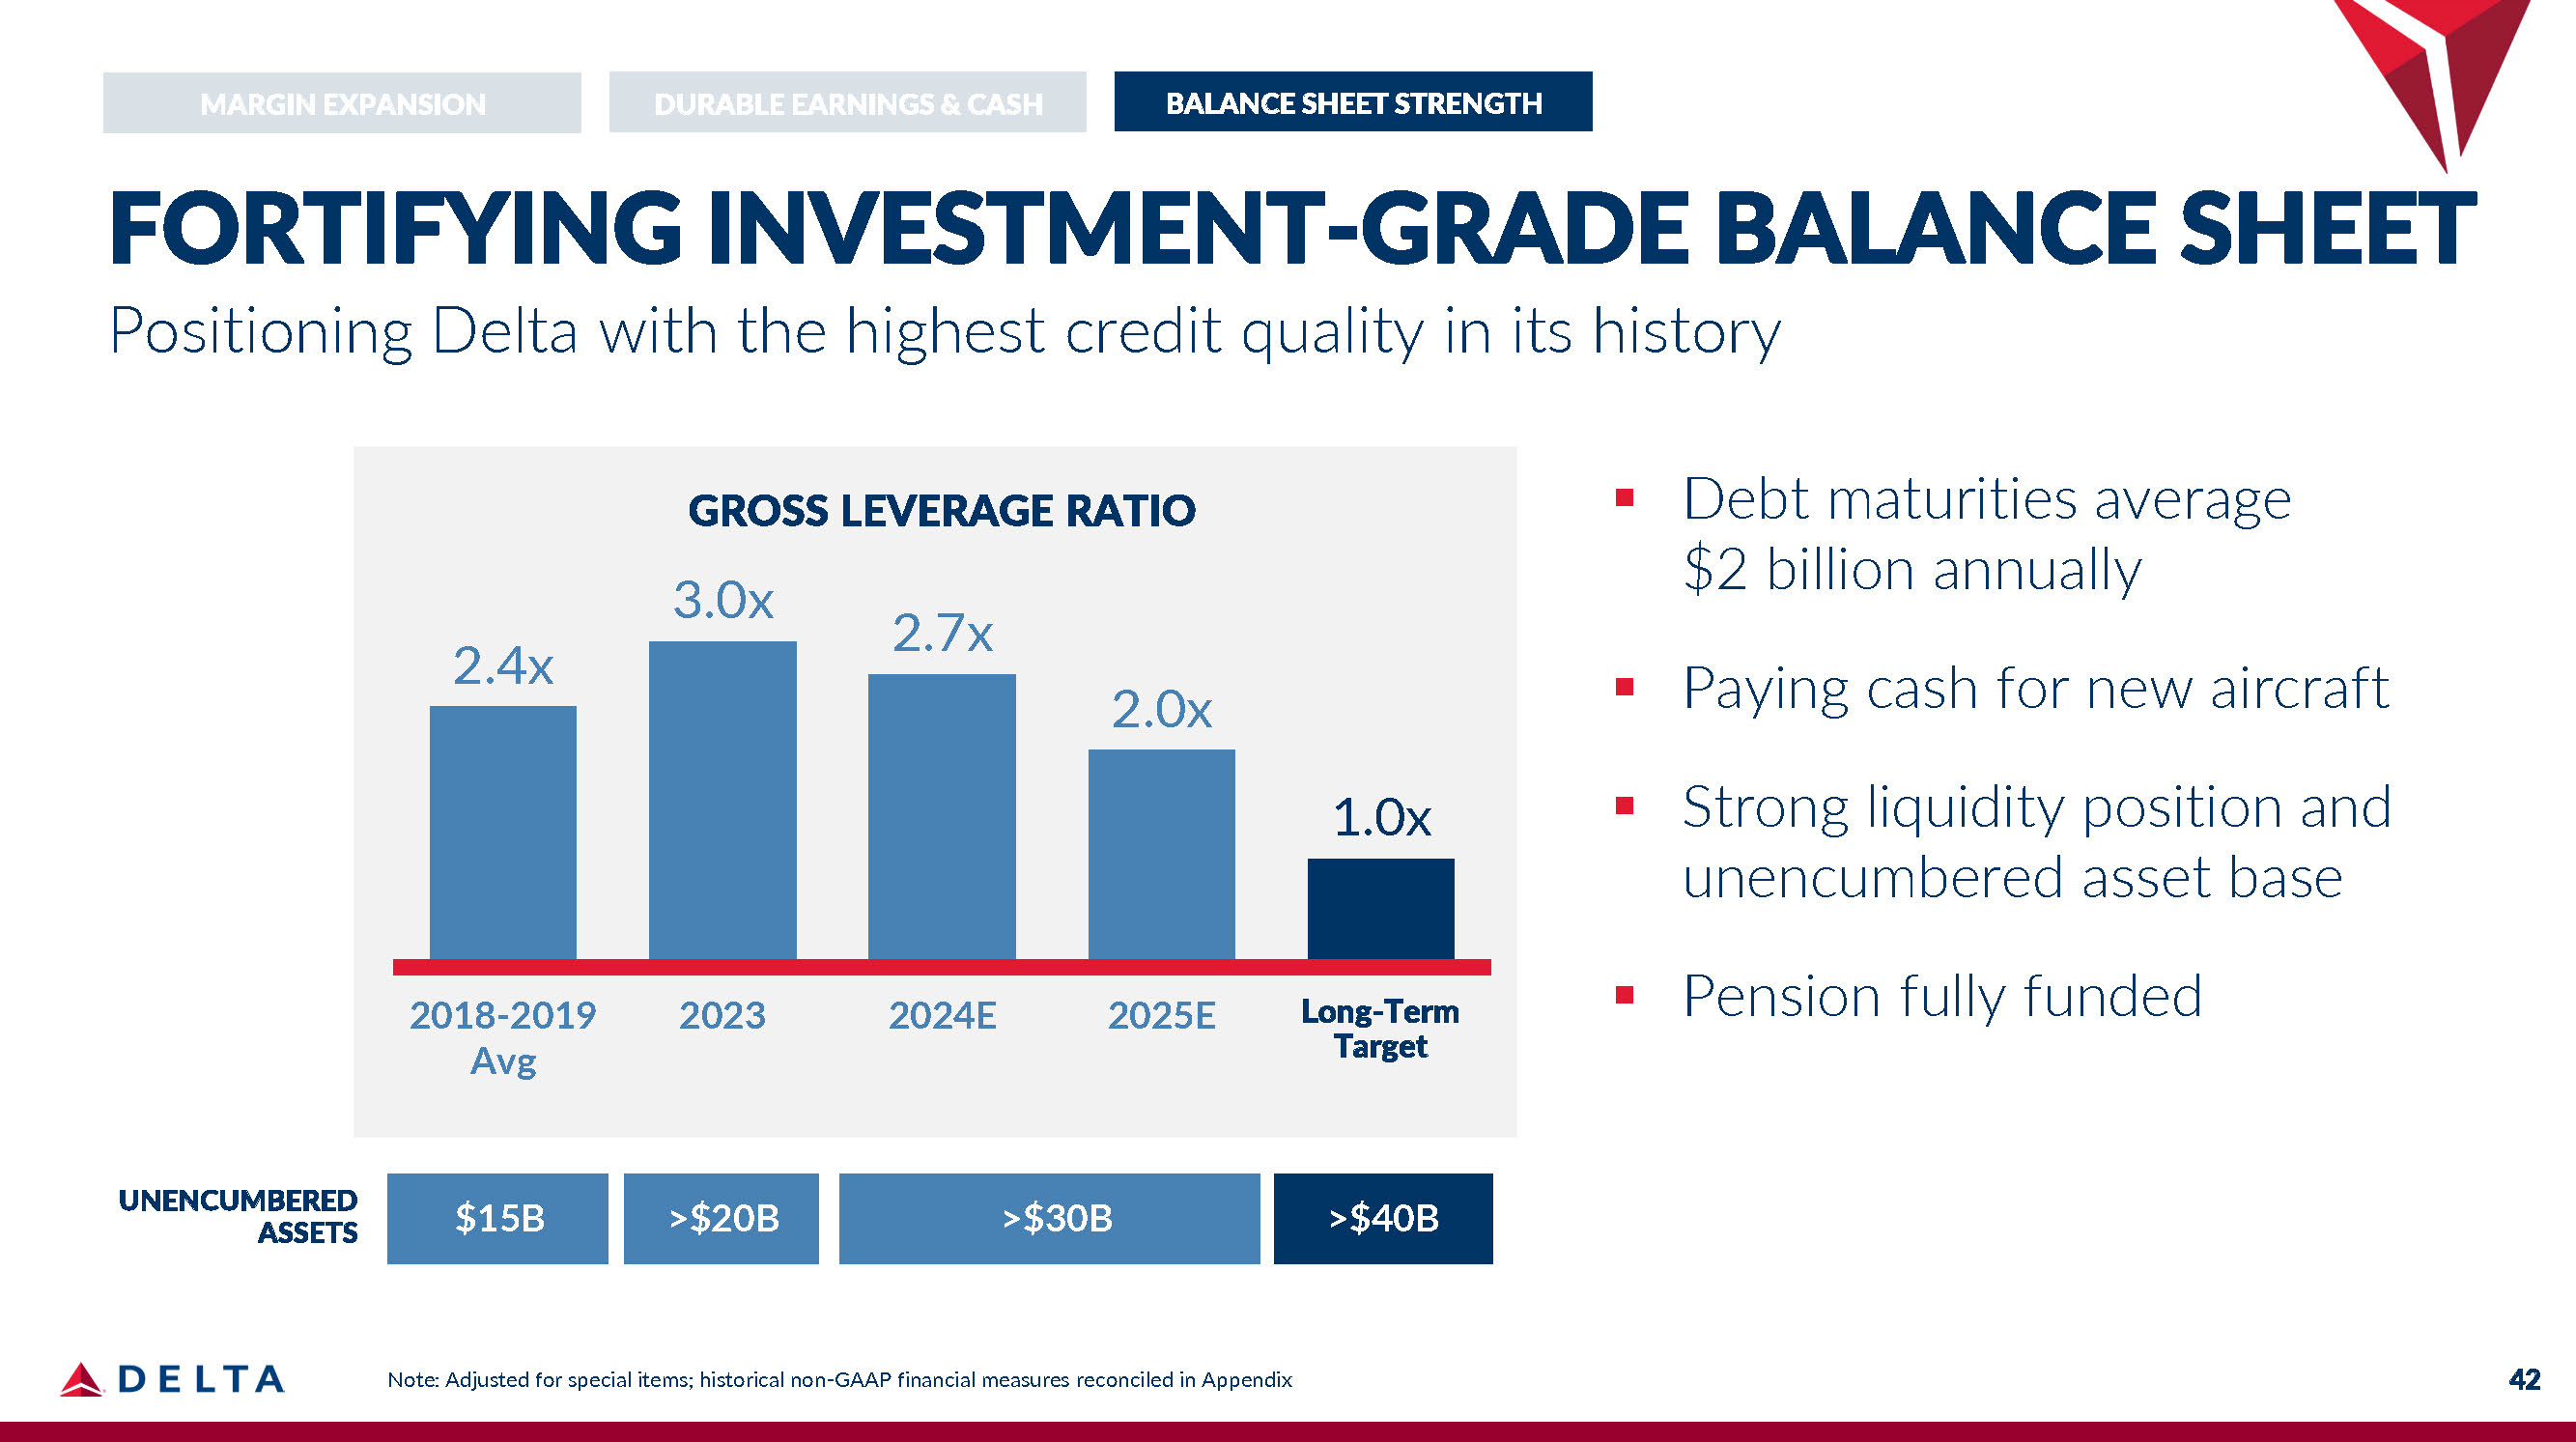
2.4x GROSS LEVERAGE RATIO 3.0x 2.7x 2.0x 1.0x 2018 - 2019 Avg 2023 2024E 2025E 2027E Long - Term Target UNENCUMBERED ASSETS ▪ Debt maturities average $2 billion annually ▪ Paying cash for new aircraft ▪ Strong liquidity position and unencumbered asset base ▪ Pension fully funded >$40B >$30B >$20B $15B BALANCE SHEET STRENGTH MARGIN EXPANSION DURABLE EARNINGS & CASH FORTIFYING INVESTMENT - GRADE BALANCE SHEET Positioning Delta with the highest credit quality in its history 42 Note: Adjusted for special items; historical non - GAAP financial measures reconciled in Appendix

BALANCED CAPITAL ALLOCATION BALANCE SHEET STRENGTH MARGIN EXPANSION DURABLE EARNINGS & CASH $9 - 11B ANNUAL OPERATING CASH FLOW 50% SHAREHOLDER RETURNS Debt reduction, dividends, repurchases 50% REINVEST FOR GROWTH CONSISTENT, DISCIPLINED REINVESTMENT REDUCE FINANCIAL RISK THROUGH DEBT PAYDOWN STEADY DIVIDEND GROWTH 43 INCREASE SHAREHOLDER RETURNS
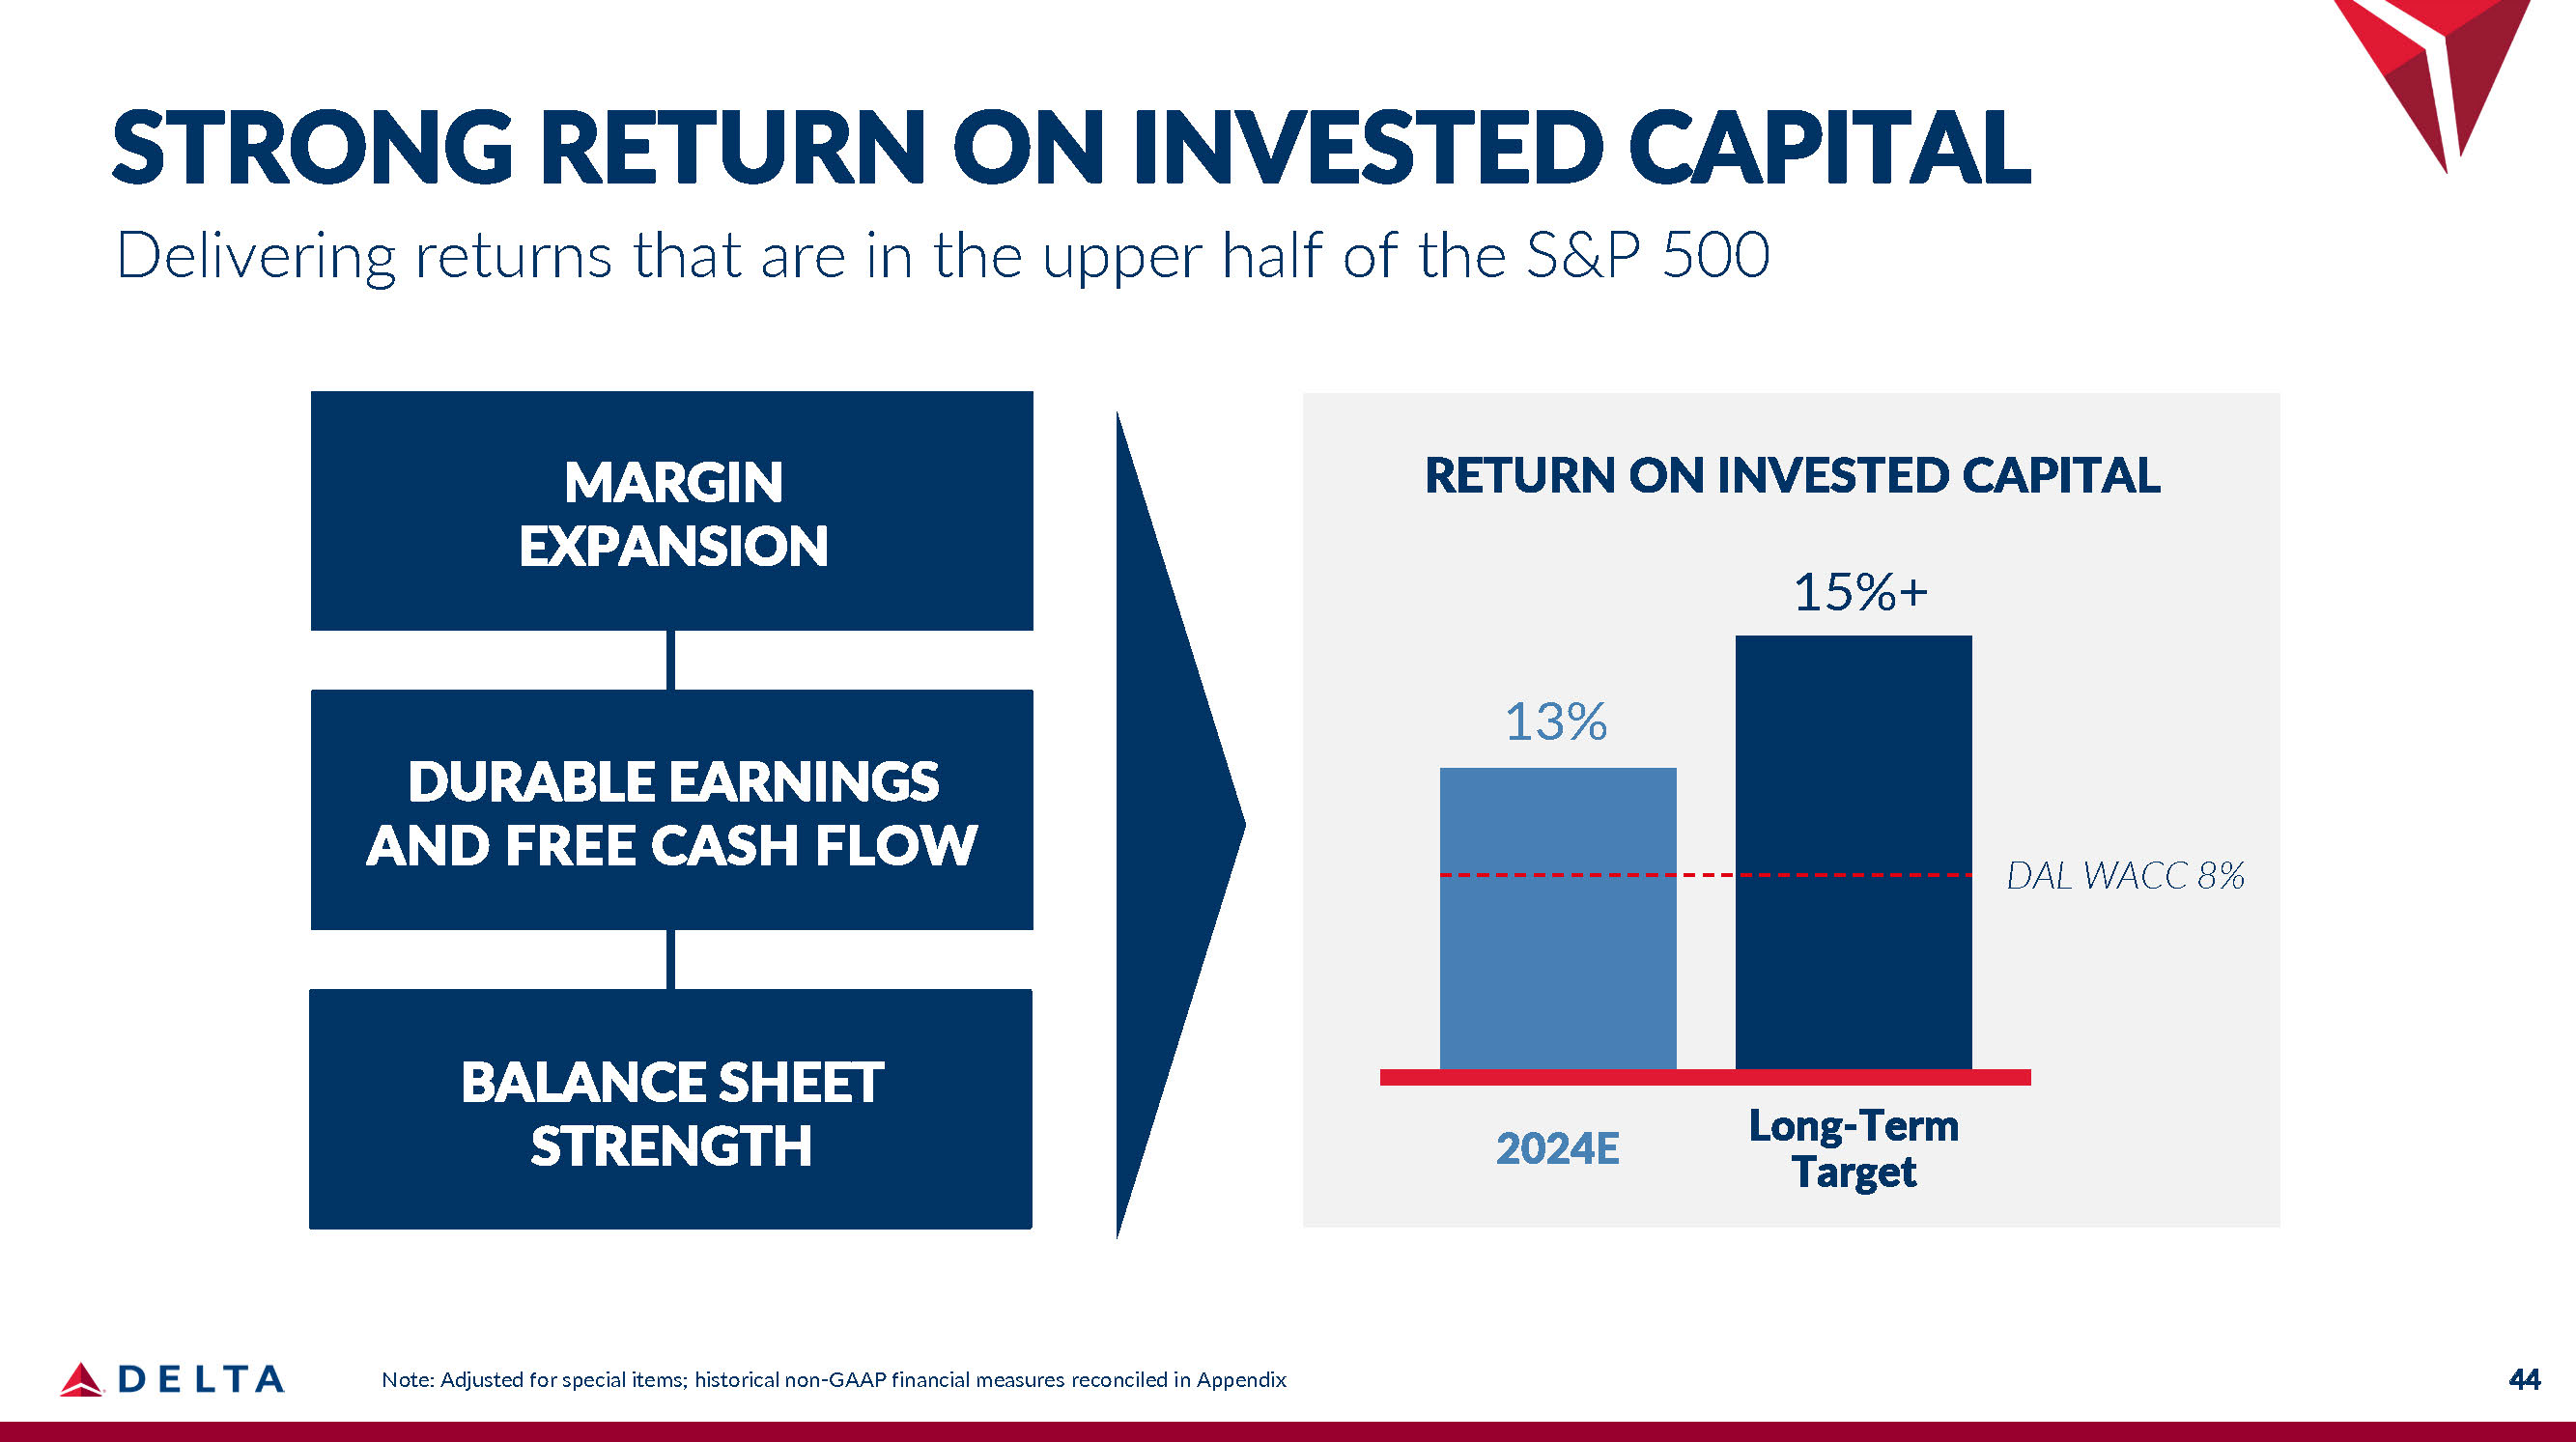
2024E Long - Term Target RETURN ON INVESTED CAPITAL 15%+ 13% DAL WACC 8% MARGIN EXPANSION DURABLE EARNINGS AND FREE CASH FLOW BALANCE SHEET STRENGTH STRONG RETURN ON INVESTED CAPITAL Delivering returns that are in the upper half of the S&P 500 44 Note: Adjusted for special items; historical non - GAAP financial measures reconciled in Appendix

DELTA: A COMPELLING INVESTMENT Positioned To Win Trusted consumer brand, led by Delta people, and 15 years of consistent strategy, investment, and execution Delivering Durability Competitive advantages, diverse revenue, and secular growth in travel demand drive durable revenue, earnings, and cash flow Creating Value Disciplined reinvestment, continued debt reduction, and increased shareholder returns drive sustained value creation for owners 45

KEEP CLIMBING .

APPENDIX
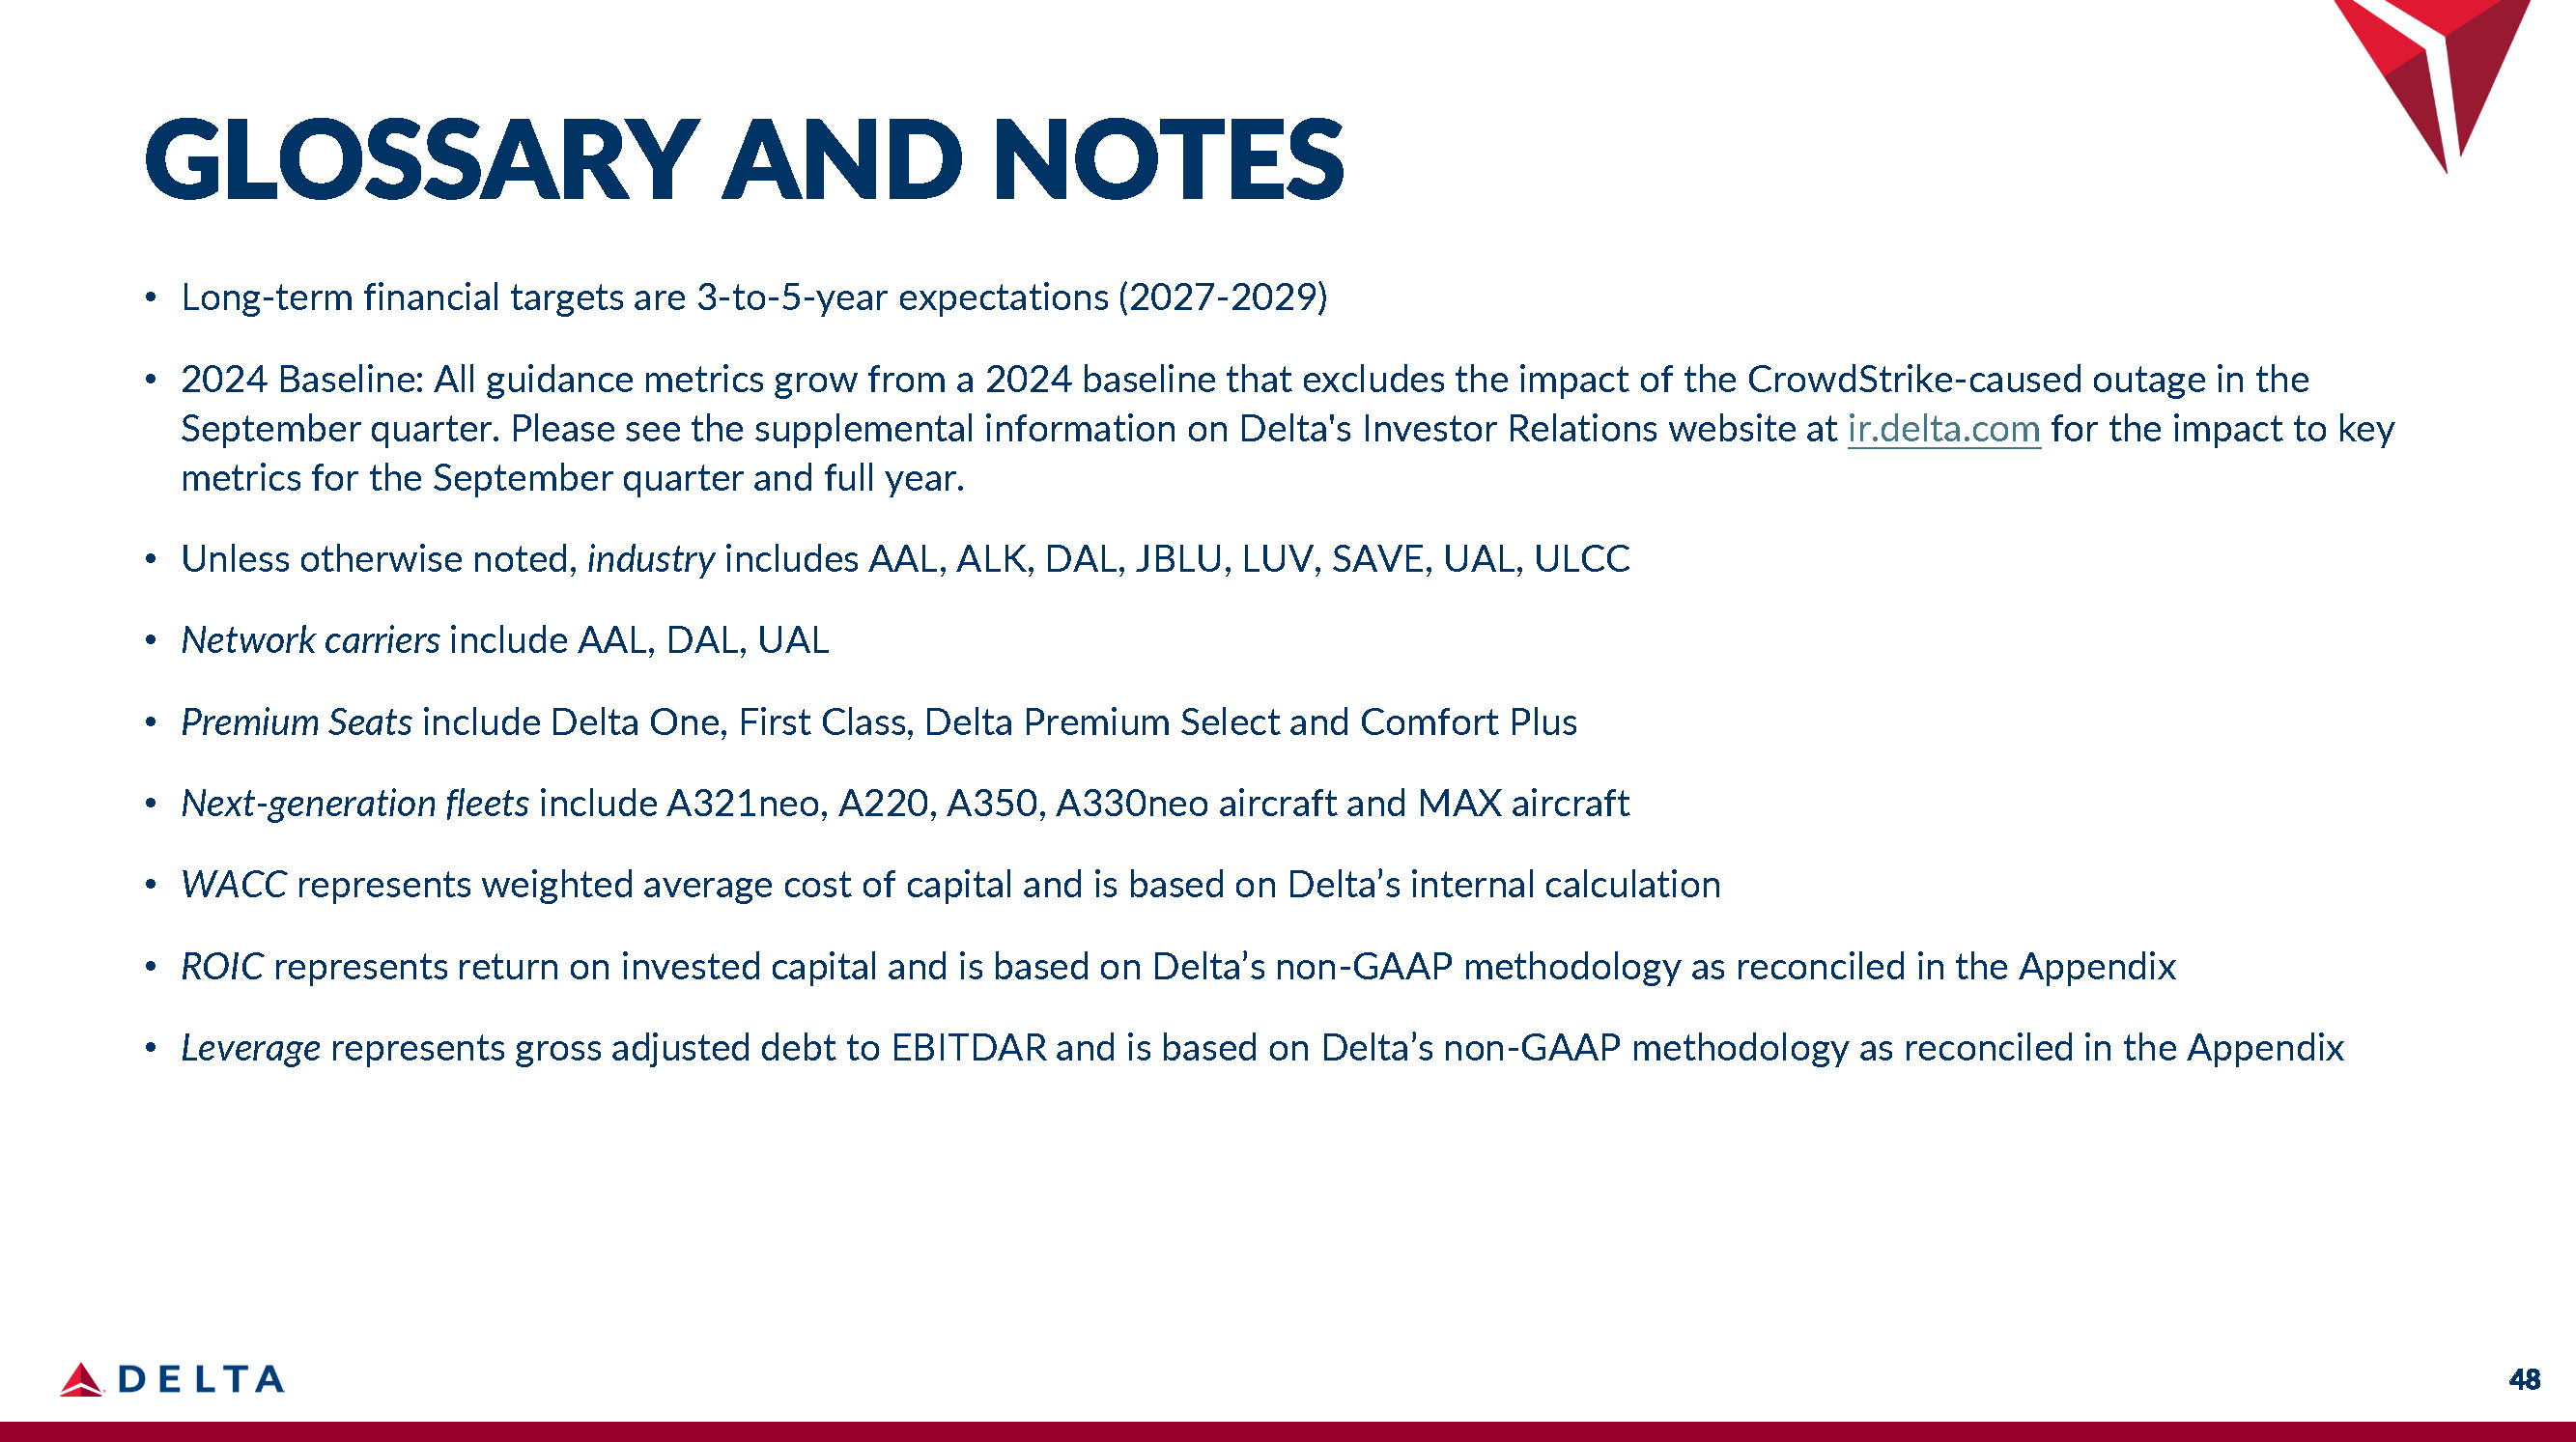
• Long - term financial targets are 3 - to - 5 - year expectations (2027 - 2029) • 2024 Baseline: All guidance metrics grow from a 2024 baseline that excludes the impact of the CrowdStrike - caused outage in the September quarter. Please see the supplemental information on Delta's Investor Relations website at ir.delta.com for the impact to key metrics for the September quarter and full year. • Unless otherwise noted, industry includes AAL, ALK, DAL, JBLU, LUV, SAVE, UAL, ULCC • Network carriers include AAL, DAL, UAL • Premium Seats include Delta One, First Class, Delta Premium Select and Comfort Plus • Next - generation fleets include A321neo, A220, A350, A330neo aircraft and MAX aircraft • WACC represents weighted average cost of capital and is based on Delta’s internal calculation • ROIC represents return on invested capital and is based on Delta’s non - GAAP methodology as reconciled in the Appendix • Leverage represents gross adjusted debt to EBITDAR and is based on Delta’s non - GAAP methodology as reconciled in the Appendix 48 GLOSSARY AND NOTES
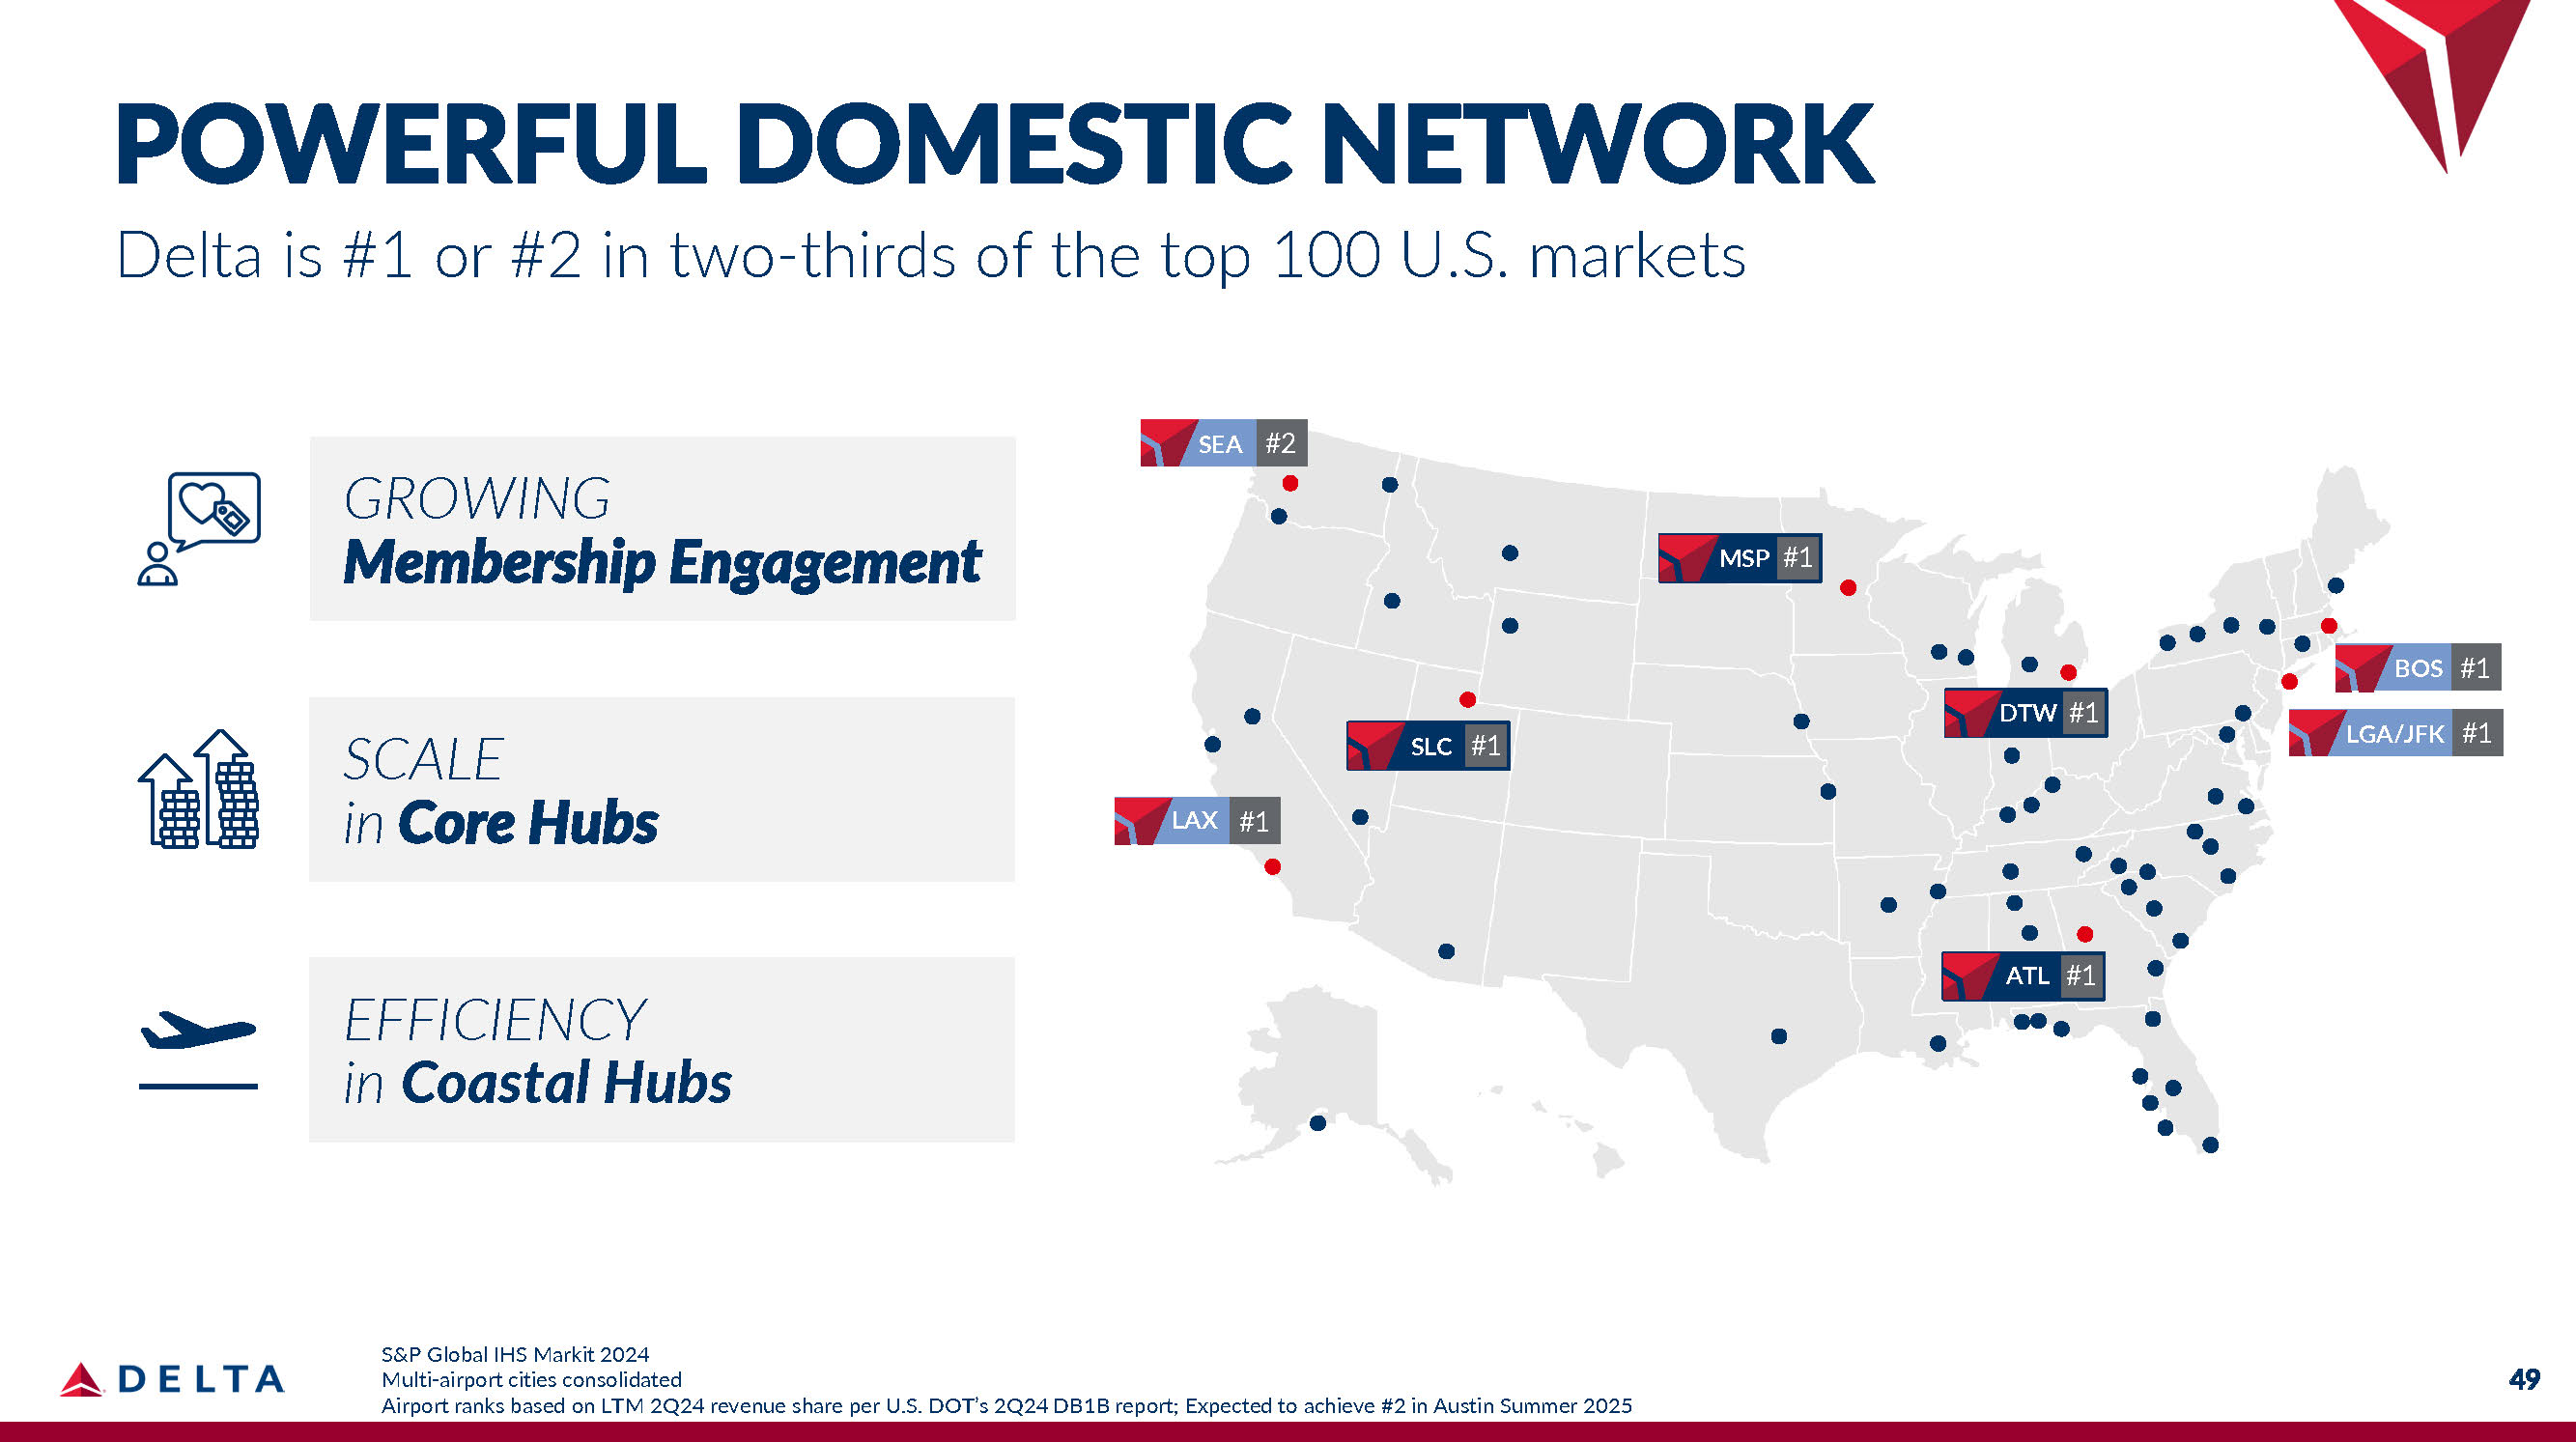
49 S&P Global IHS Markit 2024 Multi - airport cities consolidated Airport ranks based on LTM 2Q24 revenue share per U.S. DOT’s 2Q24 DB1B report; Expected to achieve #2 in Austin Summer 2025 SCALE in Core Hubs EFFICIENCY in Coastal Hubs GROWING Membership Engagement BOS LAX #1 SEA #2 SLC #1 MSP #1 DTW #1 BOS #1 LGA/JFK #1 ATL #1 POWERFUL DOMESTIC NETWORK Delta is #1 or #2 in two - thirds of the top 100 U.S. markets

MEX #1 BOG #2 GRU #1 LIM #1 SCL #1 CDG #1 AMS #1 LHR #2 ICN #1 PVG #1 PARTNER JVs UNLOCK COMMERCIAL VALUE & CREATE A SEAMLESS CUSTOMER EXPERIENCE LEADING GLOBAL NETWORK & PARTNERSHIPS Powerful domestic network creates strong foundation for international growth 50 Ranking defined as combined Delta and JV / non - JV partners November 2024 total seats per Diio
Delta sometimes uses information ("non - GAAP financial measures") that is derived from the Consolidated Financial Statements, but that is not presented in accordance with accounting principles generally accepted in the U.S. (“GAAP”). Under the U.S. Securities and Exchange Commission rules, non - GAAP financial measures may be considered in addition to results prepared in accordance with GAAP, but should not be considered a substitute for or superior to GAAP results. The following tables show reconciliations of non - GAAP financial measures used in this presentation to the most directly comparable GAAP financial measures. Reconciliations may not calculate due to rounding. Certain of these reconciliations reflect modifications to the methodologies previously presented as more completely described in Delta's earnings release for the September 2024 quarter. Delta is not able to reconcile certain forward looking non - GAAP financial measures used in this presentation without unreasonable effort because the adjusting items such as those used in the following reconciliations will not be known until the end of the indicated future periods and could be significant. Adjustments. The following reconciliations include certain adjustments to GAAP measures that are made to provide comparability between the reported periods, if applicable, and for the reasons indicated below: MTM adjustments and settlements on hedges. Mark - to - market ("MTM") adjustments are defined as fair value changes recorded in periods other than the settlement period. MTM fair value changes are not necessarily indicative of the actual settlement value of the underlying hedge in the contract settlement period. Settlements represent cash received or paid on hedge contracts settled during the applicable period. Third - party refinery sales. Refinery sales to third parties, and related expenses, are not related to our airline segment. Excluding these sales therefore provides a more meaningful comparison of our airline operations to the rest of the airline industry. One - time pilot agreement expenses. In the March 2023 quarter, Delta pilots ratified a new four - year Pilot Working Agreement effective January 1, 2023. The agreement included a provision for a one - time payment made upon ratification in the March 2023 quarter of $735 million. Additionally, we recorded adjustments to other benefit - related items of approximately $130 million. Adjusting for these expenses allows investors to better understand and analyze our core cost performance. Restructuring charges. During 2020, we recorded restructuring charges for items such as fleet impairments and voluntary early retirement and separation programs following strategic business decisions in response to the COVID - 19 pandemic. During 2022, we recognized adjustments to certain of those restructuring charges, representing changes in our estimates. 51 Non - GAAP Financial Measures
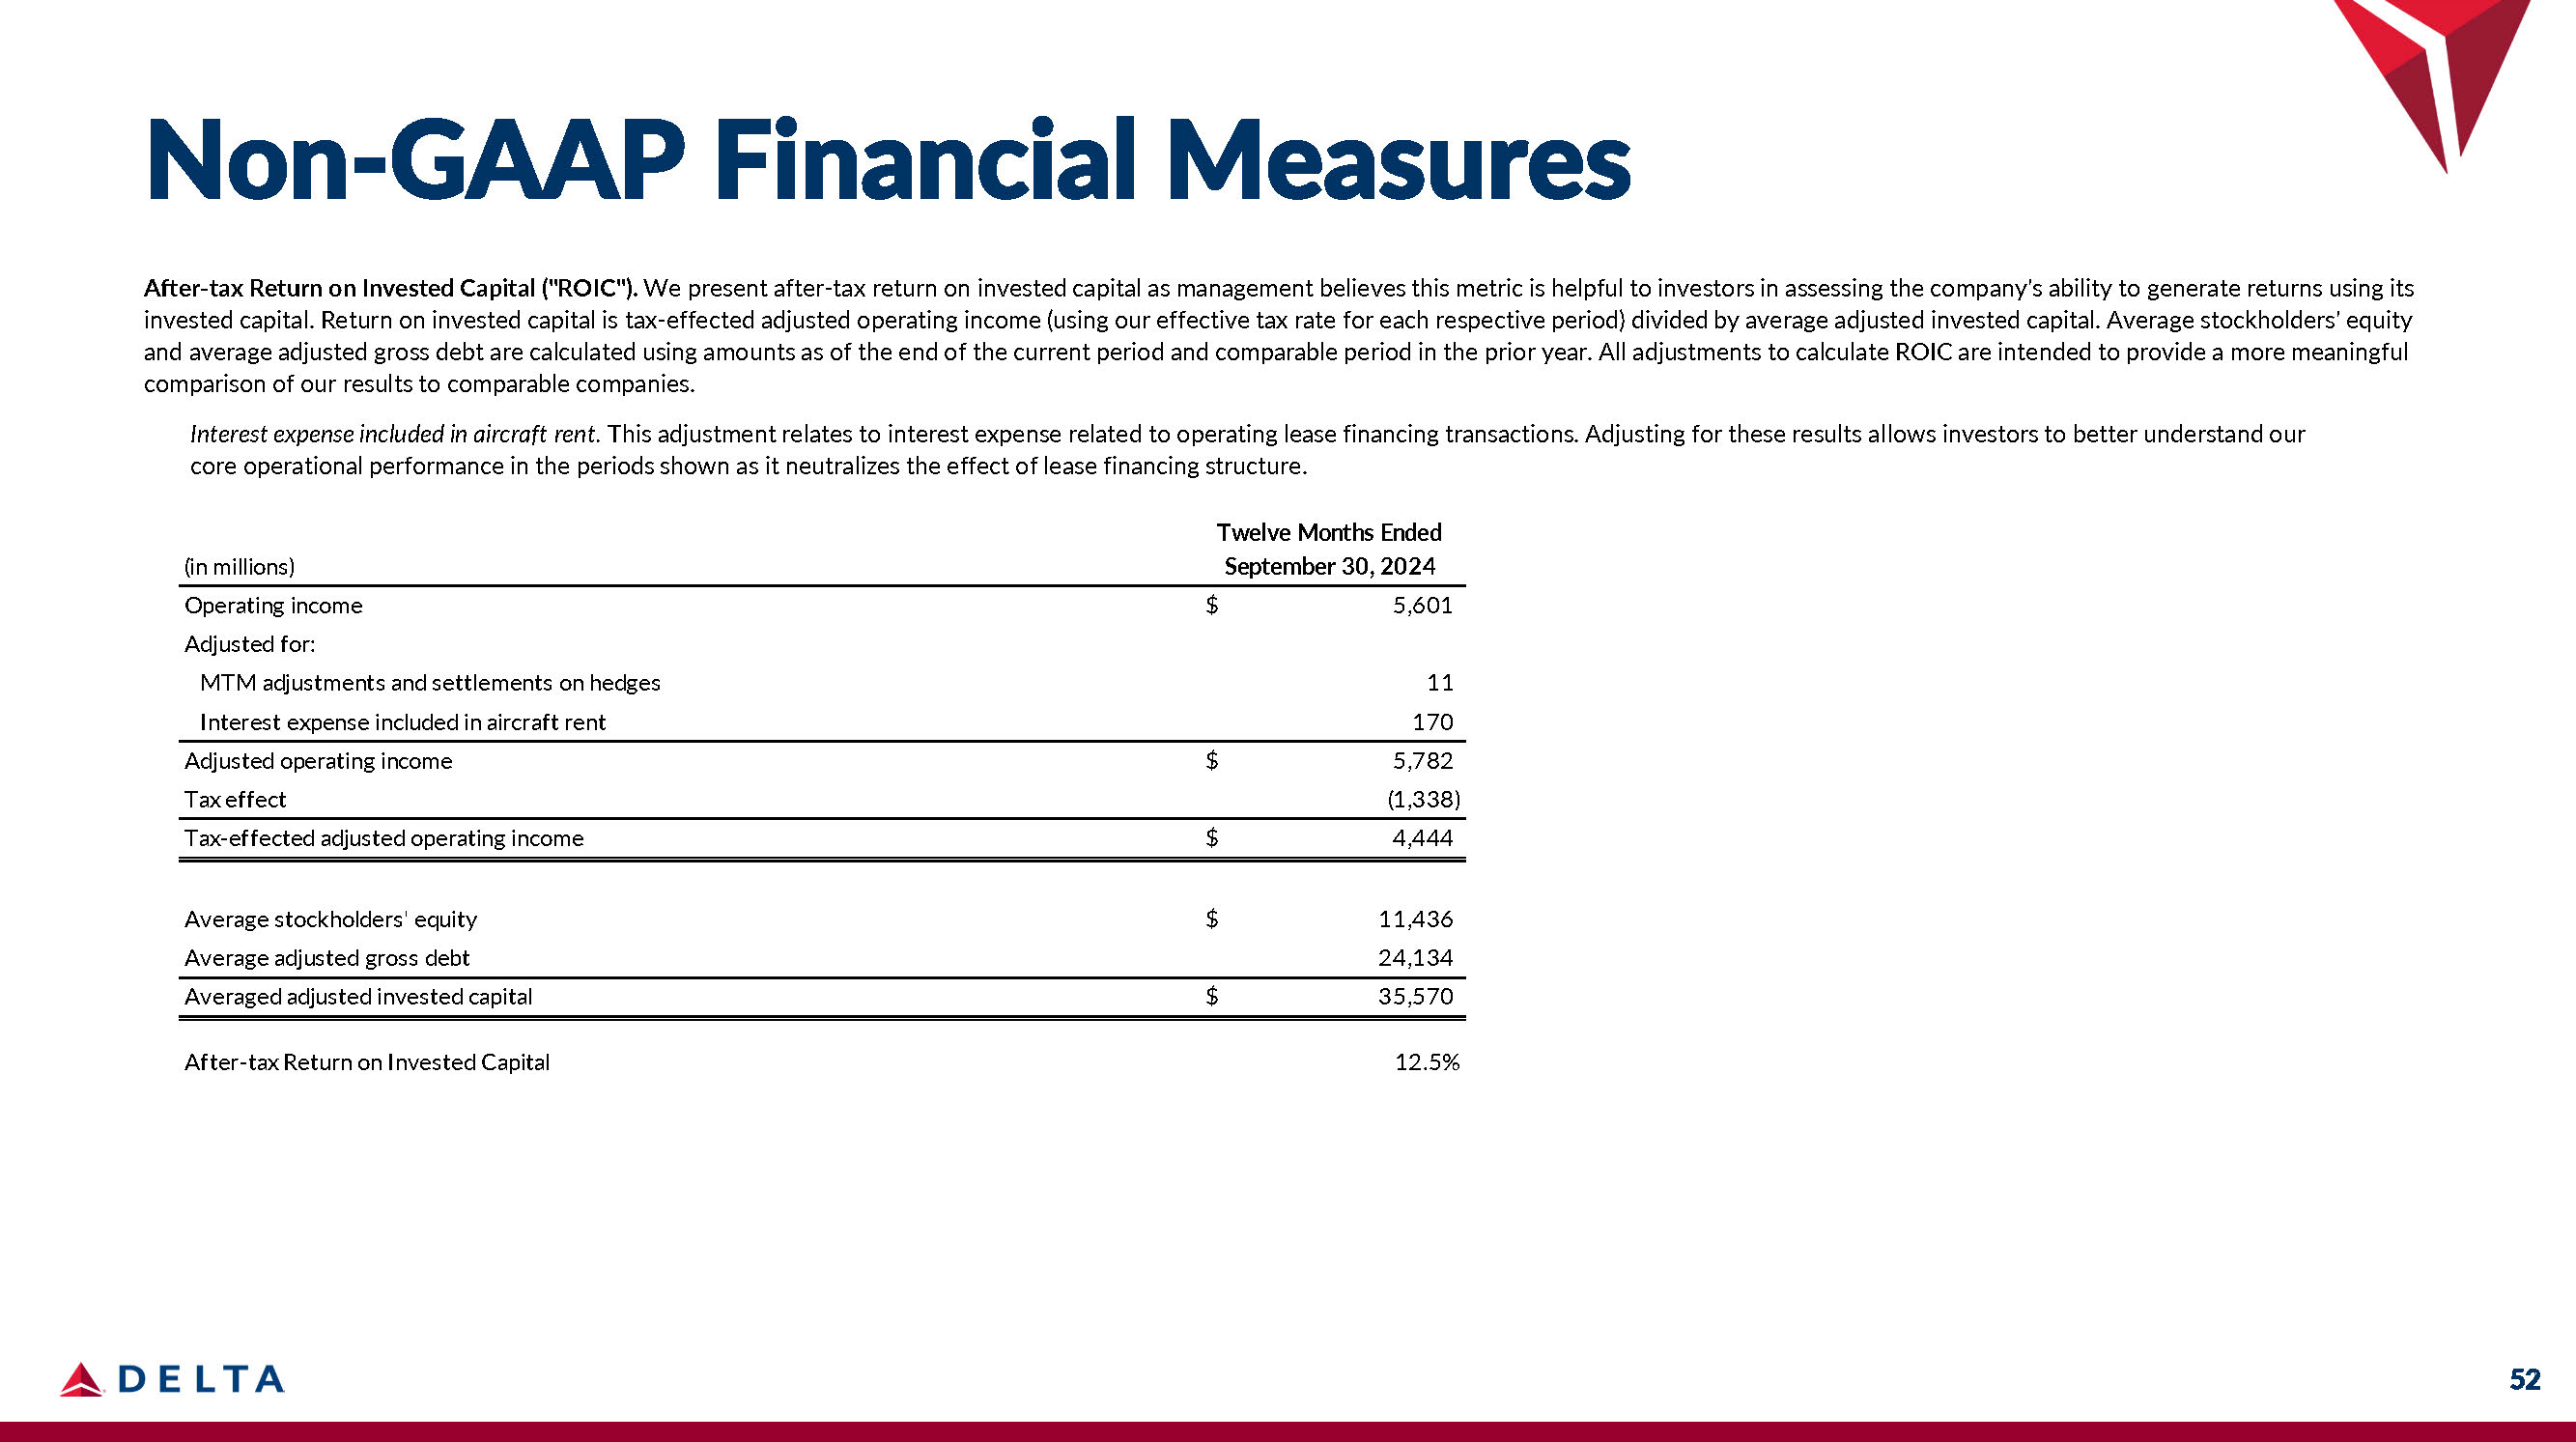
After - tax Return on Invested Capital ("ROIC") . We present after - tax return on invested capital as management believes this metric is helpful to investors in assessing the company's ability to generate r eturns using its invested capital . Return on invested capital is tax - effected adjusted operating income (using our effective tax rate for each respective period) divided by average adjusted invested capital . Average stockholders' equity and average adjusted gross debt are calculated using amounts as of the end of the current period and comparable period in the prior year . All adjustments to calculate ROIC are intended to provide a more meaningful comparison of our results to comparable companies . Interest expense included in aircraft rent. This adjustment relates to interest expense related to operating lease financing transactions. Adjusting for these results allows investors to better understand our core operational performance in the periods shown as it neutralizes the effect of lease financing structure. 52 Non - GAAP Financial Measures (in millions) Twelve Months Ended September 30, 2024 5,601 11 $ Operating income Adjusted for: MTM adjustments and settlements on hedges 170 Interest expense included in aircraft rent 5,782 $ Adjusted operating income (1,338) Tax effect 4,444 $ Tax - effected adjusted operating income 11,436 $ Average stockholders' equity 24,134 Average adjusted gross debt 35,570 $ Averaged adjusted invested capital 12.5% After - tax Return on Invested Capital

Free Cash Flow. We present free cash flow because management believes this metric is helpful to investors to evaluate the company's ability to generate cash that is available for use for debt service or general corporate initiatives. Free cash flow is also used internally as a component of incentive compensation programs. Free cash flow is defined as net cash from operating activities and net cash from investing activities, adjusted for (i) net redemptions of short - term investments, (ii) strategic investments and related, (iii) net cash flows related to certain airport construction projects and other, (iv) financed aircraft acquisitions and (v) pilot agreement payment. These adjustments are made for the following reasons: Net redemptions of short - term investments. Net redemptions of short - term investments represent the net purchase and sale activity of investments and marketable securities in the period, including gains and losses. We adjust for this activity to provide investors a better understanding of the company's free cash flow generated by our operations. Strategic investments and related. Certain cash flows related to our investments in and related transactions with other airlines are included in our GAAP investing activities. We adjust for this activity because it provides a more meaningful comparison to our airline industry peers. Net cash flows related to certain airport construction projects and other. Cash flows related to certain airport construction projects are included in our GAAP operating activities and capital expenditures. We have adjusted for these items, which were primarily funded by cash restricted for airport construction, to provide investors a better understanding of the company's free cash flow and capital expenditures that are core to our operations in the periods shown. Financed aircraft acquisitions. This adjustment reflects aircraft deliveries that are leased as capital expenditures. The adjustment is based on their original contractual purchase price or an estimate of the aircraft's fair value and provides a more meaningful view of our investing activities. Pilot agreement payment. In the March 2023 quarter, Delta pilots ratified a new four - year Pilot Working Agreement effective January 1, 2023. The agreement included a provision for a one - time payment upon ratification in the March 2023 quarter of $735 million. We adjust for this item to provide investors a better understanding of our recurring free cash flow generated by our operations. 53 Non - GAAP Financial Measures Nine Months Ended September 30, 2024 2023 2022 (in billions) 6.1 $ 6.5 $ 6.4 $ Net cash provided by operating activities: (2.6) (3.1) (6.9) Net cash used in investing activities: Adjusted for: (1.1) (2.2) (0.1) Net redemptions of short - term investments - 0.2 0.7 Strategic investments and related 0.3 0.5 0.4 Net cash flows related to certain airport construction projects and other - (0.5) (0.2) Financed aircraft acquisitions - 0.7 - Pilot agreement payment 2.7 $ 2.0 $ 0.2 $ Free cash flow Cumulative free cash flow 2022 - 2024YTD of ~$5B Year Ended December 31,

Non - GAAP Financial Measures Operating Margin, adjusted Six Months Ended June 30, 2024 2018 2019 2022 2023 9.5% 9.5% 7.2% 14.1% 11.8% Operating margin Adjusted for: 0.1 (0.1) 0.1 0.0 (0.1) MTM adjustments and settlements on hedges 0.8 0.7 0.8 0.1 0.2 Third - party refinery sales - 1.5 - - - One - time pilot agreement expenses - - (0.2) - - Restructuring charges 10.4% 11.6% 7.8% 14.2% Operating margin, adjusted 11.9% Year Ended December 31, 54
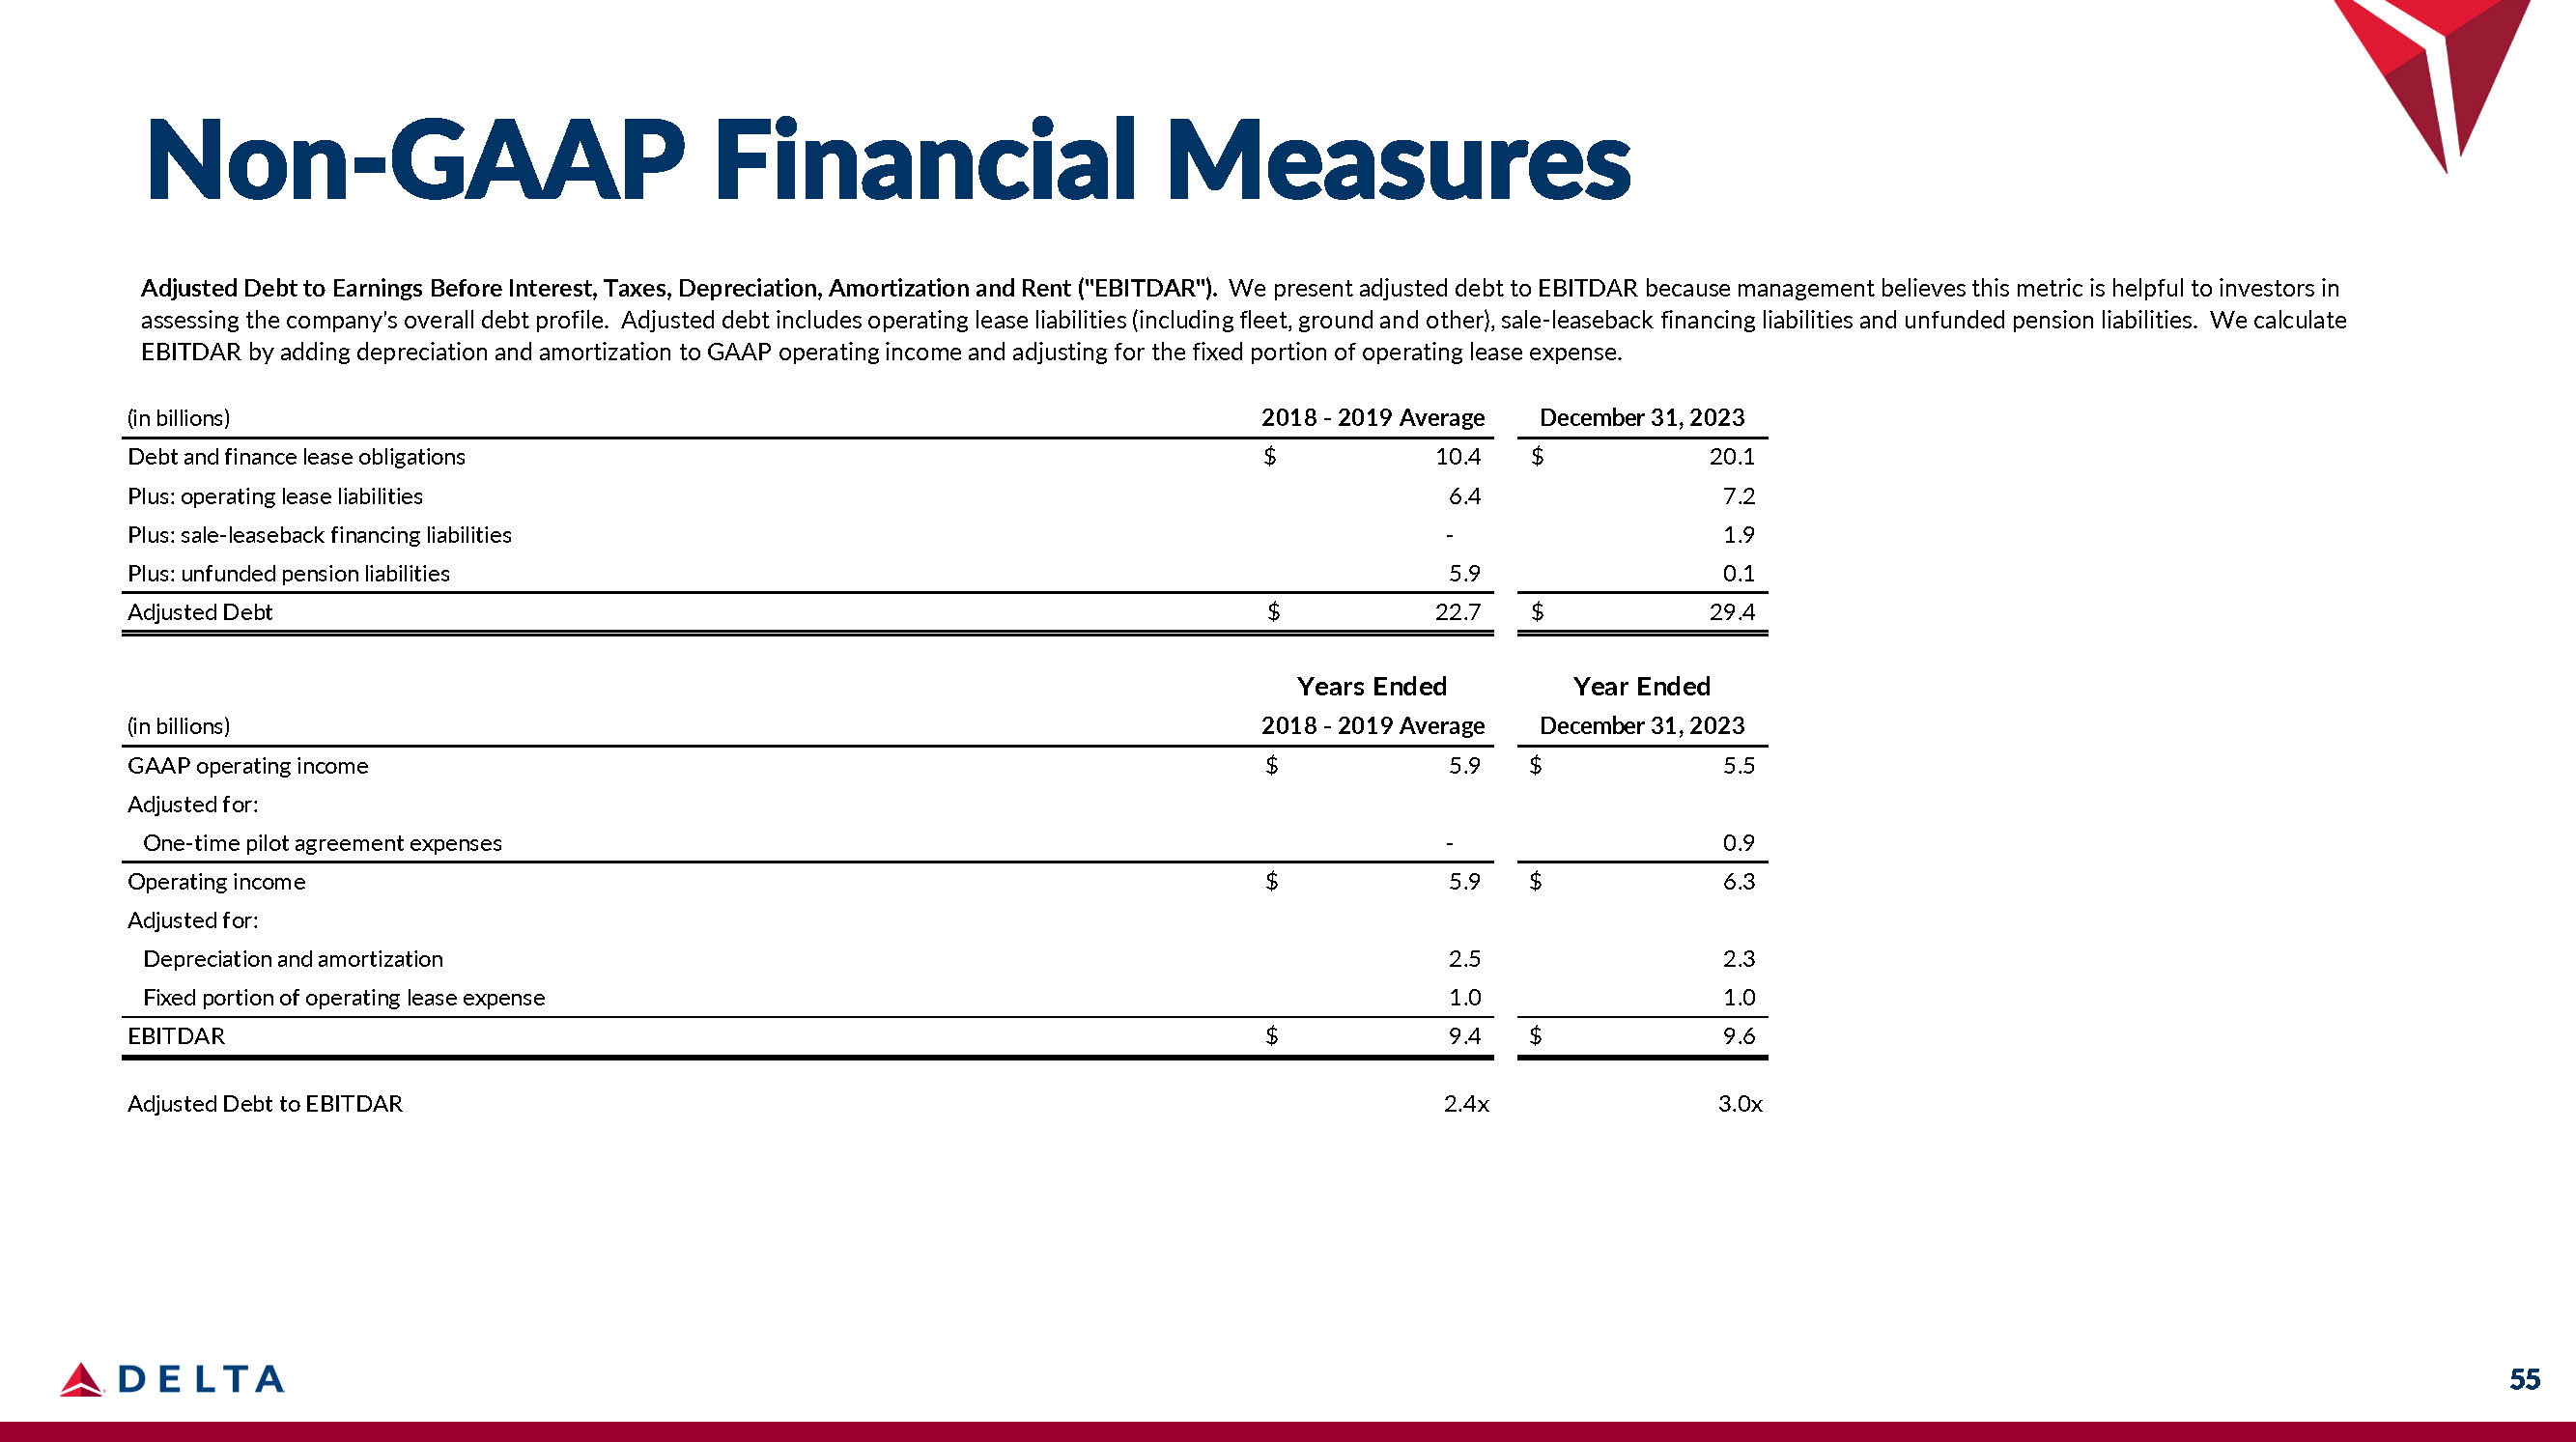
Non - GAAP Financial Measures 55 Adjusted Debt to Earnings Before Interest, Taxes, Depreciation, Amortization and Rent ("EBITDAR") . We present adjusted debt to EBITDAR because management believes this metric is helpful to investors in assessing the company's overall debt profile . Adjusted debt includes operating lease liabilities (including fleet, ground and other), sale - leaseback financing liabilities and unfunded pension liabilities . We calculate EBITDAR by adding depreciation and amortization to GAAP operating income and adjusting for the fixed portion of operating lease expense . (in billions) 2018 - 2019 Average December 31, 2023 20.1 $ 10.4 $ Debt and finance lease obligations 7.2 6.4 Plus: operating lease liabilities 1.9 - Plus: sale - leaseback financing liabilities 0.1 5.9 Plus: unfunded pension liabilities 29.4 $ 22.7 $ Adjusted Debt Year Ended December 31, 2023 Years Ended 2018 - 2019 Average (in billions) $ 5.5 0.9 $ 5.9 - GAAP operating income Adjusted for: One - time pilot agreement expenses $ 6.3 2.3 $ 5.9 2.5 Operating income Adjusted for: Depreciation and amortization 1.0 1.0 Fixed portion of operating lease expense $ 9.6 $ 9.4 EBITDAR 3.0x 2.4x Adjusted Debt to EBITDAR