QuickLinks -- Click here to rapidly navigate through this document
Exhibit 99.3
Management's
Discussion and
Analysis
For the year ended December 31, 2019
(Prepared in accordance with International
Financial Reporting Standards)

AGNICO EAGLE MINES LIMITED MANAGEMENT'S DISCUSSION AND ANALYSIS
Table of
Contents
| Executive Summary | 1 | ||||
| Strategy | 1 | ||||
| Portfolio Overview | 2 | ||||
| Key Performance Drivers | 7 | ||||
| Balance Sheet Review | 9 | ||||
| Results of Operations | 10 | ||||
| Revenues from Mining Operations | 10 | ||||
| Production Costs | 11 | ||||
| Exploration and Corporate Development Expense | 15 | ||||
| Amortization of Property, Plant and Mine Development | 16 | ||||
| General and Administrative Expense | 16 | ||||
| Finance Costs | 16 | ||||
| Impairment and Impairment Reversal | 17 | ||||
| Foreign Currency Translation Loss | 17 | ||||
| Income and Mining Taxes Expense | 17 | ||||
| Liquidity and Capital Resources | 17 | ||||
| Operating Activities | 18 | ||||
| Investing Activities | 18 | ||||
| Financing Activities | 19 | ||||
| Off-Balance Sheet Arrangements | 20 | ||||
| Contractual Obligations | 20 | ||||
| 2020 Liquidity and Capital Resources Analysis | 21 | ||||
| Quarterly Results Review | 21 | ||||
| Outlook | 22 | ||||
| Operations Outlook | 22 | ||||
| Financial Outlook | 26 | ||||
| Risk Profile | 27 | ||||
| Impact of COVID-19 | 27 | ||||
| Financial Instruments | 28 | ||||
| Interest Rates | 28 | ||||
| Commodity Prices and Foreign Currencies | 29 | ||||
| Cost Inputs | 29 | ||||
| Operational Risk | 30 | ||||
| Regulatory Risk | 30 | ||||
| Controls Evaluation | 30 | |||
| Outstanding Securities | 31 | |||
| Sustainable Development | 31 | |||
| Employee Health and Safety | 32 | |||
| Community | 32 | |||
| Environmental | 33 | |||
| Critical IFRS Accounting Policies and Accounting Estimates | 33 | |||
| Mineral Reserve Data | 34 | |||
| Non-GAAP Financial Performance Measures | 36 | |||
| Summarized Quarterly Data | 47 | |||
| Three Year Financial and Operating Summary | 53 | |||
This Management's Discussion and Analysis ("MD&A") dated March 27, 2020 of Agnico Eagle Mines Limited ("Agnico Eagle" or the "Company") should be read in conjunction with the Company's annual consolidated financial statements for the year ended December 31, 2019 that were prepared in accordance with International Financial Reporting Standards ("IFRS") as issued by the International Accounting Standards Board ("IASB") (the "Annual Financial Statements"). The annual consolidated financial statements and this MD&A are presented in United States dollars ("US dollars", "$" or "US$") and all units of measurement are expressed using the metric system unless otherwise specified. Certain information in this MD&A is presented in Canadian dollars ("C$"), Mexican pesos or European Union euros ("Euros" or "€"). Additional information relating to the Company, including the Company's Annual Information Form for the year ended December 31, 2019 (the "AIF"), is available on the Canadian Securities Administrators' (the "CSA") SEDAR website at www.sedar.com and on the United States Securities and Exchange Commission's (the "SEC") website at www.sec.gov.
NOTE TO INVESTORS CONCERNING FORWARD-LOOKING INFORMATION
Certain statements in this MD&A, referred to herein as "forward-looking statements", constitute "forward-looking information" under the provisions of Canadian provincial securities laws and constitute "forward-looking statements" within the meaning of the United States Private Securities Litigation Reform Act of 1995. These statements relate to, among other things, the Company's plans, objectives, expectations, estimates, beliefs, strategies and intentions and can generally be identified by the use of words such as "anticipate", "believe", "budget", "could", "estimate", "expect", "forecast", "likely", "may", "plan", "project", "schedule", "should", "target", "will", "would" or other variations of these terms or similar words. Forward-looking statements in this MD&A include, but are not limited to, the following:
- •
- the Company's outlook for 2020 and future periods;
- •
- statements regarding future earnings and the sensitivity of earnings to gold and other metal prices;
- •
- anticipated levels or trends for prices of gold and by-product metals mined by the Company or for exchange rates between currencies in which capital is raised, revenue is generated or expenses are incurred by the Company;
- •
- estimates of future mineral production and sales;
- •
- estimates of future costs, including mining costs, total cash costs per ounce, all-in sustaining costs per ounce, minesite costs per tonne and other costs;
- •
- estimates of future capital expenditures, exploration expenditures and other cash needs, and expectations as to the funding thereof;
- •
- statements regarding the projected exploration, development and exploitation of ore deposits, including estimates of exploration, development and production and other capital costs and estimates of the timing of such exploration, development and production or decisions with respect thereto;
- •
- estimates of mineral reserves and mineral resources and their sensitivities to gold prices and other factors, ore grades and mineral recoveries and statements regarding anticipated future exploration results;
- •
- estimates of cash flow;
- •
- estimates of mine life;
- •
- anticipated timing of events at the Company's mines, mine development projects and exploration projects;
- •
- estimates of future costs and other liabilities for environmental remediation;
- •
- statements regarding anticipated legislation and regulations, including with respect to climate change, and estimates of the impact on the Company;
- •
- other anticipated trends with respect to the Company's capital resources and results of operations;
- •
- statements regarding the Company's plans to suspend all mining activities at its operations in the Abitibi region of Quebec and the expected duration of such suspension;
- •
- statements regarding the Company's plans to reduce activities at the Meliadine mine and the Meadowbank Complex and the operations that are expected to be carried out during, and the duration of, the period of such reduced activities;
- •
- statements regarding the Company's plans to suspend exploration activities in Canada;
- •
- statements regarding the timeline for resuming normal operating levels at each of the Company's operations;
- •
- statements regarding the Company's plans with respect to the use of the $1.0 billion drawn on its US$1.2 billion unsecured revolving bank credit facility; and
- •
- other statements regarding the impact of the COVID-19 pandemic and measures taken to reduce the spread of COVID-19 on the Company's operations and overall business.
Forward-looking statements are necessarily based upon a number of factors and assumptions that, while considered reasonable by Agnico Eagle as of the date of such statements, are inherently subject to significant business, economic and competitive uncertainties and contingencies. The factors and assumptions of Agnico Eagle upon which the forward-looking statements in this MD&A are based, and which may prove to be incorrect, include the assumptions set out elsewhere in this MD&A as well as: that the duration or scope of the order by the Government of Quebec issued on March 23, 2020 to close all non-essential businesses in response to the COVID-19 outbreak is not extended or modified; that governments, the Company
or others do not take other measures in response to the COVID-19 pandemic or otherwise that, individually or in the aggregate, materially affect the Company's ability to operate its business and that there are no other significant disruptions affecting Agnico Eagle's operations, whether due to labour disruptions, supply disruptions, damage to equipment, natural or man-made occurrences, disruptions related to the COVID-19 pandemic or other health and safety issues, or the responses of governments, communities, Agnico Eagle and others to such pandemic or other issues, mining or milling issues, political changes, title issues, community protests, including by First Nations groups, or otherwise; that permitting, development, expansion and the ramp up of operations at each of Agnico Eagle's mines, mine development projects and exploration projects proceed on a basis consistent with expectations and that Agnico Eagle does not change its exploration or development plans relating to such projects; that the exchange rates between the Canadian dollar, Euro, Mexican peso and the US dollar will be approximately consistent with current levels or as set out in this MD&A; that prices for gold, silver, zinc and copper will be consistent with Agnico Eagle's expectations; that prices for key mining and construction supplies, including labour costs, remain consistent with Agnico Eagle's expectations; that production meets current expectations; that Agnico Eagle's current estimates of mineral reserves, mineral resources, mineral grades and mineral recoveries are accurate; that there are no material delays in the timing for completion of development projects; and that there are no material variations in the current tax and regulatory environments that affect Agnico Eagle.
The forward-looking statements in this MD&A reflect the Company's views as at the date of this MD&A and involve known and unknown risks, uncertainties and other factors which could cause the actual results, performance or achievements of the Company or industry results to be materially different from any future results, performance or achievements expressed or implied by such forward-looking statements. Such factors include, the risk factors set out in "Risk Factors" in our most recent Form 40-F/AIF on file with the SEC and Canadian provincial securities regulatory authorities. Given these uncertainties, readers are cautioned not to place undue reliance on these forward-looking statements, which speak only as of the date made. Except as otherwise required by law, the Company expressly disclaims any obligation or undertaking to release publicly any updates or revisions to any such statements to reflect any change in the Company's expectations or any change in events, conditions or circumstances on which any such statement is based.
Unless otherwise expressly stated, milestones set out in this MD&A have not been based on a technical report under NI 43-101 (as defined below).
Meaning of "including" and "such as": When used in this MD&A, the terms "including" and "such as" mean including and such as, without limitation.
NOTE TO INVESTORS CONCERNING ESTIMATES OF MINERAL RESERVES AND MINERAL RESOURCES
The mineral reserve and mineral resource estimates contained in this MD&A have been prepared in accordance with the CSA National Instrument 43-101 Standards of Disclosure for Mineral Projects ("NI 43-101"). These standards are similar to those used by SEC Industry Guide No. 7, as interpreted by Staff at the SEC ("Guide 7"). However, the definitions in NI 43-101 differ in certain respects from those under Guide 7. Accordingly, mineral reserve and mineral resource information contained in this MD&A may not be comparable to similar information disclosed by United States companies. Under Guide 7, mineralization may not be classified as a "reserve" unless the determination has been made that the mineralization could be economically and legally produced or extracted at the time the reserve determination is made.
For United States reporting purposes, the SEC has adopted amendments to its disclosure rules (the "SEC Modernization Rules") to modernize the mining property disclosure requirements for issuers whose securities are registered with the SEC under the United States Securities Exchange Act of 1934, as amended (the "Exchange Act"), which became effective February 25, 2019. The SEC Modernization Rules more closely align the SEC's disclosure requirements and policies for mining properties with current industry and global regulatory practices and standards, including NI 43-101, and replace the historical property disclosure requirements for mining registrants that were included in Guide 7. Issuers must begin to comply with the SEC Modernization Rules in their first fiscal year beginning on or after January 1, 2021, though Canadian issuers that report in the United States using the Multijurisdictional Disclosure System ("MJDS") may still use NI 43-101 rather than the SEC Modernization Rules when using the SEC's MJDS registration statement and annual report forms. Guide 7 will remain effective until all issuers are required to comply with the SEC Modernization Rules, at which time Guide 7 will be rescinded.
As a result of the adoption of the SEC Modernization Rules, the SEC now recognizes estimates of measured mineral resources", "indicated mineral resources" and "inferred mineral resources." In addition, the SEC has amended the definitions of "proven mineral reserves" and "probable mineral reserves" in the SEC Modernization Rules, with definitions that are substantially similar to those used in NI 43-101.
United States investors are cautioned that while the SEC now recognizes "measured mineral resources", "indicated mineral resources" and "inferred mineral resources", investors should not assume that any part or all of the mineral deposits in these categories will ever be converted into a higher category of mineral resources or into mineral reserves. These terms have a great amount of uncertainty as to their economic and legal feasibility. Accordingly, investors are cautioned not to assume that any "measured mineral resources", "indicated mineral resources", or "inferred mineral resources" that the Company reports in this management's discussion and analysis are or will be economically or legally mineable.
Further, "inferred mineral resources" have a great amount of uncertainty as to their existence and as to their economic and legal feasibility. It cannot be assumed that any part or all of an inferred mineral resource will ever be upgraded to a higher category. Under Canadian regulations, estimates of inferred mineral resources may not form the basis of feasibility or pre-feasibility studies, except in limited circumstances.Investors are cautioned not to assume that any part or all of an inferred mineral resource exists, or is or will ever be economically or legally mineable.
The mineral reserve and mineral resource data set out in this MD&A are estimates, and no assurance can be given that the anticipated tonnages and grades will be achieved or that the indicated level of recovery will be realized. The Company does not include equivalent gold ounces for by-product metals contained in mineral reserves in its calculation of contained ounces and mineral reserves are not reported as a subset of mineral resources. See "Mineral Reserves and Mineral Resources" in the AIF for additional information.
NOTE TO INVESTORS CONCERNING CERTAIN MEASURES OF PERFORMANCE
This MD&A discloses certain measures, including "total cash costs per ounce", "all-in sustaining costs per ounce", "minesite costs per tonne" and "adjusted net income" that are not recognized measures under IFRS. These measures may not be comparable to similar measures reported by other gold mining companies. For a reconciliation of these measures to the most directly comparable financial information presented in the Annual Financial Statements prepared in accordance with IFRS, and for an explanation of how management uses these measures, see Non-GAAP Financial Performance Measures in this MD&A.
The total cash costs per ounce of gold produced is reported on both a by-product basis (deducting by-product metal revenues from production costs) and co-product basis (without deducting by-product metal revenues). The total cash costs per ounce of gold produced on a by-product basis is calculated by adjusting production costs as recorded in the consolidated statements of income (loss) for by-product revenues, inventory production costs, smelting, refining and marketing charges and other adjustments, and then dividing by the number of ounces of gold produced. The total cash costs per ounce of gold produced on a co-product basis is calculated in the same manner as the total cash costs per ounce of gold produced on a by-product basis, except that no adjustment is made for by-product metal revenues. Accordingly, the calculation of total cash costs per ounce of gold produced on a co-product basis does not reflect a reduction in production costs or smelting, refining and marketing charges associated with the production and sale of by-product metals. The total cash costs per ounce of gold produced is intended to provide information about the cash-generating capabilities of the Company's mining operations. Management also uses these measures to monitor the performance of the Company's mining operations. As market prices for gold are quoted on a per ounce basis, using the total cash costs per ounce of gold produced on a by-product basis measure allows management to assess a mine's cash-generating capabilities at various gold prices. Unless otherwise specified, all references to total cash costs per ounce in this MD&A are to total cash costs per ounce reported on a by-product basis.
All-in sustaining costs per ounce is used to show the full cost of gold production from current operations. The Company calculates all-in sustaining costs per ounce of gold produced on a by-product basis as the aggregate of total cash costs per ounce on a by-product basis, sustaining capital expenditures (including capitalized exploration), general and administrative expenses (including stock options), lease payments related to sustaining assets and reclamation expenses, and then dividing by the number of ounces of gold produced. The all-in sustaining costs per ounce of gold produced on a co-product basis is calculated in the same manner as the all-in sustaining costs per ounce of gold produced on a by-product basis, except that the total cash costs per ounce on a co-product basis is used, meaning no adjustment is made for by-product metal revenues. The Company's methodology for calculating all-in sustaining costs per ounce may differ from the methodology used by other gold mining companies that disclose all-in sustaining costs per ounce. The Company may change the methodology it uses to calculate all-in sustaining costs per ounce in the future. Unless otherwise specified, all references to all-in sustaining costs per ounce in this MD&A are to all-in sustaining costs per ounce reported on a by-product basis.
Management is aware that these per ounce measures of performance can be affected by fluctuations in exchange rates and, in the case of total cash costs per ounce of gold produced on a by-product basis, by-product metal prices. Management compensates for these inherent limitations by using these measures in conjunction with minesite costs per tonne as well as other data prepared in accordance with IFRS. The World Gold Council ("WGC") is a non-regulatory market development
organization for the gold industry. Although the WGC is not a mining industry regulatory organization, it has worked closely with its member companies to develop relevant non-GAAP measures. The Company follows the guidance on all-in sustaining costs released by the WGC in November 2018. Adoption of the all-in sustaining costs metric is voluntary and, notwithstanding the Company's adoption of the WGC's guidance, all-in sustaining costs per ounce of gold produced reported by the Company may not be comparable to data reported by other gold mining companies. The Company believes that this measure provides helpful information about operating performance. However, this non-GAAP measure should be considered together with other data prepared in accordance with IFRS as it is not necessarily indicative of operating costs or cash flow measures prepared in accordance with IFRS.
Minesite costs per tonne are calculated by adjusting production costs as recorded in the consolidated statements of income (loss) for inventory production costs and other adjustments, and then dividing by tonnes of ore processed. As the total cash costs per ounce of gold produced can be affected by fluctuations in by-product metal prices and foreign exchange rates, management believes that minesite costs per tonne provide additional information regarding the performance of mining operations, eliminating the impact of varying production levels. Management also uses this measure to determine the economic viability of mining blocks. As each mining block is evaluated based on the net realizable value of each tonne mined, in order to be economically viable the estimated revenue on a per tonne basis must be in excess of the minesite costs per tonne. Management is aware that this per tonne measure of performance can be impacted by fluctuations in processing levels and compensates for this inherent limitation by using this measure in conjunction with production costs prepared in accordance with IFRS.
Adjusted net income is calculated by adjusting the net income as recorded in the consolidated statements of income for foreign currency translation gains and losses, mark-to-market adjustments, non-recurring gains and losses and unrealized gains and losses on financial instruments. Management uses adjusted net income to evaluate the underlying operating performance of the Company and to assist with the planning and forecasting of future operating results. Management believes that adjusted net income is a useful measure of performance because foreign currency translation gains and losses, mark-to-market adjustments, non-recurring gains and losses and unrealized gains and losses on financial instruments do not reflect the underlying operating performance of the Company and may not be indicative of future operating results.
Management also performs sensitivity analyses in order to quantify the effects of fluctuating exchange rates and metal prices. The Company, from time to time, also provides information as to estimated future total cash costs per ounce, all-in sustaining costs per ounce and minesite costs per tonne. Such estimates are based upon the total cash costs per ounce, all-in sustaining costs per ounce and minesite costs per tonne that the Company expects to incur to mine gold at its mines and projects and, consistent with the reconciliation of these actual costs referred to above, do not include production costs attributable to accretion expense and other asset retirement costs, which will vary over time as each project is developed and mined. It is therefore not practicable to reconcile these forward-looking non-GAAP financial measures to the most comparable IFRS measure.
Unless otherwise indicated herein all references to total cash costs per ounce and all-in sustaining costs per ounce refer to such measures as calculated on a by-product basis. For information regarding these measures as calculated on a co-product basis, please see "Non-GAAP Financial Performance Measures".
Payable production (a non-GAAP non-financial performance measure) is the quantity of mineral produced during a period contained in products that have been or will be sold by the Company, whether such products are sold during the period or held as inventories at the end of the period.
Executive Summary
Agnico Eagle is a senior Canadian gold mining company that has produced precious metals since its formation in 1972. The Company's mines are located in Canada, Mexico and Finland, with exploration and development activities in Canada, Europe, Latin America and the United States. The Company and its shareholders have full exposure to gold prices due to its long-standing policy of no forward gold sales. Agnico Eagle has declared a cash dividend every year since 1983.
Agnico Eagle earns a significant proportion of its revenue and cash flow from the production and sale of gold in both dore bar and concentrate form. The remainder of revenue and cash flow is generated by the production and sale of by-product metals, primarily silver, zinc and copper. In 2019, Agnico Eagle recorded production costs per ounce of gold of $735(i) and total cash costs per ounce of gold produced of $673(i) on a by-product basis and $745(i) on a co-product basis on payable gold production of 1,782,147 ounces. The average realized price of gold increased by 11.1% from $1,266 per ounce in 2018 to $1,406 per ounce in 2019.
Agnico Eagle's operating mines and development projects are located in what the Company believes to be politically stable countries that are supportive of the mining industry. The political stability of the regions in which Agnico Eagle operates helps to provide confidence in its current and future prospects and profitability. This is important for Agnico Eagle as it believes that many of its new mines and recently acquired mining projects have long-term mining potential.
Highlights
- •
- Continued strong operational performance with payable gold production of 1,782,147 ounces and production costs per ounce of gold of $735(i) during 2019.
- •
- Total cash costs per ounce of gold produced of $673(i) on a by-product basis and $745(i) on a co-product basis in 2019.
- •
- All-in sustaining costs per ounce of gold produced of $938(i) on a by-product basis and $1,010(i) on a co-product basis in 2019.
- •
- Proven and probable gold reserves totaled 21.6 million ounces at December 31, 2019, a 2.1% decrease compared with 22.0 million ounces at December 31, 2018 while the gold reserve grade increased by 4.8%.
- •
- As at December 31, 2019, Agnico Eagle had strong liquidity with $327.9 million in cash and cash equivalents and short-term investments along with approximately $1.2 billion in undrawn credit lines.
- •
- The Company's operations are located in mining-friendly regions that the Company believes have low political risk and long-term mining potential.
- •
- The Company continues to maintain its investment grade credit rating and has adequate financial flexibility to finance capital requirements at its mines and development projects from operating cash flow, cash and cash equivalents, short-term investments and undrawn credit lines.
- •
- The Company has strong senior management continuity as its Chief Executive Officer has over 30 years of service with the Company.
- •
- In February 2020, the Company declared a quarterly cash dividend of $0.20 per common share, an increase of $0.025 per share or approximately 14%. Agnico Eagle has now declared a cash dividend every year since 1983.
Strategy
Agnico Eagle's ability to consistently execute its business strategy has provided a solid foundation for growth.
The Company's goals are to:
- •
- Deliver high quality growth while meeting market expectations and maintaining highperformance standards in health, safety, environment and community development;
- •
- Build a strongpipeline of projects to drive future production; and
Note:
- (i)
- Excludes 85,699 ounces of payable gold production associated with the Meliadine mine, the Amaruq satellite deposit at the Meadowbank Complex and the Barnat deposit at the Canadian Malartic mine which were produced prior to the achievement of commercial production at such sites, and 5 ounces of payable gold production credited to the Company as a result of final refining reconciliation following the cessation of mining and processing operations at the Lapa mine.
- •
- Employ the bestpeople and motivate them to reach their potential.
MANAGEMENT'S DISCUSSION AND ANALYSIS AGNICO EAGLE 1
These three pillars – performance, pipeline and people – form the basis of Agnico Eagle's success and competitive advantage. By delivering on them, the Company strives to continue to build its production base and generate increased value for shareholders, while making meaningful contributions to its employees and communities.
Portfolio Overview
Northern Business
Canada – LaRonde Complex
The 100% owned LaRonde Complex in northwestern Quebec, includes the LaRonde mine, the Company's oldest mine, which achieved commercial production in 1988 and the LaRonde Zone 5 mine ("LZ5"). In 2019, the Company was granted a revision to the Certificate of Authorization at the LaRonde Complex, which allowed for the processing of ore from LZ5 through the LaRonde mill circuit. As a result, the Company now reports the operational parameters from both the LaRonde mine and the LZ5 mine on a combined basis as of the first quarter of 2020.
LaRonde Mine
The LaRonde mine extension, the portion of the mine below the 245 level, achieved commercial production in December 2011, and under current mine plans is expected to be in production through 2029.
In early December 2019, the Company saw an increase in seismicity in the West mine area outside of normal protocols, which resulted in lower anticipated gold production. In addition, as development has progressed in the West mine area, additional geological structures (faulting and fracturing) have been recognized. This information has now been incorporated into a revised ground support plan for the West mine area.
This revised plan has been developed to ensure the safety of the Company's employees, secure the higher-grade orebody to the west and preserve existing mine infrastructure in the area. To implement this plan, mining activity in the West mine area was temporarily suspended in mid-December 2019 and refocused in the East mine area.
In the West mine area, the Company is currently reinforcing ground support including installation of additional support (shotcrete, bolts and cables) in the main ramp and access points on various levels. Seismicity is expected to continue but ground support will be better adapted to manage stress levels.
The LaRonde mine's proven and probable mineral reserves were approximately 2.9 million ounces at December 31, 2019.
LaRonde Zone 5 Mine
In 2003, the Company acquired the Bousquet gold property, which adjoins the LaRonde complex to the west and hosts the Bousquet Zone 5, which the Company has renamed LZ5 due to the proximity to the LaRonde mine. Commercial production at LZ5 was achieved in June 2018 and under current mine plans, is expected to be in production through 2027.
Given the success in mining the upper portions of the LZ5 deposit (from surface to 330 metres), mining activities will be extended to 480 metres depth. The Company is also evaluating the potential to develop deeper portions of LZ5 (480 metres to 700 metres) and potentially mine portions of the neighboring Ellison property from the LZ5 underground infrastructure.
The LZ5 mine's proven and probable mineral reserves were approximately 0.7 million ounces at December 31, 2019.
Canada – Goldex Mine
The 100% owned Goldex mine in northwestern Quebec achieved commercial production from the M and E satellite zones in October 2013. The Deep 1 Zone achieved commercial production in July 2017. Production from the Deep 1 Zone is expected to extend the Goldex mine life through 2027 under current mine plans.
In 2019, mining in the South Zone continued with a total of 11 stopes mined. Stopes mined to date have shown better grades than anticipated and have confirmed dilution and recovery assumptions. The South Zone consists of quartz veins that have higher grades than those in the primary mineralized zones at Goldex. The Company continues to evaluate the potential for increased throughput from Deep 1 and the potential for additional development of Deep 2 and also the potential for increased gold production from the South Zone.
Following a successful test stope in 2018, the eastern part of the South Zone was added to the mine plan. Additional stopes were added to the mine plan for 2020 to 2026 based on the successful conversion drilling in 2019.
The Goldex mine's proven and probable mineral reserves were approximately 1.1 million ounces at December 31, 2019.
2 AGNICO EAGLE MANAGEMENT'S DISCUSSION AND ANALYSIS
Canada – Meadowbank Complex (Including the Meadowbank Mine and Amaruq Satellite Deposit)
In 2007, the Company acquired Cumberland Resources Ltd., which held a 100% interest in the Meadowbank gold project in Nunavut, Canada. Commercial production was achieved at the Meadowbank mine in March 2010. Mining operations at the Meadowbank site ceased in 2019.
The 100% owned Amaruq satellite deposit is located approximately 50 kilometres northwest of the Meadowbank mine and was identified by the Company in 2013. In 2016, the Company approved the project for development. Commercial production was achieved at the Amaruq satellite deposit in September 2019.
At December 31, 2019, the Company reported an initial underground probable mineral reserve in the Whale Tail deposit of approximately 0.6 million ounces of gold (3.3 million tonnes grading 5.43 g/t gold). Work is continuing at Amaruq to evaluate the potential for an underground operation, which could run concurrently with mining the open pit deposits.
Preliminary work suggests that there is an opportunity to selectively mine portions of the higher-grade underground deposits at Amaruq in permafrost only. This approach is expected to reduce operating and capital costs (limited heating requirements) and lower water management risk, while preserving the optionality to mine additional underground mineral reserves and/or mineral resources. The Company will continue to use a phased approach to the underground development program at Amaruq.
The Meadowbank Complex's proven and probable mineral reserves were approximately 3.3 million ounces at December 31, 2019.
Canada – Meliadine Mine
In 2010, Agnico Eagle acquired its 100% interest in the Meliadine mine project in Nunavut, Canada through its acquisition of Comaplex Minerals Corp.
In 2016, the Company's Board of Directors ("Board") approved the construction of the Meliadine mine project. Commercial production was achieved at the Meliadine mine in May 2019. In 2020, the Company approved the Phase 2 expansion which accelerates the Tiriganiaq open pits from year five of the mine life.
In the fourth quarter of 2019, the processing plant averaged approximately 3,543 tpd, with average recoveries of 94.6%. Bottlenecks at the front end of the crushing circuit and wear issues with the apron feeder hampered maximization of throughput in the mill.
In order to optimize production and lower operating costs at Meliadine, an action plan has been put in place with a primary focus on improvements to the process plant area, improving mining flexibility and water management. The plan includes:
- •
- apron feeder and chute re-engineering to correct wear issues;
- •
- filter press corrosion mitigation;
- •
- paste backfill capacity optimization;
- •
- underground maintenance continuous improvement, focus on trucks and scoops;
- •
- phase 2 expansion acceleration, development of Tiriganiaq open pits; and
- •
- saline water line discharge to sea.
The current Meliadine water management plan includes segregation of underground dewatering and surface runoff waters in specific ponds, treatment and year-round discharge to Meliadine Lake or seasonal discharge to Hudsons Bay, depending on the type of water. One of the objectives of the water management plan is to minimize the volume of water in the water containment infrastructures prior to the freshet (spring melt). In 2019, the total dissolved solids ("TDS") in the runoff water pond was higher than predicted and the volume of water that could be discharged within the prescribed TDS limit was reduced. This water was subjected to a series of tests and was deemed non-toxic. The Company is in discussion with the regulatory agencies to modify the discharge criteria and allow flexibility for the mine to manage precipitation variations and the freshet while preserving the integrity of water containment infrastructures and protecting aquatic life.
While discharge to Hudsons Bay is currently performed by trucks, the Company is investigating the possibility of installing a permanent pipeline. This is expected to reduce costs and the environmental impact of trucking. Consultations are currently underway with local stakeholders and regulatory agencies.
The Meliadine mine project had proven and probable mineral reserves of approximately 4.1 million ounces at December 31, 2019.
MANAGEMENT'S DISCUSSION AND ANALYSIS AGNICO EAGLE 3
Canada – Canadian Malartic Mine
Agnico Eagle and Yamana Gold Inc. ("Yamana") jointly acquired 100% of Osisko Mining Corporation now Canadian Malartic Corporation ("CMC"). In 2014 pursuant to a court-approved plan of arrangement under theCanada Business Corporations Act (the "Osisko Arrangement"). As a result of the Osisko Arrangement, Agnico Eagle and Yamana each indirectly own 50% of CMC and Canadian Malartic General Partnership ("CMGP"), a general partnership (the "Partnership"), which now holds the Canadian Malartic mine in northwestern Quebec.
Deep drilling east of the open pit in late 2018 resulted in the discovery of a new gold mineralized zone, located south of the East Malartic and Odyssey zones, named the East Gouldie Zone. The East Gouldie Zone has a strike length of 1,300 metres in an east-west direction, dips 60 degrees north, and extends from 700 metres to 1,900 metres depth below surface. East Gouldie is a silicified and carbonatized mineralized zone with fine disseminated pyrite developed in sheared greywacke units. There was a total of 82,379 metres (100% basis) drilled in 2019 aimed to reduce drill spacing in the central portion of the East Gouldie Zone. This drilling allowed for the estimation of initial inferred mineral resources at East Gouldie of 1.4 million ounces of gold (12.8 million tonnes grading 3.34 g/t gold) (reflecting the Company's 50% interest), as of December 31, 2019.
At the Odyssey project, the Partnership is evaluating the underground potential of several other gold deposits close to the Canadian Malartic/Barnat open pit. These include the East Malartic, Sladen, South Sladen, Sheehan, Odyssey North and Odyssey South Zones, located under and immediately east of the pit, extending approximately 2.5 kilometres to the east.
At the East Malartic Zone, the inclusion of deeper mineral resources (between 1,000 metres and 1,800 metres depth) has increased inferred mineral resources by 85% or 1.2 million ounces of gold (reflecting the Company's 50% interest), bringing total inferred mineral resources at East Malartic to 2.6 million ounces of gold (39.0 million tonnes grading 2.05 g/t gold). In addition, the East Malartic Zone has indicated mineral resources of 0.3 million ounces of gold (5.0 million tonnes grading 2.18 g/t gold) (50% interest), as of December 31, 2019.
Mineral resources at the nearby Odyssey deposit were basically unchanged between 2018 and 2019, with indicated mineral resources of 0.1 million ounces of gold (1.0 million tonnes grading 2.10 g/t gold) and inferred mineral resources of 0.8 million ounces of gold (11.7 million tonnes grading 2.22 g/t gold) (50% basis), as of December 31, 2019.
In the fourth quarter of 2019, pre-commercial production began at the Barnat extension project. Mining activities at the Barnat pit are expected to continue to ramp up during 2020.
Agnico Eagle's attributable share of proven and probable mineral reserves at the Canadian Malartic mine were approximately 2.4 million ounces at December 31, 2019.
Canada – Kirkland Lake Assets
On March 28, 2018, the Company acquired 100% of the Canadian exploration assets (the "CMC Exploration Assets") of Canadian Malartic Corporation ("CMC"), including the Kirkland Lake and Hammond Reef gold projects for an effective purchase price of $162.5 million. On the closing of the transaction, Agnico acquired all of Yamana's indirect 50% interest in the CMC Exploration Assets, giving Agnico Eagle 100% ownership. The transaction did not affect the ownership of the Canadian Malartic mine and related assets including Odyssey, East Malartic, Midway and East Amphi properties, which will continue to be jointly owned and operated by the Company and Yamana through CMC and the Partnership.
In 2019, the total exploration drilling at the Kirkland Lake project in 2019 was 40,693 metres (103 holes) comprised of 27,010 metres (73 holes) at the Upper Beaver deposit and 13,683 metres (30 holes) at the Upper Canada deposit.
The Company is still investigating various opportunities and potential synergies in terms of engineering concepts for future development of the Upper Beaver and Upper Canada deposits.
The Company is undertaking work at Upper Beaver that is expected to lead to an updated mineral resource estimate for the deposit. An increase in the mineral resources in the shallow basalts would have a significant positive impact on project economics, and could provide added flexibility for a future underground operation.
The Upper Canada deposit lies approximately six kilometres southwest of the Upper Beaver deposit, within a 300- to 400-metre wide strongly altered deformation corridor. Gold mineralization is associated with intensely altered shear zones with fine pyrite and ancillary sulphide mineralization.
Upper Beaver deposit's proven and probable mineral reserves were approximately 1.4 million ounces at December 31, 2019. No proven and probable mineral reserves have been declared for the Upper Canada or the Hammond Reef projects.
4 AGNICO EAGLE MANAGEMENT'S DISCUSSION AND ANALYSIS
Finland – Kittila Mine
The 100% owned Kittila mine in northern Finland was added to the Company's portfolio through the acquisition of Riddarhyttan Resources AB in 2005. Construction at the Kittila mine was completed in 2008 and commercial production was achieved in May 2009.
In February 2018, the Company's Board of Directors approved an expansion to increase throughput rates at Kittila to 2.0 million tonnes per annum ("mtpa") from the current rate of 1.6 mtpa. Permitting is ongoing for the increase in throughput. This expansion includes the construction of a 1,044-metre deep shaft, a processing plant expansion as well as other infrastructure and service upgrades.
The expansion project is expected to increase the efficiency of the mine and maintain or decrease operating costs while providing access to the deeper mining horizons. In addition, the shaft is expected to provide access to the mineral resources located below 1,150 metres depth, where recent exploration programs have shown promising results. The shaft and mill expansion are continuing to advance.
In the fourth quarter of 2019, Kittila expansion work continued on underground excavations for the new rock handling system and the construction of the headframe. The ultimate height of the headframe was reached on November 1, 2019, and since then work is on-going to install the required steel structures. Shaft sinking is expected to begin once final support and steel sets are installed in the first segment.
As a result of higher than expected costs in shaft sinking and in the rock handling system, the Kittila expansion project is now forecast to cost between 160 to 170 million euros (previous forecast was 160 million euros).
Exploration at the Kittila mine is focused on extending the Main and Sisar zones northward, southward and at depth in the Roura and Rimpi areas to increase the mineral reserves in the large orebody. Sisar is subparallel to and 50 to 300 metres east of the main Kittila mineralization.
Proven and probable mineral reserves at the Kittila mine were approximately 4.1 million ounces at December 31, 2019.
Southern Business
Mexico – Pinos Altos Mine
In 2006, the Company completed the acquisition of the Pinos Altos property, which was then an advanced stage exploration property in northern Mexico. Commercial production was achieved at the Pinos Altos mine in November 2009. A shaft sinking project was completed in June 2016 at the Pinos Altos mine and during 2018, the site transitioned into being a predominantly underground mining operation.
In 2019, the Company began testing samples from the Pinos Altos and La India mines relating to an ore sorting project. To-date, sorting of open pit ore from the Sinter deposit has yielded favourable preliminary results. Similar ore sorting pilot testing is being considered at the Company's other operating sites. In the fourth quarter of 2019, ore from various assets of the Company were tested at the ore sorting pilot plant at the Pinos Altos mine.
At the Cerro Colorado underground operations, mining activities in 2019 encountered an area with challenging ground conditions. To address this, the Company adjusted the mining sequence, and as a result, the mining capacity at Cerro Colorado was reduced by 75% in the third quarter of 2019. Despite efforts to mitigate the challenging ground conditions, the change in mining sequence at Cerro Colorado continued to have adverse effect on fourth quarter production as this zone was expected to provide higher grade ore feed. The Company is continuing to take measures to mitigate the challenging ground conditions at Cerro Colorado and increase the amount of ore extracted. These measures include:
- •
- decreasing the speed of the mining sequence; and
- •
- reducing stope size by 25%,
- •
- potential to add additional stopes at the Santo Nino underground;
- •
- potential to add higher grades at the Sinter deposit.
MANAGEMENT'S DISCUSSION AND ANALYSIS AGNICO EAGLE 5
Exploration at Pinos Altos is focused on the Reyna East Zone (formerly called Reyna de Plata East) in the southeast of the property and at the Cubiro deposit in the property's northwest, where the exploration ramp development is providing additional access for drilling exploration targets from underground.
The Pinos Altos mine's proven and probable mineral reserves (including satellite deposits) were approximately 1.0 million ounces at December 31, 2019.
Mexico – Creston Mascota Mine
The 100% owned Creston Mascota mine is located approximately 7.0 kilometres northwest of the Pinos Altos mine in northern Mexico. First mining activity commenced at the Creston Mascota deposit in 2010 and commercial production was achieved at the mine in March 2011. During 2017, the Bravo zone located south of the Creston Mascota facilities was added to the mine plan. Construction activities continued through 2018 and mining at the main Bravo zone began in the third quarter of 2018.
Creston Mascota open pit mineral reserves are now expected to be depleted by the end of the first half of 2020, largely due to the discovery of additional ore outside of the mineral reserve model. Gold leaching is expected to continue through the end of 2020.
The Creston Mascota mine's proven and probable mineral reserves were approximately 0.1 million ounces at December 31, 2019.
Mexico – La India Mine
Agnico Eagle acquired 100% of Grayd Resource Corporation ("Grayd") in January 2012. Grayd owned the La India project, which is located approximately 70 kilometres northwest of the Pinos Altos mine in northern Mexico. In September 2012, development and construction of the La India mine were approved by the Board and commercial production was achieved in February 2014.
In 2019, production was affected by the high clay content of the ore, which negatively affected recoveries. To mitigate this effect in the short term, belt agglomeration (adding cement to the ore delivered by conveyor from the crusher to the heap leach pad) was initiated in the third quarter of 2019, adjustments were made to the stacking sequence and irrigation rates were decreased on the leach pads to help improve percolation.
During the second half of 2019, modifications were also made to the screens and transfer chutes on the conveyors. An automatic radial stacker was acquired to improve transfer of ore to the leach pads and two agglomeration units were ordered to improve percolation and are expected to be commissioned once all the civil work has been completed.
Additional drilling is also being carried out to better define areas with higher clay content in the geological model. These improvements are expected to result in more normal production rates going forward.
The regional exploration program continues to return encouraging results at the Chipriona polymetallic sulphide target, located approximately one kilometre north of the North Zone at the La India mine. The positive drill results have led to a new indicated mineral resource and a 48% year-over-year increase of gold contained in inferred mineral resources at the Chipriona project, all at open pit depth. As of December 31, 2019, the Chipriona deposit has indicated mineral resources of 0.05 million ounces of gold, 2.1 million ounces of silver, 359 tonnes of copper and 17,000 tonnes of zinc (1.3 million tonnes grading 1.11 g/t gold, 50.99 g/t silver, 0.03% copper and 1.36% zinc) and inferred mineral resources of 0.2 million ounces of gold, 29.5 million ounces of silver, 15,400 tonnes of copper and 86,900 tonnes of zinc (10.7 million tonnes grading 0.69 g/t gold, 85.44 g/t silver, 0.14% copper and 0.81% zinc).
The La India mine's proven and probable mineral reserves (including satellite deposits) were approximately 0.5 million ounces at December 31, 2019.
Mexico – Santa Gertrudis Project
In November 2017, the Company acquired its 100% interest in the Santa Gertrudis property which is located approximately 180 kilometers north of Hermosillo in Sonora, Mexico.
The property was the site of historic heap leach operations that produced approximately 0.6 million ounces of gold at a grade of 2.10 g/t gold between 1991 and 2000. The project also has a substantial surface infrastructure already in place including pre-stripped pits, haul roads, water sources and buildings.
6 AGNICO EAGLE MANAGEMENT'S DISCUSSION AND ANALYSIS
Extensive drilling in 2019 has led to initial indicated mineral resources of 0.1 million ounces of gold (5.1 million tonnes grading 0.64 g/t gold) at open pit depth, and an increased inferred mineral resource of 1.2 million ounces of gold (22.1 million tonnes grading 1.64 g/t gold) mainly at open pit depth, as of December 31, 2019.
The full-year 2019 exploration program at Santa Gertrudis totaled 143 holes (19,352 metres in Amelia and 23,426 metres in the rest of the project), compared with an initial budget of 29,000 metres of drilling. The focus of the program was on mineral resource expansion and refining the understanding of new targets within the Trinidad Zone.
Amelia is one of three deposits that comprise the Trinidad Zone and is the site of a previously operating open-pit gold mine. High-grade gold mineralization can be found in multiple parallel structures that commonly correspond to lithological contacts. The Amelia deposit has been extended 100 metres to an east-west strike length of approximately 900 metres and dips steeply to the north; it includes an ore shoot on the west side that plunges steeply to the east. Most of the open pit (oxide) material lies between surface and 100 metres depth, while the underground material reaches below the open pit mineral resources to a depth of approximately 350 metres, but recent drilling has intersected an extension of the mineralization at 677 metres below surface. The Amelia deposit remains open along strike and at depth. The Company has updated the inferred mineral resources at Amelia to 1.6 million tonnes grading 1.38 g/t gold (0.1 million ounces of gold) at open pit depth, as well as an initial underground inferred mineral resource of 3.1 million tonnes grading 4.58 g/t gold (0.5 million ounces of gold) in the high-grade sulphide material. The Amelia mineral resources are part of the Santa Gertrudis project estimate as of December 31, 2019.
Key Performance Drivers
The key drivers of financial performance for Agnico Eagle include:
- •
- the spot price of gold, silver, zinc and copper;
- •
- production volumes;
- •
- production costs; and
- •
- US dollar/Canadian dollar, US dollar/Mexican peso and US dollar/Euro exchange rates.
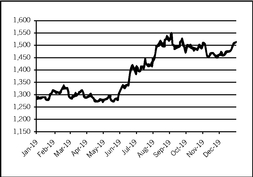
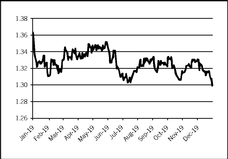
Spot Price of Gold, Silver, Zinc and Copper
| 2019 | 2018 | % Change | |||||
| High price | $1,557 | $1,366 | 14.0% | ||||
| Low price | $1,266 | $1,160 | 9.1% | ||||
| Average market price | $1,393 | $1,269 | 9.8% | ||||
| Average realized price | $1,406 | $1,266 | 11.1% | ||||
In 2019, the average market price per ounce of gold was 9.8% higher than in 2018. The Company's average realized price per ounce of gold in 2019 was 11.1% higher than in 2018.
MANAGEMENT'S DISCUSSION AND ANALYSIS AGNICO EAGLE 7
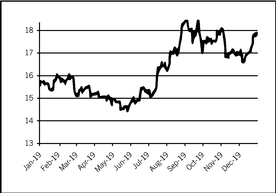
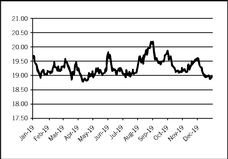
| 2019 | 2018 | % Change | |||||
| High price | $19.65 | $17.71 | 11.0% | ||||
| Low price | $14.29 | $13.89 | 2.9% | ||||
| Average market price | $16.21 | $15.71 | 3.2% | ||||
| Average realized price | $16.38 | $15.51 | 5.6% | ||||
In 2019, the average market price per ounce of silver was 3.2% higher than in 2018. The Company's average realized price per ounce of silver in 2019 was 5.6% higher than in 2018.
| ZINC ($ per tonne) | COPPER ($ per tonne) |
|---|---|
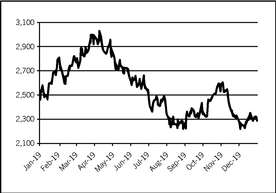 | 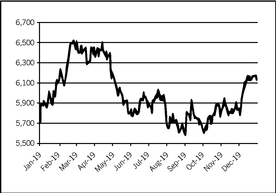 |
Agnico Eagle's average realized sales price year-over-year for zinc decreased by 14.1% and the average realized sales price for copper year-over-year decreased by 9.9%. Significant quantities of by-product metals are produced by the LaRonde mine (silver, zinc and copper) and the Pinos Altos mine (silver).
Net by-product (primarily silver, zinc and copper) revenue is treated as a reduction of production costs in calculating total cash costs per ounce of gold produced on a by-product basis and all-in sustaining costs per ounce of gold produced on a by-product basis.
The Company has never sold gold forward, allowing the Company to take full advantage of rising gold prices. Management believes that low cost production is the best protection against a decrease in gold prices.
Production Volumes and Costs
Changes in production volumes have a direct impact on the Company's financial results. Total payable gold production was 1,782,147 ounces in 2019, an increase of 9.6% compared with 1,626,669 ounces in 2018. The increase was primarily due to the achievement of commercial production at the Meliadine mine during the second quarter of 2019. Partially offsetting the overall increase in gold production was a decrease in tonnes processed at the Meadowbank Complex as the site transitioned to the Amaruq satellite deposit which achieved commercial production at the end of the third quarter of 2019.
Production costs are discussed in detail in the Results of Operations section below.
8 AGNICO EAGLE MANAGEMENT'S DISCUSSION AND ANALYSIS
Foreign Exchange Rates (Ratio to US$)
The exchange rate of the Canadian dollar, Mexican peso and Euro relative to the US dollar is an important financial driver for the Company for the following reasons:
- •
- all revenues are earned in US dollars;
- •
- a significant portion of operating costs at the Meadowbank Complex, LaRonde, LaRonde Zone 5, Goldex, Canadian Malartic, and Meliadine mines are incurred in Canadian dollars;
- •
- a significant portion of operating costs at the Pinos Altos, Creston Mascota and La India mines are incurred in Mexican pesos; and
- •
- a significant portion of operating costs at the Kittila mine are incurred in Euros.
The Company mitigates part of its foreign currency exposure by using currency hedging strategies.
| CANADIAN DOLLAR | MEXICAN PESO | EURO | ||
|---|---|---|---|---|
 |  | 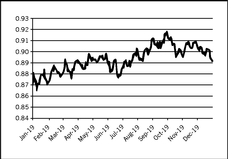 |
On average, the Canadian dollar, Euro and Mexican peso weakened relative to the US dollar in 2019 compared with 2018, decreasing costs denominated in the local currency when translated into US dollars for reporting purposes.
Balance Sheet Review
Total assets at December 31, 2019 of $8,789.9 million increased compared to December 31, 2018 total assets of $7,852.8 million. The $937.1 million increase in total assets between periods was primarily comprised of a $769.4 million increase in property, plant and mine development and an $85.9 million increase in inventories. The December 31, 2017 balance of $7,865.6 million was largely consistent with the total assets as at December 31, 2018.
Cash and cash equivalents were $321.9 million at December 31, 2019, an increase of $20.1 million compared with December 31, 2018 primarily due to an increase in cash provided by operating activities of $881.7 million and proceeds on the exercise of stock options of $140.6 million, partially offset by $882.7 million in capital expenditures and $105.4 million in dividends paid during 2019.
Current inventory balances increased by $85.9 million from $494.2 million at December 31, 2018 to $580.1 million at December 31, 2019 primarily due to a $45.5 million increase in supplies inventories and a $23.8 million increase in concentrate inventories from the ramp up at the Meliadine mine and the Amaruq satellite deposit at the Meadowbank Complex which both achieved commercial production during 2019. Non-current ore in stockpiles and on leach pads increased by $28.9 million from $116.8 million at December 31, 2018 to $145.7 million at December 31, 2019 primarily due to the the increase in the stockpiles balance not expected to be processed within 12 months at the Canadian Malartic mine, partially offset by the reclassification from current inventory at the La India mine.
Equity securities increased from $76.5 million at December 31, 2018 to $86.3 million at December 31, 2019 primarily due to $9.6 million in unrealized fair value gains and $6.0 million in new investments, partially offset by $5.7 million in disposals during 2019.
Property, plant and mine development increased by $769.4 million to $7,003.7 million at December 31, 2019 compared with December 31, 2018 due to $882.7 million in capital expenditures, primarily at the Meadowbank Complex, Kittila and Meliadine mines, and an impairment reversal at the Meliadine mine of $345.8 million in 2019. This increase was partially offset by amortization expense of $546.1 million incurred during 2019.
Total liabilities increased to $3,678.4 million at December 31, 2019 from $3,302.8 million at December 31, 2018 primarily due to the net capitalization of $114.9 million of lease obligations during 2019 in accordance with the adoption of IFRS 16 – Leases ("IFRS 16") effective January 1, 2019. Total liabilities increased to $3,302.8 million at December 31, 2018 from
MANAGEMENT'S DISCUSSION AND ANALYSIS AGNICO EAGLE 9
$2,918.6 million at December 31, 2017 primarily due to $350.0 million related to the issuance of guaranteed senior unsecured notes on April 5, 2018.
Accounts payable and accrued liabilities increased by $35.0 million between December 31, 2018 and December 31, 2019 primarily due to the timing of expenditures.
Net income taxes payable increased by $23.0 million between December 31, 2018 and December 31, 2019 primarily due to the current tax expense exceeding payments to tax authorities.
Long-term debt decreased by $357.2 million between December 31, 2018 and December 31, 2019 primarily due to $360.0 million of the Company's long-term debt that was reclassified to current liabilities.
Reclamation provision increased by $53.6 million between December 31, 2018 and December 31, 2019 primarily due to the re-measurement of the Company's reclamation provisions by applying updated expected cash flows and assumptions at the Meadowbank Complex as well as Meliadine and Kittila mines as at December 31, 2019.
Deferred income and mining tax liabilities increased by $151.4 million between December 31, 2018 and December 31, 2019 primarily due to the origination and reversal of net taxable temporary differences, including the tax effect of the Meliadine impairment reversal.
Fair Value of Derivative Financial Instruments
The Company occasionally enters into contracts to limit the risk associated with decreased by-product metal prices, increased foreign currency costs (including capital expenditures) and input costs. The contracts act as economic hedges of underlying exposures and are not held for speculative purposes. Agnico Eagle does not use complex derivative contracts to hedge exposures. The fair value of the Company's derivative financial instruments is outlined in the financial instruments note to the Company's annual consolidated financial statements.
Results of Operations
Agnico Eagle reported net income of $473.2 million, or $2.00 per share, in 2019 compared with a net loss of $326.7 million, or $1.40 per share, in 2018. In 2017, the Company reported net income of $240.8 million, or $1.05 per share. Agnico Eagle reported adjusted net income(i) of $229.4 million, or $0.97 per share, in 2019 compared with adjusted net income of $71.9 million, or $0.31 per share, in 2018. In 2017, the Company reported adjusted net income of $233.8 million, or $1.02 per share. In 2019, operating margin (revenues from mining operations less production costs) increased to $1,247.2 million from $1,030.9 million in 2018. In 2017, operating margin was $1,184.8 million.
Revenues from Mining Operations
Revenues from mining operations increased by $303.7 million, or 13.9%, to $2,494.9 million in 2019 from $2,191.2 million in 2018 primarily due to an 11.1% increase in the average realized price of gold between periods. Revenues from mining operations were $2,242.6 million in 2017.
Revenues from the Northern Business increased by $313.8 million, or 18.0%, to $2,053.0 million in 2019 from $1,739.2 million in 2018 primarily due to a higher average realized price of gold and an increase in the sales volume of gold ounces(ii). Revenues from the Southern Business decreased by $10.1 million, or 2.2%, to $441.9 million in 2019 from $452.0 million in 2018, primarily due to a decrease in the sales volume of gold ounces, partially offset by a higher average realized price of gold. Revenues from the Northern Business were $1,790.9 million and revenues from the Southern Business were $451.7 million in 2017.
Sales of precious metals (gold and silver) accounted for 98.9% of revenues from mining operations in 2019, an increase from 98.4% in 2018 and a decrease from 99.3% in 2017. The slight increase in the percentage of revenues from precious metals in 2019 compared with 2018 was primarily due to a higher average realized price of gold.
Notes:
- (i)
- Adjusted net income is a non-GAAP measure. For a discussion of the Company's use of non-GAAP measures and a reconciliation to the nearest GAAP measure, seeNon-GAAP Financial Performance Measures in this MD&A.
- (ii)
- Excludes 64,034 ounces of payable gold production sold associated with the Meliadine mine, the Amaruq satellite deposit at the Meadowbank Complex and the Barnat deposit at the Canadian Malartic mine which were sold prior to the achievement of commercial production.
10 AGNICO EAGLE MANAGEMENT'S DISCUSSION AND ANALYSIS
The table below sets out revenues from mining operations, production volumes and sales volumes by metal:
| 2019 | 2018 | 2017 | ||||||||
(thousands of United States dollars) | ||||||||||
| Revenues from mining operations: | ||||||||||
| Gold | $ | 2,393,869 | $ | 2,080,545 | $ | 2,140,890 | ||||
| Silver | 73,312 | 75,310 | 86,262 | |||||||
| Zinc | 14,711 | 14,397 | 9,177 | |||||||
| Copper | 13,000 | 20,969 | 6,275 | |||||||
| Total revenues from mining operations | $ | 2,494,892 | $ | 2,191,221 | $ | 2,242,604 | ||||
Payable production (i): | ||||||||||
| Gold (ounces) | 1,782,147 | 1,626,669 | 1,713,533 | |||||||
| Silver (thousands of ounces) | 4,310 | 4,524 | 5,016 | |||||||
| Zinc (tonnes) | 13,161 | 7,864 | 6,510 | |||||||
| Copper (tonnes) | 3,397 | 4,193 | 4,501 | |||||||
Payable metal sold: | ||||||||||
| Gold (ounces) | 1,755,334 | 1,629,785 | 1,693,774 | |||||||
| Silver (thousands of ounces) | 4,273 | 4,545 | 4,852 | |||||||
| Zinc (tonnes) | 12,292 | 8,523 | 6,316 | |||||||
| Copper (tonnes) | 3,390 | 4,195 | 4,599 | |||||||
Revenues from gold increased by $313.3 million or 15.1% in 2019 compared with 2018 primarily due to an 11.1% increase in the average realized price of gold and a 3.8% increase in the sales volume of gold(ii). The Company's average realized price of gold increased to $1,406 in 2019 compared to $1,266 in 2018, and the sales volume of gold increased to 1,691,300 ounces(ii) in 2019 compared to 1,629,785 gold ounces in 2018
Revenues from silver decreased by $2.0 million or 2.7% in 2019 compared with 2018 primarily due to a 6.0% decrease in the sales volume of silver which was partially offset by a 5.6% increase in average realized price of silver to $16.38 in 2019 from $15.51 in 2018. Revenues from zinc increased by $0.3 million or 2.2% to $14.7 million in 2019 compared with $14.4 million in 2018 primarily due to a 44.2% increase in the sales volume of zinc, partially offset by a 14.1% decrease in the average realized price of zinc between periods. Revenues from copper decreased by $8.0 million or 38.0% in 2019 compared with 2018 primarily due to a 19.2% decrease in the sales volume of copper and a 9.9% decrease in the average realized price of copper.
Production Costs
Production costs increased to $1,247.7 million in 2019 compared with $1,160.4 million in 2018 primarily due to the ramp up of the Meliadine mine which achieved commercial production in the second quarter of 2019. Partially offsetting the overall increase was an expected decrease in the mining and milling costs at the Meadowbank Complex as production at Meadowbank transitioned to the Amaruq satellite deposit, which achieved commercial production at the end of the third quarter of 2019. Production costs were $1,057.8 million in 2017.
Notes:
- (i)
- Payable production is a non-GAAP, non-financial performance measure. See "Notes to Investors Concerning Certain Measures of Performance".
- (ii)
- Excludes 64,034 ounces of payable gold production sold associated with the Meliadine mine, the Amaruq satellite deposit at the Meadowbank Complex and the Barnat deposit at the Canadian Malartic mine which were sold prior to the achievement of commercial production.
MANAGEMENT'S DISCUSSION AND ANALYSIS AGNICO EAGLE 11
The table below sets out production costs by mine:
| 2019 | 2018 | 2017 | ||||||||
| (thousands of United States dollars) | ||||||||||
| LaRonde mine | $ | 215,012 | $ | 228,294 | $ | 185,488 | ||||
| LaRonde Zone 5 mine | 41,212 | 12,991 | – | |||||||
| Lapa mine | 2,844 | 27,870 | 38,786 | |||||||
| Goldex mine | 82,533 | 78,533 | 71,015 | |||||||
| Meadowbank Complex | 180,848 | 211,147 | 224,364 | |||||||
| Meliadine mine | 142,932 | – | – | |||||||
| Canadian Malartic mine (attributable 50%) | 208,178 | 199,761 | 188,568 | |||||||
| Kittila mine | 142,517 | 157,032 | 148,272 | |||||||
| Pinos Altos mine | 130,190 | 138,362 | 108,726 | |||||||
| Creston Mascota mine | 35,801 | 37,270 | 31,490 | |||||||
| La India mine | 65,638 | 69,095 | 61,133 | |||||||
| Total production costs | $ | 1,247,705 | $ | 1,160,355 | $ | 1,057,842 | ||||
Production costs at the LaRonde mine were $215.0 million in 2019, a 5.8% decrease compared with 2018 production costs of $228.3 million primarily due to the timing of inventory sales and the weakening of the Canadian dollar relative to the US dollar between periods. During 2019, the LaRonde mine processed an average of 5,636 tonnes of ore per day compared with 5,775 tonnes of ore per day during 2018. Production costs per tonne of C$139 were the same between 2019 and 2018. Minesite costs per tonne increased to C$125 in 2019 compared with C$119 in 2018 primarily due to increased underground costs and slightly lower throughput.
Production costs at the LZ5 mine were $41.2 million in 2019, compared to $13.0 million in 2018. The LZ5 mine achieved commercial production in June 2018; therefore, the financial results for the year ended December 31, 2019 represented the first full year of production. During 2019, the LZ5 mine processed an average of 2,384 tonnes of ore per day compared with 1,940 tonnes of ore per day during 2018. The increase in throughput between periods was primarily due to mill optimization and the partial utilization of milling facilities at the LaRonde mine. Production costs per tonne decreased to C$63 in 2019 compared with C$76 in 2018 due to higher throughput and the timing of inventory sales, partially offset by higher re-handling costs. Minesite costs per tonne decreased to C$66 in 2019 compared with C$80 in 2018 primarily due to higher throughput, partially offset by higher re-handling costs.
Production costs at the Lapa mine were $2.8 million in 2019, an 89.8% decrease compared with 2018 production costs of $27.9 million due to the cessation of mining and processing operations at the site. In 2019, only residual gold ounces that remained in inventory at the end of 2018 were recovered from the mill facility and subsequently sold.
Production costs at the Goldex mine were $82.5 million in 2019, a 5.1% increase compared with 2018 production costs of $78.5 million primarily due to an increase in underground production and maintenance costs. During 2019, the Goldex mine processed an average of 7,630 tonnes of ore per day compared with 7,192 tonnes of ore per day processed during 2018. The increase in throughput between periods was primarily due to optimization of the Rail-Veyor system during the year. Production costs and minesite costs per tonne of C$39 were the same between 2019 and 2018.
Production costs at the Meadowbank Complex were $180.8 million in 2019, a 14.3% decrease compared with 2018 production costs of $211.1 million primarily due to lower open pit mining and processing costs as the mining transitioned to the Amaruq satellite deposit, the timing of inventory sales and the weakening of the Canadian dollar relative to the US dollar, partially offset by higher re-handling costs. During 2019, the Meadowbank Complex processed an average of 7,731 tonnes of ore per day compared with 8,937 tonnes of ore per day during 2018. The decrease in throughput between periods was expected as the mine transitioned to the Amaruq satellite deposit throughout the year. Production costs per tonne increased to C$101 in 2019 compared with C$83 in 2018 primarily due to lower throughput and higher contractor, mine maintenance, re-handling and long-haul costs associated with the transportation of ore from the Amaruq satellite deposit to the
12 AGNICO EAGLE MANAGEMENT'S DISCUSSION AND ANALYSIS
Meadowbank mill. The increase in production costs per tonne was partially offset by the timing of inventory sales. Minesite costs per tonne increased to C$103 in 2019 compared with C$82 in 2018 primarily due to the factors noted above.
The Meliadine mine achieved commercial production on May 14, 2019. During 2019, the Meliadine mine processed an average of 3,346 tonnes of ore per day and incurred production costs of $142.9 million. Production costs per tonne were C$244 and minesite costs per tonne were C$246 in 2019. As 2019 was Meliadine mine's first year of production, there is no comparable period in 2018.
Attributable production costs at the Canadian Malartic mine were $208.2 million in 2019, a 4.2% increase compared with 2018 production costs of $199.8 million, primarily due to higher open pit production costs and a lower amount of stripping costs being capitalized, partially offset by lower re-handling costs and the weakening of the Canadian dollar relative to the US dollar between periods. During 2019, the Canadian Malartic mine processed an average of 57,669 tonnes of ore per day on a 100% basis compared with 56,121 tonnes of ore per day in 2018. The increase in throughput between periods was primarily due to mill optimization and the availability of additional crushed ore from the portable crusher. Production costs per tonne and minesite costs per tonne increased to C$26 in 2019 compared with C$25 in 2018 primarily due to the factors noted above, other than the impact of foreign exchange.
Production costs at the Kittila mine were $142.5 million in 2019, a 9.2% decrease compared with 2018 production costs of $157.0 million primarily due to the planned 58-day mill shutdown for autoclave relining during the year, lower re-handling costs and the weakening of the Euro relative to the US dollar, partially offset by higher contractor costs related to underground development. During 2019, the Kittila mine processed an average of 4,359 tonnes of ore per day compared with the 5,005 tonnes of ore per day during 2018. The decrease in throughput was primarily due to the planned mill shutdown as noted above. Production costs per tonne decreased to €80 in 2019 compared with €73 in 2018 primarily due to lower throughput and higher underground development costs, partially offset by lower re-handling costs. Minesite costs per tonne increased to €76 in 2019 compared with €75 in 2018 due to the factors noted above.
Production costs at the Pinos Altos mine were $130.2 million in 2019, a 5.9% decrease compared with 2018 production costs of $138.4 million primarily due to lower re-handling costs and the timing of inventory sales. During 2019, the Pinos Altos mine mill processed an average of 5,214 tonnes of ore per day compared with the 5,329 tonnes of ore per day during 2018. In 2019, approximately 103,500 tonnes of ore were stacked on the Pinos Altos mine leach pad, compared with approximately 273,000 tonnes of ore stacked in 2018. The lower number of tonnes processed at the mill and leach pad was primarily due to mine sequencing. Production costs per tonne increased to $65 in 2019 compared with $62 in 2018 due to lower throughput and slightly higher underground mining costs as the mine transitioned into a predominantly underground operation, partially offset by lower re-handling costs and the timing of inventory sales. Minesite costs per tonne increased to $66 in 2019 compared with $61 in 2018 primarily due to the factors noted above, other than the timing of inventory sales.
Production costs at the Creston Mascota mine were $35.8 million in 2019, a 3.9% decrease compared with 2018 production costs of $37.3 million primarily due to the timing of inventory sales, partially offset by an increase in open pit mining costs associated with the extension of the Bravo pit. During 2019, approximately 1,066,900 tonnes of ore were processed at the Creston Mascota mine compared with approximately 1,422,400 tonnes of ore stacked in 2018. The decrease in tonnes stacked was the result of the mine approaching the end of operations. Production costs per tonne increased to $34 in 2019 compared with $26 in 2018 primarily due to lower tonnes stacked and higher open pit mining costs, partially offset by the timing of inventory sales. Minesite costs per tonne increased to $33 in 2019 compared with $27 in 2018 primarily due to the factors noted above, other than the timing of inventory sales.
Production costs at the La India mine were $65.6 million in 2019, a 5.0% decrease compared with 2018 production costs of $69.1 million primarily due to the timing of inventory sales, partially offset by increased heap leach costs, resulting from the higher consumption of reagents and higher contractor costs to facilitate recovery of gold ounces due to higher clay content contained in the ore. During 2019, the La India mine stacked approximately 5,402,400 tonnes of ore on the leach pad compared with approximately 6,127,500 tonnes of ore stacked in 2018. The decrease in tonnes stacked was primarily due to lower crushing capacity as a result of additional maintenance required to process ore with higher clay content. Production costs per tonne increased to $12 in 2019 compared with $11 in 2018 primarily due to the factors noted above. Minesite costs per tonne increased to $13 in 2019 compared with $12 in 2018 primarily due to increased heap leach costs and lower tonnes stacked.
MANAGEMENT'S DISCUSSION AND ANALYSIS AGNICO EAGLE 13
Total Production Costs by Category 2019
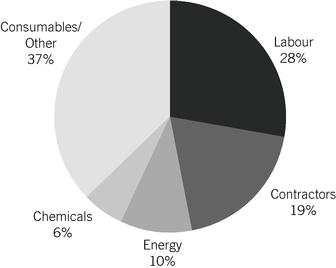
Total production costs per ounce of gold production, representing the weighted average of all of the Company's producing mines, increased to $735 in 2019 compared with $713 in 2018 and $621 in 2017. Total cash costs per ounce of gold produced on a by-product basis increased to $673 in 2019 compared with $637 in 2018 and $558 in 2017. Total cash costs per ounce of gold produced on a co-product basis increased to $745 in 2019 compared with $710 in 2018 and $637 in 2017. Set out below is an analysis of the change in total production costs per ounce and cash costs per ounce at each of the Company's mining operations.
- •
- At the LaRonde mine, total production costs per ounce of gold produced decreased to $627 in 2019 compared with $664 in 2018 primarily due to the timing of inventory sales. Total cash costs per ounce of gold produced on a by-product basis increased to $464 in 2019 compared with $445 in 2018 primarily due to an increase in treatment and refining fees associated with the processing of zinc concentrate. Total cash costs per ounce of gold produced on a co-product basis increased to $660 in 2019 compared with $634 in 2018 due to the factors noted above.
- •
- At the LZ5 mine, total production costs per ounce of gold produced decreased to $689 in 2019 compared with $698 in 2018 primarily due to an increase in gold production and the timing of inventory sales, partially offset by higher re-handling costs. Total cash costs per ounce of gold produced on a by-product basis decreased to $722 in 2019 compared with $732 in 2018 due to an increase in gold production, partially offset by higher re-handling costs. Total cash costs per ounce of gold produced on a co-product basis decreased to $725 in 2019 compared with $733 in 2018 due to the factors noted above.
- •
- At the Lapa mine, there was no production of gold in 2019 due to the cessation of mining and processing operations at the site. Therefore, no production or cash costs per ounce were reported during the year.
- •
- At the Goldex mine, total production costs per ounce of gold produced decreased to $586 in 2019 compared with $648 in 2018 primarily due to a 16.3% increase in gold production, partially offset by an increase in underground production and maintenance costs. Total cash costs per ounce of gold produced on a by-product basis decreased to $584 in 2019 compared with $646 in 2018 due to the factors noted above. Total cash costs per ounce of gold produced on a co-product basis decreased to $584 in 2019 compared with $646 in 2018 due to the factors noted above.
- •
- At the Meadowbank Complex, total production costs per ounce of gold produced increased to $1,143 in 2019 compared with $848 in 2018 primarily due to higher contractor, mine maintenance, re-handling and long-haul costs associated with the transportation of ore from the Amaruq satellite deposit to the Meadowbank mill and a 36.5% decrease in gold production, partially offset by the timing of inventory sales. Total cash costs per ounce of gold produced on a by-product basis increased to $1,152 in 2019 compared with $814 in 2018 due to the factors noted above. Total cash costs per ounce of gold produced on a co-product basis increased to $1,161 in 2019 compared with $825 in 2018 due to the factors noted above.
- •
- The Meliadine mine achieved commercial production on May 14, 2019. Total production costs per ounce of gold produced were $748 in 2019. Total cash costs per ounce of gold produced on a by-product basis were $748 and total cash costs per ounce of gold produced on a co-product basis were $750. As 2019 was Meliadine mine's first year of production, there is no comparable period in 2018.
14 AGNICO EAGLE MANAGEMENT'S DISCUSSION AND ANALYSIS
- •
- At the Canadian Malartic mine, total production costs per ounce of gold produced increased to $628 in 2019 compared with $573 in 2018 primarily due to a 4.9% decrease in the production of gold, higher open pit production costs and a lower amount of stripping costs being capitalized, partially offset by lower re-handling costs and the weakening of the Canadian dollar relative to the US dollar between periods. Total cash costs per ounce of gold produced on a by-product basis increased to $606 in 2019 compared with $559 during 2018 due to the factors noted above. Total cash costs per ounce of gold produced on a co-product basis increased to $626 in 2019 compared with $579 during 2018 due to the factors noted above.
- •
- At the Kittila mine, total production costs per ounce of gold produced decreased to $766 in 2019 compared with $831 in 2018 primarily due to lower processing costs as a result of a planned 58-day mill shutdown for autoclave relining, lower re-handling costs and the weakening of the Euro relative to the US dollar, partially offset by higher underground development costs. Total cash costs per ounce of gold produced on a by-product basis decreased to $736 in 2019 compared with $853 in 2018 due to the factors noted above. Total cash costs per ounce of gold produced on a co-product basis decreased to $737 in 2019 compared with $854 in 2018 due to the factors noted above.
- •
- At the Pinos Altos mine, total production costs per ounce of gold produced increased to $839 in 2019 compared with $764 in 2018 primarily due to a 14.3% decrease in gold production, slightly higher underground mining costs as the mine transitioned into a predominantly underground operation, partially offset by lower re-handling costs and the timing of inventory sales. Total cash costs per ounce of gold produced on a by-product basis increased to $639 in 2019 compared with $548 in 2018 primarily due to the factors noted above, other than the timing of inventory sales. Total cash costs per ounce of gold produced on a co-product basis increased to $867 in 2019 compared with $749 in 2018 due to lower by-product revenues and the factors noted above, other than the timing of inventory sales.
- •
- At the Creston Mascota mine, total production costs per ounce of gold produced decreased to $740 in 2019 compared to $928 in 2018 primarily due to a 20.4% increase in gold production and the timing of inventory sales, partially offset by an increase in open pit mining costs associated with the extension of the Bravo pit. Total cash costs per ounce of gold produced on a by-product basis decreased to $554 in 2019 compared with $841 in 2018 due to higher by-product revenues and the factors noted above, other than the timing of inventory sales. Total cash costs per ounce of gold produced on a co-product basis decreased to $754 in 2019 compared with $961 in 2018 due to the factors noted above, other than the timing of inventory sales.
- •
- At the La India mine, total production costs per ounce of gold produced increased to $799 in 2019 compared with $682 in 2018 due to an 18.9% decrease in gold production and increased heap leach costs, resulting from the higher consumption of reagents and higher contractor costs to facilitate recovery of gold ounces due to higher clay content contained in the ore, partially offset by the timing of inventory sales. Total cash costs per ounce of gold produced on a by-product basis increased to $823 in 2019 compared with $685 in 2018 due the factors noted above, other than the timing of inventory sales. Total cash costs per ounce of gold produced on a co-product basis increased to $849 in 2019 compared with $712 in 2018 due to the factors noted above, other than the timing of inventory sales.
Exploration and Corporate Development Expense
Exploration and corporate development expense decreased by 23.9% to $104.8 million in 2019 from $137.7 million in 2018. Exploration and corporate development expense was $141.5 million in 2017.
A summary of the Company's significant 2019 exploration and corporate development activities is set out below:
- •
- Exploration expenses at various mine sites decreased by 41.5% to $12.0 million in 2019 compared with 2018 primarily due to lower expensed exploration drilling at various satellite projects at the Kittila, Goldex and Pinos Altos mines.
- •
- Exploration expenses in Canada decreased by 45.2% to $25.5 million in 2019 compared with 2018 primarily due to lower expensed exploration drilling at the Amaruq satellite deposit.
- •
- Exploration expenses in Latin America decreased by 10.9% to $24.0 million in 2019 compared with 2018 primarily due to decreased exploration at the El Barqueño project, partially offset by increased exploration at the Santa Gertrudis project in Mexico.
- •
- Exploration expenses in the United States increased by 36.7% to $8.3 million in 2019 compared with 2018 primarily due to increased exploration at the Gilt Edge project in South Dakota.
- •
- Exploration expenses in Europe decreased by 49.6% to $6.2 million in 2019 compared with 2018 primarily due to decreased exploration at the Barsele project.
MANAGEMENT'S DISCUSSION AND ANALYSIS AGNICO EAGLE 15
- •
- Corporate development and project evaluation expenses increased by 13.5% to $28.8 million in 2019 compared with 2018 primarily due to increased project evaluation expenses at the Cubiro project near the Pinos Altos mine.
The table below sets out exploration expense by region and total corporate development expense:
| 2019 | 2018 | 2017 | ||||||||
| (thousands of United States dollars) | ||||||||||
| Mine sites | $ | 12,018 | $ | 20,542 | $ | 20,494 | ||||
| Canada | 25,458 | 46,420 | 58,434 | |||||||
| Latin America | 23,960 | 26,897 | 21,402 | |||||||
| United States | 8,317 | 6,082 | 3,796 | |||||||
| Europe | 6,238 | 12,368 | 14,785 | |||||||
| Corporate development and project evaluation expenses | 28,788 | 25,361 | 22,539 | |||||||
| Total exploration and corporate development expense | $ | 104,779 | $ | 137,670 | $ | 141,450 | ||||
Amortization of Property, Plant and Mine Development
Amortization of property, plant and mine development expense decreased to $546.1 million in 2019 compared with $553.9 million in 2018 and $508.7 million in 2017. The decrease in amortization of property, plant and mine development between 2019 and 2018 was primarily due to lower tonnes of ore processed at the Meadowbank Complex as the site transitioned to the Amaruq satellite deposit, lower throughput at the Kittila mine from a planned 58-day mill shutdown for autoclave relining, lower throughput at the Pinos Altos mine from a change in the mining sequence, and an increase in the proven and probable reserves at the LaRonde mine. Partially offsetting the decrease in amortization was the ramp up of the Meliadine mine, which achieved commercial production in the second quarter of 2019.
General and Administrative Expense
General and administrative expenses decreased to $121.0 million in 2019 compared with $124.9 million in 2018 and $115.1 million in 2017 primarily due to decreased employee compensation costs.
Finance Costs
Finance costs increased to $105.1 million in 2019 compared with $96.6 million in 2018 and $78.9 million in 2017 primarily due to increased interest expense on the Company's guaranteed senior unsecured notes (the "Notes") resulting from the $350.0 million private placement of guaranteed senior unsecured notes which were issued on April 5, 2018. The outstanding principal on the Notes was $1,735.0 million at December 31, 2019 and December 31, 2018.
The table below sets out the components of finance costs:
| 2019 | 2018 | 2017 | |||||||||
| (thousands of United States dollars) | |||||||||||
| Interest on Notes | $ | 91,147 | $ | 87,100 | $ | 69,935 | |||||
| Stand-by fees on credit facilities | 5,862 | 5,811 | 5,611 | ||||||||
| Amortization of credit facilities, financing and note issuance costs | 2,800 | 2,671 | 2,566 | ||||||||
| Interest on Credit Facility | 1,270 | 310 | 42 | ||||||||
| Accretion expense on reclamation provisions | 5,715 | 7,107 | 5,234 | ||||||||
| Other interest and penalties, including interest on lease obligations | 2,336 | 1,521 | 1,920 | ||||||||
| Interest capitalized to assets under construction | (4,048 | ) | (7,953 | ) | (6,377 | ) | |||||
| Total finance costs | $ | 105,082 | $ | 96,567 | $ | 78,931 | |||||
See Note 14 in the annual consolidated financial statements for details on the Company's $1.2 billion unsecured revolving bank credit facility (the "Credit Facility") and Notes referenced above.
16 AGNICO EAGLE MANAGEMENT'S DISCUSSION AND ANALYSIS
Impairment and Impairment Reversal
As at December 31, 2019, the Company completed its goodwill impairment test and its review of indicators of potential impairment of the Company's cash generating units ("CGUs") and no impairments or indicators of potential impairments were identified. As at December 31, 2018, the Company completed its goodwill impairment test and its review of indicators of potential impairment of the Company's CGUs. As a result, the Company estimated the recoverable amounts of the Canadian Malartic mine, the La India mine and the El Barqueño project and concluded the carrying amounts exceeded the recoverable amounts. The Company recorded an impairment loss of $389.7 million comprised of $250.0 million at the Canadian Malartic mine, $39.0 million at the La India mine and $100.7 million at the El Barqueño project (see Note 24 in the annual consolidated financial statements for details). No indicators of impairment were identified for the other CGUs. As at December 31, 2017, the Company completed its goodwill impairment test and its review of indicators of potential impairment of the Company's CGUs and no impairments or indicators of potential impairments were identified.
As at December 31, 2019, the Company identified indicators of potential impairment reversal for the Company's Meliadine mine. As a result of the identification of these indicators, the Company estimated the recoverable amounts of the Meliadine mine CGU and concluded the recoverable amounts exceeded the carrying amounts. The Company recorded an impairment reversal of $345.8 million ($223.4 million net of tax) at the Meliadine mine (see Note 24 in the annual consolidated financial statements for details). Based on assessments completed by the Company, no impairment reversals were required in 2018 or 2017.
Management's estimates of recoverable amounts are subject to risk and uncertainties. Therefore, it is reasonably possible that changes could occur which may affect the recoverability of the Company's long-lived assets and goodwill. This may have a material effect on the Company's future consolidated financial statements.
Foreign Currency Translation Loss
The Company's operating results and cash flow are significantly affected by changes in the closing exchange rate between the US dollar and each of the Canadian dollar, Mexican peso and Euro as all of the Company's revenues are earned in US dollars while a significant portion of its operating and capital costs are incurred in such other currencies. During the period from January 1, 2018 through December 31, 2019, the daily US dollar closing exchange rate fluctuated between C$1.30 and C$1.36 as reported by the Bank of Canada, 18.77 Mexican pesos and 20.13 Mexican pesos as reported by the Central Bank of Mexico and €0.87 and €0.92 per US$1.00 as reported by the European Central Bank.
A foreign currency translation loss of $4.9 million was recorded in 2019 compared with a foreign currency translation loss of $2.0 million in 2018 and $13.3 million in 2017. On average, the US dollar strengthened relative to the Canadian dollar, Mexican peso and Euro in 2019 compared with 2018. The US dollar also strengthened against the Euro and weakened against the Canadian dollar and Mexican peso as at December 31, 2019, compared to December 31, 2018. The net foreign currency translation loss in 2019 was primarily due to the translation impact of the Company's net monetary liabilities denominated in Canadian dollars and Mexican pesos.
Income and Mining Taxes Expense
In 2019, the Company recorded income and mining taxes expense of $265.6 million on income before income and mining taxes of $738.7 million at an effective tax rate of 36.0%. The Company's 2019 effective tax rate was higher than the applicable statutory tax rate of 26.0% primarily due to the impact of mining taxes. In 2018, the Company recorded income and mining taxes expense of $67.6 million on a loss before income and mining taxes of $259.1 million at an effective tax rate of (26.1)%. The Company's 2018 effective tax rate was lower than the applicable statutory tax rate of 26.0% primarily due to the impact of mining taxes and the non-deductible impairment loss recorded in the consolidated statements of income (loss). In 2017, the Company recorded income and mining taxes expense of $98.5 million on income before income and mining taxes of $339.3 million at an effective tax rate of 29.0%.
Liquidity and Capital Resources
As at December 31, 2019, the Company's cash and cash equivalents and short-term investments totaled $327.9 million compared with $307.9 million as at December 31, 2018. The Company's policy is to invest excess cash in highly liquid investments of the highest credit quality to reduce risks associated with these investments. Such investments with remaining maturities of greater than three months and less than one year at the time of purchase are classified as short-term investments. Decisions regarding the length of maturities are based on cash flow requirements, rates of return and various other factors.
MANAGEMENT'S DISCUSSION AND ANALYSIS AGNICO EAGLE 17
Working capital (current assets less current liabilities) decreased to $417.9 million as at December 31, 2019 compared with $711.0 million as at December 31, 2018 primarily due to the reclassification of the $360.0 million of the Company's long-term debt to current liabilities.
Subject to various risks and uncertainties, the Company believes it will generate sufficient cash flow from operations and has adequate cash and debt facilities available to finance its current operations, contractual obligations and planned capital expenditure and exploration programs.
Operating Activities
Cash provided by operating activities increased by $276.0 million to $881.7 million in 2019 compared with 2018. The increase in cash provided by operating activities was primarily due to an 11.1% increase in the Company's average realized price of gold, a 3.8% increase in the sales volume of gold(i) and more favourable working capital changes between periods. Partially offsetting the increase in cash provided by operating activities was an increase in production costs between periods. Cash provided by operating activities was $605.7 million in 2018, $161.9 million lower than in 2017 primarily due to a decrease in the sales volume of gold and an increase in production costs between periods.Note:
- (i)
- Excludes 64,034 ounces of payable gold production sold associated with the Meliadine mine, the Amaruq satellite deposit at the Meadowbank Complex and the Barnat deposit at the Canadian Malartic mine which were sold prior to the achievement of commercial production.
Investing Activities
Cash used in investing activities decreased to $873.9 million in 2019 from $1,204.4 million in 2018. The decrease in cash used in investing activities between periods was primarily due to a $206.4 million decrease in capital expenditures and a $162.5 million decrease in acquisitions, partially offset by a $31.6 million decrease in proceeds from the sale of property, plant and mine development. Cash used in investing activities was $1,000.1 million in 2017, which included capital expenditures of $874.2 million.
In 2019, the Company invested cash of $882.7 million in projects and sustaining capital expenditures compared with $1,089.1 million in 2018. Capital expenditures in 2019 included $81.8 million at the LaRonde mine, $8.4 million at the LaRonde Zone 5 mine, $41.4 million at the Goldex mine, $267.3 million at the Meadowbank Complex, $165.4 million at the Meliadine mine, $83.1 million at the Canadian Malartic mine (the Company's attributable 50% share), $171.9 million at the Kittila mine, $39.4 million at the Pinos Altos mine, $13.9 million at the La India mine and $10.1 million at the Company's other projects. The $206.4 million decrease in capital expenditures between 2019 and 2018 was primarily due to significant expenditures that were incurred in 2018 relating to the development of the Meliadine mine in advance of commercial production which was achieved in 2019.
In 2019, the Company received net proceeds of $43.7 million from the sale of equity securities and other investments compared with $17.5 million in 2018 and $0.3 million in 2017. In 2019, the Company purchased $33.5 million of equity securities and other investments compared with $11.2 million in 2018 and $51.7 million in 2017. The Company's investments in equity securities consist primarily of investments in common shares of entities in the mining industry.
On December 18, 2019, the Company was issued (the "Issuance") 10,400,000 common share purchase warrants (the "2026 Warrants") of Orla Mining Ltd. ("Orla") in connection with, and as consideration for the funding commitments provided by the Company under a loan agreement dated December 18, 2019 between, among others, Orla and Agnico Eagle. The loan agreement relates to a five-year credit facility to provide Orla financing in a principal amount of $125.0 million. The Company's aggregate financing commitment under the credit facility is $40.0 million, of which $8.0 million was drawn down by Orla as at December 31, 2019. Each 2026 Warrant entitles the holder to acquire one Common Share at a price of $3.00 at any time prior to December 18, 2026. Following the Issuance, the Company owned 17,613,835 Common Shares, 870,250 units of 2021 Warrants and 10,400,000 units of 2026 Warrants, representing approximately 9.47% of the issued and outstanding Common Shares on a non-diluted basis and 14.64% of the issued and outstanding Common Shares on a partially-diluted basis assuming exercise of the 2021 Warrants and the 2026 Warrants held by the Company.
On June 11, 2018, the Company closed a transaction with a subsidiary of Newmont Mining Corp ("Newmont"), whereby Newmont purchased Agnico Eagle's 51% interest in the West Pequop Joint Venture and the Company's 100% interest in the Summit and PQX properties in northeastern Nevada (collectively, the "Nevada Properties"). Under the purchase and sale agreement, the Company received a cash payment of $35.0 million and was granted a 0.8% net smelter return ("NSR") royalty on the Nevada Properties held by the West Pequop Joint Venture and a 1.6% NSR on the Summit and PQX properties.
On March 28, 2018, the Company acquired 100% of the Canadian exploration assets of CMC (the "CMC Exploration Assets"), including the Kirkland Lake and Hammond Reef gold projects, by way of an asset purchase agreement (the "CMC
18 AGNICO EAGLE MANAGEMENT'S DISCUSSION AND ANALYSIS
Purchase Agreement") dated December 21, 2017. On the closing of the transactions relating to the CMC Purchase Agreement, Agnico acquired all of Yamana's indirect 50% interest in the CMC Exploration Assets, giving Agnico Eagle 100% ownership of CMC's interest in the CMC Exploration Assets. Pursuant to the CMC Purchase Agreement, the effective consideration for the CMC Exploration Assets after the distribution of the sale proceeds by CMC to its shareholders totaled $162.5 million in cash paid on closing. The acquisition was accounted for by the Company as an asset acquisition and transaction costs associated with the acquisition totaling $2.9 million were capitalized to the mining properties acquired.
On February 15, 2018, the Company completed the purchase of 1,740,500 units ("Units") of Orla Mining Ltd at a price of C$1.75 per Unit for total cash consideration of C$3.0 million. Each Unit is comprised of one common share of Orla (a "Common Share") and one-half of one common share purchase warrant of Orla (each full common share purchase warrant, a "Warrant"). Each Warrant entitles the holder to acquire one Common Share at a price of C$2.35 prior to February 15, 2021. Upon closing of the transaction, the Company held 17,613,835 Common Shares and 870,250 Warrants, representing approximately 9.86% of the issued and outstanding Common Shares on a non-diluted basis and approximately 10.3% of the issued and outstanding Common Shares on a partially-diluted basis assuming exercise of the Warrants held by the Company.
Financing Activities
Cash provided by financing activities of $10.6 million in 2019 decreased compared with cash provided by financing activities of $274.1 million in 2018 primarily due to a $350.0 million decrease in issuances of notes and a $21.4 million increase in dividends paid, partially offset by a $109.7 million increase in proceeds on the exercise of stock options between periods. Cash provided by financing activities was $329.2 million in 2017.
Net proceeds from the issuance of common shares increased to $156.1 million in 2019 from $44.7 million in 2018 which was attributable to employee stock option plan exercises, issuances under the incentive share purchase plan and the dividend reinvestment plan. Net proceeds from the issuance of common shares were $269.1 million in 2017 which was attributable to employee stock option plan exercises, issuances under the incentive share purchase plan and the dividend reinvestment plan.
In 2019, the Company paid dividends of $105.4 million ($0.55 per share) compared with $84.0 million ($0.44 per share) in 2018 and $76.1 million ($0.41 per share) in 2017. Agnico Eagle has declared a cash dividend every year since 1983. Although the Company expects to continue paying dividends, future dividends will be at the discretion of the Board and will be subject to factors such as income, financial condition and capital requirements.
Repayment of lease obligations of $15.5 million in 2019 increased compared to $3.4 million in 2018 due to the adoption of IFRS 16 on January 1, 2019 (see Note 5 in the consolidated financial statements for details). Prior to the adoption of IFRS 16, leases were classified as either finance or operating leases. Payments made under operating leases were recognized as an expense in the consolidated statements of income (loss) and through operating activities in the consolidated statements of cash flows. Upon adoption of IFRS 16, the Company applied a single recognition and measurement approach for all leases, where certain leases give rise to a right-of-use asset and a corresponding liability. The principal amount of lease payments in each period is recorded in financing activities in the consolidated statements of cash flows.
On April 5, 2018, the Company closed a $350.0 million private placement of guaranteed senior unsecured notes (the "2018 Notes"). The 2018 Notes consist of $45.0 million 4.38% Series A senior notes due 2028, $55.0 million 4.48% Series B senior notes due 2030 and $250.0 million 4.63% Series C senior notes due 2033. Upon issuance, the 2018 Notes had a weighted average maturity of 13.9 years and weighted average yield of 4.57%.
On December 14, 2018, the Company amended the Credit Facility to extend the maturity date from June 22, 2022 to June 22, 2023. As at December 31, 2019, the Company's outstanding balance under the Credit Facility was nil. Credit Facility availability is reduced by outstanding letters of credit, amounting to nil as at December 31, 2019. As at December 31, 2019, $1,200.0 million was available for future drawdown under the Credit Facility.
On May 5, 2017, the Company agreed to a $300.0 million private placement of guaranteed senior unsecured notes (the "2017 Notes") which issuance closed on June 29, 2017. Upon issuance, the 2017 Notes had a weighted average maturity of 10.9 years and weighted average yield of 4.67%. Proceeds from the 2017 Notes were used for working capital and general corporate purposes.
On April 7, 2017, the Company repaid $115.0 million of the $600.0 million guaranteed senior unsecured notes that were issued on April 7, 2010 (the "2010 Notes"). As at December 31, 2019, the principal amount of the 2010 Notes that remained outstanding was $485.0 million.
On June 29, 2016, the Company entered into a standby letter of credit facility with a financial institution providing for a C$100.0 million uncommitted letter of credit facility (the "Third LC Facility"). Letters of credit issued under The Third LC
MANAGEMENT'S DISCUSSION AND ANALYSIS AGNICO EAGLE 19
Facility may be used to support the reclamation obligations or non-financial or performance obligations of the Company or its subsidiaries. The obligations of the Company under the Third LC Facility are guaranteed by certain of its subsidiaries. As at December 31, 2019, the aggregate undrawn face amount of letters of credit under the Third LC Facility was $61.9 million.
On September 23, 2015, the Company entered into a standby letter of credit facility with a financial institution providing for a C$150.0 million uncommitted letter of credit facility (as amended, the "Second LC Facility"). The Second LC Facility may be used by the Company to support the reclamation obligations of the Company, its subsidiaries or any entity in which the Company has a direct or indirect interest or the performance obligations (other than with respect to indebtedness for borrowed money) of the Company, its subsidiaries or any entity in which the Company has a direct or indirect interest that are not directly related to reclamation obligations. Payment and performance of the Company's obligations under the Second LC Facility are supported by an account performance security guarantee issued by Export Development Canada in favour of the lender. As at December 31, 2019, the aggregate undrawn face amount of letters of credit under the Second LC Facility is $104.1 million.
On July 31, 2015, the Company amended its credit agreement with a financial institution relating to its uncommitted letter of credit facility (as amended, the "First LC Facility" and together with the Second LC Facility and the Third LC Facility, the "LC Facilities"). Effective November 5, 2013, the amount available under the First LC Facility increased from C$175.0 million to C$200.0 million. Effective September 28, 2015, the amount available under the First LC Facility was increased to C$250.0 million. Effective September 27, 2016, the amount available under the First LC Facility was increased to C$350.0 million.The obligations of the Company under the First LC Facility are guaranteed by certain of its subsidiaries. The First LC Facility may be used to support the reclamation obligations or non-financial or performance obligations of the Company or its subsidiaries. As at December 31, 2019, the aggregate undrawn face amount of letters of credit under the Second LC Facility is $194.4 million.
The Company was in compliance with all covenants contained in the Credit Facility, the LC Facilities and the Notes as at December 31, 2019.
Off-Balance Sheet Arrangements
The Company's off-balance sheet arrangements as at December 31, 2019 include outstanding letters of credit for environmental and site restoration costs, custom credits, government grants and other general corporate purposes of $420.6 million under the Credit Facility and the LC Facilities (see Note 28 to the consolidated financial statements). If the Company were to terminate these off-balance sheet arrangements, the Company's liquidity position (as outlined in the table below) is sufficient to satisfy any related penalties or obligations.
Contractual Obligations
Agnico Eagle's contractual obligations as at December 31, 2019 are set out below:
| Total | 2020 | 2021-2022 | 2023-2024 | Thereafter | ||||||||||||
| (millions of United States dollars) | ||||||||||||||||
| Reclamation provisions(i) | $ | 503.3 | $ | 12.5 | $ | 23.1 | $ | 26.4 | $ | 441.3 | ||||||
| Contractual commitments(ii) | 188.4 | 166.5 | 11.6 | 5.0 | 5.3 | |||||||||||
| Pension obligations(iii) | 39.8 | 1.4 | 4.4 | 4.2 | 29.8 | |||||||||||
| Lease obligations | 129.6 | 16.6 | 31.2 | 19.2 | 62.6 | |||||||||||
| Long-term debt – principal(iv) | 1,735.0 | 360.0 | 225.0 | 200.0 | 950.0 | |||||||||||
| Long-term debt – interest(iv) | 485.5 | 73.1 | 125.9 | 98.7 | 187.8 | |||||||||||
| Total(v) | $ | 3,081.6 | $ | 630.1 | $ | 421.2 | $ | 353.5 | $ | 1,676.8 | ||||||
Notes:
- (i)
- Mining operations are subject to environmental regulations that require companies to reclaim and remediate land disturbed by mining operations. The Company has submitted closure plans to the appropriate governmental agencies which estimate the nature, extent and costs of reclamation for each of its mining properties. Expected reclamation cash flows are presented above on an undiscounted basis. Reclamation provisions recorded in the Company's consolidated financial statements are measured at the expected value of future cash flows discounted to their present value using a risk-free interest rate.
- (ii)
- Purchase commitments include contractual commitments for the acquisition of property, plant and mine development. Agnico Eagle's attributable interest in the purchase commitments associated with its joint operations totaled $4.4 million as at December 31, 2019.
- (iii)
- Agnico Eagle provides defined benefit plans for certain current and former senior officers and certain employees. The benefits are generally based on the employee's years of service, age and level of compensation. The data included in this table have been actuarially determined.
- (iv)
- The Company has assumed that repayment of its long-term debt obligations will occur on each instrument's respective maturity date.
- (v)
- The Company's future operating cash flows are expected to be sufficient to satisfy its contractual obligations.
20 AGNICO EAGLE MANAGEMENT'S DISCUSSION AND ANALYSIS
2020 Liquidity and Capital Resources Analysis
The Company believes that it has sufficient capital resources to satisfy its 2020 mandatory expenditure commitments (including the contractual obligations set out above) and discretionary expenditure commitments. The following table sets out expected capital requirements and resources for 2020:
| Amount | |||
| (millions of United States dollars) | |||
| 2020 Mandatory Commitments: | |||
| Contractual obligations, including capital expenditures (see table above) | $ | 630.1 | |
| Accounts payable and accrued liabilities (as at December 31, 2019) | 345.6 | ||
| Net income taxes payable (as at December 31, 2019) | 23.9 | ||
| Total 2020 mandatory expenditure commitments | $ | 999.6 | |
2020 Discretionary Commitments: | |||
| Expected capital expenditures | $ | 678.5 | |
| Expected exploration and corporate development expenses | 129.9 | ||
| Total 2020 discretionary expenditure commitments | 808.4 | ||
| Total 2020 mandatory and discretionary expenditure commitments | $ | 1,808.0 | |
As of December 31, 2019, the Company had adequate capital resources available to satisfy its commitments, which include cash, cash equivalents and short-term investments of $327.9 million, working capital (excluding cash, cash equivalents and short-term investments) of $90.0 million and an undrawn $1.2 billion Credit Facility. In addition, the Company anticipated funding its commitments through cash provided by operating activities.
While the Company believes its capital resources will be sufficient to satisfy all 2020 commitments (mandatory and discretionary), the Company may choose to decrease certain of its discretionary expenditure commitments, which include certain capital expenditures and exploration and corporate development expenses, should unexpected financial circumstances arise in the future. The Company believes that it will continue to have sufficient capital resources available to satisfy its planned development and growth activities. SeeOutlook andRisk Profile – Impact of COVID-19 in this MD&A.
In March 2020, the Company marketed a $200.0 million private placement of guaranteed senior unsecured notes (the "2020 Notes") to a group of institutional investors. The Company expects to issue the 2020 Notes with a weighted average maturity of 11.0 years and a weighted average yield of 2.83% in April 2020. The other terms of 2020 Notes are expected to be substantially the same as the terms of the existing outstanding Notes of the Company. The Company intends to use the proceeds from 2020 Notes to repay a portion of Series B of the 2010 Notes with principal of $360.0 million due in 2020 and for general corporate purposes.
In March 2020, the Company drew down $1.0 billion on its $1.2 billion Credit Facility. The Company drew down these funds as a cautionary measure given the current uncertainty with respect to the COVID-19 pandemic and has no current plans to use the funds, although funds may be used to repay a portion of Series B of the 2010 Notes with principal of $360.0 million due in 2020.
Quarterly Results Review
For the Company's detailed 2019 and 2018 quarterly financial and operating results seeSummarized Quarterly Data in this MD&A.
Revenues from mining operations increased by 40.0% to $753.1 million in the fourth quarter of 2019 compared with $537.8 million in the fourth quarter of 2018, which was primarily due to a 20.6% higher average realized price on gold and an 18.5% increase in the sales volume of gold between periods, which was attributable to production from the Meliadine mine and the Amaruq satellite deposit at the Meadowbank Complex that achieved commercial production in May 2019 and September 2019, respectively.
MANAGEMENT'S DISCUSSION AND ANALYSIS AGNICO EAGLE 21
Production costs increased by 31.8% to $375.0 million in the fourth quarter of 2019 compared with $284.5 million in the fourth quarter of 2018 primarily due to the ramp up of the Meliadine mine and the impact of a stronger Canadian dollar relative to the US dollar between periods. In addition, production costs increased at the Meadowbank Complex due to higher contractor, mine maintenance, re-handling and long-haul trucking costs associated with the transportation of ore from the Amaruq satellite deposit.
Exploration and corporate development expenses decreased by 13.9% to $23.8 million in the fourth quarter of 2019 compared with $27.6 million in the fourth quarter of 2018 primarily due to decreased exploration drilling at Upper Beaver and Barsele projects.
Amortization of property, plant and mine development increased by 9.5% to $150.3 million in the fourth quarter of 2019 compared with $137.2 million in the fourth quarter of 2018 primarily due to the ramp up of the Meliadine mine, partially offset by lower throughput at the Meadowbank Complex due to the acceleration of planned maintenance to the milling and crushing circuits which was scheduled for 2020. Net income of $331.7 million was recorded in the fourth quarter of 2019 after income and mining taxes expense of $172.3 million compared with a net loss of $393.7 million in the fourth quarter of 2018 after income and mining taxes expense of $6.4 million.
Cash provided by operating activities increased by 83.5% to $257.5 million in the fourth quarter of 2019 compared with $140.3 million in the fourth quarter of 2018. The increase in cash provided by operating activities was primarily due to a $215.3 million increase in revenues from mining operations due to higher average realized prices of gold and silver and an increase in the sales volume of gold ounces, partially offset by a $90.5 million increase in production costs between periods.
Outlook
The following section contains "forward-looking statements" and "forward-looking information" within the meaning of applicable securities laws.The Company continues to monitor to implications of the worldwide pandemic caused by the novel strain of coronavirus known as COVID-19. The manner and extent that the pandemic, and measures taken as a result of the pandemic, will affect the Company cannot be predicted with certainty. SeeNote to Investors Concerning Forward-Looking Information andRisk Profile – Impact of COVID-19, respectively, in this MD&A for a discussion of assumptions and risks relating to such statements and information and a discussion of the certain risks facing the Company relating to the pandemic.
On March 24, 2020, the Company announced that, in response to an order by the Government of Quebec issued on March 23, 2020 (the "Order") to close all non-essential businesses, the Company will take steps to ramp down its operations in the Abitibi region of Quebec (the LaRonde Complex, the Goldex mine and the Canadian Malartic mine). The Order was part of the Quebec government's response to the COVID-19 pandemic. Each of these operations are to be placed on care and maintenance until April 13, 2020, and as requested by the Order, minimal work will take place during that time. In addition, the Company will reduce activities at the Meliadine and Meadowbank mining operations in Nunavut, which are fly-in/fly-out mining operations, currently serviced out of Mirabel and Val d'Or, Quebec. Further, the Company announced that exploration activities in Canada would also be suspended. The Company cannot provide any assurances that the Order will not be extended.
As a result of the Order, on March 24, 2020 the Company decided to withdraw its guidance for 2020 regarding expected production volumes and costs.
Operations Outlook
LaRonde Complex
In 2019, the Company was granted a revision to the Certificate of Authorization at the LaRonde Complex, which allowed for the processing of ore from LZ5 through the LaRonde mill circuit. As a result, the Company now reports the operational parameters from the LaRonde mine and the LZ5 mine on a combined basis as of the first quarter of 2020.
In early December 2019, the Company saw an increase in seismicity in the West mine area outside of normal protocols. In addition, as development has progressed in the West mine area, additional geological structures (faulting and fracturing) have been recognized. This information has now been incorporated into a revised ground support plan for the West mine area. The Company is currently reinforcing ground support including installing additional support (shotcrete, bolts and cables) in the main ramp and access points on various levels. Seismicity is expected to continue but ground support will likely be better adapted to manage stress levels.
22 AGNICO EAGLE MANAGEMENT'S DISCUSSION AND ANALYSIS
In 2020, approximately 12% of the tonnage mined at the LaRonde mine is expected from the West mine area. This tonnage increases to approximately 20% in 2021. The capital cost for additional ground support in the West mine area in 2020 is approximately $1.5 million. The increase in operating cost related to the additional support in 2020 is still being evaluated but is expected to be minimal (less than C$1.00 per tonne).
Normal mining activities in the West mine area have been delayed since December 2019. This delay is expected to result in lower gold production as gold grades are lower in the East mine area. Production and unit costs are expected to return to more normalized levels as higher grade ore is extracted from the West mine area.
Infrastructure continues to be developed to provide further access to mine the LaRonde 3 project and construction on level 308 of the East mine cooling plant is ongoing. At Zone 11-3, which is at depth in the past producing Bousquet 2 mine, development continues on the access ramp.
A development drift has been initiated west from LaRonde's level 146 to the LaRonde 11-3 project at level 149 and will have the additional benefit of allowing for underground exploration drilling into previously unexplored targets in Zone 6 and 20N. Near term exploration will include 6,000 metres of drilling targeting historic Bousquet zones, which exhibit good exploration potential between 2,000 and 3,000 metres depth, and 3,500 metres of drilling to explore Zones 6 and 20N at depth. Compilation of historic data from the whole Bousquet property will continue.
Exploration work at the LaRonde Complex is focused on conversion drilling in the LaRonde 3 project below 3,100 metres depth. The LaRonde 3 project mineral reserves and indicated mineral resources currently extend to approximately 3,380 metres depth, while the inferred mineral resources continue to down to 3,800 metres.
Goldex Mine
The Goldex Deep 1 project (the top part of the Deep Zone, between 850 and 1,200 metres depth) has been in production since July 2017. An exploration ramp that began construction in 2018 from level 120 (1,200 metres depth) continues to extend into the Deep 2 Zone (the bottom part of the Deep Zone, between 1,200 and 1,800 metres depth). The ramp reached level 130 (1,300 metres depth) at the end of 2019, and is expected to continue toward level 140 in the future.
Drilling at the Deep 2 Zone continued in the fourth quarter of 2019 and continues to focus on areas below the current mineral reserve limit of Level 130.
Meadowbank Complex
The ramp up of production activities at Amaruq continued to improve but remained slower than expected in the fourth quarter of 2019. The ramp up was impacted by delays in pit dewatering, which resulted in a smaller than expected area for mining activities. The smaller "mining footprint" limited access to certain portions of the Whale Tail deposit, resulting in lower tonnage extracted, lower grades and higher stripping costs. In addition, mining productivity was also affected by lower than expected equipment availability as well as a longer than expected transition between the new Amaruq site with regards to site installations and internal workforce movements into new positions.
An action plan has been put in place with a primary focus on improvements to water management, equipment availability, operational performance and wildlife management protocols. De-watering of Whale Tail North was completed in October 2019 following the installation of additional pumping capacity to handle the larger than expected water inflows. Construction activity as well as a grouting program to reduce water inflows at the interface between the bedrock and Whale Tail dyke were initiated to reduce the quantity of water to manage during the 2020 freshet (spring melt). These efforts have allowed access to the Whale Tail North Lake bed area and expanded the footprint of the Whale Tail pit while reducing water management risks.
Mining equipment availability and maintenance was affected by the transition of operations from Meadowbank to the Amaruq site including: camp capacity, workforce movements, parts management and garage availability. At the end of the fourth quarter of 2019, most of the issues mentioned above have been addressed. All supervisory and management positions have been filled, along with additional workforce personnel to reduce backlogs and to implement improvement initiatives to accelerate ramp up.
The new warehouse was completed at Amaruq in January 2020, and the Company has commenced transferring material from Meadowbank to improve access to parts and reduce delivery time. Internal processes are also being reviewed and optimized in order to improve maintenance performance and equipment availability. In parallel to this, additional continuous improvement capacity is currently being added. Continuous improvement initiatives will continue to focus on drilling, loading and hauling (including long hauls) in order to increase the mining rate and reduce operating costs.
MANAGEMENT'S DISCUSSION AND ANALYSIS AGNICO EAGLE 23
In the fourth quarter of 2019, stakeholder approval was sought for the concept of "project tolerant caribou" to minimize unnecessary road closures from the migration patterns of the caribou. The concept of "project tolerant caribou" was part of the Terrestrial Environment Management Plan submitted to the authorities as part of the permitting process. This concept was discussed and agreed to at the Terrestrial Advisory Group meeting in the fall of 2019. Wildlife management (especially caribou) is an important priority and the Company continues to work with Nunavut stakeholders to find the best solutions to safeguard wildlife while minimizing production disruptions.
The current long haul truck fleet totals 22 units. In addition, three contractor units are available as back up. The Company continues to further improve mechanical and utilization availability and productivity.
The permitting process to amend the Whale Tail project certificate (Nunavut Impact Review Board ("NIRB") process) and Type A Water Licence (Nunavut Water Board ("NWB") process) to include the Amaruq Phase 2 expansion is ongoing. As part of this process, the NIRB held public hearings on the proposed expansion from August 26 to 29, 2019 in Baker Lake. In a decision issued on October 18, 2019, the NIRB concluded that if conducted in accordance with the NIRB's recommendations, this proposed amendment to the Whale Tail project could proceed to the Type A Water License amendment phase with the NWB. The Minister of Northern Affairs approved the amended Project Certificate Report from the NIRB (October 18, 2019 decision) on January 20, 2020, completing the NIRB process. The NWB water licence amendment process has been ongoing and public hearings occurred in February 2020. It is expected that the Amaruq Phase 2 permitting will be completed in the third quarter of 2020.
Additional work continues to evaluate the potential to increase mineral reserves and exploit a portion of the underground mineral resources at both Whale Tail and V Zone. A more detailed project evaluation is expected to be completed. The Company will continue to use a phased approach to the underground development program at Amaruq.
Meliadine Mine
The original Meliadine mine plan envisioned a 3,750 tpd mill with ore being sourced entirely from underground in years one to four. The mill capacity for Phase 2 is expected to increase to approximately 6,000 tpd, with ore being sourced from both underground and open pits starting in year five. The increased tonnage from the Phase 2 expansion was forecast to offset a planned decline in ore grade and keep production stable at approximately 400,000 ounces of gold per year.
The current Meliadine mill facility has demonstrated the ability to operate well in excess of the initial 3,750 tpd capacity (maximum daily rate in 2019 reached of 4,950 tpd). As a result, the Company has decided to accelerate the Phase 2 expansion by approximately two years to utilize the excess mill capacity. The initial source of open pit ore will be from two pits developed on the Tiriganiaq deposit. Development of the open pits is expected to provide additional mining flexibility and provide extra water storage capacity if needed.
The Phase 2 expansion will be carried out in three stages:
- •
- an increase in processing rate from current levels to 4,600 tpd;
- •
- increased processing rate of 5,000 tpd; and
- •
- an expansion to 6,000 tpd.
The Tiriganiaq deposit contains probable mineral reserves of 0.6 million ounces of gold (3.8 million tonnes grading 4.89 g/t gold). These pits are expected to be mined through 2027, with production gradually ramping up over the 8-year reserve life.
Capital expenditures for stage 1 of the Phase 2 expansion in 2020 are estimated to be approximately $48 million. In 2022 and 2023, an additional $35 million is expected to be spent on processing plant upgrades.
Canadian Malartic Mine
Deep drilling east of the open pit in late 2018 resulted in the discovery of a new gold mineralized zone, located south of the East Malartic and Odyssey zones, named the East Gouldie Zone. At the East Gouldie Zone, the aim of the drill program is to support the declaration of new inferred mineral resources at the zone and infill the current inferred mineral resources in the zone to convert them into indicated mineral resources.
Evaluations are underway at the Odyssey project, with consideration being given to potential new development synergies between the various zones at East Gouldie, East Malartic, Odyssey and Canadian Malartic. Initial production could potentially start in 2023 if the Partnership decides to develop the project. The Partnership is evaluating scenarios to optimize the project, which include discussions with royalty holders and other stakeholders to enhance the economics of the project. Given the
24 AGNICO EAGLE MANAGEMENT'S DISCUSSION AND ANALYSIS
Company's robust pipeline of development projects, the Company does not currently anticipate approving the project for development unless these discussions are successful and the project economics are significantly improved. The increases in mineral resources, particularly at the East Gouldie and East Malartic zones, are anticipated to eventually replace mineral reserves currently being mined at the adjacent Canadian Malartic pit.
Kittila Mine
In February 2018, the Company's Board of Directors approved an expansion to increase throughput rates at Kittila to 2.0 mtpa from the current rate of 1.6 mtpa. The expansion project is expected to result in a 50,000 to 70,000 ounce annual increase in gold production, increase the efficiency of the mine and maintain or decrease operating costs while providing access to the deeper mining horizons. In addition, the shaft is expected to provide access to the mineral resources located below 1,150 metres depth, where recent exploration programs have shown promising results. The shaft and mill expansion are continuing to advance as scheduled. The Company anticipates that final mill tie-in work will occur during a planned four to five-week mill maintenance shutdown.
Pinos Altos Mine
Development of the Sinter and Cubiro satellite deposits at Pinos Altos continued to advance in the fourth quarter of 2019. The Sinter deposit, located approximately 2.0 kilometres northwest of the Pinos Altos mine, will be mined from underground and a small open pit. At Sinter, the development of the underground continued in the fourth quarter of 2019
The Cubiro deposit is located approximately 9.2 kilometres northwest of the Pinos Altos mine and 2.0 kilometres west of the Creston Mascota deposit. Based on exploration drilling, Cubiro could potentially contribute additional ore to be processed and extend the current life of mine at Pinos Altos mine.
Creston Mascota Mine
Mining activities are now forecast to continue through the first half of 2020, with leaching activities expected to continue in 2020 and beyond. Costs are expected to decline once mining activities have ceased.
La India Mine
The Company continues to evaluate the potential to develop other satellite zones such as El Realito and Chipriona.
Production Summary
With the achievement of commercial production at the Kittila and Pinos Altos mines in 2009, the Meadowbank mine in 2010, the Creston Mascota and LaRonde mine extension in 2011, the Goldex mine M and E Zones in 2013, the La India mine in 2014, the LaRonde Zone 5 mine in 2018 and the Meliadine mine and the Amaruq satellite deposit at the Meadowbank Complex in 2019, along with the joint acquisition of the Canadian Malartic mine on June 16, 2014, Agnico Eagle has transformed from a one mine operation to a multi-mine senior gold mining company over the last 12 years. In 2019, the Company achieved payable gold production of 1,782,147 ounces. As the Company optimizes this expanded production platform, it expects to continue to deliver on its vision and strategy. The Company expects that the main contributors to achieving the targeted levels of payable gold production, mineral reserves and mineral resources in the near term will include:
- •
- continued ramp up of the Nunavut operations;
- •
- continued mill and mine plan optimization; and
- •
- continued conversion of Agnico Eagle's current mineral resources to mineral reserves.
MANAGEMENT'S DISCUSSION AND ANALYSIS AGNICO EAGLE 25
Financial Outlook
As of the date of this MD&A, the Company does not expect that the COVID-19 pandemic will affect its planned 2020 capital expenditure and exploration program, but cannot provide any assurances that proposed capital expenditure or exploration activities will not be delayed, postponed or cancelled whether as a result of the COVID-19 pandemic, measures taken associated with the pandemic or otherwise.
Exploration and Corporate Development Expenditures
In 2020, Agnico Eagle expects to incur exploration and corporate development expenses of approximately $129.9 million.
A large component of the 2020 exploration program will be focused on the Canadian Malartic and Goldex mines in the Abitibi region of northwest Quebec, the Sisar-Rimpi zones at the Kittila mine in Finland, the Kirkland Lake project in northeastern Ontario, the Santa Gertrudis project in Sonora State, Mexico and satellite targets at the Pinos Altos mine in Mexico. The goal of these exploration programs is to delineate mineral reserves and mineral resources that can help supplement the Company's existing production profile.
At the Kittila mine, the Company expects to spend $11.8 million for work that will include 58,000 metres of drilling focused on the Main Zone in the Roura and Rimpi areas as well as the Sisar Zone. The goal of this program is to further explore the Kittila mineral reserve and mineral resource potential and demonstrate the economic potential of the Sisar Zone as a new mining horizon at Kittila. The drilling includes 46,000 metres of capitalized conversion drilling at the mine as described above and 12,000 metres of expensed regional exploration drilling on targets beyond the current mineral resource area.
At the Goldex mine, the Company expects to spend $6.9 million for 79,000 metres of exploration and conversion drilling focused on the M Zone, Deep 1, Deep 2 and South zones.
At the Kirkland Lake project in Ontario, the Company expects to spend $10.3 million for 48,000 metres of exploration drilling focused on converting and expanding mineral resources at the Upper Beaver and Upper Canada deposits, which is expected to lead to an updated mineral resource estimate for the Upper Beaver deposit at year-end 2020.
At the Amaruq deposit at the Meadowbank Complex, the Company expects to spend $2.9 million for 8,400 metres of exploration drilling to test regional targets with a focus on deposits with open-pit potential. Drilling will also test the vertical extensions of near surface mineral occurrences at Mammoth Lake.
Another $2.0 million is budgeted for 5,500 metres of exploration drilling on other properties around Amaruq to test near surface open-pit targets close to existing road infrastructure between Amaruq and Baker Lake.
At the Canadian Malartic mine, the Company expects to spend $7.5 million (50% basis) for 90,000 metres (100% basis) of exploration and conversion drilling primarily focused on declaring new inferred mineral resources at the East Gouldie Zone and infilling the current inferred mineral resources in the zone to convert them into indicated mineral resources by year-end 2020. In addition to the drilling at East Gouldie, the Company is planning to spend another $5.0 million (50% basis) on 22,000 metres (100% basis) of exploration drilling to test other regional targets at Canadian Malartic and on studies.
At the Santa Gertrudis project in Sonora, Mexico, the Company expects to spend $10.4 million for approximately 25,000 metres of drilling that will be focused on expanding the mineral resource, testing the extensions of high-grade structures such as the Amelia deposit and exploring new targets.
At the Pinos Altos mine, the Company expects to spend $7.8 million for 42,000 metres of drilling, in work that will include 5,000 metres of drilling to extend the new Reyna East Zone along strike and at depth and 10,000 metres to infill and expand the mineral resource at Cubiro and Cubiro North.
Exploration programs are designed to infill and expand known deposits and test other favourable target areas that could ultimately supplement the Company's existing production profile. Exploration is success-driven and thus planned exploration could change materially based on the interim results of the various exploration programs. When it is determined that a project can generate future economic benefit, the costs of drilling and development to further delineate the ore body on such a property are capitalized. In 2020, the Company expects to capitalize approximately $25.6 million of drilling and development costs related to further delineating ore bodies and converting mineral resources into mineral reserves.
Other Expenses
General and administrative expenses are expected to be between $110.0 million and $130.0 million in 2020 compared with $121.0 million in 2019.
26 AGNICO EAGLE MANAGEMENT'S DISCUSSION AND ANALYSIS
Capital Expenditures
Capital expenditures, including sustaining capital, construction and development costs and capitalized exploration costs, are expected to total approximately $740.0 million in 2020. The Company expects to fund its 2020 capital expenditures through operating cash flow from the sale of its gold production and the associated by-product metals. Significant components of the expected 2020 capital expenditures program include the following:
- •
- $332.3 million in sustaining capital expenditures relating to the LaRonde Complex ($87.9 million), Canadian Malartic mine ($52.6 million – 50% portion attributable to the Company), Meadowbank Complex ($46.6 million), Kittila mine ($38.6 million), Meliadine mine ($37.8 million), Pinos Altos mine ($29.1 million), Goldex mine ($25.5 million), La India mine ($12.2 million) and other projects ($2.0 million);
- •
- $382.1 million in capitalized development expenditures relating to the Kittila mine ($134.1 million), Meliadine mine ($64.5 million), Meadowbank Complex ($47.2 million), LaRonde Complex ($37.1 million), Amaruq underground project ($29.0 million), La India mine ($24.9 million), Canadian Malartic mine ($22.4 million – 50% portion attributable to the Company), Goldex mine ($14.7 million) and Pinos Altos mine ($8.2 million); and
- •
- $25.6 million in capitalized drilling expenditures.
In 2020, a significant portion of the Company's capital commitments are expected to relate to the Kittila mine expansion and the advancement of the Phase two expansion at the Meliadine mine. The Kittila mine expansion capital commitment is forecast to be $134.1 million in development expenditures which represents approximately 18.1% of the expected $740.0 million in total capital expenditures in 2020.
The Company continues to examine other possible corporate development opportunities which may result in the acquisition of companies or assets using the Company's securities, cash or a combination thereof. If cash is used to fund acquisitions, Agnico Eagle may be required to issue debt or securities to satisfy cash payment requirements.
Risk Profile
The Company is subject to significant risks due to the inherent nature of the business of exploration, development and mining of properties with precious metals. The risks described below are not the only ones facing the Company. The risk factors below may include details of how the Company seeks to mitigate these risks where possible. For a more comprehensive discussion of these inherent risks, see "Risk Factors" in our most recent Form 40-F/AIF on file with the SEC and Canadian provincial securities regulatory authorities.
Impact of COVID-19
In December 2019, a novel strain of coronavirus known as COVID-19 surfaced in Wuhan, China and has spread around the world, with resulting business and social disruption. COVID-19 was declared a worldwide pandemic by the World Health Organization on March 11, 2020. The speed and extent of the spread of COVID-19, and the duration and intensity of resulting business disruption and related financial and social impact, are uncertain. Further, the extent and manner to which COVID-19, and measures taken by governments, the Company or others to attempt to reduce the spread of COVID-19, may affect the Company cannot be predicted with certainty.
COVID-19 and these measures have had and may continue to have an adverse impact on many aspects of the Company's business including, employee health, workforce productivity and availability, travel restrictions, contractor availability, supply availability, ability to sell or deliver gold dore bars or concentrate, the Company's ability to maintain its controls and procedures regarding financial and disclosure matters and the availability of insurance and the costs thereof, some of which, individually or when aggregated with other impacts, may be material to the Company. Measures taken by governments, the Company or others, or a positive test for COVID-19 associated with one of the Company's mine sites, could result in the Company reducing or suspending operations at one or more of its mines. For example, on March 23, 2020 the Government of Quebec ordered that all non-essential businesses in Quebec be closed from March 25, 2020 to April 13, 2020. As a result of this Order, the Company suspended all mining operations the LaRonde Complex, the Goldex mine and the Canadian Malartic mine. The Company also reduced activities at the Meliadine and Meadowbank mining operations in Nunavut, which are fly-in/fly-out mining operations, currently serviced out of Mirabel and Val d'Or, Quebec. As a result of the Order, on March 24, 2020 the Company determined to withdraw its guidance for 2020 regarding expected production volumes and costs. The Company cannot provide any assurances that the ordered shut down of non-essential businesses will not be extended beyond April 13, 2020, or that it can achieve a timely and safe ramp up of normal operations once all restrictions are lifted. Further, the Company cannot provide any assurances that governments in the other regions it operates will not implement measures that result in the suspension or reduction of mining operations at one or more of its mines. COVID-19
MANAGEMENT'S DISCUSSION AND ANALYSIS AGNICO EAGLE 27
and associated responses could also have an adverse effect on the Company's ability to procure inputs required for the Company's operations and capital projects.
The Company's Meadowbank Complex (including the Amaruq satellite deposit) and Meliadine mine are both located in remote areas and operate as fly-in/fly-out camps, meaning site employees and contractors are housed in on-site accommodations during the periods in which they are working. Because of the concentration of personnel working and living in a small area, risks associated with communicable diseases are higher at these sites. As a precautionary measure, on March 19, 2020, the Company made the decision to send home all of its Nunavut-based work force at the Meadowbank Complex and the Meliadine mine for a period of four weeks to reduce the risk of transmission of COVID-19. On March 24, 2020, the Company announced it would reduce activities at its sites in Nunavut. If travel restrictions related to COVID-19 affect the movement of personnel to these sites, the Company may have to further reduce or suspend activities at such sites. The Company may in the future, based on its assessment of relevant risks at the time, elect to reduce, further reduce or suspend operations at these or other sites as a precautionary measure or as a result of or in response to government or community actions. Further, COVID-19, and measures taken to attempt to reduce the spread of COVID-19, may affect the Company's ability to ship the materials that the Company requires for the operation of the Meadowbank Complex and the Meliadine mine during Nunavut's limited annual shipping season which are fourteen and ten weeks, respectively. If the Company is unable to acquire and transport necessary supplies during the limited shipping season it may result in a slowdown or stoppage of operations at the Meadowbank Complex and the Meliadine mine and may delay construction or expansion projects planned for the sites. Any of these events or circumstances could have a material adverse effect on the Company's business and results of operations.
In addition, the actual or threatened spread of COVID-19 globally, and responses of governments and others to such actual or threatened spread, could also have a material adverse effect on the global economy, could continue to negatively affect financial markets, including the price of gold and the trading price of the Company's shares, could adversely affect the Company's ability to raise capital, and could cause continued interest rate volatility and movements that could make obtaining financing or refinancing debt obligations more challenging or more expensive. If the price of gold declines, the Company's revenues from its operations will also decline.
Financial Instruments
The Company's principal financial liabilities are comprised of accounts payable and accrued liabilities, long-term debt and derivative financial instruments. The Company uses these financial instruments to manage its cash flows used to support ongoing operations and future growth.
The Company's principal financial assets are comprised of cash and cash equivalents, short-term investments, trade receivables, equity securities and derivative financial instruments. Cash and cash equivalents, short-term investments and trade receivables are generated by the Company's operations. Equity securities are generally strategic investments made in other mining companies.
Using financial instruments exposes the Company to a variety of financial risks: credit risk, liquidity risk and market risk (including interest rate risk, commodity price risk and foreign currency risk as discussed below).
Credit risk is the risk that the counterparties to financial contracts will fail to perform on an obligation to the Company. Credit risk is partially mitigated by dealing with high quality counterparties such as major banks and limiting concentration risk.
Liquidity risk is the risk that the Company will encounter difficulty in meeting obligations associated with financial liabilities that are settled by delivering cash or another financial asset. The Company mitigates liquidity risk primarily by monitoring its debt rating and the maturity dates of existing debt and other payables.
Interest Rates
The Company's current exposure to market risk for changes in interest rates relates primarily to drawdowns on its Credit Facility and its investment portfolio. Drawdowns on the Credit Facility are used primarily to fund a portion of the capital expenditures related to the Company's development projects and working capital requirements. As at December 31, 2019, there were no amounts outstanding on the Company's Credit Facility. In addition, the Company invests its cash in investments with short maturities or with frequent interest reset terms and a credit rating of R1-High or better. As a result, the Company's interest income fluctuates with short-term market conditions. As at December 31, 2019, short-term investments were $6.0 million.
Amounts drawn under the Credit Facility are subject to floating interest rates based on benchmark rates available in the United States and Canada or on LIBOR. In the past, the Company has entered into derivative instruments to hedge against
28 AGNICO EAGLE MANAGEMENT'S DISCUSSION AND ANALYSIS
unfavourable changes in interest rates. The Company will continue to monitor its interest rate exposure and may enter into such agreements to manage its exposure to fluctuating interest rates.
Commodity Prices and Foreign Currencies
Agnico Eagle's net income is sensitive to metal prices and the US dollar/Canadian dollar, US dollar/Mexican peso and US dollar/Euro exchange rates.
Changes in the market price of gold may be attributed to numerous factors such as demand, global mine production levels, central bank purchases and sales and investor sentiment. Changes in the market prices of other metals may be attributed to factors such as demand and global mine production levels. Changes in the market price of diesel may be attributed to factors such as supply and demand. Changes in exchange rates may be attributed to factors such as supply and demand for currencies and economic conditions in each country or currency area. In 2019, the ranges of metal prices, diesel prices and exchange rates were as follows:
- •
- Silver: $14.29 — $19.65 per ounce, averaging $16.21 per ounce;
- •
- Zinc: $2,202 — $3,031 per tonne, averaging $2,546 per tonne;
- •
- Copper: $5,536 — $6,572 per tonne, averaging $6,001 per tonne;
- •
- Diesel: C$0.82 — C$0.95 per litre, averaging C$0.88 per litre;
- •
- US dollar/Canadian dollar: C$1.30 — C$1.37 per $1.00, averaging C$1.33 per $1.00;
- •
- US dollar/Euro: €0.86 — €0.92 per $1.00, averaging €0.89 per $1.00; and
- •
- US dollar/Mexican peso: 18.75 — 20.26 Mexican pesos per $1.00, averaging 19.26 Mexican pesos per $1.00.
In order to mitigate the impact of fluctuating by-product metal prices, the Company occasionally enters into derivative financial instrument contracts under its Board-approved Risk Management Policies and Procedures. The Company has a long-standing policy of no forward gold sales. However, the policy does allow the Company to use other hedging strategies where appropriate to mitigate foreign exchange and by-product metal pricing risks. The Company occasionally buys put options, enters into price collars and enters into forward contracts to protect minimum by-product metal prices while maintaining full exposure to the price of gold. The Risk Management Committee has approved the strategy of using short-term call options in an attempt to enhance realized by-product metal prices. The Company's policy does not allow speculative trading.
The Company receives payment for all of its metal sales in US dollars and pays most of its operating and capital costs in Canadian dollars, Euros or Mexican pesos. This gives rise to significant currency risk exposure. The Company enters into currency hedging transactions under its Board-approved Foreign Exchange Risk Management Policies and Procedures to hedge part of its foreign currency exposure. The policy does not permit the hedging of translation exposure (that is, the gains and losses that arise from the accounting translation of Canadian dollar, Euro or Mexican peso denominated assets and liabilities into US dollars), as it does not give rise to cash exposure. The Company's foreign currency derivative financial instrument strategy includes the use of purchased puts, sold calls, collars and forwards that are not held for speculative purposes. As at December 31, 2019, there were foreign exchange derivatives outstanding related to $252.0 million of 2020 expenditures. During the year ended December 31, 2019 the Company recognized a gain of $9.6 million on foreign exchange derivatives in the (gain) loss on derivative financial instruments line item of the consolidated statements of income (loss).
Cost Inputs
The Company considers and may enter into risk management strategies to mitigate price risk on certain consumables including, but not limited to, diesel fuel. These strategies may include longer term purchasing contracts and financial and derivative instruments. As at December 31, 2019, there were derivative financial instruments outstanding relating to 12 million gallons of heating oil. During the year ended December 31, 2019 the Company recognized a gain of $3.6 million on heating oil derivatives in the (gain) loss on derivative financial instruments line item of the consolidated statements of income (loss).
MANAGEMENT'S DISCUSSION AND ANALYSIS AGNICO EAGLE 29
Operational Risk
The LaRonde Complex (including LZ5), Canadian Malartic and Meliadine mines were the Company's most significant contributors in 2019 to the Company's payable gold production at 22.6%, 18.8% and 13.4%, respectively, and are expected to account for a significant portion of the Company's payable gold production in the future.
Mining is a complex and unpredictable business and, therefore, actual payable gold production may differ from expectations. Adverse conditions affecting mining or milling may have a material adverse impact on the Company's financial performance and results of operations. The Company anticipates using revenue generated by its operations to finance the capital expenditures required at its mine projects.
Regulatory Risk
The Company's mining and mineral processing operations, exploration activities and properties are subject to the laws and regulations of federal, provincial, state and local governments in the jurisdictions in which the Company operates. These laws and regulations are extensive and govern prospecting, exploration, development, production, exports, taxes, labour standards, occupational health and safety, waste disposal and tailings management, toxic substances, environmental protection, greenhouse gases, mine safety, reporting of payments to governments and other matters. Compliance with such laws and regulations increases the costs of planning, designing, drilling, developing, constructing, operating, managing, closing, reclaiming and rehabilitating mines and other facilities. New laws or regulations, amendments to current laws and regulations governing operations and activities on mining properties or more stringent implementation or interpretation thereof could have a material adverse effect on the Company, increase costs, cause a reduction in levels of production and delay or prevent the development of new mining properties. Regulatory enforcement, in the form of compliance or infraction notices, has occurred at some of the Company's mines and, while the current risks related to such enforcement are not expected to be material, the risk of material fines or corrective action cannot be ruled out in the future.
Controls Evaluation
The Company's management is responsible for establishing and maintaining adequate internal control over financial reporting ("ICFR") and disclosure controls and procedures ("DC&P").
ICFR is a framework designed to provide reasonable assurance regarding the reliability of financial reporting and the preparation of financial statements for external purposes in accordance with IFRS. Management has used theInternal Control – Integrated Framework issued by the Committee of Sponsoring Organizations of the Treadway Commission (2013 framework) in order to assess the effectiveness of the Company's ICFR.
DC&P form a broader framework designed to provide reasonable assurance that information required to be disclosed by the Company in its annual and interim filings and other reports filed under securities legislation is recorded, processed, summarized and reported within the time frame specified in securities legislation and includes controls and procedures designed to ensure that information required to be disclosed by the Company in its annual and interim filings and other reports submitted under securities legislation is accumulated and communicated to the Company's management to allow timely decisions regarding required disclosure.
Together, the ICFR and DC&P frameworks provide internal control over financial reporting and disclosure. The Company maintains disclosure controls and procedures that are designed to provide reasonable assurance that information, which is required to be disclosed in the Company's annual and interim filings and other reports filed under securities legislation, is accumulated and communicated in a timely fashion. Due to their inherent limitations, the Company acknowledges that, no matter how well designed, ICFR and DC&P can provide only reasonable assurance of achieving the desired control objectives and as such may not prevent or detect all misstatements. Further, the effectiveness of ICFR is subject to the risk that controls may become inadequate because of changes in conditions or that the degree of compliance with policies or procedures may change.
The Company's management, under the supervision of the Company's Chief Executive Officer and Chief Financial Officer, has evaluated the effectiveness of its ICFR and DC&P as at December 31, 2019. Based on this evaluation, management concluded that the Company's ICFR and DC&P were effective as at December 31, 2019.
30 AGNICO EAGLE MANAGEMENT'S DISCUSSION AND ANALYSIS
Outstanding Securities
The following table sets out the maximum number of common shares that would be outstanding if all dilutive instruments outstanding at March 17, 2020 were exercised:
| Common shares outstanding | 239,914,359 | ||
| Employee stock options | 4,969,950 | ||
| Common shares held in a trust in connection with the Restricted Share Unit plan, Performance Share Unit plan and Long Term Incentive Plan | 933,869 | ||
| Total | 245,818,178 | ||
Sustainable Development
In 2019, the Company continued the process of incorporating health, safety and environmental sustainability into all aspects and stages of its business, from the corporate objectives and executive responsibility of 'maintaining high standards in sustainability' to exploration and acquisition activities, day-to-day operating and site closure. The formal integration of this process began in 2012 with the adoption of an integrated Health, Safety, Environment and Social Acceptability Policy (the "Sustainable Development Policy") that reflects the Company's commitment to responsible mining practices. This policy was updated in 2019 to include clearer commitments to the protection of human rights and a greater emphasis on risk management. The Company believes that the Sustainable Development Policy will lead to the achievement of more sustainable practices through oversight and accountability.
The Sustainable Development Policy operates through the development and implementation of a formal and integrated Health, Safety and Environmental Management System, termed the Risk Management and Monitoring System (the "RMMS"), across all divisions of the Company. The Partnership has committed to implementing a similar system at Canadian Malartic in the future. The aim of the RMMS is to promote a culture of accountability and leadership in managing health, safety, environmental and social acceptability matters. RMMS implementation is supported by software widely used in the Canadian mining industry that is consistent with the ISO 14001 Environmental Management System and the Occupational Health and Safety Assessment Series 18001 Health and Safety Management System.
The RMMS incorporates the Company's commitments as a signatory to the Cyanide Code, a voluntary program that addresses the safe production, transport, storage, handling and disposal of cyanide. The Company became a signatory to the Cyanide Code in September 2011.
The RMMS also integrates the requirements of the Mining Association of Canada's industry leading Towards Sustainable Mining Initiative (the "TSM Initiative"), as well as the Global Reporting Initiative's ("GRI") sustainability reporting guidelines for the mining industry. The GRI sustainability reporting guidelines consist of principles for defining report content and ensuring the quality of reported information. In December 2010, the Company became a member of the Mining Association of Canada and endorsed the TSM Initiative. The TSM Initiative helps mining companies evaluate the quality, comprehensiveness and robustness of their management systems under eight performance elements: crisis management; energy and greenhouse gas emissions management; tailings management; biodiversity conservation management; health and safety; and indigenous and community relations and water stewardship.
The Company has adopted and implemented the World Gold Council's Conflict Free Gold Standard. This implementation was initiated on January 1, 2013.
In 2017, the Company adopted the Voluntary Principles on Security and Human Rights, a set of principles designed to guide companies in maintaining the safety and security of their operations within an operating framework that encourages respect for human rights. An external audit of the Voluntary Principles was performed at the La India mine in 2018 and the Pinos Altos mine in 2019.
In 2018, the Company adopted an Indigenous Engagement Policy and a Diversity and Inclusion policy. A Diversity Advisory Council was established in 2019. An internal review was completed at each site to identify best practices as well as any obstacles or barriers to the successful implementation of these policies.
In 2019, the Company committed to the application of the World Gold Council's Responsible Mining principles. These commitments will also be integrated into the RMMS.
The Company's Sustainable Development Policy is available on the Company's website at, www.agnicoeagle.com. The Canadian Malartic mine's sustainable development report is available at its website, www.canadianmalartic.com.
MANAGEMENT'S DISCUSSION AND ANALYSIS AGNICO EAGLE 31
Employee Health and Safety
The Company's overall health and safety performance, as measured by accident frequency, improved during 2019. A combined lost time and restricted work accident frequency rate (excluding the Canadian Malartic mine) of 0.98 was achieved, a 23% decrease from the 2018 rate of 1.27 and below the target rate of 1.10. Extensive health and safety training continued to be provided to employees during 2019.
The Canadian Malartic mine's combined accident frequency rate in 2019 was 1.20, a slight decrease from the 2018 rate of 1.21 but above the target rate of 0.95.
One of the measures implemented by the Company to improve safety performance is the workplace safety card system. This system was implemented across all of the Company's operations to strengthen the risk-based training program. Developed by the Quebec Mining Association (the "AMQ"), the safety card system teaches workers and supervisors to use risk-based thinking in their duties. Workers and their supervisors must meet every day to discuss on the job health and safety matters. The safety card system also allows the Company's workers and supervisors to document daily inspections and record observations on conditions in the workplace, as well as the nature of risks, issues and other relevant information. In addition, it allows supervisors to exchange and analyze all relevant information between shifts and various technical services to improve efficiency and safety.
In 2019, the AMQ acknowledged the Company's strong performance in the area of health and safety, recognizing 23 of the Company's supervisors from the LaRonde and Goldex mines for keeping their workers safe. The supervisors received AMQ security trophy awards for 50,000 or more hours supervised without a lost time accident. Together, this group of 23 supervisors achieved more than 2.1 million hours supervised without a lost time accident for a member of their crew. The AMQ also recognized 14 supervisors from the Canadian Malartic mine for achieving 2.25 million hours without a lost time accident.
IN 2019, the National Mining Association of Mexico awarded the La India mine the Jorge Rangel Zamorano – Silver Helmet award as the safest mine in Mexico in the open pit category (500 employees) for the second year in a row.
Each of the Company's mining operations has its own Emergency Response Plan and has personnel trained to respond to safety, fire and environmental emergencies. Each mine also maintains the appropriate response equipment. In 2014, the corporate crisis management plan was updated to align with industry best practices and the TSM Initiative requirements. Emergency response simulations are also performed at all divisions on an annual basis. The TSM Initiative also contains a Health and Safety protocol which has been implemented at all the Company's mining operations.
Community
The Company's goal, at each of its operations worldwide, is to hire as much of its workplace as possible, including management teams, directly from the local region in which the operation is located. For example, at the Company's mines in Mexico, 53% of the workforce comes from the local region. In Nunavut, 27% of the workforce is Inuit. The Company believes that providing employment is one of the most significant contributions it can make to the communities in which it operates.
The Company continued its efforts in community development agreements in Nunavut. In 2015, the Meadowbank IIBA was renewed and the Meliadine IIBA was signed. In 2018, the Amaruq IIBA was signed. In 2019, the Company continued its dialogue with First Nations around the Kirkland Lake project.
The Company has adopted a reconciliation action plan consistent with the call for action No. 92 of theTruth and Reconciliation Commission of Canada: Calls to Action, the first step of which was to give training on First Nations Matters to the Company's senior management which was completed in 2018. In 2019, the Company continued to make progress with this call to action by engaging in discussions with the First Nations communities in the regions of our mines and projects in Nunavut, Quebec and Ontario.
The Canadian Malartic mine continued its contribution to the economic development fund which was established prior to mine development to diversify the local economy throughout the mine life so that the town of Malartic is well equipped to face the eventual mine closure. The Canadian Malartic mine has also participated in forums initiated by the town council on the future of the town of Malartic. As part of ongoing stakeholder engagement, a draft agreement with four First Nations groups has been prepared and presented for consultation by the communities, As with the Good Neighbour Guide and other community relations efforts at Canadian Malartic, the Partnership is working collaboratively with stakeholders to establish cooperative relationships that support the long-term potential of the mine.
A Good Neighbour Guide was initiated at the LaRonde Mine in 2019 and will be implemented in 2020. Goldex is in the progress of initiating a similar guide.
32 AGNICO EAGLE MANAGEMENT'S DISCUSSION AND ANALYSIS
The Company continued to support community health and educational initiatives in the region surrounding the Pinos Altos mine, including the establishment of a Goods Deeds Initiative where community members, mining leaders and government officials gathered and achieved more than 2,000 good deeds supporting the environment, local education, health as well as acts of kindness towards community members.
The Company's Code of Business Conduct and Ethics Policy is available on the Company's website at www.agnicoeagle.com.
Environmental
The Company's exploration activities and mining and processing operations are subject to the federal, state, provincial, territorial, regional and local environmental laws and regulations in the jurisdictions in which the Company's activities and facilities are located. These include requirements for planning and implementing the closure and reclamation of mining properties and related financial assurance. Each mine is subject to environmental assessment and permitting processes during development and, in operation, has an environmental management system consistent with ISO 14001 as well as an internal audit program. The Company works closely with regulatory authorities in each jurisdiction where it operates to ensure ongoing compliance.
The Company has reported greenhouse gas emissions and climate change risk factors annually to the Carbon Disclosure Project since 2007.
With respect to activities in 2019, the Canadian Malartic Partnership received four non-compliance notices, two for overpressure and two for nitrogen oxide emissions. The mine's team of on-site environmental experts continue to monitor regulatory compliance in terms of approvals, permits and observance of directives and requirements and continue to implement improvement measures.
The Company's total liability for reclamation and closure cost obligations as at December 31, 2019 was $439.8 million (including the Company's share of the Canadian Malartic reclamation costs) and the Company's environmental remediation expense for the year ended December 31, 2019 was $2.8 million.
The Company's Environmental Policy is available on the Company's website at www.agnicoeagle.com.
Critical IFRS Accounting Policies and Accounting Estimates
The Company's annual consolidated financial statements are prepared in accordance with International Financial Reporting Standards ("IFRS") as issued by the International Accounting Standards Board. Agnico Eagle's significant accounting policies including a summary of current and future changes in accounting policies are disclosed in Note 3 in the consolidated annual financial statements.
The preparation of the annual consolidated financial statements in accordance with IFRS requires management to make estimates and judgments that affect the reported amounts of assets, liabilities, revenues and expenses. Critical accounting estimates have a reasonable likelihood that materially different amounts could be reported under different conditions or using different assumptions. In making judgments about the carrying value of assets and liabilities, the Company uses estimates based on historical experience and assumptions that are considered reasonable in the circumstances. Although the Company evaluates its accounting estimates on an ongoing basis using the most current information available, actual results may differ from these estimates. The critical judgments and key sources of estimation uncertainties in the application of accounting policies during the year ended December 31, 2019 are disclosed in Note 4 to the annual consolidated financial statements.
Management has discussed the development and selection of critical accounting policies and estimates with the Audit Committee which has reviewed the Company's disclosure in this MD&A.
MANAGEMENT'S DISCUSSION AND ANALYSIS AGNICO EAGLE 33
Mineral Reserve Data
The scientific and technical information contained in this MD&A relating to Quebec operations has been approved by Daniel Paré, Eng., Vice-President Operations – Eastern Canada; relating to Nunavut operations has been approved by Dominique Girard, Eng., Vice-President, Nunavut Operations; relating to the Finland operations has been approved by Francis Brunet, Eng., Corporate Director Business Strategy; relating to Southern Business operations has been approved by Marc Legault, Eng., Senior Vice-President, Operations – U.S.A. & Latin America; and relating to exploration has been approved by Guy Gosselin, Eng. and P.Geo., Senior Vice-President, Exploration, each of whom is a "Qualified Person" for the purposes of National Instrument 43-101 Standards of Disclosure for Mineral Projects ("NI 43-101").
The scientific and technical information relating to Agnico Eagle's mineral reserves and mineral resources contained herein (other than the Canadian Malartic mine) has been approved by Dyane Duquette, P.Geo., Corporate Director, Reserve Development; relating to mineral reserves and mineral resources at the Canadian Malartic mine, the Odyssey, the East Malartic and the East Gouldie projects, has been approved by Sylvie Lampron, Eng., Senior Project Mine Engineer at Canadian Malartic Corporation (for enginerring) and Pascal Lehouiller, P. Geo., Senior Resource Geologist at Canadian Malartic Corporation (for geology), each of whom is a "Qualified Person" for the purposes of NI 43-101.
The assumptions used for the mineral reserve estimates at all mines and projects reported in this MD&A (except the Canadian Malartic mine, the Upper Canada project and the Upper Beaver project) as at December 31, 2019 are $1,200 per ounce gold, $15.50 per ounce silver, $1.00 per pound zinc and $2.50 per pound copper. Foreign exchange rates assumptions of C$1.25 per US$1.00, €0.87 per US$1.00 and 17.00 Mexican pesos per US$1.00 were used for all mines and projects other than the Creston Mascota mine and the Sinter satellite deposit at the Pinos Altos mine in Mexico, which used foreign exchange rate assumption of 18.00 Mexican pesos per US$1.00 (other assumptions unchanged) due to their shorter remaining mine lives.
December 31, 2019 mineral reserves at the Canadian Malartic mine, the Upper Canada project and the Upper Beaver project have been estimated using the following assumptions: $1,200 per ounce gold and $2.75 per pound copper; a cut-off grade at the Canadian Malartic mine between 0.40 g/t and 0.43 g/t gold (depending on the deposit); a C$125/tonne net smelter return (NSR) for the Upper Beaver project; and a foreign exchange rate of C$1.25 per US$1.00.
34 AGNICO EAGLE MANAGEMENT'S DISCUSSION AND ANALYSIS
| Proven and Probable Mineral Reserves by Property(i)(ii) | Tonnes | Gold Grade (Grams per Tonne) | Contained Gold (Ounces)(iii) | ||||
(thousands) | (thousands) | ||||||
| Proven Mineral Reserves | |||||||
| LaRonde mine | 4,802 | 5.05 | 780 | ||||
| LaRonde Zone 5 mine | 3,307 | 2.13 | 226 | ||||
| Canadian Malartic mine (attributable 50.0%) | 23,847 | 0.83 | 635 | ||||
| Goldex mine | 272 | 1.85 | 16 | ||||
| Meadowbank mine | 37 | 2.24 | 3 | ||||
| Amaruq satellite deposit (part of Meadowbank Complex) | 172 | 1.83 | 10 | ||||
| Meliadine mine | 866 | 7.14 | 199 | ||||
| Kittila mine | 1,444 | 4.55 | 211 | ||||
| Pinos Altos mine | 3,334 | 2.55 | 273 | ||||
| Creston Mascota mine | 1 | 5.55 | – | ||||
| La India mine | 279 | 0.49 | 4 | ||||
| Total Proven Mineral Reserves | 38,361 | 1.91 | 2,357 | ||||
Probable Mineral Reserves | |||||||
| LaRonde mine | 10,117 | 6.48 | 2,108 | ||||
| LaRonde Zone 5 mine | 5,980 | 2.39 | 460 | ||||
| Canadian Malartic mine (attributable 50.0%) | 43,057 | 1.27 | 1,754 | ||||
| Goldex mine | 20,709 | 1.61 | 1,072 | ||||
| Akasaba West project | 5,413 | 0.85 | 147 | ||||
| Meadowbank mine | – | – | – | ||||
| Amaruq satellite deposit (part of Meadowbank Complex) | 25,903 | 3.97 | 3,308 | ||||
| Meliadine mine | 19,883 | 6.05 | 3,868 | ||||
| Upper Beaver project | 7,992 | 5.43 | 1,395 | ||||
| Kittila mine | 27,481 | 4.40 | 3,885 | ||||
| Pinos Altos mine | 11,124 | 1.91 | 684 | ||||
| Creston Mascota mine | 757 | 2.49 | 61 | ||||
| La India mine | 20,152 | 0.75 | 486 | ||||
| Total Probable Mineral Reserves | 198,569 | 3.01 | 19,227 | ||||
| Total Proven and Probable Mineral Reserves | 236,930 | 2.83 | 21,585 | ||||
Notes:
- (i)
- Amounts presented in this table have been rounded to the nearest thousand and therefore totals may differ slightly from the addition of the numbers.
- (ii)
- Complete information on the verification procedures, quality assurance program, quality control procedures, expected payback period of capital, parameters and methods and other factors that may materially affect scientific and technical information presented in this MD&A and definitions of certain terms used herein may be found in: the AIF under the heading "Information on Mineral Reserves and Mineral Resources of the Company"; the Technical Report on the 2005 LaRonde Mineral Resource & Mineral Reserve Estimate filed with Canadian securities regulatory authorities on SEDAR on March 23, 2005; the Technical Report on the December 31, 2009, Mineral Resource and Mineral Reserve Estimate and the Suuri Extension Project, Kittila Mine, Finland filed with the Canadian securities regulatory authorities on SEDAR on March 4, 2010; the Technical Report on the Mineral Resources and Mineral Reserves at Meadowbank Gold Complex including the Amaruq satellite deposit, Nunavut, Canada as at December 31, 2017 filed with Canadian securities regulatory authorities on SEDAR on March 22, 2018; the Pinos Altos Gold-Silver Mining Project, Chihuahua State, Mexico, Technical Report on Mineral Resources and Reserves as of December 31, 2008 filed with Canadian securities regulatory authorities on March 25, 2009; the Updated Technical Report on the Meliadine Gold Project, Nunavut, Canada dated February 11, 2015 filed with Canadian securities regulatory authorities on SEDAR on March 12, 2015; the Technical Report on the June 30, 2012 Update of the Mineral Resources and Mineral Reserves, La India Gold Project, Municipality of Sahuaripa, Sonora, Mexico dated August 31, 2012 filed with Canadian securities regulatory authorities on SEDAR on October 12, 2012; the Technical Report on Production of the M and E Zones at Goldex Mine dated October 14, 2012 filed with the Canadian securities regulatory authorities on SEDAR on November 1, 2012; and the Technical Report on the Mineral Resource and Mineral Reserve Estimates for the Canadian Malartic Property as at June 16, 2014 filed with Canadian securities regulatory authorities on SEDAR on August 13, 2014.
- (iii)
- Total contained gold ounces does not include equivalent gold ounces for the by-product metals contained in the mineral reserves.
MANAGEMENT'S DISCUSSION AND ANALYSIS AGNICO EAGLE 35
Non-GAAP Financial Performance Measures
This MD&A presents certain financial performance measures, including adjusted net income, total cash costs per ounce of gold produced (on both a by-product and co-product basis), minesite costs per tonne and all-in sustaining costs per ounce of gold produced (on both a by-product and co-product basis), that are not recognized measures under IFRS. This data may not be comparable to data presented by other gold producers. Non-GAAP financial performance measures should be considered together with other data prepared in accordance with IFRS.
Adjusted Net Income
Adjusted net income is not a recognized measure under IFRS and this data may not be comparable to data presented by other gold producers. This measure is calculated by adjusting net income as recorded in the consolidated statements of income (loss) for non-recurring, unusual and other items. The Company believes that this generally accepted industry measure allows the evaluation of the results of continuing operations and is useful in making comparisons between periods. Adjusted net income is intended to provide investors with information about the Company's continuing income generating capabilities. Management uses this measure to monitor and plan for the operating performance of the Company in conjunction with other data prepared in accordance with IFRS. The Company does not exclude stock-based compensation expense in its calculation of adjusted net income. Stock option expense for the year ended December 31, 2019 was $16.1 million (2018 – $19.3 million; 2017 – $19.2 million).
| 2019 | 2018 | 2017 | |||||||||
(thousands of United States dollars) | |||||||||||
| Net income (loss) for the year | $ | 473,166 | $ | (326,701 | ) | $ | 240,795 | ||||
| Impairment loss on equity securities | – | – | 8,532 | ||||||||
| Foreign currency translation loss | 4,850 | 1,991 | 13,313 | ||||||||
| (Gain) loss on derivative financial instruments | (17,124 | ) | 6,065 | (17,898 | ) | ||||||
| Impairment reversal | (345,821 | ) | – | – | |||||||
| Impairment loss(i) | – | 389,693 | – | ||||||||
| Income and mining taxes adjustments(ii) | 118,820 | 7,629 | (24,921 | ) | |||||||
| Other(iii) | (4,447 | ) | (6,802 | ) | 14,006 | ||||||
| Adjusted net income for the year | $ | 229,444 | $ | 71,875 | $ | 233,827 | |||||
| Net income (loss) per share – basic | $ | 2.00 | $ | (1.40 | ) | $ | 1.05 | ||||
| Net income (loss) per share – diluted | $ | 1.99 | $ | (1.40 | ) | $ | 1.04 | ||||
| Adjusted net income per share – basic | $ | 0.97 | $ | 0.31 | $ | 1.02 | |||||
| Adjusted net income per share – diluted | $ | 0.96 | $ | 0.31 | $ | 1.01 | |||||
Notes:
- (i)
- The Company did not record a tax impact on the impairment loss as a result of the initial recognition exemption which does not require deferred tax to be recorded on goodwill or asset acquisitions.
- (ii)
- Income and mining taxes adjustments reflect foreign currency translation recorded to the income and mining taxes expense, recognition of previously unrecognized capital losses, the result of income and mining tax audits, impact of tax law changes, tax impact on impairment reversal, and reflective adjustments to prior period operating results.
- (iii)
- The Company includes certain adjustments in "Other" to the extent that management believes that these items are not reflective of the underlying performance of the Company's core operating business. Examples of items historically included in "Other" include changes in estimates of asset retirement obligations at closed sites and gains and losses on the disposal of assets.
Total Cash Costs per Ounce of Gold Produced and Minesite Costs per Tonne
The Company believes that total cash costs per ounce of gold produced and minesite costs per tonne are realistic indicators of operating performance and facilitate period over period comparisons. However, both of these non-GAAP generally accepted industry measures should be considered together with other data prepared in accordance with IFRS. These measures, taken by themselves, are not necessarily indicative of operating costs or cash flow measures prepared in accordance with IFRS.
36 AGNICO EAGLE MANAGEMENT'S DISCUSSION AND ANALYSIS
The total cash costs per ounce of gold produced is reported on both a by-product basis (deducting by-product metal revenues from production costs) and co-product basis (without deducting by-product metal revenues). The total cash costs per ounce of gold produced on a by-product basis is calculated by adjusting production costs as recorded in the consolidated statements of income (loss) for by-product revenues, inventory production costs, smelting, refining and marketing charges and other adjustments, and then dividing by the number of ounces of gold produced. The total cash costs per ounce of gold produced on a co-product basis is calculated in the same manner as the total cash costs per ounce of gold produced on a by-product basis, except that no adjustment is made for by-product metal revenues. Accordingly, the calculation of total cash costs per ounce of gold produced on a co-product basis does not reflect a reduction in production costs or smelting, refining and marketing charges associated with the production and sale of by-product metals. The total cash costs per ounce of gold produced is intended to provide information about the cash- generating capabilities of the Company's mining operations. Management also uses these measures to monitor the performance of the Company's mining operations. As market prices for gold are quoted on a per ounce basis, using the total cash costs per ounce of gold produced on a by-product basis measure allows management to assess a mine's cash-generating capabilities at various gold prices. Management is aware that these per ounce measures of performance can be affected by fluctuations in exchange rates and, in the case of total cash costs per ounce of gold produced on a by-product basis, by-product metal prices. Management compensates for these inherent limitations by using these measures in conjunction with minesite costs per tonne (discussed below) as well as other data prepared in accordance with IFRS. Management also performs sensitivity analysis in order to quantify the effects of fluctuating metal prices and exchange rates.
Agnico Eagle's primary business is gold production and the focus of its current operations and future development is on maximizing returns from gold production, with other metal production being incidental to the gold production process. Accordingly, all metals other than gold are considered by-products.
Total cash costs per ounce of gold produced is reported on a by-product basis because (i) the majority of the Company's revenues are gold revenues, (ii) the Company mines ore, which contains gold, silver, zinc, copper and other metals, (iii) it is not possible to specifically assign all costs to revenues from the gold, silver, zinc, copper and other metals the Company produces and (iv) it is a method used by management and the Board to monitor operations.
Minesite costs per tonne are calculated by adjusting production costs as recorded in the consolidated statements of income (loss) for inventory production costs and other adjustments, and then dividing by tonnes of ore processed. As the total cash costs per ounce of gold produced can be affected by fluctuations in by-product metal prices and foreign exchange rates, management believes that minesite costs per tonne provide additional information regarding the performance of mining operations, eliminating the impact of varying production levels. Management also uses this measure to determine the economic viability of mining blocks. As each mining block is evaluated based on the net realizable value of each tonne mined, in order to be economically viable the estimated revenue on a per tonne basis must be in excess of the minesite costs per tonne. Management is aware that this per tonne measure of performance can be impacted by fluctuations in production levels and compensates for this inherent limitation by using this measure in conjunction with processing costs prepared in accordance with IFRS.
The following tables set out a reconciliation of total cash costs per ounce of gold produced (on both a by-product basis and co-product basis) and minesite costs per tonne to production costs, exclusive of amortization, as presented in the consolidated statements of income (loss) in accordance with IFRS.
MANAGEMENT'S DISCUSSION AND ANALYSIS AGNICO EAGLE 37
Total Production Costs by Mine
| Year Ended December 31, 2019 | Year Ended December 31, 2018 | Year Ended December 31, 2017 | |||||||
(thousands of United States dollars) | |||||||||
| LaRonde mine | $ | 215,012 | $ | 228,294 | $ | 185,488 | |||
| LaRonde Zone 5 mine | 41,212 | 12,991 | – | ||||||
| Lapa mine | 2,844 | 27,870 | 38,786 | ||||||
| Goldex mine | 82,533 | 78,533 | 71,015 | ||||||
| Meadowbank Complex | 180,848 | 211,147 | 224,364 | ||||||
| Meliadine mine | 142,932 | – | – | ||||||
| Canadian Malartic mine(i) | 208,178 | 199,761 | 188,568 | ||||||
| Kittila mine | 142,517 | 157,032 | 148,272 | ||||||
| Pinos Altos mine | 130,190 | 138,362 | 108,726 | ||||||
| Creston Mascota mine | 35,801 | 37,270 | 31,490 | ||||||
| La India mine | 65,638 | 69,095 | 61,133 | ||||||
| Production costs per the consolidated statements of income (loss) | $ | 1,247,705 | $ | 1,160,355 | $ | 1,057,842 | |||
Reconciliation of Production Costs to Total Cash Costs per Ounce of Gold Produced(ii) by Mine and Reconciliation of Production Costs to Minesite Costs per Tonne(iii) by Mine
(thousands of United States dollars, except as noted)
| LaRonde Mine Per Ounce of Gold Produced(ii) | Year Ended December 31, 2019 | Year Ended December 31, 2018 | Year Ended December 31, 2017 | ||||||||||||||||||
(thousands) | ($ per ounce) | (thousands) | ($ per ounce) | (thousands) | ($ per ounce) | ||||||||||||||||
| Gold production (ounces) | 343,154 | 343,686 | 348,870 | ||||||||||||||||||
Production costs | $ | 215,012 | $ | 627 | $ | 228,294 | $ | 664 | $ | 185,488 | $ | 532 | |||||||||
| Inventory and other adjustments(iv) | 11,595 | 33 | (10,475 | ) | (30 | ) | 26,246 | 75 | |||||||||||||
| Cash operating costs (co-product basis) | $ | 226,607 | $ | 660 | $ | 217,819 | $ | 634 | $ | 211,734 | $ | 607 | |||||||||
| By-product metal revenues | (67,224 | ) | (196 | ) | (64,973 | ) | (189 | ) | (70,054 | ) | (201 | ) | |||||||||
| Cash operating costs (by-product basis) | $ | 159,383 | $ | 464 | $ | 152,846 | $ | 445 | $ | 141,680 | $ | 406 | |||||||||
| LaRonde Mine Per Tonne(iii) | Year Ended December 31, 2019 | Year Ended December 31, 2018 | Year Ended December 31, 2017 | ||||||||||||||||
(thousands) | ($ per tonne) | (thousands) | ($ per tonne) | (thousands) | ($ per tonne) | ||||||||||||||
| Tonnes of ore milled (thousands of tonnes) | 2,057 | 2,108 | 2,246 | ||||||||||||||||
Production costs | $ | 215,012 | $ | 105 | $ | 228,294 | $ | 108 | $ | 185,488 | $ | 83 | |||||||
| Production costs (C$) | C$ | 285,423 | C$ | 139 | C$ | 293,094 | C$ | 139 | C$ | 243,638 | C$ | 108 | |||||||
| Inventory and other adjustments (C$)(v) | (27,629 | ) | (14 | ) | (41,568 | ) | (20 | ) | (1,107 | ) | – | ||||||||
| Minesite operating costs (C$) | C$ | 257,794 | C$ | 125 | C$ | 251,526 | C$ | 119 | C$ | 242,531 | C$ | 108 | |||||||
38 AGNICO EAGLE MANAGEMENT'S DISCUSSION AND ANALYSIS
| LaRonde Zone 5 Mine Per Ounce of Gold Produced(ii)(vi) | Year Ended December 31, 2019 | Year Ended December 31, 2018 | Year Ended December 31, 2017 | |||||||||||||||||
(thousands) | ($ per ounce) | (thousands) | ($ per ounce) | (thousands) | ($ per ounce) | |||||||||||||||
| Gold production (ounces) | 59,830 | 18,620 | – | |||||||||||||||||
Production costs | $ | 41,212 | $ | 689 | $ | 12,991 | $ | 698 | $ | – | $ | – | ||||||||
| Inventory and other adjustments(iv) | 2,169 | 36 | 656 | 35 | – | – | ||||||||||||||
| Cash operating costs (co-product basis) | $ | 43,381 | $ | 725 | $ | 13,647 | $ | 733 | $ | – | $ | – | ||||||||
| By-product metal revenues | (185 | ) | (3 | ) | (21 | ) | (1 | ) | – | – | ||||||||||
| Cash operating costs (by-product basis) | $ | 43,196 | $ | 722 | $ | 13,626 | $ | 732 | $ | – | $ | – | ||||||||
| LaRonde Zone 5 Mine Per Tonne(iii)(vii) | Year Ended December 31, 2019 | Year Ended December 31, 2018 | Year Ended December 31, 2017 | ||||||||||||||||
(thousands) | ($ per tonne) | (thousands) | ($ per tonne) | (thousands) | ($ per tonne) | ||||||||||||||
| Tonnes of ore milled (thousands of tonnes) | 870 | 225 | – | ||||||||||||||||
Production costs | $ | 41,212 | $ | 47 | $ | 12,991 | $ | 58 | $ | – | $ | – | |||||||
| Production costs (C$) | C$ | 54,644 | C$ | 63 | C$ | 17,028 | C$ | 76 | C$ | – | C$ | – | |||||||
| Inventory and other adjustments (C$)(v) | 2,855 | 3 | 945 | 4 | – | – | |||||||||||||
| Minesite operating costs (C$) | C$ | 57,499 | C$ | 66 | C$ | 17,973 | C$ | 80 | C$ | – | C$ | – | |||||||
| Lapa Mine Per Ounce of Gold Produced(ii)(viii) | Year Ended December 31, 2019 | Year Ended December 31, 2018 | Year Ended December 31, 2017 | ||||||||||||||||||
(thousands) | ($ per ounce) | (thousands) | ($ per ounce) | (thousands) | ($ per ounce) | ||||||||||||||||
| Gold production (ounces) | – | 34,026 | 48,410 | ||||||||||||||||||
Production costs | $ | 2,844 | $ | – | $ | 27,870 | $ | 819 | $ | 38,786 | $ | 801 | |||||||||
| Inventory and other adjustments(iv) | (2,844 | ) | – | 1,843 | 54 | (2,143 | ) | (44 | ) | ||||||||||||
| Cash operating costs (co-product basis) | $ | – | $ | – | $ | 29,713 | $ | 873 | $ | 36,643 | $ | 757 | |||||||||
| By-product metal revenues | – | – | (26 | ) | (1 | ) | (112 | ) | (2 | ) | |||||||||||
| Cash operating costs (by-product basis) | $ | – | $ | – | $ | 29,687 | $ | 872 | $ | 36,531 | $ | 755 | |||||||||
| Lapa Mine Per Tonne(iii) | Year Ended December 31, 2019 | Year Ended December 31, 2018 | Year Ended December 31, 2017 | |||||||||||||||||
(thousands) | ($ per tonne) | (thousands) | ($ per tonne) | (thousands) | ($ per tonne) | |||||||||||||||
| Tonnes of ore milled (thousands of tonnes) | – | 311 | 398 | |||||||||||||||||
Production costs | $ | 2,844 | $ | – | $ | 27,870 | $ | 90 | $ | 38,786 | $ | 97 | ||||||||
| Production costs (C$) | C$ | 3,723 | C$ | – | C$ | 35,854 | C$ | 115 | C$ | 50,976 | C$ | 128 | ||||||||
| Inventory and other adjustments (C$)(v) | (3,723 | ) | – | 2,369 | 8 | (3,166 | ) | (8 | ) | |||||||||||
| Minesite operating costs (C$) | C$ | – | C$ | – | C$ | 38,223 | C$ | 123 | C$ | 47,810 | C$ | 120 | ||||||||
MANAGEMENT'S DISCUSSION AND ANALYSIS AGNICO EAGLE 39
| Goldex Mine Per Ounce of Gold Produced(ii)(ix) | Year Ended December 31, 2019 | Year Ended December 31, 2018 | Year Ended December 31, 2017 | ||||||||||||||||||
(thousands) | ($ per ounce) | (thousands) | ($ per ounce) | (thousands) | ($ per ounce) | ||||||||||||||||
| Gold production (ounces) | 140,884 | 121,167 | 110,906 | ||||||||||||||||||
Production costs | $ | 82,533 | $ | 586 | $ | 78,533 | $ | 648 | $ | 71,015 | $ | 640 | |||||||||
| Inventory and other adjustments(iv) | (289 | ) | (2 | ) | (219 | ) | (2 | ) | (3,289 | ) | (29 | ) | |||||||||
| Cash operating costs (co-product basis) | $ | 82,244 | $ | 584 | $ | 78,314 | $ | 646 | $ | 67,726 | $ | 611 | |||||||||
| By-product metal revenues | (33 | ) | – | (25 | ) | – | (24 | ) | (1 | ) | |||||||||||
| Cash operating costs (by-product basis) | $ | 82,211 | $ | 584 | $ | 78,289 | $ | 646 | $ | 67,702 | $ | 610 | |||||||||
| Goldex Mine Per Tonne(iii)(x) | Year Ended December 31, 2019 | Year Ended December 31, 2018 | Year Ended December 31, 2017 | |||||||||||||||||
(thousands) | ($ per tonne) | (thousands) | ($ per tonne) | (thousands) | ($ per tonne) | |||||||||||||||
| Tonnes of ore milled (thousands of tonnes) | 2,785 | 2,625 | 2,396 | |||||||||||||||||
Production costs | $ | 82,533 | $ | 30 | $ | 78,533 | $ | 30 | $ | 71,015 | $ | 30 | ||||||||
| Production costs (C$) | C$ | 109,373 | C$ | 39 | C$ | 101,787 | C$ | 39 | C$ | 91,998 | C$ | 38 | ||||||||
| Inventory and other adjustments (C$)(v) | (245 | ) | – | 44 | – | (2,404 | ) | (1 | ) | |||||||||||
| Minesite operating costs (C$) | C$ | 109,128 | C$ | 39 | C$ | 101,831 | C$ | 39 | C$ | 89,594 | C$ | 37 | ||||||||
| Meadowbank Complex Per Ounce of Gold Produced(ii)(xi) | Year Ended December 31, 2019 | Year Ended December 31, 2018 | Year Ended December 31, 2017 | ||||||||||||||||||
(thousands) | ($ per ounce) | (thousands) | ($ per ounce) | (thousands) | ($ per ounce) | ||||||||||||||||
| Gold production (ounces) | 158,208 | 248,997 | 352,526 | ||||||||||||||||||
Production costs | $ | 180,848 | $ | 1,143 | $ | 211,147 | $ | 848 | $ | 224,364 | $ | 636 | |||||||||
| Inventory and other adjustments(iv) | 2,859 | 18 | (5,769 | ) | (23 | ) | (3,127 | ) | (8 | ) | |||||||||||
| Cash operating costs (co-product basis) | $ | 183,707 | $ | 1,161 | $ | 205,378 | $ | 825 | $ | 221,237 | $ | 628 | |||||||||
| By-product metal revenues | (1,391 | ) | (9 | ) | (2,685 | ) | (11 | ) | (4,714 | ) | (14 | ) | |||||||||
| Cash operating costs (by-product basis) | $ | 182,316 | $ | 1,152 | $ | 202,693 | $ | 814 | $ | 216,523 | $ | 614 | |||||||||
| Meadowbank Complex Per Tonne(iii)(xii) | Year Ended December 31, 2019 | Year Ended December 31, 2018 | Year Ended December 31, 2017 | ||||||||||||||||
(thousands) | ($ per tonne) | (thousands) | ($ per tonne) | (thousands) | ($ per tonne) | ||||||||||||||
| Tonnes of ore milled (thousands of tonnes) | 2,381 | 3,262 | 3,853 | ||||||||||||||||
Production costs | $ | 180,848 | $ | 76 | $ | 211,147 | $ | 65 | $ | 224,364 | $ | 58 | |||||||
| Production costs (C$) | C$ | 240,014 | C$ | 101 | C$ | 272,140 | C$ | 83 | C$ | 292,216 | C$ | 76 | |||||||
| Inventory and other adjustments (C$)(v) | 6,292 | 2 | (4,477 | ) | (1 | ) | 1,512 | – | |||||||||||
| Minesite operating costs (C$) | C$ | 246,306 | C$ | 103 | C$ | 267,663 | C$ | 82 | C$ | 293,728 | C$ | 76 | |||||||
40 AGNICO EAGLE MANAGEMENT'S DISCUSSION AND ANALYSIS
| Meliadine Mine Per Ounce of Gold Produced(ii)(xiii) | Year Ended December 31, 2019 | Year Ended December 31, 2018 | Year Ended December 31, 2017 | |||||||||||||||||
(thousands) | ($ per ounce) | (thousands) | ($ per ounce) | (thousands) | ($ per ounce) | |||||||||||||||
| Gold production (ounces) | 191,113 | – | – | |||||||||||||||||
Production costs | $ | 142,932 | $ | 748 | $ | – | $ | – | $ | – | $ | – | ||||||||
| Inventory and other adjustments(iv) | 389 | 2 | – | – | – | – | ||||||||||||||
| Cash operating costs (co-product basis) | $ | 143,321 | $ | 750 | $ | – | $ | – | $ | – | $ | – | ||||||||
| By-product metal revenues | (286 | ) | (2 | ) | – | – | – | – | ||||||||||||
| Cash operating costs (by-product basis) | $ | 143,035 | $ | 748 | $ | – | $ | – | $ | – | $ | – | ||||||||
| Meliadine Mine Per Tonne(iii)(xiv) | Year Ended December 31, 2019 | Year Ended December 31, 2018 | Year Ended December 31, 2017 | ||||||||||||||||
(thousands) | ($ per tonne) | (thousands) | ($ per tonne) | (thousands) | ($ per tonne) | ||||||||||||||
| Tonnes of ore milled (thousands of tonnes) | 773 | – | – | ||||||||||||||||
Production costs | $ | 142,932 | $ | 185 | $ | – | $ | – | $ | – | $ | – | |||||||
| Production costs (C$) | C$ | 188,680 | C$ | 244 | C$ | – | C$ | – | C$ | – | C$ | – | |||||||
| Inventory and other adjustments (C$)(v) | 1,409 | 2 | – | – | – | – | |||||||||||||
| Minesite operating costs (C$) | C$ | 190,089 | C$ | 246 | C$ | – | C$ | – | C$ | – | C$ | – | |||||||
| Canadian Malartic Mine(i) Per Ounce of Gold Produced(ii)(xv) | Year Ended December 31, 2019 | Year Ended December 31, 2018 | Year Ended December 31, 2017 | ||||||||||||||||||
(thousands) | ($ per ounce) | (thousands) | ($ per ounce) | (thousands) | ($ per ounce) | ||||||||||||||||
| Gold production (ounces) | 331,459 | 348,600 | 316,731 | ||||||||||||||||||
Production costs | $ | 208,178 | $ | 628 | $ | 199,761 | $ | 573 | $ | 188,568 | $ | 595 | |||||||||
| Inventory and other adjustments(iv) | (723 | ) | (2 | ) | 1,947 | 6 | (497 | ) | (1 | ) | |||||||||||
| Cash operating costs (co-product basis) | $ | 207,455 | $ | 626 | $ | 201,708 | $ | 579 | $ | 188,071 | $ | 594 | |||||||||
| By-product metal revenues | (6,711 | ) | (20 | ) | (6,806 | ) | (20 | ) | (5,759 | ) | (18 | ) | |||||||||
| Cash operating costs (by-product basis) | $ | 200,744 | $ | 606 | $ | 194,902 | $ | 559 | $ | 182,312 | $ | 576 | |||||||||
| Canadian Malartic Mine(i) Per Tonne(iii)(xvi) | Year Ended December 31, 2019 | Year Ended December 31, 2018 | Year Ended December 31, 2017 | ||||||||||||||||
(thousands) | ($ per tonne) | (thousands) | ($ per tonne) | (thousands) | ($ per tonne) | ||||||||||||||
| Tonnes of ore milled (thousands of tonnes) | 10,391 | 10,242 | 10,179 | ||||||||||||||||
Production costs | $ | 208,178 | $ | 20 | $ | 199,761 | $ | 20 | $ | 188,568 | $ | 19 | |||||||
| Production costs (C$) | C$ | 274,786 | C$ | 26 | C$ | 258,291 | C$ | 25 | C$ | 243,903 | C$ | 24 | |||||||
| Inventory and other adjustments (C$)(v) | (2,201 | ) | – | 2,972 | – | (3,567 | ) | – | |||||||||||
| Minesite operating costs (C$) | C$ | 272,585 | C$ | 26 | C$ | 261,263 | C$ | 25 | C$ | 240,336 | C$ | 24 | |||||||
MANAGEMENT'S DISCUSSION AND ANALYSIS AGNICO EAGLE 41
| Kittila Mine Per Ounce of Gold Produced(ii) | Year Ended December 31, 2019 | Year Ended December 31, 2018 | Year Ended December 31, 2017 | ||||||||||||||||||
(thousands) | ($ per ounce) | (thousands) | ($ per ounce) | (thousands) | ($ per ounce) | ||||||||||||||||
| Gold production (ounces) | 186,101 | 188,979 | 196,938 | ||||||||||||||||||
Production costs | $ | 142,517 | $ | 766 | $ | 157,032 | $ | 831 | $ | 148,272 | $ | 753 | |||||||||
| Inventory and other adjustments(iv) | (5,314 | ) | (29 | ) | 4,374 | 23 | 213 | 1 | |||||||||||||
| Cash operating costs (co-product basis) | $ | 137,203 | $ | 737 | $ | 161,406 | $ | 854 | $ | 148,485 | $ | 754 | |||||||||
| By-product metal revenues | (238 | ) | (1 | ) | (186 | ) | (1 | ) | (192 | ) | (1 | ) | |||||||||
| Cash operating costs (by-product basis) | $ | 136,965 | $ | 736 | $ | 161,220 | $ | 853 | $ | 148,293 | $ | 753 | |||||||||
| Kittila Mine Per Tonne(iii) | Year Ended December 31, 2019 | Year Ended December 31, 2018 | Year Ended December 31, 2017 | ||||||||||||||||
(thousands) | ($ per tonne) | (thousands) | ($ per tonne) | (thousands) | ($ per tonne) | ||||||||||||||
| Tonnes of ore milled (thousands of tonnes) | 1,591 | 1,827 | 1,685 | ||||||||||||||||
Production costs | $ | 142,517 | $ | 90 | $ | 157,032 | $ | 86 | $ | 148,272 | $ | 88 | |||||||
| Production costs (€) | € | 127,355 | € | 80 | € | 133,817 | € | 73 | € | 131,111 | € | 78 | |||||||
| Inventory and other adjustments (€)(v) | (5,882 | ) | (4 | ) | 2,545 | 2 | (79 | ) | – | ||||||||||
| Minesite operating costs (€) | € | 121,473 | € | 76 | € | 136,362 | € | 75 | € | 131,032 | € | 78 | |||||||
| Pinos Altos Mine Per Ounce of Gold Produced(ii) | Year Ended December 31, 2019 | Year Ended December 31, 2018 | Year Ended December 31, 2017 | ||||||||||||||||||
(thousands) | ($ per ounce) | (thousands) | ($ per ounce) | (thousands) | ($ per ounce) | ||||||||||||||||
| Gold production (ounces) | 155,124 | 181,057 | 180,859 | ||||||||||||||||||
Production costs | $ | 130,190 | $ | 839 | $ | 138,362 | $ | 764 | $ | 108,726 | $ | 601 | |||||||||
| Inventory and other adjustments(iv) | 4,229 | 28 | (2,767 | ) | (15 | ) | 5,926 | 33 | |||||||||||||
| Cash operating costs (co-product basis) | $ | 134,419 | $ | 867 | $ | 135,595 | $ | 749 | $ | 114,652 | $ | 634 | |||||||||
| By-product metal revenues | (35,322 | ) | (228 | ) | (36,301 | ) | (201 | ) | (43,169 | ) | (239 | ) | |||||||||
| Cash operating costs (by-product basis) | $ | 99,097 | $ | 639 | $ | 99,294 | $ | 548 | $ | 71,483 | $ | 395 | |||||||||
| Pinos Altos Mine Per Tonne(iii) | Year Ended December 31, 2019 | Year Ended December 31, 2018 | Year Ended December 31, 2017 | ||||||||||||||||
(thousands) | ($ per tonne) | (thousands) | ($ per tonne) | (thousands) | ($ per tonne) | ||||||||||||||
| Tonnes of ore processed (thousands of tonnes) | 2,007 | 2,218 | 2,308 | ||||||||||||||||
Production costs | $ | 130,190 | $ | 65 | $ | 138,362 | $ | 62 | $ | 108,726 | $ | 47 | |||||||
| Inventory and other adjustments(v) | 3,074 | 1 | (3,061 | ) | (1 | ) | 6,065 | 3 | |||||||||||
| Minesite operating costs | $ | 133,264 | $ | 66 | $ | 135,301 | $ | 61 | $ | 114,791 | $ | 50 | |||||||
42 AGNICO EAGLE MANAGEMENT'S DISCUSSION AND ANALYSIS
| Creston Mascota Mine Per Ounce of Gold Produced(ii) | Year Ended December 31, 2019 | Year Ended December 31, 2018 | Year Ended December 31, 2017 | ||||||||||||||||||
(thousands) | ($ per ounce) | (thousands) | ($ per ounce) | (thousands) | ($ per ounce) | ||||||||||||||||
| Gold production (ounces) | 48,380 | 40,180 | 48,384 | ||||||||||||||||||
Production costs | $ | 35,801 | $ | 740 | $ | 37,270 | $ | 928 | $ | 31,490 | $ | 651 | |||||||||
| Inventory and other adjustments(iv) | 678 | 14 | 1,326 | 33 | 862 | 18 | |||||||||||||||
| Cash operating costs (co-product basis) | $ | 36,479 | $ | 754 | $ | 38,596 | $ | 961 | $ | 32,352 | $ | 669 | |||||||||
| By-product metal revenues | (9,671 | ) | (200 | ) | (4,818 | ) | (120 | ) | (4,535 | ) | (94 | ) | |||||||||
| Cash operating costs (by-product basis) | $ | 26,808 | $ | 554 | $ | 33,778 | $ | 841 | $ | 27,817 | $ | 575 | |||||||||
| Creston Mascota Mine Per Tonne(iii) | Year Ended December 31, 2019 | Year Ended December 31, 2018 | Year Ended December 31, 2017 | ||||||||||||||||
(thousands) | ($ per tonne) | (thousands) | ($ per tonne) | (thousands) | ($ per tonne) | ||||||||||||||
| Tonnes of ore processed (thousands of tonnes) | 1,067 | 1,422 | 2,196 | ||||||||||||||||
Production costs | $ | 35,801 | $ | 34 | $ | 37,270 | $ | 26 | $ | 31,490 | $ | 14 | |||||||
| Inventory and other adjustments(v) | (122 | ) | (1 | ) | 853 | 1 | 559 | 1 | |||||||||||
| Minesite operating costs | $ | 35,679 | $ | 33 | $ | 38,123 | $ | 27 | $ | 32,049 | $ | 15 | |||||||
| La India Mine Per Ounce of Gold Produced(ii) | Year Ended December 31, 2019 | Year Ended December 31, 2018 | Year Ended December 31, 2017 | ||||||||||||||||||
(thousands) | ($ per ounce) | (thousands) | ($ per ounce) | (thousands) | ($ per ounce) | ||||||||||||||||
| Gold production (ounces) | 82,190 | 101,357 | 101,150 | ||||||||||||||||||
Production costs | $ | 65,638 | $ | 799 | $ | 69,095 | $ | 682 | $ | 61,133 | $ | 604 | |||||||||
| Inventory and other adjustments(iv) | 4,166 | 50 | 3,084 | 30 | 2,958 | 30 | |||||||||||||||
| Cash operating costs (co-product basis) | $ | 69,804 | $ | 849 | $ | 72,179 | $ | 712 | $ | 64,091 | $ | 634 | |||||||||
| By-product metal revenues | (2,184 | ) | (26 | ) | (2,777 | ) | (27 | ) | (5,392 | ) | (54 | ) | |||||||||
| Cash operating costs (by-product basis) | $ | 67,620 | $ | 823 | $ | 69,402 | $ | 685 | $ | 58,699 | $ | 580 | |||||||||
| La India Mine Per Tonne(iii) | Year Ended December 31, 2019 | Year Ended December 31, 2018 | Year Ended December 31, 2017 | ||||||||||||||||
(thousands) | ($ per tonne) | (thousands) | ($ per tonne) | (thousands) | ($ per tonne) | ||||||||||||||
| Tonnes of ore processed (thousands of tonnes) | 5,402 | 6,128 | 5,965 | ||||||||||||||||
Production costs | $ | 65,638 | $ | 12 | $ | 69,095 | $ | 11 | $ | 61,133 | $ | 10 | |||||||
| Inventory and other adjustments(v) | 2,591 | 1 | 2,109 | 1 | 1,545 | 1 | |||||||||||||
| Minesite operating costs | $ | 68,229 | $ | 13 | $ | 71,204 | $ | 12 | $ | 62,678 | $ | 11 | |||||||
MANAGEMENT'S DISCUSSION AND ANALYSIS AGNICO EAGLE 43
Notes:
- (i)
- The information set out in this table reflects the Company's 50% interest in the Canadian Malartic mine.
- (ii)
- The total cash costs per ounce of gold produced is not a recognized measure under IFRS and this data may not be comparable to data reported by other gold producers. The total cash costs per ounce of gold produced is reported on both a by-product basis (deducting by-product metal revenues from production costs) and co-product basis (without deducting by-product metal revenues). The total cash costs per ounce of gold produced on a by-product basis is calculated by adjusting production costs as recorded in the consolidated statements of income (loss) for by-product revenues, inventory production costs, smelting, refining and marketing charges and other adjustments, and then dividing by the number of ounces of gold produced. The total cash costs per ounce of gold produced on a co-product basis is calculated in the same manner as the total cash costs per ounce of gold produced on a by-product basis except that no adjustment is made for by-product metal revenues. Accordingly, the calculation of total cash costs per ounce of gold produced on a co-product basis does not reflect a reduction in production costs or smelting, refining and marketing charges associated with the production and sale of by-product metals. The total cash costs per ounce of gold produced is intended to provide information about the cash-generating capabilities of the Company's mining operations. Management also uses these measures to monitor the performance of the Company's mining operations. As market prices for gold are quoted on a per ounce basis, using the total cash costs per ounce of gold produced on a by-product basis measure allows management to assess a mine's cash-generating capabilities at various gold prices. Management is aware that these per ounce measures of performance can be affected by fluctuations in exchange rates and, in the case of total cash costs of gold produced on a by-product basis, by-product metal prices. Management compensates for these inherent limitations by using these measures in conjunction with minesite costs per tonne as well as other data prepared in accordance with IFRS. Management also performs sensitivity analysis in order to quantify the effects of fluctuating metal prices and exchange rates.
- (iii)
- Minesite costs per tonne is not a recognized measure under IFRS and this data may not be comparable to data reported by other gold producers. Minesite costs per tonne are calculated by adjusting production costs as recorded in the consolidated statements of income (loss) for inventory production costs and other adjustments, and then dividing by tonnes of ore processed. As the total cash costs per ounce of gold produced can be affected by fluctuations in by-product metal prices and foreign exchange rates, management believes that minesite costs per tonne provide additional information regarding the performance of mining operations, eliminating the impact of varying production levels. Management also uses this measure to determine the economic viability of mining blocks. As each mining block is evaluated based on the net realizable value of each tonne mined, in order to be economically viable the estimated revenue on a per tonne basis must be in excess of the minesite costs per tonne. Management is aware that this per tonne measure of performance can be impacted by fluctuations in processing levels and compensates for this inherent limitation by using this measure in conjunction with production costs prepared in accordance with IFRS.
- (iv)
- Under the Company's revenue recognition policy, revenue from contracts with customers is recognized upon the transfer of control over metals sold to the customer. As total cash costs per ounce of gold produced are calculated on a production basis, an inventory adjustment is made to reflect the portion of production not yet recognized as revenue. Other adjustments include the addition of smelting, refining and marketing charges to production costs.
- (v)
- This inventory and other adjustment reflects production costs associated with the portion of production still in inventory and smelting, refining and marketing charges associated with production.
- (vi)
- The LZ5 mine's per ounce of gold production calculations for the year ended December 31, 2017 exclude 515 ounces of payable gold production and the associated costs which were produced prior to the achievement of commercial production.
- (vii)
- The LZ5 mine's per tonne calculations for the year ended December 31, 2017 exclude 7,709 tonnes and the associated costs which were processed prior to the achievement of commercial production.
- (viii)
- The Lapa mine's cost calculations per ounce of gold produced for the year ended December 31, 2019 exclude 5 ounces of payable gold production, which were credited to the Company as a result of final refining reconciliation following the cessation of mining and processing operations at the Lapa mine on December 31, 2018. In addition, the Lapa mine's per ounce of gold production calculations for the year ended December 31, 2017 exclude 203 ounces of payable gold production as a result of the Lapa mill being placed on temporary maintenance.
- (ix)
- The Goldex mine's per ounce of gold production calculations for the year ended December 31, 2017 exclude 8,041 ounces of payable gold production and the associated costs related to the Deep 1 Zone which were produced prior to the achievement of commercial production.
- (x)
- The Goldex mine's per tonne calculations for the year ended December 31, 2017 exclude 175,514 tonnes processed and the associated costs related to the Deep 1 Zone which were processed prior to the achievement of commercial production.
- (xi)
- The Meadowbank Complex's cost calculations per ounce of gold produced for the year ended December 31, 2019 exclude 35,281 ounces of payable gold production which were produced prior to the achievement of commercial production at the Amaruq satellite deposit on September 30, 2019.
- (xii)
- The Meadowbank Complex's cost calculations per tonne for the year ended December 31, 2019 exclude 369,519 tonnes which were processed prior to the achievement of commercial production at the Amaruq satellite deposit on September 30, 2019.
- (xiii)
- The Meliadine mine's cost calculations per ounce of gold produced for the year ended December 31, 2019 exclude 47,281 ounces of payable gold production which were produced prior to the achievement of commercial production on May 14, 2019.
- (xiv)
- The Meliadine mine's cost calculations per tonne for the year ended December 31, 2019 exclude 263,749 tonnes which were processed prior to the achievement of commercial production on May 14, 2019.
- (xv)
- The Canadian Malartic mine's cost calculations per ounce of gold produced for the year ended December 31, 2019 exclude 3,137 ounces of payable gold production which were produced during this period as commercial production at the Barnat deposit has not yet been achieved.
- (xvi)
- The Canadian Malartic mine's cost calculations per tonne for the year ended December 31, 2019 exclude 133,615 tonnes which were processed during this period as commercial production at the Barnat deposit has not yet been achieved.
44 AGNICO EAGLE MANAGEMENT'S DISCUSSION AND ANALYSIS
All-in Sustaining Costs per Ounce of Gold Produced
The WGC is a non-regulatory market development organization for the gold industry. Although the WGC is not a mining industry regulatory organization, it has worked closely with its member companies to develop relevant non-GAAP measures. The Company follows the guidance on all-in sustaining costs released by the WGC in November 2018. Adoption of the all-in sustaining costs metric is voluntary and, notwithstanding the Company's adoption of the WGC's guidance, all-in sustaining costs per ounce of gold produced reported by the Company may not be comparable to data reported by other gold mining companies. The Company believes that this measure provides helpful information about operating performance. However, this non-GAAP measure should be considered together with other data prepared in accordance with IFRS as it is not necessarily indicative of operating costs or cash flow measures prepared in accordance with IFRS.
All-in sustaining costs per ounce is used to show the full cost of gold production from current operations. The Company calculates all-in sustaining costs per ounce of gold produced on a by-product basis as the aggregate of total cash costs per ounce on a by-product basis, sustaining capital expenditures (including capitalized exploration), general and administrative expenses (including stock options), lease payments related to sustaining assets and reclamation expenses, and then dividing by the number of ounces of gold produced. The all-in sustaining costs per ounce of gold produced on a co-product basis is calculated in the same manner as the all-in sustaining costs per ounce of gold produced on a by-product basis, except that the total cash costs per ounce on a co-product basis is used, meaning no adjustment is made for by-product metal revenues. The Company's methodology for calculating all-in sustaining costs per ounce may differ from the methodology used by other gold mining companies that disclose all-in sustaining costs per ounce. The Company may change the methodology it uses to calculate all-in sustaining costs per ounce in the future.
The following table sets out a reconciliation of production costs to all-in sustaining costs per ounce of gold produced for the years ended December 31, 2019, December 31, 2018 and December 31, 2017 on both a by-product basis (deducting by-product metal revenues from production costs) and co-product basis (without deducting by-product metal revenues).
Reconciliation of Production Costs to All-in Sustaining Costs per Ounce of Gold Produced
| (United States dollars per ounce of gold produced, except where noted) | Year Ended December 31, 2019 | Year Ended December 31, 2018 | Year Ended December 31, 2017 | |||||
| Production costs per the consolidated statements of income (loss) (thousands of United States dollars) | $1,247,705 | $1,160,355 | $1,057,842 | |||||
| Adjusted gold production (ounces)(i)(ii)(iii)(iv)(v)(vi) | 1,696,443 | 1,626,669 | 1,704,774 | |||||
| Production costs per ounce of adjusted gold production | $735 | $713 | $621 | |||||
| Adjustments: | ||||||||
| Inventory and other adjustments(vii) | 10 | (3) | 16 | |||||
| Total cash costs per ounce of gold produced (co-product basis)(viii) | $745 | $710 | $637 | |||||
| By-product metal revenues | (72) | (73) | (79) | |||||
| Total cash costs per ounce of gold produced (by-product basis)(viii) | $673 | $637 | $558 | |||||
| Adjustments: | ||||||||
| Sustaining capital expenditures (including capitalized exploration) | 185 | 159 | 176 | |||||
| General and administrative expenses (including stock options) | 71 | 77 | 67 | |||||
| Non-cash reclamation provision, sustaining leases and other | 9 | 4 | 3 | |||||
| All-in sustaining costs per ounce of gold produced (by-product basis) | $938 | $877 | $804 | |||||
| By-product metal revenues | 72 | 73 | 79 | |||||
| All-in sustaining costs per ounce of gold produced (co-product basis) | $1,010 | $950 | $883 | |||||
MANAGEMENT'S DISCUSSION AND ANALYSIS AGNICO EAGLE 45
Notes:
- (i)
- Adjusted gold production for the year ended December 31, 2017 excludes 515 ounces of payable gold production at the LZ5 mine, which were produced prior to the achievement of commercial production.
- (ii)
- Adjusted gold production for the year ended December 31, 2017 excludes 8,041 ounces of payable gold production at the Goldex mine, which were produced prior to the achievement of commercial production at the Deep 1 Zone.
- (iii)
- Adjusted gold production for the year ended December 31, 2019 excludes 5 ounces of payable gold production at the Lapa mine which were credited to the Company as a result of final refining reconciliation following the cessation of mining and processing operations at the site on December 31, 2018. In addition, the Lapa mine's adjusted gold production for the year ended December 31, 2017 excludes 203 ounces of payable gold production as a result of the Lapa mill being placed on temporary maintenance.
- (iv)
- Adjusted gold production for the year ended December 31, 2019 excludes 35,281 ounces of payable gold production at the Meadowbank Complex, which were produced prior to the achievement of commercial production at the Amaruq satellite deposit on September 30, 2019.
- (v)
- Adjusted gold production for the year ended December 31, 2019 excludes 47,281 ounces of payable gold production at the Meliadine mine, which were produced prior to the achievement of commercial production on May 14, 2019.
- (vi)
- Adjusted gold production for the year ended December 31, 2019 excludes 3,137 ounces of payable gold production at the Canadian Malartic mine, which were produced during this period as commercial production at the Barnat deposit has not yet been achieved.
- (vii)
- Under the Company's revenue recognition policy, revenue from contracts with customers is recognized upon transfer of control over metals sold to the customer. As total cash costs per ounce of gold produced are calculated on a production basis, an inventory adjustment is made to reflect the portion of production not yet recognized as revenue. Other adjustments are represented by the inclusion of smelting, refining and marketing charges and exclusion of charges not directly associated with the production of minerals.
- (viii)
- The total cash costs per ounce of gold produced is not a recognized measure under IFRS and this data may not be comparable to data reported by other gold producers. The total cash costs per ounce of gold produced is reported on both a by-product basis (deducting by-product metal revenues from production costs) and co-product basis (without deducting by-product metal revenues). The total cash costs per ounce of gold produced on a by-product basis is calculated by adjusting production costs as recorded in the consolidated statements of income (loss) for by-product revenues, inventory production costs, smelting, refining and marketing charges and other adjustments, and then dividing by the number of ounces of gold produced. The total cash costs per ounce of gold produced on a co-product basis is calculated in the same manner as the total cash costs per ounce of gold produced on a by-product basis, except that no adjustment is made for by-product metal revenues. Accordingly, the calculation of total cash costs per ounce of gold produced on a co-product basis does not reflect a reduction in production costs or smelting, refining and marketing charges associated with the production and sale of by-product metals. The total cash costs per ounce of gold produced is intended to provide information about the cash-generating capabilities of the Company's mining operations. Management also uses these measures to monitor the performance of the Company's mining operations. As market prices for gold are quoted on a per ounce basis, using the total cash costs per ounce of gold produced on a by-product basis measure allows management to assess a mine's cash-generating capabilities at various gold prices. Management is aware that these per ounce measures of performance can be affected by fluctuations in exchange rates and, in the case of total cash costs of gold produced on a by-product basis, by-product metal prices. Management compensates for these inherent limitations by using these measures in conjunction with minesite costs per tonne as well as other data prepared in accordance with IFRS. Management also performs sensitivity analysis in order to quantify the effects of fluctuating metal prices and exchange rates.
46 AGNICO EAGLE MANAGEMENT'S DISCUSSION AND ANALYSIS
AGNICO EAGLE MINES LIMITED
SUMMARIZED QUARTERLY DATA
(thousands of United States dollars, except where noted)
| Three Months Ended | ||||||||||||||||||
| March 31, 2019 | June 30, 2019 | September 30, 2019 | December 31, 2019 | Total 2019 | ||||||||||||||
| Operating margin(i): | ||||||||||||||||||
| Revenues from mining operations | $ | 532,223 | $ | 526,611 | $ | 682,959 | $ | 753,099 | $ | 2,494,892 | ||||||||
| Production costs | 276,893 | 279,497 | 316,346 | 374,969 | 1,247,705 | |||||||||||||
| Total operating margin(i) | 255,330 | 247,114 | 366,613 | 378,130 | 1,247,187 | |||||||||||||
| Operating margin(i) by mine: | ||||||||||||||||||
| Northern Business | ||||||||||||||||||
| LaRonde mine | 65,202 | 66,902 | 93,223 | 111,865 | 337,192 | |||||||||||||
| LaRonde Zone 5 mine | 5,079 | 8,882 | 12,238 | 12,954 | 39,153 | |||||||||||||
| Lapa mine | 2,033 | – | – | – | 2,033 | |||||||||||||
| Goldex mine | 24,964 | 25,126 | 33,197 | 31,200 | 114,487 | |||||||||||||
| Meadowbank Complex | 19,030 | 9,244 | 9,227 | 3,303 | 40,804 | |||||||||||||
| Meliadine mine | – | 15,033 | 50,323 | 61,970 | 127,326 | |||||||||||||
| Canadian Malartic mine(ii) | 54,629 | 60,232 | 70,263 | 73,015 | 258,139 | |||||||||||||
| Kittila mine | 25,239 | 8,205 | 44,696 | 39,666 | 117,806 | |||||||||||||
| Southern Business | ||||||||||||||||||
| Pinos Altos mine | 34,099 | 27,281 | 30,003 | 28,004 | 119,387 | |||||||||||||
| Creston Mascota mine | 11,115 | 14,863 | 12,203 | 4,041 | 42,222 | |||||||||||||
| La India mine | 13,940 | 11,346 | 11,240 | 12,112 | 48,638 | |||||||||||||
| Total operating margin(i) | 255,330 | 247,114 | 366,613 | 378,130 | 1,247,187 | |||||||||||||
| Gain on impairment reversal | – | – | – | (345,821 | ) | (345,821 | ) | |||||||||||
| Amortization of property, plant and mine development | 128,242 | 124,203 | 143,293 | 150,319 | 546,057 | |||||||||||||
| Exploration, corporate and other | 74,567 | 80,091 | 83,864 | 69,687 | 308,209 | |||||||||||||
| Income before income and mining taxes | 52,521 | 42,820 | 139,456 | 503,945 | 738,742 | |||||||||||||
| Income and mining taxes | 15,489 | 15,048 | 62,789 | 172,250 | 265,576 | |||||||||||||
| Net income for the period | $ | 37,032 | $ | 27,772 | $ | 76,667 | $ | 331,695 | $ | 473,166 | ||||||||
| Net income per share – basic (US$) | $ | 0.16 | $ | 0.12 | $ | 0.32 | $ | 1.39 | $ | 2.00 | ||||||||
| Net income per share – diluted (US$) | $ | 0.16 | $ | 0.12 | $ | 0.32 | $ | 1.38 | $ | 1.99 | ||||||||
Cash flows: | ||||||||||||||||||
| Cash provided by operating activities | $ | 148,690 | $ | 126,301 | $ | 349,233 | $ | 257,468 | $ | 881,692 | ||||||||
| Cash used in investing activities | $ | (227,606 | ) | $ | (233,238 | ) | $ | (245,829 | ) | $ | (167,211 | ) | $ | (873,884 | ) | |||
| Cash (used in) provided by financing activities | $ | (33,454 | ) | $ | 34,906 | $ | 37,249 | $ | (28,091 | ) | $ | 10,610 | ||||||
MANAGEMENT'S DISCUSSION AND ANALYSIS AGNICO EAGLE 47
| Three Months Ended | |||||||||||||||||
| March 31, 2019 | June 30, 2019 | September 30, 2019 | December 31, 2019 | Total 2019 | |||||||||||||
| Realized prices (US$): | |||||||||||||||||
| Gold (per ounce) | $ | 1,303 | $ | 1,318 | $ | 1,480 | $ | 1,489 | $ | 1,406 | |||||||
| Silver (per ounce) | $ | 15.65 | $ | 14.83 | $ | 17.46 | $ | 17.55 | $ | 16.38 | |||||||
| Zinc (per tonne) | $ | 2,673 | $ | 2,811 | $ | 2,415 | $ | 2,398 | $ | 2,607 | |||||||
| Copper (per tonne) | $ | 6,087 | $ | 6,036 | $ | 5,569 | $ | 5,948 | $ | 5,892 | |||||||
| Payable production(iii): | |||||||||||||||||
| Gold (ounces) | |||||||||||||||||
| Northern Business | |||||||||||||||||
| LaRonde mine | 77,433 | 76,587 | 91,664 | 97,470 | 343,154 | ||||||||||||
| LaRonde Zone 5 mine | 12,988 | 16,170 | 15,438 | 15,234 | 59,830 | ||||||||||||
| Lapa mine | 5 | – | – | – | 5 | ||||||||||||
| Goldex mine | 34,454 | 34,325 | 37,142 | 34,963 | 140,884 | ||||||||||||
| Meadowbank Complex | 43,502 | 39,457 | 48,870 | 61,660 | 193,489 | ||||||||||||
| Meliadine mine | 17,582 | 61,112 | 78,093 | 81,607 | 238,394 | ||||||||||||
| Canadian Malartic mine(ii) | 83,670 | 84,311 | 81,573 | 85,042 | 334,596 | ||||||||||||
| Kittila mine | 49,336 | 20,077 | 61,343 | 55,345 | 186,101 | ||||||||||||
| Southern Business | |||||||||||||||||
| Pinos Altos mine | 42,730 | 41,740 | 34,832 | 35,822 | 155,124 | ||||||||||||
| Creston Mascota mine | 13,529 | 18,336 | 9,596 | 6,919 | 48,380 | ||||||||||||
| La India mine | 22,988 | 20,200 | 18,386 | 20,616 | 82,190 | ||||||||||||
| Total gold (ounces) | 398,217 | 412,315 | 476,937 | 494,678 | 1,782,147 | ||||||||||||
| Silver (thousands of ounces) | |||||||||||||||||
| Northern Business | |||||||||||||||||
| LaRonde mine | 197 | 196 | 227 | 263 | 883 | ||||||||||||
| LaRonde Zone 5 mine | 2 | 3 | 2 | 5 | 12 | ||||||||||||
| Lapa mine | 1 | – | – | – | 1 | ||||||||||||
| Goldex mine | – | 1 | – | 1 | 2 | ||||||||||||
| Meadowbank Complex | 22 | 20 | 29 | 15 | 86 | ||||||||||||
| Meliadine mine | 1 | 4 | 6 | 7 | 18 | ||||||||||||
| Canadian Malartic mine(ii) | 111 | 94 | 102 | 114 | 421 | ||||||||||||
| Kittila mine | 4 | 2 | 4 | 3 | 13 | ||||||||||||
| Southern Business | |||||||||||||||||
| Pinos Altos mine | 562 | 563 | 517 | 519 | 2,161 | ||||||||||||
| Creston Mascota mine | 133 | 216 | 134 | 97 | 580 | ||||||||||||
| La India mine | 46 | 33 | 27 | 27 | 133 | ||||||||||||
| Total silver (thousands of ounces) | 1,079 | 1,132 | 1,048 | 1,051 | 4,310 | ||||||||||||
| Zinc (tonnes) | 2,834 | 4,407 | 3,475 | 2,445 | 13,161 | ||||||||||||
| Copper (tonnes) | 808 | 702 | 958 | 929 | 3,397 | ||||||||||||
48 AGNICO EAGLE MANAGEMENT'S DISCUSSION AND ANALYSIS
| Three Months Ended | ||||||||||||
| March 31, 2019 | June 30, 2019 | September 30, 2019 | December 31, 2019 | Total 2019 | ||||||||
| Payable metal sold: | ||||||||||||
| Gold (ounces) | ||||||||||||
| Northern Business | ||||||||||||
| LaRonde mine | 89,857 | 75,777 | 90,867 | 104,197 | 360,698 | |||||||
| LaRonde Zone 5 mine | 8,222 | 16,172 | 15,368 | 17,236 | 56,998 | |||||||
| Lapa mine | 3,777 | – | – | – | 3,777 | |||||||
| Goldex mine | 33,811 | 34,729 | 36,488 | 36,357 | 141,385 | |||||||
| Meadowbank Complex | 46,668 | 38,807 | 52,211 | 53,710 | 191,396 | |||||||
| Meliadine mine | 3,210 | 57,345 | 71,407 | 81,328 | 213,290 | |||||||
| Canadian Malartic mine(ii)(iv) | 74,846 | 79,800 | 77,595 | 83,215 | 315,456 | |||||||
| Kittila mine | 49,205 | 22,620 | 60,020 | 52,595 | 184,440 | |||||||
| Southern Business | ||||||||||||
| Pinos Altos mine | 42,455 | 39,500 | 37,535 | 36,260 | 155,750 | |||||||
| Creston Mascota mine | 14,610 | 16,400 | 12,285 | 7,310 | 50,605 | |||||||
| La India mine | 24,309 | 20,620 | 17,385 | 19,225 | 81,539 | |||||||
| Total gold (ounces) | 390,970 | 401,770 | 471,161 | 491,433 | 1,755,334 | |||||||
| Silver (thousands of ounces) | ||||||||||||
| Northern Business | ||||||||||||
| LaRonde mine | 186 | 221 | 212 | 264 | 883 | |||||||
| LaRonde Zone 5 mine | 2 | 3 | 2 | 4 | 11 | |||||||
| Lapa mine | 2 | – | – | – | 2 | |||||||
| Goldex mine | – | 1 | – | 1 | 2 | |||||||
| Meadowbank Complex | 23 | 14 | 32 | 15 | 84 | |||||||
| Meliadine mine | – | 1 | – | 15 | 16 | |||||||
| Canadian Malartic mine(ii)(iv) | 94 | 104 | 83 | 105 | 386 | |||||||
| Kittila mine | 4 | 4 | 1 | 5 | 14 | |||||||
| Southern Business | ||||||||||||
| Pinos Altos mine | 560 | 500 | 576 | 522 | 2,158 | |||||||
| Creston Mascota mine | 140 | 175 | 160 | 100 | 575 | |||||||
| La India mine | 54 | 34 | 26 | 26 | 140 | |||||||
| Total silver (thousands of ounces) | 1,065 | 1,057 | 1,092 | 1,057 | 4,271 | |||||||
| Zinc (tonnes) | 1,586 | 4,999 | 4,075 | 1,632 | 12,292 | |||||||
| Copper (tonnes) | 764 | 734 | 947 | 945 | 3,390 | |||||||
MANAGEMENT'S DISCUSSION AND ANALYSIS AGNICO EAGLE 49
AGNICO EAGLE MINES LIMITED
SUMMARIZED QUARTERLY DATA
(thousands of United States dollars, except where noted)
| Three Months Ended | ||||||||||||||||||
| March 31, 2018 | June 30, 2018 | September 30, 2018 | December 31, 2018 | Total 2018 | ||||||||||||||
| Operating margin(i): | ||||||||||||||||||
| Revenues from mining operations | $ | 578,435 | $ | 556,282 | $ | 518,683 | $ | 537,821 | $ | 2,191,221 | ||||||||
| Production costs | 295,326 | 303,695 | 276,862 | 284,472 | 1,160,355 | |||||||||||||
| Total operating margin(i) | 283,109 | 252,587 | 241,821 | 253,349 | 1,030,866 | |||||||||||||
| Operating margin(i) by mine: | ||||||||||||||||||
| Northern Business | ||||||||||||||||||
| LaRonde mine | 89,760 | 74,517 | 65,405 | 58,697 | 288,379 | |||||||||||||
| LaRonde Zone 5 mine | – | 334 | 2,402 | 5,600 | 8,336 | |||||||||||||
| Lapa mine | 289 | 6,303 | 1,467 | 3,868 | �� | 11,927 | ||||||||||||
| Goldex mine | 18,052 | 18,686 | 17,837 | 19,318 | 73,893 | |||||||||||||
| Meadowbank Complex | 30,193 | 21,001 | 32,816 | 27,985 | 111,995 | |||||||||||||
| Canadian Malartic mine(ii) | 62,261 | 67,680 | 58,478 | 60,346 | 248,765 | |||||||||||||
| Kittila mine | 23,309 | 15,312 | 19,115 | 22,516 | 80,252 | |||||||||||||
| Southern Business | ||||||||||||||||||
| Pinos Altos mine | 37,219 | 29,620 | 29,072 | 36,582 | 132,493 | |||||||||||||
| Creston Mascota mine | 7,636 | 3,313 | 1,660 | 4,794 | 17,403 | |||||||||||||
| La India mine | 14,390 | 15,821 | 13,569 | 13,643 | 57,423 | |||||||||||||
| Total operating margin(i) | 283,109 | 252,587 | 241,821 | 253,349 | 1,030,866 | |||||||||||||
| Impairment loss | – | – | – | 389,693 | 389,693 | |||||||||||||
| Amortization of property, plant and mine development | 134,370 | 138,469 | 143,859 | 137,235 | 553,933 | |||||||||||||
| Exploration, corporate and other | 79,386 | 73,710 | 79,502 | 113,694 | 346,292 | |||||||||||||
| Income (loss) before income and mining taxes | 69,353 | 40,408 | 18,460 | (387,273 | ) | (259,052 | ) | |||||||||||
| Income and mining taxes | 24,423 | 35,436 | 1,407 | 6,383 | 67,649 | |||||||||||||
| Net income (loss) for the period | $ | 44,930 | $ | 4,972 | $ | 17,053 | $ | (393,656 | ) | $ | (326,701 | ) | ||||||
| Net income (loss) per share – basic (US$) | $ | 0.19 | $ | 0.02 | $ | 0.07 | $ | (1.68 | ) | $ | (1.40 | ) | ||||||
| Net income (loss) per share – diluted (US$) | $ | 0.19 | $ | 0.02 | $ | 0.07 | $ | (1.68 | ) | $ | (1.40 | ) | ||||||
| Cash flows: | ||||||||||||||||||
| Cash provided by operating activities | $ | 207,706 | $ | 120,087 | $ | 137,573 | $ | 140,284 | $ | 605,650 | ||||||||
| Cash used in investing activities | $ | (354,717 | ) | $ | (201,405 | ) | $ | (311,870 | ) | $ | (336,376 | ) | $ | (1,204,368 | ) | |||
| Cash (used in) provided by financing activities | $ | (34,348 | ) | $ | 340,498 | $ | (13,952 | ) | $ | (18,099 | ) | $ | 274,099 | |||||
50 AGNICO EAGLE MANAGEMENT'S DISCUSSION AND ANALYSIS
| Three Months Ended | |||||||||||||||||
| March 31, 2018 | June 30, 2018 | September 30, 2018 | December 31, 2018 | Total 2018 | |||||||||||||
| Realized prices (US$): | |||||||||||||||||
| Gold (per ounce) | $ | 1,332 | $ | 1,293 | $ | 1,204 | $ | 1,235 | $ | 1,266 | |||||||
| Silver (per ounce) | $ | 16.76 | $ | 16.43 | $ | 14.20 | $ | 14.53 | $ | 15.51 | |||||||
| Zinc (per tonne) | $ | 3,439 | $ | 3,144 | $ | 2,615 | $ | 2,568 | $ | 3,034 | |||||||
| Copper (per tonne) | $ | 7,201 | $ | 6,760 | $ | 5,900 | $ | 6,126 | $ | 6,543 | |||||||
| Payable production(iii): | |||||||||||||||||
| Gold (ounces) | |||||||||||||||||
| Northern Business | |||||||||||||||||
| LaRonde mine | 89,785 | 84,526 | 88,353 | 81,022 | 343,686 | ||||||||||||
| LaRonde Zone 5 mine | – | 4,601 | 3,823 | 10,196 | 18,620 | ||||||||||||
| Lapa mine | 1,722 | 14,533 | 10,464 | 7,307 | 34,026 | ||||||||||||
| Goldex mine | 27,924 | 30,480 | 31,255 | 31,508 | 121,167 | ||||||||||||
| Meadowbank Complex | 61,447 | 59,627 | 68,259 | 59,664 | 248,997 | ||||||||||||
| Canadian Malartic mine(ii) | 83,403 | 91,863 | 88,602 | 84,732 | 348,600 | ||||||||||||
| Kittila mine | 48,118 | 42,049 | 49,459 | 49,353 | 188,979 | ||||||||||||
| Southern Business | |||||||||||||||||
| Pinos Altos mine | 41,836 | 43,646 | 46,405 | 49,170 | 181,057 | ||||||||||||
| Creston Mascota mine | 11,988 | 8,716 | 8,024 | 11,452 | 40,180 | ||||||||||||
| La India mine | 23,055 | 24,920 | 27,074 | 26,308 | 101,357 | ||||||||||||
| Total gold (ounces) | 389,278 | 404,961 | 421,718 | 410,712 | 1,626,669 | ||||||||||||
| Silver (thousands of ounces) | |||||||||||||||||
| Northern Business | |||||||||||||||||
| LaRonde mine | 367 | 234 | 234 | 205 | 1,040 | ||||||||||||
| LaRonde Zone 5 mine | – | – | 1 | 1 | 2 | ||||||||||||
| Lapa mine | – | 1 | – | 1 | 2 | ||||||||||||
| Goldex mine | – | 1 | – | – | 1 | ||||||||||||
| Meadowbank Complex | 60 | 48 | 35 | 28 | 171 | ||||||||||||
| Canadian Malartic mine(ii) | 106 | 117 | 110 | 104 | 437 | ||||||||||||
| Kittila mine | 3 | 3 | 3 | 4 | 13 | ||||||||||||
| Southern Business | |||||||||||||||||
| Pinos Altos mine | 541 | 538 | 658 | 631 | 2,368 | ||||||||||||
| Creston Mascota mine | 91 | 77 | 59 | 83 | 310 | ||||||||||||
| La India mine | 45 | 37 | 44 | 54 | 180 | ||||||||||||
| Total silver (thousands of ounces) | 1,213 | 1,056 | 1,144 | 1,111 | 4,524 | ||||||||||||
| Zinc (tonnes) | 1,046 | 2,778 | 872 | 3,168 | 7,864 | ||||||||||||
| Copper (tonnes) | 1,292 | 961 | 1,026 | 914 | 4,193 | ||||||||||||
MANAGEMENT'S DISCUSSION AND ANALYSIS AGNICO EAGLE 51
| Three Months Ended | ||||||||||||
| March 31, 2018 | June 30, 2018 | September 30, 2018 | December 31, 2018 | Total 2018 | ||||||||
| Payable metal sold: | ||||||||||||
| Gold (ounces) | ||||||||||||
| Northern Business | ||||||||||||
| LaRonde mine | 101,825 | 94,868 | 86,292 | 81,831 | 364,816 | |||||||
| LaRonde Zone 5 mine | – | 683 | 7,155 | 9,631 | 17,469 | |||||||
| Lapa mine | 613 | 13,286 | 6,335 | 11,640 | 31,874 | |||||||
| Goldex mine | 27,458 | 30,531 | 30,884 | 31,748 | 120,621 | |||||||
| Meadowbank Complex | 68,125 | 59,126 | 67,153 | 58,610 | 253,014 | |||||||
| Canadian Malartic mine(ii)(iv) | 77,045 | 84,920 | 84,303 | 84,352 | 330,620 | |||||||
| Kittila mine | 49,780 | 41,758 | 48,340 | 47,993 | 187,871 | |||||||
| Southern Business | ||||||||||||
| Pinos Altos mine | 46,360 | 43,653 | 44,714 | 50,717 | 185,444 | |||||||
| Creston Mascota mine | 11,889 | 9,499 | 7,795 | 10,409 | 39,592 | |||||||
| La India mine | 22,030 | 25,362 | 26,005 | 25,067 | 98,464 | |||||||
| Total gold (ounces) | 405,125 | 403,686 | 408,976 | 411,998 | 1,629,785 | |||||||
| Silver (thousands of ounces) | ||||||||||||
| Northern Business | ||||||||||||
| LaRonde mine | 362 | 249 | 225 | 207 | 1,043 | |||||||
| LaRonde Zone 5 mine | – | – | 1 | – | 1 | |||||||
| Lapa mine | – | 1 | – | 1 | 2 | |||||||
| Goldex mine | – | 1 | – | 1 | 2 | |||||||
| Meadowbank Complex | 58 | 51 | 35 | 26 | 170 | |||||||
| Canadian Malartic mine(ii)(iv) | 87 | 107 | 110 | 90 | 394 | |||||||
| Kittila mine | 4 | 2 | 3 | 4 | 13 | |||||||
| Southern Business | ||||||||||||
| Pinos Altos mine | 611 | 528 | 659 | 644 | 2,442 | |||||||
| Creston Mascota mine | 86 | 81 | 59 | 75 | 301 | |||||||
| La India mine | 47 | 41 | 37 | 51 | 176 | |||||||
| Total silver (thousands of ounces) | 1,255 | 1,061 | 1,129 | 1,099 | 4,544 | |||||||
| Zinc (tonnes) | 2,530 | 2,979 | 1,118 | 1,896 | 8,523 | |||||||
| Copper (tonnes) | 1,288 | 945 | 1,036 | 926 | 4,195 | |||||||
Notes:
- (i)
- Operating margin is calculated as revenues from mining operations less production costs.
- (ii)
- The information set out in this table reflects the Company's 50% interest in the Canadian Malartic mine.
- (iii)
- Payable production (a non-GAAP non-financial performance measure) is the quantity of mineral produced during a period contained in products that are or will be sold by the Company, whether such products are sold during the period or held as inventories at the end of the period.
- (iv)
- The Canadian Malartic mine's payable metal sold excludes the 5.0% net smelter return royalty granted to Osisko Gold Royalties Ltd., in connection with the Company's acquisition of its 50% interest of the Canadian Malartic mine.
52 AGNICO EAGLE MANAGEMENT'S DISCUSSION AND ANALYSIS
AGNICO EAGLE MINES LIMITED
THREE YEAR FINANCIAL AND OPERATING SUMMARY
(thousands of United States dollars, except where noted)
| 2019 | 2018 | 2017 | |||||||||
| Revenues from mining operations | $ | 2,494,892 | $ | 2,191,221 | $ | 2,242,604 | |||||
| Production costs | 1,247,705 | 1,160,355 | 1,057,842 | ||||||||
| Operating margin(i) | 1,247,187 | 1,030,866 | 1,184,762 | ||||||||
| Amortization of property, plant and mine development | 546,057 | 553,933 | 508,739 | ||||||||
| Impairment (reversal) loss | (345,821 | ) | 389,693 | – | |||||||
| Exploration, corporate and other | 308,209 | 346,292 | 336,734 | ||||||||
| Income (loss) before income and mining taxes | 738,742 | (259,052 | ) | 339,289 | |||||||
| Income and mining taxes | 265,576 | 67,649 | 98,494 | ||||||||
| Net income (loss) for the year | $ | 473,166 | $ | (326,701 | ) | $ | 240,795 | ||||
| Net income (loss) per share – basic | $ | 2.00 | $ | (1.40 | ) | $ | 1.05 | ||||
| Net income (loss) per share – diluted | $ | 1.99 | $ | (1.40 | ) | $ | 1.04 | ||||
| Operating cash flow | $ | 881,692 | $ | 605,650 | $ | 767,557 | |||||
| Investing cash flow | $ | (873,884 | ) | $ | (1,204,368 | ) | $ | (1,000,052 | ) | ||
| Financing cash flow | $ | 10,610 | $ | 274,099 | $ | 329,167 | |||||
| Dividends declared per share | $ | 0.55 | $ | 0.44 | $ | 0.41 | |||||
| Capital expenditures per Consolidated Statements of Cash Flows | $ | 882,664 | $ | 1,089,100 | $ | 874,153 | |||||
| Average gold price per ounce realized | $ | 1,406 | $ | 1,266 | $ | 1,261 | |||||
| Average silver price per ounce realized | $ | 16.38 | $ | 15.51 | $ | 17.07 | |||||
| Average zinc price per tonne realized | $ | 2,607 | $ | 3,034 | $ | 2,829 | |||||
| Average copper price per tonne realized | $ | 5,892 | $ | 6,543 | $ | 6,345 | |||||
| Weighted average number of common shares outstanding – basic (thousands) | 236,934 | 233,251 | 230,252 | ||||||||
| Working capital (including undrawn credit lines) | $ | 1,617,899 | $ | 1,910,978 | $ | 2,326,939 | |||||
| Total assets | $ | 8,789,885 | $ | 7,852,843 | $ | 7,865,601 | |||||
| Long-term debt | $ | 1,364,108 | $ | 1,721,308 | $ | 1,371,851 | |||||
| Shareholders' equity | $ | 5,111,514 | $ | 4,550,012 | $ | 4,946,991 | |||||
MANAGEMENT'S DISCUSSION AND ANALYSIS AGNICO EAGLE 53
| 2019 | 2018 | 2017 | ||||||||||
| Operating Summary | ||||||||||||
| LaRonde mine | ||||||||||||
| Revenues from mining operations | $ | 552,204 | $ | 516,673 | $ | 484,488 | ||||||
| Production costs | 215,012 | 228,294 | 185,488 | |||||||||
| Operating margin(i) | $ | 337,192 | $ | 288,379 | $ | 299,000 | ||||||
| Amortization of property, plant and mine development | 83,688 | 94,406 | 82,979 | |||||||||
| Gross profit | $ | 253,504 | $ | 193,973 | $ | 216,021 | ||||||
| Tonnes of ore milled | 2,057,187 | 2,108,068 | 2,246,114 | |||||||||
| Gold – grams per tonne | 5.46 | 5.32 | 5.05 | |||||||||
| Gold production – ounces | 343,154 | 343,686 | 348,870 | |||||||||
| Silver production – thousands of ounces | 883 | 1,040 | 1,254 | |||||||||
| Zinc production – tonnes | 13,161 | 7,864 | 6,510 | |||||||||
| Copper production – tonnes | 3,397 | 4,193 | 4,501 | |||||||||
| Total cash costs per ounce of gold produced ($ per ounce basis): | ||||||||||||
| Production costs | $ | 627 | $ | 664 | $ | 532 | ||||||
| Adjustments: | ||||||||||||
| Inventory and other adjustments(ii) | 33 | (30 | ) | 75 | ||||||||
| Total cash costs per ounce of gold produced – co-product basis(iii) | $ | 660 | $ | 634 | $ | 607 | ||||||
| By-product metal revenues | (196 | ) | (189 | ) | (201 | ) | ||||||
| Total cash costs per ounce of gold produced – by-product basis(iii) | $ | 464 | $ | 445 | $ | 406 | ||||||
| Minesite costs per tonne(iv) | C$ | 125 | C$ | 119 | C$ | 108 | ||||||
| LaRonde Zone 5 mine | ||||||||||||
| Revenues from mining operations | $ | 80,365 | $ | 21,327 | $ | – | ||||||
| Production costs | 41,212 | 12,991 | – | |||||||||
| Operating margin(i) | $ | 39,153 | $ | 8,336 | $ | – | ||||||
| Amortization of property, plant and mine development | 6,818 | 1,658 | – | |||||||||
| Gross profit | $ | 32,335 | $ | 6,678 | $ | – | ||||||
| Tonnes of ore milled | 869,568 | 224,643 | 7,709 | |||||||||
| Gold – grams per tonne | 2.27 | 2.76 | – | |||||||||
| Gold production – ounces | 59,830 | 18,620 | 515 | |||||||||
54 AGNICO EAGLE MANAGEMENT'S DISCUSSION AND ANALYSIS
| 2019 | 2018 | 2017 | ||||||||||
| Total cash costs per ounce of gold produced ($ per ounce basis): | ||||||||||||
| Production costs | $ | 689 | $ | 698 | $ | – | ||||||
| Adjustments: | ||||||||||||
| Inventory and other adjustments(ii) | 36 | 35 | – | |||||||||
| Total cash costs per ounce of gold produced – co-product basis(iii)(v) | $ | 725 | $ | 733 | $ | – | ||||||
| By-product metal revenues | (3 | ) | (1 | ) | – | |||||||
| Total cash costs per ounce of gold produced – by-product basis(iii)(v) | $ | 722 | $ | 732 | $ | – | ||||||
| Minesite costs per tonne(iv)(vi) | C$ | 66 | C$ | 80 | C$ | – | ||||||
| Lapa mine | ||||||||||||
| Revenues from mining operations | $ | 4,877 | $ | 39,797 | $ | 64,572 | ||||||
| Production costs | 2,844 | 27,870 | 38,786 | |||||||||
| Operating margin(i) | $ | 2,033 | $ | 11,927 | $ | 25,786 | ||||||
| Amortization of property, plant and mine development | 30 | 268 | 1,736 | |||||||||
| Gross profit | $ | 2,003 | $ | 11,659 | $ | 24,050 | ||||||
| Tonnes of ore milled | – | 311,013 | 398,248 | |||||||||
| Gold – grams per tonne | – | 4.24 | 4.24 | |||||||||
| Gold production – ounces | 5 | 34,026 | 48,613 | |||||||||
| Total cash costs per ounce of gold produced ($ per ounce basis): | ||||||||||||
| Production costs | $ | – | $ | 819 | $ | 801 | ||||||
| Adjustments: | ||||||||||||
| Inventory and other adjustments(ii) | – | 54 | (44 | ) | ||||||||
| Total cash costs per ounce of gold produced – co-product basis(iii)(vii) | $ | – | $ | 873 | $ | 757 | ||||||
| By-product metal revenues | – | (1 | ) | (2 | ) | |||||||
| Total cash costs per ounce of gold produced – by-product basis(iii)(vii) | $ | – | $ | 872 | $ | 755 | ||||||
| Minesite costs per tonne(iv) | C$ | – | C$ | 123 | C$ | 120 | ||||||
| Goldex mine | ||||||||||||
| Revenues from mining operations | $ | 197,020 | $ | 152,426 | $ | 139,665 | ||||||
| Production costs | 82,533 | 78,533 | 71,015 | |||||||||
| Operating margin(i) | $ | 114,487 | $ | 73,893 | $ | 68,650 | ||||||
| Amortization of property, plant and mine development | 43,452 | 37,390 | 36,488 | |||||||||
| Gross profit | $ | 71,035 | $ | 36,503 | $ | 32,162 | ||||||
MANAGEMENT'S DISCUSSION AND ANALYSIS AGNICO EAGLE 55
| 2019 | 2018 | 2017 | ||||||||||
| Tonnes of ore milled | 2,784,524 | 2,624,682 | 2,572,014 | |||||||||
| Gold – grams per tonne | 1.71 | 1.54 | 1.53 | |||||||||
| Gold production – ounces | 140,884 | 121,167 | 118,947 | |||||||||
| Total cash costs per ounce of gold produced ($ per ounce basis): | ||||||||||||
| Production costs | $ | 586 | $ | 648 | $ | 640 | ||||||
| Adjustments: | ||||||||||||
| Inventory and other adjustments(ii) | (2 | ) | (2 | ) | (29 | ) | ||||||
| Total cash costs per ounce of gold produced – co-product basis(iii)(viii) | $ | 584 | $ | 646 | $ | 611 | ||||||
| By-product metal revenues | – | – | (1 | ) | ||||||||
| Total cash costs per ounce of gold produced – by-product basis(iii)(viii) | $ | 584 | $ | 646 | $ | 610 | ||||||
| Minesite costs per tonne(iv)(ix) | C$ | 39 | C$ | 39 | C$ | 37 | ||||||
| Meadowbank Complex | ||||||||||||
| Revenues from mining operations | $ | 221,652 | $ | 323,142 | $ | 449,025 | ||||||
| Production costs | 180,848 | 211,147 | 224,364 | |||||||||
| Operating margin(i) | $ | 40,804 | $ | 111,995 | $ | 224,661 | ||||||
| Amortization of property, plant and mine development | 64,285 | 83,361 | 74,130 | |||||||||
| Gross profit | $ | (23,481 | ) | $ | 28,634 | $ | 150,531 | |||||
| Tonnes of ore milled | 2,750,306 | 3,262,040 | 3,853,034 | |||||||||
| Gold – grams per tonne | 2.35 | 2.56 | 3.12 | |||||||||
| Gold production – ounces | 193,489 | 248,997 | 352,526 | |||||||||
| Silver production – thousands of ounces | 86 | 171 | 275 | |||||||||
| Total cash costs per ounce of gold produced ($ per ounce basis): | ||||||||||||
| Production costs | $ | 1,143 | $ | 848 | $ | 636 | ||||||
| Adjustments: | ||||||||||||
| Inventory and other adjustments(ii) | 18 | (23 | ) | (8 | ) | |||||||
| Total cash costs per ounce of gold produced – co-product basis(iii)(x) | $ | 1,161 | $ | 825 | $ | 628 | ||||||
| By-product metal revenues | (9 | ) | (11 | ) | (14 | ) | ||||||
| Total cash costs per ounce of gold produced – by-product basis(iii)(x) | $ | 1,152 | $ | 814 | $ | 614 | ||||||
| Minesite costs per tonne(iv)(xi) | C$ | 103 | C$ | 82 | C$ | 76 | ||||||
56 AGNICO EAGLE MANAGEMENT'S DISCUSSION AND ANALYSIS
| 2019 | 2018 | 2017 | |||||||||
| Meliadine mine | |||||||||||
| Revenues from mining operations | $ | 270,258 | $ | – | $ | – | |||||
| Production costs | 142,932 | – | – | ||||||||
| Operating margin(i) | $ | 127,326 | $ | – | $ | – | |||||
| Amortization of property, plant and mine development | 48,901 | – | – | ||||||||
| Gross profit | $ | 78,425 | $ | – | $ | – | |||||
| Tonnes of ore milled | 1,036,746 | – | – | ||||||||
| Gold – grams per tonne | 7.60 | – | – | ||||||||
| Gold production – ounces | 238,394 | – | – | ||||||||
| Silver production – thousands of ounces | 18 | – | – | ||||||||
| Total cash costs per ounce of gold produced ($ per ounce basis): | |||||||||||
| Production costs | $ | 748 | $ | – | $ | – | |||||
| Adjustments: | |||||||||||
| Inventory and other adjustments(ii) | 2 | – | – | ||||||||
| Total cash costs per ounce of gold produced – co-product basis(iii)(xii) | $ | 750 | $ | – | $ | – | |||||
| By-product metal revenues | (2 | ) | – | – | |||||||
| Total cash costs per ounce of gold produced – by-product basis(iii)(xii) | $ | 748 | $ | – | $ | – | |||||
| Minesite costs per tonne(iv)(xiii) | C$ | 246 | C$ | – | C$ | – | |||||
| Canadian Malartic mine (xiv) | |||||||||||
| Revenues from mining operations | $ | 466,317 | $ | 448,526 | $ | 404,441 | |||||
| Production costs | 208,178 | 199,761 | 188,568 | ||||||||
| Operating margin(i) | ��$ | 258,139 | $ | 248,765 | $ | 215,873 | |||||
| Amortization of property, plant and mine development | 119,822 | 126,422 | 122,368 | ||||||||
| Gross profit | $ | 138,317 | $ | 122,343 | $ | 93,505 | |||||
| Tonnes of ore milled | 10,524,531 | 10,241,870 | 10,178,803 | ||||||||
| Gold – grams per tonne | 1.11 | 1.20 | 1.09 | ||||||||
| Gold production – ounces | 334,596 | 348,600 | 316,731 | ||||||||
| Silver production – thousands of ounces | 421 | 437 | 341 | ||||||||
MANAGEMENT'S DISCUSSION AND ANALYSIS AGNICO EAGLE 57
| 2019 | 2018 | 2017 | ||||||||||
| Total cash costs per ounce of gold produced ($ per ounce basis): | ||||||||||||
| Production costs | $ | 628 | $ | 573 | $ | 595 | ||||||
| Adjustments: | ||||||||||||
| Inventory and other adjustments(ii) | (2 | ) | 6 | (1 | ) | |||||||
| Total cash costs per ounce of gold produced – co-product basis(iii)(xv) | $ | 626 | $ | 579 | $ | 594 | ||||||
| By-product metal revenues | (20 | ) | (20 | ) | (18 | ) | ||||||
| Total cash costs per ounce of gold produced – by-product basis(iii)(xv) | $ | 606 | $ | 559 | $ | 576 | ||||||
| Minesite costs per tonne(iv)(xvi) | C$ | 26 | C$ | 25 | C$ | 24 | ||||||
| Kittila mine | ||||||||||||
| Revenues from mining operations | $ | 260,323 | $ | 237,284 | $ | 248,761 | ||||||
| Production costs | 142,517 | 157,032 | 148,272 | |||||||||
| Operating margin(i) | $ | 117,806 | $ | 80,252 | $ | 100,489 | ||||||
| Amortization of property, plant and mine development | 56,085 | 71,732 | 58,682 | |||||||||
| Gross profit | $ | 61,721 | $ | 8,520 | $ | 41,807 | ||||||
| Tonnes of ore milled | 1,590,902 | 1,827,335 | 1,684,626 | |||||||||
| Gold – grams per tonne | 4.15 | 3.80 | 4.15 | |||||||||
| Gold production – ounces | 186,101 | 188,979 | 196,938 | |||||||||
| Silver production – thousands of ounces | 13 | 13 | 13 | |||||||||
| Total cash costs per ounce of gold produced ($ per ounce basis): | ||||||||||||
| Production costs | $ | 766 | $ | 831 | $ | 753 | ||||||
| Adjustments: | ||||||||||||
| Inventory and other adjustments(ii) | (29 | ) | 23 | 1 | ||||||||
| Total cash costs per ounce of gold produced – co-product basis(iii) | $ | 737 | $ | 854 | $ | 754 | ||||||
| By-product metal revenues | (1 | ) | (1 | ) | (1 | ) | ||||||
| Total cash costs per ounce of gold produced – by-product basis(iii) | $ | 736 | $ | 853 | $ | 753 | ||||||
| Minesite costs per tonne(iv) | € | 76 | € | 75 | € | 78 | ||||||
| Pinos Altos mine | ||||||||||||
| Revenues from mining operations | $ | 249,577 | $ | 270,855 | $ | 257,905 | ||||||
| Production costs | 130,190 | 138,362 | 108,726 | |||||||||
| Operating margin(i) | $ | 119,387 | $ | 132,493 | $ | 149,179 | ||||||
| Amortization of property, plant and mine development | 58,302 | 70,203 | 59,970 | |||||||||
| Gross profit | $ | 61,085 | $ | 62,290 | $ | 89,209 | ||||||
58 AGNICO EAGLE MANAGEMENT'S DISCUSSION AND ANALYSIS
| 2019 | 2018 | 2017 | |||||||||||
| Tonnes of ore processed | 2,006,652 | 2,217,979 | 2,307,872 | ||||||||||
| Gold – grams per tonne processed at the mill | 2.65 | 2.96 | 2.86 | ||||||||||
| Gold production – ounces | 155,124 | 181,057 | 180,859 | ||||||||||
| Silver production – thousands of ounces | 2,161 | 2,368 | 2,535 | ||||||||||
| Total cash costs per ounce of gold produced ($ per ounce basis): | |||||||||||||
| Production costs | $ | 839 | $ | 764 | $ | 601 | |||||||
| Adjustments: | |||||||||||||
| Inventory and other adjustments(ii) | 28 | (15 | ) | 33 | |||||||||
| Total cash costs per ounce of gold produced – co-product basis(iii) | $ | 867 | $ | 749 | $ | 634 | |||||||
| By-product metal revenues | (228 | ) | (201 | ) | (239 | ) | |||||||
| Total cash costs per ounce of gold produced – by-product basis(iii) | $ | 639 | $ | 548 | $ | 395 | |||||||
| Minesite costs per tonne(iv) | $ | 66 | $ | 61 | $ | 50 | |||||||
| Creston Mascota mine | |||||||||||||
| Revenues from mining operations | $ | 78,023 | $ | 54,673 | $ | 63,798 | |||||||
| Production costs | 35,801 | 37,270 | 31,490 | ||||||||||
| Operating margin(i) | $ | 42,222 | $ | 17,403 | $ | 32,308 | |||||||
| Amortization of property, plant and mine development | 18,538 | 18,465 | 22,605 | ||||||||||
| Gross profit | $ | 23,684 | $ | (1,062 | ) | $ | 9,703 | ||||||
| Tonnes of ore processed | 1,066,907 | 1,422,411 | 2,195,655 | ||||||||||
| Gold – grams per tonne | 1.87 | 1.03 | 1.23 | ||||||||||
| Gold production – ounces | 48,380 | 40,180 | 48,384 | ||||||||||
| Silver production – thousands of ounces | 580 | 310 | 281 | ||||||||||
| Total cash costs per ounce of gold produced ($ per ounce basis): | |||||||||||||
| Production costs | $ | 740 | $ | 928 | $ | 651 | |||||||
| Adjustments: | |||||||||||||
| Inventory and other adjustments(ii) | 14 | 33 | 18 | ||||||||||
| Total cash costs per ounce of gold produced – co-product basis(iii) | $ | 754 | $ | 961 | $ | 669 | |||||||
| By-product metal revenues | (200 | ) | (120 | ) | (94 | ) | |||||||
| Total cash costs per ounce of gold produced – by-product basis(iii) | $ | 554 | $ | 841 | $ | 575 | |||||||
| Minesite costs per tonne(iv) | 33 | 27 | 15 | ||||||||||
MANAGEMENT'S DISCUSSION AND ANALYSIS AGNICO EAGLE 59
| 2019 | 2018 | 2017 | ||||||||||
| La India mine | ||||||||||||
| Revenues from mining operations | $ | 114,276 | $ | 126,518 | $ | 129,949 | ||||||
| Production costs | 65,638 | 69,095 | 61,133 | |||||||||
| Operating margin(i) | $ | 48,638 | $ | 57,423 | $ | 68,816 | ||||||
| Amortization of property, plant and mine development | 40,591 | 48,329 | 46,918 | |||||||||
| Gross profit | $ | 8,047 | $ | 9,094 | $ | 21,898 | ||||||
| Tonnes of ore processed | 5,402,415 | 6,127,526 | 5,965,250 | |||||||||
| Gold – grams per tonne | 0.68 | 0.72 | 0.69 | |||||||||
| Gold production – ounces | 82,190 | 101,357 | 101,150 | |||||||||
| Silver production – thousands of ounces | 133 | 180 | 313 | |||||||||
| Total cash costs per ounce of gold produced ($ per ounce basis): | ||||||||||||
| Production costs | $ | 799 | $ | 682 | $ | 604 | ||||||
| Adjustments: | ||||||||||||
| Inventory and other adjustments(ii) | 50 | 30 | 30 | |||||||||
| Total cash costs per ounce of gold produced – co-product basis(iii) | $ | 849 | $ | 712 | $ | 634 | ||||||
| By-product metal revenues | (26 | ) | (27 | ) | (54 | ) | ||||||
| Total cash costs per ounce of gold produced – by-product basis(iii) | $ | 823 | $ | 685 | $ | 580 | ||||||
| Minesite costs per tonne(iv) | $ | 13 | $ | 12 | $ | 11 | ||||||
Notes:
| (i) | Operating margin is calculated as revenues from mining operations less production costs. |
| (ii) | Under the Company's revenue recognition policy, revenue from contracts with customers is recognized upon the transfer of control over metals sold to the customer. As total cash costs per ounce of gold produced are calculated on a production basis, an inventory adjustment is made to reflect the portion of production not yet recognized as revenue. Other adjustments include the addition of smelting, refining and marketing charges to production costs. |
| (iii) | The total cash costs per ounce of gold produced is not a recognized measure under IFRS and this data may not be comparable to data reported by other gold producers. The total cash costs per ounce of gold produced is reported on both a by-product basis (deducting by-product metal revenues from production costs) and co-product basis (without deducting by-product metal revenues). The total cash costs per ounce of gold produced on a by-product basis is calculated by adjusting production costs as recorded in the consolidated statements of income (loss) for by-product revenues, inventory production costs, smelting, refining and marketing charges and other adjustments, and then dividing by the number of ounces of gold produced. The total cash costs per ounce of gold produced on a co-product basis is calculated in the same manner as the total cash costs per ounce of gold produced on a by-product basis, except that no adjustment is made for by-product metal revenues. Accordingly, the calculation of total cash costs per ounce of gold produced on a co-product basis does not reflect a reduction in production costs or smelting, refining and marketing charges associated with the production and sale of by-product metals. The total cash costs per ounce of gold produced is intended to provide information about the cash-generating capabilities of the Company's mining operations. Management also uses these measures to monitor the performance of the Company's mining operations. As market prices for gold are quoted on a per ounce basis, using the total cash costs per ounce of gold produced on a by-product basis measure allows management to assess a mine's cash-generating capabilities at various gold prices. Management is aware that these per ounce measures of performance can be affected by fluctuations in exchange rates and, in the case of total cash costs of gold produced on a by-product basis, by-product metal prices. Management compensates for these inherent limitations by using these measures in conjunction with minesite costs per tonne as well as other data prepared in accordance with IFRS. Management also performs sensitivity analysis in order to quantify the effects of fluctuating metal prices and exchange rates. |
| (iv) | Minesite costs per tonne is not a recognized measure under IFRS and this data may not be comparable to data reported by other gold producers. Minesite costs per tonne are calculated by adjusting production costs as recorded in the consolidated statements of income (loss) for inventory production costs and other adjustments, and then dividing by tonnes of ore processed. As the total cash costs per ounce of gold produced can be affected by fluctuations in by-product metal prices and foreign exchange rates, management believes that minesite costs per tonne provide additional information regarding the performance of mining operations, eliminating the impact of varying production levels. Management also uses this measure to determine the economic viability of mining blocks. As each mining block is evaluated based on the net realizable value of each tonne mined, in order to be economically viable the estimated revenue on a per tonne basis must be in excess of the minesite costs per tonne. Management is aware that this per tonne measure of performance can be impacted by fluctuations in processing levels and compensates for this inherent limitation by using this measure in conjunction with production costs prepared in accordance with IFRS. |
| (v) | The LZ5 mine's per ounce of gold production calculations exclude 515 ounces for the year ended December 31, 2017 of payable gold production and the associated costs which were produced prior to the achievement of commercial production. |
60 AGNICO EAGLE MANAGEMENT'S DISCUSSION AND ANALYSIS
| (vi) | The LZ5 mine's per tonne calculations exclude 7,709 tonnes for the year ended December 31, 2017 and the associated costs which were processed prior to the achievement of commercial production. |
| (vii) | The Lapa mine's cost calculations per ounce of gold produced for the year ended December 31, 2019 exclude 5 ounces of payable gold production, which were credited to the Company as a result of final refining reconciliation following the cessation of mining and processing operations at the site. In addition, the Lapa mine's per ounce of gold production calculations for the year ended December 31, 2017 exclude 203 ounces of payable gold production as a result of the Lapa mill being placed on temporary maintenance. |
| (viii) | The Goldex mine's per ounce of gold production calculations for the year ended December 31, 2017 exclude 8,041 ounces of payable gold production and the associated costs related to the Deep 1 Zone which were produced prior to the achievement of commercial production. |
| (ix) | The Goldex mine's per tonne calculations for the year ended December 31, 2017 exclude 175,514 tonnes processed and the associated costs related to the Deep 1 Zone which were processed prior to the achievement of commercial production. |
| (x) | The Meadowbank Complex's cost calculations per ounce of gold produced for the year ended December 31, 2019 exclude 35,281 ounces of payable gold production which were produced prior to the achievement of commercial production at the Amaruq satellite deposit on September 30, 2019. |
| (xi) | The Meadowbank Complex's cost calculations per tonne for the year ended December 31, 2019 exclude 369,519 tonnes which were processed prior to the achievement of commercial production at the Amaruq satellite deposit on September 30, 2019. |
| (xii) | The Meliadine mine's cost calculations per ounce of gold produced for the year ended December 31, 2019 exclude 47,281 ounces of payable gold production which were produced prior to the achievement of commercial production on May 14, 2019. |
| (xiii) | The Meliadine mine's cost calculations per tonne for the year ended December 31, 2019 exclude 263,749 tonnes which were processed prior to the achievement of commercial production on May 14, 2019. |
| (xiv) | The information set out in this table reflects the Company's 50% interest in the Canadian Malartic mine. |
| (xv) | The Canadian Malartic mine's cost calculations per ounce of gold produced for the year ended December 31, 2019 exclude 3,137 ounces of payable gold production which were produced during this period as commercial production at the Barnat deposit has not yet been achieved. |
| (xvi) | The Canadian Malartic mine's cost calculations per tonne for the year ended December 31, 2019 exclude 133,615 tonnes which were processed during this period as commercial production at the Barnat deposit has not yet been achieved. |
MANAGEMENT'S DISCUSSION AND ANALYSIS AGNICO EAGLE 61
NOTE TO INVESTORS CONCERNING FORWARD - LOOKING INFORMATION
NOTE TO INVESTORS CONCERNING ESTIMATES OF MINERAL RESERVES AND MINERAL RESOURCES
NOTE TO INVESTORS CONCERNING CERTAIN MEASURES OF PERFORMANCE
GOLD ($ per ounce)
SILVER ($ per ounce)
Total Production Costs by Category 2019
AGNICO EAGLE MINES LIMITED SUMMARIZED QUARTERLY DATA (thousands of United States dollars, except where noted)
AGNICO EAGLE MINES LIMITED SUMMARIZED QUARTERLY DATA (thousands of United States dollars, except where noted)
AGNICO EAGLE MINES LIMITED THREE YEAR FINANCIAL AND OPERATING SUMMARY (thousands of United States dollars, except where noted)