Table of Contents
As filed with the Securities and Exchange Commission on June 22, 2005
Registration No. 333-124201
SECURITIES AND EXCHANGE COMMISSION
Washington, D.C. 20549
AMENDMENT NO. 2
TO
FORM S-1
REGISTRATION STATEMENT
Under
The Securities Act of 1933
COMTECH GROUP, INC.
(Exact Name of Registrant as Specified in its Charter)
| Maryland | 3670 | 52-0466460 | ||
(State or Other Jurisdiction of Incorporation or Organization) | (Primary Standard Industrial Classification Code Number) | (IRS Employer Identification Number) |
Suite 1001, Tower C, Skyworth Building
High-Tech Industrial Park
Nanshan, Shenzhen 518057
People’s Republic of China
011-86-755-2674-3210
(Address, including zip code, and telephone number, including area code, of Registrant’s principal executive offices)
Jeffrey Kang
Chief Executive Officer
Suite 1001, Tower C, Skyworth Building
High-Tech Industrial Park
Nanshan, Shenzhen 518057
People’s Republic of China
011-86-755-2674-3210
(Name, address, including zip code, and telephone number, including area code of agent for service)
Copies to:
Greg Miao, Esq. Robert G. Wray, Esq. Skadden, Arps, Slate, Meagher & Flom LLP 30/F Lippo Centre 89 Queensway Central, Hong Kong SAR PRC
Tel: 011-852-2820-0700 Fax: 011-852-2820-0727 | Jeffrey Saper, Esq. Don Williams, Esq. Wilson Sonsini Goodrich & Rosati, P.C. 650 Page Mill Road Palo Alto, CA 94304-1050 USA
Tel: 1-650-493-9300 Fax: 1-650-493-6811 |
Approximate date of commencement of proposed sale to the public: As soon as practicable after the Registration Statement becomes effective.
If any of the securities being registered on this Form are to be offered on a delayed or continuous basis pursuant to Rule 415 under the Securities Act of 1933, check the following box. ¨
If this Form is filed to register additional securities for an offering pursuant to Rule 462(b) under the Securities Act of 1933, check the following box and list the Securities Act registration statement number of the earlier effective registration statement for the same offering. ¨
If this Form is a post-effective amendment filed pursuant to Rule 462(c) under the Securities Act of 1933, check the following box and list the Securities Act registration statement number of the earlier effective registration statement for the same offering. ¨
If this Form is a post-effective amendment filed pursuant to Rule 462(d) under the Securities Act of 1933, check the following box and list the Securities Act registration statement number of the earlier effective registration statement for the same offering. ¨
If delivery of the prospectus is expected to be made pursuant to Rule 434 under the Securities Act of 1933, please check the following box. ¨
The Registrant hereby amends this Registration Statement on such date or dates as may be necessary to delay its effective date until the Registrant shall file a further amendment which specifically states that this Registration Statement shall thereafter become effective in accordance with Section 8(a) of the Securities Act of 1933 or until the Registration Statement shall become effective on such date as the Commission, acting pursuant to said Section 8(a), may determine.
Table of Contents
The information in this prospectus is not complete and may be changed. We may not sell these securities until the registration statement filed with the Securities and Exchange Commission is effective. This prospectus is not an offer to sell these securities and it is not soliciting an offer to buy these securities in any state where the offer or sale is not permitted.
| PRELIMINARY PROSPECTUS | Subject to Completion | June 22, 2005 |
Shares

Common Stock
We are offering shares of our common stock and the selling shareholders identified in this prospectus are offering shares of our common stock. We will not receive any proceeds from the sale of our common stock by the selling shareholders.
Our common stock is quoted on the Nasdaq National Market under the symbol “COGO.” On June 21, 2005, the last reported sale price of our common stock on the Nasdaq National Market was $6.01 per share.
Investing in our common stock involves a high degree of risk. Before buying any shares, you should read the discussion of material risks of investing in our common stock in “Risk factors” beginning on page 8 of this prospectus.
Neither the Securities and Exchange Commission nor any state securities commission has approved or disapproved of these securities or passed upon the adequacy or accuracy of this prospectus. Any representation to the contrary is a criminal offense.
| Per share | Total | |||
| Public offering price | $ | $ | ||
| Underwriting discounts and commissions | $ | $ | ||
| Proceeds, before expenses, to us | $ | $ | ||
| Proceeds, before expenses, to the selling shareholders | $ | $ |
The underwriters may also purchase up to an additional shares of our common stock at the public offering price, less the underwriting discounts and commissions, to cover over-allotments, if any, within 30 days of the date of this prospectus. Of these additional shares that the underwriters may purchase to cover over-allotments, if any, up to shares will be offered by us and up to shares will be offered by the selling shareholders. If the underwriters exercise this option in full, the total underwriting discounts and commissions will be $ , our total proceeds, before expenses, will be $ , and the total proceeds, before expenses, to the selling shareholders will be $ .
The underwriters are offering the common stock as set forth under “Underwriting.” Delivery of the shares will be made on or about , 2005.
UBS Investment Bank
C.E. Unterberg, Towbin
WR Hambrecht + Co
Maxim Group LLC
Table of Contents

Table of Contents
You should only rely on the information contained in this prospectus. We have not, and the underwriters have not, authorized anyone to provide you with additional information or information different from that contained in this prospectus. We are offering to sell, and seeking offers to buy, shares only in jurisdictions where offers and sales are permitted. The information contained in this prospectus is accurate only as of the date of this prospectus, regardless of the time of delivery of this prospectus or of any sale of shares of our common stock.
| 1 | ||
| 8 | ||
| 22 | ||
| 23 | ||
| 24 | ||
| 25 | ||
| 26 | ||
| 27 | ||
| 28 | ||
| 31 | ||
Management’s discussion and analysis of financial condition and results of operations | 33 | |
| 50 | ||
| 53 | ||
| 60 | ||
| 68 | ||
| 70 | ||
| 72 | ||
| 74 | ||
Certain United States federal income tax consequences to non-U.S. holders | 76 | |
| 78 | ||
| 79 | ||
| 83 | ||
| 83 | ||
| 84 | ||
| F-1 |
Table of Contents
This summary highlights selected information appearing elsewhere in this prospectus and may not contain all of the information that is important to you. This prospectus includes information about the shares of common stock we are offering as well as information regarding our business and detailed financial data. You should read this prospectus and the registration statement of which this prospectus is part in their entirety, especially the risks of investing in our common stock, which we discuss under “Risk Factors,” and our financial statements and related notes beginning on page F-1.
Unless the context requires otherwise, the words “Comtech,” “we,” “us,” “our” and “our company” refer to Comtech Group, Inc. and its subsidiaries, including its PRC operating companies.
OUR BUSINESS
We are a provider of customized module design solutions in China and serve as a gateway for our suppliers to access leading electronics manufacturers in China. Our customized module design solutions allow our customers to use technology components from established suppliers in a timely and cost-effective manner, reducing their time-to-market and lowering their overall costs. Our close collaboration with our customers’ product development teams gives us an understanding of their needs, and enables us to provide customization of our suppliers’ technology components with module designs to suit each of our many customers’ specific needs.
We have historically focused on the mobile handset and telecom equipment end-markets in China, but have recently expanded our addressable market to include the digital consumer electronics end-market. Within these industries we focus on wireless, broadband and digital home entertainment products. Over the last three years, we have worked with over 200 customers, including a majority of the largest and most well-known manufacturers in the mobile handset and telecom equipment end-markets in China. In addition to these original equipment manufacturers, or OEMs, our other customers include industry participants that support these OEMs, such as subsystem designers and manufacturers. In developing customized module design solutions for use in our customers’ products, we work closely with over 30 suppliers of technology components, including many large multinational companies such as Broadcom Corporation, JDS Uniphase Corporation and Matsushita Electric Works Ltd.
Based on a given customer’s specific design requirements, we propose a customized module reference design, which typically incorporates technology components from our suppliers. If the customer accepts our design, it will generally agree to purchase from us some of the specific components contained in our proposed design. Our customers and their third-party contract manufacturers are responsible for the manufacture and assembly of the customized module design solutions based on our designs. Our business model is to generate revenue by reselling a limited number of specific components required in our module reference designs. The difference between the purchase price we pay our suppliers for these components and our sales price to our customers for these components compensates us for our design, technical support and distribution services.
From 2002 to 2004, our net revenue grew from RMB207.6 million to RMB625.7 million ($75.6 million), representing a CAGR of 73.6%, and our net income grew from RMB9.2 million to RMB62.2 million ($7.5 million) during the same period, representing a CAGR of 159.8%. For the three months ended March 31, 2005, we recorded net revenue of RMB172.0 million ($20.8 million) and net income of RMB15.8 million ($1.9 million).
1
Table of Contents
Prospectus summary
OUR INDUSTRY
China has emerged as a major participant in the global electronics market and has experienced rapid growth in domestic demand for electronics products. With increasingly advanced technology requirements within various segments of the mobile handset, telecom equipment and digital consumer electronics end-markets, manufacturers in these end-markets in China are ever more demanding for more customized module design solutions to ensure that their products can incorporate the latest technology and innovation. We believe that the development of a highly-skilled, low-cost manufacturing base has enabled China’s domestic manufacturers to be competitive in the global marketplace and has resulted in the growth of exports internationally. As a result, global technology companies are increasingly using China as a global manufacturing base for design and production, leveraging the comparative cost advantages in both product design and manufacturing. We also believe that OEMs’ greater reliance on outsourcing will continue to drive demand for customized applications of standard components, requiring more design and customization work from providers such as ourselves.
OUR COMPETITIVE STRENGTHS
We believe that our customized module design solutions allow our customers to more effectively utilize our suppliers’ technology components to more efficiently compete in their target end-markets. We believe our competitive strengths include:
| Ø | Differentiated business model. We facilitate our customers’ use of technology components in their end-products, both reducing their time-to-market and lowering their overall costs. We do not directly charge a design fee for our customized module solutions. Instead, we are compensated for the value added by our design work through a markup on the components we sell, determined principally by the extent of the design work we provide. |
| Ø | Broad and diversified customer base and deep customer relationships. Our broad and diversified customer base includes all of the major domestic mobile handset and telecom equipment manufacturers in China and many of their supporting subsystem suppliers. |
| Ø | Strong relationships with technology components suppliers. We work closely with more than 30 technology components suppliers, including some of the leading global suppliers. |
OUR STRATEGY
Our objective is to be the leading provider of customized module design solutions for customers in China’s mobile handset, telecom equipment and digital consumer electronics end-markets. To achieve this objective, we plan to execute the following key business strategies:
| Ø | Strengthen our design and development capabilities. Given the shortening product life cycles in our targeted end-markets, we believe that we must continue to build and maintain strong, in-depth and diversified solution development and design capabilities to meet the changing needs of our customers, and continue to differentiate ourselves from our competitors. |
| Ø | Leverage our strong customer relationships into new opportunities. We believe that we are well positioned to capture significant growth and higher margin opportunities in the digital consumer electronics end-market, as many of our key customers in China’s mobile handset end-market have expanded into the digital consumer electronics end-markets. |
2
Table of Contents
Prospectus summary
| Ø | Make strategic investments, acquisitions or form strategicalliances. We intend to grow and expand our business by making investments, acquisitions or forming strategic relationships with companies that possess complementary design capabilities and technology. For example, we have recently established a company, 55% owned by us, to distribute semiconductors and other products for Broadcom, a leading global producer of broadband communications semiconductors, and have recently licensed and agreed to acquire technology to apply to our newly initiated storage solutions business in China. |
RISK FACTORS
An investment in our common stock involves a high degree of risk that includes risks related to our company, the industries in which we operate, the PRC, the ownership of our common stock and this offering, including the following specific risks:
| Ø | We must continually develop new customized module design solutions that help our customers respond to competitive pressures, achieve shorter time-to-market or broaden and improve their product offerings. Once we develop our proposed customized module design solutions, there is no obligation for customers to accept our proposed reference designs. |
| Ø | Because we do not charge a design fee for our solutions, but rather generate revenue through the resale of specified components contained in our module reference designs, if our customers do not accept our module reference designs, we will not capitalize on the invested resources, time and effort that we expended on a project. |
| Ø | Our business greatly relies on the continued services of our principal shareholder and chief executive officer, Jeffrey Kang, who has been responsible for developing and maintaining many relationships with our key suppliers and customers. |
| Ø | We depend on a limited number of key customers and key suppliers, the loss of which could materially impact our business. |
| Ø | Pressure from current or future competitors could cause our module reference designs to lose acceptance by our customers or require us to significantly reduce the price of our solutions to keep existing and attract new customers. |
See “Risk factors” beginning on page 8 for a more detailed description of these and other risks related to an investment in our common stock.
OUR CORPORATE INFORMATION
We were formerly known as Trident Rowan Group, Inc., or Trident, which was incorporated in Maryland in 1917. On July 22, 2004, Trident, which was a public reporting company that ceased operations in 2000, acquired all of the outstanding capital stock of Comtech Group, a Cayman Islands company, or Comtech Cayman, in exchange for the issuance of approximately 91.2% of the then- outstanding shares of its common stock to the shareholders of Comtech Cayman. On August 2, 2004, we changed our name from Trident to Comtech Group, Inc. For a complete description of the share exchange transaction, our corporate structure and our operating companies, see “Corporate structure.”
Our principal executive offices are located at Suite 1001, Tower C, Skyworth Building, High-Tech Industrial Park, Nanshan, Shenzhen 518057, PRC, and our telephone number is 011-86-755-2674-3210. We maintain an Internet website atwww.comtech.com.cn.We have not incorporated by reference into this prospectus the information on our website, and you should not consider it to be a part of this prospectus.
3
Table of Contents
The offering
Common stock we are offering | shares |
Common stock being offered by selling shareholders | shares |
Common stock to be outstanding after this offering | shares |
Over-allotment option | We and the selling shareholders have granted the underwriters a 30-day option to purchase up to and additional shares, respectively, to cover any over-allotments. |
Use of proceeds after expenses | We estimate that the net proceeds from this offering will be approximately $ million, or approximately $ million if the underwriters exercise their over-allotment option in full. We expect to use the net proceeds from this offering to fund possible strategic alliances or acquisitions, to expand our research and development efforts relating to new products, and for working capital and other general corporate purposes. |
Dividend policy | We do not have any present plan to pay any cash dividends on our shares of common stock in the foreseeable future. |
Nasdaq symbol | COGO |
The number of shares of our common stock outstanding immediately after the closing of this offering is based on shares of our common stock outstanding as of , 2005. The number of shares of our common stock outstanding immediately after this offering excludes:
| Ø | shares of common stock issuable upon the exercise of outstanding options and warrants to purchase our common stock, with a weighted average exercise price of per share; and |
| Ø | shares of common stock reserved for issuance under our 2004 Incentive Stock Option Plan. |
4
Table of Contents
Conventions that apply to this prospectus
Unless otherwise indicated, references in this prospectus to:
| Ø | “CAGR” are to the compound annual growth rate; |
| Ø | “China” or the “PRC” are to the People’s Republic of China, including for the purpose of this prospectus Hong Kong, but excluding Macau and Taiwan; |
| Ø | “Nasdaq” is to the Nasdaq National Stock Market, Inc.; |
| Ø | “RMB” are to Renminbi, the legal currency of China; |
| Ø | “shares” are to our shares of common stock, with par value $0.01 per share; |
| Ø | “U.S. GAAP” are to generally accepted accounting principles in the United States; |
| Ø | “$” are to U.S. dollars, the legal currency of the United States; and |
| Ø | “Comtech”, “we”, “us”, “our” and “our company” are to Comtech Group, Inc. and its subsidiaries, including its PRC operating companies. |
Unless otherwise indicated, all information in this prospectus:
| Ø | assumes that the underwriters do not exercise their option to purchase up to additional shares of our common stock from us and the selling shareholders to cover over-allotments, if any; and |
| Ø | gives effect to the one-for-two reverse stock split of our common stock completed on January 14, 2005. |
Solely for your convenience, this prospectus contains translations of certain Renminbi amounts into U.S. dollars at specified rates. All translations from Renminbi to U.S. dollars are made (unless otherwise indicated) at the rate of RMB8.2765 per $1.00, the noon buying rate in effect on March 31, 2005. No representation is made that the Renminbi or U.S. dollars amounts referred to in this prospectus could have been or could be converted into U.S. dollars or Renminbi, as the case may be, at any particular rate or at all.
5
Table of Contents
Summary consolidated financial data
The following summary consolidated statement of operations data for the three years ended December 31, 2004 and the consolidated balance sheet data as of December 31, 2004, 2003 and 2002, presented below are derived from our audited consolidated financial statements and related notes thereto, which for the three years ended December 31, 2004 have been included elsewhere in this prospectus. These audited consolidated financial statements and the related notes have been prepared in accordance with U.S. GAAP, and have been audited by Deloitte Touche Tohmatsu, an independent registered public accounting firm.
The consolidated statement of operations data for the three months ended March 31, 2005 and 2004, and the consolidated balance sheet as of March 31, 2005, are derived from our unaudited condensed consolidated financial statements and related notes which have been included elsewhere in this prospectus. These unaudited condensed consolidated financial statements have been prepared in accordance with U.S. GAAP. We have prepared the unaudited condensed consolidated financial statements on the same basis as the audited consolidated financial statements, and have included in our opinion, all adjustments, consisting only of normal and recurring adjustments, that we consider necessary for a fair presentation of the financial information set forth in those statements. Our historical results for any prior or interim period are not necessarily indicative of results to be expected for a full fiscal year or for any future period.
The consolidated financial statements are reported in Renminbi because all of our material operating entities are based in and operated entirely within the PRC. Renminbi and U.S. dollar amounts are presented in thousands, except share and per share data. This data should be read in conjunction with our “Management’s discussion and analysis of financial condition and results of operations” and our audited consolidated financial statements and the related notes included elsewhere in this prospectus.
6
Table of Contents
Summary consolidated financial data
Consolidated Statement of Operations Data:
| Three months ended March 31, | Year ended December 31, | |||||||||||||||||||||||||||
| 2005 | 2005 | 2004 | 2004 | 2004 | 2003 | 2002 | ||||||||||||||||||||||
| (in thousands, except share and per share data) | ||||||||||||||||||||||||||||
Net revenue | $ | 20,782 | RMB | 172,001 | RMB | 153,754 | $ | 75,594 | RM | B625,656 | RMB | 357,805 | RMB | 207,607 | ||||||||||||||
Cost of revenue | (17,606 | ) | (145,716 | ) | (130,092 | ) | (64,133 | ) | (530,800 | ) | (306,939 | ) | (190,265 | ) | ||||||||||||||
Gross profit | 3,176 | 26,285 | 23,662 | 11,461 | 94,856 | 50,866 | 17,342 | |||||||||||||||||||||
Selling, research and development, general and administrative expenses | (953 | ) | (7,894 | ) | (3,329 | ) | (3,289 | ) | (27,213 | ) | (20,341 | ) | (7,461 | ) | ||||||||||||||
Other operating income | 134 | 1,110 | — | — | ||||||||||||||||||||||||
Income from operations | 2,223 | 18,391 | 20,333 | 8,306 | 68,753 | 30,525 | 9,881 | |||||||||||||||||||||
Interest expense | (47 | ) | (393 | ) | (322 | ) | (260 | ) | (2,156 | ) | (801 | ) | — | |||||||||||||||
Interest income | 3 | 29 | 11 | 5 | 38 | 54 | 157 | |||||||||||||||||||||
Income before income tax | 2,179 | 18,027 | 20,022 | 8,051 | 66,635 | 29,778 | 10,038 | |||||||||||||||||||||
Income tax | (180 | ) | (1,487 | ) | (465 | ) | (278 | ) | (2,300 | ) | (1,295 | ) | (820 | ) | ||||||||||||||
Net income before minority interest | 1,999 | 16,540 | 19,557 | 7,773 | 64,335 | 28,483 | 9,218 | |||||||||||||||||||||
Minority interest | (88 | ) | (729 | ) | (697 | ) | (258 | ) | (2,133 | ) | — | — | ||||||||||||||||
Net income | $ | 1,911 | RMB | 15,811 | RMB | 18,860 | $ | 7,515 | RMB | 62,202 | RMB | 28,483 | RMB | 9,218 | ||||||||||||||
Earnings per share | ||||||||||||||||||||||||||||
Basic | $ | 0.08 | RMB | 0.62 | RMB | 0.93 | $ | 0.35 | RMB | 2.87 | RMB | 1.41 | RMB | 0.46 | ||||||||||||||
Diluted | $ | 0.07 | RMB | 0.59 | RMB | 0.93 | $ | 0.34 | RMB | 2.84 | RMB | 1.41 | RMB | 0.46 | ||||||||||||||
Dividends declared per share | RMB | 2.04 | RMB | — | ||||||||||||||||||||||||
Weighted average number of shares outstanding | ||||||||||||||||||||||||||||
Basic | 25,381,853 | 25,381,853 | 20,251,075 | 21,690,560 | 21,690,560 | 20,251,075 | 20,251,075 | |||||||||||||||||||||
Diluted | 26,871,865 | 26,871,865 | 20,251,075 | 21,885,053 | 21,885,053 | 20,251,075 | 20,251,075 | |||||||||||||||||||||
| Consolidated Balance Sheet Data: | ||||||||||||||||||||||||||||
| As of March 31, | As of December 31, | |||||||||||||||||||||||||||
| 2005 | 2005 | 2004 | 2004 | 2003 | 2002 | |||||||||||||||||||||||
| (in thousands) | ||||||||||||||||||||||||||||
Cash |
| $ 5,168 | RMB | 42,771 | $ | 5,007 | RMB | 41,444 | RMB | 30,683 | RMB | 12,194 | ||||||||||||||||
Trade accounts receivable, net of allowance for doubtful amounts |
| 24,350 | 201,532 | 20,418 | 168,989 | 92,259 | 67,597 | |||||||||||||||||||||
Property and equipment, net |
| 419 | 3,467 | 401 | 3,317 | 2,961 | 2,371 | |||||||||||||||||||||
Total assets |
| 38,754 | 320,748 | 37,355 | 309,167 | 160,200 | 97,072 | |||||||||||||||||||||
Total current liabilities |
| 13,906 | 115,098 | 14,372 | 118,955 | 142,546 | 66,514 | |||||||||||||||||||||
Total liabilities and minority interest |
| 14,502 | 120,031 | 14,880 | 123,159 | 142,546 | 66,514 | |||||||||||||||||||||
Total shareholders’ equity |
| 24,252 | 200,717 | 22,475 | 186,008 | 17,654 | 30,558 | |||||||||||||||||||||
7
Table of Contents
You should carefully consider the risks described below, in conjunction with other information and our consolidated financial statements and related notes included elsewhere in this prospectus, before making an investment decision. You should pay particular attention to the fact that we conduct substantially all of our operations in China and are governed by a legal and regulatory environment that in some respects differ significantly from the environment that may prevail in other countries that you may be familiar with. Our business, financial condition or operating results could be affected materially and adversely by any or all of these risks. The trading price of our common stock could decline due to any or all of these risks, and you may lose all or part of your investment. An investment in our common stock consequently involves a high degree of risk that you should be aware of.
RISKS RELATED TO OUR BUSINESS
Our operating results fluctuate from quarter to quarter.
Our quarterly revenue, income and other operating results have fluctuated in the past and may fluctuate significantly in the future due to a number of factors, including the following:
| Ø | the ability of our suppliers to meet our supply requirements; |
| Ø | the cancellation of large orders; |
| Ø | competitive pressures; |
| Ø | the time required for research and development; |
| Ø | changing design requirements resulting from rapid technology shifts; and |
| Ø | industry trends impacting the overall market for our customers’ end-products. |
As a result of these and other factors, our results of operations may vary on a quarterly basis and net revenue may be adversely affected from period to period. For example, our net revenue relating to sales of our mobile handset solutions was adversely affected in the third and fourth quarters of 2004 due to excess inventory held by our customers during those periods, which was a result of reduced demand in the mobile handset end-market. Our results of operations for a particular quarter may not be indicative of our future performance. If our operating results in a quarter fall below our expectations or the expectations of market analysts or investors, the price of our common stock is likely to decrease.
Our operating results are substantially dependent on development of new customized module design solutions.
We may be unable to develop new customized module design solutions in a timely or cost-efficient manner, and these new solutions may fail to meet the requirements of our customers’ end-markets. If we fail to develop new solutions that help our customers respond to competitive pressures, achieve shorter time-to-market or broaden and improve their product offerings, we will lose business and our results of operations will be materially and adversely affected.
8
Table of Contents
Risk factors
If our customers do not accept our proposed customized module design solutions or do not purchase from us the specified components contained in the proposed module reference design, our net revenue will be adversely affected.
While approximately 50% of our proposed customized module design solutions are accepted by our customers, there is no obligation for customers to accept our proposed solutions. We dedicate personnel, management and financial resources to research and development and technical support in developing new customized module design solutions for our customers. The time frames for most research and development projects typically range from two to 18 months. Because we do not charge a design fee for our services, but rather generate revenue through the resale of specified components contained in our proposed reference designs, if our customers do not accept our proposed designs, we will fail to capitalize on the invested resources, time and effort that we expended on a project.
Furthermore, our customers typically make purchases on a purchase order basis. Prior to submission of a purchase order, our customers are not obligated to purchase from us any quantity of specific components that we propose to sell in our proposed module reference design. Our customers may cancel or defer their purchase orders on short notice without significant penalty. Even if a customer accepts our proposed module reference design, the customer could bypass us and contract with our competitors or possibly our suppliers directly for the purchase of the specific components we otherwise had proposed to sell. The failure to accept our proposed module reference design, the loss of ongoing business from our customers or the transition away from us in favor of direct purchases from our competitors or suppliers could each result in our failure to realize potentially significant net revenue.
Reliance on our suppliers, with whom we often do not have long-term supply agreements, makes us vulnerable to the loss of one or more key suppliers or the delivery capabilities of our suppliers.
We typically rely on a limited number of key suppliers, and many customized module design solutions that we develop are designed around technology components provided by our suppliers. We typically do not have long-term supply agreements or other forms of exclusive arrangements with our suppliers. In 2004, for example, Matsushita Electric Works, Ltd. and its affiliated entities, or Matsushita, and JDS Uniphase Corp. accounted for approximately 52% and 24%, respectively, of our cost of revenue. Furthermore, although we deal with approximately ten different divisions within Matsushita, purchases of relays and connectors from Matsushita accounted for a substantial portion of our cost of revenue attributable to Matsushita. If we lose a key supplier or a supplier reduces the quantity of products it sells to us, does not maintain a sufficient inventory level of products required by us or is otherwise unable to meet our demand for its components, we may have to expend significant time, effort and other resources to locate a suitable alternative supplier and secure replacement components. For example, when a key supplier recently relocated its production facilities, interruption in its production capacity resulted in its inability to meet our quarterly supply requirements. If suitable replacement components are unavailable, we may be forced to redevelop certain of our solutions, which ultimately may not be accepted by our customers.
Also, if our suppliers fail to introduce new products that keep up with new technologies, they may be surpassed by other suppliers entering the market with whom we may not have existing relationships. The costs and delays related to finding new suppliers or redeveloping solutions could significantly harm our business.
9
Table of Contents
Risk factors
If we fail to attract and retain key personnel, particularly our chief executive officer, our business will be materially impaired and our financial condition and results of operations will suffer.
Our business greatly relies on the continued services of Jeffrey Kang, our principal shareholder and chief executive officer. Many relationships with our key suppliers and key customers have been developed by and continue to be maintained by Mr. Kang. Our future success will depend to a significant degree upon the performance and contribution of Mr. Kang and other members of our senior management team in areas including sales, research and development, information technology and finance. Therefore, our business and results of operations may be materially and adversely affected if Mr. Kang or another member of our senior management team leaves us, which they may do at any time since, as with the exception of our chief financial officer, they do not have an employment or non-compete agreement with us. In addition, we will incur additional expenses to recruit and develop senior management members if one or more of our key employees is unwilling or unable to continue his or her employment with us. We do not maintain key man life insurance covering our senior management or any of our key employees.
Our future success also depends on our ability to identify, attract, hire, train, retain and motivate highly-skilled personnel. If we cannot attract and retain the personnel we require at a reasonable cost, our cost of revenue will increase and the profitability of our business could be negatively affected. Our business is especially dependent on sales, marketing and research and development personnel. Competition in China for executive-level and skilled technical and sales and marketing personnel is strong, and recruiting, training, and retaining qualified key personnel are important factors affecting our ability to meet our growth objectives. Should key employees leave our company, we may lose both an important internal asset and net revenue from customer projects in which those employees were involved.
Loss of key customers may adversely impact our net revenue.
We generate the majority of our net revenue from a small number of key customers, and we anticipate that a small number of key customers will continue to account for a significant portion of our net revenue in the foreseeable future, particularly in the telecom equipment segment. In 2004, our sales to ZTE, UTStarcom and Huawei accounted for approximately 13%, 12% and 11%, respectively, of our net revenue, although sales to UTStarcom fell substantially in the first quarter of 2005 compared to the fourth quarter of 2004, as for some of our module design solutions, our existing component suppliers were unable to produce on a timely basis the components needed to meet the more advanced technological specifications of UTStarcom. Sales to our top 10 customers represented approximately 58% of our net revenue in 2004. Should we lose, receive reduced orders from, or experience any adverse change in our relationship with any of our key customers, we will suffer a substantial loss in net revenue.
The end-markets in which we operate are highly competitive and fragmented. We expect competition to intensify in the future, and if we fail to compete effectively, our business will be harmed.
Pressures from current or future competitors could cause our solutions to lose market acceptance or require us to significantly reduce our sales prices to keep and attract customers. Our competitors often have longer operating histories, stronger customer and supplier relationships, larger technical staffs and sales forces, and/or greater financial, technical and marketing resources than we do. Although we believe that there are no direct competitors of any meaningful size who operate using the same business model as ours, we face indirect competition from:
| Ø | Other technology component suppliers. For each project, we work with one enabling technology component supplier to compete against other enabling technology component suppliers. Consequently, we indirectly compete against our suppliers’ competitors. For example, by working with JDS Uniphase, we compete against companies such as Avanex Corp. and Bookham Inc. in supplying optical transmission module design solutions. |
10
Table of Contents
Risk factors
| Ø | Component manufacturers and distributors. We compete indirectly with component manufacturers such as Vishay Intertechnology and Epcos AG, and component distributors such as Arrow Electronics, Inc., Avnet Inc. and Memec Inc., which may seek to expand their product/service offerings to include customized module design solutions. |
We may also face indirect competition from customers and suppliers. Currently many of our customers and suppliers do not focus on customized module design. If our customers or suppliers decide to devote more time and resources to in-house module design, the demand for our solutions may decline. In addition, our customers may change their procurement strategy or decide to rely on us primarily for component delivery and not for integration or design work. Similarly, component suppliers may also seek to offer their component products or modules incorporating key components from our solutions directly to our customers. The loss of customers for our customized module design solutions as a result of these competitive factors would have a material adverse effect on our business, financial condition and results of operations.
As we expand our business, we intend to develop new customized module design solutions and technological capabilities in end-markets where we do not currently have extensive experience or technological capability. Failure to develop or execute this growth strategy will have a material adverse effect on our net revenue.
Historically we have derived substantially all of our net revenue from our customized module design solutions provided to customers in the mobile handset and telecom equipment end-markets. We recently began targeting the digital consumer electronics and storage solution end-markets in which we have not had extensive experience or developed significant technological capability to date. In particular, we have not had any prior experience or technological capability in the storage solutions end-market. Over time, we hope to develop our integrated circuit and application software design capabilities and provide solutions based on our own proprietary technology, primarily for Internet protocol television, or IPTV, set-top boxes and digital televisions, or DTV. Our success in the digital consumer electronics end-market will depend, in significant part, on our ability to develop the necessary technological capability and to leverage our existing customer base that has expanded into this end-market. We expect to incur significant research and development expenses, through hiring additional engineering personnel to develop new solutions and expanding our intellectual property capabilities. If we are unable to quickly develop technological expertise, increase our research and development capabilities and leverage our customer base as anticipated, our return on our investment with respect to these efforts may be lower than anticipated and our operating results may suffer. Moreover, market acceptance of our customers’ new digital consumer electronics products, such as IPTV set-top boxes and DTV, is unproven, and our new markets for digital consumer electronics and storage solutions may not develop as anticipated, or at all. Finally, our customer base may not respond to our efforts to expand our proprietary capabilities and may be unwilling to utilize these enhanced capabilities.
We may be unable to manage rapid growth and a changing operating environment, which could adversely affect our ability to serve our customers and harm our business.
We have experienced rapid growth over the last five years, with our net revenue increasing from RMB55.9 million in 2000 to RMB625.7 million ($75.6 million) in 2004. Over the same period, our number of employees has also increased from approximately 30 to 94. We have limited operational, administrative and financial resources, which may be inadequate to sustain our current growth rate. If we are unable to manage our growth effectively, the quality of our solutions could deteriorate and our business may suffer. As our customer base increases and we enter new end-markets, such as the digital consumer electronics end-market, or as we expand our technological capabilities to include integrated circuit and application software design, we will need to:
| Ø | increase our investments in personnel, research and development capabilities, facilities and other operational areas; |
11
Table of Contents
Risk factors
| Ø | continue training, motivating and retaining our existing employees, and attract and integrate new qualified employees; |
| Ø | develop and improve our operational, financial, accounting and other internal systems and controls; and |
| Ø | take enhanced measures to protect any proprietary technology or technological capability we develop. |
Any failure to manage our growth successfully could distract management’s attention and result in our failure to serve our customers and harm our business.
We may not have sufficient funds to pay our accounts payable when due, which could adversely affect our operations and net revenue.
We experience a time lag in our accounts payable and accounts receivable cycles. Consequently, we may experience periods during which our cash from operations is insufficient to fund our working capital requirements. We have historically funded our working capital requirements through cash on hand, operating cash flows, as well as short-term credit facilities, factoring arrangements and loans from our principal shareholder and chief executive officer, Jeffrey Kang, and his affiliated companies. As we grow and our working capital requirements increase, these facilities may not be sufficient to meet our needs. We may be unable to maintain these liquidity sources or obtain additional liquidity sources on commercially reasonable terms to meet our increased funding requirements. For additional details regarding our working capital needs and arrangements, please see “Management’s discussion and analysis of financial condition and results of operations—Liquidity and Capital Resources.”
We generally cannot replace a supplier without the need to redevelop the modules that incorporate its components, and in doing so, we would incur significant expenses and consume additional development time. If we do not have sufficient working capital to pay our suppliers on a timely basis, we may be unable to grow our business, and our suppliers may reduce the quantity of components they supply or may no longer sell components to us, either of which would have a material adverse effect on our net revenue and results of operations.
We face risks associated with future investments or acquisitions.
An important component of our growth strategy is to invest in or acquire companies that possess complementary design capabilities and technologies. We may be unable to identify suitable investment or acquisition candidates or to make these investments or acquisitions on a commercially reasonable basis, if at all. If we complete an investment or acquisition, we may not realize the anticipated benefits from the transaction.
Integrating an acquired company or technology is complex, distracting and time consuming, as well as a potentially expensive process. The successful integration of an acquisition would require us to:
| Ø | integrate and retain key management, sales, research and development, and other personnel; |
| Ø | incorporate the acquired products or capabilities into our offerings both from an engineering and sales and marketing perspective; |
| Ø | coordinate research and development efforts; |
| Ø | integrate and support pre-existing supplier, distribution and customer relationships; and |
| Ø | consolidate duplicate facilities and functions and combine back office accounting, order processing and support functions. |
12
Table of Contents
Risk factors
The geographic distance between the companies, the complexity of the technologies and operations being integrated and the disparate corporate cultures being combined may increase the difficulties of combining an acquired company or technology. Acquired businesses are likely to have different standards, controls, contracts, procedures and policies, making it more difficult to implement and harmonize company-wide financial, accounting, billing, information and other systems. Management’s focus on integrating operations may distract attention from our day-to-day business and may disrupt key research and development, marketing or sales efforts.
Our acquisition strategy also depends on our ability to obtain necessary government approvals that may be required, as described under “—Risks Related to Doing Business in China—Our acquisition strategy depends on government regulatory approvals in China.”
The unauthorized use of our module design solutions could have a material adverse impact on our net revenue.
Our in-house design engineering teams develop our customized module design solutions. We typically do not have patent or other intellectual property protection for our solutions, nor do we typically have non-disclosure or confidentiality agreements with most of our suppliers or customers to keep our design specifications confidential. Suppliers or other competitors may attempt to circumvent us by selling products or providing module design solutions directly to our customers.
A component of our growth strategy is to begin to develop proprietary solutions in-house, specifically integrated circuits and application software design, and to make strategic investments in, form strategic alliances with or acquire, companies that possess complementary design capabilities and technology. Therefore, we expect that proprietary intellectual property will become increasingly important to our business. The unauthorized use by our suppliers or other competitors of our module design solution specifications or other intellectual property in the future would result in a substantial loss of our net revenue. The validity, enforceability and scope of protection of intellectual property in China is uncertain and still evolving, and PRC laws may not protect intellectual property rights to the same extent as the laws of some other jurisdictions, such as the United States. Moreover, litigation may be necessary in the future to enforce any intellectual property rights we may establish or acquire in the future, which could result in substantial costs and diversion of our resources, and have a material adverse effect on our business, financial condition and results of operations.
We became a public company through a share exchange with a non-operating public shell company, where we were the accounting acquirer and assumed all known and unknown potential liabilities of our predecessor entity.
Our July 2004 share exchange with Trident, as described more fully under “Corporate structure” was accounted for as a reverse merger in which Comtech Cayman was deemed the accounting acquirer and Trident, which was originally incorporated in 1917, was the legal acquirer. We have retained all the known and unknown liabilities of Trident. In addition to the threatened litigation discussed under “Our business—Legal Proceedings”, we cannot guarantee that other potential liability will not come to our knowledge in the future.
13
Table of Contents
Risk factors
We depend upon contractual agreements with the two shareholders of Shenzhen Comtech in conducting our business through Shenzhen Comtech and Shanghai E&T and receiving payments, which may not be as effective in providing operational control as direct ownership and may be difficult to enforce. Further, if the PRC government finds these contractual agreements violate or conflict with PRC governmental regulations, our business would be materially adversely affected.
At the time of the incorporation of Shenzhen Comtech, foreign shareholding in a trading business such as ours could not exceed 65%. With subsequent PRC deregulation, foreign shareholding in a trading business can now reach 100%. However, general trading with foreign investments is still restricted, requiring special approval, which is difficult to obtain. Because foreign investments in general trading businesses such as Shenzhen Comtech’s are restricted in the PRC, in order to exercise control over Shenzhen Comtech and Shanghai E&T without direct shareholding by our offshore entities, our principal shareholder and chief executive officer, Jeffery Kang and his wife own through contractual agreements and for the benefit of our 100% directly owned subsidiary, Comtech China, all of the equity interest in our PRC operating company, Shenzhen Comtech, which, in turn, owns 60% equity interest in another of our PRC operating companies, Shanghai E&T. While we do not have any equity interest in Shenzhen Comtech, through these contractual agreements, we enjoy voting control and are entitled to the economic interests associated with Jeffery Kang’s and his wife’s equity interest in Shenzhen Comtech. For additional details regarding these contractual agreements, see “Corporate structure” and “Related party transactions.” These contractual agreements may not be as effective in providing us with control over Shenzhen Comtech as direct ownership because we rely on the performance of Jeffery Kang and his wife under the agreements. If Jeffrey Kang or his wife fail to perform his or her respective obligations under the agreements, we may have to incur substantial costs and resources to enforce such agreements and may not be able to do so in any case. Also, we must rely on legal remedies under applicable law, which may not be as effective as those in the United States. Because we rely on Shenzhen Comtech and Shanghai E&T in conducting our business operations in China, the realization of any of these risks relating to our corporate structure could result in a material disruption of our business, diversion of our resources and the incurrence of substantial costs, any of which could materially and adversely affect our operating results and financial condition.
In the opinion of our PRC counsel, Grandall Legal Group, the ownership structure of Shenzhen Comtech and the contractual agreements among Comtech China, Mr. Kang and his wife do not violate existing PRC laws, rules and regulations. There are, however, substantial uncertainties regarding the interpretation and application of current or future PRC laws and regulations, including but not limited to the laws and regulations governing the validity and enforcement of these contractual agreements. In particular, this type of contractual agreement is not commonly seen in China and accordingly, we cannot assure you that PRC regulatory authorities will not determine that these contractual agreements with Jeffrey Kang and his wife violate or conflict with PRC laws or regulations, including those regarding restrictions on foreign investments in trading businesses.
If we or our PRC operating company, Shenzhen Comtech, are found to violate any existing or future PRC laws or regulations, the relevant regulatory authorities will have broad discretion in dealing with such violation, which would cause significant disruptions to our business operations or render us unable to conduct our business operations and may materially adversely affect our business, financial condition and results of operations.
RISKS RELATED TO OUR INDUSTRY
Historically, we have focused on the mobile handset and telecom equipment end-markets in China, but recently expanded our focus to include the digital consumer electronics end-market in China. We currently do not derive a significant portion of our net revenue from the consumer electronics end-market.
14
Table of Contents
Risk factors
Our inability to respond quickly and effectively to rapid technological advances and market demands would adversely impact our competitive position and our results of operations.
The mobile handset and telecom equipment end-markets are characterized by rapid technological advances, intense competition, frequent introduction of new products and services and consumer demand for greater functionality, lower costs, smaller products and better performance. We must constantly seek out new products and develop new solutions to maintain in our portfolio. We have experienced and will continue to experience some solution design obsolescence. We expect our customers’ demands for improvements in product performance to increase, which means that we must continue to improve our design solutions and develop new solutions to remain competitive and grow our business. Our failure to compete successfully for customers will result in price reductions, reduced margins or loss of market share, any of which would harm our business, results of operations and financial condition.
Substantially all of our net revenue currently comes from sales to manufacturers in the highly cyclical mobile handset and telecom equipment end-markets, and cyclical downturns could harm our operating results.
The mobile handset and telecom equipment end-markets are highly cyclical and have experienced severe and prolonged downturns, often in connection with maturing product cycles and declines in general economic conditions. These downturns have been characterized by diminished product demand, production overcapacity, high inventory levels and accelerated erosion of average selling prices. For example, during the second half of 2004, our net revenue relating to sales in the mobile handset end-market was adversely affected due to excess inventory being held by our customers during the period, which was a result of reduced demand in the mobile handset end-market. The impact of slowing end-customer demand was compounded by higher than normal levels of equipment and inventories among our customers and our customers’ adjustments in their order levels, resulting in increased pricing pressure.
In addition, our recent and significant growth in net revenue resulted, in large part, from the high growth in sales of products manufactured by domestic mobile handset and telecom equipment manufacturers in China. These domestic manufacturers may not continue to grow their sales at historical levels, if at all. The stagnation or reduction in overall demand for mobile handset and telecom equipment products would materially affect our results of operations and financial condition.
The mobile handset end-market is characterized by a short product lifecycle, making time-to-market and sensitivity to customer needs critical to our success and our failure to respond will harm our business.
Mobile handsets typically have a lifecycle of approximately six months before the technology becomes obsolete. Time-to-market, both with respect to our customers’ ability to supply consumers with timely and marketable products and our ability to provide our customers with a wide array of latest generation customized module design solutions, is critical to our success. As design cycles in the industry shorten, we face logistical challenges in providing our solutions in an increasingly shorter timeframe. If we are unable to respond to the shortened lifecycles and time-to-market, our business will suffer.
RISKS RELATED TO DOING BUSINESS IN CHINA
There are substantial risks associated with doing business in China, including those set forth in the following risk factors.
15
Table of Contents
Risk factors
Our operations may be adversely affected by China’s economic, political and social conditions.
Substantially all of our operations and assets are located in China and substantially all of our net revenue derived from our operations in China. Accordingly, our results of operations and future prospects are subject to economic, political and social developments in China. In particular, our results of operations may be adversely affected by:
| Ø | changes in China’s political, economic and social conditions; |
| Ø | changes in policies of the government or changes in laws and regulations, or the interpretation of laws and regulations; |
| Ø | changes in foreign exchange regulations; |
| Ø | measures that may be introduced to control inflation, such as interest rate increases; and |
| Ø | changes in the rate or method of taxation. |
The PRC economy has historically been a planned economy. The majority of productive assets in China are still owned by various levels of the PRC government. In recent years the government has implemented economic reform measures emphasizing decentralization, utilization of market forces in the development of the economy and a high level of management autonomy. Such economic reform measures may be inconsistent or ineffectual, and we may not benefit from all such reforms. Furthermore, these measures may be adjusted or modified, possibly resulting in such economic liberalization measures being applied inconsistently from industry to industry, or across different regions of the country.
In the past twenty years, China has been one of the world’s fastest growing economies in terms of gross domestic product, or GDP. This growth may not be sustainable. Moreover, a slowdown in the economies of the United States, the European Union and certain Asian countries may adversely affect economic growth in China which depends on exports to those countries. Our financial condition and results of operations, as well as our future prospects, would be materially and adversely affected by an economic downturn in China.
Our financial results benefit from tax concessions granted by the PRC government, the change to or expiration of which would materially change our results of operations.
Our results of operation may be adversely affected by changes to or expiration of preferential tax concessions that some of our PRC operating companies currently enjoy or expect to enjoy in the future. The statutory tax rate generally applicable to Chinese companies is 33%. As a result of preferential tax rate incentives, our operations have been subject to relatively low tax liabilities. Tax that would otherwise have been payable without preferential tax treatment amounted to approximately RMB19.9 million ($2.4 million), RMB10.2 million and RMB2.4 million in 2004, 2003, and 2002, respectively. For additional details regarding these tax incentives, please see “Management’s discussion and analysis of financial condition and result of operations—Taxation.”
Tax laws in China are subject to interpretations by relevant tax authorities. The preferential tax treatment may not remain in effect or may change, in which case we may be required to pay the higher income tax rate generally applicable to Chinese companies, or such other rate as is required by the laws of China.
The telecom equipment market is extensively regulated in China.
The telecom equipment end-market accounted for 39.9% of our net revenues in 2004. China’s telecom industry is heavily regulated. Changes in regulations affecting sales of these customers could negatively affect the telecom equipment end-market for our solutions, which will materially harm our business.
16
Table of Contents
Risk factors
Government control of currency conversion may affect the value of your investment.
Because the majority of our net revenue is denominated in Renminbi, any restrictions on currency exchange may limit our ability to use revenue generated in Renminbi to meet our foreign currency obligations, primarily denominated in U.S. dollars. The principal regulation governing foreign currency exchange in China is the Foreign Currency Administration Rules (1996), or the Rules, as amended. Under the Rules, once certain procedural requirements are met, Renminbi is convertible for current account transactions, including trade and service-related foreign exchange transactions and dividend payments, but not for capital account transactions, including direct investment, loans or investments in securities outside China, without prior approval of the State Administration of Foreign Exchange of the People’s Republic of China, or its local counter-parts. Since a significant amount of our future revenues will continue to be denominated in Renminbi, any existing and future restrictions on currency exchange may limit our ability to utilize revenue generated to fund our business activities outside of China, if any, or expenditures denominated in foreign currencies, or our ability to meet our foreign currency obligations, which could have a material adverse effect on our business, financial condition and results of operations. We cannot be certain that the PRC regulatory authorities will not impose more stringent restrictions on the convertibility of Renminbi with respect to foreign exchange transactions.
Our acquisition strategy depends on government regulatory approvals in China.
Regulations were recently promulgated by State Development and Reform Commission, or SDRC, and the State Administration of Foreign Exchange, or SAFE, that require registration with, and approval from, PRC government authorities in connection with direct or indirect offshore investment activities by individuals who are PRC residents and PRC corporate entities. These regulations may apply to our future offshore or cross-border acquisitions, as well as to the equity interests in offshore companies held by our PRC shareholders who are considered PRC residents. We intend to make all required application and filings, and will require the shareholders of the offshore entities in our corporate group who are considered PRC residents to make the application and filings, as required under these regulations and under any implementing rules or approval practices that may be established under these regulations. However, because these regulations are relatively new and lacking implementing rules or reconciliation with other approval requirements, it remains uncertain how these regulations, and any future legislation concerning offshore or cross-border transactions, will be interpreted and implemented by the relevant government authorities. The approval criteria by SDRC agencies for outbound investment by PRC residents are not provided under the relevant SDRC regulations. Also, the criteria for registration with SAFE agencies, and whether such registration procedure is discretionary, are still uncertain as the criteria, if any, are not provided for under relevant SDRC regulations. Furthermore, there is a lack of relevant registration precedents for us to determine the registration criteria in practice. Accordingly, we cannot provide any assurances that we will be able to, nor can we ensure that our shareholders will be considered PRC residents and they must comply with or register under the relevant regulations and that they will be able to, comply with, qualify under or obtain any registration or approval as required by these regulations or other related legislations. Our failure or the failure of our PRC resident shareholders to obtain these approvals or registrations may restrict our ability to acquire a company outside of China or use our entities outside of China to acquire or establish companies inside of China, which could negatively affect our business and future prospects.
PRC laws and our corporate structure may restrict our ability to receive dividends and payments from, and transfer funds to, our PRC operating companies, which may negatively affect our results of operations and restrict our ability to act in response to changing market conditions.
Substantially all of our operations are conducted through our PRC operating companies. The ability of our PRC operating companies to make dividend and other payments to us may be restricted by factors such as changes in applicable foreign exchange and other laws and regulations. For example, under the
17
Table of Contents
Risk factors
new SAFE regulations discussed in the previous risk factor, the foreign exchange activities of our present or prospective PRC subsidiaries are conditioned upon the compliance with the SAFE registration requirements by the shareholders of our offshore entities who are PRC residents. Failure to comply with these SAFE registration requirements may result in substantial restriction on the foreign exchange inflow to and outflow from our PRC subsidiaries, including, remittance of dividends and foreign-currency- denominated borrowings by our PRC subsidiaries. In addition, our PRC operating companies are required, where applicable, to allocate a portion of their net profit to certain funds before distributing dividends, including at least 10% of their net profit to certain reserve funds until the balance of such fund has reached 50% of their registered capital. These reserves can only be used for specific purposes, including making-up cumulative losses of previous years, conversion to equity capital, and application to business expansion, and are not distributable as dividends. Our PRC operating companies are also required, where applicable, to allocate an additional 5% to 10% of their net profits to a statutory common welfare fund. The net profit available for distribution from our PRC operating companies is determined in accordance with generally accepted accounting principles in China, which may materially differ from a determination performed in accordance with U.S. GAAP. As a result, we may not receive sufficient distributions or other payments from these entities to enable us to make dividend distributions to our shareholders in the future, even if our U.S. GAAP financial statements indicate that our operations have been profitable.
We do not directly own the equity interest in Shenzhen Comtech, which accounted for approximately 30% of our net revenue in 2004, as well as Shenzhen Comtech’s 60% owned subsidiary, Shanghai E&T, which accounted for approximately 10% of our net revenue in 2004. Our principal shareholder and chief executive officer, Jeffrey Kang, and his wife, the shareholders of Shenzhen Comtech, have contractually agreed, among others things, to apply all dividends or other payments they receive from Shenzhen Comtech to payments to our 100% directly owned subsidiary, Comtech China, or its designated entities, to the extent permitted by applicable PRC law, including PRC foreign exchange law. PRC law and regulatory requirements would currently restrict the ability of Mr. Kang and his wife, based solely upon the contractual agreements, to directly apply the dividends or other payments they receive from Shenzhen Comtech in U.S. dollars to payments to Comtech China or in Renminbi to Comtech China’s designated entities in China. If Jeffrey Kang and his wife fail to apply such dividends or other payments received from Shenzhen Comtech, which might include profit distributions from Shanghai E&T to Shenzhen Comtech, to payments to Comtech China or its designated entities, our financial condition would be negatively affected.
Apart from the dividend distribution from our PRC subsidiaries to us, the transfer of funds from our company to our PRC operating companies, either as a shareholder loan or as an increase in registered capital or otherwise, is subject to registration or approval with or by PRC governmental authorities, including the relevant administration of foreign exchange and/or other relevant examining and approval authorities. These limitations on the free flow of funds between us and our PRC operating companies may restrict our ability to act in response to changing market conditions.
Fluctuations in the value of the Renminbi relative to foreign currencies could affect our financial condition, results of operations and the price of our common stock.
The majority of our net revenue is denominated in Renminbi, while a portion of our cost of revenue is denominated in foreign currencies, primarily U.S. dollars. Since 1994, the official exchange rate of Renminbi to U.S. dollars has been based on rates set by the People’s Bank of China and generally has been stable. However, recently there has been increased political pressure on the PRC government to decouple the Renminbi from the U.S. dollar, and the PRC government may in the future relinquish the U.S. dollar peg or increase the current trading range. Future movements in the exchange rate of Renminbi and other currencies may have an adverse effect on our financial condition and results of operations. For example, a depreciation of the Renminbi relative to the U.S. dollar would have the effect
18
Table of Contents
Risk factors
of reducing our U.S. dollar-translated net revenue and increasing the debt servicing requirements for our U.S. dollar-denominated debt. On the other hand, the appreciation of the Renminbi would make our customers’ products more expensive to purchase outside of China because many of our customers are involved in the export of goods, which could adversely affect their sales, thereby eroding our customer base and adversely affecting our results of operations.
The legal system in China has inherent uncertainties that may limit the legal protections available to you as an investor or to us in the event of any claims or disputes with third parties.
The legal system in China is based on written statutes. Prior court decisions may be cited for reference but have limited precedential value. Since 1979, the central government has promulgated laws and regulations dealing with economic matters such as foreign investment, corporate organization and governance, commerce, taxation and trade. As China’s foreign investment laws and regulations are relatively new and the legal system is still evolving, the interpretation of many laws, regulations and rules is not always uniform and enforcement of these laws, regulations and rules involve uncertainties, which may limit the remedies available to you as an investor and to us in the event of any claims or disputes with third parties. In addition, any litigation in China may be protracted and result in substantial costs and diversion of resources and management attention.
You may experience difficulties in effecting service of legal process and enforcing judgments against us and our management.
Substantially all of our operations and assets are located in China. In addition, most of our directors, executive officers and some of the experts named in this document reside within China, and many of the assets of these persons are also located within China. As a result, it may not be possible to effect service of process within the United States or elsewhere outside China upon these directors or executive officers or some of the experts named in this document, including with respect to matters arising under U.S. federal securities laws or applicable state securities laws. Moreover, our PRC legal counsel, Grandall Legal Group, has advised us that China does not have treaties with the United States or many other countries providing for the reciprocal recognition and enforcement of court judgments. As a result, recognition and enforcement in China of judgments of a court of the United States or any other jurisdiction, including judgments against us or our directors, executive officers, or the named experts, may be difficult or impossible.
RISKS RELATED TO OUR COMMON STOCK
Our principal shareholder and chief executive officer and his wife together control a substantial majority of our common stock. As a result, the trading price for our shares may be depressed due to market perception, and our principal shareholder and chief executive officer will be able to take actions that may be adverse to your interests.
Jeffrey Kang, our principal shareholder and chief executive officer, and his wife, Nan Ji, directly and through entities they control, together currently beneficially own approximately 72.6% of our issued and outstanding common stock and will continue to beneficially own approximately % after this offering. This significant concentration of share ownership may adversely affect the trading price of our common stock because investors, often perceive a disadvantage in owning shares in a company with only one or very few controlling shareholders. Furthermore, Mr. Kang, and his wife, Nan Ji, together have the ability to control the outcome of all matters requiring shareholder approval, including the election of directors and approval of significant corporate transactions, such as mergers, consolidations or the sale of substantially all of our assets. This concentration of ownership may have the effect of delaying or preventing a change of control, including a merger, consolidation or other business combination involving us, or discouraging a potential acquirer from making a tender offer or otherwise attempting to obtain control, even if such a change of control would benefit you.
19
Table of Contents
Risk factors
Efforts to comply with recently enacted changes in securities laws and regulations will increase our costs and require additional management resources. Our failure to comply could adversely affect our stock price.
We have only recently begun to evaluate our internal controls over financial reporting. Given the status of our efforts, coupled with the fact that guidance from regulatory authorities in the area of internal controls continues to evolve, substantial uncertainty exists regarding our ability to comply by applicable deadlines. As directed by Section 404 of the Sarbanes-Oxley Act of 2002, public companies are required to include a report of management on the company’s internal controls over financial reporting in their annual reports on Form 10-K and the public accounting firm auditing a company’s financial statements must attest to and report on management’s assessment of the effectiveness of the company’s internal controls over financial reporting. This requirement will first apply to our annual report on Form 10-K for our fiscal year ending December 31, 2006. If we are unable to conclude that we have effective internal controls over financial reporting, or if our independent auditors are unable to provide us with an unqualified report as to the effectiveness of our internal controls over financial reporting as of December 31, 2006 and future year ends, as required by Section 404 of the Sarbanes-Oxley Act, we could experience delays or inaccuracies in our reporting of financial information, or non-compliance with SEC reporting and other regulatory requirements. This could subject us to regulatory scrutiny and result in a loss of public confidence in our management, which could, among other things, adversely affect our stock price.
Significant dilution may result from the indemnification provisions of our share exchange agreement.
The terms of the share exchange with Trident provide for the issuance of up to 30,173,047 additional shares of our common stock to the original holders of Comtech Cayman in the event there is a breach of any representations, warranties, covenants or obligations made by Trident in the share exchange agreement for an amount of damages in excess of $625,000. This indemnification provision expired on April 30, 2005, except in the case of known claims, which will survive until such matters are resolved finally by a court of law. Prior to the expiration of this period, we were notified of a possible claim relating to a transaction entered into by Trident prior to the consummation of the share exchange agreement, as discussed under “Business—Legal Proceedings” that could trigger this indemnification provision. The potential issuance of additional shares of our common stock under this indemnification provision could result in dilution to other shareholders.
RISKS RELATING TO THIS OFFERING
There has not been significant trading in our common stock, and our stock price may fluctuate dramatically in the future.
From March 1999 to January 30, 2005, our common stock was quoted on the Over-The-Counter Market, known as the “pink sheets”, or on the Electronic Bulletin Board of the Over-The-Counter Market, or OTCBB. Since January 31, 2005, our common stock has been quoted on Nasdaq under the symbol “COGO”. To date, there has been a limited trading market for our common stock. There is a significant risk that our stock price may fluctuate dramatically in the future in response to any of the following factors, some of which are beyond our control:
| Ø | variations in our quarterly operating results; |
| Ø | announcements that our net revenue or income are below research analysts’ expectations; |
| Ø | general economic slowdowns; |
20
Table of Contents
Risk factors
| Ø | changes in market valuations of similar companies; |
| Ø | sales of large blocks of our common stock; |
| Ø | announcements by us or our competitors of significant contracts, acquisitions, strategic partnerships, joint ventures or capital commitments; and |
| Ø | fluctuations in stock market prices and volumes, which are particularly common among highly volatile securities of China-based companies. |
We have broad discretion over the use of the net proceeds received by us from this offering.
We have broad discretion over the use of net proceeds received by us from this offering. Although we expect to use the net proceeds we will receive to fund possible strategic alliances or acquisitions of businesses that possess complementary products or technologies, to expand our research and development efforts relating to new products, and for working capital and other general corporate purposes, we have not identified any specific uses. Accordingly, you will be relying on the judgment of our board of directors and management regarding the application of these net proceeds.
Future sales of shares could have an adverse effect on the market price of our common stock.
A significant portion of our shares are held by a small number of shareholders. Historically, trading volume of our shares has been relatively low. Sales by our current shareholders of a substantial number of shares could significantly reduce the market price of our common stock. These sales could also impede our ability to raise future capital.
As of March 31, 2005, we had 25,532,898 shares of common stock outstanding, which shares will be able to be sold in the public market in the near future, subject to, with respect to shares of common stock held by affiliates and shares issued between 12 and 24 months ago, the volume restrictions and/or manner of sale requirements of Rule 144 under the Securities Act. On February 7, 2005, a registration statement on Form S-1 was declared effective with respect to 6,365,417 shares of our common stock. These shares are freely tradable without restriction or further registration, subject to the related prospectus delivery requirements.
As of May 31, 2005, we had stock options outstanding to purchase an aggregate of 2,252,500 shares of common stock under our Incentive Plan, and options to purchase an aggregate of 115,000 shares under our Directors’ Plan. We also had warrants outstanding to purchase 941,667 shares of our common stock. To the extent that the options and warrants are exercised, they may be exercised at prices below the price of our shares of common stock on the public market, resulting in a significant number of shares entering the public market and the dilution of our common stock. In addition, in the event that any future financing should be in the form of securities convertible into, or exchangeable for, equity securities, investors may experience additional dilution upon the conversion or exchange of such securities.
21
Table of Contents
Special note regarding forward-looking statements
Many statements made in this prospectus under the captions “Prospectus summary,” “Risk factors,” “Management’s discussion and analysis of financial condition and results of operations” and “Our business” and elsewhere are forward-looking statements that reflect our current expectations and views of future events. These statements relate to future events or our future financial performance. We have attempted to identify forward-looking statements by terminology including “anticipate”, “believe”, “expect”, “can”, “continue”, “could”, “estimate”, “intend”, “may”, “plan”, “potential”, “predict”, “should” or “will” or the negative of these terms or other comparable terminology. These statements are only predictions. Uncertainties and other factors, including the risks outlined under “Risk Factors” contained in this prospectus, may cause our actual results, levels of activity, performance or achievements to be materially different from any future results, levels or activity, performance or achievements expressed or implied by these forward-looking statements. These forward-looking statements include, among other things, statements regarding:
| Ø | the availability and cost of products from our suppliers incorporated into our customized module design solutions; |
| Ø | changes in end-user demand for the products manufactured and sold by our customers; |
| Ø | general and cyclical economic and business conditions, domestic or foreign, and, in particular, those in China’s mobile handset, telecom equipment and digital consumer electronics industries; |
| Ø | the rate of introduction of new products by our customers; |
| Ø | the rate of introduction of technologies by our suppliers; |
| Ø | changes in our pricing policies or the pricing policies of our competitors or suppliers; |
| Ø | our ability to compete effectively with our current and future competitors; |
| Ø | our ability to enter into and renew key corporate and strategic relationships with our customers and suppliers; |
| Ø | our implementation of stock-based compensation plans; |
| Ø | changes in the favorable tax incentives enjoyed by our PRC operating companies; |
| Ø | foreign currency exchange rates fluctuations; |
| Ø | adverse changes in the securities markets; and |
| Ø | legislative or regulatory changes in China. |
Although we believe that the expectations reflected in the forward-looking statements are reasonable, we cannot guarantee future results, levels of activity, performance or achievements. Our expectations are as of the date this prospectus, and we do not intend to update any of the forward-looking statements to conform these statements to actual results, unless required by law.
22
Table of Contents
We estimate that the net proceeds from the shares of common stock that we are offering will be approximately $ million, after deducting estimated underwriting discounts and commissions and estimated offering expenses payable by us, and assuming a public offering price of $ per share. If the underwriters exercise their over-allotment option in full, we estimate that our net proceeds will be approximately $ million and net proceeds to the selling shareholders will be approximately $ million. We will not receive any proceeds from the sale of the common stock by the selling shareholders.
We currently anticipate that we will use the net proceeds of the offering as described below; however, actual uses could vary depending on business, economic and other developments:
| Ø | approximately 50% to fund possible strategic alliances with key component suppliers, as well as possible strategic acquisitions of technology, products and related intellectual property, design houses or related businesses that could complement our existing capabilities and business, although we are not currently negotiating any such transaction. |
| Ø | approximately 30% to expand our research and development efforts relating to new solutions for the digital consumer electronics market, including, for example, digital home entertainment products and smart phones, as well as storage solutions. |
| Ø | approximately 20% to fund working capital and for other general working capital purposes. |
Pending these uses, we intend to invest the net proceeds in interest-bearing, investment grade securities, certificates of deposit, direct or guaranteed obligations of the U.S. government or other short-term money market instruments.
23
Table of Contents
Prior to the share exchange with Trident on July 22, 2004, we declared dividends of RMB41.4 million ($5.0 million) on our common stock and paid such dividend to the shareholders of record prior to the share exchange in September 2004. During the last two fiscal years we have not declared any other cash dividends on our common stock.
We currently intend to retain our future earnings, if any, to finance the further development and expansion of our business and do not intend to pay cash dividends in the foreseeable future. Any future determination to pay dividends will be at the discretion of our board of directors and will depend on our financial condition, results of operations, current and anticipated cash needs, restrictions contained in current or future financing instruments, plans for expansion and such other factors as our board of directors deems relevant.
Our PRC operating companies are required, where applicable, to allocate a portion of their net profit to certain funds before distributing dividends, including at least 10% of their net profit to certain reserve funds until the balance of such fund has reached 50% of their registered capital. These reserves can only be used for specific purposes, including making-up cumulative losses of previous years, conversion to our equity capital, and application to business expansion, and are not distributable as dividends. Our PRC operating companies are also required, where applicable, to allocate an additional 5% to 10% of their net profits to a statutory common welfare fund. For risks associated with the uncertainty in our receipt of the equivalent economic interest in connection with the equity interest in Shenzhen Comtech, see “Risk factors—PRC laws and our corporate structure may restrict our ability to receive dividends and payments from, and transfer funds to, our PRC operating companies, which may negatively affect our results of operations and restrict our ability to act in response to changing market conditions.”
A majority of our net revenue is denominated in Renminbi. A portion of our net revenue must be converted into other currencies to meet our foreign currency obligations, which primarily include purchases of imported components. Once certain procedural requirements are met Renminbi is convertible for current account transactions, including trade and service-related foreign exchange transactions and dividend payments, but not for capital account transactions, including direct investment, loans or investments in securities outside China, without prior approval of the State Administration of Foreign Exchange of the People’s Republic of China, or its local counter-parts. We cannot be certain that the PRC regulatory authorities will not impose more stringent restrictions on the convertibility of Renminbi with respect to foreign exchange transactions. For a description of the risks associated with PRC government control of currency conversion, see “Risk factors—Government control of currency conversion may affect the value of your investment.”
24
Table of Contents
Substantially all of our operations are conducted in China and a majority of our net revenue is denominated in Renminbi. Unless otherwise noted, the conversion of Renminbi into U.S. dollars in this prospectus is solely for the convenience of the reader and was made at a rate of RMB8.2765 to $1.00, the noon-buying rate in the City of New York for cable transfers of Renminbi as certified for customs purposes by the Federal Reserve Bank of New York in effect as of December 31, 2004. The prevailing noon-buying rate as of June 21, 2005 was RMB8.2765 to $1.00. We make no representation that any Renminbi or U.S. dollar amounts referred to in this prospectus could have been or could be converted into U.S. dollars or Renminbi, as the case may be, at any particular rate or at all.
The following table sets forth the month-end noon buying rates between Renminbi and U.S. dollars for the months indicated:
| Noon Buying Rate | ||||
| RMB per $ | ||||
| High | Low | |||
2004 | ||||
October | 8.2768 | 8.2765 | ||
November | 8.2765 | 8.2764 | ||
December | 8.2767 | 8.2765 | ||
2005 | ||||
January | 8.2765 | 8.2765 | ||
February | 8.2765 | 8.2765 | ||
March | 8.2765 | 8.2765 | ||
April | 8.2765 | 8.2765 | ||
May | 8.2765 | 8.2765 | ||
June 1 - June 21 | 8.2765 | 8.2765 | ||
The following table sets forth the high and low period-end noon buying rates between Renminbi and U.S. dollars for each of 2000, 2001, 2002, 2003 and 2004 (calculated by averaging the noon buying rates on the last day of each month of the periods shown):
| Noon Buying Rate | ||||
| RMB per $ | RMB per $ | |||
| High | Low | |||
2000 | 8.2978 | 8.2768 | ||
2001 | 8.2786 | 8.2676 | ||
2002 | 8.2800 | 8.2700 | ||
2003 | 8.2800 | 8.2765 | ||
2004 | 8.2774 | 8.2764 | ||
The PRC government imposes control over its foreign currency reserves in part through direct regulation of the conversion of Renminbi into foreign exchange and in part through restrictions on foreign trade.
25
Table of Contents
The following table sets forth our short-term bank borrowings and capitalization as of March 31, 2005 presented on:
| Ø | an actual basis; and |
| Ø | on a pro forma basis to reflect the sale by us of shares of common stock in this offering, assuming a public offering price of $ per share, after deducting underwriting discounts and commissions and estimated offering expenses payable by us. |
| As of March 31, 2005 | |||||||||||
| Actual | Pro Forma | ||||||||||
| (in thousands) | |||||||||||
Short-term bank borrowings(1) | $ | 4,137 | RMB | 34,236 | RMB | ||||||
Minority interests | 596 | 4,933 | |||||||||
Shareholders’ equity: | |||||||||||
Common stock, $0.01 par value per share (200,000,000 shares authorized, actual and pro forma; 25,532,898 shares issued and outstanding, actual; shares issued and outstanding, pro forma) | 255 | 2,113 | |||||||||
Additional paid-in capital | 14,165 | 117,236 | |||||||||
Deferred stock-based compensation | (26 | ) | (216 | ) | |||||||
Retained earnings | 9,858 | 81,584 | |||||||||
Total shareholders’ equity | 24,252 | 200,717 | |||||||||
Total short-term bank borrowings and capitalization | $ | 28,985 | RMB | 239,886 | RMB | ||||||
| (1) | We are currently in the process of negotiating an additional credit facility with another bank to fund our working capital needs, although this financing may not be arranged on satisfactory terms or at all. |
The table above should be read in conjunction with our consolidated financial statements and related notes appearing elsewhere in this prospectus. This table is based on 25,532,898 shares of our common stock outstanding as of March 31, 2005 and excludes:
| Ø | shares of common stock issuable upon the exercise of outstanding options and warrants to purchase our common stock with a weighted average exercise price of per share; and |
| Ø | shares of common stock reserved for issuance under our 2004 Incentive Stock Option Plan. |
26
Table of Contents
Market price of our common stock
In connection with the share exchange transactions with Trident, we changed our name from “Trident Rowan Group, Inc.” to “Comtech Group, Inc.” on August 2, 2004. From March 18, 1999 to August 7, 2004, our common stock was quoted on the Over-The-Counter Market, known as the “pink sheets”, under the symbol “TRGI”. From August 6, 2004 to August 23, 2004, our common stock was quoted on the Electronic Bulletin Board of the Over-The-Counter Market, or OTCBB, under the symbol “TRGI”, and from August 24, 2004 to January 30, 2005 under the symbol “COGO”. Since January 31, 2005, our common stock has been quoted on Nasdaq under the symbol “COGO”.
The following table sets forth the high and low sale prices for our common stock for the periods indicated as reported by the respective markets. These prices represent prices between dealers, without adjustment for retail mark-ups, mark-downs or commissions, and may not necessarily represent actual transactions. All periods presented prior to July 22, 2004 represent the performance of the common stock of Trident.
All share amounts have been retroactively restated for all periods presented to reflect our one-for-two reverse stock split completed on January 14, 2005.
| Price Range of Common Stock | ||||||
| High | Low | |||||
2005: | ||||||
April 1 – June 21(1) First quarter | $ | 6.35 7.85 | $ | 5.01 5.50 | ||
2004: | ||||||
Fourth quarter | 5.98 | 3.68 | ||||
Third quarter: | ||||||
July 1 – July 21 | 2.80 | 2.30 | ||||
July 22 – September 30 | 4.80 | 2.28 | ||||
Second quarter | 2.86 | 1.98 | ||||
First quarter | 1.70 | 1.60 | ||||
2003: | ||||||
Fourth quarter | 1.70 | 1.04 | ||||
Third quarter | 1.60 | 0.58 | ||||
Second quarter | 0.58 | 0.56 | ||||
First quarter | 0.84 | 0.44 | ||||
| (1) | Represents partial period. |
The last reported price of our common stock on Nasdaq on June 21, 2005 was $6.01 per share.
As of March 31, 2005, there were 25,532,898 shares of our common stock outstanding, and we had approximately 920 shareholders of record. The transfer agent and registrar for our common stock is American Stock Transfer & Trust Company.
27
Table of Contents
Comtech Group, Inc., formerly known as Trident Rowan Group, Inc., or Trident, was incorporated in 1917 as a Maryland corporation. On July 22, 2004, Trident, which was a public reporting company that ceased operations in 2000, acquired all of the outstanding capital stock of Comtech Cayman, a Cayman Islands company, in exchange for the issuance of approximately 91.2% of the then-outstanding shares of its common stock to the shareholders of Comtech Cayman. On August 2, 2004, we changed our name from Trident to Comtech Group, Inc.
During 2002 and 2003, we underwent a group reorganization, which consisted of:
| Ø | incorporation of Comtech Cayman; |
| Ø | establishment of Comtech China and Comtech Holding as wholly owned subsidiaries of Comtech Cayman; and |
| Ø | establishment of Comtech Communication and Comtech Software as wholly owned subsidiaries of Comtech China. |
Substantially all of our operations are currently conducted in the PRC through our PRC operating companies. Our PRC operating companies include our direct and indirect wholly-owned subsidiaries, including our PRC subsidiaries, Comtech Communication Technology (Shenzhen) Company Limited, or Comtech Communication, and Comtech Software Technology (Shenzhen) Company Limited, or Comtech Software, and our Hong Kong subsidiary, Comtech International (Hong Kong) Limited, or Comtech Hong Kong, as well as our other operating companies, including Shenzhen Comtech International Limited, or Shenzhen Comtech, and its 60% owned subsidiary, Shanghai E&T System Company Limited, or Shanghai E&T. The remaining interest in Shanghai E&T is owned by Michael Shao and Sun Jun, employees of Shanghai E&T, each of whom hold a 20% interest.
While we are a Maryland company as a result of the share exchange transaction with Trident, which was a Maryland corporation, the next level entities are holding companies based in the Cayman Islands or British Virgin Islands, as is often the case with companies in China that are seeking to tap offshore markets for investors and funding. Such a structure provides us with a corporate law and a regulatory environment more familiar and friendly to overseas capital markets investors. At the time of the incorporation of Shenzhen Comtech, foreign shareholding in a trading business such as ours could not exceed 65%. With subsequent PRC deregulation, foreign shareholding in a trading business can now reach 100%. However, general trading with foreign investments is still restricted, requiring special approval, which is difficult to obtain. Because foreign investments in general trading businesses such as Shenzhen Comtech’s are restricted in the PRC, in order to exercise control over Shenzhen Comtech and Shanghai E&T without direct shareholding by our offshore entities, our principal shareholder and chief executive officer, Jeffrey Kang, and his wife own for the benefit of our 100% directly owned subsidiary, Comtech China, all of the equity interest in our PRC operating company, Shenzhen Comtech, which, in turn, owns a 60% equity interest in another of our PRC operating companies, Shanghai E&T. While we do not have any equity interest in Shenzhen Comtech, through contractual agreements described below, we enjoy voting control and are entitled to the economic interests associated with Jeffery Kang’s and his wife’s equity interest in Shenzhen Comtech.
Under these contractual agreements, Comtech China and each of Jeffrey Kang and his wife have agreed, to the extent permitted by relevent PRC laws and regulations, to:
| Ø | deal with and exercise any rights arising from the equity interests they hold in Shenzhen Comtech in such manner as Comtech China may from time to time direct; |
| Ø | (a) apply the dividend and other distributions from the equity interests they hold in Shenzhen Comtech, if any, to the payments to Comtech China or its designated entities for valid and valuable consideration and to the extent permitted by PRC laws and regulations, (b) in the cases where the payments under (a) are not permitted by PRC laws or compliance with PRC legal or regulatory requirements would render such payments not commercially feasible, seek alternate means to perform their payment obligation under (a) including using offshore personal assets equivalent in value to the |
28
Table of Contents
Corporate structure
dividend and other distributions they will receive in connection with their equity interests in Shenzhen Comtech, and (c) cause Shenzhen Comtech not to declare and make any dividend payment or other distributions without prior written approval from Comtech China; |
| Ø | attend all meetings of shareholders or otherwise which they shall be entitled to attend by virtue of being the registered holder of the equity interests in Shenzhen Comtech and to vote at such meetings as Comtech China may direct, or alternatively, to execute all proxies or other documents which shall be necessary or proper to enable Comtech China’s nominees to attend and vote at any such meeting, and also give all notices, orders and directions which Comtech China may require to give; and |
| Ø | execute, at any time and from time to time, such further documents, instruments and agreements and to take any actions required by Comtech China to give effect to these contractual agreements, including transferring the equity interests they hold in Shenzhen Comtech to Comtech China or its designees. |
As a result of these contractual arrangements, which have no fixed expiry date or termination provisions, our consolidated operating results include those of Shenzhen Comtech and Shanghai E&T, and we may refer to these entities as our subsidiaries for U.S. accounting purposes. Sales made through Shenzhen Comtech relate to historical customer sales relationships. New customer relationships and opportunities are being directed to our other PRC operating companies. Further, most of our design work is done by Comtech Communication. As a result, we expect the percentage of our net revenue derived from Shenzhen Comtech to continue to decrease over time and to become less significant to our aggregate net revenue. See “Risk factors—We depend upon contractual agreements with the two shareholders of Shenzhen Comtech in conducting our business through Shenzhen Comtech and Shanghai E&T and receiving payments, which may not be as effective in providing operational control as direct ownership and may be difficult to enforce. Further, if the PRC government finds these contractual agreements violate or conflict with PRC governmental regulations, our business would be materially adversely affected.”
Our business is distributed among our operating subsidiaries mainly based on geographical location. For example, our business in Hong Kong, and other international business, is primarily conducted through Comtech Hong Kong. Business within China is typically conducted through Shenzhen Comtech and Comtech Communication, except for business in Shanghai, which is conducted through Shanghai E&T. Sales made through Shenzhen Comtech relate to historical customer sales relationships for our traditional solutions. New customer relationships and new solutions are mainly being directed to Comtech Communication.
Our new wholly owned subsidiary, Comtech Software, which has not yet begun operations, will mainly focus on software design, installations and support. UIT, another new wholly owned subsidiary, will focus on our new storage technology business.
Comtech Broadband Corporation Limited, or Comtech Broadband, was incorporated in March 2005 to distribute semiconductor and other related products for Broadcom, and began operating in May 2005. Comtech Broadband is owned 55% by us and 45% by Broadwell Group Ltd., a company whose founders have broad experience in selling Broadcom’s products to an established customer base in Hong Kong and China, but with no other prior relationship with us or Broadcom. Comtech Broadband is self-financing, but if required, we have agreed to assist it in negotiating a bank line of credit. Two of three directors of Comtech Broadband have been appointed by us.
On May 12, 2005, we entered an agreement related to United Information Technology Co. Ltd., or UIT, our new wholly owned subsidiary, incorporated in the British Virgin Islands. UIT will engage in the storage solution business through a wholly owned subsidiary in the PRC, although it has no contractual agreements with outside parties at this point. Under the agreement, we agreed to inject into UIT an aggregate sum of $4 million in loan advances for working capital purposes to finance the expansion of the business, of which $2.5 million was paid in May 2005 and $1.5 million is payable in August 2005. In addition, UIT will license related technology from third parties who own such technology at zero cost. If UIT reaches earnings and net income milestones in 2005 specified in the agreement, UIT will have an
29
Table of Contents
Corporate structure
obligation in 2006 to purchase technology and related intellectual property from the same third parties. As consideration for this purchase, UIT will issue up to 40% of its equity to the third parties, which we will have a right to reacquire over time at prices calculated based on a predetermined formula. If for the first six months of 2006, additional earnings and net income milestones are met, we will reacquire back 15% of its equity at a price calculated based on a predetermined formula, and at the same time, UIT will have a further obligation to purchase additional technology and intellectual property, in return for up to an additional 20% of its equity. We will also have the right to reacquire the remaining equity owned by the third parties over time.
As of March 31, 2005, our corporate structure was as follows:
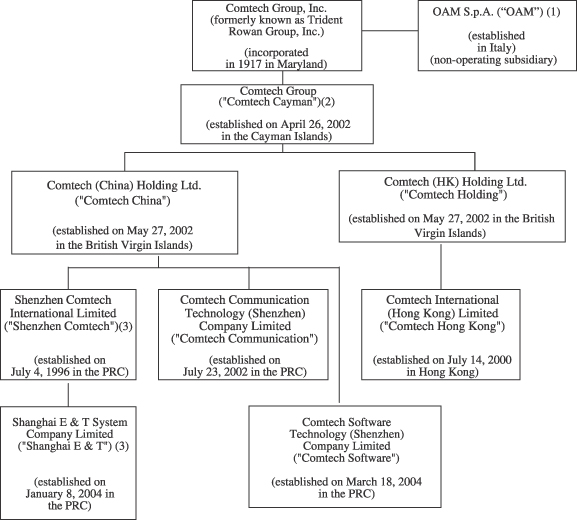
| (1) | We hold 98.6% of the shares in OAM. |
| (2) | Comtech Cayman holds a 55% interest in Comtech Broadband Corporation Limited, or Comtech Broadband, a Hong Kong company established in 2005 with Broadwell Group Ltd., which owns the remaining 45%. Subsequent to March 31, 2005, UIT, has become a wholly owned subsidiary of Comtech Cayman. |
| (3) | Our principal shareholder and chief executive officer, Jeffrey Kang, and his wife own for the benefit of Comtech China all of the equity interest in Shenzhen Comtech, which, in turn, owns a 60% equity interest in Shanghai E&T. |
30
Table of Contents
Selected consolidated financial data
The following selected consolidated statement of operations data for the four years ended December 31, 2004 and consolidated balance sheet data as of December 31, 2004, 2003, 2002 and 2001, presented below are derived from our audited consolidated financial statements and related notes thereto, which for the three years ended December 31, 2004 have been included elsewhere in this prospectus. These audited consolidated financial statements and the related notes have been prepared in accordance with U.S. GAAP, and have been audited by Deloitte Touche Tohmatsu, an independent registered public accounting firm. The selected consolidated statement of operations data for the year ended December 31, 2000 and the consolidated balance sheet data as of December 31, 2000, presented below are derived from our unaudited consolidated financial statements not included in this prospectus. The financial data for the year ended December 31, 2000 was prepared by management on a basis consistent with the audited consolidated financial statements. The unaudited consolidated financial statements include, in the opinion of management, all adjustments necessary for the fair presentation of the financial information set forth in those statements.
The consolidated statement of operations data for the three months ended March 31, 2005 and 2004, and the consolidated balance sheet as of March 31, 2005, are derived from our unaudited condensed consolidated financial statements and related notes which have been included elsewhere in this prospectus. These unaudited condensed consolidated financial statements have been prepared in accordance with U.S. GAAP. We have prepared the unaudited condensed consolidated financial statements on the same basis as the audited consolidated financial statements, and have included in our opinion, all adjustments, consisting only of normal and recurring adjustments, that we consider necessary for a fair presentation of the financial information set forth in those statements. Our historical results for any prior or interim period are not necessarily indicative of results to be expected for a full fiscal year or for any future period.
The consolidated financial statements are reported in Renminbi because all of our material operating entities are based in and operated entirely within the PRC. Renminbi and U.S. dollar amounts are presented in thousands, except share and per share data. This data should be read in conjunction with our “Management’s discussion and analysis of financial condition and results of operations” and our audited consolidated financial statements and the related notes included elsewhere in this prospectus.
31
Table of Contents
Selected consolidated financial data
Consolidated Statement of Operations Data:
| Three months ended March 31, | Year ended December 31, | ||||||||||||||||||||||||||||||||||
| 2005 | 2005 | 2004 | 2004 | 2004 | 2003 | 2002 | 2001 | 2000 | |||||||||||||||||||||||||||
| (in thousands, except share and per share data) | |||||||||||||||||||||||||||||||||||
Net revenue | 20,782 | 172,001 | 153,754 | $ | 75,594 | RMB | 625,656 | RMB | 357,805 | RMB | 207,607 | RMB | 171,721 | RMB | 55,881 | ||||||||||||||||||||
Cost of revenue | (17,606 | ) | (145,716 | ) | (130,092 | ) | (64,133 | ) | (530,800 | ) | (306,939 | ) | (190,265 | ) | (159,244 | ) | (47,937 | ) | |||||||||||||||||
Gross profit | 3,176 | 26,285 | 23,662 | 11,461 | 94,856 | 50,866 | 17,342 | 12,477 | 7,944 | ||||||||||||||||||||||||||
Selling, research and development, general and administrative expenses | (953 | ) | (7,894 | ) | (3,329 | ) | (3,289 | ) | (27,213 | ) | (20,341 | ) | (7,461 | ) | (7,911 | ) | (3,359 | ) | |||||||||||||||||
Other operating income | 134 | 1,110 | — | — | — | — | |||||||||||||||||||||||||||||
Income from operations | 2,223 | 18,391 | 20,333 | 8,306 | 68,753 | 30,525 | 9,881 | 4,566 | 4,585 | ||||||||||||||||||||||||||
Interest expense | (47 | ) | (393 | ) | (322 | ) | (260 | ) | (2,156 | ) | (801 | ) | — | (9 | ) | (39 | ) | ||||||||||||||||||
Interest income | 3 | 29 | 11 | 5 | 38 | 54 | 157 | 175 | 18 | ||||||||||||||||||||||||||
Income before income tax | 2,179 | 18,027 | 20,022 | 8,051 | 66,635 | 29,778 | 10,038 | 4,732 | 4,564 | ||||||||||||||||||||||||||
Income tax | (180 | ) | (1,487 | ) | (465 | ) | (278 | ) | (2,300 | ) | (1,295 | ) | (820 | ) | (825 | ) | (682 | ) | |||||||||||||||||
Net income before minority interest | 1,999 | 16,540 | 19,557 | 7,773 | 64,335 | 28,483 | 9,218 | 3,907 | 3,882 | ||||||||||||||||||||||||||
Minority interest | (88 | ) | (729 | ) | (697 | ) | (258 | ) | (2,133 | ) | — | — | — | — | |||||||||||||||||||||
Net income | 1,911 | 15,811 | 18,860 | $ | 7,515 | RMB | 62,202 | RMB | 28,483 | RMB | 9,218 | RMB | 3,907 | RMB | 3,882 | ||||||||||||||||||||
Earnings per share | |||||||||||||||||||||||||||||||||||
Basic | 0.08 | 0.62 | 0.93 | $ | 0.35 | RMB | 2.87 | RMB | 1.41 | RMB | 0.46 | RMB | 0.19 | RMB | 0.19 | ||||||||||||||||||||
Diluted | 0.07 | 0.59 | 0.93 | $ | 0.34 | RMB | 2.84 | RMB | 1.41 | RMB | 0.46 | RMB | 0.19 | RMB | 0.19 | ||||||||||||||||||||
Dividends declared per share | RMB | 2.04 | — | — | — | ||||||||||||||||||||||||||||||
Weighted average number of shares outstanding | |||||||||||||||||||||||||||||||||||
Basic | 25,381,853 | 25,381,853 | 20,251,075 | 21,690,560 | 21,690,560 | 20,251,075 | 20,251,075 | 20,251,075 | 20,251,075 | ||||||||||||||||||||||||||
Diluted | 26,871,865 | 26,871,865 | 20,251,075 | 21,885,053 | 21,885,053 | 20,251,075 | 20,251,075 | 20,251,075 | 20,251,075 | ||||||||||||||||||||||||||
| As of March 31, | As of December 31, | ||||||||||||||||||||||||||||||||||
| 2005 | 2005 | 2004 | 2004 | 2003 | 2002 | 2001 | 2000 | ||||||||||||||||||||||||||||
| (in thousands) | |||||||||||||||||||||||||||||||||||
Cash |
| $ | 5,168 | RMB | 42,771 | $ | 5,007 | RMB | 41,444 | RMB | 30,683 | RMB | 12,194 | RMB | 30,066 | RMB | 13,703 | ||||||||||||||||||
Trade accounts receivable, net of allowance for doubtful amounts |
| 24,350 | 201,532 | 20,418 | 168,989 | 92,259 | 67,597 | 45,048 | 23,604 | ||||||||||||||||||||||||||
Property and equipment, net |
| 419 | 3,467 | 401 | 3,317 | 2,961 | 2,371 | 2,446 | 553 | ||||||||||||||||||||||||||
Total assets |
| 38,754 | 320,748 | 37,355 | 309,167 | 160,200 | 97,072 | 80,724 | 41,845 | ||||||||||||||||||||||||||
Total current liabilities |
| 13,906 | 115,098 | 14,372 | 118,955 | 142,546 | 66,514 | 59,467 | 24,495 | ||||||||||||||||||||||||||
Total liabilities and minority interest |
| 14,502 | 120,031 | 14,880 | 123,159 | 142,546 | 66,514 | 59,467 | 24,495 | ||||||||||||||||||||||||||
Total shareholders’ equity |
| 24,252 | 200,717 | 22,475 | 186,008 | 17,654 | 30,558 | 21,257 | 17,350 | ||||||||||||||||||||||||||
32
Table of Contents
Management’s discussion and analysis of financial condition and results of operations
The following discussion of our financial condition and results of operations is based upon and should be read in conjunction with our consolidated financial statements and their related notes included in this prospectus. This discussion contains forward-looking statements that involve risks and uncertainties. We caution you that our business and financial performance are subject to substantial risks and uncertainties. Actual results could differ materially from those projected in the forward-looking statements. In evaluating our business, you should carefully consider the information provided under the caption “Risk factors” in this prospectus.
OVERVIEW
We are a provider of customized module design solutions in China and serve as a gateway for our suppliers to access leading electronics manufacturers in China. We historically have focused on the mobile handset and telecom equipment end-markets in China, but have recently expanded our addressable market to include the digital consumer electronics end-market. We work closely with leading manufacturers in these end-markets to develop solutions to meet their needs for customized module designs. Our customized module design solutions allow our customers to use technology components from established suppliers in a timely and cost-effective manner, reducing their time-to-market and lowering their overall costs. Over the last three years, we have worked with over 200 customers, including a majority of the largest and best-known manufacturers in the mobile handset and telecom equipment end-markets in China. In addition to these OEMs, our other customers include industry participants which support these OEMs, such as subsystem designers and manufacturers. In developing customized module design solutions for use in our customers’ products, we work closely with over 30 suppliers of technology components, including many large multinational companies such as Broadcom, JDS Uniphase and Matsushita.
PRINCIPAL FACTORS AFFECTING OUR RESULTS OF OPERATIONS
The major factors affecting our results of operations and financial condition include:
Revenue mix. Our net revenue and gross profit are affected by our product mix. Over the last two years, mobile handset module related sales, which have higher profit margins than our telecom equipment module related sales, have increasingly constituted a significantly greater portion of our total net revenue.
Growth in end-marketindustries. The rapid growth of the domestic mobile handset, telecom equipment and digital consumer electronics products end-markets have been important drivers of growth of China’s electronics manufacturing industries. Specific segments that we expect to continue growing are the data communications segment, consisting of asymmetric digital subscriber line (ADSL) modems and Voice over Internet Protocol (VoIP) equipment; the routers and network security equipment segments; the optical transmission systems segment; and the fixed line telecom network segment. The growth in these segments has driven, and we believe will continue to drive, growth in the electronics manufacturing businesses supporting hardware OEMs, including those engaged in the customized design of module solutions such as ourselves. However, these industries and the respective domestic manufacturers that operate in these industries may not continue to grow their sales at historical levels, if at all. The stagnation or reduction in overall demand for mobile handset and telecom equipment products would materially affect our results of operations.
33
Table of Contents
Management’s discussion and analysis of financial condition and results of operations
Increase in exports. We believe that the development of a highly-skilled, low-cost manufacturing base has also enabled China’s domestic mobile handset and telecom equipment manufacturers to be competitive in the global marketplace. As an example, Huawei has become a major supplier of telecom equipment to international customers, while ZTE, a major manufacturer of mobile handset and telecom equipment in China, as well as other telecom equipment and mobile handset manufacturers, have also begun to expand overseas. We believe that growth in the export market will likely have a positive effect on our results of operations and financial condition, as it should increase the demand for our solutions, particularly among our mobile handset clients.
Growth by entering new end-markets, strengthening in-house capabilities and leveraging our customer base. We recently began targeting the digital consumer electronics and storage solution end-markets and, over time, we intend to develop integrated circuit and application software design capabilities and provide solutions based on our own proprietary technology. In the first quarter of 2005, we began generating net revenue from customized module design solutions for digital home entertainment products, primarily for IPTV set-top boxes and DTV, through sales to our existing customers, Haier, Konka, Lenovo, TCL and UTStarcom. More recently, we have initiated a business to provide networked storage and data management solutions in China. We anticipate that sales related to the digital consumer electronics and storage solution end-markets that we recently entered will initially have higher profit margins than our mobile handset and telecom equipment modules related sales, though such higher margins may decline over time as these industries matures. Our success in the consumer electronics end-market will depend, in significant part, on our ability to leverage our existing customer base. We expect to incur significant research and development expenses, through hiring additional engineering personnel to develop new solutions and expanding our intellectual property and technological capabilities, to meet the needs of our customers that have expanded into or are expected to expand into the digital consumer electronics end-market.
NET REVENUE
We do not charge our customers an independent design fee for our solutions. Instead, our business model is to generate revenue by reselling a limited number of specific components required in our module reference design. The difference between the purchase price we pay our suppliers for these components and our sales price to the customer for these components compensates us for our design, technical support and distribution services. Our net revenue is revenue net of a 17% value-added tax, or VAT.
Over the last three years, we have worked with over 200 customers. In addition to many of the largest China-based manufacturers of mobile handsets, telecom equipment and digital consumer electronics products, our customers include industry participants supporting these OEMs, such as subsystem designers and manufacturers in China, as well as international manufacturers who have begun to manufacture end-products in China for the domestic and international market. Our largest customer in the mobile handset segment for 2004 was TCL, which is one of China’s largest domestic mobile handset manufacturers. Our top two revenue producing customers from the telecom equipment industry, based on aggregate sales for 2003 and 2004, have been Huawei and ZTE, China’s two largest telecom equipment suppliers. During 2004, Huawei, ZTE and UTStarcom, another major telecom equipment manufacturer in China, each accounted for more than 10% of our net revenue and collectively accounted for 36% of our net revenue, although revenues from UTStarcom declined in the first quarter of 2005 compared with the fourth quarter of 2004. The loss of, or significant reduction in orders from, any of these customers will have a material adverse impact on our operating results.
Our net revenue is subject to seasonal fluctuation and periods of increased demand. Telecom equipment related module sales are typically highest in the fourth quarter of the year due to desire by OEMs to spend remaining budgets allocated for a given period, usually on an annual basis. Telecom equipment related module sales have historically been lowest in the first quarter of the year due to the Chinese New Year holiday and the general reduction in sales following the holiday season. Mobile handset and digital
34
Table of Contents
Management’s discussion and analysis of financial condition and results of operations
consumer electronics related module sales are typically highest in the first and fourth quarters of the year due to the Chinese New Year and Christmas holidays, and lowest in the second and third quarters. These sales patterns may not be indicative of future sales performance.
COST OF REVENUE
Cost of revenue primarily consists of the purchase of components from suppliers. We develop our customized module design solutions based on specific technology components purchased from key and other suppliers in our target end-markets. Our list of over 30 key suppliers includes Broadcom (DTV), JDS Uniphase (optoelectronic components), M-Systems (Flash memory, DiskOnChip), Matsushita (switches), NAIS (connectors, Relay), Pixelplus (CMOS sensors) and Sambu (speakers). We typically issue purchase orders to our suppliers only after we receive customer orders, enabling us to maintain low inventory levels and, in turn, minimize risks typically associated with holding inventory. During 2004, based on cost of revenue, we purchased approximately 52% and 24% of the components sold to our customers from Matsushita and its affiliated entities and from JDS Uniphase, respectively. If we lose a key supplier, or a supplier reduces the quantity of products it sells to us, does not maintain a sufficient inventory level of products required by us or is otherwise unable to meet our demands for its components, we may have to expend significant time, effort and other resources to locate a suitable alternative supplier and secure replacement components. Even if we are able to find a replacement supplier, we may be required to redevelop the customized module design solution to effectively incorporate the replacement components.
OPERATING EXPENSES
Selling, general and administrative expenses
Our selling expenses include expenditures to promote our new module solutions and gain a larger customer base, personnel expenses and travel and entertainment costs related to sales and marketing activities, and freight charges. We expense all these expenses as they are incurred. Selling expenses are expected to continue to grow in the future as we diversify by developing and acquiring new design capabilities and expanding into new end-markets.
General and administrative expenses include compensation and benefits for our general and administrative staff, professional fees, and general travel and entertainment costs. We expense all general and administrative expenses as they are incurred. We expect that general and administrative expenses will continue to increase for the foreseeable future as a result of our expected continued growth and the increased costs of complying with U.S. rules and regulations necessary to maintain our listing in the United States and comply with Section 404 of the Sarbanes-Oxley Act of 2002.
Research and development expenses
Research and development expenses consist primarily of salaries and related costs of the employees engaged in research, design and development activities; the costs for design and testing; the cost of parts for prototypes; equipment depreciation; and third party development expenses. We expense research and development expenses as they are incurred. As of March 31, 2005, we had approximately 40 engineers and other technical employees engaged in research and development related activities to develop new customized module design solutions targeted at the wireless handset, telecom equipment and digital consumer electronics industries. Research and development expenses were significantly higher in the three months ended March 31, 2005 than they were in the same period of 2004, and we expect that our research and development expenses, including those relating to the planned hiring of additional research and development personnel, will increase in the future as we seek to expand our business by developing new customized module design solutions and penetrating new end-markets such as digital consumer electronics.
35
Table of Contents
Management’s discussion and analysis of financial condition and results of operations
MINORITY INTEREST
Minority interests consist of 40% of the outstanding equity interest in Shanghai E&T, and 1.4% of the outstanding equity interest in OAM, a non-operating Italian subsidiary, held by minority shareholders of these entities. For the three months ended March 31, 2005, approximately 8% of our total net revenue was generated through Shanghai E&T.
TAXATION
We are a holding company incorporated in the State of Maryland and conduct substantially all our operations through our PRC operating companies. Although we are subject to United States taxation, we do not anticipate incurring significant United States income tax liability for the foreseeable future because:
| Ø | we do not conduct any material business in the United States, |
| Ø | the earnings generated from our non-U.S. operating companies are generally eligible for a deferral from United States taxation until such earnings are repatriated to the United States, and |
| Ø | we believe that we will not generate any significant amount of income inclusions under the income imputation rules applicable to a United States company that owns “controlled foreign corporations” for United States federal income tax purposes. |
Our subsidiaries that are incorporated in Cayman Islands and the British Virgin Islands are not subject to income taxes in those jurisdictions.
The usual statutory tax rate applicable to PRC companies is 33%, while the statutory tax rate applicable to PRC companies in the Shenzhen Special Economic Zone in China is 15%. Since two of our PRC operating companies, Shenzhen Comtech and Comtech Communication, are established in the Shenzhen Special Economic Zone and have agreed to operate for a minimum of 10 years in China, Shenzhen Comtech was and Comtech Communication has been and will continue to be, entitled to preferential income tax treatment under PRC law as follows:
| Ø | Shenzhen Comtech was subject to a three-year preferential tax rate of 7.5% in 2002, 2003 and 2004; and |
| Ø | Comtech Communication operated under a zero-tax exemption in 2003 and 2004, and will be subject to a three-year preferential tax rate of 7.5% in 2005, 2006 and 2007. |
Our recently established PRC operating company, Comtech Software, which is also located in the Shenzhen Special Economic Zone, has not had any assessable profit to date and is currently applying for preferential tax treatment. Following expiration of the preferential tax treatment described above, our PRC operating companies located in the Shenzhen Special Economic Zone will be subject to the statutory tax rate of 15%. In addition, Shanghai E&T, our PRC operating company located in the Shanghai Qingpu Zone, has elected to be taxed on a deemed basis at 0.5% of its net revenue in accordance with guidelines issued by the local tax authority in the Shanghai Qingpu Zone in 2004.
As a result of the incentives above, our operations have been subject to relatively low tax liabilities. Our effective tax rate for the first quarter of 2005 was 8.2%, compared with 2.3% for the same period of 2004. The increase in our effective tax rate in this period was mostly due to the expiry of the preferential income tax period for Shenzhen Comtech and Comtech Communications. We are currently applying for preferential tax treatment for Comtech Software, which we anticipate will be approved in the second
36
Table of Contents
Management’s discussion and analysis of financial condition and results of operations
quarter of 2005. If so, we expect that our effective tax rate will be lower in the second half of 2005. Our effective tax rate in 2004, 2003 and 2002 was 3.5%, 4.3% and 8.2%, respectively, with the gradual decrease in the effective tax rate over this three year period being mostly due to the mix of our PRC operating companies’ earnings: more income was earned in our PRC operating companies that enjoy preferential tax treatment. Tax that would otherwise have been payable without preferential tax treatment amounted to approximately RMB19.9 million ($2.4 million), RMB10.2 million and RMB2.4 million in 2004, 2003, and 2002, respectively.
BASIS OF PRESENTATION
Our financial statements reflect the historical consolidated operations of Comtech Cayman. In the July 2004 share exchange with Trident, the stockholders of Comtech Cayman received in exchange for our business approximately 91.2% of the then-outstanding common stock of Trident. This share exchange transaction was accounted for as a reverse acquisition in which Comtech Cayman was deemed the accounting acquirer and Trident was deemed the legal acquirer. In connection with the share exchange, we changed our name to Comtech Group, Inc. from Trident.
As a result of the share exchange transaction:
| Ø | the historical financial statements of Trident for periods prior to the date of the share exchange transaction are no longer presented; |
| Ø | the historical financial statements for periods prior to the date of the transaction are those of Comtech Cayman, as the accounting acquirer; |
| Ø | all references to the financial statements apply to the historical financial statements of Comtech Cayman prior to the transaction; and |
| Ø | the number of our shares of common stock has been restated retroactively to reflect the share exchange ratio as at the date of the share exchange transaction. |
CRITICAL ACCOUNTING POLICIES AND ESTIMATES
The preparation of our consolidated financial statements requires us to make estimates and judgments that affect the reported amounts of our assets, liabilities, revenue and expenses. These estimates are based on our historical experience and on various other assumptions that we believe to be reasonable. Estimates are evaluated on an ongoing basis, but actual results may differ from these estimates.
Critical accounting policies are those that, in management’s view, are most important in the portrayal of our financial condition and results of operations. Those that require significant judgments and estimates include:
Revenue recognition. Revenue, net of VAT, from sales related to our customized module design solutions are recorded when the specific components contained in the related module reference design sold by us are delivered, title has passed to our customers, and we have no further obligation to provide services related to the operation of the components.
Allowance for doubtful accounts. We establish an allowance for doubtful accounts primarily based upon the age of receivables and factors surrounding the credit risk of specific customers. We generally do not require collateral or other security from our customers. As of March 31, 2005, our accounts receivable balance was RMB201.5 million ($24.3 million), net of a RMB3.8 million ($0.5 million) allowance for doubtful accounts. As our business grows, we expect our accounts receivable balance to increase, as could our allowance for doubtful accounts. If the financial condition of our customers deteriorates, our uncollectible account receivables could exceed our current or future allowances.
37
Table of Contents
Management’s discussion and analysis of financial condition and results of operations
Stock option valuation. We account for stock-based compensation using the intrinsic value method in accordance with Accounting Principles Board Opinion No. 25, “Accounting for Stock Issued to Employees”, and its related interpretations. Under this method, compensation cost for stock options, warrants and stock awards is measured as the excess, if any, of the quoted market price of our common stock at the date of the grant over the amount an employee must pay to acquire the stock.
The fair value of the options was estimated at the date of grant using a Black-Scholes option valuation model based on various assumptions including the expected risk-free interest rate, the expected dividend yield, the expected life of the options, and the expected stock price volatility. The Black-Scholes option valuation model was developed for use in estimating the fair value of traded options. Our employee stock options have characteristics significantly different from those of traded options such as limited transferability and, in most cases, vesting restrictions. In addition, the assumptions used in option valuation models are based upon historical averages that may not predict future results, particularly the expected stock price volatility of the underlying stock. Changes in these input assumptions can materially affect the fair value estimate of the options.
RESULTS OF OPERATIONS
Three months ended March 31, 2005 compared to three months ended March 31, 2004
Net revenue—Details of net revenue for the three months ended March 31, 2005 and 2004 are as follows:
| Three months ended March 31, | |||||||||||||||
| 2005 | 2005 | 2004 | 2004 | % change | |||||||||||
| % of net revenue | % of net revenue | ||||||||||||||
| (in millions, except for percentages) | |||||||||||||||
Mobile handset | RMB | 102.4 | 59.5 | RMB | 96.1 | 62.5 | % | 6.6 | % | ||||||
Telecom equipment | 61.7 | 35.9 | 55.6 | 36.2 | 11.0 | ||||||||||
Digital consumer electronics and other(1) | 7.9 | 4.6 | 2.1 | 1.3 | 276.2 | ||||||||||
Total net revenue | RMB | 172.0 | 100.0 | % | RMB | 153.8 | 100.0 | % | 11.8 | % | |||||
| (1) | Other revenue includes sales of lightning protection devices for wireless base stations. |
Net revenue for the three months ended March 31, 2005 was RMB172.0 million ($20.8 million), or RMB18.2 million or 11.8% higher than that of the same period in 2004. The increase was mainly attributed to new business from Broadcom for which we provide mobile handset related components amounting to RMB30.8 million, and sales of newly launched components for the digital consumer electronics end market amounting to RMB6.4 million.
Gross Profit—Gross profit increased from RMB23.7 million for the three months ended March 31, 2004 to RMB26.3 million ($3.2 million) for the three months ended March 31, 2005. Gross margin for the three months ended March 31, 2005 remained stable at 15.3%, compared to 15.4% in the same period in 2004.
38
Table of Contents
Management’s discussion and analysis of financial condition and results of operations
Selling, R&D, and General and Administrative Expenses—Selling, R&D, general and administrative expenses were RMB7.9 million ($1.0 million) in the three months ended March 31, 2005, or 139.4% higher than those of the same period in 2004. Details of these expenses for the three month period ended March 31, 2005 and 2004 are as follows:
| Three months ended March 31, | ||||||||||
| 2005 | 2005 | 2004 | 2004 | |||||||
| % of net revenue | % of net revenue | |||||||||
| (in millions, except for percentages) | ||||||||||
Selling, general and administrative expenses | RMB6.6 | 3.8 | % | RMB2.5 | 1.6 | % | ||||
R&D expenses | 1.3 | 0.7 | 0.8 | 0.5 | ||||||
Total | RMB7.9 | 4.5 | % | RMB3.3 | 2.1 | % | ||||
The increase in selling expenses in the three months ended March 31, 2005 as compared to the same period of 2004 of RMB1.2 million ($0.1 million), or 154.1%, was mainly attributable to an increase in sales staff costs of RMB0.4 million. Other indirect selling expenses such as freight charges and salesperson expenses and additional costs in opening new sales representative offices contributed to the balance of the increase. The increase in general and administrative expenses of RMB0.8 million was primarily attributed to corporate expenses related to being a public company in the U.S. following our share exchange in July 2004, as well as costs associated with our additional employees.
R&D expenses increased in the three months ended March 31, 2005 by RMB0.5 million ($0.1 million), or 62.5%, as compared to the same period in 2004. The increase was primarily attributed to additional research and development personnel and new digital consumer electronic solutions initiatives. In addition, we opened two new research centers, one in Shenzhen and one in Shanghai, to service the expected increase in our digital consumer electronic solutions business.
Interest Expense—Interest expense in the three months ended March 31, 2005 amounted to RMB393,000 ($48,000), compared to RMB322,000 in the same period of 2004. The interest rate was overnight LIBOR or 1.5% per annum above the deposit rate for the pledged deposit, whichever is higher.
Interest Income—Interest income in the three months ended March 31, 2005 amounted to RMB29,000 ($3,500), compared to RMB11,000 in the same period of 2004. The increase was attributed to higher net cash inflows generated from revenue resulting in higher average deposit balances.
Income Tax—The effective tax rate for the three months ended March 31, 2005 was 8.2% compared to 2.3% for the comparable period in 2004. The increase in the effective tax rate was primarily due to the expiry of the preferential tax period for two of our PRC operating companies.
Net Income; Earnings Per Share—As a result of the above items, net income for the three months ended March 31, 2005 was RMB15.8 million ($1.9 million), compared to net income of RMB18.9 million in the corresponding period of 2004. We reported basic per share earnings of RMB0.62 ($0.08) for the three months ended March 31, 2005, based on 25,381,853 outstanding weighted average shares, and a diluted per share earnings of RMB0.59 ($0.07), based on 26,871,865 outstanding weighted average shares, compared to basic and diluted per share earnings of RMB0.93 for the same period of 2004, based on 20,251,075 outstanding weighted average shares.
39
Table of Contents
Management’s discussion and analysis of financial condition and results of operations
Year ended December 31, 2004 compared to year ended December 31, 2003
Net Revenue—Details of net revenue for the years ended December 31, 2004 and 2003 are as follows:
| 2004 | 2004 | 2003 | 2003 | % change | |||||||||||
| Amount | % of net revenue | Amount | % of net revenue | ||||||||||||
| (in millions, except for percentages) | |||||||||||||||
Mobile handset | RMB | 368.1 | 58.8 | % | RMB | 143.2 | 40.0 | % | 157.1 | % | |||||
Telecom equipment | 249.3 | 39.9 | 207.3 | 57.9 | 20.3 | ||||||||||
Other(1) | 8.3 | 1.3 | 7.3 | 2.1 | 13.7 | ||||||||||
Total net revenue | RMB | 625.7 | 100.0 | % | RMB | 357.8 | 100.0 | % | 74.9 | % | |||||
| (1) | Other revenue includes sales of lightning protection devices for wireless base stations. |
Net revenue in 2004 was RMB625.7 million ($75.6 million), or 74.9% higher than in 2003. The increase was mainly attributed to the increase in net revenue from the sale of mobile handset and telecom equipment related components incorporated into our customized module design solutions. Mobile handset related sales increased by RMB224.9 million ($27.2 million), or 157.1%, and telecom equipment related sales increased by RMB42.0 million ($5.1 million), or 20.3%. The increase in mobile handset related revenue reflects continued growth in demand for mobile handsets in the PRC domestic market, as well as the increase in mobile handset exports by domestic manufacturers. Telecom equipment related revenue increased due to higher demand from telecom operators in China that continued to expand their existing infrastructures. The contribution to total net revenue by mobile handset related sales in 2004 increased to RMB368.1 million ($44.5 million), or 58.8% of total net revenue, from RMB143.2 million, or 40.0% of total net revenue, in 2003. The contribution to total net revenue by telecom equipment related sales decreased from 57.9% in 2003 to 39.9% in 2004, though total telecom equipment related sales increased from RMB207.3 million in 2003 to RMB249.3 million ($30.1 million) in 2004.
Gross Profit—Gross profit increased from RMB50.9 million in 2003 to RMB94.9 million ($11.5 million) in 2004. Gross margin was 15.2% in 2004 compared to 14.2% in 2003. The increase in gross margin was principally due to the change in revenue mix, as mobile handset related sales had a higher margin than those of telecom equipment related sales.
Selling, R&D and General and Administrative Expenses—Selling, R&D and general and administrative expenses were RMB27.2 million ($3.3 million) in 2004, or 34.0% higher than in 2003. Details of these expenses for the years ended December 31, 2004 and 2003 are as follows:
| 2004 | 2004 | 2003 | 2003 | |||||||
| Amount | % of net revenue | Amount | % of net revenue | |||||||
| (in millions, except for percentages) | ||||||||||
Selling, general and administrative expenses | RMB21.1 | 3.4 | % | RMB19.3 | 5.4 | % | ||||
R&D expenses | 6.1 | 1.0 | 1.0 | 0.3 | ||||||
Total | RMB27.2 | 4.4 | % | RMB20.3 | 5.7 | % | ||||
The increase in selling expenses in 2004 as compared to the selling expenses in 2003 by RMB5.0 million ($0.6 million), or 192.3%, was mainly attributed to an increase in marketing and business development
40
Table of Contents
Management’s discussion and analysis of financial condition and results of operations
expenses for promoting new module solutions and gaining a larger customer base. Other indirect selling expenses such as freight charges and salesperson expenses contributed to the balance of the increase and, consistent with the same period of last year, represented about 1.0% of net revenue.
General and administrative expenses decreased in 2004 by RMB3.2 million ($0.4 million), or 19.2%, as compared to 2003. The decrease was attributable to bad debt provision of RMB4.0 million recorded in 2003, with no additional provision in 2004. Offsetting this decrease in part were additional corporate expenses of approximately RMB1.0 million ($0.1 million) in 2004 incurred as a result of expanding our business and an increase in legal and other expenses in 2004 associated with meeting our reporting and compliance obligations as a public company in the United States.
R&D expenses increased in 2004 by RMB5.1 million ($0.6 million), or 510.0%, as compared to 2003. The increase reflected approximately RMB2.6 million ($0.3 million) in additional costs incurred in developing new customized module design solutions targeted at the mobile handset, telecom equipment and consumer electronics end-markets, as well as additional personnel costs of approximately RMB2.4 million ($0.3 million) associated with strengthening our engineering team. The headcount in our R&D department increased from 20 persons as of December 31, 2003 to 25 as of December 31, 2004. As a percentage of net revenue, R&D expenses increased from 0.3% in 2003 to 1.0% in 2004.
Interest Expense—Interest expense in 2004 amounted to RMB2.2 million ($0.3 million), compared to RMB0.8 million in 2003. The increase of RMB1.4 million ($0.2 million) in 2004, or 175.0%, was due to new bank loans totaling RMB72.5 million ($8.8 million) obtained in August and September of 2004. The applicable interest rate on the loans was overnight LIBOR or 1.5% per annum above the deposit rate, whichever is highest. No similar loans were outstanding in 2003.
Interest Income—Interest income in 2004 amounted to approximately RMB38,000 ($5,000), compared to approximately RMB54,000 in 2003. The decrease was attributable to lower average deposit balances.
Income Tax—The effective tax rate for 2004 was 3.5% compared to 4.3% in 2003. The decrease in the effective tax rate was mostly due to having earned more income in our PRC operating companies that enjoy preferential tax treatment.
Net Income; Earnings Per Share—As a result of the above items, net income for 2004 was RMB62.2 million ($7.5 million) compared to net income of RMB28.5 million in 2003, an increase of 118.2%. We reported basic per share earnings of RMB2.87 ($0.35) for 2004, based on 21,690,560 outstanding weighted average shares, and a diluted per share earnings of RMB2.84 ($0.34), based on 21,885,053 outstanding weighted average shares, compared to basic and diluted per share earnings of RMB1.41 for 2003, based on 20,251,075 outstanding weighted average shares.
Year ended December 31, 2003 compared to year ended December 31, 2002
Net Revenue—Details of net revenue for the years ended December 31, 2003 and 2002 are as follows:
| 2003 | 2003 | 2002 | 2002 | % change | |||||||||||
| Amount | % of net revenue | Amount | % of net revenue | ||||||||||||
| (in millions, except for percentages ) | |||||||||||||||
Mobile handset | RMB | 143.2 | 40.0 | % | RMB | 62.3 | 30.0 | % | 129.9 | % | |||||
Telecom equipment | 207.3 | 57.9 | 143.3 | 69.0 | 44.7 | ||||||||||
Other(1) | 7.3 | 2.1 | 2.0 | 1.0 | 265.0 | ||||||||||
Total net revenue | RMB | 357.8 | 100.0 | % | RMB | 207.6 | 100.0 | % | 72.4 | % | |||||
| (1) | Other revenue includes sales of lightning protection devices for wireless base stations. |
41
Table of Contents
Management’s discussion and analysis of financial condition and results of operations
Net revenue in 2003 was RMB357.8 million, or 72.4% higher than in 2002. The increase was mainly attributed to the increase in both mobile handset and telecom equipment module related component sales. The increase in mobile handset related sales reflects increased demand for mobile handsets in China and increased market penetration in China by domestic manufacturers. The increase in telecom equipment related sales was driven by growth in China’s telecom equipment industry and by the increase in investment by telecom operators in China. Contribution of mobile handset related net revenue to total revenue increased from RMB62.3 million, or 30.0%, to RMB143.2 million, or 40.0% in 2003. Contribution of telecom equipment related net revenue to total net revenue decreased from 69.0% to 57.9%, though the telecom equipment related net revenue increased from RMB143.3 million in 2002 to RMB207.3 million in 2003.
Gross Profit—Gross profit increased to RMB50.9 million in 2003 from RMB17.3 million in 2002. Gross margin was 14.2% in 2003, compared to 8.4% in 2002. The increase in gross margin was principally due to an increase in sales volume and a change in revenue mix, with mobile handset related sales carrying a higher margin than telecom equipment related sales.
Selling, R&D and General and Administrative Expenses—Selling, R&D and general and administrative expenses increased in 2003 by RMB12.8 million, or 170.7%, compared to 2002. Details of these expenses for the years ended December 31, 2003 and 2002 are as follows:
| 2003 | 2003 | 2002 | 2002 | |||||||||
| Amount | % of net revenue | Amount | % of net revenue | |||||||||
| (in millions, except for percentages) | ||||||||||||
Selling, general and administrative expenses | RMB | 19.3 | 5.4 | % | RMB | 6.5 | 3.1 | % | ||||
R&D expenses | 1.0 | 0.3 | 1.0 | 0.5 | ||||||||
Total | RMB | 20.3 | 5.7 | % | RMB | 7.5 | 3.6 | % | ||||
The increase in selling expenses in 2003 by RMB1.8 million, or 225.0%, was mainly attributed to the increase in marketing and business development expenses of approximately RMB1.0 million for promoting new module solutions and gaining a larger customer base. Other indirect selling expenses such as freight charges and salesperson expenses contributed to the balance of the increase, primarily due to increased sales transactions. As a percentage of net revenue, selling expenses increased from 0.4% in 2002 to 0.7% in 2003.
R&D expenses decreased slightly in 2003 by approximately RMB59,000. The R&D expenses were incurred in developing new module solutions for mobile handsets and telecom equipment end-markets. As a percentage of net revenue, R&D expenses decreased from 0.5% in 2002 to 0.3% in 2003.
General and administrative expenses increased in 2003 by RMB11.0 million, or 193.0%, as compared to 2002. The increase was partially attributable to the bad debt provision of RMB4.0 million made in 2003 representing full provision for receivables overdue for more than 180 days and a partial provision for other overdue receivables based on our best estimate of recoverability. The remaining RMB7.0 million increase was due to an increase in staff costs, and an increase in corporate administrative expenses reflecting our growth. As a percentage of net revenue, general and administrative expenses increased from 2.7% in 2002 to 4.7% in 2003.
Interest Expense—Interest expense in 2003 amounted to RMB0.8 million as compared to zero in 2002. The increase in interest expense was associated with bank overdraft and bank handling charges incurred during 2003.
42
Table of Contents
Management’s discussion and analysis of financial condition and results of operations
Interest Income—Interest income in 2003 amounted to approximately RMB54,000, compared to approximately RMB157,000 in 2002. The decrease was due to increase in net cash outflow used in operating activities during 2003.
Income Tax—The effective tax rate for 2003 was 4.3% compared to 8.2% in 2002. The decrease in the effective tax rate was mostly due to the mix of PRC operating companies’ earnings. More income was earned in our PRC operating companies that enjoy preferential tax treatment.
Net Income; Earnings Per Share—As a result of the above items, net income for 2003 was RMB28.5 million, compared to net income of RMB9.2 million in 2002. We reported basic and diluted per share earnings of RMB1.41 for 2003, based on 20,251,075 outstanding weighted average shares, compared to basic and diluted per share earnings of RMB0.46 for 2002, based on 20,251,075 outstanding weighted average shares.
LIQUIDITY AND CAPITAL RESOURCES
Cash flows and working capital
Our accounts payable cycle typically averages approximately one month, whereas our receivables cycle typically averages approximately three months. Accordingly, additional working capital is needed to fund this time difference.
As at March 31, 2005, we had no material commitments for capital expenditures.
As of March 31, 2005, we had approximately RMB42.8 million ($5.2 million) in cash. We regularly review our cash funding requirements and attempt to meet those requirements through a combination of cash on hand, cash provided by operations, available borrowings under bank lines of credit and factoring facilities and possible future public or private equity offerings. At times, we may evaluate possible acquisitions of, or investments in, businesses that are complementary to ours, which may require the use of cash. We believe that our cash, operating cash flows, credit arrangements, and access to equity capital markets, taken together, provide adequate resources to fund our ongoing operating expenditures for the next 12 months. In the event that they do not, we may require additional funds in the future to support our working capital requirements or for other purposes and may seek to raise such additional funds through the sale of public or private equity, as well as from other sources.
As of March 31, 2005, we had working capital of RMB202.2 million ($24.4 million), including RMB42.8 million ($5.2 million) in cash, as compared with working capital of RMB186.9 million at December 31, 2004, including RMB41.4 million in cash.
Operating activities provided cash of RMB22.3 million ($2.7 million) for the three months ended March 31, 2005 compared to cash used of RMB1.2 million ($0.1 million) in the corresponding period of 2004. The increase in cash provided by operating activities as compared to the prior year is primarily due to the collection of accounts and bills receivables on a more timely basis, and the increase in trade payables. The increase in payable was partly off-set by an increase in inventories of RMB17.1 million ($2.1 million). The increase in inventories as at March 31, 2005 resulted from an increase in demand for our products, and a change in product mix. Given the increase in sales, inventory levels as at March 31, 2005, were generally in line with those maintained over the past two years. The overall cash inflows from operating activities was largely attributable to our tighter credit policy on trade accounts receivables. The increase in trade accounts payable balances was primarily associated with the increased purchases of inventories.
Operating activities used cash of RMB60.3 million ($7.3 million) in 2004, compared to RMB25.4 million used in 2003, despite the contribution of net income in 2004 of RMB62.2 million ($7.5 million)
43
Table of Contents
Management’s discussion and analysis of financial condition and results of operations
compared to RMB28.5 million in 2003. The increase in cash used in operating activities in 2004 as compared to 2003 was primarily due to an increase in accounts and bills receivable of RMB71.6 million ($8.7 million) and RMB64.0 million ($7.7 million), respectively, and the increase in trade payables of RMB1.4 million ($0.2 million) and a decrease in inventories of RMB4.1 million ($0.5 million). Overall collections of trade accounts receivable and credit quality of customers improved in 2004. Average trade accounts receivable turnover approximated 76 days for 2004, compared with 82 days in 2003. The increase in trade accounts payable was primarily associated with increased purchases. Our inventory levels are low as we begin purchasing components generally only after we receive purchase orders from our customers.
Investing activities used RMB330,000 ($40,000) during the three months ended March 30, 2005, mainly for the purchase of fixed assets.
Investing activities used RMB1.6 million ($0.2 million) in 2004, mainly for the purchase of property and equipment, and for the acquisition of our PRC operating company, Shanghai E&T, in which we have a 60% controlling interest, from the current minority shareholders in January 2004. The purpose of this acquisition was to provide us with a larger sales force, advanced technology know-how and a potential customer base in Shanghai.
Financing activities used net cash of RMB20.6 million ($2.5 million) during the three months ended March 30, 2005. Cash was used to pay for transaction costs of RMB1.1 million ($0.1 million) in connection with the issuance of shares and for the repayment of certain bank borrowings for discounted bills receivables of RMB19.5 million ($2.4 million).
Financing activities provided net cash inflow of RMB72.7 million ($8.8 million) during 2004. Cash was provided by new bank borrowing and discounting arrangements amounting to RMB53.7 million ($6.5 million) and cash balances of RMB26.7 million ($3.2 million) obtained from Trident in the share exchange in July 2004. A private placement of 3.2 million shares of our common stock to a group consisting primarily of institutional investors, generated aggregate net proceeds to us of RMB84.0 million ($10.1 million). These financing cash inflows were partially off-set by repayment of amounts due to Comtech Global Investment Ltd., one of our principal shareholders and an entity over which Jeffrey Kang, our principal shareholder and chief executive officer, and his wife share voting and investment power, of RMB50.4 million ($6.1 million) and the dividend payment on September 2004 relating to the prior year amounting to RMB41.4 million ($5.0 million).]
Distributions by our PRC operating companies to us may be subject to governmental approval and taxation. Any transfer of funds from us to our PRC operating companies, either as a shareholder loan or as an increase in registered capital, is subject to registration or approval with or by PRC governmental authorities, including the relevant administration of foreign exchange and/or other relevant examining and approval authorities. These limitations on the free flow of funds between us and our PRC operating companies may restrict our ability to act in response to changing market conditions. To date, none of our PRC operating companies, including Shenzhen Comtech and Shanghai E&T, have declared or paid dividends to us, and historically, we have not relied on such distributions for our liquidity needs. In addition, we have not declared dividends since the share exchange transaction. Our holding companies have no business operations and therefore the related expenses are relatively low, consisting mainly of legal, accounting and other fees and expenses associated with being a holding company or, in the case of Comtech Group, Inc., a public company. Two of our major operating companies, Comtech Hong Kong and Comtech Communication, are legally permitted to declare and pay dividends, enabling them to provide any funds necessary to meet the holding companies’ limited operating expenses. Therefore, we do not expect restrictions between us and our PRC operating companies to affect our liquidity and capital
44
Table of Contents
Management’s discussion and analysis of financial condition and results of operations
resources in the near future. For risks associated with the uncertainty in our receipt of the equivalent economic interest in connection with the equity interest in Shenzhen Comtech, see “Risk factors—PRC laws and our corporate structure may restrict our ability to receive dividends and payments from, and transfer funds to, our PRC operating companies, which may negatively affect our results of operations and restrict our ability to act in response to changing market conditions.”
Our PRC operating companies are required, where applicable, to allocate a portion of their net profit to certain funds before distributing dividends, including at least 10% of their net profit to certain reserve funds until the balance of such fund has reached 50% of their registered capital. These reserves can only be used for specific purposes, including making-up cumulative losses of previous years, conversion to equity capital, and application to business expansion, and are not distributable as dividends. Our PRC operating subsidiaries are required, where applicable, to allocate an additional 5% to 10% of their net profits to a statutory common welfare fund. These reserves can only be used for specific purposes and are not distributable as dividends. For risks associated with the uncertainty in our receipt of the equivalent economic interest in connection with the equity interest in Shenzhen Comtech, see “Risk factors—PRC laws and our corporate structure may restrict our ability to receive dividends and payments from, and transfer funds to, our PRC operating companies, which may negatively affect our results of operations and restrict our ability to act in response to changing market conditions.
Indebtedness
In July 2004, Comtech Hong Kong, our Hong Kong operating company, entered into a RMB33.1 million ($4.0 million) U.S. dollar-denominated revolving credit facility with the Bank of Communications, Hong Kong branch. In September 2004, the amount of the facility was increased to RMB82.8 million ($10.0 million). Apart from income from operations, this revolving credit facility serves as our principal source of liquidity to fund our working capital needs. As of March 31, 2005, the outstanding loan balance under the revolving credit facility was RMB23.4 million ($2.8 million), leaving RMB59.4 million ($7.2 million) in availability under the facility, subject to maintenance of security provided by Jeffrey Kang, our chief executive officer and principal shareholder, in the form of a $10 million bank deposit. The facility bears interest at the higher of LIBOR or 1.5% over the deposit rate, payable monthly. The effective interest rate for the three months ended March 31, 2005 was approximately 3.5%. Based on a variable return on interest, the bank borrowings amounted to fair value.
We are currently in the process of negotiating an additional credit facility with another bank to fund our working capital needs, although this financing may not be arranged on satisfactory terms or at all.
In August 2004, Comtech Communication entered into an accounts receivable factoring agreement with Guangdong Development Bank, Shenzhen branch. Under the terms of the agreement, accounts receivable from UTStarcom, one of our major customers, up to a maximum amount of RMB30.0 million ($3.6 million), can be transferred to the bank with recourse. An amount equal to 30% of the accounts receivable transferred is secured by funds we have on deposit with the bank. The factoring arrangement bears interest at the PRC official loan interest rate, payable monthly. On October 20, 2004, we transferred accounts receivable of approximately RMB11.4 million ($1.4 million) under the agreement. As of March 31, 2005, we had no factored accounts receivable outstanding under the agreement and had no pledged deposit with Guangdong Development Bank.
Some of our customers enter into arrangements with their respective banks for purposes of settling their bills. Under such arrangements, we are entitled to collect the amounts owed directly from the customers’ banks when the invoice becomes due. These amounts are recorded as bills receivable on our consolidated balance sheet. In certain circumstances, we have arranged to transfer with recourse certain of our bills receivable to the bank. Under this discounting arrangement, the bank pays a discounted amount to us and collects the amounts owed from the customers’ banks. The discount is typically 0.8% of the balance transferred, which is recorded as interest expense. As of March 31, 2005, we had discounted bills receivable amounting to approximately RMB10.8 million ($1.3 million).
45
Table of Contents
Management’s discussion and analysis of financial condition and results of operations
Contractual obligations and commercial commitments
The following table sets forth our contractual payment obligations for operating leases and purchase obligations as of December 31, 2004:
| Payments due by period | |||||||||||||
| Total | Less than 1 year | 1-3 years | 3-5 years | More than 5 years | |||||||||
| (in millions) | |||||||||||||
Operating lease obligations | RMB | 2.0 | RMB | 1.3 | RMB | 0.7 | — | — | |||||
Purchase obligations | 21.4 | 21.4 | — | — | — | ||||||||
Bank borrowings | 53.7 | 53.7 | — | — | — | ||||||||
Total | RMB | 77.1 | RMB | 76.4 | RMB | 0.7 | — | — | |||||
Operating lease obligations consist primarily of operating lease agreements for our office facilities, including our head office and research center in Shenzhen. Our leases have remaining terms ranging from one to 36 months.
Purchase obligations consist of outstanding purchase orders for components from our suppliers. We do not have any minimum purchase obligations with these suppliers.
Off-balance sheet arrangements
We have no outstanding off-balance sheet arrangements, derivative financial instruments, interest rate swap transactions or foreign currency forward contracts. We do not engage in trading activities involving non-exchange traded contracts.
Quarterly Results of Operations
The following table presents our supplemental selected unaudited quarterly results of operations for the nine quarters prior to and including the quarter ended March 31, 2005. You should read the following table in conjunction with our audited consolidated financial statements and related notes contained elsewhere in this prospectus. In our management’s opinion, we have prepared our unaudited quarterly results of operation on substantially the same basis as our audited consolidated financial statements. Due to the evolving nature of our business and other factors affecting our business as described under “Risk factors”, our results of operations for any quarter are not necessarily indicative of results that may be expected for any future periods.
| For the three months ended, | ||||||||||||||||||||||||||
| Mar. 31, 2003 | June 30, 2003 | Sept. 30, 2003 | Dec. 31, 2003 | Mar. 31, 2004 | June 30, 2004 | Sept. 30, 2004 | Dec. 31, 2004 | Mar. 31, 2005 | ||||||||||||||||||
| (in millions of RMB, except per share data) | ||||||||||||||||||||||||||
Net revenue | 61.5 | 88.6 | 96.2 | 111.5 | 153.8 | 163.8 | 147.4 | 160.7 | 172.0 | |||||||||||||||||
Gross profit | 9.0 | 13.4 | 13.7 | 14.8 | 23.7 | 23.6 | 22.6 | 25.1 | 26.3 | |||||||||||||||||
Net income | 4.8 | 8.5 | 9.4 | 5.7 | 18.9 | 12.8 | 11.9 | 18.7 | 15.8 | |||||||||||||||||
Earnings per share | ||||||||||||||||||||||||||
Basic | 0.24 | 0.42 | 0.47 | 0.28 | 0.93 | 0.63 | 0.55 | 0.76 | 0.62 | |||||||||||||||||
Diluted | 0.24 | 0.42 | 0.47 | 0.28 | 0.93 | 0.63 | 0.54 | 0.74 | 0.59 | |||||||||||||||||
46
Table of Contents
Management’s discussion and analysis of financial condition and results of operations
Our quarterly net revenue over the past two years has experienced continued sequential growth, with the exception of the last two quarters of 2004 when we, like many of our customers and competitors, were affected by a general economic slowdown and an accompanying decline in demand for many of our customers’ products. The impact of slowing end-customer demand was compounded by higher than normal levels of equipment and inventories among our customers and our customers’ adjustments in their order levels, resulting in increased pricing pressure for our customers and fewer orders for our solutions.
The overall increase in our net revenue over the past two years was consistent with growing demand for both mobile handset and telecom equipment solutions in China’s domestic market as China’s telecom operators continued to expand and upgrade their infrastructure.
We believe that the general increase in gross profit from quarter to quarter can be primarily attributed to a change in our product mix. Specifically, mobile handset related sales, which have higher profit margins than our telecom equipment related sales, have increasingly constituted a significantly greater portion of our total net revenue over the past two years.
QUANTITATIVE AND QUALITATIVE DISCLOSURES ABOUT MARKET RISK
Foreign exchange risk
Our functional currency is the Renminbi. Transactions in other currencies are recorded in Renminbi at the rates of exchange prevailing when the transactions occur. Monetary assets and liabilities denominated in other currencies are remeasured into Renminbi at rates of exchange in effect at the balance sheet dates. Exchange gains and losses are recorded in our statements of operations as a component of current period earnings.
The PRC State Administration for Foreign Exchange, under the authority of the People’s Bank of China, controls the conversion of Renminbi into foreign currencies. The principal regulation governing foreign currency exchange in China is the Foreign Currency Administration Rules (1996), as amended, or the “Rules”. Under the Rules, once various procedural requirements are met, Renminbi is convertible for current account transactions, including trade and service-related foreign exchange transactions and dividend payments, but not for capital account transactions, including direct investment, loans or investments in securities outside China, without prior approval of the State Administration of Foreign Exchange of the People’s Republic of China, or its local counterparts.
The value of the Renminbi is subject to changes in China’s central government policies and to international economic and political developments affecting supply and demand in the China Foreign Exchange Trading System market. Since 1994, the conversion of Renminbi into foreign currencies, including U.S. dollars, has been based on rates set by the People’s Bank of China, which are set daily based on the previous day’s interbank foreign exchange market rates and current exchange rates on the world financial markets. Since 1994, the official exchange rate generally has been stable. However, recently there has been increased political pressure on the PRC government to decouple the Renminbi from the U.S. dollar, and the PRC government may in the future relinquish the U.S. dollar peg or increase the current trading range.
We conduct substantially all of our operations through our PRC operating companies, and their financial performance and position are measured in terms of Renminbi. Our solutions are primarily procured, sold and delivered in the PRC for Renminbi. The majority of our net revenue is denominated in Renminbi.
47
Table of Contents
Management’s discussion and analysis of financial condition and results of operations
Any devaluation of the Renminbi against the U.S. dollar would consequently have an adverse effect on our financial performance and asset values when measured in terms of U.S. dollars. On the other hand, the appreciation of the Renminbi could make our customers’ products more expensive to purchase because many of our customers are involved in the export of goods, which may have an adverse impact on their sales. A decrease in sales by our customers could have an adverse effect on our operating results. In addition, from time to time we may have U.S. dollar denominated borrowings, and therefore a decoupling of the Renminbi many affect our financial performance in the future.
We have experienced minimal foreign exchange gain and losses to date due to the relative stability of the Renminbi. We believe that our overall exposure to foreign currency exchange rate risk is not material and we do not currently engage in hedging activities to reduce our exposure to exchange rate fluctuations.
Interest rate risk
We are exposed to interest rate risk arising from short-term variable rate borrowings from time to time. Our future interest expense will fluctuate in line with any change in our borrowing rates. We do not have any derivative financial instruments and believe our exposure to interest rate risk and other relevant market risks is not material. Our bank borrowings amounted to RMB34.2 million ($4.1 million) as of March 31, 2005. Based on a variable rate of return, the bank borrowings approximated fair value at that date.
Inflation
In recent years, China has not experienced significant inflation, and thus inflation has not had a material impact on our results of operations. According to the National Bureau of Statistics of China, the change in Consumer Price Index in China was (0.8%), 1.2% and 3.9% in 2002, 2003 and 2004, respectively.
Recently issued accounting pronouncements
In December 2004, the Financial Accounting Standards Board issued SFAS No. 123R, “Share-Based Payment”. This statement is a revision to SFAS No. 123 and supercedes APB Opinion No. 25. This statement establishes standards for the accounting for transactions in which an entity exchanges its equity instruments for goods or services, primarily focusing on the accounting for transactions in which an entity obtains employee services in share-based payment transactions. Entities will be required to measure the cost of employee services received in exchange for an award of equity instruments based on the grant-date fair value of the award, with limited exceptions. That cost will be recognized over the period during which an employee is required to provide service, the requisite service period (usually the vesting period), in exchange for the award. The grant-date fair value of employee share options and similar instruments will be estimated using option-pricing models. If an equity award is modified after the grant date, the incremental compensation cost will be recognized in an amount equal to the excess of the fair value of the modified award over the fair value of the original award immediately before the modification. This statement is effective as of the beginning of the annual reporting period that begins after June 15, 2005.
In accordance with the standard, we will adopt SFAS No. 123R effective January 1, 2006. Upon adoption, we have two application methods to choose from: the modified-prospective transition approach or the modified-retrospective transition approach. Under the modified-prospective transition method, we would be required to recognize compensation cost for share-based awards to employees
48
Table of Contents
Management’s discussion and analysis of financial condition and results of operations
based on our grant-date fair value from the beginning of the fiscal period in which the recognition provisions are first applied as well as compensation cost for awards that were granted prior to, but not vested as of the date of adoption. Prior periods remain unchanged and pro forma disclosures previously required by SFAS No. 123 continue to be required. Under the modified-retrospective transition method, we would restate prior periods by recognizing compensation cost in the amounts previously reported in the pro forma footnote disclosure under SFAS No. 123. Under this method, we are permitted to apply this presentation to all periods presented or to the start of the fiscal year in which SFAS No. 123R is adopted. We would follow the same guidelines as in the modified-prospective transition method for awards granted subsequent to adoption and those that were granted and not yet vested. We have not yet determined which methodology we will adopt but believe that the impact that the adoption of SFAS No. 123R will have on our financial position or results of operations will approximate the magnitude of the stock-based employee compensation cost disclosed in Note 2 of our consolidated financial statements.
49
Table of Contents
We believe that China has emerged as a major participant in the global electronics market and has experienced rapid growth in domestic demand for electronics products, including mobile handsets, telecom equipment and digital consumer electronics products. We also believe that China has emerged as one of the world’s most attractive locations for global electronics manufacturers, where domestic and foreign manufacturers undertake extensive design and manufacturing work.
CURRENT INDUSTRY TRENDS
Growth of domestic electronics markets. The rapid growth of the domestic mobile handset, telecom equipment and digital consumer electronics products end-markets have been important drivers of growth of China’s electronics manufacturing industries. For example, according to a February 2005 report by Datamonitor, an independent research and consulting organization, China’s domestic mobile handset market is estimated to grow from approximately 72 million units in 2004 to approximately 99 million units in 2008, a CAGR of 8.3%. According to China’s Ministry of Information Industry, in 2004 China ranked as the world’s largest cellular phone market, with approximately 300 million subscribers.
With strong consumer demand for mobile handsets, increasing wireless penetration and the continued build-out and upgrading of China’s telecommunications infrastructure, including the advent of 3G, China’s telecom industry continues to see strong investment in the broader telecom equipment industry. Specific segments that we expect to continue growing are the data communications segment, consisting of asymmetric digital subscriber line (ADSL) equipment, Voice over Internet Protocol (VoIP) equipment, and routers and network security equipment; the optical transmission systems segment; and the fixed line telecom network segment. The growth in these segments has driven, and we believe will continue to drive, growth in the electronics manufacturing businesses supporting hardware OEMs, including those engaged in the customized design of module solutions such as ourselves.
With increasingly advanced technology requirements within various segments of the digital consumer electronics market, we believe that digital consumer electronics manufacturers in China are increasingly demanding more customized module design solutions to ensure that their products incorporate the latest technology and innovation. An example of this is the growing DTV market in China: In February 2005, BDA reported that the number of DTV subscribers was 0.3 million in 2003 and forecast the number of DTV subscribers to rise to 6.0 million in 2005.
In addition, we believe that the market for data storage is growing, driven by growth of data volume, proliferation of different types of data, and the emergence of Internet-based communication protocols, among other factors.
Rise of domestic electronics manufacturers. The growth of the domestic electronics end-markets has been accompanied by a proliferation of domestic companies competing to serve these end-markets. Initially, most domestic companies had limited product offerings and lacked the ability to develop their own products. For example, until the late 1990’s, most domestic mobile handset suppliers in China simply re-branded products imported from foreign suppliers and differentiated themselves based on the quality and depth of their distribution channels. As a result, domestic mobile handset suppliers have continued to penetrate China’s mobile handset end-market and have captured market share from international suppliers such as Motorola Inc., Nokia Oyj, Siemens AG and Sony-Ericsson Mobile Communications AB. According to reports by Gartner, China’s mobile handset manufacturers have grown their share of China’s domestic market from less than 4% in 1999 to approximately 40% at the end of 2004, although market share growth has leveled off since mid-2003 as a result of the introduction in China of low-end products by international vendors.
Growth of exports from domestic electronics manufacturers. The growth in the number of domestic electronics manufacturers has created an environment where the domestic mobile handset, telecom
50
Table of Contents
Industry overview
equipment and digital consumer electronics suppliers must continually innovate and develop new products while at the same time follow aggressive pricing policies in order to compete more effectively. The development of a highly-skilled, low-cost manufacturing base has enabled China’s domestic manufacturers to become competitive in the global marketplace. For example, Huawei, a major domestic telecom equipment manufacturer in China, has become a major supplier of telecom equipment to international customers. ZTE, the second largest manufacturer of telecom equipment in China, and other telecom equipment manufacturers and mobile handset device makers have also begun to expand overseas. More recently, we believe that emerging domestic mobile handset designers have begun helping mobile handset suppliers by incorporating leading-edge technology features and shortening design cycles in a cost-competitive fashion.
Growth of China’s design and manufacturing base for global technology providers. China has historically been recognized as a low-cost manufacturing base for companies seeking to enhance their global competitiveness. Recently, however, China has emerged as a primary location for technology companies seeking access to a low-cost, highly-skilled workforce to engage in product design, development and manufacturing. As a result, global technology companies are increasingly using China as a global hub for design and production, leveraging the comparative cost advantages in both product design and manufacturing. An example of this trend is in the mobile handset market where, according to a report by BDA China, a market research firm, the number of mobile handsets produced in China and sold globally is expected to increase to approximately 260 million in 2005, compared with approximately 186 million in 2003, representing a CAGR of 18.2%.
OTHER FACTORS INFLUENCING INDUSTRY GROWTH
In addition to the preceding trends, we believe that the following factors will continue to influence continued growth in the mobile handset, telecom equipment and consumer electronics end-markets, and in the OEMs and other industry participants supporting OEMs in these end-markets:
Increasing technological complexity. We believe that increasing complexity of mobile handsets, due to constantly changing consumer tastes and the upgrade of telecom networks in China, is driving the need for greater customization of components. In the mobile handset market, new features are being added to mobile handsets at an accelerating pace due to competition between mobile handset makers and the increasing functionality and data transmission capability enabled by advanced networks such as 2.5G and 3G. We believe that this increased demand for mobile handset functionality, in turn, will continue to drive demand for more customized applications of standard components, requiring more design and customization work from providers such as ourselves.
Increased reliance on outsourcing. We believe that OEMs are increasingly outsourcing the development, design, prototyping, engineering, manufacturing, assembly and testing of components and systems to subsystem and module solution providers in order to:
| Ø | reduce required investments in R&D, inventory and operating assets in the face of cyclical demands for their products; |
| Ø | reduce design-to-delivery and time-to-market cycle times; |
| Ø | control costs given industry-wide pricing pressure; |
| Ø | take advantage of subsystem and module solution providers’ customized product designs; |
51
Table of Contents
Industry overview
| Ø | effectively utilize subsystem suppliers’ inventory management capabilities and purchasing power; and |
| Ø | focus on their core marketing and branding competencies. |
52
Table of Contents
OUR COMPANY
We are a provider of customized module design solutions in China and serve as a gateway for our suppliers to access leading electronics manufacturers in China. Our customized module design solutions allow our customers to use technology components from established suppliers in a timely and cost-effective manner, reducing their time-to-market and lowering their overall costs. Our close collaboration with our customers’ product development teams gives us an understanding of their needs, and enables us to provide customization of our suppliers’ technology components with module designs to suit each of our many customers’ specific needs.
We have historically focused on the mobile handset and telecom equipment end-markets in China, but have recently expanded our addressable market to include the digital consumer electronics end-market. Within these industries we focus on wireless, broadband and digital home entertainment products. Over the last three years, we have worked with over 200 customers, including a majority of the largest and most well-known manufacturers in the mobile handset and telecom equipment end-markets in China. In addition to these original equipment manufacturers, or OEMs, our other customers include industry participants that support these OEMs, such as subsystem designers and contract manufacturers. In developing customized module design solutions for use in our customers’ products, we work closely with over 30 suppliers of technology components, including many large multinational companies such as Broadcom, JDS Uniphase and Matsushita.
Based on a given customer’s specific design requirements, we propose a customized module reference design, which typically incorporates technology components from our suppliers. If the customer accepts our module reference design, it will generally agree to purchase from us some of the specific components contained in our proposed design. Our customers and their third-party contract manufacturers are responsible for the manufacture and assembly of the customized module design solutions based on our designs. Our business model is to generate revenue by reselling a limited number of specific components required in our module reference designs. The difference between the purchase price we pay our suppliers for these components and our sales price to our customers for these components compensates us for our design, technical support and distribution services.
From 2002 to 2004, our net revenue grew from RMB207.6 million to RMB625.7 million ($75.6 million), representing a CAGR of 73.6%, and our net income grew from RMB9.2 million to RMB62.2 million ($7.5 million) during the same period, representing a CAGR of 160.0%. For the three months ended March 31, 2005, we recorded net revenue of RMB172.0 million ($20.8 million) and net income of RMB15.8 million ($1.9 million).
OUR COMPETITIVE STRENGTHS
We believe that our customized module design solutions allow our customers to more effectively utilize our suppliers’ enabling technology components to more efficiently compete in their target end-markets. We believe our competitive strengths include:
Differentiated business model. We facilitate our customers’ use of technology components in their end-products, both reducing their time-to-market and lowering their overall costs. Because we focus on meeting our existing customers’ requirements instead of on developing specific technologies, we believe that we remain insulated from risks associated with being a provider of specific technology rather than on various competing technologies. We do not directly charge a design fee for our customized module
53
Table of Contents
solutions. Instead, we are compensated for the value added by our design work through a markup on the components we sell, determined principally by the extent of the design work we provide.
Broad and diversified customer base and deep customer relationships. Our broad and diversified customer base of over 200 customers over the last three years includes all of the major domestic mobile handset and telecom equipment manufacturers in China and many of their supporting subsystem suppliers. Being a customized module design solution provider to our customers frequently involves a time-consuming and difficult procurement qualification process. Our deep customer relationships are the result of extensive time spent onsite with our customers’ engineers to develop many different customized solutions for use in their products. We believe that these close customer relationships, together with our continued qualified solution provider status, facilitate understanding of our customers’ time-to-market, technology and cost requirements. We have been a qualified module design solution provider to each of our top ten customers in 2004 for at least three consecutive years.
Strong relationships with enabling technology components suppliers. We work closely with more than 30 technology components suppliers, including some of the leading global suppliers such as Matsushita, JDS Uniphase and Broadcom. In addition to facilitating the customization of their technology components, our suppliers often rely on us as a means of penetrating new China-based electronics manufacturers with whom we have existing relationships.
We believe that we have been effective in establishing high entry barriers within our customers’ supply chains, allowing us to build and sustain our competitive position.
OUR STRATEGY
Our objective is to be the leading provider of customized module design solutions for customers in China’s mobile handset, telecom equipment and digital consumer electronics end-markets.
Strengthen our design and development capabilities. Given the shortening product life cycles in our targeted end-markets, we believe that we must continue to build and maintain strong, in-depth and diversified solution development and design capabilities to meet the changing needs of our customers, and continue to differentiate ourselves from our competitors.
Leverage our strong customer relationships into new opportunities. We believe that we are well positioned to capture significant growth and higher margin opportunities in the digital consumer electronics end-market, as many of our key customers in China’s mobile handset end-market, including Haier, Konka, Lenovo and TCL, have expanded into the digital consumer electronics end-markets.
Make strategic investments, acquisitions or form strategic alliances. We intend to grow and expand our business by making investments, acquisitions or forming strategic relationships with companies that possess complementary design capabilities and technology. In particular, we plan to pursue opportunities where we expect to generate additional near-term revenue or expand our long-term growth opportunities. For example, we have entered into a joint venture agreement with Broadwell Group to establish a Hong Kong-based joint venture to distribute semiconductors and other related products for Broadcom, a leading global producer of broadband communications semiconductors. We have also recently licensed and agreed to acquire technology to apply to our newly initiated storage solutions business, which we believe will allow us to broaden our customer base and diversify our product offerings.
54
Table of Contents
Our business
OUR TECHNOLOGY SOLUTIONS
We provide customization of our suppliers’ technology components with module designs to suit each of our many customers’ specific needs. Our customized module design solutions include:
| Mobile Handsets | Telecom Equipment | Digital Consumer Electronics | ||
LCD modules | Fixed line telecom network modules | IPTV set-top box modules(1) | ||
Camera modules | Data communications modules | DTV modules(1) | ||
Persistent storage modules | Optical transmission modules | |||
Input/output modules | Wireless base-station modules | |||
Sound system | ||||
Power supplies | ||||
| (1) | Introduced in the first quarter of 2005. |
The following table sets forth the revenue contribution from our mobile handset, telecom equipment and other end-markets during 2003 and 2004. Revenue from other end-markets includes the sale of our proprietary network lightning protection solutions for wireless base-stations. Beginning in the first quarter of 2005, other revenue included net revenue from digital consumer electronics related sales.
| Segment | 2003 | 2004 | ||||
Mobile handset | 40.0 | % | 58.8 | % | ||
Telecom equipment | 57.9 | 39.9 | ||||
Other | 2.1 | 1.3 | ||||
Total | 100.0 | % | 100.0 | % | ||
We have also recently begun providing customized module design solutions for use in automobile electronics applications for customers such as Dongfeng Automobile Co. Ltd., a leading automobile manufacturer in China.
Through our recent investment in UIT, we plan to also become a provider of storage systems for organizations requiring high reliability, high performance networked storage and data management solutions. We anticipate that our storage solutions will consist of integrated hardware and software products employing a modular system that allows end-users to add capacity as needed. We intend to target our storage solutions at customers such as OEMs, telecom service providers, banks and government agencies.
The value of our technology solutions can be illustrated by specific examples of how we have worked closely with our customers and suppliers in leveraging our competitive position and differentiated business model to build and extend our existing business, as well as identify and capture new opportunities:
Growing with our customers. We have been a provider of customized module design solutions to many of our major customers for a substantial portion of our operating history, often developing multi-level relationships with the various customer groups with whom we work. For example, we first became a provider to Huawei in 1995 when Huawei had several hundred employees, compared to over 24,000 employees at the end of 2004. As China’s telecom market has grown, so has Huawei’s telecom equipment business and the demand for our module design solutions customized specifically for
55
Table of Contents
Our business
application within Huawei’s products. Our total net revenue from Huawei grew to RMB71.0 million ($8.6 million) in 2004.
Applying our customized module design capabilities to new end-markets. We have used our customized module design capabilities, coupled with our deep, multi-level customer relationships, to follow our customers into new end-markets. Since 1995, we have been a provider of telecom equipment customized module design solutions to ZTE, a major telecom equipment manufacturer in China. ZTE first sought to enter the mobile handset market in China in 2000. Although we had not previously provided mobile handset solutions to ZTE, based on our history of working with ZTE on telecom equipment solutions and on our proven design capabilities, ZTE selected us as a provider of customized module design solutions for their mobile handsets in 2000. Since that time, total net revenue from ZTE has grown from RMB10.0 million in 2001 to RMB82.8 million ($10.0 million) in 2004.
We have also been able to leverage our relationship with TCL as a provider of customized mobile handset module design solutions to become a provider of similar solutions for their digital consumer electronics products. Based on our existing working relationships and enhanced R&D effort in the digital consumer electronics products end-market, we began to provide TCL with customized module design solutions for DTV in the first quarter of 2005.
Development of collaborative relationships with key component suppliers. We have grown our business through collaborating with our key component suppliers and incorporating our suppliers’ technology components into our module reference designs to provide solutions for different OEM customers with different needs. For example, demand for flash memory integrated circuits has increased as the need for high volume storage has grown rapidly due to the more advanced data services offered over wireless networks onto mobile handsets. We developed a customized storage module by incorporating one supplier’s flash memory products, customized for each customer according to their varying design criteria. Through this approach, we were able to custom-design each module to provide optimal functionality to a variety of different OEM customers. Our ability to bring this solution to each of these OEM customers:
| Ø | allowed our customers to optimize their mobile handsets with enabling flash memory technology in a fast and cost-efficient fashion; |
| Ø | allowed this supplier to begin to penetrate the China market and these specific OEM customers, without having to design and manufacture separate flash memory products; and |
| Ø | reinforced and broadened our relationship with this key component supplier. |
SALES AND MARKETING
We generate sales of our customized module design solutions through our direct sales force, consisting of approximately 30 sales directors, account managers and sales support staff at March 31, 2005. Our sales directors are responsible for establishing sales strategy and setting objectives for specific customer accounts. Each account manager is dedicated to a specific customer account and is responsible for the day-to-day management of that customer relationship. Account managers work closely with customers and, in many cases, provide on-site support. Account managers often attend our customers’ internal meetings related to production, engineering design and quality assurance to ensure that our customers’ expectations are appropriately interpreted and communicated to our operations group, and ultimately met or exceeded throughout the design process. Account managers also work with our customers to identify and meet their cost and design-to-delivery cycle time objectives.
Our new business development account managers initiate and maintain long-term, multi-level relationships with customer accounts and work closely with customers on new business opportunities throughout the design-to-delivery cycle.
56
Table of Contents
Our business
OUR CUSTOMERS
Our customer base has grown to over 200 customers over the last three years. In addition to many of the largest China-based manufacturers of mobile handsets, telecom equipment and digital consumer electronics products, our customers include industry participants supporting these OEMs, such as subsystem designers and contract manufacturers in China, as well as international manufacturers who have begun to manufacture end-products in China for the domestic and international market. Our largest customer in the mobile handset segment has been TCL, which is one of China’s largest domestic mobile handset manufacturers. Our top two revenue producing customers from the telecom equipment industry since 2003 have been Huawei and ZTE, China’s two largest telecom equipment manufacturers. During 2004, Huawei, ZTE and UTStarcom, another major telecom equipment producer in China, each accounted for more than 10% of our net revenue and collectively accounted for 36% of our net revenue. In the first quarter of 2005, only Huawei represented more than 10% of our revenues for the period.
As of December 31, 2004, our five largest customers by end-market are:
| Ø | Mobile Handset Manufacturers—Lenovo, Ningbo Bird Co. Ltd., TCL, UTStarcom and ZTE. |
| Ø | Telecom Equipment Manufacturers—Datang Telecom and Technology Co. Ltd., Huawei, Lucent Technologies Inc., UTStarcom and ZTE. |
| Ø | Digital Consumer Electronics Manufacturers—Haier, Konka, Lenovo, TCL and UTStarcom. |
For the fiscal year 2004, our top 10 customers in terms of net revenue were as follows:
| 2004 | 2004 | |||||
| Customer Name | Net Revenue (in millions) | Percentage of Net Revenue (%) | ||||
ZTE | RMB | 82.8 | 13.2 | % | ||
UTStarcom | 76.1 | 12.2 | ||||
Huawei | 71.0 | 11.3 | ||||
Konka | 37.0 | 6.0 | ||||
Jabil Circuit Shanghai Ltd. | 26.9 | 4.3 | ||||
TCL | 23.3 | 3.7 | ||||
Guangzhou Soutec Group Technology Co., Ltd. | 15.5 | 2.5 | ||||
Guangzhou Kyokuto Electronics Ltd. | 12.1 | 1.9 | ||||
Foxconn Electronics Inc. | 11.5 | 1.8 | ||||
Wuxi Zhongxing Optoelectronics Co. Ltd. | 11.5 | 1.8 | ||||
Total | RMB | 367.7 | 58.0 | % | ||
OUR SUPPLIERS
We develop our customized module design solutions based on technology components provided by key technology and other suppliers in our target end-markets. We work with a select list of more than 30 key suppliers globally, including:
| Supplier Name | Product | |
Broadcom | DTV | |
JDS Uniphase | Optoelectronic components | |
Matsushita | Switches, connectors, relay | |
M-Systems Flash Disk Pioneers Ltd. | Flash memory | |
Pixelplus Semiconductor, Inc. | CMOS sensors | |
Sambu Communics Co., Ltd. | Speakers |
During 2004, based on cost, we purchased approximately 52% and 24% of the components sold to our customers from Matsushita and from JDS Uniphase, respectively. We have established long-standing relationships with our key suppliers. For example, we have worked with Matsushita since our inception
57
Table of Contents
Our business
in 1995. While we depend on our key suppliers, we believe that we can find alternate suppliers within a reasonable amount of time without significantly altering our proposed solutions. For further information concerning our reliance on Matsushita and other key suppliers, see “Risk factors—Reliance on our suppliers, with whom we often do not have long-term supply agreements, makes us vulnerable to the loss of one or more key suppliers or the delivery capabilities of our suppliers.”
OUR COMPETITORS
We believe that the principal competitive factors affecting the markets for our customized module design solutions include:
| Ø | understanding our customers’ time-to-market, technology and cost requirements; |
| Ø | access to technology providers; |
| Ø | pricing and efficiency; |
| Ø | design capabilities; |
| Ø | customer relationships; and |
| Ø | technical support. |
We believe that we compete favorably with respect to each of these criteria. In addition, while we do not believe that there are any direct competitors of any meaningful size that operate using the same business model as ours, we face indirect competition from the following:
Other technology component suppliers. For each project, we work with suppliers to compete against other technology component suppliers. Consequently, we indirectly compete against our suppliers’ competitors. For example, by working with JDS Uniphase, we compete indirectly against companies such as Avanex and Bookham in supplying optical transmission module designs.
Component manufacturers and distributors. We compete indirectly with component manufacturers such as Vishay Intertechnology and Epcos, and component distributors such as Arrow Electronics, Avnet and Memec, which may seek to expand their product/service offerings to include customized module design solutions. We believe that these large component manufacturers and distributors have not historically engaged in customized module design, and therefore we believe that it is not one of their core competencies.
OUR INTELLECTUAL PROPERTY
We currently have five issued utility patents relating to our lightning surge protection for network products and a ceramic-to-steel adhesive application. Historically, we have derived a small percentage of our net revenue from our proprietary products. However, a component of our growth strategy is to begin to develop proprietary solutions in-house, specifically integrated circuits and application software design, and to make strategic investments in, form strategic alliances with or acquire companies that possess complementary design capabilities and technology. Therefore, we expect that proprietary intellectual property will become increasingly important to our business.
EMPLOYEES
As of March 31, 2005, we had approximately 120 employees, approximately 40 of whom perform research and development related activities.
58
Table of Contents
Our business
We make contributions for most of our employees in the PRC to retirement benefits based on their salaries and length of service upon retirement in accordance with a PRC government-managed retirement plan. The PRC government is directly responsible for the payments of benefits to these retired employees. We are required to make contributions to the government-managed retirement plan at specified rates of the salaries, bonuses and certain allowances of our employees, up to a maximum amount specified by the local government from time to time.
Our future success will depend, in part, on our ability to continue to attract, retain and motivate highly qualified technical, marketing and management personnel, for whom competition is intense. Our employees are not covered by any collective bargaining agreement and we have never experienced a work stoppage. We believe we enjoy good relations with our employees.
PROPERTIES
We lease properties with a total area of approximately 52,000 square feet in six locations in China including Shenzhen, Shanghai, Beijing, Wuhai, Qingdao and Hong Kong. Approximately 8,000 square feet is for our corporate headquarters located in Shenzhen, approximately 7,000 square feet is for our research and development centers in Shenzhen and Shanghai, approximately 20,000 square feet is for our representative offices located in the other six cities, and approximately 13,000 square feet is used for manufacturing of our proprietary lightning protection product for wireless base stations. Approximately 4,000 square feet of space was also recently leased from a related party to be used as a research and development center, as described in “Related party transactions.” These leases have remaining terms ranging from one to 36 months.
As described under “Related party transactions—Commercial Transactions,” in 2001, we purchased a small office suite located in Shenzhen from Matsunichi Electronics, an affiliate owned by our principal shareholder and chief executive officer, Mr. Jeffrey Kang.
We believe that our existing facilities and equipment are well maintained and in good operating condition, and are sufficient to meet our needs for the foreseeable future.
LEGAL PROCEEDINGS
We claimed several refunds from the Italian government on corporate taxes paid by OAM, our 98.6% owned Italian subsidiary, during the 1970s and early 1980s. In one instance, the Italian tax authorities counterclaimed, assessing additional unpaid taxes due by OAM. A hearing of the Italian General Tax Committee was held on March 22, 2005, and on April 7, 2005, the appeal by the Italian tax authorities was rejected. We are not aware of any further claims by the Italian tax authorities.
We have received a draft complaint threatening an action for damages arising from alleged breaches of fiduciary duties in connection with transactions involving Centerpoint Corporation and Bion Environmental Technologies, Inc. The transactions took place before the consummation of our share exchange agreement with Trident, at a time when Trident and our subsidiary, OAM, owned a majority of the shares of Centerpoint. We are named as a potential defendant in the draft complaint, together with OAM, and Mark Hauser and Mark Segall, who are current members of our board of directors, and other individuals and entities associated with Trident. The draft complaint is said to be on behalf of Centerpoint and a class of Bion shareholders, and alleges that the potential defendants controlled the affairs of Centerpoint, and used their positions, among other things, to divert Centerpoint assets to themselves. We are investigating the allegations made in the draft complaint, which seeks damages in an unspecified amount. Should any formal legal proceedings be instituted, we intend to vigorously defend ourself, although we cannot predict the outcome of any possible legal proceedings.
Except as described above, we are not currently involved in any material litigation. From time to time, we may be also involved in litigation arising in the normal course of our business.
59
Table of Contents
DIRECTORS AND EXECUTIVE OFFICERS
The following table sets forth information about our directors and executive officers as of March 31, 2005.
| Name | Age | Position | ||
Jeffrey Kang | 35 | Chief Executive Officer, President and Chairman of the Board | ||
Li Zhou | 39 | Chief Technical Officer and Director | ||
Hope Ni | 32 | Chief Financial Officer and Secretary | ||
Amy Kong(1)(2)(3) | 49 | Director | ||
Q.Y. Ma(1)(2)(3) | 48 | Director | ||
Frank Zheng(1)(2)(3) | 38 | Director | ||
Mark S. Hauser | 47 | Director | ||
Mark B. Segall | 42 | Director |
| (1) | Member of the audit committee. |
| (2) | Member of the nominating and corporate governance committee. |
| (3) | Member of the compensation committee. |
Jeffrey Kang, Chairman of the Board, President and Chief Executive Officer. Mr. Kang was a co-founder of Comtech and has served as our chief executive officer, president and chairman of the board since September 1999. Mr. Kang founded Shenzhen Matsunichi Electronics Co., Ltd. and Matsunichi Electronic (Hong Kong) Limited, the predecessor to Comtech Cayman, in 1995, when Matsunichi commenced operations as a distributor for Matsushita. In 1999, Mr. Kang formed Comtech Cayman and transferred all operations and assets of Matsunichi into the Comtech Cayman. Prior to forming Matsunichi, Mr. Kang worked for Matsushita Electronics from June 1992 to July 1995 where he was responsible for selling components to the telecom industry within China. From 1998 to 1999, Mr. Kang was vice president of Shenzhen SME (Small and Medium Enterprises) Association, a non-profit association in Shenzhen. Mr. Kang earned a B.S. degree in Electrical Engineering from South China Technology University in Guangzhou, China.
Li Zhou, Chief Technical Officer and Director. Prior to joining us in November 2003 as our chief technology officer, Mr. Zhou served as chief technology officer of HTW China, the largest personal digital assistant supplier in China, from October 2000 to December 2002. Previously, he worked for Microsoft Corporation in Redmond, Washington from 1991 to 1998, and in Beijing, China from 1998 to 2000, where he held various positions including group manager of Microsoft’s embedded systems. Mr. Zhou earned an M.S. degree in computer science from Michigan State University after completing a B.S. and an M.S. degree in computer science from Zhejiang University in China.
Hope Ni, Chief Financial Officer and Secretary. Prior to joining us in August 2004 as our chief financial officer, Ms. Ni spent six years as a practicing attorney at Skadden, Arps, Slate, Meagher & Flom LLP in New York and Hong Kong, specializing in corporate finance. Prior to that, Ms. Ni worked at Merrill Lynch, investment banking division in New York. Currently, Ms. Ni is a member of the investment committee of Time Innovation Ventures, a venture capital firm focused on funding technology start-ups and joint ventures in China. Ms. Ni also serves on the board of Qianjia Consulting Company, which she founded in 2002. Ms. Ni received her J.D. degree from University of Pennsylvania Law School and her B.S. degree in Applied Economics and Business Management from Cornell University.
60
Table of Contents
Management
Amy Kong, Director. Ms. Kong has been a director since July 2004. Ms. Kong founded Primustech Ventures (HK) Limited, a private equity investment firm focused on Greater China, and has been its chief executive officer since 2000. Ms. Kong invested in a number of private equity projects in the areas of document management, professional training and education, medical waste management, medical devices, consumer electronics and information technology consulting. From 1999 to 2000, Ms. Kong served as interim chief executive officer of Cyber City International, a Shenzhen-based company. In 1996, Ms. Kong founded GTF Asset Management for the Gajah Tunggal Group, an $800 million global asset management company. Ms. Kong received a B.A. degree from Princeton University and an M.B.A. degree from New York University.
Q.Y. Ma, Director. Dr. Ma has been a director since December 2004. Dr. Ma has been the managing director of Time Innovation Ventures, a venture capital firm, since 2000, and has served as a professor of electrical engineering at the University of Hong Kong since 1998. Dr. Ma was an associate professor at the Columbia University from 1994 to 2000. He has also served as a technology consultant to IBM, General Electric, TRW Inc. and DuPont. Dr. Ma is a co-founder and advisor of Semiconductor Manufacturing International Corp., and has served as an adviser to the Ministry of Information Industry, Beijing Government, and a senior advisor to Zhangjiang Hi-Tech Park in Shanghai. Dr. Ma received his Ph.D. from Columbia University, and attended the Executive Program of Stanford University’s School of Business.
Frank Zheng, Director. Mr. Zheng has been a director since January 2005. He has been the vice president of travel service for eLong, Inc., a leading online travel service company in China, since May 2000. Mr. Zheng is responsible for the overall operation of eLong’s travel services. Before he joined eLong, Mr. Zheng was a senior director of travel services with Asia.com. From 1994 through 2000, Mr. Zheng held various financial and operations positions with Bank of New York, The Reserve Management Corp, and Dean Witter Intercapital Company. Mr. Zheng received a B.B.A degree in Accounting from City University of New York.
Mark S. Hauser, Director. Mr. Hauser has been a director since May 1997. He served as president and chief executive officer or joint chief executive officer of Trident from March 1998 until the consummation of the share exchange on July 22, 2004. Since July 2000, Mr. Hauser has also been a managing director of FdG Associates, a middle-market private equity fund based in New York. Prior to that, he was an attorney and a founder and managing director of Tamarix Capital Corporation, a New York-based merchant and investment banking firm. Mr. Hauser received his undergraduate degree from Sydney University and an LLM from London School of Economics.
Mark B. Segall, Director. Mr. Segall has been a director since December 1999. He served as non-executive secretary of Trident from December 1999 until the consummation of the share exchange on July 22, 2004. Mr. Segall is the founder and chief executive officer of Kidron Corporate Advisors LLC, a mergers and acquisitions and corporate advisory boutique for emerging growth companies. Prior to founding Kidron in 2003, Mr. Segall was the chief executive officer of Investec Inc., the U.S. investment banking operations of the South African based Investec Group. While at Investec, Mr. Segall also served as general counsel and senior vice president of Investec Ernst & Company, the U.S. securities and clearing operations of Investec. Prior to joining Investec in 1999, he was a partner at Kramer Levin Naftalis & Frankel LLP, a New York law firm. Mr. Segall is a director and audit committee member of Greg Manning Auctions Inc., and a director of Gurunet Corporation and Integrated Asset Management. Mr. Segall received a B.A. degree from Columbia University and a J.D. degree from New York University.
61
Table of Contents
Management
BOARD PRACTICES
Our business and affairs are managed under the direction of our board of directors. The primary responsibilities of our board of directors are to provide oversight, strategic guidance, counseling and direction to our management. It is our expectation that the board of directors will meet regularly on a quarterly basis and additionally as required.
BOARD COMMITTEES
Our board of directors has an audit committee, a nominating and corporate governance committee, and a compensation committee. Our board of directors has determined that Amy Kong, Frank Zheng and Q.Y. Ma, the members of these committees, are “independent directors” under the current independence standards of Nasdaq Marketplace Rule 4200(a)(15) and meet the criteria for independence set forth in Rule 10A-3(b)(1) of the Securities Exchange Act of 1934, as amended, or the Exchange Act. Our board of directors has also determined that these persons have no material relationships with us—either directly or as a partner, shareholder or officer of any entity—which could be inconsistent with a finding of their independence as members of our board of directors.
Audit Committee
The audit committee, consisting of Ms. Kong and Messrs. Ma and Zheng, oversees our financial reporting process on behalf of the board of directors.
The responsibilities of our audit committee include the following functions:
| Ø | approve and retain the independent auditors to conduct the annual audit of our books and records; |
| Ø | review the proposed scope and results of the audit; |
| Ø | review and pre-approve the independent auditors’ audit and non-audit services rendered; |
| Ø | approve the audit fees to be paid; |
| Ø | review accounting and financial controls with the independent auditors and our financial and accounting staff; |
| Ø | review and approve transactions between us and our directors, officers and affiliates; and |
| Ø | recognize and prevent prohibited non-audit services. |
Our board of directors has determined that Ms. Kong, the Chairperson of the Audit Committee, is an “audit committee financial expert” as defined by the SEC’s rules.
Nominating and Corporate Governance Committee
The nominating and corporate governance committee, consisting of Ms. Kong and Messrs. Ma and Zheng, is responsible for identifying potential candidates to serve on our board and its committees.
The responsibilities of our nominating and corporate governance committee include for the following functions:
| Ø | making recommendations to the board regarding the size and composition of the board; |
| Ø | identifying and recommending to the board nominees for election or re-election to the board, or for appointment to fill any vacancy; |
| Ø | establishing procedures for the nomination process; |
62
Table of Contents
Management
| Ø | advising the board periodically with respect to corporate governance matters and practices, including periodically reviewing corporate governance guidelines to be adopted by the board; and |
| Ø | establishing and administering a periodic assessment procedure relating to the performance of the board as a whole and its individual members. |
Compensation Committee
The compensation committee, consisting of Ms. Kong and Messrs. Ma and Zheng, is responsible for making recommendations to the board concerning salaries and incentive compensation for our officers and employees and administering our stock option plans.
The responsibilities of our compensation committee include the following functions:
| Ø | reviewing and recommending policy relating to the compensation and benefits of our officers and employees, including reviewing and approving corporate goals and objectives relevant to the compensation of our chief executive officer and other senior officers; evaluating the performance of these officers in light of those goals and objectives; and setting compensation of these officers based on such evaluations; |
| Ø | administering our benefit plans and the issuance of stock options and other awards under our stock option plans; and reviewing and establishing appropriate insurance coverage for our directors and executive officers; |
| Ø | recommending the type and amount of compensation to be paid or awarded to members of our board of directors, including consulting, retainer, meeting, committee and committee chair fees and stock option grants or awards; and |
| Ø | reviewing and approving the terms of any employment agreements, severance arrangements, change-of-control protections and any other compensatory arrangements for our executive officers. |
COMPENSATION COMMITTEE INTERLOCKS AND INSIDER PARTICIPATION
No member of our compensation committee has at any time been an officer or employee of ours or our subsidiaries. No interlocking relationship exists between our board of directors or compensation committee and the board of directors or compensation committee of any other company, nor has any interlocking relationship existed in the past.
DIRECTOR COMPENSATION
Our non-employee directors receive compensation in the form of cash and stock options for serving on our board. For 2004, each non-employee director received options to purchase 5,000 shares of our common stock at an exercise price of $3.74 per share, which the board determined to be the fair market value of the stock on the date of the grant and which vested fully on December 31, 2004, as well as $2,000 cash. For 2005, each non-employee director receives annually $4,000 in cash and a grant of options to purchase 10,000 shares of our common stock. The members of our audit committee receive a grant of options to purchase 5,000 shares of common stock each year, with the Chairman of the audit committee receiving an additional grant of options to purchase 2,500 shares of common stock. The members of each of our compensation committee and nominating and corporate governance committee receive a grant of options to purchase 2,500 shares of common stock per year. All of the options granted to the directors will vest quarterly during the year following the date of grant. The exercise price for
63
Table of Contents
Management
these director options granted is $3.74 per share. If a non-employee director ceases to act as a board member or to serve on a committee, he or she will be entitled to all vested options; unvested options will be forfeited.
On January 19, 2005, our board of directors adopted similar director compensation resolutions relating to our two newly appointed directors, Q.Y. Ma and Frank Zheng, with the exception that the options granted to them for 2005 have an exercise price of $5.50 per share, which the board determined to be the fair market value of the stock on the date of the grant.
Each non-employee director who becomes a director after the grant of options is entitled to receive options on a pro rata basis for the portion of the period for which they will serve. All of the options granted to the incoming directors will be exercisable at the fair market value on the date of grant and will vest quarterly during the remainder of the period following the close of grant.
CODE OF ETHICS
On November 4, 2004, we adopted a Code of Business Conduct and Ethics that applies to our directors, officers and employees, including our chief executive officer and chief financial officer—our principal executive officer and principal financial and accounting officer, respectively. This code is filed as Exhibit 14.1 to our Form 10-K for the year ended December 31, 2004, which was filed with the SEC on March 31, 2005.
EXECUTIVE COMPENSATION
The following summary compensation table sets forth the aggregate compensation awarded to, earned by, or paid to the chief executive officer and the other executive officers at December 31, 2004, whose annual cash compensation exceeded $100,000 for the fiscal year ended December 31, 2004:
Summary Compensation Table
| Year | Annual Compensation | Other Annual Compensation ($) | Long Term Compensation Awards | Payouts | All Other Compen- sation ($) | |||||||||||
| Name and Principal Position | Salary ($) | Bonus ($) | Restricted Stock Award(s) (#) | Securities Underlying Options (#) | LTIP Payouts ($) | |||||||||||
Jeffrey Kang, Chairman, Chief Executive Officer and President | 2004 2003 2002 | 22,744 10,590 10,590 | — 416,984 — | — — — | — — — | 500,000 — — | — — — | 967 967 967 | ||||||||
Hope Ni, Chief Financial Officer and Secretary(1) | 2004 | 54,000 | — | — | — | 210,000 | — | — | ||||||||
| (1) | Ms. Ni joined our company in August 2004. Her annual salary is $117,000. |
Mr. Kang is entitled to retirement benefits under a PRC government-managed retirement plan, described in note 16 to our consolidated financial statements included elsewhere in this prospectus. Expenses related to Mr. Kang’s participation in the PRC government managed retirement plan amounted to approximately RMB8,000 ($967), RMB8,000 and RMB8,000 for the years ended December 31, 2004, 2003 and 2002, respectively. Ms. Ni is not entitled to any benefits under PRC or Hong Kong government managed retirement plans.
64
Table of Contents
Management
Option Grants In Last Fiscal Year
The following table summarizes options granted during the year ended December 31, 2004 to the named executive officers:
| Individual Grants | Potential Realizable Value | ||||||||||||||
Number of Granted | % of Total Options Granted to Employees In 2004 Fiscal Year | Exercise Price | Expiration Date | Assumed Annual Rates of Appreciation for Option(1) | |||||||||||
| Name | 5% | 10% | |||||||||||||
| (in thousands) | |||||||||||||||
Jeffrey Kang | 500,000 | 27.4 | % | 3.74 | 2014 | $ | 1,176 | $ | 2,980 | ||||||
Hope Ni | 210,000 | 11.5 | % | 3.00 | 2014 | $ | 465 | $ | 1,113 | ||||||
| (1) | The amounts shown as potential realizable value represent hypothetical gains that could be achieved for the respective options if exercised at the end of the option term. The 5% and 10% assumed annual rates of compounded stock price appreciation are mandated by rules of the SEC and do not represent our estimate or projection of our future common stock prices. These amounts represent certain assumed rates of appreciation in the value of our common stock from the fair market value on the date of grant. Actual gains, if any, on stock option exercises are dependent on the future performance of the common stock and overall stock market conditions. The amounts reflected in the table may not necessarily be achieved. |
Aggregate Option Exercises In Last Fiscal Year And Fiscal Year-End Option Values
The following table provides option exercise information for the named executive officers during 2004. During the fiscal year ended December 31, 2004, no stock options were exercised by any named executive officer. The table shows the number and value of exercisable and unexercisable options held at December 31, 2004. The “Value Realized” shown in the table represents an amount equal to the difference between the market price of the shares purchased on the exercise dated and the option exercise price, multiplied by the number of shares acquired on exercise. The “Value of Unexercised In the Money Options at Fiscal Year-End” shown in the table represents an amount equal to the difference between the market price of the shares on December 31, 2004 and the option exercise price, multiplied by the number of exercisable and unexercisable options held at December 31, 2004. These calculations do not take into account the effect of any taxes that may be applicable to the option exercises.
| Shares Acquired on Exercise | Value Realized | Number of Unexercised Options at Fiscal Year-End | Value of Unexercised In-the-Money Options at Fiscal Year End | |||||||||||
| Name and Principal Position | Exercisable | Unexercisable | Exercisable | Unexercisable | ||||||||||
| (in thousands) | ||||||||||||||
Jeffrey Kang | — | — | — | 500,000 | — | $ | 780,000 | |||||||
Hope Ni | — | — | 32,813 | 177,187 | $ | 75,470 | $ | 407,530 | ||||||
2004 Incentive Stock Option Plan and 1995 Directors’ Plan
On August 3, 2004, our board of directors adopted the Comtech Group, Inc. 2004 Incentive Stock Option Plan, or the Incentive Plan, under which 2,500,000 shares of common stock are reserved for
65
Table of Contents
Management
issuance upon exercise of stock options, and for the issuance of stock appreciation rights, restricted stock awards and performance shares. The purpose of this Incentive Plan is to provide additional incentive to employees, directors, advisors and consultants by facilitating their acquisition of our common stock. The Incentive Plan provides for a term of 10 years from the date of its adoption by the board of directors, after which no awards may be made, unless the Incentive Plan is earlier terminated by the board. Options granted under the Incentive Plan are either incentive stock options (i.e., options that afford favorable tax treatment to recipients upon compliance with certain restrictions pursuant to Section 422 of the Internal Revenue Code and that do not result in tax deductions to us unless participants fail to comply with Section 422 of the Internal Revenue Code) or options that do not so qualify. We intend to seek shareholder approval of the Incentive Plan.
Our board of directors determines when options under the Incentive Plan are exercisable and the option exercise price. The Incentive Plan permits options to be exercised with cash, check, certain other shares of our common stock, consideration received by us under “cashless exercise” programs, or if permitted by our board of directors, promissory notes or other property. Our board of directors also determines: the performance goals and performance period for performance shares; the purchase price and conditions of repurchase for restricted stock; and the terms of stock appreciation rights. Our board of directors may at any time accelerate the vesting of any outstanding award. In the event we are sold, merged, consolidated, reorganized or liquidated, our board of directors may take any of the following actions as to outstanding awards: (a) provide that the successor will assume or substitute for the awards; (b) provide that all unexercised options and stock appreciation rights shall terminate immediately prior to the consummation of the transaction if not previously exercised; (c) in the event of a sale where the common shareholders receive cash for their shares, provide that each outstanding vested option and stock appreciation right will be exchanged for a payment in cash equal to the excess of the sales price over the exercise price; and (d) make such other adjustments deemed necessary to provide participants with a benefit substantially similar to which they would have been entitled had the event not occurred. In the event of any stock dividend, split, recapitalization or other similar change, our board of directors may adjust the number and kind of shares subject to outstanding awards, the exercise or purchase price of awards, and any other equitable adjustments it deems appropriate.
In 1995, the Trident board of directors adopted, and the shareholders approved, the 1995 Stock Option Plan for Outside Directors, or the Directors’ Plan, under which 5,000 options would be granted annually to each non-employee director of Trident for each full fiscal year of service on the board. The Directors’ Plan will expire on December 31, 2005. The options exercisable under the Directors’ Plan terminate on July 1, 2009. We do not intend to issue any additional options under this Directors’ Plan.
The Incentive Plan and the Directors’ Plan are administered by the compensation committee of our board of directors. The compensation committee selects the employees to whom awards are to be granted, the number of shares to be subject to such awards, and the terms and conditions of such awards, provided that any discretion exercised by the compensation committee must be consistent with resolutions adopted by our board of directors and the terms of the Incentive Plan.
As of May 31, 2005, options to purchase an aggregate of 2,252,500 shares had been granted under the Incentive Plan, and options to purchase an aggregate of 115,000 shares had been granted under the Directors’ Plan.
66
Table of Contents
Management
Equity Compensation Plan Information
The following table sets forth aggregate information regarding our equity compensation plans in effect as of December 31, 2004.
| Plan category | Number of securities to be issued upon exercise of outstanding options/warrants | Weighted-average exercise price of outstanding options/warrants | Number of securities remaining available for future issuance under equity compensation plans | ||||||
Equity compensation plans approved by security holders | 115,000 | $ | 3.00 | 22,083 | (1) | ||||
Equity compensation plans not yet approved by security holders | 1,900,000 | (2) | 3.66 | 600,000 | |||||
Total | 2,015,000 | $ | 3.62 | 622,083 | |||||
| (1) | We do not intend to grant further options under this plan. |
| (2) | During the quarter ended March 31, 2005, we issued an additional 30,000 options under our Incentive Plan, with an additional 322,500 options being granted in May 2005. |
Employment Contracts, Termination Of Employment And Change-In-Control Arrangements
On August 1, 2004, we entered into an employment agreement with Hope Ni to serve as our chief financial officer and secretary. The employment agreement terminates on December 31, 2007, but will be automatically extended unless either we give Ms. Ni notice prior to her termination date or Ms. Ni gives written notice of 30 days to us of her election not to extend. Under the terms of the agreement, Ms. Ni receives a base salary of $117,000 per annum and was granted 10-year options to purchase a total of 210,000 shares of our common stock at an exercise price of $3.00, which options vest in various installments through August 1, 2007. In the event we engage in an underwritten offering of shares of common stock which yields gross proceeds to us in excess of $30 million, all of Ms. Ni’s stock options will accelerate and become fully vested.
If we terminate Ms. Ni’s employment without cause, or she resigns for good reason, Ms. Ni will receive termination benefits, including the payment of a lump sum amount equal to three times Ms. Ni’s monthly salary in effect immediately prior to her termination and payment of all premiums due for health insurance for a period of six months after termination.
If a change in control occurs prior to December 31, 2007 and we subsequently terminate Ms. Ni’s employment without cause, or if she resigns for good reason prior to the date that our board of directors certifies our audit for the first complete fiscal year after the change in control, which we refer to as the Change in Control Audit Date, Ms. Ni will be entitled to receive standard termination benefits and a payment equal to the greater of (a) six times her monthly salary or (b) 12 months salary less compensation paid to her between the date of the change in control and the date of termination. If the change in control occurs prior to December 31, 2007 and we terminate Ms. Ni’s employment without cause, or if she resigns for good reason after the Change in Control Audit Date, Ms. Ni would be entitled to the same termination benefits she would have received had a change in control not occurred and we terminated her employment without cause or she resigned for good reason. Upon a change in control, Ms. Ni’s stock options will accelerate and be deemed fully vested. If Ms. Ni’s employment is terminated after the Change in Control Audit Date, other than as a result of her resignation, Ms. Ni will have the right to exercise all of her stock options. If Ms. Ni resigns prior to the Change in Control Audit Date, notwithstanding the acceleration of vesting of the stock options on a change in control, Ms. Ni shall have the right to exercise a specified number of shares at a price to be determined under the terms of the agreement at the time of her resignation. For purposes of Ms. Ni’s employment agreement, a “change in control” means the consummation of a reorganization, merger of consolidation of us with one or more other persons.
67
Table of Contents
Principal and selling shareholders
The following table sets forth as of March 31, 2005 information about the beneficial ownership of our common stock by:
| Ø | each person, or group of persons, who beneficially owns more than 5% of our capital stock; |
| Ø | each of our directors; |
| Ø | each named executive officer; |
| Ø | all directors and executive officers as a group; and |
| Ø | other selling shareholders. |
Unless otherwise indicated, the address for each person or entity is Suite 1001, Tower C, Skyworth Building, High-Tech Industrial Park, Nanshan, Shenzhen 518057, PRC.
| Name of Beneficial Owner | Number of shares prior to this offering | Shares being sold in this offering | Shares beneficially owned after this offering** | |||||||||
| Directors and executive officers | ||||||||||||
Jeffrey Kang | 18,547,655 | (2) | 72.6 | % | ||||||||
Hope Ni | 59,061 | (3) | * | |||||||||
Amy Kong | 10,625 | (4) | * | |||||||||
Q.Y. Ma | 5,000 | (5) | * | |||||||||
Li Zhou | 10,416 | (6) | * | |||||||||
Mark S. Hauser | 347,799 | (7) | 1.4 | |||||||||
Mark B. Segall | 98,750 | (8) | * | |||||||||
Frank Zheng | 2,500 | (9) | * | |||||||||
All executive officers and directors as a group (8 persons) | 19,081,806 | 74.7 | ||||||||||
Principal and selling shareholders | ||||||||||||
Yang Shi | 2,044,549 | (10) | 8.0 | |||||||||
Nan Ji | 13,163,199 | (11) | 51.6 | |||||||||
Comtech Global Investment Ltd. | 13,163,199 | (12) | 51.6 | |||||||||
Ren Investment International Ltd. | 4,937,917 | (13) | 19.3 | |||||||||
Purple Mountain Holding, Ltd. | 1,620,086 | (14) | 6.3 | |||||||||
| * | Represents beneficial ownership of less than one percent of our outstanding shares. |
| ** | Assumes full exercise of underwriters’ over-allotment option and is based on shares of our common stock outstanding after this offering. |
| (1) | Beneficial ownership is determined in accordance with the rules and regulations of the SEC. In computing the number of shares beneficially owned by a person and the percentage ownership of that person, shares of common stock subject to options held by that person that are currently exercisable or exercisable with 60 days of the date hereof are deemed outstanding. Such shares, however, are not deemed outstanding for the purposes of computing the percentage ownership of any other person. Except as indicated in the footnotes to the following table or pursuant to applicable community property laws, each shareholder named in the table has sole voting and investment power with respect to the shares set forth opposite such shareholder’s name. The percentage of beneficial ownership is based on 25,532,898 shares of common stock outstanding as of March 31, 2005. |
(footnotes continued on following page)
68
Table of Contents
Principal and selling shareholders
| (2) | Includes (a) 41,666 shares issuable upon exercise of currently exercisable stock options, (b) 13,163,199 shares beneficially owned by Comtech Global Investment Ltd., over which Mr. Kang and his wife, Ms. Nan Ji, share voting and investment power and (c) 5,342,790 shares beneficially owned by Ren Investment International Ltd., over which Mr. Kang, as sole director, has sole voting and investment power. Mr. Kang does not have an economic interest in any shares of Ren Investment International Ltd. Mr. Kang owns a 29% interest and Ms. Nan Ji a 71% interest in Comtech Global Investment Ltd. The directors of Comtech Global Investment Ltd. are Mr. Kang, his brother Kang Yi and Yang Shi, a major shareholder and co-founder of our company. |
| (3) | Represents shares issuable upon exercise of currently exercisable stock options. |
| (4) | Represents shares issuable upon exercise of currently exercisable stock options. Does not include shares held by Ren Investment International Ltd., in which Ms. Kong owns less than a 1% interest. Ms. Kong disclaims beneficial ownership of such shares. |
| (5) | Represents shares issuable upon exercise of currently exercisable stock options. |
| (6) | Represents shares issuable upon exercise of currently exercisable stock options. Does not include shares held by Ren Investment International Ltd., in which Mr. Zhou has an approximate 3.7% interest. Mr. Zhou disclaims beneficial ownership of such shares. |
| (7) | Includes (a) warrants to purchase 234,166 shares and (b) 8,750 shares issuable upon exercise of currently exercisable stock options. |
| (8) | Includes (a) 23,750 shares issuable upon exercise of currently exercisable stock options and (b) warrants to purchase an aggregate of 75,000 shares issued to Kidron Corporate Advisors LLC, an affiliate of Mr. Segall. |
| (9) | Represents shares issuable upon exercise of currently exercisable stock options. |
| (10) | Represents Mr. Yang’s proportionate interest in the 4,937,917 shares held by Ren Investment International Ltd., in which Mr. Yang has an approximately 41.4% interest. Mr. Yang disclaims beneficial ownership of such shares. |
| (11) | Represents 13,163,199 shares beneficially owned by Comtech Global Investment Ltd., over which Mr. Kang and his wife, Ms. Nan Ji, share voting and investment power. Mr. Kang owns a 29% interest and Ms. Nan Ji a 71% interest in Comtech Global Investment Ltd. The directors of Comtech Global Investment Ltd. are Mr. Kang, his brother Kang Yi and Yang Shi, a major shareholder and co-founder of our company. |
| (12) | Mr. Kang owns a 29% interest and Ms. Nan Ji a 71% interest in Comtech Global Investment Ltd. The directors of Comtech Global Investment Ltd. are Mr. Kang, his brother Kang Yi and Yang Shi, a principal shareholder and co-founder of our company. |
| (13) | Apart from Yang Shi, none of the other shareholders of Ren Investment International Ltd. beneficially own more than 5% of our outstanding shares. |
| (14) | All shares held by Purple Mountain Holding, Ltd. are beneficially owned by Justin Tang, the chairman and chief executive officer of eLong, Inc. The address for Purple Mountain Holding, Ltd. is 3rd Floor, Qwomer Complex, P.O. Box 765, Road Town, Tortola, British Virgin Islands. |
69
Table of Contents
SHARE EXCHANGE AGREEMENT
On May 25, 2004, Trident, a public company that ceased operations in 2000, entered into a share exchange agreement with Comtech Cayman and Comtech Cayman’s shareholders, which were Comtech Global Investment Ltd., Purple Mountain Holding Ltd., and Ren International Investment Ltd. Under the agreement, Trident agreed to acquire all of the issued and outstanding shares of stock of Comtech Cayman in exchange for the issuance in the aggregate of 21,000,000 of Trident’s shares of common stock to Comtech Cayman’s shareholders. The transaction was consummated on July 22, 2004. In accordance with the provisions in the agreement, the number of shares to be issued to Comtech Cayman’s shareholders was adjusted at closing to 20,251,075. As a result of the transaction, Comtech Cayman became a wholly-owned subsidiary of Trident and, upon the issuance of the shares, Comtech Cayman’s shareholders owned approximately 91.2% of all of our issued and outstanding stock. On August 2, 2004, we changed our name from Trident to Comtech Group, Inc.
Trident and its shareholders, Emanuel Arbib, Gianni Bulgari, Mark S. Hauser and Mark B. Segall, and Comtech Cayman’s shareholders executed a stockholders’ agreement, which provided for the designation of Trident shareholder representatives to serve on our board of directors. Under the stockholders’ agreement, until July 22, 2006, the Trident shareholders and Comtech Cayman’s shareholders will be permitted to nominate two and five persons, respectively, to our board of directors at each annual meeting of a shareholders, and will be required to vote their shares of common stock for all such nominees. Currently, Messrs. Hauser and Segall are the representatives of the Trident shareholders on our board of directors.
The terms of the share exchange agreement provide for the issuance of up to 30,173,047 additional shares to Comtech Cayman’s shareholders in the event there is a breach of any representations, warranties, covenants or obligations made by Trident in the share exchange agreement for an amount of damages in excess of $625,000. This indemnification provision expired on April 30, 2005, except in the case of known claims, which will survive until such matters are resolved finally by a court of law. Prior to the expiration of this period, we were notified of a possible claim relating to a transaction entered into by Trident prior to the consummation of the share exchange agreement, as discussed under “Business—Legal Proceedings” that could trigger this indemnification provision. The potential issuance of additional shares of our common stock under this indemnification provision could result in dilution to other shareholders.
SHAREHOLDER LOANS AND FINANCING TRANSACTIONS; DIVIDENDS AND DISTRIBUTIONS
During the year ended December 31, 2003, Comtech Global Investment Ltd., an entity which holds 51.6% of our common stock and is controlled by Jeffrey Kang, our principal shareholder and chief executive officer, and his wife, Nan Ji, made working capital advances to us in the aggregate amount of RMB50.4 million ($6.1 million). In addition, during 2003, we deferred payment of a dividend payable to Comtech Global Investment Ltd. in the amount of RMB41.4 million ($5.0 million). In September 2004, we repaid the zero interest shareholder loan from, and dividends payable to, Comtech Global Investment Ltd. There are no amounts currently outstanding to Comtech Global Investment Ltd.
In July 2004, Comtech Hong Kong entered into a $4.0 million revolving credit facility with the Bank of Communications, Hong Kong branch, which was subsequently increased to $10.0 million on September 14, 2004. The facility is secured by funds on deposit owned by Jeffrey Kang in an amount equal to the outstanding borrowings. The outstanding balance under the facility was RMB23.2 million ($2.8 million) as of December 31, 2004. Any additional draw downs from this facility will require Mr. Kang or other parties to pledge additional funds on deposit with the bank as security to the facility.
70
Table of Contents
Related party transactions
In June 2004, Shenzhen Comtech borrowed for working capital purposes RMB3.6 million ($435,000) from Viewtran Technology Limited, or Viewtran, an entity in which our principal shareholder and chief executive officer, Mr. Kang, has an approximately 6.1% interest and for which he is chairman of the board of directors. The loan was unsecured, non-interest bearing and had no fixed repayment terms. We repaid RMB3.0 million ($362,000) of this loan on June 30, 2004. The balance in the amount of RMB600,000 ($73,000) was outstanding as of December 31, 2004.
Since the time of the share exchange, there have been no dividends or distributions paid to us from entities owned by our affiliates.
COMMERCIAL TRANSACTIONS
In 2001, we purchased a small office suite located in Shenzhen from Matsunichi Electronics, an entity owned by our principal shareholder and chief executive officer, Mr. Kang. The purchase price of RMB1.7 million was based on the carrying value of the property at the time. As at March 31, 2005, there was a unsettled payable to Matsunichi, with no fixed repayment date, amounting to RMB1.6 million in connection with this purchase.
In 2003, we acted as an agent for Viewtran, a technology design firm, for various sales transactions, totaling RMB5.4 million ($0.7 million). The sales transactions made on behalf of Viewtran were for our business promotion purposes. We did not charge Viewtran any service fee since we expected to have further business opportunities with Viewtran at a time when, prior to the share exchange transaction, Comtech Cayman was a private company. We recorded no profit or loss on these transactions. The agreement under which we carried out these transactions expired on December 31, 2003, and has not been renewed.
On April 1, 2005, we entered into an operating lease with a Viewtran with respect to a property to be used for research and development purposes. The property is located at High-tech Industrial Park in Shenzhen, with a total area of approximately 4,000 square feet. The monthly rental is RMB28,000 ($3,400), including property management fee and utility charges, and the lease period ends on March 31, 2006. There are no specific provisions for extending the lease beyond its expiry date, except that at the end of the rental period, we have a priority right to continue leasing the space.
OTHER RELATED PARTY TRANSACTIONS
Mark Segall, one of our directors, is the founder and chief executive officer of Kidron Corporate Advisors LLC, which performed financial advisory services for Trident in 2003 and 2004, for which Kidron received $360,000 in cash, and warrants to purchase (a) 37,500 shares of our common stock at an exercise price of $3.00 per share and (b) 37,500 shares of our common stock at an exercise price of $2.50 per share.
Our principal shareholder and chief executive officer, Mr. Kang, and his wife, Ms. Nan Ji own, for the benefit of Comtech China, all of the equity interest in Shenzhen Comtech, which, in turn, owns 60% equity interest in Shanghai E&T. The equity interest in Shanghai E&T was acquired in January 2004 for RMB1.2 million from the current minority shareholders, Michael Shao and Sun Jun, employees of Shanghai E&T, in order to provide a larger sales force, advanced technology know-how and a potential customer base in Shanghai. The registered capital of Shanghai E&T was RMB2 million. While we do not have any equity interest in Shenzhen Comtech, through contractual agreements among Comtech China, Mr. Kang and his wife, Ms. Nan Ji, we enjoy voting control over and are entitled to all economic interests associated with Mr. Kang’s and his wife’s equity interest in Shenzhen Comtech. At present, most of our business in China is done through Shenzhen Comtech and Shenzhen Communication, except for business in Shanghai, which is conducted mostly through Shanghai E&T. No dividends have been paid or distributions made by Shenzhen Comtech to Comtech China thus far. For additional details regarding these contractual agreements, which have no fixed expiry date or termination provisions, see “Corporate structure.”
71
Table of Contents
As of the date of this prospectus, our authorized capital stock consisted of 200,000,000 shares of common stock, par value $0.01 per share, 25,532,898 of which were outstanding as at March 30, 2005.
DESCRIPTION OF COMMON STOCK
Voting rights. All shares of our common stock have equal voting rights and, when validly issued and outstanding, the holders of shares of common stock are entitled to one vote for each share held on record on all matters to be voted on by the shareholders.
Dividends. The holders of outstanding shares of common stock are entitled to receive dividends, if any, out of assets legally available at such times and in such amounts as our board of directors may from time to time determine.
Preemptive, subscription, redemption and conversion rights. Holders of shares of our common stock have no preemptive, subscription or redemption rights, and there are no conversion provisions applicable to our common stock.
Liquidation. Upon our liquidation, dissolution or winding-up, the holders of our common stock are entitled to receive pro rata the assets of the company which are legally available for distribution to shareholders, unless there are outstanding shares of preferred stock with priority rights. Currently, we have no class of preferred stock authorized to be issued.
STOCKHOLDERS’ AGREEMENT
In connection with the share exchange, we, certain shareholders of Trident and the shareholders of Comtech Cayman entered into a stockholders’ agreement, which provides for the designation and voting by Trident’s shareholders and Comtech Cayman’s shareholders of persons to serve on our board of directors. Under the stockholders’ agreement, during the two-year period commencing on July 22, 2004, the Trident shareholders and the Comtech Cayman shareholders will be permitted to designate two and five persons, respectively, for nomination as directors at each annual meeting, and will be required to vote their shares of common stock for all such nominees. Until the expiration of the two-year period, any vacancies on our board of directors shall be filled by the appointment of directors either by (a) the remaining Trident nominees, if the vacancy was created by a Trident nominee or (b) by the remaining Comtech Cayman nominees, if the vacancy was created by a Comtech Cayman nominee.
WARRANTS
Prior to the share exchange, Trident granted warrants to purchase up to 925,417 shares of our common stock which were assumed as a part of the share exchange transaction. Each warrant represents the right to receive one share of the our common stock, at an exercise price of $3.00 per share for 484,452 common stock warrants and $2.50 per share for 440,965 common stock warrants. The warrants expire on July 1, 2009. The holders of these warrants, which include former directors and officers of Trident, were granted piggyback registration rights with respect to the underlying shares of common stock. All of these underlying shares were registered for resale under our registration statement on Form S-1, declared effective in February, 2005.
On January 1, 2004, we entered into a financial advisory agreement with Broadband Capital Management LLC, or Broadband, in connection with the anticipated share exchange. As part of the
72
Table of Contents
Description of share capital
financial advisory fee payable to Broadband upon consummation of the share exchange, we agreed to issue warrants to purchase up to 325,000 shares of our common stock to Broadband and certain of its affiliates. The holders of the Broadband warrants were granted piggyback registration rights with respect to the underlying shares of common stock. All of these underlying shares were registered for resale under our registration statement on Form S-1, declared effective in February 2005.
INDEMNIFICATION OF DIRECTORS AND OFFICERS
Our amended and restated bylaws provide that we will indemnify our directors and officers to the maximum extent required or permitted by Maryland law. Our bylaws permit us to indemnify any person made or threatened to be made a party to an action, suit or proceeding, whether, civil, criminal, administrative or investigative, by reason of the fact that such person, at our request, is or was a director or officer of another corporation, against the liabilities, costs and expenses of every kind actually and reasonably incurred by him as a result of such action, suit or proceeding, or any threat thereof or any appeal thereon, to the full extent required or permitted under applicable common or statutory law, state or federal. This indemnity is exclusive of other rights to which such person may be entitled.
MARYLAND TAKEOVER STATUTE
Under Section 3-602 of the Maryland General Corporation Laws, which prevents an “interested shareholder” - defined, generally, as a person owning 15% or more of a corporation’s outstanding voting stock - - from engaging in a “business combination” with a publicly held Maryland corporation for five years following the date such person became an interested shareholder, unless: (a) before such person became an interested shareholder, the board of directors of the corporation approved the transaction in which the interested shareholder became an interested shareholder or approved the business combination; (b) upon consummation of the transaction that resulted in the interested shareholder’s becoming an interested shareholder, the interested shareholder owns at least 80% of the voting stock of the corporation outstanding at the time the transaction commenced, subject to various exceptions; or (c) following the transaction in which such person became an interested shareholder, the business combination is approved by the board of directors of the corporation and authorized at a meeting of shareholders by the affirmative vote of the holders of 66% of the outstanding voting stock of the corporation not owned by the interested shareholder. A “business combination” includes mergers, stock or asset sales and other transactions resulting in a financial benefit to the interested shareholder. As a result, our principal shareholder and chief executive officer, Jeffrey Kang, who alone has the ability to control the outcome of all matters requiring shareholder approval, may engage in such business combinations without the protections of the Maryland takeover statute.
TRANSFER AGENT AND REGISTRAR
The transfer agent and registrar for our common stock is American Stock Transfer & Trust Company.
LISTING
Our shares of common stock are currently quoted on Nasdaq under the symbol “COGO.”
73
Table of Contents
Shares eligible for future sale
Upon completion of the offering, we will have outstanding shares of common stock ( shares if the underwriters’ over-allotment option is exercised in full), based on 25,532,898 shares outstanding as of March 30, 2005. Of that amount, shares ( shares if the underwriters’ over-allotment option is exercised in full) will be publicly held by investors participating in the offering, and shares ( shares if the underwriters’ over-allotment option is exercised in full) will be held by our existing shareholders, who may be our “affiliates” within the meaning of the Securities Act. In addition, based on options and warrants outstanding as of March 31, 2005:
| Ø | shares will be subject to outstanding options after the offering, of which approximately shares will be vested and exercisable days after the offering; and |
| Ø | shares will be subject to outstanding warrants, all of which are exercisable after the offering. |
All shares of common stock sold by us in the offering will be freely tradable without restriction or further registration under the Securities Act, unless the shares are held by “affiliates,” as that term is defined in Rule 144 under the Securities Act. For purposes of Rule 144, an “affiliate” of an issuer is a person that, directly or indirectly through one or more intermediaries, controls, or is controlled by or is under common control with, the issuer. Shares purchased by an affiliate may not be resold, except pursuant to an effective registration statement or an exemption from registration, including an exemption under Rule 144 of the Securities Act described below.
On February 7, 2005, a registration statement on Form S-1 was declared effective with respect to 6,365,417 shares of our common stock. These shares are freely tradable without restriction or further registration, subject to the prospectus delivery requirements. Under this registration statement, we registered for resale:
| Ø | 1,850,000 shares of our common stock owned by existing shareholders, primarily Ren Investment International Ltd; |
| Ø | shares underlying (a) warrants held by former Trident shareholders to purchase up to 925,417 shares of our common stock and (b) options held by former Trident shareholders to purchase up to 115,000 shares of our common stock, the holders of which had piggyback registration rights; |
| Ø | 3,150,000 shares of our common stock owned by investors who purchased shares in our 2004 private placement, pursuant to the registration rights provisions of the stock purchase agreement; and |
| Ø | shares underlying warrants held by Broadband and certain of its affiliates to purchase up to 325,000 shares of our common stock. |
With respect to the 3,150,000 shares of our common stock owned by investors who purchased shares in our 2004 private placement, we have a right under the registration rights provisions of the stock purchase agreement, in the event we undertake an underwritten public offering such as this offering, to suspend sales of these shares in certain circumstances.
All remaining shares, and all shares issuable upon exercise of options and shares issuable upon exercise of warrants, in each case outstanding upon completion of the offering, are “restricted securities” as the term is defined in Rule 144 under the Securities Act. These restricted securities may be sold in the United States only if they are registered or if they qualify for an exemption from registration under Rule 144 or Rule 144(k) under the Securities Act. These rules are described below.
Future sales of substantial amounts of our common stock in the public markets after this offering, or the perception that such future sales could occur, could adversely affect prevailing market prices of our common stock from time to time.
74
Table of Contents
Shares eligible for future sale
LOCKUP ARRANGEMENTS
Public Offering Lock-Up
We, each of our principal shareholders and our chief financial officer have entered into lock-up agreements with the underwriters pursuant to which they have agreed not to, subject to certain exceptions, without the prior written approval of UBS AG, offer, sell, contract to sell, make any short sale or otherwise dispose of or hedge our common stock or securities convertible into or exchangeable for our common stock for a period of 180 days after the date of this prospectus. The 180-day period may be extended under certain circumstances. UBS AG has permittedour chief financial officer to dispose of up to 105,000 shares of our common stock. See “Underwriting—No Sales of Similar Securities.” Parties that beneficially own an aggregate of approximately million shares (or %) of our common stock after this offering have executed this lock-up agreement, without giving effect to the carve-outs enumerated above.
NASD Lock-Up
Persons and entities affiliated with C.E. Unterberg, Towbin LLC, an underwriter in this offering, may be required by the NASD to enter into lock-up agreements with respect to an aggregate of 60,010 shares of our common stock. See “Underwriting—No Sales of Similar Securities.”
ELIGIBILITY OF RESTRICTED SHARES FOR SALE IN THE PUBLIC MARKET
Rule 144 and Rule 144(k)
In general, under Rule 144 as currently in effect, a person who has beneficially owned “restricted securities” for at least one year would be entitled to sell in the United States, within any three-month period, a number of shares that is not more than the greater of:
| Ø | 1% of the number of our shares of common stock then outstanding; or |
| Ø | the average weekly trading volume of the shares of our common stock on all exchanges during the four calendar weeks before a notice of the sale on Form 144 is filed with the U.S. Securities and Exchange Commission. |
Sales under Rule 144 are also subject to manner of sale provisions, notice requirements and the availability of current public information about us.
Under Rule 144(k), a person who is not deemed to have been our affiliate at any time during the 90 days preceding a sale, and who has beneficially owned the shares proposed to be sold for at least two years from the later of the date these shares were acquired from us or from our affiliate, including the holding period of any prior owner other than an affiliate, is entitled to sell those shares in the United States without complying with the manner of sale, public information, volume limitation or notice provisions of Rule 144.
Stock Options
As of May 31, 2005, options to purchase an aggregate of 2,252,500 shares of common stock were outstanding under our stock option plans. A registration statement on Form S-8 under the Securities Act to register 2.5 million shares of common stock reserved for issuance under our stock option plans was filed on June 10, 2005. Any vested shares registered under the Form S-8 registration statement will be available for sale in the public market immediately upon effectiveness of the registration statement, subject to the lock-up period and the Rule 144 volume limitations applicable to our affiliates.
75
Table of Contents
Certain United States federal income tax consequences to non-U.S. holders
The following is a discussion of certain United States federal income tax consequences of an investment in our common stock by a holder that, for United States federal income tax purposes, is not a “United States person” as defined below (a “Non-U.S. Holder”). This discussion is based upon existing United States federal income tax law, which is subject to differing interpretations or change, possibly with retroactive effect. This discussion does not address all aspects of United States federal income taxation which may be important to particular investors in light of their individual investment circumstances, such as common stock held by investors subject to special tax rules (e.g., financial institutions, insurance companies, broker-dealers, foreign tax-exempt organizations (including private foundations) and foreign partnerships) or to persons that will hold the common stock as part of a straddle, hedge, conversion, constructive sale, or other integrated security transaction for United States federal income tax purposes, all of whom may be subject to tax rules that differ significantly from those summarized below. In addition, this discussion does not discuss any (i) United States federal income tax consequences to a Non-U.S. Holder that (A) is engaged in the conduct of a United States trade or business or (B) is a nonresident alien individual and is present in the United States for 183 or more days during the taxable year and (ii) state, local, or foreign tax considerations. This discussion assumes that an investor will hold his common stock as a “capital asset” (generally, property held for investment) under the Internal Revenue Code of 1986. Each prospective investor is urged to consult his tax advisor regarding the United States federal, state, local and foreign income and other tax considerations of an investment in our common stock.
For purposes of this discussion, a “United States person” is, for United States federal income tax purposes, (i) an individual who is a citizen or resident of the United States, (ii) a corporation, partnership, or limited liability company created in, or organized under the law of, the United States or any State or political subdivision thereof, (iii) an estate the income of which is includible in gross income for United States federal income tax purposes regardless of its source, and (iv) a trust (A) the administration of which is subject to the primary supervision of a United States court and which has one or more United States persons who have the authority to control all substantial decisions of the trust or (B) that was in existence on August 20, 1996, was treated as a United States person on the previous day, and elected to continue to be so treated.
General
Dividends paid in cash to a Non-U.S. Holder will generally be subject to withholding of United States federal income tax at the rate of 30%. A Non-U.S. Holder is urged to consult any applicable income tax treaties that may provide for a reduction in, or exemption from, withholding taxes. A Non-U.S. Holder may be required to provide a completed Internal Revenue Service (“IRS”) Form W-8BEN or other certification in order to claim a treaty benefit. Upon a sale or other disposition of our common stock, a Non-U.S. Holder will generally not be subject to United States federal income tax.
Backup Withholding and Information Reporting
In general, backup withholding will not apply to dividends on our common stock paid by us or our paying agent to a Non-U.S. Holder if the holder has provided a completed IRS Form W-8BEN or other certification that it is a Non-U.S. Holder and neither we nor our paying agents have actual knowledge or reason to know otherwise. Generally, we must provide to the IRS information regarding the amount of dividends paid, the name and the address of the recipient, and the amount, if any, of tax withheld. This information reporting requirement will apply even if no tax was required to be withheld.
76
Table of Contents
Certain United States federal income tax consequences to non-U.S. holders
In general, backup withholding and information reporting will not apply to proceeds derived from the disposition of common stock paid to a Non-U.S. Holder if the holder has provided a completed IRS Form W-8BEN or other certification that such holder is a Non-U.S. Holder and neither we nor our paying agent have actual knowledge or reason to know otherwise. Any amounts withheld under the backup withholding rules from a payment to a Non-U.S. Holder may be refunded, or credited against the holder’s United States federal income tax liability, if any, provided that certain required information is provided to the IRS.
77
Table of Contents
Enforceability of civil liabilities
Substantially all of our assets are located in China. In addition, most of our directors and officers are nationals and/or residents of countries other than the United States, and all or a substantial portion of our or such persons’ assets are located in China. As a result, it may be difficult for you to effect service of process within the United States upon us or such persons or to enforce against them or against us, judgments obtained in United States courts, including judgments predicated upon the civil liability provisions of the securities laws of the United States or any state thereof. Grandall Legal Group has advised us further that the recognition and enforcement of foreign judgments are provided for under PRC Civil Procedural Law. Courts in China may recognize and enforce foreign judgments in accordance with the requirements of PRC Civil Procedural Law based either on treaties between China and the country where the judgment is made or on reciprocity between jurisdictions.
The name and address of our resident agent for service of process are: The Corporation Trust Incorporated at 300 East Lombard Street, Baltimore, MD 21202.
78
Table of Contents
We and the selling shareholders are offering the shares of our common stock described in this prospectus through the underwriters named below. UBS AG is the representative of the underwriters. We and the selling shareholders have entered into an underwriting agreement with the underwriters. Subject to the terms and conditions of the underwriting agreement, each of the underwriters has severally agreed to purchase the number of shares of common stock listed next to its name in the following table:
| Underwriters | Number of shares | |
UBS AG | ||
C.E. Unterberg, Towbin LLC | ||
WR Hambrecht + Co, LLC | ||
Maxim Group LLC | ||
Total | ||
The underwriting agreement provides that the underwriters must buy all of the shares if they buy any of them, provided that certain conditions are satisfied. However, the underwriters are not required to take or pay for the shares covered by the underwriters’ over-allotment option described below.
All sales of our shares in the United States will be made by U.S. registered broker/dealers. UBS AG is expected to make offers and sales in the United States through its registered broker/dealer affiliate, UBS Securities LLC.
Our common stock and the common stock of the selling shareholders are offered subject to a number of conditions, including:
| Ø | receipt and acceptance of the common stock by the underwriters, and |
| Ø | the underwriters’ right to reject orders in whole or in part. |
OVER-ALLOTMENT OPTION
We and the selling shareholders have granted the underwriters an option to buy up to additional shares of our common stock. The underwriters may exercise this option solely for the purpose of covering over-allotments, if any, made in connection with this offering. The underwriters have 30 days from the date of this prospectus to exercise this option. If the underwriters exercise this option, they will each purchase additional shares approximately in proportion to the amounts specified in the table above.
COMMISSIONS AND DISCOUNTS
Shares sold by the underwriters to the public will initially be offered at the offering price set forth on the cover of this prospectus. Any shares sold by the underwriters to securities dealers may be sold at a discount of up to $ per share from the public offering price. Any of these securities dealers may resell any shares purchased from the underwriters to other brokers or dealers at a discount of up to $ per share from the public offering price. If all the shares are not sold at the public offering price, the representative may change the offering price and the other selling terms. The underwriters have informed us that they do not expect discretionary sales to exceed % of the shares of common stock to be offered.
79
Table of Contents
Underwriting
The following table shows the per share and total underwriting discounts and commissions we and the selling shareholders will pay to the underwriters, assuming both no exercise and full exercise of the underwriters’ option to purchase up to an additional shares:
| Paid by us | Paid by selling shareholders | Total | ||||||||||||||||
| No exercise | Full exercise | No exercise | Full exercise | No exercise | Full exercise | |||||||||||||
Per share | $ | $ | $ | $ | $ | $ | ||||||||||||
Total | $ | $ | $ | $ | $ | $ | ||||||||||||
We estimate that the total expenses of this offering payable by us, not including the underwriting discounts and commissions, will be approximately $ million.
NO SALES OF SIMILAR SECURITIES
We, each of our principal shareholders and our chief financial officer have entered into lock-up agreements with the underwriters. Under these agreements, we and each of these persons may not, subject to certain exceptions, without the prior written approval of UBS AG, offer, sell, contract to sell, make any short sale or otherwise dispose of or hedge our common stock or securities convertible into or exchangeable for our common stock. These restrictions will be in effect for a period of 180 days after the date of this prospectus. At any time and without public notice, UBS AG may in its sole discretion release some or all of the securities from these lock-up agreements. UBS AG has permittedour chief financial officer to dispose of up to 105,000 shares of our common stock.
If:
| Ø | during the period that begins on the date that is 15 calendar days plus three business days before the last day of the 180-day lock-up period and ends on the last day of the 180-day lock-up period, |
| Ø | we issue an earnings release or |
| Ø | material news or a material event relating to us occurs; or |
| Ø | prior to the expiration of the 180-day lock-up period, we announce that we will release earnings results during the 16-day period beginning on the last day of the 180-day lock-up period, |
then the 180-day lock-up period will be extended until the expiration of the date that is 15 calendar days plus three business days after the date on which the issuance of the earnings release or the material news or material event occurs.
INDEMNIFICATION AND CONTRIBUTION
We and the selling shareholders have agreed to indemnify the underwriters and their controlling persons against certain liabilities, including liabilities under the Securities Act. If we or the selling shareholders are unable to provide this indemnification, we and the selling shareholders will contribute to payments the underwriters and their controlling persons may be required to make in respect of those liabilities.
80
Table of Contents
Underwriting
PRICE STABILIZATION, SHORT POSITIONS
In connection with this offering, the underwriters may engage in activities that stabilize, maintain or otherwise affect the price of our common stock, including:
| Ø | stabilizing transactions; |
| Ø | short sales; |
| Ø | purchases to cover positions created by short sales; |
| Ø | imposition of penalty bids; and |
| Ø | syndicate covering transactions. |
Stabilizing transactions consist of bids or purchases made for the purpose of preventing or retarding a decline in the market price of our common stock while this offering is in progress. These transactions may also include making short sales of our common stock, which involve the sale by the underwriters of a greater number of shares of common stock than they are required to purchase in this offering. Short sales may be “covered short sales,” which are short positions in an amount not greater than the underwriters’ over-allotment option referred to above, or may be “naked short sales,” which are short positions in excess of that amount.
The underwriters may close out any covered short position either by exercising their over-allotment option, in whole or in part, or by purchasing shares in the open market. In making this determination, the underwriters will consider, among other things, the price of shares available for purchase in the open market compared to the price at which they may purchase shares through the over-allotment option. The underwriters must close out any naked short position by purchasing shares in the open market. A naked short position is more likely to be created if the underwriters are concerned that there may be downward pressure on the price of the common stock in the open market that could adversely affect investors who purchased in this offering.
The underwriters also may impose a penalty bid. This occurs when a particular underwriter repays to the underwriters a portion of the underwriting discount received by it because the representatives have repurchased shares sold by or for the account of that underwriter in stabilizing or short covering transactions.
As a result of these activities, the price of our common stock may be higher than the price that otherwise might exist in the open market. If these activities are commenced, they may be discontinued by the underwriters at any time. The underwriters may carry out these transactions on the Nasdaq National Market, in the over-the-counter market or otherwise.
AFFILIATIONS
Certain of the underwriters and their affiliates have in the past provided and may from time to time provide certain commercial banking, financial advisory, investment banking and other services for us for which they were and will be entitled to receive separate fees. On each of October 27 and November 5, 2004, we completed a private placement in which we sold an aggregate of 3,150,000 shares of our common stock. C.E. Unterberg, Towbin LLC, an underwriter in this offering, acted as lead placement agent in connection with the offering and received a 6% placement fee. WR Hambrecht + Co, LLC, an underwriter in this offering, acted as co-placement agent in connection with the offering and received a portion of the 6% placement fee. Each of C.E. Unterberg, Towbin Capital Partners I, L.P. and another
81
Table of Contents
Underwriting
individual, affiliates of C.E. Unterberg, Towbin LLC, an underwriter in this offering, purchased 57,150 and 2,850 shares, respectively, of our common stock in our private placement that closed in October and November of 2004, which is within 180 days prior to the filing of this registration statement. These affiliates of C.E. Unterberg, Towbin LLC may be required by the NASD to enter into lock-up agreements with respect to an aggregate of 60,010 shares of our common stock.
The underwriters and their affiliates may from time to time in the future engage in transactions with us and perform services for us in the ordinary course of their business.
82
Table of Contents
Certain legal matters as to United States federal and New York law will be passed upon for us by Skadden, Arps, Slate, Meagher & Flom LLP. The validity of the shares we are offering will be passed upon for us by Loeb & Loeb LLP, New York, New York. Certain legal matters in connection with the offering will be passed upon for the underwriters by Wilson Sonsini Goodrich & Rosati, P.C. Certain legal matters as to PRC law will be passed upon for us by Grandall Legal Group and for the underwriters by Fangda Partners. Certain legal matters as to British Virgin Island law will be passed upon for the selling shareholders by Conyers Dill & Pearman, British Virgin Islands.
The consolidated financial statement of Comtech Group, Inc. as of December 31, 2003 and 2004 and for the years ended December 31, 2002, 2003 and 2004, included herein and in the registration statement have been audited by Deloitte Touche Tohmatsu, our independent registered public accounting firm, as stated in their report appearing herein and elsewhere in the registration statement, and are included in reliance upon the report of such firm given upon their authority as experts in accounting and auditing.
83
Table of Contents
Where you can find more information
We have filed with the U.S. Securities and Exchange Commission, or the SEC, a registration statement on Form S-1 under the Securities Act in connection with this offering of our common stock. This prospectus, which forms a part of the registration statement, does not contain all of the information set forth in the registration statement, and the exhibits and schedules thereto. We have omitted certain portions of the registration statement from the prospectus in accordance with the rules and regulations of the SEC. You should refer to the registration statement for further information. Statements contained in this prospectus as to the contents of any contract or other document that is filed as an exhibit to the registration statement are not necessarily complete, and each such statement is qualified in all respects by reference to the full text of such contract or document.
We have filed annual, quarterly and special reports, proxy statements and other information with the SEC. Copies of this registration statement, all exhibits and amendments, as well as such reports and other information, when so filed, may be inspected without charge and may be obtained at prescribed rates at the SEC’s Public Reference Room located at 450 Fifth Street, N.W., Room 1200, Washington, D.C. 20549. The public may obtain information regarding the Washington, D.C. Public Reference Room by calling the SEC at 1-800-SEC-0330 or by contacting the SEC at its website at www.sec.gov. Our SEC filings, including the registration statements, and other information may also be inspected at the offices of the Nasdaq National Market, Reports Section, 1735 K Street, N.W., Washington, D.C. 20006.
We maintain an Internet website atwww.comtech.com.cn.The information at our website is not incorporated in this prospectus by reference, and you should not consider it a part of this prospectus.
84
Table of Contents
INDEX TO CONSOLIDATED FINANCIAL STATEMENTS
TABLE OF CONTENTS
F-1
Table of Contents
Report of independent registered public accounting firm
TO THE BOARD OF DIRECTORS AND SHAREHOLDERS OF COMTECH GROUP, INC.
We have audited the accompanying consolidated balance sheets of Comtech Group and its subsidiaries (the “Company”) as of December 31, 2004 and 2003 and the related consolidated statements of income, shareholders’ equity and cash flows for each of the three years in the period ended December 31, 2004. These financial statements are the responsibility of the Company’s management. Our responsibility is to express an opinion on these financial statements based on our audits.
We conducted our audit in accordance with the standards of the Public Company Accounting Oversight Board (United States). Those standards require that we plan and perform the audit to obtain reasonable assurance about whether the financial statements are free of material misstatement. The Company is not required to have, nor were we engaged to perform, an audit of its internal control over financial reporting. Our audit included consideration of internal control over financial reporting as a basis for designing audit procedures that are appropriate in the circumstances, but not for the purpose of expressing an opinion on the effectiveness of the Company’s internal control over financial reporting. Accordingly, we express no such opinion. An audit also includes examining, on a test basis, evidence supporting the amounts and disclosures in the financial statements, assessing the accounting principles used and significant estimates made by management, as well as evaluating the overall financial statement presentation. We believe that our audit provides a reasonable basis for our opinion.
In our opinion, such consolidated financial statements present fairly, in all material respects, the financial position of the Company as of December 31, 2004 and 2003 and the results of its operations and its cash flows for each of the three years in the period ended December 31, 2004 in conformity with accounting principles generally accepted in the United States of America.
Our audit also comprehended the translation of Renminbi amounts into United States dollar amounts and, in our opinion, such translation has been made in conformity with the basis stated in Note 2. Such United States dollar amounts are presented solely for the convenience of the readers in the United States of America.
Deloitte Touche Tohmatsu
Certified Public Accountants
Hong Kong
March 28, 2005
F-2
Table of Contents
CONSOLIDATED BALANCE SHEETS
(in thousands, except shares and per share amounts)
| At December 31, | ||||||||
| 2004 | 2004 | 2003 | ||||||
| USD | RMB | RMB | ||||||
| ASSETS | ||||||||
Current assets: | ||||||||
Cash | 5,007 | 41,444 | 30,683 | |||||
Trade accounts receivable, net of allowance for doubtful accounts of USD463 (RMB3,833) in 2004 RMB4,145 in 2003 | 20,418 | 168,989 | 92,259 | |||||
Bills receivable | 9,344 | 77,338 | 13,306 | |||||
Other receivables | 263 | 2,176 | 2,297 | |||||
Inventories | 1,922 | 15,903 | 18,350 | |||||
Total current assets | 36,954 | 305,850 | 156,895 | |||||
Property and equipment, net | 401 | 3,317 | 2,961 | |||||
Other assets | — | — | 344 | |||||
| 401 | 3,317 | 3,305 | ||||||
TOTAL ASSETS | 37,355 | 309,167 | 160,200 | |||||
| LIABILITIES AND SHAREHOLDERS’ EQUITY | ||||||||
Current liabilities: | ||||||||
Trade accounts payable | 6,411 | 53,063 | 44,564 | |||||
Bank borrowings | 6,489 | 53,707 | — | |||||
Amount due to holding company | — | — | 50,356 | |||||
Amount due to other related party | 265 | 2,192 | 1,592 | |||||
Dividend payable | — | — | 41,387 | |||||
Income tax payable | 180 | 1,487 | 902 | |||||
Accrued expenses and other liabilities | 1,027 | 8,506 | 3,745 | |||||
Total current liabilities | 14,372 | 118,955 | 142,546 | |||||
Minority interest | 508 | 4,204 | — | |||||
Commitments and contingencies (note 12) | — | — | — | |||||
Shareholders’ equity: | ||||||||
Common Stock (USD0.01 par value—authorized 200,000,000 shares in 2004 and 50,000,000 shares in 2003; shares issued and outstanding 25,361,025 in 2004 and 20,251,075 in 2003) | 254 | 2,099 | 1,676 | |||||
Additional paid-in capital | 14,304 | 118,383 | 12,407 | |||||
Deferred stock-based compensation | (30 | ) | (247 | ) | — | |||
Retained earnings | 7,947 | 65,773 | 3,571 | |||||
Total shareholders’ equity | 22,475 | 186,008 | 17,654 | |||||
TOTAL LIABILITIES AND SHAREHOLDERS’ EQUITY | 37,355 | 309,167 | 160,200 | |||||
See notes to consolidated financial statements.
F-3
Table of Contents
CONSOLIDATED STATEMENTS OF OPERATIONS
(in thousands, except shares and per share amounts)
| Year ended December 31, | ||||||||||||
| 2004 | 2004 | 2003 | 2002 | |||||||||
| USD | RMB | RMB | RMB | |||||||||
Net revenue | 75,594 | 625,656 | 357,805 | 207,607 | ||||||||
Cost of revenue | (64,133 | ) | (530,800 | ) | (306,939 | ) | (190,265 | ) | ||||
Gross profit | 11,461 | 94,856 | 50,866 | 17,342 | ||||||||
Selling, general and administrative expenses | (2,549 | ) | (21,092 | ) | (19,358 | ) | (6,419 | ) | ||||
Research and development expenses | (740 | ) | (6,121 | ) | (983 | ) | (1,042 | ) | ||||
Other operating income | 134 | 1,110 | — | — | ||||||||
Income from operations | 8,306 | 68,753 | 30,525 | 9,881 | ||||||||
Interest expense | (260 | ) | (2,156 | ) | (801 | ) | — | |||||
Interest income | 5 | 38 | 54 | 157 | ||||||||
Income before income tax | 8,051 | 66,635 | 29,778 | 10,038 | ||||||||
Income tax | (278 | ) | (2,300 | ) | (1,295 | ) | (820 | ) | ||||
Income before minority interest | 7,773 | 64,335 | 28,483 | 9,218 | ||||||||
Minority interest | (258 | ) | (2,133 | ) | — | — | ||||||
Net income | 7,515 | 62,202 | 28,483 | 9,218 | ||||||||
Earnings per share | ||||||||||||
Basic | 0.35 | 2.87 | 1.41 | 0.46 | ||||||||
Diluted | 0.34 | 2.84 | 1.41 | 0.46 | ||||||||
Weighted average number of ordinary shares outstanding | ||||||||||||
Basic | 21,690,560 | 21,690,560 | 20,251,075 | 20,251,075 | ||||||||
Diluted | 21,885,053 | 21,885,053 | 20,251,075 | 20,251,075 | ||||||||
See notes to consolidated financial statements.
F-4
Table of Contents
CONSOLIDATED STATEMENTS OF SHAREHOLDERS’ EQUITY
(in thousands, except shares and per share amounts)
| Common stock | Additional paid-in capital | Deferred stock-based compensation | Retained earnings | Total shareholders’ equity | |||||||||||
| Number of shares | RMB | RMB | RMB | RMB | RMB | ||||||||||
Balance at January 1, 2002 (note 16) | 20,251,075 | 1,676 | 12,324 | — | 7,257 | 21,257 | |||||||||
Capital contribution | — | — | 83 | — | — | 83 | |||||||||
Net income | — | — | — | — | 9,218 | 9,218 | |||||||||
Balance at December 31, 2002 | 20,251,075 | 1,676 | 12,407 | — | 16,475 | 30,558 | |||||||||
Net income | — | — | — | — | 28,483 | 28,483 | |||||||||
Dividend | — | — | — | — | (41,387 | ) | (41,387 | ) | |||||||
Balance at December 31, 2003 | 20,251,075 | 1,676 | 12,407 | — | 3,571 | 17,654 | |||||||||
Shares of stock held by Trident’s shareholders | 1,959,950 | 162 | 162 | — | — | 324 | |||||||||
Recapitalization in connection with the Share Exchange Transaction | — | — | 23,181 | — | — | 23,181 | |||||||||
Deferred stock-based compensation | — | — | 348 | (348 | ) | — | — | ||||||||
Amortisation of deferred stock-based Compensation | — | — | — | 101 | — | 101 | |||||||||
Issue of shares in connection with private placement | 3,150,000 | 261 | 82,285 | — | — | 82,546 | |||||||||
Net income | — | — | — | — | 62,202 | 62,202 | |||||||||
Balance at December 31, 2004 | 25,361,025 | 2,099 | 118,383 | (247 | ) | 65,773 | 186,008 | ||||||||
Balance at December 31, 2004 (in thousands of USD) | 254 | 14,304 | (30 | ) | 7,947 | 22,475 | |||||||||
See notes to consolidated financial statements.
F-5
Table of Contents
CONSOLIDATED STATEMENTS OF CASH FLOWS
(in thousands)
| Year ended December 31, | ||||||||||||
| 2004 | 2004 | 2003 | 2002 | |||||||||
| USD | RMB | RMB | RMB | |||||||||
Cash flows from operating activities: | ||||||||||||
Net income | 7,515 | 62,202 | 28,483 | 9,218 | ||||||||
Adjustment to reconcile net income to net cash used in operating activities: | ||||||||||||
Depreciation expense | 111 | 913 | 427 | 455 | ||||||||
Minority interest | 258 | 2,133 | — | — | ||||||||
Stock based compensation cost | 12 | 101 | — | — | ||||||||
Changes in operating assets and liabilities, net of businesses acquired | ||||||||||||
Trade accounts receivable | (8,650 | ) | (71,588 | ) | (24,662 | ) | (22,549 | ) | ||||
Bills receivable | (7,737 | ) | (64,032 | ) | (7,164 | ) | (5,142 | ) | ||||
Other receivables | 650 | 5,380 | (784 | ) | (640 | ) | ||||||
Inventories | 500 | 4,136 | (11,437 | ) | (5,964 | ) | ||||||
Amount due from other related party | — | — | 298 | — | ||||||||
Trade accounts payable | 167 | 1,386 | (11,137 | ) | 3,963 | |||||||
Amount due to other related party | 72 | 600 | (1,573 | ) | (1,332 | ) | ||||||
Income tax payable | 71 | 585 | 816 | (98 | ) | |||||||
Accrued expenses and other liabilities | (260 | ) | (2,155 | ) | 1,327 | (630 | ) | |||||
Net cash used in operating activities | (7,291 | ) | (60,339 | ) | (25,406 | ) | (22,719 | ) | ||||
Cash flows from investing activities: | ||||||||||||
Acquisition of a new business | (109 | ) | (906 | ) | — | — | ||||||
Purchases of property and equipment | (125 | ) | (1,033 | ) | (1,017 | ) | (380 | ) | ||||
Changes in other assets | 41 | 344 | (300 | ) | — | |||||||
Cash used in investing activities | (193 | ) | (1,595 | ) | (1,317 | ) | (380 | ) | ||||
Cash flows from financing activities: | ||||||||||||
Net cash inflow from issue of shares (net of transaction cost) | 10,154 | 84,036 | — | — | ||||||||
Net cash inflow from share exchange transaction (net of transaction cost) | 3,225 | 26,695 | — | — | ||||||||
New bank borrowings | 6,489 | 53,707 | — | — | ||||||||
Repayment of amount due to holding company | (6,084 | ) | (50,356 | ) | — | — | ||||||
Payment of 2003 dividend | (5,000 | ) | (41,387 | ) | — | — | ||||||
Amount received from holding company | — | — | 45,212 | 5,144 | ||||||||
Capital contribution | — | — | — | 83 | ||||||||
Net cash provided by financing activities | 8,784 | 72,695 | 45,212 | 5,227 | ||||||||
Net increase (decrease) in cash and cash equivalents | 1,300 | 10,761 | 18,489 | (17,872 | ) | |||||||
Cash at beginning of the year | 3,707 | 30,683 | 12,194 | 30,066 | ||||||||
Cash at end of the year | 5,007 | 41,444 | 30,683 | 12,194 | ||||||||
Supplemental disclosure of cash flows information: | ||||||||||||
Cash paid for: | ||||||||||||
Interest | 260 | 2,156 | 801 | — | ||||||||
Income taxes | 194 | 1,608 | 479 | 918 | ||||||||
See notes to consolidated financial statements.
F-6
Table of Contents
NOTES TO CONSOLIDATED FINANCIAL STATEMENTS
(in thousands, except shares and per share amounts)
1. ORGANIZATION AND NATURE OF OPERATIONS
Comtech Group, Inc., formerly Trident Rowan Group Inc, (the “Parent”) and its subsidiaries (together, the “Company”) provide customized module design solutions to various manufacturers in the mobile handset and telecom equipment industries in China. The Company currently offers their customers over 500 design solutions and product lines integrating components from many suppliers. The Company purchases the specific components from their suppliers and generates revenue through the sale of the specific components that are incorporated in their module design.
Jeffrey Kang, the Company’s principal shareholder and chief executive officer, directly or through entities he controls, currently has a controlling interest in the Company. Mr. Kang thus has the ability to control the outcome of all matters requiring shareholder approval, including the election of directors and approval of significant corporate transactions, such as mergers, consolidations or the sale of substantially all of the Company’s assets.
The Share Exchange Transaction
On May 25, 2004, the Parent entered into a Share Exchange Agreement (the “Exchange Agreement”) with Comtech Group pursuant to which the Parent acquired all of the issued and outstanding shares of Comtech Group in exchange for the issuance in the aggregate of 20,251,075 shares of the Parent on July 22, 2004. As a result of the transaction, Comtech Group became a wholly-owned subsidiary of the Parent and because the former shareholders of Comtech Group acquired approximately 91.2% of the Parent’s outstanding stock, the Share Exchange Transaction was accounted for as a reverse acquisition in which Comtech Group was deemed to be the accounting acquirer and the Parent the legal acquirer. The Parent changed its name to Comtech Group, Inc. on August 2, 2004.
As a result of the Share Exchange Transaction the historical consolidated financial statements of the Company for periods prior to the date of the transaction are those of Comtech Group, as the accounting acquirer, and all references to the consolidated financial statements of the Company apply to the historical financial statements of Comtech Group prior to the transaction and the consolidated financial statements of the Company subsequent to the transaction. The Company’s shares have been restated retroactively to reflect the share exchange ratio as at the date of the transaction in a manner similar to a stock split.
Because the Parent was a non-operating public shell company, before the Share Exchange Transaction, no goodwill has been recorded in connection with the transaction and the costs incurred in connection with such have been charged directly to equity. The assets and liabilities of the Parent acquired under the Share Exchange Transaction are as follows:
| RMB | |||
Net assets acquired: | |||
Cash | 32,367 | ||
Other receivables | 2,853 | ||
Accrued expenses and other liabilities | (5,126 | ) | |
Minority interest | (917 | ) | |
| 29,177 | |||
Less: Transaction costs (note) | (5,672 | ) | |
| 23,505 | |||
F-7
Table of Contents
COMTECH GROUP, INC.
NOTES TO CONSOLIDATED FINANCIAL STATEMENTS — (Continued)
(in thousands, except shares and per share amounts)
| Note: | In connection with the Share Exchange Transaction with the Parent, the Company has paid USD160 (RMB1,324) to a financial advisor under a service agreement and such amount has been included in the transaction costs as stated above. In addition, pursuant to the service agreement, the Company is required to issue warrants to the financial advisor to purchase common stock of the Company. Details of warrants issued are disclosed in Note 17. |
As a part of the Share Exchange Transaction, the Company assumed fully vested options previously issued by the Parent to purchase 115,000 shares of common stock with an exercise price of USD 3.00 per share. Additionally, the Company assumed 925,417 fully exercisable common stock warrants. Each warrant represents the right to receive 1 share of the Company’s common stock, at an exercise price of USD3.00 per share for 484,452 common stock warrants and USD2.50 per share for 440,965 common stock warrants. The options and warrants assumed from the Parent expire on July 1, 2009.
The terms of the Exchange Agreement provide for the issuance of up to 30,173,047 additional shares to the original shareholders of Comtech Group in the event there is a breach of any representations, warranties, covenants or obligations made by the Parent in the Exchange Agreement, which indemnification provision will expire 30 days following the date of filing of the Company’s annual report on Form 10-K, but in no event earlier than April 30, 2005. The issuance of additional shares pursuant to this indemnification provision would result in dilution to shareholders of the Company. As of the balance sheet date, the Company is not aware of any such breach or the threat of a breach.
Acquisitions and Newly Formed Subsidiaries
On January 18, 2004, the Company signed an agreement to acquire 60% of Shanghai E&T System Co., Ltd., which is located in the PRC, for cash consideration of RMB1,200 (USD145). The total assets and liabilities of the acquired subsidiary was RMB9,235 (USD1,116) and RMB8,035 (USD971), respectively.
On March 18, 2004, the Company established a 100% owned subsidiary, Comtech Software Technology (Shenzhen) Co, Ltd., in the PRC. The Company contributed RMB4,966 (USD600) to this new subsidiary, which represented 100% of the registered capital of this subsidiary.
F-8
Table of Contents
COMTECH GROUP, INC.
NOTES TO CONSOLIDATED FINANCIAL STATEMENTS — (Continued)
(in thousands, except shares and per share amounts)
As of December 31, 2004, the ownership structure of the Company as a result of the Share Exchange Transaction is as follows:

| Note [(1)]: | The Company holds 98.6% shares in OAM S.P.A. and 60% shares in Shanghai E & T. |
Prior to the Share Exchange Transaction and the incorporation of the Comtech Group, the Company conducted its business through Shenzhen Comtech, which then wholly owned Comtech Hong Kong. During 2002 and 2003, the Company underwent a group reorganization, which consisted of the following: (i) incorporation of the Comtech Group; (ii) establishment of Comtech China and Comtech Holding as wholly owned subsidiaries of the Comtech Group; (iii) establishment of Comtech Communication as a wholly owned subsidiary of Comtech China, (iv) transfer of the ownership in Comtech Hong Kong from Shenzhen Comtech to Comtech Holding on August 28, 2002, and (v) transfer of the direct ownership in Shenzhen Comtech by the original shareholders (the “Original Shareholders”)
F-9
Table of Contents
COMTECH GROUP, INC.
NOTES TO CONSOLIDATED FINANCIAL STATEMENTS — (Continued)
(in thousands, except shares and per share amounts)
of Shenzhen Comtech. The Original Shareholders, on December 30, 2003, transferred to Comtech China their direct ownership interests in Shezhen Comtech at no consideration.
In order to effect the transfer of the direct ownership in Shenzhen Comtech, the Original Shareholders and Comtech China entered into an Agreement whereby the beneficial ownership interest in Shenzhen Comtech was transferred, but the legal title remained in the name of the Original Shareholders in order to comply with Chinese laws.
The transactions described in the preceding paragraphs are reorganization of companies under common control and were accounted for at historical cost. The accompanying consolidated financial statements reflect the historical result of operations and cash flows of the Company during each respective period and include the results of operations and cash flows of Shenzhen Comtech and Comtech Hong Kong from January 1, 2002. The share capital of Shenzhen Comtech was accounted for as an additional equity contribution by the original shareholders and was presented in shareholders’ equity as “Additional paid-in capital”.
2. SUMMARY OF PRINCIPAL ACCOUNTING POLICIES
The accompanying consolidated financial statements have been prepared in accordance with accounting principles generally accepted in the United States of America (“US GAAP”).
Principle of consolidation
The consolidated financial statements include the financial statements of Comtech Group, Inc. and its subsidiaries. All significant intercompany transactions and balances are eliminated in consolidation.
Use of Estimates
The preparation of financial statements requires management to make estimates and assumptions that affect the reported amounts of assets and liabilities and disclosure of contingent assets and liabilities at the date of the financial statements and the reported amounts of revenues and expenses during the reported period. Actual results could differ from those estimates.
Cash
Cash consisted of cash in bank and the Company does not have any cash equivalents.
Trade accounts receivable
Trade accounts receivable are stated at the nominal value and are reduced by appropriate allowances for estimated irrecoverable amounts.
Bills receivable
Bills receivable from banks are unsecured, non-interest bearing and without recourse.
Inventories
Inventories, which primarily consist of telecommunication system equipment, mobile handset components and network protection devices, are stated at the lower of cost or market. Cost is determined by the first-in, first-out method.
F-10
Table of Contents
COMTECH GROUP, INC.
NOTES TO CONSOLIDATED FINANCIAL STATEMENTS — (Continued)
(in thousands, except shares and per share amounts)
Property and equipment
Property and equipment are recorded at cost less accumulated depreciation. Depreciation is provided on a straight-line basis over the estimated useful lives of the assets. Estimated useful lives of property and equipment are as follows:
Office building | 10 years | |
Machinery | 5 years | |
Furniture and office equipment | 5 years | |
Motor vehicles | 5 years |
Major improvements of property and equipment are capitalized, while expenditures for repairs, maintenance and minor renewals and betterments are expensed.
Long-lived assets
The Company evaluates its long-lived assets for impairment whenever events or changes in circumstances indicate that the carrying amount of such assets may not be recoverable according to Statement of Financial Accounting Standards No. 144 “Accounting for the Impairment or Disposal of Long-Lived Assets”. Recoverability of assets to be held and used is measured by a comparison of the carrying amount of the assets to future undiscounted net cash flows expected to be generated by use of the assets. If the carrying amounts of long-lived assets are not recoverable, the impairment loss to be recognized is measured by the amount by which the carrying amounts of the assets exceed their fair values. No impairment loss was recorded for all periods presented.
Income taxes
Deferred tax assets and liabilities are recognized for the future tax consequences attributable to differences between the carrying amounts of existing assets and liabilities and their respective tax bases as well as operating loss and tax credit carry forwards. Deferred tax assets and liabilities are measured using enacted tax rates expected to apply to taxable income in the years in which those temporary differences are expected to be recovered or settled. The effect on deferred tax assets and liabilities of a change in tax rates is recognized in income in the period that includes the enactment date. Valuation allowances are established when it is more likely than not that some or all of the deferred tax assets will not be realized.
Revenue recognition
Sales of telecommunication system equipment, mobile handset components and network protection devices are recorded when the equipment is delivered, title has passed to the customers and the Company has no further obligations to provide services related to the operation of such equipment. Revenue is recorded net of value added tax incurred. Such value added taxes amounted to RMB109,757 (USD13,261), RMB41,693 and RMB21,075, for the year ended December 31, 2004, 2003 and 2002, respectively.
Cost of revenue
Cost of revenue includes purchase costs and shipping and handling costs for products sold, and direct costs associated with the delivery of the equipment, including salaries, employee benefits and overhead costs associated with employees providing the related services.
F-11
Table of Contents
COMTECH GROUP, INC.
NOTES TO CONSOLIDATED FINANCIAL STATEMENTS — (Continued)
(in thousands, except shares and per share amounts)
Foreign currency translation
The functional currency of the Company is the Renminbi (“RMB”). Transactions in other currencies are recorded in RMB at the rates of exchange prevailing when the transactions occur. Monetary assets and liabilities denominated in other currencies are translated into RMB at rates of exchange in effect at the balance sheet dates. Exchange gains and losses are recorded in the consolidated statements of operations as a component of current period earnings.
Translation into United States Dollars
The financial statements of the Company are stated in RMB. The translation of RMB amounts at and for the year ended December 31, 2004 into United States dollars (“USD”) is included solely for the convenience of readers and has been made at the rate of RMB8.2765 to USD 1. Such translations should not be construed as representations that RMB amounts could be converted into USD at that rate or any other rate.
Fair value of financial instruments
The carrying amounts of cash, bills receivable, trade accounts receivable, trade accounts payable and accrued expenses, approximate their fair values due to the short-term nature of these instruments.
Foreign Currency Risk
The RMB is not a freely convertible currency. The State Administration for Foreign Exchange, under the authority of the People’s Bank of China, controls the conversion of Renminbi into foreign currencies. The value of the RMB is subject to changes in central government policies and to international economic and political developments affecting supply and demand in the China Foreign Exchange Trading System market.
The PRC subsidiaries conduct their business substantially in the PRC, and their financial performance and position are measured in terms of RMB. Any devaluation of the RMB against the United States dollar would consequently have an adverse effect on the financial performance and asset values of the Company when measured in terms of United States dollars. The PRC subsidiaries’ products are primarily procured, sold and delivered in the PRC for RMB. Thus, their revenues and profits are predominantly denominated in RMB. Should the RMB devalue against United States dollar, such devaluation could have a material adverse effect on the Company’s profits and the foreign currency equivalent of such profits repatriated by the PRC entities to the Company.
Concentration of credit risk
Financial instruments that potentially expose the Company to concentrations of credit risk consist primarily of cash and accounts receivable. The Company places its cash with financial institutions with high-credit ratings and quality.
The Company conducts credit evaluations of customers and generally does not require collateral or other security from its customers. The Company establishes an allowance for doubtful accounts primarily based upon the age of the receivables and factors surrounding the credit risk of specific customers.
F-12
Table of Contents
COMTECH GROUP, INC.
NOTES TO CONSOLIDATED FINANCIAL STATEMENTS — (Continued)
(in thousands, except shares and per share amounts)
Comprehensive income
Comprehensive income is defined to include all changes in equity except those resulting from investments by owners and distributions to owners. During the years presented, the Company’s comprehensive income represents its net income.
Research and development expenses
Expenditures on research and development activities are recognised as an expense in the period in which it is incurred. These expenditures amounted to RMB6,121 (USD740), RMB983 and RMB1,042 for the years ended December 31, 2004, 2003 and 2002, respectively.
Earnings per share
Basic earnings per share is computed by dividing net income attributable to ordinary shareholders by the weighted average number of ordinary shares outstanding during the year. Diluted earnings per share gives effect to all dilutive potential common shares outstanding during the year. The weighted average number of common shares outstanding is adjusted to include the number of additional common shares that would have been outstanding if the dilutive potential common shares had been issued.
Stock-based compensation
The Company accounts for stock-based compensation using the intrinsic value method in accordance with Accounting Principles Board (“APB”) Opinion No. 25, “Accounting for Stock Issued to Employees”, and its related interpretations. Under this method, compensation cost for stock options, warrants and stock awards is measured as the excess, if any, of the quoted market price of the Company’s common stock at the date of the grant over the amount an employee must pay to acquire the stock.
F-13
Table of Contents
COMTECH GROUP, INC.
NOTES TO CONSOLIDATED FINANCIAL STATEMENTS — (Continued)
(in thousands, except shares and per share amounts)
Had compensation cost for the Company’s stock option plan and stock purchase rights been accounted for using the fair value of awards at the grant date in accordance with the method of Statement of Financial Accounting Standards No.123, “Accounting for Stock-Based Compensation”, the Company’s net income and earnings per share would have been as follows:
For the year ended December 31:
| 2004 | 2004 | 2003 | 2002 | |||||||||
| USD | RMB | RMB | RMB | |||||||||
Net income, as reported | 7,515 | 62,202 | 28,483 | 9,218 | ||||||||
Add: Stock based compensation costs as reported | 12 | 101 | — | — | ||||||||
Less: Stock based compensation costs under fair value based method for all awards | (254 | ) | (2,103 | ) | — | — | ||||||
Pro forma net income | 7,273 | 60,200 | 28,483 | 9,218 | ||||||||
Shares used in computation | ||||||||||||
Basic | 21,690,560 | 21,690,560 | 20,251,075 | 20,251,075 | ||||||||
Diluted | 21,885,053 | 21,885,053 | 20,251,075 | 20,251,075 | ||||||||
Earnings per share—basic | As reported | 0.35 | 2.87 | 1.41 | 0.46 | |||||||
| Pro forma | 0.34 | 2.78 | 1.41 | 0.46 | ||||||||
Earnings per share—diluted | As reported | 0.34 | 2.84 | 1.41 | 0.46 | |||||||
| Pro forma | 0.33 | 2.75 | 1.41 | 0.46 | ||||||||
The weighted average fair value of options granted during 2004 was RMB13.24 (USD1.60) per share, using the Black-Scholes option-pricing model based on the following assumptions:
Risk-free interest rate | 4.78% to 4.99 | % | |
Expected life | 5.25 to 6.50 years | ||
Expected volatility | 36% to 37 | % | |
Expected dividend yield | — |
Recently Issued Accounting Pronouncements
In December 2004, the FASB issued SFAS No. 123R, “Share-Based Payment”. This statement is a revision to SFAS No. 123 and supercedes APB Opinion No. 25. This statement establishes standards for the accounting for transactions in which an entity exchanges its equity instruments for goods or services, primarily focusing on the accounting for transactions in which an entity obtains employee services in share-based payment transactions. Entities will be required to measure the cost of employee services received in exchange for an award of equity instruments based on the grant-date fair value of the award (with limited exceptions). That cost will be recognized over the period during which an employee is required to provide service, the requisite service period (usually the vesting period), in exchange for the award. The grant-date fair value of employee share options and similar instruments will be estimated using option-pricing models. If an equity award is modified after the grant date, incremental compensation cost will be recognized in an amount equal to the excess of the fair value of the modified
F-14
Table of Contents
COMTECH GROUP, INC.
NOTES TO CONSOLIDATED FINANCIAL STATEMENTS — (Continued)
(in thousands, except shares and per share amounts)
award over the fair value of the original award immediately before the modification. This statement is effective as of the beginning of the annual reporting period that begins after June 15, 2005. In accordance with the standard, the Company will adopt SFAS No. 123R effective January 1, 2006.
Upon adoption, the Company has two application methods to choose from: the modified-prospective transition approach or the modified-retrospective transition approach. Under the modified-prospective transition method, the Company would be required to recognize compensation cost for share-based awards to employees based on their grant-date fair value from the beginning of the fiscal period in which the recognition provisions are first applied as well as compensation cost for awards that were granted prior to, but not vested as of the date of adoption. Prior periods remain unchanged and pro forma disclosures previously required by SFAS No. 123 continue to be required. Under the modified-retrospective transition method, the Company would restate prior periods by recognizing compensation cost in the amounts previously reported in the pro forma footnote disclosure under SFAS No. 123. Under this method, the Company is permitted to apply this presentation to all periods presented or to the start of the fiscal year in which SFAS No. 123R is adopted. The Company would follow the same guidelines as in the modified-prospective transition method for awards granted subsequent to adoption and those that were granted and not yet vested. The Company has not yet determined which methodology it will adopt but believes that the impact that the adoption of SFAS No. 123R will have on its financial position or results of operations will approximate the magnitude of the stock-based employee compensation cost disclosed in Note 2 pursuant to the disclosure requirements of SFAS No. 123.
3. INVENTORIES
| 2004 | 2004 | 2003 | ||||
| USD | RMB | RMB | ||||
Raw materials | 114 | 946 | 8,100 | |||
Finished goods | 1,808 | 14,957 | 10,250 | |||
| 1,922 | 15,903 | 18,350 | ||||
Inventories amounting to RMB628 (USD76), were written off in 2004. There was no write off of inventories in 2003 and 2002, respectively.
4. PROPERTY AND EQUIPMENT, NET
Property and equipment consist of the following:
| 2004 | 2004 | 2003 | ||||
| USD | RMB | RMB | ||||
Office building | 202 | 1,672 | 1,672 | |||
Machinery | 38 | 317 | 76 | |||
Furniture and office equipment | 246 | 2,035 | 1,073 | |||
Motor vehicles | 193 | 1,593 | 1,526 | |||
Total | 679 | 5,617 | 4,347 | |||
Less: accumulated depreciation | 278 | 2,300 | 1,386 | |||
Property and equipment, net | 401 | 3,317 | 2,961 | |||
F-15
Table of Contents
COMTECH GROUP, INC.
NOTES TO CONSOLIDATED FINANCIAL STATEMENTS — (Continued)
(in thousands, except shares and per share amounts)
Depreciation expense charged to income from operations for the year ended December 31, 2004, 2003, and 2002 was RMB913 (USD111), RMB427, and RMB455, respectively.
5. BANK BORROWINGS AND BANKING FACILITIES
On July 21, 2004, Comtech Hong Kong, a wholly-owned subsidiary of the Company, entered into a RMB33,109 (USD4,000) revolving credit facility (the “Facility”) with the Bank of Communications Hong Kong branch (the “Bank of Communication”). On September 14, 2004, the amount of the Facility was increased to RMB82,773 (USD10,000). As of December 31, 2004, the outstanding loan balance under the Facility was approximately RMB23,157 (USD2,798). These bank borrowings were raised for general working capital purposes of the Company and RMB8,095 (USD978) of them were directly used for settlement of amount owed to Comtech Global Investment Ltd. during 2004. The Facility is secured by funds on deposit with the Bank of Communication owned by Jeffrey Kang, the Company’s principal shareholder and Chief Executive Officer, in an amount equal to the borrowings. The facility bears interest at the higher of LIBOR or 1.5% over the deposit rate, payable monthly. The effective interest rate is 2.42% as of December 31, 2004.
On August 24, 2004, Comtech Communication, a wholly-owned subsidiary of the Company, entered into a factoring agreement (the “Agreement”) with Guangdong Development Bank Shenzhen branch (the “Guangdong Development Bank”). Pursuant to the Agreement, accounts receivable from UT Starcom with the maximum amount of RMB30,000 (USD3,625) can be transferred to the Guangdong Development Bank with recourse. An amount equal to 30% of the accounts receivable transferred is secured by funds of Comtech Communication deposited with the Guangdong Development Bank. The factoring arrangement bears interest at the PRC official loan interest rate as of December 31, 2004, payable monthly. The effective interest rate is 5.22% as of December 31, 2004. As of December 31, 2004, the Company had no factored accounts receivable outstanding under the Agreement and had no pledged deposit with the Guangdong Development Bank.
Certain of the Company’s customers enter into arrangements with their respective banks for a line of credit for purposes of settling their bills. Under such arrangements, the Company is entitled to collect the amounts owed directly from the customers’ banks when the invoice becomes due. These amounts are recorded as bills receivable on the consolidated balance sheet. The Company, in certain circumstances, has arranged to transfer with recourse on a revolving basis certain of its bills receivable to its bank. Under this discounting arrangement, the bank pays a discounted amount to the Company and collects the amounts owed from the customers’ banks. The discount is typically 0.8% of the balance transferred, which is recorded as interest expense. As of December 31, 2004, the Company had discounted bills receivable amounting to approximately RMB30,550 (USD3,691) under such facility arrangement. The Company had no discounted bills receivable as of December 31, 2003, and 2002 respectively.
F-16
Table of Contents
COMTECH GROUP, INC.
NOTES TO CONSOLIDATED FINANCIAL STATEMENTS — (Continued)
(in thousands, except shares and per share amounts)
6. ACCRUED EXPENSES AND OTHER LIABILITIES
The components of accrued expenses and other liabilities are as follows:
| 2004 | 2004 | 2003 | ||||
| USD | RMB | RMB | ||||
Legal and professional fees | 436 | 3,609 | 828 | |||
Commission fee payables | 346 | 2,869 | — | |||
Other accruals and liabilities | 245 | 2,028 | 2,917 | |||
| 1,027 | 8,506 | 3,745 | ||||
7. INCOME TAXES
The provision for income taxes consists of the following:
| 2004 | 2004 | 2003 | 2002 | |||||
| USD | RMB | RMB | RMB | |||||
PRC, excluding Hong Kong | 247 | 2,046 | 1,187 | 740 | ||||
Hong Kong | 31 | 254 | 108 | 80 | ||||
| 278 | 2,300 | 1,295 | 820 | |||||
The subsidiaries that are incorporated in the Cayman Islands and the British Virgin Islands are not subject to income taxes under those jurisdictions.
The PRC statutory tax rate is 33%. Shenzhen Comtech, Comtech Communication and Comtech Software are located in the Shenzhen Special Economic Zone in the PRC, which is subject to a reduced tax rate of 15%. Since the PRC subsidiaries have agreed to operate for a minimum of 10 years in the PRC, a two-year tax holiday from the first year profit making year is available, following which in the third through fifth years there is a 50% reduction to 7.5%. The following details the tax concessions received for the Company’s PRC subsidiaries:
| Ø | Shenzhen Comtech is subject to a PRC preferential income tax rate at 7.5% in 2002, 2003 and 2004. |
| Ø | Comtech Communication is under a tax holiday in 2003 and 2004, and a lower income tax rate of 7.5% until 2007. |
| Ø | Comtech Software has no assessable profit in 2004 and is currently applying for a tax holiday in the PRC. |
Shanghai E & T is located in Shanghai Qingpu Zone and is taxed on a deemed basis at 0.5% of its turnover in accordance with the tax guidelines issued by the local tax authority in Qingpu Zone in 2004.
Comtech Hong Kong is subject to Profit Taxes in Hong Kong at 16% in 2002, and 17.5% in 2003 and 2004.
F-17
Table of Contents
COMTECH GROUP, INC.
NOTES TO CONSOLIDATED FINANCIAL STATEMENTS — (Continued)
(in thousands, except shares and per share amounts)
A reconciliation of income tax expense to the amount computed by applying the PRC statutory tax rate to the income before income tax in the consolidated statements of operations is as follows:
| 2004 | 2004 | 2003 | 2002 | |||||||||
| USD | RMB | RMB | RMB | |||||||||
Income before income tax | 8,051 | 66,635 | 29,778 | 10,038 | ||||||||
PRC statutory tax rate | 33 | % | 33 | % | 33 | % | 33 | % | ||||
Income tax expense at PRC statutory tax rate | 2,657 | 21,990 | 9,827 | 3,313 | ||||||||
Effect of preferential income tax rate | (1,529 | ) | (12,656 | ) | (5,082 | ) | (2,425 | ) | ||||
Effect of tax exemptions granted to a PRC subsidiary | (870 | ) | (7,199 | ) | (5,147 | ) | — | |||||
Effect of the different income tax rate in other tax jurisdictions | (27 | ) | (225 | ) | (91 | ) | (90 | ) | ||||
Non-deductible (taxable) items | 54 | 448 | 1,444 | (4 | ) | |||||||
Others | (7 | ) | (58 | ) | 344 | 26 | ||||||
| 278 | 2,300 | 1,295 | 820 | |||||||||
There was no significant deferred tax asset or liability as of December 31, 2004, and 2003.
Tax that would otherwise have been payable without tax holiday and tax concessions amounts to approximately RMB19,855 (USD2,399), RMB10,229, RMB2,425 in the years ended December 31, 2004, 2003, and 2002, respectively (representing a decrease in the basic earnings per share of RMB0.92, RMB0.51, and RMB0.12 and diluted earnings per share of RMB0.91, RMB0.51, and RMB0.12 in the years ended December 31, 2004, 2003 and 2002, respectively).
For United States federal income tax purposes, the Company has assumed net operating loss carry-forwards of approximately $12.7 million from the Parent as part of the Share Exchange Transaction. These losses will expire from 2006 through 2020. It is management’s opinion that it is more likely than not such loss carry-forwards will not be realised, therefore, full valuation allowance has been provided. In addition, United States income taxes have not been provided on unremitted earnings of subsidiaries located outside of the United States as such earnings are considered to be permanently reinvested.
8. STOCK-BASED COMPENSATION
In 1995, the Parent Board of Directors adopted, and the stockholders approved, the 1995 Stock Option Plan for Outside Directors (the “Directors’ Plan”), pursuant to which 5,000 options would be granted annually to each non-employee director of Parent for each full fiscal year of service on the Board. As part of the Share Exchange Transaction with Parent, the Company assumed fully vested options under the Directors’ Plan to purchase 115,000 shares of the Company’s common stock. In addition to the options under the Directors’ Plan, the Company also assumed 925,417 fully exercisable common stock warrants. Each warrant represents the right to receive 1 share of the Company’s common stock. The Directors’ Plan expires on December 31, 2005, however, the options exercisable under the Directors’ Plan terminate on July 1, 2009. The Company does not intend to issue any additional options under the Directors’ Plan.
On August 3, 2004, the Board of Directors adopted the Comtech Group, Inc. 2004 Stock Incentive Plan (the “Incentive Plan”) pursuant to which 2,500,000 shares of Common Stock are reserved for issuance upon exercise of stock options, and for the issuance of stock appreciation rights, restricted stock awards and performance shares. As at December 31, 2004, 600,000 shares of Common Stock are remaining available for future issuance under the Incentive Plan. The purpose of the Incentive Plan is to provide
F-18
Table of Contents
COMTECH GROUP, INC.
NOTES TO CONSOLIDATED FINANCIAL STATEMENTS — (Continued)
(in thousands, except shares and per share amounts)
additional incentive to employees, directors, advisors and consultants by facilitating their acquisition of the Company’s common stock. The Incentive Plan provides for a term of 10 years from the date of its adoption by the Board of Directors, after which no awards may be made, unless the Plan is earlier terminated by the Board. Options granted under the Incentive Plan are either incentive stock options (i.e. options that afford favorable tax treatment to recipients upon compliance with certain restrictions pursuant to Section 422 of the Internal Revenue Code and that do not result in tax deductions to us unless participants fail to comply with Section 422 of the Internal Revenue Code) or options that do not so qualify.
The Directors’ Plan and the Incentive Plan are administered by the Compensation Committee of the Board of Directors. The Compensation Committee selects the employees to whom awards are to be granted, the number of shares to be subject to such awards, and the terms and conditions of such awards (provided that any discretion exercised by the Compensation Committee must be consistent with resolutions adopted by the Board of Directors and the terms of the Incentive Plan).
The following summarizes the options and warrants outstanding:
| Stock warrants | Stock options | |||||||
| Exercise price | Number of shares | Exercise price | Number of shares | |||||
| USD | USD | |||||||
Outstanding at January 1, 2002, 2003 and 2004 | — | — | — | — | ||||
Stock warrants assumed upon the Share Exchange Transaction on July 22, 2004 | 2.50 | 440,965 | — | — | ||||
Stock warrants assumed upon the Share Exchange Transaction on July 22, 2004 | 3.00 | 484,452 | — | — | ||||
Stock options assumed upon the Share Exchange Transaction on July 22, 2004 | — | — | 3.00 | 115,000 | ||||
Stock options granted under the Incentive Plans on August 16, 2004 | — | — | 3.00 | 210,000 | ||||
Stock options granted under the Incentive Plans on November 11, 2004 | — | — | 3.74 | 1,690,000 | ||||
Outstanding at December 31, 2004 | 925,417 | 2,015,000 | ||||||
The average exercise price for the stock warrants and stock options are USD2.76 per share and USD3.62 per share, respectively.
The warrants and options assumed from Parent expire on July 1, 2009 and are all exercisable as of December 31, 2004.
Of the 210,000 options, options vest as follows: (1) 39,375 shares vest on February 1, 2005 or vesting in equal monthly installments over the six months from August 16, 2004 (2) 118,125 shares vest in equal monthly installments over the period from February 2, 2005 to August 1, 2006, and (3) 52,500 shares vest in equal monthly installments over the period from August 2, 2006 to August 1, 2007. With respect to the 1,690,000 options granted, 20,000 options were fully vested in 2004, 52,500 options vest quarterly during the year following the date of grant, and the remaining 1,617,500 options vest quarterly over a period of 3 years starting from the date of the grant.
F-19
Table of Contents
COMTECH GROUP, INC.
NOTES TO CONSOLIDATED FINANCIAL STATEMENTS — (Continued)
(in thousands, except shares and per share amounts)
The options granted under the Incentive Plan expire 10 years from the date of the grant. Compensation cost recognised for the year ended December 31, 2004 under APB Opinion No. 25 amounted to RMB101 (USD12). The Company has no compensation cost recognised under APB Opinion No. 25 for the year ended December 31, 2003 and 2002, respectively.
9. EARNINGS PER SHARE
Basic earnings per share are computed by dividing net income by the weighted average number of shares of common stock outstanding for the period. Diluted earnings per share are computed by dividing net income by the sum of (a) the weighted average number of shares of common stock outstanding during the period and (b) the dilutive effect of potential common stock equivalents during the period. The weighted average number of shares used for the computation of diluted earnings per share is as follows:
| 2004 | 2003 | 2002 | ||||
Weighted average number of shares outstanding—basic | 21,690,560 | 20,251,075 | 20,251,075 | |||
Dilutive effect of stock options and warrants | 194,493 | — | — | |||
Weighted average number of shares outstanding—diluted | 21,885,053 | 20,251,075 | 20,251,075 | |||
As disclosed in note 1, in connection with the Share Exchange Transaction, the terms of the Exchange Agreement with Parent provide for the issuance of up to 30,173,047 additional shares to the original holders of Comtech Group in the event there is a breach of any representations, warranties, covenants or obligations made by Parent in the Exchange Agreement, which indemnification provision will expire 30 days following the date of filing of the Company’s annual report on Form 10-K, but in no event earlier than April 30, 2005. The issuance of additional shares pursuant to this indemnification provision would result in dilution to other shareholders. The above diluted earnings per share calculations have not included these contingently issuable shares because the Company is not aware of any such breach or the threat of a breach as of December 31, 2004.
Further, the Company entered into an employment contract with its Chief Financial Officer (“Employment Contract”), the terms of the Employment Contract provide that in the event the Company engages in an underwritten offering of shares of common stock which yields gross proceeds to the Company in excess of RMB248,319 (USD30,000), all of the 210,000 stock options will accelerate and be fully vested. As of December 31, 2004, the Company did not consider the acceleration of the vesting to be probable.
10. MINORITY INTEREST
Minority interests represent a 40% interest in Shanghai E & T and a 1.4% interest in OAM S.P.A. held by the minority shareholders.
11. SEGMENT AND GEOGRAPHIC INFORMATION
The Company’s chief operating decision maker has been identified as the Chief Executive Officer, who reviews consolidated results when making decisions about allocating resources and assessing performance of the Company. The Company believes it operates in one segment, and all financial segment information can be found in the consolidated financial statements.
F-20
Table of Contents
COMTECH GROUP, INC.
NOTES TO CONSOLIDATED FINANCIAL STATEMENTS — (Continued)
(in thousands, except shares and per share amounts)
Geographic Information
The Company has substantially all of its operations in the PRC, and accordingly attributes all of its revenues to these operations based on the selling location. All of the Company’s long lived assets are located in the PRC.
12. COMMITMENTS AND CONTINGENCIES
(a) The Company has operating lease agreements principally for its office facilities. The leases have remaining terms of one to thirty-six months. Rental expense was RMB1,590 (USD192), RMB418 and RMB958 for the years ended December 31, 2004, 2003 and 2002, respectively.
Future minimum lease payments under non-cancellable operating lease agreements as of December 31, 2004 were as follows:
| 2004 | 2004 | |||
| USD | RMB | |||
Fiscal year | ||||
2005 | 158 | 1,307 | ||
2006 | 85 | 703 | ||
Total | 243 | 2,010 | ||
(b) As at December 31, 2004, the Company has outstanding purchase orders for components from suppliers in the amount of approximately RMB21,404 (USD2,586). The Company does not have any minimum purchase obligations with these suppliers. Other than as disclosed above, the Company had no other contractual obligations and had no off-balance sheet guarantees or arrangements or transactions as at December 31, 2004.
13. RELATED PARTY BALANCES AND TRANSACTIONS
Related Party Balances
Amount due to other related party
| 2004 | 2004 | 2003 | ||||
| USD | RMB | RMB | ||||
Matsunichi Electronics (Hong Kong) Limited (“Matsunichi”) | 192 | 1,592 | 1,592 | |||
Viewtran Technology Limited (“Viewtran”) | 73 | 600 | — | |||
| 265 | 2,192 | 1,592 | ||||
Mr. Kang Jing Wei has a controlling interest in Viewtran and Matsunichi.
Amount due to holding company
Comtech Global Investment Ltd. | — | — | 50,356 | |||
The amount due to other related party and amount due to holding company represent cash advances to or from them and were unsecured, non-interest bearing and had no fixed repayment terms.
F-21
Table of Contents
COMTECH GROUP, INC.
NOTES TO CONSOLIDATED FINANCIAL STATEMENTS — (Continued)
(in thousands, except shares and per share amounts)
Related Party Transactions
In 2003, the Company acted as an agent for Viewtran for certain sales transactions, totalling RMB5,456 (USD659). The Company recorded no profit or loss on these transactions. The agreement under which the Company carried out these transactions expired on December 31, 2003.
14. MAINLAND CHINA PROFIT APPROPRIATION
Pursuant to the PRC laws, the Company’s PRC subsidiaries are required, where applicable, to allocate a portion of their net profits (as determined under accounting principles and financial regulations applicable to PRC enterprises at each year end) to certain funds before distributing dividends, including at least 10% of their net profits to certain reserve funds until the balance of such fund has reached 50% of their registered capital; and an additional 5% to 10% of their net profits to a statutory common welfare fund. These reserves can only be used for specific purposes and are not distributable as dividends. The balance of these reserves shown in the management accounts and statutory accounts of the Company’s PRC subsidiaries amounted to RMB7,892 and RMB5,380 as of December 31, 2004 and 2003, respectively.
15. CONCENTRATION OF CREDIT
A substantial percentage of the Company’s sales are made to four customers. Details of the customers accounting for 10% or more of total net revenue in any of the years ended December 31, 2004, 2003 and 2002 are as follows:
| 2004 | 2003 | 2002 | |||||||
Company A | 11 | % | 24 | % | 30 | % | |||
Company B | 13 | % | 14 | % | * | ||||
Company C | 12 | % | * | * | |||||
Company D | * | * | 12 | % |
| * | Less than 10% |
Details of the accounts receivable from the three customers with the largest receivable balances at December 31, 2004 and 2003 are as follows:
| Percentage of accounts receivable | ||||||
| 2004 | 2003 | |||||
Company A | 18 | % | — | |||
Company B | 10 | % | 11 | % | ||
Company C | 6 | % | — | |||
Company D | — | 10 | % | |||
Company E | — | 8 | % | |||
Three largest receivable balances | 34 | % | 29 | % | ||
F-22
Table of Contents
COMTECH GROUP, INC.
NOTES TO CONSOLIDATED FINANCIAL STATEMENTS — (Continued)
(in thousands, except shares and per share amounts)
16. EMPLOYEE BENEFIT PLANS
Certain employees of the Company in the PRC are entitled to retirement benefits based on their salaries and length of service upon retirement in accordance with a PRC government-managed retirement plan. The PRC government is directly responsible for the payments of the benefits to these retired employees. The Company is required to make contributions to the government-managed retirement plan at 6.5% to 9% of the monthly basic salaries of certain employees. The expense of such arrangements to the Company for the year ended December 31, 2004, 2003 and 2002 was RMB270 (USD33), RMB179 and RMB87, respectively.
The Company operates a Mandatory Provident Fund Scheme for all qualifying employees in Hong Kong. The assets of the scheme are held separately from those of the Company by trustees. The Company contributes 5% of relevant payroll costs to the scheme, which contribution is matched by employees. The contributions paid by the Company for the years ended December 31, 2004, 2003 and 2002 were RMB32 (USD4), RMB34 and RMB36, respectively.
17. SUBSEQUENT EVENT
As stated in note 1, the Company’s board of directors approved a one-for-two reverse stock split of the Company’s common stock on January 14, 2005. The reverse stock split was effected on the market open on January 14, 2005 thereby reducing 50,722,050 shares of issued common stock to 25,361,025 shares. All per share amounts and outstanding shares, including all common stock equivalents (stock options and warrants), have been retroactively restated in the accompanying consolidated financial statements and notes thereto for all periods presented to reflect the reverse stock split.
On January 17, 2005 and February 23, 2005, the Company entered into an Equity Joint Venture Agreement with Broadwell Group Ltd. (“Broadwell”) to establish a joint venture in Hong Kong (the “JV”) and a Memorandum of Understanding on Equity Joint Venture Agreement between the Company and Broadwell, respectively. The Company will hold 55% of the equity interests in the JV and Broadwell will hold 45% of the equity interests. The JV will distribute semiconductor and other related products for Broadcom Singapore, a subsidiary of Broadcom Corporation, as well as other products introduced by Broadwell. Pursuant to the Memorandum of Understanding on Equity Joint Venture Agreement, the Company shall not have any commitment on providing operational funding and credit facilities to the JV.
On January 19, 2005, Comtech Group, Inc. granted 30,000 stock options to two of its directors under the Comtech Group, Inc. 2004 Stock Incentive Plan at an exercise price of USD5.50 per share. The 30,000 stock options are vesting quarterly for a period of 3 years from the date of grant.
On January 31, 2005, the Company has agreed to issue common stock warrants of 325,000 shares to the financial advisor as part of the financial advisory fee payable in connection with the Share Exchange Transaction of the Company consummated in July 22, 2004. The holders of these common stock warrants were granted piggyback registration rights.
F-23
Table of Contents
INTERIM FINANCIAL STATEMENTS (UNAUDITED)
UNAUDITED CONDENSED CONSOLIDATED BALANCE SHEET
As of March 31, 2005 and December 31, 2004
| Mar 31, 2005 | Mar 31, 2005 | Dec 31, 2004 | |||||||
| US$’000 | RMB’000 | RMB’000 | |||||||
| Assets | |||||||||
Current assets: | |||||||||
Cash | 5,168 | 42,771 | 41,444 | ||||||
Trade accounts receivable, net of allowance for doubtful accounts | 24,350 | 201,532 | 168,989 | ||||||
Bills receivable | 4,363 | 36,109 | 77,338 | ||||||
Other receivables | 465 | 3,852 | 2,176 | ||||||
Inventories | 3,989 | 33,017 | 15,903 | ||||||
Total current assets | 38,335 | 317,281 | 305,850 | ||||||
Property and equipment, net | 419 | 3,467 | 3,317 | ||||||
Total Assets | 38,754 | 320,748 | 309,167 | ||||||
| Liabilities and shareholders’ equity | |||||||||
Current liabilities: | |||||||||
Trade accounts payable | 8,502 | 70,370 | 53,063 | ||||||
Bank borrowings | 4,137 | 34,236 | 53,707 | ||||||
Amount due to other related party | 192 | 1,592 | 2,192 | ||||||
Income tax payable | 345 | 2,857 | 1,487 | ||||||
Accrued expenses and other liabilities | 730 | 6,043 | 8,506 | ||||||
Total current liabilities | 13,906 | 115,098 | 118,955 | ||||||
Minority interests | 596 | 4,933 | 4,204 | ||||||
Shareholders’ equity | |||||||||
Common stock | 255 | 2,113 | 2,099 | ||||||
Additional paid-in capital | 14,165 | 117,236 | 118,383 | ||||||
Deferred stock-based compensation | (26 | ) | (216 | ) | (247 | ) | |||
Retained earnings | 9,858 | 81,584 | 65,773 | ||||||
Total stockholders’ equity | 24,252 | 200,717 | 186,008 | ||||||
Total liabilities and stockholders’ equity | 38,754 | 320,748 | 309,167 | ||||||
See notes to condensed consolidated financial statements.
Q-1
Table of Contents
UNAUDITED CONDENSED CONSOLIDATED STATEMENTS OF OPERATIONS
Three months ended March 31, 2005 and 2004
| Three months ended March 31, | | ||||||||
| 2005 | 2005 | 2004 | |||||||
| US$’000 | RMB’000 | RMB’000 | |||||||
Net revenue | 20,782 | 172,001 | 153,754 | ||||||
Cost of revenues | (17,606 | ) | (145,716 | ) | (130,092 | ) | |||
Gross profit | 3,176 | 26,285 | 23,662 | ||||||
Selling, general and administrative expenses | (797 | ) | (6,607 | ) | (2,520 | ) | |||
Research and development expenses | (156 | ) | (1,287 | ) | (809 | ) | |||
Income from operations | 2,223 | 18,391 | 20,333 | ||||||
Interest expense | (47 | ) | (393 | ) | (322 | ) | |||
Interest income | 3 | 29 | 11 | ||||||
Income before income tax | 2,179 | 18,027 | 20,022 | ||||||
Income tax | (180 | ) | (1,487 | ) | (465 | ) | |||
Income before minority interests | 1,999 | 16,540 | 19,557 | ||||||
Minority interests | (88 | ) | (729 | ) | (697 | ) | |||
Net income | 1,911 | 15,811 | 18,860 | ||||||
Earnings per share | |||||||||
- Basic | 0.08 | 0.62 | 0.93 | ||||||
- Diluted | 0.07 | 0.59 | 0.93 | ||||||
Weighted average number of shares outstanding | |||||||||
- Basic | 25,381,853 | 25,381,853 | 20,251,075 | ||||||
- Diluted | 26,871,865 | 26,871,865 | 20,251,075 | ||||||
See notes to condensed consolidated financial statements.
Q-2
Table of Contents
UNAUDITED CONDENSED CONSOLIDATED STATEMENTS OF CASH FLOWS
Three months ended March 31, 2005 and 2004
| Three months ended March 31, | | ||||||||
| 2005 | 2005 | 2004 | |||||||
| US$’000 | RMB’000 | RMB’000 | |||||||
Cash flows from operating activities: | |||||||||
Net income | 1,911 | 15,811 | 18,860 | ||||||
Adjustments to reconcile net income to net cash provided by (used in) operating activities: | |||||||||
Depreciation expense | 22 | 180 | 157 | ||||||
Minority interest | 88 | 729 | 697 | ||||||
Stock based compensation cost | 4 | 31 | 0 | ||||||
Changes in operating assets and liabilities: | |||||||||
Trade accounts receivable | (3,932 | ) | (32,543 | ) | (39,439 | ) | |||
Bills receivable | 4,982 | 41,229 | 8,567 | ||||||
Other receivables | (203 | ) | (1,676 | ) | (1,909 | ) | |||
Inventories | (2,068 | ) | (17,114 | ) | (13,527 | ) | |||
Trade accounts payable | 2,091 | 17,307 | 23,403 | ||||||
Amount due to other related party | (72 | ) | (600 | ) | — | ||||
Income tax payable | 166 | 1,370 | (301 | ) | |||||
Accrued expenses and other liabilities | (296 | ) | (2,449 | ) | 2,266 | ||||
Cash provided by (used in) operating activities | 2,693 | 22,275 | (1,226 | ) | |||||
Cash flows from investing activities: | |||||||||
Acquisition of a new business | — | — | (906 | ) | |||||
Purchases of property and equipment | (40 | ) | (330 | ) | (17 | ) | |||
Changes in other assets | �� | — | — | 344 | |||||
Cash used in investing activities | (40 | ) | (330 | ) | (579 | ) | |||
Cash flows from financing activities: | |||||||||
Payment of transaction cost in connection with issue of shares | (139 | ) | (1,147 | ) | 0 | ||||
Repayment of bank borrowings | (2,353 | ) | (19,471 | ) | 0 | ||||
Repayment of amount due to holding company | 0 | 0 | (7,000 | ) | |||||
Cash used in financing activities | (2,492 | ) | (20,618 | ) | (7,000 | ) | |||
Net increase (decrease) in cash and cash equivalents | 161 | 1,327 | (8,805 | ) | |||||
Cash at beginning of the period | 5,007 | 41,444 | 30,683 | ||||||
Cash at end of the period | 5,168 | 42,771 | 21,878 | ||||||
See notes to condensed consolidated financial statements.
Q-3
Table of Contents
NOTES TO CONDENSED CONSOLIDATED FINANCIAL STATEMENTS
(in thousands, except shares and per share amounts)
Note 1—Basis Of Presentation
The accompanying unaudited condensed consolidated financial statements of Comtech Group, Inc., (formerly Trident Rowan Group Inc, (the “Parent”) and its subsidiaries (together, the “Company”)) have been prepared in accordance with the instructions to Form 10-Q and Rule 10-01 of Regulation S-X. Certain information and footnote disclosures normally included in financial statements prepared in accordance with United States generally accepted accounting principles have been condensed or omitted. For a summary of the Company’s accounting principles, and other footnote information, reference is made to the Registrant’s Audited Consolidated Financial Statements for the years ended December 31, 2002, 2003 and 2004 included elsewhere in this prospectus. The interim financial statements and notes thereto should be read in conjunction with the financial statements and notes included elsewhere in this prospectus. All adjustments necessary for the fair presentation of the results of operations for the interim periods covered by this report have been included. All such adjustments are of a normal and recurring nature. The results of operations for the three months ended March 31, 2005 are not necessarily indicative of the operating results for the full year.
The condensed consolidated financial statements are reported in Renminbi (“RMB”) because all of the Company’s material operating entities are based in and operated entirely within the People’s Republic of China. The translation of RMB amounts into U.S. dollar amounts is included solely for the convenience of the readers of the financial statements and has been calculated at the rate of US$1 to RMB 8.2765, the approximate exchange rate at March 31, 2005. Such transactions should not be construed as representations that the RMB amounts could be converted into USD at that rate or any other rate.
Note 2—Organization And Nature Of Business
The Company provides over 500 customized module design solutions and product lines integrating components from many suppliers to various manufacturers in the wireless handset and telecom equipment industries in China. The Company purchases the specific components and generates revenue through the sale of the specific components that are incorporated in their modules.
Mr. Jeffrey Kang, the Company’s principal shareholder and chief executive officer, directly or through entities he controls, currently has a controlling interest in the Company. Mr. Kang thus has the ability to control the outcome of all matters requiring shareholder approval, including the election of directors and approval of significant corporate transactions, such as mergers, consolidations or the sale of substantially all of the Company’s assets.
The Share Exchange Transaction
On May 25, 2004, the Parent entered into a Share Exchange Agreement (the “Exchange Agreement”) with Comtech Group pursuant to which the Parent acquired all of the issued and outstanding shares of Comtech Group in exchange for the issuance in the aggregate of 20,251,075 shares of the Parent on July 22, 2004. As a result of the transaction, Comtech Group became a wholly-owned subsidiary of the Parent and because the former shareholders of Comtech Group acquired approximately 91.2% of the Parent’s outstanding stock, the Share Exchange Transaction was accounted for as a reverse acquisition in which Comtech Group was deemed to be the accounting acquirer and the Parent the legal acquirer. The Parent changed its name to Comtech Group, Inc. on August 2, 2004.
Q-4
Table of Contents
COMTECH GROUP, INC.
NOTES TO CONDENSED CONSOLIDATED FINANCIAL STATEMENTS — (CONTINUED)
(in thousands, except shares and per share amounts)
As a result of the Share Exchange Transaction the historical consolidated financial statements of the Company for periods prior to the date of the transaction are those of Comtech Group, as the accounting acquirer, and all references to the consolidated financial statements of the Company apply to the historical financial statements of Comtech Group prior to the transaction and the consolidated financial statements of the Company subsequent to the transaction. The Company’s shares have been restated retroactively to reflect the share exchange ratio as at the date of the transaction in a manner similar to a stock split.
As a part of the Share Exchange Transaction, the Company assumed fully vested options previously issued by the Parent to purchase 115,000 shares of common stock with an exercise price of USD3.00 per share. Additionally, the Company assumed 925,417 fully exercisable common stock warrants. Each warrant represents the right to receive 1 share of the Company’s common stock, at an exercise price of USD3.00 per share for 484,452 common stock warrants and USD2.50 per share for 440,965 common stock warrants. The options and warrants assumed from the Parent expire on July 1, 2009.
The Company’s board of directors approved a one-for-two reverse stock split of the Company’s common stock on January 14, 2005. All per share amounts and outstanding shares, including all common stock equivalents (stock options and warrants), have been retroactively restated in the accompanying condensed consolidated financial statements and notes thereto for all periods presented to reflect the reverse stock split.
The terms of the Exchange Agreement provide for the issuance of up to 30,173,047 additional shares to the original shareholders of Comtech Group in the event there is a breach of any representations, warranties, covenants or obligations made by the Parent in the Exchange Agreement, which indemnification provision expired on April 30, 2005. On April 26, 2005, the Company sent a notice in relation to any potential damages in connection with a possible claim relating to a transaction entered into by the Parent prior to the consummation of the Exchange Agreement regarding Centerpoint Corporation.
Newly Formed Subsidiaries
On January 18, 2004, the Company signed an agreement to acquire 60% of Shanghai E&T System Co., Ltd., which is located in the PRC, for cash consideration of RMB1,200 (USD145). The total assets and liabilities of the acquired subsidiary was RMB9,235 (USD1,116) and RMB8,035 (USD971), respectively.
On March 18, 2004, the Company established a 100% owned subsidiary, Comtech Software Technology (Shenzhen) Co, Ltd., in the PRC. The Company contributed RMB4,966 (USD600) to this new subsidiary, which represented 100% of the registered capital of this subsidiary.
On May 12, 2005, the Company entered an agreement related to United Information Technology Co. Ltd. (“UIT”), its newly established wholly owned subsidiary (the “Agreement”). UIT will engage in the storage solution business through a wholly owned subsidiary in the PRC. Pursuant to the Agreement, the Company agreed to inject into UIT an aggregate sum of USD4,000 in loan advances for working capital purposes, which will be made up of USD2,500 payable in May 2005 and USD1,500 payable in August 2005. In addition, UIT will license certain related technology from a third party who owns such technology at zero cost. If UIT reaches certain milestones specified in the Agreement, UIT will have an obligation in 2006 to purchase such technology and related intellectual property from the third party, and as a consideration of such purchase, UIT will issue a certain percentage of its equity to the third party.
Q-5
Table of Contents
COMTECH GROUP, INC.
NOTES TO CONDENSED CONSOLIDATED FINANCIAL STATEMENTS — (CONTINUED)
(in thousands, except shares and per share amounts)
Note 3—Summary Of Principal Accounting Policies
The accompanying consolidated financial statements have been prepared in accordance with accounting principles generally accepted in the United States of America (“US GAAP”).
Revenue recognition
Sales of telecommunication system equipment, wireless handset components and network protection devices are recorded when the equipment is delivered, title has passed to the customers and the Company has no further obligations to provide services related to the operation of such equipment. Revenue is recorded net of value added tax incurred. Such value added taxes amounted to 21,594 thousand (USD2,609 thousand) and RMB24,631, for the quarter ended March 31, 2005 and 2004, respectively.
Translation into United States Dollars
The financial statements of the Company are stated in RMB. The translation of RMB amounts at and for the quarter ended March 31, 2005 into United States dollars (“USD”) are included solely for the convenience of readers and have been made at the rate of RMB 8.2765 to USD1. Such translations should not be construed as representations that RMB amounts could be converted into USD at that rate or any other rate.
Research and development expenses
Expenditures on research and development activities is recognised as an expense in the period in which it is incurred. These expenditures amounted to RMB1,287 (USD156) and RMB809 for the quarters ended March 31, 2005 and 2004, respectively.
Recently Issued Accounting Pronouncements
In December 2004, the FASB issued SFAS No. 123R, “Share-Based Payment”. This statement is a revision to SFAS No. 123 and supercedes APB Opinion No. 25. This statement establishes standards for the accounting for transactions in which an entity exchanges its equity instruments for goods or services, primarily focusing on the accounting for transactions in which an entity obtains employee services in share-based payment transactions. Entities will be required to measure the cost of employee services received in exchange for an award of equity instruments based on the grant-date fair value of the award (with limited exceptions). That cost will be recognized over the period during which an employee is required to provide service, the requisite service period (usually the vesting period), in exchange for the award. The grant-date fair value of employee share options and similar instruments will be estimated using option-pricing models. If an equity award is modified after the grant date, incremental compensation cost will be recognized in an amount equal to the excess of the fair value of the modified award over the fair value of the original award immediately before the modification. This statement is effective as of the beginning of the annual reporting period that begins after June 15, 2005.
In accordance with the standard, the Company will adopt SFAS No. 123R effective January 1, 2006. Upon adoption, the Company has two application methods to choose from: the modified-prospective transition approach or the modified-retrospective transition approach. Under the modified-prospective transition method, the Company would be required to recognize compensation cost for share-based awards to employees based on their grant-date fair value from the beginning of the fiscal period in which the recognition provisions are first applied as well as compensation cost for awards that were granted
Q-6
Table of Contents
COMTECH GROUP, INC.
NOTES TO CONDENSED CONSOLIDATED FINANCIAL STATEMENTS — (CONTINUED)
(in thousands, except shares and per share amounts)
prior to, but not vested as of the date of adoption. Prior periods remain unchanged and pro forma disclosures previously required by SFAS No. 123 continue to be required. Under the modified-retrospective transition method, the Company would restate prior periods by recognizing compensation cost in the amounts previously reported in the pro forma footnote disclosure under SFAS No. 123. Under this method, the Company is permitted to apply this presentation to all periods presented or to the start of the fiscal year in which SFAS No. 123R is adopted. The Company would follow the same guidelines as in the modified-prospective transition method for awards granted subsequent to adoption and those that were granted and not yet vested. The Company has not yet determined which methodology it will adopt but believes that the impact that the adoption of SFAS No. 123R will have on its financial position or results of operations will approximate the magnitude of the stock-based employee compensation cost disclosed in Note 5 pursuant to the disclosure requirements of SFAS No. 123.
Note 4—Financing Arrangements
Certain of the Company’s customers enter into arrangements with their respective banks for purposes of settling their bills. Under such arrangements, the Company is entitled to collect the amounts owed directly from the customers’ banks when the invoice becomes due. These amounts are recorded as bills receivable on the consolidated balance sheet. The Company, in certain circumstances, has arranged to transfer with recourse certain of its bills receivable to its bank. Under this discounting arrangement, the bank pays a discounted amount to the Company and collects the amounts owed from the customers’ banks. The discount is typically 0.8% of the balance transferred, which is recorded as interest expense. As of March 31, 2005, the Company had discounted bills receivable amounting to approximately RMB10,878 thousand (USD1,314 thousand). The Company had no discounted bills receivable as of March 31, 2004.
Note 5—Stock-Based Compensation
Had compensation cost for the Company’s stock option plan and stock purchase rights been accounted for using the fair value of awards at the grant date in accordance with the method of Statement of Financial Accounting Standards No.123, “Accounting for Stock-Based Compensation”, the Company’s net income and earnings per share would have been as follows:
For the three month period ended March 31, 2005:
| RMB’000 | |||
| (except per share numbers) | |||
Net income, as reported | 15,811 | ||
Add: Stock based compensation costs as reported | 31 | ||
Less: Stock based compensation costs under fair value based method for all awards | (2,320 | ) | |
Net income, pro forma | 13,522 | ||
Earnings per share—basic | |||
As reported | 0.62 | ||
Pro forma | 0.53 | ||
Earnings per share—diluted | |||
As reported | 0.59 | ||
Pro forma | 0.50 |
Q-7
Table of Contents
COMTECH GROUP, INC.
NOTES TO CONDENSED CONSOLIDATED FINANCIAL STATEMENTS — (CONTINUED)
(in thousands, except shares and per share amounts)
The weighted average fair value of options granted for the Company’s option was RMB13.41 (USD1.62) per share, using the Black-Scholes option-pricing model based on the following assumptions:
| Risk-free interest rate | 4.78% to 4.99% | |
| Expected life | 5.25 to 6.50 years | |
| Expected volatility | 36% to 37% | |
| Expected dividend yield | — |
Note 6—Earnings Per Share
Basic earnings per share are computed by dividing net income by the weighted average number of shares of common stock outstanding for the period. Diluted earnings per share are computed by dividing net income by the sum of (a) the weighted average number of shares of common stock outstanding during the period and (b) the dilutive effect of potential common stock equivalents during the period. The weighted average number of shares used for the computation of diluted earnings per share is as follows:
Three month period ended March 31, 2005 | Three month period ended March 31, 2004 | |||
Weighted average number of shares outstanding—basic | 25,381,853 | 20,251,075 | ||
Dilutive effect of stock options and warrants | 1,490,012 | — | ||
Weighted average number of shares outstanding—diluted | 26,871,865 | 20,251,075 |
As disclosed in note 2, in connection with the Share Exchange Transaction, the terms of the Exchange Agreement with the Parent provide for the issuance of up to 30,173,047 additional shares to the original holders of Comtech Group in the event there is a breach of any representations, warranties, covenants or obligations made by Parent in the Exchange Agreement, which indemnification provision expired on April 30, 2005. The issuance of additional shares pursuant to this indemnification provision would result in dilution to other shareholders. Further, the Company entered into an employment contract with its Chief Financial Officer (“Employment Contract”), the terms of which provide that in the event the Company engages in an underwritten offering of shares of common stock which yields gross proceeds to the Company in excess of RMB248,295 (USD30,000), all of the 210,000 stock options will accelerate and be fully vested.
Note 7—Subsequent Events
On April 26, 2005, the Company sent a notice in connection with any potential damages in connection with a possible claim discussed in note 2.
On April 1, 2005, the Company entered into an operating lease with its related company, Viewtran Technology Limited (“Viewtran”), with respect to a property to be used for research and development purposes. The property is located at High-tech Industrial Park in Shenzhen of PRC, with a total area of 354 square meter. The monthly rental is RMB28 (USD3), including property management fee and utility charges, and the lease period ends on March 31, 2006.
Q-8
Table of Contents
COMTECH GROUP, INC.
NOTES TO CONDENSED CONSOLIDATED FINANCIAL STATEMENTS — (CONTINUED)
(in thousands, except shares and per share amounts)
On May 12, 2005, the Company entered an agreement related to UIT, its newly established wholly owned subsidiary (the “Agreement”). UIT will engage in the storage solution business through a wholly owned subsidiary in the PRC. Pursuant to the Agreement, the Company agreed to inject into UIT an aggregate sum of USD4,000 in loan advances for working capital purposes, which will be made up of USD2,500 payable in May 2005 and USD1,500 payable in August 2005. In addition, UIT will license certain related technology from a third party who owns such technology at zero cost. If UIT reaches certain milestones specified in the Agreement, UIT will have an obligation in 2006 to purchase such technology and related intellectual property from the third party, and as a consideration of such purchase, UIT will issue a certain percentage of equity to the third party.
Q-9
Table of Contents
Table of Contents
Part II
Item 13. Expenses related to this offering
The following table sets forth the estimated costs and expenses, other than the underwriting discounts and commissions, payable by us in connection with the offering described in the Registration Statement (all amounts are estimated except the U.S. Securities and Exchange Commission registration fee and National Association of Securities Dealers filing fee).
U.S. Securities and Exchange Commission registration fee | $ | 5,885 | |
National Association of Securities Dealers filing fee | 5,500 | ||
Blue Sky fees and expenses | * | ||
Legal fees and expenses | * | ||
Accounting fees and expenses | * | ||
Printing costs | * | ||
Transfer agent fees | * | ||
Miscellaneous | * | ||
Total | $ | * | |
* To be provided by amendment.
Item 14. Indemnification of Directors and Officers
Our amended and restated bylaws provide that we will indemnify our directors and officers to the maximum extent required or permitted by Maryland law. Our bylaws permit us to indemnify any person made or threatened to be made a party to an action, suit or proceeding, whether, civil, criminal, administrative or investigative, by reason of the fact that such person, at our request, is or was a director or officer of another corporation, against the liabilities, costs and expenses of every kind actually and reasonably incurred by him as a result of such action, suit or proceeding, or any threat thereof or any appeal thereon, to the full extent required or permitted under applicable common or statutory law, state or federal. This indemnity is exclusive of other rights to which such person may be entitled.
The proposed form of the Underwriting Agreement provides for indemnification under certain circumstances by the underwriters of the company and our directors and certain officers for certain liabilities arising under the Securities Act.
Reference is made to the Underwriting Agreement and the bylaws filed as exhibits to this Registration Statement regarding relevant indemnification provisions described above and elsewhere herein.
Item 15. Recent Sales of Unregistered Securities
The following sets forth information regarding our sales of the unregistered securities during the last three years:
On July 22, 2004, we issued 20,251,075 shares of common stock to Ren Investment International Limited, Comtech Global Investment Ltd. and Purple Mountain Holding, Ltd., shareholders of Comtech Cayman, under a share exchange agreement with Comtech Cayman and its shareholders.
On October 29 and November 5, 2004, we consummated a private placement of an aggregate of 3,150,000 shares of our common stock to a group of 20 institutional and individual accredited investors at a purchase price of $3.50 per share for aggregate consideration of $11,025,000.
II-1
Table of Contents
Part II
All of the above-described issuances were exempt from registration pursuant to Section 4(2) of the Securities Act, Regulation D or Rule 144A promulgated thereunder, as transactions not involving a public offering. With respect to each transaction listed above, no general solicitation was made by either us or any person acting on our behalf; the securities sold are subject to transfer restrictions; and the certificates for the shares contained an appropriate legend stating such securities have not been registered under the Securities Act and may not be offered or sold absent registration or pursuant to an exemption therefrom.
II-2
Table of Contents
Part II
Item 16. Exhibits and Financial Statement Schedules
Description | ||
| 1.1 | Form of Underwriting Agreement.* | |
| 3.1 | Amended and Restated Articles of Incorporation. | |
| 3.2 | Bylaws. (Incorporated by reference to Exhibit 3.2 of the Quarterly Report on Form 10-Q for the quarter period ended June 30, 1999, filed with the Securities and Exchange Commission on August 20, 1999.) | |
| 4.1 | Specimen Stock Certificate. (Incorporated by reference to Exhibit 4.1 of the Registration Statement on Form S-1 filed with the Securities and Exchange Commission on December 23, 2004, and subsequently amended on February 2, 2005.) | |
| 4.2 | Stockholders Agreement, dated July 23, 2004. (Incorporated by reference to Exhibit 4.1 of the Form 8-K filed with the Securities and Exchange Commission on July 22, 2004.) | |
| 5.1 | Opinion of Loeb & Loeb LLP as to the legality of the securities being offered (filed previously). | |
| 10.1 | Comtech Group, Inc. 2004 Incentive Stock Option Plan. (Incorporated by reference to Exhibit 10.1 of the Registration Statement on Form S-1 filed with the Securities and Exchange Commission on December 23, 2004, and subsequently amended on February 2, 2005.) | |
| 10.2 | Employment Agreement with Hope Ni, dated as of August 1, 2004. (Incorporated by reference to the Exhibit 10.2 of the Registration Statement on Form S-1 filed with the Securities and Exchange Commission on December 23, 2004, and subsequently amended on February 2, 2005.) | |
| 10.3 | Revolving Credit Agreement with Bank of Communications Hong Kong branch, dated September 14, 2004. (Incorporated by reference to Exhibit 10.3 of the Form 10-K filed with the Securities and Exchange Commission on March 31, 2005.) | |
| 10.4 | Share Exchange Agreement between Trident Rowan Group Inc., Comtech Group, Inc., and certain other parties, dated May 25, 2004. (Incorporated by reference to Exhibit 10.1 of the Form 8-K filed with the Securities and Exchange Commission on May 28, 2004.) | |
| 10.5 | Equity Joint Venture Agreement between Comtech Group, Inc. and Broadwell Group Ltd. dated January 17, 2005. (Incorporated by reference to Exhibit 10.12 of the Form 8-K filed with the Securities and Exchange Commission on January 21, 2005.) | |
| 10.6 | Trident 1995 Director’s Plan. (Incorporated by reference to Exhibit 10.1 of Form 10-K filed with the Securities and Exchange Commission on May 24, 1996.) | |
| 10.7 | Agreements dated April 14, 2005, between (a) Comtech (China) Holding Ltd. and Jeffrey Kang and (b) Comtech (China) Holding Ltd. and Nan Ji, concerning shares of Shenzhen Comtech International Ltd. | |
| 10.8 | Agreement of United Information Technology Co. Ltd. between Comtech Group, United Information Technology Co. Ltd. and various other parties. | |
| 10.9 | Lease agreement between the Registrant and Viewtran Technology Limited. | |
| 10.10 | Memorandum of Understanding on Equity Joint Venture Agreement between Comtech Group, Inc. and Broadwell Group Ltd., dated February 23, 2005. | |
| 14.1 | Code of Business Conduct and Ethics. (Incorporated by reference to Exhibit 14.1 of the Form 10-K filed with the Securities and Exchange Commission on March 31, 2005.) | |
II-3
Table of Contents
Part II
Description | ||
| 21.1 | List of Subsidiaries of the Registrant. | |
| 23.1 | Consent of Deloitte Touche Tohmatsu. | |
| 23.2 | Consent of Loeb & Loeb LLP (included in Exhibit 5.1) (filed previously). | |
| 23.3 | Consent of Grandall Legal Group (included in Exhibit 99.1). | |
| 24.1 | Power of Attorney (filed previously). | |
| 99.1 | Opinion of Grandall Legal Group, the People’s Republic of China, Counsel to the Registrant. | |
| * | To be filed by amendment. |
Item 17. Undertakings
Insofar as indemnification for liabilities arising under the Securities Act may be permitted to our directors, officers and controlling persons pursuant to the foregoing provisions, or otherwise, we have been advised that in the opinion of the Securities and Exchange Commission such indemnification is against public policy as expressed in the Securities Act and is, therefore, unenforceable. In the event that a claim for indemnification against such liabilities (other than payment by us of expenses incurred or paid by one of our directors, officers or controlling persons in the successful defense of any action, suit or proceeding) is asserted by such director, officer or controlling person in connection with the securities being registered, we will, unless in the opinion of our counsel the matter has been settled by controlling precedent, submit to a court of appropriate jurisdiction the question of whether such indemnification by it is against public policy as expressed in the Securities Act and will be governed by the final adjudication of such issue.
We hereby undertake that:
| (1) | For purposes of determining any liability under the Securities Act, the information omitted from the form of prospectus filed as part of this registration statement in reliance upon Rule 430A and contained in a form of prospectus filed by us pursuant to Rule 424(b)(1) or (4) or 497(h) under the Securities Act shall be deemed to be part of this registration statement as of the time it was declared effective. |
| (2) | For the purpose of determining any liability under the Securities Act, each post-effective amendment that contains a form of prospectus shall be deemed to be a new registration statement relating to the securities offered therein, and the offering of such securities at that time shall be deemed to be the initialbona fide offering thereof. |
II-4
Table of Contents
Signatures
Pursuant to the requirements of the Securities Act of 1933, the Registrant has duly caused this Registration Statement to be signed on its behalf by the undersigned, thereunto duly authorized, in Shenzhen, People’s Republic of China, on June 22, 2005.
Comtech Group, Inc. | ||
By: | /s/ Jeffrey Kang | |
Name: | Jeffrey Kang | |
Title: | Chief Executive Officer | |
Power of Attorney
Pursuant to the requirements of the Securities Act, this Registration Statement has been signed by the following persons on June 22, 2005, in the capacities indicated.
Title | Date | |
/s/ Jeffrey Kang Jeffrey Kang Chairman of the Board, President and (Principal Executive Officer) | June 22, 2005 | |
/s/ Hope Ni Hope Ni Chief Financial Officer (Principal Financial and Accounting Officer) | June 22, 2005 | |
* Li Zhou Director | June 22, 2005 | |
* Amy Kong Director | June 22, 2005 | |
* Q.Y. Ma Director | June 22, 2005 | |
* Frank Zheng Director | June 22, 2005 | |
Mark S. Hauser Director | ||
II-5
Table of Contents
Signatures
Title | Date | |
* Mark B. Segall Director | June 22, 2005 | |
By | * /s/ Hope Ni Hope Ni, Attorney-in-Fact | |||
II-6
Table of Contents
Exhibit index
Description | ||
| 1.1 | Form of Underwriting Agreement.* | |
| 3.1 | Amended and Restated Articles of Incorporation. | |
| 3.2 | Bylaws. (Incorporated by reference to Exhibit 3.2 of the Quarterly Report on Form 10-Q for the quarter ended June 30, 1999, filed with the Securities and Exchange Commission on August 20, 1999.) | |
| 4.1 | Specimen Stock Certificate. (Incorporated by reference to Exhibit 4.1 of the Registration Statement on Form S-1 filed with the Securities and Exchange Commission on December 23, 2004, and subsequently amended on February 2, 2005.) | |
| 4.2 | Stockholders Agreement, dated July 23, 2004. (Incorporated by reference to Exhibit 4.1 of the Form 8-K filed with the Securities and Exchange Commission on July 22, 2004.) | |
| 5.1 | Opinion of Loeb & Loeb LLP as to the legality of the securities being offered (filed previously). | |
| 10.1 | Comtech Group, Inc. 2004 Incentive Stock Option Plan. (Incorporated by reference to Exhibit 10.1 of the Registration Statement on Form S-1 filed with the Securities and Exchange Commission on December 23, 2004, and subsequently amended on February 2, 2005.) | |
| 10.2 | Employment Agreement with Hope Ni, dated as of August 1, 2004. (Incorporated by reference to Exhibit 10.2 of the Registration Statement on Form S-1 filed with the Securities and Exchange Commission on December 23, 2004, and subsequently amended on February 2, 2005.) | |
| 10.3 | Revolving Credit Agreement with Bank of Communications Hong Kong branch, dated September 14, 2004. (Incorporated by reference to Exhibit 10.3 of the Form 10-K filed with the Securities and Exchange Commission on March 31, 2005.) | |
| 10.4 | Share Exchange Agreement between Trident Rowan Group Inc., Comtech Group, Inc., and certain other parties, dated May 25, 2004. (Incorporated by reference to Exhibit 10.1 of the Form 8-K filed with the Securities and Exchange Commission on May 28, 2004.) | |
| 10.5 | Equity Joint Venture Agreement between Comtech Group, Inc. and Broadwell Group Ltd. dated January 17, 2005. (Incorporated by reference to Exhibit 10.12 of the Form 8-K filed with the Securities and Exchange Commission on January 21, 2005.) | |
| 10.6 | Trident 1995 Director’s Plan. (Incorporated by reference to Exhibit 10.1 of Form 10-K filed with the Securities and Exchange Commission on May 24, 1996.) | |
| 10.7 | Agreements dated April 14, 2005, between (a) Comtech (China) Holding Ltd. and Jeffrey Kang and (b) Comtech (China) Holding Ltd. and Nan Ji, concerning shares of Shenzhen Comtech International Ltd. | |
| 10.8 | Agreement of United Information Technology Co. Ltd. between Comtech Group, United Information Technology Co. Ltd. and various other parties. | |
| 10.9 | Lease agreement between the Registrant and Viewtran Technology Limited. | |
| 10.10 | Memorandum of Understanding on Equity Joint Venture Agreement between Comtech Group, Inc. and Broadwell Group Ltd., dated February 23, 2005. | |
| 14.1 | Code of Business Conduct and Ethics. (Incorporated by reference to Exhibit 14.1 of the Form 10-K filed with the Securities and Exchange Commission on March 31, 2005.) | |
Table of Contents
Description | ||
| 21.1 | List of Subsidiaries of the Registrant. | |
| 23.1 | Consent of Deloitte Touche Tohmatsu. | |
| 23.2 | Consent of Loeb & Loeb LLP (included in Exhibit 5.1) (filed previously). | |
| 23.3 | Consent of Grandall Legal Group (included in Exhibit 99.1). | |
| 24.1 | Power of Attorney (filed previously). | |
| 99.1 | Opinion of Grandall Legal Group, the People’s Republic of China, Counsel to the Registrant. | |
| * | To be filed by amendment. |