UNITED STATES
SECURITIES AND EXCHANGE COMMISSION
Washington, D.C. 20549
FORM 10-K
(Mark One)
| x | ANNUAL REPORT PURSUANT TO SECTION 13 OR 15(d) OF THE SECURITIES EXCHANGE ACT OF 1934. |
For the Fiscal year ended December 31, 2006
OR
| ¨ | TRANSACTION REPORT PURSUANT TO SECTION 13 OR 15(d) OF THE SECURITIES EXCHANGE ACT OF 1934. |
For the transition period from to
Commission File Number: 000-02642
COMTECH GROUP, INC.
(Exact name of Registrant as specified in its charter)
| | |
| Maryland | | 52-0466460 |
(State or other jurisdiction of incorporation or organization) | | (IRS Employer Identification Number) |
Room 10001, Tower C, Skyworth Building
High-Tech Industrial Park
Nanshan, Shenzhen 5180, PRC
(Address of Principal Executive Offices) (Zip Code)
011-86-755-267-43210
(Registrant’s telephone number, including area code)
Securities registered pursuant Section 12(b) of the Exchange Act: Common Stock, $0.01 par value
Securities registered pursuant Section 12(g) of the Exchange Act: None.
Indicate by check mark if the registrant is a well-known seasoned issuer, as defined in Rule 405 of the Securities Act. YES ¨ NO x
Indicate by check mark if the registrant is not required to file reports pursuant to Section 13 or 15(d) of the Act. YES ¨ NO x
Indicate by check mark whether the registrant (1) has filed all reports required to be filed by Section 13 or 15(d) of the Securities Exchange Act of 1934 during the preceding 12 months (or for such shorter period that the registrant was required to file such reports), and (2) has been subject to such filing requirements for the past 90 days. YES x NO ¨
Indicate by check mark if disclosure of delinquent filer pursuant to Item 405 of Regulation S-K is not contained herein, and will not be contained, to the best of the registrant’s knowledge, in definitive proxy or information statements incorporate by reference in Part III of the Form 10-K or any amendment to the Form 10-K ¨
Indicate by check mark whether the registrant is a large accelerated filer, an accelerated filer, or a non-accelerated filer. See definition of “accelerated filer and large accelerated filer” in Rule 12b-2 of the Exchange Act. (Check one):
| | | | |
Large accelerated filer ¨ | | Accelerated filer x | | Non-accelerated filer ¨ |
Indicate by check mark whether the registrant is a shell company (as defined in Rule 12b-2 of the Act.) YES ¨ NO x
The aggregate market value of the voting stock held by non-affiliates of the registrant was $196,209,000 based on the reported last sale price of common stock on the Nasdaq Global Market on June 30, 2006, which is the last business day of the registrant’s most recently completed second fiscal quarter.
The number of shares of common stock of the registrant outstanding on March 12, 2007 was 33,105,911.
TABLE OF CONTENTS
FORWARD LOOKING STATEMENTS
This Annual Report on Form 10-K contains forward-looking statements within the meaning of Section 27A of the Securities Act of 1933, and Section 21E of the Securities Exchange Act of 1934. These statements relate to future events or our future financial performance. We have attempted to identify forward-looking statements by terminology including “anticipates”, “believes”, “expects”, “can”, “continue”, “could”, “estimates”, “expects”, “intends”, “may”, “plans”, “potential”, “predict”, “should” or “will” or the negative of these terms or other comparable terminology. These statements are only predictions. Uncertainties and other factors, including the risks outlined under Risk Factors contained in Item 1A of this Form 10-K, may cause our actual results, levels of activity, performance or achievements to be materially different from any future results, levels or activity, performance or achievements expressed or implied by these forward-looking statements.
A variety of factors, some of which are outside our control, may cause our operating results to fluctuate significantly. They include:
| | • | | the availability and cost of products from our suppliers incorporated into our customized module design solutions; |
| | • | | changes in end-user demand for the products manufactured and sold by our customers; |
| | • | | general and cyclical economic and business conditions, domestic or foreign, and, in particular, those in China’s mobile handset, telecom equipment and digital media industries; |
| | • | | the rate of introduction of new products by our customers; |
| | • | | the rate of introduction of enabling technologies by our suppliers; |
| | • | | changes in our pricing policies or the pricing policies of our competitors or suppliers; |
| | • | | the success of our new engineering services business; |
| | • | | our ability to compete effectively with our current and future competitors; |
| | • | | our ability to manage our growth effectively, including possible growth through acquisitions; |
| | • | | our ability to enter into and renew key corporate and strategic relationships with our customers and suppliers; |
| | • | | our implementation of stock-based compensation plans; |
| | • | | changes in the favorable tax incentives enjoyed by our PRC operating companies; |
| | • | | foreign currency exchange rates fluctuations; |
| | • | | adverse changes in the securities markets; and |
| | • | | legislative or regulatory changes in China. |
Although we believe that the expectations reflected in the forward-looking statements are reasonable, we cannot guarantee future results, levels of activity, performance or achievements. Our expectations are as of the date this Form 10-K is filed, and we do not intend to update any of the forward-looking statements after the filing date to conform these statements to actual results, unless required by law.
1
We file annual reports on Form 10-K, quarterly reports on Form 10-Q, current reports on Form 8-K and proxy and information statements and amendments to reports filed or furnished pursuant to Sections 13(a) and 15(d) of the Securities Exchange Act of 1934, as amended. You may read and copy these materials at the SEC’s Public Reference Room at 450 Fifth Street, NW, Washington, D.C. 20549. You may obtain information on the operation of the public reference room by calling the SEC at 1-800-SEC-0330. The SEC also maintains a website(http://www.sec.gov) that contains reports, proxy and information statements and other information regarding us and other companies that file materials with the SEC electronically. You may also obtain copies of reports filed with the SEC, free of charge, via a link included on our website athttp://www.comtech.com.cn.
PART I
ITEM 1. BUSINESS
Company Overview
We provide customized module design solutions for a diverse set of applications and end markets, serving as a gateway for our technology component suppliers to access leading electronics manufacturers in China. Our customized module design solutions allow our customers to take advantage of technology components from reputable suppliers in an efficient and cost-effective manner, effectively reducing their time-to-market and lowering their overall costs. Our close collaboration with our customers’ product development teams provides us with a unique understanding of their needs, enabling us to customize our suppliers’ technology components with module designs that meet our customers’ needs. In addition, in 2006, we began offering technology and engineering services, network system integration and related training and maintenance services to telecom equipment vendors in China and in Southeast Asia.
We are focused on the mobile handset, telecom equipment and digital media end-markets in China. In the mobile handset end-market, we provide module solutions for functionalities such as LCD, camera, power supply and Bluetooth; in the telecom equipment end-market, we provide solutions for public switched telephone network, or PSTN, switching, optical transmitters, electrical signal processing and optical signal amplification; and in the digital media end-market, we provide solutions for digital set-top boxes and GPS applications. Over the course of our operating history, we have worked with over 200 customers, including many of the most established manufacturers in the mobile handset, telecom equipment and digital media end-markets in China such as ZTE, Huawei and Lenovo. In addition to these original equipment manufacturers, or OEMs, our other customers include industry participants that support these OEMs, such as subsystem designers and contract manufacturers. In developing customized module design solutions for use in our customers’ products, we collaborate closely with over 30 suppliers of technology components, including many large multinational companies such as Broadcom, JDS Uniphase and Matsushita. In addition, in October 2006 we became one of the first China-based companies to license software technology and have access to selected source codes relating to digital media directly from Microsoft.
Based on the customer’s specific requirements, we will propose a customized module reference design, which usually incorporates technology components from our suppliers. If the customer accepts our module reference design, it will generally agree to purchase specific components contained in our proposed design from us. However, our customers and their third-party contract manufacturers are responsible for the manufacture and assembly of the customized module based on our designs. Our business model is based on generating recurring revenue by reselling specific components required in our module reference designs. The difference between the purchase price we pay our suppliers for these components and our sales price to our customers for these components compensates us for our design, technical support and distribution services.
To further broaden and deepen the relationship with our existing customers, we began offering technology and engineering services in January 2006 to help facilitate the deployment of their products both in China as well as abroad. In addition, we continue to explore and identify new end-markets where we can leverage both our design and engineering expertise. For example, in 2006 we commenced the development of location-based search applications, particularly GPS module solutions for handsets and others mobile applications.
From 2004 to 2006, our net sales grew from RMB625.7 million to RMB1,323.6 million ($169.6 million), representing a compound annual growth rate, or CAGR, of45.4%, and our net income grew from RMB62.2 million to RMB123.3 million ($15.8 million) during the same period, representing a CAGR of40.8%.
2
Competitive Strengths
We believe that our customized module design solutions allow our customers to more effectively utilize our suppliers’ enabling technology components, which in turn allows them to better compete in their targeted end-markets. We believe our competitive strengths include:
Broad and diversified customer base and deep customer relationships. Our broad and diversified customer base includes many major domestic mobile handset, telecom equipment and digital consumer electronics manufacturers in China and many of their supporting subsystem suppliers. Being a customized module design solution provider to our customers requires a time-consuming and difficult procurement qualification process, which we believe serves as a significant barrier to entry for other participants. We believe that these close customer relationships, together with our continued qualified solution provider status, facilitate better understanding of our customers’ time-to-market, technology and cost requirements. These relationships also present new business opportunities by enabling us to identify and capture additional revenue streams from our customers’ new growth areas.
Differentiated business model. We facilitate our customers’ use of technology components in their end-products, thus reducing both their time-to-market and overall costs. As we focus on providing solutions to meet our customers’ specific requirements, we believe that we are less vulnerable to risks associated with the development and adoption of new and unproven technology. We do not directly charge a design fee for our customized module solutions. Instead, we are compensated by a markup on the components recommended in our design solution, which is determined principally by the extent of the design work we provide.
Accumulated design solutions expertise.Over the years, we have developed an extensive portfolio of design solutions we can leverage to accommodate the needs of new clients or existing clients with changed needs. As such, we are able to achieve significant design cost efficiencies by reducing the need to invest the time or resources associated with designing a new solution. In addition, our engineers have also accumulated a significant amount of design and engineering expertise from working with various clients from our extensive customer base.
Strong relationships with enabling technology components suppliers. We work closely with more than 30 technology components suppliers, including major global components suppliers such as Broadcom, JDS Uniphase and Matsushita. In addition to facilitating the customization of their technology components, our suppliers often rely on us as a means of penetrating new China-based electronics manufacturers via our existing domestic relationships.
Strategy
We intend to strengthen our position as a technology solution provider for customers in China’s mobile handset, telecom equipment and digital media end-markets.
Leverage our strong customer relationships into new opportunities. We intend to drive future revenue growth and profitability by continuing to leverage our strong customer relationships and expanding the solutions we offer to them. For example, our relationship with Huawei began in 1995 when we provided design solutions for Huawei’s core telecom equipment business. When Huawei expanded into the 3G mobile phone business, we began providing solutions for this business in 2006. Similarly, as Huawei’s demand for engineering services within its telecom equipment business increased, we began offering services to facilitate the deployment of Huawei’s products in China as well as abroad. Growing with our clients will enable us to enter new end-markets and expand geographic presence.
Strengthen our design and development capabilities. To meet the changing needs of our customers, which include increasingly shorter product life cycles, we intend to continue to improve and strengthen our in-depth and diversified solution development and design capabilities. We plan to continue investing resources to maintain the most experienced and skilled design team to preserve competitiveness within a frequently changing and challenging industry landscape.
Enhance our competitiveness in new product areas through strategic alliances.We intend to broaden our product offerings by leveraging our existing design and engineering expertise as well as selectively entering into strategic alliances with third parties to complement our existing capabilities. For example, we entered into a collaborative arrangement with Microsoft whereby we will have the ability to license next generation software
3
technology from Microsoft’s IP Ventures program and use Microsoft’s source codes to develop design solutions across a variety of digital media applications. We believe this collaborative arrangement will enhance our competitiveness in design solutions for digital media initiatives, targeting various end-markets including the digital set top-box, GPS, game console, smartphone and portable media player markets. We intend to continue collaborating with third parties in ways that will enhance our competitiveness.
Make strategic investments and acquisitions. We intend to grow and expand our business by making strategic investments in and acquiring businesses complementary to ours that will enable us to expand the solutions we offer to our existing target customer base, and that will provide opportunities to expand into new markets. In particular, we plan to pursue opportunities where we expect to generate additional near-term revenue or expand our long-term growth opportunities by expanding our customer base or target end-markets. For example, on December 15, 2006, we acquired all the outstanding shares of Viewtran Technology (Shenzhen) Co., Limited, or Viewtran, a Shenzhen-based digital media technology and solutions provider focusing on digital TV and GPS applications. We believe the acquisition of Viewtran will complement our long-term strategy for China’s digital media industry by strengthening our research and development, or R&D, capabilities and broadening our product portfolio.
Products and Technology
We provide customization of our suppliers’ technology components with module designs to suit each of our customers’ specific needs. Our customized module design solutions include:
| | | | |
Mobile Handsets Modules | | Telecom Equipment Modules | | Digital Media Modules |
| LCD | | Fixed line telecom network | | Digital set-top box |
| | |
| Camera | | Data communications | | GPS |
| | |
| Persistent storage | | Optical transmission | | Multimedia module in portable media player |
| | |
| Input / output | | Wireless base-station | | Multimedia module in home entertainment |
| | |
| Sound system | | | | |
| | |
| Power supplies | | | | |
| | |
| Bluetooth | | | | |
| | |
| Multimedia | | | | |
The following table sets forth the revenue contribution from our mobile handset, telecom equipment and digital media/other services end-markets during 2005 and 2006.
| | | | | | |
Market | | 2005 | | | 2006 | |
Mobile handset | | 51.5 | % | | 39.7 | % |
Telecommunication equipment | | 37.7 | | | 34.4 | |
Digital media and others | | 10.8 | | | 21.8 | |
Engineering services | | — | | | 4.1 | |
| | | | | | |
Total | | 100.0 | % | | 100.0 | % |
| | | | | | |
Our R&D unit has always been a driving component in our business and remains crucial in providing the best design solutions for our customers. We have a team of approximately 350 highly qualified design and application engineering specialists and 200 other technical employees engaged in R&D related activities to develop new customized module solutions targeted at the wireless handset, telecom equipment and digital media industries. For 2006, we invested RMB28.0 million for R&D purposes and will continue to devote significant resources to supporting and enhancing the depth and capabilities of our R&D unit.
4
Customers
Our broad and diversified customer base includes many of the major domestic mobile handset, telecom equipment and digital consumer electronics manufacturers in China. In addition, our customers include industry participants supporting these OEMs, such as subsystem designers and contract manufacturers in China, as well as international manufacturers who have begun to manufacture end-products in China for the domestic and international market. Our largest customer in terms of 2006 net sales was T&W Electronics Co., Ltd., or T&W Electronics, a major broadband terminal equipment and digital consumer electronics provider in China. Our largest customer in the mobile handset market in terms of 2006 net sales was ZTE, both a large domestic mobile handset manufacturer and one of the largest telecom equipment manufacturers in China. Our two largest customers from the telecom equipment industry in terms of 2006 net sales were Huawei and ZTE, major telecom equipment manufacturers in China. Our two largest customers in the digital media end-market in terms of 2006 net sales were T&W Electronics and Sichuan Jiuzhou Electronics. During 2006, T&W Electronics, ZTE and Huawei, accounted for 15.9%, 8.6% and 6.9% of our net sales, respectively.
As of December 31, 2006, we believe that our major customers by end-market were as follows:
| | • | | Mobile Handset Manufacturers—Lenovo and ZTE. |
| | • | | Telecommunication Equipment Manufacturers—Huawei and ZTE. |
| | • | | Digital Media—T&W Electronics and Sichuan Jiuzhou Electronics. |
In 2006, our top 10 customers to whom we sold directly, including several contract manufacturers used by some of our major end-market customers, were as follows:
| | | | | | | |
| | | 2006 | |
Customer Name | | Net Sales (in millions) | | Percentage
of Net Sales (%) | |
T&W Electronics | | RMB | | 210.7 | | 15.9 | % |
ZTE | | | | 113.9 | | 8.6 | |
Huawei | | | | 90.9 | | 6.9 | |
Wuxi Zhongxing Optoelectronics | | | | 81.8 | | 6.2 | |
Wuhan Research Institute of Post & Telecommunications | | | | 74.3 | | 5.6 | |
ATI | | | | 53.9 | | 4.1 | |
Young Poong Electronics | | | | 45.4 | | 3.4 | |
Sichuan Jiuzhou Electronics | | | | 44.2 | | 3.3 | |
Starnet Digital Technology | | | | 42.4 | | 3.2 | |
Accelink Technologies | | | | 41.3 | | 3.1 | |
| | | | | |
Total | | RMB | | 798.8 | | 60.4 | % |
| | | | | |
The value of our technology solutions can be illustrated by specific examples of how we have worked closely with our customers and suppliers in leveraging our competitive position and unique business model to solidify and extend our existing business, as well as identify and capture new opportunities:
Growing with our customers. We have been a provider of customized module design solutions to many of our major customers for a significant portion of our operating history, often developing multi-level relationships with the various customer groups with whom we work. For example, we first became a solutions provider to Huawei in 1995 when Huawei had several hundred employees, compared to over 61,000 employees at the end of 2006. As China’s telecom market has grown, so has Huawei’s telecom equipment business and the demand for our module design solutions customized specifically for application within Huawei’s products. In 2006, we also began providing customized 3G cell phone modules to Huawei, as well as engineering services to Huawei. Our total net sales from Huawei grew to RMB90.9 million ($11.6 million) in 2006.
5
Applying our customized module design capabilities to new end-markets. We have leveraged our customized module design capabilities and our deep, multi-level customer relationships to follow our customers into new end-markets. Since 1995, we have been a provider of customized module design solutions for telecom equipment to ZTE, one of the largest telecom equipment manufacturers in China. ZTE first sought to enter the mobile handset market in China in 2000. Based on our working history with ZTE on telecom equipment solutions and on our proven design capabilities, ZTE selected us as a provider of customized module design solutions for their mobile handsets in 2000. Our total net sales from ZTE has grown to RMB113.9 million ($14.6 million) in 2006.
Suppliers
We develop our customized module design solutions based on technology components provided by key technology and other suppliers in our target end-markets. We work with a select list of more than 30 key suppliers, including:
| | |
Supplier Name | | Product |
| Broadcom | | Various products including integrated circuit and Bluetooth |
| |
| JDS Uniphase | | Optoelectronic components |
| |
| Matsushita | | Switches, connectors, relay |
| |
| M-Systems Flash Disk Pioneers Ltd. | | Flash memory |
| |
| Sambu Communics Co., Ltd. | | Speakers |
During 2006, based on cost, we purchased approximately 34.9%, 16.5% and 15.7% of the components sold to our customers from Broadcom, JDS Uniphase and Matsushita, respectively. We have established long-standing relationships with our key suppliers. For example, we have worked with Matsushita since our inception in 1995. While we depend on our key suppliers, we believe that we can find alternate suppliers within a reasonable amount of time without significantly altering our proposed solutions. For further information concerning our reliance on Broadcom, Matsushita and other key suppliers, see “Risk factors—Reliance on our suppliers, with whom we often do not have long-term supply agreements, makes us vulnerable to the loss of one or more key suppliers or the delivery capabilities of our suppliers.”
Development of collaborative relationships with key component suppliers. We have expanded our business by collaborating with our key component suppliers and incorporating our suppliers’ technology components into our module reference designs to provide customized solutions for different OEM customers. For example, demand for flash memory integrated circuits has increased as the need for high volume storage has grown rapidly due to the more advanced data services offered over wireless networks onto mobile handsets. We developed a storage module by incorporating our supplier’s flash memory products, customizable for each customer according to their varying design criteria. Through this approach, we were able to customize each module to provide optimal functionality to a variety of OEM customers. Our ability to bring this solution to each of these OEM customers:
| | • | | allow our customers to optimize their mobile handsets by incorporating flash memory technology in a fast and cost-efficient fashion; |
| | • | | allow this supplier to penetrate the China market and specific OEM customers, without having to design and manufacture separate flash memory products; and |
| | • | | reinforce and broaden our relationship with this key component supplier. |
Sales and Marketing
We generate sales of our customized module design solutions through our direct sales force, consisting of approximately 105 sales directors, account managers and sales support staff as at December 31, 2006. Our sales directors are responsible for establishing sales strategy and setting objectives for specific customer accounts. Each account manager is dedicated to a specific customer account and is responsible for the day-to-day management of that customer relationship. Account managers work closely with customers and, in many cases, provide on-site support. Account managers often attend our customers’ internal meetings related to
6
production, engineering design and quality assurance to ensure that our customers’ expectations are appropriately interpreted and communicated to our operations group, and ultimately met or exceeded throughout the design process. Account managers also work with our customers to identify and meet their cost and design-to-delivery cycle time objectives.
Currently Huawei is our principal customer for engineering services, though we intend to market these services more broadly to other customers in the future through an expanded engineering services sales force.
Our new business development account managers initiate and maintain long-term, multi-level relationships with customer accounts and work closely with customers on new business opportunities throughout the design-to-delivery cycle.
Competition
We believe that the principal competitive factors affecting the markets for our customized module design solutions and engineering services include:
| | • | | understanding our customers’ time-to-market, technology and cost requirements; |
| | • | | access to technology providers; |
| | • | | pricing and efficiency; |
| | • | | customer relationships; and |
We believe that we compare favorably with respect to each of these criteria. In addition, while we do not believe that there are any direct competitors of any meaningful size that operate using the same business model as ours, we face indirect competition from the following:
Other technology component suppliers. For each project, we work with suppliers to compete against other technology component suppliers. Consequently, we indirectly compete against our suppliers’ competitors. For example, by working with JDS Uniphase, we compete indirectly against companies such as Avanex and Bookham in supplying optical transmission module designs.
Component manufacturers and distributors. We compete indirectly with component manufacturers such as Epcos, and component distributors such as Arrow Electronics, Avnet and Memec, which may seek to expand their product/service offerings to include customized module design solutions. We believe that these large component manufacturers and distributors have not historically engaged in customized module design, and therefore we believe that it is not one of their core competencies.
We may also face indirect competition from customers and suppliers. Currently many of our customers and suppliers do not focus on customized module design. If our customers or suppliers decide to devote more time and resources to in-house module design, the demand for our solutions may decline. In addition, our customers may change their procurement strategy or decide to rely on us primarily for component delivery and not for integration or design work. Similarly, component suppliers may also seek to offer their component products or modules incorporating key components from our solutions directly to our customers.
Intellectual Property
We currently have five issued utility patents relating to our lightning surge protection for network products and a ceramic-to-steel adhesive application and a patent on algorism for quality of services, or QoS, relating to our digital media application. Historically, we have derived a small percentage of our net sales from our proprietary products.
Employees
As of December 31, 2006, we had approximately 700 employees, with 350 in engineering services, 200 in research and development, 105 in sales and marketing and 45 in administrative positions.
We make contributions for many of our employees in the PRC to retirement benefits based on their salaries and length of service upon retirement in accordance with a PRC government-managed retirement plan.
7
The mandatory insurance schemes in Shenzhen, PRC includes a pension scheme, medical insurance, work-related insurance and unemployment insurance. The PRC government is directly responsible for the payments of benefits to these retired employees. We are required to make contributions to the government-managed retirement plan at specified rates of the salaries, bonuses and certain allowances of our employees, up to a maximum amount specified by the local government from time to time.
Our future success will depend, in part, on our ability to continue to attract, retain and motivate highly qualified technical, marketing and management personnel, for whom competition is intense. Our employees are not covered by any collective bargaining agreement and we have never experienced a work stoppage. We believe we enjoy good relations with our employees.
ITEM 1A. RISK FACTORS
In addition to the other information in this Form 10-K, readers should carefully consider the following important factors. These factors, among others, in some cases have affected, and in the future could affect, our financial condition and results of operations and could cause our future results to differ materially from those expressed or implied in any forward-looking statements that appear in this on Form 10-K or that we have made or will make elsewhere.
Risks Related to Our Business
Our operating results fluctuate from quarter to quarter.
Our quarterly revenue, income and other operating results have fluctuated in the past and may fluctuate significantly in the future due to a number of factors, including the following:
| | • | | the ability of our suppliers to meet our supply requirements; |
| | • | | the cancellation of large orders; |
| | • | | the time required for research and development; |
| | • | | changing design requirements resulting from rapid technology shifts; and |
| | • | | industry trends impacting the overall market for our customers’ end-products. |
As a result of these and other factors, our results of operations may vary on a quarterly basis and net sales may be adversely affected from period to period. Our results of operations for a particular quarter may not be indicative of our future performance. If our operating results in a quarter fall below our expectations or the expectations of market analysts or investors, the price of our common stock is likely to decrease.
Our operating results are substantially dependent on development of new customized module design solutions.
We may be unable to develop new customized module design solutions in a timely or cost-efficient manner, and these new solutions may fail to meet the requirements of our customers’ end-markets. If we fail to develop new solutions that help our customers respond to competitive pressures, achieve shorter time-to-market or broaden and improve their product offerings, we will lose business and our results of operations will be materially and adversely affected.
If our customers do not accept our proposed customized module design solutions or do not purchase from us the specified components contained in the proposed module reference design, our net sales will be adversely affected.
While many of our proposed customized module design solutions are accepted by our customers, there is no obligation for customers to accept our proposed solutions. We dedicate personnel, management and financial resources to research and development and technical support in developing new customized module design solutions for our customers. The time frames for most research and development projects typically range from two to 18 months. Because we do not charge a design fee for our services, but rather generate revenue through the resale of specified components contained in our proposed reference designs, if our customers do not accept our proposed designs, we will fail to capitalize on the invested resources, time and effort that we expended on a project.
8
Furthermore, our customers typically make purchases on a purchase order basis. Prior to submission of a purchase order, our customers are not obligated to purchase from us any quantity of specific components that we propose to sell in our proposed module reference design. Our customers may cancel or defer their purchase orders on short notice without significant penalty. Even if a customer accepts our proposed module reference design, the customer could bypass us and contract with our competitors or possibly our suppliers directly for the purchase of the specific components we otherwise had proposed to sell. The failure to accept our proposed module reference design, the loss of ongoing business from our customers or the transition away from us in favor of direct purchases from our competitors or suppliers could each result in our failure to realize potentially significant net sales.
Reliance on our suppliers, with whom we often do not have long-term supply agreements, makes us vulnerable to the loss of one or more key suppliers or the delivery capabilities of our suppliers.
We typically rely on a limited number of key suppliers, and many customized module design solutions that we develop are designed around technology components provided by our suppliers. We typically do not have long-term supply agreements or other forms of exclusive arrangements with our suppliers. In 2006, for example, Broadcom, JDS Uniphase and Matsushita, accounted for approximately 34.9%, 16.5% and 15.7%, respectively, of our cost of sales. Furthermore, although we deal with approximately ten different divisions within Matsushita, purchases of relays and connectors from Matsushita accounted for a substantial portion of our cost of sales attributable to Matsushita. If we lose a key supplier or a supplier reduces the quantity of products it sells to us, does not maintain a sufficient inventory level of products required by us or is otherwise unable to meet our demand for its components, we may have to expend significant time, effort and other resources to locate a suitable alternative supplier and secure replacement components. For example, on one prior occasion, one of our key suppliers experienced an interruption in its production capacity due to a relocation of its production facilities, which resulted in its inability to meet our quarterly supply requirements. If suitable replacement components are unavailable, we may be forced to redevelop certain of our solutions, which ultimately may not be accepted by our customers.
Also, if our suppliers fail to introduce new products that keep up with new technologies, they may be surpassed by other suppliers entering the market with whom we may not have existing relationships. The costs and delays related to finding new suppliers or redeveloping solutions could significantly harm our business.
If we fail to attract and retain key personnel, particularly our chief executive officer, our business will be materially impaired and our financial condition and results of operations will suffer.
Our business greatly relies on the continued services of Jeffrey Kang, our principal shareholder and chief executive officer. Many relationships with our key suppliers and key customers have been developed by and continue to be maintained by Mr. Kang. Our future success will depend to a significant degree upon the performance and contribution of Mr. Kang and other members of our senior management team in areas including sales, research and development, information technology and finance. Therefore, our business and results of operations may be materially and adversely affected if Mr. Kang or another member of our senior management team leaves us, which they may do at any time since, as with the exception of our chief financial officer, they do not have an employment or non-compete agreement with us. In addition, we will incur additional expenses to recruit and develop senior management members if one or more of our key employees are unwilling or unable to continue his or her employment with us. We do not maintain key man life insurance covering our senior management or any of our key employees.
Our future success also depends on our ability to identify, attract, hire, train, retain and motivate highly-skilled personnel. If we cannot attract and retain the personnel we require at a reasonable cost, our cost of goods sold will increase and the profitability of our business could be negatively affected. Our business is especially dependent on sales, marketing, research and development, and services personnel. Competition in China for executive-level and skilled technical and sales and marketing personnel is strong, and recruiting, training, and retaining qualified key personnel are important factors affecting our ability to meet our growth objectives. Should key employees leave our company, we may lose both an important internal asset and net sales from customer projects in which those employees were involved.
Loss of key customers may adversely impact our net sales.
We generate the majority of our net sales from a small number of key customers, and we anticipate that a relatively small number of key customers will continue to account for a significant portion of our net sales in
9
the foreseeable future, particularly in the telecom equipment market. In 2006, our sales to T&W, ZTE and Huawei accounted for approximately 15.9%, 8.6%, and 6.9% respectively, of our net sales. Sales to our top 10 customers represented approximately 60.4% of our net sales in 2006. Should we lose, receive reduced orders from, or experience any adverse change in our relationship with any of our key customers, or should they decide to use solutions provided by other companies, we will suffer a substantial loss in net sales.
The end-markets in which we operate are highly competitive and fragmented. Competition may intensify in the future, and if we fail to compete effectively, our business will be harmed.
Pressures from current or future competitors could cause our solutions to lose market acceptance or require us to significantly reduce our sales prices to keep and attract customers. Our competitors often have longer operating histories, stronger customer and supplier relationships, larger technical staffs and sales forces, and/or greater financial, technical and marketing resources than we do. Although we believe that there are no direct competitors of any meaningful size who operate using the same business model as ours, we face indirect competition from:
| | • | | Other technology component suppliers. For each project, we work with one enabling technology component supplier to compete against other enabling technology component suppliers. Consequently, we indirectly compete against our suppliers’ competitors. For example, by working with JDS Uniphase, we compete against companies such as Avanex Corp. and Bookham Inc. in supplying optical transmission module design solutions. |
| | • | | Component manufacturers and distributors. We compete indirectly with component manufacturers such as Epcos AG, and component distributors such as Arrow Electronics, Inc., Avnet Inc. and Memec Inc., which may seek to expand their product/service offerings to include customized module design solutions. |
We may also face indirect competition from customers and suppliers. Currently many of our customers and suppliers do not focus on customized module design. If our customers or suppliers decide to devote more time and resources to in-house module design, the demand for our solutions may decline. In addition, our customers may change their procurement strategy or decide to rely on us primarily for component delivery and not for integration or design work. Similarly, component suppliers may also seek to offer their component products or modules incorporating key components from our solutions directly to our customers. The loss of customers for our customized module design solutions as a result of these competitive factors would have a material adverse effect on our business, financial condition and results of operations.
As we expand our business, we intend to develop new customized module design solutions and technological capabilities in end-markets where we do not currently have extensive experience or technological capability. Failure to develop or execute this growth strategy will have a material adverse effect on our net sales.
Prior to 2005, we derived substantially all of our net sales from our customized module design solutions provided to customers in the mobile handset and telecom equipment end-markets. In 2005, we began targeting the digital media end-market and in 2006, we began our engineering services businesses, which to date has related primarily to engineering services provided to Huawei. Our success in the digital media end-market will depend, in significant part, on our ability to continue to develop the necessary technological capability and to leverage our existing customer base that has expanded into this end-market. If we are unable to quickly develop technological expertise, increase our research and development capabilities and leverage our customer base as anticipated, our return on our investment with respect to these efforts may be lower than anticipated and our operating results may suffer. Finally, our customer base may not respond to our efforts to expand our proprietary capabilities and may be unwilling to utilize these enhanced capabilities.
We may be unable to manage rapid growth and a changing operating environment, which could adversely affect our ability to serve our customers and harm our business.
We have experienced rapid growth over the last five years, with our net sales increasing from RMB207.6 million in 2002 to RMB1,323.6 million ($169.6 million) in 2006. Our number of employees has increased from approximately 30 in 2001 to 700 as at December 31, 2006. We have limited operational, administrative and financial resources, which may be inadequate to sustain our current growth rate. If we are
10
unable to manage our growth effectively, the quality of our solutions could deteriorate and our business may suffer. As our customer base increases and we enter new end-markets, we will need to:
| | • | | increase our investments in personnel, research and development capabilities, facilities and other operational areas; |
| | • | | continue training, motivating and retaining our existing employees, and attract and integrate new qualified employees; |
| | • | | develop and improve our operational, financial, accounting and other internal systems and controls; and |
| | • | | take enhanced measures to protect any proprietary technology or technological capability we develop. |
Any failure to manage our growth successfully could distract management’s attention and result in our failure to serve our customers and harm our business.
We face risks associated with future investments or acquisitions.
An important component of our growth strategy is to invest in or acquire businesses complementary to ours that will enable us to expand the solutions we offer to our existing target customer base, and that will provide opportunities to expand into new markets. We may be unable to identify suitable investment or acquisition candidates or to make these investments or acquisitions on a commercially reasonable basis, if at all. If we complete an investment or acquisition, we may not realize the anticipated benefits from the transaction.
Integrating an acquired company or technology is complex, distracting and time consuming, as well as a potentially expensive process. The successful integration of an acquisition would require us to:
| | • | | integrate and retain key management, sales, research and development, and other personnel; |
| | • | | incorporate the acquired products or capabilities into our offerings both from an engineering and sales and marketing perspective; |
| | • | | coordinate research and development efforts; |
| | • | | integrate and support pre-existing supplier, distribution and customer relationships; and |
| | • | | consolidate duplicate facilities and functions and combine back office accounting, order processing and support functions. |
The geographic distance between the companies, the complexity of the technologies and operations being integrated and the disparate corporate cultures being combined may increase the difficulties of combining an acquired company or technology. Acquired businesses are likely to have different standards, controls, contracts, procedures and policies, making it more difficult to implement and harmonize company-wide financial, accounting, billing, information and other systems. Management’s focus on integrating operations may distract attention from our day-to-day business and may disrupt key research and development, marketing or sales efforts.
Our acquisition strategy also depends on our ability to obtain necessary government approvals that may be required, as described under “—Risks Related to Doing Business in China—Our acquisition strategy may be subject to SDRC approval under legislation enacted in 2005.”
Our competitive position could decline if we are unable to obtain additional financing to acquire businesses or technologies that are strategic for our success, or otherwise execute our business strategy.
We believe that our current cash will be sufficient to fund our working capital and capital expenditure requirements for at least the next twelve months. However, we may need to raise additional funds to support more rapid expansion, respond to competitive pressures, acquire complementary businesses or technologies or respond to unanticipated requirements. We cannot assure you that additional funding will be available to us in amounts or on terms acceptable to us. If sufficient funds are not available or are not available on acceptable terms, our ability to fund our expansion, take advantage of acquisition opportunities, develop or enhance our services or products, or otherwise respond to competitive pressures would be significantly limited.
If appropriate opportunities arise, we intend to acquire businesses, technologies, services or products that we believe are strategic for our success. Our competitive position could decline if we are unable to identify and acquire businesses or technologies that are strategic for our success in this market.
11
The unauthorized use of our module design solutions could have a material adverse impact on our net sales.
Our in-house design engineering teams develop our customized module design solutions. We typically do not have patent or other intellectual property protection for our solutions, nor do we typically have non-disclosure or confidentiality agreements with most of our suppliers or customers to keep our design specifications confidential. Suppliers or other competitors may attempt to circumvent us by selling products or providing module design solutions directly to our customers. The unauthorized use by our suppliers or other competitors of our module design solution specifications or other intellectual property in the future would result in a substantial decrease in out net sales. The validity, enforceability and scope of protection of intellectual property in China is uncertain and still evolving, and PRC laws may not protect intellectual property rights to the same extent as the laws of some other jurisdictions, such as the United States. Moreover, litigation may be necessary in the future to enforce any intellectual property rights we may establish or acquire in the future, which could result in substantial costs and diversion of our resources, and have a material adverse effect on our business, financial condition and results of operations.
We became a public company through a share exchange with a non-operating public shell company, where we were the accounting acquirer and assumed all known and unknown potential liabilities of our predecessor entity.
Our July 2004 share exchange with Trident was accounted for as a reverse merger in which Comtech Cayman was deemed the accounting acquirer and Trident, which was originally incorporated in 1917, was the legal acquirer. We have retained all the known and unknown liabilities of Trident. In addition to the threatened litigation discussed under “Item 3. Legal Proceedings”, we cannot guarantee that other potential liability will not come to our knowledge in the future.
We depend upon contractual agreements with the two shareholders of Shenzhen Comtech in conducting our business through Shenzhen Comtech and Shanghai E&T and receiving payments, which may not be as effective in providing operational control as direct ownership and may be difficult to enforce. Further, if the PRC government finds these contractual agreements violate or conflict with PRC governmental regulations, our business would be materially adversely affected.
At the time of its incorporation, foreign shareholding in a trading business such as Shenzhen Comtech could not exceed 65%. With subsequent PRC deregulation, foreign ownership of such a trading business can now reach 100%, and approval of foreign ownership of companies in the PRC engaged in commodity trading businesses—which includes agency trade, wholesale, retail and franchise operations is now delegated to local government agencies of the PRC Ministry of Commerce. In order to exercise control over Shenzhen Comtech (a PRC operating company legally permitted to engage in a commodity trading business), without direct shareholding by us (a U.S.-listed company and therefore a foreign-invested entity), Honghui Li, our vice president, and Huimo Chen, the mother of our principal shareholder and chief executive officer, Jeffrey Kang, hold 99% and 1%, respectively, of the equity interests of Shenzhen Comtech, and through contractual agreements with us hold such equity interests exclusively for the benefit of our 100% directly owned subsidiary, Comtech China. Shenzhen Comtech, in turn owns a 60% equity interest in another of our PRC operating companies, Shanghai E&T, with the other 40% being held by Comtech China (BVI) through trust agreements. Under the trust agreements, Shenzhen Comtech owns a 35% equity interest in Shanghai E&T for the benefit of Comtech China (BVI) and Honghui Li owns a 5% equity interest in Shanghai E&T for the benefit of Comtech China (BVI). While we do not have any equity interest in Shenzhen Comtech, through these contractual agreements, we enjoy voting control and are entitled to the economic interests associated with their equity interest in Shenzhen Comtech. For additional details regarding these contractual agreements, see “Item 13. Certain Relationships and Related Transactions, and Director Independence.” These contractual agreements may not be as effective in providing us with control over Shenzhen Comtech as direct ownership because we rely on the performance of Honghui Li and Huimo Chen under the agreements. If they fail to perform their respective obligations under the agreements, we may have to incur substantial costs and resources to enforce such agreements and may not be able to do so in any case. Further, the profits of Shenzhen Comtech may not be able to be remitted outside the PRC due to foreign exchange controls. Also, we must rely on legal remedies under applicable law, which may not be as effective as those in the United States. Because we rely on Shenzhen Comtech and Shanghai E&T in conducting our business operations in China, the realization of any of these risks relating to our corporate structure could result in a material disruption of our business, diversion of our resources and the incurrence of substantial costs, any of which could materially and adversely affect our operating results and financial condition.
12
In the opinion of our PRC counsel, Horizon Law Firm, the ownership structure of Shenzhen Comtech and the contractual agreements among Comtech China, Honghui Li and Huimo Chen do not violate existing PRC laws, rules and regulations. There are, however, substantial uncertainties regarding the interpretation and application of current or future PRC laws and regulations, including but not limited to the laws and regulations governing the validity and enforcement of these contractual agreements. Accordingly, we cannot assure you that PRC regulatory authorities will not determine that these contractual agreements violate or conflict with PRC laws or regulations.
If we or our PRC operating company, Shenzhen Comtech, are found to violate any existing or future PRC laws or regulations, the relevant regulatory authorities will have broad discretion in dealing with such violation, which would cause significant disruptions to our business operations or render us unable to conduct our business operations and may materially adversely affect our business, financial condition and results of operations.
Risks Related to Our Industry
Our inability to respond quickly and effectively to rapid technological advances and market demands would adversely impact our competitive position and our results of operations.
Historically, we have focused on the mobile handset, telecom equipment and digital media end-markets in China. The mobile handset, telecom equipment and digital media end-markets are characterized by rapid technological advances, intense competition, frequent introduction of new products and services and consumer demand for greater functionality, lower costs, smaller products and better performance. We must constantly seek out new products and develop new solutions to maintain in our portfolio. We have experienced and will continue to experience some solution design obsolescence. We expect our customers’ demands for improvements in product performance to increase, which means that we must continue to improve our design solutions and develop new solutions to remain competitive and grow our business. Our failure to compete successfully for customers will result in price reductions, reduced margins or loss of market share, any of which would harm our business, results of operations and financial condition.
A large portion of our net sales currently comes from sales to manufacturers in the cyclical mobile handset, telecom equipment and digital media end-markets and cyclical downturns could harm our operating results.
The mobile handset and telecom equipment end-markets in particular are highly cyclical and have experienced severe and prolonged downturns, often in connection with maturing product cycles and declines in general economic conditions. These downturns have been characterized by diminished product demand, production overcapacity, high inventory levels and accelerated erosion of average selling prices. The impact of slowing end-customer demand may be compounded by higher than normal levels of equipment and inventories among our customers and our customers’ adjustments in their order levels, resulting in increased pricing pressure. The digital media industry may also experience cyclical fluctuations, as well as fluctuations relating to how quickly certain new digital media products and technologies are adopted by the market.
In addition, our recent and significant growth in net sales resulted, in large part, from the high growth in sales of products manufactured by domestic mobile handset, telecom equipment and digital consumer electronics manufacturers in China. These domestic manufacturers may not continue to grow their sales at historical levels, if at all. The stagnation or reduction in overall demand for mobile handset and telecom equipment products would materially affect our results of operations and financial condition.
The mobile handset end-market is characterized by a short product lifecycle, making time-to-market and sensitivity to customer needs critical to our success and our failure to respond will harm our business.
Mobile handsets typically have a lifecycle of approximately six to 12 months before the technology becomes obsolete. Time-to-market, both with respect to our customers’ ability to supply consumers with timely and marketable products and our ability to provide our customers with a wide array of latest generation customized module design solutions, is critical to our success. As design cycles in the industry shorten, we face logistical challenges in providing our solutions in an increasingly shorter timeframe. If we are unable to respond to the shortened lifecycles and time-to-market, our business will suffer.
13
Risks Related to Doing Business in China
There are substantial risks associated with doing business in China, including those set forth in the following risk factors.
Our operations may be adversely affected by China’s economic, political and social conditions.
Substantially all of our operations and assets are located in China and substantially all of our net sales are derived from our operations in China. Accordingly, our results of operations and future prospects are subject to economic, political and social developments in China. In particular, our results of operations may be adversely affected by:
| | • | | changes in China’s political, economic and social conditions; |
| | • | | changes in policies of the government or changes in laws and regulations, or the interpretation of laws and regulations; |
| | • | | changes in foreign exchange regulations; |
| | • | | measures that may be introduced to control inflation, such as interest rate increases; and |
| | • | | changes in the rate or method of taxation. |
The PRC economy has historically been a planned economy. The majority of productive assets in China are still owned by various levels of the PRC government. In recent years the government has implemented economic reform measures emphasizing decentralization, utilization of market forces in the development of the economy and a high level of management autonomy. Such economic reform measures may be inconsistent or ineffectual, and we may not benefit from all such reforms. Furthermore, these measures may be adjusted or modified, possibly resulting in such economic liberalization measures being applied inconsistently from industry to industry, or across different regions of the country.
In the past twenty years, China has been one of the world’s fastest growing economies in terms of gross domestic product, or GDP. This growth may not be sustainable. Moreover, a slowdown in the economies of the United States, the European Union and certain Asian countries may adversely affect economic growth in China which depends on exports to those countries. Our financial condition and results of operations, as well as our future prospects, would be materially and adversely affected by an economic downturn in China.
Our financial results benefit from tax concessions granted by the PRC government, the change to or expiration of which would materially change our results of operations.
Our results of operation may be adversely affected by changes to or expiration of preferential tax concessions that some of our PRC operating companies currently enjoy or expect to enjoy in the future. The statutory tax rate generally applicable to Chinese companies is 33%. As a result of preferential tax rate incentives, our operations have been subject to relatively low tax liabilities. Tax that would otherwise have been payable without preferential tax treatment amounted to approximately RMB34.4 million($4.4 million) in 2006. For additional details regarding these tax incentives, please see “Item 7. Management’s discussion and analysis of financial condition and result of operations—Taxation.”
Tax laws in China are subject to interpretations by relevant tax authorities. The preferential tax treatment may not remain in effect or may change, in which case we may be required to pay the higher income tax rate generally applicable to Chinese companies, or such other rate as is required by the laws of China.
The PRC government, in particular the National People’s Congress, or NPC, is currently reviewing a draft new Enterprise Income Tax Law that, if enacted, would impose a single income tax rate of 25% for most domestic enterprises and FIEs. The draft contemplates various transition periods for existing preferential tax policies. The draft is subject to change and may end up not being enacted by the PRC government. If the proposed Enterprise Income Tax Law is enacted, it is expected to be effective as of January 1, 2008, and could eliminate or significantly shorten the period in whichShenzhen China as an FIE enjoys our preferential tax treatment. The enactment of the Enterprise Income Tax Law could adversely affect our financial condition and results of operations. Moreover, our historical operating results may not be indicative of our operating results for future periods as a result of the expiration of the tax holidays and value-added tax refunds we enjoy.
14
The telecom equipment market is extensively regulated in China.
The telecom equipment end-market accounted for 34.4% of our net sales in 2006. China’s telecom industry is heavily regulated. Changes in regulations affecting sales of these customers could negatively affect the telecom equipment end-market for our solutions, which will materially harm our business.
PRC government control of currency conversion may affect our ability to meet foreign currency obligations.
Because the majority of our net sales are denominated in Renminbi, any restrictions on currency exchange may limit our ability to use revenue generated in Renminbi to meet our foreign currency obligations, such as settling the purchase of materials which may be denominated in U.S. dollars. The principal regulation governing foreign currency exchange in China is the Foreign Currency Administration Rules (1996), or the Rules, as amended. Under the Rules, once certain procedural requirements are met, Renminbi is convertible for current account transactions, including trade and service-related foreign exchange transactions and dividend payments, but not for capital account transactions, including direct investment, loans or investments in securities outside China, without prior approval of the PRC State Administration of Foreign Exchange, or SAFE, or its local counter-parts. Since a significant amount of our future revenues will continue to be denominated in Renminbi, any existing and future restrictions on currency exchange may limit our ability to utilize revenue generated in China to fund our business activities outside of China, if any, or expenditures denominated in foreign currencies, or our ability to meet our foreign currency obligations, which could have a material adverse effect on our business, financial condition and results of operations. We cannot be certain that the PRC regulatory authorities will not impose more stringent restrictions on the convertibility of Renminbi with respect to foreign exchange transactions.
Recent PRC regulations relating to offshore investment activities by PRC residents may increase the administrative burden we face and create regulatory uncertainties that could restrict our overseas and cross-border investment activity, and a failure by our shareholders who are PRC residents to make any required applications and filings pursuant to such regulations may prevent us from being able to distribute profits and could expose us and our PRC resident shareholders to liability under PRC law.
In October 2005, the PRC State Administration of Foreign Exchange, or SAFE, promulgated regulations that require PRC residents and PRC corporate entities to register with and obtain approvals from relevant PRC government authorities in connection with their direct or indirect offshore investment activities. These regulations apply to our shareholders who are PRC residents in connection with our prior and any future offshore acquisitions.
The SAFE regulation required registration by March 31, 2006 of direct or indirect investments previously made by PRC residents in offshore companies prior to the implementation of the Notice on Issues Relating to the Administration of Foreign Exchange in Fund-Raising and Reverse Investment Activities of Domestic Residents Conducted via Offshore Special Purpose Companies on November 1, 2005. If a PRC shareholder with a direct or indirect stake in an offshore parent company fails to make the required SAFE registration, the PRC subsidiaries of such offshore parent company may be prohibited from making distributions of profit to the offshore parent and from paying the offshore parent proceeds from any reduction in capital, share transfer or liquidation in respect of the PRC subsidiaries, and may be prohibited from receiving capital contributions, shareholder loan or other payments from our offshore parent company, and may be further prohibited from making payments to or receiving payments from other overseas entities. Furthermore, failure to comply with the various SAFE registration requirements described above could result in liability under PRC law for foreign exchange evasion.
Some of our PRC resident shareholders may not have completed their registration with SAFE under the SAFE regulation, in part, due to confusion over the application of the SAFE regulation to our company. For example, in mid-2006, some of our PRC resident shareholders attempted to register with SAFE in Shenzhen under predecessor regulations to the SAFE regulation, but were informed by Shenzhen SAFE that the regulation did not apply to them. These PRC resident shareholders did not realize they might be required to register under the new SAFE regulations. Further, even if our PRC resident shareholders do apply for SAFE registration, they may not be able to obtain such registration at the discretion of SAFE due to various reasons including their failure to comply with the retroactive SAFE registration requirement prior to March 31, 2006, the statutorily prescribed deadline for compliance. The failure or inability of our PRC resident shareholders to obtain any required approvals or make any required registrations may subject us to fines and legal sanctions, prevent us
15
from being able to make distributions or pay dividends or to receive capital contribution or shareholder loans, as a result of which our business operations and our ability to distribute profits to you or capitalize our operation in China could be materially and adversely affected.
Our acquisition strategy may be subject to SDRC approval under legislation enacted in 2004.
State Development and Reform Commission, or SDRC, promulgated a regulation in 2004 that requires SDRC approval in connection with direct or indirect offshore investment activities by individuals who are PRC residents and PRC corporate entities. This regulation may apply to our future offshore or cross-border acquisitions, as well as to the equity interests in offshore companies held by our PRC shareholders who are considered PRC residents. We intend to make all required application and filings, and will require the shareholders of the offshore entities in our corporate group who are considered PRC residents to make the application and filings, as required under the regulation and under any implementing rules or approval practices that may be established under this regulation. However, because this regulation lacks implementing rules, approval precedents or reconciliation with other approval requirements, it remains uncertain how this regulation, and any future legislation concerning offshore or cross-border transactions, will be interpreted and implemented by the relevant government authorities. The approval criteria by SDRC agencies for outbound investment by PRC residents are not provided under this regulation or other SDRC regulations. Accordingly, we cannot provide any assurances that we will be able to comply with, qualify under or obtain any approval as required by this regulation or other related legislations. Our failure or the failure of our PRC resident shareholders to obtain SDRC approvals may restrict our ability to acquire a company outside of China or use our entities outside of China to acquire or establish companies inside of China, which could negatively affect our business and future prospects.
PRC laws and our corporate structure may restrict our ability to receive dividends and payments from, and transfer funds to, our PRC operating companies, which may negatively affect our results of operations and restrict our ability to act in response to changing market conditions.
Substantially all of our operations are conducted through our PRC operating companies. The ability of our PRC operating companies to make dividends and other payments to us may be restricted by factors such as changes in applicable foreign exchange and other laws and regulations. For example, under the SAFE regulations discussed above, the foreign exchange activities of our present or prospective PRC subsidiaries are conditioned upon the compliance with the SAFE registration requirements by the shareholders of our offshore entities who are PRC residents. Failure to comply with these SAFE registration requirements may substantially restrict or prohibit the foreign exchange inflow to and outflow from our PRC subsidiaries, namely Comtech Communications and Comtech Software, including, remittance of dividends and foreign-currency- denominated borrowings by these PRC subsidiaries. In addition, our PRC operating companies are required, where applicable, to allocate a portion of their net profit to certain funds before distributing dividends, including at least 10% of their net profit to certain reserve funds until the balance of such fund has reached 50% of their registered capital. These reserves can only be used for specific purposes, including making-up cumulative losses of previous years, conversion to equity capital, and application to business expansion, and are not distributable as dividends. Our PRC operating companies are also required, where applicable, to allocate an additional 5% to 10% of their net profits to a statutory common welfare fund. The net profit available for distribution from our PRC operating companies is determined in accordance with generally accepted accounting principles in China, which may materially differ from a determination performed in accordance with U.S. GAAP. As a result, we may not receive sufficient distributions or other payments from these entities to enable us to make dividend distributions to our shareholders in the future, even if our U.S. GAAP financial statements indicate that our operations have been profitable.
We do not directly own the equity interest in Shenzhen Comtech, which accounted for approximately 7.1% of our net sales in 2006, or Shanghai E&T, which is owned 60% by Shenzhen Comtech and 40% by Comtech China through contractual agreements with Shenzhen Comtech and Honghui Li respectively, and which accounted for approximately 6.5% of our net sales in 2006. Honghui Li and Huimo Chen, the shareholders of Shenzhen Comtech, have contractually agreed, among others things, to apply all dividends or other payments they receive from Shenzhen Comtech to payments to our 100% directly owned subsidiary, Comtech China, or its designated entities, for valid and valuable consideration and to the extent permitted by applicable PRC law, including PRC foreign exchange law. PRC law and regulatory requirements would currently restrict the ability of the shareholders of Shenzhen Comtech, based solely upon the contractual agreement, to directly apply the dividends or other payments they receive from Shenzhen Comtech in U.S. dollars to payments to Comtech China or in Renminbi to Comtech China’s designated entities in China. For example, the PRC foreign exchange authorities would have discretion to review the adequacy of the
16
consideration given in exchange for the application of any dividends or payments from Shenzhen Comtech to Comtech China. If Honghui Li and Huimo Chen fail to apply such dividends or other payments received from Shenzhen Comtech, which might include profit distributions from Shanghai E&T to Shenzhen Comtech, to payments to Comtech China or its designated entities, our financial condition would be negatively affected. Apart from the dividend distribution from our PRC subsidiaries to us, the transfer of funds from our company to our PRC operating companies, either as a shareholder loan or as an increase in registered capital or otherwise, is subject to registration or approval with or by PRC governmental authorities, including the relevant administration of foreign exchange and/or other relevant examining and approval authorities. These limitations on the free flow of funds between us and our PRC operating companies may restrict our ability to act in response to changing market conditions.
Fluctuations in exchange rates could adversely affect our business.
Because a substantial majority of our earnings and cash assets are denominated in Renminbi, fluctuations in the exchange rate between the U.S. dollar and the Renminbi will affect the relative purchasing power of these proceeds and our balance sheet and earnings per share in U.S. dollars following this offering. In addition, appreciation or depreciation in the value of the Renminbi relative to the U.S. dollar would affect our financial results reported in U.S. dollar terms without giving effect to any underlying change in our business or results of operations. Fluctuations in the exchange rate will also affect the relative value any dividend we may issue after this offering that will be exchanged into U.S. dollars and earnings from and the value of any U.S. dollar-denominated investments we make in the future. In addition, a depreciation of the Renminbi relative to the U.S. dollar would have the effect of reducing our U.S. dollar-translated net sales and increasing the debt servicing requirements for our U.S. dollar-denominated debt. On the other hand, the appreciation of the Renminbi would make our customers’ products more expensive to purchase outside of China because many of our customers are involved in the export of goods, which could adversely affect their sales, thereby eroding our customer base and adversely affecting our results of operations.
Since July 2005, the Renminbi has no longer been pegged to the U.S. dollar. Although currently the Renminbi exchange rate versus the U.S. dollar is restricted to a rise or fall of no more than 0.3% per day and the People’s Bank of China regularly intervenes in the foreign exchange market to prevent significant short-term fluctuations in the exchange rate, the Renminbi may appreciate or depreciate significantly in value against the U.S. dollar in the medium to long term. Moreover, it is possible that in the future, the PRC authorities may lift restrictions on fluctuations in the Renminbi exchange rate and lessen intervention in the foreign exchange market.
Very limited hedging transactions are available in China to reduce our exposure to exchange rate fluctuations. To date, we have not entered into any hedging transactions in an effort to reduce our exposure to foreign currency exchange risk. While we may enter into hedging transactions in the future, the availability and effectiveness of these transactions may be limited and we may not he able to successfully hedge our exposure at all. In addition, our foreign currency exchange losses may be magnified by PRC exchange control regulations that restrict our ability to convert Renminbi into foreign currencies.
The legal system in China has inherent uncertainties that may limit the legal protections available to you as an investor or to us in the event of any claims or disputes with third parties.
The legal system in China is based on written statutes. Prior court decisions may be cited for reference but have limited precedential value. Since 1979, the central government has promulgated laws and regulations dealing with economic matters such as foreign investment, corporate organization and governance, commerce, taxation and trade. As China’s foreign investment laws and regulations are relatively new and the legal system is still evolving, the interpretation of many laws, regulations and rules is not always uniform and enforcement of these laws, regulations and rules involve uncertainties, which may limit the remedies available to you as an investor and to us in the event of any claims or disputes with third parties. In addition, any litigation in China may be protracted and result in substantial costs and diversion of resources and management attention.
On August 8, 2006, six PRC regulatory agencies, including the Chinese Securities Regulatory Commission, or CSRC, promulgated the Regulation on Mergers and Acquisitions of Domestic Companies by Foreign Investors, which became effective on September 8, 2006. This new regulation, among other things, requires offshore special purpose vehicles, or SPVs, formed for overseas listing purposes through acquisitions of PRC domestic companies and controlled by PRC individuals, to obtain the approval of the CSRC prior to publicly listing their securities on an overseas stock exchange. We believe, based on the advice of
17
our PRC counsel, that this regulation does not apply to us or this offering and that CSRC approval is not required because such acquisition was completed long before September 8, 2006 when the new regulation became effective. On September 21, 2006, the CSRC published a notice specifying the documents and materials that are required to be submitted for obtaining CSRC approval. In the opinion of our PRC counsel, the new notice does not contradict its interpretation of the new regulation, nor does it add greater clarity to the applicability of the new regulation to us. Based on the advice we have received from our PRC counsel, we do not intend to seek CSRC approval in connection with this offering.
Since the new regulation has only recently been adopted, there may be some uncertainty as to how this regulation will be interpreted or implemented. If the CSRC or other PRC regulatory body subsequently determines that the CSRC’s approval is required for this offering, we may face sanctions by the CSRC or other PRC regulatory agencies. These regulatory agencies may impose fines and penalties on our operations in the PRC, limit our operation privileges in the PRC, delay or restrict the repatriation of the proceeds from this offering into the PRC, restrict or prohibit payment or remittance of dividends by Comtech China, or take other actions that could have a material adverse effect on our business, financial condition, results of operations, reputation and prospects, as well as the trading price of our shares. The CSRC or other PRC regulatory agencies may also take actions requiring us, or making it advisable to us, to halt this offering before settlement and delivery of the shares being offered by us.
You may experience difficulties in effecting service of legal process and enforcing judgments against us and our management.
Substantially all of our operations and assets are located in China. In addition, most of our directors, executive officers and some of the experts named in this document reside within China, and many of the assets of these persons are also located within China. As a result, it may not be possible to effect service of process within the United States or elsewhere outside China upon these directors or executive officers or some of the experts named in this document, including with respect to matters arising under U.S. federal securities laws or applicable state securities laws. Moreover, our PRC legal counsel has advised us that China does not have treaties with the United States or many other countries providing for the reciprocal recognition and enforcement of court judgments. As a result, recognition and enforcement in China of judgments of a court of the United States or any other jurisdiction, including judgments against us or our directors, executive officers, or the named experts, may be difficult or impossible.
We face risks related to health epidemics and outbreaks of contagious diseases, including avian influenza and Severe Acute Respiratory Syndrome, or SARS.
Our business could be adversely affected by the effects of avian influenza, SARS or other epidemics or outbreaks of contagious diseases. There were recent reports of outbreaks of a highly pathogenic avian influenza, or avian flu, caused by the H5N1 virus in certain regions of Asia and Europe. In 2005 and 2006, there were reports on the occurrences of avian flu in various parts of China, including some confirmed human cases. A major outbreak of avian flu in the human population could result in a widespread health crisis that could adversely affect the economies and financial markets of many countries, particularly in Asia. Additionally, a recurrence of SARS, a highly contagious form of atypical pneumonia, similar to the occurrence in 2003 which affected China, Hong Kong, Taiwan, Singapore, Vietnam and certain other countries, would also have similar adverse effects. Since all of our operations and substantially all of our customers and suppliers are based in Asia, an outbreak of avian flu, SARS or other contagious diseases in China, other places in Asia or elsewhere, or the perception that such outbreaks could occur, and the measures taken by the governments of countries affected, would adversely affect our business, financial condition or results of operations. We have not adopted any written preventive measures or contingency plans to combat any future outbreaks of avian flu, SARS or any other epidemics.
Risks Related to Our Common Stock
Our principal shareholder and chief executive officer beneficially owns a substantial majority of our common stock. As a result, the trading price for our shares may be depressed due to market perception that our principal shareholder and chief executive officer will be able to take actions that may be adverse to your interests.
Jeffrey Kang, our principal shareholder and chief executive officer, directly and through entities he controls, currently beneficially owns approximately32.8% of our issued and outstanding common stock. This
18
significant concentration of share ownership may adversely affect the trading price of our common stock because investors, often perceive a disadvantage in owning shares in a company with only one or very few controlling shareholders. Furthermore, Mr. Kang has the ability to significantly influence the outcome of all matters requiring shareholder approval, including the election of directors and approval of significant corporate transactions, such as mergers, consolidations or the sale of substantially all of our assets. This concentration of ownership may have the effect of delaying or preventing a change of control, including a merger, consolidation or other business combination involving us, or discouraging a potential acquirer from making a tender offer or otherwise attempting to obtain control, even if such a change of control would benefit you.
Failure to comply with recently enacted changes in securities laws and regulations could adversely affect our stock price.
As directed by Section 404 of the Sarbanes-Oxley Act of 2002, public companies are required to include a report of management on the company’s internal controls over financial reporting in their annual reports on Form 10-K and the public accounting firm auditing a company’s financial statements must attest to and report on management’s assessment of the effectiveness of the company’s internal controls over financial reporting. If we are unable in the future to conclude that we have effective internal controls over financial reporting, or if our independent auditors are unable to provide us with an unqualified report as to the effectiveness of our internal controls over financial reporting as of future year ends, as required by Section 404 of the Sarbanes-Oxley Act, we could experience delays or inaccuracies in our reporting of financial information, or non-compliance with SEC reporting and other regulatory requirements. This could subject us to regulatory scrutiny and result in a loss of public confidence in our management, which could, among other things, adversely affect our stock price.
The trading prices of our shares have been and are likely to continue to be volatile, which could result in substantial losses to you.
The trading prices of our shares have been and are likely to continue to be volatile. Since January 1, 2005, the trading price of our shares on the Nasdaq Global Market has ranged from $4.63 to $19.89 per share, and the last reported sale price on March 14, 2007 was $15.20 per share. The trading prices of our shares could fluctuate widely in response to factors beyond our control. In particular, the performance and fluctuation of the market prices of other companies with business operations located mainly in China that have listed their securities in the United States may affect the volatility in the price of and trading volumes for our shares. Recently, a number of PRC companies have listed their securities, or are in the process of preparing for listing their securities, on U.S. stock markets. Some of these companies have experienced significant volatility, including significant price declines after their initial public offerings. The trading performances of these PRC companies’ securities at the time of or after their offerings may affect the overall investor sentiment towards PRC companies listed in the United States and consequently may impact the trading performance of our ADSs. These broad market and industry factors may significantly affect the market price and volatility of our ADSs, regardless of our actual operating performance.
In addition to market and industry factors, the price and trading volume for our shares may be highly volatile for specific business reasons. In particular, factors such as variations in our revenues, earnings and cash flow, announcements of new investments, cooperation arrangements or acquisitions or sales of large blocks of our shares, could cause the market price for our shares to change substantially. Any of these factors may result in large and sudden changes in the volume and trading price of our shares. In the past, following periods of volatility in the market price of a company’s securities, shareholders have often instituted securities class action litigation against that company. If we were involved in a class action suit, it could divert the attention of senior management, and, if adversely determined, could have a material adverse effect on our financial condition and results of operations.
Future sales of shares could have an adverse effect on the market price of our common stock.
A significant portion of our shares are held by a small number of shareholders. Historically, trading volume of our shares has been relatively low. Sales by our current shareholders of a substantial number of shares could significantly reduce the market price of our common stock. These sales could also impede our ability to raise future capital.
As of December 31, 2006, we had 32,971,901 shares of common stock outstanding, which shares will be able to be sold in the public market in the near future, subject to, with respect to shares of common stock held
19
by affiliates and shares issued between 12 and 24 months ago, the volume restrictions and/or manner of sale requirements of Rule 144 under the Securities Act. These shares are freely tradable without restriction or further registration, subject to the related prospectus delivery requirements.
As of December 31, 2006, we had stock options outstanding to purchase an aggregate of 1,428,519 shares of common stock and warrants outstanding to purchase 171,028 shares of our common stock. To the extent that the options and warrants are exercised, they may be exercised at prices below the price of our shares of common stock on the public market, resulting in a significant number of shares entering the public market and the dilution of our common stock. In addition, in the event that any future financing should be in the form of securities convertible into, or exchangeable for, equity securities, investors may experience additional dilution upon the conversion or exchange of such securities.
ITEM 1B. UNRESOLVED STAFF COMMENTS
Not applicable.
ITEM 2. PROPERTIES
We lease properties with a total area of approximately 95,000 square feet in 20 locations in China including Shenzhen, Shanghai, Beijing, Hang Zhou and Hong Kong. Approximately 20,000 square feet is for our corporate headquarters located in Shenzhen, approximately 38,000 square feet is for our research and development centers in Shenzhen and Shanghai, approximately 17,000 square feet is for our representative offices located in the other cities, and approximately 20,000 square feet is used for manufacturing of our proprietary lightning protection product for wireless base stations. These leases have remaining terms ranging from one to 40 months.
We believe that our existing facilities and equipment are well maintained and in good operating condition, and are sufficient to meet our needs for the foreseeable future.
ITEM 3. LEGAL PROCEEDINGS
In 2004, we received a complaint threatening an action for damages arising from alleged breaches of fiduciary duties in connection with transactions involving Centerpoint Corporation and Bion Environmental Technologies, Inc. The transactions took place before the consummation of our share exchange agreement with Trident, at a time when Trident and our subsidiary, OAM, owned a majority of the shares of Centerpoint. We were named as a potential defendant in the draft complaint, together with OAM, and Mark Hauser and Mark Segall, who were former members of our board of directors, and other individuals and entities associated with Trident. The complaint was said to be on behalf of Centerpoint and a class of Bion shareholders, and alleged that the potential defendants controlled the affairs of Centerpoint, and used their positions, among other things, to divert Centerpoint assets to themselves. The complaint has never been formally served, and there has not been any active litigation, as the parties have been attempting to negotiate a settlement.
We claimed several refunds from the Italian government on corporate taxes paid by OAM, our 98.6% owned Italian subsidiary, during the 1970s and early 1980s. In one instance, the Italian tax authorities have counterclaimed, assessing additional unpaid taxes due by OAM. We have been successful in two lower courts in our defense of these counterclaims and was informed that the case had been determined in our favor in April 2005. In May 2006, we received notification from the Italian counsel that the Italian tax authorities have counterclaimed again against the earlier judgment in April 2005. The Italian counsel also informed us that there were grounds under Italian law to appeal this latest determination. In early 2007, we entered a Sale and Purchase Agreement for OAM with Asia Pacific Technology Development Limited.
We believe that the outcome of the two matters above will have no material effect on our financial condition or results of operations.
Except as described above, we are not currently involved in any material litigation. From time to time, we may be also involved in litigation arising in the normal course of our business.
20
ITEM 4. SUBMISSION OF MATTERS TO A VOTE OF SECURITY HOLDERS
At its Annual Meeting of shareholders held on December 20, 2006, the Company submitted the following matters to a vote of its shareholders:
| | | | |
Name of Director | | Votes For | | Votes Withheld |
Jeffrey Kang | | 30,341,763 | | 509,736 |
| | |
Hope Ni | | 30,339,441 | | 512,058 |
| | |
Amy Kong | | 30,686,326 | | 165,173 |
| | |
Q.Y. Ma | | 30,690,978 | | 160,521 |
| | |
Frank Zheng | | 30,689,977 | | 161,522 |
| 2. | Approve 2006 Equity Incentive Plan which provides for the grant of up to 4,800,000 shares of our Common Stock pursuant to Incentive Stock Options, Non-Qualified Stock Options, Restricted Stock, Stock Appreciation Rights, and Performance Stock Awards: |
| | | | |
Votes For | | Votes Against | | Abstentions |
18,727,885 | | 6,173,348 | | 89,459 |
| 3. | Appointment of KPMG as the independent registered public accounting firm of the Company: |
| | | | |
Votes For | | Votes Against | | Abstentions |
30,827,685 | | 16,324 | | 7,489 |
PART II
ITEM 5. MARKET FOR REGISTRANT’S COMMON EQUITY, RELATED SHAREHOLDER MATTERS AND ISSUER PURCHASES OF EQUITY SECURITIES
Market Prices of Common Stock
Our common stock is quoted on the Nasdaq Global Select Market under the symbol “COGO”. The following table sets forth the reported high and low sale prices for our common stock for the periods indicated. These prices represent prices between dealers, without adjustment for retail mark-ups, mark-downs or commissions, and may not necessarily represent actual transactions.
| | | | | | | | |
| | | 2006 | | 2005 |
Dollars Per Share | | High | | Low | | High | | Low |
Quarter: | | | | | | | | |
First | | 11.59 | | 5.80 | | 8.50 | | 5.45 |
Second | | 16.70 | | 10.08 | | 6.69 | | 4.63 |
Third | | 15.28 | | 9.03 | | 6.83 | | 4.91 |
Fourth | | 19.89 | | 13.45 | | 6.66 | | 5.41 |
The closing price of our common stock on March 14, 2007 as reported by the Nasdaq Global Market was $15.20.
Shareholders
As of March 12, 2007, there were 33,105,911 shares of our common stock outstanding, and we had approximately 795 shareholders of record. The transfer agent and registrar for our common stock is American Stock Transfer & Trust Company.
Dividends
Prior to the share exchange with Trident on July 22, 2004, we declared dividends of RMB41.4 million ($5.0 million) on our common stock. In September 2004, we paid our shareholders of record prior to the share exchange such dividends. During the last two fiscal years we have not declared any other cash dividends on our common stock.
21
We currently intend to retain our future earnings, if any, to finance the further development and expansion of our business and do not intend to pay cash dividends in the foreseeable future. Any future determination to pay dividends will be at the discretion of our board of directors and will depend on our financial condition, results of operations, current and anticipated cash needs, restrictions contained in current or future financing instruments, plans for expansion and such other factors as our board of directors deems relevant.
Our PRC operating companies are required, where applicable, to allocate a portion of their net profit to certain funds before distributing dividends, including at least 10% of their net profit to certain reserve funds until the balance of such fund has reached 50% of their registered capital. These reserves can only be used for specific purposes, including making-up cumulative losses of previous years, conversion to our equity capital, and application to business expansion, and are not distributable as dividends. Our PRC operating companies are also required, where applicable, to allocate an additional 5% to 10% of their net profits to a statutory common welfare fund. For risks associated with the uncertainty in our receipt of the equivalent economic interest in connection with the equity interest in Shenzhen Comtech, see “Risk factors—PRC laws and our corporate structure may restrict our ability to receive dividends and payments from, and transfer funds to, our PRC operating companies, which may negatively affect our results of operations and restrict our ability to act in response to changing market conditions.”
Stock Performance Graph
The following graph compares the cumulative total stockholder return on our common stock since we become public through a share exchange (July 22, 2004) through December 31, 2006 with the cumulative total stockholder return of (1) the Nasdaq Composite Index and (2) the companies using the same SIC Code as us (SIC Code 3670 – Electronic Components and Accessories). The graph assumes $100 was invested in our common stock, and in each Index, on July 22, 2004, and that all dividends were reinvested. The stock price performance on the following graph is not necessarily indicative of future stock price performance.
22
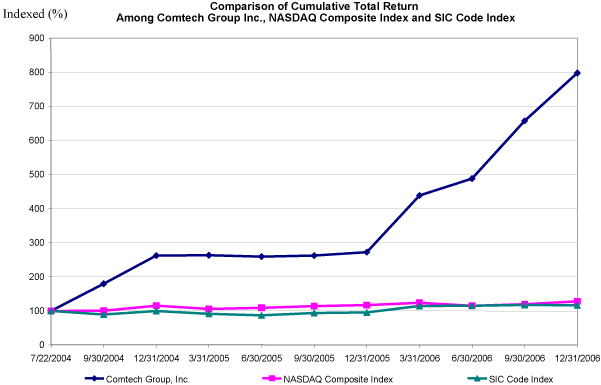
The stock performance Graph is not “soliciting material,” is not deemed filed with the Securities and Exchange Commission and is not deemed to be incorporated by reference by any general statement incorporating by reference this annual report on Form 10-K into any filing of ours under the Securities Act of 1933, or any filing under the Securities Exchange Act of 1934, except to the extent that we specifically request that the information be treated as soliciting material or specifically incorporate this information by reference into any such filing, and will not otherwise be deemed incorporated by reference into any other filing under the Securities Act or the Securities Exchange Act.
Recent Sales of Unregistered Securities
None.
Equity Compensation Plan Information
See “Item 11. Executive Compensation” for the aggregate information regarding our equity compensation plans in effect on December 31, 2006.
ITEM 6. SELECTED FINANCIAL DATA
The following selected consolidated statement of operations data for the five years ended December 31, 2006 and consolidated balance sheet data as of December 31, 2006, 2005, 2004, 2003 and 2002, presented below are derived from our audited consolidated financial statements and related notes thereto. These audited consolidated financial statements and the related notes have been prepared in accordance with U.S. GAAP, and have been audited by KPMG, an independent registered public accounting firm, for the year ended December 31, 2006, and by Deloitte Touche Tohmatsu, an independent registered public accounting firm, for the years ended December 31, 2005 and 2004. The selected statements of income data for each of the two year periods ended December 31, 2003 and 2002 and the balance sheet as of December 31, 2004, 2003 and 2002 were derived from our audited financial statements which are not included in this report.
23
The consolidated financial statements are reported in Renminbi because all of our material operating entities are based in and operated entirely within the PRC. Renminbi and U.S. dollar amounts are presented in thousands, except share and per share data. This data should be read in conjunction with our “Management’s discussion and analysis of financial condition and results of operations” and our audited consolidated financial statements and the related notes included elsewhere in this Form 10-K.
The accompanying consolidated financial statements are expressed in Renminbi (“RMB”), the national currency of the PRC. Solely for the convenience of the reader, the December 31, 2006 audited consolidated financial statements have been translated into United States dollars (“US$” or “$”) at the closing rate in New York City on December 31, 2006 for cable transfers in RMB as certified for customers purposes by the Federal Reserve Bank of New York of US$ 1.00 = RMB 7.8041. No representation is made that the RMB could have been, or could be, converted into US$ at that rate or at any other certain rate on December 31, 2006, or at any other certain date.
Consolidated Statement of Operations Data
(In thousands, except share and per share amounts)
| | | | | | | | | | | | | | | | | | |
| | | Year Ended December 31, | |
| | | 2006 $(1) | | | 2006 RMB(1) | | | 2005 RMB | | | 2004 RMB | | | 2003 RMB | | | 2002 RMB | |
Net sales | | | | | | | | | | | | | | | | | | |
Product revenue | | 162,629 | | | 1,269,176 | | | 866,332 | | | 625,656 | | | 357,805 | | | 207,607 | |
Services revenue | | 6,969 | | | 54,387 | | | — | | | — | | | — | | | — | |
| | | | | | | | | | | | | | | | | | |
| | 169,598 | | | 1,323,563 | | | 866,332 | | | 625,656 | | | 357,805 | | | 207,607 | |
Cost of sales | | | | | | | | | | | | | | | | | | |
Cost of goods sold | | (133,642 | ) | | (1,042,951 | ) | | (714,881 | ) | | (530,800 | ) | | (306,939 | ) | | (190,265 | ) |
Cost of services | | (4,347 | ) | | (33,928 | ) | | — | | | — | | | — | | | — | |
| | | | | | | | | | | | | | | | | | |
| | (137,989 | ) | | (1,076,879 | ) | | (714,881 | ) | | (530,800 | ) | | (306,939 | ) | | (190,265 | ) |
Gross profit | | 31,609 | | | 246,684 | | | 151,451 | | | 94,856 | | | 50,866 | | | 17,342 | |
Selling, general and administrative expenses | | (11,544 | ) | | (90,097 | ) | | (38,970 | ) | | (21,092 | ) | | (20,341 | ) | | (7,461 | ) |
Research and development expenses | | (3,585 | ) | | (27,977 | ) | | (15,837 | ) | | (6,121 | ) | | | | | | |
Other operating income | | 24 | | | 185 | | | 180 | | | 1,110 | | | — | | | — | |
| | | | | | | | | | | | | | | | | | |
Income from operations | | 16,504 | | | 128,795 | | | 96,824 | | | 68,753 | | | 30,525 | | | 9,881 | |
Gain on disposal of a subsidiary | | 855 | | | 6,673 | | | — | | | — | | | — | | | — | |
Interest expense | | (371 | ) | | (2,896 | ) | | (1,762 | ) | | (2,156 | ) | | (801 | ) | | — | |
Interest income | | 942 | | | 7,352 | | | 2,493 | | | 38 | | | 54 | | | 157 | |
| | | | | | | | | | | | | | | | | | |
Income before income taxes and minority interests | | 17,930 | | | 139,924 | | | 97,555 | | | 66,635 | | | 29,778 | | | 10,038 | |
Income taxes | | (1,423 | ) | | (11,104 | ) | | (6,736 | ) | | (2,300 | ) | | (1,295 | ) | | (820 | ) |
| | | | | | | | | | | | | | | | | | |
Income before minority interests | | 16,507 | | | 128,820 | | | 90,819 | | | 64,335 | | | 28,483 | | | 9,218 | |
| | | | | | | | | | | | | | | | | | |
Minority interests in income of consolidated subsidiaries | | (711 | ) | | (5,545 | ) | | (3,977 | ) | | (2,133 | ) | | — | | | — | |
| | | | | | | | | | | | | | | | | | |
Net income | | 15,796 | | | 123,275 | | | 86,842 | | | 62,202 | | | 28,483 | | | 9,218 | |
Earnings per share | | | | | | | | | | | | | | | | | | |
Basic | | 0.49 | | | 3.83 | | | 3.08 | | | 2.87 | | | 1.41 | | | 0.46 | |
| | | | | | | | | | | | | | | | | | |
Diluted | | 0.47 | | | 3.64 | | | 2.94 | | | 2.84 | | | 1.41 | | | 0.46 | |
| | | | | | | | | | | | | | | | | | |
Dividends declared per share | | — | | | — | | | — | | | — | | | 2.04 | | | — | |
| | | | | | | | | | | | | | | | | | |
Weighted average number of common shares outstanding | | | | | | | | | | | | | | | | | | |
Basic | | 32,200,044 | | | 32,200,044 | | | 28,168,274 | | | 21,690,560 | | | 20,251,075 | | | 20,251,075 | |
| | | | | | | | | | | | | | | | | | |
Diluted | | 33,829,519 | | | 33,829,519 | | | 29,507,939 | | | 21,885,053 | | | 20,251,075 | | | 20,251,075 | |
| | | | | | | | | | | | | | | | | | |
| | | | | | |
Consolidated Balance Sheet Data | | | | | | | | | | | | | | | | | | |
| |
| | | As of December 31, | |
| | | 2006 $(2) | | | 2006 RMB(2) | | | 2005 RMB | | | 2004 RMB | | | 2003 RMB | | | 2002 RMB | |
Cash | | 48,071 | | | 375,147 | | | 177,098 | | | 41,444 | | | 30,683 | | | 12,194 | |
Accounts receivable, net of allowance for doubtful amounts | | 35,698 | | | 278,589 | | | 267,543 | | | 168,989 | | | 92,259 | | | 67,597 | |
Property and equipment, net | | 1,588 | | | 12,395 | | | 6,904 | | | 3,317 | | | 2,961 | | | 2,371 | |
Total assets | | 116,233 | | | 907,098 | | | 668,935 | | | 309,167 | | | 160,200 | | | 97,072 | |
Total current liabilities | | 30,950 | | | 241,534 | | | 153,777 | | | 118,955 | | | 142,546 | | | 66,514 | |
Total liabilities and minority interests | | 31,160 | | | 243,180 | | | 162,376 | | | 123,159 | | | 142,546 | | | 66,514 | |
Total stockholders’ equity | | 85,073 | | | 663,918 | | | 506,559 | | | 186,008 | | | 17,654 | | | 30,558 | |
| (1) | We adopted Financial Accounting Standards No. 123R, Share Based Payments (“SFAS No. 123R”) on January 1, 2006. Prior to 2006, we applied the intrinsic value method as allowed under SFAS No. 123, Accounting for Stock Based Compensation (“SFAS No. 123”). The adoption of SFAS No. 123R effective January 1, 2006, resulted in recognition of incremental stock-based compensation expense of RMB20.0 million ($2.6 million) for the year ended December 31, 2006. |
24
| (2) | Acquisitions during 2006 did not significantly increase total assets. |
ITEM 7. MANAGEMENT’S DISCUSSION AND ANALYSIS OF FINANCIAL CONDITION AND RESULTS OF OPERATIONS
The following discussion of our financial condition and results of operations should be read in conjunction with our audited consolidated financial statements and the notes to those financial statements appearing elsewhere in this Form 10-K. This discussion contains forward-looking statements that involve significant risks and uncertainties. As a result of many factors, such as those set forth under “Forward Looking Statements” and “Item 1A. Risk Factors” and elsewhere in this Form 10-K, our actual results may differ materially from those anticipated in these forward-looking statements.
Overview
We provide customized module design solutions for a diverse set of applications and end markets, serving as a gateway for our technology component suppliers to access leading electronics manufacturers in China. Our customized module design solutions allow our customers to take advantage of technology components from reputable suppliers in an efficient and cost-effective manner, thus reducing their time-to-market and lowering their overall costs. Our close collaboration with our customers’ product development teams provides us with a unique understanding of their needs, enabling us to customize our suppliers’ technology components with module designs that meet our customers’ needs. In addition, in 2006, we began offering technology and engineering services, network system integration and related training and maintenance services to telecom equipment vendors in China and in Southeast Asia.
We are focused on the mobile handset, telecom equipment and digital media end-markets in China. In the mobile handset end-market, we provide module solutions for functionalities such as LCD, camera, power supply and Bluetooth; in the telecom equipment end-market, we provide solutions for PSTN switching, optical transmitters, electrical signal processing and optical signal amplification; and in the digital media end-market, we provide solutions for digital set-top boxes and GPS applications. Over the course of our operating history, we have worked with over 200 customers, including a majority of the most established manufacturers in the mobile handset, telecom equipment and digital media end-markets in China such as ZTE, Huawei and Lenovo. In addition to these original equipment manufacturers, or OEMs, our other customers include industry participants that support these OEMs, such as subsystem designers and contract manufacturers. In developing customized module design solutions for use in our customers’ products, we collaborate closely with over 30 suppliers of technology components, including many large multinational companies such as Broadcom, JDS Uniphase and Matsushita. In addition, in October 2006, we became one of the first China-based companies to license software technology and have access to selected source codes directly from Microsoft.
For the year ended December 31, 2006, we have two reportable operating segments: product revenue, consisting of revenues generated by providing customized module design solutions focusing primarily in the mobile handset, telecommunications equipment and digital media end-markets, and services revenue, generated by providing technology and engineering services, network system integration and related training and maintenance services. Prior to 2006, our only operating segment was product revenue.
Principal Factors Affecting Our Results of Operations
The major factors affecting our results of operations and financial condition include:
Revenue mix. Our net sales and gross profit are affected by our product mix. Over the last year, digital media related sales, which have generally higher profit margins than our mobile handset module related sales and our telecom equipment module related sales, have constituted a significantly greater portion of our total net sales as compared to previous years.
25
Growth in end-market industries. The rapid growth of the domestic mobile handset, telecom equipment and digital media end-markets have been important growth drivers for China’s electronics manufacturing industries. Specific markets that we expect to experience continued growth are the data communications market, consisting of asymmetric digital subscriber line (ADSL) modems and Voice over Internet Protocol (VoIP) equipment; the routers and network security equipment markets; the optical transmission systems market; the fixed line telecom network market, as well as the digital media market particularly relating to digital TV and GPS applications. Increased domestic consumer spending power has contributed to rapid growth in these markets. This growth in domestic consumer spending power in turn has driven, and we believe will continue to drive, growth in the electronics manufacturing businesses supporting hardware OEMs, including those engaged in the customized design of module solutions such as ourselves. However, these industries and the respective domestic manufacturers that operate in these industries may not continue to grow their sales at historical levels, if at all. The stagnation or reduction in overall demand for mobile handset, telecom equipment and digital media products could materially affect our results of operations.
Increase in exports. We believe that the development of a highly-skilled, low-cost manufacturing base has also enabled China’s domestic mobile handset, telecom equipment and digital consumer electronics manufacturers to be competitive in the global marketplace. As an example, Huawei has become a major supplier of telecom equipment to international customers, while ZTE, a major manufacturer of mobile handset and telecom equipment in China, as well as other telecom equipment and mobile handset manufacturers, have also begun to expand overseas. We believe that growth in the export market will likely have a positive effect on our results of operations and financial condition, as it should increase the demand for our solutions, particularly among our mobile handset and digital media clients.
Growth by entering new end-markets, strengthening in-house capabilities and leveraging our customer base. In 2005, we began targeting the digital media end-market and, over time, we intend to develop integrated circuit and application software design capabilities and provide solutions based on our own proprietary technology. In the first quarter of 2005, we began generating sales from customized module design solutions for digital home entertainment products, primarily for digital set-top boxes, through sales to our existing end-customers, Haier, Konka, Lenovo and TCL. We have since then grown our revenues generated from this market from constituting 10.8% of our 2005 revenue to 21.8% of our 2006 revenue. We anticipate that sales related to the digital media end-markets will generally have higher profit margins than our mobile handset and telecom equipment modules related sales, though such higher margins may decline over time as this industry mature. We will also look for opportunities to expand into new end markets that we believe represent significant growth opportunities.
Our success in the digital media end-market will depend, in significant part, on our ability to leverage our existing customer base. We expect to continue to incur additional research and development expenses, through hiring additional engineering personnel to develop new solutions and expanding our intellectual property and technological capabilities, to meet the needs of our customers that have expanded into or are expected to expand into the digital media end-market.
Net Sales
Product Revenue
We do not charge our customers an independent design fee for our solutions. Instead, our business model is to generate revenue by reselling a limited number of specific components required in our module reference design. The difference between the purchase price we pay our suppliers for these components and our sales price to the customer for these components compensates us for our design, technical support and distribution services. Our net sales includes a17% value-added tax, or VAT. In 2006, we received a VAT refund of RMB2.0 million.
Our broad and diversified customer base includes many of the major domestic mobile handset, telecom equipment and digital consumer electronics manufacturers in China. In addition, our customers include industry participants supporting these OEMs, such as subsystem designers and contract manufacturers in China, as well as international manufacturers who have begun to manufacture end-products in China for the domestic and international market. Our largest customer in terms of 2006 net sales was T&W Electronics Co., Ltd., or T&W Electronics, a major broadband terminal equipment and digital consumer electronics provider in China. Our largest customer in the mobile handset market has been ZTE, both a large domestic mobile handset manufacturer and one of the largest telecom equipment manufacturers in China. Our two largest customers from the telecom equipment industry are Huawei and ZTE, both of which are major telecom equipment manufacturers in China. Our largest customers in the digital media end-market are T&W Electronics and Sichuan Jiuzhou Electronics. During 2006, T&W Electronics, ZTE and Huawei, accounted for 15.9%, 8.6% and 6.9% of our net sales, respectively.
26
Our net sales are subject to seasonal fluctuation and periods of increased demand. All product module sales are typically highest in the fourth quarter of the year due to desire by OEMs to spend remaining budgets allocated for a given period, usually on an annual basis. Net sales have historically been lowest in the first quarter of the year due to the Chinese New Year holiday and the general reduction in sales following the holiday season. The digital media industry also experiences cyclical fluctuations, as well as fluctuations in how quickly certain new digital media products and technologies are adopted by the market. These sales patterns may not be indicative of future sales performance.
Services Revenue
We provide technology and engineering services, and related training and maintenance services to our customers. We generate revenue when our services are rendered and acknowledged by our customers. Since beginning this service in early 2006, Huawei has accounted for substantially all of our services revenue.
Cost of Sales
Our cost of sales comprises cost of goods sold and cost of services.
Cost of Goods Sold
Cost of goods sold primarily consists of the purchase of components from suppliers. We develop our customized module design solutions based on specific technology components purchased from suppliers in our target end-markets. Our list of over 30 key suppliers includes Broadcom (integrated circuit and Bluetooth), JDS Uniphase (optoelectronic components), M-Systems (flash memory, DiskOnChip), Matsushita (switches), and Sambu (speakers). We typically issue purchase orders to our suppliers only after we receive customer orders, enabling us to maintain low inventory levels and, in turn, minimize risks typically associated with holding inventory. During 2006, based on cost of sales, we purchased approximately 34.9%, 16.5% and 15.7% of the components sold to our customers from Broadcom, JDS Uniphase and Matsushita and its affiliated entities, respectively. If we lose a key supplier, or a supplier reduces the quantity of products it sells to us, does not maintain a sufficient inventory level of products required by us or is otherwise unable to meet our demands for its components, we may have to expend significant time, effort and other resources to locate a suitable alternative supplier and secure replacement components. Even if we are able to find a replacement supplier, we may be required to redevelop the customized module design solution to effectively incorporate the replacement components.
Cost of Services
Cost of services consists of direct staff costs and other direct related costs for providing engineering and technology services including training and materials.
Operating Expenses
Selling, General and Administrative Expenses
Our selling expenses include expenditures to promote our new module solutions and gain a larger customer base, personnel expenses and travel and entertainment costs related to sales and marketing activities, and freight charges. We expense all these expenditures as they are incurred. Selling expenses are expected to continue to grow in the future as we diversify by developing and acquiring new design capabilities and expanding into new end-markets.
General and administrative expenses include compensation and benefits for our general and administrative staff, professional fees, and general travel and entertainment costs. We expense all general and administrative expenses as they are incurred. We expect that general and administrative expenses will continue to increase for the foreseeable future as a result of our expected continued growth and the continuing costs of complying with U.S. rules and regulations necessary to maintain our listing in the United States.
27
Research and Development Expenses
Research and development expenses consist primarily of salaries and related costs of the employees engaged in research, design and development activities; the costs for design and testing; the cost of parts for prototypes; equipment depreciation; and third party development expenses. We expense research and development expenses as they are incurred. As of December 31, 2006, we had approximately 350 engineers and 200 other technical employees engaged in research and development related activities to develop new customized module design solutions targeted at the mobile handset, telecom equipment and digital media industries. As a result of additional costs incurred in developing new customized module design solutions, and an increasing headcount in our R&D department, research and development expenses were significantly higher in 2006 than they were in 2005, and we expect that our research and development expenses, including those relating to the planned hiring of additional research and development personnel, will increase in the future as we seek to expand our business by developing new customized module design solutions and penetrating new end-markets, and as we seek to grow our engineering services business.
Minority Interests
Minority interests consist of 45% of the outstanding equity interest in Comtech Broadband, 40% of the outstanding equity interest in Comtech Wireless, 48.9% of the outstanding equity interest in Huameng and 1.4% of the outstanding equity interest in OAM, a non-operating Italian subsidiary, held by minority shareholders of these entities. For the year ended December 31, 2006, approximately 22.1% of our total net sales was generated through these subsidiaries.
Taxation
We are a holding company incorporated in the State of Maryland and conduct substantially all our operations through our PRC operating companies. Although we are subject to United States taxation, we do not anticipate incurring significant United States income tax liability for the foreseeable future because:
| | • | | we do not conduct any material business in the United States, |
| | • | | the earnings generated from our non-U.S. operating companies are generally eligible for a deferral from United States taxation until such earnings are repatriated to the United States, and |
| | • | | we believe that we will not generate any significant amount of income inclusions under the income imputation rules applicable to a United States company that owns “controlled foreign corporations” for United States federal income tax purposes. |
Our subsidiaries that are incorporated in Cayman Islands and the British Virgin Islands are not subject to income taxes in those jurisdictions.
Our subsidiaries incorporated in Hong Kong, Comtech Hong Kong and Comtech Broadband, are subject to taxes on their profits in Hong Kong at 17.5% for 2006, 2005 and 2004.
The usual statutory tax rate applicable to PRC companies is 33%, while the statutory tax rate applicable to PRC companies in the Shenzhen Special Economic Zone in China is 15%. Since three of our PRC operating companies, Shenzhen Comtech, Comtech Communication and Comtech Software, are established in the Shenzhen Special Economic Zone, have agreed to operate for a minimum of 10 years in China and more than 50% of their revenues will be derived from their manufacturing operations, Shenzhen Comtech was, and Comtech Communication and Comtech Software have been and will continue to be, entitled to preferential income tax treatment under PRC law as follows:
| | • | | Shenzhen Comtech was subject to a three-year preferential tax rate of 7.5% in 2002, 2003 and 2004 and a tax rate of 15% in 2005 and 2006; |
| | • | | Comtech Communication operated under a zero-tax exemption in 2003 and 2004, and will be subject to a three-year preferential tax rate of 7.5% in 2005, 2006 and 2007; and |
| | • | | Comtech Software has been operating under a zero-tax exemption in 2005 and 2006, and will be subject to a three-year preferential tax rate of 7.5% in 2007, 2008 and 2009. |
28
Our acquired PRC operating companies, Viewtran PRC, Huameng PRC and Comloca PRC, which are also located in the Shenzhen Special Economic Zone, have no assessable profit in 2006. Following expiration of the preferential tax treatment described above, our PRC operating companies located in the Shenzhen Special Economic Zone will be subject to the statutory tax rate of 15%. In addition, Shanghai E&T, our PRC operating company located in the Shanghai Qingpu Zone, has elected to be taxed on a deemed basis at 0.5% of its net sales in accordance with guidelines issued by the local tax authority in the Shanghai Qingpu Zone since 2004. As a result of the incentives above, our operations have been subject to relatively low tax liabilities. See “Risk factors—Our financial results benefit from tax concessions granted by the PRC government, the change to or expiration of which would materially change our results of operations.” Our effective tax rate was 7.9%, 6.9% and 3.5% in 2006, 2005 and 2004, respectively. The increase in our effective tax rate over this three year period was mostly due to our subsidiaries with higher tax rates representing a greater percentage of our revenues. The ending of the preferential income tax period for Shenzhen Comtech and Comtech Communication also contributed to the increase in the effective tax rate. Having been granted the preferential tax treatment for Comtech Software, we expect that our effective tax rate will not significantly increase. Tax that would otherwise have been payable without preferential tax treatment amounted to approximately RMB34.4 ($4.4 million), RMB29.6 million and RMB19.9 million in 2006, 2005, and 2004, respectively.
Basis of Presentation
Our financial statements reflect the historical consolidated operations of Comtech Cayman. In the July 2004 share exchange with Trident, the stockholders of Comtech Cayman received in exchange for our business approximately 91.2% of the then-outstanding common stock of Trident. This share exchange transaction was accounted for as a reverse acquisition in which Comtech Cayman was deemed the accounting acquirer and Trident was deemed the legal acquirer. In connection with the share exchange, we changed our name to Comtech Group, Inc. from Trident.
As a result of the share exchange transaction:
| | • | | the historical financial statements of Trident for periods prior to the date of the share exchange transaction are no longer presented; |
| | • | | the historical financial statements for periods prior to the date of the transaction are those of Comtech Cayman, as the accounting acquirer; |
| | • | | all references to the financial statements apply to the historical financial statements of Comtech Cayman prior to the transaction; and |
| | • | | the number of our shares of common stock has been restated retroactively to reflect the share exchange ratio as at the date of the share exchange transaction. |
In order to exercise control over Shenzhen Comtech (a PRC operating company legally permitted to engage in a commodity trading business), without direct shareholding by us (a U.S.-listed company and therefore a foreign-invested entity), Honghui Li, our vice president, and Huimo Chen, the mother of our principal shareholder and chief executive officer, Jeffrey Kang, hold 99% and 1%, respectively, of the equity interests of Shenzhen Comtech, and through contractual agreements with us hold such equity interests exclusively for the benefit of our 100% directly owned subsidiary, Comtech China. Shenzhen Comtech, in turn owns a 60% equity interest in another of our PRC operating companies, Shanghai E&T, with the other 40% being held by Comtech China (BVI) through trust agreements. Under the trust agreements, Shenzhen Comtech owns a 35% equity interest in Shanghai E&T for the benefit of Comtech China (BVI) and Honghui Li owns a 5% equity interest in Shanghai E&T for the benefit of Comtech China (BVI). While we do not have any equity interest in Shenzhen Comtech, through these contractual agreements, we enjoy voting control and are entitled to the economic interests associated with their equity interest in Shenzhen Comtech. For additional details regarding these contractual agreements, see “Item 13. Certain Relationships and Related Transactions, and Director Independence.”
Critical Accounting Policies and Estimates
The preparation of our consolidated financial statements requires us to make estimates and judgments that affect the reported amounts of our assets, liabilities, revenue and expenses. These estimates are based on our historical experience and on various other assumptions that we believe to be reasonable. Estimates are evaluated on an ongoing basis, but actual results may differ from these estimates.
29
Critical accounting policies are those that, in management’s view, are most important in the portrayal of our financial condition and results of operations. Those that require significant judgments and estimates include:
Acquisition. As of December 31, 2006, our intangible assets primarily consist of proprietary technology and customer relationships that were acquired in connection with our acquisition of the remaining 40% equity interest in Shanghai E&T that were not already owned by the company, and the acquisition of the 100% equity interest in Viewtran. Both acquisitions were made during 2006. We allocate the cost of an acquired entity to the assets acquired and the liabilities assumed based on their estimated fair value on the date of acquisition. This process is commonly referred to as the purchase price allocation. As part of the purchase price allocation, we are required to determine the fair value of any identifiable intangible assets acquired. The determination of the fair value of the intangible assets acquired involves certain judgments and estimates. These judgments can include, but are not limited to, the cash flows that an asset is expected to generate in the future. A change in the amount allocated to identifiable intangible assets would have an offsetting effect on the amount of goodwill recognized from the acquisition and would change the amount of amortization expense recognized related to those identifiable intangible assets.
The fair values of our identifiable intangible assets were determined by independent appraisers using mainly the income approach. Future cash flows are predominately based on the historical pricing and expense levels, taking into consideration the relevant market size and growth factors and expected industry. The resulting cash flows are then discounted at a rate approximating our weighted average cost of capital.
Allowance for Doubtful Accounts. We establish an allowance for doubtful accounts primarily based upon the age of receivables and factors surrounding the credit risk of specific customers. We generally do not require collateral or other security from our customers. As of December 31, 2006, our accounts receivable balance was RMB278.6 million ($35.7 million), net of an RMB15.4 million ($2.0 million) allowance for doubtful accounts. As our business grows, we expect our accounts receivable balance to increase, as could our allowance for doubtful accounts. If the financial condition of our customers deteriorates, our uncollectible account receivables could exceed our current or future allowances.
Stock-based Compensation. Prior to 2006, we applied the intrinsic value method as allowed in SFAS No. 123, Accounting for Stock Based Compensation (“SFAS No. 123”), and related interpretations, in accounting for stock options. Under the intrinsic value method, compensation cost for stock options is measured as the excess, if any, of the quoted market price of our common stock at the date of the grant over the amount an employee must pay to acquire the stock. Compensation cost is recognized on a straight line basis over the requisite service period, which is generally the same as the vesting period.
Effective January 1, 2006, we adopted SFAS No. 123R, Share-Based Payment (“SFAS No. 123R”). SFAS No. 123R replaces SFAS No. 123. SFAS No. 123R requires that all stock-based compensation be recognized as an expense in the consolidated financial statements and that such cost be measured at the fair value of the award and requires compensation cost to reflect estimated forfeitures. SFAS No. 123R was adopted using the modified prospective method of application. Under this method, we recorded stock-based compensation expense for awards granted prior to, but not yet vested as of January 1, 2006 and for stock-based awards granted after January 1, 2006. Compensation cost is recognized on a straight line basis over the requisite service period, which is generally the same as the vesting period.
We currently use authorized and unissued shares to satisfy share award exercises.
The adoption of SFAS No. 123R effective January 1, 2006, resulted in recognition of an incremental stock-based compensation expense of RMB20.0 million ($2.6 million) for the year ended December 31, 2006.
Allowance for Obsolete Inventories. We established inventory allowance for estimated obsolescence or unmarketable inventory in an amount equal to the difference between the cost of inventory and its estimated realizable value based upon assumptions about future demand and market conditions. Management records a write-down against inventory based on several factors, including expected sales price of the item and the length of time the item has been in inventory. If actual demand and market conditions are less favorable than those projected by management, additional inventory allowance could be required. In that event, our gross margin would be reduced.
30
Results of Operations
Year ended December 31, 2006 compared to year ended December 31, 2005
Net Sales.Total net sales increased RMB457.2 million ($58.6 million), or 52.8% in 2006 when compared to 2005. The increase was mainly due to an increase in product revenue by approximately RMB402.9 million ($51.6 million) and the new services revenue by RMB54.4 million ($7.0 million).
Product Revenue
Details of product revenue by product type for the years ended December 31, 2006 and 2005 were as follows:
| | | | | | | | | | | | | | | | |
| | | Years ended December 31, | |
| | | 2006 | | 2006 | | | 2005 | | 2005 | | | % change | |
| | | Amount | | % of Net
Sales | | | Amount | | % of Net
Sales | | |
| | | (in millions, except for percentages) | |
Mobile handset | | $ | 67.3 | | RMB525.4 | | 39.7 | % | | RMB446.4 | | 51.5 | % | | 17.7 | % |
Telecommunications equipment | | | 58.3 | | 455.2 | | 34.4 | | | 326.7 | | 37.7 | | | 39.3 | |
Digital media and other (1) | | | 37.0 | | 288.6 | | 21.8 | | | 93.2 | | 10.8 | | | 209.7 | |
| | | | | | | | | | | | | | | | |
Total product revenue | | $ | 162.6 | | RMB1,269.2 | | 95.9 | % | | RMB866.3 | | 100. | % | | 46.5 | % |
| | | | | | | | | | | | | | | | |
| (1) | Other includes sales of lightning protection devices for wireless base stations and storage technology solutions. |
Product revenue for the year ended 2006 was RMB1,269.2 million ($162.6 million), or RMB402.9 million or 46.5% higher than the year ended 2005. Mobile handset related sales increased by RMB79.0 million ($10.1 million), or 17.7%, telecom equipment related sales increased by RMB128.5 million ($16.5 million), or 39.3%, and digital media and other sales increased by RMB195.4 million ($25.0 million), or 209.7%. The increase in product revenue was mainly attributable to stable growth in sales volume, which resulted from an increase in our customer base and an increase in our product types for all markets. The wider variety of product solutions and newly introduced business lines in digital media markets, such as home entertainment products also contributed to the increase. The contribution to total net sales by digital media and other sales in 2006 significantly increased to RMB288.6 million ($37.0 million), or 21.8% of total net sales, from RMB93.2 million, or 10.8% of total net sales, in 2005. Though we had an increase in revenue amounts for both mobile handset and telecom equipment related sales, their contribution to total net sales decreased from 51.5% and 37.7% in 2005 to 39.7% and 34.4% in 2006, respectively, due to significant growth in our digital media business.
Services Revenue. Services revenue for the years ended December 31, 2006 and 2005 were as follows:
| | | | | | | | | | | | |
| | | Years ended December 31, |
| | | 2006 | | 2006 | | | 2005 | | 2005 |
| | | Amount | | % of Net
Sales | | | Amount | | % of Net
Sales |
| | | (in millions) | | | | | (in millions) | | |
Services revenue | | $ | 7.0 | | RMB54.4 | | 4.1 | % | | — | | — |
Services revenue was derived from the provision of technology and engineering services, network system integration and related training and maintenance services commencing from January 2006. Huawei has accounted for substantially all of our services revenue.
Gross Profit. Gross profit was RMB246.7 million ($31.6 million) in 2006, an increase of RMB95.2 million ($12.2 million), or 62.8% when compared to RMB151.5 million ($19.4 million) in 2005. The increase in both gross profit and percentage is primarily attributable to a change in product mix. Digital media module related sales have generally higher margins than the other two market sales. The higher margin for services revenue also contributed to the increase.
In 2006 and 2005, we recorded a provision for inventory of RMB7.4 million ($0.9 million) and RMB3.9 million, respectively.
31
Selling, General and Administrative Expenses. Selling, general and administrative and R&D expenses were RMB118.1 million ($15.1 million) in the year ended 2006, or [115.5]% higher than those of the same period the prior year. The expenses for the years ended December 31, 2006 and 2005 were as follows:
| | | | | | | | | | | | | |
| | | Years ended December 31, | |
| | | 2006 | | 2006 | | | 2005 | | 2005 | |
| | | Amount | | Amount | | % of Net
Sales | | | Amount | | % of Net
Sales | |
| | | (in millions, except for percentages) | |
Selling expenses | | $ | 5.3 | | RMB41.3 | | 3.1 | % | | RMB15.8 | | 1.8 | % |
General and administrative expenses | | | 6.2 | | 48.8 | | 3.7 | | | 23.2 | | 2.7 | |
R&D expenses | | | 3.6 | | 28.0 | | 2.1 | | | 15.8 | | 1.8 | |
| | | | | | | | | | | | | |
Total | | $ | 15.1 | | RMB118.1 | | 8.9 | % | | RMB54.8 | | 6.3 | % |
| | | | | | | | | | | | | |
The increase in selling expenses in 2006 of RMB25.5 million ($3.3 million), or 161.4%, was mainly attributable to an increase in our bad debt provision of RMB7.9 million made for 2006, and increases in our marketing and shipping expenses. In addition, business trip and salesperson expenses increased by RMB9.3 million, in line with increased sales volumes. An increase in sales staff costs also contributed to the increase of RMB2.9 million and RMB1.8 million, respectively. Other indirect selling expenses such as freight charges and additional costs in opening new sales representative offices contributed to the balance of the increase.
The increase in general and administrative expenses of RMB25.6 million ($3.3 million), or 110.3% was primarily attributable to corporate compliance expenses related to being a public company in the U.S., as well as additional salaries and other costs associated with our new employees of RMB3.3 million. The balance of the increase was contributed by increase in office access and other general administrative expense.
R&D Expenses. R&D expenses increased in 2006 by RMB12.1 million ($1.6 million), or 77.2%, as compared to 2005. The increase was primarily attributable to the significant increase in R&D personnel and engineers, in which the related staff cost was increased by approximately RMB4.7 million. The remaining increase resulted from additional research expenditures spent for potential new markets, such as digital media solutions.
Gain on Disposal of a Subsidiary. In August 2006, we disposed of our wholly-owned subsidiary, United Information Technology Company Limited and its wholly-owned subsidiary United Information Technology (Shenzhen) Company Limited, or UIT to an independent third party for consideration of RMB29,884 ($3,829). The disposal resulted in a gain of RMB6.7 million ($0.9 million).
Interest Expense.Interest expense increased in 2006 by RMB1.1 million ($0.1 million) or 61.1%, as compared to 2005. The increase was due to more bills receivable discounted to banks in 2006 than in 2005. The discounts in respect of the bills receivable sold of RMB0.8 million ($0.1 million) were included in interest expense. In addition, increase in interest rate also contributed to the increase in the expense. The average interest rate during the year ended December 31, 2006 was 6.4% per annum as compared to 4.9% during 2005.
Interest Income. Interest income in 2006 amounted to RMB7.4 million ($0.9 million), compared to RMB2.5 million in 2005. The increase was principally attributable to higher net cash inflows generated from revenue resulting from higher average deposit balances.
Income Tax. The effective tax rate for 2006 was 7.9% compared to 6.9% for 2005. The increase in the effective tax rate was primarily due to subsidiaries with higher tax rates representing a greater percentage of our revenues in 2006.
Net Income; Earnings Per Share. As a result of the above items, net income for 2006 was RMB123.3 million ($15.8 million), compared to net income of RMB86.8 million in 2005. We reported basic per share earnings of RMB3.83 ($0.49) for 2006, based on 32,200,044 outstanding weighted average shares, and a diluted per share earnings of RMB3.64 ($0.47), based on 33,829,519 outstanding weighted average shares, compared to basic per share earnings of RMB3.08 for 2005, based on 28,168,274 outstanding weighted average shares, and a diluted per share earnings of RMB2.94, based on 29,507,939 outstanding weighted average shares.
32
Year ended December 31, 2005 compared to year ended December 31, 2004
Net Sales. Details of net sales for the years ended December 31, 2005 and 2004 are as follows:
| | | | | | | | | | | | | | | | |
| | | Years ended December 31, | |
| | | 2005 | | 2005 | | | 2004 | | 2004 | | | % change | |
| | | Amount | | % of Net
Sales | | | Amount | | % of Net
Sales | | |
| | | (in millions, except for percentages) | |
Mobile handset | | $ | 55.3 | | RMB446.4 | | 51.5 | % | | RMB368.1 | | 58.8 | % | | 21.3 | % |
Telecom equipment | | | 40.5 | | 326.7 | | 37.7 | | | 249.3 | | 39.9 | | | 31.0 | |
Digital media and Other (1) | | | 11.5 | | 93.2 | | 10.8 | | | 8.3 | | 1.3 | | | 1,022.9 | |
| | | | | | | | | | | | | | | | |
Total net sales | | $ | 107.3 | | RMB866.3 | | 100 | % | | RMB625.7 | | 100 | % | | 38.5 | % |
| | | | | | | | | | | | | | | | |
| (1) | Other includes sales of lightning protection devices for wireless base stations and storage technology solutions. |
Net sales for the year ended December 31, 2005 was RMB866.3 million ($107.3), or RMB240.6 million or 38.5% higher than for the year ended December 31, 2004. Mobile handset related sales increased by RMB78.3 million ($9.7 million), or 21.3%, telecom equipment related sales increased by RMB77.4 million ($9.6 million), or 31.0%, and digital media and other sales increased by RMB84.9 million ($10.5 million), or 1,022.9%. The increase was mainly attributed to growth in sales volume of the domestic mobile handset, telecom equipment and digital consumer electronic products. More variety of product solutions and newly introduced business lines, such as Broadcom and digital TV products also contributed to the increase. The contribution to total net sales by digital media and other sales in 2005 significantly increased to RMB93.2 million ($11.5 million), or 10.8% of total net sales, from RMB8.3 million, or 1.3% of total net sales, in 2004. Though we had an increase in revenue amounts for both mobile handset and telecom equipment related sales, their contribution to total net sales decreased from 58.8% and 39.9% in 2004 to 51.5% and 37.7% in 2005 respectively.
Gross Profit. Gross profit increased from RMB94.9 million or 15.2% in the year ended 2004 to RMB151.5 million ($18.8 million) or 17.5% in 2005. The increase was principally due to an increase in consumer electronic module sales which have a higher margin than mobile handset or telecom equipment. In addition, decrease in marginal cost of goods sold, which resulted from bulk purchases, also contributed to the improvement in gross margin.
Selling, General and Administrative and R&D Expenses. Selling, general and administrative and R&D expenses were RMB54.8 million ($6.8 million) in the year ended December 31, 2005, or 101.5% higher than those of the same period the prior year. The expenses for the years ended December 31, 2005 and 2004 were as follows:
| | | | | | | | | | | | | |
| | | Years ended December 31, | |
| | | 2005 | | 2005 | | | 2004 | | 2004 | |
| | | Amount | | Amount | | % of Net
Sales | | | Amount | | % of Net
Sales | |
| | | (in millions, except for percentages) | |
Selling expenses | | $ | 2.0 | | RMB15.8 | | 1.8 | % | | RMB7.6 | | 1.2 | % |
General and administrative expenses | | | 2.8 | | 23.2 | | 2.7 | | | 13.5 | | 2.2 | |
R&D expenses | | | 2.0 | | 15.8 | | 1.8 | | | 6.1 | | 1.0 | |
| | | | | | | | | | | | | |
Total | | $ | 6.8 | | RMB54.8 | | 6.3 | % | | RMB27.2 | | 4.4 | % |
| | | | | | | | | | | | | |
The increase in selling expenses in 2005 as compared to 2004 of RMB8.2 million ($1.0 million), or 107.9%, was mainly attributable to an additional bad debt provision of RMB3.7 million made for 2005. In addition, an increase in sales staff costs and an increase in cost on product logistics contributed to the increase of RMB1.4 million and RMB1.8 million respectively. Other indirect selling expenses such as freight charges and salesperson expenses and additional costs in opening new sales representative offices contributed to the balance of the increase.
The increase in general and administrative expenses of RMB9.7 million ($1.2 million), or 71.9% was primarily attributable to corporate expenses related to being a public company in the U.S. following our share exchange in July 2004, as well as costs associated with our additional employees.
33
R&D expenses increased in 2005 by RMB9.7 million ($1.2 million), or 159.0%, as compared to 2004. The increase was primarily attributable to the significant increase in R&D personnel and engineers, in which the related staff cost was increased by RMB7.2 million. The remaining RMB2.5 million was resulted from additional research expenditure for potential new consumer electronics markets, such as digital TV, IPTV and storage technology solutions.
Interest Expense. Interest expense in 2005 amounted to RMB1.8 million ($0.2 million), compared to RMB2.2 million in 2004. The average interest rate during the year ended December 31, 2005 was 4.9% per annum as compared to 4.0% during 2004. The increase resulted from the gradual increase in the bank borrowing interest rate.
Interest Income.Interest income in 2005 amounted to RMB2.5 million ($0.3 million), compared to RMB0.04 million in 2004. The increase was principally attributed to the proceeds of approximately $30 million received in the public offering on July 20, 2005. Higher net cash inflows generated from revenue resulting from higher average deposit balances also contributed to the increase.
Income Tax. The effective tax rate for 2005 was 6.9% compared to 3.5% for 2004. The increase in the effective tax rate was primarily due to the expiration of the preferential tax period for two of our PRC subsidiaries, Shenzhen Comtech and Comtech Communication.
Net Income; Earnings Per Share. As a result of the above items, net income for 2005 was RMB86.8 million ($10.8 million), compared to net income of RMB62.2 million in 2004. We reported basic per share earnings of RMB3.08 ($0.38) for 2005, based on 28,168,274 outstanding weighted average shares, and a diluted per share earnings of RMB2.94 ($0.36), based on 29,507,939 outstanding weighted average shares, compared to basic per share earnings of RMB2.87 for 2004, based on 21,690,560 outstanding weighted average shares, and a diluted per share earnings of RMB2.84, based on 21,885,053 outstanding weighted average shares.
Quarterly Results of Operations
The following table presents our supplemental selected unaudited quarterly results of operations for the eight quarters prior to and including the quarter ended December 31, 2006. You should read the following table in conjunction with our audited consolidated financial statements and related notes contained elsewhere in this Form 10K. In our management’s opinion, we have prepared our unaudited quarterly results of operations on substantially the same basis as our audited consolidated financial statements. Due to the evolving nature of our business and other factors affecting our business as described under “Item 1A. Risk factors”, our results of operations for any quarter are not necessarily indicative of results that may be expected for any future periods.
| | | | | | | | | | | | | | | | |
| | | For the three months ended, |
| | | Dec 31,
2006 | | Sept. 30,
2006 | | June. 30,
2006 | | Mar. 31,
2006 | | Dec. 31,
2005 | | Sept. 30
2005 | | June 30,
2005 | | Mar. 31,
2005 |
| | | (in millions of RMB, except per share data) |
Net sales | | 378.2 | | 341.2 | | 332.5 | | 271.7 | | 271.3 | | 215.2 | | 207.8 | | 172.0 |
Gross profit | | 69.2 | | 64.0 | | 61.5 | | 52.0 | | 50.3 | | 38.2 | | 36.7 | | 26.3 |
Net income | | 35.7 | | 32.6 | | 28.8 | | 26.2 | | 28.3 | | 21.5 | | 21.2 | | 15.8 |
Earnings per share | | | | | | | | | | | | | | | | |
Basic | | 1.09 | | 1.01 | | 0.90 | | 0.83 | | 0.90 | | 0.71 | | 0.83 | | 0.62 |
Diluted | | 1.04 | | 0.97 | | 0.85 | | 0.79 | | 0.86 | | 0.69 | | 0.79 | | 0.59 |
Our quarterly net sales over the past two years have experienced continued sequential growth.
The overall increase in our net sales over the past two years was consistent with (1) growing demand for all product solutions in China’s domestic market as China’s telecom operators continued to expand and upgrade their infrastructure, and (2) by a recent increase in our engineering services revenue via acquisitions.
We believe that the general increase in gross profit from quarter to quarter was primarily attributable to a change in our product mix. Specifically, services revenues, and mobile handset and digital media related sales, which have higher profit margins than our mobile handset and telecom equipment related sales, have increasingly constituted a greater portion of our total net sales over the past two years.
34
Recently Issued Accounting Pronouncements
In December 2004, the Financial Accounting Standards Board issued SFAS No. 123R, “Share-Based Payment”. This statement is a revision to SFAS No. 123 and supersedes APB Opinion No. 25. This statement establishes standards for the accounting for transactions in which an entity exchanges its equity instruments for goods or services, primarily focusing on the accounting for transactions in which an entity obtains employee services in share-based payment transactions. Entities will be required to measure the cost of employee services received in exchange for an award of equity instruments based on the grant-date fair value of the award, with limited exceptions. That cost will be recognized over the period during which an employee is required to provide service, the requisite service period (usually the vesting period), in exchange for the award. The grant-date fair value of employee share options and similar instruments will be estimated using option-pricing models. If an equity award is modified after the grant date, the incremental compensation cost will be recognized in an amount equal to the excess of the fair value of the modified award over the fair value of the original award immediately before the modification. This statement is effective as of the beginning of the annual reporting period that begins after June 15, 2005. We adopted this statement with effect from January 1, 2006 under the modified prospective method of application. Under that method, we recognize compensation costs for new grants of share-based awards, awards modified after the effect date, and the remaining portion of the fair value of the unvested awards at the adoption date.
In May 2005, the FASB issued SFAS No. 154, “Accounting Changes and Error Corrections” (“SFAS 154”) which replaces Accounting Principles Board Opinions No. 20, “Accounting Changes” and SFAS No. 3, “Reporting Accounting Changes in Interim Financial Statements—An Amendment of APB Opinion No. 28.” SFAS 154 provides guidance on the accounting for and reporting of accounting changes and error corrections. It establishes retrospective application, or the latest practicable date, as the required method for reporting a change in accounting principle and the reporting of a correction of an error. SFAS 154 is effective for accounting changes and corrections of errors made in fiscal years beginning after December 15, 2005. We do not anticipate the adoption of this statement will have a material effect on the our financial position or results of operations.
In September 2005, the FASB Emerging Issues Task Force (“EITF”) issued EITF Issue No. 04-13,Accounting for Purchases and Sales of Inventory with the Same Counterparty. EITF 04-13 provides guidance as to when purchases and sales of inventory with the same counterparty should be accounted for as a single exchange transaction. EITF 04-13 also provides guidance as to when a nonmonetary exchange of inventory should be accounted for at fair value. EITF 04-13 will be applied to new arrangements entered into, and modification or renewals of existing arrangements occurring after January 1, 2007. We do not expect the adoption of EITF 04-13 will have a significant effect on our consolidated financial statements.
In June 2006, the FASB issued Interpretation No. 48,Accounting for Uncertainty in Income Taxes (“FIN 48”). FIN 48 clarifies the accounting for uncertainty in income taxes recognized in the Company’s financial statements in accordance with SFAS No. 109. FIN 48 prescribes a recognition threshold and measurement attributes for the financial statement recognition and measurement of a tax position taken or expected to be taken in a tax return. The provisions of FIN 48 are effective for the fiscal years beginning after December 15, 2006. We do not expect that the adoption of FIN 48 will have a significant effect on our consolidated financial statements.
In September 2006, the FASB issued SFAS No. 157,Fair Value Measurements(“SFAS No. 157”),which defines fair value, provides a framework for measuring fair value, and expands the disclosures required for fair value measurements. SFAS No. 157 applies to other accounting pronouncements that require fair value measurements and does not require any new fair value measurements. SFAS No. 157 is effective for fiscal years beginning after November 15, 2007 and is required to be adopted by us in fiscal year 2008. Although we will continue to evaluate the application of SFAS No. 157, we do not currently believe the adoption of SFAS No. 157 will have a material impact on our consolidated financial statements.
In February 2007, the FASB issued Statement No. 159,The Fair Value Option for Financial Assets and Financial Liabilities — Including an amendment of FASB Statement No. 115 (“SFAS No 159). SFAS No. 159 permits an entity to elect fair value as the initial and subsequent measurement attribute for many financial assets and liabilities. Entities electing the fair value option would be required to recognize changes in fair value in earnings. Entities electing the fair value option are required to distinguish, on the face of the statement of financial position, the fair value of assets and liabilities for which the fair value option has been elected and similar assets and liabilities measured using another measurement attribute. We are required to adopt SFAS No
35
159 beginning on January 1, 2008. The adjustment to reflect the difference between the fair value and the carrying amount would be accounted for as a cumulative-effect adjustment to retained earnings as of the date of initial adoption. Although we will continue to evaluate the provisions of SFAS No. 159, management currently does not believe the adoption of SFAS No. 159 will have a material impact on our consolidated financial statements.
Liquidity and Capital Resources
Cash Flows and Working capital
Our accounts payable cycle typically averages approximately one month, whereas our receivables cycle typically averages approximately three months. Accordingly, additional working capital, being current assets less current liabilities, is needed to fund this time difference.
As at December 31, 2006, we had no material commitments for capital expenditures.
As of December 31, 2006, we had approximately RMB375.1 million ($48.1 million) in cash. We regularly review our cash funding requirements and attempt to meet those requirements through a combination of cash on hand, cash provided by operations, available borrowings under bank lines of credit and factoring facilities and possible future public or private equity offerings. At times, we may evaluate possible acquisitions of, or investments in, businesses that are complementary to ours, which may require the use of cash. We believe that our cash, increased operating cash flows, credit arrangements, and access to equity and debt capital markets, taken together, provide adequate resources to fund our ongoing operating expenditures for the next 12 months. In the event that they do not, we may require additional funds in the future to support our working capital requirements or for other purposes and may seek to raise such additional funds through the sale of public or private equity, as well as from other sources.
As of December 31, 2006, we had working capital of RMB585.6 million ($75.0 million), including RMB375.1 million ($48.1 million) in cash, as compared with working capital of RMB507.3 million at December 31, 2005, including RMB177.1 million in cash.
Operating activities generated cash of RMB202.8 million ($26.0 million) for the year ended December 31, 2006 compared to cash used of RMB35.1 million in the year ended December 2005. The increase in cash generated from operating activities as compared to the prior year is primarily due to the collection of accounts and receivables on a more timely basis, which was primarily due to the sale of receivables and the increase in trade payables. The incremental amount discounted as of 2006 was RMB80 million compared to 2005. The decrease in inventories of RMB26.9 million as at December 31, 2006 resulting from better inventory control also contributed to the generation of operating cash.
Operating activities used cash of RMB35.1 million ($4.3 million) for the year ended December 31, 2005 compared to cash used of RMB60.3 million in the year ended December 2004. The decrease in cash used in operating activities as compared to the prior year is primarily due to [the collection of accounts and receivables on a more timely basis], [discounting of receivables] and the increase in trade payables. The increase in payables was partly off-set by an increase in inventories of RMB94.9 million ($11.8 million). The increase in inventories as at December 31, 2005 resulted from an increase in demand for our products, and a change in product mix.
Investing activities used RMB9.0 million ($1.1 million) during 2006, mainly for new bank deposits of RMB16.1 million ($2.1 million) to pledge additional credit facilities of RMB46.8 million ($6.0 million) with banks. The remaining investing activities were the purchases of fixed assets of RMB7.5 million and acquisition of subsidiaries net of cash acquired of RMB12.7 million. The use of cash for investing activities was partly compensated by sale of subsidiary net of cash disposed of RMB 27.7 million. Investing activities used RMB46.2 million ($5.7 million) during 2005, mainly for bank deposits of RMB40.7 million ($5.0 million) to pledge credit facilities of RMB113.0 million ($14.0 million) with two banks. The remaining investing activities were the purchases of fixed assets.
Financing activities provided net cash of RMB11.9 million ($1.5 million) during 2006. Cash was provided by net proceeds from exercise of stock options and warrants, net of the repurchase of treasury stock, of RMB24.0 million. The cash inflow was reduced by repayment of bank borrowings of RMB6.3 million and a dividend paid to minority shareholders of RMB9.1 million.
36
Financing activities used net cash of RMB217.3 million ($26.9 million) during 2005. Cash was provided by the net proceeds of RMB234.7 million ($29.1 million) from the public offering of 5,912,160 shares of our common stock on July 20, 2005. The cash inflow was compensated by repayment of certain bank borrowings of RMB17.4 million ($2.2 million).
Distributions by our PRC operating companies to us may be subject to governmental approval and taxation. Any transfer of funds from us to our PRC operating companies, either as a shareholder loan or as an increase in registered capital, is subject to registration or approval with or by PRC governmental authorities, including the relevant administration of foreign exchange and/or other relevant examining and approval authorities. These limitations on the free flow of funds between us and our PRC operating companies may restrict our ability to act in response to changing market conditions. To date, none of our PRC operating companies, including Shenzhen Comtech and Shanghai E&T, have declared or paid dividends to us, and historically, we have not relied on such distributions for our liquidity needs. In addition, we have not declared dividends since the share exchange transaction. Our holding companies have no business operations and therefore the related expenses are relatively low, consisting mainly of legal, accounting and other fees and expenses associated with being a holding company or, in the case of Comtech Group, Inc., a public company. Three of our major operating companies, Comtech Hong Kong and Comtech Broadband, both Hong Kong incorporated companies, and Comtech Communication and Comtech Software, both wholly owned foreign enterprises, are legally permitted to declare and pay dividends, enabling them to provide any funds necessary to meet the holding companies’ limited operating expenses, although in the case of a wholly owned foreign enterprise, such dividends would be subject to the conditions described in “Risk Factors—PRC laws and our corporate structure may restrict our ability to receive dividend payments from, and transfer funds to, our PRC operating companies, which may negatively affect our results of operations and restrict our ability to act in response to changing market conditions.” We do not expect restrictions between us and our PRC operating companies to affect our liquidity and capital resources in the near future. For risks associated with the uncertainty in our receipt of the equivalent economic interest in connection with the equity interest in Shenzhen Comtech, see “Risk factors—PRC laws and our corporate structure may restrict our ability to receive dividends and payments from, and transfer funds to, our PRC operating companies, which may negatively affect our results of operations and restrict our ability to act in response to changing market conditions.”
Our PRC operating companies are required, where applicable, to allocate a portion of their net profit to certain funds before distributing dividends, including at least 10% of their net profit to certain reserve funds until the balance of such fund has reached 50% of their registered capital. These reserves can only be used for specific purposes, including making-up cumulative losses of previous years, conversion to equity capital, and application to business expansion, and are not distributable as dividends. Our PRC operating subsidiaries are required, where applicable, to allocate an additional 5% to 10% of their net profits to a statutory common welfare fund. These reserves can only be used for specific purposes and are not distributable as dividends. For risks associated with the uncertainty in our receipt of the equivalent economic interest in connection with the equity interest in Shenzhen Comtech or Shanghai E&T, see “Risk factors—PRC laws and our corporate structure may restrict our ability to receive dividends and payments from, and transfer funds to, our PRC operating companies, which may negatively affect our results of operations and restrict our ability to act in response to changing market conditions.”
Indebtedness
On October 7, 2005, Comtech Hong Kong entered into a RMB40.4 million ($5 million) U.S. dollar denominated credit facility with Standard Chartered Bank (Hong Kong) Limited, or SCB, and a RMB72.6 million ($9 million) U.S. dollar denominated facility with Bank of China, or BOC. In 2006, BOC increased the amount available under the facility to RMB 117.1 million ($15 million). Both of the SCB and BOC facilities are guaranteed by Comtech Group, Inc. Apart from income from operations, these revolving credit facilities serve as our principal source of liquidity to fund our working capital needs.
As of December 31, 2006, there was no outstanding loan balance under the SCB facility. This facility is secured by funds on deposit in an amount not less than $2 million, and bears interest from 1.5% per annum over HIBOR or U.S. prime, depending on different kinds of borrowings made. The SCB facility is repayable on demand and SCB may immediately terminate the facility without our consent or that of any third party.
37
As of December 31, 2006, the outstanding loan balance under the BOC facility was RMB30.3 million ($3.9 million), at an interest rate of approximately 7.3% per annum, leaving RMB88.4 million ($11.4 million) in availability. This facility is secured by funds on deposit in an amount not less than $5 million, and bears interest from LIBOR plus 1.75% to 2% per annum, depending on different kinds of borrowings made and is used to settle foreign exchange obligations to the extent needed. The facility is repayable on demand and BOC may increase, reduce and/or cancel the facility by notice to us. Based on a variable return on interest, the bank borrowings amounted to fair value.
Some of our customers enter into arrangements with their respective banks for purposes of settling their bills. Under such arrangements, we are entitled to collect the amounts owed directly from the customers’ banks when the invoice becomes due. In certain circumstances, we have arranged to transfer with recourse certain of our bills receivable to the bank. Under this discounting arrangement, the bank pays a discounted amount to us and collects the amounts owed from the customers’ banks. The discount typically ranges from 0.69% to 0.8% of the balance transferred, which is recorded as interest expense. For the year ended December 31, 2006, we had received proceeds from the sales of the bills receivable amounting to RMB106.9 million ($13.7 million), compared with RMB60.7 million ($7.8 million) for the previous year.
Contractual Obligations and Commercial Commitments
The following table sets forth our contractual payment obligations for operating leases and purchase obligations as of December 31, 2006:
| | | | | | | | | | |
| | | Payments due by Period |
Contractual Obligations | | Total | | Less than 1 year | | 1-3 Years | | 3-5 Years | | More Than 5 Years |
| | (in millions of RMB) |
Operating lease obligations | | 11.3 | | 6.0 | | 4.7 | | 0.6 | | — |
Purchase obligations | | 202.9 | | 202.9 | | — | | — | | — |
Bank borrowings | | 30.3 | | 30.3 | | — | | — | | — |
| | | | | | | | | | |
Total | | 244.5 | | 239.2 | | 4.7 | | 0.6 | | — |
Operating lease obligations consist primarily of operating lease agreements for our office facilities, including our head office and research center in Shenzhen. Our leases have remaining terms ranging from one to 40 months.
Purchase obligations consist of outstanding purchase orders for components from our suppliers. We do not have any minimum purchase obligations with these suppliers.
Off-Balance Sheet Arrangements
Apart from the discounting of receivables discussed under “—Indebtedness” and operating lease obligations discussed under “Contractual Obligations,” we have no outstanding off-balance sheet arrangements, derivative financial instruments, interest rate swap transactions or foreign currency forward contracts. We do not engage in trading activities involving non-exchange traded contracts.
ITEM 7A QUANTITATIVE AND QUALITATIVE DISCLOSURES ABOUT MARKET RISK
Foreign Exchange Risk
Our reporting currency is the Renminbi. Transactions in other currencies are recorded in Renminbi at the rates of exchange prevailing when the transactions occur. Monetary assets and liabilities denominated in other currencies are remeasured into Renminbi at rates of exchange in effect at the balance sheet dates. Exchange gains and losses are recorded in our statements of operations as a component of current period earnings.
The PRC State Administration for Foreign Exchange, under the authority of the People’s Bank of China, controls the conversion of Renminbi into foreign currencies. The principal regulation governing foreign currency exchange in China is the Foreign Currency Administration Rules (1996), as amended, or the “Rules”. Under the Rules, once various procedural requirements are met, Renminbi is convertible for current account transactions, including trade and service-related foreign exchange transactions and dividend payments, but not for capital account transactions, including direct investment, loans or investments in securities outside China, without prior approval of the State Administration of Foreign Exchange of the People’s Republic of China, or its local counterparts.
38
Since July 2005, the Renminbi has no longer been pegged to the U.S. dollar. Although currently the Renminbi exchange rate versus the U.S. dollar is restricted to a rise or fall of no more than 0.3% per day and the People’s Bank of China regularly intervenes in the foreign exchange market to prevent significant short-term fluctuations in the exchange rate, the Renminbi may appreciate or depreciate significantly in value against the U.S. dollar in the medium to long term. Moreover, it is possible that in the future, the PRC authorities may lift restrictions on fluctuations in the Renminbi exchange rate and lessen intervention in the foreign exchange market. As of December 31, 2006, the exchange rate of RMB to $1 was RMB7.8041.
We conduct substantially all of our operations through our PRC operating companies, and their financial performance and position are measured in terms of Renminbi. Our solutions are primarily procured, sold and delivered in the PRC for Renminbi. The majority of our net sales are denominated in Renminbi.
Any devaluation of the Renminbi against the U.S. dollar would consequently have an adverse effect on our financial performance and asset values when measured in terms of U.S. dollars. On the other hand, the appreciation of the Renminbi could make our customers’ products more expensive to purchase because many of our customers are involved in the export of goods, which may have an adverse impact on their sales. A decrease in sales by our customers could have an adverse effect on our operating results. In addition, from time to time we may have U.S. dollar denominated borrowings, and therefore a decoupling of the Renminbi many affect our financial performance in the future.
We recognized a foreign currency translation adjustment of approximately RMB10.0 million ($1.3 million) for the year ended December 31, 2006. We do not currently engage in hedging activities, as such, we may in the future experience economic loss as a result of any foreign currency exchange rate fluctuations.
Interest Rate Risk
We are exposed to interest rate risk arising from short-term variable rate borrowings from time to time. Our future interest expense will fluctuate in line with any change in our borrowing rates. We do not have any derivative financial instruments and believe our exposure to interest rate risk and other relevant market risks is not material. Our bank borrowings amounted to RMB30.3 million ($3.9 million) as of December 31, 2006. Based on the variable nature of the underlying interest rate, the bank borrowings approximated fair value at that date.
If there was a hypothetical 1% change in interest rates, the net impact to earnings and cash flows would be approximately RMB0.3 million ($0.04 million). The potential change in cash flows and earnings is calculated based on the change in the net interest expense over a one year period due to an immediate 1% change in rates.
Inflation
In recent years, China has not experienced significant inflation, and thus inflation has not had a material impact on our results of operations. According to the National Bureau of Statistics of China, the change in Consumer Price Index in China was 3.9%, 1.8% and 1.5% in 2004, 2005 and 2006, respectively.
ITEM 8. FINANCIAL STATEMENTS AND SUPPLEMENTARY DATA
The following financial statements and the footnotes thereto are included in the section beginning on page F-1.
| | 1. | Reports of Independent Registered Public Accounting Firm. |
| | 2. | Consolidated Balance Sheets as of December 31, 2006 and 2005. |
| | 3. | Consolidated Statements of Operations for the years ended December 31, 2006, 2005 and 2004. |
39
| | 4. | Consolidated Statements of Shareholders’ Equity and other comprehensive income for the years ended December 31, 2006, 2005 and 2004. |
| | 5. | Consolidated Statements of Cash Flows for the years ended December 31, 2006, 2005 and 2004. |
| | 6. | Notes to Consolidated Financial Statements. |
The Management’s Report on Internal Control over Financial Reporting, Report of Independent Registered Public Accounting Firm, Consolidated Financial Statements, Notes to Consolidated Financial Statements and Financial Statements Schedules which are listed in the Index to Financial Statements and which appear beginning on page F-2 of this report are incorporated into this Item 8. Quarterly Results of Operations information is included elsewhere in this report and is incorporated into this Item 8.
ITEM 9. CHANGES IN AND DISAGREEMENTS WITH ACCOUNTANTS ON ACCOUNTING AND FINANCIAL DISCLOSURE
In April 2006, we dismissed Deloitte Touche Tohmatsu, which served as our independent public accountants for the 2005 fiscal year, and engaged KPMG as our independent public accountants for the 2006 financial year. This change in independent public accountants was previously reported by us in Current Reports on Form 8-K field with the Securities and Exchange Commission dated April 13, 2006 and April 21, 2006.
ITEM 9A. CONTROLS AND PROCEDURES
| | (a) | Disclosure Controls and Procedures |
We maintain controls and procedures designed to ensure that we are able to collect the information we are required to disclose in the reports we file with the SEC and to record, process, summarize, and disclose this information within the time periods specified in the rules of the SEC. Based on an evaluation of our disclosure controls and procedures as of the end of the period covered by this report conducted by our management, our chief executive and chief financial officers have concluded these controls and procedures are effective to ensure we are able to record, collect, process, and disclose the information we are required to disclose in the reports we file with the SEC within the required time periods.
| | (b) | Management’s Report on Internal Control over Financial Reporting |
Our management’s annual report on internal control over financial reporting and the related report of our independent registered public accounting firm are included in this report on pages F-2 and F-3, respectively.
40
ITEM 9B. OTHER INFORMATION
None.
41
PART III
ITEM 10. DIRECTORS, EXECUTIVE OFFICERS AND CORPORATE GOVERNANCE
Directors and Executive Officers
The following table sets forth information about our directors and executive officers as of December 31, 2006.
| | | | |
Name | | Age | | Position |
| Jeffrey Kang | | 37 | | Chief Executive Officer, President and Chairman of the Board |
| Hope Ni | | 34 | | Chief Financial Officer, Secretary and Director |
| Amy Kong (1)(2)(3) | | 52 | | Director |
| Q.Y. Ma (1)(2)(3) | | 50 | | Director |
| Frank Zheng (1)(2)(3) | | 40 | | Director |
| (1) | Member of Audit Committee |
| (2) | Member of Nominating and Governance Committee |
| (3) | Member of Compensation Committee |
Jeffrey Kang, Chairman of the Board, Chief Executive Officer and President. Mr. Kang was a co-founder of Comtech and has served as our chief executive officer and chairman of the board since September 1999. Mr. Kang founded Shenzhen Matsunichi Electronics Co., Ltd. and Matsunichi Electronic (Hong Kong) Limited, predecessor of the Company, in 1995, when Matsunichi commenced operations as a distributor for Matsushita. In 1999, Mr. Kang transferred all operations and assets of Matsunichi into the Company’s immediate predecessor. Prior to forming Matsunichi, Mr. Kang worked for Matsushita Electronics from June 1992 to July 1995 where he was responsible for selling components to the telecom industry within China. From 1998 to 1999, Mr. Kang was vice president of Shenzhen SME (Small and Medium Enterprises) Association, a non-profit association in Shenzhen. Mr. Kang earned B.S. degree in Electrical Engineering from South China Technology University in Guangzhou, China.
Hope Ni, Chief Financial Officer, Secretary and Director. Ms. Ni has served as our chief financial officer and secretary to our board since August 2004, and as our director since January 2005. Prior to joining us, Ms. Ni spent six years as a practicing attorney at Skadden, Arps, Slate, Meagher & Flom LLP in New York and Hong Kong, specializing in corporate finance. Prior to that, Ms. Ni worked at Merrill Lynch, investment banking division in New York. Currently, Ms. Ni is a member of the investment committee of Time Innovation Ventures, a venture capital firm focused on funding technology start-ups and joint ventures in China. Ms. Ni also serves on the board of Qianjia Consulting Company, which she founded in 2002 and serves on the board of KongZhong Corporation, a Cayman Islands corporation traded in the Nasdaq Global Market. Ms. Ni received her J.D. degree from University of Pennsylvania Law School and her B.S. degree in Applied Economics and Business Management from Cornell University.
Amy Kong, Director. Ms. Kong has been a director since July 2004. Ms. Kong founded Primustech Ventures (HK) Limited, a private equity investment firm focused on Greater China, and has been its chief executive officer since 2000. Ms. Kong invested in a number of private equity projects in the areas of document management, professional training and education, medical waste management, medical devices, consumer electronics and information technology consulting. From 1999 to 2000, Ms. Kong served as interim chief executive officer of Cyber City International, a Shenzhen, China based company. In 1996, Ms. Kong founded GTF Asset Management for the Gajah Tunggal Group, an $800 million global asset management company. Ms. Kong received a B.A. degree from Princeton University and an M.B.A. degree from New York University.
Q.Y. Ma, Director. Dr. Ma has been a director since December 2004. Dr. Ma has been the managing director of Time Innovation Ventures, a venture capital firm, since 2000, and served as a professor at the University of Hong Kong from 1998 to 2000. Dr. Ma was an associate professor at Columbia University from 1994 to 2000. He has also served as a technology consultant to IBM, General Electric, TRW, Inc. and DuPont. Dr. Ma is a co-founder and advisor of Semiconductor Manufacturing International Corp., and has served as an adviser to the Ministry of Information Industry, Beijing Government, and a senior advisor to Zhangjiang Hi-Tech Park in Shanghai. Dr. Ma received his Ph.D. from Columbia University, and attended the Executive Program of Stanford University’s School of Business.
42
Frank Zheng, Director. Mr. Zheng has been a director since January 2005. He has been the vice president of travel service for eLong, Inc., a leading online travel service company in China, since July 2000. Mr. Zheng is responsible for the overall operation of eLong’s travel services. Before he joined eLong, Mr. Zheng was a senior director of travel services with Asia.com. From 1994 through 2000, Mr. Zheng held various financial and operations positions with The Bank of New York, The Reserve Management Corp, and Dean Witter Intercapital Company. Mr. Zheng received a B.B.A degree in Accounting from City University of New York.
Board Practices
Our business and affairs are managed under the direction of our board of directors. The primary responsibilities of our board of directors are to provide oversight, strategic guidance, counseling and direction to our management. It is our expectation that the board of directors will meet regularly on a quarterly basis and additionally as required.
Board Committees
Our board of directors has an audit committee, a nominating and corporate governance committee, and a compensation committee, each established in 2005. Our board of directors has determined that Amy Kong, Frank Zheng and Q.Y. Ma, the members of these committees, are “independent” under the current independence standards of Nasdaq Marketplace Rule 4200(a)(15) and meet the criteria for independence set forth in Rule 10A-3(b)(1) under the U.S. Securities Exchange Act of 1934, as amended (the Exchange Act). Our board of directors has also determined that these persons have no material relationships with us—either directly or as a partner, stockholder or officer of any entity—which could be inconsistent with a finding of their independence as members of our board of directors.
Audit Committee
The audit committee, consisting of Ms. Kong and Messrs. Ma and Zheng, oversees our financial reporting process on behalf of the board of directors. The committee’s responsibilities include the following functions:
| | • | | approve and retain the independent auditors to conduct the annual audit of our books and records; |
| | • | | review the proposed scope and results of the audit; |
| | • | | review and pre-approve the independent auditors’ audit and non-audited services rendered; |
| | • | | approve the audit fees to be paid; |
| | • | | review accounting and financial controls with the independent auditors and our financial and accounting staff; |
| | • | | review and approve transactions between us and our directors, officers and affiliates; and |
| | • | | recognize and prevent prohibited non-audit services. |
Our board of directors has determined that Ms. Kong, the Chair of the Audit Committee, is an “audit committee financial expert” as defined by the SEC’s rules.
Nominating And Corporate Governance Committee
The nominating and governance committee, consisting of Ms. Kong and Messrs. Ma and Zheng, is responsible for identifying potential candidates to serve on our board and its committees. The committee’s responsibilities include the following functions:
| | • | | making recommendations to the board regarding the size and composition of the board; |
43
| | • | | identifying and recommending to the board nominees for election or re-election to the board, or for appointment to fill any vacancy; |
| | • | | establishing procedures for the nomination process; |
| | • | | advising the board periodically with respect to corporate governance matters and practices, including periodically reviewing corporate governance guidelines to be adapted by the board; and |
| | • | | establishing and administering a periodic assessment procedure relating to the performance of the board as a whole and its individual members. |
The nominating and corporate governance committee will consider director candidates recommended by security holders. Potential nominees to the board of directors are required to have such experience in business or financial matters as would make such nominee an asset to the board and may, under certain circumstances, be required to be “independent”, as such term is defined under independence standards applicable to the Company. Security holders wishing to submit the name of a person as a potential nominee to the board must send the name, address, and a brief (no more than 500 words) biographical description of such potential nominee to the committee at the following address: Nominating and Corporate Governance Committee of the Board of Directors, c/o Comtech Group, Inc., Suite 1001, Tower C, Skyworth Building, High-Tech Industrial Park, Nanshan, Shenzhen 518057, People’s Republic of China. Potential director nominees will be evaluated by personal interview, such interview to be conducted by one or more members of the committee, and/or any other method the committee deems appropriate, which may, but need not, include a questionnaire. The committee may solicit or receive information concerning potential nominees from any source it deems appropriate. The committee need not engage in an evaluation process unless (1) there is a vacancy on the board, (2) a director is not standing for re-election, or (3) the committee does not intend to recommend the nomination of a sitting director for re-election. A potential director nominee recommended by a security holder will not be evaluated any differently than any other potential nominee.
Compensation Committee
The compensation committee, consisting of Ms. Kong and Messrs. Ma and Zheng, is responsible for making recommendations to the board concerning salaries and incentive compensation for our officers and employees and administers our stock option plans. Its responsibilities include the following functions:
| | • | | reviewing and recommending policy relating to the compensation and benefits of our officers and employees, including reviewing and approving corporate goals and objectives relevant to the compensation of our chief executive officer and other senior officers; evaluating the performance of these officers in light of those goals and objectives; and setting compensation of these officers based on such evaluations; |
| | • | | administering our benefit plans and the issuance of stock options and other awards under our stock plans; and reviewing and establishing appropriate insurance coverage for our directors and executive officers; |
| | • | | recommending the type and amount of compensation to be paid or awarded to members of our board of directors, including consulting, retainer, meeting, committee and committee chair fees and stock option grants or awards; and |
| | • | | reviewing and approving the terms of any employment agreements, severance arrangements, change-of-control protections and any other compensatory arrangements for our executive officers. |
Compensation Committee Interlocks And Insider Participation
No member of our compensation committee has at any time been an officer or employee of ours, or our subsidiaries. No interlocking relationship exists between our board of directors or compensation committee and the board of directors or compensation committee of any other company, nor has any interlocking relationship existed in the past.
44
Section 16(a) Beneficial Ownership Reporting Compliance
Section 16(a) of the Securities Exchange Act of 1934, as amended, or the Exchange Act, requires our executive officers, directors and persons who beneficially own more than 10% of a registered class of our equity securities to file with the Securities and Exchange Commission initial reports of ownership and reports of changes in ownership of our common stock and other equity securities. These executive officers, directors, and greater than 10% beneficial owners are required by SEC regulation to furnish us with copies of all Section 16(a) forms filed by such reporting persons.
There was a failure by each of the following to timely file their respective Form 4s: Jeffrey Kang, Comtech Global Investment Ltd. and Ren Investment International Ltd. Based solely on our review of such forms furnished to us and written representations from certain reporting persons, we believe that all other filing requirements applicable to our executive officers, directors and greater than 10% beneficial owners were complied with during 2006.
Code of Ethics
On November 4, 2004, we adopted a Code of Business Conduct and Ethics that applies to our directors, officers and employees, including our chief executive officer and chief financial officer—our principal executive officer and principal financial and accounting officer, respectively. A copy of our Code of Business Conduct and Ethics is available on the Investor Information page of our website, www.comtech.com.cn.
| ITEM 11. | EXECUTIVE COMPENSATION |
COMPENSATION DISCUSSION AND ANALYSIS
Overview
This compensation discussion describes the material elements of compensation awarded to, earned by, or paid to each of our executive officers listed in the Summary Compensation Table below (the “named executive officers”) during the last completed fiscal year. This compensation discussion focuses on the information contained in the following tables and related footnotes and narrative for primarily the last completed fiscal year, but we also describe compensation actions taken before or after the last completed fiscal year to the extent it enhances the understanding of our executive compensation disclosure.
The compensation committee currently oversees the design and administration of our executive compensation program.
The principal elements of our executive compensation program are base salary, annual cash incentives, long-term equity incentives in the form of stock options,other benefits and perquisites, post-termination severance and acceleration of stock option vesting for certain named executive officers upon termination and/or a change in control. Our other benefits and perquisites consist of life and health insurance benefits.
Objectives and Philosophy
In General. The objectives of our compensation programs are to:
| | • | | attract, motivate and retain talented and dedicated executive officers, |
| | • | | provide our executive officers with both cash and equity incentives to further the interests of us and our stockholders, and |
| | • | | provide employees with long-term incentives so we can retain them and provide stability during our growth stage. |
Generally, the compensation of our executive officers is composed of a base salary, an annual incentive compensation award andequity awards in the form of stock options. In setting base salaries, the compensation committee generally reviews the individual contributions of the particular executive. In addition, stock options are granted to provide the opportunity for long-term compensation based upon the performance of our common stock over time. Our philosophy is to position the aggregate of these elements at a level that is commensurate with our size and sustained performance.
45
Elements of Compensation
Compensation consists of following elements:
Base Salary. The employment agreement with Hope Ni, our Chief Financial Officer, establishes a minimum base salary for the term of the agreement. Base salaries for our executives officers are established based on the scope of their responsibilities, taking into account competitive market compensation paid by other companies in our industry for similar positions, and the other elements of the executive officer’s compensation, including stock-based compensation. Our intent is to target executive base salaries near the median of the range of salaries for executives in similar positions with similar responsibilities at comparable companies, in line with our compensation philosophy. Base salaries are reviewed annually, and may be increased annually to realign salaries with market levels after taking into account individual responsibilities, performance and experience. Based on publicly available information, we believe that the base salaries established for our executive officers are comparable to those paid by similar companies in our industry.
Annual Bonuses. Our executive officers and certain other employees are eligible for annual cash bonuses, which are paid at the discretion of our compensation committee. The employment agreement with our Chief Financial Officer does do not provide for minimum bonuses. The determination of the amount of annual bonuses paid to our executive officers generally reflects a number of subjective considerations, including the performance of our company overall and the contributions of the executive officer during the relevant period.
Incentive Compensation. We believe that long-term performance is achieved through an ownership culture that encourages long-term performance by our executive officers through the use of stock-based awards. We adopted the Comtech Group, Inc. 2006 Equity Incentive Plan, which permits the grant of shares of our incentive stock options, non-qualified stock options, restricted stock, stock appreciation rights, and performance stock awards. Our Board or a committee created by the Board will have the authority under the plan to award incentive compensation to our executive officers, employees, consultants and directors in such amounts and on such terms as the committee determines in its sole discretion.
Currently, we do not maintain any incentive compensation plans based on pre-defined performance criteria. Incentive compensation is intended to compensate executive officers, employees, consultants and directors for achieving financial and operational goals and for achieving individual annual performance objectives. These objectives are expected to vary depending on the individual executive, but are expected to relate generally to strategic factors such as expansion of our services and to financial factors such as improving our results of operations. The actual amount of incentive compensation for the prior year will be determined following a review of each executive’s individual performance and contribution to our strategic goals conducted during the first quarter of each year. Specific performance targets used to determine incentive compensation for each of our executive officers in 2007 have not yet been determined.
Other Employee Grants.
Other Compensation. Each employment agreement provides the executive with certain other benefits, including reimbursement of business and entertainment expenses and life insurance. Each executive is eligible to participate in all benefit plans and programs that are or in the future may be available to other executive employees of our company, including any profit-sharing plan, thrift plan, health insurance or health care plan, disability insurance, pension plan, supplemental retirement plan, vacation and sick leave plan, and other similar plans. The compensation committee in its discretion may revise, amend or add to the officer’s executive benefits and perquisites as it deems advisable. We believe that these benefits and perquisites are typically provided to senior executives of similar companies.
Compensation Committee Report on Executive Compensation
Our compensation committee has certain duties and powers as described in its charter. The compensation committee is currently composed of the three non-employee directors named at the end of this report, each of whom is independent as defined by the Nasdaq Global Market listing standards.
46
The compensation committee has reviewed and discussed with management the disclosures contained in the Compensation Discussion and Analysis section of this proxy statement. Based upon this review and discussion, the compensation committee recommended to our Board of Directors that the Compensation Discussion and Analysis section be included in our Annual Report on Form 10-K to be filed with the SEC.
| | |
| | | Compensation Committee of the Board of Directors |
| | Amy Kong |
| |
| | Q. Y. Ma |
| |
| | Frank Zheng |
SEC filings sometimes “incorporate information by reference.” This means that we are referring you to information that has previously been filed with the SEC, and that this information should be considered as part of the filing you are reading. Unless we specifically state otherwise, this report shall not be deemed to be incorporated by reference and shall not constitute soliciting material or otherwise be considered filed under the Securities Act or the Securities Exchange Act.
Executive Compensation
Summary Compensation Table
| | | | | | | | | | | | | | | | | |
Name and Principal Position | | Year | | Salary ($) | | Bonus ($) | | Stock Awards ($) | | Option Awards ($) | | Non-Equity Incentive Plan Compensation ($) | | All Other Compensation ($) | | | Total ($) |
Jeffrey Kang, Chairman, Chief Executive Officer and President | | 2006 | | 66,847 | | — | | — | | 269,800 | | — | | 2,471 | (2)(3) | | 339,118 |
| | 2005 | | 65,162 | | — | | — | | 269,800 | | — | | 1,048 | (2) | | 336,010 |
| | 2004 | | 22,744 | | — | | — | | — | | — | | 967 | (2) | | 23,711 |
Hope Ni, Chief Financial Officer, Secretary and Director(1) | | 2006 | | 125,000 | | — | | 372,234 | | — | | — | | — | | | 497,234 |
| | 2005 | | 117,000 | | — | | — | | 284,640 | | — | | — | | | 401,640 |
| | 2004 | | 54,000 | | — | | — | | 25,876 | | — | | — | | | 79,876 |
| (1) | Ms. Ni joined our company in August 2004. |
| (2) | Mr. Kang is entitled to retirement benefits under a PRC government-managed retirement plan. Expenses related to Mr. Kang’s participation in the PRC government managed retirement plan amounted to approximately RMB6,250 ($807) for the year ended December 31, 2006 and RMB8,458 ($1,048) for the year ended December 31, 2005 and RMB8,000 ($967) for each of the year ended December 31, 2004. |
| (3) | Mr. Kang is entitled to retirement benefits under Hong Kong’s mandatory provident fund scheme. Expenses related to Mr. Kang’s participation in the mandatory provident fund scheme amounted to approximately HKD13,000 ($1,664) for the year ended December 31, 2006. |
| (4) | All the shares of restricted stock were granted to Ms. Ni on March 8, 2006 and vested quarterly during the one-year period following the date of grant. |
Grants of Plan Based Awards
The following table summarizes our awards made to our named executive officers under any plan in 2006.
| | | | | | | | | | | | | | | | | | |
Name | | Grant Date | | Approval Date | | Estimated Future Payouts Under
Equity Incentive Plan Awards | | All Other
Stock
Awards:
Number of
Shares of
Stock or Units (#) | | All Other
Option
Awards:
Number of
Securities
Underlying Options (#) | | Exercise
or Base
Price of
Option
Awards ($ / Sh) | | Closing
Price
on
Grant
Date ($ / Sh) |
| | | | Threshold (#) | | Target (#) | | Maximum (#) | | | | |
Jeffrey Kang | | N/A | | N/A | | N/A | | N/A | | N/A | | — | | — | | — | | — |
Hope Ni | | Mar. 8, 2006 | | Mar. 7, 2006 | | N/A | | N/A | | N/A | | 50,000 | | — | | — | | 9.14 |
47
2004 Incentive Stock Option Plan
On August 3, 2004, the Company’s board of directors adopted the Comtech Group, Inc. 2004 Stock Incentive Plan (the Incentive Plan), under which 2,500,000 shares of common stock are reserved for issuance upon exercise of stock options, and for the issuance of stock appreciation rights, restricted stock awards and performance shares. The purpose of the Incentive Plan is to provide additional incentive to employees, directors, advisors and consultants by facilitating their acquisition of common stock. The Incentive Plan provides for a term of ten years from the date of its adoption by the board of directors (unless the Incentive Plan is earlier terminated), after which no awards may be made. Options granted under the Incentive Plan are either incentive stock options (i.e., options that afford favorable tax treatment to recipients upon compliance with certain restrictions pursuant to Section 422 of the U.S. Internal Revenue Code (IRC) and that do not result in tax deductions to us unless participants fail to comply with that Section) or options that do not so qualify.
Our board of directors determines when options under the Incentive Plan are exercisable and the option exercise price. The Incentive Plan permits options to be exercised with cash, check, certain other shares of our common stock, consideration received by us under “cashless exercise” programs, or if permitted by our board, promissory notes or other property. Our board also determines the performance goals and performance period for performance shares; the purchase price and conditions of repurchase for restricted stock and the terms of stock appreciation rights. Our board may at any time accelerate the vesting of any outstanding award. In the event we are sold, merged, consolidated, reorganized or liquidated, our board may take any of the following actions as to outstanding awards: (a) provide that the successor will assume or provide a substitute for the awards; (b) provide that all unexercised options and stock appreciation rights shall terminate immediately prior to the consummation of the transaction, if not previously exercised; (c) in the event of a sale where common stockholders receive cash for their shares, provide that each outstanding vested option and stock appreciation right will be exchanged for a payment in cash equal to the excess of the sales price over the exercise price; and (d) make such other adjustments deemed necessary to provide participants with a benefit substantially similar to that which they would have been entitled had the event not occurred. In the event of any stock dividend, split, recapitalization or other similar change, our board may adjust the number and kind of shares subject to outstanding awards, the exercise or purchase price of awards, and any other equitable adjustments it deems appropriate.
The Incentive Plan and the Directors’ Plan are administered by the compensation committee of our board of directors. The compensation committee selects the employees to whom awards are to be granted, the number of shares to be subject to such awards, and the terms and conditions of such awards, provided that any discretion exercised by the compensation committee must be consistent with resolutions adopted by our board and the terms of the Incentive Plan.
As of December 31, 2005, options to purchase an aggregate of 2,357,500 shares had been granted under the Incentive Plan, and options to purchase an aggregate of 115,000 shares had been granted under the Directors’ Plan.
2006 Equity Incentive Plan
Awards
The 2006 Plan provides for the grant of options, stock appreciation rights (“SARs”), performance share awards and restricted stock awards of up to an aggregate of 4,800,000 shares of Common Stock to officers, employees and independent contractors of the Company or its affiliates. If any award expires, is cancelled, or terminates unexercised or is forfeited, the number of shares subject thereto is again available for grant under the 2006 Plan. The number of shares of Common Stock for which awards may be granted to a participant under the 2006 Plan in any calendar year cannot exceed 2,400,000.
Currently, there are 43 employees and directors who would be entitled to receive stock options and/or restricted shares under the 2006 Plan. Future new hires and additional consultants would be eligible to participate in the 2006 Plan as well. The number of stock options and/or restricted shares to be granted to executives and directors cannot be determined at this time as the grant of stock options and/or restricted shares is dependent upon various factors such as hiring requirements and job performance.
48
Administration of the 2006 Plan
The 2006 Plan is administered by the Board of Directors or a committee of the Board of Directors consisting of not less than two members of the Board, each of whom is a “non-employee director” within the meaning of Rule 16b-3 promulgated under the Exchange Act and an “outside director” within the meaning of Code Section 162(m) (in either case, the “Committee”). Among other things, the Committee has complete discretion, subject to the express limits of the 2006 Plan, to determine the employees and independent contractors to be granted an award, the type of award to be granted, the number of shares of Common Stock subject to each award, the exercise price of each option and base price of each SAR, the term of each award, the vesting schedule for an award, whether to accelerate vesting, the value of the stock, and the required withholding. The Committee may amend, modify or terminate any outstanding award, provided that the participant’s consent to such action is required if the action would materially and adversely affect the participant. The Committee is also authorized to construe the award agreements, and may prescribe rules relating to the 2006 Plan. Notwithstanding the foregoing, the Committee does not have any authority to grant or modify an award under the 2006 Plan with terms or conditions that would cause the grant, vesting or exercise to be considered nonqualified “deferred compensation” subject to Code Section 409A.
Options
Options granted under the 2006 Plan may be either “incentive stock options” (“ISOs”), which are intended to meet the requirements for special federal income tax treatment under the Code, or “nonqualified stock options” (“NQSOs”). Options may be granted on such terms and conditions as the Committee may determine; provided, however, that the exercise price of an option may not be less than the fair market value of the underlying stock on the date of grant and the term of the option my not exceed 10 years (110% of such value and 5 years in the case of an ISO granted to an employee who owns (or is deemed to own) more than 10% of the total combined voting power of all classes of capital stock of the Company or a parent or subsidiary of the Company). ISOs may only be granted to employees. In addition, the aggregate fair market value of Common Stock covered by ISOs (determined at the time of grant) which are exercisable for the first time by an employee during any calendar year may not exceed $100,000. Any excess is treated as a NQSO.
Stock Appreciation Rights (SARs)
An SAR entitles the participant, upon exercise, to receive an amount, in cash or stock or a combination thereof, equal to the increase in the fair market value of the underlying stock between the date of grant and the date of exercise. SARs may be granted in tandem with, or independently of, options granted under the 2006 Plan. An SAR granted in tandem with an option (1) is exercisable only at such times, and to the extent, that the related option is exercisable in accordance with the procedure for exercise of the related option; (2) terminates upon termination or exercise of the related option (likewise, the option granted in tandem with an SAR terminates upon exercise of the SAR); (3) is transferable only with the related option; and (4) if the related option is an ISO, may be exercised only when the value of the stock subject to the option exceeds the exercise price of the option. An SAR that is not granted in tandem with an option is exercisable at such times as the Committee may specify.
Performance Shares
Performance share awards entitle the participant to acquire shares of stock upon attaining specified performance goals.
Restricted Stock
A restricted stock award is a grant or sale of stock to the participant, subject to the Company’s right to repurchase all or part of the shares at their purchase price (or to require forfeiture of such shares if purchased at no cost) in the event that conditions specified by the Committee in the award are not satisfied prior to the end of the time period during which the shares subject to the award may be repurchased by or forfeited to the Company. The purchase price for each share of restricted stock may not be less than the par value of the Company’s Common Stock.
Additional Terms
Except as provided in the 2006 Plan, awards granted under the 2006 Plan are not transferable and may be exercised only by the respective grantees during their lifetime or by their guardian or legal representative.
49
Each award agreement will specify, among other things, the effect on an award of the disability, death, retirement, authorized leave of absence or other termination of employment. The Company may require a participant to pay the Company the amount of any required withholding in connection with the grant, vesting, exercise or disposition of an award. A participant is not considered a stockholder with respect to the shares underlying an award until the shares are issued to the participant.
Term; Amendments
The 2006 Plan is effective for 10 years, unless it is sooner terminated or suspended. The Committee may at any time amend, alter, suspend or terminate the 2006 Plan; provided, that no amendment requiring stockholder approval will be effective unless such approval has been obtained. No termination or suspension of the 2006 Plan will affect an award which is outstanding at the time of the termination or suspension.
Certain Federal Income Tax Consequences
The following is a general summary of the federal income tax consequences under current tax law of options, stock appreciation rights and restricted stock. It does not purport to cover all of the special rules, including special rules relating to participants subject to Section 16(b) of the Exchange Act and the exercise of an option with previously-acquired shares, or the state or local income or other tax consequences inherent in the ownership and exercise of stock options and the ownership and disposition of the underlying shares or the ownership and disposition of restricted stock.
A participant does not recognize taxable income upon the grant of NQSO or an ISO. Upon the exercise of a NQSO, the participant recognizes ordinary income in an amount equal to the excess, if any, of the fair market value of the shares acquired on the date of exercise over the exercise price thereof, and the Company will generally be entitled to a deduction for such amount at that time. If the participant later sells shares acquired pursuant to the exercise of a NQSO, the participant recognizes long-term or short-term capital gain or loss, depending on the period for which the shares were held. Long-term capital gain is generally subject to more favorable tax treatment than ordinary income or short-term capital gain.
Upon the exercise of an ISO, the participant does not recognize taxable income. If the participant disposes of the shares acquired pursuant to the exercise of an ISO more than two years after the date of grant and more than one year after the transfer of the shares to the participant, the participant recognizes long-term capital gain or loss and the Company is not be entitled to a deduction. However, if the participant disposes of such shares within the required holding period, all or a portion of the gain is treated as ordinary income and the Company is generally entitled to deduct such amount.
In addition to the tax consequences described above, a participant may be subject to the alternative minimum tax, which is payable to the extent it exceeds the participant’s regular tax. For this purpose, upon the exercise of an ISO, the excess of the fair market value of the shares over the exercise price therefore is an adjustment which increases alternative minimum taxable income. In addition, the participant’s basis in such shares is increased by such excess for purposes of computing the gain or loss on the disposition of the shares for alternative minimum tax purposes. If a participant is required to pay an alternative minimum tax, the amount of such tax which is attributable to deferral preferences (including the incentive option adjustment) is allowed as a credit against the participant’s regular tax liability in subsequent years. To the extent the credit is not used, it is carried forward.
A participant does not recognize income upon the grant of an SAR. The participant has ordinary compensation income upon exercise of the SAR equal to the increase in the value of the underlying shares, and the Company will generally be entitled to a deduction for such amount.
A participant does not recognize income on the receipt of a performance share award until the shares are received. At such time, the participant recognizes ordinary compensation income equal to the excess, if any, of the fair market value of the shares over any amount paid for the shares, and the Company is generally entitled to deduct such amount at such time.
A participant who receives a grant of restricted stock generally recognizes ordinary compensation income equal to the excess, if any of fair market value of the stock at the time the restriction lapses over any amount paid for the shares. Alternatively, the participant may elect to be taxed on the value at the time of grant. The Company is generally entitled to a deduction at the same time and in the same amount as the income required to be included by the participant.
50
Outstanding Equity Awards at Fiscal Year-End
The following table summarizes the number of securities underlying outstanding plan awards for each named executive officer as of December 31, 2006.
| | | | | | | | | | | | | | | | | | | | |
| | | Option Awards | | Stock Awards |
| | | Number of
Securities
Underlying
Unexercised
Options (#) | | Number of
Securities
Underlying
Unexercised
Options (#) | | Equity
Incentive
Plan
Awards:
Number of
Securities
Underlying
Unexercised
Unearned
Options (#) | | Option
Exercise
Price ($) | | Option
Expiration Date | | Number
of Shares
or Units
of Stock
That
Have Not
Vested (#) | | | Market
Value of
Shares or
Units of
Stock
That
Have Not
Vested ($) | | | Equity
Incentive Plan
Awards:
Number of
Unearned
Shares, Units
or Other
Rights That
Have Not
Vested (#) | | Equity
Incentive Plan
Awards:
Market or
Payout Value
of Unearned
Shares, Units
or Other
Rights That
Have Not
Vested ($) |
Name | | Exercisable | | Unexercisable | | | | | | | |
Jeffrey Kang | | 283,376 | | 166,666 | | — | | 3.74 | | Nov. 11, 2014 | | — | | | — | | | — | | — |
Hope Ni | | 100,000 | | — | | — | | 3.00 | | Aug. 16, 2014 | | 12,500 | (1) | | 227,375 | (2) | | — | | — |
| (1) | 12,500 shares vest on each of June 8, 2006, Sept. 8, 2006 and Dec. 8, 2006. |
| (2) | The market value of the shares that have not vested has been calculated by multiplying the number of shares times $18.19, which represents the last reported sale price of our common stock on the Nasdaq Global Market on December 31, 2006, which is the last day of the most recent fiscal year. |
Option Exercises and Stock Vested
The following table summarizes stock option exercises by our named executive officers in 2006.
| | | | | | | | | | |
| | | Option Awards | | Stock Awards |
Name | | Number of Shares
Acquired on Exercise (#) | | Value Realized on
Exercise ($) | | Number of Shares
Acquired on Vesting (#) | | | Value Realized on
Vesting ($) |
Jeffrey Kang | | 49,957 | | $ | 587,494 | | — | | | — |
Hope Ni | | 110,000 | | $ | 1,060,494 | | 37,500 | (1) | | 546,250 |
| (1) | 12,500 shares vest on each of June 8, 2006, Dec. 8, 2006 and Sept. 8, 2006. |
Pension Benefits
We do not sponsor any qualified or non-qualified defined benefit plans.
Nonqualified Deferred Compensation
We do not maintain any non-qualified defined contribution or deferred compensation plans. The compensation committee may elect to provide our officers and other employees with non-qualified defined contribution or deferred compensation benefits if the compensation committee determines that doing so is in our best interests.
Employment Agreements
On August 1, 2004, we entered into an employment agreement with Hope Ni to serve as our chief financial officer and secretary. The employment agreement terminates on December 31, 2007, but will be automatically extended unless either we give Ms. Ni notice prior to her termination date or Ms. Ni gives 30 days’ written notice to us of her election not to extend. Under the terms of the agreement, Ms. Ni receives a base salary of $117,000 per annum and was granted ten-year options to purchase a total of 210,000 shares of our common stock at an exercise price of $3.00, which options are all fully vested. In March 2006, the compensation committee approved a new compensation package for Hope Ni which includes a base salary of $125,000 per annum and 50,000 additional restricted shares which will be vested quarterly over one year.
51
Potential Payments Upon Termination or Change In Control
The following are the payments we would have been required to make to Ms. Ni if her employment had been terminated by us without cause or by her resignation for good reason, as of December 31, 2006:
| | | | | | | | | | | | | | | | | | |
| | | | | Before Change
in Control | | | After Change
in Control | | | | | | | | | |
Name | | Benefit | | Termination
w/o Cause or
for Good
Reason | | | Termination
w/o Cause or
for Good
Reason | | | Voluntary
Termination | | Death | | Disability | | Change
in
Control |
Hope Ni | | Cash Severance | | $ | 31,250 | (1) | | $ | 62,500 | (2) | | None | | None | | None | | None |
| (1) | Equal to three times monthly salary. |
| (2) | If a change in control occurs prior to December 31, 2007 and we subsequently terminate Ms. Ni’s employment without cause, or if she resigns for good reason prior to the date that our board of directors certifies our audit for the first complete fiscal year after the change in control (the Change in Control Audit Date), Ms. Ni will be entitled to receive standard termination benefits and a payment equal to the greater of (a) six times her monthly salary or (b) 12 months salary less compensation paid to her between the date of the change in control and the date of termination. If the change in control occurs prior to December 31, 2007 and we terminate Ms. Ni’s employment without cause, or if she resigns for good reason after the Change in Control Audit Date, Ms. Ni will be entitled to the same termination benefits she would have received had a change in control not occurred and we terminated her employment without cause or she resigned for good reason. |
| | We are not obligated to make any cash payments to Ms. Ni if her employment is terminated by us for cause or by the executive not for good reason. No severance or benefits are provided for any of the executive officers in the event of death or disability. If Ms. Ni’s employment is terminated after the Change in Control Audit Date, other than as a result of her resignation, Ms. Ni will have the right to exercise all of her stock options. If Ms. Ni resigns prior to the Change in Control Audit Date, notwithstanding the fact that her options are fully vested, Ms. Ni shall have the right to exercise a specified number of shares at a price to be determined under the terms of the agreement at the time of her resignation. For purposes of Ms. Ni’s employment agreement, a “change in control” means the consummation of a reorganization, merger of consolidation of us with one or more other persons. |
| (3) | The employment agreement contains a provision that reduces the exercise price of Ms. Ni’s options to $1.50 upon a change in control. The exercise price of Ms. Ni’s options is $3.00. |
Director Compensation
The following table summarizes compensation that our directors earned during 2006 for services as members of our Board.
| | | | | | | | | | | | | | | |
Name | | Fees Earned
or Paid in
Cash ($) | | | Stock
Awards ($) | | Option
Awards ($) | | Non-Equity
Incentive Plan
Compensation ($) | | Change in
Pension Value and
Nonqualified
Deferred
Compensation
Earnings ($) | | All Other
Compensation ($) | | Total ($) |
Amy Kong | | 26,000 | (2) | | — | | — | | — | | — | | — | | 26,000 |
Q.Y. Ma | | 21,000 | (2) | | — | | — | | — | | — | | — | | 21,000 |
Frank Zheng | | 21,000 | (3) | | — | | — | | — | | — | | — | | 21,000 |
Mark Hauser(1) | | 20,000 | (4) | | — | | — | | — | | — | | — | | 20,000 |
Mark B. Segall(1) | | 20,000 | (4) | | — | | — | | — | | — | | — | | 20,000 |
| (1) | Mark Hauser and Mark Segall are no longer members of our Board as of December 31, 2006 as they did not stand for re-election. |
| (2) | Received $5,000 for meeting attendance, $10,000 for acting as Chair of our audit committee and $1,000 for serving on the compensation committee and nominating and corporate governance committees. |
52
| (3) | Received $5,000 for meeting attendance, $5,000 for being a member of the audit committee and $1,000 for serving on the compensation committee and nominating and corporate governance committees. |
| (4) | Received $5,000 for meeting attendance and $5,000 for providing capital market advice. |
Each non-employee director who becomes a director after the grant of options is entitled to receive options on a pro rata basis for the portion of the period for which they will serve. All of the options granted to the incoming directors will be exercisable at the fair market value on the date of grant and will vest quarterly during the remainder of the period following the close of grant.
ITEM 12. SECURITY OWNERSHIP OF CERTAIN BENEFICIAL OWNERS AND MANAGEMENT AND RELATED SHAREHOLDER MATTERS
The following table sets forth, as of March 12, 2007, certain information as to the stock ownership of (1) each person known by us to own beneficially more than five percent of our common stock, (2) each of our directors, (3) each of our executive officers, and (4) our executive officers and directors as a group. Except as set forth in Note 11 to the table, the business address of each shareholder is c/o Comtech Group, Inc. Company, Suite 1001, Tower C, Skyworth Building, High-Tech Industrial Park, Nanshan, Shenzhen 518057, People’s Republic of China.
| | | | | | |
Name of Beneficial Owner | | Number of Shares
Beneficially Owned (1) | | | Percentage
Ownership | |
Jeffrey Kang | | 10,862,067 | (2) | | 32.8 | % |
Hope Ni | | 150,000 | (5) | | * | |
Amy Kong | | — | | | * | |
Q.Y. Ma | | 10,000 | (6) | | * | |
Frank Zheng | | 7,500 | (5) | | * | |
All executive officers and directors as a group (5 persons) | | 11,029,567 | | | 33.3 | % |
| | |
Principal Stockholders | | | | | | |
Nan Ji | | 10,537,024 | (4)(7) | | 31.8 | % |
Comtech Global Investment Ltd. | | 10,537,024 | (4) | | 31.8 | % |
Yi Kang | | 2,669,528 | (3) | | 8.1 | % |
Ren Investment International Ltd. | | 2,669,528 | (8) | | 8.1 | % |
| * | Represents beneficial ownership of less than one percent of our outstanding shares. |
| (1) | Beneficial ownership is determined in accordance with the rules and regulations of the U.S. Securities and Exchange Commission (SEC). In computing the number of shares beneficially owned by a person and the percentage ownership of that person, shares of common stock subject to options held by that person that are currently exercisable or exercisable within 60 days of March 12, 2007 are deemed outstanding. Such shares, however, are not deemed outstanding for the purposes of computing the percentage ownership of any other person. Except as indicated in the footnotes to the following table or pursuant to applicable community property laws, each stockholder named in the table has sole voting and investment power with respect to the shares set forth opposite such stockholder’s name. The percentage of beneficial ownership is based on 33,105,911 shares of common stock outstanding as of March 12, 2007. |
| (2) | Includes (a) 325,043 shares issuable upon exercise of currently exercisable stock options and (b) 10,537,024 shares beneficially owned by Comtech Global Investment Ltd., over which Mr. Jeffrey Kang and his wife, Ms. Nan Ji, share voting and investment power. |
| (3) | Includes 2,669,528 shares beneficially owned by Ren Investment International Ltd., over which Mr. Yi Kang, as sole director, has sole voting and investment power. Mr. Yi Kang, the brother of Jeffery Kang, does not have an economic interest in any shares of Ren Investment International Ltd. |
| (4) | Mr. Jeffrey Kang owns a 29% interest and Ms. Nan Ji a 71% interest in Comtech Global Investment Ltd. The directors of Comtech Global Investment Ltd. are Mr. Jeffrey Kang and Mr. Yi Kang. |
| (5) | Includes (a) 100,000 shares issuable upon exercise of currently exercisable stock options and (b) 50,000 shares owned by Ms. Ni. |
| (6) | Represents shares issuable upon exercise of currently exercisable stock options. |
53
| (7) | Represents 10,537,024 shares beneficially owned by Comtech Global Investment Ltd., over which Mr. Jeffrey Kang and his wife, Ms. Nan Ji, share voting and investment power. |
| (8) | Shares of Ren Investment International Ltd. are beneficially owned by Mr. Yi Kang, who as sole director, has sole voting and investment power over the shares. Mr. Yi Kang does not have any economic interest in any shares of Ren Investment International Ltd. |
ITEM 13. CERTAIN RELATIONSHIPS AND RELATED TRANSACTIONS, AND DIRECTOR INDEPENDENCE
Commercial Transactions
As at December 31, 2006, there was a unsettled payable to Matsunichi, with no fixed repayment date, amounting to RMB1.5 million ($0.2 million) in connection with this purchase.
Other Related Party Transactions
At the time of its incorporation, foreign shareholding in a trading business such as Shenzhen Comtech could not exceed 65%. With subsequent PRC deregulation, foreign ownership of such a trading business can now reach 100%, and approval of foreign ownership of companies in the PRC engaged in commodity trading businesses—which includes agency trade, wholesale, retail and franchise operations is now delegated to local government agencies of the PRC Ministry of Commerce. In order to exercise control over Shenzhen Comtech (a PRC operating company legally permitted to engage in a commodity trading business), without direct shareholding by us (a U.S.-listed company and therefore a foreign-invested entity), Honghui Li, our vice president, and Huimo Chen, the mother of our principal shareholder and chief executive officer, Jeffrey Kang, hold 99% and 1%, respectively, of the equity interests of Shenzhen Comtech, and through contractual agreements with us hold such equity interests exclusively for the benefit of our 100% directly owned subsidiary, Comtech China. Shenzhen Comtech, in turn owns a 60% equity interest in another of our PRC operating companies, Shanghai E&T, with the other 40% being held by Comtech China (BVI) through trust agreements. Under the trust agreements, Shenzhen Comtech owns a 35% equity interest in Shanghai E&T for the benefit of Comtech China (BVI) and Honghui Li owns a 5% equity interest in Shanghai E&T for the benefit of Comtech China (BVI). While we do not have any equity interest in Shenzhen Comtech, through these contractual agreements, we enjoy voting control and are entitled to the economic interests associated with their equity interest in Shenzhen Comtech. For additional details regarding these contractual agreements, see “Risk Factors—Risks Related to our Business—We depend upon contractual agreements with the two shareholders of Shenzhen Comtech in conducting our business through Shenzhen Comtech and Shanghai E&T and receiving payments, which may not be as effective in providing operational control as direct ownership and may be difficult to enforce. Further, if the PRC government finds these contractual agreements violate or conflict with PRC governmental regulations, our business would be materially adversely affected.”
In 2005, Nan Ji executed an agreement to transfer her 70% equity interest in Shenzhen Comtech to Jeffrey Kang and her 1% equity interest in Shenzhen Comtech to Huimo Chen, the mother of Jeffrey Kang, who is a PRC citizen. Jeffrey Kang and Huimo Chen have also agreed that upon the successful transfer of Nan Ji’s equity interest as described above, they will enter into and be bound by the same contractual arrangements with Comtech China relating to the voting control of Shenzhen Comtech. In 2006, Jeffrey Kang executed an agreement to transfer his 99% equity interest in Shenzhen Comtech to Honghui Li.
On August 6, 2006, Comtech China, our wholly-owned subsidiary, entered into a share acquisition agreement pursuant to which Comtech China acquired the remaining 40% minority interests of Shanghai E&T for cash consideration of RMB16,000 ($2,024). Comtech China in turn entered into trust agreements with Honghui Li and Shenzhen Comtech. Under the trust agreements, Honghui Li owns 5% interest in Shanghai E&T, and Shenzhen Comtech owns 35% interest in Shanghai E&T, in addition to 60% equity interest it owned previously. We enjoy voting control over and all economic interests associated with Shanghai E&T.
At present, most of our business in China is done through Shenzhen Comtech and Shenzhen Communication, except for business in Shanghai, which is conducted mostly through Shanghai E&T. No dividends have been paid or distributions made by Shenzhen Comtech to Comtech China thus far.
In the event any transaction in which we propose to engage is a related-person transaction, our management must present information regarding the proposed related-person transaction to the disinterested non-employee members of our board of directors for consideration and approval or ratification. The presentation must include a description of, among other things, the material facts, the interests, direct and indirect, of the related persons, the benefits to us of the transaction and whether any alternative transactions were available. To identify related-person transactions in advance, we rely on information supplied by our executive officers,
54
directors and significant stockholders. In considering related-person transactions, the disinterested non-employee members of the board take into account the relevant available facts and circumstances including, but not limited to (a) the risks, costs and benefits to us, (b) the impact on a director’s independence in the event the related person is a director, immediate family member of a director or an entity with which a director is affiliated, (c) the terms of the transaction, (d) the availability of other sources for comparable services or products and (e) the terms available to or from, as the case may be, unrelated third parties or to or from employees generally. In the event a director has an interest in the proposed transaction, the director must excuse himself or herself from the deliberations and approval. The policy requires that, in determining whether to approve, ratify or reject a related-person transaction, the disinterested non-employee members of the board look at, in light of known circumstances, whether the transaction is in, or is not inconsistent with, our best interests and our stockholders, as determined in the good faith exercise of such directors’ discretion.
Director Independence
See the information set forth in the section titled “Directors, Executive Officers and Corporate Governance—Board Committees” in Part III, Item 10 of this Annual Report.
ITEM 14. PRINCIPAL ACCOUNTANT FEES AND SERVICES
The following table presents the aggregate fees for professional services and other services rendered by our principal accountant to us in 2006 and 2005.
| | | | |
| | | 2006 | | 2005 |
| | | (in millions) |
Audit fees(1) | | 4.3 | | RMB2.4 |
Audit-related fees | | — | | 1.9 |
Tax fees | | — | | 0.3 |
All other fees | | 0.2 | | — |
| | | | |
Total | | RMB4.5 | | RMB4.6 |
| (1) | Audit fees consist of fees billed for the professional services rendered for the audit of our consolidated financial statements for each of these fiscal years and the review of the interim financial statements for the fiscal years ended December 31, 2006 and December 31, 2005, respectively. |
We are required to obtain pre-approval by our audit committee for all audit and permitted non-audit services performed by our independent auditors. In accordance with this requirement, during fiscal 2006, 100% of all audit, audit-related, tax and other services performed by KPMG were approved in advance by the audit committee. Any pre-approved decisions are presented to the full audit committee at the next scheduled meeting. KPMG was our principal auditor and no work was performed by persons outside of this firm.
55
PART IV
ITEM 15. EXHIBITS AND FINANCIAL STATEMENT SCHEDULES
(a)(1) Index to Consolidated Financial Statements
Please see the accompanying Index to Consolidated Financial Statements which appears on page F-1 of this report. The Management’s Report on Internal Control over Financial Reporting, Reports of Independent Registered Public Accounting Firms, Consolidated Financial Statements and Notes to Consolidated Financial Statements which are listed in the Index to Consolidated Financial Statements and which appear beginning on page F-2 of this report are included in Item 8 above.
(a)(2) Financial Statements Schedule
All financial statements schedules have been omitted because the information required to be set forth therein is not applicable or is included in the Consolidated Financial Statements or notes thereto.
(c) Exhibits
The following exhibits are filed as part of, or are incorporated by reference in, this Form 10-K:
| | |
| | | Description |
| |
| 3.1 | | Amended Articles of Restatement of the Articles of Incorporation. (Incorporated by reference to Exhibit 3.1 of the Annual Report on Form 10-K for the fiscal year ended December 31, 1996 filed with the Securities and Exchange Commission on April 15, 1997.) |
| |
| 3.1(a) | | Amendments to Articles of Incorporation. (Incorporated by reference to the Registration Statement on Form S-1 filed on December 23, 2004, and subsequently amended on February 2, 2005.) |
| |
| 3.2 | | Bylaws. (Incorporated by reference to the Registration Statement on Form S-1 filed on December 23, 2004, and subsequently amended on February 2, 2005.) |
| |
| 4.1 | | Specimen Stock Certificate. (Incorporated by reference to the Registration Statement on Form S-1 filed on December 23, 2004, and subsequently amended on February 2, 2005.) |
| |
| 4.2 | | Shareholders Agreement, dated July 23, 2004. (Incorporated by reference to Exhibit 4.1 of the Form 8-K filed with the Securities and Exchange Commission on July 22, 2004.) |
| |
| 10.1 | | Comtech Group, Inc. 2004 Incentive Stock Option Plan. (Incorporated by reference to the Registration Statement on Form S-1 filed on December 23, 2004, and subsequently amended on February 2, 2005.) |
| |
| 10.2 | | Employment Agreement with Hope Ni, dated as of August 1, 2004. (Incorporated by reference to the Registration Statement on Form S-1 filed on December 23, 2004, and subsequently amended on February 2, 2005.) |
| |
| 10.3 | | Revolving Credit Agreement with Bank of Communications Hong Kong branch, dated September 14, 2004. (Incorporated by reference to Exhibit 10.3 to our Form 10-K for the year ended December 31, 2004 filed on March 31, 2005) |
| |
| 10.4 | | Share Exchange Agreement between Trident Rowan Group Inc., Comtech Group Inc., and certain other parties, dated May 25, 2004. (Incorporated by reference to Exhibit 10.1 of the Form 8-K filed with the Securities and Exchange Commission on May 28, 2005.) |
| |
| 10.5 | | Equity Joint Venture Agreement between Comtech Group, Inc. and Broadwell Group Ltd. dated January 17, 2005. (Incorporated by reference to Exhibit 10.12 of the Form 8-K filed with the Securities and Exchange Commission on January 21, 2005.) |
56
| | |
| | | Description |
| |
| 10.6 | | Trident 1995 Director’s Plan. (Incorporated by reference to Exhibit 10.1 of Form 10-K filed with the Securities and Exchange Commission on May 24, 1996.) |
| |
| 10.7 | | Agreement between Comtech Group, Inc. and United Information Technology Co. Ltd., dated May 12, 2005. (Incorporated by reference to Exhibit 10.1 of the Form 8-K filed with the Securities and Exchange Commission on May 17, 2005.) |
| |
| 10.8 | | Agreement between Comtech Cayman and Century Teltone Technology Co. Ltd., dated November 9, 2005. (Incorporated by reference to Exhibit 10.1 of the Form 8-K filed with the Securities and Exchange Commission on November 17, 2005.) |
| |
| 10.9 | | Agreement, dated August 6, 2006, between Comtech Group, Inc. and United Information Technology Co., Ltd. (Incorporated by reference to Exhibit 10.1 of the Form 8-K filed with the Securities and Exchange Commission on August 9, 2006) |
| |
| 10.10 | | Termination Agreement, dated August 6, 2006, between Comtech Group, Inc. and United Information Technology Co., Ltd. (Incorporated by reference to Exhibit 10.2 of the Form 8-K filed with the Securities and Exchange Commission on August 9, 2006) |
| |
| 10.11 | | Shares Acquisition Agreement, dated August 6, 2006, between Comtech (China) Holding Ltd. and Duckworth Investments, Ltd. (Incorporated by reference to Exhibit 10.3 of the Form 8-K filed with the Securities and Exchange Commission on August 9, 2006) |
| |
| 10.12 | | 2006 Equity Incentive Plan. (Incorporated by reference to Exhibit A to our Schedule A filed with the Securities and Exchange Commission on December 1, 2006.) |
| |
| 10.13† | | Deed Concerning Shares of Shanghai E & T System Company Limited, dated December 12, 2006, among Honghui Li and Comtech (China) Holding Ltd. |
| |
| 10.14† | | Deed Concerning Shares of Shenzhen Comtech International Ltd, dated December 12, 2006, among Jeffrey (Jingwei) Kang, Honghui Li and Comtech (China) Holding Ltd. |
| |
| 14.1 | | Code of Business Conduct and Ethics. (Incorporated by reference to Exhibit 14.1 to our Form 10-K for the year ended December 31, 2004 file on March 31, 2005) |
| |
| 15.1† | | Consent of KPMG, Independent Registered Public Accounting Firm |
| |
| 15.2† | | Consent of Deloitte Touche Tohmatsu, Independent Registered Public Accounting Firm† |
| |
| 21.1† | | List of Subsidiaries of the Registrant. |
| |
| 24.1 | | Power of Attorney (included on signature page to Form 10-K) |
| |
| 31.1† | | Certification of Chief Executive Officer pursuant to Section 302 of the Sarbanes-Oxley Act of 2002. |
| |
| 31.2† | | Certification of Chief Financial Officer pursuant to Section 302 of the Sarbanes-Oxley Act of 2002. |
| |
| 32.1†† | | Certification of Chief Executive Officer pursuant to Section 906 of the Sarbanes-Oxley Act of 2002. |
| |
| 32.2†† | | Certification of Chief Financial Officer pursuant to Section 906 of the Sarbanes-Oxley Act of 2002. |
57
SIGNATURES
Pursuant to the requirements of Section 13 or 15(d) of the Exchange Act of 1934, the registrant caused this report to be signed on its behalf by the undersigned, thereunto duly authorized.
| | | | |
| | COMTECH GROUP, INC. |
| | |
| | By: | | /s/ Jeffrey Kang |
| Dated: March 16, 2007 | | Name: | | Jeffrey Kang |
| | Title: | | Chairman and Chief Executive Officer |
POWER OF ATTORNEY
KNOW ALL PERSONS BY THESE PRESENT, that each person whose signature appears below constitutes and appoints Jeffrey Kang and Hope Ni, and each of them, his or her true and lawful attorneys-in-fact and agents, each with full power of substitution and resubstitution, for him or her in any and all capacities, to sign any or all amendments to this Annual Report on Form 10-K, and to file the same, with all exhibits thereto and other documents in connection therewith, with the Securities and Exchange Commission, hereby ratifying and confirming all that said attorneys-in-fact and agents, or any of them, or their substitutes, may lawfully do or cause to be done by virtue hereof.
Pursuant to the requirements of the Securities Exchange Act of 1934, this report has been signed below by the following persons on behalf of the registrant and in the capacities and on the dates indicated.
| | | | | | |
| Dated March 16, 2007 | | | | By: | | /s/ Jeffrey Kang |
| | | | Name: | | Jeffrey Kang |
| | | | Title: | | Chairman and Chief Executive Officer |
| | | | | | (Principal Executive Officer) |
| | | |
| Dated March 16, 2007 | | | | By: | | /s/ Hope Ni |
| | | | Name: | | Hope Ni |
| | | | Title: | | Chief Financial Officer, Secretary and Director |
| | | | | | (Principal Financial Officer) |
| | | |
| Dated March 16, 2007 | | | | By: | | /s/ Amy Kong |
| | | | Name: | | Amy Kong |
| | | | Title: | | Director |
| | | |
| Dated March 16, 2007 | | | | By: | | /s/ Q.Y. Ma |
| | | | Name: | | Q.Y. Ma |
| | | | Title: | | Director |
| | | |
| Dated March 16, 2007 | | | | By: | | /s/ Frank Zheng |
| | | | Name: | | Frank Zheng |
| | | | Title: | | Director |
INDEX TO CONSOLIDATED FINANCIAL STATEMENTS
MANAGEMENT’S REPORT ON INTERNAL CONTROL OVER FINANCIAL REPORTING
Our management is responsible for establishing and maintaining adequate “internal control over financial reporting” (as defined in Rule 13a-15(f) under the Securities Exchange Act of 1934) for Comtech Group Inc. and its subsidiaries (the “Company”). Our internal control over financial reporting is a process designed under the supervision of the Chief Executive Officer and Chief Financial Officer to provide reasonable assurance regarding the reliability of financial reporting and the preparation of our financial statements for external reporting purposes in accordance with U.S. generally accepted accounting principles. A company’s internal control over financial reporting includes policies and procedures that (1) pertain to the maintenance of records that accurately and fairly reflect, in reasonable detail, transactions and dispositions of our assets, (2) provide reasonable assurance that transactions are recorded as necessary to permit preparation of financial statements in accordance with U.S. generally accepted accounting principles and that receipts and expenditures are being made only in accordance with authorizations of management and the directors of the Company, and (3) provide reasonable assurance regarding the prevention or timely detection of unauthorized acquisition, use, or disposition of our assets that could have a material effect on our financial statements.
Because of its inherent limitations, internal control over financial reporting cannot provide absolute assurance of achieving financial reporting objectives. Also, projections of any evaluation of effectiveness to future periods are subject to the risk that controls may become inadequate because of changes in conditions, or that the degree of compliance with policies or procedures may deteriorate.
Under the supervision and with the participation of our management, including the Chief Executive Officer and Chief Financial Officer, evaluated the effectiveness of Comtech’s internal control over financial reporting as of December 31, 2006. In its evaluation, management used the criteria set forth by the Committee of Sponsoring Organizations of the Treadway Commission (COSO) in Internal Control-Integrated Framework. Management believes that as of December 31, 2006, the Company’s internal control over financial reporting was effective based on those criteria. The Board’s management’s assessment of the effectiveness of the Company’s internal controls over financial reporting excluded those of Viewtran Cayman, a company acquired on December 15, 2006. Viewtran Cayman is a wholly-owned subsidiary of the Company whose total assets represented approximately 7% of consolidated total assets and less than 1% of consolidated net sales as of and for the year ended December 31, 2006. If adequately disclosed, companies are allowed to exclude acquisitions from their assessment of internal control over financial reporting during the first year of an acquisition while integrating the acquired company under guidelines established by the U.S. Securities and Exchange Commission.
Based on our assessment and the criteria described above, management has concluded that, as of December 31, 2006, our internal control over financial reporting was effective.
The Company’s independent registered public accounting firm has issued an audit report on management’s assessment of the Company’s internal control over financial reporting. This report is included herein.
F-2
REPORT OF INDEPENDENT REGISTERED PUBLIC ACCOUNTING FIRM
The Board of Directors and Stockholders
Comtech Group Inc.
We have audited management’s assessment, included in the accompanying Management’s Report on Internal Control over Financial Reporting, that Comtech Group Inc. and its subsidiaries (“the Company”) maintained effective internal control over financial reporting as of December 31, 2006, based on criteria established inInternal Control – Integrated Frameworkissued by the Committee of Sponsoring Organizations of the Treadway Commission (“COSO”). The Company’s management is responsible for maintaining effective internal control over financial reporting and for its assessment of the effectiveness of internal control over financial reporting. Our responsibility is to express an opinion on management’s assessment and an opinion on the effectiveness of the Company’s internal control over financial reporting based on our audit.
We conducted our audit in accordance with the standards of the Public Company Accounting Oversight Board (United States). Those standards require that we plan and perform the audit to obtain reasonable assurance about whether effective internal control over financial reporting was maintained in all material respects. Our audit included obtaining an understanding of internal control over financial reporting, evaluating management’s assessment, testing and evaluating the design and operating effectiveness of internal control, and performing such other procedures as we considered necessary in the circumstances. We believe that our audit provides a reasonable basis for our opinion.
A company’s internal control over financial reporting is a process designed to provide reasonable assurance regarding the reliability of financial reporting and the preparation of financial statements for external purposes in accordance with U.S. generally accepted accounting principles. A company’s internal control over financial reporting includes those policies and procedures that (1) pertain to the maintenance of records that, in reasonable detail, accurately and fairly reflect the transactions and dispositions of the assets of the company; (2) provide reasonable assurance that transactions are recorded as necessary to permit preparation of financial statements in accordance with generally accepted accounting principles, and that receipts and expenditures of the company are being made only in accordance with authorizations of management and directors of the company; and (3) provide reasonable assurance regarding prevention or timely detection of unauthorized acquisition, use, or disposition of the company’s assets that could have a material effect on the financial statements.
Because of its inherent limitations, internal control over financial reporting may not prevent or detect misstatements. Also, projections of any evaluation of effectiveness to future periods are subject to the risk that controls may become inadequate because of changes in conditions, or that the degree of compliance with the policies or procedures may deteriorate.
In our opinion, management’s assessment that the Company maintained effective internal control over financial reporting as of December 31, 2006, is fairly stated, in all material respects, based on criteria established inInternal Control – Integrated Frameworkissued by Committee of Sponsoring Organizations of the Treadway Commission (“COSO”). Also, in our opinion, the Company maintained, in all material respects, effective internal control over financial reporting as of December 31, 2006, based on criteria established in Internal Control –Integrated Frameworkissued by Committee of Sponsoring Organizations of the Treadway Commission (“COSO”).
The Company acquired Viewtran Cayman (the “Acquired Company”) on December 15, 2006, and management excluded from its assessment of the effectiveness of its internal control over financial reporting as of December 31, 2006 the Acquired Company’s internal control over financial reporting associated with total assets representing approximately 7% of total consolidated assets and less than 1% of consolidated net sales of the Company as of and for the year ended December 31, 2006. Our audit of internal control over financial reporting of the Company excluded an evaluation of the internal control over financial reporting of the Acquired Company.
We have also audited, in accordance with the standards of the Public Company Accounting Oversight Board (United States), the consolidated balance sheet of Comtech Group, Inc. and its subsidiaries as of December 31, 2006 and the related consolidated statements of operations, stockholders’ equity and comprehensive income, and cash flows for the year ended December 31, 2006 and our report dated March 16, 2007 expressed an unqualified opinion on those consolidated financial statements.
KPMG
Hong Kong, China
March 16, 2007
F-3
REPORT OF INDEPENDENT REGISTERED ACCOUNTING FIRM
To the Board of Directors and Stockholders of
Comtech Group, Inc.
We have audited the accompanying consolidated balance sheet of Comtech Group, Inc. and its subsidiaries (the "Company") as of December 31, 2006 and the related consolidated statements of operations, stockholders' equity and comprehensive income, and cash flows for the year ended December 31, 2006. These consolidated financial statements are the responsibility of the Company's management. Our responsibility is to express an opinion on these consolidated financial statements based on our audit.
We conducted our audit in accordance with the standards of the Public Company Accounting Oversight Board (United States). Those standards require that we plan and perform the audit to obtain reasonable assurance about whether the financial statements are free of material misstatement. An audit includes examining, on a test basis, evidence supporting the amounts and disclosures in the financial statements. An audit also includes assessing the accounting principles used and significant estimates made by management, as well as evaluating the overall financial statement presentation. We believe that our audit provides a reasonable basis for our opinion.
In our opinion, the consolidated financial statements referred to above present fairly, in all material respects, the financial position of Comtech Group, Inc and subsidiaries as of December 31, 2006, and the results of their operations and their cash flows for the year ended December 31, 2006 in conformity with U.S. generally accepted accounting principles.
The accompanying consolidated financial statements as of and for the year ended December 31, 2006 have been translated into United States dollars solely for the convenience of the reader. We have audited the translation and, in our opinion, such consolidated financial statements expressed in Renminbi have been translated into United States dollars on the basis set forth in Note 2(c) to the consolidated financial statements.
As discussed in note 2(n) to the consolidated financial statements, on January 1, 2006, the Company adopted Statement of Financial Accounting Standards (“SFAS”) No.123(Revised 2004),“Share-Based Payment”,using the modified prospective method, representing a change in the Company’s method of accounting for stock-based compensation.
We also have audited, in accordance with the standards of the Public Company Accounting Oversight Board (United States), the effectiveness of Comtech Group, Inc.’s internal control over financial reporting as of December 31, 2006, based on criteria established inInternal Control-Integrated Framework issued by the Committee of Sponsoring Organizations of the Treadway Commission (COSO), and our report dated March 16, 2007 expressed an unqualified opinion on management’s assessment of, and the effective operation of, internal control over financial reporting.
KPMG
Hong Kong, China
March 16, 2007
F-4
REPORT OF INDEPENDENT REGISTERED PUBLIC ACCOUNTING FIRM
TO THE BOARD OF DIRECTORS AND SHAREHOLDERS OF COMTECH GROUP, INC.
We have audited the accompanying consolidated balance sheets of Comtech Group, Inc. and its subsidiaries (the “Company”) as of December 31, 2005 and the related consolidated statements of operations, shareholders’ equity and other comprehensive income, and cash flows for each of the two years in the period ended December 31, 2005. These consolidated financial statements are the responsibility of the Company’s management. Our responsibility is to express an opinion on these financial statements based on our audits.
We conducted our audit in accordance with the standards of the Public Company Accounting Oversight Board (United States). Those standards require that we plan and perform the audit to obtain reasonable assurance about whether the financial statements are free of material misstatement. The Company is not required to have, nor were we engaged to perform, an audit of its internal control over financial reporting. Our audit included consideration of internal control over financial reporting as a basis for designing audit procedures that are appropriate in the circumstances, but not for the purpose of expressing an opinion on the effectiveness of the Company’s internal control over financial reporting. Accordingly, we express no such opinion. An audit also includes examining, on a test basis, evidence supporting the amounts and disclosures in the financial statements, assessing the accounting principles used and significant estimates made by management, as well as evaluating the overall financial statement presentation. We believe that our audit provides a reasonable basis for our opinion.
In our opinion, such consolidated financial statements present fairly, in all material respects, the financial position of the Company as of December 31, 2005 and the results of its operations and its cash flows for each of the two years in the period ended December 31, 2005 in conformity with accounting principles generally accepted in the United States of America.
Deloitte Touche Tohmatsu
Certified Public Accountants
Hong Kong
March 23, 2006
F-5
COMTECH GROUP, INC.
CONSOLIDATED BALANCE SHEETS
(in thousands, except shares and per share amounts)
| | | | | | | | | | | |
| | | | | At December 31, | |
| | | Note | | 2006 | | | 2006 | | | 2005 | |
| | | | | USD | | | RMB | | | RMB | |
| ASSETS | | | | | | | | | | | |
| | | | |
Current assets: | | | | | | | | | | | |
Cash | | | | 48,071 | | | 375,147 | | | 177,098 | |
Pledged bank deposits | | 9 | | 7,101 | | | 55,416 | | | 40,692 | |
Accounts receivable, net of allowance for doubtful accounts | | 3 | | 35,698 | | | 278,589 | | | 267,543 | |
Bills receivable | | 4 | | 4,074 | | | 31,797 | | | 54,905 | |
Prepaid expenses and other receivables | | | | 1,826 | | | 14,254 | | | 9,657 | |
Amount due from a minority stockholder | | | | — | | | — | | | 468 | |
Inventories | | 5 | | 9,221 | | | 71,959 | | | 110,763 | |
| | | | | | | | | | | |
Total current assets | | | | 105,991 | | | 827,162 | | | 661,126 | |
| | | | |
Property and equipment, net | | 6 | | 1,588 | | | 12,395 | | | 6,904 | |
Intangible assets, net | | 8 | | 2,502 | | | 19,528 | | | — | |
Investment in an affiliated company | | 7 | | 53 | | | 416 | | | — | |
Goodwill | | 8 | | 5,983 | | | 46,692 | | | — | |
Other assets | | | | 116 | | | 905 | | | 905 | |
| | | | | | | | | | | |
| | | | |
TOTAL ASSETS | | | | 116,233 | | | 907,098 | | | 668,935 | |
| | | | | | | | | | | |
| | | | |
LIABILITIES AND STOCKHOLDERS’ EQUITY | | | | | | | | | | | |
| | | | |
Current liabilities: | | | | | | | | | | | |
Trade accounts payable | | | | 14,636 | | | 114,217 | | | 104,308 | |
Bank borrowings | | 9 | | 3,879 | | | 30,272 | | | 35,779 | |
Amounts due to related parties | | | | 195 | | | 1,522 | | | 1,816 | |
Income taxes payable | | 10 | | 1,188 | | | 9,270 | | | 2,524 | |
Accrued expenses and other liabilities | | 11 | | 11,052 | | | 86,253 | | | 9,350 | |
| | | | | | | | | | | |
Total current liabilities | | | | 30,950 | | | 241,534 | | | 153,777 | |
| | | | | | | | | | | |
Minority interests | | | | 210 | | | 1,646 | | | 8,599 | |
| | | | | | | | | | | |
Stockholders’ equity: | | | | | | | | | | | |
Common stock (USD0.01 par value | | | | | | | | | | | |
- authorized 200,000,000 shares; issued and outstanding 32,971,901 shares in 2006 and 31,445,058 shares in 2005) | | | | 349 | | | 2,725 | | | 2,602 | |
Additional paid-in capital | | | | 51,604 | | | 402,721 | | | 358,775 | |
Retained earnings | | | | 35,352 | | | 275,890 | | | 152,615 | |
Accumulated other comprehensive loss | | | | (2,232 | ) | | (17,418 | ) | | (7,433 | ) |
| | | | | | | | | | | |
| | | | |
Total stockholders’ equity | | | | 85,073 | | | 663,918 | | | 506,559 | |
| | | | | | | | | | | |
| | | | |
Commitments and contingencies | | 17 | | | | | | | | | |
| | | | |
TOTAL LIABILITIES AND STOCKHOLDERS’ EQUITY | | | | 116,233 | | | 907,098 | | | 668,935 | |
| | | | | | | | | | | |
See accompanying notes to consolidated financial statements.
F-6
COMTECH GROUP, INC.
CONSOLIDATED STATEMENTS OF OPERATIONS
(in thousands, except shares and per share amounts)
| | | | | | | | | | | | | | |
| | | Note | | 2006 | | | 2006 | | | 2005 | | | 2004 | |
| | | | | USD | | | RMB | | | RMB | | | RMB | |
Net sales | | | | | | | | | | | | | | |
Product revenue | | 15 | | 162,629 | | | 1,269,176 | | | 866,332 | | | 625,656 | |
Services revenue | | 15 | | 6,969 | | | 54,387 | | | — | | | — | |
| | | | | | | | | | | | | | |
| | | | 169,598 | | | 1,323,563 | | | 866,332 | | | 625,656 | |
| | | | | |
Cost of sales | | | | | | | | | | | | | | |
Cost of goods sold | | | | (133,642 | ) | | (1,042,951 | ) | | (714,881 | ) | | (530,800 | ) |
Cost of services | | | | (4,347 | ) | | (33,928 | ) | | — | | | — | |
| | | | | | | | | | | | | | |
| | | | (137,989 | ) | | (1,076,879 | ) | | (714,881 | ) | | (530,800 | ) |
| | | | | | | | | | | | | | |
Gross profit | | | | 31,609 | | | 246,684 | | | 151,451 | | | 94,856 | |
Selling, general and administrative | | | | | | | | | | | | | | |
expenses | | | | (11,544 | ) | | (90,097 | ) | | (38,970 | ) | | (21,092 | ) |
Research and development expenses | | | | (3,585 | ) | | (27,977 | ) | | (15,837 | ) | | (6,121 | ) |
Other operating income | | | | 24 | | | 185 | | | 180 | | | 1,110 | |
| | | | | | | | | | | | | | |
Income from operations | | | | 16,504 | | | 128,795 | | | 96,824 | | | 68,753 | |
Gain on disposal of a subsidiary | | 12 | | 855 | | | 6,673 | | | — | | | — | |
Interest expense | | | | (371 | ) | | (2,896 | ) | | (1,762 | ) | | (2,156 | ) |
Interest income | | | | 942 | | | 7,352 | | | 2,493 | | | 38 | |
| | | | | | | | | | | | | | |
Income before income taxes and minority interests | | | | 17,930 | | | 139,924 | | | 97,555 | | | 66,635 | |
Income taxes | | 10 | | (1,423 | ) | | (11,104 | ) | | (6,736 | ) | | (2,300 | ) |
| | | | | | | | | | | | | | |
Income before minority interests | | | | 16,507 | | | 128,820 | | | 90,819 | | | 64,335 | |
Minority interests in income of consolidated subsidiaries | | | | (711 | ) | | (5,545 | ) | | (3,977 | ) | | (2,133 | ) |
| | | | | | | | | | | | | | |
| | | | | |
Net income | | | | 15,796 | | | 123,275 | | | 86,842 | | | 62,202 | |
| | | | | | | | | | | | | | |
Earnings per share | | | | | | | | | | | | | | |
Basic | | 14 | | 0.49 | | | 3.83 | | | 3.08 | | | 2.87 | |
| | | | | | | | | | | | | | |
Diluted | | 14 | | 0.47 | | | 3.64 | | | 2.94 | | | 2.84 | |
| | | | | | | | | | | | | | |
Weighted average number of common shares outstanding | | | | | | | | | | | | | | |
Basic | | 14 | | 32,200,044 | | | 32,200,044 | | | 28,168,274 | | | 21,690,560 | |
| | | | | | | | | | | | | | |
Diluted | | 14 | | 33,829,519 | | | 33,829,519 | | | 29,507,939 | | | 21,885,053 | |
| | | | | | | | | | | | | | |
See accompanying notes to consolidated financial statements.
F-7
COMTECH GROUP, INC.
CONSOLIDATED STATEMENTS OF STOCKHOLDERS' EQUITY
AND COMPREHENSIVE INCOME
(in thousands, except shares and per share amounts)
| | | | | | | | | | | | | | |
| | | Common stock | | Additional
paid-in
capital RMB | | Deferred
stock-based
compensation RMB | | Retained
earnings RMB | | Accumulated
other
comprehensive
loss RMB | | Total
stockholders’
equity RMB |
| | | Number of shares | | RMB | | | | | |
Balance at January 1, 2004 | | 20,251,075 | | 1,676 | | 12,407 | | — | | 3,571 | | — | | 17,654 |
Net income | | — | | — | | — | | — | | 62,202 | | — | | 62,202 |
Common stock held by Trident’s stockholders | | 1,959,950 | | 162 | | 162 | | — | | — | | — | | 324 |
Recapitalization in connection with the share exchange transaction | | — | | — | | 23,181 | | — | | — | | — | | 23,181 |
Deferred stock-based compensation | | — | | — | | 348 | | (348) | | — | | — | | — |
Amortization of deferred stock-based compensation | | — | | — | | — | | 101 | | — | | — | | 101 |
Issuance of common stock in connection with private placement | | 3,150,000 | | 261 | | 82,285 | | — | | — | | — | | 82,546 |
| | | | | | | | | | | | | | |
| | | | | | | |
Balance at December 31, 2004 | | 25,361,025 | | 2,099 | | 118,383 | | (247) | | 65,773 | | — | | 186,008 |
| | | | | | | |
Net income | | — | | — | | — | | — | | 86,842 | | — | | 86,842 |
Foreign currency translation adjustments | | — | | — | | — | | — | | — | | (7,433) | | (7,433) |
| | | | | | | | | | | | | | |
Comprehensive income | | — | | — | | — | | — | | — | | — | | 79,409 |
Issuance of common stock on exercise of warrants | | 171,873 | | 14 | | — | | — | | — | | — | | 14 |
Amortization of deferred stock-based compensation | | — | | — | | — | | 247 | | — | | — | | 247 |
Issuance of common stock in connection with public offering | | 5,912,160 | | 489 | | 240,392 | | — | | — | | — | | 240,881 |
| | | | | | | | | | | | | | |
| | | | | | | |
Balance at December 31, 2005 | | 31,445,058 | | 2,602 | | 358,775 | | — | | 152,615 | | (7,433) | | 506,559 |
| | | | | | | |
Net income | | — | | — | | — | | — | | 123,275 | | — | | 123,275 |
Foreign currency translation adjustments | | — | | — | | — | | — | | — | | (9,985) | | (9,985) |
| | | | | | | | | | | | | | |
| | | | | | | |
Comprehensive income | | — | | — | | — | | — | | — | | — | | 113,290 |
| | | | | | | |
Issuance of common stock on exercise of warrants and options | | 1,635,482 | | 132 | | 37,851 | | — | | — | | — | | 37,983 |
| | | | | | | |
Repurchase of shares issued under stock option exercises | | (108,639) | | (9) | | (13,934) | | — | | — | | — | | (13,943) |
| | | | | | | |
Stock-based compensation | | — | | — | | 20,029 | | — | | — | | — | | 20,029 |
| | | | | | | | | | | | | | |
| | | | | | | |
Balance at December 31, 2006 | | 32,971,901 | | 2,725 | | 402,721 | | — | | 275,890 | | (17,418) | | 663,918 |
| | | | | | | | | | | | | | |
Balance at December 31, 2006 (in USD) | | | | USD 349 | | USD 51,604 | | USD — | | USD 35,352 | | USD(2,232) | | USD 85,073 |
| | | | | | | | | | | | | | |
See accompanying notes to consolidated financial statements.
F-8
COMTECH GROUP, INC.
CONSOLIDATED STATEMENTS OF CASH FLOWS
(in thousands)
| | | | | | | | | | | | |
| | | Years ended December 31, | |
| | | 2006 | | | 2006 | | | 2005 | | | 2004 | |
| | | USD | | | RMB | | | RMB | | | RMB | |
Cash flows from operating activities: | | | | | | | | | | | | |
Net income | | 15,796 | | | 123,275 | | | 86,842 | | | 62,202 | |
Adjustments to reconcile net income to net cash used in operating activities: | | | | | | | | | | | | |
Depreciation expense | | 302 | | | 2,359 | | | 974 | | | 913 | |
Amortization of intangible assets | | 89 | | | 695 | | | — | | | — | |
Loss on disposal of property and equipment | | 12 | | | 94 | | | — | | | — | |
Gain on disposal of subsidiary | | (855 | ) | | (6,673 | ) | | — | | | — | |
Minority interests | | 711 | | | 5,545 | | | 3,977 | | | 2,133 | |
Stock-based compensation | | 2,566 | | | 20,029 | | | 247 | | | 101 | |
Changes in current assets and liabilities, net of effects of acquisitions and dispositions: | | | | | | | | | | | | |
Accounts receivable | | (692 | ) | | (5,398 | ) | | (100,086 | ) | | (71,588 | ) |
Prepaid expenses and other receivables | | (1,073 | ) | | (8,377 | ) | | (7,509 | ) | | 5,380 | |
Bill receivables | | 2,897 | | | 22,608 | | | 22,433 | | | (64,032 | ) |
Inventories | | 3,443 | | | 26,870 | | | (94,860 | ) | | 4,136 | |
Trade accounts payable | | 767 | | | 5,984 | | | 51,403 | | | 1,386 | |
Amounts due to related parties | | (38 | ) | | (294 | ) | | (376 | ) | | 600 | |
Income taxes payable | | 666 | | | 5,198 | | | 1,037 | | | 585 | |
Accrued expenses and other liabilities | | 1,400 | | | 10,923 | | | 844 | | | (2,155 | ) |
| | | | | | | | | | | | |
Net cash used in operating activities | | 25,991 | | | 202,838 | | | (35,074 | ) | | (60,339 | ) |
| | | | |
Cash flows from investing activities: | | | | | | | | | | | | |
Decrease in pledged bank deposits | | (2,057 | ) | | (16,055 | ) | | (40,692 | ) | | — | |
Purchases of property and equipment | | (963 | ) | | (7,514 | ) | | (4,561 | ) | | (1,033 | ) |
Proceeds from disposal of property and equipment | | 1 | | | 5 | | | — | | | — | |
Payment for acquisitions of subsidiaries, net of cash acquired | | (1,629 | ) | | (12,709 | ) | | — | | | (906 | ) |
Investment in an affiliated company | | (54 | ) | | (421 | ) | | — | | | — | |
Net proceeds from disposal of subsidiaries | | 3,555 | | | 27,742 | | | — | | | — | |
(Increase)/decrease in other assets | | — | | | — | | | (905 | ) | | 344 | |
| | | | | | | | | | | | |
Net cash used in investing activities | | (1,147 | ) | | (8,952 | ) | | (46,158 | ) | | (1,595 | ) |
| | | | | | | | | | | | |
Cash flow from financing activities: | | | | | | | | | | | | |
Proceeds from issuance of common stock (net of transaction cost) | | — | | | — | | | 234,695 | | | 84,036 | |
Net cash from share exchange transaction (net of transaction cost) | | — | | | — | | | — | | | 26,695 | |
Proceeds from exercises of stock warrants and options | | 4,867 | | | 37,983 | | | — | | | — | |
Payments for repurchase of shares issued under stock options exercises | | (1,786 | ) | | (13,943 | ) | | — | | | — | |
Proceeds from new bank borrowings | | — | | | — | | | — | | | 53,707 | |
Repayment of bank borrowings | | (808 | ) | | (6,305 | ) | | (17,377 | ) | | — | |
Repayment of amount due to holding company | | — | | | — | | | — | | | (50,356 | ) |
Dividend paid | | — | | | — | | | — | | | (41,387 | ) |
Contribution from minority interest | | 424 | | | 3,309 | | | — | | | — | |
Dividend paid to minority interest | | (1,169 | ) | | (9,124 | ) | | — | | | — | |
| | | | | | | | | | | | |
Net cash provided by financing activities | | 1,528 | | | 11,920 | | | 217,318 | | | 72,695 | |
| | | | | | | | | | | | |
Effect of exchange rate changes on cash | | (994 | ) | | (7,757 | ) | | (432 | ) | | — | |
| | | | | | | | | | | | |
Net increase in cash | | 25,378 | | | 198,049 | | | 135,654 | | | 10,761 | |
Cash at beginning of the year | | 22,693 | | | 177,098 | | | 41,444 | | | 30,683 | |
| | | | | | | | | | | | |
Cash at end of the year | �� | 48,071 | | | 375,147 | | | 177,098 | | | 41,444 | |
| | | | | | | | | | | | |
Supplementary disclosures: | | | | | | | | | | | | |
Interest paid | | 371 | | | 2,896 | | | 1,762 | | | 2,156 | |
| | | | | | | | | | | | |
Income taxes paid | | 558 | | | 4,358 | | | 5,661 | | | 1,608 | |
| | | | | | | | | | | | |
See accompanying notes to consolidated financial statements.
F-9
COMTECH GROUP, INC.
NOTES TO CONSOLIDATED FINANCIAL STATEMENTS
(in thousands, except shares and per share amounts)
| 1. | ORGANIZATION AND NATURE OF OPERATIONS |
Comtech Group, Inc. (the “Company”), formerly Trident Rowan Group Inc. (the “Parent”), and its subsidiaries (together, the "Group") are principally engaged in the sale of component parts for electronic devices and equipment such as liquid crystal display, cameras, persistent storage, and peripheral devices for wireless handsets and fixed-line telecommunication to manufacturers in the People’s Republic of China (“PRC”) and other overseas countries. The Group also provides technology and engineering, business process outsourcing and other services in the PRC.
On May 25, 2004, the Parent entered into a share exchange agreement (the "Share Exchange Agreement") with Comtech Group, a Cayman Islands corporation, pursuant to which the Parent acquired all of the issued and outstanding shares of Comtech Group in exchange for the issuance in the aggregate of 20,251,075 shares of the Parent’s common stock on July 22, 2004. As a result of the transaction, Comtech Group became a wholly-owned subsidiary of the Parent and because the former stockholders of Comtech Group acquired approximately 91.2% of the Parent's outstanding stock, this acquisition was accounted for as a reverse acquisition in which Comtech Group was deemed to be the accounting acquirer and the Parent the legal acquirer. The Parent changed its name to Comtech Group, Inc. on August 2, 2004.
Accordingly, the historical consolidated financial statements of the Company for periods prior to the date of the transaction are those of Comtech Group, as the accounting acquirer, and all references to the consolidated financial statements of the Company apply to the historical financial statements of Comtech Group prior to the transaction and the consolidated financial statements of the Company subsequent to the transaction. The Company's shares have been restated retroactively to reflect the share exchange ratio as at the date of the transaction in a manner similar to a stock split.
As a part of the Share Exchange Agreement, the Company assumed fully vested options previously issued by the Parent to purchase 115,000 shares of common stock with an exercise price of USD 3.00 per share. Additionally, the Company assumed 925,417 fully exercisable common stock warrants previously issued by the Parent. Each warrant represents the right to receive 1 share of the Company's common stock, at an exercise price of USD3.00 per share for 484,452 common stock warrants and USD2.50 per share for 440,965 common stock warrants. The options and warrants assumed from the Parent will expire on July 1, 2009.
On January 14, 2005, the Company's board of directors approved a one-for-two reverse stock split of common stock of the Company. All per share amounts and outstanding shares, including all common stock equivalents (stock options and warrants), have been retroactively restated for all periods presented to reflect the reverse stock split.
On July 20, 2005, the Company publicly sold 5,912,160 shares of the Company's common stock at USD5.1425 per share, after underwriting discounts and commissions, for gross proceeds of approximately RMB245,000 (USD30,000).
F-10
COMTECH GROUP, INC.
NOTES TO CONSOLIDATED FINANCIAL STATEMENTS
(in thousands, except shares and per share amounts)
| 1. | ORGANIZATION AND NATURE OF OPERATIONS - continued |
As of December 31, 2006, the subsidiaries of the Company include the following:
| | | | | | |
Name of company | | Place and date of incorporation/
establishment | | Attributable equity interest
held | | Principal activity |
Alphalink Global Limited | | BVI November 23, 2004 | | 100% | | Investment holding |
| | | |
COGO Engineering Services Limited (previously known as "Huameng Engineering Services Limited”) (“Huameng BVI”) | | British Virgin Islands ("BVI") December 8, 2005 | | 51.12% | | Investment holding (note b) |
| | | |
Comloca Technology (Shenzhen) Company Limited ("Comloca") | | People’s Republic of China (“PRC”) November 3, 2005 | | 60% | | Location-based search business |
| | | |
Comtech Broadband Corporation Limited ("Comtech Broadband") | | Hong Kong March 23, 2005 | | 55% | | Sales of electronics components and related products |
| | | |
Comtech (China) Holding Limited ("Comtech China") | | BVI May 27, 2002 | | 100% | | Investment holding |
| | | |
Comtech Communication Technology (Shenzhen) Company Limited ("Comtech Communication") | | PRC July 23, 2002 | | 100% | | Sales of electronics components and related products |
| | | |
Comtech Group | | Cayman Islands April 26, 2002 | | 100% | | Investment holding |
| | | |
Comtech (Hong Kong) Holding Limited ("Comtech Holding") | | BVI May 27, 2002 | | 100% | | Investment holding |
| | | |
Comtech International (Hong Kong) Limited ("Comtech Hong Kong") | | Hong Kong July 14, 2000 | | 100% | | Sales of electronics components and related products |
| | | |
Comtech Software Technology (Shenzhen) Company Limited ("Comtech Software") | | PRC March 18, 2004 | | 100% | | Sales of electronics components and related products and research and development of software products |
| | | |
Comtech Wireless Limited ("Comtech Wireless") | | BVI July 7, 2005 | | 60% | | Investment holding |
| | | |
OAM S.p.A. ("OAM") | | Italy | | 98.6% | | Non-operating subsidiary |
| | | |
Reliable Group Limited | | BVI January 7, 2005 | | 100% | | Investment holding |
| | | |
Shenzhen Comtech International Limited ("Shenzhen Comtech") | | PRC July 4, 1996 | | 100% | | Sales of electronics components and related products (note a) |
| | | | | | |
| | | |
Shanghai E&T System Company Limited ("Shanghai E & T") | | PRC June 5, 2003 | | 100% | | Sales of electronics components and related products (notes a and b) |
| | | |
Shenzhen Huameng Software Company Limited (“Huameng PRC”) business process | | PRC November 26, 2003 | | 51.12% | | Provision of technology and engineering services, outsourcing, network system integration and related training and maintenance services (note b) |
F-11
COMTECH GROUP, INC.
NOTES TO CONSOLIDATED FINANCIAL STATEMENTS
(in thousands, except shares and per share amounts)
| 1. | ORGANIZATION AND NATURE OF OPERATIONS - continued |
| | | | | | |
Name of company | | Place and date of incorporation/ establishment | | Attributable equity interest held | | Principal activity |
| Viewtran Technology Limited (“Viewtran Cayman”) | | Cayman Islands December 2, 2002 | | 100% | | Investment holding (note b) |
| | | |
| Viewtran Technology (Shenzhen) Co., Limited (“Viewtran PRC”) | | PRC July 12, 2000 | | 100% | | Provision of media communication and collaboration platforms and solutions |
| | | | | | (note b) |
| | |
Note a | | The Company exercises its control over Shenzhen Comtech, which in turn, has a controlling interest in Shanghai E&T, through a declaration of trust dated December 30, 2003 (“Declaration of Trust”) entered into between the Comtech China, a wholly-owned subsidiary of the Company, and Shenzhen Comtech’s legal shareholders (“Legal Shareholders”), Jeffrey Kang, who is the principal shareholder and chief executive officer, and his wife, Nan Ji. Pursuant to the Declaration of Trust, the Legal Shareholders transferred their 100% equity interest in Shenzhen Comtech to Comtech China that was accounted as a business combination under common control and agreed to hold the equity interest in Shenzhen Comtech on behalf of Comtech China and waive their full rights and risks of ownership of the equity interests in favor of Comtech China. In 2005, Nan Ji, executed an agreement to transfer her 70% equity interest in Shenzhen Comtech to Jeffrey Kang and her 1 % equity interest in Shenzhen Comtech to Huimo Chen, the mother of Jeffrey Kang, who is a PRC citizen. In 2006, Jeffrey Kang executed an agreement to transfer his 99% equity interest in Shenzhen Comtech to Honghui Li, Vice President of the Group, who is a PRC citizen. Huimo Chen and Honghui Li have also entered into and bound by similar legal arrangements with Comtech China relating to holding of the equity interest in Shenzhen Comtech on behalf of Comtech China and waiving their full rights and risks of ownership of the equity interests in favor of Comtech China. In addition, Shenzhen Comtech and Honghui Li entered into and bound by similar legal arrangements with Comtech China relating to holding of 35% and 5% equity interest in Shanghai E&T on behalf of Comtech China and waived their full rights and risks of ownership of the equity interests in favor of Comtech China, respectively. |
| |
Note b | | Details of the acquisition of Huameng BVI, Huameng PRC, Shanghai E&T, Viewtran Cayman and Viewtran PRC are set out in note 8. |
| 2. | SUMMARY OF SIGNIFICANT ACCOUNTING POLICIES |
The accompanying consolidated financial statements have been prepared in accordance with U.S. generally accepted accounting principles (“U.S. GAAP”).
| | (a) | Principle of Consolidation |
The consolidated financial statements include the accounts of Comtech Group, Inc. and its majority owned subsidiaries. All significant inter-company balances and transactions have been eliminated in consolidation. In addition, the Group also consolidated any variable interest entities (“VIE’s”) of which it is the primary beneficiary, as defined by Financial Accounting Standards Board (“FASB”) Interpretation No. 46 (R) Consolidation of Variable Interest Entities an interpretation of ARB No. 51(“FIN 46R”).
The preparation of the consolidated financial statements in conformity with U.S. generally accepted accounting principles requires management of the Group to make a number of estimates and assumptions relating to the reported amounts of assets and liabilities and the disclosure of contingent assets and liabilities at the date of the consolidated financial statements and the reported amounts of revenues and expenses during the period. Significant items subject to such estimates and assumptions include the carrying amount of property, plant and equipment, goodwill and intangible assets; valuation allowances for doubtful receivables and deferred tax assets; valuation of share-based compensation; depreciation and amortizable lives; recoverability of inventories; and amounts recorded for contingencies. These estimates are often based on complex judgments and assumptions that management believe to be reasonable but are inherently uncertain and unpredictable. Actual results may differ from those estimates.
F-12
COMTECH GROUP, INC.
NOTES TO CONSOLIDATED FINANCIAL STATEMENTS
(in thousands, except shares and per share amounts)
| 2. | SUMMARY OF PRINCIPAL ACCOUNTING POLICIES - continued |
| (c) | Foreign Currency Transactions and Translation |
Transactions denominated in currencies other than the functional currency are translated into the functional currency at the exchange rates prevailing at the dates of the transaction. Monetary assets and liabilities denominated in currencies other than the functional currency are translated into the functional currency using the applicable exchange rates at the balance sheet dates. The resulting exchange differences are recorded in the consolidated statement of operations.
The Group’s reporting currency is the Renminbi (“RMB”). The functional currency of the Company’s subsidiaries in the PRC is the RMB as the PRC is primary economic environment in which these entities operate.
The functional currency of the Company is the US dollar (“USD”). In addition, the functional currency of the Company’s subsidiaries in Hong Kong is the Hong Kong dollar (“HKD”). Assets and liabilities of the Company and its subsidiaries whose functional currency is not the RMB are translated into RMB, in accordance with Statement of Financial Accounting Standards (“SFAS”) No 52, Foreign Currency Translation, using the exchange rate on the balance sheet date. Revenues and expenses are translated at average rates prevailing during the year. The gains and losses resulting from translation of financial statements of foreign subsidiaries are recorded as a separate component of accumulated other comprehensive income within stockholders’ equity.
For the U.S. dollar convenience translation amounts included in the accompanying consolidated financial statements, the RMB amounts were translated into USD at the rate of USD1.00 = RMB7.8041, representing the rate quoted by the People’s Bank of China at the close of business on December 29, 2006. No representation is made that the RMB amounts could have been, or could be, converted into USD at that rate or at any particular rate or at all.
| (d) | Cash and Pledged Bank Deposits |
Cash consists of cash on hand, cash in bank accounts and interest-bearing savings accounts. Cash deposits that are restricted as to withdrawal or pledged as security, are disclosed separately on the face of the consolidated balance sheet, and not included in the cash total for the purpose of the consolidated statements of cash flow.
| (e) | Trade Accounts Receivable |
Trade accounts receivable are recorded at the invoiced amount and do not bear interest. The allowance for doubtful accounts is the Group’s best estimate of the amount of probable credit losses in the Group’s existing accounts receivable. The Group determines the allowance based on a review of specifically identified accounts and ageing data. The Group reviews its allowance for doubtful accounts monthly. Past due balances over 90 days and over a specified amount are reviewed individually for collectibility. All other balances are reviewed on a pooled basis.
Account balances are charged off against the allowance after all means of collection have been exhausted and the potential for recovery is considered remote. The Company’s subsidiaries in the PRC are required to comply with local tax requirements on the write-offs of doubtful accounts, which allow for such write-offs only when sufficient evidence is available to prove the debtors’ inability to make payments. For financial reporting purposes, the Group generally records write-offs of doubtful accounts at the same time the local tax requirements for the write-offs are met. As a result, there may be time lags between the time when a provision for doubtful accounts is provided and the time the doubtful accounts and the related allowance are written off.
Apart from those disclosed in note 17(c), the Group does not have any off balance-sheet credit exposure related to its customers.
Inventories are stated at the lower of cost or market. Cost is determined by the first-in, first-out method. Cost of inventories comprises direct materials.
F-13
COMTECH GROUP, INC.
NOTES TO CONSOLIDATED FINANCIAL STATEMENTS
(in thousands, except shares and per share amounts)
| 2. | SUMMARY OF PRINCIPAL ACCOUNTING POLICIES - continued |
Property and Equipment and Intangible Assets
Property and equipment are stated at cost. Depreciation is calculated on a straight-line method over the estimated useful lives of the assets. The estimated useful lives are as follows:
| | |
| Office unit | | 20 years |
| Machinery | | 5 years |
| Furniture and office equipment | | 5 years |
| Motor vehicles | | 5 years |
Intangible assets with estimable useful lives are amortized over their respective estimated useful lives to their estimated residual values. The estimated useful lives are as follows:
| | |
| Customer relationships | | 5 years |
| Proprietary technology | | 3 years |
| Software assets | | 3 years |
| License agreements | | 2 years |
| Non-compete agreements | | 1 year |
In accordance with SFAS No. 144,Accounting for Impairment or Disposal of Long-Lived Assets (“SFAS No. 144”), long-lived assets, such as property and equipment, and purchased intangible assets subject to amortization, are reviewed for impairment whenever events or changes in circumstances indicate that the carrying amount of an asset may not be recoverable. Recoverability of assets to be held and used is measured by a comparison of the carrying amount of an asset to estimated undiscounted future cash flows expected to be generated by the asset. If the carrying amount of an asset exceeds its estimated future cash flows, an impairment charge is recognized by the amount by which the carrying amount of the asset exceeds the fair value of the asset. Assets to be disposed of are separately presented in the balance sheet and reported at the lower of the carrying amount or fair value less costs to sell, and are no longer depreciated. The assets and liabilities of a disposal group classified as held for sale are presented separately in the appropriate asset and liability sections of the balance sheet.
Goodwill
Goodwill represents the excess of costs over fair value of assets of businesses acquired. Goodwill is not amortized, but instead tested for impairment at least annually in accordance with the provisions of SFAS No. 142,Goodwill and Other Intangible Assets.
Goodwill is tested for impairment more frequently if events and circumstances indicate that the asset might be impaired. This determination is made at the reporting unit level and consists of two steps. First the Group determines the fair value of a reporting unit and compares it to the reporting unit’s carrying amount, including goodwill. Second, if the carrying amount of a reporting unit exceeds its fair value, an impairment loss is recognized for any excess of the carrying amount of the reporting unit’s goodwill over the implied fair value of that goodwill. The implied fair value of goodwill is determined by allocating the fair value of the reporting unit in a manner similar to a purchase price allocation. The residual fair value after this allocation is the implied fair value of the reporting unit goodwill.
| (h) | Investment in an Affiliated Company |
An investment in an affiliated company is an entity in which the Group has significant influence, but not control , over its management, including participation in the financial and operating policy decisions.
An investment in an affiliated company is accounted for in the consolidated financial statements under the equity method and is initially recorded at cost and adjusted thereafter for the Group’s share of the affiliate’s income and losses. When the Group’s share of losses exceeds its interest in the affiliate, the Group’s interest is reduced to nil and recognition of further losses is discontinued.
F-14
COMTECH GROUP, INC.
NOTES TO CONSOLIDATED FINANCIAL STATEMENTS
(in thousands, except shares and per share amounts)
| 2. | SUMMARY OF PRINCIPAL ACCOUNTING POLICIES - continued |
Income taxes are accounted for under the asset and liability method. Deferred tax assets and liabilities are recognized for the future tax consequences attributable to differences between the financial statement carrying amounts of existing assets and liabilities and their respective tax bases and operating loss and tax credit carry forwards. Deferred tax assets and liabilities are measured using enacted tax rates expected to apply to taxable income in the years in which those temporary differences are expected to be recovered or settled. The effect on deferred tax assets and liabilities of a change in tax rates is recognized in income in the period that includes the enactment date.
Sales of Components
The Company recognizes revenue when the components are delivered and the customer takes ownership and assumes risk of loss, collections of the relevant receivable is probable, persuasive evidence of an arrangement exists and the sales price is fixed or determinable.
Sales of components represent the invoiced value of goods, net of value added taxes (“VAT”), sales returns, trade discounts and allowances.
In the PRC, VAT at a general rate of 17% on invoice amount is collected on behalf of tax authorities in respect of the sales of products and is not recorded as revenue. VAT collected from customers, net of VAT paid for purchases, is recorded as a liability in the consolidated balance sheets until it is paid to the authorities.
Certain PRC subsidiaries of the Company are eligible to receive a refund of a portion of the VAT paid to the local tax authority. The refund is reported as other revenue in the consolidated statements of income, as it is akin to a government operating subsidy, and is recognized as revenue upon receipt since the refund amount is discretionary and the amount varies year to year based on the availability of government funds as determined by the local tax authority.
Engineering Services
Revenue for services is generally recognized when services are performed.
| (k) | Research and Development and Advertising |
Research and development and advertising costs are expensed as incurred. Research and development costs amounted to RMB26,924 (USD4,336), RMB15,837 and RMB6,121 for the years ended December 31, 2006, 2005 and 2004, respectively. Advertising costs amounted to RMB2,257 (USD289), RMB1,210 and RMB1,200 for the years ended December 31, 2006, 2005 and 2004 respectively.
| (l) | Shipping and handling fees and costs |
Costs incurred by the Group for shipping and handling, including costs paid to third-party transportation companies, to transport and deliver products to customers, are included in “Selling expenses”. Shipping and handling fees and costs amounted to RMB5,184 (USD664), RMB3,351 and RMB1,581 for the years ended December 31, 2006, 2005 and 2004, respectively.
Other comprehensive income refers to revenues, expenses, gains and losses that under U.S. GAAP are included in comprehensive income but are excluded from net income as these amounts are recorded as a component of stockholders’ equity. The Company’s other comprehensive income represented foreign currency translation adjustment.
| (n) | Stock-based Compensation |
Prior to 2006, the Group applied the intrinsic value method as allowed in SFAS No. 123,Accounting for Stock Based Compensation (“SFAS No. 123”), and related interpretations, in accounting for stock options. Under the intrinsic value method, compensation cost for stock options is measured as the excess, if any, of the quoted market price of the Company’s common stock at the date of the grant over the amount an employee must pay to acquire the stock. Compensation cost is recognized on a straight line basis over the requisite service period, which is generally the same as the vesting period.
F-15
COMTECH GROUP, INC.
NOTES TO CONSOLIDATED FINANCIAL STATEMENTS
(in thousands, except shares and per share amounts)
| 2. | SUMMARY OF PRINCIPAL ACCOUNTING POLICIES - continued |
| (n) | Stock-based Compensation - continued |
Effective January 1, 2006, the Group adopted SFAS No. 123R,Share-Based Payment (“SFAS No. 123R”). SFAS No. 123R replaces SFAS No. 123. SFAS No. 123R requires that all stock-based compensation be recognized as an expense in the consolidated financial statements and that such cost be measured at the fair value of the award and requires compensation cost to reflect estimated forfeitures. SFAS No. 123R was adopted using the modified prospective method of application. Under this method, the Group recorded stock-based compensation expense for awards granted prior to, but not yet vested as of January 1, 2006 and for stock-based awards granted after January 1, 2006. Compensation cost is recognized on a straight line basis over the requisite service period, which is generally the same as the vesting period.
The Company currently uses authorized and unissued shares to satisfy share award exercises.
The adoption of SFAS No. 123R effective January 1, 2006, resulted in recognition of incremental stock-based compensation expense of RMB20,029 (USD2,566) for the year ended December 31, 2006. Since stock-based compensation is not tax deductible in the PRC and the Company does not generate any taxable income in the United States, no related tax benefit has been recognized.
The following table illustrates the effect on net income for the years ended December 31, 2005 and 2004 as if the Group had applied the fair value recognition provisions of SFAS No. 123 to options granted under the Company’s stock plans rather than APB No. 25. No pro forma disclosure has been made for periods following the adoption of SFAS No. 123R on January 1, 2006 as all stock-based compensation has been recognized in net income. For purpose of this pro forma disclosure, the value of the options is estimated using a Black-Scholes option-pricing model and amortized to expense over the options’ service periods with forfeitures recognized as they occurred.
| | | | | | |
| | | 2005 | | | 2004 | |
| | | RMB | | | RMB | |
Net income as reported | | 86,842 | | | 62,202 | |
Share-based employee compensation expense included in reported | | | | | | |
Net income | | 247 | | | 101 | |
Pro forma compensation expense, net of nil tax benefit | | (14,677 | ) | | (2,103 | ) |
| | | | | | |
Pro forma net income | | 72,412 | | | 60,200 | |
| | | | | | |
Earnings per share – basic | | | | | | |
As reported | | 3.08 | | | 2.87 | |
| | | | | | |
Pro forma | | 2.57 | | | 2.78 | |
| | | | | | |
Earnings per share – diluted | | | | | | |
As reported | | 2.94 | | | 2.84 | |
| | | | | | |
Pro forma | | 2.45 | | | 2.75 | |
| | | | | | |
Basic earnings per share is based on the weighted average number of shares of common stock, and with respect to diluted earnings per share, also includes the effect of all dilutive potential common stock outstanding. Dilutive potential common stock results from dilutive stock options and warrants. The effect of such dilutive potential common stock on earnings per share is computed using the treasury stock method.
| (p) | Commitments and Contingencies |
Liabilities for loss contingencies arising from claims, assessments, litigation, fines and other sources are recorded when it is probable that a liability has been incurred and the amount of the assessment can be reasonable estimated.
F-16
COMTECH GROUP, INC.
NOTES TO CONSOLIDATED FINANCIAL STATEMENTS
(in thousands, except shares and per share amounts)
| 2. | SUMMARY OF PRINCIPAL ACCOUNTING POLICIES - continued |
| (q) | Recently Issued Accounting Pronouncements |
In September 2005, the FASB Emerging Issues Task Force (“EITF”) issued EITF Issue No. 04-13,Accounting for Purchases and Sales of Inventory with the Same Counterparty. EITF 04-13 provides guidance as to when purchases and sales of inventory with the same counterparty should be accounted for as a single exchange transaction. EITF 04-13 also provides guidance as to when a nonmonetary exchange of inventory should be accounted for at fair value. EITF 04-13 will be applied to new arrangements entered into, and modification or renewals of existing arrangements occurring after January 1, 2007. The Group does not expect the adoption of EITF 04-13 will have a significant effect on its consolidated financial statements.
In June 2006, the FASB issued Interpretation No. 48,Accounting for Uncertainty in Income Taxes (“FIN 48”). FIN 48 clarifies the accounting for uncertainty in income taxes recognized in the Company’s financial statements in accordance with SFAS No. 109. FIN 48 prescribes a recognition threshold and measurement attributes for the financial statement recognition and measurement of a tax position taken or expected to be taken in a tax return. The provisions of FIN 48 are effective for the fiscal years beginning after December 15, 2006. The Group does not expect that the adoption of FIN 48 will have a significant effect on its consolidated financial statements.
In September 2006, the FASB issued SFAS No. 157,Fair Value Measurements(“SFAS No. 157”),which defines fair value, provides a framework for measuring fair value, and expands the disclosures required for fair value measurements. SFAS No. 157 applies to other accounting pronouncements that require fair value measurements and does not require any new fair value measurements. SFAS No. 157 is effective for fiscal years beginning after November 15, 2007 and is required to be adopted by the Group in fiscal year 2008. Although the Group will continue to evaluate the application of SFAS No. 157, management does not currently believe the adoption of SFAS No. 157 will have a material impact on the Company’s consolidated financial statements.
In February 2007, the FASB issued Statement No. 159,The Fair Value Option for Financial Assets and Financial Liabilities — Including an amendment of FASB Statement No. 115 (“SFAS No 159). SFAS No. 159 permits an entity to elect fair value as the initial and subsequent measurement attribute for many financial assets and liabilities. Entities electing the fair value option would be required to recognize changes in fair value in earnings. Entities electing the fair value option are required to distinguish, on the face of the statement of financial position, the fair value of assets and liabilities for which the fair value option has been elected and similar assets and liabilities measured using another measurement attribute. The Group is required to adopt SFAS No 159 beginning on January 1, 2008. The adjustment to reflect the difference between the fair value and the carrying amount would be accounted for as a cumulative-effect adjustment to retained earnings as of the date of initial adoption. Although the Group will continue to evaluate the provisions of SFAS No. 159, management currently does not believe the adoption of SFAS No. 159 will have a material impact on the Company’s consolidated financial statements.
| (r) | Recently Adopted Accounting Pronouncements |
In September 2006, the SEC issued Staff Accounting Bulletin No. 108,Considering the Effects of Prior Year Misstatements when Quantifying Misstatements in Current Year Financial Statements (“SAB No 108”). SAB No. 108 provides interpretive guidance on how the effects of the carryover or reversal of prior year misstatements should be considered in quantifying a current year misstatement. Under SAB No. 108, the Group should quantify errors using both a balance sheet and income statement approach (“dual approach”) and evaluate whether either approach results in a misstatement that is material when all relevant quantitative and qualitative factors are considered. The adoption of SAB 108 did not have any impact on the Company’s consolidated financial statements.
F-17
COMTECH GROUP, INC.
NOTES TO CONSOLIDATED FINANCIAL STATEMENTS
(in thousands, except shares and per share amounts)
| 3 | ACCOUNTS RECEIVABLE, NET |
Accounts receivable consist of the following:
| | | | | | | | | |
| | | 2006 | | | 2006 | | | 2005 | |
| | | USD | | | RMB | | | RMB | |
Account receivable | | 37,673 | | | 294,004 | | | 275,038 | |
Less: allowance for doubtful accounts | | (1,975 | ) | | (15,415 | ) | | (7,495 | ) |
| | | | | | | | | |
| | 35,698 | | | 278,589 | | | 267,543 | |
| | | | | | | | | |
An analysis of the allowance for doubtful accounts is follows:
| | | | | | | | | |
| | | 2006 | | 2006 | | 2005 | | 2004 | |
| | | USD | | RMB | | RMB | | RMB | |
Balance at beginning of year | | 960 | | 7,495 | | 3,833 | | 4,145 | |
Charges to consolidated statement of income | | 1,015 | | 7,920 | | 3,662 | | — | |
Written-off against accounts receivable | | — | | — | | — | | (312 | ) |
| | | | | | | | | |
Balance at end of year | | 1,975 | | 15,415 | | 7,495 | | 3,833 | |
| | | | | | | | | |
The Group has a credit policy in place and the exposure to credit risk is monitored on a ongoing basis. Credit evaluations are performed on all customers requiring credit over a certain amount.
F-18
COMTECH GROUP, INC.
NOTES TO CONSOLIDATED FINANCIAL STATEMENTS
(in thousands, except shares and per share amounts)
To reduce the Group’s credit risk, the Group has required certain customers to pay for the sale of the Group’s products by bills receivable. Bills receivable represents a short-term notes receivable issued by a financial institution that entitles the Group to receive the full face amount from the financial institution at maturity, which generally ranges from 3 to 6 months from the date of issuance. Historically, the Group has experienced no losses on bills receivable.
The Group, in certain circumstances, has arranged to transfer with recourse certain of its bills receivable to banks. Under this discounting arrangement, the bank pays a discounted amount to the Group and collects the amounts owed from the customers' banks. The discount typically ranges from 0.6% to 0.8% of the balance transferred, which is recorded as interest expense.
For the years ended December 31, 2006, 2005 and 2004, the Group received proceeds from the sales of the bills receivable amounting to RMB106,935 (USD13,702), RMB60,751 and RMB157,683, respectively. In addition, the Group recorded discounts amounting to RMB781 (USD100), RMB379 and RMB1,285 in respect of the bills receivable sold for the years ended December 31, 2006, 2005 and 2004, respectively, which have been included in interest expense.
For certain bills receivable sold to banks that the Group has surrendered control, the Group derecognised these discounted bills receivable pursuant to the provisions of SFAS No. 140,Accounting for Transfers and Servicing of Financial Assets and Extinguishments of Liabilities (“SFAS No. 140”). As at December 31, 2006 and 2005, the Group has derecognized discounted bills receivable amounting to RMB58,531 (USD7,500) and RMB Nil, respectively in accordance with SFAS No. 140. Discounted bills receivable under such arrangement that are not derecognized pursuant to SFAS No. 140 amounted to RMB Nil (USD Nil) and RMB14,472 as of December 31, 2006 and 2005, respectively and are accounted for as secured borrowings and included in “Bank borrowings”.
Inventories by major categories are summarized as follows:
| | | | | | |
| | | 2006 | | 2006 | | 2005 |
| | | USD | | RMB | | RMB |
Raw materials | | 473 | | 3,694 | | 2,979 |
Finished goods | | 8,748 | | 68,265 | | 107,784 |
| | | | | | |
| | 9,221 | | 71,959 | | 110,763 |
| | | | | | |
Inventories amounting to RMB 7,369 (USD 924), RMB 3,867 and RMB 628 were written off in 2006, 2005 and 2004, respectively.
| 6 | PROPERTY AND EQUIPMENT, NET |
Property and equipment consists of the following:
| | | | | | | | | |
| | | 2006 | | | 2006 | | | 2005 | |
| | | USD | | | RMB | | | RMB | |
Office unit | | 214 | | | 1,671 | | | 1,706 | |
Machinery | | 137 | | | 1,066 | | | 574 | |
Furniture and office equipment | | 1,487 | | | 11,605 | | | 4,933 | |
Motor vehicles | | 453 | | | 3,536 | | | 2,965 | |
| | | | | | | | | |
| | | |
Total | | 2,291 | | | 17,878 | | | 10,178 | |
Less: accumulated depreciation | | (703 | ) | | (5,483 | ) | | (3,274 | ) |
| | | | | | | | | |
| | | |
Property and equipment, net | | 1,588 | | | 12,395 | | | 6,904 | |
| | | | | | | | | |
Depreciation expense for the years ended December 31, 2006, 2005, and 2004 was RMB2,359 (USD302), RMB974, and RMB913, respectively.
F-19
COMTECH GROUP, INC.
NOTES TO CONSOLIDATED FINANCIAL STATEMENTS
(in thousands, except shares and per share amounts)
| 7 | INVESTMENT IN AN AFFILIATED COMPANY |
In June 2006, Huameng BVI established a joint venture, COGO Engineering Services (Malaysia) Sdn Bhd (“COGO Malaysia”), with Silver Ridge Sdn Bhd. Huameng BVI contributed RMB416 for 56% equity interest in COGO Malaysia. The investment in COGO Malaysia has been accounted under the equity method in accordance with EITF96-16Investor's Accounting for an Investee When the Investor Has a Majority of the Voting Interest but the Minority Shareholder or Shareholders Have Certain Approval or Veto Rightssince the minority shareholder has certain approval or veto rights over the operations of COGO Malaysia. As at December 31, 2006, COGO Malaysia has not commenced operations.
| 8 | ACQUISITIONS, GOODWILL AND INTANGIBLE ASSETS |
Huameng BVI and Huameng PRC
As part of the Group’s expansion into the engineering services business, Comtech Group entered into an agreement on January 11, 2006 to acquire a 51.12% equity interest in Huameng BVI, an investment holding company, for a cash consideration of RMB44 (USD5) which in turn acquired a 100% equity interest in Huameng PRC for RMB6,769 (USD847) payable in cash. Huameng PRC is engaged in the provision of technology and engineering services, business process outsourcing, and related training and maintenance services.
The acquisition of Huameng PRC, through Huameng BVI, was accounted for by the Group as a purchase business combination. The following table summarizes Comtech Group’s share of fair value of the assets acquired and liabilities assumed at the date of acquisition:
| | | |
| | | RMB | |
Cash | | 206 | |
Accounts receivable | | 6,741 | |
Prepaid expenses and other receivables | | 242 | |
Property, plant and equipment | | 409 | |
| | | |
Total assets acquired | | 7,598 | |
Accrued expenses and other liabilities | | (829 | ) |
| | | |
Net assets acquired | | 6,769 | |
| | | |
Shanghai E&T
On August 6, 2006, Comtech China, a wholly-owned subsidiary of the Company, entered into a share acquisition agreement pursuant to which Comtech China acquired the remaining 40% minority interests of Shanghai E&T for cash consideration of RMB16,000 (USD2,024). The acquisition of the remaining 40% of Shanghai E&T was accounted for by the Group as a step purchase transaction. The purchase price was allocated to the tangible and intangible assets acquired and liabilities assumed on the basis of their respective estimated fair values on the acquisition date. The acquisition of the 40% of Shanghai E&T resulted in the recognition of goodwill of RMB4,264 and an intangible asset of RMB5,467. The intangible asset acquired consisted of customer relationships and is being amortized using the straight-line method over 5 years.
F-20
COMTECH GROUP, INC.
NOTES TO CONSOLIDATED FINANCIAL STATEMENTS
(in thousands, except shares and per share amounts)
| 8 | ACQUISTIONS, GOODWILL AND INTANGIBLE ASSETS - continued |
| (a) | Acquisitions - continued |
Viewtran Cayman and Viewtran PRC
As part of the Group’s strategy to expand into other businesses to provide a more extensive service to its existing customers, Comtech Group entered into a share purchase agreement on December 15, 2006 to purchase all the outstanding shares of Viewtran Cayman, an investment holding company which owns a 100% equity interest in Viewtran PRC, for consideration of RMB58,529 (USD7,500). Viewtran PRC is engaged in the provision of media communication and collaboration platforms and solutions services.
The acquisition of Viewtran PRC, through Viewtran Cayman, was accounted for by the Group as a purchase business combination. The following table summarizes the fair value of the assets acquired and liabilities assumed at the date of acquisition. The Group is in the process of finalizing the purchase price allocations; thus, the allocation of the purchase price is subject to refinement.
| | | |
| | | RMB | |
Cash | | 3,910 | |
Accounts receivable | | 173 | |
Prepaid expenses and other receivables | | 38 | |
Inventories | | 1,367 | |
Property, plant and equipment | | 500 | |
Intangibles asset | | | |
– proprietary technology | | 11,610 | |
– non-compete agreements | | 1,327 | |
– license agreement | | 1,249 | |
– software asset | | 570 | |
Goodwill | | 42,428 | |
| | | |
Total assets acquired | | 63,172 | |
Trade accounts payable | | (3,922 | ) |
Accrued expenses and other liabilities | | (721 | ) |
| | | |
Net assets acquired | | 58,529 | |
| | | |
Proforma financial information
The following unaudited pro forma financial information presents the combined results of operations of the Group as if the acquisitions of Huameng PRC and Viewtran PRC had occurred as of the beginning of January 1, 2005. The unaudited pro forma financial information is not necessarily indicative of what the Company’s consolidated results of operations actually would have been had it completed these acquisitions at the beginning of each year. In addition, the unaudited pro forma financial information does not attempt to project the future results of operations of the Group.
| | | | | | |
| | | Year ended December 31, |
| | | 2006 | | 2006 | | 2005 |
| | | USD | | RMB | | RMB |
| | | (unaudited) | | (unaudited) | | (unaudited) |
Net sales | | | | | | |
Product revenue | | 162,629 | | 1,269,176 | | 866,332 |
Services revenue | | 7,044 | | 54,972 | | 7,421 |
| | | | | | |
| | 169,673 | | 1,324,148 | | 873,753 |
Income from operations | | 14,105 | | 110,080 | | 77,802 |
Net income | | 13,398 | | 104,559 | | 67,735 |
Income per share | | | | | | |
Basic | | 0.42 | | 3.25 | | 2.40 |
Diluted | | 0.40 | | 3.09 | | 2.30 |
F-21
COMTECH GROUP, INC.
NOTES TO CONSOLIDATED FINANCIAL STATEMENTS
(in thousands, except shares and per share amounts)
| 8 | ACQUISTIONS, GOODWILL AND INTANGIBLE ASSETS—continued |
The changes in the carrying amount of goodwill for the year ended December 31, 2006 are as follows:
| | | | | | | | |
| | | As at December 31, 2006 |
| | | 2006 | | 2006 | | 2005 | | 2004 |
| | | USD | | RMB | | RMB | | RMB |
Balance as of January 1, 2006 | | — | | — | | — | | — |
Acquisition of the remaining minority interest of Shanghai E&T | | 546 | | 4,264 | | — | | — |
Acquisition of Viewtran PRC | | 5,437 | | 42,428 | | — | | — |
Impairment loss | | — | | — | | — | | — |
| | | | | | | | |
Balance as of December 31, 2006 | | 5,983 | | 46,692 | | — | | — |
| | | | | | | | |
The goodwill represents the intangible benefits that the acquired business is expected to bring to the Group in the future by providing the Group the access to potential strategic customers and broadening the Group’s product/service offerings to its customers.
The Group’s intangible assets related to the acquisition of Shanghai E&T and Viewtran PRC in 2006, and consisted of the following:
| | | | | | |
| | | As of December 31, 2006 |
| | | Gross carrying
amount | | Amortization
period | | Accumulated
amortization |
| | | RMB | | Years | | RMB |
Customer relationships | | 5,467 | | 5 | | 437 |
Proprietary technology | | 11,610 | | 3 | | 166 |
Non-compete agreements | | 1,327 | | 1 | | 57 |
License agreement | | 1,249 | | 2 | | 27 |
Software asset | | 570 | | 3 | | 8 |
| | | | | | |
Total | | 20,223 | | | | 695 |
| | | | | | |
| | | |
| | | USD | | | | USD |
Total (in USD) | | 2,591 | | | | 89 |
| | | | | | |
Aggregate amortization expense for amortizing intangible assets was RMB695 for the year ended December 31, 2006. Estimated amortization expense for the next five years is: RMB7,048 in 2007, RMB5,751 in 2008, RMB4,979 in 2009, RMB1,094 in 2010, and RMB656 in 2011.
| 9 | BANK BORROWINGS AND BANKING FACILITIES |
On October 7, 2005, Comtech Hong Kong entered into a USD5,000 credit facility with Standard Chartered Bank (Hong Kong) Limited ("SCB"). This facility is secured by funds on deposit in an amount of RMB15,945 (USD2,043) as of December 31, 2006, and bears interest at rates 1.5% per annum over HIBOR or USD Prime. The SCB facility is repayable on demand and SCB may immediately terminate the facility without the Group's consent or that of any third party. There was no outstanding balance under the SCB facility as of December 31, 2006 or 2005.
On October 7, 2005, Comtech Hong Kong entered into a USD9,000 credit facility with Bank of China (Hong Kong) Limited (“BOC”). As of December 31, 2005, the outstanding loan balance under the BOC facility was RMB21,307, at an interest rate of approximately 6% per annum, leaving RMB51,325 in availability and was secured by funds on deposit in an amount of RMB24,455 and accounts receivable in an amount of RMB17,027, and bore interest at rates LIBOR plus 2% per annum (6.34% at December 31, 2005). On December 20, 2006, the BOC facility was increased to USD15,000. As of December 31, 2006, the outstanding loan balance under the BOC facility was RMB30,272 (USD3,879), at an interest rate of 6% per annum, leaving RMB86,790 (USD11,121) in availability. This facility is secured by funds on deposit in an amount of RMB39,471 (USD5,058) as of December 31, 2006, and bears interest at rates LIBOR plus 2% per annum (7.34% as of December 31, 2006). The BOC facility is repayable on demand and BOC may increase, reduce and/or cancel the facility by written notice to the Group.
F-22
COMTECH GROUP, INC.
NOTES TO CONSOLIDATED FINANCIAL STATEMENTS
(in thousands, except shares and per share amounts)
The Company is incorporated in the United States, and is subject to United States federal income tax. The Company did not generate income subject to income tax in the United States in 2004, 2005 and 2006. The Company’s subsidiaries that are incorporated in the Cayman Islands and the British Virgin Islands are not subject to income taxes under those jurisdictions. The Company’s subsidiaries in the PRC and Hong Kong are subject to income or profits tax.
PRC
The PRC statutory tax rate is 33%. Shenzhen Comtech, Comtech Communication and Comtech Software (collectively the “Shenzhen Subsidiaries”), being located in the Shenzhen Special Economic Zone in the PRC, are subject to a reduced tax rate of 15%. Since the Shenzhen Subsidiaries have agreed to operate for a minimum of 10 years in the PRC, a two-year tax holiday from the first profit making year is available and thereafter from the third to the fifth years, a 50% reduction to a tax rate of 7.5% as follows:
| | • | | Shenzhen Comtech is subject to a tax rate at 7.5% in 2004, and a tax rate of 15% in 2005 and 2006. |
| | • | | Comtech Communication is under a tax holiday in 2004, and a tax rate of 7.5% until 2007. |
| | • | | Comtech Software is under a tax holiday in 2005 and 2006, and will be subject to a three year tax rate of 7.5% until 2009. |
Shanghai E & T is located in Shanghai Qingpu Zone and is taxed on a deemed basis at 0.5% (2005: 0.5%) of its turnover in accordance with the tax guidelines issued by the local tax authority in Qingpu Zone in 2005 and 2006.
Comloca, Viewtran PRC and Huameng PRC have no assessable profits in 2006 or 2005.
Hong Kong
Comtech Hong Kong and Comtech Broadband, subsidiaries incorporated in Hong Kong, are subject to profits taxes in Hong Kong at a rate of 17.5% in 2004, 2005 and 2006.
The provision for income taxes consists of the following:
| | | | | | | | |
| | | 2006 | | 2006 | | 2005 | | 2004 |
| | | USD | | RMB | | RMB | | RMB |
Current tax | | | | | | | | |
United States | | — | | — | | — | | — |
PRC, excluding Hong Kong | | 654 | | 5,104 | | 4,852 | | 2,046 |
Hong Kong | | 769 | | 6,000 | | 1,884 | | 254 |
Deferred tax | | — | | — | | — | | — |
| | | | | | | | |
| | 1,423 | | 11,104 | | 6,736 | | 2,300 |
| | | | | | | | |
A reconciliation between income tax expense and amounts calculated using the PRC statutory tax rate is as follows:
| | | | | | | | | | | | |
| | | 2006 | | | 2006 | | | 2005 | | | 2004 | |
| | | USD | | | RMB | | | RMB | | | RMB | |
Income before income tax | | 17,930 | | | 139,924 | | | 97,555 | | | 66,635 | |
| | | | | | | | | | | | |
PRC statutory tax rate | | 33 | % | | 33 | % | | 33 | % | | 33 | % |
Computed “expected” tax expenses | | 5,917 | | | 46,175 | | | 32,193 | | | 21,990 | |
Effect of preferential income tax rate | | (708 | ) | | (5,528 | ) | | (12,891 | ) | | (12,656 | ) |
Effect of tax holiday granted to Shenzhen Subsidiaries | | (3,697 | ) | | (28,850 | ) | | (16,744 | ) | | (7,199 | ) |
Foreign tax differential | | (1,119 | ) | | (8,729 | ) | | (1,672 | ) | | (225 | ) |
Change in valuation allowance | | 760 | | | 5,928 | | | — | | | — | |
Non-deductible items: | | | | | | | | | | | | |
Stock based compensation | | 192 | | | 1,502 | | | — | | | — | |
Others non-deductible item | | 78 | | | 606 | | | 5,754 | | | 448 | |
Others | | — | | | — | | | 96 | | | (58 | ) |
| | | | | | | | | | | | |
Income taxes | | 1,423 | | | 11,104 | | | 6,736 | | | 2,300 | |
| | | | | | | | | | | | |
F-23
COMTECH GROUP, INC.
NOTES TO CONSOLIDATED FINANCIAL STATEMENTS
(in thousands, except shares and per share amounts)
| 10 | INCOME TAXES - continued |
The PRC tax rate has been used because the majority of the Company’s pre-tax and taxable income arises in the PRC. The effect on tax payable without tax holiday and preferential tax amounted to approximately RMB34,378 (USD4,405), RMB29,635 and RMB19,855 in the years ended December 31, 2006, 2005, and 2004, respectively (equivalent to basic earnings per share amount of RMB1.07 (USD0.14), RMB1.05, and RMB0.92 and a diluted earnings per share amount of RMB1.02 (USD0.13), RMB1.00, and RMB0.91 in the years ended December 31, 2006, 2005 and 2004, respectively).
Certain of the Company’s PRC subsidiaries have generated net operating losses within the jurisdiction in which they operate amounting to approximately RMB36,168 (USD4,634). These losses will expire on various dates through 2011 and are expected to be utilized during the tax exemption period.
On March 16, 2007, the PRC government has enacted the new Enterprise Income Tax Law which imposes a single income tax rate of 25% for most domestic enterprises and foreign investment enterprises. The Enterprise Income Tax Law is effective as of January 1, 2008 and may result in higher income taxes to the Group in the future.
United States
For United States federal income tax purposes, the Company has net operating loss carry-forwards of approximately USD15,453 (2005: USD13,200) and expire at various dates through 2026. Included in these US losses are net operating loss carry-forwards of approximately USD12,743 that are subject to significant limitations due to prior ownership change, as defined under Section 382 of the Internal Revenue Code. Based on management’s best estimate, it is not probable that these US loss carry-forwards are expected to be utilizable due to this prior ownership change and thus, no deferred tax assets were recognized for these US loss carry-forwards as of December 31, 2006 and 2005. For the net operating loss carry-forwards that are not currently subject to such limitations, gross deferred tax assets of RMB6,979 (USD894) and RMB1,051 were recognized as of December 31, 2006 and 2005, respectively. However, management believes it is more likely than not that such net operating loss carry-forwards will not be realized, therefore, a full valuation allowance has been provided as of December 31, 2006 and 2005. There was no other significant deferred tax asset or liability, except for the net operating loss carry-forwards, as of December 31, 2006 and 2005. The increase in the valuation allowance during the years ended December 31, 2006 and 2005 was RMB5,928 (USD760) and RMB392, respectively.
In addition, United States income taxes have not been provided on undistributed earnings of subsidiaries located outside the United States of approximately RMB280,904 (USD35,994) as such earnings are considered to be permanently reinvested. If circumstances change and it becomes apparent that some or all of the undistributed earnings of subsidiaries will be remitted in the foreseeable future but income taxes have not been recognized by the Company, income tax expenses for such undistributed earnings of foreign subsidiaries would be accrued as an expense.
| 11 | ACCRUED EXPENSES AND OTHER LIABILITIES |
Accrued expenses and other liabilities consists of the following:
| | | | | | |
| | | 2006 | | 2006 | | 2005 |
| | | USD | | RMB | | RMB |
Legal and professional fees | | 518 | | 4,043 | | 3,503 |
Accrued staff related costs | | 1,338 | | 10,443 | | 2,774 |
Payable for acquisitions (Note a) | | 8,297 | | 64,750 | | — |
Other accruals and liabilities | | 899 | | 7,017 | | 3,073 |
| | | | | | |
| | 11,052 | | 86,253 | | 9,350 |
| | | | | | |
| | |
| Note a | | The balance represents amounts payable in relation to the Group’s acquisition of Viewtran Cayman and Shanghai E&T amounting to RMB58,529 (USD7,500) and RMB6,221 (USD797), respectively. |
| |
| | Amount payable in relation to the Viewtran Cayman acquisition is non-interest bearing of which RMB31,214 (USD4,000) is due and payable as of December 31, 2006, RMB19,511 (USD2,500) is due on March 31, 2007 and the remaining balance of RMB7,804 (USD1,000) is due on December 31, 2007. The balance of RMB31,214 (USD4,000) was settled in February 2007. |
| |
| | Amount payable in relation to the Shanghai E&T acquisition is non-interest bearing and was settled in February 2007. |
F-24
COMTECH GROUP, INC.
NOTES TO CONSOLIDATED FINANCIAL STATEMENTS
(in thousands, except shares and per share amounts)
| 12 | GAIN ON DISPOSAL OF A SUBSIDIARY |
In August 2006, the Group disposed of its wholly-owned subsidiary, United Information Technology Company Limited and its wholly-owned subsidiary, United Information Technology (Shenzhen) Company Limited (“UIT”), to an independent third party for consideration of RMB29,884 (USD3,829). The principal activity of UIT was the sales of electronics components and related products. The Company continues to operate in this market through its other subsidiaries. The disposal resulted in a gain of RMB6,673 (USD855) which was recognized in the consolidated statements of operations.
| 13 | STOCK-BASED COMPENSATION |
| (a) | Options and stock warrants assumed under the Share Exchange Agreement |
Prior to the share exchange transaction, the Board of Directors of the Parent adopted, and the then stockholders of the Parent approved, the 1995 Stock Option Plan for Outside Directors (the “Directors’ Plan”) under which 5,000 options would be granted annually to each non-employee director of the Parent for each full year of service on the Board of the Parent. As a part of the Share Exchange Agreement, the Company assumed fully vested options under the Directors’ Plan to purchase 115,000 shares of the Company’s common stock. The options granted under the Directors’ Plan have a weighted average exercise price per option of USD3.00 each and expire on July 1, 2009. Since the share exchange transaction, the Company has not granted additional options under the Directors’ Plan. None of the options exercisable under the Directors’ Plan was exercised in the years ended December 31, 2006, 2005 or 2004. As of December 31, 2006, the aggregate intrinsic value of the outstanding exercisable options was USD1,747.
Prior to the share exchange transaction, the Parent granted fully exercisable stock warrants to purchase up to 925,417 shares of the Company’s common stock which were assumed as a part of the Share Exchange Agreement. The stock warrants assumed by the Company have a weighted average exercisable price per stock warrant of USD2.76 each and expire on July 1, 2009. During the year ended December 31, 2006, 754,389 stock warrants with weighted average exercisable price per stock warrant of USD2.72 each were exercised. No stock warrants were exercised during the years ended December 31, 2005 and 2004. As of December 31, 2006, 171,028 exercisable stock warrants remained outstanding with a weighted average exercisable price per stock warrant and aggregate intrinsic value of USD2.67 each and USD2,654 respectively.
| (b) | Stock warrants issued to financial advisor as part of the financial advisory fee payable in connection with the share exchange transaction |
In 2005, the Company granted 325,000 stock warrants to the financial advisor as part of the financial advisory fee payable in connection of the share exchange transaction in 2004. The stock warrants have an exercise price per stock warrant of USD3.00 each. During the years ended December 31, 2006 and 2005, 16,250 and 308,750 stock warrants were exercised. As of December 31, 2006, no stock warrants remained outstanding.
F-25
COMTECH GROUP, INC.
NOTES TO CONSOLIDATED FINANCIAL STATEMENTS
(in thousands, except shares and per share amounts)
| 13 | STOCK-BASED COMPENSATION - continued |
On August 3, 2004, the Board of Directors adopted the Comtech Group, Inc. 2004 Stock Incentive Plan (the “2004 Incentive Plan”) pursuant to which 2,500,000 shares of the Company’s common stock are reserved for issuance upon exercise of stock options, and for the issuance of stock appreciation rights, non-vested shares and performance shares. The purpose of the 2004 Incentive Plan is to provide additional incentive to employees, directors, advisors and consultants. The 2004 Incentive Plan provides for a term of 10 years from the date of its adoption by the Board of Directors, after which no awards may be made, unless the 2004 Incentive Plan is early terminated by the Board.
Stock options
A summary of stock option activity is as follows:
| | | | | | | | | |
| | | Number of
options | | | Weighted
average
exercise
price | | Weighted
average
remaining
contractual
term | | Aggregate
intrinsic
value |
| | | | | | USD | | Years | | USD |
Balance as of January 1, 2004 | | — | | | — | | | | |
Granted on August 16, 2004 (note i) | | 210,000 | | | 3.00 | | | | |
Granted on November 11, 2004 (note ii) | | 1,690,000 | | | 3.74 | | | | |
| | | | | | | | | |
Balance as of December 31, 2004 | | 1,900,000 | | | 3.66 | | | | |
Granted on January 19, 2005 (note iii) | | 30,000 | | | 5.50 | | | | |
Granted on May 16, 2005 (note iii) | | 322,500 | | | 5.01 | | | | |
Granted on December 12, 2005 (note iv) | | 105,000 | | | 5.53 | | | | |
| | | | | | | | | |
Balance as of December 31, 2005 | | 2,357,500 | | | 3.95 | | | | |
Exercised | | (922,313 | ) | | 3.88 | | | | |
Forfeited | | (121,668 | ) | | 3.90 | | | | |
| | | | | | | | | |
Balance as of December 31, 2006 | | 1,313,519 | | | 4.01 | | 7.99 | | 18,632 |
| | | | | | | | | |
Exercisable as of December 31, 2006 | | 307,541 | | | 4.31 | | 8.19 | | 4,269 |
| | | | | | | | | |
| | |
| Note i | | The vesting of these options is as follows: (1) 39,375 shares vest on February 1, 2005 or vest in equal monthly instalments over the six months from August 16, 2005, (2) 118,125 shares vest in equal monthly instalments over the period from February 2, 2005 to August 1, 2006, and (3) 52,500 shares vest in equal monthly instalments over the period from August 2, 2006 to August 1, 2007. In addition, the Company entered into an employment contract with its Chief Financial Officer (“Employment Contract”). The terms of the Employment Contract provide that in the event the Company engaged in an underwritten offering of shares of common stock which would yield gross proceeds to the Company in excess of RMB248,319 (USD30,000), all of the 210,000 stock options would be accelerated and become fully vested. In July 2005, the Company completed the registered offering and gross proceeds in excess of USD30,000 was raised, and accordingly, all of the 210,000 stock options were accelerated and became fully vested at such time. |
F-26
COMTECH GROUP, INC.
NOTES TO CONSOLIDATED FINANCIAL STATEMENTS
(in thousands, except shares and per share amounts)
| (c) | 2004 Incentive Plan - continued |
| | |
| Note ii | | 20,000 options were fully vested in 2005. 52,500 options vest in equal quarterly instalments over one year beginning the year following the date of grant, and the remaining 1,617,500 options vest in equal quarterly instalments over a period of three years starting from the date of grant. |
| |
| Note iii | | The stock options vest in equal quarterly instalments over a period of three years from the date of grant. |
| |
| Note iv | | The stock options were fully vested on the date of grant. |
The fair value of each option award is estimated on the date of grant using the Black-Scholes option-pricing model based on the assumptions in the following table:
| | | | | | |
| | | 2006 | | 2005 | | 2004 |
Risk-free interest rate | | N/A | | 4.78% to 5.08% | | 4.78% to 4.99% |
Expected life | | N/A | | 5.25 to 6.50 years | | 5.25 to 6.50 years |
Expected volatility | | N/A | | 36% to 50% | | 36% to 37% |
Expected dividend yield | | N/A | | - | | - |
The Group used a blended volatility rate using a combination of historical stock price volatility and market implied volatility. The risk-free interest rate assumption is based upon the average daily closing rates during the preceding quarter for U.S. treasury notes that have a life which approximates the expected life of the option. The dividend yield assumption is based on the Company’s history and expectation of dividend payouts. The expected life of employee stock options represents the weighted-average period the stock options are expected to remain outstanding. The expected life assumptions are established through the review of annual historical employee exercise behavior of option grants with similar vesting periods. The Group estimated that the forfeiture rate approximated zero percent as there were no history of significant forfeiture and the Group expects the future forfeiture to be minimal.
The weighted average fair value of options granted during the years ended December 31, 2005 and 2004 was USD1.60 and USD2.48 each, respectively. The total intrinsic value of options exercised during the year ended December 31, 2006 was USD8,766.
Non-vested equity share unit
A summary of non-vested equity share unit activity is as follows:
| | | | | |
| | | Shares | | | Weighted average
Grant-date fair value |
| | | | | | USD |
Balance as of January 1, 2006 | | — | | | — |
Granted on March 8, 2006 (note i) | | 50,000 | | | 9.14 |
Granted on March 8, 2006 (note ii) | | 7,500 | | | 9.14 |
Granted on July 21, 2006 (note iii) | | 6,000 | | | 10.12 |
Granted on July 21, 2006 (note i) | | 96,000 | | | 10.12 |
Vested | | (96,762 | ) | | 9.69 |
| | | | | |
Balance as of December 31, 2006 | | 62,738 | | | 9.89 |
| | | | | |
| | |
| Note i | | The stock awards vest in equal quarterly instalments over a period of one year from the date of grant. |
| |
| Note ii | | The stock awards vest in equal quarterly instalments over a period of three years from the date of grant. |
| |
| Note iii | | The stock awards were fully vested on the date of grant. |
The total fair value of non-vested equity share units vested during the year ended December 31, 2006 was USD937. As of December 31, 2006, the aggregate unamortized fair value of all non-vested equity share units was USD620, which is expected to be amortized on a straight-line basis over a weighted average period of approximately 0.44 years.
F-27
COMTECH GROUP, INC.
NOTES TO CONSOLIDATED FINANCIAL STATEMENTS
(in thousands, except shares and per share amounts)
| 13 | STOCK-BASED COMPENSATION - continued |
| (c) | 2004 Incentive Plan - continued |
Performance shares
A summary of performance shares activity is as follows:
| | | | | |
| | | Shares | | | Weighted average
Grant-date fair value |
| | | | | | USD |
Balance as of January 1, 2006 | | — | | | — |
Granted on July 21, 2006 (note i) | | 104,000 | | | 10.12 |
Vested | | (34,667 | ) | | 10.12 |
| | | | | |
Balance as of December 31, 2006 | | 69,333 | | | 10.12 |
| | | | | |
| | Note i | The performance awards vest in equal quarterly instalments over three quarters from October 1, 2006 to June 30, 2007 and were subject to a company-wide performance goal which was achieved for the year ended December 31, 2006. |
The total fair value of shares vested during the year ended December 31, 2006 was USD351. As of December 31, 2006, the aggregate unamortized fair value of all non-vested performance shares awards was USD702, which is expected to be amortized on a straight-line basis over a weighted average period of approximately 0.31 years.
On December 20, 2006, the Board of Directors adopted the 2006 Equity Incentive Plan (the “2006 Incentive Plan”) pursuant to which 4,800,000 shares of the Company’s common stock are reserved for issuance upon exercise of stock options, and for the issuance of stock appreciation rights, restricted stock awards and performance shares. The purpose of the 2006 Incentive Plan is to provide additional incentive to employees, directors, advisors and consultants. The 2006 Incentive Plan provides for a term of 10 years from the date of its adoption by the Board of Directors, after which no awards may be made, unless the 2006 Incentive Plan is early terminated by the Board. No awards have been granted under the 2006 Incentive Plan.
The following table sets forth the computation of basic and diluted earnings per share as of December 31:
| | | | | | | | |
| | | 2006 | | 2006 | | 2005 | | 2004 |
| | | USD | | RMB | | RMB | | RMB |
Numerator for basic and diluted earnings per share: | | | | | | | | |
Net income | | 15,796 | | 123,275 | | 86,842 | | 62,202 |
| | | | | | | | |
Denominator: | | | | | | | | |
Basic weighted average shares | | | | 32,200,044 | | 28,168,274 | | 21,690,560 |
Effect of dilutive options | | | | 1,629,475 | | 1,339,665 | | 194,493 |
| | | | | | | | |
Diluted weighted average shares | | | | 33,829,519 | | 29,507,939 | | 21,885,053 |
| | | | | | | | |
Basic earnings per share: | | 0.49 | | 3.83 | | 3.08 | | 2.87 |
| | | | | | | | |
Diluted earnings per share: | | 0.47 | | 3.64 | | 2.94 | | 2.84 |
| | | | | | | | |
F-28
COMTECH GROUP, INC.
NOTES TO CONSOLIDATED FINANCIAL STATEMENTS
(in thousands, except shares and per share amounts)
| 15 | OPERATING SEGMENT INFORMATION |
SFAS No. 131,Disclosures about Segments of an Enterprise and Related Information, establishes standards for reporting information about operating segments in financial statements. Operating segments are defined as components of an enterprise about which separate financial information is available that is evaluated regularly by the chief operating decision maker, or decision making group, in deciding how to allocate resources and in assessing performance.
For the year ended December 31, 2006, the Company determined it has two operating segments based on the above: Component Sales and Engineering Services. Prior to the acquisition of Huameng PRC in January 2006, the Group’s only operating segment was Component Sales.
The Component Sales segment primarily consists of the sale of components for the mobile handset, telecommunication system equipment, digital media and other (such as network protection devices and data storage) markets. The Engineering Services segment primarily consists of the provision of technology and engineering services, business process outsourcing, network system integration and related training and maintenance services. There was no inter-segment revenue during the periods reported. Unallocated includes items such as corporate staff and overhead.
Substantially all of the Group’s operations are in the PRC. Consequentially, no geographic information is presented.
Following is the segment information for the year ended December 31, 2006:
| | | | | | | | | | | | |
| | | Component
Sales RMB | | | Engineering
Services
RMB | | | Unallocated
RMB | | | Total RMB | |
Segment revenue from external customers | | 1,269,176 | | | 54,387 | | | — | | | 1,323,563 | |
| | | | | | | | | | | | |
Income/(loss) from operations | | 156,544 | | | 9,354 | | | (37,103 | ) | | 128,795 | |
Gain on disposal of a subsidiary | | 6,673 | | | — | | | — | | | 6,673 | |
Interest expense | | (2,834 | ) | | (62 | ) | | — | | | (2,896 | ) |
Interest income | | 7,187 | | | 154 | | | 11 | | | 7,352 | |
| | | | | | | | | | | | |
Income before income taxes and Minority interests | | 167,570 | | | 9,446 | | | (37,092 | ) | | 139,924 | |
| | | | | | | | | | | | |
Significant non-cash items: | | | | | | | | | | | | |
– Minority interest | | 8,795 | | | (3,250 | ) | | — | | | 5,545 | |
– Stock-based compensation cost | | — | | | — | | | 20,029 | | | 20,029 | |
– Bad debt expense | | 7,920 | | | — | | | — | | | 7,920 | |
– Provision for inventory write-down | | 7,369 | | | — | | | — | | | 7,369 | |
– Depreciation and amortization | | 2,252 | | | 802 | | | — | | | 3,054 | |
| | | | | | | | | | | | |
Segment assets | | 747,577 | | | 150,519 | | | 9,002 | | | 907,098 | |
| | | | | | | | | | | | |
Total expenditures for additions to long-lived assets | | | | | | | | | | | | |
– Property and equipment | | 3,370 | | | 5,053 | | | — | | | 8,423 | |
– Intangible assets | | 5,467 | | | 14,756 | | | — | | | 20,223 | |
– Investment in an affiliated company | | — | | | 416 | | | — | | | 416 | |
– Goodwill | | 4,264 | | | 42,428 | | | — | | | 46,692 | |
| | | | | | | | | | | | |
Revenues from external customers by product category are summarized as follows:
| | | | | | | | |
| | | 2006 | | 2006 | | 2005 | | 2004 |
| | | USD | | RMB | | RMB | | RMB |
Net revenue | | | | | | | | |
Component Sales | | | | | | | | |
Mobile handset | | 67,327 | | 525,427 | | 446,370 | | 368,116 |
Telecommunications equipment | | 58,331 | | 455,223 | | 326,714 | | 249,254 |
Digital media and others | | 36,971 | | 288,526 | | 93,248 | | 8,286 |
| | | | | | | | |
| | 162,629 | | 1,269,176 | | 866,332 | | 625,656 |
Engineering Services | | 6,969 | | 54,387 | | — | | — |
| | | | | | | | |
Total net revenue | | 169,598 | | 1,323,563 | | 866,332 | | 625,656 |
| | | | | | | | |
F-29
COMTECH GROUP, INC.
NOTES TO CONSOLIDATED FINANCIAL STATEMENTS
(in thousands, except shares and per share amounts)
According to laws applicable to the PRC’s Foreign Investment Enterprises and the Articles of Association of certain subsidiaries of the Company in the PRC (the “PRC subsidiaries”), the PRC subsidiaries are required to appropriate part of their net profits as determined in accordance with the accounting principles and the relevant financial regulations applicable to enterprises limited by shares as established by the Ministry of Finance of the PRC (“PRC GAAP”) to various reserves. These include general reserves, statutory surplus reserve and statutory public welfare fund.
For general reserve, appropriation to general reserve is at the discretion of the board of directors of the relevant PRC subsidiaries. The reserve can only be used for specific purposes and is not distributable as cash dividends.
For statutory surplus reserve, 10% of the net profit, as determined in accordance with PRC GAAP, of the relevant PRC subsidiaries is transferred to the statutory surplus reserve until the reserve balance reaches 50% of the registered capital of the relevant PRC companies. The transfer to this reserve must be made before distribution of dividends to shareholders can be made. The statutory surplus reserve can be used to made good previous years’ losses, if any, and may be converted into share capital by the issue of new shares to shareholders in proportion to their existing shareholders in proportion to their existing shareholdings or by increasing the par value of the shares currently held by the shareholders, provided that the balance after such issue is not less than 25% of the registered capital.
For statutory public welfare fund, 5% to 10% of the net profit, as determined in accordance with PRC GAAP, of the relevant PRC subsidiaries is transferred to the statutory public welfare fund. This fund can only be utilized on capital items for the collective benefit of the employees such as the construction of dormitories, canteen and other staff welfare facilities. The fund is non-distributable other than on liquidation. The transfer to this fund must be made before distribution of dividends to shareholders can be made.
The accumulated balance of these statutory reserves maintained at the Company’s PRC subsidiaries as of December 31, 2006 and 2005 were RMB19,946 (USD2,556) and RMB14,711, respectively.
F-30
COMTECH GROUP, INC.
NOTES TO CONSOLIDATED FINANCIAL STATEMENTS
(in thousands, except shares and per share amounts)
| 17 | COMMITMENTS AND CONTINGENCIES |
| | (a) | The Group has operating lease agreements principally for its office facilities. The leases have remaining terms up to forty months. Rental expense was RMB 6,783 (USD 869), RMB 3,537 and RMB 1,590 for the years ended December 31, 2006, 2005 and 2004, respectively. |
Future minimum lease payments under non-cancellable operating lease agreements as of December 31, 2006 were as follows:
| | | | |
| | | USD | | RMB |
Year ending December 31, | | | | |
2007 | | 772 | | 6,024 |
2008 | | 363 | | 2,838 |
2009 | | 232 | | 1,810 |
2010 | | 77 | | 599 |
| | | | |
Total | | 1,444 | | 11,271 |
| | | | |
| | (b) | As at December 31, 2006, the Group has outstanding purchase orders for components from suppliers in the amount of approximately RMB202,918 (USD26,001). The Group does not have any minimum purchase obligations with these suppliers. Other than as disclosed above, the Group had no other contractual obligations, off-balance sheet guarantees or arrangements as at December 31, 2006. |
| | (c) | As of December 31, 2006, outstanding bills discounted with banks for which the Group has retained a recourse obligation amounting to RMB58,531 (USD7,500). |
| 18 | RELATED PARTY BALANCES AND TRANSACTIONS |
Related Party Balances
Amounts due to related parties
| | | | | | |
| | | 2006 | | 2006 | | 2005 |
| | | USD | | RMB | | RMB |
Matsunichi Electronics (Hong Kong) Limited ("Matsunichi") | | 195 | | 1,522 | | 1,561 |
| | | | | | |
The balance represented consideration payable to Matsunichi for the purchase of a small office suite by the Group in 2001. Mr. Jeffrey Kang, Chairman of the Company, has a controlling interest in Matsunichi. The balance is interest free and has no fixed date of repayment. Apart from the foregoing, there was no other related party balances or transactions.
F-31
COMTECH GROUP, INC.
NOTES TO CONSOLIDATED FINANCIAL STATEMENTS
(in thousands, except shares and per share amounts)
| 19 | CONCENTRATION OF CREDIT |
A substantial percentage of the Group's sales are made to the following customers. Details of the customers accounting for 10% or more of total net revenue in any of the years ended December 31, 2006, 2005 and 2004 are as follows:
| | | | | | | | |
| | | 2006 | | | 2005 | | 2004 | |
Company A | | 16 | % | | * | | * | |
Company B | | * | | | * | | 13 | % |
Company C | | * | | | * | | 12 | % |
Company D | | * | | | * | | 11 | % |
There were no customers that accounted for 10% or more of the total net revenue of the Group for the year ended December 31, 2005.
Details of the accounts receivable from the four customers with the largest receivable balances at December 31, 2006 and 2005 are as follows:
| | | | | | |
| | | Percentage of accounts receivable | |
| | | 2006 | | | 2005 | |
| | | | | | |
Company A | | 3 | % | | 6 | % |
Company B | | 16 | % | | 10 | % |
Company C | | 4 | % | | 2 | % |
Company D | | 7 | % | | 10 | % |
| | | | | | |
| | 30 | % | | 28 | % |
| | | | | | |
Certain employees of the Group in the PRC are entitled to retirement benefits based on their salaries and length of service upon retirement in accordance with a PRC government-managed retirement plan. The PRC government is directly responsible for the payments of the benefits to these retired employees. The Group is required to make contributions to the government-managed retirement plan at 6.5% to 9% of the monthly basic salaries of certain employees. The expense of such arrangements to the Group for the years ended December 31, 2006, 2005 and 2004 was RMB1,961 (USD251), RMB722 and RMB270, respectively.
The Group operates a Mandatory Provident Fund Scheme (“the MPF scheme”) under the Hong Kong Mandatory Provident Fund Schemes Ordinance for employees employed under the jurisdiction of the Hong Kong Employment Ordinance. The assets of the MPF scheme are held by independent trustees and are separated from those of the Group’s assets. Under the MPF scheme, the employer and its employees are each required to make contributions to the plan at 5% of the employees’ relevant income, subject to a cap of monthly relevant income of HKD20. Contributions to the plan by the employee vest immediately. The contributions paid by the Group for the years ended December 31, 2006, 2005, and 2004 were RMB125 (USD16), RMB45 and RMB32, respectively.
F-32
COMTECH GROUP, INC.
NOTES TO CONSOLIDATED FINANCIAL STATEMENTS
(in thousands, except shares and per share amounts)
| 21 | FAIR VALUE OF FINANCIAL INSTRUMENTS |
The fair values of pledged bank deposits, trade accounts receivable, bills receivable, amounts due from related parties, short-term loans, trade accounts payable, amounts due to related parties, and other payables and accrued liabilities approximated the respective carrying amounts because of the short maturity of these instruments.
The RMB is not a freely convertible currency. The State Administration for Foreign Exchange, under the authority of the People's Bank of China, controls the conversion of RMB into foreign currencies. The value of the RMB is subject to changes in central government policies and to international economic and political developments affecting supply and demand in the China Foreign Exchange Trading System market.
The PRC subsidiaries conduct their business substantially in the PRC, and their financial performance and position are measured in terms of RMB. Any devaluation of the RMB against the USD would consequently have an adverse effect on the financial performance and asset values of the Group when measured in terms of USD. The PRC subsidiaries' products are primarily procured, sold and delivered in the PRC for RMB. Thus, their revenues and profits are predominantly denominated in RMB. Should the RMB devalue against USD, such devaluation could have a material adverse effect on the Group's profits and the foreign currency equivalent of such profits repatriated by the PRC entities to the Company.
The Group is exposed to interest rate risk arising from short-term variable rate borrowings from time to time. The Group’s future interest expense will fluctuate in line with any change in borrowing rates. The Group does not have any derivative financial instruments as of December 31, 2006 and 2005 and believes its exposure to interest rate risk is not material.
F-33