UBS Natural Gas, Electric Power and MLP Conference
Nick Khouri, Vice President & Treasurer February 29, 2012
Safe Harbor Statement
The information contained herein is as of the date of this presentation. Many factors may impact forward-looking statements including, but not limited to, the following: impact of regulation by the FERC, MPSC, NRC and other applicable governmental proceedings and regulations, including any associated impact on rate structures; the amount and timing of cost recovery allowed as a result of regulatory proceedings, related appeals or new legislation; impact of electric and gas utility restructuring in Michigan, including legislative amendments and Customer Choice programs; economic conditions and population changes in our geographic area resulting in changes in demand, customer conservation, increased thefts of electricity and gas and high levels of uncollectible accounts receivable; environmental issues, laws, regulations, and the increasing costs of remediation and compliance, including actual and potential new federal and state requirements; health, safety, financial, environmental and regulatory risks associated with ownership and operation of nuclear facilities; changes in the cost and availability of coal and other raw materials, purchased power and natural gas; volatility in the short-term natural gas storage markets impacting third-party storage revenues; access to capital markets and the results of other financing efforts which can be affected by credit agency ratings; instability in capital markets which could impact availability of short and long-term financing; the timing and extent of changes in interest rates; the level of borrowings; the potential for losses on investments, including nuclear decommissioning and benefit plan assets and the related increases in future expense and contributions; the potential for increased costs or delays in completion of significant construction projects; the uncertainties of successful exploration of unconventional gas and oil resources and challenges in estimating gas and oil reserves with certainty; changes in and application of federal, state and local tax laws and their interpretations, including the Internal Revenue Code, regulations, rulings, court proceedings and audits; the effects of weather and other natural phenomena on operations and sales to customers, and purchases from suppliers; unplanned outages; the cost of protecting assets against, or damage due to, terrorism or cyber attacks; employee relations and the impact of collective bargaining agreements; the availability, cost, coverage and terms of insurance and stability of insurance providers; cost reduction efforts and the maximization of plant and distribution system performance; the effects of competition; changes in and application of accounting standards and financial reporting regulations; changes in federal or state laws and their interpretation with respect to regulation, energy policy and other business issues; binding arbitration, litigation and related appeals; and the risks discussed in our public filings with the Securities and Exchange Commission. New factors emerge from time to time. We cannot predict what factors may arise or how such factors may cause our results to differ materially from those contained in any forward-looking statement. Any forward-looking statements refer only as of the date on which such statements are made. We undertake no obligation to update any forward-looking statement to reflect events or circumstances after the date on which such statement is made or to reflect the occurrence of unanticipated events. This presentation should also be read in conjunction with the “Forward-Looking Statements” sections in each of DTE Energy’s and Detroit Edison’s 2011 Forms 10-K and 2011 Forms 10-Q (which sections are incorporated herein by reference), and in conjunction with other SEC reports filed by DTE Energy and Detroit Edison.
Cautionary Note – The Securities and Exchange Commission permits oil and gas companies, in their filings with the SEC, to disclose only proved reserves that a company has demonstrated by actual production or conclusive formation tests to be economically and legally producible under existing economic and operating conditions. We use certain terms in this presentation such as “probable reserves” that the SEC’s guidelines strictly prohibit us from including in filings with the SEC. You are urged to consider closely the disclosure in DTE Energy’s 2011 Form 10-K and 2011 Forms 10-Q, File No. 1-11607, available from our offices or from our website at www.dteenergy.com. You can also obtain these Forms from the SEC by accessing its website at www.sec.gov or by calling 1-800-SEC-0330.
Overview
2011 Accomplishments
Long-Term Growth Update
Financial Update
3
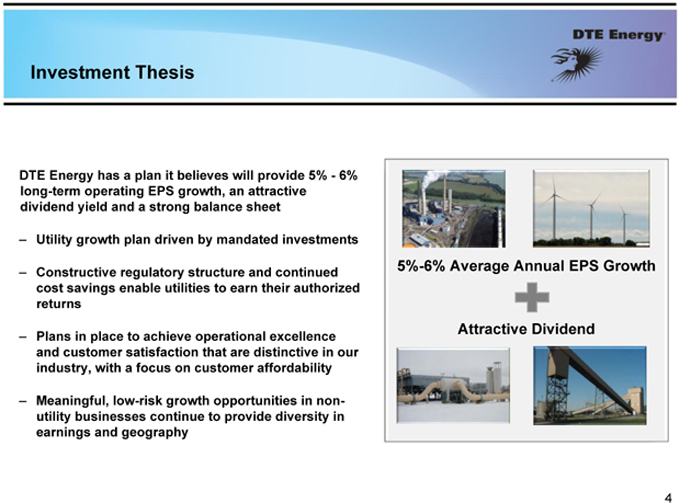
Investment Thesis
DTE Energy has a plan it believes will provide 5%—6% long-term operating EPS growth, an attractive dividend yield and a strong balance sheet
– Utility growth plan driven by mandated investments
– Constructive regulatory structure and continued cost savings enable utilities to earn their authorized returns
– Plans in place to achieve operational excellence and customer satisfaction that are distinctive in our industry, with a focus on customer affordability
– Meaningful, low-risk growth opportunities in non-utility businesses continue to provide diversity in earnings and geography
5%-6% Average Annual EPS Growth
Attractive Dividend
4
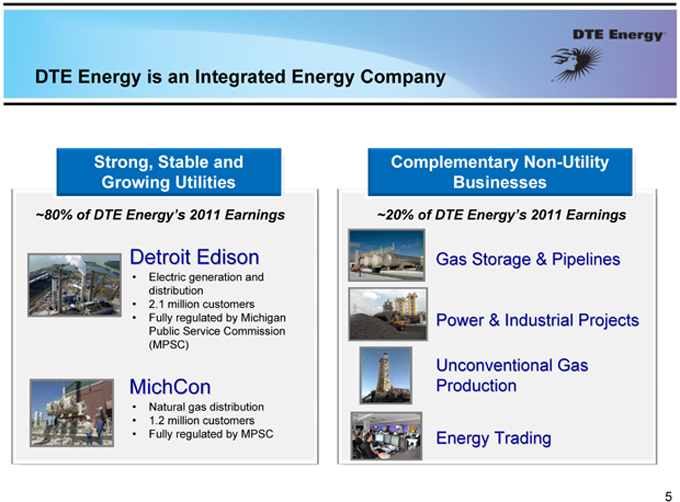
DTE Energy is an Integrated Energy Company
Strong, Stable and Growing Utilities
~80% of DTE Energy’s 2011 Earnings
Detroit Edison
• Electric generation and distribution
• 2.1 million customers
• Fully regulated by Michigan Public Service Commission (MPSC)
MichCon
• Natural gas distribution
• 1.2 million customers
• Fully regulated by MPSC
Complementary Non-Utility Businesses
~20% of DTE Energy’s 2011 Earnings
Gas Storage & Pipelines
Power & Industrial Projects
Unconventional Gas Production
Energy Trading
5
Overview
2011 Accomplishments
Long-Term Growth Update
Financial Update
6
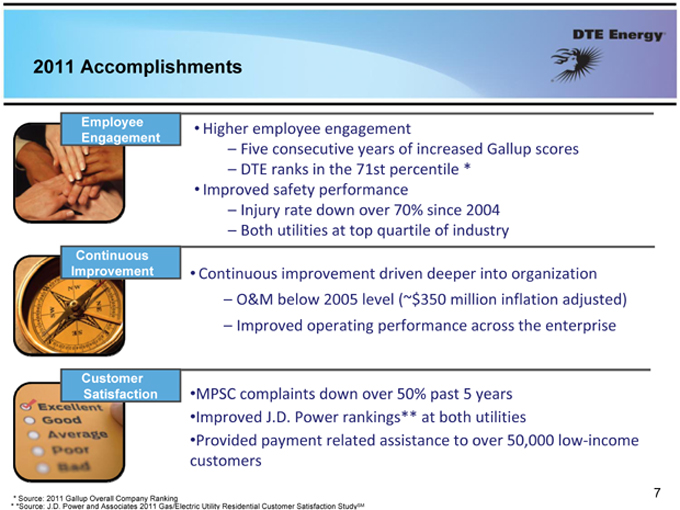
2011 Accomplishments
Employee Engagement
Higher employee engagement
– Five consecutive years of increased Gallup scores
– DTE ranks in the 71st percentile * Improved safety performance
– Injury rate down over 70% since 2004
– Both utilities at top quartile of industry
Continuous Improvement
Continuous improvement driven deeper into organization
– O&M below 2005 level (~$350 million inflation adjusted)
– Improved operating performance across the enterprise
Customer Satisfaction
MPSC complaints down over 50% past 5 years Improved J.D. Power rankings** at both utilities
Provided payment related assistance to over 50,000 low-income customers
* Source: 2011 Gallup Overall Company Ranking
* *Source: J.D. Power and Associates 2011 Gas/Electric Utility Residential Customer Satisfaction StudySM
7
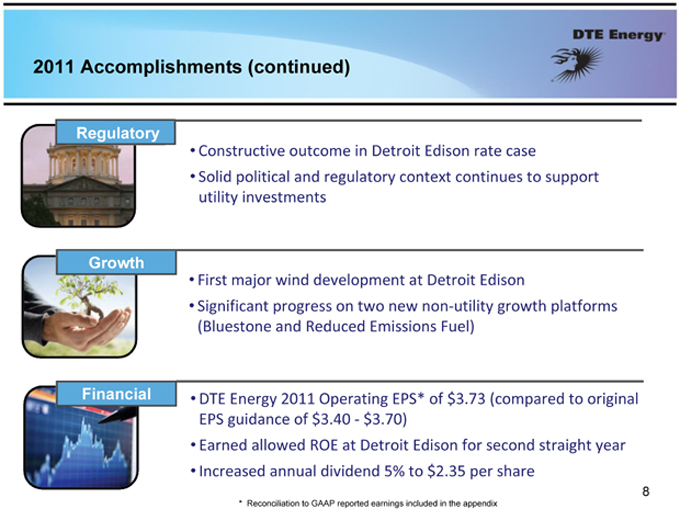
2011 Accomplishments (continued)
Regulatory
Constructive outcome in Detroit Edison rate case
Solid political and regulatory context continues to support utility investments
Growth
First major wind development at Detroit Edison
Significant progress on two new non-utility growth platforms (Bluestone and Reduced Emissions Fuel)
Financial
DTE Energy 2011 Operating EPS* of $3.73 (compared to original EPS guidance of $3.40—$3.70) Earned allowed ROE at Detroit Edison for second straight year Increased annual dividend 5% to $2.35 per share
* Reconciliation to GAAP reported earnings included in the appendix
8
Overview
2011 Accomplishments
Long-Term Growth Update
Financial Update
9
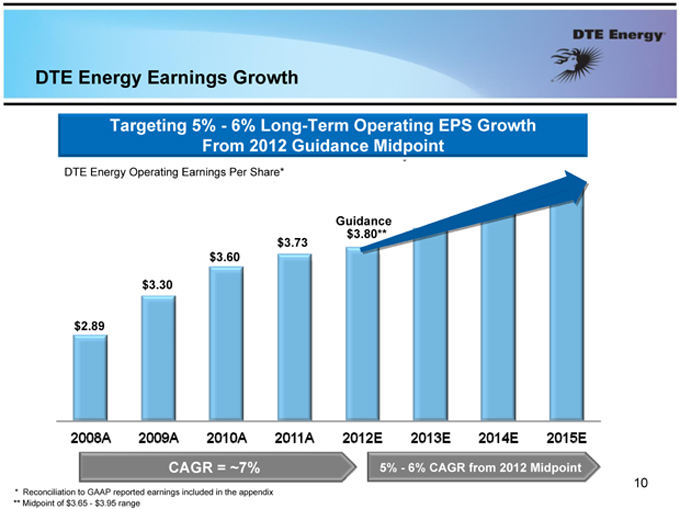
DTE Energy Earnings Growth
Targeting 5%—6% Long-Term Operating EPS Growth From 2012 Guidance Midpoint
DTE Energy Operating Earnings Per Share*
$2.89
$3.30
$3.60
$3.73
Guidance $3.80**
2008A 2009A 2010A 2011A 2012E 2013E 2014E 2015E
CAGR = ~7%
5%—6% CAGR from 2012 Midpoint
* Reconciliation to GAAP reported earnings included in the appendix
** Midpoint of $3.65—$3.95 range
10
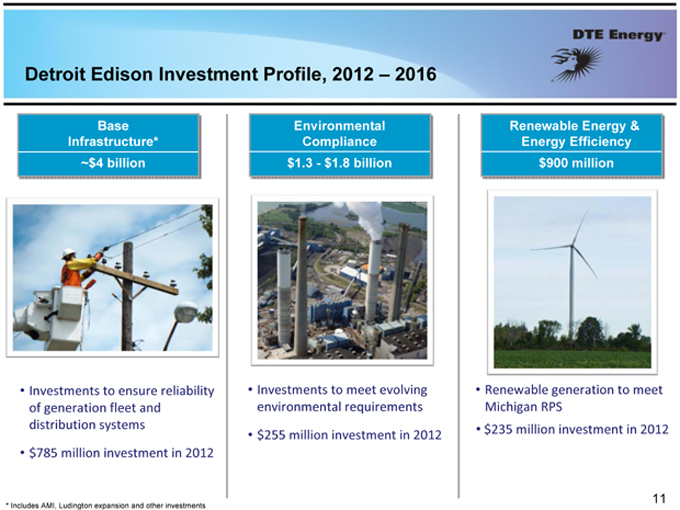
Detroit Edison Investment Profile, 2012 – 2016
Base Infrastructure
~$4 billion
Investments to ensure reliability of generation fleet and distribution systems $785 million investment in 2012
Environmental Compliance $1.3—$1.8 billion
Investments to meet evolving environmental requirements $255 million investment in 2012
Renewable Energy & Energy Efficiency $900 million
Renewable generation to meet Michigan RPS $235 million investment in 2012
* Includes AMI, Ludington expansion and other investments
11
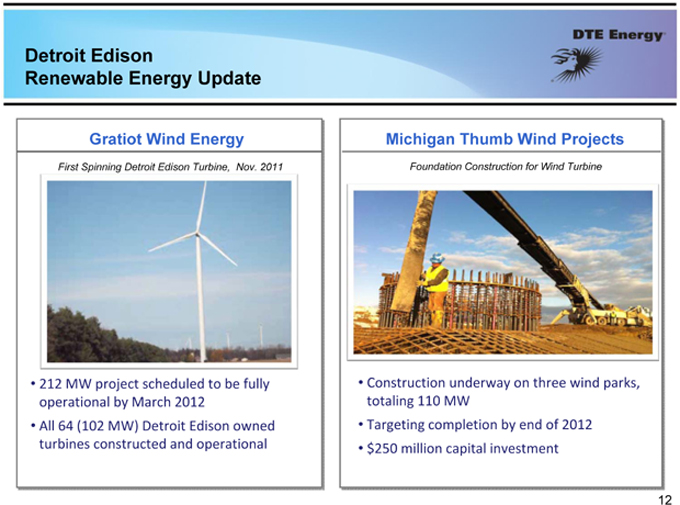
Detroit Edison
Renewable Energy Update
Gratiot Wind Energy
First Spinning Detroit Edison Turbine, Nov. 2011
212 MW project scheduled to be fully operational by March 2012 All 64 (102 MW) Detroit Edison owned turbines constructed and operational
Michigan Thumb Wind Projects
Foundation Construction for Wind Turbine
Construction underway on three wind parks, totaling 110 MW
Targeting completion by end of 2012 $250 million capital investment
12
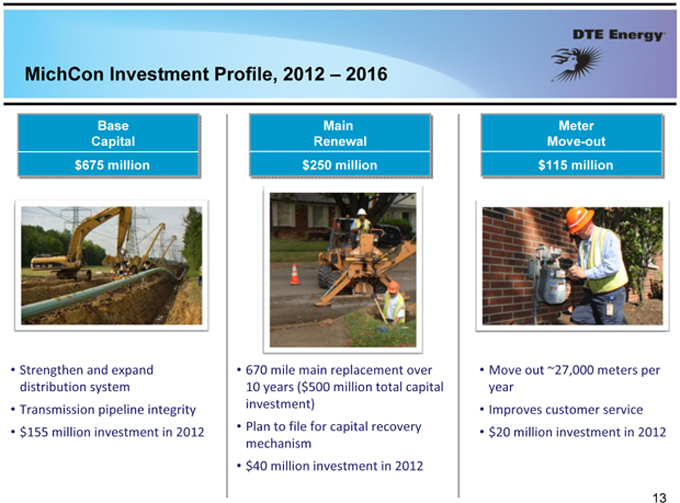
MichCon Investment Profile, 2012 – 2016
Base Capital $675 million
Strengthen and expand distribution system Transmission pipeline integrity $155 million investment in 2012
Main Renewal $250 million
670 mile main replacement over 10 years ($500 million total capital investment) Plan to file for capital recovery mechanism $40 million investment in 2012
Meter Move-out $115 million
Move out ~27,000 meters per year Improves customer service $20 million investment in 2012
13
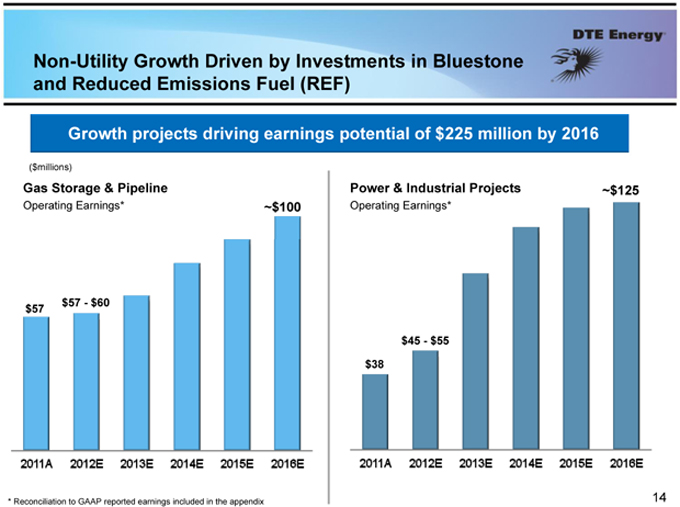
Non-Utility Growth Driven by Investments in Bluestone and Reduced Emissions Fuel (REF)
Growth projects driving earnings potential of $225 million by 2016
($millions)
Gas Storage & Pipeline
Operating Earnings*
$57
$57—$60
~$100
2011A 2012E 2013E 2014E 2015E 2016E
Power & Industrial Projects
Operating Earnings*
$38
$45—$55
~$125
2011A 2012E 2013E 2014E 2015E 2016E
* Reconciliation to GAAP reported earnings included in the appendix
14
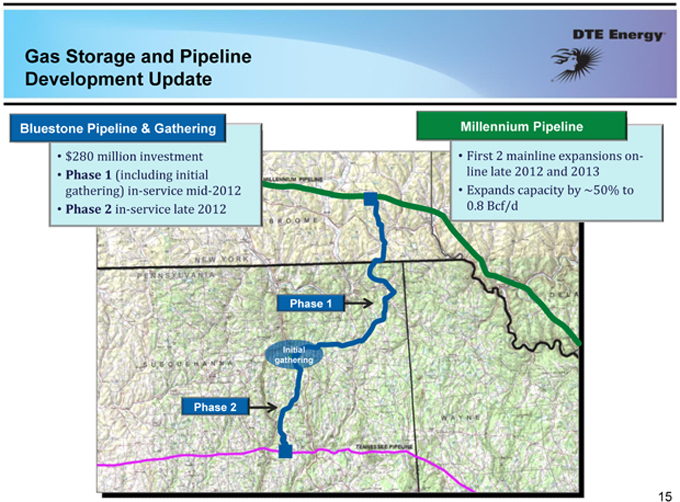
Gas Storage and Pipeline Development Update
Bluestone Pipeline & Gathering
$280 million Phase 1 (including gathering) in-Phase 2 in-service
Millennium Pipeline
First 2 line late 2012 Expands capacity
0.8 Bcf/d
Phase 1
Initial gathering
Phase 2
15
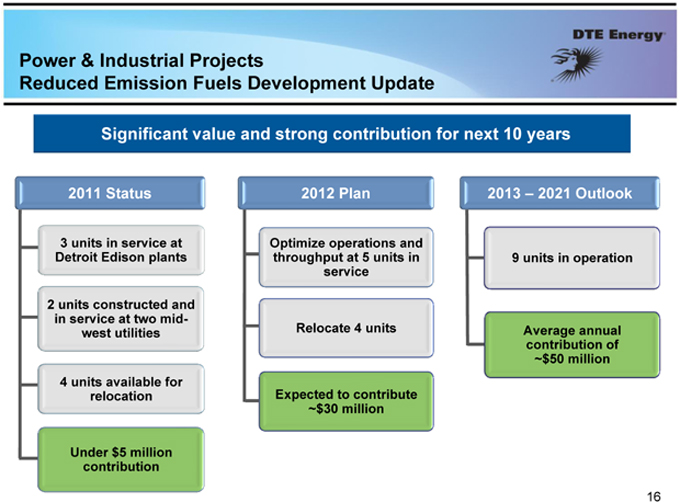
Power & Industrial Projects
Reduced Emission Fuels Development Update
Significant value and strong contribution for next 10 years
2011 Status
3 units in service at Detroit Edison plants
2 units constructed and in service at two midwest utilities
4 units available for relocation
Under $5 million contribution
2012 Plan
Optimize operations and throughput at 5 units in service
Relocate 4 units
Expected to contribute
~$30 million
2013 – 2021 Outlook
9 units in operation
Average annual contribution of
~$50 million
16
Overview
2011 Accomplishments
Long-Term Growth Update
Financial Update
17
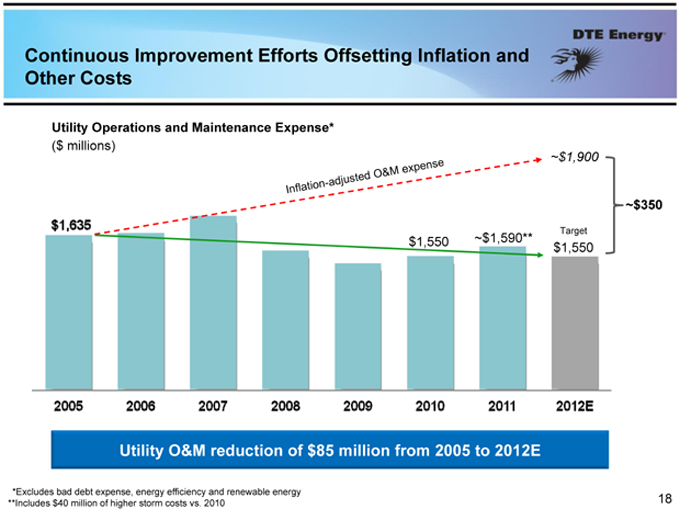
Continuous Improvement Efforts Offsetting Inflation and Other Costs
Utility Operations and Maintenance Expense*
($ millions)
$1,635
~$1,900
Target
$1,550 ~$1,590** $1,550
Inflation-adjusted O&M expense
~$350
2005 2006 2007 2008 2009 2010 2011 2012E
Utility O&M reduction of $85 million from 2005 to 2012E
*Excludes bad debt expense, energy efficiency and renewable energy
**Includes $40 million of higher storm costs vs. 2010
18
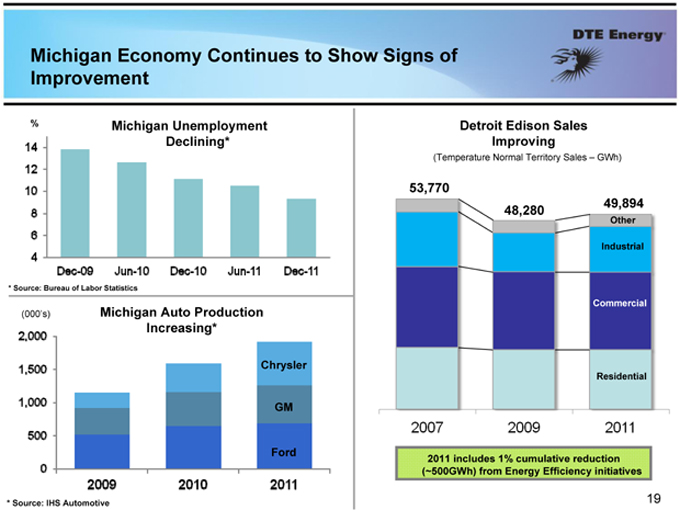
Michigan Economy Continues to Show Signs of Improvement
Michigan Unemployment Declining*
%
14
12
10
8
6
4
Dec-09 Jun-10 Dec-10 Jun-11 Dec-11
* Source: Bureau of Labor Statistics
(000’s)
2,000
1,500
1,000
500
0
Michigan Auto Production Increasing*
Chrysler
GM
Ford
2009
2010
2011
* Source: IHS Automotive
Detroit Edison Sales Improving
(Temperature Normal Territory Sales – GWh)
53,770
48,280
49,894
Other
Industrial
Commercial
Residential
2007 2009 2011
2011 includes 1% cumulative reduction (~500GWh) from Energy Efficiency initiatives
19
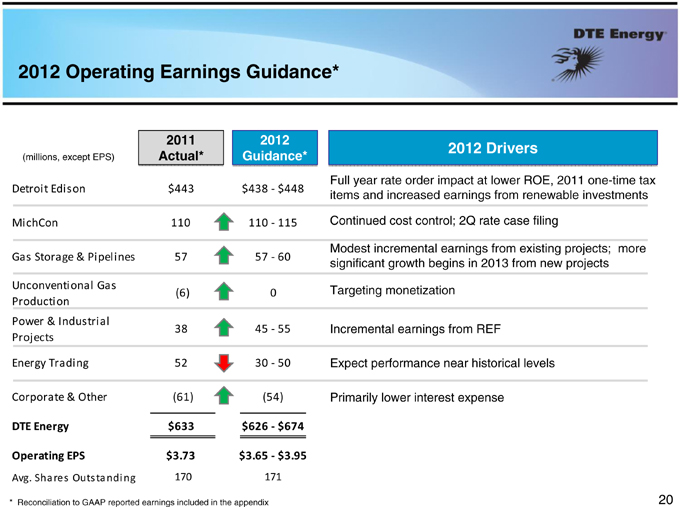
2012 Operating Earnings Guidance*
(millions, except EPS)
2011
Actual*
2012 Guidance*
2012 Drivers
Detroit Edison $443 $438—$448
MichCon 110 110—115
Gas Storage & Pipelines 57 57—60
Unconventional Gas (6) 0
Production
Power & Industrial 38 45—55
Projects
Energy Trading 52 30—50
Corporate & Other (61) (54)
DTE Energy $633 $626—$674
Operating EPS $3.73 $3.65—$3.95
Avg. Shares Outstanding 170 171
Full year rate order impact at lower ROE, 2011 one-time tax items and increased earnings from renewable investments
Continued cost control; 2Q rate case filing
Modest incremental earnings from existing projects; more significant growth begins in 2013 from new projects
Targeting monetization
Incremental earnings from REF
Expect performance near historical levels
Primarily lower interest expense
* Reconciliation to GAAP reported earnings included in the appendix
20
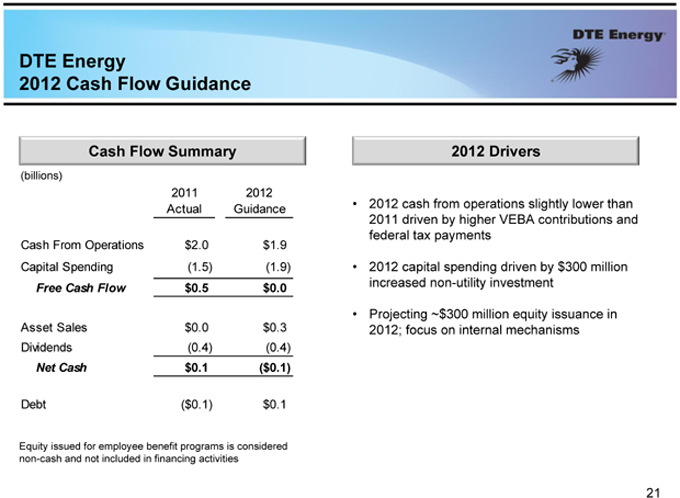
DTE Energy
2012 Cash Flow Guidance
Cash Flow Summary
(billions)
2011 2012
Actual Guidance
Cash From Operations $2.0 $1.9
Capital Spending (1.5) (1.9)
Free Cash Flow $0.5 $0.0
Asset Sales $0.0 $0.3
Dividends (0.4) (0.4)
Net Cash $0.1 ($0.1)
Debt ($0.1) $0.1
2012 Drivers
2012 cash from operations slightly lower than
2011 driven by higher VEBA contributions and federal tax payments
2012 capital spending driven by $300 million increased non-utility investment
Projecting ~$300 million equity issuance in 2012; focus on internal mechanisms
Equity issued for employee benefit programs is considered non-cash and not included in financing activities
21
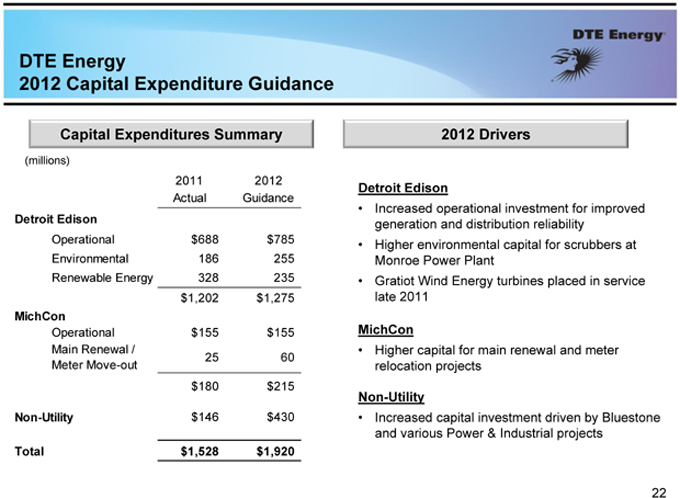
DTE Energy
2012 Capital Expenditure Guidance
Capital Expenditures Summary
(millions)
2011 2012
Actual Guidance
Detroit Edison
Operational $688 $785
Environmental 186 255
Renewable Energy 328 235
$1,202 $1,275
MichCon
Operational $155 $155
Main Renewal /
Meter Move-out 25 60
$180 $215
Non-Utility $146 $430
Total $1,528 $1,920
2012 Drivers
Detroit Edison
• Increased operational investment for improved generation and distribution reliability
• Higher environmental capital for scrubbers at Monroe Power Plant
• Gratiot Wind Energy turbines placed in service late 2011
MichCon
• Higher capital for main renewal and meter relocation projects
Non-Utility
• Increased capital investment driven by Bluestone and various Power & Industrial projects
22
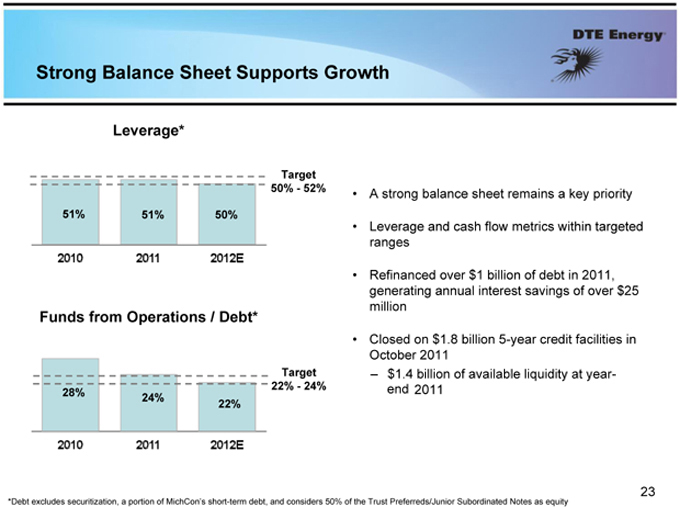
Strong Balance Sheet Supports Growth
Leverage*
Target 50%—52%
51% 51% 50%
2010 2011 2012E
Funds from Operations / Debt*
Target 22%—24%
28%
24%
22%
2010 2011 2012E
A strong balance sheet remains a key priority
Leverage and cash flow metrics within targeted ranges
Refinanced over $1 billion of debt in 2011, generating annual interest savings of over $25 million
Closed on $1.8 billion 5-year credit facilities in October 2011
– $1.4 billion of available liquidity at year-end 2011
*Debt excludes securitization, a portion of MichCon’s short-term debt, and considers 50% of the Trust Preferreds/Junior Subordinated Notes as equity
23
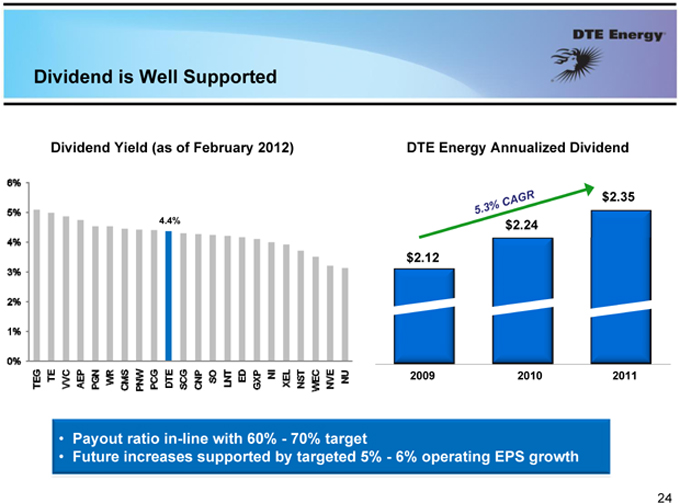
Dividend is Well Supported
Dividend Yield (as of February 2012)
6% 5% 4% 3% 2% 1% 0%
TEG TE VVC AEP PGN WR CMS PNW PCG DTE SCG CNP
SO LNT ED GXP
NI XEL NST WEC NVE
NU
4.4%
DTE Energy Annualized Dividend
$2.12
$2.24
$2.35
2009 2010 2011
Payout ratio in-line with 60%—70% target
Future increases supported by targeted 5%—6% operating EPS growth
24
Contact Us
DTE Energy Investor Relations www.dteenergy.com/investors 313-235-8030
25
Appendix

Michigan Public Service Commission (MPSC)
The Michigan Public Service Commission is composed of three members appointed by the Governor with the advice and consent of the Senate.
Commissioners are appointed to serve staggered six-year terms.
No more than two Commissioners may represent the same political party.
One commissioner is designated as chairman by the Governor.
John Quackenbush
Chairman
Appointed: 9/15/11
Term Ends: 7/2/17 (Republican)
Orjiakor Isiogu
Commissioner
Appointed: 9/9/07
Term Ends: 7/2/13 (Democrat)
Greg White
Commissioner
Appointed: 12/4/09
Term Ends: 7/2/15 (Independent)
Source: MPSC website—www.michigan.gov/mpsc—Jan. 2010
27
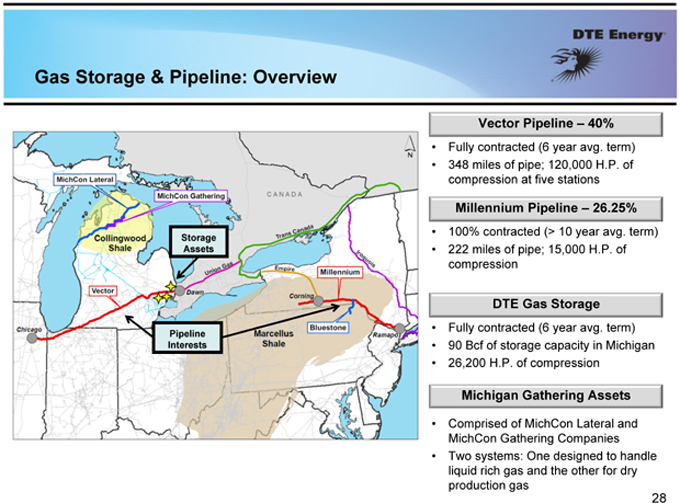
Gas Storage & Pipeline: Pipeline: Overview Overview
Storage Assets
Pipeline Interests
Vector Pipeline – 40%
Fully contracted (6 year avg. term)
348 miles of pipe; 120,000 H.P. of compression at five stations
Millennium Pipeline – 26.25%
100% contracted (> 10 year avg. term) 222 miles of pipe; 15,000 H.P. of compression
DTE Gas Storage
Fully contracted (6 year avg. term)
90 Bcf of storage capacity in Michigan
26,200 H.P. of compression
Michigan Gathering Assets
Comprised of MichCon Lateral and
MichCon Gathering Companies
Two systems: One designed to handle liquid rich gas and the other for dry production gas
28
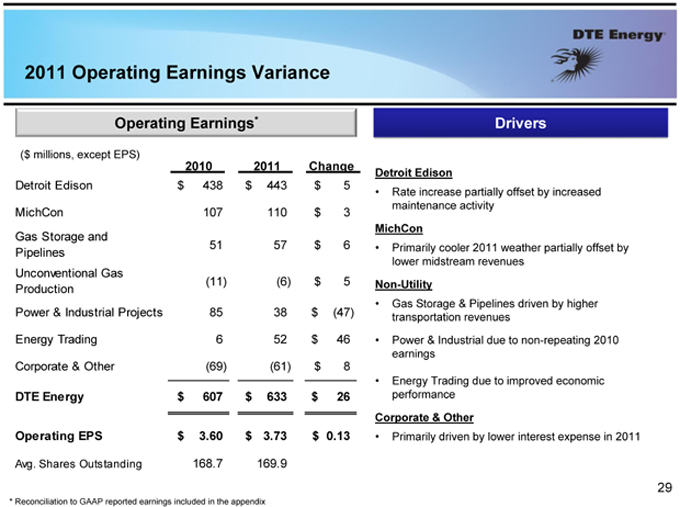
2011 Operating Earnings Variance
Operating Earnings*
($ millions, except EPS)
2010 2011 Change
Detroit Edison $ 438 $ 443 $ 5
MichCon 107 110 $ 3
Gas Storage and
Pipelines 51 57 $ 6
Unconventional Gas
Production (11) (6) $ 5
Power & Industrial Projects 85 38 $ (47)
Energy Trading 6 52 $ 46
Corporate & Other (69) (61) $ 8
DTE Energy $ 607 $ 633 $ 26
Operating EPS $ 3.60 $ 3.73 $ 0.13
Avg. Shares Outstanding 168.7 169.9
Drivers
Detroit Edison
• Rate increase partially offset by increased maintenance activity
MichCon
• Primarily cooler 2011 weather partially offset by lower midstream revenues
Non-Utility
• Gas Storage & Pipelines driven by higher transportation revenues
• Power & Industrial due to non-repeating 2010 earnings
• Energy Trading due to improved economic performance
Corporate & Other
• Primarily driven by lower interest expense in 2011
* Reconciliation to GAAP reported earnings included in the appendix
29
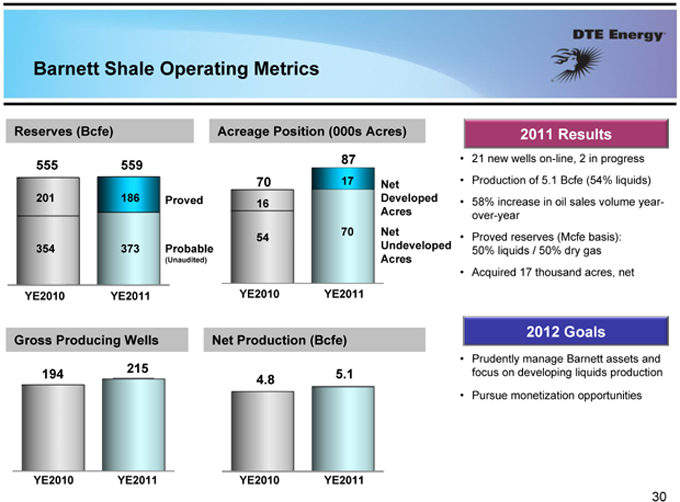
Barnett Shale Operating Metrics
Reserves (Bcfe)
555 559
201 186
354 373
Proved
Probable
(Unaudited)
YE2010 YE2011
Acreage Position (000s Acres)
70 16
54
87 17
70
YE2010 YE2011
Net Developed Acres Net Undeveloped Acres
Gross Producing Wells
194 215
YE2010 YE2011
Net Production (Bcfe)
4.8 5.1
YE2010 YE2011
2011 Results
21 new wells on-line, 2 in progress Production of 5.1 Bcfe (54% liquids) 58% increase in oil sales volume year-over-year Proved reserves (Mcfe basis): 50% liquids / 50% dry gas Acquired 17 thousand acres, net
2012 Goals
Prudently manage Barnett assets and focus on developing liquids production
Pursue monetization opportunities
30
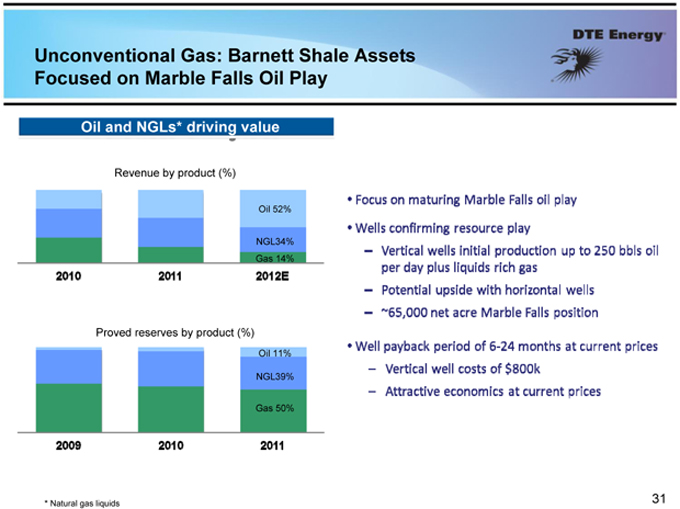
Unconventional Gas: Barnett Shale Assets Focused on Marble Falls Oil Play
Oil and NGLs* driving value
Revenue by product (%)
Oil 52%
NGL34% Gas 14%
2010 2011 2012E
Proved reserves by product (%)
Oil 11%
NGL39%
Gas 50%
Focus on maturing Marble Falls oil play Wells confirming resource play
– Vertical wells initial production up to 250 bbls oil per day plus liquids rich gas
– Potential upside with horizontal wells
– ~65,000 net acre Marble Falls position
Well payback period of 6-24 months at current prices
– Vertical well costs of $800k
– Attractive economics at current prices
* Natural gas liquids
31
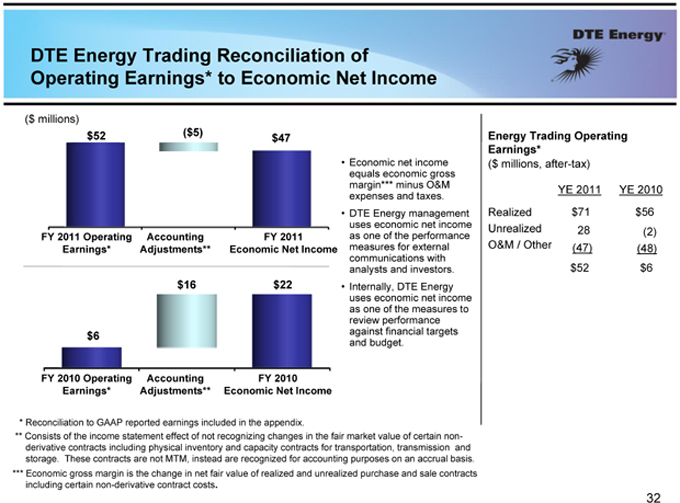
DTE Energy Trading Reconciliation of Operating Earnings* to Economic Net Income
($ millions)
$52
($5)
$47
FY 2011 Operating Earnings*
Accounting
Adjustments**
FY 2011 Economic Net Income
$6
$16
$22
FY 2010 Operating Earnings*
Accounting
Adjustments**
FY 2010 Economic Net Income
Economic net income equals economic gross margin*** minus O&M expenses and taxes. DTE Energy management uses economic net income as one of the performance measures for external communications with analysts and investors. Internally, DTE Energy uses economic net income as one of the measures to review performance against financial targets and budget.
* Reconciliation to GAAP reported earnings included in the appendix.
** Consists of the income statement effect of not recognizing changes in the fair market value of certain non-derivative contracts including physical inventory and capacity contracts for transportation, transmission and storage. These contracts are not MTM, instead are recognized for accounting purposes on an accrual basis.
*** Economic gross margin is the change in net fair value of realized and unrealized purchase and sale contracts including certain non-derivative contract costs.
Energy Trading Operating Earnings*
($ millions, after-tax)
YE 2011 YE 2010
Realized $71 $56
Unrealized 28 (2)
O&M / Other (47) (48)
$52 $6
32
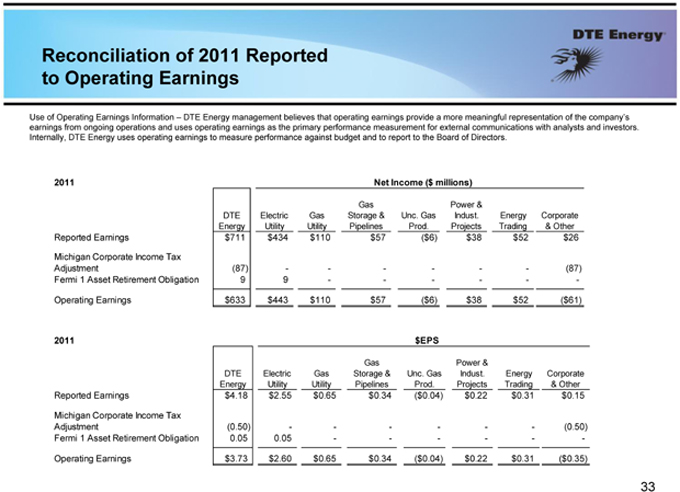
Reconciliation of 2011 Reported to Operating Earnings
Use of Operating Earnings Information – DTE Energy management believes that operating earnings provide a more meaningful representation of the company’s earnings from ongoing operations and uses operating earnings as the primary performance measurement for external communications with analysts and investors. Internally, DTE Energy uses operating earnings to measure performance against budget and to report to the Board of Directors.
2011 Net Income ($ millions)
DTE Energy Electric Utility Gas Utility Gas Storage & Pipelines Inc. Gas Prod. Power & Indust. Projects Energy Trading Corporate & Other
Reported Earnings $711 $434 $110 $57 ($6) $38 $52 $26
Michigan Corporate Income Tax
Adjustment (87)———— (87)
Fermi 1 Asset Retirement Obligation 9 9————
Operating Earnings $633 $443 $110 $57 ($6) $38 $52 ($61)
2011 $EPS
Gas Power &
DTE Electric Gas Storage & Unc. Gas Indust. Energy Corporate Energy Utility Utility Pipelines Prod. Projects Trading & Other Reported Earnings $4.18 $2.55 $0.65 $0.34 ($0.04) $0.22 $0.31 $0.15
Michigan Corporate Income Tax
Adjustment (0.50) — — — — — — (0.50) Fermi 1 Asset Retirement Obligation 0.05 0.05 — — — — — -
Operating Earnings $3.73 $2.60 $0.65 $0.34 ($0.04) $0.22 $0.31 ($0.35)
33
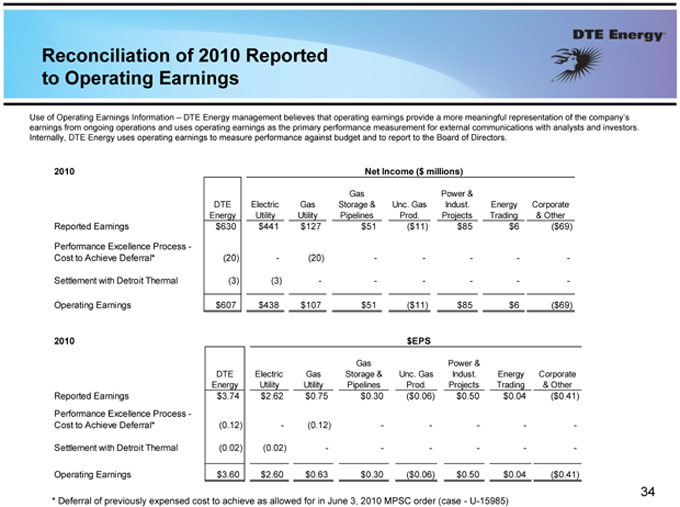
Reconciliation of 2010 Reported to Operating Earnings
Use of Operating Earnings Information – DTE Energy management believes that operating earnings provide a more meaningful representation of the company’s earnings from ongoing operations and uses operating earnings as the primary performance measurement for external communications with analysts and investors. Internally, DTE Energy uses operating earnings to measure performance against budget and to report to the Board of Directors.
2010 Net Income ($ millions)
DTE Energy Electric Utility Gas Utility Gas Storage & Pipelines Inc. Gas Prod. Power & Indust. Projects Energy Trading Corporate & Other
Reported Earnings $630 $441 $127 $51 ($11) $85 $6 ($69)
Performance Excellence Process—
Cost to Achieve Deferral* (20)—(20)———-
Settlement with Detroit Thermal (3) (3)————
Operating Earnings $607 $438 $107 $51 ($11) $85 $6 ($69)
2010 $EPS
DTE Energy Electric Utility Gas Utility Gas Storage & Pipelines Inc. Gas Prod. Power & Indust. Projects Energy Trading Corporate & Other
Reported Earnings $3.74 $2.62 $0.75 $0.30 ($0.06) $0.50 $0.04 ($0.41)
Performance Excellence Process—
Cost to Achieve Deferral* (0.12)—(0.12)———-
Settlement with Detroit Thermal (0.02) (0.02)————
Operating Earnings $3.60 $2.60 $0.63 $0.30 ($0.06) $0.50 $0.04 ($0.41)
* Deferral of previously expensed cost to achieve as allowed for in June 3, 2010 MPSC order (case—U-15985)
34
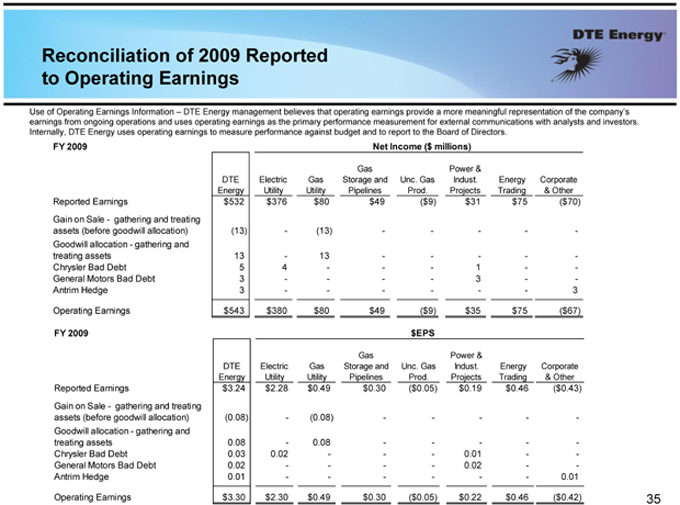
Reconciliation of 2009 Reported to Operating Earnings
Use of Operating Earnings Information – DTE Energy management believes that operating earnings provide a more meaningful representation of the company’s earnings from ongoing operations and uses operating earnings as the primary performance measurement for external communications with analysts and investors. Internally, DTE Energy uses operating earnings to measure performance against budget and to report to the Board of Directors.
FY 2009 Net Income ($ millions)
DTE Energy Electric Utility Gas Utility Gas Storage and Pipelines Unc. Gas Prod. Power & Indust. Projects Energy Trading Corporate & Other
Reported Earnings $532 $376 $80 $49 ($9) $31 $75 ($70)
Gain on Sale—gathering and treating
assets (before goodwill allocation) (13)—(13)———-
Goodwill allocation—gathering and
treating assets 13—13———-
Chrysler Bad Debt 5 4—— 1—-
General Motors Bad Debt 3———3—-
Antrim Hedge 3———— 3
Operating Earnings $543 $380 $80 $49 ($9) $35 $75 ($67)
FY 2009 $EPS
Gas Power &
DTE Electric Gas Storage and Unc. Gas Indust. Energy Corporate
Energy Utility Utility Pipelines Prod. Projects Trading & Other
Reported Earnings $3.24 $2.28 $0.49 $0.30 ($0.05) $0.19 $0.46 ($0.43)
Gain on Sale—gathering and treating
assets (before goodwill allocation) (0.08)—(0.08)———-
Goodwill allocation—gathering and
treating assets 0.08—0.08———-
Chrysler Bad Debt 0.03 0.02—— 0.01—-
General Motors Bad Debt 0.02———0.02—-
Antrim Hedge 0.01———— 0.01
Operating Earnings $3.30 $2.30 $0.49 $0.30 ($0.05) $0.22 $0.46 ($0.42)
35
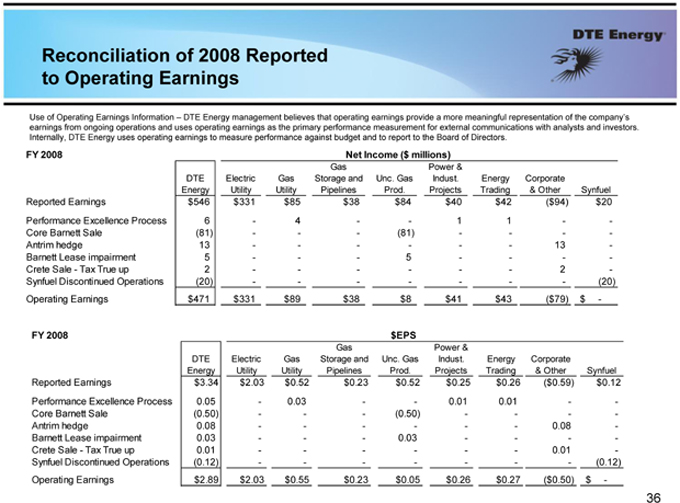
Reconciliation of 2008 Reported to Operating Earnings
Use of Operating Earnings Information – DTE Energy management believes that operating earnings provide a more meaningful representation of the company’s earnings from ongoing operations and uses operating earnings as the primary performance measurement for external communications with analysts and investors. Internally, DTE Energy uses operating earnings to measure performance against budget and to report to the Board of Directors.
FY 2008 Net Income ($ millions)
DTE Energy Electric Utility Gas Utility Gas Storage and Pipelines Unc. Gas Prod. Power & Indust. Projects Energy Trading Corporate & Other Synfuel
Reported Earnings $546 $331 $85 $38 $84 $40 $42 ($94) $20
Performance Excellence Process 6—4—- 1 1—-
Core Barnett Sale (81)—— (81)—— -
Antrim hedge 13———— 13 -
Barnett Lease impairment 5—— 5—— -
Crete Sale—Tax True up 2———— 2 -
Synfuel Discontinued Operations (20)—————(20)
Operating Earnings $471 $331 $89 $38 $8 $41 $43 ($79) $ -
FY 2008 $EPS
DTE Energy Electric Utility Gas Utility Gas Storage and Pipelines Unc. Gas Prod. Power & Indust. Projects Energy Trading Corporate & Other Synfuel
Reported Earnings $3.34 $2.03 $0.52 $0.23 $0.52 $0.25 $0.26 ($0.59) $0.12
Performance Excellence Process 0.05—0.03—- 0.01 0.01—-
Core Barnett Sale (0.50)—— (0.50)—— -
Antrim hedge 0.08———— 0.08 -
Barnett Lease impairment 0.03—— 0.03—— -
Crete Sale—Tax True up 0.01———— 0.01 -
Synfuel Discontinued Operations (0.12)—————(0.12)
Operating Earnings $2.89 $2.03 $0.55 $0.23 $0.05 $0.26 $0.27 ($0.50) $ -
36
Reconciliation of Other Reported to Operating Earnings
Use of Operating Earnings Information – DTE Energy management believes that operating earnings provide a more meaningful representation of the company’s earnings from ongoing operations and uses operating earnings as the primary performance measurement for external communications with analysts and investors. Internally, DTE Energy uses operating earnings to measure performance against budget and to report to the Board of Directors.
In this presentation, DTE Energy provides guidance for future period operating earnings. It is likely that certain items that impact the company’s future period reported results will be excluded from operating results. A reconciliation to the comparable future period reported earnings is not provided because it is not possible to provide a reliable forecast of specific line items. These items may fluctuate significantly from period to period and may have a significant impact on reported earnings.
37