Use these links to rapidly review the document
FINANCIAL REVIEW AND REPORTS Comerica Incorporated and Subsidiaries
FINANCIAL REVIEW AND REPORTS
Comerica Incorporated and Subsidiaries
| | | | | |
Performance Graph | | | 10 | |
Financial Results and Key Corporate Initiatives | | |
12 | |
Overview | | |
14 | |
Strategic Lines of Business | | |
25 | |
Balance Sheet and Capital Funds Analysis | | |
30 | |
Risk Management | | |
38 | |
Critical Accounting Policies | | |
60 | |
Supplemental Financial Data | | |
66 | |
Forward-Looking Statements | | |
67 | |
Consolidated Financial Statements: | | | | |
| | Consolidated Balance Sheets | | |
69 | |
| | Consolidated Statements of Income | | |
70 | |
| | Consolidated Statements of Changes in Shareholders' Equity | | |
71 | |
| | Consolidated Statements of Cash Flows | | |
72 | |
Notes to Consolidated Financial Statements | | |
73 | |
Report of Management | | |
150 | |
Reports of Independent Registered Public Accounting Firm | | |
151 | |
Historical Review | | |
153 | |
9
Table of Contents
PERFORMANCE GRAPH
Comparison of Five Year Cumulative Total Return
Among Comerica Incorporated, Keefe Bank Index, and S&P 500 Index
(Assumes $100 Invested on 12/31/04 and Reinvestment of Dividends)
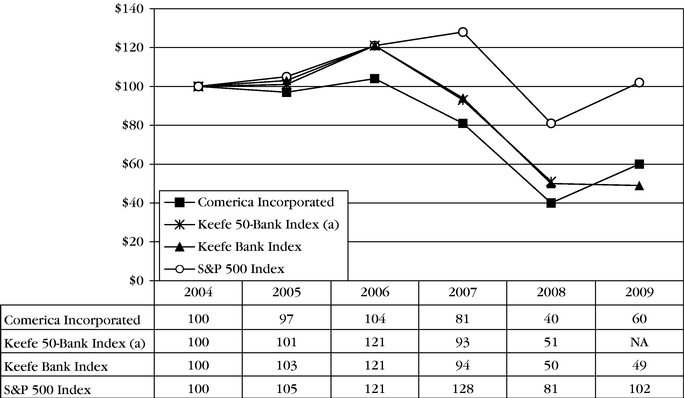
- (a)
- In 2009, the Keefe 50-Bank Index was discontinued by Keefe, Bruyette and Woods. For comparative purposes, the Corporation replaced the Keefe 50-Bank Index with the Keefe Bank Index (BKX).
The performance shown on the graph is not necessarily indicative of future performance.
10
Table of Contents
SELECTED FINANCIAL DATA
| | | | | | | | | | | | | | | | |
| | Years Ended December 31 | |
|---|
| | 2009 | | 2008 | | 2007 | | 2006 | | 2005 | |
|---|
| | (dollar amounts in millions,
except per share data)
| |
|---|
EARNINGS SUMMARY | | | | | | | | | | | | | | | | |
Net interest income | | $ | 1,567 | | $ | 1,815 | | $ | 2,003 | | $ | 1,983 | | $ | 1,956 | |
Provision for loan losses | | | 1,082 | | | 686 | | | 212 | | �� | 37 | | | (47 | ) |
Noninterest income | | | 1,050 | | | 893 | | | 888 | | | 855 | | | 819 | |
Noninterest expenses | | | 1,650 | | | 1,751 | | | 1,691 | | | 1,674 | | | 1,613 | |
Provision (benefit) for income taxes | | | (131 | ) | | 59 | | | 306 | | | 345 | | | 393 | |
Net income | | | 17 | | | 213 | | | 686 | | | 893 | | | 861 | |
Preferred stock dividends | | | 134 | | | 17 | | | — | | | — | | | — | |
Net income (loss) attributable to common shares | | | (118 | ) | | 192 | | | 680 | | | 886 | | | 858 | |
PER SHARE OF COMMON STOCK | | | | | | | | | | | | | | | | |
Diluted net income (loss) | | $ | (0.79 | ) | $ | 1.28 | | $ | 4.43 | | $ | 5.49 | | $ | 5.11 | |
Cash dividends declared | | | 0.20 | | | 2.31 | | | 2.56 | | | 2.36 | | | 2.20 | |
Common shareholders' equity | | | 31.82 | | | 33.31 | | | 34.12 | | | 32.70 | | | 31.11 | |
Market value | | | 29.57 | | | 19.85 | | | 43.53 | | | 58.68 | | | 56.76 | |
Average diluted shares (in thousands) | | | 149 | | | 149 | | | 154 | | | 161 | | | 168 | |
YEAR-END BALANCES | | | | | | | | | | | | | | | | |
Total assets | | $ | 59,249 | | $ | 67,548 | | $ | 62,331 | | $ | 58,001 | | $ | 53,013 | |
Total earning assets | | | 54,558 | | | 62,374 | | | 57,448 | | | 54,052 | | | 48,646 | |
Total loans | | | 42,161 | | | 50,505 | | | 50,743 | | | 47,431 | | | 43,247 | |
Total deposits | | | 39,665 | | | 41,955 | | | 44,278 | | | 44,927 | | | 42,431 | |
Total medium- and long-term debt | | | 11,060 | | | 15,053 | | | 8,821 | | | 5,949 | | | 3,961 | |
Total common shareholders' equity | | | 4,878 | | | 5,023 | | | 5,117 | | | 5,153 | | | 5,068 | |
Total shareholders' equity | | | 7,029 | | | 7,152 | | | 5,117 | | | 5,153 | | | 5,068 | |
AVERAGE BALANCES | | | | | | | | | | | | | | | | |
Total assets | | $ | 62,809 | | $ | 65,185 | | $ | 58,574 | | $ | 56,579 | | $ | 52,506 | |
Total earning assets | | | 58,162 | | | 60,422 | | | 54,688 | | | 52,291 | | | 48,232 | |
Total loans | | | 46,162 | | | 51,765 | | | 49,821 | | | 47,750 | | | 43,816 | |
Total deposits | | | 40,091 | | | 42,003 | | | 41,934 | | | 42,074 | | | 40,640 | |
Total medium- and long-term debt | | | 13,334 | | | 12,457 | | | 8,197 | | | 5,407 | | | 4,186 | |
Total common shareholders' equity | | | 4,959 | | | 5,166 | | | 5,070 | | | 5,176 | | | 5,097 | |
Total shareholders' equity | | | 7,099 | | | 5,442 | | | 5,070 | | | 5,176 | | | 5,097 | |
CREDIT QUALITY | | | | | | | | | | | | | | | | |
Total allowance for credit losses | | $ | 1,022 | | $ | 808 | | $ | 578 | | $ | 519 | | $ | 549 | |
Total nonperforming loans | | | 1,181 | | | 917 | | | 404 | | | 214 | | | 138 | |
Foreclosed property | | | 111 | | | 66 | | | 19 | | | 18 | | | 24 | |
Total nonperforming assets | | | 1,292 | | | 983 | | | 423 | | | 232 | | | 162 | |
Net credit-related charge-offs | | | 869 | | | 472 | | | 153 | | | 72 | | | 116 | |
Net credit-related charge-offs as a percentage of average total loans | | | 1.88 | % | | 0.91 | % | | 0.31 | % | | 0.15 | % | | 0.26 | % |
Allowance for loan losses as a percentage of total period-end loans | | | 2.34 | | | 1.52 | | | 1.10 | | | 1.04 | | | 1.19 | |
Allowance for loan losses as a percentage of total nonperforming loans | | | 83 | | | 84 | | | 138 | | | 231 | | | 373 | |
RATIOS | | | | | | | | | | | | | | | | |
Net interest margin | | | 2.72 | % | | 3.02 | % | | 3.66 | % | | 3.79 | % | | 4.06 | % |
Return on average assets | | | 0.03 | | | 0.33 | | | 1.17 | | | 1.58 | | | 1.64 | |
Return on average common shareholders' equity | | | (2.37 | ) | | 3.79 | | | 13.52 | | | 17.24 | | | 16.90 | |
Dividend payout ratio | | | N/M | | | 179.07 | | | 57.79 | | | 42.99 | | | 43.05 | |
Average common shareholders' equity as a percentage of average assets (a) | | | 7.90 | | | 7.93 | | | 8.66 | | | 9.15 | | | 9.71 | |
Tier 1 common capital as a percentage of risk-weighted assets (a) | | | 8.18 | | | 7.08 | | | 6.85 | | | 7.54 | | | 7.78 | |
Tier 1 capital as a percentage of risk-weighted assets | | | 12.46 | | | 10.66 | | | 7.51 | | | 8.03 | | | 8.38 | |
Tangible common equity as a percentage of tangible assets (a) | | | 7.99 | | | 7.21 | | | 7.97 | | | 8.62 | | | 9.16 | |
- (a)
- See Supplemental Financial Data section for reconcilements of non-GAAP financial measures.
N/M — not meaningful.
11
Table of Contents
2009 FINANCIAL RESULTS AND KEY CORPORATE INITIATIVES
Financial Results
- •
- Net income was $17 million for 2009, compared to $213 million for 2008. The net loss attributable to common shares was $118 million for 2009, compared to net income attributable to common shares of $192 million for 2008. Included in the net income (loss) attributable to common shares were preferred dividends of $134 million and $17 million in 2009 and 2008, respectively. The net loss per diluted common share was $0.79 for 2009, compared to net income per diluted common share of $1.28 for 2008. In the first half of 2009, the national economy was hampered by turmoil in the financial markets, declining home values and a global recession. The most significant items contributing to the decrease in net income were an increase in the provision for loan losses of $396 million, a decline in net interest income of $248 million and an increase in Federal Deposit Insurance Corporation (FDIC) insurance expense of $74 million. These were partially offset by a $176 million increase in net securities gains, a $94 million decrease in salaries expense and an $88 million 2008 auction-rate securities charge.
- •
- Average loans in 2009 were $46.2 billion, a decrease of $5.6 billion from 2008. By geographic market, average loans declined in all geographic markets from 2008 to 2009: International (15 percent), Western (14 percent), Midwest (11 percent), Florida (eight percent), Other (eight percent) and Texas (five percent). Average loans declined in nearly all business lines, including declines in National Dealer Services (29 percent), Middle Market (14 percent), Specialty Businesses (13 percent), Commercial Real Estate (eight percent), Global Corporate Banking (seven percent) and Small Business (seven percent). The declines reflected reduced demand, consistent with previous post-recessionary environments.
- •
- Average deposits in 2009 were $40.1 billion, a decrease of $1.9 billion, or five percent, compared to 2008, resulting primarily from decreases of $2.6 billion, or 39 percent, in other time deposits and $1.3 billion, or nine percent, in money market and NOW deposits, partially offset by an increase of $2.3 billion, or 21 percent, in noninterest-bearing deposits in 2009, compared to 2008.
- •
- Net interest income declined $248 million to $1.6 billion in 2009, compared to 2008. The net interest margin decreased 30 basis points to 2.72 percent, primarily due to loan rates declining faster than deposit rates from late 2008 rate reductions, excess liquidity (represented by average balances deposited with the Federal Reserve Bank (FRB)) and the reduced contribution of noninterest-bearing funds in a significantly lower rate environment, partially offset by increased loan spreads. Excluding excess liquidity, the net interest margin would have been 2.83 percent for 2009, compared to 3.03 percent for 2008.
- •
- Noninterest income increased $157 million, or 18 percent, compared to 2008, largely due to a $176 million increase in net securities gains and a $36 million increase in deferred compensation asset returns (offset by an increase in deferred compensation plan costs in noninterest expenses), partially offset by decreases of $38 million in fiduciary income and $11 million in brokerage fees.
- •
- Noninterest expenses decreased $101 million, or six percent, compared to 2008, primarily due to decreases in salaries expense ($94 million), reflecting a decline in workforce and reduced incentives, deferred compensation plan costs ($36 million), the provision for credit losses on lending-related commitments ($18 million), discretionary expenses and an $88 million net charge in 2008 related to the repurchase of auction-rate securities (included in "litigation and operational expenses"), partially offset by increases in FDIC insurance expense ($74 million), other real estate expense ($38 million) and defined benefit pension expense ($37 million). Full-time equivalent employees decreased eight percent from year-end 2008 to year-end 2009.
- •
- Credit issues in 2009 resulted primarily from challenges in the Middle Market (primarily the Midwest and Western markets), Commercial Real Estate (Midwest, Florida, Texas and Western markets, primarily residential real estate developments), Global Corporate Banking (primarily the Western and International markets), Leasing (primarily the Midwest market) and Private Banking (primarily the Western and Midwest markets) loan portfolios. Commercial Real Estate challenges in the Western market moderated in 2009, compared to 2008, but remained a significant portion of Commercial Real
12
Table of Contents
Estate provisions and net charge-offs. Net credit-related charge-offs were 1.88 percent of average total loans in 2009, compared to 0.91 percent in 2008. Nonperforming assets increased to $1.3 billion, at year-end 2009, compared to $983 million at year-end 2008.
Key Corporate Initiatives
- •
- Aggressively focused significant resources on managing deteriorating credit quality in 2009, particularly in the commercial real estate portfolio. Within the commercial real estate loan portfolio in the Commercial Real Estate business line, year-end 2009 residential real estate development exposure was reduced by 44 percent, compared to year-end 2008.
- •
- Continued the loan optimization plan implemented in mid-2008, which increased loan spreads and enhanced customer relationship returns.
- •
- Increased average core deposits $973 million, or three percent, in 2009, compared to 2008. The increase in average core deposits included an increase in average noninterest-bearing deposits of $2.3 billion, or 21 percent, in 2009. Core deposits exclude other time deposits and foreign office time deposits.
- •
- Decreased noninterest expenses $101 million, or six percent, compared to full-year 2008, due to control of discretionary expenses and workforce. Reduced full-time equivalent staff by approximately 850, or eight percent, in 2009.
- •
- Continued to enhance capital ratios as the Tier 1 common capital and Tier 1 capital ratios were 8.18 percent and 12.46 percent, respectively, at December 31, 2009, up from 7.08 percent and 10.66 percent, respectively, at December 31, 2008.
- •
- Leveraged favorable market conditions to sell mortgage-backed government agency securities for $225 million of gains in 2009.
- •
- Continued organic growth focused in high growth markets, including opening 10 new banking centers in 2009. The Corporation expects to open 13 new banking centers in 2010 primarily in our growth markets of California, Texas and Arizona. The banking center expansion program for 2009 and planned program for 2010 was curtailed in comparison to earlier years due to the strained economic environment. Since the banking center expansion program began in late 2004, new banking centers have resulted in nearly $3.0 billion in new deposits.
- •
- At such time as feasible, redeem the $2.25 billion of Fixed Rate Cumulative Perpetual Preferred Stock issued to the U.S. Treasury, with careful consideration given to the economic environment.
13
Table of Contents
OVERVIEW
Comerica Incorporated (the Corporation) is a financial holding company headquartered in Dallas, Texas. The Corporation's major business segments are the Business Bank, the Retail Bank and Wealth & Institutional Management. The core businesses are tailored to each of the Corporation's four primary geographic markets: Midwest, Western, Texas and Florida.
The accounting and reporting policies of the Corporation and its subsidiaries conform to U.S. generally accepted accounting principles (GAAP) and prevailing practices within the banking industry. The Corporation's consolidated financial statements are prepared based on the application of accounting policies, the most significant of which are described in Note 1 to the consolidated financial statements. The most critical of these significant accounting policies are discussed in the "Critical Accounting Policies" section of this financial review.
As a financial institution, the Corporation's principal activity is lending to and accepting deposits from businesses and individuals. The primary source of revenue is net interest income, which is derived principally from the difference between interest earned on loans and investment securities and interest paid on deposits and other funding sources. The Corporation also provides other products and services that meet the financial needs of customers and which generate noninterest income, the Corporation's secondary source of revenue. Growth in loans, deposits and noninterest income is affected by many factors, including economic conditions in the markets the Corporation serves, the financial requirements and health of customers, and successfully adding new customers and/or increasing the number of products used by current customers. Success in providing products and services depends on the financial needs of customers and the types of products desired.
More than half of the Corporation's revenues are generated by the Business Bank business segment, making the Corporation highly sensitive to changes in the business environment in its primary geographic markets. To facilitate better balance among business segments and geographic markets, the Corporation opened 10 new banking centers in 2009 in markets with favorable demographics and plans to continue banking center expansion in these markets. This is expected to provide opportunity for growth across all business segments, especially in the Retail Bank and Wealth & Institutional Management segments, as the Corporation penetrates existing relationships through cross-selling and develops new relationships.
For 2010, management expects the following, compared to 2009, based on a modestly improving economic environment:
- –
- Management expects low single-digit period-end to period-end loan growth. Investment securities available-for-sale are expected to remain at a level similar to year-end 2009.
- –
- Based on no increase in the Federal Funds rate, management expects an average full-year net interest margin between 3.15 percent and 3.25 percent, reflecting the benefit, compared to full-year 2009, from improved loan pricing, lower funding costs and a lower level of excess liquidity.
- –
- Management expects full-year net credit-related charge-offs to decrease to between $775 million and $825 million. The provision for credit losses is expected to be slightly in excess of net charge-offs.
- –
- Management expects flat noninterest income, after excluding $243 million of 2009 net securities gains.
- –
- Management expects a low single-digit decrease in noninterest expenses.
- –
- Management expects income tax expense to approximate 35 percent of income before income taxes less approximately $60 million of permanent differences related to low-income housing and bank-owned life insurance.
14
Table of Contents
ANALYSIS OF NET INTEREST INCOME
Fully Taxable Equivalent (FTE)
| | | | | | | | | | | | | | | | | | | | | | | | | | | | | | | |
| |
| | Years Ended December 31 | |
|---|
| |
| | 2009 | | 2008 | | 2007 | |
|---|
| |
| | Average
Balance | | Interest | | Average
Rate | | Average
Balance | | Interest | | Average
Rate | | Average
Balance | | Interest | | Average
Rate | |
|---|
| |
| | (dollar amounts in millions)
| |
|---|
Commercial loans (a)(b) | | $ | 24,534 | | $ | 890 | | | 3.63 | % | $ | 28,870 | | $ | 1,468 | | | 5.08 | % | $ | 28,132 | | $ | 2,038 | | | 7.25 | % |
Real estate construction loans | | | 4,140 | | | 121 | | | 2.92 | | | 4,715 | | | 231 | | | 4.89 | | | 4,552 | | | 374 | | | 8.21 | |
Commercial mortgage loans | | | 10,415 | | | 437 | | | 4.20 | | | 10,411 | | | 580 | | | 5.57 | | | 9,771 | | | 709 | | | 7.26 | |
Residential mortgage loans | | | 1,756 | | | 97 | | | 5.53 | | | 1,886 | | | 112 | | | 5.94 | | | 1,814 | | | 111 | | | 6.13 | |
Consumer loans | | | 2,553 | | | 94 | | | 3.68 | | | 2,559 | | | 130 | | | 5.08 | | | 2,367 | | | 166 | | | 7.00 | |
Lease financing (c) | | | 1,231 | | | 40 | | | 3.25 | | | 1,356 | | | 8 | | | 0.59 | | | 1,302 | | | 40 | | | 3.04 | |
International loans | | | 1,533 | | | 58 | | | 3.79 | | | 1,968 | | | 101 | | | 5.13 | | | 1,883 | | | 133 | | | 7.06 | |
Business loan swap income (expense) (d) | | | — | | | 34 | | | — | | | — | | | 24 | | | — | | | — | | | (67 | ) | | — | |
| | | | | | | | | | | | | | | | | | | | | | |
| | Total loans (b)(e) | | | 46,162 | | | 1,771 | | | 3.84 | | | 51,765 | | | 2,654 | | | 5.13 | | | 49,821 | | | 3,504 | | | 7.03 | |
Auction-rate securities available-for-sale | | | 1,010 | | | 15 | | | 1.47 | | | 193 | | | 6 | | | 2.95 | | | — | | | — | | | — | |
Other investment securities available-for-sale | | | 8,378 | | | 318 | | | 3.88 | | | 7,908 | | | 384 | | | 4.88 | | | 4,447 | | | 206 | | | 4.56 | |
| | | | | | | | | | | | | | | | | | | | | | |
| | Total investment securities available-for-sale (f) | | | 9,388 | | | 333 | | | 3.61 | | | 8,101 | | | 390 | | | 4.83 | | | 4,447 | | | 206 | | | 4.56 | |
Federal funds sold and securities purchased under agreements to resell | | | 18 | | | — | | | 0.32 | | | 93 | | | 2 | | | 2.08 | | | 164 | | | 9 | | | 5.28 | |
Interest-bearing deposits with banks (g) | | | 2,440 | | | 6 | | | 0.25 | | | 219 | | | 1 | | | 0.61 | | | 15 | | | 1 | | | 4.00 | |
Other short-term investments | | | 154 | | | 3 | | | 1.74 | | | 244 | | | 10 | | | 3.98 | | | 241 | | | 13 | | | 5.75 | |
| | | | | | | | | | | | | | | | | | | | | | |
| | Total earning assets | | | 58,162 | | | 2,113 | | | 3.64 | | | 60,422 | | | 3,057 | | | 5.06 | | | 54,688 | | | 3,733 | | | 6.82 | |
Cash and due from banks | | | 883 | | | | | | | | | 1,185 | | | | | | | | | 1,352 | | | | | | | |
Allowance for loan losses | | | (947 | ) | | | | | | | | (691 | ) | | | | | | | | (520 | ) | | | | | | |
Accrued income and other assets | | | 4,711 | | | | | | | | | 4,269 | | | | | | | | | 3,054 | | | | | | | |
| | | | | | | | | | | | | | | | | | | | | | | | | | | | |
| | Total assets | | $ | 62,809 | | | | | | | | $ | 65,185 | | | | | | | | $ | 58,574 | | | | | | | |
| | | | | | | | | | | | | | | | | | | | | | | | | | | | |
Money market and NOW deposits (a) | | $ | 12,965 | | | 63 | | | 0.49 | | $ | 14,245 | | | 207 | | | 1.45 | | $ | 14,937 | | | 460 | | | 3.08 | |
Savings deposits | | | 1,339 | | | 2 | | | 0.11 | | | 1,344 | | | 6 | | | 0.45 | | | 1,389 | | | 13 | | | 0.93 | |
Customer certificates of deposit | | | 8,131 | | | 183 | | | 2.26 | | | 8,150 | | | 263 | | | 3.23 | | | 7,687 | | | 342 | | | 4.45 | |
| | | | | | | | | | | | | | | | | | | | | | |
| | Total interest-bearing core deposits | | | 22,435 | | | 248 | | | 1.11 | | | 23,739 | | | 476 | | | 2.01 | | | 24,013 | | | 815 | | | 3.39 | |
Other time deposits (d)(h) | | | 4,103 | | | 121 | | | 2.96 | | | 6,715 | | | 232 | | | 3.45 | | | 5,563 | | | 300 | | | 5.39 | |
Foreign office time deposits (i) | | | 653 | | | 2 | | | 0.29 | | | 926 | | | 26 | | | 2.77 | | | 1,071 | | | 52 | | | 4.85 | |
| | | | | | | | | | | | | | | | | | | | | | |
| | Total interest-bearing deposits | | | 27,191 | | | 371 | | | 1.37 | | | 31,380 | | | 734 | | | 2.34 | | | 30,647 | | | 1,167 | | | 3.81 | |
Short-term borrowings | | | 1,000 | | | 2 | | | 0.24 | | | 3,763 | | | 87 | | | 2.30 | | | 2,080 | | | 105 | | | 5.06 | |
Medium- and long-term debt (d)(h) | | | 13,334 | | | 165 | | | 1.23 | | | 12,457 | | | 415 | | | 3.33 | | | 8,197 | | | 455 | | | 5.55 | |
| | | | | | | | | | | | | | | | | | | | | | |
| | Total interest-bearing sources | | | 41,525 | | | 538 | | | 1.29 | | | 47,600 | | | 1,236 | | | 2.59 | | | 40,924 | | | 1,727 | | | 4.22 | |
| | | | | | | | | | | | | | | | | | | | | | | | | |
Noninterest-bearing deposits (a) | | | 12,900 | | | | | | | | | 10,623 | | | | | | | | | 11,287 | | | | | | | |
Accrued expenses and other liabilities | | | 1,285 | | | | | | | | | 1,520 | | | | | | | | | 1,293 | | | | | | | |
Total shareholders' equity | | | 7,099 | | | | | | | | | 5,442 | | | | | | | | | 5,070 | | | | | | | |
| | | | | | | | | | | | | | | | | | | | | | | | | | | | |
| | Total liabilities and shareholders' equity | | $ | 62,809 | | | | | | | | $ | 65,185 | | | | | | | | $ | 58,574 | | | | | | | |
| | | | | | | | | | | | | | | | | | | | | | | | | | | | |
Net interest income/rate spread (FTE) | | | | | $ | 1,575 | | | 2.35 | | | | | $ | 1,821 | | | 2.47 | | | | | $ | 2,006 | | | 2.60 | |
| | | | | | | | | | | | | | | | | | | | | | | | | | | | |
FTE adjustment (j) | | | | | $ | 8 | | | | | | | | $ | 6 | | | | | | | | $ | 3 | | | | |
| | | | | | | | | | | | | | | | | | | | | | | | | | | | |
Impact of net noninterest-bearing sources of funds | | | | | | | | | 0.37 | | | | | | | | | 0.55 | | | | | | | | | 1.06 | |
| | | | | | | | | | | | | | | | | | | | | | | | | | | | |
Net interest margin (as a percentage of average earning assets (FTE) (b)(c)(g) | | | | | | | | | 2.72 | % | | | | | | | | 3.02 | % | | | | | | | | 3.66 | % |
| | | | | | | | | | | | | | | | | | | | | | | | | | | | |
| |
(a) | | FSD balances included above: | | | | | | | | | | | | | | | | | | | | | | | | | | | | |
| | Loans (primarily low-rate) | | $ | 210 | | $ | 3 | | | 1.65 | % | $ | 498 | | $ | 7 | | | 1.40 | % | $ | 1,318 | | $ | 9 | | | 0.69 | % |
| | Interest-bearing deposits | | | 448 | | | 2 | | | 0.54 | | | 957 | | | 19 | | | 1.99 | | | 1,202 | | | 47 | | | 3.91 | |
| | Noninterest-bearing deposits | | | 1,306 | | | | | | | | | 1,643 | | | | | | | | | 2,836 | | | | | | | |
(b) | | Impact of FSD loans (primarily low-rate) on the following: | | | | | | | | | | | | | | | | | | | | | | | | | | | | |
| | Commercial loans | | | | | | | | | (0.02 | )% | | | | | | | | (0.07 | )% | | | | | | | | (0.32 | )% |
| | Total loans | | | | | | | | | (0.01 | ) | | | | | | | | (0.03 | ) | | | | | | | | (0.18 | ) |
| | Net interest margin (FTE) (assuming loans were funded by noninterest-bearing deposits) | | | | | | | | | — | | | | | | | | | (0.01 | ) | | | | | | | | (0.08 | ) |
(c) | | 2008 net interest income declined $38 million and the net interest margin declined six basis points due to tax-related non-cash | |
| | lease income charges. Excluding these charges, the net interest margin would have been 3.08%. | |
(d) | | The gain or loss attributable to the effective portion of cash flow hedges of loans is shown in "Business loan swap income (expense)". The gain or loss attributable to the effective portion of fair value hedges of other time deposits and medium- and long-term debt, which totaled a net gain of $61 million in 2009, is included in the related interest expense line item. | |
(e) | | Nonaccrual loans are included in average balances reported and are used to calculate rates. | |
(f) | | Average rate based on average historical cost. | |
(g) | | Excess liquidity, represented by average balances deposited with the Federal Reserve Bank, reduced the net interest margin by 11 basis points and one basis point in 2009 and 2008, respectively, and had no impact on the net interest margin in 2007. Excluding excess liquidity, the net interest margin would have been 2.83% in 2009 and 3.03% in 2008. | |
(h) | | Other time deposits and medium- and long-term debt average balances have been adjusted to reflect the gain or loss attributable to the risk hedged by risk management swaps that qualify as fair value hedges. | |
(i) | | Includes substantially all deposits by foreign domiciled depositors; deposits are primarily in excess of $100,000. | |
(j) | | The FTE adjustment is computed using a federal income tax rate of 35%. | |
15
Table of Contents
RATE-VOLUME ANALYSIS
Fully Taxable Equivalent (FTE)
| | | | | | | | | | | | | | | | | | | | | |
| | 2009/2008 | | 2008/2007 | |
|---|
| | Increase
(Decrease)
Due to
Rate | | Increase
(Decrease)
Due to
Volume (a) | | Net
Increase
(Decrease) | | Increase
(Decrease)
Due to
Rate | | Increase
(Decrease)
Due to
Volume (a) | | Net
Increase
(Decrease) | |
|---|
| | (in millions)
| |
|---|
Interest income (FTE): | | | | | | | | | | | | | | | | | | | |
Loans: | | | | | | | | | | | | | | | | | | | |
| | Commercial loans | | $ | (421 | ) | $ | (157 | ) | $ | (578 | ) | $ | (608 | ) | $ | 38 | | $ | (570 | ) |
| | Real estate construction loans | | | (93 | ) | | (17 | ) | | (110 | ) | | (151 | ) | | 8 | | | (143 | ) |
| | Commercial mortgage loans | | | (143 | ) | | — | | | (143 | ) | | (165 | ) | | 36 | | | (129 | ) |
| | Residential mortgage loans | | | (8 | ) | | (7 | ) | | (15 | ) | | (3 | ) | | 4 | | | 1 | |
| | Consumer loans | | | (36 | ) | | — | | | (36 | ) | | (46 | ) | | 10 | | | (36 | ) |
| | Lease financing | | | 36 | | | (4 | ) | | 32 | | | (32 | ) | | — | | | (32 | ) |
| | International loans | | | (26 | ) | | (17 | ) | | (43 | ) | | (36 | ) | | 4 | | | (32 | ) |
| | Business loan swap income (expense) | | | 10 | | | — | | | 10 | | | 91 | | | — | | | 91 | |
| | | | | | | | | | | | | | |
| | | Total loans | | | (681 | ) | | (202 | ) | | (883 | ) | | (950 | ) | | 100 | | | (850 | ) |
Auction-rate securities available-for-sale | | | (3 | ) | | 12 | | | 9 | | | — | | | 6 | | | 6 | |
Other investment securities available-for-sale | | | (84 | ) | | 18 | | | (66 | ) | | 10 | | | 168 | | | 178 | |
| | | | | | | | | | | | | | |
| | | Total investment securities available-for-sale | | | (87 | ) | | 30 | | | (57 | ) | | 10 | | | 174 | | | 184 | |
Federal funds sold and securities purchased under agreements to resell | | | (2 | ) | | — | | | (2 | ) | | (5 | ) | | (2 | ) | | (7 | ) |
Interest-bearing deposits with banks | | | (1 | ) | | 6 | | | 5 | | | (1 | ) | | 1 | | | — | |
Other short-term investments | | | (2 | ) | | (5 | ) | | (7 | ) | | (4 | ) | | 1 | | | (3 | ) |
| | | | | | | | | | | | | | |
| | | Total interest income (FTE) | | | (773 | ) | | (171 | ) | | (944 | ) | | (950 | ) | | 274 | | | (676 | ) |
Interest expense: | | | | | | | | | | | | | | | | | | | |
Interest-bearing deposits: | | | | | | | | | | | | | | | | | | | |
| | Money market and NOW accounts | | | (138 | ) | | (6 | ) | | (144 | ) | | (242 | ) | | (11 | ) | | (253 | ) |
| | Savings deposits | | | (4 | ) | | — | | | (4 | ) | | (7 | ) | | — | | | (7 | ) |
| | Customer certificates of deposit | | | (79 | ) | | (1 | ) | | (80 | ) | | (94 | ) | | 15 | | | (79 | ) |
| | Other time deposits | | | (34 | ) | | (77 | ) | | (111 | ) | | (108 | ) | | 40 | | | (68 | ) |
| | Foreign office time deposits | | | (23 | ) | | (1 | ) | | (24 | ) | | (22 | ) | | (4 | ) | | (26 | ) |
| | | | | | | | | | | | | | |
| | | Total interest-bearing deposits | | | (278 | ) | | (85 | ) | | (363 | ) | | (473 | ) | | 40 | | | (433 | ) |
Short-term borrowings | | | (78 | ) | | (7 | ) | | (85 | ) | | (57 | ) | | 39 | | | (18 | ) |
Medium- and long-term debt | | | (262 | ) | | 12 | | | (250 | ) | | (182 | ) | | 142 | | | (40 | ) |
| | | | | | | | | | | | | | |
| | | Total interest expense | | | (618 | ) | | (80 | ) | | (698 | ) | | (712 | ) | | 221 | | | (491 | ) |
| | | | | | | | | | | | | | |
| | | Net interest income (FTE) | | $ | (155 | ) | $ | (91 | ) | $ | (246 | ) | $ | (238 | ) | $ | 53 | | $ | (185 | ) |
| | | | | | | | | | | | | | |
- (a)
- Rate/volume variances are allocated to variances due to volume.
16
Table of Contents
NET INTEREST INCOME
Net interest income is the difference between interest and yield-related fees earned on assets and interest paid on liabilities. Adjustments are made to the yields on tax-exempt assets in order to present tax-exempt income and fully taxable income on a comparable basis. Gains and losses related to the effective portion of risk management interest rate swaps that qualify as hedges are included with the interest income or expense of the hedged item when classified in net interest income. Net interest income on a fully taxable equivalent (FTE) basis comprised 60 percent of total revenues in 2009, compared to 67 percent in 2008 and 69 percent in 2007. The "Analysis of Net Interest Income-Fully Taxable Equivalent" table of this financial review provides an analysis of net interest income for the years ended December 31, 2009, 2008 and 2007. The rate-volume analysis in the table above details the components of the change in net interest income on a FTE basis for 2009, compared to 2008, and 2008, compared to 2007.
Net interest income was $1.6 billion in 2009, a decrease of $248 million, or 14 percent, compared to $1.8 billion in 2008. The decrease in net interest income in 2009 was primarily due to loan rates declining faster than deposit rates with late 2008 rate reductions, partially offset by increased loan spreads. On a FTE basis, net interest income was $1.6 billion in 2009, a decrease of $246 million, or 13 percent, from 2008. The net interest margin (FTE) decreased to 2.72 percent in 2009, from 3.02 percent in 2008, resulting primarily from the reasons cited for the decline in net interest income discussed above, as well as excess liquidity and the reduced contribution of noninterest-bearing funds in a significantly lower rate environment. The net interest margin was reduced by approximately 11 basis points in 2009 from excess liquidity, represented by $2.4 billion of average balances deposited with the FRB. The excess liquidity resulted from strong core deposit growth at a time when loan demand remained weak. Average earning assets decreased $2.2 billion, or four percent, to $58.2 billion in 2009, compared to 2008, primarily as a result of a $5.6 billion decrease in average loans, partially offset by increases of $2.2 billion in average interest-bearing deposits with the FRB and $1.3 billion in average investment securities available-for-sale.
The Corporation implements various asset and liability management tactics to manage net interest income exposure to interest rate risk. Refer to the "Interest Rate Risk" section of this financial review for additional information regarding the Corporation's asset and liability management policies.
In 2008, net interest income was $1.8 billion, a decrease of $188 million, or nine percent, from 2007. The decrease in net interest income in 2008 was primarily due to a decrease in loan portfolio yields, a competitive environment for deposit pricing, the impact of a higher level of nonaccrual loans and $38 million of tax-related non-cash charges to lease income, partially offset by growth in average earnings assets, largely driven by growth in investment securities available-for-sale. The lease income charges reflected the reversal of previously recognized income resulting from projected changes in the timing of income tax cash flows on certain structured leasing transactions and will fully reverse over the remaining lease terms. (Further information about the charges can be found in Note 20 to the consolidated financial statements). In 2008, net interest income (FTE) was $1.8 billion, a decrease of $185 million, or nine percent, from 2007. The net interest margin (FTE) decreased to 3.02 percent in 2008, from 3.66 percent in 2007, resulting primarily from the reasons cited for the decline in net interest income discussed above, and as a result of the change in the mix of both earning assets, driven by growth in investment securities available-for-sale, and interest-bearing sources of funds. The 2008 lease income charges discussed above reduced the net interest margin by six basis points. Average earning assets increased $5.7 billion, or 10 percent, to $60.4 billion in 2008, compared to 2007, primarily as a result of a $3.7 billion increase in average investment securities available-for-sale and a $1.9 billion increase in average loans.
Based on no increase in the Federal Funds rate, management expects an average full-year 2010 net interest margin between 3.15 percent and 3.25 percent, reflecting the benefit, compared to full-year 2009, from improved loan pricing, lower funding costs and a lower level of excess liquidity.
17
Table of Contents
PROVISION FOR CREDIT LOSSES
The provision for credit losses includes both the provision for loan losses and the provision for credit losses on lending-related commitments. The provision for loan losses reflects management's evaluation of the adequacy of the allowance for loan losses. The allowance for loan losses represents management's assessment of probable losses inherent in the Corporation's loan portfolio. The provision for credit losses on lending-related commitments, a component of "noninterest expenses" on the consolidated statements of income, reflects management's assessment of the adequacy of the allowance for credit losses on lending-related commitments. The allowance for credit losses on lending-related commitments, which is included in "accrued expenses and other liabilities" on the consolidated balance sheets, covers probable credit-related losses inherent in credit-related commitments, including letters of credit and financial guarantees. The Corporation performs a detailed credit quality review quarterly to determine the adequacy of both allowances. For a further discussion of both the allowance for loan losses and the allowance for credit losses on lending-related commitments, refer to the "Credit Risk" and the "Critical Accounting Policies" sections of this financial review.
The provision for loan losses was $1.1 billion in 2009, compared to $686 million in 2008 and $212 million in 2007. The $396 million increase in the provision for loan losses in 2009, compared to 2008, resulted primarily from challenges in the Middle Market (primarily the Midwest and Western markets), Commercial Real Estate in the Midwest, Florida and Texas markets (primarily residential real estate developments), Global Corporate Banking (primarily the Western and International markets), Leasing (primarily the Midwest market) and Private Banking (primarily the Western and Midwest markets) loan portfolios. Commercial Real Estate challenges in the Western market moderated in 2009, compared to 2008, but remained a significant portion of the Commercial Real Estate provision for loan losses. In the first half of 2009, the national economy was hampered by turmoil in the financial markets, declining home values and a global recession. Signs of growth in the national economy began in the third quarter of 2009, as the credit and capital markets began functioning at a more normal level and the housing market began to stabilize. The Michigan economy contracted sharply in the first half of 2009, but has recently shown signs of leveling off. The average Michigan Business Activity Index compiled by the Corporation for January through November 2009 declined 15 percent, compared to the average for the full-year 2008. However, the November 2009 index rebounded by nine percent from a low reached in May 2009, with particular strength noted in automotive and steel production. The Michigan Business Activity index represents nine different measures of Michigan economic activity compiled by the Corporation. The California economy continues to lag moderately behind the national economy, with ongoing declines in construction and the state's budget problems more severe than in most other states. However, the California Economic Activity Index compiled by the Corporation is signaling that a recovery is developing. The November 2009 index was up 12 percent from a low reached in March 2009, with all components of the index contributing to the upturn except nonfarm payrolls. The California Economic Activity Index equally weights nine, seasonally-adjusted coincident indicators of real economic activity compiled by the Corporation. A wide variety of economic reports indicate that Texas continued to outperform the nation in 2009. The Texas economy began contracting following the financial market turmoil in the fall of 2008, but has experienced a much more modest reduction in homebuilding than most other states, and the state's manufacturing sector is beginning to revive as domestic and export demand is on the rise. However, the state's energy sector was hit hard by the sharp drop in crude oil and natural gas prices. Forward-looking indicators suggest that economic conditions in the Corporation's primary geographic markets are likely to strengthen gradually as moderate national and global recoveries continue to develop. The increase in the provision for loan losses in 2008, when compared to 2007, was primarily the result of challenges in the residential real estate development business located in the Western market (primarily California) and to a lesser extent in the Middle Market and Small Business loan portfolios.
The provision for credit losses on lending-related commitments was a charge of less than $0.5 million in 2009, compared to a charge of $18 million in 2008 and a negative provision of $1 million in 2007. The $18 million decrease in the provision for credit losses on lending-related commitments in 2009, compared to 2008, resulted primarily from the cancellation and drawdown of letters of credit in the Midwest market and a reduction in unfunded commitment levels. The $19 million increase in 2008, compared to 2007, was primarily
18
Table of Contents
the result of an increase in specific reserves related to unused commitments extended to customers in the Commercial Real Estate business line in the Michigan and Western markets (largely residential real estate developments) and standby letters of credit extended to customers in the Michigan commercial real estate industry. An analysis of the changes in the allowance for credit losses on lending-related commitments is presented in the "Credit Risk" section of this financial review.
Net loan charge-offs in 2009 increased $397 million to $868 million, or 1.88 percent of average total loans, compared to $471 million, or 0.91 percent, in 2008 and $149 million, or 0.30 percent, in 2007. Total net credit-related charge-offs, which includes net charge-offs on both loans and lending-related commitments, were $869 million, or 1.88 percent of average total loans, in 2009, compared to $472 million, or 0.91 percent, in 2008 and 153 million, or 0.31 percent, in 2007. The $397 million increase in net credit-related charge-offs in 2009, compared to 2008, resulted primarily from increases in net credit-related charge-offs in the Middle Market ($133 million), Commercial Real Estate ($70 million), Global Corporate Banking ($55 million), Small Business ($41 million) and Leasing ($38 million) loan portfolios. By geographic market, net credit-related charge-offs in the Midwest and Western markets increased $199 million and $86 million, respectively, in 2009, compared to 2008. An analysis of the changes in the allowance for loan losses, including charge-offs and recoveries by loan category, is presented in the "Analysis of the Allowance for Loan Losses" table in the "Risk Management" section of this financial review. An analysis of the changes in the allowance for credit losses on lending-related commitments is presented in the "Credit Risk" section of this financial review.
Management expects full-year 2010 net credit-related charge-offs to decrease to between $775 million and $825 million. The provision for credit losses is expected to be slightly in excess of net charge-offs.
NONINTEREST INCOME
| | | | | | | | | | | |
| | Years Ended
December 31 | |
|---|
| | 2009 | | 2008 | | 2007 | |
|---|
| | (in millions)
| |
|---|
Service charges on deposit accounts | | $ | 228 | | $ | 229 | | $ | 221 | |
Fiduciary income | | | 161 | | | 199 | | | 199 | |
Commercial lending fees | | | 79 | | | 69 | | | 75 | |
Letter of credit fees | | | 69 | | | 69 | | | 63 | |
Card fees | | | 51 | | | 58 | | | 54 | |
Foreign exchange income | | | 41 | | | 40 | | | 40 | |
Bank-owned life insurance | | | 35 | | | 38 | | | 36 | |
Brokerage fees | | | 31 | | | 42 | | | 43 | |
Net securities gains | | | 243 | | | 67 | | | 7 | |
Other noninterest income | | | 112 | | | 82 | | | 150 | |
| | | | | | | | |
| | Total noninterest income | | $ | 1,050 | | $ | 893 | | $ | 888 | |
| | | | | | | | |
Noninterest income increased $157 million, or 18 percent, to $1.1 billion in 2009, compared to $893 million in 2008, and increased $5 million, or less than one percent, in 2008, compared to $888 million in 2007. Excluding net securities gains, noninterest income decreased two percent in 2009, compared to 2008, and six percent in 2008, compared to 2007. An analysis of increases and decreases by individual line item is presented below.
Service charges on deposit accounts decreased $1 million, or less than one percent, to $228 million in 2009, compared to $229 million in 2008, and increased $8 million, or three percent, in 2008, compared to $221 million in 2007. The increase in 2008 was primarily due to lower earnings credit allowances provided on deposit balances to business customers as a result of the interest rate environment.
19
Table of Contents
Fiduciary income decreased $38 million, or 19 percent, to $161 million in 2009, compared to $199 million in 2008, and was unchanged in 2008, compared to 2007. Personal and institutional trust fees are the two major components of fiduciary income. These fees are based on services provided and assets managed. Fluctuations in the market values of the underlying assets managed, which include both equity and fixed income securities, impact fiduciary income. The decrease in 2009 was primarily due to lower personal trust fees related to market value decline in late 2008 and a decline in institutional trust fees related to the sale of the Corporation's proprietary defined contribution plan recordkeeping business in the second quarter 2009. In 2008, lower fees related to market value decline were offset by net new business.
Commercial lending fees increased $10 million, or 14 percent, to $79 million in 2009, compared to a decrease of $6 million, or eight percent, in 2008. The majority of the increase in 2009 resulted from increased risk-adjusted pricing on unused commercial loan commitments. The decrease in 2008 resulted from lower participation fees and lower unused commercial loan commitments.
Letter of credit fees of $69 million were unchanged in 2009, compared to an increase of $6 million, or 10 percent, in 2008. The increase in 2008 was principally due to one-time adjustments related to the timing of recognition of letter of credit fees.
Card fees, which consist primarily of interchange fees earned on debit and commercial cards, decreased $7 million, or 13 percent, to $51 million in 2009, compared to $58 million in 2008, and increased $4 million, or nine percent, in 2008, compared to $54 million in 2007. The decline in 2009 resulted primarily from lower levels of retail and commercial card business activity. Growth in 2008 resulted primarily from an increase in transaction volume caused by the continued shift to electronic banking, new customer accounts and new products.
Foreign exchange income increased $1 million, or one percent, to $41 million in 2009, compared to $40 million in both 2008 and 2007.
Bank-owned life insurance income decreased $3 million, or eight percent, to $35 million in 2009, compared to an increase of $2 million, to $38 million in 2008. The decrease in 2009 resulted primarily from a decrease in death benefits received and reduced earnings on bank-owned life insurance policies. The increase in 2008 resulted primarily from an increase in death benefits received.
Brokerage fees of $31 million decreased $11 million, or 25 percent, in 2009, compared to a decrease of $1 million to $42 million in 2008. Brokerage fees include commissions from retail brokerage transactions and mutual fund sales and are subject to changes in the level of market activity. The decreases in 2009 and 2008 were primarily due to lower transaction and dollar volumes as a result of depressed market conditions.
Net securities gains increased $176 million, to $243 million in 2009, compared to an increase of $60 million, to $67 million in 2008. The increase in 2009 resulted primarily from gains on the sale of mortgage-backed government agency securities ($225 million) and gains on the redemption of auction-rate securities ($14 million), compared to gains resulting from the sales of the Corporation's ownership of Visa ($48 million) and MasterCard shares ($14 million) in 2008. Mortgage-backed government agency securities were sold in 2009 as market conditions were favorable and there was no longer a need to hold a large portfolio of fixed-rate securities to mitigate the impact of potential future rate declines on net interest income.
20
Table of Contents
Other noninterest income increased $30 million, or 37 percent, in 2009, compared to a decrease of $69 million, or 46 percent, in 2008. The following table illustrates fluctuations in certain categories included in "other noninterest income" on the consolidated statements of income.
| | | | | | | | | | | |
| | Years Ended
December 31 | |
|---|
| | 2009 | | 2008 | | 2007 | |
|---|
| | (in millions)
| |
|---|
Other noninterest income | | | | | | | | | | |
| | Gain on repurchase of debt | | $ | 15 | | $ | — | | $ | — | |
| | Deferred compensation asset returns (a) | | | 10 | | | (26 | ) | | 7 | |
| | Net gain on termination of leveraged leases | | | 8 | | | — | | | — | |
| | Net gain on sales of businesses | | | 5 | | | — | | | 3 | |
| | Gain on sale of SBA loans | | | — | | | 5 | | | 14 | |
| | Risk management hedge gains (losses) from interest rate and foreign exchange contracts | | | (6 | ) | | 8 | | | 3 | |
| | Net income (loss) from principal investing and warrants | | | (6 | ) | | (10 | ) | | 19 | |
| | Amortization of low income housing investments | | | (44 | ) | | (42 | ) | | (33 | ) |
- (a)
- Compensation deferred by the Corporation's officers is invested in stocks and bonds to reflect the investment selections of the officers. Income (loss) earned on these assets is reported in noninterest income and the offsetting increase (decrease) in the liability is reported in salaries expense.
Management expects flat noninterest income, after excluding $243 million of 2009 securities gains, in 2010, compared to 2009 levels.
NONINTEREST EXPENSES
| | | | | | | | | | | |
| | Years Ended December 31 | |
|---|
| | 2009 | | 2008 | | 2007 | |
|---|
| | (in millions)
| |
|---|
Salaries | | $ | 687 | | $ | 781 | | $ | 844 | |
Employee benefits | | | 210 | | | 194 | | | 193 | |
| | | | | | | | |
| | Total salaries and employee benefits | | | 897 | | | 975 | | | 1,037 | |
Net occupancy expense | | | 162 | | | 156 | | | 138 | |
Equipment expense | | | 62 | | | 62 | | | 60 | |
Outside processing fee expense | | | 97 | | | 104 | | | 91 | |
FDIC Insurance expense | | | 90 | | | 16 | | | 5 | |
Software expense | | | 84 | | | 76 | | | 63 | |
Other real estate expense | | | 48 | | | 10 | | | 7 | |
Legal fees | | | 37 | | | 29 | | | 24 | |
Litigation and operational losses | | | 10 | | | 103 | | | 18 | |
Customer services | | | 4 | | | 13 | | | 43 | |
Provision for credit losses on lending-related commitments | | | — | | | 18 | | | (1 | ) |
Other noninterest expenses | | | 159 | | | 189 | | | 206 | |
| | | | | | | | |
| | Total noninterest expenses | | $ | 1,650 | | $ | 1,751 | | $ | 1,691 | |
| | | | | | | | |
Noninterest expenses decreased $101 million, or six percent, to $1,650 million in 2009, compared to $1,751 million in 2008, and increased $60 million, or four percent, in 2008, from $1,691 million in 2007. Excluding an $88 million net charge related to the repurchase of auction-rate securities from certain customers in 2008, noninterest expenses decreased $13 million, or one percent, in 2009, compared to 2008. An analysis of increases and decreases by individual line item is presented below.
21
Table of Contents
The following table summarizes the various components of salaries and employee benefits expense.
| | | | | | | | | | | | |
| | Years Ended December 31 | |
|---|
| | 2009 | | 2008 | | 2007 | |
|---|
| | (in millions)
| |
|---|
Salaries | | | | | | | | | | |
| | Regular salaries (including contract labor) | | $ | 570 | | $ | 609 | | $ | 635 | |
| | Severance | | | 14 | | | 29 | | | 4 | |
| | Incentives (including commissions) | | | 60 | | | 117 | | | 138 | |
| | Deferred compensation plan costs | | | 11 | | | (25 | ) | | 8 | |
| | Share-based compensation | | | 32 | | | 51 | | | 59 | |
| | | | | | | | |
| | | Total salaries | | | 687 | | | 781 | | | 844 | |
Employee benefits | | | | | | | | | | |
| | Defined benefit pension expense | | | 57 | | | 20 | | | 36 | |
| | Severance-related benefits | | | 3 | | | 5 | | | — | |
| | Other employee benefits | | | 150 | | | 169 | | | 157 | |
| | | | | | | | |
| | | Total employee benefits | | | 210 | | | 194 | | | 193 | |
| | | | | | | | |
| | | Total salaries and employee benefits | | $ | 897 | | $ | 975 | | $ | 1,037 | |
| | | | | | | | |
Salaries expense decreased $94 million, or 12 percent, in 2009, compared to a decrease of $63 million, or seven percent, in 2008. The decrease in 2009 was primarily due to decreases in business unit and executive incentives ($57 million), regular salaries ($39 million), share-based compensation ($19 million) and severance ($15 million), partially offset by an increase in deferred compensation plan costs ($36 million). Business unit incentives are tied to new business and business unit profitability, while executive incentives are tied to the Corporation's overall performance and peer-based comparisons of results. The decrease in regular salaries in 2009 was primarily the result of a decrease in staff of approximately 850 full-time equivalent employees from year-end 2008 to year-end 2009. The increase in deferred compensation plan costs in 2009 was offset by increased deferred compensation asset returns in noninterest income. The decrease in salaries expense in 2008 was primarily due to decreases in deferred compensation plan costs ($33 million), regular salaries ($26 million), incentives ($21 million) and share-based compensation ($8 million), partially offset by an increase in severance expense ($25 million). The decrease in regular salaries in 2008 was primarily the result of the refinement to the deferral of costs associated with loan origination, as described in Note 1 to the consolidated financial statements, and a decrease in staff of approximately 600 full-time equivalent employees from year-end 2007 to year-end 2008.
Employee benefits expense increased $16 million, or eight percent, in 2009, compared to an increase of $1 million, or one percent, in 2008. The increase in 2009 resulted primarily from an increase in defined benefit pension expense. In 2008, when compared to 2007, increases in staff insurance costs and severance-related benefits, were substantially offset by a decline in defined benefit pension expense. For a further discussion of defined benefit pension expense, refer to the "Critical Accounting Policies" section of this financial review and Note 19 to the consolidated financial statements.
Net occupancy and equipment expense increased $6 million, or three percent, to $224 million in 2009, compared to an increase of $20 million, or 10 percent, in 2008. Net occupancy and equipment expense increased $7 million and $11 million in 2009 and 2008, respectively, due to the addition of new banking centers since the banking center expansion program began in late 2004.
Outside processing fee expense decreased $7 million, or seven percent, to $97 million in 2009, from $104 million in 2008, compared to an increase of $13 million, or 13 percent, in 2008. The decrease in 2009 was largely due to lower volumes in activity-based processing charges resulting from the sale of the Corporation's proprietary defined contribution plan recordkeeping business. The increase in 2008 was due to higher volumes in activity-based processing charges, in part related to outsourcing.
22
Table of Contents
FDIC insurance expense increased $74 million to $90 million in 2009, compared to an increase of $11 million in 2008. The increase in 2009 was primarily due to a second quarter 2009 industry-wide special assessment charge ($29 million), an increase in base assessment rates and a surcharge related to the Corporation's participation in the Temporary Liquidity Guarantee Program. For additional information regarding the Temporary Liquidity Guarantee Program, refer to the "Deposits and Borrowed Funds" portion of the "Balance Sheet and Capital Funds Analysis" section of this financial review. The increase in 2008 reflected the exhaustion of a one-time credit against which deposit insurance assessments had been applied from 2007 through mid-2008.
Software expense increased $8 million, or 10 percent, in 2009, compared to an increase of $13 million, or 21 percent, in 2008. The increase in 2009 was mostly due to a full year of amortization expense for investments in technology throughout 2008. The increase in 2008 was primarily due to increased investments in technology, including treasury management, sales tracking tools, anti-money laundering initiatives, transition from paper to electronic check processing and the continued development of loan portfolio and enterprise level analytical tools, combined with an increase in maintenance costs.
Other real estate expenses increased $38 million to $48 million in 2009, from $10 million in 2008, and increased $3 million in 2008, compared to 2007. Other real estate expenses reflects write-downs, net gains (losses) on sales and carrying costs related primarily to foreclosed property. The increase in 2009 was primarily due to write-downs on foreclosed property of $34 million in 2009 reflecting continued declines in property values. For additional information regarding foreclosed property, refer to the "Nonperforming Assets" portion of the "Credit Risk" section of this financial review.
Legal fees increased $8 million to $37 million in 2009, from $29 million in 2008, and increased $5 million in 2008, compared to 2007. The increase in 2009 was primarily due to increased loan workout and collection expenses, partially offset by lower other litigation expenses.
Litigation and operational losses decreased $93 million to $10 million in 2009, from $103 million in 2008, and increased $85 million in 2008, compared to $18 million in 2007. Litigation and operational losses include traditionally defined operating losses, such as fraud and processing losses, as well as uninsured losses and litigation losses. These expenses are subject to fluctuation due to timing of authorized and actual litigation settlements, as well as insurance settlements. Litigation and operational losses in 2008 included a net charge of $88 million related to the repurchase of auction-rate securities from certain customers, partially offset by a 2008 reversal of a $13 million loss sharing expense related to the Corporation's membership in Visa recognized in 2007. For additional information on the repurchase of auction-rate securities, refer to the "Investment Securities Available-for-Sale" portion of the "Balance Sheet and Capital Funds Analysis" section and "Critical Accounting Policies" section of this financial review and Note 4 to the consolidated financial statements.
Customer services expense decreased $9 million, or 71 percent, to $4 million in 2009, from $13 million in 2008, and decreased $30 million, or 69 percent, in 2008, from $43 million in 2007. Customer services expense represents certain expenses paid on behalf of particular customers, and is one method to attract and retain title and escrow deposits in the Financial Services Division. The amount of customer services expense varies from period to period as a result of changes in the level of noninterest-bearing deposits and low-rate loans in the Financial Services Division and the earnings credit allowances provided on these deposits, as well as the competitive environment. Average Financial Services Division noninterest-bearing deposits and loans decreased $337 million and $288 million, in 2009, compared to 2008, respectively.
The provision for credit losses on lending-related commitments decreased $18 million to a charge of less than $0.5 million in 2009, from a charge of $18 million in 2008, and increased $19 million in 2008, compared to a negative provision of $1 million in 2007. For additional information on the provision for credit losses on lending-related commitments, refer to the "Provision for Credit Losses" section of this financial review and Note 1 to the consolidated financial statements.
Other noninterest expenses decreased $30 million, or 15 percent, in 2009, and decreased $17 million, or eight percent, in 2008. The decrease in 2009 was due in part to a decrease of $11 million, or 40 percent, in travel and entertainment expenses. The decrease in 2008 was due to nominal decreases in several categories.
23
Table of Contents
Management expects a low single-digit decrease in noninterest expenses in 2010 compared to 2009 levels.
INCOME TAXES AND TAX-RELATED ITEMS
The provision for income taxes was a benefit of $131 million in 2009, compared to provisions of $59 million in 2008 and $306 million in 2007. The income tax benefit in 2009 reflected the decrease in income before taxes compared to 2008 and a benefit of $14 million related to the settlement of certain tax matters due to the audit of years 2001-2004, the filing of certain amended state tax returns and the reduction of tax interest due to anticipated refunds due from the Internal Revenue Service (IRS). The provision for income taxes in 2008 reflected the impact of lower pre-tax income compared to 2007 and included a net after-tax charge of $9 million related to the acceptance of a global settlement offered by the IRS on certain structured leasing transactions, settlement with the IRS on disallowed foreign tax credits related to a series of loans to foreign borrowers and other tax adjustments.
The Corporation had a net deferred tax asset of $158 million at December 31, 2009. Included in net deferred taxes at December 31, 2009 were deferred tax assets of $678 million, net of a $1 million valuation allowance established for certain state deferred tax assets. A valuation allowance is provided when it is "more-likely-than-not" that some portion of the deferred tax asset will not be realized. Deferred tax assets are evaluated for realization based on available evidence of loss carryback capacity, projected future reversals of existing taxable temporary differences and assumptions made regarding future events.
Management expects 2010 income tax expense to approximate 35 percent of income before income taxes less approximately $60 million of permanent differences related to low-income housing and bank-owned life insurance.
INCOME FROM DISCONTINUED OPERATIONS, NET OF TAX
Income from discontinued operations, net of tax, was $1 million in both 2009 and 2008 and $4 million in 2007. Income from discontinued operations in 2007 included adjustments to the initial gain recorded on the sale of Munder Capital Management (Munder) in 2006. For further information on the sale of Munder and discontinued operations, refer to Note 26 to the consolidated financial statements.
PREFERRED STOCK DIVIDENDS
In the fourth quarter 2008, the Corporation participated in the U.S. Department of Treasury (U.S. Treasury) Capital Purchase Program (the Capital Purchase Program) and received proceeds of $2.25 billion from the U. S. Treasury. In return, the Corporation issued 2.25 million shares of Fixed Rate Cumulative Perpetual Preferred Stock, Series F, without par value (preferred shares) and granted a warrant to purchase 11.5 million shares of common stock to the U.S. Treasury. The preferred shares pay a cumulative dividend rate of five percent per annum on the liquidation preference of $1,000 per share.
The proceeds from the Capital Purchase Program were allocated between the preferred shares and the related warrant based on relative fair value, which resulted in an initial carrying value of $2.1 billion for the preferred shares and $124 million for the warrant. The resulting discount to the preferred shares of $124 million accretes on a level yield basis over five years through November 2013 and is being recognized as additional preferred stock dividends.
Preferred stock dividends were $134 million for the year ended December 31, 2009, which included $112 million of cash dividends and $22 million of discount accretion. Preferred stock dividends, including accretion of the discount, were $17 million for the fourth quarter 2008 and the year ended December 31, 2008.
For further information on the Capital Purchase Program, refer to the "Capital" section of this financial review and Note 15 to the consolidated financial statements.
At such time as feasible, management intends to redeem the $2.25 billion of Fixed Rate Cumulative Perpetual Preferred Stock issued to the U.S. Treasury, with careful consideration given to the economic environment.
24
Table of Contents
STRATEGIC LINES OF BUSINESS
BUSINESS SEGMENTS
The Corporation's operations are strategically aligned into three major business segments: the Business Bank, the Retail Bank and Wealth & Institutional Management. These business segments are differentiated based upon the products and services provided. In addition to the three major business segments, the Finance Division is also reported as a segment. The Other category includes discontinued operations and items not directly associated with these business segments or the Finance Division. Note 24 to the consolidated financial statements describes the business activities of each business segment and the methodologies which form the basis for these results, and presents financial results of these business segments for the years ended December 31, 2009, 2008 and 2007.
The following table presents net income (loss) by business segment.
| | | | | | | | | | | | | | | | | | | | |
| | Years Ended December 31 | |
|---|
| | 2009 | | 2008 | | 2007 | |
|---|
| | (dollar amounts in millions)
| |
|---|
Business Bank | | $ | 147 | | | 104 | % | $ | 237 | | | 89 | % | $ | 516 | | | 72 | % |
Retail Bank | | | (48 | ) | | (34 | ) | | 34 | | | 13 | | | 128 | | | 18 | |
Wealth & Institutional Management (a) | | | 43 | | | 30 | | | (4 | ) | | (2 | ) | | 70 | | | 10 | |
| | | | | | | | | | | | | | |
| | | 142 | | | 100 | % | | 267 | | | 100 | % | | 714 | | | 100 | % |
Finance | | | (110 | ) | | | | | (48 | ) | | | | | (38 | ) | | | |
Other (b) | | | (15 | ) | | | | | (6 | ) | | | | | 10 | | | | |
| | | | | | | | | | | | | | | | | |
| | Total | | $ | 17 | | | | | $ | 213 | | | | | $ | 686 | | | | |
| | | | | | | | | | | | | | | | | |
- (a)
- 2008 included an $88 million net charge ($56 million, after-tax) related to the repurchase of auction-rate securities from customers.
- (b)
- Includes discontinued operations and items not directly associated with the three major business segments or the Finance Division.
The Business Bank's net income decreased $90 million, or 38 percent, to $147 million in 2009, compared to a decrease of $279 million, or 54 percent, to $237 million in 2008. Net interest income (FTE) was $1.3 billion in 2009, an increase of $51 million, or four percent, compared to 2008. The increase in net interest income (FTE) was primarily due to an increase in loan spreads and a $402 million increase in average deposits, partially offset by a $5.5 billion decrease in average loans. The provision for loan losses increased $317 million to $860 million in 2009, from $543 million in 2008, primarily due to increases in reserves for the Middle Market, Commercial Real Estate (in the Midwest, Florida and Texas markets), Leasing and Global Corporate Banking loan portfolios, partially offset by a reduction in reserves for Western residential real estate developers (primarily in California). Net credit-related charge-offs of $712 million increased $320 million, primarily due to an increase in charge-offs in the Middle Market, Commercial Real Estate, Global Corporate Banking, Small Business and Leasing loan portfolios. Noninterest income of $291 million in 2009 decreased $11 million from 2008, primarily due to a $14 million gain on the sale of MasterCard shares in 2008 and decreases in income from customer derivatives ($11 million), card fees ($7 million) and investment banking fees ($5 million), partially offset by increases in warrant income ($9 million), commercial lending fees ($7 million) and service charges on deposits ($5 million), and an $8 million 2009 net gain on the termination of leveraged leases. Noninterest expenses of $638 million in 2009 decreased $71 million from 2008, primarily due to decreases in allocated net corporate overhead expenses ($54 million), incentive compensation ($26 million), customer services expense ($10 million), salaries expense ($9 million), the provision for credit losses on lending-related commitments ($6 million), travel and entertainment expense ($5 million) and smaller decreases in several other expense categories, partially offset by increases in other real estate expenses ($33 million) and FDIC insurance expense ($27 million). The corporate overhead allocation rates used were approximately 3.3 percent and 6.1 percent in 2009 and 2008, respectively.
25
Table of Contents
The decrease in rate in 2009, when compared to 2008, resulted primarily from an increase in funding credits due to the preferred stock issued to the U.S. Treasury.
The Retail Bank's net income decreased $82 million to a net loss of $48 million in 2009, compared to a decrease of $94 million, to net income of $34 million in 2008. Net interest income (FTE) of $510 million decreased $56 million, or 10 percent, in 2009, primarily due to a decline in deposit spreads caused by a competitive pricing environment, a decline in loan spreads and a decrease in average loans ($335 million), partially offset by an increase in average deposit balances ($444 million). The provision for loan losses increased $20 million to $143 million in 2009, primarily due to increases in reserves for the Personal Banking loan portfolio (primarily the Midwest market). Noninterest income of $190 million decreased $68 million in 2009, from $258 million in 2008, primarily due to a $48 million gain on the sale of Visa shares in 2008, a decrease in service charges on deposit accounts ($6 million) and a decline in net gains from the sale of Small Business loans and the early 2008 discontinuation of student loan sales ($5 million). Noninterest expenses of $642 million in 2009 decreased $3 million from 2008, primarily due to decreases in allocated net corporate overhead expenses ($25 million), salaries expense ($17 million) and smaller decreases in several other expense categories, partially offset by increases in FDIC insurance expense ($31 million) and net occupancy expense ($7 million), and the first quarter 2008 reversal of a $13 million Visa loss sharing expense recognized in 2007. Refer to the Business Bank discussion above for an explanation of the decrease in allocated net corporate overhead expenses.
Wealth & Institutional Management's net income increased $47 million to $43 million in 2009, compared to a decrease of $74 million to a net loss of $4 million in 2008. Net interest income (FTE) of $161 million increased $13 million, or eight percent, in 2009, compared to 2008, primarily due to increases in average deposits ($221 million) and average loans ($216 million), and an improvement in loan spreads from 2008. The provision for loan losses increased $37 million to $62 million, primarily due to an increase in reserves for the Private Banking loan portfolio. Noninterest income of $269 million decreased $23 million, or eight percent, in 2009, primarily due to decreases in fiduciary income ($37 million) and brokerage fees ($11 million), partially offset by an increase in gains on the redemption of auction-rate-securities ($10 million), an increase in investment banking fees ($9 million) and a $5 million gain on the second quarter 2009 sale of the Corporation's proprietary defined contribution plan recordkeeping business. The decrease in fiduciary income was primarily due to lower personal trust fees related to market value decline in late 2008 and a decline in institutional trust fees related to the second quarter 2009 sale of the Corporation's proprietary defined contribution plan recordkeeping business. Noninterest expenses of $302 million in 2009 decreased $120 million from 2008, primarily due to the $88 million net charge related to the repurchase of auction-rate securities in 2008, decreases in allocated net corporate overhead expenses ($13 million) and incentive compensation ($8 million), and smaller decreases in several other expense categories, partially offset by an increase in FDIC insurance expense ($5 million). Refer to the Business Bank discussion above for an explanation of the decrease in allocated net corporate overhead expenses.
The net loss in the Finance Division was $110 million in 2009, compared to a net loss of $48 million in 2008. Contributing to the $62 million increase in net loss was a $314 million decline in net interest income (FTE), primarily due to the Corporation's internal funds transfer policy. In the current low rate environment, the Finance Division provided a greater benefit for deposits, particularly noninterest-bearing deposits, to the three major business segments in 2009 than was actually realized at the corporate level. Noninterest expenses increased $6 million primarily due to an increase in FDIC insurance expense ($6 million). Partially offsetting these items was an increase of $224 million in noninterest income, resulting primarily from $225 million of gains on the sale of mortgage-backed government agency securities in 2009.
The net loss in the Other category was $15 million in 2009, compared to a net loss of $6 million in 2008. The increase in net loss of $9 million was primarily due to timing differences between when corporate overhead expenses are reflected as a consolidated expense and when the expenses are allocated to the business segments.
26
Table of Contents
GEOGRAPHIC MARKET SEGMENTS
The Corporation's management accounting system also produces market segment results for the Corporation's four primary geographic markets: Midwest, Western, Texas and Florida. In addition to the four primary geographic markets, Other Markets and International are also reported as market segments. The Finance & Other Businesses category includes discontinued operations and items not directly associated with the market segments. Note 24 to the consolidated financial statements presents a description of each of these market segments as well as the financial results for the years ended December 31, 2009, 2008 and 2007.
The following table presents net income (loss) by market segment.
| | | | | | | | | | | | | | | | | | | | |
| | Years Ended December 31 | |
|---|
| | 2009 | | 2008 | | 2007 | |
|---|
| | (dollar amounts in millions)
| |
|---|
Midwest | | $ | 37 | | | 26 | % | $ | 205 | | | 77 | % | $ | 294 | | | 40 | % |
Western | | | (14 | ) | | (10 | ) | | (19 | ) | | (7 | ) | | 190 | | | 27 | |
Texas | | | 40 | | | 28 | | | 53 | | | 20 | | | 84 | | | 12 | |
Florida | | | (23 | ) | | (16 | ) | | (13 | ) | | (5 | ) | | 7 | | | 1 | |
Other Markets (a) | | | 78 | | | 55 | | | 12 | | | 4 | | | 89 | | | 13 | |
International | | | 24 | | | 17 | | | 29 | | | 11 | | | 50 | | | 7 | |
| | | | | | | | | | | | | | |
| | | 142 | | | 100 | % | | 267 | | | 100 | % | | 714 | | | 100 | % |
Finance & Other Businesses (b) | | | (125 | ) | | | | | (54 | ) | | | | | (28 | ) | | | |
| | | | | | | | | | | | | | | | | |
| | Total | | $ | 17 | | | | | $ | 213 | | | | | $ | 686 | | | | |
| | | | | | | | | | | | | | | | | |
- (a)
- 2008 included an $88 million net charge ($56 million, after-tax) related to the repurchase of auction-rate securities from customers.
- (b)
- Includes discontinued operations and items not directly associated with the market segments.
The Midwest market's net income decreased $168 million, or 82 percent, to $37 million in 2009, compared to a decrease of $89 million, or 30 percent, to $205 million in 2008. Net interest income (FTE) of $807 million increased $31 million from 2008, primarily due to $38 million of tax-related non-cash charges to income related to certain structured leasing transactions in 2008, an increase in loan spreads and the benefit provided by an increase in average deposit balances ($1.1 billion), partially offset by a decrease in average loan balances ($2.1 billion) and a decline in deposit spreads resulting from a significantly lower rate environment. The provision for loan losses increased $293 million, to $448 million in 2009, compared to 2008, primarily due to increases in reserves for the Middle Market, Commercial Real Estate (primarily residential real estate developments) and Leasing loan portfolios. Net credit-related charge-offs increased $199 million, largely due to increases in the Middle Market, Leasing, Commercial Real Estate and Small Business loan portfolios. Noninterest income of $435 million in 2009 decreased $89 million from 2008, primarily due to gains of $39 million on the sale of Visa shares and $14 million on the sale of MasterCard shares in 2008, and decreases in fiduciary income ($28 million), service charges on deposit accounts ($9 million) and card fees ($8 million). Partially offsetting these decreases was an increase in investment banking fees ($9 million) and an $8 million 2009 net gain on the termination of leveraged leases. Noninterest expenses of $761 million in 2009 decreased $52 million from 2008, primarily due to decreases in allocated net corporate overhead expenses ($41 million), incentive compensation ($13 million), the provision for credit losses on lending-related commitments ($7 million), service fees ($6 million) and smaller decreases in several other expense categories, partially offset by increases in FDIC insurance expense ($30 million) and other real estate expenses ($12 million), and the first quarter 2008 reversal of a $10 million Visa loss sharing arrangement expense recognized in 2007. Refer to the Business Bank discussion above for an explanation of the decrease in allocated net corporate overhead expenses.
The net loss in the Western market decreased $5 million to $14 million in 2009, compared to a $209 million decrease in net income to a net loss of $19 million in 2008. Net interest income (FTE) of $623 million decreased
27
Table of Contents
$45 million, or seven percent, in 2009, primarily due to declines in average loan balances ($2.3 billion) and average Financial Services Division deposits ($829 million), and the reduced value of these deposits due to the low interest rate environment, partially offset by an increase in loan spreads. The provision for loan losses decreased $21 million, to $358 million in 2009, from $379 million in 2008, primarily due to a reduction in reserves for the Commercial Real Estate loan portfolio (primarily residential real estate developers in California), partially offset by increases in reserves for the Global Corporate Banking and Middle Market loan portfolios. Net credit-related charge-offs increased $86 million, largely due to increases in charge-offs in the Global Corporate Banking and Middle Market loan portfolios. Noninterest income was $133 million in 2009, a decrease of $6 million from 2008, primarily due to a $5 million decrease in customer derivative income and smaller decreases in several other income categories, partially offset by increases in warrant income ($8 million) and service charges on deposits ($6 million). Noninterest expenses of $432 million in 2009 decreased $16 million from 2008, primarily due to decreases in allocated net corporate overhead expenses ($26 million), incentive compensation ($11 million) and customer services expense ($9 million), and smaller decreases in several other expense categories, partially offset by increases in other real estate expenses ($20 million), FDIC insurance expense ($19 million) and net occupancy expense ($6 million). Refer to the Business Bank discussion above for an explanation of the decrease in allocated net corporate overhead expenses.
The Texas market's net income decreased $13 million, or 25 percent, to $40 million in 2009, compared to a decrease of $31 million, or 37 percent, to $53 million in 2008. Net interest income (FTE) of $298 million increased $6 million, or two percent, in 2009, compared to 2008. The increase in net interest income (FTE) was primarily due to an increase in loan spreads and the benefit provided by an increase of $489 million in average deposit balances, partially offset by declines in deposit spreads. The provision for loan losses increased $34 million, primarily due to increases in reserves for the Commercial Real Estate and Middle Market loan portfolios in 2009, compared to 2008. Noninterest income of $86 million in 2009 decreased $8 million from 2008, primarily due to a $7 million gain on the sale of Visa shares in 2008. Noninterest expenses of $238 million in 2009 decreased $8 million from 2008, primarily due to a decrease in allocated net corporate overhead expenses ($13 million), partially offset by smaller increases in several other expense categories. Refer to the Business Bank discussion above for an explanation of the decrease in allocated net corporate overhead expenses.
The Florida market's net loss increased $10 million to $23 million in 2009, compared to a decrease in net income of $20 million to a net loss of $13 million in 2008. Net interest income (FTE) of $44 million in 2009 decreased $3 million, or seven percent, from 2008, primarily due to a $147 million decrease in average loan balances. The provision for loan losses increased $19 million and net credit-related charge-offs increased $21 million, primarily due to the Commercial Real Estate loan portfolio. Noninterest income of $12 million in 2009 decreased $4 million from 2008, primarily due to a decrease in customer derivative income. Noninterest expenses of $37 million in 2009 decreased $5 million from 2008 due to small decreases in several expense categories.
The Other Markets' net income increased $66 million to $78 million in 2009, compared to a decrease of $77 million to $12 million in 2008. Net interest income (FTE) of $158 million in 2009 increased $11 million from 2008, primarily due to an increase in loan spreads and a $212 million increase in average deposit balances, partially offset by a $334 million decrease in average loans. The provision for loan losses increased $20 million, primarily due to an increase in reserves for the Middle Market and Commercial Real Estate loan portfolios, partially offset by a decrease in reserves in the Global Corporate Banking loan portfolio. Net credit-related charge-offs increased $46 million, primarily due to an increase in charge-offs in the Commercial Real Estate loan portfolio. Noninterest income of $51 million increased $3 million in 2009, compared to 2008, primarily due to a $10 million increase in gains on the redemption of auction-rate securities and a gain of $5 million on the second quarter 2009 sale of the Corporation's proprietary defined contribution plan recordkeeping business, partially offset by a $5 million decrease in investment banking fees and smaller decreases in several other income categories. Noninterest expenses of $83 million in 2009 decreased $103 million from 2008, primarily due to the $88 million net charge related to the repurchase of auction-rate securities in 2008 and decreases in incentive
28
Table of Contents
compensation ($16 million) and allocated net corporate overhead expenses ($7 million). Refer to the Business Bank discussion above for an explanation of the decrease in allocated net corporate overhead expenses.
The International market's net income decreased $5 million, to $24 million in 2009, compared to a decrease of $21 million to $29 million in 2008. Net interest income (FTE) of $69 million in 2009 increased $8 million from 2008, primarily due to an increase in loan spreads, partially offset by a $330 million decrease in average loan balances. The provision for loan losses of $33 million in 2009 increased $29 million from $4 million in 2008. Noninterest income of $33 million in 2009 increased $2 million from 2008. Noninterest expenses of $31 million decreased $10 million in 2009 compared to 2008, primarily due to small decreases in several expense categories.
The net loss for the Finance & Other Business segment was $125 million in 2009, compared to a net loss of $54 million in 2008. The $71 million increase in net loss resulted from the same reasons noted in the Finance Division and Other category discussions under the "Business Segments" heading above.
The following table lists the Corporation's banking centers by geographic market segment.
| | | | | | | | | | | |
| | December 31 | |
|---|
| | 2009 | | 2008 | | 2007 | |
|---|
Midwest (Michigan) | | | 232 | | | 233 | | | 237 | |
Western: | | | | | | | | | | |
| | California | | | 98 | | | 96 | | | 83 | |
| | Arizona | | | 16 | | | 12 | | | 8 | |
| | | | | | | | |
| | | 114 | | | 108 | | | 91 | |
Texas | | | 90 | | | 87 | | | 79 | |
Florida | | | 10 | | | 10 | | | 9 | |
International | | | 1 | | | 1 | | | 1 | |
| | | | | | | | |
| | Total | | | 447 | | | 439 | | | 417 | |
| | | | | | | | |
29
Table of Contents
BALANCE SHEET AND CAPITAL FUNDS ANALYSIS
Total assets were $59.2 billion at December 31, 2009, a decrease of $8.3 billion from $67.5 billion at December 31, 2008. On an average basis, total assets decreased $2.4 billion to $62.8 billion in 2009, from $65.2 billion in 2008, resulting primarily from a decrease in loans ($5.6 billion), partially offset by increases in interest-bearing deposits with the FRB ($2.2 billion) and investment securities available-for-sale ($1.3 billion). Also, on an average basis, total liabilities decreased $4.0 billion to $55.7 billion in 2009, from $59.7 billion in 2008, resulting primarily from decreases of $4.2 billion in interest-bearing deposits and $2.8 billion in short-term borrowings, partially offset by increases of $2.3 billion in noninterest-bearing deposits and $877 million in medium- and long-term debt.
ANALYSIS OF INVESTMENT SECURITIES AND LOANS
| | | | | | | | | | | | | | | | | | |
| | December 31 | |
|---|
| | 2009 | | 2008 | | 2007 | | 2006 | | 2005 | |
|---|
| | (in millions)
| |
|---|
U.S. Treasury and other U.S. government agency securities | | $ | 103 | | $ | 79 | | $ | 36 | | $ | 46 | | $ | 124 | |
Government-sponsored enterprise residential mortgage-backed securities | | | 6,261 | | | 7,861 | | | 6,165 | | | 3,497 | | | 3,954 | |
State and municipal securities | | | 47 | | | 66 | | | 3 | | | 4 | | | 4 | |
Corporate debt securities: | | | | | | | | | | | | | | | | |
| | Auction-rate debt securities | | | 150 | | | 147 | | | — | | | — | | | — | |
| | Other corporate debt securities | | | 50 | | | 42 | | | 46 | | | 46 | | | 58 | |
Equity and other non-debt securities: | | | | | | | | | | | | | | | | |
| | Auction-rate preferred securities | | | 706 | | | 936 | | | — | | | — | | | — | |
| | Money market and other mutual funds | | | 99 | | | 70 | | | 46 | | | 69 | | | 100 | |
| | | | | | | | | | | | |
| | | Total investment securities available-for-sale | | $ | 7,416 | | $ | 9,201 | | $ | 6,296 | | $ | 3,662 | | $ | 4,240 | |
| | | | | | | | | | | | |
Commercial loans | |
$ |
21,690 | |
$ |
27,999 | |
$ |
28,223 | |
$ |
26,265 | |
$ |
23,545 | |
Real estate construction loans: | | | | | | | | | | | | | | | | |
| | Commercial Real Estate business line (a) | | | 2,988 | | | 3,831 | | | 4,089 | | | 3,449 | | | 2,831 | |
| | Other business lines (b) | | | 473 | | | 646 | | | 727 | | | 754 | | | 651 | |
| | | | | | | | | | | | |
| | | Total real estate construction loans | | | 3,461 | | | 4,477 | | | 4,816 | | | 4,203 | | | 3,482 | |
Commercial mortgage loans: | | | | | | | | | | | | | | | | |
| | Commercial Real Estate business line (a) | | | 1,824 | | | 1,619 | | | 1,377 | | | 1,534 | | | 1,450 | |
| | Other business lines (b) | | | 8,633 | | | 8,870 | | | 8,671 | | | 8,125 | | | 7,417 | |
| | | | | | | | | | | | |
| | | Total commercial mortgage loans | | | 10,457 | | | 10,489 | | | 10,048 | | | 9,659 | | | 8,867 | |
Residential mortgage loans | | | 1,651 | | | 1,852 | | | 1,915 | | | 1,677 | | | 1,485 | |
Consumer loans: | | | | | | | | | | | | | | | | |
| | Home equity | | | 1,803 | | | 1,781 | | | 1,616 | | | 1,591 | | | 1,775 | |
| | Other consumer | | | 708 | | | 811 | | | 848 | | | 832 | | | 922 | |
| | | | | | | | | | | | |
| | | Total consumer loans | | | 2,511 | | | 2,592 | | | 2,464 | | | 2,423 | | | 2,697 | |
Lease financing | | | 1,139 | | | 1,343 | | | 1,351 | | | 1,353 | | | 1,295 | |
International loans: | | | | | | | | | | | | | | | | |
| | Government and official institutions | | | — | | | — | | | — | | | — | | | 3 | |
| | Banks and other financial institutions | | | 1 | | | 7 | | | 27 | | | 47 | | | 46 | |
| | Commercial and industrial | | | 1,251 | | | 1,746 | | | 1,899 | | | 1,804 | | | 1,827 | |
| | | | | | | | | | | | |
| | | Total international loans | | | 1,252 | | | 1,753 | | | 1,926 | | | 1,851 | | | 1,876 | |
| | | | | | | | | | | | |
| | | Total loans | | $ | 42,161 | | $ | 50,505 | | $ | 50,743 | | $ | 47,431 | | $ | 43,247 | |
| | | | | | | | | | | | |
- (a)
- Primarily loans to real estate investors and developers.
- (b)
- Primarily loans secured by owner-occupied real estate.
30
Table of Contents
EARNING ASSETS
Total earning assets decreased $7.8 billion, or 13 percent, to $54.6 billion at December 31, 2009, from $62.4 billion at December 31, 2008. The Corporation's average earning assets balances are reflected in the "Analysis of Net Interest Income-Fully Taxable Equivalent" table of this financial review.
Loans
The following tables detail the Corporation's average loan portfolio by loan type, business line and geographic market.
| | | | | | | | | | | | | | | |
| |
| |
| |
| |
| |
|---|
| | Years Ended December 31 | |
|---|
Average Loans By Loan Type: | | 2009 | | 2008 | | Change | | Percent
Change | |
|---|
| | (dollar amounts in millions)
| |
| |
|---|
Commercial loans | | $ | 24,534 | | $ | 28,870 | | $ | (4,336 | ) | | (15 | )% |
Real estate construction loans: | | | | | | | | | | | | | |
| | Commercial Real Estate business line (a) | | | 3,538 | | | 4,052 | | | (514 | ) | | (13 | ) |
| | Other business lines (b) | | | 602 | | | 663 | | | (61 | ) | | (9 | ) |
| | | | | | | | | | | |
| | | Total real estate construction loans | | | 4,140 | | | 4,715 | | | (575 | ) | | (12 | ) |
Commercial mortgage loans: | | | | | | | | | | | | | |
| | Commercial Real Estate business line (a) | | | 1,694 | | | 1,536 | | | 158 | | | 10 | |
| | Other business lines (b) | | | 8,721 | | | 8,875 | | | (154 | ) | | (2 | ) |
| | | | | | | | | | | |
| | | Total commercial mortgage loans | | | 10,415 | | | 10,411 | | | 4 | | | — | |
Residential mortgage loans | | | 1,756 | | | 1,886 | | | (130 | ) | | (7 | ) |
Consumer loans: | | | | | | | | | | | | | |
| | Home equity | | | 1,796 | | | 1,669 | | | 127 | | | 8 | |
| | Other consumer | | | 757 | | | 890 | | | (133 | ) | | (15 | ) |
| | | | | | | | | | | |
| | | Total consumer loans | | | 2,553 | | | 2,559 | | | (6 | ) | | — | |
Lease financing | | | 1,231 | | | 1,356 | | | (125 | ) | | (9 | ) |
International loans | | | 1,533 | | | 1,968 | | | (435 | ) | | (22 | ) |
| | | | | | | | | | | |
Total loans | | $ | 46,162 | | $ | 51,765 | | $ | (5,603 | ) | | (11 | )% |
| | | | | | | | | | | |
- (a)
- Primarily loans to real estate investors and developers.
- (b)
- Primarily loans secured by owner-occupied real estate.
31
Table of Contents
| | | | | | | | | | | | | | | |
| |
| |
| |
| |
| |
|---|
| | Years Ended December 31 | |
|---|
Average Loans By Business Line: | | 2009 | | 2008 | | Change | | Percent
Change | |
|---|
| | (dollar amounts in millions)
| |
| |
|---|
Middle Market | | $ | 14,286 | | $ | 16,528 | | $ | (2,242 | ) | | (14 | )% |
Commercial Real Estate | | | 6,083 | | | 6,610 | | | (527 | ) | | (8 | ) |
Global Corporate Banking | | | 6,006 | | | 6,444 | | | (438 | ) | | (7 | ) |
National Dealer Services | | | 3,466 | | | 4,872 | | | (1,406 | ) | | (29 | ) |
Specialty Businesses (a) | | | 5,561 | | | 6,413 | | | (852 | ) | | (13 | ) |
| | | | | | | | | | | |
| | | Total Business Bank | | | 35,402 | | | 40,867 | | | (5,465 | ) | | (13 | ) |
Small Business | | | 3,948 | | | 4,244 | | | (296 | ) | | (7 | ) |
Personal Financial Services | | | 2,059 | | | 2,098 | | | (39 | ) | | (2 | ) |
| | | | | | | | | | | |
| | | Total Retail Bank | | | 6,007 | | | 6,342 | | | (335 | ) | | (5 | ) |
Private Banking | | | 4,758 | | | 4,542 | | | 216 | | | 5 | |
| | | | | | | | | | | |
| | | Total Wealth & Institutional Management | | | 4,758 | | | 4,542 | | | 216 | | | 5 | |
Finance/Other | | | (5 | ) | | 14 | | | (19 | ) | | N/M | |
| | | | | | | | | | | |
Total loans | | $ | 46,162 | | $ | 51,765 | | $ | (5,603 | ) | | (11 | )% |
| | | | | | | | | | | |
- (a)
- Includes Entertainment, Energy, Leasing, Financial Services Division and Technology and Life Sciences.
N/M — not meaningful.
| | | | | | | | | | | | | |
| |
| |
| |
| |
| |
|---|
| | Years Ended December 31 | |
|---|
Average Loans By Geographic Market: | | 2009 | | 2008 | | Change | | Percent
Change | |
|---|
| | (dollar amounts in millions)
| |
| |
|---|
Midwest | | $ | 16,965 | | $ | 19,062 | | $ | (2,097 | ) | | (11 | )% |
Western | | | 14,281 | | | 16,565 | | | (2,284 | ) | | (14 | ) |
Texas | | | 7,384 | | | 7,776 | | | (392 | ) | | (5 | ) |
Florida | | | 1,745 | | | 1,892 | | | (147 | ) | | (8 | ) |
Other Markets | | | 3,883 | | | 4,217 | | | (334 | ) | | (8 | ) |
International | | | 1,909 | | | 2,239 | | | (330 | ) | | (15 | ) |
Finance/Other | | | (5 | ) | | 14 | | | (19 | ) | | N/M | |
| | | | | | | | | | | |
Total loans | | $ | 46,162 | | $ | 51,765 | | $ | (5,603 | ) | | (11 | )% |
| | | | | | | | | | | |
N/M — not meaningful.
Total loans were $42.2 billion at December 31, 2009, a decrease of $8.3 billion from $50.5 billion at December 31, 2008. As shown in the tables above, total average loans decreased $5.6 billion, or 11 percent, to $46.2 billion in 2009, compared to $51.8 billion 2008, with declines in nearly all business lines and in all geographic markets from 2008 to 2009.
Average commercial real estate loans, consisting of real estate construction and commercial mortgage loans, decreased $571 million, or four percent, to $14.6 billion in 2009, from $15.1 billion in 2008. Commercial mortgage loans are loans where the primary collateral is a lien on any real property. Real property is generally considered primary collateral if the value of that collateral represents more than 50 percent of the commitment at loan approval. Average loans to borrowers in the Commercial Real Estate business line, which primarily includes loans to real estate investors and developers, represented $5.2 billion, or 36 percent of average total commercial real estate loans, in 2009, compared to $5.6 billion, or 37 percent of average total commercial real estate loans, in
32
Table of Contents
2008. The decrease in average commercial real estate loans to borrowers in the Commercial Real Estate business line in 2009 largely resulted from the Corporation's efforts to reduce exposure to the residential real estate developer business. The remaining $9.4 billion and $9.5 billion of average commercial real estate loans in other business lines in 2009 and 2008, respectively, were primarily loans secured by owner-occupied real estate. In addition to the $14.6 billion of average 2009 commercial real estate loans discussed above, the Commercial Real Estate business line also had $851 million of average 2009 loans not classified as commercial real estate on the consolidated balance sheet.
Average residential mortgage loans, which primarily include mortgages originated and retained for certain relationship customers, decreased $130 million, or seven percent, to $1.8 billion in 2009, from 2008.
Average home equity loans increased $127 million, or eight percent, in 2009, from 2008, as a result of an increase in draws on new and existing commitments extended.
For more information on real estate loans, refer to the "Commercial and Residential Real Estate Lending" portion of the "Risk Management" section of this financial review.
Management expects low single-digit period-end loan growth for 2010, compared to period-end 2009.
ANALYSIS OF INVESTMENT SECURITIES PORTFOLIO
(Fully Taxable Equivalent)
| | | | | | | | | | | | | | | | | | | | | | | | | | | | | | | | | | | | |
| | Maturity (a) | |
| |
|---|
| | Weighted Average Maturity | |
|---|
| | Within 1 Year | | 1 - 5 Years | | 5 - 10 Years | | After 10 Years | | Total | |
|---|
December 31, 2009 | | Amount | | Yield | | Amount | | Yield | | Amount | | Yield | | Amount | | Yield | | Amount | | Yield | | Yrs./Mos. | |
|---|
| | (dollar amounts in millions)
| |
|---|
Available-for-sale | | | | | | | | | | | | | | | | | | | | | | | | | | | | | | | | | | |
| | U.S. Treasury and other | | | | | | | | | | | | | | | | | | | | | | | | | | | | | | | | | | |
| | | U.S. government agency
securities | | $ | 103 | | | 0.43 | % | $ | — | | | — | % | $ | — | | | — | % | $ | — | | | — | % | $ | 103 | | | 0.45 | % | | 0/6 | |
| | Government-sponsored enterprise residential mortgage-backed securities | | | 119 | | | 3.78 | | | 146 | | | 3.61 | | | 542 | | | 4.15 | | | 5,454 | | | 3.77 | | | 6,261 | | | 3.80 | | | 13/4 | |
| | State and municipal securities (b) | | | 1 | | | 9.55 | | | — | | | — | | | — | | | — | | | 46 | | | 1.91 | | | 47 | | | 2.15 | | | 18/0 | |
| | Corporate debt securities: | | | | | | | | | | | | | | | | | | | | | | | | | | | | | | | | | | |
| | | Auction-rate debt securities | | | — | | | — | | | — | | | — | | | — | | | — | | | 150 | | | 2.96 | | | 150 | | | 2.96 | | | 31/7 | |
| | | Other corporate debt securities | | | 43 | | | 0.25 | | | 7 | | | 7.55 | | | — | | | — | | | — | | | — | | | 50 | | | 1.22 | | | 0/7 | |
| | Equity and other non-debt securities: | | | | | | | | | | | | | | | | | | | | | | | | | | | | | | | | | | |
| | | Auction-rate preferred securities (c) | | | — | | | — | | | — | | | — | | | — | | | — | | | 706 | | | 1.08 | | | 706 | | | 1.08 | | | — | |
| | | Money market and other mutual funds (d) | | | — | | | — | | | — | | | — | | | — | | | — | | | 99 | | | — | | | 99 | | | — | | | — | |
| | | | | | | | | | | | | | | | | | | | | | | | |
Total investment securities available-for-sale | | $ | 266 | | | 1.92 | % | $ | 153 | | | 3.80 | % | $ | 542 | | | 4.15 | % | $ | 6,455 | | | 3.44 | % | $ | 7,416 | | | 3.45 | % | | 13/5 | |
| | | | | | | | | | | | | | | | | | | | | | | | |
- (a)
- Based on final contractual maturity.
- (b)
- Primarily auction-rate securities.
- (c)
- Auction-rate preferred securities have no contractual maturity and are excluded from weighted average maturity.
- (d)
- Balances are excluded from the calculation of total yield and weighted average maturity.
33
Table of Contents
Investment Securities Available-for-Sale
Investment securities available-for-sale decreased $1.8 billion to $7.4 billion at December 31, 2009, from $9.2 billion at December 31, 2008, reflecting sales of $5.3 billion of mortgage-backed government agency securities and redemptions of $262 million of auction-rate securities. Mortgage-backed government agency securities were sold in 2009 as market conditions were favorable and there was no longer a need to hold a large portfolio of fixed-rate securities to mitigate the impact of potential future rate declines on net interest income. On an average basis, investment securities available-for-sale increased $1.3 billion to $9.4 billion in 2009, compared to $8.1 billion in 2008, primarily due to the 2008 purchase of auction-rate securities from certain customers, all in the fourth quarter 2008.
The purchase of auction-rate securities in 2008 resulted from the Corporation's September 2008 offer to repurchase, at par, auction-rate securities held by certain retail and institutional clients that were sold through Comerica Securities, a broker/dealer subsidiary of Comerica Bank (the Bank). As of December 31, 2009, the Corporation's auction-rate securities portfolio was carried at an estimated fair value of $901 million, a decrease of $246 million compared to $1.1 billion at December 31, 2008. Subsequent to repurchase, auction-rate securities, primarily taxable and non-taxable auction-rate preferred securities, of $276 million were called or redeemed at par, resulting in net securities gains of $14 million in 2009, compared to $84 million called or redeemed at par in the fourth quarter 2008, resulting in net securities gains of $4 million in 2008. The Corporation experienced minimal credit-related losses or defaults on contractual interest payments related to the portfolio; however, the market for these securities was not active. For additional information on the repurchase of auction-rate securities, refer to the "Critical Accounting Policies" section of this financial review and Note 4 to the consolidated financial statements.
Management expects investment securities available-for-sale for 2010 to remain at a level similar to year-end 2009.
Short-Term Investments
Short-term investments include federal funds sold and securities purchased under agreements to resell, interest-bearing deposits with banks and other short-term investments. Federal funds sold offer supplemental earnings opportunities and serve correspondent banks. Average federal funds sold and securities purchased under agreements to resell decreased $75 million to $18 million during 2009, compared to 2008. Interest-bearing deposits with banks are investments with banks in developed countries or international banking facilities of foreign banks located in the United States and include deposits with the FRB since October 1, 2008, the date at which the FRB began paying interest on such balances. Average interest-bearing deposits with banks increased $2.2 billion to $2.4 billion in 2009, compared to 2008, due to an increase in average deposits with the FRB. Average deposits with the FRB represent excess liquidity, which resulted from strong core deposit growth at a time when loan demand remained weak. At December 31, 2009, interest-bearing deposits with the FRB totaled $4.8 billion, compared to $2.3 billion at December 31, 2008. Other short-term investments include trading securities and loans held-for-sale. Loans held-for-sale typically represent residential mortgage loans and Small Business Administration loans that have been originated with management's intention to sell. Short-term investments, other than loans held-for-sale, provide a range of maturities less than one year and are mostly used to manage liquidity requirements of the Corporation. Average other short-term investments decreased $90 million to $154 million in 2009, compared to 2008.
34
Table of Contents
INTERNATIONAL CROSS-BORDER OUTSTANDINGS
(year-end outstandings exceeding 1% of total assets)
| | | | | | | | | | | | | | | |
December 31 | |
| | Government
and Official
Institutions | | Banks and
Other Financial
Institutions | | Commercial
and Industrial | | Total | |
|---|
| |
| | (in millions)
| |
|---|
| Mexico | | 2009 | | $ | — | | $ | — | | $ | 681 | | $ | 681 | |
| | | 2008 | | | — | | | — | | | 883 | | | 883 | |
| | | 2007 | | | — | | | 4 | | | 911 | | | 915 | |
International assets are subject to general risks inherent in the conduct of business in foreign countries, including economic uncertainties and each foreign government's regulations. Risk management practices minimize the risk inherent in international lending arrangements. These practices include structuring bilateral agreements or participating in bank facilities, which secure repayment from sources external to the borrower's country. Accordingly, such international outstandings are excluded from the cross-border risk of that country. Mexico, with cross-border outstandings of $681 million, or 1.15 percent of total assets at December 31, 2009, was the only country with outstandings exceeding 1.00 percent of total assets at year-end 2009. There were no countries with cross-border outstandings between 0.75 and 1.00 percent of total assets at year-end 2009. Additional information on the Corporation's Mexican cross-border risk is provided in the table above.
DEPOSITS AND BORROWED FUNDS
The Corporation's average deposits and borrowed funds balances are detailed in the following table.
| | | | | | | | | | | | | | |
| | Years Ended
December 31 | |
| |
| |
|---|
| |
| | Percent
Change | |
|---|
| | 2009 | | 2008 | | Change | |
|---|
| | (dollar amounts in millions)
| |
| |
|---|
Noninterest-bearing deposits | | $ | 12,900 | | $ | 10,623 | | $ | 2,277 | | | 21 | % |
Money market and NOW deposits | | | 12,965 | | | 14,245 | | | (1,280 | ) | | (9 | ) |
Savings deposits | | | 1,339 | | | 1,344 | | | (5 | ) | | — | |
Customer certificates of deposit | | | 8,131 | | | 8,150 | | | (19 | ) | | — | |
| | | | | | | | | | | |
| | Total core deposits | | | 35,335 | | | 34,362 | | | 973 | | | 3 | |
Other time deposits | | | 4,103 | | | 6,715 | | | (2,612 | ) | | (39 | ) |
Foreign office time deposits | | | 653 | | | 926 | | | (273 | ) | | (29 | ) |
| | | | | | | | | | | |
Total deposits | | $ | 40,091 | | $ | 42,003 | | $ | (1,912 | ) | | (5 | )% |
| | | | | | | | | | | |
Short-term borrowings | | $ | 1,000 | | $ | 3,763 | | $ | (2,763 | ) | | (73 | )% |
Medium- and long-term debt | | | 13,334 | | | 12,457 | | | 877 | | | 7 | |
| | | | | | | | | | | |
| | Total borrowed funds | | $ | 14,334 | | $ | 16,220 | | $ | (1,886 | ) | | (12 | )% |
| | | | | | | | | | | |
Average deposits were $40.1 billion in 2009, a decrease of $1.9 billion, or five percent, from $42.0 billion in 2008. Average core deposits increased $973 million, or three percent, in 2009, compared to 2008. Excluding the Financial Services Division, average core deposits increased $1.8 billion, or three percent, in 2009, compared to 2008. Within average core deposits, the majority of business lines showed increases from 2008 to 2009, including Global Corporate Banking (47 percent), National Dealer Services (17 percent) and Private Banking (nine percent). Average core deposits increased in nearly all geographic markets from 2008 to 2009, including International (42 percent), Other Markets (17 percent), Texas (12 percent), Florida (eight percent) and Midwest (five percent). The increase in average core deposits was, in part, due to an increased level of savings by customers during the uncertain economic conditions throughout 2009. The increase in insurance coverage limits on all domestic deposits from $100,000 to $250,000 and the temporary unlimited insurance coverage on certain
35
Table of Contents
transaction accounts, discussed below, expanded options to deposit savings into FDIC insured deposits. Average other time deposits decreased $2.6 billion and average foreign office time deposits decreased $273 million in 2009, compared to 2008. Other time deposits represent certificates of deposit issued to institutional investors in denominations in excess of $100,000 and to retail customers in denominations of less than $100,000 through brokers, and are an alternative to other sources of purchased funds. In the Financial Services Division, customers deposit large balances (primarily non-interest bearing) and the Corporation pays certain expenses on behalf of such customers and/or makes low-rate loans to such customers. Average Financial Services Division deposits decreased $846 million, or 33 percent, in 2009, compared to 2008, due to declines of $509 million in average interest-bearing deposits and $337 million in average noninterest-bearing deposits. The decrease in average Financial Services Division deposits in 2009 reflected lower home sales prices, as well as reduced home mortgage financing and refinancing activity. Financial Services Division deposit levels may change with the direction of mortgage activity changes, and the desirability of and competition for such deposits.
Short-term borrowings include federal funds purchased, securities sold under agreements to repurchase, borrowings under the Federal Reserve Term Auction Facility (TAF) and treasury tax and loan notes. Average short-term borrowings decreased $2.8 billion, to $1.0 billion in 2009, compared to $3.8 billion in 2008, reflecting decreases in federal funds purchased and TAF borrowing, due to reduced funding requirements of the Corporation. At December 31, 2009, the Corporation had no TAF borrowings.
The Corporation uses medium-term debt (both domestic and European) and long-term debt to provide funding to support earning assets. Medium- and long-term debt decreased by $4.0 billion in 2009, to $11.1 billion at December 31, 2009, compared to $15.1 billion at December 31, 2008, primarily as the result of the maturity of Federal Home Loan Bank advances ($2.0 billion) and medium-term notes ($1.6 billion) in 2009. On an average basis, medium- and long-term debt increased $877 million, or seven percent, in 2009, compared to 2008. Further information on medium- and long-term debt is provided in Note 14 to the consolidated financial statements.
In the fourth quarter 2008, the Corporation elected to participate in the Temporary Liquidity Guarantee Program (the TLG Program) announced by the FDIC in October 2008. At December 31, 2009, there was approximately $7 million of senior unsecured debt outstanding in the form of bank-to-bank deposits issued under the TLG Program, compared to $3 million at December 31, 2008.
The Corporation elected in 2009 to continue to participate in the unlimited FDIC deposit insurance protection under the TLG program covering noninterest-bearing deposit transaction accounts, interest-bearing transaction accounts earning interest rates of 50 basis points or less, and Interest on Lawyers' Trust Accounts (IOLTA's) through June 30, 2010, regardless of the account balance. This unlimited coverage is in addition to the increased FDIC limits approved on October 3, 2008, which increased insurance coverage limits on all deposits from $100,000 to $250,000 per account and expires December 31, 2013. An annualized surcharge of 10 basis points in 2009 and 15 to 25 basis points in 2010 is applied to those insured accounts not otherwise covered under the increased deposit insurance limit of $250,000, in addition to the existing risk-based deposit insurance premium paid on those deposits.
For further information on the TLG Program, see Note 14 to the consolidated financial statements.
36
Table of Contents
CAPITAL
Total shareholders' equity was $7.0 billion at December 31, 2009, compared to $7.2 billion at December 31, 2008. The following table presents a summary of changes in total shareholders' equity in 2009:
| | | | | | | | |
| | (in millions)
| |
|---|
Balance at January 1, 2009 | | | | | $ | 7,152 | |
Retention of earnings (net income less cash dividends declared) | | | | | | (126 | ) |
Change in accumulated other comprehensive loss: | | | | | | | |
Investment securities available-for-sale | | $ | (120 | ) | | | |
Cash flow hedges | | | (12 | ) | | | |
Defined benefit and other postretirement plans | | | 105 | | | | |
| | | | | | | |
| | Total change in accumulated other comprehensive loss | | | | | | (27 | ) |
Repurchase of common stock under employee stock plans | | | | | | (1 | ) |
Issuance of common stock under employee stock plans | | | | | | (3 | ) |
Share-based compensation | | | | | | 32 | |
Other | | | | | | 2 | |
| | | | | | | |
Balance at December 31, 2009 | | | | | $ | 7,029 | |
| | | | | | | |
Further information on the change in accumulated other comprehensive income (loss) is provided in Note 16 to the consolidated financial statements.
The Corporation assesses capital adequacy against the risk inherent in the balance sheet, recognizing that unexpected loss is the common denominator of risk and that common equity has the greatest capacity to absorb unexpected loss. At December 31, 2009, the Corporation and its U.S. banking subsidiaries exceeded the capital ratios required for an institution to be considered "well capitalized" by the standards developed under the Federal Deposit Insurance Corporation Improvement Act of 1991. Refer to Note 22 to the consolidated financial statements for further discussion of regulatory capital requirements and capital ratio calculations.
Under the Capital Purchase Program, the consent of the U.S. Treasury is required for any increase in common dividends declared from the dividend rate in effect at the time of investment (quarterly dividend rate of $0.33 per share for the Corporation) and for any common share repurchases, other than common share repurchases in connection with any benefit plan in the ordinary course of business, until November 2011, unless the preferred shares have been fully redeemed or the U.S. Treasury has transferred all the preferred shares to third parties prior to that date. In addition, all accrued and unpaid dividends on the preferred shares must be declared and the payment set aside for the benefit of the holders of preferred shares before any dividend may be declared on the Corporation's common stock and before any shares of the Corporation's common stock may be repurchased, other than share repurchases in connection with any benefit plan in the ordinary course of business.
The Corporation made no share repurchases in the open market in 2009 or 2008, compared to repurchases of 10.0 million shares in 2007 for $580 million. At December 31, 2009, 12.6 million shares of Comerica Incorporated common stock remained available for repurchase under the Corporation's publicly announced repurchase program authorized by the Board of Directors of the Corporation (the Board). As discussed above, common share repurchases through November 2011 require the consent of the U.S. Treasury under the terms of the Capital Purchase Program.
Refer to Note 15 to the consolidated financial statements for additional information on the Capital Purchase Program and the Corporation's share repurchase program.
37
Table of Contents
RISK MANAGEMENT
The Corporation assumes various types of risk in the normal course of business. Management classifies risk exposures into five areas: (1) credit, (2) market, (3) operational, (4) compliance and (5) business risks and considers credit risk as the most significant risk.
The Corporation continues to enhance its risk management capabilities with additional processes, tools and systems designed to provide management with deeper insight into the Corporation's various risks, enhance the Corporation's ability to control those risks and ensure that appropriate return is received for the risks taken.
Specialized risk managers, along with the risk management committees in credit, market and liquidity, operational and compliance are responsible for the day-to-day management of those respective risks. The Corporation's Enterprise-Wide Risk Management Committee is responsible for establishing the governance over the risk management process, as well as providing oversight in managing the Corporation's aggregate risk position. The Enterprise-Wide Risk Management Committee is principally made up of the various managers from the different risk areas and business units and has reporting responsibility to the Enterprise Risk Committee of the Board.
CREDIT RISK
Credit risk represents the risk of loss due to failure of a customer or counterparty to meet its financial obligations in accordance with contractual terms. The Corporation manages credit risk through underwriting, periodically reviewing and approving its credit exposures using Board committee approved credit policies and guidelines. Additionally, the Corporation manages credit risk through loan sales and loan portfolio diversification, limiting exposure to any single industry, customer or guarantor, and selling participations and/or syndicating to third parties credit exposures above those levels it deems prudent.
38
Table of Contents
ANALYSIS OF THE ALLOWANCE FOR LOAN LOSSES
| | | | | | | | | | | | | | | | | | | | |
| | Years Ended December 31 | |
|---|
| | 2009 | | 2008 | | 2007 | | 2006 | | 2005 | |
|---|
| | (dollar amounts in millions)
| |
|---|
Balance at beginning of year | | $ | 770 | | $ | 557 | | $ | 493 | | $ | 516 | | $ | 673 | |
Loan charge-offs: | | | | | | | | | | | | | | | | |
| | Domestic | | | | | | | | | | | | | | | | |
| | | Commercial | | | 375 | | | 183 | | | 89 | | | 44 | | | 91 | |
| | | Real estate construction: | | | | | | | | | | | | | | | | |
| | | | Commercial Real Estate business line (a) | | | 234 | | | 184 | | | 37 | | | — | | | 2 | |
| | | | Other business lines (b) | | | 1 | | | 1 | | | 5 | | | — | | | — | |
| | | | | | | | | | | | |
| | | | | Total real estate construction | | | 235 | | | 185 | | | 42 | | | — | | | 2 | |
| | | Commercial mortgage: | | | | | | | | | | | | | | | | |
| | | | Commercial Real Estate business line (a) | | | 90 | | | 72 | | | 15 | | | 4 | | | 4 | |
| | | | Other business lines (b) | | | 81 | | | 28 | | | 37 | | | 13 | | | 13 | |
| | | | | | | | | | | | |
| | | | | Total commercial mortgage | | | 171 | | | 100 | | | 52 | | | 17 | | | 17 | |
| | | | Residential mortgage | | | 21 | | | 7 | | | — | | | — | | | 1 | |
| | | | Consumer | | | 34 | | | 22 | | | 13 | | | 23 | | | 15 | |
| | | | Lease financing | | | 36 | | | 1 | | | — | | | 10 | | | 37 | |
| | International | | | 23 | | | 2 | | | — | | | 4 | | | 11 | |
| | | | | | | | | | | | |
| | | | Total loan charge-offs | | | 895 | | | 500 | | | 196 | | | 98 | | | 174 | |
Recoveries: | | | | | | | | | | | | | | | | |
| | Domestic | | | | | | | | | | | | | | | | |
| | | Commercial | | | 18 | | | 17 | | | 27 | | | 27 | | | 55 | |
| | | Real estate construction | | | 1 | | | 3 | | | — | | | — | | | — | |
| | | Commercial mortgage | | | 3 | | | 4 | | | 4 | | | 4 | | | 3 | |
| | | Residential mortgage | | | — | | | — | | | — | | | — | | | — | |
| | | Consumer | | | 2 | | | 3 | | | 4 | | | 3 | | | 5 | |
| | | Lease financing | | | 1 | | | 1 | | | 4 | | | — | | | — | |
| | International | | | 2 | | | 1 | | | 8 | | | 4 | | | 1 | |
| | | | | | | | | | | | |
| | | | Total recoveries | | | 27 | | | 29 | | | 47 | | | 38 | | | 64 | |
| | | | | | | | | | | | |
Net loan charge-offs | | | 868 | | | 471 | | | 149 | | | 60 | | | 110 | |
Provision for loan losses | | | 1,082 | | | 686 | | | 212 | | | 37 | | | (47 | ) |
Foreign currency translation adjustment | | | 1 | | | (2 | ) | | 1 | | | — | | | — | |
| | | | | | | | | | | | |
Balance at end of year | | $ | 985 | | $ | 770 | | $ | 557 | | $ | 493 | | $ | 516 | |
| | | | | | | | | | | | |
Allowance for loan losses as a percentage of total loans at end of year | | | 2.34 | % | | 1.52 | % | | 1.10 | % | | 1.04 | % | | 1.19 | % |
Net loan charge-offs during the year as a percentage of average loans outstanding during the year | | | 1.88 | | | 0.91 | | | 0.30 | | | 0.13 | | | 0.25 | |
- (a)
- Primarily charge-offs of loans to real estate investors and developers.
- (b)
- Primarily charge-offs of loans secured by owner-occupied real estate.
Allowance for Credit Losses
The allowance for credit losses includes both the allowance for loan losses and the allowance for credit losses on lending-related commitments. The allowance for loan losses represents management's assessment of
39
Table of Contents
probable losses inherent in the Corporation's loan portfolio. The allowance for loan losses provides for probable losses that have been identified with specific customer relationships and for probable losses believed to be inherent in the loan portfolio that have not been specifically identified. Internal risk ratings are assigned to each business loan at the time of approval and are subject to subsequent periodic reviews by the Corporation's senior management. The Corporation defines business loans as those belonging to the commercial, real estate construction, commercial mortgage, lease financing and international loan portfolios. The Corporation performs a detailed credit quality review quarterly on both large business and certain large consumer and residential mortgage loans that have deteriorated below certain levels of credit risk. When these individual loans are impaired, the Corporation may allocate a specific portion of the allowance to such loans, estimated using one of several methods, including estimated collateral value, market value of similar debt or discounted expected cash flows. A portion of the allowance is allocated to the remaining business loans by applying estimated loss ratios to the loans within each risk rating based on numerous factors identified below. In addition, a portion of the allowance is allocated to these remaining loans based on industry-specific risks inherent in certain portfolios that have experienced above average losses, including portfolio exposures to Small Business loans, high technology companies, retail trade (gasoline delivery) companies and automotive parts and tooling supply companies. The portion of the allowance allocated to all other consumer and residential mortgage loans is determined by applying estimated loss ratios to various segments of the loan portfolio. Estimated loss ratios for all portfolios are updated quarterly, incorporating factors such as recent charge-off experience, current economic conditions and trends, changes in collateral values of properties securing loans (using index-based estimates), and trends with respect to past due and nonaccrual amounts, and are supported by underlying analysis, including information on migration and loss given default studies from each of the Corporation's three largest domestic geographic markets (Midwest, Western and Texas), as well as mapping to bond tables. For collateral-dependent loans, independent appraisals are obtained at loan inception and updated on an as-needed basis, generally at the time a loan is determined to be impaired and at least annually thereafter. The allowance for credit losses on lending-related commitments, included in "accrued expenses and other liabilities" on the consolidated balance sheets, provides for probable credit losses inherent in lending-related commitments, including unused commitments to extend credit, letters of credit and financial guarantees. Lending-related commitments for which it is probable that the commitment will be drawn (or sold) are reserved with the same estimated loss rates as loans, or with specific reserves. In general, the probability of draw for letters of credit is considered certain once the credit is assigned a risk rating that is generally consistent with regulatory defined substandard or doubtful. Other letters of credit and all unfunded commitments have a lower probability of draw, to which standard loan loss rates are applied.
Actual loss ratios experienced in the future may vary from those estimated. The uncertainty occurs because factors may exist which affect the determination of probable losses inherent in the loan portfolio and are not necessarily captured by the application of estimated loss ratios or identified industry-specific risks. A portion of the allowance is maintained to capture these probable losses and reflects management's view that the allowance should recognize the margin for error inherent in the process of estimating expected loan losses. Factors that were considered in the evaluation of the adequacy of the Corporation's allowance include the inherent imprecision in the risk rating system which covers probable loan losses as a result of inaccuracy in assigning risk ratings or stale ratings which may not have been updated for recent negative trends in particular credits. In the first quarter 2009, the Corporation refined the methodology used to estimate the imprecision in the risk rating system portion of the allowance by only applying the identified error rate in assigning risk ratings, based on semiannual reviews, solely to the loan population that was tested. Previously, the error rate was applied to a larger population of loans. This change in methodology reduced the allowance by approximately $16 million in the first quarter 2009.
The allowance for loan losses is available to absorb losses from any segment within the portfolio. Unanticipated economic events, including political, economic and regulatory instability in countries where the Corporation has loans, could cause changes in the credit characteristics of the portfolio and result in an unanticipated increase in the allowance. Inclusion of other industry-specific portfolio exposures in the allowance, as well as significant increases in the current portfolio exposures, could also increase the amount of
40
Table of Contents
the allowance. Any of these events, or some combination thereof, may result in the need for additional provision for loan losses in order to maintain an allowance that complies with credit risk and accounting policies. The allowance for loan losses was $985 million at December 31, 2009, compared to $770 million at December 31, 2008, an increase of $215 million. The increase resulted primarily from increases in individual and industry reserves for the Middle Market (primarily the Midwest and Western markets), Global Corporate Banking (primarily the International and Western markets), Private Banking (primarily the Western market) and Commercial Real Estate (primarily in the Texas and Florida markets, partially offset by a decline in the Western market) loan portfolios. Commercial Real Estate challenges in the Western market moderated in 2009, compared to 2008, but remained a significant portion of the Commercial Real Estate allowance for loan losses. The $215 million increase in the allowance for loan losses in 2009 was directionally consistent with the $264 million increase in nonperforming loans from December 31, 2008 to December 31, 2009. The allowance for loan losses as a percentage of total period-end loans increased to 2.34 percent at December 31, 2009, from 1.52 percent at December 31, 2008. As noted above, all large nonperforming loans are individually reviewed each quarter for potential charge-offs and reserves. Charge-offs are taken as amounts are determined to be uncollectible. A measure of the level of charge-offs already taken on nonperforming loans is the current book balance as a percentage of the contractual amount owed. At December 31, 2009, nonperforming loans were charged-off to 56 percent of the contractual amount, compared to 66 percent at December 31, 2008. This level of write-downs is consistent with loss percentages taken on defaulted loans in recent years. The allowance as a percentage of total nonperforming loans, a ratio which results from the actions noted above, was 83 percent at December 31, 2009, compared to 84 percent at December 31, 2008. The Corporation's loan portfolio is heavily composed of business loans, which in the event of default are typically carried on the books at fair value as nonperforming assets for a longer period of time than are consumer loans, which are generally fully charged off when they become nonperforming, resulting in lower nonperforming loan allowance coverage. The allowance for loan losses as a multiple of total annual net loan charge-offs decreased to 1.1 times for the year ended December 31, 2009, compared to 1.6 times for the year ended December 31, 2008, as a result of higher levels of net loan charge-offs in 2009.
The allowance as a percentage of total loans, as a percentage of total nonperforming loans and as a multiple of annual net loan charge-offs is provided in the following table.
| | | | | | | | | | |
| | Years Ended December 31 | |
|---|
| | 2009 | | 2008 | | 2007 | |
|---|
Allowance for loan losses as a percentage of total loans at end of year | | | 2.34 | % | | 1.52 | % | | 1.10 | % |
Allowance for loan losses as a percentage of total nonperforming loans at end of year | | | 83 | | | 84 | | | 138 | |
Allowance for loan losses as a multiple of total net loan charge-offs for the year | | | 1.1 | x | | 1.6 | x | | 3.7 | x |
ALLOCATION OF THE ALLOWANCE FOR LOAN LOSSES
| | | | | | | | | | | | | | | | | | | | | | | | | | | | | | | | | | | | |
| | 2009 | | 2008 | | 2007 | | 2006 | | 2005 | |
|---|
| | December 31 | |
|---|
| | Allocated
Allowance | | Allowance
Ratio(a) | | %(b) | | Allocated
Allowance | | %(b) | | Allocated
Allowance | | %(b) | | Allocated
Allowance | | %(b) | | Allocated
Allowance | | %(b) | |
|---|
| | (dollar amounts in millions)
| |
|---|
Domestic | | | | | | | | | | | | | | | | | | | | | | | | | | | | | | | | | | |
| | Commercial | | $ | 456 | | | 2.10 | % | | 51 | % | $ | 380 | | | 55 | % | $ | 288 | | | 55 | % | $ | 320 | | | 55 | % | $ | 336 | | | 55 | % |
| | Real estate construction | | | 194 | | | 5.60 | | | 8 | | | 194 | | | 9 | | | 128 | | | 9 | | | 29 | | | 9 | | | 21 | | | 8 | |
| | Commercial mortgage | | | 219 | | | 2.09 | | | 25 | | | 147 | | | 21 | | | 92 | | | 20 | | | 80 | | | 20 | | | 74 | | | 21 | |
| | Residential mortgage | | | 32 | | | 1.95 | | | 4 | | | 4 | | | 4 | | | 2 | | | 4 | | | 2 | | | 4 | | | 1 | | | 3 | |
| | Consumer | | | 38 | | | 1.51 | | | 6 | | | 27 | | | 5 | | | 21 | | | 5 | | | 22 | | | 5 | | | 25 | | | 6 | |
| | Lease financing | | | 13 | | | 1.15 | | | 3 | | | 6 | | | 3 | | | 15 | | | 3 | | | 27 | | | 3 | | | 29 | | | 3 | |
International | | | 33 | | | 2.63 | | | 3 | | | 12 | | | 3 | | | 11 | | | 4 | | | 13 | | | 4 | | | 30 | | | 4 | |
| | | | | | | | | | | | | | | | | | | | | | | | |
| | | Total | | $ | 985 | | | 2.34 | % | | 100 | % | $ | 770 | | | 100 | % | $ | 557 | | | 100 | % | $ | 493 | | | 100 | % | $ | 516 | | | 100 | % |
| | | | | | | | | | | | | | | | | | | | | | | | |
- (a)
- Allocated Allowance as a percentage of related loans outstanding.
- (b)
- Loans outstanding as a percentage of total loans.
41
Table of Contents
The allowance for credit losses on lending-related commitments was $37 million at December 31, 2009, compared to $38 million at December 31, 2008, a decrease of $1 million. An analysis of the changes in the allowance for credit losses on lending-related commitments is presented below.
| | | | | | | | | | | | | | | | |
| | Years Ended December 31 | |
|---|
| | 2009 | | 2008 | | 2007 | | 2006 | | 2005 | |
|---|
| | (dollar amounts in millions)
| |
|---|
Balance at beginning of year | | $ | 38 | | $ | 21 | | $ | 26 | | $ | 33 | | $ | 21 | |
Less: Charge-offs on lending-related commitments (a) | | | 1 | | | 1 | | | 4 | | | 12 | | | 6 | |
Add: Provision for credit losses on lending-related commitments | | | — | | | 18 | | | (1 | ) | | 5 | | | 18 | |
| | | | | | | | | | | | |
Balance at end of year | | $ | 37 | | $ | 38 | | $ | 21 | | $ | 26 | | $ | 33 | |
| | | | | | | | | | | | |
- (a)
- Charge-offs result from the sale of unfunded lending-related commitments.
SUMMARY OF NONPERFORMING ASSETS AND PAST DUE LOANS
| | | | | | | | | | | | | | | | | | | | |
| |
| | December 31 | |
|---|
| |
| | 2009 | | 2008 | | 2007 | | 2006 | | 2005 | |
|---|
| |
| | (dollar amounts in millions)
| |
|---|
| | Nonaccrual loans: | | | | | | | | | | | | | | | | |
| | | Commercial | | $ | 238 | | $ | 205 | | $ | 75 | | $ | 97 | | $ | 65 | |
| | | Real estate construction: | | | | | | | | | | | | | | | | |
| | | | Commerical Real Estate business line (a) | | | 507 | | | 429 | | | 161 | | | 18 | | | 3 | |
| | | | Other business lines (b) | | | 4 | | | 5 | | | 6 | | | 2 | | | — | |
| | | | | | | | | | | | | |
| | | | | Total real estate construction | | | 511 | | | 434 | | | 167 | | | 20 | | | 3 | |
| | | Commercial mortgage: | | | | | | | | | | | | | | | | |
| | | | Commerical Real Estate business line (a) | | | 127 | | | 132 | | | 66 | | | 18 | | | 6 | |
| | | | Other business lines (b) | | | 192 | | | 130 | | | 75 | | | 54 | | | 29 | |
| | | | | | | | | | | | | |
| | | | | Total commercial mortgage | | | 319 | | | 262 | | | 141 | | | 72 | | | 35 | |
| | | Residential mortgage | | | 50 | | | 7 | | | 1 | | | 1 | | | 2 | |
| | | Consumer | | | 12 | | | 6 | | | 3 | | | 4 | | | 2 | |
| | | Lease financing | | | 13 | | | 1 | | | — | | | 8 | | | 13 | |
| | | International | | | 22 | | | 2 | | | 4 | | | 12 | | | 18 | |
| | | | | | | | | | | | | |
| | | | | Total nonaccrual loans | | | 1,165 | | | 917 | | | 391 | | | 214 | | | 138 | |
| | Reduced-rate loans | | | 16 | | | — | | | 13 | | | — | | | — | |
| | | | | | | | | | | | | |
| | | | | Total nonperforming loans | | | 1,181 | | | 917 | | | 404 | | | 214 | | | 138 | |
| | Foreclosed property | | | 111 | | | 66 | | | 19 | | | 18 | | | 24 | |
| | | | | | | | | | | | | |
| | | | | Total nonperforming assets | | $ | 1,292 | | $ | 983 | | $ | 423 | | $ | 232 | | $ | 162 | |
| | | | | | | | | | | | | |
| | Nonperforming loans as a percentage of total loans | | | 2.80 | % | | 1.82 | % | | 0.80 | % | | 0.45 | % | | 0.32 | % |
| | Nonperforming assets as a percentage of total loans and foreclosed property | | | 3.06 | | | 1.94 | | | 0.83 | | | 0.49 | | | 0.37 | |
| | Allowance for loan losses as a percentage of total nonperforming loans | | | 83 | | | 84 | | | 138 | | | 231 | | | 373 | |
| | Loans past due 90 days or more and still accruing | | $ | 101 | | $ | 125 | | $ | 54 | | $ | 14 | | $ | 16 | |
| | Loans past due 90 days or more and still accruing as a percentage of total loans | | | 0.24 | % | | 0.25 | % | | 0.11 | % | | 0.03 | % | | 0.04 | % |
- (a)
- Primarily loans to real estate investors and developers.
- (b)
- Primarily loans secured by owner-occupied real estate.
42
Table of Contents
Nonperforming Assets
Nonperforming assets include loans on nonaccrual status, loans which have been renegotiated to less than market rates due to a serious weakening of the borrower's financial condition and real estate which has been acquired through foreclosure and is awaiting disposition. Nonperforming assets increased $309 million to $1.3 billion at December 31, 2009, from $983 million at December 31, 2008. The table above presents nonperforming balances by category.
Residential real estate loans, which consist of traditional residential mortgages and home equity loans and lines of credit, are generally placed on nonaccrual status and charged off to current appraised values, less costs to sell, during the foreclosure process, normally no later than 180 days past due. Other consumer loans are generally not placed on nonaccrual status and are charged off at no later than 120 days past due, earlier if deemed uncollectible. Business loans are generally placed on nonaccrual status when management determines that principal or interest may not be fully collectible or when principal or interest payments are 90 days or more past due, unless the loan is fully collateralized and in the process of collection. Loan amounts in excess of probable future cash collections are charged off to an amount that management ultimately expects to collect. Interest previously accrued but not collected on nonaccrual loans is charged against current income at the time the loan is placed on nonaccrual. Income on such loans is then recognized only to the extent that cash is received and the future collection of principal is probable. Loans restructured in troubled debt restructurings bearing market rates of interest at the time of restructuring and performing in compliance with their modified terms (performing restructured loans) are considered impaired in the calendar year of the restructuring. At December 31, 2009, troubled debt restructurings totaled $34 million, of which $11 million were included in performing assets and $23 million were included in nonperforming assets ($16 million reduced-rate loans and $7 million nonaccrual loans). Refer to Note 1 to the consolidated financial statements for a further discussion of impaired loans.
The $248 million increase in nonaccrual loans at December 31, 2009, compared to December 31, 2008, resulted primarily from increases in nonaccrual real estate construction (primarily residential real estate developments) ($77 million), commercial mortgage ($57 million), residential mortgage ($43 million) and commercial ($33 million) loans. Nonperforming assets as a percentage of total loans and foreclosed property was 3.06 percent and 1.94 percent at December 31, 2009 and 2008, respectively.
43
Table of Contents
The following table presents a summary of changes in nonaccrual loans.
| | | | | | | |
| | 2009 | | 2008 | |
|---|
| | (in millions)
| |
|---|
Balance at January 1 | | $ | 917 | | $ | 391 | |
Loans transferred to nonaccrual (a) | | | 1,287 | | | 1,123 | |
Nonaccrual business loan gross charge-offs (b) | | | (838 | ) | | (469 | ) |
Loans transferred to accrual status (a) | | | (8 | ) | | (11 | ) |
Nonaccrual business loans sold (c) | | | (64 | ) | | (47 | ) |
Payments/Other (d) | | | (129 | ) | | (70 | ) |
| | | | | | |
Balance at December 31 | | $ | 1,165 | | $ | 917 | |
| | | | | | |
- (a)
- Based on an analysis of nonaccrual loans with book balances greater than $2 million.
- (b)
- Analysis of gross loan charge-offs:
| | | | | | | | | | |
| | | Nonaccrual business loans | | $ | 838 | | $ | 469 | |
| | | Performing watch list loans (as defined below) | | | 2 | | | 2 | |
| | | Consumer and residential mortgage loans | | | 55 | | | 29 | |
| | | | | | |
| | | | Total gross loan charge-offs | | $ | 895 | | $ | 500 | |
| | | | | | |
- (c)
- Analysis of loans sold:
| | | | | | | | | | |
| | | Nonaccrual business loans | | $ | 64 | | $ | 47 | |
| | | Performing watch list loans (as defined below) | | | 31 | | | 16 | |
| | | | | | |
| | | | Total loans sold | | $ | 95 | | $ | 63 | |
| | | | | | |
- (d)
- Includes net changes related to nonaccrual loans with balances less than $2 million, payments on nonaccrual loans with book balances greater than $2 million, transfers of nonaccrual loans to foreclosed property and consumer and residential mortgage loan charge-offs. Excludes business loan gross charge-offs and nonaccrual business loans sold.
The following table presents the number of nonaccrual loan relationships greater than $2 million and balance by size of relationship at December 31, 2009.
| | | | | | | |
Nonaccrual
Relationship Size | | Number of Relationships | | Balance | |
|---|
| | (dollar amounts
in millions)
| |
|---|
| $2 million — $5 million | | | 71 | | $ | 231 | |
| $5 million — $10 million | | | 41 | | | 295 | |
| $10 million — $25 million | | | 20 | | | 305 | |
| Greater than $25 million | | | 3 | | | 98 | |
| | | | | | |
| Total loan relationships greater than $2 million at December 31, 2009 | | | 135 | | $ | 929 | |
| | | | | | |
There were 148 loan relationships each with balances greater than $2 million, totaling $1.3 billion, transferred to nonaccrual status in 2009, an increase of $164 million when compared to $1.1 billion in 2008. Of the transfers to nonaccrual with balances greater than $2 million in 2009, $597 million were from the Commercial Real Estate business line (including $305 million and $100 million from the Western and Florida markets, respectively), $336 million were from the Middle Market business line (including $202 million from the Midwest market) and $155 million were from the Global Corporate Banking business line. There were 45 loan relationships greater than $10 million transferred to nonaccrual in 2009, totaling $840 million, including
44
Table of Contents
transfers from companies in the Commercial Real Estate ($472 million), Middle Market ($173 million) and Global Corporate Banking ($124 million) business lines. The $472 million of Commercial Real Estate loan relationships greater than $10 million transferred to nonaccrual included $243 million from the Western market, $96 million from the Florida market and $70 million from the Midwest market.
The Corporation sold $64 million of nonaccrual business loans in 2009, including $36 million and $19 million of loans from the Global Corporate Banking and Commercial Real Estate loan portfolios, respectively.
Loans past due 90 days or more and still accruing interest generally represent loans that are well collateralized and managed in a continuing process that is expected to result in repayment or restoration to current status. Loans past due 90 days or more and still accruing decreased $24 million, to $101 million at December 31, 2009, from $125 million at December 31, 2008. Loans past due 30-89 days increased $110 million to $522 million at December 31, 2009, compared to $412 million at December 31, 2008.
Loans past due 90 days or more and still accruing are summarized in the following table.
| | | | | | | |
| | December 31 | |
|---|
| | 2009 | | 2008 | |
|---|
| | (in millions)
| |
|---|
Commercial | | $ | 10 | | $ | 34 | |
Real estate construction | | | 30 | | | 25 | |
Commercial mortgage | | | 31 | | | 36 | |
Residential mortgage | | | 15 | | | 23 | |
Consumer | | | 13 | | | 7 | |
Lease financing | | | — | | | — | |
International | | | 2 | | | — | |
| | | | | | |
Total loans past due 90 days or more and still accruing | | $ | 101 | | $ | 125 | |
| | | | | | |
The following table presents a summary of total internally classified watch list loans (generally consistent with regulatory defined special mention, substandard and doubtful loans) at December 31, 2009 and 2008. Watch list loans that meet certain criteria are individually subjected to quarterly credit quality reviews, and the Corporation may allocate a specific portion of the allowance for loan losses to such loans. Consistent with the increase in nonaccrual loans from December 31, 2008 to December 31, 2009, total watch list loans increased both in dollars and as a percentage of the total loan portfolio. The increase in watch list loans primarily reflected negative migration in the Commercial Real Estate and Middle Market business lines.
| | | | | | | |
| | December 31 | |
|---|
| | 2009 | | 2008 | |
|---|
| | (dollar amounts
in millions)
| |
|---|
Total watch list loans | | $ | 7,730 | | $ | 5,732 | |
As a percentage of total loans | | | 18.3 | % | | 11.3 | % |
45
Table of Contents
The following table presents a summary of nonaccrual loans at December 31, 2009 and loan relationships transferred to nonaccrual and net loan charge-offs during the year ended December 31, 2009, based primarily on Standard Industrial Classification (SIC) industry categories.
| | | | | | | | | | | | | | | | | | | |
| |
| |
| | Year Ended December 31, 2009 | |
|---|
| | December 31, 2009 | |
|---|
| | Loans Transferred to Nonaccrual (a) | |
| |
| |
|---|
Industry Category | | Nonaccrual Loans | | Net Loan Charge-Offs | |
|---|
| | (dollar amounts in millions)
| |
|---|
Real estate | | $ | 677 | | | 58 | % | $ | 613 | | | 47 | % | $ | 337 | | | 39 | % |
Services | | | 95 | | | 8 | | | 118 | | | 9 | | | 105 | | | 12 | |
Manufacturing | | | 62 | | | 5 | | | 99 | | | 8 | | | 96 | | | 11 | |
Holding & other investment | | | 48 | | | 4 | | | 50 | | | 4 | | | 20 | | | 2 | |
Retail trade | | | 45 | | | 4 | | | 24 | | | 2 | | | 49 | | | 6 | |
Wholesale trade | | | 37 | | | 3 | | | 68 | | | 5 | | | 38 | | | 4 | |
Automotive | | | 31 | | | 3 | | | 102 | | | 8 | | | 54 | | | 6 | |
Information | | | 29 | | | 2 | | | 36 | | | 3 | | | 18 | | | 2 | |
Hotels | | | 22 | | | 2 | | | 39 | | | 3 | | | 19 | | | 2 | |
Natural resources | | | 13 | | | 1 | | | 24 | | | 2 | | | 9 | | | 1 | |
Finance | | | 13 | | | 1 | | | 22 | | | 2 | | | 16 | | | 2 | |
Transportation | | | 13 | | | 1 | | | 11 | | | 1 | | | 10 | | | 1 | |
Contractors | | | 10 | | | 1 | | | 7 | | | 1 | | | 19 | | | 2 | |
Technology-related | | | 7 | | | 1 | | | 47 | | | 3 | | | 24 | | | 3 | |
Consumer non-durables | | | 6 | | | 1 | | | 15 | | | 1 | | | 4 | | | 1 | |
Utilities | | | 3 | | | — | | | 3 | | | — | | | 7 | | | 1 | |
Other (b) | | | 54 | | | 5 | | | 9 | | | 1 | | | 43 | | | 5 | |
| | | | | | | | | | | | | | |
Total | | $ | 1,165 | | | 100 | % | $ | 1,287 | | | 100 | % | $ | 868 | | | 100 | % |
| | | | | | | | | | | | | | |
- (a)
- Based on an analysis of nonaccrual loan relationships with book balances greater than $2 million.
- (b)
- Consumer, excluding certain personal purpose, nonaccrual loans and net charge-offs, is included in the "Other" category.
The following table presents a summary of foreclosed property by property type as of December 31, 2009 and 2008.
| | | | | | | |
| | December 31 | |
|---|
| | 2009 | | 2008 | |
|---|
| | (in millions)
| |
|---|
Construction, land development and other land | | $ | 62 | | $ | 26 | |
Single family residential properties | | | 16 | | | 16 | |
Multi-family residential properties | | | 3 | | | 2 | |
Other non-land, nonresidential properties | | | 30 | | | 22 | |
| | | | | | |
Total foreclosed property | | $ | 111 | | $ | 66 | |
| | | | | | |
46
Table of Contents
At December 31, 2009, foreclosed property totaled $111 million and consisted of approximately 210 properties, compared to $66 million and approximately 160 properties at December 31, 2008, an increase of $45 million. The following table presents a summary of changes in foreclosed property.
| | | | | | | |
| | 2009 | | 2008 | |
|---|
| | (in millions)
| |
|---|
Balance at January 1 | | $ | 66 | | $ | 19 | |
Acquired in foreclosure | | | 114 | | | 63 | |
Write-downs | | | (34 | ) | | (6 | ) |
Foreclosed property sold | | | (37 | ) | | (10 | ) |
Capitalized expenditures | | | 2 | | | — | |
| | | | | | |
Balance at December 31 | | $ | 111 | | $ | 66 | |
| | | | | | |
At December 31, 2009, there were 13 foreclosed properties each with a carrying value greater than $2 million, totaling $61 million, an increase of $25 million when compared to $36 million at December 31, 2008. Of the foreclosed properties with balances greater than $2 million at December 31, 2009, $58 million were in the Commercial Real Estate business line, including $33 million in the Western market. At December 31, 2009 and 2008, there were no foreclosed properties with a carrying value greater than $10 million.
Concentration of Credit
The Corporation has an industry concentration with the automotive industry. Loans to automotive dealers and to borrowers involved with automotive production are reported as automotive, as management believes these loans have similar economic characteristics that might cause them to react similarly to changes in economic conditions. This aggregation involves the exercise of judgment. Included in automotive production are: (a) original equipment manufacturers and Tier 1 and Tier 2 suppliers that produce components used in vehicles and whose primary revenue source is automotive-related ("primary" defined as greater than 50%) and (b) other manufacturers that produce components used in vehicles and whose primary revenue source is automotive-related. Loans less than $1 million and loans recorded in the Small Business loan portfolio are excluded from the definition. Foreign ownership consists of North American affiliates of foreign automakers and suppliers.
The following table presents a summary of loans outstanding to companies related to the automotive industry.
| | | | | | | | | | | | | | | |
| | December 31 | |
|---|
| | 2009 | | 2008 | |
|---|
| | Loans
Outstanding | | Percent of
Total Loans | | Loans
Outstanding | | Percent of
Total Loans | |
|---|
| | (in millions)
| |
|---|
Production: | | | | | | | | | | | | | |
| | Domestic | | $ | 760 | | | | | $ | 1,219 | | | | |
| | Foreign | | | 181 | | | | | | 240 | | | | |
| | | | | | | | | | | | |
| | | Total production | | | 941 | | | 2.2 | % | | 1,459 | | | 2.9 | % |
Dealer: | | | | | | | | | | | | | |
| | Floor plan | | | 1,324 | | | | | | 2,295 | | | | |
| | Other | | | 2,106 | | | | | | 2,360 | | | | |
| | | | | | | | | | | | |
| | | Total dealer | | | 3,430 | | | 8.2 | % | | 4,655 | | | 9.2 | % |
| | | | | | | | | | |
| | | Total automotive | | $ | 4,371 | | | 10.4 | % | $ | 6,114 | | | 12.1 | % |
| | | | | | | | | | |
At December 31, 2009, dealer loans, as shown in the table above, totaled $3.4 billion, of which approximately $2.2 billion, or 64 percent, were to foreign franchises, $782 million, or 23 percent, were to domestic franchises and $463 million, or 13 percent, were to other. Other dealer loans include obligations where
47
Table of Contents
a primary franchise was indeterminable, such as loans to large public dealership consolidators and rental car, leasing, heavy truck and recreation vehicle companies.
Nonaccrual loans to automotive borrowers totaled $31 million, or three percent, of total nonaccrual loans at December 31, 2009. Total automotive net loan charge-offs were $54 million in 2009. The following table presents a summary of automotive net loan charge-offs for the years ended December 31, 2009 and 2008.
| | | | | | | | |
| | Years Ended December 31 | |
|---|
| | 2009 | | 2008 | |
|---|
| | (in millions)
| |
|---|
Production: | | | | | | | |
| | Domestic | | $ | 50 | | $ | 6 | |
| | Foreign | | | 4 | | | — | |
| | | | | | |
| | Total production | | $ | 54 | | $ | 6 | |
Dealer | | | — | | | — | |
| | | | | | |
| | Total automotive net loan charge-offs | | $ | 54 | | $ | 6 | |
| | | | | | |
All other industry concentrations, as defined by management, individually represented less than 10 percent of total loans at December 31, 2009.
48
Table of Contents
Commercial and Residential Real Estate Lending
The Corporation limits risk inherent in its commercial real estate lending activities by limiting exposure to those borrowers directly involved in the commercial real estate markets and adhering to conservative policies on loan-to-value ratios for such loans. Commercial real estate loans, consisting of real estate construction and commercial mortgage loans, totaled $13.9 billion at December 31, 2009, of which $4.8 billion, or 35 percent, were to borrowers in the Commercial Real Estate business line, which includes loans to residential real estate developers. The remaining $9.1 billion, or 65 percent, of commercial real estate loans in other business lines consisted primarily of owner-occupied commercial mortgages which bear credit characteristics similar to non-commercial real estate business loans.
The geographic distribution and project type of commercial real estate loans are important factors in diversifying credit risk within the portfolio. The following table reflects real estate construction and commercial mortgage loans to borrowers in the Commercial Real Estate business line by project type and location of property.
| | | | | | | | | | | | | | | | | | | | | | | | | | | | | | | | |
| | December 31, 2009 | | December 31, 2008 | |
|---|
| | Location of Property | |
| |
| |
| |
| |
|---|
Project Type: | | Western | | Michigan | | Texas | | Florida | | Other
Markets | | Total | | % of
Total | | Total | | % of
Total | |
|---|
| | (dollar amounts in millions)
| |
|---|
Real estate construction loans: | | | | | | | | | | | | | | | | | | | | | | | | | | | | |
| | Commercial Real Estate business line: | |
| | | Residential: | | | | | | | | | | | | | | | | | | | | | | | | | | | | |
| | | | Single family | | $ | 276 | | $ | 43 | | $ | 24 | | $ | 104 | | $ | 53 | | $ | 500 | | | 17 | % | $ | 1,046 | | | 26 | % |
| | | | Land development | | | 132 | | | 31 | | | 102 | | | 14 | | | 26 | | | 305 | | | 10 | | | 465 | | | 12 | |
| | | | | | | | | | | | | | | | | | | | |
| | | | | Total residential | | | 408 | | | 74 | | | 126 | | | 118 | | | 79 | | | 805 | | | 27 | | | 1,511 | | | 38 | |
| | | Other construction: | | | | | | | | | | | | | | | | | | | | | | | | | | | | |
| | | | Multi-family | | | 215 | | | 6 | | | 258 | | | 143 | | | 152 | | | 774 | | | 27 | | | 596 | | | 16 | |
| | | | Retail | | | 197 | | | 124 | | | 347 | | | 51 | | | 40 | | | 759 | | | 25 | | | 832 | | | 21 | |
| | | | Multi-use | | | 136 | | | 34 | | | 36 | | | 24 | | | 12 | | | 242 | | | 8 | | | 402 | | | 11 | |
| | | | Office | | | 110 | | | 5 | | | 89 | | | 15 | | | 33 | | | 252 | | | 8 | | | 297 | | | 8 | |
| | | | Commercial | | | 1 | | | 23 | | | 46 | | | — | | | — | | | 70 | | | 2 | | | 105 | | | 3 | |
| | | | Land development | | | 8 | | | 15 | | | 10 | | | — | | | 3 | | | 36 | | | 1 | | | 60 | | | 2 | |
| | | | Other | | | 33 | | | — | | | 7 | | | — | | | 10 | | | 50 | | | 2 | | | 28 | | | 1 | |
| | | | | | | | | | | | | | | | | | | | |
Total | | $ | 1,108 | | $ | 281 | | $ | 919 | | $ | 351 | | $ | 329 | | $ | 2,988 | | | 100 | % | $ | 3,831 | | | 100 | % |
| | | | | | | | | | | | | | | | | | | | |
Commercial mortgage loans: | | | | | | | | | | | | | | | | | | | | | | | | | | | | |
| | Commercial Real Estate business line: | |
| | | Residential: | | | | | | | | | | | | | | | | | | | | | | | | | | | | |
| | | | Single family | | $ | 14 | | $ | 2 | | $ | 13 | | $ | 10 | | $ | 2 | | $ | 41 | | | 2 | % | $ | 60 | | | 4 | % |
| | | | Land carry | | | 64 | | | 62 | | | 30 | | | 41 | | | 19 | | | 216 | | | 12 | | | 344 | | | 21 | |
| | | | | | | | | | | | | | | | | | | | |
| | | | | Total residential | | | 78 | | | 64 | | | 43 | | | 51 | | | 21 | | | 257 | | | 14 | | | 404 | | | 25 | |
| | | Other commercial mortgage: | | | | | | | | | | | | | | | | | | | | | | | | | | | | |
| | | | Multi-family | | | 68 | | | 62 | | | 126 | | | 103 | | | 52 | | | 411 | | | 22 | | | 303 | | | 19 | |
| | | | Retail | | | 134 | | | 58 | | | 2 | | | 24 | | | 74 | | | 292 | | | 16 | | | 212 | | | 13 | |
| | | | Land carry | | | 143 | | | 61 | | | 13 | | | 13 | | | 11 | | | 241 | | | 13 | | | 295 | | | 18 | |
| | | | Multi-use | | | 149 | | | — | | | 12 | | | — | | | 75 | | | 236 | | | 13 | | | 46 | | | 3 | |
| | | | Office | | | 97 | | | 57 | | | 24 | | | 11 | | | 5 | | | 194 | | | 11 | | | 219 | | | 14 | |
| | | | Commercial | | | 49 | | | 28 | | | 6 | | | — | | | 43 | | | 126 | | | 7 | | | 121 | | | 7 | |
| | | | Other | | | 16 | | | 9 | | | 1 | | | — | | | 41 | | | 67 | | | 4 | | | 19 | | | 1 | |
| | | | | | | | | | | | | | | | | | | | |
Total | | $ | 734 | | $ | 339 | | $ | 227 | | $ | 202 | | $ | 322 | | $ | 1,824 | | | 100 | % | $ | 1,619 | | | 100 | % |
| | | | | | | | | | | | | | | | | | | | |
Residential real estate development outstandings of $1.1 billion at December 31, 2009 decreased $853 million, or 44 percent, from $1.9 billion at December 31, 2008. Net credit-related charge-offs in the Commercial Real Estate business line were $335 million in 2009, including $179 million in the Western market, with the majority from the residential real estate development business, and $80 million in the Midwest market.
49
Table of Contents
The following table summarizes the Corporation's commercial real estate loan portfolio by loan category as of December 31, 2009 and 2008.
| | | | | | | | |
| | December 31 | |
|---|
| | 2009 | | 2008 | |
|---|
| | (in millions)
| |
|---|
Real estate construction loans: | | | | | | | |
| | Commercial Real Estate business line (a) | | $ | 2,988 | | $ | 3,831 | |
| | Other business lines (b) | | | 473 | | | 646 | |
| | | | | | |
Total real estate construction loans | | $ | 3,461 | | | 4,477 | |
| | | | | | |
Commercial mortgage loans: | | | | | | | |
| | Commercial Real Estate business line (a) | | $ | 1,824 | | | 1,619 | |
| | Other business lines (b) | | | 8,633 | | | 8,870 | |
| | | | | | |
Total commercial mortgage loans | | $ | 10,457 | | | 10,489 | |
| | | | | | |
- (a)
- Primarily loans to real estate investors and developers.
- (b)
- Primarily loans secured by owner-occupied real estate.
The real estate construction loan portfolio totaled $3.5 billion at December 31, 2009 and included approximately 800 loans, of which approximately 40 percent had balances less than $1 million. The real estate construction loan portfolio primarily contains loans made to long-time customers with satisfactory completion experience. However, the significant and sudden decline in residential real estate activity in the Western, Florida and Midwest markets proved extremely difficult for many smaller residential real estate developers. Of the $3.0 billion of real estate construction loans in the Commercial Real Estate business line, $507 million were on nonaccrual status at December 31, 2009, of which $257 million were single family projects (largely in the Western and Florida markets) and $112 million were residential land development projects (largely in the Western and Texas markets). Real estate construction loan net charge-offs in the Commercial Real Estate business line totaled $233 million for 2009, including $135 million from single family projects, largely concentrated in the Western market, and $73 million from residential land development projects, primarily in the Western and Midwest markets.
When the Corporation enters into a loan agreement with a borrower for a real estate construction loan, an interest reserve is often included in the amount of the loan commitment. An interest reserve allows the borrower to add interest charges to the outstanding loan balance during the construction period. Interest reserves are established on substantially all real estate construction loans in the Corporation's Commercial Real Estate business line. Interest reserves provide an effective means to address the cash flow characteristics of a real estate construction loan. Loan agreements containing an interest reserve generally require more equity to be contributed by the borrower to the construction project at inception. Real estate construction loans with interest reserves are subject to substantially the same Board committee approved underwriting standards as loans without interest reserves. Interest that has been added to the balance of a real estate construction loan through the use of an interest reserve is recognized as income only if the Corporation expects full collection of the remaining contractual principal and interest payments. If a real estate construction loan with interest reserves is in default and deemed uncollectible, interest is no longer funded through the interest reserve. Interest previously recognized from interest reserves generally is not reversed against current income when a construction loan with interest reserves is placed on nonaccrual status. All real estate construction loans are closely monitored through physical inspections, reconciliation of draw requests, review of rent rolls and operating statements and quarterly portfolio reviews performed by the Corporation's senior management. When appropriate, extensions, renewals and restructurings of real estate construction loans are approved after giving consideration to the project's status, the borrower's financial condition, and the collateral protection based on current market conditions, and
50
Table of Contents
typically strengthen the Corporation's position by adding additional collateral and controls and/or requiring amortization on the existing debt.
The commercial mortgage loan portfolio totaled $10.5 billion at December 31, 2009 and included approximately 8,500 loans, of which approximately 75 percent had balances of less than $1 million. The commercial mortgage loan portfolio included $8.6 billion of primarily owner-occupied commercial mortgage loans. Commercial mortgage loans in the Commercial Real Estate business line totaled $1.8 billion and included $127 million of nonaccrual loans at December 31, 2009, which consisted primarily of residential land carry, commercial land carry and office projects ($50 million, $28 million and $28 million, respectively), located primarily in the Western and Midwest markets. Commercial mortgage loan net charge-offs in the Commercial Real Estate business line totaled $89 million for 2009, primarily from residential and commercial land carry projects ($48 million and $26 million, respectively).
Residential real estate loans, which consist of traditional residential mortgages and home equity loans and lines of credit, totaled $3.5 billion at December 31, 2009. Residential mortgages totaled $1.7 billion at December 31, 2009, and were primarily larger, variable-rate mortgages originated and retained for certain private banking relationship customers. By geographic market, 42 percent of residential mortgage loans outstanding were in the Midwest market, 30 percent in the Western market, 15 percent in the Texas market and 13 percent in the Florida market at December 31, 2009.
The home equity portfolio totaled $1.8 billion at December 31, 2009, of which $1.6 billion was outstanding under primarily variable-rate, interest-only home equity lines of credit and $246 million consisted of closed-end home equity loans. By geographic market, 62 percent of home equity loans outstanding were in the Midwest market, 26 percent in the Western market, nine percent in the Texas market and three percent in the Florida market at December 31, 2009. A substantial majority of the home equity portfolio was secured by junior liens.
The Corporation rarely originates residential real estate loans with a loan-to-value ratio at origination above 100 percent, has no sub-prime mortgage programs and does not originate payment-option adjustable-rate mortgages or other nontraditional mortgages that allow negative amortization. A significant majority of residential mortgage originations are sold in the secondary market. The residential real estate portfolio is principally located within the Corporation's primary geographic markets. The economic recession and significant declines in home values in the Western, Florida and Midwest markets following the financial market turmoil beginning in the fall of 2008 adversely impacted the residential real estate portfolio. At December 31, 2009, the Corporation estimated that, of the $15 million total residential mortgage loans past due 90 days or more and still accruing interest, less than $5 million exceeded 90 percent of the current value of the underlying collateral, based on S&P/Case-Shiller home price indices. To account for this exposure, the Corporation factors changes in home values into estimated loss ratios for residential real estate loans, using index-based estimates by major metropolitan area, resulting in an increased allowance allocated for residential real estate loans when home values decline. Additionally, to mitigate increasing credit exposure due to depreciating home values, the Corporation periodically reviews home equity lines of credit and makes line reductions or converts outstanding balances at line maturity to closed-end, amortizing loans when necessary.
Shared National Credits
Shared National Credit (SNC) loans are facilities greater than $20 million shared by three or more federally supervised financial institutions that are reviewed by regulatory authorities at the agent bank level. The Corporation generally seeks to obtain ancillary business at the origination of a SNC relationship. Loans classified as SNC loans (approximately 1,000 borrowers) totaled $9.1 billion at December 31, 2009, a decline of $2.8 billion from $11.9 billion at December 31, 2008. SNC loans, diversified by both business line and geographic market, comprised approximately 20 percent of total loans at both December 31, 2009 and December 31, 2008. SNC loans are held to the same credit underwriting standards as the remainder of the loan portfolio and face similar credit challenges, primarily driven by residential real estate developments.
51
Table of Contents
MARKET RISK
Market risk represents the risk of loss due to adverse movements in market rates or prices, including interest rates, foreign exchange rates and equity prices, the failure to meet financial obligations coming due resulting from an inability to liquidate assets or obtain adequate funding, and the inability to easily unwind or offset specific exposures without significantly lowering prices, due to inadequate market depth or market disruptions.
The Asset and Liability Policy Committee establishes and monitors compliance with the policies and risk limits pertaining to market risk management activities. The Asset and Liability Policy Committee meets regularly to discuss and review market risk management strategies and consists of executive and senior management from various areas of the Corporation, including finance, lending, deposit gathering and risk management.
Interest Rate Risk
Net interest income, which is derived principally from the difference between interest earned on loans and investment securities and interest paid on deposits and other funding sources, is the predominant source of revenue for the Corporation. Interest rate risk arises primarily through the Corporation's core business activities of extending loans and accepting deposits. The Corporation's balance sheet is predominantly characterized by floating-rate commercial loans funded by a combination of core deposits and wholesale borrowings. This creates a natural imbalance between the floating-rate loan portfolio and the more slowly repricing deposit products. The result is that growth and/or contraction in the Corporation's core businesses will lead to sensitivity to interest rate movements without mitigating actions. Examples of such actions are purchasing investment securities, primarily fixed-rate, which provide liquidity to the balance sheet and act to mitigate the inherent interest sensitivity, and hedging the sensitivity with interest rate swaps. The Corporation actively manages its exposure to interest rate risk, with the principal objective of optimizing net interest income and the economic value of equity while operating within acceptable limits established for interest rate risk and maintaining adequate levels of funding and liquidity.
Interest Rate Sensitivity
Interest rate risk arises in the normal course of business due to differences in the repricing and cash flow characteristics of assets and liabilities. Since no single measurement system satisfies all management objectives, a combination of techniques is used to manage interest rate risk. These techniques examine earnings at risk and the economic value of equity utilizing multiple simulation analyses.
The Corporation frequently evaluates net interest income under various balance sheet and interest rate scenarios, using simulation modeling analysis as its principal risk management evaluation technique. The results of these analyses provide the information needed to assess the balance sheet structure. Changes in economic activity, whether domestic or international, different from those management included in its simulation analyses could translate into a materially different interest rate environment than currently expected. Management evaluates a base case net interest income under an unchanged interest rate environment and what is believed to be the most likely balance sheet structure. This base case net interest income is then evaluated against non-parallel interest rate scenarios that gradually increase and decrease rates approximately 200 basis points in a linear fashion from the base case over twelve months (but decrease to no lower than zero percent). Due to the low level of interest rates, both the December 31, 2009 and 2008 analyses reflect a declining interest rate scenario of a 25 basis point drop, to zero percent, while the rising interest rate scenario reflects a gradual 200 basis point rise. In addition, consistent with each interest rate scenario, adjustments to asset prepayment levels, yield curves, and overall balance sheet mix and growth assumptions are made. These assumptions are inherently uncertain and, as a result, the model may not precisely predict the impact of higher or lower interest rates on net interest income. Actual results may differ from simulated results due to timing, magnitude and frequency of changes in interest rate, market conditions and management strategies, among other factors. However, the model can indicate the likely direction of change. Derivative instruments entered into for risk management purposes are included in these analyses.
52
Table of Contents
The table below, as of December 31, 2009 and 2008, displays the estimated impact on net interest income during the next 12 months by relating the base case scenario results to those from the rising and declining rate scenarios described above.
| | | | | | | | | | | | | | |
| | December 31
2009 | | December 31
2008 | |
|---|
| | Amount | | % | | Amount | | % | |
|---|
| | (in millions)
| |
| | (in millions)
| |
| |
|---|
Change in Interest Rates: | | | | | | | | | | | | | |
| | +200 basis points | | $ | 74 | | | 4 | | $ | 85 | | | 5 | |
| | -25 basis points (to zero percent) | | | (13 | ) | | (1 | ) | | (19 | ) | | (1 | ) |
Corporate policy limits adverse change to no more than four percent of management's most likely net interest income forecast, and the Corporation was within this policy guideline at December 31, 2009. The change in interest rate sensitivity from December 31, 2008 to December 31, 2009 was primarily driven by changes in the Corporation's deposit mix resulting from movement of fixed-rate certificates of deposit into other deposit products. Interest rate risk is actively managed principally through the use of either on-balance sheet financial instruments or interest rate swaps to achieve the desired risk profile.
In addition to the simulation analysis, an economic value of equity analysis is performed for a longer term view of the interest rate risk position. The economic value of equity analysis begins with an estimate of the mark-to-market valuation of the Corporation's balance sheet and then applies the estimated impact of rate movements to the market value of assets, liabilities and off-balance sheet instruments. The economic value of equity is then calculated as the difference between the estimated market value of assets and liabilities net of the impact of off-balance sheet instruments.
The table below, as of December 31, 2009 and 2008, displays the estimated impact on the economic value of equity from a 200 basis point immediate parallel increase or decrease in interest rates (but decrease to no lower than zero percent). Similar to the simulation analysis above, due to the low level of interest rates, both the December 31, 2009 and 2008 economic value of equity analyses below reflects an interest rate scenario of an immediate 25 basis point drop, to zero percent, while the rising interest rate scenario reflects an immediate 200 basis point rise.
| | | | | | | | | | | | | | |
| | December 31
2009 | | December 31
2008 | |
|---|
| | Amount | | % | | Amount | | % | |
|---|
| | (in millions)
| |
| | (in millions)
| |
| |
|---|
Change in Interest Rates: | | | | | | | | | | | | | |
| | +200 basis points | | $ | 329 | | | 3 | | $ | 585 | | | 5 | |
| | -25 basis points (to zero percent) | | | (91 | ) | | (1 | ) | | (134 | ) | | (1 | ) |
Corporate policy limits adverse change in the estimated market value change in the economic value of equity to 15 percent of the base economic value of equity. The Corporation was within this policy parameter at December 31, 2009. The change in the sensitivity of the economic value of equity to a 200 basis point parallel increase in rates between December 31, 2008 and December 31, 2009 was primarily driven by changes in the Corporation's deposit mix resulting from movement of fixed-rate certificates of deposit into other deposit products. As with net interest income shocks, a variety of alternative scenarios are performed to measure the impact on the economic value of equity, including changes in the level, slope and shape of the yield curve.
53
Table of Contents
LOAN MATURITIES AND INTEREST RATE SENSITIVITY
| | | | | | | | | | | | | | | |
| | Loans Maturing | |
|---|
December 31, 2009 | | Within
One Year(a) | | After One
But Within
Five Years | | After
Five Years | | Total | |
|---|
| | (in millions)
| |
|---|
Commercial loans | | $ | 17,139 | | $ | 4,112 | | $ | 439 | | $ | 21,690 | |
Real estate construction loans | | | 2,684 | | | 699 | | | 78 | | | 3,461 | |
Commercial mortgage loans | | | 4,887 | | | 4,475 | | | 1,095 | | | 10,457 | |
International loans | | | 1,176 | | | 72 | | | 4 | | | 1,252 | |
| | | | | | | | | | |
| | | Total | | $ | 25,886 | | $ | 9,358 | | $ | 1,616 | | $ | 36,860 | |
| | | | | | | | | | |
Sensitivity of Loans to Changes in Interest Rates: | | | | | | | | | | | | | |
| | Predetermined (fixed) interest rates | | | | | $ | 4,183 | | $ | 1,195 | | | | |
| | Floating interest rates | | | | | | 5,175 | | | 421 | | | | |
| | | | | | | | | | | | |
| | | Total | | | | | $ | 9,358 | | $ | 1,616 | | | | |
| | | | | | | | | | | | |
- (a)
- Includes demand loans, loans having no stated repayment schedule or maturity and overdrafts.
The Corporation uses investment securities and derivative instruments, predominantly interest rate swaps, as asset and liability management tools with the overall objective of managing the volatility of net interest income from changes in interest rates. Swaps modify the interest rate characteristics of certain assets and liabilities (e.g., from a floating rate to a fixed rate, from a fixed rate to a floating rate or from one floating-rate index to another). These tools assist management in achieving the desired interest rate risk management objectives.
Risk Management Derivative Instruments
| | | | | | | | | | |
Risk Management Notional Activity
| | Interest
Rate
Contracts | | Foreign
Exchange
Contracts | | Totals | |
|---|
| | (in millions)
| |
|---|
Balance at January 1, 2008 | | $ | 5,402 | | $ | 549 | | $ | 5,951 | |
Additions | | | 1,850 | | | 5,252 | | | 7,102 | |
Maturities/amortizations | | | (3,702 | ) | | (5,257 | ) | | (8,959 | ) |
Terminations | | | (150 | ) | | — | | | (150 | ) |
| | | | | | | | |
Balance at December 31, 2008 | | $ | 3,400 | | $ | 544 | | $ | 3,944 | |
Additions | | | 429 | | | 3,148 | | | 3,577 | |
Maturities/amortizations | | | (529 | ) | | (3,439 | ) | | (3,968 | ) |
Terminations | | | — | | | — | | | — | |
| | | | | | | | |
Balance at Decmber 31, 2009 | | $ | 3,300 | | $ | 253 | | $ | 3,553 | |
| | | | | | | | |
The notional amount of risk management interest rate swaps totaled $3.3 billion at December 31, 2009 and $3.4 billion at December 31, 2008. The fair value of risk management interest rate swaps was a net unrealized gain of $224 million at December 31, 2009, compared to a net unrealized gain of $396 million at December 31, 2008.
For the year ended December 31, 2009, risk management interest rate swaps generated $95 million of net interest income, compared to $67 million of net interest income for the year ended December 31, 2008. The increase in swap income for 2009, compared to 2008, was primarily due to maturities in 2008 of interest rate swaps that carried negative spreads.
54
Table of Contents
In addition to interest rate swaps, the Corporation employs various other types of derivative instruments as offsetting positions to mitigate exposures to interest rate and foreign currency risks associated with specific assets and liabilities (e.g., customer loans or deposits denominated in foreign currencies). Such instruments may include interest rate caps and floors, total return swaps, foreign exchange forward contracts and foreign exchange swap agreements. The aggregate notional amounts of these risk management derivative instruments at December 31, 2009 and 2008 were $253 million and $544 million, respectively.
Further information regarding risk management derivative instruments is provided in Note 10 to the consolidated financial statements.
Customer-Initiated and Other Derivative Instruments
| | | | | | | | | | | | | |
Customer-Initiated and Other Notional Activity
| | Interest Rate Contracts | | Energy Derivative Contracts | | Foreign Exchange Contracts | | Totals | |
|---|
| | (in millions)
| |
|---|
Balance at January 1, 2008 | | $ | 8,508 | | $ | 1,481 | | $ | 2,715 | | $ | 12,704 | |
Additions | | | 5,454 | | | 1,670 | | | 108,886 | | | 116,010 | |
Maturities/amortizations | | | (1,140 | ) | | (918 | ) | | (108,878 | ) | | (110,936 | ) |
Terminations | | | (480 | ) | | (88 | ) | | — | | | (568 | ) |
| | | | | | | | | | |
Balance at December 31, 2008 | | $ | 12,342 | | $ | 2,145 | | $ | 2,723 | | $ | 17,210 | |
Additions | | | 2,527 | | | 1,734 | | | 97,715 | | | 101,976 | |
Maturities/amortizations | | | (2,190 | ) | | (1,519 | ) | | (98,360 | ) | | (102,069 | ) |
Terminations | | | (583 | ) | | (23 | ) | | (55 | ) | | (661 | ) |
| | | | | | | | | | |
Balance at December 31, 2009 | | $ | 12,096 | | $ | 2,337 | | $ | 2,023 | | $ | 16,456 | |
| | | | | | | | | | |
The Corporation writes and purchases interest rate caps and floors and enters into foreign exchange contracts, interest rate swaps and energy derivative contracts to accommodate the needs of customers requesting such services. Customer-initiated and other notional activity represented 82 percent of total interest rate, energy and foreign exchange contracts at December 31, 2009, compared to 81 percent at December 31, 2008.
Further information regarding customer-initiated and other derivative instruments in provided in Note 10 to the consolidated financial statements.
Liquidity Risk and Off-Balance Sheet Arrangements
Liquidity is the ability to meet financial obligations through the maturity or sale of existing assets or the acquisition of additional funds. Various financial obligations, including contractual obligations and commercial commitments, may require future cash payments by the Corporation. The following contractual obligations table summarizes the Corporation's noncancelable contractual obligations and future required minimum payments. Refer to Notes 8, 12, 13, 14, and 20 to the consolidated financial statements for further information regarding these contractual obligations.
55
Table of Contents
Contractual Obligations
| | | | | | | | | | | | | | | | | |
| | Minimum Payments Due by Period | |
|---|
December 31, 2009 | | Total | | Less than
1 Year | | 1–3
Years | | 3–5
Years | | More than
5 Years | |
|---|
| | (in millions)
| |
|---|
Deposits without a stated maturity (a) | | $ | 31,662 | | $ | 31,662 | | $ | — | | $ | — | | $ | — | |
Certificates of deposit and other deposits with a stated maturity (a) | | | 8,002 | | | 7,146 | | | 722 | | | 93 | | | 41 | |
Short-term borrowings (a) | | | 462 | | | 462 | | | — | | | — | | | — | |
Medium- and long-term debt (a) | | | 10,851 | | | 2,750 | | | 2,533 | | | 3,250 | | | 2,318 | |
Operating leases | | | 643 | | | 68 | | | 125 | | | 107 | | | 343 | |
Commitments to fund low income housing partnerships | | | 63 | | | 44 | | | 18 | | | 1 | | | — | |
Other long-term obligations (b) | | | 270 | | | 45 | | | 67 | | | 22 | | | 136 | |
| | | | | | | | | | | | |
| | Total contractual obligations | | $ | 51,953 | | $ | 42,177 | | $ | 3,465 | | $ | 3,473 | | $ | 2,838 | |
| | | | | | | | | | | | |
Medium- and long-term debt (a) (parent company only) | | $ | 965 | | $ | 150 | | $ | — | | $ | — | | $ | 815 | |
| | | | | | | | | | | | |
- (a)
- Deposits and borrowings exclude accrued interest.
- (b)
- Includes unrecognized tax benefits.
In addition to contractual obligations, other commercial commitments of the Corporation impact liquidity. These include commitments to purchase and sell earning assets, commitments to fund indirect private equity and venture capital investments, unused commitments to extend credit, standby letters of credit and financial guarantees, and commercial letters of credit. The following commercial commitments table summarizes the Corporation's commercial commitments and expected expiration dates by period.
Commercial Commitments
| | | | | | | | | | | | | | | | | |
| | Expected Expiration Dates by Period | |
|---|
December 31, 2009 | | Total | | Less than
1 Year | | 1–3
Years | | 3–5
Years | | More than
5 Years | |
|---|
| | (in millions)
| |
|---|
Commitments to purchase investment securities | | $ | 19 | | $ | 19 | | $ | — | | $ | — | | $ | — | |
Commitments to sell investment securities | | | 19 | | | 19 | | | — | | | — | | | — | |
Commitments to fund indirect private equity and venture capital investments | | | 27 | | | 4 | | | 5 | | | 2 | | | 16 | |
Unused commitments to extend credit | | | 24,368 | | | 10,092 | | | 11,506 | | | 1,093 | | | 1,677 | |
Standby letters of credit and financial guarantees | | | 5,670 | | | 3,812 | | | 1,398 | | | 416 | | | 44 | |
Commercial letters of credit | | | 104 | | | 92 | | | 11 | | | 1 | | | — | |
| | | | | | | | | | | | |
| | Total commercial commitments | | $ | 30,207 | | $ | 14,038 | | $ | 12,920 | | $ | 1,512 | | $ | 1,737 | |
| | | | | | | | | | | | |
Since many of these commitments expire without being drawn upon, the total amount of these commercial commitments does not necessarily represent the future cash requirements of the Corporation. Refer to the "Other Market Risks" section below and Note 10 to the consolidated financial statements for a further discussion of these commercial commitments.
Wholesale Funding
The Corporation satisfies liquidity requirements with either liquid assets or various funding sources. At December 31, 2009, the Corporation held excess liquidity, represented by $4.8 billion deposited with the FRB. The Corporation may access the purchased funds market when necessary, which includes certificates of deposit
56
Table of Contents
issued to institutional investors in denominations in excess of $100,000 and to retail customers in denominations of less than $100,000 through brokers ("other time deposits" on the consolidated balance sheets), foreign office time deposits and short-term borrowings. Purchased funds totaled $2.1 billion at December 31, 2009, compared to $9.5 billion and $10.2 billion at December 31, 2008 and 2007, respectively. Capacity for incremental purchased funds at December 31, 2009 consisted largely of federal funds purchased, brokered certificates of deposits and securities sold under agreements to repurchase. In addition, the Corporation is a member of the Federal Home Loan Bank of Dallas, Texas (FHLB), which provides short- and long-term funding to its members through advances collateralized by real estate-related assets. The actual borrowing capacity is contingent on the amount of collateral available to be pledged to the FHLB. As of December 31, 2009, the Corporation had $6.0 billion of outstanding borrowings from the FHLB with remaining maturities ranging from less than 3 months to 5 years. Another source of funding, if needed, would be liquid assets, which totaled $7.7 billion at December 31, 2009, compared to $6.5 billion at December 31, 2008, including cash and due from banks, federal funds sold and securities purchased under agreements to resell, interest-bearing deposits with the FRB and other banks, other short-term investments and unencumbered investment securities available-for-sale. Additionally, if market conditions were to permit, the Corporation could issue up to $12.8 billion of debt at December 31, 2009 under an existing $15 billion medium-term senior note program which allows its principal banking subsidiary to issue debt with maturities between one year and 30 years.
The Corporation participates in the voluntary Temporary Liquidity Guarantee Program (the TLG Program) announced by the FDIC in October 2008 and amended in March 2009, for certain debt issuances prior to October 2009. At December 31, 2009, there was approximately $7 million of senior unsecured debt outstanding in the form of bank-to-bank deposits guaranteed by the FDIC issued under the TLG Program. For more information regarding the TLG program, refer to Note 14 to the consolidated financial statements.
The ability of the Corporation and the Bank to raise funds at competitive rates is impacted by rating agencies' views of the credit quality, liquidity, capital and earnings of the Corporation and the Bank. As of December 31, 2009, the four major rating agencies had assigned the following ratings to long-term senior unsecured obligations of the Corporation and the Bank. A security rating is not a recommendation to buy, sell, or hold securities and may be subject to revision or withdrawal at any time by the assigning rating agency. Each rating should be evaluated independently of any other rating.
| | | | |
December 31, 2009 | | Comerica
Incorporated | | Comerica
Bank |
|---|
Standard and Poor's | | A- | | A |
Moody's Investors Service | | A2 | | A1 |
Fitch Ratings | | A | | A |
Dominion Bond Rating Service | | A | | A (High) |
The parent company held $5 million of cash and cash equivalents and $2.2 billion of short-term investments with its principle banking subsidiary at December 31, 2009. A source of liquidity for the parent company is dividends from its subsidiaries. As discussed in Note 22 to the consolidated financial statements, banking subsidiaries are subject to regulation and may be limited in their ability to pay dividends or transfer funds to the parent company. During 2010, the banking subsidiaries can pay dividends up to approximately $56 million plus 2010 net profits without prior regulatory approval. The Corporation has sufficient liquid assets at December 31, 2009 to fulfill its 2010 dividend payment obligations without reliance on dividend payments from banking subsidiaries. One measure of current parent company liquidity is investment in subsidiaries as a percentage of shareholders' equity. A ratio over 100 percent represents the reliance on subsidiary dividends to repay liabilities. As of December 31, 2009, the ratio was 81 percent. Refer to the "Contractual Obligations" table in this financial review for information on parent company future minimum payments on medium- and long-term debt.
The Corporation regularly evaluates its ability to meet funding needs in unanticipated, stressed environments. In conjunction with the quarterly 200 basis point interest rate shock analyses, discussed in the "Interest Rate Sensitivity" section of this financial review, liquidity ratios and potential funding availability are
57
Table of Contents
examined. Each quarter, the Corporation also evaluates its ability to meet liquidity needs under a series of broad events, distinguished in terms of duration and severity. The evaluation as of December 31, 2009 projected that sufficient sources of liquidity were available under each series of events.
Variable Interest Entities
The Corporation also holds a significant interest in certain unconsolidated variable interest entities (VIEs). These unconsolidated VIEs are principally indirect private equity and venture capital funds and low income housing limited partnerships. The Corporation defines a significant interest in a VIE as a subordinated interest that exposes the Corporation to a significant portion of the VIEs expected losses or residual returns. In general, a VIE is an entity that either (1) has an insufficient amount of equity to carry out its principal activities without additional subordinated financial support, (2) has a group of equity owners that are unable to make significant decisions about its activities, or (3) has a group of equity owners that do not have the obligation to absorb losses or the right to receive returns generated by its operations. If any of these characteristics is present, the entity is subject to a variable interests consolidation model, and consolidation is based on variable interests, not on ownership of the entity's outstanding voting stock. Variable interests are defined as contractual, ownership, or other monetary interests in an entity that change with fluctuations in the entity's net asset value. A company must consolidate an entity depending on whether the entity is a voting rights entity or a VIE. Refer to the "Principles of Consolidation" section in Note 1 to the consolidated financial statements for a summary of the Corporation's consolidation policy. Also, refer to Note 11 to the consolidated financial statements for a discussion of the Corporation's involvement in VIEs, including those in which the Corporation holds a significant interest but for which it is not the primary beneficiary.
Other Market Risks
Market risk related to the Corporation's trading instruments is not significant, as trading activities are limited. Certain components of the Corporation's noninterest income, primarily fiduciary income, are at risk to fluctuations in the market values of underlying assets, particularly equity and debt securities. Other components of noninterest income, primarily brokerage fees, are at risk to changes in the volume of market activity.
Share-based compensation expense recognized by the Corporation is dependent upon the fair value of stock options and restricted stock at the date of grant. The fair value of both stock options and restricted stock is impacted by the market price of the Corporation's stock on the date of grant and is at risk to changes in equity markets, general economic conditions and other factors. For further information regarding the valuation of stock options and restricted stock, refer to the "Critical Accounting Policies" section of this financial review.
Nonmarketable Equity Securities
At December 31, 2009, the Corporation had a $57 million portfolio of investments in indirect private equity and venture capital funds, with commitments of $27 million to fund additional investments in future periods. The value of these investments is at risk to changes in equity markets, general economic conditions and a variety of other factors. The majority of these investments are not readily marketable and are reported in other assets. The investments are individually reviewed for impairment on a quarterly basis by comparing the carrying value to the estimated fair value. For further information regarding the valuation of nonmarketable equity securities, refer to the "Critical Accounting Policies" section of this financial review. Income from indirect private equity and venture capital funds in 2009 was $3 million, which was more than offset by $15 million of write-downs and
58
Table of Contents
expenses recognized on such investments in 2009. The following table provides information on the Corporation's indirect private equity and venture capital funds investment portfolio.
| | | | |
| | December 31,
2009 | |
|---|
| | (dollar amounts
in millions)
| |
|---|
Number of investments | | | 133 | |
Balance of investments | | $ | 57 | |
Largest single investment | | | 6 | |
Commitments to fund additional investments | | | 27 | |
OPERATIONAL RISK
Operational risk represents the risk of loss resulting from inadequate or failed internal processes, people and systems, or from external events. The definition includes legal risk, which is the risk of loss resulting from failure to comply with laws and regulations as well as prudent ethical standards and contractual obligations. It also includes the exposure to litigation from all aspects of an institution's activities. The definition does not include strategic or reputational risks. Although operational losses are experienced by all companies and are routinely incurred in business operations, the Corporation recognizes the need to identify and control operational losses and seeks to limit losses to a level deemed appropriate by management after considering the nature of the Corporation's business and the environment in which it operates. Operational risk is mitigated through a system of internal controls that are designed to keep operating risks at appropriate levels. The Operational Risk Management Committee monitors risk management techniques and systems. The Corporation has developed a framework that includes a centralized operational risk management function and business/support unit risk coordinators responsible for managing operational risk specific to the respective business lines.
In addition, internal audit and financial staff monitor and assess the overall effectiveness of the system of internal controls on an ongoing basis. Internal Audit reports the results of reviews on the controls and systems to management and the Audit Committee of the Board. The internal audit staff independently supports the Audit Committee oversight process. The Audit Committee serves as an independent extension of the Board.
COMPLIANCE RISK
Compliance risk represents the risk of regulatory sanctions, reputational impact or financial loss resulting from the Corporation's failure to comply with regulations and standards of good banking practice. Activities which may expose the Corporation to compliance risk include, but are not limited to, those dealing with the prevention of money laundering, privacy and data protection, community reinvestment initiatives, fair lending challenges resulting from the Corporation's expansion of its banking center network and employment and tax matters.
The Enterprise-Wide Compliance Committee, comprised of senior business unit managers, as well as managers responsible for compliance, audit and overall risk, oversees compliance risk. This enterprise-wide approach provides a consistent view of compliance across the organization. The Enterprise-Wide Compliance Committee also ensures that appropriate actions are implemented in business units to mitigate risk to an acceptable level.
BUSINESS RISK
Business risk represents the risk of loss due to impairment of reputation, failure to fully develop and execute business plans, failure to assess current and new opportunities in business, markets and products, and any other event not identified in the defined risk categories of credit, market, operational or compliance risks. Mitigation of the various risk elements that represent business risk is achieved through initiatives to help the Corporation better understand and report on the various risks. Wherever quantifiable, the Corporation uses situational analysis and other testing techniques to appreciate the scope and extent of these risks.
59
Table of Contents
CRITICAL ACCOUNTING POLICIES
The Corporation's consolidated financial statements are prepared based on the application of accounting policies, the most significant of which are described in Note 1 to the consolidated financial statements. These policies require numerous estimates and strategic or economic assumptions, which may prove inaccurate or subject to variations. Changes in underlying factors, assumptions or estimates could have a material impact on the Corporation's future financial condition and results of operations. The most critical of these significant accounting policies are the policies related to allowance for credit losses, valuation methodologies, pension plan accounting and income taxes. These policies are reviewed with the Audit Committee of the Board and are discussed more fully below.
ALLOWANCE FOR CREDIT LOSSES
The allowance for credit losses, which includes both the allowance for loan losses and the allowance for credit losses on lending-related commitments, is calculated with the objective of maintaining a reserve sufficient to absorb estimated probable losses. Management's determination of the adequacy of the allowance is based on periodic evaluations of the loan portfolio, lending-related commitments, and other relevant factors. This evaluation is inherently subjective as it requires an estimate of the loss content for each risk rating and for each impaired loan, an estimate of the amounts and timing of expected future cash flows, an estimate of the value of collateral, including the fair value of assets with few transactions (e.g., residential real estate developments and nonmarketable securities), many of which may be stressed, and an estimate of the probability of draw on unused commitments.
Allowance for Loan Losses
Loans for which it is probable that payment of interest and principal will not be made in accordance with the contractual terms of the loan agreement are considered impaired. Consistent with this definition, all nonaccrual and reduced-rate loans are impaired. The fair value of impaired loans is estimated using one of several methods, including the estimated collateral value, market value of similar debt or discounted cash flows. The valuation is reviewed and updated on a quarterly basis. While the determination of fair value may involve estimates, each estimate is unique to the individual loan, and none is individually significant.
The allowance for loan losses provides for probable losses that have been identified with specific customer relationships and for probable losses believed to be inherent in the loan portfolio that have not been specifically identified. Internal risk ratings are assigned to each business loan at the time of approval and are subject to subsequent periodic reviews by the Corporation's senior management. The Corporation performs a detailed credit quality review quarterly on both large business and certain large consumer and residential mortgage loans that have deteriorated below certain levels of credit risk and may allocate a specific portion of the allowance to such loans based upon this review. The Corporation defines business loans as those belonging to the commercial, real estate construction, commercial mortgage, lease financing and international loan portfolios. The portion of the allowance allocated to the remaining business loans is determined by applying estimated loss ratios to loans in each risk category. The portion of the allowance allocated to all other consumer and residential mortgage loans is determined by applying estimated loss ratios to various segments of the loan portfolios. Estimated loss ratios incorporate factors such as recent charge-off experience, current economic conditions and trends, changes in collateral values of properties securing loans, and trends with respect to past due and nonaccrual amounts, and are supported by underlying analysis, including information on migration and loss given default studies from each of the three major domestic geographic markets, as well as mapping to bond tables. Since a loss ratio is applied to a large portfolio of loans, any variation between actual and assumed results could be significant. In addition, a portion of the allowance is allocated to these remaining loans based on industry-specific risks inherent in certain portfolios that have experienced above average losses, including portfolio exposures to Small Business loans, high technology companies, retail trade (gasoline delivery) companies and automotive parts and tooling supply companies.
60
Table of Contents
A portion of the allowance is also maintained to cover factors affecting the determination of probable losses inherent in the loan portfolio that are not necessarily captured by the application of estimated loss ratios or identified industry specific risks including the imprecision in the risk rating system.
The principle assumption used in deriving the allowance for loan losses is the estimate of loss content for each risk rating. To illustrate, if recent loss experience dictated that the estimated loss ratios would be changed by five percent (of the estimate) across all risk ratings, the allowance for loan losses as of December 31, 2009 would change by approximately $50 million.
Allowance for Credit Losses on Lending-Related Commitments
Lending-related commitments for which it is probable that the commitment will be drawn (or sold) are reserved with the same estimated loss rates as loans, or with specific reserves. In general, the probability of draw for letters of credit is considered certain once the credit is assigned a risk rating that is generally consistent with regulatory defined substandard or doubtful. Other letters of credits and all unfunded commitments have a lower probability of draw, to which standard loan loss rates are applied.
For further discussion of the methodology used in the determination of the allowance for credit losses, refer to the "Allowance for Credit Losses" section in this financial review and Note 1 to the consolidated financial statements. To the extent actual outcomes differ from management estimates, additional provision for credit losses may be required that would adversely impact earnings in future periods. A substantial majority of the allowance is assigned to business segments. Any earnings impact resulting from actual outcomes differing from management estimates would primarily affect the Business Bank segment.
VALUATION METHODOLOGIES
Fair Value Measurement of Level 3 Financial Instruments
Fair value measurement applies whenever accounting guidance requires or permits assets or liabilities to be measured at fair value. Fair value is defined as the exchange price that would be received to sell an asset or paid to transfer a liability in the principal or most advantageous market for the asset or liability in an orderly transaction (i.e., not a forced transaction, such as a liquidation or distressed sale) between market participants at the measurement date and is based on the assumptions market participants would use when pricing an asset or liability.
Fair value measurement and disclosure guidance establishes a three-level hierarchy for disclosure of assets and liabilities recorded at fair value. The classification of assets and liabilities within the hierarchy is based on whether the inputs used for measurement are observable or unobservable. Observable inputs reflect market-derived or market-based information obtained from independent sources, while unobservable inputs reflect management's estimates about market data. Level 1 and 2 valuations are based on quoted prices for identical instruments traded in active markets and quoted prices for similar instruments in active markets, quoted prices for identical or similar instruments in markets that are not active, and model-based valuation techniques for which all significant assumptions are observable in the market. Level 3 valuations are generated from model-based techniques that use at least one significant assumption not observable in the market. These unobservable assumptions reflect estimates of assumptions market participants would use in pricing the asset or liability. Valuation techniques include the use of option pricing models, discounted cash flow models and similar techniques.
Fair value measurement and disclosure guidance differentiates between those assets and liabilities required to be carried at fair value at every reporting period ("recurring") and those assets and liabilities that are only required to be adjusted to fair value under certain circumstances ("nonrecurring"). Level 3 financial instruments recorded at fair value on a recurring basis included primarily auction-rate securities at December 31, 2009. Additionally, from time to time, the Corporation may be required to record at fair value other financial assets or liabilities on a nonrecurring basis. Note 3 to the consolidated financial statements includes information about the
61
Table of Contents
extent to which fair value is used to measure assets and liabilities and the valuation methodologies and key inputs used.
For assets and liabilities recorded at fair value, the Corporation's policy is to maximize the use of observable inputs and minimize the use of unobservable inputs when developing fair value measurements for those items where there is an active market. In certain cases, when market observable inputs for model-based valuation techniques may not be readily available, the Corporation is required to make judgments about assumptions market participants would use in estimating the fair value of the financial instrument. The models used to determine fair value adjustments are periodically evaluated by management for relevance under current facts and circumstances.
Changes in market conditions may reduce the availability of quoted prices or observable data. For example, reduced liquidity in the capital markets or changes in secondary market activities could result in observable market inputs becoming unavailable. Therefore, when market data is not available, the Corporation would use valuation techniques requiring more management judgment to estimate the appropriate fair value.
At December 31, 2009, Level 3 financial assets recorded at fair value on a recurring basis totaled $916 million, or two percent of total assets, and consisted primarily of auction-rate securities. At December 31, 2009, there were no Level 3 financial liabilities recorded at fair value on a recurring basis.
At December 31, 2009, Level 3 financial assets recorded at fair value on a nonrecurring basis totaled $1.3 billion, or two percent of total assets, and consisted primarily of impaired loans and foreclosed property. At December 31, 2009, there were no financial liabilities recorded at fair value on a nonrecurring basis.
See Note 3 to the consolidated financial statements for a complete discussion on the Corporation's use of fair value and the related measurement techniques.
Restricted Stock and Stock Options
The fair value of share-based compensation as of the date of grant is recognized as compensation expense on a straight-line basis over the vesting period, taking into consideration the effect of retirement-eligible status and Capital Purchase Program restrictions on the vesting period. In 2009, the Corporation recognized total share-based compensation expense of $32 million. The option valuation model requires several inputs, including the risk-free interest rate, the expected dividend yield, expected volatility factors of the market price of the Corporation's common stock and the expected option life. For further discussion on the valuation model inputs, see Note 18 to the consolidated financial statements. Changes in input assumptions can materially affect the fair value estimates. The option valuation model is sensitive to the market price of the Corporation's stock at the grant date, which affects the fair value estimates and, therefore, the amount of expense recorded on future grants. Using the number of stock options granted in 2009 and the Corporation's stock price at December 31, 2009, a $5.00 per share increase in stock price would result in an increase in pretax expense of approximately $2 million, from the assumed base, over the options' vesting periods. The fair value of restricted stock is based on the market price of the Corporation's stock at the grant date. Using the number of restricted stock awards issued in 2009, a $5.00 per share increase in stock price would result in an increase in pretax expense of approximately $4 million, from the assumed base, over the awards' vesting periods. Refer to Notes 1 and 18 to the consolidated financial statements for further discussion of share-based compensation expense.
Nonmarketable Equity Securities
At December 31, 2009, the Corporation had a $57 million portfolio of investments in indirect private equity and venture capital investments, with commitments of $27 million to fund additional investments in future periods. The majority of these investments are not readily marketable. The investments are individually reviewed for impairment, on a quarterly basis, by comparing the carrying value to the estimated fair value. Fair value measurement guidance permits the measurement of investments of this type on the basis of net asset value per share, provided the net asset value is calculated by the fund in compliance with fair value measurement guidance
62
Table of Contents
applicable to investment companies. The Corporation bases its estimates of fair value for the majority of its indirect private equity and venture capital investments on its percentage ownership in the net asset value of the entire fund, as reported by the fund, after indication that the fund adheres to applicable fair value measurement guidance. For those funds where net asset value is not reported by the fund, the Corporation derives the fair value of the fund by estimating the fair value of each underlying investment in the fund. In addition to using qualitative information about each underlying investment, as provided by the fund, the Corporation gives consideration to information pertinent to the specific nature of the debt or equity investment, such as relevant market conditions, offering prices, operating results, financial conditions, exit strategy and other qualitative information, as available. The lack of an independent source to validate fair value estimates, including the impact of future capital calls and transfer restrictions, is an inherent limitation in the valuation process. The amount by which the carrying value exceeds the fair value that is determined to be other-than-temporary impairment is charged to current earnings and the carrying value of the investment is written down accordingly. While the determination of fair value involves estimates, no generic assumption is applied to all investments when evaluating for impairment. As such, each estimate is unique to the individual investment, and none is individually significant. The inherent uncertainty in the process of valuing equity securities for which a ready market is unavailable may cause our estimated values of these securities to differ significantly from the values that would have been derived had a ready market for the securities existed, and those differences could be material. The value of these investments is at risk to changes in equity markets, general economic conditions and a variety of other factors, which could result in an impairment charge in future periods.
Auction-Rate Securities
As a result of the Corporation's 2008 repurchase, at par, of auction-rate securities held by certain customers, the Corporation holds a portfolio of auction-rate securities recorded as investment securities available-for-sale and stated at fair value of $901 million at December 31, 2009. Due to the lack of a robust secondary auction-rate securities market with active fair value indications, fair value at December 31, 2009 was determined using an income approach based on a discounted cash flow model utilizing two significant assumptions in the model: discount rate (including a liquidity risk premium for certain securities) and workout period. The discount rate was calculated using credit spreads of the underlying collateral or similar securities plus a liquidity risk premium. The liquidity risk premium was based on observed industry auction-rate securities valuations by third parties. The workout period was based on an assessment of publicly available information on efforts to re-establish functioning markets for these securities and the Corporation's redemption experience.
The fair value of auction-rate securities recorded on the Corporation's consolidated balance sheets represents management's best estimate of the fair value of these instruments within the framework of existing accounting standards. Changes in the above material assumptions could result in significantly different valuations. For example, an increase or decrease in the liquidity premium of 100 basis points changes the fair value by $22 million.
The valuation of auction-rate securities is complex and is subject to a certain degree of management judgment. The inherent uncertainty in the process of valuing auction-rate securities for which a ready market is unavailable may cause estimated values of these auction-rate securities assets to differ from the values that would have been derived had a ready market for the auction-rate securities existed, and those differences could be significant. The use of an alternative valuation methodology or alternative approaches used to calculate material assumptions could result in significantly different estimated values for these assets. In addition, the value of auction-rate securities is at risk to changes in equity markets, general economic conditions and other factors.
PENSION PLAN ACCOUNTING
The Corporation has defined benefit pension plans in effect for substantially all full-time employees hired before January 1, 2007. Benefits under the plans are based on years of service, age and compensation. Assumptions are made concerning future events that will determine the amount and timing of required benefit payments, funding requirements and defined benefit pension expense. The three major assumptions are the
63
Table of Contents
discount rate used in determining the current benefit obligation, the long-term rate of return expected on plan assets and the rate of compensation increase. The assumed discount rate is determined by matching the expected cash flows of the pension plans to a yield curve that is representative of long-term, high-quality fixed income debt instruments as of the measurement date, December 31. The long-term rate of return expected on plan assets is set after considering both long-term returns in the general market and long-term returns experienced by the assets in the plan. The current target asset allocation model for the plans is detailed in Note 19 to the consolidated financial statements. The expected returns on these various asset categories are blended to derive one long-term return assumption. The assets are invested in certain collective investment and mutual funds, common stocks, U.S. Treasury and other U.S. government agency securities, and corporate and municipal bonds and notes. The rate of compensation increase is based on reviewing recent annual pension-eligible compensation increases as well as the expectation of future increases. The Corporation reviews its pension plan assumptions on an annual basis with its actuarial consultants to determine if the assumptions are reasonable and adjusts the assumptions to reflect changes in future expectations.
The key actuarial assumptions used to calculate 2010 expense for the defined benefit pension plans were a discount rate of 5.92 percent, a long-term rate of return on plan assets of 8.00 percent and a rate of compensation increase of 3.5 percent. Defined benefit pension expense in 2010 is expected to be approximately $19 million, a decrease of $38 million from the $57 million recorded in 2009, primarily driven by the improvement in plan asset values in 2009 and changes in plan demographics.
Changing the 2010 key actuarial assumptions discussed above by 25 basis points would have the following impact on defined benefit pension expense in 2010:
| | | | | | | |
| | 25 Basis Point | |
|---|
| | Increase | | Decrease | |
|---|
| | (in millions)
| |
|---|
Key Actuarial Assumption | | | | | | | |
Discount rate | | $ | (6.0 | ) | $ | 6.0 | |
Long-term rate of return | | | (3.6 | ) | | 3.6 | |
Rate of compensation increase | | | 2.6 | | | (2.6 | ) |
If the assumed long-term return on plan assets differs from the actual return on plan assets, the asset gains or losses are incorporated in the market-related value, which is used to determine the expected return on assets, over a five-year period. The Employee Benefits Committee, which consists of executive and senior managers from various areas of the Corporation, provides broad asset allocation guidelines to the asset managers, who report results and investment strategy quarterly to the Employee Benefits Committee. Actual asset allocations are compared to target allocations by asset category and investment returns for each class of investment are compared to expected results based on broad market indices.
The net funded status of the qualified defined benefit pension plan was an asset of $125 million at December 31, 2009. Due to the long-term nature of pension plan assumptions, actual results may differ significantly from the actuarial-based estimates. Differences between estimates and experience not recovered in the market or by future assumption changes are required to be recorded in shareholders' equity as part of accumulated other comprehensive income (loss) and amortized to defined benefit pension expense in future years. For further information, refer to Note 1 to the consolidated financial statements. The actuarial net gain in the qualified defined benefit plan recognized in accumulated other comprehensive income (loss) at December 31, 2009 was $89 million, net of tax. In 2009, the actual return on plan assets was $200 million, compared to an expected return on plan assets of $104 million. In 2008, the actual loss on plan assets was $293 million, compared to an expected return on plan assets of $100 million. The Corporation may make contributions from time to time to the qualified defined benefit plan to mitigate the impact of the actuarial losses on future years. A contribution of $100 million was made to the plan in 2009.
Defined benefit pension expense is recorded in "employee benefits" expense on the consolidated statements of income and is allocated to business segments based on the segment's share of salaries expense.
64
Table of Contents
Given the salaries expense included in 2009 segment results, defined benefit pension expense was allocated approximately 40 percent, 29 percent, 26 percent and 5 percent to the Retail Bank, Business Bank, Wealth & Institutional Management and Finance segments, respectively, in 2009.
INCOME TAXES
The calculation of the Corporation's income tax provision (benefit) and tax-related accruals is complex and requires the use of estimates and judgments. The provision for income taxes is based on amounts reported in the consolidated statements of income after deducting non-taxable items, principally income on bank-owned life insurance, and deducting tax credits related to investments in low income housing partnerships, and includes deferred income taxes on temporary differences between the income tax basis and financial accounting basis of assets and liabilities. Accrued taxes represent the net estimated amount due to or to be received from taxing jurisdictions, currently or in the future, and are included in "accrued income and other assets" or "accrued expenses and other liabilities" on the consolidated balance sheets. The Corporation assesses the relative risks and merits of tax positions for various transactions after considering statutes, regulations, judicial precedent and other available information and maintains tax accruals consistent with these assessments. The Corporation is subject to audit by taxing authorities that could question and/or challenge the tax positions taken by the Corporation.
Included in net deferred taxes are deferred tax assets. Deferred tax assets are evaluated for realization based on available evidence of loss carryback capacity, projected future reversals of existing taxable temporary differences and assumptions made regarding future events. A valuation allowance is provided when it is more-likely-than-not that some portion of the deferred tax asset will not be realized. At December 31, 2009, the Corporation carried a valuation allowance of $1 million for certain state deferred tax assets.
Changes in the estimate of accrued taxes occur due to changes in tax law, interpretations of existing tax laws, new judicial or regulatory guidance, and the status of examinations conducted by taxing authorities that impact the relative risks and merits of tax positions taken by the Corporation. These changes in the estimate of accrued taxes could be significant to the operating results of the Corporation. For further information on tax accruals and related risks, see Note 20 to the consolidated financial statements.
65
Table of Contents
SUPPLEMENTAL FINANCIAL DATA
The following table provides a reconciliation of non-GAAP financial measures used in this financial review with financial measures defined by GAAP.
| | | | | | | | | | | | | | | | | |
| | December 31 | |
|---|
| | 2009 | | 2008 | | 2007 | | 2006 | | 2005 | |
|---|
| | (dollar amounts in millions)
| |
|---|
Tier 1 capital (a) | | $ | 7,704 | | $ | 7,805 | | $ | 5,640 | | $ | 5,657 | | $ | 5,399 | |
Less: | | | | | | | | | | | | | | | | |
| | Fixed rate cumulative perpetual preferred stock | | | 2,151 | | | 2,129 | | | — | | | — | | | — | |
| | Trust preferred securities | | | 495 | | | 495 | | | 495 | | | 339 | | | 387 | |
| | | | | | | | | | | | |
Tier 1 common capital | | $ | 5,058 | | $ | 5,181 | | $ | 5,145 | | $ | 5,318 | | $ | 5,012 | |
| | | | | | | | | | | | |
Risk-weighted assets (a) | | $ | 61,815 | | $ | 73,702 | | $ | 75,102 | | $ | 70,486 | | $ | 64,390 | |
Tier 1 common capital ratio | | | 8.18 | % | | 7.08 | % | | 6.85 | % | | 7.54 | % | | 7.78 | % |
| | | | | | | | | | | | |
Total shareholders' equity | | $ | 7,029 | | $ | 7,152 | | $ | 5,117 | | $ | 5,153 | | $ | 5,068 | |
Less: | | | | | | | | | | | | | | | | |
| | Fixed rate cumulative perpetual preferred stock | | | 2,151 | | | 2,129 | | | — | | | — | | | — | |
| | Goodwill | | | 150 | | | 150 | | | 150 | | | 150 | | | 213 | |
| | Other intangible assets | | | 8 | | | 12 | | | 12 | | | 14 | | | 20 | |
| | | | | | | | | | | | |
Tangible common equity | | $ | 4,720 | | $ | 4,861 | | $ | 4,955 | | $ | 4,989 | | $ | 4,835 | |
| | | | | | | | | | | | |
Total assets | | $ | 59,249 | | $ | 67,548 | | $ | 62,331 | | $ | 58,001 | | $ | 53,013 | |
Less: | | | | | | | | | | | | | | | | |
| | Goodwill | | | 150 | | | 150 | | | 150 | | | 150 | | | 213 | |
| | Other intangible assets | | | 8 | | | 12 | | | 12 | | | 14 | | | 20 | |
| | | | | | | | | | | | |
Tangible assets | | $ | 59,091 | | $ | 67,386 | | $ | 62,169 | | $ | 57,837 | | $ | 52,780 | |
| | | | | | | | | | | | |
Tangible common equity ratio | | | 7.99 | % | | 7.21 | % | | 7.97 | % | | 8.62 | % | | 9.16 | % |
| | | | | | | | | | | | |
- (a)
- Tier 1 capital and risk-weighted assets as defined by regulation.
The Tier 1 common capital ratio removes preferred stock and qualifying trust preferred securities from Tier 1 capital as defined by and calculated in conformity with bank regulations. The tangible common equity ratio removes preferred stock and the effect of intangible assets from capital and the effect of intangible assets from total assets. The Corporation believes these measurements are meaningful measures of capital adequacy used by investors, regulators, management and others to evaluate the adequacy of common equity and to compare against other companies in the industry.
66
Table of Contents
FORWARD-LOOKING STATEMENTS
This report includes forward-looking statements, as defined in the Private Securities Litigation Reform Act of 1995. In addition, the Corporation may make other written and oral communications from time to time that contain such statements. All statements regarding the Corporation's expected financial position, strategies and growth prospects and general economic conditions expected to exist in the future are forward-looking statements. The words, "anticipates," "believes," "feels," "expects," "estimates," "seeks," "strives," "plans," "intends," "outlook," "forecast," "position," "target," "mission," "assume," "achievable," "potential," "strategy," "goal," "aspiration," "outcome," "continue," "remain," "maintain," "trend," "objective," and variations of such words and similar expressions, or future or conditional verbs such as "will," "would," "should," "could," "might," "can," "may" or similar expressions, as they relate to the Corporation or its management, are intended to identify forward-looking statements.
The Corporation cautions that forward-looking statements are subject to numerous assumptions, risks and uncertainties, which change over time. Forward-looking statements speak only as of the date the statement is made, and the Corporation does not undertake to update forward-looking statements to reflect facts, circumstances, assumptions or events that occur after the date the forward-looking statements are made. Actual results could differ materially from those anticipated in forward-looking statements and future results could differ materially from historical performance.
In addition to factors mentioned elsewhere in this report or previously disclosed in the Corporation's SEC reports (accessible on the SEC's website atwww.sec.gov or on the Corporation's website atwww.comerica.com), actual results could differ materially from forward-looking statements and future results could differ materially from historical performance due to a variety of reasons, including but not limited to, the following factors:
- •
- general political, economic or industry conditions, either domestically or internationally, may be less favorable than expected;
- •
- governmental monetary and fiscal policies may adversely affect the financial services industry and, therefore, impact the Corporation's financial condition and results of operations;
- •
- volatility and disruptions in the functioning of the financial markets and related liquidity issues could continue or worsen and, therefore, may adversely impact the Corporation's business, financial condition and results of operations;
- •
- changes in the performance and creditworthiness of our customers and other counterparties may adversely impact the Corporation's business, financial condition and results of operations;
- •
- the soundness of other financial institutions could adversely affect the Corporation;
- •
- recently enacted legislation, actions recently taken or proposed by the United States Department of Treasury, the Federal Deposit Insurance Corporation, the Federal Reserve Bank or other governmental entities, and legislation enacted in the future subject the Corporation to further regulation, and the impact and expiration of such legislation and regulatory actions may adversely affect the Corporation;
- •
- unfavorable developments concerning credit quality could adversely impact the Corporation's financial results;
- •
- problems faced by residential real estate developers could adversely affect the Corporation;
- •
- businesses or industries in which the Corporation has lending concentrations, including, but not limited to, the automotive production industry and the real estate business, could suffer a significant decline, which could adversely affect the Corporation;
- •
- the introduction, implementation, withdrawal, success and timing of business initiatives and strategies, including, but not limited to, the opening of new banking centers and plans to grow personal financial
67
Table of Contents
68
Table of Contents
CONSOLIDATED BALANCE SHEETS
Comerica Incorporated and Subsidiaries
| | | | | | | | | | |
| | December 31 | |
|---|
| | 2009 | | 2008 | |
|---|
| | (in millions, except
share data)
| |
|---|
ASSETS | | | | | | | |
Cash and due from banks | | $ | 774 | | $ | 913 | |
Federal funds sold and securities purchased under agreements to resell | | |
— | | |
202 | |
Interest-bearing deposits with banks | | | 4,843 | | | 2,308 | |
Other short-term investments | | | 138 | | | 158 | |
Investment securities available-for-sale | | |
7,416 | | |
9,201 | |
Commercial loans | | |
21,690 | | |
27,999 | |
Real estate construction loans | | | 3,461 | | | 4,477 | |
Commercial mortgage loans | | | 10,457 | | | 10,489 | |
Residential mortgage loans | | | 1,651 | | | 1,852 | |
Consumer loans | | | 2,511 | | | 2,592 | |
Lease financing | | | 1,139 | | | 1,343 | |
International loans | | | 1,252 | | | 1,753 | |
| | | | | | |
| | | | Total loans | | | 42,161 | | | 50,505 | |
Less allowance for loan losses | | | (985 | ) | | (770 | ) |
| | | | | | |
| | | | Net loans | | | 41,176 | | | 49,735 | |
Premises and equipment | | | 644 | | | 683 | |
Customers' liability on acceptances outstanding | | | 11 | | | 14 | |
Accrued income and other assets | | | 4,247 | | | 4,334 | |
| | | | | | |
| | | | Total assets | | $ | 59,249 | | $ | 67,548 | |
| | | | | | |
LIABILITIES AND SHAREHOLDERS' EQUITY | | | | | | | |
Noninterest-bearing deposits | | $ | 15,871 | | $ | 11,701 | |
Money market and NOW deposits | | |
14,450 | | |
12,437 | |
Savings deposits | | | 1,342 | | | 1,247 | |
Customer certificates of deposit | | | 6,413 | | | 8,807 | |
Other time deposits | | | 1,047 | | | 7,293 | |
Foreign office time deposits | | | 542 | | | 470 | |
| | | | | | |
| | | | Total interest-bearing deposits | | | 23,794 | | | 30,254 | |
| | | | | | |
| | | | Total deposits | | | 39,665 | | | 41,955 | |
Short-term borrowings | | | 462 | | | 1,749 | |
Acceptances outstanding | | | 11 | | | 14 | |
Accrued expenses and other liabilities | | | 1,022 | | | 1,625 | |
Medium- and long-term debt | | | 11,060 | | | 15,053 | |
| | | | | | |
| | | | Total liabilities | | | 52,220 | | | 60,396 | |
Fixed rate cumulative perpetual preferred stock, series F, no par value,
$1,000 liquidation value per share: | | | | | | | |
| | | Authorized — 2,250,000 shares | | | | | | | |
| | | Issued — 2,250,000 shares at 12/31/09 and 12/31/08 | | | 2,151 | | | 2,129 | |
Common stock — $5 par value: | | | | | | | |
| | | Authorized — 325,000,000 shares | | | | | | | |
| | | Issued — 178,735,252 shares at 12/31/09 and 12/31/08 | | | 894 | | | 894 | |
Capital surplus | | | 740 | | | 722 | |
Accumulated other comprehensive loss | | | (336 | ) | | (309 | ) |
Retained earnings | | | 5,161 | | | 5,345 | |
Less cost of common stock in treasury — 27,555,623 shares at 12/31/09
and 28,244,967 shares at 12/31/08 | | | (1,581 | ) | | (1,629 | ) |
| | | | | | |
| | | | Total shareholders' equity | | | 7,029 | | | 7,152 | |
| | | | | | |
| | | | Total liabilities and shareholders' equity | | $ | 59,249 | | $ | 67,548 | |
| | | | | | |
See notes to consolidated financial statements.
69
Table of Contents
CONSOLIDATED STATEMENTS OF INCOME
Comerica Incorporated and Subsidiaries
| | | | | | | | | | | | |
| | Years Ended
December 31 | |
|---|
| | 2009 | | 2008 | | 2007 | |
|---|
| | (in millions, except per
share data)
| |
|---|
INTEREST INCOME | | | | | | | | | | |
Interest and fees on loans | | $ | 1,767 | | $ | 2,649 | | $ | 3,501 | |
Interest on investment securities | | | 329 | | | 389 | | | 206 | |
Interest on short-term investments | | | 9 | | | 13 | | | 23 | |
| | | | | | | | |
| | | Total interest income | | | 2,105 | | | 3,051 | | | 3,730 | |
INTEREST EXPENSE | | | | | | | | | | |
Interest on deposits | | | 372 | | | 734 | | | 1,167 | |
Interest on short-term borrowings | | | 2 | | | 87 | | | 105 | |
Interest on medium- and long-term debt | | | 164 | | | 415 | | | 455 | |
| | | | | | | | |
| | | Total interest expense | | | 538 | | | 1,236 | | | 1,727 | |
| | | | | | | | |
| | | Net interest income | | | 1,567 | | | 1,815 | | | 2,003 | |
Provision for loan losses | | | 1,082 | | | 686 | | | 212 | |
| | | | | | | | |
| | | Net interest income after provision for loan losses | | | 485 | | | 1,129 | | | 1,791 | |
NONINTEREST INCOME | | | | | | | | | | |
Service charges on deposit accounts | | | 228 | | | 229 | | | 221 | |
Fiduciary income | | | 161 | | | 199 | | | 199 | |
Commercial lending fees | | | 79 | | | 69 | | | 75 | |
Letter of credit fees | | | 69 | | | 69 | | | 63 | |
Card fees | | | 51 | | | 58 | | | 54 | |
Foreign exchange income | | | 41 | | | 40 | | | 40 | |
Bank-owned life insurance | | | 35 | | | 38 | | | 36 | |
Brokerage fees | | | 31 | | | 42 | | | 43 | |
Net securities gains | | | 243 | | | 67 | | | 7 | |
Other noninterest income | | | 112 | | | 82 | | | 150 | |
| | | | | | | | |
| | | Total noninterest income | | | 1,050 | | | 893 | | | 888 | |
NONINTEREST EXPENSES | | | | | | | | | | |
Salaries | | | 687 | | | 781 | | | 844 | |
Employee benefits | | | 210 | | | 194 | | | 193 | |
| | | | | | | | |
| | Total salaries and employee benefits | | | 897 | | | 975 | | | 1,037 | |
Net occupancy expense | | | 162 | | | 156 | | | 138 | |
Equipment expense | | | 62 | | | 62 | | | 60 | |
Outside processing fee expense | | | 97 | | | 104 | | | 91 | |
FDIC insurance expense | | | 90 | | | 16 | | | 5 | |
Software expense | | | 84 | | | 76 | | | 63 | |
Other real estate expense | | | 48 | | | 10 | | | 7 | |
Legal fees | | | 37 | | | 29 | | | 24 | |
Litigation and operational losses | | | 10 | | | 103 | | | 18 | |
Customer services | | | 4 | | | 13 | | | 43 | |
Provision for credit losses on lending-related commitments | | | — | | | 18 | | | (1 | ) |
Other noninterest expenses | | | 159 | | | 189 | | | 206 | |
| | | | | | | | |
| | | Total noninterest expenses | | | 1,650 | | | 1,751 | | | 1,691 | |
| | | | | | | | |
Income (loss) from continuing operations before income taxes | | | (115 | ) | | 271 | | | 988 | |
Provision (benefit) for income taxes | | | (131 | ) | | 59 | | | 306 | |
| | | | | | | | |
Income from continuing operations | | | 16 | | | 212 | | | 682 | |
Income from discontinued operations, net of tax | | | 1 | | | 1 | | | 4 | |
| | | | | | | | |
NET INCOME | | $ | 17 | | $ | 213 | | $ | 686 | |
| | | | | | | | |
Net income (loss) attributable to common shares | | $ | (118 | ) | $ | 192 | | $ | 680 | |
| | | | | | | | |
Basic earnings per common share: | | | | | | | | | | |
| | Income (loss) from continuing operations | | $ | (0.80 | ) | $ | 1.28 | | $ | 4.43 | |
| | Net income (loss) | | | (0.79 | ) | | 1.29 | | | 4.45 | |
Diluted earnings per common share: | | | | | | | | | | |
| | Income (loss) from continuing operations | | | (0.80 | ) | | 1.28 | | | 4.40 | |
| | Net income (loss) | | | (0.79 | ) | | 1.28 | | | 4.43 | |
Cash dividends declared on common stock | | | 30 | | | 348 | | | 393 | |
Cash dividends declared per common share | | | 0.20 | | | 2.31 | | | 2.56 | |
See notes to consolidated financial statements.
70
Table of Contents
CONSOLIDATED STATEMENTS OF CHANGES IN SHAREHOLDERS' EQUITY
Comerica Incorporated and Subsidiaries
| | | | | | | | | | | | | | | | | | | | | | | | | |
| |
| | Common Stock | |
| |
| |
| |
| |
| |
|---|
| | Nonredeemable Preferred Stock | | Shares Outstanding | | Amount | | Capital Surplus | | Accumulated Other Comprehensive Loss | | Retained Earnings | | Treasury Stock | | Total Shareholders' Equity | |
|---|
| | (in millions, except per share data)
| |
|---|
BALANCE AT JANUARY 1, 2007 | | $ | — | | | 157.6 | | $ | 894 | | $ | 520 | | $ | (324 | ) | $ | 5,230 | | $ | (1,219 | ) | $ | 5,101 | |
Net income | | | — | | | — | | | — | | | — | | | — | | | 686 | | | — | | | 686 | |
Other comprehensive income, net of tax | | | — | | | — | | | — | | | — | | | 147 | | | — | | | — | | | 147 | |
| | | | | | | | | | | | | | | | | | | | | | | | | |
Total comprehensive income | | | | | | | | | | | | | | | | | | | | | | | | 833 | |
Cash dividends declared on common stock ($2.56 per share) | | | — | | | — | | | — | | | — | | | — | | | (393 | ) | | — | | | (393 | ) |
Purchase of common stock | | | — | | | (10.0 | ) | | — | | | — | | | — | | | — | | | (580 | ) | | (580 | ) |
Net issuance of common stock under employee stock plans | | | — | | | 2.4 | | | — | | | (16 | ) | | — | | | (26 | ) | | 139 | | | 97 | |
Share-based compensation | | | — | | | — | | | — | | | 59 | | | — | | | — | | | — | | | 59 | |
Other | | | — | | | — | | | — | | | 1 | | | — | | | — | | | (1 | ) | | — | |
| | | | | | | | | | | | | | | | | | |
BALANCE AT DECEMBER 31, 2007 | | $ | — | | | 150.0 | | $ | 894 | | $ | 564 | | $ | (177 | ) | $ | 5,497 | | $ | (1,661 | ) | $ | 5,117 | |
Net income | | | — | | | — | | | — | | | — | | | — | | | 213 | | | — | | | 213 | |
Other comprehensive loss, net of tax | | | — | | | — | | | — | | | — | | | (132 | ) | | — | | | — | | | (132 | ) |
| | | | | | | | | | | | | | | | | | | | | | | | | |
Total comprehensive income | | | | | | | | | | | | | | | | | | | | | | | | 81 | |
Cash dividends declared on common stock ($2.31 per share) | | | — | | | — | | | — | | | — | | | — | | | (348 | ) | | — | | | (348 | ) |
Purchase of common stock | | | — | | | — | | | — | | | — | | | — | | | — | | | (1 | ) | | (1 | ) |
Issuance of preferred stock and related warrant | | | 2,126 | | | — | | | — | | | 124 | | | — | | | — | | | — | | | 2,250 | |
Accretion of discount on preferred stock | | | 3 | | | — | | | — | | | — | | | — | | | (3 | ) | | — | | | — | |
Net issuance of common stock under employee stock plans | | | — | | | 0.5 | | | — | | | (19 | ) | | — | | | (14 | ) | | 33 | | | — | |
Share-based compensation | | | — | | | — | | | — | | | 53 | | | — | | | — | | | — | | | 53 | |
| | | | | | | | | | | | | | | | | | |
BALANCE AT DECEMBER 31, 2008 | | $ | 2,129 | | | 150.5 | | $ | 894 | | $ | 722 | | $ | (309 | ) | $ | 5,345 | | $ | (1,629 | ) | $ | 7,152 | |
Net income | | | — | | | — | | | — | | | — | | | — | | | 17 | | | — | | | 17 | |
Other comprehensive loss, net of tax | | | — | | | — | | | — | | | — | | | (27 | ) | | — | | | — | | | (27 | ) |
| | | | | | | | | | | | | | | | | | | | | | | | | |
Total comprehensive loss | | | | | | | | | | | | | | | | | | | | | | | | (10 | ) |
Cash dividends declared on preferred stock | | | — | | | — | | | — | | | — | | | — | | | (113 | ) | | — | | | (113 | ) |
Cash dividends declared on common stock ($0.20 per share) | | | — | | | — | | | — | | | — | | | — | | | (30 | ) | | — | | | (30 | ) |
Purchase of common stock | | | — | | | (0.1 | ) | | — | | | — | | | — | | | — | | | (1 | ) | | (1 | ) |
Accretion of discount on preferred stock | | | 22 | | | — | | | — | | | — | | | — | | | (22 | ) | | — | | | — | |
Net issuance of common stock under employee stock plans | | | — | | | 0.8 | | | — | | | (15 | ) | | — | | | (36 | ) | | 48 | | | (3 | ) |
Share-based compensation | | | — | | | — | | | — | | | 32 | | | — | | | — | | | — | | | 32 | |
Other | | | — | | | — | | | — | | | 1 | | | — | | | — | | | 1 | | | 2 | |
| | | | | | | | | | | | | | | | | | |
BALANCE AT DECEMBER 31, 2009 | | $ | 2,151 | | | 151.2 | | $ | 894 | | $ | 740 | | $ | (336 | ) | $ | 5,161 | | $ | (1,581 | ) | $ | 7,029 | |
| | | | | | | | | | | | | | | | | | |
See notes to consolidated financial statements.
71
Table of Contents
CONSOLIDATED STATEMENTS OF CASH FLOWS
Comerica Incorporated and Subsidiaries
| | | | | | | | | | | | | | |
| | Years Ended December 31 | |
|---|
| | 2009 | | 2008 | | 2007 | |
|---|
| | (in millions)
| |
|---|
OPERATING ACTIVITIES | | | | | | | | | | |
| | Net income | | $ | 17 | | $ | 213 | | $ | 686 | |
| | | Income from discontinued operations, net of tax | | | 1 | | | 1 | | | 4 | |
| | | | | | | | |
| | | Income from continuing operations, net of tax | | | 16 | | | 212 | | | 682 | |
| | Adjustments to reconcile net income to net cash provided by operating activities: | | | | | | | | | | |
| | | Provision for loan losses | | | 1,082 | | | 686 | | | 212 | |
| | | Provision for credit losses on lending-related commitments | | | — | | | 18 | | | (1 | ) |
| | | Provision (benefit) for deferred income taxes | | | (112 | ) | | (99 | ) | | (53 | ) |
| | | Depreciation and software amortization | | | 122 | | | 114 | | | 96 | |
| | | Auction-rate securities charge | | | — | | | 88 | | | — | |
| | | Lease income charge | | | — | | | 38 | | | — | |
| | | Net gain on early termination of leveraged leases | | | (8 | ) | | — | | | — | |
| | | Share-based compensation expense | | | 32 | | | 51 | | | 59 | |
| | | Net amortization of securities | | | (5 | ) | | (11 | ) | | (3 | ) |
| | | Net securities gains | | | (243 | ) | | (67 | ) | | (7 | ) |
| | | Net gain on sales of businesses | | | (5 | ) | | — | | | (3 | ) |
| | | Gain on repurchase of medium- and long-term debt | | | (15 | ) | | — | | | — | |
| | | Contribution to qualified pension plan | | | (100 | ) | | (175 | ) | | — | |
| | | Excess tax benefits from share-based compensation arrangements | | | — | | | — | | | (9 | ) |
| | | Net decrease (increase) in trading securities | | | 16 | | | (6 | ) | | 61 | |
| | | Net decrease in loans held-for-sale | | | 4 | | | 99 | | | 14 | |
| | | Net decrease in accrued income receivable | | | 62 | | | 82 | | | 1 | |
| | | Net (decrease) increase in accrued expenses | | | (311 | ) | | (306 | ) | | 36 | |
| | | Other, net | | | (445 | ) | | 137 | | | (75 | ) |
| | | Discontinued operations, net | | | 1 | | | 1 | | | 4 | |
| | | | | | | | |
| | | | | Net cash provided by operating activities | | | 91 | | | 862 | | | 1,014 | |
INVESTING ACTIVITIES | | | | | | | | | | |
| | Proceeds from sales of investment securities available-for-sale | | | 8,785 | | | 156 | | | 7 | |
| | Proceeds from maturities of investment securities available-for-sale | | | 2,253 | | | 1,667 | | | 882 | |
| | Purchases of investment securities available-for-sale | | | (9,011 | ) | | (4,496 | ) | | (3,519 | ) |
| | Sales (purchases) of Federal Home Loan Bank stock | | | 82 | | | (353 | ) | | — | |
| | Net decrease (increase) in loans | | | 7,317 | | | (259 | ) | | (3,561 | ) |
| | Proceeds from early termination of leveraged leases | | | 107 | | | — | | | — | |
| | Net increase in fixed assets | | | (74 | ) | | (166 | ) | | (189 | ) |
| | Net decrease in customers' liability on acceptances outstanding | | | 3 | | | 34 | | | 8 | |
| | Proceeds from sales of businesses | | | 7 | | | — | | | 3 | |
| | Discontinued operations, net | | | — | | | — | | | — | |
| | | | | | | | |
| | | | | Net cash provided by (used in) investing activities | | | 9,469 | | | (3,417 | ) | | (6,369 | ) |
FINANCING ACTIVITIES | | | | | | | | | | |
| | Net decrease in deposits | | | (2,010 | ) | | (2,299 | ) | | (1,295 | ) |
| | Net (decrease) increase in short-term borrowings | | | (1,287 | ) | | (1,058 | ) | | 2,172 | |
| | Net decrease in acceptances outstanding | | | (3 | ) | | (34 | ) | | (8 | ) |
| | Proceeds from issuance of medium- and long-term debt | | | — | | | 8,000 | | | 4,335 | |
| | Repayments of medium- and long-term debt | | | (3,683 | ) | | (2,000 | ) | | (1,529 | ) |
| | Repurchases of medium- and long-term debt | | | (197 | ) | | — | | | — | |
| | Proceeds from issuance of preferred stock and related warrant | | | — | | | 2,250 | | | — | |
| | Proceeds from issuance of common stock under employee stock plans | | | — | | | 1 | | | 89 | |
| | Excess tax benefits from share-based compensation arrangements | | | — | | | — | | | 9 | |
| | Purchase of common stock for treasury | | | (1 | ) | | (1 | ) | | (580 | ) |
| | Dividends paid on common stock | | | (72 | ) | | (395 | ) | | (390 | ) |
| | Dividends paid on preferred stock | | | (113 | ) | | — | | | — | |
| | Discontinued operations, net | | | — | | | — | | | — | |
| | | | | | | | |
| | | | | Net cash (used in) provided by financing activities | | | (7,366 | ) | | 4,464 | | | 2,803 | |
| | | | | | | | |
Net increase (decrease) in cash and cash equivalents | | | 2,194 | | | 1,909 | | | (2,552 | ) |
Cash and cash equivalents at beginning of year | | | 3,423 | | | 1,514 | | | 4,066 | |
| | | | | | | | |
Cash and cash equivalents at end of year | | $ | 5,617 | | $ | 3,423 | | $ | 1,514 | |
| | | | | | | | |
Interest paid | | $ | 619 | | $ | 1,266 | | $ | 1,703 | |
| | | | | | | | |
Income taxes, tax deposits and tax-related interest paid | | $ | 251 | | $ | 241 | | $ | 402 | |
| | | | | | | | |
Noncash investing and financing activities: | | | | | | | | | | |
| | Loans transferred to other real estate | | $ | 114 | | $ | 65 | | $ | 20 | |
| | Loans transferred from held-for-sale to portfolio | | | — | | | 84 | | | — | |
| | Loans transferred from portfolio to held-for-sale | | | — | | | — | | | 83 | |
See notes to consolidated financial statements.
72
Table of Contents
NOTES TO CONSOLIDATED FINANCIAL STATEMENTS
Comerica Incorporated and Subsidiaries
Note 1 — Summary of Significant Accounting Policies
Organization
Comerica Incorporated (the Corporation) is a registered financial holding company headquartered in Dallas, Texas. The Corporation's major business segments are the Business Bank, the Retail Bank and Wealth & Institutional Management. For further discussion of each business segment, refer to Note 24. The core businesses are tailored to each of the Corporation's four primary geographic markets: Midwest, Western, Texas and Florida. The Corporation and its banking subsidiaries are regulated at both the state and federal levels.
The accounting and reporting policies of the Corporation conform to U.S. generally accepted accounting principles (GAAP) and prevailing practices within the banking industry. The preparation of financial statements in conformity with GAAP requires management to make estimates and assumptions that affect the reported amounts of assets and liabilities and disclosure of contingent assets and liabilities at the date of the financial statements and the reported amounts of revenue and expenses during the reporting period. Actual results could differ from these estimates. Management evaluated subsequent events through February 25, 2009, the date the consolidated financial statements were issued.
The following summarizes the significant accounting policies of the Corporation applied in the preparation of the accompanying consolidated financial statements.
Accounting Standards Codification
In the third quarter 2009, the Corporation adopted Statement of Financial Accounting Standards (SFAS) No. 168, "The FASB Accounting Standards Codification and the Hierarchy of Generally Accepted Accounting Principles," (SFAS 168). SFAS 168 establishes the Financial Accounting Standards Board (FASB) Accounting Standards Codification (the Codification, or ASC) as the single source of authoritative, nongovernmental GAAP recognized by the FASB. Rules and interpretive releases of the Securities and Exchange Commission (SEC) are also sources of authoritative GAAP for SEC registrants. The Codification is not intended to change GAAP. Effective with the adoption of SFAS 168, all existing non-SEC accounting and reporting standards, except for grandfathered guidance and certain recently-issued standards not yet integrated into the Codification, were superseded and are considered nonauthoritative. References to GAAP in these Notes to Consolidated Financial Statements are provided under the Codification structure where applicable.
Principles of Consolidation
The consolidated financial statements include the accounts of the Corporation and its subsidiaries after elimination of all significant intercompany accounts and transactions. Certain amounts in the financial statements for prior years have been reclassified to conform to current financial statement presentation.
The Corporation consolidates variable interest entities (VIEs) in which it is the primary beneficiary. In general, a VIE is an entity that either (1) has an insufficient amount of equity to carry out its principal activities without additional subordinated financial support, (2) has a group of equity owners that are unable to make significant decisions about its activities or (3) has a group of equity owners that do not have the obligation to absorb losses or the right to receive returns generated by its operations. If any of these characteristics is present, the entity is subject to a variable interests consolidation model, and consolidation is based on variable interests, not on ownership of the entity's outstanding voting stock. Variable interests are defined as contractual, ownership or other money interests in an entity that change with fluctuations in the entity's net asset value. The primary beneficiary consolidates the VIE; the primary beneficiary is defined as the enterprise that absorbs a majority of expected losses or receives a majority of residual returns (if the losses or returns occur), or both. The Corporation consolidates entities not determined to be VIEs when it holds a majority (controlling) interest in the entity's outstanding voting stock. On January 1, 2009, the Corporation adopted new consolidation guidance,
73
Table of Contents
NOTES TO CONSOLIDATED FINANCIAL STATEMENTS
Comerica Incorporated and Subsidiaries
which defines noncontrolling interests as the portion of equity in a subsidiary not attributable, directly or indirectly, to the parent. The adoption of the new guidance was not material to the Corporation's financial condition and results of operations. Due to the insignificance of the amounts, noncontrolling (minority) interest in less than 100 percent owned consolidated subsidiaries is included in "capital surplus" on the consolidated balance sheets and the related net income (loss) attributable to noncontrolling (minority) interest in earnings is included in "other noninterest expenses" on the consolidated statements of income.
Equity investments in entities that are not VIEs where the Corporation owns less than a majority (controlling) interest and equity investments in entities that are VIEs where the Corporation is not the primary beneficiary are not consolidated. Rather, such investments are accounted for using either the equity method or cost method. The equity method is used for investments in corporate joint ventures and investments where the Corporation has the ability to exercise significant influence over the investee's operation and financial policies, which is generally presumed to exist if the Corporation owns more than 20 percent of the voting interest of the investee. Equity method investments are included in "accrued income and other assets" on the consolidated balance sheets, with income and losses recorded in "other noninterest income" on the consolidated statements of income. Unconsolidated equity investments that do not meet the criteria to be accounted for under the equity method are accounted for under the cost method. Cost method investments in publicly traded companies are included in "investment securities available-for-sale" on the consolidated balance sheets, with income (net of write-downs) recorded in "net securities gains" on the consolidated statements of income. Cost method investments in non-publicly traded companies are included in "accrued income and other assets" on the consolidated balance sheets, with income (net of write-downs) recorded in "other noninterest income" on the consolidated statements of income.
For further information regarding the Corporation's investments in VIEs, refer to Note 11.
Fair Value Measurements
Fair value measurement applies whenever accounting guidance requires or permits assets or liabilities to be measured at fair value. Fair value is defined as the exchange price that would be received to sell an asset or paid to transfer a liability in the principal or most advantageous market for the asset or liability in an orderly transaction (i.e., not a forced transaction, such as a liquidation or distressed sale) between market participants at the measurement date. Fair value is based on the assumptions market participants would use when pricing an asset or liability. Fair value measurements and disclosures guidance establishes a three-level fair value hierarchy that prioritizes the information used to develop fair value. The fair value hierarchy gives the highest priority to quoted prices in active markets and the lowest priority to unobservable data. Fair value measurements are separately disclosed by level within the fair value hierarchy. For assets and liabilities recorded at fair value, it is the Corporation's policy to maximize the use of observable inputs and minimize the use of unobservable inputs when developing fair value measurements for those items for which there is an active market.
In the first quarter 2009, the Corporation adopted new fair value measurement guidance related to determining fair value when the volume and level of activity for the asset or liability have significantly decreased. The new guidance requires an assessment of whether certain factors exist to indicate that the market for an instrument is not active at the measurement date. If, after evaluating those factors, the evidence indicates the market is not active, the Corporation must determine whether recent quoted transaction prices are associated with distressed transactions. If the Corporation concludes that the quoted prices are associated with distressed transactions, an adjustment to the quoted prices may be necessary or the Corporation may conclude that a change in valuation technique or the use of multiple techniques may be appropriate to estimate an instrument's fair value. The adoption of the new fair value measurement guidance impacted the estimated fair value of auction-rate securities at March 31, 2009, as the Corporation determined the market was not active for the auction-rate securities portfolio. The rate of redemption of the various types of auction-rate securities held by the
74
Table of Contents
NOTES TO CONSOLIDATED FINANCIAL STATEMENTS
Comerica Incorporated and Subsidiaries
Corporation during the first quarter 2009, which ranged from nominal to 20 percent, was a significant consideration in the determination of a reasonable market premium a buyer would require. As a result, the fair value of auction-rate securities remaining in the Corporation's investment portfolio at March 31, 2009 increased $36 million from December 31, 2008.
In the fourth quarter 2009, the Corporation adopted new guidance on the fair value measurement of liabilities. The new guidance clarifies that in circumstances in which a quoted price in an active market for an identical liability is not available, the Corporation is required to measure fair value using one or more of the following techniques: a valuation technique that uses the quoted price of the identical liability when traded as an asset or a quoted price for a similar liability when traded as an asset, or another valuation method that is consistent with the principles of fair value measurement guidance. The new guidance also clarifies that when estimating the fair value of a liability, the Corporation is not required to include a separate input or adjustments to other inputs relating to the existence of a restriction that prevents the transfer of the liability. The adoption of the new guidance was not material to the Corporation's financial condition and results of operations.
Also in the fourth quarter 2009, the Corporation adopted new fair value measurement guidance that permits the measurement of certain alternative investments on the basis of net asset value per share of the investment (or its equivalent). The Corporation has certain private equity and venture capital investments within the scope of the new guidance; however, adoption of the guidance was not material to the Corporation's financial condition or results of operations.
Fair value measurements for assets and liabilities where there exists limited or no observable market data and, therefore, are based primarily upon estimates, are often calculated based on the economic and competitive environment, the characteristics of the asset or liability and other factors. Therefore, the results cannot be determined with precision and may not be realized in an actual sale or immediate settlement of the asset or liability. Additionally, there may be inherent weaknesses in any calculation technique, and changes in the underlying assumptions used, including discount rates and estimates of future cash flows, could significantly affect the results of current or future values.
For further information about fair value measurements, refer to Note 3.
Other Short-Term Investments
Other short-term investments include trading securities and loans held-for-sale.
Trading securities are carried at market value. Realized and unrealized gains or losses on trading securities are included in "other noninterest income" on the consolidated statements of income.
Loans held-for-sale, typically residential mortgages and Small Business Administration loans, are carried at the lower of cost or market. Market value is determined in the aggregate for each portfolio.
Investment Securities
Debt securities held-to-maturity are those securities which the Corporation has the ability and management has the positive intent to hold to maturity as of the balance sheet dates. Debt securities held-to-maturity are recorded at cost, adjusted for amortization of premium and accretion of discount.
Debt securities that are not considered held-to-maturity and marketable equity securities are accounted for as securities available-for-sale and recorded at fair value, with unrealized gains and losses, net of income taxes, reported as a separate component of other comprehensive income (loss) (OCI).
Investment securities are reviewed quarterly for possible other-than-temporary impairment (OTTI). In the first quarter 2009, the Corporation adopted new guidance on debt and equity securities, related to recognition and presentation of other-than-temporary impairments. The new guidance changed the method for determining
75
Table of Contents
NOTES TO CONSOLIDATED FINANCIAL STATEMENTS
Comerica Incorporated and Subsidiaries
whether OTTI exists for debt securities by requiring an assessment of the likelihood of selling the security prior to recovering its amortized cost basis. It also changed the amount of an impairment charge to be recorded in the consolidated statements of income. If the Corporation intends to sell the security or it is more-likely-than-not that the Corporation will be required to sell the security prior to recovery of its amortized cost basis, the security would be written down to fair value with the full amount of any impairment charge recorded as a loss in "net securities gains" in the consolidated statements of income. If the Corporation does not intend to sell the security and it is more-likely-than-not that the Corporation will not be required to sell the security prior to recovery of its amortized cost basis, only the credit component of any impairment of a debt security would be recognized as a loss in "net securities gains" on the consolidated statements of income, with the remaining impairment recorded in OCI. The adoption of the guidance was not material to the Corporation's financial condition or results of operations.
The OTTI review for equity securities includes an analysis of the facts and circumstances of each individual investment and focuses on the severity of loss, the length of time the fair value has been below cost, the expectation for that security's performance, the financial condition and near-term prospects of the issuer, and management's intent and ability to hold the security to recovery. A decline in value of an equity security that is considered to be other-than-temporary is recorded as a loss in "net securities gains" on the consolidated statements of income.
Gains or losses on the sale of securities are computed based on the adjusted cost of the specific security sold.
For further information on investment securities, refer to Note 4.
Allowance for Credit Losses
The allowance for credit losses includes both the allowance for loan losses and the allowance for credit losses on lending-related commitments.
Allowance for Loan Losses
The allowance for loan losses represents management's assessment of probable losses inherent in the Corporation's loan portfolio. The allowance provides for probable losses that have been identified with specific customer relationships and for probable losses believed to be inherent in the loan portfolio that have not been specifically identified. Internal risk ratings are assigned to each business loan at the time of approval and are subject to subsequent periodic reviews by the Corporation's senior management. The Corporation defines business loans as those belonging to the commercial, real estate construction, commercial mortgage, lease financing and international loan portfolios. The Corporation performs a detailed credit quality review quarterly on both large business and certain large consumer and residential mortgage loans that have deteriorated below certain levels of credit risk. When these individual loans are impaired, the level of impairment is estimated using one of several methods, including the estimated collateral value, market value of similar debt or discounted expected cash flows. When fair value is less than current carrying value, the difference is charged-off when appropriate, or a valuation allowance is established within the allowance for loan losses. Those impaired loans not requiring an allowance represent loans for which the fair value of expected repayments or collateral exceeded the recorded investment in such loans. At December 31, 2009, substantially all impaired loans were evaluated based on fair value of related collateral. A portion of the allowance is allocated to the remaining business loans by applying estimated loss ratios to the loans within each risk rating, based on numerous factors identified below. In addition, a portion of the allowance is allocated to these remaining loans based on industry-specific risks inherent in certain portfolios that have experienced above average losses. The portion of the allowance allocated to all other consumer and residential mortgage loans is determined by applying estimated loss ratios to various segments of the loan portfolio. Estimated loss ratios for all portfolios are updated quarterly, incorporating factors such as recent charge-off experience, current economic conditions and trends, changes in
76
Table of Contents
NOTES TO CONSOLIDATED FINANCIAL STATEMENTS
Comerica Incorporated and Subsidiaries
collateral values of properties securing loans (using index-based estimates), and trends with respect to past due and nonaccrual amounts, and are supported by underlying analysis, including information on migration and loss given default studies from each of the Corporation's three largest domestic geographic markets (Midwest, Western and Texas), as well as mapping to bond tables. For collateral-dependent real estate loans, independent appraisals are obtained at loan inception and updated on an as-needed basis, generally at the time a loan is determined to be impaired and at least annually thereafter.
Actual loss ratios experienced in the future may vary from those estimated. The uncertainty occurs because factors may exist which affect the determination of probable losses inherent in the loan portfolio and are not necessarily captured by the application of estimated loss ratios or identified industry-specific risks. A portion of the allowance is maintained to capture these probable losses and reflects management's view that the allowance should recognize the margin for error inherent in the process of estimating expected loan losses. Factors that were considered in the evaluation of the adequacy of the Corporation's allowance include the inherent imprecision in the risk rating system which covers probable loan losses as a result of an inaccuracy in assigning risk ratings or stale ratings which may not have been updated for recent negative trends in particular credits. In the first quarter 2009, the Corporation refined the methodology used to estimate the imprecision in the risk rating system portion of the allowance by only applying the identified error rate in assigning risk ratings, based on semiannual reviews, solely to the loan population that was tested. Previously, the error rate was applied to a larger population of loans. This change in methodology reduced the allowance by approximately $16 million in the first quarter 2009.
The total allowance for loan losses is available to absorb losses from any segment within the portfolio. Unanticipated economic events, including political, economic and regulatory instability in countries where the Corporation has loans, could cause changes in the credit characteristics of the portfolio and result in an unanticipated increase in the allowance. Inclusion of other industry-specific portfolio exposures in the allowance, as well as significant increases in the current portfolio exposures, could also increase the amount of the allowance. Any of these events, or some combination thereof, may result in the need for additional provision for loan losses in order to maintain an allowance that complies with credit risk and accounting policies.
Loans deemed uncollectible are charged off and deducted from the allowance. The provision for loan losses and recoveries on loans previously charged off are added to the allowance.
Allowance for Credit Losses on Lending-Related Commitments
The allowance for credit losses on lending-related commitments provides for probable credit losses inherent in lending-related commitments, including unused commitments to extend credit, letters of credit and financial guarantees. Lending-related commitments for which it is probable that the commitment will be drawn (or sold) are reserved with the same estimated loss rates as loans, or with specific reserves. In general, the probability of draw for letters of credit is considered certain once the credit is assigned a risk rating that is generally consistent with regulatory defined substandard or doubtful. Other letters of credit and all unfunded commitments have a lower probability of draw, to which standard loan loss rates are applied. The allowance for credit losses on lending-related commitments is included in "accrued expenses and other liabilities" on the consolidated balance sheets, with the corresponding charge reflected in "provision for credit losses on lending-related commitments" in the noninterest expenses section on the consolidated statements of income.
Nonperforming Assets
Nonperforming assets consist of loans, including loans held-for-sale, and debt securities for which the accrual of interest has been discontinued, loans for which the terms have been renegotiated to less than market rates due to a serious weakening of the borrower's financial condition, and real estate which has been acquired through foreclosure and is awaiting disposition.
77
Table of Contents
NOTES TO CONSOLIDATED FINANCIAL STATEMENTS
Comerica Incorporated and Subsidiaries
A loan is impaired when it is probable that interest or principal payments will not be made in accordance with the contractual terms of the original loan agreement. Consistent with this definition, all nonaccrual and reduced-rate loans are impaired. Loans restructured in troubled debt restructurings bearing market rates of interest at the time of restructuring and performing in compliance with their modified terms (performing restructured loans) for a period of six months are considered impaired only in the calendar year of the restructuring.
Residential real estate loans, which consist of traditional residential mortgages and home equity loans and lines of credit, are generally placed on nonaccrual status and charged off to current appraised values, less costs to sell, during the foreclosure process, normally no later than 180 days past due. Other consumer loans are generally not placed on nonaccrual status and are charged off at no later than 120 days past due, earlier if deemed uncollectible. Business loans and debt securities are generally placed on nonaccrual status when management determines full collection of principal or interest is unlikely or when principal or interest payments are 90 days past due, unless the loan is fully collateralized and in the process of collection. At the time a loan or debt security is placed on nonaccrual status, interest previously accrued but not collected is charged against current income. Income on such loans and debt securities is then recognized only to the extent that cash is received and where future collection of principal is probable. Generally, a loan or debt security may be returned to accrual status when all delinquent principal and interest have been received and the Corporation expects repayment of the remaining contractual principal and interest, or when the loan or debt security is both well secured and in the process of collection.
Real estate acquired through foreclosure (foreclosed property) is carried at the lower of cost or fair value, less estimated costs to sell. Independent appraisals are obtained to substantiate the fair value of real estate transferred to foreclosed property at the time of foreclosure and updated at least annually or upon evidence of deterioration in the property's value. At the time of foreclosure, any excess of the related loan balance over fair value (less estimated costs to sell) of the property acquired is charged to the allowance for loan losses. Subsequent write-downs, operating expenses and losses upon sale, if any, are charged to noninterest expenses.
Premises and Equipment
Premises and equipment are stated at cost, less accumulated depreciation and amortization. Depreciation, computed on the straight-line method, is charged to operations over the estimated useful lives of the assets. The estimated useful lives are generally 10 years to 33 years for premises that the Corporation owns and three years to eight years for furniture and equipment. Leasehold improvements are amortized over the terms of their respective leases or 10 years, whichever is shorter.
Software
Capitalized software is stated at cost, less accumulated amortization. Capitalized software includes purchased software and capitalizable application development costs associated with internally-developed software. Amortization, computed on the straight-line method, is charged to operations over the estimated useful life of the software, which is generally five years. Capitalized software is included in "accrued income and other assets" on the consolidated balance sheets.
Goodwill
Goodwill is subject to impairment testing, which the Corporation conducts annually as of July 1 each year and on an interim basis if events or changes in circumstances between annual tests indicate the assets might be impaired. Under applicable accounting guidance, the goodwill impairment test is a two-step test. The first step of the goodwill impairment test compares the fair value of identified reporting units, which are a subset of the Corporation's operating segments, with their carrying amount, including goodwill. If the fair value of a reporting
78
Table of Contents
NOTES TO CONSOLIDATED FINANCIAL STATEMENTS
Comerica Incorporated and Subsidiaries
unit exceeds its carrying value, goodwill of the reporting unit is not impaired. If the fair value of the reporting unit is less than the carrying value, the second step must be performed to determine the implied fair value of the reporting unit's goodwill and the amount of goodwill impairment.
Additional information regarding goodwill and impairment testing can be found in Note 9.
Nonmarketable Equity Securities
The Corporation has a portfolio of investments in indirect private equity and venture capital funds. The majority of these investments are not readily marketable and are included in "accrued income and other assets" on the consolidated balance sheets. The investments are individually reviewed for impairment on a quarterly basis by comparing the carrying value to the estimated fair value. The amount by which the carrying value exceeds the fair value that is determined to be other-than-temporary impairment is charged to current earnings and the carrying value of the investment is written down accordingly.
The Corporation also holds restricted equity investments, which are securities the Corporation is required to hold for various reasons and consist primarily of Federal Home Loan Bank of Dallas (FHLB) and Federal Reserve Bank (FRB) stock. Restricted equity securities, classified in "accrued income and other assets" on the consolidated balance sheets, are not readily marketable and are recorded at cost (par value) and evaluated for impairment based on the ultimate recoverability of the par value. If the Corporation does not expect to recover the full par value, the amount by which the par value exceeds the ultimately recoverable value would be charged to current earnings and the carrying value of the investment would be written down accordingly.
Derivative Instruments and Hedging Activities
Derivative instruments are carried at fair value in either "accrued income and other assets" or "accrued expenses and other liabilities" on the consolidated balance sheets. The accounting for changes in the fair value (i.e., gains or losses) of a derivative instrument is determined by whether it has been designated and qualifies as part of a hedging relationship and, further, by the type of hedging relationship. For those derivative instruments that are designated and qualify as hedging instruments, the Corporation designates the hedging instrument, based upon the exposure being hedged, as either a fair value hedge or a cash flow hedge. For derivative instruments designated and qualifying as fair value hedges (i.e., hedging the exposure to changes in the fair value of an asset or a liability or an identified portion thereof that is attributable to a particular risk), the gain or loss on the derivative instrument, as well as the offsetting loss or gain on the hedged item attributable to the hedged risk, are recognized in current earnings during the period of the change in fair values. For derivative instruments that are designated and qualify as cash flow hedges (i.e., hedging the exposure to variability in expected future cash flows that is attributable to a particular risk), the effective portion of the gain or loss on the derivative instrument is reported as a component of other comprehensive income and reclassified into earnings in the same period or periods during which the hedged transaction affects earnings. The remaining gain or loss on the derivative instrument in excess of the cumulative change in the present value of future cash flows of the hedged item (i.e., the ineffective portion), if any, is recognized in current earnings during the period of change. For derivative instruments not designated as hedging instruments, the gain or loss is recognized in current earnings during the period of change.
For derivatives designated as hedging instruments at inception, the Corporation uses either the short-cut method or applies dollar offset or statistical regression analysis to assess effectiveness. The short-cut method is used for certain fair value hedges of medium- and long-term debt. This method allows for the assumption of zero hedge ineffectiveness and eliminates the requirement to further assess hedge effectiveness on these transactions. For hedge relationships to which the Corporation does not apply the short-cut method, either the dollar offset or statistical regression analysis is used at inception and for each reporting period thereafter to assess whether the derivative used has been and is expected to be highly effective in offsetting changes in the fair value or cash flows
79
Table of Contents
NOTES TO CONSOLIDATED FINANCIAL STATEMENTS
Comerica Incorporated and Subsidiaries
of the hedged item. All components of each derivative instrument's gain or loss are included in the assessment of hedge effectiveness. Net hedge ineffectiveness is recorded in "other noninterest income" on the consolidated statements of income.
On January 1, 2009, the Corporation adopted new guidance relating to disclosures about derivative instruments and hedging activities. This new guidance requires entities to provide greater transparency about (a) how and why an entity uses derivative instruments, (b) how derivative instruments and related hedged items are accounted for, and (c) how derivative instruments and related hedged items affect an entity's financial position, results of operations and cash flows. To meet those objectives, the guidance requires (1) qualitative disclosures about objectives for using derivatives by primary underlying risk exposure (e.g., interest rate, credit or foreign exchange rate) and by purpose or strategy (fair value hedge, cash flow hedge, net investment hedge and non-hedges), (2) information about the volume of derivative activity in a flexible format that the preparer believes is the most relevant and practicable, (3) tabular disclosures about balance sheet location and gross fair value amounts of derivative instruments, income statement and other comprehensive income location of gain and loss amounts on derivative instruments by type of contract, and (4) disclosures about credit-risk-related contingent features in derivative agreements.
Further information on the Corporation's derivative instruments and hedging activities is included in Note 10.
Standby and Commercial Letters of Credit and Financial Guarantees
Certain guarantee contracts or indemnification agreements issued or modified subsequent to December 31, 2002, that contingently require the Corporation, as guarantor, to make payments to the guaranteed party are initially measured at fair value and included in "accrued expenses and other liabilities" on the consolidated balance sheets. Further information on the Corporation's obligations under guarantees is included in Note 10.
Loan Origination Fees and Costs
On January 1, 2008, the Corporation prospectively implemented a refinement in the application of receivables guidance related to nonrefundable fees and other costs, which resulted in the deferral and amortization to net interest income of substantially all loan origination fees and costs over the life of the related loan or over the commitment period as a yield adjustment. Prior to January 1, 2008, the Corporation deferred and amortized business loan origination and commitment fees greater than $10 thousand and all Small Business Administration, residential mortgage and consumer loan origination fees and costs over the life of the related loan or over the commitment period as a yield adjustment. The impact of the refinement on 2008 results was a reduction in net interest income of $17 million, a reduction in the net interest margin of 3 basis points, a reduction in noninterest expenses of $44 million and an increase in net income of $17 million, or $0.11 per diluted share. The impact does not include an adjustment to cumulatively correct the application of the receivables guidance related to nonrefundable fees and other costs, as such an adjustment was deemed immaterial, based on the existing accounting changes and error corrections guidance on materiality. The Corporation also concluded that a retroactive application of the refinement to any prior periods would not have been material.
Loan fees on unused commitments and net origination fees related to loans sold are recognized in noninterest income.
Share-Based Compensation
In 2006, the Corporation adopted stock compensation guidance using the modified-prospective transition method. The Corporation recognizes share-based compensation expense using the straight-line method over the
80
Table of Contents
NOTES TO CONSOLIDATED FINANCIAL STATEMENTS
Comerica Incorporated and Subsidiaries
requisite service period for all stock awards, including those with graded vesting. Measurement and attribution of compensation cost for awards that were granted prior to 2006 continue to be based on the estimate of the grant-date fair value and attribution method used under prior accounting guidance.
The guidance adopted in 2006 requires that the expense associated with share-based compensation awards be recorded over the requisite service period. The requisite service period is the period an employee is required to provide service in order to vest in the award, which cannot extend beyond the retirement-eligible date (the date at which the employee is no longer required to perform any service to receive the share-based compensation). Prior to 2006, the Corporation recorded the expense associated with share-based compensation awards over the explicit service period (vesting period). Upon retirement, any remaining unrecognized costs related to share-based compensation awards retained after retirement were expensed.
The Corporation elected to adopt the alternative transition method provided in the 2006 guidance for calculating the tax effects of share-based compensation. The alternative transition method included simplified methods to establish the beginning balance of the additional paid-in capital pool (APIC pool) related to the tax effects of employee share-based compensation, and to determine the subsequent impact on the APIC pool and consolidated statements of cash flows of the tax effects of employee share-based compensation awards that were outstanding and fully or partially unvested upon adoption of the guidance.
Further information on the Corporation's share-based compensation plans is included in Note 18.
Defined Benefit Pension and Other Postretirement Costs
Defined benefit pension costs are charged to "employee benefits" expense on the consolidated statements of income and are funded consistent with the requirements of federal laws and regulations. Inherent in the determination of defined benefit pension costs are assumptions concerning future events that will affect the amount and timing of required benefit payments under the plans. These assumptions include demographic assumptions such as retirement age and mortality, a compensation rate increase, a discount rate used to determine the current benefit obligation and a long-term expected rate of return on plan assets. Net periodic defined benefit pension expense includes service cost, interest cost based on the assumed discount rate, an expected return on plan assets based on an actuarially derived market-related value of assets, amortization of prior service cost and amortization of net actuarial gains or losses. The market-related value used to determine the expected return on plan assets is based on fair value adjusted for the difference between expected returns and actual asset performance. The asset gains and losses are incorporated in the market-related value over a five-year period. Prior service costs include the impact of plan amendments on the liabilities and are amortized over the future service periods of active employees expected to receive benefits under the plan. Actuarial gains and losses result from experience different from that assumed and from changes in assumptions (excluding asset gains and losses not yet reflected in market-related value). Amortization of actuarial gains and losses is included as a component of net periodic defined benefit pension cost for a year if the actuarial net gain or loss exceeds 10 percent of the greater of the projected benefit obligation or the market-related value of plan assets. If amortization is required, the excess is amortized over the average remaining service period of participating employees expected to receive benefits under the plan.
Postretirement benefits are recognized in "employee benefits" expense on the consolidated statements of income during the average remaining service period of participating employees expected to receive benefits under the plan or the average remaining future lifetime of retired participants currently receiving benefits under the plan.
For further information regarding the Corporation's defined benefit pension and other postretirement plans, refer to Note 19.
81
Table of Contents
NOTES TO CONSOLIDATED FINANCIAL STATEMENTS
Comerica Incorporated and Subsidiaries
Income Taxes
The provision for income taxes is based on amounts reported in the consolidated statements of income (after deducting non-taxable items, principally income on bank-owned life insurance, and deducting tax credits related to investments in low income housing partnerships) and includes deferred income taxes on temporary differences between the income tax basis and financial accounting basis of assets and liabilities. Deferred tax assets are evaluated for realization based on available evidence of loss carry-back capacity, future reversals of existing taxable temporary differences, and assumptions made regarding future events. A valuation allowance is provided when it is more-likely-than-not that some portion of the deferred tax asset will not be realized. The provision for income taxes assigned to discontinued operations is based on statutory rates, adjusted for permanent differences generated by those operations.
The Corporation classifies interest and penalties on income tax liabilities in the "provision for income taxes" on the consolidated statements of income.
On January 1, 2008, the Corporation adopted new guidance on accounting for the income tax benefits of dividends on share-based payment awards. The new guidance requires the Corporation to recognize the income tax benefit realized from dividends charged to retained earnings and paid to employees for nonvested restricted stock awards as an increase to capital surplus. Prior to 2008, the income tax benefit for such dividends was recognized as a reduction of income tax expense. For a further discussion of income taxes, refer to Note 20.
Discontinued Operations
Components of the Corporation that have been or will be disposed of by sale, where the Corporation does not have a significant continuing involvement in the operations after the disposal, are accounted for as discontinued operations in all periods presented if significant to the consolidated financial statements. For further information on discontinued operations, refer to Note 26.
Earnings Per Share
On January 1, 2009, the Corporation adopted new earnings per share guidance related to determining whether instruments granted in share-based payment transactions are participating securities. The new guidance clarified that unvested share-based payment awards that contain nonforfeitable rights to dividends or dividend equivalents are considered participating securities and should be included in the calculation of basic earnings per share using the two-class method and was applied retrospectively to all prior periods presented. The impact of adoption on the years ended December 31, 2008 and 2007 is provided in the following table. For further earnings per share information, refer to Note 17.
| | | | | | | | |
| | 2008 | | 2007 | |
|---|
Basic earnings per common share: | | | | | | | |
| | Income (loss) from continuing operations | | $ | (0.02 | ) | $ | (0.04 | ) |
| | Net income (loss) | | | (0.02 | ) | | (0.04 | ) |
Diluted earnings per common share: | | | | | | | |
| | Income (loss) from continuing operations | | $ | (0.01 | ) | $ | — | |
| | Net income (loss) | | | (0.01 | ) | | — | |
Statements of Cash Flows
Cash and cash equivalents are defined as those amounts included in "cash and due from banks", "federal funds sold and securities purchased under agreements to resell" and "interest-bearing deposits with banks" on
82
Table of Contents
NOTES TO CONSOLIDATED FINANCIAL STATEMENTS
Comerica Incorporated and Subsidiaries
the consolidated balance sheets. Cash flows from discontinued operations are reported as separate line items within cash flows from operating, investing and financing activities in the consolidated statements of cash flows.
Other Comprehensive Income (Loss)
The Corporation has elected to present information on comprehensive income in the consolidated statements of changes in shareholders' equity and in Note 16.
Note 2 — Pending Accounting Pronouncements
In June 2009, the FASB issued SFAS No. 166, "Accounting for Transfers of Financial Assets, an amendment of FASB Statement No. 140," and in December 2009 issued Accounting Standards Update (ASU) No. 2009-16, "Transfers and Servicing (Topic 860): Accounting for Transfers of Financial Assets," (ASU 2009-16) to codify the guidance. ASU 2009-16 removes the concept of a qualifying special-purpose entity from ASC Topic 860, "Transfers and Servicing," and eliminates the exception for qualifying special-purpose entities from consolidation guidance. In addition, ASU 2009-16 establishes specific conditions for reporting a transfer of a portion of a financial asset as a sale. If the transfer does not meet established sale conditions, the transferor and transferee must account for the transfer as a secured borrowing. An enterprise that continues to transfer portions of a financial asset that do not meet the established sale conditions would be eligible to record a sale only after it has transferred all of its interest in that asset. The effective date is for fiscal years beginning after November 15, 2009. Accordingly, the Corporation will adopt the provisions of ASU 2009-16 in the first quarter 2010. The Corporation does not expect the adoption of the provisions of ASU 2009-16 to have a material effect on the Corporation's financial condition and results of operations.
In June 2009, the FASB issued SFAS No. 167, "Amendments to FASB Interpretation No. 46(R)," and in December 2009 issued ASU No. 2009-17, "Consolidation (Topic 810): Improvements in Financial Reporting by Enterprises Involved with Variable Interest Entities," (ASU 2009-17) to codify the guidance. ASU 2009-17 replaces the quantitative-based risks and rewards calculation for determining which enterprise, if any, is the primary beneficiary and is required to consolidate a VIE with a qualitative approach focused on identifying which enterprise has both the power to direct the activities of the VIE that most significantly impact the entity's economic performance and the obligation to absorb losses or the right to receive benefits that could be significant to the entity. In addition, ASU 2009-17 requires reconsideration of whether an entity is a VIE when any changes in facts and circumstances occur such that the holders of the equity investment at risk, as a group, lose the power to direct the activities of the entity that most significantly impact the entity's economic performance through loss of voting or similar rights. It also requires ongoing assessments of whether an enterprise is the primary beneficiary of a VIE and additional disclosures about an enterprise's involvement in VIEs. The effective date is for fiscal years beginning after November 15, 2009. Accordingly, the Corporation will adopt the provisions of ASU 2009-17 in the first quarter 2010. The Corporation evaluated its interest in certain entities to determine if these entities meet the definition of a VIE and whether the Corporation was the primary beneficiary under the provisions of ASU 2009-17, and concluded no additional entities require consolidation, except for two money market funds managed by the Corporation, which held $1.9 billion in assets at December 31, 2009. In January 2010, the FASB approved a deferral of ASU 2009-17 for certain investment entities and money market funds and announced plans to issue a related ASU in the first quarter of 2010. The ASU will defer the requirement to consolidate the two money market funds managed by the Corporation.
In January 2010, the FASB issued ASU No. 2010-06, "Fair Value Measurements and Disclosures (Topic 820): Improving Disclosures about Fair Value Measurements," (ASU 2010-06) to amend the Codification. ASU 2010-06 requires separate disclosure of significant transfers in and out of Level 1 and Level 2 fair value measurements and the reasons for the transfers, and disclosure of purchases, sales, issuances and settlements activity on a gross (rather than net) basis in the Level 3 reconciliation of fair value measurements for
83
Table of Contents
NOTES TO CONSOLIDATED FINANCIAL STATEMENTS
Comerica Incorporated and Subsidiaries
assets and liabilities measured at fair value on a recurring basis. In addition, ASU 2010-06 clarifies existing disclosures for level of disaggregation of fair value measurements of assets and liabilities, and inputs and valuation techniques used for fair value measurements in Levels 2 and 3. The effective date is for fiscal years beginning after December 15, 2009, except for the disclosures about activity on a gross basis in Level 3 fair value measurements, which are effective for fiscal years beginning after December 15, 2010. Accordingly, the Corporation will adopt the provisions of ASU 2010-06 in the first quarter 2010, except for the disclosures about activity on a gross basis in Level 3 fair value measurements, which the Corporation will adopt in the first quarter 2011. The Corporation does not expect the adoption of the provisions of ASU 2010-06 to have a material effect on the Corporation's financial condition and results of operations.
Note 3 — Fair Value Measurements
The Corporation utilizes fair value measurements to record fair value adjustments to certain assets and liabilities and to determine fair value disclosures. Investment securities available-for-sale, trading securities, derivatives and certain liabilities are recorded at fair value on a recurring basis. Additionally, from time to time, the Corporation may be required to record other assets and liabilities at fair value on a nonrecurring basis, such as impaired loans, other real estate (primarily foreclosed properties), indirect private equity and venture capital investments and certain other assets and liabilities. These nonrecurring fair value adjustments typically involve write-downs of individual assets or application of lower of cost or fair value accounting.
The Corporation categorizes assets and liabilities recorded at fair value into a three-level hierarchy, based on the markets in which the assets and liabilities are traded and the reliability of the assumptions used to determine fair value. These levels are:
| | | |
| | Level 1 | | Valuation is based upon quoted prices for identical instruments traded in active markets. |
| | Level 2 | | Valuation is based upon quoted prices for similar instruments in active markets, quoted prices for identical or similar instruments in markets that are not active, and model-based valuation techniques for which all significant assumptions are observable in the market. |
| | Level 3 | | Valuation is generated from model-based techniques that use at least one significant assumption not observable in the market. These unobservable assumptions reflect estimates of assumptions that market participants would use in pricing the asset or liability. Valuation techniques include use of option pricing models, discounted cash flow models and similar techniques. |
Following is a description of the valuation methodologies and key inputs used to measure financial assets and liabilities recorded at fair value, as well as a description of the methods and significant assumptions used to estimate fair value disclosures for financial instruments not recorded at fair value in their entirety on a recurring basis. For financial assets and liabilities recorded at fair value, the description includes an indication of the level of the fair value hierarchy in which the assets or liabilities are classified.
Cash and due from banks, federal funds sold and securities purchased under agreements to resell, and interest-bearing deposits with banks
The carrying amount of these instruments approximates the estimated fair value.
Trading securities and associated liabilities
Securities held for trading purposes and associated liabilities are recorded at fair value and included in "other short-term investments" and "accrued expenses and other liabilities," respectively, on the consolidated balance sheets. Level 1 securities held for trading purposes include assets related to employee deferred compensation plans, which are invested in mutual funds and other securities traded on an active exchange, such
84
Table of Contents
NOTES TO CONSOLIDATED FINANCIAL STATEMENTS
Comerica Incorporated and Subsidiaries
as the New York Stock Exchange. Deferred compensation plan liabilities represent the fair value of the obligation to the employee, which corresponds to the fair value of the invested assets. Level 2 trading securities include municipal bonds and mortgage-backed securities issued by U.S. government-sponsored entities and corporate debt securities. Securities classified as Level 3 include securities in less liquid markets and securities not rated by a credit agency. The methods used to value trading securities are the same as the methods used to value investment securities available-for-sale, discussed below.
Loans held-for-sale
Loans held-for-sale, included in "other short-term investments" on the consolidated balance sheets, are recorded at the lower of cost or fair value. The fair value of loans held-for-sale is based on what secondary markets are currently offering for portfolios with similar characteristics. As such, the Corporation classifies loans held-for-sale subjected to nonrecurring fair value adjustments as Level 2.
Investment securities available-for-sale
Investment securities available-for-sale are recorded at fair value on a recurring basis. Fair value measurement is based upon quoted prices, if available. If quoted prices are not available or the market is deemed to be inactive at the measurement date and quoted prices are determined to be associated with distressed transactions, an adjustment to the quoted prices may be necessary or the Corporation may conclude that a change in valuation technique or the use of multiple valuation techniques may be appropriate to estimate an instrument's fair value. Level 1 securities include those traded on an active exchange, such as the New York Stock Exchange, U.S. Treasury securities that are traded by dealers or brokers in active over-the-counter markets and money market funds. Level 2 securities primarily include residential mortgage-backed securities issued by U.S. government-sponsored enterprises. Securities classified as Level 3, of which the substantial majority are auction-rate securities, represent securities in less liquid markets requiring significant management assumptions when determining fair value. Due to the lack of a robust secondary auction-rate securities market with active fair value indicators, fair value at December 31, 2009 and 2008 was determined using an income approach based on a discounted cash flow model utilizing two significant assumptions: discount rate (including a liquidity risk premium) and workout period. The discount rate was calculated using credit spreads of the underlying collateral or similar securities plus a liquidity risk premium. The liquidity risk premium was based on observed industry auction-rate securities valuations by third parties. The workout period was based on an assessment of publicly available information on efforts to re-establish functioning markets for these securities and the Corporation's redemption experience. The rate of redemption of the various types of auction-rate securities held by the Corporation during the year ended December 31, 2009, which ranged from nominal to approximately 45 percent, was a significant consideration in the determination of a reasonable market premium a buyer would require. For further information regarding auction-rate securities, refer to Note 4 to the consolidated financial statements.
Loans
The Corporation does not record loans at fair value on a recurring basis. However, periodically, the Corporation records nonrecurring adjustments to the carrying value of loans based on fair value measurements. Loans for which it is probable that payment of interest or principal will not be made in accordance with the contractual terms of the original loan agreement are considered impaired. Impaired loans where an allowance is established based on the fair value of collateral require classification in the fair value hierarchy. When the fair value of the collateral is based on an observable market price or a current appraised value, the Corporation classifies the impaired loan as nonrecurring Level 2. When a current appraised value is not available or management determines the fair value of the collateral is further impaired below the appraised value and there is no observable market price, the Corporation classifies the impaired loan as nonrecurring Level 3.
85
Table of Contents
NOTES TO CONSOLIDATED FINANCIAL STATEMENTS
Comerica Incorporated and Subsidiaries
Business loans consist of commercial, real estate construction, commercial mortgage, lease financing and international loans. The estimated fair value for variable rate business loans that reprice frequently is based on carrying values adjusted for estimated credit losses and other adjustments that would be expected to be made by a market participant in an active market. The fair value for other business loans, and consumer and residential mortgage loans are estimated using a discounted cash flow model that employs interest rates currently offered on the loans, adjusted by an amount for estimated credit losses and other adjustments that would be expected to be made by a market participant in an active market. The rates take into account the expected yield curve, as well as an adjustment for prepayment risk, when applicable.
Customers' liability on acceptances outstanding and acceptances outstanding
The carrying amount approximates the estimated fair value.
Derivative assets and liabilities
Substantially all of the derivative instruments held or issued by the Corporation for risk management or customer-initiated activities are traded in over-the-counter markets where quoted market prices are not readily available. For those derivative instruments, the Corporation measures fair value using internally developed models that use primarily market observable inputs, such as yield curves and option volatilities, and include the value associated with counterparty credit risk. As such, the Corporation classifies those derivative instruments as recurring Level 2. Examples of Level 2 derivative instruments are interest rate swaps, energy and foreign exchange derivative contracts.
The Corporation also holds a portfolio of warrants for generally nonmarketable equity securities. These warrants are primarily from high technology, non-public companies obtained as part of the loan origination process. Warrants which contain a net exercise provision or a non-contingent put right embedded in the warrant agreement are accounted for as derivatives and recorded at fair value using a Black-Scholes valuation model with five inputs: risk-free rate, expected life, volatility, exercise price, and the per share market value of the underlying company. The Corporation classifies warrants accounted for as derivatives as recurring Level 3.
Foreclosed property
Upon transfer from the loan portfolio, foreclosed property is adjusted to and subsequently carried at the lower of carrying value or fair value. Fair value is based upon independent market prices, appraised value or management's estimation of the value. When the fair value of the collateral is based on an observable market price or a current appraised value, the Corporation classifies the foreclosed property as nonrecurring Level 2. When a current appraised value is not available or management determines the fair value of the foreclosed property is further impaired below the appraised value and there is no observable market price, the Corporation classifies the foreclosed property as nonrecurring Level 3.
Nonmarketable equity securities
The Corporation has a portfolio of indirect (through funds) private equity and venture capital investments. These funds generally cannot be redeemed and the majority are not readily marketable. Distributions from funds are received by the Corporation as the result of liquidation of underlying investments of the funds and/or as income distributions. It is estimated that the underlying assets of the funds will be liquidated over a period of up to 15 years. The value of these investments is at risk to changes in equity markets, general economic conditions and a variety of other factors. The investments are individually reviewed for impairment on a quarterly basis by comparing the carrying value to the estimated fair value. Fair value measurement guidance permits the measurement of investments of this type on the basis of net asset value, provided the net asset value is calculated by the fund in compliance with fair value measurement guidance applicable to investment companies. Where
86
Table of Contents
NOTES TO CONSOLIDATED FINANCIAL STATEMENTS
Comerica Incorporated and Subsidiaries
there is not a readily determinable fair value, the Corporation estimates fair value for indirect private equity and venture capital investments based on percentage ownership in the net asset value of the entire fund, as reported by the fund, after indication that the fund adheres to applicable fair value measurement guidance. For those funds where the net asset value is not reported by the fund, the Corporation derives the fair value of the fund by estimating the fair value of each underlying investment in the fund. In addition to using qualitative information about each underlying investment, as provided by the fund, the Corporation gives consideration to information pertinent to the specific nature of the debt or equity investment, such as relevant market conditions, offering prices, operating results, financial conditions, exit strategy and other qualitative information, as available. The lack of an independent source to validate fair value estimates, including the impact of future capital calls and transfer restrictions, is an inherent limitation in the valuation process. At December 31, 2009, there was approximately $3 million of unfunded commitments related to the funds subjected to nonrecurring fair value adjustments.
The Corporation also holds restricted equity investments, primarily FHLB and FRB stock. Restricted equity securities are not readily marketable and are recorded at cost (par value) and evaluated for impairment based on the ultimate recoverability of the par value. No significant observable market data for these instruments is available. The Corporation considers positive and negative evidence, including the profitability and asset quality of the issuer, dividend payment history and recent redemption experience, when determining the ultimate recoverability of the par value. The Corporation's investment in FHLB stock totaled $271 million and $353 million at December 31, 2009 and 2008, respectively, and its investment in FRB stock totaled $59 million at both December 31, 2009 and 2008. The Corporation believes its investments in FHLB and FRB stock are ultimately recoverable at par.
The Corporation classifies nonmarketable equity securities subjected to nonrecurring fair value adjustments as Level 3.
Loan servicing rights
Loan servicing rights are subject to impairment testing. A valuation model is used for impairment testing, which utilizes a discounted cash flow analysis using interest rates and prepayment speed assumptions currently quoted for comparable instruments and a discount rate determined by management. If the valuation model reflects a value less than the carrying value, loan servicing rights are adjusted to fair value through a valuation allowance as determined by the model. As such, the Corporation classifies loan servicing rights subjected to nonrecurring fair value adjustments as Level 3.
Goodwill
Goodwill is subject to impairment testing that requires an estimate of the fair value of the Corporation's reporting units. Estimating the fair value of reporting units is a subjective process involving the use of estimates and judgments, particularly related to future cash flows, discount rates (including market risk premiums) and market multiples. The fair values of the reporting units were determined using a blend of two commonly used valuation techniques, the market approach and the income approach. The Corporation gives consideration to two valuation techniques, as either technique can be an indicator of value. For the market approach, valuations of reporting units were based on an analysis of relevant price multiples in market trades in industries similar to the reporting unit. Market trades do not consider a control premium associated with an acquisition or a sale transaction. For the income approach, estimated future cash flows and terminal value (value at the end of the cash flow period, based on price multiples) were discounted. The discount rate was based on the imputed cost of equity capital. Material assumptions used in the valuation models included the comparable public company price multiples used in the terminal value, future cash flows and the market risk premium component of the discount rate. Due to the general uncertainty and depressed earning capacity in the financial services industry as
87
Table of Contents
NOTES TO CONSOLIDATED FINANCIAL STATEMENTS
Comerica Incorporated and Subsidiaries
of the measurement date, the Corporation concluded that the valuation under the income approach more clearly reflected the long-term future earning capacity of the reporting unit than the valuation under the market approach, and thus gave greater weight to the income approach.
If goodwill impairment testing resulted in impairment, the Corporation would classify goodwill subjected to nonrecurring fair value adjustments as Level 3. Additional information regarding goodwill impairment testing can be found in Notes 1 and 9.
Deposit liabilities
The estimated fair value of checking, savings and certain money market deposit accounts is represented by the amounts payable on demand. The carrying amount of deposits in foreign offices approximates their estimated fair value, while the estimated fair value of term deposits is calculated by discounting the scheduled cash flows using the year-end rates offered on these instruments.
Short-term borrowings
The carrying amount of federal funds purchased, securities sold under agreements to repurchase and other short-term borrowings approximates the estimated fair value.
Medium- and long-term debt
The carrying value of variable-rate FHLB advances approximates the estimated fair value. The estimated fair value of the Corporation's remaining variable-and fixed-rate medium- and long-term debt is based on quoted market values. If quoted market values are not available, the estimated fair value is based on the market values of debt with similar characteristics.
Credit-related financial instruments
The estimated fair value of unused commitments to extend credit and standby and commercial letters of credit is represented by the estimated cost to terminate or otherwise settle the obligations with the counterparties. This amount is approximated by the fees currently charged to enter into similar arrangements, considering the remaining terms of the agreements and any changes in the credit quality of counterparties since the agreements were executed. This estimate of fair value does not take into account the significant value of the customer relationships and the future earnings potential involved in such arrangements as the Corporation does not believe that it would be practicable to estimate a representational fair value for these items.
88
Table of Contents
NOTES TO CONSOLIDATED FINANCIAL STATEMENTS
Comerica Incorporated and Subsidiaries
Assets and Liabilities Recorded at Fair Value on a Recurring Basis
The table below presents the recorded amount of assets and liabilities measured at fair value on a recurring basis.
| | | | | | | | | | | | | | | | | |
| | Total | | Level 1 | | Level 2 | | Level 3 | |
|---|
| | (in millions)
| |
|---|
December 31, 2009 | | | | | | | | | | | | | |
| | Trading securities | | $ | 107 | | $ | 86 | | $ | 21 | | $ | — | |
| | Investment securities available-for-sale: | | | | | | | | | | | | | |
| | | U.S. Treasury and other U.S. government agency securities | | | 103 | | | 103 | | | — | | | — | |
| | | Government-sponsored enterprise residential mortgage-backed securities | | | 6,261 | | | — | | | 6,261 | | | — | |
| | | State and municipal securities (a) | | | 47 | | | — | | | 1 | | | 46 | |
| | | Corporate debt securities: | | | | | | | | | | | | | |
| | | | Auction-rate debt securities | | | 150 | | | — | | | — | | | 150 | |
| | | | Other corporate debt securities | | | 50 | | | — | | | 43 | | | 7 | |
| | | Equity and other non-debt securities: | | | | | | | | | | | | | |
| | | | Auction-rate preferred securities | | | 706 | | | — | | | — | | | 706 | |
| | | | Money market and other mutual funds | | | 99 | | | 99 | | | — | | | — | |
| | | | | | | | | | |
| | | | | Total investment securities available-for-sale | | | 7,416 | | | 202 | | | 6,305 | | | 909 | |
| | Derivative assets | | | 675 | | | — | | | 668 | | | 7 | |
| | | | | | | | | | |
| | Total assets at fair value | | $ | 8,198 | | $ | 288 | | $ | 6,994 | | $ | 916 | |
| | | | | | | | | | |
| | Derivative liabilities | | $ | 410 | | $ | — | | $ | 410 | | $ | — | |
| | Other liabilities (b) | | | 86 | | | 86 | | | — | | | — | |
| | | | | | | | | | |
| | Total liabilities at fair value | | $ | 496 | | $ | 86 | | $ | 410 | | $ | — | |
| | | | | | | | | | |
December 31, 2008 | | | | | | | | | | | | | |
| | Trading securities | | $ | 124 | | $ | 80 | | $ | 10 | | $ | 34 | |
| | Investment securities available-for-sale: | | | | | | | | | | | | | |
| | | U.S. Treasury and other U.S. government agency securities | | | 79 | | | 79 | | | — | | | — | |
| | | Government-sponsored enterprise residential mortgage-backed securities | | | 7,861 | | | — | | | 7,861 | | | — | |
| | | State and municipal securities (a) | | | 66 | | | — | | | 1 | | | 65 | |
| | | Corporate debt securities: | | | | | | | | | | | | | |
| | | | Auction-rate debt securities | | | 147 | | | — | | | — | | | 147 | |
| | | | Other corporate debt securities | | | 42 | | | — | | | 37 | | | 5 | |
| | | Equity and other non-debt securities: | | | | | | | | | | | | | |
| | | | Auction-rate preferred securities | | | 936 | | | — | | | — | | | 936 | |
| | | | Money market and other mutual funds | | | 70 | | | 70 | | | — | | | — | |
| | | | | | | | | | |
| | | | | Total investment securities available-for-sale | | | 9,201 | | | 149 | | | 7,899 | | | 1,153 | |
| | Derivative assets | | | 1,123 | | | — | | | 1,115 | | | 8 | |
| | | | | | | | | | |
| | Total assets at fair value | | $ | 10,448 | | $ | 229 | | $ | 9,024 | | $ | 1,195 | |
| | | | | | | | | | |
| | Derivative liabilities | | $ | 671 | | $ | — | | $ | 671 | | $ | — | |
| | Other liabilities (b) | | | 85 | | | 80 | | | — | | | 5 | |
| | | | | | | | | | |
| | Total liabilities at fair value | | $ | 756 | | $ | 80 | | $ | 671 | | $ | 5 | |
| | | | | | | | | | |
- (a)
- Primarily auction-rate securities.
- (b)
- Primarily deferred compensation plans.
89
Table of Contents
NOTES TO CONSOLIDATED FINANCIAL STATEMENTS
Comerica Incorporated and Subsidiaries
The table below summarizes the changes in Level 3 assets and liabilities measured at fair value on a recurring basis for the years ended December 31, 2009 and 2008.
| | | | | | | | | | | | | | | | | | | | | | | | | |
| |
| | Net Realized/Unrealized Gains (Losses) | |
| |
| |
| |
|---|
| |
| | Recorded in Earnings | |
| |
| | Transfers
In and/or
Out of
Level 3 | |
| |
|---|
| | Balance at
Beginning of
Period | | Recorded in Other
Comprehensive
Income (Pre-tax) | | Purchases, Sales,
Issuances and
Settlements, Net | | Balance at
End of
Period | |
|---|
| | Realized | | Unrealized | |
|---|
| | (in millions)
| |
|---|
Year Ended December 31, 2009 | | | | | | | | | | | | | | | | | | | | | | |
| | Trading securities | | $ | 34 | | $ | — | | $ | — | | $ | — | | $ | (34 | ) | $ | — | | $ | — | |
| | Investment securities available-for-sale: | | | | | | | | | | | | | | | | | | | | | | |
| | | State and municipal securities (a) | | | 65 | | | — | | | — | | | (2 | ) | | (17 | ) | | — | | | 46 | |
| | | Auction-rate debt securities | | | 147 | | | — | | | — | | | 5 | | | (2 | ) | | — | | | 150 | |
| | | Other corporate debt securities | | | 5 | | | — | | | 2 | | | — | | | — | | | — | | | 7 | |
| | | Auction-rate preferred securities | | | 936 | | | 14 | | | — | | | 13 | | | (257 | ) | | — | | | 706 | |
| | | | | | | | | | | | | | | | |
| | | | Total investment securities available-for-sale | | | 1,153 | | | 14 | | | 2 | | | 16 | | | (276 | ) | | — | | | 909 | |
| | Derivative assets (warrants) | | | 8 | | | — | | | 4 | | | — | | | (5 | ) | | — | | | 7 | |
| | Other liabilities | | | 5 | | | (2 | ) | | — | | | — | | | (7 | ) | | — | | | — | |
Year Ended December 31, 2008 | | | | | | | | | | | | | | | | | | | | | | |
| | Trading securities | | $ | — | | $ | — | | $ | — | | $ | — | | $ | 31 | | $ | 3 | | $ | 34 | |
| | Investment securities available-for-sale: | | | | | | | | | | | | | | | | | | | | | | |
| | | State and municipal securities (a) | | | 1 | | | — | | | — | | | (3 | ) | | 67 | | | — | | | 65 | |
| | | Auction-rate debt securities | | | — | | | — | | | — | | | (11 | ) | | 158 | | | — | | | 147 | |
| | | Other corporate debt securities | | | 2 | | | — | | | 4 | | | — | | | (1 | ) | | — | | | 5 | |
| | | Auction-rate preferred securities | | | — | | | 4 | | | — | | | (18 | ) | | 950 | | | — | | | 936 | |
| | | | | | | | | | | | | | | | |
| | | | Total investment securities available-for-sale | | | 3 | | | 4 | | | 4 | | | (32 | ) | | 1,174 | | | — | | | 1,153 | |
| | Derivative assets (warrants) | | | 23 | | | 2 | | | (9 | ) | | — | | | (8 | ) | | — | | | 8 | |
| | Other liabilities | | | — | | | — | | | (5 | ) | | — | | | — | | | — | | | 5 | |
- (a)
- Primarily auction-rate securities
90
Table of Contents
NOTES TO CONSOLIDATED FINANCIAL STATEMENTS
Comerica Incorporated and Subsidiaries
The table below presents the income statement classification of realized and unrealized gains and losses due to changes in fair value recorded in earnings for the years ended December 31, 2009 and 2008 for recurring Level 3 assets and liabilities, as shown in the previous table.
| | | | | | | | | | | | | | | | | | | | | | | | | | | | |
| | Net Securities
Gains (Losses) | | Other Noninterest
Income | | Discontinued Operations | | Total | |
|---|
| | Realized | | Unrealized | | Realized | | Unrealized | | Realized | | Unrealized | | Realized | | Unrealized | |
|---|
| | (in millions)
| |
|---|
Year Ended December 31, 2009 | | | | | | | | | | | | | | | | | | | | | | | | | |
| | Investment securities available-for-sale: | | | | | | | | | | | | | | | | | | | | | | | | | |
| | | Other corporate debt securities | | $ | — | | $ | — | | $ | — | | $ | — | | $ | — | | $ | 2 | | $ | — | | $ | 2 | |
| | | Auction-rate preferred securities | | | 14 | | | — | | | — | | | — | | | — | | | — | | | 14 | | | — | |
| | | | | | | | | | | | | | | | | | |
| | | | Total investment securities available-for-sale | | | 14 | | | — | | | — | | | — | | | — | | | 2 | | | 14 | | | 2 | |
| | Derivative assets (warrants) | | | — | | | — | | | — | | | 4 | | | — | | | — | | | — | | | 4 | |
| | Other liabilities | | | (2 | ) | | — | | | — | | | — | | | — | | | — | | | (2 | ) | | — | |
Year Ended December 31, 2008 | | | | | | | | | | | | | | | | | | | | | | | | | |
| | Investment securities available-for-sale: | | | | | | | | | | | | | | | | | | | | | | | | | |
| | | Other corporate debt securities | | $ | — | | $ | — | | $ | — | | $ | — | | $ | — | | $ | 4 | | $ | — | | $ | 4 | |
| | | Auction-rate preferred securities | | | 4 | | | — | | | — | | | — | | | — | | | — | | | 4 | | | — | |
| | | | | | | | | | | | | | | | | | |
| | | | Total investment securities available-for-sale | | | 4 | | | — | | | — | | | — | | | — | | | 4 | | | 4 | | | 4 | |
| | Derivative assets (warrants) | | | — | | | — | | | 2 | | | (9 | ) | | — | | | — | | | 2 | | | (9 | ) |
| | Other liabilities | | | — | | | (5 | ) | | — | | | — | | | — | | | — | | | — | | | (5 | ) |
Assets and Liabilities Recorded at Fair Value on a Nonrecurring Basis
The Corporation may be required, from time to time, to record certain assets and liabilities at fair value on a nonrecurring basis. These include assets that are recorded at the lower of cost or fair value that were recognized
91
Table of Contents
NOTES TO CONSOLIDATED FINANCIAL STATEMENTS
Comerica Incorporated and Subsidiaries
at fair value below cost at the end of the period. Assets and liabilities recorded at fair value on a nonrecurring basis are included in the table below.
| | | | | | | | | | | | | | |
| | Total | | Level 1 | | Level 2 | | Level 3 | |
|---|
| | (in millions)
| |
|---|
December 31, 2009 | | | | | | | | | | | | | |
| | Loans (a) | | $ | 1,131 | | $ | — | | $ | — | | $ | 1,131 | |
| | Nonmarketable equity securities (b) | | | 8 | | | — | | | — | | | 8 | |
| | Other assets (c)(d) | | | 129 | | | — | | | 6 | | | 123 | |
| | | | | | | | | | |
| | Total assets at fair value | | | 1,268 | | $ | — | | $ | 6 | | $ | 1,262 | |
| | | | | | | | | | |
| | Total liabilities at fair value | | $ | — | | $ | — | | $ | — | | $ | — | |
| | | | | | | | | | |
December 31, 2008 | | | | | | | | | | | | | |
| | Loans (a) | | $ | 904 | | $ | — | | $ | — | | $ | 904 | |
| | Nonmarketable equity securities (b) | | | 64 | | | — | | | — | | | 64 | |
| | Other assets (c)(d) | | | 89 | | | — | | | 5 | | | 84 | |
| | | | | | | | | | |
| | Total assets at fair value | | $ | 1,057 | | $ | — | | $ | 5 | | $ | 1,052 | |
| | | | | | | | | | |
| | Total liabilities at fair value | | $ | — | | $ | — | | $ | — | | $ | — | |
| | | | | | | | | | |
- (a)
- The Corporation recorded $834 million and $533 million in fair value losses on impaired loans (included in "provision for loan losses" on the consolidated statements of income) during the years ended December 31, 2009 and 2008, respectively, based on the estimated fair value of the underlying collateral.
- (b)
- The Corporation recorded $13 million and $14 million in fair value losses related to write-downs on nonmarketable equity securities (included in "other noninterest income" on the consolidated statements of income) during the years ended December 31, 2009 and 2008, respectively, based on the estimated fair value of the funds.
- (c)
- Includes other real estate (primarily foreclosed properties), loans held-for-sale and loan servicing rights.
- (d)
- The Corporation recorded $34 million and $7 million in fair value losses related to write-downs of other real estate, based on the estimated fair value of the underlying collateral, and recognized a net loss of $2 million and a net gain of $2 million on sales of other real estate during the years ended December 31, 2009 and 2008, respectively (included in "other noninterest expenses" on the consolidated statements of income).
Estimated Fair Values of Financial Instruments Not Recorded at Fair Value in their Entirety on a Recurring Basis
Disclosure of the estimated fair values of financial instruments, which differ from carrying values, often requires the use of estimates. In cases where quoted market values in an active market are not available, the Corporation uses present value techniques and other valuation methods to estimate the fair values of its financial instruments. These valuation methods require considerable judgment and the resulting estimates of fair value can be significantly affected by the assumptions made and methods used.
The amounts provided herein are estimates of the exchange price that would be received to sell an asset or paid to transfer a liability in an orderly transaction (i.e., not a forced transaction, such as a liquidation or distressed sale) between market participants at the measurement date. However, the calculated fair value estimates in many instances cannot be substantiated by comparison to independent markets and, in many cases,
92
Table of Contents
NOTES TO CONSOLIDATED FINANCIAL STATEMENTS
Comerica Incorporated and Subsidiaries
may not be realizable in a current sale of the financial instrument. The Corporation typically holds the majority of its financial instruments until maturity and thus does not expect to realize many of the estimated amounts disclosed. The disclosures also do not include estimated fair value amounts for items that are not defined as financial instruments, but which have significant value. These include such items as core deposit intangibles, the future earnings potential of significant customer relationships and the value of trust operations and other fee generating businesses. The Corporation believes the imprecision of an estimate could be significant.
The carrying amount and estimated fair value of financial instruments not recorded at fair value in their entirety on a recurring basis on the Corporation's consolidated balance sheets are as follows:
| | | | | | | | | | | | | | | |
| | December 31, | |
|---|
| | 2009 | | 2008 | |
|---|
| | Carrying
Amount | | Estimated
Fair Value | | Carrying
Amount | | Estimated
Fair Value | |
|---|
| | (in millions)
| |
|---|
Assets | | | | | | | | | | | | | |
| | Cash and due from banks | | $ | 774 | | $ | 774 | | $ | 913 | | $ | 913 | |
| | Federal funds sold and securities purchased under agreements to resell | | | — | | | — | | | 202 | | | 202 | |
| | Interest-bearing deposits with banks | | | 4,843 | | | 4,843 | | | 2,308 | | | 2,308 | |
| | Loans held-for-sale | | |
30 | | |
30 | | |
34 | | |
34 | |
| | Total loans, net of allowance for loan losses (a) | | |
41,176 | | |
41,098 | | |
49,735 | | |
50,799 | |
| | Customers' liability on acceptances outstanding | | |
11 | | |
11 | | |
14 | | |
14 | |
| | Loan servicing rights | | | 7 | | | 7 | | | 11 | | | 11 | |
| | Nonmarketable equity securities (b) | | | 57 | | | 61 | | | 64 | | | 64 | |
Liabilities | | | | | | | | | | | | | |
| | Demand deposits (noninterest-bearing) | | | 15,871 | | | 15,871 | | | 11,701 | | | 11,701 | |
| | Interest-bearing deposits | | | 23,794 | | | 23,814 | | | 30,254 | | | 30,390 | |
| | | | | | | | | | |
| | | Total deposits | | | 39,665 | | | 39,685 | | | 41,955 | | | 42,091 | |
| | Short-term borrowings | | |
462 | | |
462 | | |
1,749 | | |
1,749 | |
| | Acceptances outstanding | | | 11 | | | 11 | | | 14 | | | 14 | |
| | Medium- and long-term debt | | | 11,060 | | | 10,723 | | | 15,053 | | | 13,995 | |
Credit-related financial instruments | | |
(90 |
) | |
(115 |
) | |
(98 |
) | |
(136 |
) |
- (a)
- Included $1,131 million and $904 million of impaired loans recorded at fair value on a nonrecurring basis at December 31, 2009 and 2008, respectively.
- (b)
- Included $8 million and $64 million of indirect private equity and venture capital investments recorded at fair value on a nonrecurring basis at December 31, 2009 and 2008, respectively.
93
Table of Contents
NOTES TO CONSOLIDATED FINANCIAL STATEMENTS
Comerica Incorporated and Subsidiaries
Note 4 — Investment Securities
A summary of the Corporation's investment securities available-for-sale follows:
| | | | | | | | | | | | | | | |
| | Amortized
Cost | | Gross
Unrealized
Gains | | Gross
Unrealized
Losses | | Fair
Value | |
|---|
| | (in millions)
| |
|---|
December 31, 2009 | | | | | | | | | | | | | |
| | U.S. Treasury and other U.S. government agency securities | | $ | 103 | | $ | — | | $ | — | | $ | 103 | |
| | Government-sponsored enterprise residential mortgage-backed securities | | | 6,228 | | | 51 | | | 18 | | | 6,261 | |
| | State and municipal securities (a) | | | 51 | | | — | | | 4 | | | 47 | |
| | Corporate debt securities: | | | | | | | | | | | | | |
| | | Auction-rate debt securities | | | 156 | | | — | | | 6 | | | 150 | |
| | | Other corporate debt securities | | | 50 | | | — | | | — | | | 50 | |
| | Equity and other non-debt securities: | | | | | | | | | | | | | |
| | | Auction-rate preferred securities | | | 711 | | | 8 | | | 13 | | | 706 | |
| | | Money market and other mutual funds | | | 99 | | | — | | | — | | | 99 | |
| | | | | | | | | | |
Total investment securities available-for-sale | | $ | 7,398 | | $ | 59 | | $ | 41 | | $ | 7,416 | |
| | | | | | | | | | |
December 31, 2008 | | | | | | | | | | | | | |
| | U.S. Treasury and other U.S. government agency securities | | $ | 79 | | $ | — | | $ | — | | $ | 79 | |
| | Government-sponsored enterprise residential mortgage-backed securities | | | 7,624 | | | 242 | | | 5 | | | 7,861 | |
| | State and municipal securities (a) | | | 69 | | | — | | | 3 | | | 66 | |
| | Corporate debt securities: | | | | | | | | | | | | | |
| | | Auction-rate debt securities | | | 158 | | | — | | | 11 | | | 147 | |
| | | Other corporate debt securities | | | 42 | | | — | | | — | | | 42 | |
| | Equity and other non-debt securities: | | | | | | | | | | | | | |
| | | Auction-rate preferred securities | | | 954 | | | — | | | 18 | | | 936 | |
| | | Money market and other mutual funds | | | 70 | | | — | | | — | | | 70 | |
| | | | | | | | | | |
Total investment securities available-for-sale | | $ | 8,996 | | $ | 242 | | $ | 37 | | $ | 9,201 | |
| | | | | | | | | | |
- (a)
- Primarily auction-rate securities.
94
Table of Contents
NOTES TO CONSOLIDATED FINANCIAL STATEMENTS
Comerica Incorporated and Subsidiaries
A summary of the Corporation's temporarily impaired investment securities available-for-sale follows:
| | | | | | | | | | | | | | | | | | | | | |
| | Temporarily Impaired | |
|---|
| | Less than 12 months | | Over 12 months | | Total | |
|---|
| | Fair
Value | | Unrealized
Losses | | Fair
Value | | Unrealized
Losses | | Fair
Value | | Unrealized
Losses | |
|---|
| | (in millions)
| |
|---|
December 31, 2009 | | | | | | | | | | | | | | | | | | | |
| | U.S. Treasury and other U.S. government agency securities | | $ | — | | $ | — | | $ | — | | $ | — | | $ | — | | $ | — | |
| | Government-sponsored enterprise residential mortgage-backed securities | | | 1,609 | | | 18 | | | — | | | — | | | 1,609 | | | 18 | |
| | State and municipal securities (a) | | | — | | | — | | | 46 | | | 4 | | | 46 | | | 4 | |
| | Corporate debt securities: | | | | | | | | | | | | | | | | | | | |
| | | Auction-rate debt securities | | | 150 | | | 6 | | | — | | | — | | | 150 | | | 6 | |
| | | Other corporate debt securities | | | — | | | — | | | — | | | — | | | — | | | — | |
| | Equity and other non-debt securities: | | | | | | | | | | | | | | | | | | | |
| | | Auction-rate preferred securities | | | 510 | | | 13 | | | — | | | — | | | 510 | | | 13 | |
| | | Money market and other mutual funds | | | — | | | — | | | — | | | — | | | — | | | — | |
| | | | | | | | | | | | | | |
| | Total temporarily impaired securities | | $ | 2,269 | | $ | 37 | | $ | 46 | | $ | 4 | | $ | 2,315 | | $ | 41 | |
| | | | | | | | | | | | | | |
December 31, 2008 | | | | | | | | | | | | | | | | | | | |
| | U.S. Treasury and other U.S. government agency securities | | $ | — | | $ | — | | $ | — | | $ | — | | $ | — | | $ | — | |
| | Government-sponsored enterprise residential mortgage-backed securities | | | 137 | | | 1 | | | 559 | | | 4 | | | 696 | | | 5 | |
| | State and municipal securities (a) | | | 64 | | | 3 | | | — | | | — | | | 64 | | | 3 | |
| | Corporate debt securities: | | | | | | | | | | | | | | | | | | | |
| | | Auction-rate debt securities | | | 147 | | | 11 | | | — | | | — | | | 147 | | | 11 | |
| | | Other corporate debt securities | | | — | | | — | | | — | | | — | | | — | | | — | |
| | Equity and other non-debt securities: | | | | | | | | | | | | | | | | | | | |
| | | Auction-rate preferred securities | | | 936 | | | 18 | | | — | | | — | | | 936 | | | 18 | |
| | | Money market and other mutual funds | | | — | | | — | | | — | | | — | | | — | | | — | |
| | | | | | | | | | | | | | |
| | Total temporarily impaired securities | | $ | 1,284 | | $ | 33 | | $ | 559 | | $ | 4 | | $ | 1,843 | | $ | 37 | |
| | | | | | | | | | | | | | |
- (a)
- Primarily auction-rate securities.
At December 31, 2009, the Corporation had 469 securities in an unrealized loss position, including 328 auction-rate preferred securities, 78 auction-rate corporate debt securities, 43 state and municipal auction-rate debt securities and 17 AAA-rated U.S. government-sponsored enterprise residential mortgage-backed securities (i.e., FMNA, FHLMC). The unrealized losses resulted from changes in market interest rates and liquidity, not from changes in the probability of contractual cash flows. The Corporation does not intend to sell the securities, and it is not more-likely-than-not that the Corporation will be required to sell the securities prior to recovery of amortized cost. Full collection of the amounts due according to the contractual terms of the securities is expected; therefore, the Corporation does not consider these investments to be other-than-temporarily impaired at December 31, 2009.
95
Table of Contents
NOTES TO CONSOLIDATED FINANCIAL STATEMENTS
Comerica Incorporated and Subsidiaries
Sales, calls and write-downs of investment securities available-for-sale resulted in realized gains and losses as follows:
| | | | | | | | | | | |
| | Years Ended
December 31 | |
|---|
| | 2009 | | 2008 | | 2007 | |
|---|
| | (in millions)
| |
|---|
Securities gains | | $ | 245 | | $ | 68 | | $ | 9 | |
Securities losses | | | (2 | ) | | (1 | ) | | (2 | ) |
| | | | | | | | |
| | Total net securities gains | | $ | 243 | | $ | 67 | | $ | 7 | |
| | | | | | | | |
The table below summarizes the amortized cost and fair values of debt securities by contractual maturity. Securities with multiple maturity dates are classified in the period of final maturity. Expected maturities will differ from contractual maturities because borrowers may have the right to call or prepay obligations with or without call or prepayment penalties.
| | | | | | | | | |
| | December 31, 2009 | |
|---|
| | Amortized
Cost | | Fair
Value | |
|---|
| | (in millions)
| |
|---|
Contractual maturity | | | | | | | |
| | Within one year | | $ | 147 | | $ | 147 | |
| | After one year through five years | | | 7 | | | 7 | |
| | After five years through ten years | | | — | | | — | |
| | After ten years | | | 206 | | | 196 | |
| | | | | | |
| | | Subtotal | | | 360 | | | 350 | |
Residential mortgage-backed securities | | | 6,228 | | | 6,261 | |
Equity and other nondebt securities: | | | | | | | |
| | Auction-rate preferred securities | | | 711 | | | 706 | |
| | Money market and other mutual funds | | | 99 | | | 99 | |
| | | | | | |
| | | Total investment securities available-for-sale | | $ | 7,398 | | $ | 7,416 | |
| | | | | | |
Included in the contractual maturity distribution in the table above were auction-rate securities with a total amortized cost and fair value of $206 million and $196 million, respectively. Auction-rate securities are long-term, floating rate instruments for which interest rates are reset at periodic auctions. At each successful auction, the Corporation has the option to sell the security at par value. Additionally, the issuers of auction-rate securities generally have the right to redeem or refinance the debt. As a result, the expected life of auction-rate securities may differ significantly from the contractual life.
At December 31, 2009, investment securities having a carrying value of $5.5 billion were pledged where permitted or required by law to secure $5.3 billion of liabilities, including public and other deposits, FHLB advances and derivative instruments. This included residential mortgage-backed securities of $3.3 billion pledged with the FHLB to secure advances of $3.2 billion at December 31, 2009. The remaining pledged securities of $2.2 billion were primarily with state and local government agencies to secure $2.0 billion of deposits and other liabilities.
In September 2008, the Corporation announced an offer to repurchase, at par, auction-rate securities held by certain retail and institutional clients that were sold through Comerica Securities, a broker/dealer subsidiary of Comerica Bank. Auction-rate securities that were the subject of functioning auctions or current calls or
96
Table of Contents
NOTES TO CONSOLIDATED FINANCIAL STATEMENTS
Comerica Incorporated and Subsidiaries
redemptions were not eligible for repurchase. The repurchase offers commenced in October 2008 and concluded in December 2008.
The following table summarizes auction-rate securities activity for the years ended December 31, 2009 and 2008.
| | | | | | | | | | | | | | |
| | Par
Value | | Fair
Value (a) | | Repurchase
Charge (b) | | Securities
Gains | |
|---|
| | (in millions)
| |
|---|
Balance at January 1, 2008 | | $ | — | | $ | — | | | | | | | |
| | Repurchased from customers | | | 1,345 | | | 1,259 | | $ | 88 | | | | |
| | Called or redeemed subsequent to repurchase | | | (84 | ) | | (80 | ) | | | | $ | 4 | |
| | Unrealized losses (c) | | | — | | | (32 | ) | | | | | | |
| | | | | | | | | | | | |
Balance at December 31, 2008 | | $ | 1,261 | | $ | 1,147 | | | | | | | |
| | Called or redeemed subsequent to repurchase | | | (276 | ) | | (262 | ) | | | | $ | 14 | |
| | Unrealized gains (c) | | | — | | | 16 | | | | | | | |
| | | | | | | | | | | | |
Balance at December 31, 2009 | | $ | 985 | | $ | 901 | | | | | | | |
| | | | | | | | | | | | |
- (a)
- Recorded in "investment securities available-for-sale" on the consolidated balance sheets.
- (b)
- Recorded in "litigation and operational losses" on the consolidated statements of income. Includes the difference between cost (par value) and fair value of the securities repurchased and other repurchase-related charges.
- (c)
- Changes in fair value subsequent to repurchase recognized in accumulated other comprehensive income (loss).
Note 5 — Nonperforming Assets
The following table summarizes nonperforming assets, which consist of nonaccrual loans, reduced-rate loans and real estate acquired through foreclosure. Nonaccrual loans are those on which interest is not being recognized. Reduced-rate loans are those on which interest has been renegotiated to lower than market rates because of the weakened financial condition of the borrower.
97
Table of Contents
NOTES TO CONSOLIDATED FINANCIAL STATEMENTS
Comerica Incorporated and Subsidiaries
Nonaccrual and reduced-rate loans are included in the corresponding loan line items and real estate acquired through foreclosure is included in "accrued income and other assets" on the consolidated balance sheets.
| | | | | | | | | | |
| | December 31 | |
|---|
| | 2009 | | 2008 | |
|---|
| | (in millions)
| |
|---|
Nonaccrual loans: | | | | | | | |
| | Commercial | | $ | 238 | | $ | 205 | |
| | Real estate construction: | | | | | | | |
| | | Commerical Real Estate business line (a) | | | 507 | | | 429 | |
| | | Other business lines (b) | | | 4 | | | 5 | |
| | | | | | |
| | | | Total real estate construction | | | 511 | | | 434 | |
| | Commercial mortgage: | | | | | | | |
| | | Commerical Real Estate business line (a) | | | 127 | | | 132 | |
| | | Other business lines (b) | | | 192 | | | 130 | |
| | | | | | |
| | | | Total commercial mortgage | | | 319 | | | 262 | |
| | Residential mortgage | | | 50 | | | 7 | |
| | Consumer | | | 12 | | | 6 | |
| | Lease financing | | | 13 | | | 1 | |
| | International | | | 22 | | | 2 | |
| | | | | | |
| | | | Total nonaccrual loans | | | 1,165 | | | 917 | |
Reduced-rate loans | | | 16 | | | — | |
| | | | | | |
| | | | Total nonperforming loans | | | 1,181 | | | 917 | |
Foreclosed property | | | 111 | | | 66 | |
| | | | | | |
| | | | Total nonperforming assets | | $ | 1,292 | | $ | 983 | |
| | | | | | |
Loans past due 90 days or more and still accruing | | $ | 101 | | $ | 125 | |
| | | | | | |
Gross interest income that would have been recorded had the nonaccrual and reduced-rate loans performed in accordance with original terms | | $ | 109 | | $ | 98 | |
| | | | | | |
Interest income recognized | | $ | 21 | | $ | 24 | |
| | | | | | |
- (a)
- Primarily loans to real estate investors and developers.
- (b)
- Primarily loans secured by owner-occupied real estate.
98
Table of Contents
NOTES TO CONSOLIDATED FINANCIAL STATEMENTS
Comerica Incorporated and Subsidiaries
The following presents information regarding impaired loans and the related valuation allowance:
| | | | | | | | | | | |
| | December 31 | |
|---|
| | 2009 | | 2008 | | 2007 | |
|---|
| | (in millions)
| |
|---|
Average individually evaluated impaired loans for the year | | $ | 1,078 | | $ | 690 | | $ | 264 | |
| | | | | | | | |
Total nonaccrual loans | | $ | 1,165 | | $ | 917 | | $ | 391 | |
Total reduced-rate loans | | | 16 | | | — | | | 13 | |
| | | | | | | | |
| | Total nonperforming loans | | | 1,181 | | | 917 | | | 404 | |
Total performing restructured loans | | | 11 | | | — | | | 4 | |
| | | | | | | | |
| | Total impaired loans | | | 1,192 | | | 917 | | | 408 | |
Impaired loans excluded from individual evaluation | | | (51 | ) | | (13 | ) | | (4 | ) |
| | | | | | | | |
| | Individually evaluated impaired loans | | $ | 1,141 | | $ | 904 | | $ | 404 | |
| | | | | | | | |
Individually evaluated impaired loans requiring | | | | | | | | | | |
| | a valuation allowance | | $ | 1,080 | | $ | 807 | | $ | 356 | |
| | | | | | | | |
Valuation allowance on individually evaluated impaired loans | | $ | 196 | | $ | 175 | | $ | 85 | |
| | | | | | | | |
Note 6 — Allowance for Loan Losses
An analysis of changes in the allowance for loan losses follows:
| | | | | | | | | | | |
| | 2009 | | 2008 | | 2007 | |
|---|
| | (dollar amounts in millions)
| |
|---|
Balance at January 1 | | $ | 770 | | $ | 557 | | $ | 493 | |
Loan charge-offs | | | (895 | ) | | (500 | ) | | (196 | ) |
Recoveries on loans previously charged-off | | | 27 | | | 29 | | | 47 | |
| | | | | | | | |
| | Net loan charge-offs | | | (868 | ) | | (471 | ) | | (149 | ) |
Provision for loan losses | | | 1,082 | | | 686 | | | 212 | |
Foreign currency translation adjustment | | | 1 | | | (2 | ) | | 1 | |
| | | | | | | | |
Balance at December 31 | | $ | 985 | | $ | 770 | | $ | 557 | |
| | | | | | | | |
As a percentage of total loans | | | 2.34 | % | | 1.52 | % | | 1.10 | % |
Note 7 — Significant Group Concentrations of Credit Risk
Concentrations of both on-balance sheet and off-balance sheet credit risk are controlled and monitored as part of credit policies. The Corporation is a regional financial services holding company with a geographic concentration of its on-balance-sheet and off-balance-sheet activities in Michigan, California and Texas.
The Corporation has an industry concentration with the automotive industry. Loans to automotive dealers and to borrowers involved with automotive production are reported as automotive, as management believes these loans have similar economic characteristics that might cause them to react similarly to changes in economic conditions. This aggregation involves the exercise of judgment. Included in automotive production are: (a) original equipment manufacturers and Tier 1 and Tier 2 suppliers that produce components used in vehicles and whose primary revenue source is automotive-related ("primary" defined as greater than 50%) and (b) other manufacturers that produce components used in vehicles and whose primary revenue source is automotive-related. Loans less than $1 million and loans recorded in the Small Business loan portfolio were excluded from
99
Table of Contents
NOTES TO CONSOLIDATED FINANCIAL STATEMENTS
Comerica Incorporated and Subsidiaries
the definition. Outstanding loans and total exposure from loans, unused commitments and standby letters of credit to companies related to the automotive industry were as follows:
| | | | | | | | | |
| | December 31 | |
|---|
| | 2009 | | 2008 | |
|---|
| | (in millions)
| |
|---|
Automotive loans: | | | | | | | |
| | Production | | $ | 941 | | $ | 1,459 | |
| | Dealer | | | 3,430 | | | 4,655 | |
| | | | | | |
| | | Total automotive loans | | $ | 4,371 | | $ | 6,114 | |
| | | | | | |
Total automotive exposure: | | | | | | | |
| | Production | | $ | 1,869 | | $ | 2,867 | |
| | Dealer | | | 5,767 | | | 6,646 | |
| | | | | | |
| | | Total automotive exposure | | $ | 7,636 | | $ | 9,513 | |
| | | | | | |
Further, the Corporation's portfolio of commercial real estate loans, which includes real estate construction and commercial mortgage loans, was as shown in the following table.
| | | | | | | | | |
| | December 31 | |
|---|
| | 2009 | | 2008 | |
|---|
| | (in millions)
| |
|---|
Real estate construction loans: | | | | | | | |
| | Commercial Real Estate business line (a) | | $ | 2,988 | | $ | 3,831 | |
| | Other business lines (b) | | | 473 | | | 646 | |
| | | | | | |
| | | Total real estate construction loans | | | 3,461 | | | 4,477 | |
Commercial mortgage loans: | | | | | | | |
| | Commercial Real Estate business line (a) | | | 1,824 | | | 1,619 | |
| | Other business lines (b) | | | 8,633 | | | 8,870 | |
| | | | | | |
| | | Total commercial mortgage loans | | | 10,457 | | | 10,489 | |
| | | | | | |
| | | Total commercial real estate loans | | $ | 13,918 | | $ | 14,966 | |
| | | | | | |
Total unused commitments on commercial real estate loans | | $ | 1,249 | | $ | 3,549 | |
| | | | | | |
- (a)
- Primarily loans to real estate investors and developers.
- (b)
- Primarily loans secured by owner-occupied real estate.
100
Table of Contents
NOTES TO CONSOLIDATED FINANCIAL STATEMENTS
Comerica Incorporated and Subsidiaries
Note 8 — Premises and Equipment
A summary of premises and equipment by major category follows:
| | | | | | | | |
| | December 31 | |
|---|
| | 2009 | | 2008 | |
|---|
| | (in millions)
| |
|---|
Land | | $ | 93 | | $ | 92 | |
Buildings and improvements | | | 754 | | | 753 | |
Furniture and equipment | | | 508 | | | 494 | |
| | | | | | |
| | Total cost | | | 1,355 | | | 1,339 | |
Less: Accumulated depreciation and amortization | | | (711 | ) | | (656 | ) |
| | | | | | |
| | Net book value | | $ | 644 | | $ | 683 | |
| | | | | | |
The Corporation conducts a portion of its business from leased facilities and leases certain equipment. Rental expense for leased properties and equipment amounted to $84 million, $76 million and $65 million in 2009, 2008 and 2007, respectively. As of December 31, 2009, future minimum payments under operating leases and other long-term obligations were as follows:
| | | | | |
| | Years Ending
December 31 | |
|---|
| | (in millions)
| |
|---|
2010 | | $ | 112 | |
2011 | | | 95 | |
2012 | | | 70 | |
2013 | | | 63 | |
2014 | | | 58 | |
Thereafter | | | 479 | |
| | | | |
| | Total | | $ | 877 | |
| | | | |
Note 9 — Goodwill
Goodwill is subject to impairment testing annually and on an interim basis if events or changes in circumstances between annual tests indicate the assets might be impaired. The annual test of goodwill performed as of July 1, 2009 and 2008, and the tests performed on an interim basis between those dates, did not indicate that an impairment charge was required. The impairment test performed as of July 1, 2009 utilized assumptions that incorporate the Corporation's view that the current market conditions reflected only a short-term, distressed view of recent and near-term results rather than future long-term earning capacity.
The carrying amount of goodwill for the years ended December 31, 2009, 2008 and 2007 are shown in the following table. Amounts in all periods are based on business segments in effect at December 31, 2009.
| | | | | | | | | | | | | |
| | Business
Bank | | Retail
Bank | | Wealth &
Insitutional
Management | | Total | |
|---|
| | (in millions)
| |
|---|
Balances at December 31, 2009, 2008 and 2007 | | $ | 90 | | $ | 47 | | $ | 13 | | $ | 150 | |
| | | | | | | | | | |
101
Table of Contents
NOTES TO CONSOLIDATED FINANCIAL STATEMENTS
Comerica Incorporated and Subsidiaries
Note 10 — Derivative and Credit-Related Financial Instruments
In the normal course of business, the Corporation enters into various transactions involving derivative and credit-related financial instruments to manage exposure to fluctuations in interest rate, foreign currency and other market risks and to meet the financing needs of customers. These financial instruments involve, to varying degrees, elements of credit and market risk.
Credit risk is the possible loss that may occur in the event of nonperformance by the counterparty to a financial instrument. The Corporation attempts to minimize credit risk arising from financial instruments by evaluating the creditworthiness of each counterparty, adhering to the same credit approval process used for traditional lending activities. Counterparty risk limits and monitoring procedures also facilitate the management of credit risk. Collateral is obtained, if deemed necessary, based on the results of management's credit evaluation. Collateral varies, but may include cash, investment securities, accounts receivable, equipment or real estate.
Market risk is the potential loss that may result from movements in interest rates, foreign currency exchange rates or energy commodity prices that cause an unfavorable change in the value of a financial instrument. Market risk arising from derivative instruments is reflected in the consolidated financial statements. The Corporation manages this risk by establishing monetary exposure limits and monitoring compliance with those limits. Market risk inherent in derivative instruments entered into on behalf of customers is mitigated by taking offsetting positions, except in those circumstances when the amount, tenor and/or contract rate level results in negligible economic risk. Market risk inherent in derivative instruments held or issued for risk management purposes is typically offset by changes in the fair value of the assets or liabilities being hedged.
Derivative Instruments
Derivative instruments are traded over an organized exchange or negotiated over-the-counter. Credit risk associated with exchange-traded contracts is typically assumed by the organized exchange. Over-the-counter contracts are tailored to meet the needs of the counterparties involved and, therefore, contain a greater degree of credit risk and liquidity risk than exchange-traded contracts, which have standardized terms and readily available price information. The Corporation reduces exposure to credit and liquidity risks from over-the-counter derivative instruments entered into for risk management purposes, and transactions entered into to mitigate the market risk associated with customer-initiated transactions, by conducting such transactions with investment grade domestic and foreign financial institutions and subjecting counterparties to credit approvals, limits and monitoring procedures similar to those used in making other extensions of credit.
Detailed discussions of each class of derivative instruments held or issued by the Corporation for both risk management and customer-initiated and other activities are as follows.
Interest Rate Swaps
Interest rate swaps are agreements in which two parties periodically exchange fixed cash payments for variable payments based on a designated market rate or index, or variable payments based on two different rates or indices, applied to a specified notional amount until a stated maturity. The Corporation's swap agreements are structured such that variable payments are primarily based on prime, one-month LIBOR or three-month LIBOR. These instruments are principally negotiated over-the-counter and are subject to credit risk, market risk and liquidity risk.
Foreign Exchange Contracts
Foreign exchange contracts such as futures, forwards and options are primarily entered into as a service to customers and to offset market risk arising from such positions. Futures and forward contracts require the
102
Table of Contents
NOTES TO CONSOLIDATED FINANCIAL STATEMENTS
Comerica Incorporated and Subsidiaries
delivery or receipt of foreign currency at a specified date and exchange rate. Foreign currency options allow the owner to purchase or sell a foreign currency at a specified date and price. Foreign exchange futures are exchange-traded, while forwards, swaps and most options are negotiated over-the-counter. Foreign exchange contracts expose the Corporation to both market risk and credit risk. The Corporation also uses foreign exchange rate swaps and cross-currency swaps for risk management purposes.
Interest Rate Options, Including Caps and Floors
Option contracts grant the option holder the right to buy or sell an underlying financial instrument for a predetermined price before the contract expires. Interest rate caps and floors are option-based contracts which entitle the buyer to receive cash payments based on the difference between a designated reference rate and the strike price, applied to a notional amount. Written options, primarily caps, expose the Corporation to market risk but not credit risk. A fee is received at inception for assuming the risk of unfavorable changes in interest rates. Purchased options contain both credit and market risk. All interest rate caps and floors entered into by the Corporation are over-the-counter agreements.
Energy Derivative Contracts
The Corporation offers energy derivative contracts, including over-the-counter and NYMEX-based natural gas and crude oil fixed-rate swaps and options, as a service to customers seeking to hedge market risk in the underlying products. Contract tenors are typically limited to three years to accommodate hedge requirements and are further limited to products that are liquid and available on demand. Energy derivative swaps are over-the-counter agreements in which the Corporation and the counterparty periodically exchange fixed cash payments for variable payments based upon a designated market price or index. Energy derivative contracts expose the Corporation to both credit and market risk. Energy derivative option contracts grant the option owner the right to buy or sell the underlying commodity for a predetermined price at settlement date. Energy caps, floors and collars are option-based contracts that result in the buyer and seller of the contract receiving or making cash payments based on the difference between a designated reference price and the contracted strike price, applied to a notional amount. An option fee or premium is received by the Corporation at inception for assuming the risk of unfavorable changes in energy commodity prices. Purchased options contain both credit and market risk. Commodity options entered into by the Corporation are over-the-counter agreements.
Commitments
The Corporation also enters into commitments to purchase or sell earning assets for risk management and trading purposes. These transactions are similar in nature to forward contracts.
103
Table of Contents
NOTES TO CONSOLIDATED FINANCIAL STATEMENTS
Comerica Incorporated and Subsidiaries
The following table presents the composition of the Corporation's derivative instruments, excluding commitments, held or issued for risk management purposes or in connection with customer-initiated and other activities at December 31, 2009 and 2008.
| | | | | | | | | | | | | | | | | | | | | | |
| | December 31, 2009 | | December 31, 2008 | |
|---|
| |
| | Fair Value (a) | |
| | Fair Value (a) | |
|---|
| | Notional/
Contract
Amount (b) | | Asset
Derivatives
(Unrealized
Gains) (c) | | Liability
Derivatives
(Unrealized
Losses) | | Notional/
Contract
Amount (b) | | Asset
Derivatives
(Unrealized
Gains) (c) | | Liability
Derivatives
(Unrealized
Losses) | |
|---|
| | (in millions)
| |
|---|
Risk management purposes | | | | | | | | | | | | | | | | | | | |
| | Derivatives designated as hedging instruments | | | | | | | | | | | | | | | | | | | |
| | | Interest rate contracts: | | | | | | | | | | | | | | | | | | | |
| | | | Swaps — cash flow — receive fixed/pay floating | | $ | 1,700 | | $ | 30 | | $ | — | | $ | 1,700 | | $ | 50 | | $ | — | |
| | | | Swaps — fair value — receive fixed/pay floating | | | 1,600 | | | 194 | | | — | | | 1,700 | | | 346 | | | — | |
| | | | | | | | | | | | | | |
| | Total risk management interest rate swaps designated as hedging instruments | | | 3,300 | | | 224 | | | — | | | 3,400 | | | 396 | | | — | |
| | | | | | | | | | | | | | |
| | Derivatives used as economic hedges | | | | | | | | | | | | | | | | | | | |
| | | Foreign exchange contracts: | | | | | | | | | | | | | | | | | | | |
| | | | Spot and forwards | | | 252 | | | — | | | 1 | | | 531 | | | 5 | | | 9 | |
| | | | Swaps | | | 1 | | | — | | | — | | | 13 | | | 3 | | | — | |
| | | | | | | | | | | | | | |
| | Total risk management foreign exchange contracts used as economic hedges | | | 253 | | | — | | | 1 | | | 544 | | | 8 | | | 9 | |
| | | | | | | | | | | | | | |
Total risk management purposes | | $ | 3,553 | | $ | 224 | | $ | 1 | | $ | 3,944 | | $ | 404 | | $ | 9 | |
| | | | | | | | | | | | | | |
Customer-initiated and other activities | | | | | | | | | | | | | | | | | | | |
| | Interest rate contracts: | | | | | | | | | | | | | | | | | | | |
| | | Caps and floors written | | $ | 1,176 | | $ | — | | $ | 10 | | $ | 1,271 | | $ | — | | $ | 14 | |
| | | Caps and floors purchased | | | 1,176 | | | 10 | | | — | | | 1,271 | | | 14 | | | — | |
| | | Swaps | | | 9,744 | | | 262 | | | 230 | | | 9,800 | | | 410 | | | 376 | |
| | | | | | | | | | | | | | |
| | Total interest rate contracts | | | 12,096 | | | 272 | | | 240 | | | 12,342 | | | 424 | | | 390 | |
| | | | | | | | | | | | | | |
| | Energy derivative contracts: | | | | | | | | | | | | | | | | | | | |
| | | Caps and floors written | | | 869 | | | — | | | 70 | | | 634 | | | — | | | 84 | |
| | | Caps and floors purchased | | | 869 | | | 70 | | | — | | | 634 | | | 84 | | | — | |
| | | Swaps | | | 599 | | | 67 | | | 66 | | | 877 | | | 101 | | | 101 | |
| | | | | | | | | | | | | | |
| | Total energy derivative contracts | | | 2,337 | | | 137 | | | 136 | | | 2,145 | | | 185 | | | 185 | |
| | | | | | | | | | | | | | |
| | Foreign exchange contracts: | | | | | | | | | | | | | | | | | | | |
| | | Spot, forwards, futures and options | | | 2,000 | | | 34 | | | 32 | | | 2,695 | | | 101 | | | 86 | |
| | | Swaps | | | 23 | | | 1 | | | 1 | | | 28 | | | 1 | | | 1 | |
| | | | | | | | | | | | | | |
| | Total foreign exchange contracts | | | 2,023 | | | 35 | | | 33 | | | 2,723 | | | 102 | | | 87 | |
| | | | | | | | | | | | | | |
Total customer-initiated and other activities | | $ | 16,456 | | $ | 444 | | $ | 409 | | $ | 17,210 | | $ | 711 | | $ | 662 | |
| | | | | | | | | | | | | | |
Total derivatives | | $ | 20,009 | | $ | 668 | | $ | 410 | | $ | 21,154 | | $ | 1,115 | | $ | 671 | |
| | | | | | | | | | | | | | |
- (a)
- Asset derivatives are included in "accrued income and other assets" and liability derivatives are included in "accrued expenses and other liabilities" in the consolidated balance sheets.
- (b)
- Notional or contract amounts, which represent the extent of involvement in the derivatives market, are used to determine the contractual cash flows required in accordance with the terms of the agreement. These amounts are typically not exchanged, significantly exceed amounts subject to credit or market risk and are not reflected in the consolidated balance sheets.
- (c)
- Unrealized gains represent receivables from derivative counterparties, and therefore expose the Corporation to credit risk. Credit risk, which excludes the effects of any collateral or netting arrangements, is measured as the cost to replace contracts in a profitable position at current market rates.
104
Table of Contents
NOTES TO CONSOLIDATED FINANCIAL STATEMENTS
Comerica Incorporated and Subsidiaries
By purchasing and writing derivative contracts, the Corporation is exposed to credit risk if the counterparties fail to perform. The Corporation minimizes credit risk through credit approvals, limits, monitoring procedures and collateral requirements. Nonperformance risk, including credit risk, is included in the determination of net fair value. Customer-initiated derivative instruments with a fair value of $444 million at December 31, 2009 were net of credit-related adjustments totaling $4 million.
Bilateral collateral agreements with counterparties reduce credit risk by providing for the daily exchange of cash or highly rated securities issued by the U.S. Treasury or other U.S. government agencies to collateralize amounts due to either party. At December 31, 2009, counterparties had pledged marketable investment securities to secure approximately 75 percent of the fair value of contracts with bilateral collateral agreements in an unrealized gain position. In addition, at December 31, 2009, master netting arrangements were in place with substantially all interest rate and energy swap counterparties and certain foreign exchange counterparties. These arrangements effectively reduce credit risk by permitting settlement, on a net basis, of contracts entered into with the same counterparty.
The aggregate fair value of all derivative instruments with credit-risk-related contingent features that were in a liability position on December 31, 2009 was $144 million, for which the Corporation had assigned collateral of $128 million in the normal course of business. The credit-risk-related contingent features require the Corporation's debt to maintain an investment grade credit rating from each of the major credit rating agencies. If the Corporation's debt were to fall below investment grade, the counterparties to the derivative instruments could require additional overnight collateral on derivative instruments in net liability positions. If the credit-risk-related contingent features underlying these agreements had been triggered on December 31, 2009, the Corporation would have been required to assign an additional $25 million of collateral to its counterparties.
The Corporation had commitments to purchase $19 million of investment securities for its trading account portfolio at December 31, 2009 and $1.3 billion of investment securities for its available-for-sale and trading account portfolios at December 31, 2008. Commitments to sell investment securities related to the trading account portfolio totaled $19 million and $10 million at December 31, 2009 and 2008, respectively. Outstanding commitments expose the Corporation to both credit and market risk.
Risk Management
As an end-user, the Corporation employs a variety of financial instruments for risk management purposes. Activity related to these instruments is centered predominantly in the interest rate markets and mainly involves interest rate swaps. Various other types of instruments also may be used to manage exposures to market risks, including interest rate caps and floors, total return swaps, foreign exchange forward contracts and foreign exchange swap agreements.
As part of a fair value hedging strategy, the Corporation entered into interest rate swap agreements for interest rate risk management purposes. These interest rate swap agreements effectively modify the Corporation's exposure to interest rate risk by converting fixed-rate debt and deposits to a floating rate. These agreements involve the receipt of fixed-rate interest amounts in exchange for floating-rate interest payments over the life of the agreement, without an exchange of the underlying principal amount.
Risk management fair value interest rate swaps generated net interest income of $61 million and $43 million for the years ended December 31, 2009 and 2008, respectively.
105
Table of Contents
NOTES TO CONSOLIDATED FINANCIAL STATEMENTS
Comerica Incorporated and Subsidiaries
The net gains (losses) recognized in other noninterest income (i.e., the ineffective portion) in the consolidated statements of income on risk management derivatives designated as fair value hedges of fixed-rate debt and deposits were as follows.
| | | | | | | |
| | Years Ended December 31 | |
|---|
| | 2009 | | 2008 | |
|---|
| | (in millions)
| |
|---|
Interest rate swaps | | $ | (4 | ) | $ | 9 | |
As part of a cash flow hedging strategy, the Corporation entered into predominantly two-year interest rate swap agreements (weighted-average original maturity of 2.2 years) that effectively convert a portion of existing and forecasted floating-rate loans to a fixed-rate basis, thus reducing the impact of interest rate changes on future interest income over the life of the agreements (currently over the next 15 months). Approximately four percent ($1.7 billion) of the Corporation's outstanding loans were designated as hedged items to interest rate swap agreements at December 31, 2009. If interest rates, interest yield curves and notional amounts remain at current levels, the Corporation expects to reclassify $16 million of net gains, net of tax, on derivative instruments designated as cash flow hedges from accumulated other comprehensive income (loss) to earnings during the next twelve months due to receipt of variable interest associated with existing and forecasted floating-rate loans.
The net gains (losses) recognized in income and OCI on risk management derivatives designated as cash flow hedges of loans for the years ended December 31, 2009 and 2008 are displayed in the table below.
| | | | | | | | |
| | Years Ended December 31 | |
|---|
| | 2009 | | 2008 | |
|---|
| | (in millions)
| |
|---|
Interest rate swaps | | | | | | | |
| | Gain recognized in OCI (effective portion) | | $ | 15 | | $ | 69 | |
| | Gain (loss) recognized in other noninterest income (ineffective portion) | | | (2 | ) | | — | |
| | Gain reclassified from accumulated OCI into interest and fees on loans (effective portion) | | | 34 | | | 24 | |
Foreign exchange rate risk arises from changes in the value of certain assets and liabilities denominated in foreign currencies. The Corporation employs spot and forward contracts in addition to swap contracts to manage exposure to these and other risks.
The net gains (losses) recognized in other noninterest income in the consolidated statements of income on risk management derivative instruments used as economic hedges were as follows.
| | | | | | | |
| | Years Ended December 31 | |
|---|
| | 2009 | | 2008 | |
|---|
| | (in millions)
| |
|---|
Foreign exchange contracts | | $ | (1 | ) | $ | — | |
106
Table of Contents
NOTES TO CONSOLIDATED FINANCIAL STATEMENTS
Comerica Incorporated and Subsidiaries
The following table summarizes the expected weighted average remaining maturity of the notional amount of risk management interest rate swaps and the weighted average interest rates associated with amounts expected to be received or paid on interest rate swap agreements as of December 31, 2009 and 2008.
| | | | | | | | | | | | | | | |
| |
| | Weighted Average | |
|---|
| | Notional
Amount | | Remaining
Maturity
(in years) | | Receive
Rate | | Pay
Rate (a) | |
|---|
| | (dollar amounts in millions)
| |
|---|
December 31, 2009 | | | | | | | | | | | | | |
Swaps — cash flow — receive fixed/pay floating rate: | | | | | | | | | | | | | |
| | Variable rate loan designation | | $ | 1,700 | | | 0.9 | | | 5.22 | % | | 3.25 | % |
Swaps — fair value — receive fixed/pay floating rate: | | | | | | | | | | | | | |
| | Medium- and long-term debt designation | | | 1,600 | | | 8.1 | | | 5.73 | | | 1.01 | |
| | | | | | | | | | | | | |
| | | Total risk management interest rate swaps | | $ | 3,300 | | | | | | | | | | |
| | | | | | | | | | | | | |
December 31, 2008 | | | | | | | | | | | | | |
Swaps — cash flow — receive fixed/pay floating rate: | | | | | | | | | | | | | |
| | Variable rate loan designation | | $ | 1,700 | | | 1.9 | | | 5.22 | % | | 3.56 | % |
Swaps — fair value — receive fixed/pay floating rate: | | | | | | | | | | | | | |
| | Medium- and long-term debt designation | | | 1,700 | | | 8.6 | | | 5.75 | | | 3.34 | |
| | | | | | | | | | | | | |
| | | Total risk management interest rate swaps | | $ | 3,400 | | | | | | | | | | |
| | | | | | | | | | | | | |
- (a)
- Variable rates paid on receive fixed swaps are based on prime and LIBOR (with various maturities) rates in effect at December 31, 2009.
Management believes these hedging strategies achieve the desired relationship between the rate maturities of assets and funding sources which, in turn, reduce the overall exposure of net interest income to interest rate risk, although there can be no assurance that such strategies will be successful. The Corporation employs cash instruments, such as investment securities, as well as various types of derivative instruments to manage exposure to interest rate risk and other risks. Such instruments may include interest rate caps and floors, foreign exchange forward contracts, investment securities, foreign exchange option contracts and foreign exchange cross-currency swaps.
Customer-Initiated and Other Activities
Fee income is earned from entering into various transactions at the request of customers (customer-initiated contracts), principally foreign exchange contracts, interest rate contracts and energy derivative contracts. The Corporation mitigates market risk inherent in customer-initiated interest rate and energy contracts by taking offsetting positions, except in those circumstances when the amount, tenor and/or contracted rate level results in negligible economic risk, whereby the cost of purchasing an offsetting contract is not economically justifiable. For customer-initiated foreign exchange contracts, the Corporation mitigates most of the inherent market risk by taking offsetting positions and manages the remainder through individual foreign currency position limits and aggregate value-at-risk limits. These limits are established annually and reviewed quarterly.
For those customer-initiated derivative contracts which were not offset or where the Corporation holds a speculative position within the limits described above, the Corporation recognized, in "other noninterest income" in the consolidated statements of income, net gains of $1 million, $2 million and $1 million for the years ended December 31, 2009, 2008 and 2007, respectively.
107
Table of Contents
NOTES TO CONSOLIDATED FINANCIAL STATEMENTS
Comerica Incorporated and Subsidiaries
Fair values of customer-initiated and other derivative instruments represent the net unrealized gains or losses on such contracts and are recorded in the consolidated balance sheets. Changes in fair value are recognized in the consolidated statements of income. The net gains recognized in income on customer-initiated and other derivative instruments were as follows.
| | | | | | | | | |
| |
| | Years Ended December 31 | |
|---|
| | Location of Gain | | 2009 | | 2008 | |
|---|
| |
| | (in millions)
| |
|---|
Interest rate contracts | | Other noninterest income | | $ | 8 | | $ | 15 | |
Energy derivative contracts | | Other noninterest income | | | 1 | | | 1 | |
Foreign exchange contracts | | Foreign exchange income | | | 34 | | | 40 | |
| | | | | | | | |
Total | | | | $ | 43 | | $ | 56 | |
| | | | | | | | |
Credit-Related Financial Instruments
The Corporation issues off-balance sheet financial instruments in connection with commercial and consumer lending activities. The Corporation's credit risk associated with these instruments is represented by the contractual amounts indicated in the following table.
| | | | | | | | |
| | December 31 | |
|---|
| | 2009 | | 2008 | |
|---|
| | (in millions)
| |
|---|
Unused commitments to extend credit: | | | | | | | |
| | Commercial and other | | $ | 22,451 | | $ | 25,901 | |
| | Bankcard, revolving check credit and home equity loan commitments | | | 1,917 | | | 2,124 | |
| | | | | | |
| | Total unused commitments to extend credit | | $ | 24,368 | | $ | 28,025 | |
| | | | | | |
Standby letters of credit | | $ | 5,652 | | $ | 6,204 | |
Commercial letters of credit | | | 104 | | | 156 | |
Other financial guarantees | | | 18 | | | 36 | |
The Corporation maintains an allowance to cover probable credit losses inherent in lending-related commitments, including unused commitments to extend credit, letters of credit and financial guarantees. At December 31, 2009 and 2008, the allowance for credit losses on lending-related commitments, included in "accrued expenses and other liabilities" on the consolidated balance sheets, was $37 million and $38 million, respectively.
Unused Commitments to Extend Credit
Commitments to extend credit are legally binding agreements to lend to a customer, provided there is no violation of any condition established in the contract. These commitments generally have fixed expiration dates or other termination clauses and may require payment of a fee. Since many commitments expire without being drawn upon, the total contractual amount of commitments does not necessarily represent future cash requirements of the Corporation. Commercial and other unused commitments are primarily variable rate commitments.
108
Table of Contents
NOTES TO CONSOLIDATED FINANCIAL STATEMENTS
Comerica Incorporated and Subsidiaries
Standby and Commercial Letters of Credit and Financial Guarantees
Standby and commercial letters of credit represent conditional obligations of the Corporation which guarantee the performance of a customer to a third party. Standby letters of credit are primarily issued to support public and private borrowing arrangements, including commercial paper, bond financing and similar transactions. Commercial letters of credit are issued to finance foreign or domestic trade transactions and are short-term in nature. These contracts expire in decreasing amounts through the year 2019. The Corporation may enter into participation arrangements with third parties, which effectively reduce the maximum amount of future payments which may be required under standby and commercial letters of credit. These risk participations covered $404 million of the $5.8 billion standby and commercial letters of credit outstanding at December 31, 2009.
Financial guarantees at December 31, 2009 consisted of credit risk participation agreements, where the Corporation, primarily as part of a syndicated lending arrangement, guaranteed a portion of the credit risk on an interest rate swap agreement between the lead bank in the syndicate and a customer. In the event of default by a customer, the Corporation would be required to pay the portion of the unpaid amount guaranteed by the Corporation to the lead bank. At December 31, 2009, the estimated fair value of the Corporation's credit risk participation agreements where the Corporation was the guarantor was $18 million, and the estimated credit exposure was $27 million. The estimated credit exposure includes the estimated credit risk as of December 31, 2009, in addition to an estimate for potential future risk for changes in interest rates in each remaining year of the contract until maturity. In addition, the estimated credit exposure assumes the lead bank would be unable to liquidate assets of the customers. In the event of default, the lead bank has the ability to liquidate the assets of the customer, in which case the lead bank would be required to return a percentage of recouped assets to the participating banks. These credit risk participation agreements expire in decreasing amounts through the year 2016, with a weighted average remaining maturity for outstanding agreements of 1.6 years.
At December 31, 2009, the carrying value of the Corporation's standby and commercial letters of credit and financial guarantees, included in "accrued expenses and other liabilities" on the consolidated balance sheet, totaled $70 million.
The following table presents a summary of total internally classified watch list standby and commercial letters of credit and financial guarantees (generally consistent with regulatory defined special mention, substandard and doubtful) at December 31, 2009 and 2008. The Corporation manages credit risk through underwriting, periodically reviewing and approving its credit exposures using Board committee approved credit policies and guidelines.
| | | | | | | |
| | December 31 | |
|---|
| | 2009 | | 2008 | |
|---|
| | (dollar amounts
in millions)
| |
|---|
Total watch list standby and commercial letters of credit | | $ | 432 | | $ | 277 | |
As a percentage of total outstanding standby and commercial letters of credit | | | 7.5 | % | | 4.3 | % |
Total watch list financial guarantees | | $ | 1 | | $ | — | |
As a percentage of total outstanding financial guarantees | | | 5.8 | % | | — | % |
109
Table of Contents
NOTES TO CONSOLIDATED FINANCIAL STATEMENTS
Comerica Incorporated and Subsidiaries
Note 11 — Variable Interest Entities (VIEs)
The Corporation evaluates its interest in certain entities to determine if these entities meet the definition of a VIE and whether the Corporation was the primary beneficiary and should consolidate the entity based on the variable interests it held. The following provides a summary of the VIEs in which the Corporation has a significant interest.
The Corporation owns 100 percent of the common stock of an entity formed in 2007 to issue trust preferred securities. This entity meets the definition of a VIE, but the Corporation is not the primary beneficiary as the expected losses and residual returns of the trust are absorbed by the trust preferred stock holders. The trust preferred securities held by this entity ($500 million at December 31, 2009) qualify as Tier 1 capital and are classified as subordinated debt included in "medium- and long-term debt" on the consolidated balance sheets, with associated interest expense recorded in "interest on medium- and long-term debt" on the consolidated statements of income. The Corporation is not exposed to loss related to this VIE.
The Corporation has limited partnership interests in three private equity investment partnerships, which were acquired in 1998, 1999 and 2001, where the general partner (an employee of the Corporation) in these three partnerships is considered a related party to the Corporation. These entities meet the definition of a VIE; however, the Corporation is not the primary beneficiary of the entities, as the majority of variable interests are expected to accrue to the nonaffiliated limited partners. As such, the Corporation accounts for its interest in these partnerships on the cost method. Investments are included in "accrued income and other assets" on the consolidated balance sheets, with income (net of write-downs) recorded in "other noninterest income" on the consolidated statements of income. These entities had approximately $108 million in assets at December 31, 2009. These funds generally cannot be redeemed. Distributions from these funds are received by the Corporation as the result of liquidation of underlying investments of the funds and/or as income distributions. Exposure to loss as a result of involvement with these entities at December 31, 2009 was limited to the book basis of the Corporation's investments of approximately $4 million and approximately $1 million of commitments for future investments.
The Corporation, as a limited partner, also holds an insignificant ownership percentage interest in 130 other private equity and venture capital investment partnerships where the Corporation is not related to the general partner. While these entities may meet the definition of a VIE, the Corporation is not the primary beneficiary of any of these entities as a result of its insignificant ownership interest. The Corporation accounts for its interests in these partnerships on the cost method. Investments are included in "accrued income and other assets" on the consolidated balance sheets with income (net of write-downs) recorded in "other noninterest income" on the consolidated statements of income. These funds generally cannot be redeemed. Distributions from these funds are received by the Corporation as the result of liquidation of underlying investments of the funds and/or as income distributions. Exposure to loss as a result of involvement with these entities at December 31, 2009 was limited to the book basis of the Corporation's investments of approximately $53 million and approximately $25 million of commitments for future investments.
A limited liability subsidiary of the Corporation is the general partner in an investment fund partnership formed in 2003. The subsidiary manages the investments held by the fund and the investment partnership meets the definition of a VIE. The Corporation is the primary beneficiary and consolidates the entity, as the majority of the variable interests are expected to accrue to the Corporation. The investment partnership had assets of approximately $2 million at December 31, 2009 and was structured so that the Corporation's exposure to loss as a result of its interest would be limited to the book basis of the Corporation's investment in the limited liability subsidiary, which was insignificant at December 31, 2009. Total fee revenue earned by the Corporation as
110
Table of Contents
NOTES TO CONSOLIDATED FINANCIAL STATEMENTS
Comerica Incorporated and Subsidiaries
general partner for the fund was insignificant (less than $0.1 million) for each of the years ended December 31, 2009, 2008 and 2007.
The Corporation has a significant limited partnership interest in 20 low income housing tax credit/historic rehabilitation tax credit partnerships, acquired at various times from 1992 through 2008. These entities meet the definition of a VIE; however, the Corporation is not the primary beneficiary of the entities as the majority of the variable interests are expected to accrue to the general partner, who is also the party engaging in activities that are most closely associated with the entities. The Corporation accounts for its interest in these partnerships on the cost or equity method. These entities had approximately $142 million in assets at December 31, 2009. Exposure to loss as a result of the Corporation's involvement with these entities at December 31, 2009 was limited to the book basis of the Corporation's investment of approximately $8 million, which includes unused commitments for future investments.
The Corporation, as a limited partner, also holds an insignificant ownership percentage interest in 119 other low income housing tax credit/historic rehabilitation tax credit partnerships. While these entities may meet the definition of a VIE, the Corporation is not the primary beneficiary of any of these entities as a result of its insignificant ownership interest. As such, the Corporation accounts for its interest in these partnerships on the cost or equity method. Exposure to loss as a result of its involvement with these entities at December 31, 2009 was limited to the book basis of the Corporation's investment of approximately $328 million, which includes unused commitments for future investments.
As a limited partner, the Corporation obtains income tax credits and deductions from the operating losses of these low income housing tax credit/historic rehabilitation tax credit partnerships, which are recorded as a reduction of income tax expense (or an increase to income tax benefit) and a reduction of federal income taxes payable. These income tax credits and deductions are allocated to the funds' investors based on their ownership percentages. Investment balances, including all legally binding commitments to fund future investments, are included in "accrued income and other assets" on the consolidated balance sheets, with amortization and other write-downs of investments recorded in "other noninterest income" on the consolidated statements of income. In addition, a liability is recognized in "accrued expenses and other liabilities" on the consolidated balance sheets for all legally binding unfunded commitments to fund low income housing partnerships ($63 million at December 31, 2009).
The Corporation provided no financial or other support that was not contractually required to any of the above VIEs during the year ended December 31, 2009.
The following table summarizes the impact of these VIEs on line items on the Corporation's consolidated statements of income.
| | | | | | | |
| | Years Ended
December 31 | |
|---|
| | 2009 | | 2008 | |
|---|
| | (in millions)
| |
|---|
Classfication in Earnings | | | | | | | |
Interest on medium- and long-term debt | | $ | 34 | | $ | 34 | |
Other noninterest income | | | (60 | ) | | (53 | ) |
Provision (benefit) for income taxes (a) | | | (46 | ) | | (45 | ) |
- (a)
- Income tax credits from low income housing tax credit/historic rehabilitation tax credit partnerships.
For further information on the Corporation's consolidation policy, see Note 1.
111
Table of Contents
NOTES TO CONSOLIDATED FINANCIAL STATEMENTS
Comerica Incorporated and Subsidiaries
Note 12 — Deposits
At December 31, 2009, the scheduled maturities of certificates of deposit and other deposits with a stated maturity were as follows:
| | | | | |
| | Years Ending
December 31 | |
|---|
| | (in millions)
| |
|---|
2010 | | $ | 7,146 | |
2011 | | | 633 | |
2012 | | | 88 | |
2013 | | | 51 | |
2014 | | | 43 | |
Thereafter | | | 41 | |
| | | | |
| | Total | | $ | 8,002 | |
| | | | |
A maturity distribution of domestic certificates of deposit of $100,000 and over follows:
| | | | | | | | |
| | December 31 | |
|---|
| | 2009 | | 2008 | |
|---|
| | (in millions)
| |
|---|
Three months or less | | $ | 1,657 | | $ | 3,834 | |
Over three months to six months | | | 1,142 | | | 2,152 | |
Over six months to twelve months | | | 1,333 | | | 5,211 | |
Over twelve months | | | 536 | | | 1,234 | |
| | | | | | |
| | Total | | $ | 4,668 | | $ | 12,431 | |
| | | | | | |
All foreign office time deposits of $542 million and $470 million at December 31, 2009 and 2008, respectively, were in denominations of $100,000 or more.
112
Table of Contents
NOTES TO CONSOLIDATED FINANCIAL STATEMENTS
Comerica Incorporated and Subsidiaries
Note 13 — Short-Term Borrowings
Federal funds purchased and securities sold under agreements to repurchase generally mature within one to four days from the transaction date. Other short-term borrowings, which may consist of Federal Reserve Term Auction Facility borrowings, commercial paper, borrowed securities, term federal funds purchased, short-term notes and treasury tax and loan deposits, generally mature within one to 120 days from the transaction date. The following table provides a summary of short-term borrowings.
| | | | | | | | |
| | Federal Funds Purchased
and Securities Sold Under
Agreements to Repurchase | | Other
Short-term
Borrowings | |
|---|
| | (dollar amounts in millions)
| |
|---|
December 31, 2009 | | | | | | | |
| | Amount outstanding at year-end | | $ | 462 | | $ | — | |
| | Weighted average interest rate at year-end | | | 0.03 | % | | — | % |
| | Maximum month-end balance during the year | | $ | 655 | | $ | 2,558 | |
| | Average balance outstanding during the year | | | 467 | | | 532 | |
| | Weighted average interest rate during the year | | | 0.19 | % | | 0.28 | % |
December 31, 2008 | | | | | | | |
| | Amount outstanding at year-end | | $ | 696 | | $ | 1,053 | |
| | Weighted average interest rate at year-end | | | 0.37 | % | | 0.40 | % |
| | Maximum month-end balance during the year | | $ | 3,617 | | $ | 3,046 | |
| | Average balance outstanding during the year | | | 2,105 | | | 1,658 | |
| | Weighted average interest rate during the year | | | 2.20 | % | | 2.43 | % |
December 31, 2007 | | | | | | | |
| | Amount outstanding at year-end | | $ | 1,749 | | $ | 1,058 | |
| | Weighted average interest rate at year-end | | | 1.84 | % | | 3.87 | % |
| | Maximum month-end balance during the year | | $ | 1,985 | | $ | 1,191 | |
| | Average balance outstanding during the year | | | 1,854 | | | 226 | |
| | Weighted average interest rate during the year | | | 5.04 | % | | 5.21 | % |
At December 31, 2009, Comerica Bank (the Bank), a subsidiary of the Corporation, had pledged loans totaling $11 billion which provided for up to $7 billion of collateralized borrowing with the FRB.
113
Table of Contents
NOTES TO CONSOLIDATED FINANCIAL STATEMENTS
Comerica Incorporated and Subsidiaries
Note 14 — Medium- and Long-Term Debt
Medium- and long-term debt are summarized as follows:
| | | | | | | | |
| | December 31 | |
|---|
| | 2009 | | 2008 | |
|---|
| | (in millions)
| |
|---|
Parent company | | | | | | | |
Subordinated notes: | | | | | | | |
| | 4.80% subordinated note due 2015 | | $ | 325 | | $ | 342 | |
| | 6.576% subordinated notes due 2037 | | | 511 | | | 510 | |
| | | | | | |
Total subordinated notes | | | 836 | | | 852 | |
Medium-term note: | | | | | | | |
| | Floating rate based on LIBOR indices due 2010 | | | 150 | | | 150 | |
| | | | | | |
Total parent company | | | 986 | | | 1,002 | |
Subsidiaries | | | | | | | |
Subordinated notes: | | | | | | | |
| | 8.50% subordinated note due 2009 | | | — | | | 101 | |
| | 7.125% subordinated note due 2010 | | | 152 | | | 149 | |
| | 5.70% subordinated note due 2014 | | | 275 | | | 286 | |
| | 5.75% subordinated notes due 2016 | | | 678 | | | 701 | |
| | 5.20% subordinated notes due 2017 | | | 543 | | | 592 | |
| | 8.375% subordinated note due 2024 | | | 187 | | | 207 | |
| | 7.875% subordinated note due 2026 | | | 204 | | | 246 | |
| | | | | | |
Total subordinated notes | | | 2,039 | | | 2,282 | |
Medium-term notes: | | | | | | | |
| | Floating rate based on LIBOR indices due 2009 to 2012 | | | 1,982 | | | 3,669 | |
| | Floating rate based on Federal Funds indices due 2009 | | | — | | | 100 | |
Federal Home Loan Bank advances: | | | | | | | |
| | Floating rate based on LIBOR indices due 2009 to 2014 | | | 6,000 | | | 8,000 | |
Other notes: | | | | | | | |
| | 6.0% — 6.4% fixed rate notes due 2020 | | | 53 | | | — | |
| | | | | | |
Total subsidiaries | | | 10,074 | | | 14,051 | |
| | | | | | |
Total medium- and long-term debt | | $ | 11,060 | | $ | 15,053 | |
| | | | | | |
The carrying value of medium- and long-term debt has been adjusted to reflect the gain or loss attributable to the risk hedged. Concurrent with or subsequent to the issuance of certain of the medium- and long-term debt
114
Table of Contents
NOTES TO CONSOLIDATED FINANCIAL STATEMENTS
Comerica Incorporated and Subsidiaries
presented above, the Corporation entered into interest rate swap agreements to convert the stated rate of the debt to a rate based on the indices identified in the following table.
| | | | | | | | | | | |
| | Principal Amount
of Debt
Converted | | Base Rate | | Base
Rate at
12/31/09 | |
|---|
| | (dollar amounts in millions)
| |
|---|
Parent company | | | | | | | | | | |
| | 4.80% subordinated note due 2015 | | $ | 300 | | | 6-month LIBOR | | | 4.34 | % |
Subsidiaries | | | | | | | | | | |
| | 5.70% subordinated note due 2014 | | | 250 | | | 6-month LIBOR | | | 4.34 | |
| | 5.75% subordinated notes due 2016 | | | 250 | | | 6-month LIBOR | | | 4.34 | |
| | 5.20% subordinated notes due 2017 | | | 500 | | | 6-month LIBOR | | | 4.34 | |
| | 8.375% subordinated note due 2024 | | | 150 | | | 6-month LIBOR | | | 4.34 | |
| | 7.875% subordinated note due 2026 | | | 150 | | | 6-month LIBOR | | | 4.34 | |
The Bank is a member of the FHLB, which provides short- and long-term funding collateralized by mortgage-related assets to its members. FHLB advances bear interest at variable rates based on LIBOR and were secured by $2.8 billion of real estate-related loans and $3.2 billion of mortgage-backed investment securities at December 31, 2009. The FHLB advances outstanding at December 31, 2009 are due from 2010 to 2014. The advances do not qualify as Tier 2 capital and are not insured by the Federal Deposit Insurance Corporation (FDIC).
In 2009, the Bank repurchased, at a discount, $212 million of floating-rate medium-term notes maturing in 2012 and recognized a gain of $15 million. In January 2010, the Bank exercised its option to redeem a $150 million, 7.125% subordinated note, which had an original maturity date of 2013.
The Corporation has $500 million of 6.576% subordinated notes maturing in 2037 that relate to trust preferred securities issued by an unconsolidated subsidiary. The 6.576% subordinated notes qualify as Tier 1 capital. All other subordinated notes with maturities greater than one year qualify as Tier 2 capital.
The Corporation currently has a $15 billion medium-term senior note program. This program allows the principal banking subsidiary to issue fixed- or floating-rate notes with maturities between one year and 30 years. The Bank did not issue any notes under the senior note program during the years ended December 31, 2009 and 2008. The interest rate on the floating rate medium-term notes based on LIBOR at December 31, 2009, ranged from one-month LIBOR plus 0.10% to three-month LIBOR plus 0.15%. The medium-term notes outstanding at December 31, 2009 are due from 2010 to 2012. The medium-term notes do not qualify as Tier 2 capital and are not insured by the FDIC.
The Bank participated in the voluntary Temporary Liquidity Guarantee Program (the TLG Program) announced by the Federal Deposit Insurance Corporation (FDIC) in October 2008 and amended in March 2009. Under the TLG Program, all senior unsecured debt issued between October 14, 2008 and October 31, 2009, with a maturity of more than 30 days, is guaranteed by the FDIC. Debt guaranteed by the FDIC is backed by the full faith and credit of the United States. The FDIC guarantee expires on the earlier of the maturity date of the debt or December 31, 2012 (June 30, 2012 for debt issued prior to April 1, 2009). At December 31, 2009, there was approximately $7 million of senior unsecured debt outstanding in the form of bank-to-bank deposits issued under the TLG Program.
115
Table of Contents
NOTES TO CONSOLIDATED FINANCIAL STATEMENTS
Comerica Incorporated and Subsidiaries
At December 31, 2009, the principal maturities of medium- and long-term debt were as follows:
| | | | | |
| | Years Ending December 31 | |
|---|
| | (in millions)
| |
|---|
2010 | | $ | 2,750 | |
2011 | | | 1,375 | |
2012 | | | 1,158 | |
2013 | | | 2,000 | |
2014 | | | 1,250 | |
Thereafter | | | 2,318 | |
| | | | |
| | Total | | $ | 10,851 | |
| | | | |
Note 15 — Shareholders' Equity
In November 2007, the Board of Directors of the Corporation (the Board) authorized the purchase of up to 10 million shares of Comerica Incorporated outstanding common stock, in addition to the remaining unfilled portion of the November 2006 authorization. There is no expiration date for the Corporation's share repurchase program. Substantially all shares purchased as part of the Corporation's publicly announced repurchase program were transacted in the open market and were within the scope of Rule 10b-18, which provides a safe harbor for purchases in a given day if an issuer of equity securities satisfies the manner, timing, price and volume conditions of the rule when purchasing its own common shares in the open market. There were no open market repurchases in 2009 and 2008. Open market repurchases totaled 10.0 million shares for the year ended December 31, 2007. The following table summarizes the Corporation's share repurchase activity for the year ended December 31, 2009.
| | | | | | | | | | | | | | |
| | Total Number of Shares
Purchased as Part of Publicly
Announced Repurchase Plans
or Programs | | Remaining Share
Repurchase
Authorization (a) | | Total Number
of Shares
Purchased (b) | | Average Price
Paid Per Share | |
|---|
| | (shares in thousands)
| |
|---|
Total first quarter 2009 | | | — | | | 12,576 | | | 65 | | $ | 15.11 | |
| | | | | | | | | | |
Total second quarter 2009 | | | — | | | 12,576 | | | 32 | | | 20.56 | |
| | | | | | | | | | |
Total third quarter 2009 | | | — | | | 12,576 | | | 3 | | | 23.88 | |
| | | | | | | | | | |
October 2009 | | | — | | | 12,576 | | | 1 | | | 28.55 | |
November 2009 | | | — | | | 12,576 | | | — | | | — | |
December 2009 | | | — | | | 12,576 | | | — | | | — | |
| | | | | | | | | | |
Total fourth quarter 2009 | | | — | | | 12,576 | | | 1 | | | 28.25 | |
| | | | | | | | | | |
| | Total 2009 | | | — | | | 12,576 | | | 101 | | $ | 17.25 | |
| | | | | | | | | | |
- (a)
- Maximum number of shares that may yet be purchased under the publicly announced plans or programs.
- (b)
- Includes shares purchased as part of publicly announced repurchase plans or programs, shares purchased pursuant to deferred compensation plans and shares purchased from employees to pay for grant prices and/or taxes related to stock option exercises and restricted stock vesting under the terms of an employee share-based compensation plan.
In 2008, the Corporation participated in the U.S. Department of Treasury (U.S. Treasury) Capital Purchase Program (the Capital Purchase Program) and received proceeds of $2.25 billion from the U.S. Treasury. In
116
Table of Contents
NOTES TO CONSOLIDATED FINANCIAL STATEMENTS
Comerica Incorporated and Subsidiaries
return, the Corporation issued 2.25 million shares of Fixed Rate Cumulative Perpetual Preferred Stock, Series F, without par value (Series F Preferred Shares) and granted a warrant to purchase 11.5 million shares of common stock at an exercise price of $29.40 per share to the U.S. Treasury. The Series F Preferred Shares pay a cumulative dividend rate of five percent per annum on the liquidation preference of $1,000 per share through November 2013, and a rate of nine percent per annum thereafter. The Series F Preferred Shares are non-voting, other than class voting rights on matters that could adversely affect the shares. The Series F Preferred Shares may be redeemed at $1,000 per share, plus accrued and unpaid dividends, subject to consultation with the Corporation's banking regulators, with the consent of the U.S. Treasury. The U.S. Treasury may transfer the Series F Preferred Shares to a third party at any time. The Series F Preferred Shares qualify as Tier 1 capital.
The warrant to purchase common stock was immediately exercisable and is not subject to contractual restrictions on transfer. The warrant qualifies as Tier 1 capital and expires in November 2018.
The proceeds from the Capital Purchase Program were allocated between the Series F Preferred Shares and the related warrant based on relative fair value, which resulted in an initial carrying value of $2.1 billion for the Series F Preferred Shares and $124 million for the warrant. The resulting discount to the Series F Preferred Shares of $124 million is accreting on a level yield basis over five years ending November 2013 and is being recognized as additional preferred stock dividends. The cash dividend combined with the accretion of the discount results in an effective preferred dividend rate of 6.3 percent. At December 31, 2009, accumulated preferred stock dividends not declared for the Series F Preferred Shares, excluding the discount accretion discussed above, totaled $14 million, or $6.39 per preferred share. The fair value assigned to the Series F Preferred Shares was estimated using a discounted cash flow model. The discount rate used in the model was based on yields on comparable publicly traded perpetual preferred stocks. The fair value assigned to the warrant was based on a binomial model using several inputs, including risk-free rate, expected stock price volatility and expected dividend yield. The risk-free interest rate assumption used in the binomial model was based on the ten-year U. S. Treasury interest rate. The expected dividend yield was based on the historical and projected dividend yield patterns of the Corporation's common shares. Expected volatility assumptions considered both the historical volatility of the Corporation's common stock over a ten-year period and implied volatility based on the most recent observed market transaction as of the valuation date.
Under the Capital Purchase Program, the consent of the U.S. Treasury is required for any increase in common dividends declared from the dividend rate in effect at the time of investment (quarterly dividend rate of $0.33 per share) and for any common share repurchases, other than common share repurchases in connection with any benefit plan in the ordinary course of business, until November 2011, unless the Series F Preferred Shares have been fully redeemed or the U.S. Treasury has transferred all the Series F Preferred Shares to third parties prior to that date. In addition, all accrued and unpaid dividends on the Series F Preferred Shares must be declared and the payment set aside for the benefit of the holders of the Series F Preferred Shares before any dividend may be declared on the Corporation's common stock and before any shares of the Corporation's common stock may be repurchased, other than share repurchases in connection with any benefit plan in the ordinary course of business.
As required by the Capital Purchase Program, the Corporation adopted the U.S. Treasury's standards for executive compensation and corporate governance for the period during which the U.S. Treasury holds equity issued under the Capital Purchase Program. These standards generally apply to the chief executive officer, the chief financial officer, and the three most highly compensated executive officers (the senior executive officers), plus the 20 most highly compensated employees. In addition, the Corporation was not allowed to deduct, for tax purposes, executive compensation in excess of $500,000 for each senior executive officer.
At December 31, 2009, the Corporation had 11.5 million shares of common stock reserved for the warrant issued under the Capital Purchase Program, 25.4 million shares of common stock reserved for stock option
117
Table of Contents
NOTES TO CONSOLIDATED FINANCIAL STATEMENTS
Comerica Incorporated and Subsidiaries
exercises and 2.1 million shares of restricted stock outstanding to employees and directors under share-based compensation plans.
Note 16 — Accumulated Other Comprehensive Income (Loss)
Other comprehensive income (loss) includes the change in net unrealized gains and losses on investment securities available-for-sale, the change in accumulated net gains and losses on cash flow hedges and the change in the accumulated defined benefit and other postretirement plans adjustment. Total comprehensive income (loss) was ($10) million, $81 million and $833 million for the years ended December 31, 2009, 2008 and 2007, respectively. The $91 million decrease in total comprehensive income for the year ended December 31, 2009, when compared to 2008, resulted principally from a decrease in net unrealized gains on investment securities available-for-sale ($260 million, after-tax) and a decrease in net income ($196 million), partially offset by a benefit from the defined benefit and other postretirement benefit plans adjustment ($405 million, after-tax). The following table presents reconciliations of the components of accumulated other comprehensive income (loss) for the years ended December 31, 2009, 2008 and 2007.
For a further discussion of the effects of investment securities available-for-sale, derivative instruments and defined benefit and other postretirement benefit plans on other comprehensive income (loss) refer to Notes 1, 10 and 19.
| | | | | | | | | | | | |
| | Years Ended
December 31 | |
|---|
| | 2009 | | 2008 | | 2007 | |
|---|
| | (in millions)
| |
|---|
Accumulated net unrealized gains (losses) on investment securities available-for-sale: | | | | | | | | | | |
| | Balance at beginning of period, net of tax | | $ | 131 | | $ | (9 | ) | $ | (61 | ) |
| | | Net unrealized holding gains arising during the period | | | 54 | | | 285 | | | 87 | |
| | | Less: Reclassification adjustment for net gains included in net income | | | 243 | | | 67 | | | 7 | |
| | | | | | | | |
| | | Change in net unrealized gains before income taxes | | | (189 | ) | | 218 | | | 80 | |
| | | Less: Provision for income taxes | | | (69 | ) | | 78 | | | 28 | |
| | | | | | | | |
| | | Change in net unrealized gains on investment securities available-for-sale, net of tax | | | (120 | ) | | 140 | | | 52 | |
| | | | | | | | |
| | Balance at end of period, net of tax | | $ | 11 | | $ | 131 | | $ | (9 | ) |
Accumulated net gains (losses) on cash flow hedges: | | | | | | | | | | |
| | Balance at beginning of period, net of tax | | $ | 30 | | $ | 2 | | $ | (48 | ) |
| | | Net cash flow hedge gains arising during the period | | | 15 | | | 69 | | | 9 | |
| | | Less: Reclassification adjustment for net gains (losses) included in net income | | | 34 | | | 24 | | | (67 | ) |
| | | | | | | | |
| | | Change in net cash flow hedge gains before income taxes | | | (19 | ) | | 45 | | | 76 | |
| | | Less: Provision for income taxes | | | (7 | ) | | 17 | | | 26 | |
| | | | | | | | |
| | | Change in net cash flow hedge gains, net of tax | | | (12 | ) | | 28 | | | 50 | |
| | | | | | | | |
| | Balance at end of period, net of tax | | $ | 18 | | $ | 30 | | $ | 2 | |
Accumulated defined benefit pension and other postretirement plans adjustment: | | | | | | | | | | |
| | Balance at beginning of period, net of tax | | $ | (470 | ) | $ | (170 | ) | $ | (215 | ) |
| | | Net defined benefit pension and other postretirement adjustment arising during the period | | | 112 | | | (488 | ) | | 41 | |
| | | Less: Adjustment for amounts recognized as components of net periodic benefit cost during the period | | | (53 | ) | | (18 | ) | | (30 | ) |
| | | | | | | | |
| | | Change in defined benefit and other postretirement plans adjustment before income taxes | | | 165 | | | (470 | ) | | 71 | |
| | | Less: Provision for income taxes | | | 60 | | | (170 | ) | | 26 | |
| | | | | | | | |
| | | Change in defined benefit and other postretirement plans adjustment, net of tax | | | 105 | | | (300 | ) | | 45 | |
| | | | | | | | |
| | Balance at end of period, net of tax | | $ | (365 | ) | $ | (470 | ) | $ | (170 | ) |
| | | | | | | | |
Total accumulated other comprehensive loss at end of period, net of tax | | $ | (336 | ) | $ | (309 | ) | $ | (177 | ) |
| | | | | | | | |
118
Table of Contents
NOTES TO CONSOLIDATED FINANCIAL STATEMENTS
Comerica Incorporated and Subsidiaries
Note 17 — Net Income (Loss) Per Common Share
Basic and diluted income (loss) from continuing operations per common share and net income (loss) per common share are presented in the following table.
| | | | | | | | | | | | |
| | Years Ended December 31 | |
|---|
| | 2009 | | 2008 | | 2007 | |
|---|
| | (in millions, except per share data)
| |
|---|
Basic and diluted | | | | | | | | | | |
| | Income from continuing operations | | $ | 16 | | $ | 212 | | $ | 682 | |
| | Less: | | | | | | | | | | |
| | | Preferred stock dividends | | | 134 | | | 17 | | | — | |
| | | Income allocated to participating securities | | | 1 | | | 4 | | | 6 | |
| | | | | | | | |
| | Income (loss) from continuing operations attributable to common shares | | $ | (119 | ) | $ | 191 | | $ | 676 | |
| | | | | | | | |
| | Net income | |
$ |
17 | |
$ |
213 | |
$ |
686 | |
| | Less: | | | | | | | | | | |
| | | Preferred stock dividends | | | 134 | | | 17 | | | — | |
| | | Income allocated to participating securities | | | 1 | | | 4 | | | 6 | |
| | | | | | | | |
| | Net income (loss) attributable to common shares | | $ | (118 | ) | $ | 192 | | $ | 680 | |
| | | | | | | | |
Basic average common shares | | |
149 | | |
149 | | |
153 | |
| | | | | | | | |
Basic income (loss) from continuing operations per common share | |
$ |
(0.80 |
) |
$ |
1.28 | |
$ |
4.43 | |
Basic net income (loss) per common share | | | (0.79 | ) | | 1.29 | | | 4.45 | |
Basic average common shares | | |
149 | | |
149 | | |
153 | |
Common stock equivalents: | | | | | | | | | | |
| | Net effect of the assumed exercise of stock options | | | — | | | — | | | 1 | |
| | Net effect of the assumed exercise of warrant | | | — | | | — | | | — | |
| | | | | | | | |
Diluted average common shares | | | 149 | | | 149 | | | 154 | |
| | | | | | | | |
Diluted income (loss) from continuing operations per common share | |
$ |
(0.80 |
) |
$ |
1.28 | |
$ |
4.40 | |
Diluted net income (loss) per common share | | | (0.79 | ) | | 1.28 | | | 4.43 | |
Basic income (loss) from continuing operations per common share and net income (loss) per common share are calculated using the two-class method. The two-class method is an earnings allocation formula that determines earnings per share for each share of common stock and participating securities according to dividends declared (distributed earnings) and participation rights in undistributed earnings. Distributed and undistributed earnings are allocated between common and participating security shareholders based on their respective rights to receive dividends. Unvested share-based payment awards that contain nonforfeitable rights to dividends or dividend equivalents are considered participating securities (i.e., nonvested restricted stock). Undistributed net losses are not allocated to nonvested restricted shareholders, as these shareholders do not have a contractual obligation to fund the losses incurred by the Corporation. Income (loss) from continuing operations attributable to common shares and net income (loss) attributable to common shares are then divided by the weighted-average number of common shares outstanding during the period.
119
Table of Contents
NOTES TO CONSOLIDATED FINANCIAL STATEMENTS
Comerica Incorporated and Subsidiaries
Diluted income (loss) from continuing operations per common share and net income (loss) per common share consider common stock issuable under the assumed exercise of stock options granted under the Corporation's stock plans and a warrant. Diluted income (loss) from continuing operations attributable to common shares and net income (loss) attributable to common shares are then divided by the total of weighted-average number of common shares and common stock equivalents outstanding during the period.
The following average shares related to outstanding options and a warrant to purchase shares of common stock were not included in the computation of diluted net income (loss) per common share because the options' and warrant's exercise prices were greater than the average market price of common shares for the period.
| | | | | | |
| | 2009 | | 2008 | | 2007 |
|---|
| | (shares in millions)
|
|---|
Average shares related to outstanding options and warrant | | 29.1 | | 19.7 | | 10.3 |
Range of exercise prices | | $28.07 – $66.81 | | $33.69 – $71.58 | | $56.00 – $71.58 |
Due to the net loss attributable to common shares reported for the year ended December 31, 2009, options to purchase 1.5 million shares, with average exercise prices less than the average market price of common shares for the period, were excluded from the computation of diluted net loss per share, as their inclusion would have been anti-dilutive.
Note 18 — Share-Based Compensation
Share-based compensation expense is charged to "salaries" expense on the consolidated statements of income. The components of share-based compensation expense for all share-based compensation plans and related tax benefits are as follows:
| | | | | | | | | | |
| | 2009 | | 2008 | | 2007 | |
|---|
| | (in millions)
| |
|---|
Total share-based compensation expense | | $ | 32 | | $ | 51 | | $ | 59 | |
| | | | | | | | |
Related tax benefits recognized in net income | | $ | 12 | | $ | 19 | | $ | 21 | |
| | | | | | | | |
The following table summarizes unrecognized compensation expense for all share-based plans:
| | | | |
| | December 31,
2009 | |
|---|
| | (dollar amount
in millions)
| |
|---|
Total unrecognized share-based compensation expense | | $ | 35 | |
| | | | |
Weighted-average expected recognition period (in years) | | | 2.7 | |
| | | | |
The Corporation has share-based compensation plans under which it awards both shares of restricted stock to key executive officers and key personnel and stock options to executive officers, directors and key personnel of the Corporation and its subsidiaries. Restricted stock vests over periods ranging from three years to five years. Stock options vest over periods ranging from one year to four years. During the period the U.S. Treasury holds equity issued under the Capital Purchase Program, restricted share grants may not vest in less than two years from the grant date and retirement-based acceleration is not allowed. These restrictions lengthen the requisite service period and, therefore, the amortization period for retirement eligible grantees. The maturity of each option is determined at the date of grant; however, no options may be exercised later than ten years and one month from the date of grant. The options may have restrictions regarding exercisability. The plans originally
120
Table of Contents
NOTES TO CONSOLIDATED FINANCIAL STATEMENTS
Comerica Incorporated and Subsidiaries
provided for a grant of up to 13.2 million common shares, plus shares under certain plans that are forfeited, expire or are cancelled. At December 31, 2009, 7.0 million shares were available for grant.
The Corporation used a binomial model to value stock options granted in the periods presented. Option valuation models require several inputs, including the expected stock price volatility, and changes in input assumptions can materially affect the fair value estimates. The model used may not necessarily provide a reliable single measure of the fair value of employee and director stock options. The risk-free interest rate assumption used in the binomial option-pricing model as outlined in the table below was based on the federal ten-year treasury interest rate. The expected dividend yield was based on the historical and projected dividend yield patterns of the Corporation's common shares. Expected volatility assumptions considered both the historical volatility of the Corporation's common stock over a ten-year period and implied volatility based on actively traded options on the Corporation's common stock with pricing terms and trade dates similar to the stock options granted.
The estimated weighted-average grant-date fair value per option share and the underlying binomial option-pricing model assumptions are summarized in the following table:
| | | | | | | | | | | |
| | 2009 | | 2008 | | 2007 | |
|---|
Weighted-average grant-date fair value per option share | | $ | 6.55 | | $ | 9.54 | | $ | 12.47 | |
Weighted-average assumptions: | | | | | | | | | | |
| | Risk-free interest rates | | | 3.08 | % | | 3.73 | % | | 4.88 | % |
| | Expected dividend yield | | | 4.62 | | | 4.62 | | | 3.85 | |
| | Expected volatility factors of the market price of Comerica common stock | | | 58 | | | 34 | | | 23 | |
| | Expected option life (in years) | | | 6.4 | | | 6.6 | | | 6.4 | |
A summary of the Corporation's stock option activity and related information for the year ended December 31, 2009 follows:
| | | | | | | | | | | | | | |
| |
| | Weighted-Average | |
| |
|---|
| | Number of
Options
(in thousands) | | Exercise
Price
per Share | | Remaining
Contractual
Term
(in years) | | Aggregate
Intrinsic
Value
(in millions) | |
|---|
Outstanding — January 1, 2009 | | | 19,234 | | $ | 53.51 | | | | | | | |
| | Granted | | | 1,535 | | | 17.36 | | | | | | | |
| | Forfeited or expired | | | (2,347 | ) | | 61.18 | | | | | | | |
| | Exercised | | | — | | | — | | | | | | | |
| | | | | | | | | | | | | |
Outstanding — December 31, 2009 | | | 18,422 | | | 49.52 | | | 4.9 | | $ | 18 | |
| | | | | | | | | | | | | |
Outstanding, net of expected forfeitures — December 31, 2009 | | | 18,253 | | | 49.70 | | | 4.9 | | | 17 | |
Exercisable — December 31, 2009 | | | 13,927 | | | 53.17 | | | 4.0 | | | — | |
The aggregate intrinsic value of outstanding options shown in the table above represents the total pretax intrinsic value at December 31, 2009, based on the Corporation's closing stock price of $29.57 at December 31, 2009.
There were no stock options exercised during 2009. The total intrinsic value of stock options exercised was less than $0.5 million and $33 million for the years ended December 31, 2008 and 2007, respectively. Cash received from the exercise of stock options during 2008 and 2007 totaled $1 million and $89 million, respectively. The net excess income tax benefit realized for the tax deductions from the exercise of these options
121
Table of Contents
NOTES TO CONSOLIDATED FINANCIAL STATEMENTS
Comerica Incorporated and Subsidiaries
totaled less than $0.5 million for the year ended December 31, 2008 and $8 million for the year ended December 31, 2007.
A summary of the Corporation's restricted stock activity and related information for 2009 follows:
| | | | | | | | |
| | Number
of Shares
(in thousands) | | Weighted-Average
Grant-Date
Fair Value
per Share | |
|---|
Outstanding — January 1, 2009 | | | 1,627 | | $ | 50.17 | |
| | Granted | | | 882 | | | 18.92 | |
| | Forfeited | | | (118 | ) | | 41.45 | |
| | Vested | | | (302 | ) | | 54.67 | |
| | | | | | | |
Outstanding — December 31, 2009 | | | 2,089 | | $ | 36.82 | |
| | | | | | | |
The total fair value of restricted stock awards that fully vested during the years ended December 31, 2009, 2008 and 2007 was $16 million, $7 million and $10 million, respectively.
The Corporation expects to satisfy the exercise of stock options and future grants of restricted stock by issuing shares of common stock out of treasury. At December 31, 2009, the Corporation held 27.6 million shares in treasury.
For further information on the Corporation's share-based compensation plans, refer to Note 1.
Note 19 — Employee Benefit Plans
Defined Benefit Pension and Postretirement Benefit Plans
The Corporation has a qualified and a non-qualified defined benefit pension plan, which together provide benefits for substantially all full-time employees hired before January 1, 2007. Employee benefits expense included defined benefit pension expense of $57 million, $20 million and $36 million in the years ended December 31, 2009, 2008 and 2007, respectively, for the plans. Benefits under the defined benefit plans are based primarily on years of service, age and compensation during the five highest paid consecutive calendar years occurring during the last ten years before retirement.
The Corporation's postretirement benefit plan continues to provide postretirement health care and life insurance benefits for retirees as of December 31, 1992. The plan also provides certain postretirement health care and life insurance benefits for a limited number of retirees who retired prior to January 1, 2000. For all other employees hired prior to January 1, 2000, a nominal benefit is provided. Employees hired on or after January 1, 2000 are not eligible to participate in the plan. The Corporation funds the pre-1992 retiree plan benefits with bank-owned life insurance.
122
Table of Contents
NOTES TO CONSOLIDATED FINANCIAL STATEMENTS
Comerica Incorporated and Subsidiaries
The following table sets forth reconciliations of the projected benefit obligation and plan assets of the Corporation's qualified defined benefit pension plan, non-qualified defined benefit pension plan and postretirement benefit plan. The Corporation used a measurement date of December 31, 2009 for these plans.
| | | | | | | | | | | | | | | | | | | |
| | Qualified
Defined Benefit
Pension Plan | | Non-Qualified
Defined Benefit
Pension Plan | | Postretirement
Benefit Plan | |
|---|
| | 2009 | | 2008 | | 2009 | | 2008 | | 2009 | | 2008 | |
|---|
| | (in millions)
| |
|---|
Change in projected benefit obligation: | | | | | | | | | | | | | | | | | | | |
Projected benefit obligation at January 1 | | $ | 1,165 | | $ | 1,037 | | $ | 156 | | $ | 140 | | $ | 80 | | $ | 81 | |
Service cost | | | 28 | | | 28 | | | 4 | | | 4 | | | — | | | — | |
Interest cost | | | 69 | | | 66 | | | 9 | | | 8 | | | 5 | | | 5 | |
Actuarial (gain) loss | | | (7 | ) | | 73 | | | (11 | ) | | 8 | | | 5 | | | 4 | |
Benefits paid | | | (42 | ) | | (39 | ) | | (6 | ) | | (4 | ) | | (6 | ) | | (7 | ) |
Plan change | | | — | | | — | | | 4 | | | — | | | — | | | (3 | ) |
| | | | | | | | | | | | | | |
Projected benefit obligation at December 31 | | $ | 1,213 | | $ | 1,165 | | $ | 156 | | $ | 156 | | $ | 84 | | $ | 80 | |
| | | | | | | | | | | | | | |
Change in plan assets: | | | | | | | | | | | | | | | | | | | |
Fair value of plan assets at January 1 | | $ | 1,080 | | $ | 1,237 | | $ | — | | $ | — | | $ | 74 | | $ | 85 | |
Actual return on plan assets | | | 200 | | | (293 | ) | | — | | | — | | | 7 | | | (10 | ) |
Employer contributions | | | 100 | | | 175 | | | — | | | — | | | (1 | ) | | 6 | |
Benefits paid | | | (42 | ) | | (39 | ) | | — | | | — | | | (7 | ) | | (7 | ) |
| | | | | | | | | | | | | | |
Fair value of plan assets at December 31 | | $ | 1,338 | | $ | 1,080 | | $ | — | | $ | — | | $ | 73 | | $ | 74 | |
| | | | | | | | | | | | | | |
Accumulated benefit obligation | | $ | 1,096 | | $ | 1,031 | | $ | 142 | | $ | 131 | | $ | 84 | | $ | 80 | |
| | | | | | | | | | | | | | |
Funded status at December 31 (a) | | $ | 125 | | $ | (85 | ) | $ | (156 | ) | $ | (156 | ) | $ | (11 | ) | $ | (6 | ) |
| | | | | | | | | | | | | | |
- (a)
- Based on projected benefit obligation for pension plans and accumulated benefit obligation for postretirement benefit plan.
The 2009 non-qualified defined benefit pension plan change of $4 million reflected the recognition of special agreement benefits not previously included in plan valuations. The accumulated benefit obligation exceeded the fair value of plan assets for the non-qualified defined benefit pension plan and the postretirement benefit plan at December 31, 2009 and 2008.
123
Table of Contents
NOTES TO CONSOLIDATED FINANCIAL STATEMENTS
Comerica Incorporated and Subsidiaries
The following table details the amounts recognized in accumulated other comprehensive income (loss) at December 31, 2009, 2008 and 2007, and changes for the years then ended, for the qualified defined benefit pension plan, non-qualified defined benefit pension plan and postretirement benefit plan.
| | | | | | | | | | | | | | | | | | | | | | | | | | |
| | Qualified
Defined Benefit
Pension Plan | | Non-Qualified
Defined Benefit
Pension Plan | |
|---|
| | Net Loss | | Prior
Service
(Cost)
Credit | | Net
Transition
Obligation | | Total | | Net
Loss | | Prior
Service
(Cost)
Credit | | Net
Transition
Obligation | | Total | |
|---|
| | (in millions)
| |
|---|
Balance at December 31, 2006, net of tax | | $ | (138 | ) | $ | (24 | ) | $ | — | | $ | (162 | ) | $ | (31 | ) | $ | 8 | | $ | — | | $ | (23 | ) |
| | Adjustment arising during the year | | | 59 | | | — | | | — | | | 59 | | | (18 | ) | | — | | | — | | | (18 | ) |
| | Less: Adjustment for amounts recognized as components of net periodic benefit cost during the year | | | (15 | ) | | (6 | ) | | — | | | (21 | ) | | (6 | ) | | 2 | | | — | | | (4 | ) |
| | | | | | | | | | | | | | | | | | |
Change in amounts recognized in other comprehensive income before income taxes | | | 74 | | | 6 | | | — | | | 80 | | | (12 | ) | | (2 | ) | | — | | | (14 | ) |
| | Less: Provision for income taxes | | | 26 | | | 2 | | | — | | | 28 | | | (4 | ) | | (1 | ) | | — | | | (5 | ) |
| | | | | | | | | | | | | | | | | | |
Change in amounts recognized in other comprehensive income, net of tax | | | 48 | | | 4 | | | — | | | 52 | | | (8 | ) | | (1 | ) | | — | | | (9 | ) |
| | | | | | | | | | | | | | | | | | |
Balance at December 31, 2007, net of tax | | $ | (90 | ) | $ | (20 | ) | $ | — | | $ | (110 | ) | $ | (39 | ) | $ | 7 | | $ | — | | $ | (32 | ) |
| | Adjustment arising during the year | | | (466 | ) | | — | | | — | | | (466 | ) | | (8 | ) | | — | | | — | | | (8 | ) |
| | Less: Adjustment for amounts recognized as components of net periodic benefit cost during the year | | | (4 | ) | | (7 | ) | | — | | | (11 | ) | | (4 | ) | | 2 | | | — | | | (2 | ) |
| | | | | | | | | | | | | | | | | | |
Change in amounts recognized in other comprehensive income before income taxes | | | (462 | ) | | 7 | | | — | | | (455 | ) | | (4 | ) | | (2 | ) | | — | | | (6 | ) |
| | Less: Provision for income taxes | | | (167 | ) | | 3 | | | — | | | (164 | ) | | (2 | ) | | — | | | — | | | (2 | ) |
| | | | | | | | | | | | | | | | | | |
Change in amounts recognized in other comprehensive income, net of tax | | | (295 | ) | | 4 | | | — | | | (291 | ) | | (2 | ) | | (2 | ) | | — | | | (4 | ) |
| | | | | | | | | | | | | | | | | | |
Balance at December 31, 2008, net of tax | | $ | (385 | ) | $ | (16 | ) | $ | — | | $ | (401 | ) | $ | (41 | ) | $ | 5 | | $ | — | | $ | (36 | ) |
| | Adjustment arising during the year | | | 103 | | | — | | | — | | | 103 | | | 11 | | | — | | | — | | | 11 | |
| | Less: Adjustment for amounts recognized as components of net periodic benefit cost during the year | | | (38 | ) | | (6 | ) | | — | | | (44 | ) | | (5 | ) | | 2 | | | — | | | (3 | ) |
| | | | | | | | | | | | | | | | | | |
Change in amounts recognized in other comprehensive income before income taxes | | | 141 | | | 6 | | | — | | | 147 | | | 16 | | | (2 | ) | | — | | | 14 | |
| | Less: Provision for income taxes | | | 52 | | | 2 | | | — | | | 54 | | | 6 | | | (1 | ) | | — | | | 5 | |
| | | | | | | | | | | | | | | | | | |
Change in amounts recognized in other comprehensive income, net of tax | | | 89 | | | 4 | | | — | | | 93 | | | 10 | | | (1 | ) | | — | | | 9 | |
| | | | | | | | | | | | | | | | | | |
Balance at December 31, 2009, net of tax | | $ | (296 | ) | $ | (12 | ) | $ | — | | $ | (308 | ) | $ | (31 | ) | $ | 4 | | $ | — | | $ | (27 | ) |
| | | | | | | | | | | | | | | | | | |
124
Table of Contents
NOTES TO CONSOLIDATED FINANCIAL STATEMENTS
Comerica Incorporated and Subsidiaries
| | | | | | | | | | | | | | | | | | | | | | | | | | |
| | Postretirement Benefit Plan | | Total | |
|---|
| | Net Loss | | Prior
Service
(Cost)
Credit | | Net
Transition
Obligation | | Total | | Net Loss | | Prior
Service
(Cost)
Credit | | Net
Transition
Obligation | | Total | |
|---|
| | (in millions)
| |
|---|
Balance at December 31, 2006, net of tax | | $ | (8 | ) | $ | (6 | ) | $ | (16 | ) | $ | (30 | ) | $ | (177 | ) | $ | (22 | ) | $ | (16 | ) | $ | (215 | ) |
| | Adjustment arising during the year | | | — | | | — | | | — | | | — | | | 41 | | | — | | | — | | | 41 | |
| | Less: Adjustment for amounts recognized as components of net periodic benefit cost during the year | | | — | | | (1 | ) | | (4 | ) | | (5 | ) | | (21 | ) | | (5 | ) | | (4 | ) | | (30 | ) |
| | | | | | | | | | | | | | | | | | |
Change in amounts recognized in other comprehensive income before income taxes | | | — | | | 1 | | | 4 | | | 5 | | | 62 | | | 5 | | | 4 | | | 71 | |
| | Less: Provision for income taxes | | | — | | | 1 | | | 2 | | | 3 | | | 22 | | | 2 | | | 2 | | | 26 | |
| | | | | | | | | | | | | | | | | | |
Change in amounts recognized in other comprehensive income, net of tax | | | — | | | — | | | 2 | | | 2 | | | 40 | | | 3 | | | 2 | | | 45 | |
| | | | | | | | | | | | | | | | | | |
Balance at December 31, 2007, net of tax | | $ | (8 | ) | $ | (6 | ) | $ | (14 | ) | $ | (28 | ) | $ | (137 | ) | $ | (19 | ) | $ | (14 | ) | $ | (170 | ) |
| | Adjustment arising during the year | | | (17 | ) | | 3 | | | — | | | (14 | ) | | (491 | ) | | 3 | | | — | | | (488 | ) |
| | Less: Adjustment for amounts recognized as components of net periodic benefit cost during the year | | | (1 | ) | | — | | | (4 | ) | | (5 | ) | | (9 | ) | | (5 | ) | | (4 | ) | | (18 | ) |
| | | | | | | | | | | | | | | | | | |
Change in amounts recognized in other comprehensive income before income taxes | | | (16 | ) | | 3 | | | 4 | | | (9 | ) | | (482 | ) | | 8 | | | 4 | | | (470 | ) |
| | Less: Provision for income taxes | | | (6 | ) | | 1 | | | 1 | | | (4 | ) | | (175 | ) | | 4 | | | 1 | | | (170 | ) |
| | | | | | | | | | | | | | | | | | |
Change in amounts recognized in other comprehensive income, net of tax | | | (10 | ) | | 2 | | | 3 | | | (5 | ) | | (307 | ) | | 4 | | | 3 | | | (300 | ) |
| | | | | | | | | | | | | | | | | | |
Balance at December 31, 2008, net of tax | | $ | (18 | ) | $ | (4 | ) | $ | (11 | ) | $ | (33 | ) | $ | (444 | ) | $ | (15 | ) | $ | (11 | ) | $ | (470 | ) |
| | Adjustment arising during the year | | | (2 | ) | | — | | | — | | | (2 | ) | | 112 | | | — | | | — | | | 112 | |
| | Less: Adjustment for amounts recognized as components of net periodic benefit cost during the year | | | (1 | ) | | (1 | ) | | (4 | ) | | (6 | ) | | (44 | ) | | (5 | ) | | (4 | ) | | (53 | ) |
| | | | | | | | | | | | | | | | | | |
Change in amounts recognized in other comprehensive income before income taxes | | | (1 | ) | | 1 | | | 4 | | | 4 | | | 156 | | | 5 | | | 4 | | | 165 | |
| | Less: Provision for income taxes | | | — | | | — | | | 1 | | | 1 | | | 58 | | | 1 | | | 1 | | | 60 | |
| | | | | | | | | | | | | | | | | | |
Change in amounts recognized in other comprehensive income, net of tax | | | (1 | ) | | 1 | | | 3 | | | 3 | | | 98 | | | 4 | | | 3 | | | 105 | |
| | | | | | | | | | | | | | | | | | |
Balance at December 31, 2009, net of tax | | $ | (19 | ) | $ | (3 | ) | $ | (8 | ) | $ | (30 | ) | $ | (346 | ) | $ | (11 | ) | $ | (8 | ) | $ | (365 | ) |
| | | | | | | | | | | | | | | | | | |
125
Table of Contents
NOTES TO CONSOLIDATED FINANCIAL STATEMENTS
Comerica Incorporated and Subsidiaries
Components of net periodic defined benefit cost are as follows:
| | | | | | | | | | | | | | | | | | | |
| | Qualified Defined Benefit
Pension Plan | | Non-Qualified Defined Benefit
Pension Plan | |
|---|
| | Years Ended December 31 | |
|---|
| | 2009 | | 2008 | | 2007 | | 2009 | | 2008 | | 2007 | |
|---|
| | (in millions)
| |
|---|
Service cost | | $ | 28 | | $ | 28 | | $ | 30 | | $ | 4 | | $ | 4 | | $ | 4 | |
Interest cost | | | 69 | | | 66 | | | 62 | | | 9 | | | 9 | | | 8 | |
Expected return on plan assets | | | (104 | ) | | (100 | ) | | (93 | ) | | — | | | — | | | — | |
Amortization of prior service cost (credit) | | | 6 | | | 7 | | | 6 | | | (2 | ) | | (2 | ) | | (2 | ) |
Amortization of net loss | | | 38 | | | 4 | | | 15 | | | 5 | | | 4 | | | 6 | |
Recognition of special agreement benefits | | | — | | | — | | | — | | | 4 | | | — | | | — | |
| | | | | | | | | | | | | | |
Net periodic defined benefit cost | | $ | 37 | | $ | 5 | | $ | 20 | | $ | 20 | | $ | 15 | | $ | 16 | |
| | | | | | | | | | | | | | |
Additional information: | | | | | | | | | | | | | | | | | | | |
Actual return (loss) on plan assets | | $ | 200 | | $ | (293 | ) | $ | 89 | | $ | — | | $ | — | | $ | — | |
| | | | | | | | | | | | | | |
| | | | | | | | | | |
| | Postretirement Benefit Plan | |
|---|
| | Years Ended December 31 | |
|---|
| | 2009 | | 2008 | | 2007 | |
|---|
| | (in millions)
| |
|---|
Interest cost | | $ | 5 | | $ | 5 | | $ | 5 | |
Expected return on plan assets | | | (4 | ) | | (4 | ) | | (4 | ) |
Amortization of transition obligation | | | 4 | | | 4 | | | 4 | |
Amortization of prior service cost | | | 1 | | | — | | | 1 | |
Amortization of net loss | | | 1 | | | 1 | | | — | |
| | | | | | | | |
Net periodic benefit cost | | $ | 7 | | $ | 6 | | $ | 6 | |
| | | | | | | | |
Additional information: | | | | | | | | | | |
Actual return (loss) on plan assets | | $ | 7 | | $ | (10 | ) | $ | 5 | |
| | | | | | | | |
The estimated portion of balances remaining in accumulated other comprehensive income (loss) that are expected to be recognized as a component of net periodic benefit cost in the year ended December 31, 2010 are as follows.
| | | | | | | | | | | | | |
| | Qualified
Defined Benefit
Pension Plan | | Non-Qualified
Defined Benefit
Pension Plan | | Postretirement
Benefit Plan | | Total | |
|---|
| | (in millions)
| |
|---|
Net loss | | $ | 18 | | $ | 4 | | $ | 1 | | $ | 23 | |
Transition obligation | | | — | | | — | | | 4 | | $ | 4 | |
Prior service cost (credit) | | | 6 | | | (2 | ) | | 1 | | $ | 5 | |
Actuarial assumptions are reflected below. The discount rate and rate of compensation increase used to determine the benefit obligation for each year shown is as of the end of the year. The discount rate, expected return on plan assets and rate of compensation increase used to determine net cost for each year shown is as of the beginning of the year.
126
Table of Contents
NOTES TO CONSOLIDATED FINANCIAL STATEMENTS
Comerica Incorporated and Subsidiaries
Weighted-average assumptions used to determine year-end benefit obligations:
| | | | | | | | | | | | | | | | | | | |
| | Qualified and Non-Qualified
Defined Benefit Pension Plans | | Postretirement
Benefit Plan | |
|---|
| | December 31 | |
|---|
| | 2009 | | 2008 | | 2007 | | 2009 | | 2008 | | 2007 | |
|---|
Discount rate | | | 5.92 | % | | 6.03 | % | | 6.47 | % | | 5.41 | % | | 6.20 | % | | 6.15 | % |
Rate of compensation increase | | | 3.50 | | | 4.00 | | | 4.00 | | | | | | | | | | |
Weighted-average assumptions used to determine net periodic benefit cost:
| | | | | | | | | | | | | | | | | | | |
| | Qualified and Non-Qualified
Defined Benefit Pension Plans | | Postretirement
Benefit Plan | |
|---|
| | Years Ended December 31 | |
|---|
| | 2009 | | 2008 | | 2007 | | 2009 | | 2008 | | 2007 | |
|---|
Discount rate | | | 6.03 | % | | 6.47 | % | | 5.89 | % | | 6.20 | % | | 6.15 | % | | 5.89 | % |
Expected long-term return on plan assets | | | 8.25 | | | 8.25 | | | 8.25 | | | 5.00 | | | 5.00 | | | 5.00 | |
Rate of compensation increase | | | 4.00 | | | 4.00 | | | 4.00 | | | | | | | | | | |
The long-term rate of return expected on plan assets is set after considering both long-term returns in the general market and long-term returns experienced by the assets in the plan. The returns on the various asset categories are blended to derive one long-term rate of return. The Corporation reviews its pension plan assumptions on an annual basis with its actuarial consultants to determine if assumptions are reasonable and adjusts the assumptions to reflect changes in future expectations.
Assumed healthcare and prescription drug cost trend rates:
| | | | | | | | | | | | | |
| | Healthcare | | Prescription Drug | |
|---|
| | December 31 | |
|---|
| | 2009 | | 2008 | | 2009 | | 2008 | |
|---|
Cost trend rate assumed for next year | | | 8.00 | % | | 8.00 | % | | 8.00 | % | | 8.00 | % |
Rate to which the cost trend rate is assumed to decline (the ultimate trend rate) | | | 5.00 | | | 5.00 | | | 5.00 | | | 5.00 | |
Year that the rate reaches the ultimate trend rate | | | 2030 | | | 2028 | | | 2030 | | | 2028 | |
Assumed healthcare and prescription drug cost trend rates have a significant effect on the amounts reported for the healthcare plans. A one-percentage point change in 2009 assumed healthcare and prescription drug cost trend rates would have the following effects:
| | | | | | | |
| | One-Percentage-Point | |
|---|
| | Increase | | Decrease | |
|---|
| | (in millions)
| |
|---|
Effect on postretirement benefit obligation | | $ | 5 | | $ | (5 | ) |
Effect on total service and interest cost | | | — | | | — | |
127
Table of Contents
NOTES TO CONSOLIDATED FINANCIAL STATEMENTS
Comerica Incorporated and Subsidiaries
Plan Assets
The Corporation's overall investment goals for the qualified defined benefit pension plan are to maintain a portfolio of assets of appropriate liquidity and diversification; to generate investment returns (net of operating costs) that are reasonably anticipated to maintain the plan's fully funded status or to reduce a funding deficit, after taking into account various factors, including reasonably anticipated future contributions and expense and the interest rate sensitivity of the plan's assets relative to that of the plan's liabilities; and to generate investment returns (net of operating costs) that meet or exceed a customized benchmark as defined in the plan investment policy. Derivative instruments are permissible for hedging and transactional efficiency, but only to the extent that the derivative use enhances the efficient execution of the plan's investment policy. Securities issued by the Corporation and its subsidiaries are not eligible for use within this plan. The Corporation's target allocations for plan investments are 55 percent to 65 percent equity securities and 35 percent to 45 percent fixed income, including cash. Equity securities include collective investment and mutual funds and common stock. Fixed income securities include U.S. Treasury and other U.S. government agency securities, mortgage-backed securities, corporate bonds and notes, municipal bonds, collateralized mortgage obligations and money market funds.
Fair Value Measurements
The Corporation's qualified defined benefit pension plan utilizes fair value measurements to record fair value adjustments and to determine fair value disclosures. The Corporation's qualified benefit pension plan categorizes investments recorded at fair value into a three-level hierarchy, based on the markets in which the investment are traded and the reliability of the assumptions used to determine fair value. Refer to Note 3 for a description of the three-level hierarchy.
Following is a description of the valuation methodologies and key inputs used to measure the fair value of the Corporation's qualified defined benefit pension plan investments, including an indication of the level of the fair value hierarchy in which the investments are classified.
Collective investment and mutual funds
Fair value measurement is based upon quoted prices in active markets, if available. If quoted prices in active markets are not available, fair values are measured using the net asset value (NAV) provided by the administrator of the fund. The NAV is a quoted price in a market that is not active. Level 1 securities include those traded on an active exchange, such as the New York Stock Exchange, and money market funds. Level 2 securities include collective investment funds measured using the NAV.
Common stock
Fair value measurement is based upon the closing price reported on the New York Stock Exchange. Level 1 common stock includes domestic and foreign stock and real estate investment trusts. Level 2 common stock includes American Depositary Receipts.
U.S. Treasury and other U.S. government agency securities
Fair value measurement is based upon quoted prices, if available. If quoted prices are not available, fair values are measured using independent pricing models or other model-based valuation techniques, such as the present value of future cash flows, adjusted for the security's credit rating, prepayment assumptions and other factors such as credit loss and liquidity assumptions. Level 1 securities include U.S. Treasury securities that are traded by dealers or brokers in active over-the-counter markets. Level 2 securities include pooled Small Business Administration loans.
128
Table of Contents
NOTES TO CONSOLIDATED FINANCIAL STATEMENTS
Comerica Incorporated and Subsidiaries
Mortgage-backed securities
Fair value measurement is based upon quoted prices and is included in Level 2 of the fair value hierarchy.
Corporate and municipal bonds and notes
Fair value measurement is based upon quoted prices. Level 2 securities include corporate bonds, municipal bonds, other asset-backed securities and foreign bonds and notes.
Collateralized mortgage obligations
Fair value measurement is based upon independent pricing models or other model-based valuation techniques such as the present value of future cash flows, adjusted for the security's credit rating, prepayment assumptions and other factors, such as credit loss and liquidity assumptions, and is included in Level 2 of the fair value hierarchy.
Securities purchased under agreements to resell
Fair value measurement is based upon independent pricing models or other model-based valuation techniques such as the present value of future cash flows, and is included in Level 2 of the fair value hierarchy.
Private placements
Fair value is measured using the NAV provided by fund management, as quoted prices in active markets are not available. Management considers additional discounts to the provided NAV for market and credit risk. Private placements are included in Level 3 of the fair value hierarchy.
129
Table of Contents
NOTES TO CONSOLIDATED FINANCIAL STATEMENTS
Comerica Incorporated and Subsidiaries
The fair values of the Corporation's qualified defined benefit pension plan investments measured at fair value on a recurring basis at December 31, 2009 and 2008, by asset category and level within the fair value hierarchy, are detailed in the table below.
| | | | | | | | | | | | | | |
| | Total | | Level 1 | | Level 2 | | Level 3 | |
|---|
| | (in millions)
| |
|---|
December 31, 2009 | | | | | | | | | | | | | |
Equity securities: | | | | | | | | | | | | | |
| | Collective investment and mutual funds | | $ | 495 | | $ | 163 | | $ | 332 | | $ | — | |
| | Common stock | | | 320 | | | 318 | | | 2 | | | — | |
Fixed income securities: | | | | | | | | | | | | | |
| | U.S. Treasury and other U.S. government agency securities | | | 168 | | | 168 | | | — | | | — | |
| | Corporate and municipal bonds and notes | | | 288 | | | — | | | 288 | | | — | |
| | Collateralized mortgage obligations | | | 6 | | | — | | | 6 | | | — | |
| | Collective investments and mutual funds | | | 20 | | | 20 | | | — | | | — | |
Private placements | | | 28 | | | — | | | — | | | 28 | |
Other assets: | | | | | | | | | | | | | |
| | Securities purchased under agreements to resell | | | 5 | | | — | | | 5 | | | — | |
| | | | | | | | | | |
| | Total investments at fair value | | $ | 1,330 | | $ | 669 | | $ | 633 | | $ | 28 | |
| | | | | | | | | | |
December 31, 2008 | | | | | | | | | | | | | |
Equity securities: | | | | | | | | | | | | | |
| | Collective investment and mutual funds | | $ | 250 | | $ | 73 | | $ | 177 | | $ | — | |
| | Common stock | | | 308 | | | 298 | | | 10 | | | — | |
Fixed income securities: | | | | | | | | | | | | | |
U.S. Treasury and other U.S. government agency securities | | | 65 | | | 61 | | | 4 | | | — | |
| | Mortgage-backed securities | | | 71 | | | — | | | 71 | | | — | |
| | Corporate and municipal bonds and notes | | | 81 | | | — | | | 81 | | | — | |
| | Collateralized mortgage obligations | | | 113 | | | — | | | 113 | | | — | |
| | Collective investments and mutual funds | | | 189 | | | 189 | | | — | | | — | |
| | | | | | | | | | |
| | Total investments at fair value | | $ | 1,077 | | $ | 621 | | $ | 456 | | $ | — | |
| | | | | | | | | | |
The table below provides a summary of changes in the Corporation's qualified defined benefit pension plan's Level 3 investments measured at fair value on a recurring basis for the years ended December 31, 2009 and 2008.
| | | | | | | | | | | | | | | | |
| |
| | Gains (Losses) | |
| |
| |
|---|
| | Balance at
Beginning
of Period | | Purchases,
Sales and
Settlements, Net | | Balance at
End of Period | |
|---|
| | Realized | | Unrealized | |
|---|
| | (in millions)
| |
|---|
Year ended December 31, 2009 | | | | | | | | | | | | | | | | |
Private placements | | $ | — | | $ | — | | $ | 1 | | $ | 27 | | $ | 28 | |
| | | | | | | | | | | | |
Year ended December 31, 2008 | | | | | | | | | | | | | | | | |
Private placements | | $ | 4 | | $ | — | | $ | (1 | ) | $ | (3 | ) | $ | — | |
| | | | | | | | | | | | |
There were no assets in the non-qualified defined benefit pension plan at December 31, 2009, and 2008. The postretirement benefit plan is fully invested in bank-owned life insurance policies. The fair value of
130
Table of Contents
NOTES TO CONSOLIDATED FINANCIAL STATEMENTS
Comerica Incorporated and Subsidiaries
bank-owned life insurance policies is based on the cash surrender values of the policies as reported by the insurance companies and are classified in level 2 of the fair value hierarchy.
Cash Flows
Estimated future employer contributions were zero for the qualified and non-qualified defined benefit pension plans and postretirement benefit plan for the year ended December 31, 2010.
| | | | | | | | | | |
| | Estimated Future Benefit Payments | |
|---|
| | Qualified
Defined Benefit
Pension Plan | | Non-Qualified
Defined Benefit
Pension Plan | | Postretirement
Benefit Plan (a) | |
|---|
| | (in millions)
| |
|---|
Years Ended December 31 | | | | | | | | | | |
2010 | | $ | 46 | | $ | 7 | | $ | 7 | |
2011 | | | 48 | | | 8 | | | 7 | |
2012 | | | 52 | | | 9 | | | 7 | |
2013 | | | 55 | | | 9 | | | 7 | |
2014 | | | 58 | | | 10 | | | 7 | |
2015-2019 | | | 356 | | | 57 | | | 34 | |
- (a)
- Estimated benefit payments in the postretirement benefit plan are net of estimated Medicare subsidies.
Defined Contribution Plan
Substantially all of the Corporation's employees are eligible to participate in the Corporation's principal defined contribution plan (a 401(k) plan). Under this plan, the Corporation makes core matching cash contributions of 100 percent of the first four percent of qualified earnings contributed by employees (up to the current IRS compensation limit), invested based on employee investment elections. Effective September 16, 2008, the Corporation eliminated Comerica Stock as an investment option for future deposits, including employee contributions, matching contributions and transfers. Employee benefits expense included expense for the plan of $20 million, $22 million and $20 million in the years ended December 31, 2009, 2008 and 2007, respectively.
On January 1, 2007, the Corporation added a defined contribution feature to its principal defined contribution plan for the benefit of substantially all full-time employees hired on or after January 1, 2007. Under the defined contribution feature, the Corporation makes an annual contribution to the individual account of each eligible employee ranging from three percent to eight percent of annual compensation, determined based on combined age and years of service. The contributions are invested based on employee investment elections. The employee fully vests in the defined contribution account after three years of service. Before an employee is eligible to participate, the plan feature requires the equivalent of six months of service for employees hired on or after January 1, 2008 and required one year of service for employees hired in the year ended December 31, 2007. The Corporation recognized $3 million and $2 million in employee benefits expense for this plan feature for the years ended December 31, 2009 and 2008, respectively. No expense was incurred for this plan feature for the year ended December 31, 2007.
131
Table of Contents
NOTES TO CONSOLIDATED FINANCIAL STATEMENTS
Comerica Incorporated and Subsidiaries
Deferred Compensation Plan
The Corporation offers an optional deferred compensation plan under which certain employees may make an irrevocable election to defer incentive compensation and/or a portion of base salary until retirement or separation from the Corporation. The employee may direct deferred compensation into one or more deemed investment options. Although not required to do so, the Corporation invests actual funds into the deemed investments as directed by employees, resulting in a deferred compensation asset, recorded in "other short-term investments" on the consolidated balance sheets that offsets the liability to employees under the plan, recorded in "accrued expenses and other liabilities." The earnings from the deferred compensation asset are recorded in "interest on short-term investments" and "other noninterest income" and the related change in the liability to employees under the plan is recorded in "salaries" expense on the consolidated statements of income.
Note 20 — Income Taxes and Tax-Related Items
The provision (benefit) for federal income taxes is computed by applying the statutory federal income tax rate to income (loss) before income taxes as reported in the consolidated financial statements after deducting non-taxable items, principally income on bank-owned life insurance, and deducting tax credits related to investments in low income housing partnerships. Tax interest, state and foreign taxes are then added to the federal tax provision.
In the ordinary course of business, the Corporation enters into certain transactions that have tax consequences. From time to time, the Internal Revenue Service (IRS) questions and/or challenges the tax position taken by the Corporation with respect to those transactions. The Corporation believes that its tax returns were filed based upon applicable statutes, regulations and case law in effect at the time of the transactions. The IRS, an administrative authority or a court, if presented with the transactions, could disagree with the Corporation's interpretation of the tax law. After evaluating the risks and opportunities, the best outcome may result in a settlement. The ultimate outcome for each position is not known.
On January 1, 2007, the Corporation adopted new income tax guidance related to accounting for uncertainty in income taxes. On December 31, 2009, the Corporation had net unrecognized tax benefits of less than $0.5 million compared to net unrecognized tax benefits of $70 million at December 31, 2008. After consideration of the effect of the federal tax benefit available on unrecognized state tax benefits, the total amount of unrecognized tax benefits that, if recognized, would affect the Corporation's effective tax rate was approximately $32 million at December 31, 2009 and $56 million at December 31, 2008. Accrued interest and penalties were $19 million and $85 million at December 31, 2009 and 2008, respectively.
The Corporation recognized a benefit of approximately $19 million in 2009 in interest and penalties on income tax liabilities included in the "provision (benefit) for income taxes" on the consolidated statements of income, compared with expense of approximately $8 million in 2008 and $5 million in 2007. The 2009 interest and penalties on income tax liabilities includes an $18 million reduction of interest due to anticipated refunds due from the IRS. The 2007 interest and penalties on income tax liabilities were net of a $9 million reduction of interest resulting from settlement with the IRS on a refund claim.
The amount of interest and penalties accrued at December 31, 2009 included interest for unrecognized tax benefits in addition to interest accrued for structured leasing transactions that are expected to be paid in the first quarter 2010. The Corporation engaged in certain types of structured leasing transactions that the IRS disallowed. In the third quarter 2008 the IRS issued a settlement offer which the Corporation subsequently accepted. The settlement resolved all tax issues associated with structured leasing transactions.
132
Table of Contents
NOTES TO CONSOLIDATED FINANCIAL STATEMENTS
Comerica Incorporated and Subsidiaries
In 2009 there was a decline in unrecognized tax benefits due to the closing of the IRS examination of years 2001-2004, the amending of certain state income tax returns and the recognition of certain anticipated refunds from the IRS. For further information regarding the settlement refer to the table below.
A reconciliation of the beginning and ending amount of unrecognized tax benefit follows:
| | | | | |
| | Unrecognized
Tax Benefits | |
|---|
| | (in millions)
| |
|---|
Balance at January 1, 2009 | | $ | 70 | |
| | Increases as a result of tax positions taken during a prior period | | | 2 | |
| | Increases as a result of tax positions taken during a current period | | | 1 | |
| | Decreases as a result of filing amended tax returns | | | (34 | ) |
| | Decreases as a result of tax positions taken during a current period | | | (1 | ) |
| | Decreases as a result of tax positions taken during a prior period | | | (38 | ) |
| | | | |
Balance at December 31, 2009 | | $ | — | |
| | | | |
The Corporation anticipates that it is reasonably possible that settlements of federal and state tax issues will result in an increase in unrecognized tax benefits of approximately $6 million within the next twelve months.
Based on current knowledge and probability assessment of various potential outcomes, the Corporation believes that current tax reserves, determined in accordance with income tax guidance, are adequate to cover the matters outlined above, and the amount of any incremental liability arising from these matters is not expected to have a material adverse effect on the Corporation's consolidated financial condition or results of operations. Probabilities and outcomes are reviewed as events unfold, and adjustments to the reserves are made when necessary.
The following tax years for significant jurisdictions remain subject to examination as of December 31, 2009:
| | | | |
Jurisdiction | | Tax Years | |
|---|
Federal | | | 2005-2008 | |
California | | | 2004-2008 | |
On January 1, 2007, the Corporation adopted new leasing guidance that required a recalculation of lease income from the inception of a leveraged lease if, during the lease term, the expected timing of the income tax cash flows generated from a leveraged lease is revised. In 2007 the Corporation recorded a one-time non-cash after-tax charge to beginning retained earnings of $46 million to reflect changes in expected timing of the income tax cash flows generated from affected leveraged leases (structured leasing transactions), which is expected to be recognized as income over periods ranging from 3 years to 18 years.
In 2008 the Corporation reassessed the size and timing of the tax deductions related to the structured leasing transactions discussed above which resulted in a $38 million ($24 million after-tax) charge to lease income in the year ended December 31, 2008. The charges, unless the leases are terminated, will fully reverse over the next 18 years.
133
Table of Contents
NOTES TO CONSOLIDATED FINANCIAL STATEMENTS
Comerica Incorporated and Subsidiaries
The current and deferred components of the provision for income taxes for continuing operations were as follows:
| | | | | | | | | | | | |
| | December 31 | |
|---|
| | 2009 | | 2008 | | 2007 | |
|---|
| | (in millions)
| |
|---|
Current | | | | | | | | | | |
| | Federal | | $ | (28 | ) | $ | 126 | | $ | 322 | |
| | Foreign | | | 6 | | | 10 | | | 11 | |
| | State and local | | | 3 | | | 22 | | | 26 | |
| | | | | | | | |
| | | Total current | | | (19 | ) | | 158 | | | 359 | |
Deferred | | | | | | | | | | |
| | Federal | | | (102 | ) | | (86 | ) | | (51 | ) |
| | State and local | | | (10 | ) | | (13 | ) | | (2 | ) |
| | | | | | | | |
| | | Total deferred | | | (112 | ) | | (99 | ) | | (53 | ) |
| | | | | | | | |
| | | Total | | $ | (131 | ) | $ | 59 | | $ | 306 | |
| | | | | | | | |
Loss from continuing operations before income taxes of $115 million for the year ended December 31, 2009, included $27 million of foreign-source income.
Income from discontinued operations, net of tax, included a provision for income taxes on discontinued operations of $1 million, $1 million and $2 million for the years ended December 31, 2009, 2008 and 2007, respectively. The income tax provision on securities transactions was $85 million, $23 million and $2 million for the years ended December 31, 2009, 2008 and 2007, respectively.
134
Table of Contents
NOTES TO CONSOLIDATED FINANCIAL STATEMENTS
Comerica Incorporated and Subsidiaries
The principal components of deferred tax assets and liabilities were as follows:
| | | | | | | | | |
| | December 31 | |
|---|
| | 2009 | | 2008 | |
|---|
| | (in millions)
| |
|---|
Deferred tax assets: | | | | | | | |
| | Allowance for loan losses | | $ | 344 | | $ | 279 | |
| | Deferred loan origination fees and costs | | | 27 | | | 21 | |
| | Other comprehensive income | | | 192 | | | 175 | |
| | Employee benefits | | | — | | | 17 | |
| | Foreign tax credit | | | 13 | | | 6 | |
| | Tax interest | | | 7 | | | 31 | |
| | Auction-rate securities | | | 24 | | | 29 | |
| | Other temporary differences, net | | | 72 | | | 68 | |
| | | | | | |
| | | Total deferred tax assets before valuation allowance | | | 679 | | | 626 | |
| | Valuation allowance | | | (1 | ) | | (1 | ) |
| | | | | | |
| | | Total deferred tax assets, net of valuation allowance | | | 678 | | | 625 | |
Deferred tax liabilities: | | | | | | | |
| | Lease financing transactions | | | (458 | ) | | (580 | ) |
| | Allowance for depreciation | | | (42 | ) | | (16 | ) |
| | Employee benefits | | | (20 | ) | | — | |
| | | | | | |
| | | Total deferred tax liabilities | | | (520 | ) | | (596 | ) |
| | | | | | |
| | | Net deferred tax asset | | $ | 158 | | $ | 29 | |
| | | | | | |
Included in deferred tax assets at December 31, 2009 were net state tax credit carry-forwards of $5 million. The credits will expire in 2027. The valuation allowance of $1 million for certain state deferred tax assets was unchanged in 2009 compared to 2008. The Corporation determined that a valuation allowance was not needed against the federal deferred tax assets. This determination was based on sufficient taxable income in the carry-back period to absorb a significant portion of the deferred tax assets. The remaining federal deferred tax assets will be absorbed by future reversals of existing taxable temporary differences. For further information on the Corporation's valuation policy for deferred tax assets, refer to Note 1.
At December 31, 2009, the Corporation had undistributed earnings of approximately $146 million related to a foreign subsidiary. The Corporation intends to reinvest these earnings indefinitely. The amount of income tax that would be due on these earnings if repatriated to the United States would be approximately $53 million.
135
Table of Contents
NOTES TO CONSOLIDATED FINANCIAL STATEMENTS
Comerica Incorporated and Subsidiaries
A reconciliation of expected income tax expense at the federal statutory rate of 35 percent to the Corporation's provision for income taxes for continuing operations and effective tax rate follows:
| | | | | | | | | | | | | | | | | | | |
| | Years Ended December 31 | |
|---|
| | 2009 | | 2008 | | 2007 | |
|---|
| | Amount | | Rate | | Amount | | Rate | | Amount | | Rate | |
|---|
| | (dollar amounts in millions)
| |
|---|
Tax based on federal statutory rate | | $ | (40 | ) | | 35.0 | % | $ | 95 | | | 35.0 | % | $ | 346 | | | 35.0 | % |
State income taxes | | | (5 | ) | | 3.9 | | | 5 | | | 2.0 | | | 16 | | | 1.6 | |
Affordable housing and historic credits | | | (46 | ) | | 40.2 | | | (45 | ) | | (16.5 | ) | | (36 | ) | | (3.6 | ) |
Bank-owned life insurance | | | (14 | ) | | 12.0 | | | (15 | ) | | (5.5 | ) | | (14 | ) | | (1.4 | ) |
Disallowance of foreign tax credit | | | — | | | — | | | 9 | | | 3.2 | | | — | | | — | |
Termination of structured leasing transactions | | | (11 | ) | | 9.8 | | | — | | | — | | | — | | | — | |
Other changes in unrecognized tax benefits | | | 1 | | | (1.1 | ) | | 10 | | | 3.7 | | | — | | | — | |
Interest on income tax liabilities | | | (13 | ) | | 10.9 | | | 6 | | | 2.0 | | | 3 | | | 0.3 | |
Other | | | (3 | ) | | 3.0 | | | (6 | ) | | (2.2 | ) | | (9 | ) | | (0.9 | ) |
| | | | | | | | | | | | | | |
Provision (benefit) for income taxes | | $ | (131 | ) | | 113.7 | % | $ | 59 | | | 21.7 | % | $ | 306 | | | 31.0 | % |
| | | | | | | | | | | | | | |
Note 21 — Transactions with Related Parties
The Corporation's banking subsidiaries had, and expect to have in the future, transactions with the Corporation's directors and executive officers, companies with which these individuals are associated, and certain related individuals. Such transactions were made in the ordinary course of business and included extensions of credit, leases and professional services. With respect to extensions of credit, all were made on substantially the same terms, including interest rates and collateral, as those prevailing at the same time for comparable transactions with other customers and did not, in management's opinion, involve more than normal risk of collectibility or present other unfavorable features. The aggregate amount of loans attributable to persons who were related parties at December 31, 2009, totaled $341 million at the beginning of 2009 and $342 million at the end of 2009. During 2009, new loans to related parties aggregated $333 million and repayments totaled $332 million.
Note 22 — Regulatory Capital and Reserve Requirements
Reserves required to be maintained and/or deposited with the FRB were classified in cash and due from banks through September 30, 2008, and were subsequently classified in interest-bearing deposits with banks, coincident with the date the FRB commenced paying interest on such balances. These reserve balances vary, depending on the level of customer deposits in the Corporation's banking subsidiaries. The average required reserve balances were $290 million and $292 million for the years ended December 31, 2009 and 2008, respectively.
Banking regulations limit the transfer of assets in the form of dividends, loans or advances from the bank subsidiaries to the parent company. Under the most restrictive of these regulations, the aggregate amount of dividends which can be paid to the parent company without obtaining prior approval from bank regulatory agencies approximated $56 million at January 1, 2010, plus 2010 net profits. Substantially all the assets of the Corporation's banking subsidiaries are restricted from transfer to the parent company of the Corporation in the form of loans or advances.
Dividends declared to the parent company of the Corporation by its banking subsidiaries amounted to $59 million, $267 million and $614 million in 2009, 2008 and 2007, respectively.
136
Table of Contents
NOTES TO CONSOLIDATED FINANCIAL STATEMENTS
Comerica Incorporated and Subsidiaries
The Corporation and its U.S. banking subsidiaries are subject to various regulatory capital requirements administered by federal and state banking agencies. Quantitative measures established by regulation to ensure capital adequacy require the maintenance of minimum amounts and ratios of Tier 1 and total capital (as defined in the regulations) to average and risk-weighted assets. Failure to meet minimum capital requirements can initiate certain mandatory and possibly additional discretionary actions by regulators that, if undertaken, could have a direct material effect on the Corporation's financial statements. At December 31, 2009 and 2008, the Corporation and its U. S. banking subsidiaries exceeded the ratios required for an institution to be considered "well capitalized" (total risk-based capital, Tier 1 risk-based capital and leverage ratios greater than 10 percent, six percent and five percent, respectively). There were no conditions or events since December 31, 2009 that management believes have changed the capital adequacy classification of the Corporation or its U.S. banking subsidiaries.
The Corporation participated in the U. S. Treasury Capital Purchase Program in the fourth quarter 2008 and issued preferred stock and a related warrant totaling $2.25 billion, which qualifies as Tier 1 capital and significantly increased Tier 1 and total capital ratios for Comerica Incorporated (Consolidated). For more information regarding the Capital Purchase Program, refer to Note 15 to the consolidated financial statements. The following is a summary of the capital position of the Corporation and Comerica Bank, its principal banking subsidiary.
| | | | | | | | |
| | Comerica
Incorporated
(Consolidated) | | Comerica
Bank | |
|---|
| | (dollar amounts in millions)
| |
|---|
December 31, 2009 | | | | | | | |
| | Tier 1 capital (minimum-$2.5 billion (Consolidated)) | | $ | 7,104 | | $ | 5,763 | |
| | Total capital (minimum-$4.9 billion (Consolidated)) | | | 10,468 | | | 8,226 | |
| | Risk-weighted assets | | | 61,815 | | | 61,566 | |
| | Average assets (fourth quarter) | | | 58,153 | | | 57,837 | |
| | Tier 1 capital to risk-weighted assets (minimum-4.0%) | | |
12.46 |
% | |
9.36 |
% |
| | Total capital to risk-weighted assets (minimum-8.0%) | | | 16.93 | | | 13.36 | |
| | Tier 1 capital to average assets (minimum-3.0%) | | | 13.25 | | | 9.96 | |
December 31, 2008 | | | | | | | |
| | Tier 1 capital (minimum-$2.9 billion (Consolidated)) | | $ | 7,805 | | $ | 5,707 | |
| | Total capital (minimum-$5.9 billion (Consolidated)) | | | 10,774 | | | 8,378 | |
| | Risk-weighted assets | | | 73,207 | | | 72,909 | |
| | Average assets (fourth quarter) | | | 66,309 | | | 66,071 | |
| | Tier 1 capital to risk-weighted assets (minimum-4.0%) | | |
10.66 |
% | |
7.83 |
% |
| | Total capital to risk-weighted assets (minimum-8.0%) | | | 14.72 | | | 11.49 | |
| | Tier 1 capital to average assets (minimum-3.0%) | | | 11.77 | | | 8.64 | |
Note 23 — Contingent Liabilities
Legal Proceedings
The Corporation and certain of its subsidiaries are subject to various pending or threatened legal proceedings arising out of the normal course of business or operations. In view of the inherent difficulty of predicting the outcome of such matters, the Corporation cannot state the eventual outcome of these matters. However, based on current knowledge and after consultation with legal counsel, management believes that current reserves are adequate, and the amount of any incremental liability arising from these matters is not
137
Table of Contents
NOTES TO CONSOLIDATED FINANCIAL STATEMENTS
Comerica Incorporated and Subsidiaries
expected to have a material adverse effect on the Corporation's consolidated financial condition. For information regarding income tax contingencies, refer to Note 20.
Note 24 — Business Segment Information
The Corporation has strategically aligned its operations into three major business segments: the Business Bank, the Retail Bank, and Wealth & Institutional Management. These business segments are differentiated based on the type of customer and the related products and services provided. In addition to the three major business segments, the Finance Division is also reported as a segment. Business segment results are produced by the Corporation's internal management accounting system. This system measures financial results based on the internal business unit structure of the Corporation. Information presented is not necessarily comparable with similar information for any other financial institution. The management accounting system assigns balance sheet and income statement items to each business segment using certain methodologies, which are regularly reviewed and refined. For comparability purposes, amounts in all periods are based on business segments and methodologies in effect at December 31, 2009. These methodologies, which are briefly summarized in the following paragraph, may be modified as management accounting systems are enhanced and changes occur in the organizational structure or product lines.
The Corporation's internal funds transfer pricing system records cost of funds or credit for funds using a combination of matched maturity funding for certain assets and liabilities and a blended rate based on various maturities for the remaining assets and liabilities. The allowance for loan losses is allocated to both large business and certain large personal purpose consumer and residential mortgage loans that have deteriorated below certain levels of credit risk based on a non-standard, specifically calculated amount. Additional loan loss reserves are allocated based on industry-specific risk and are maintained to capture probable losses due to the inherent imprecision in the risk rating system and new business migration risk not captured in the credit scores of individual loans. For other business loans, the allowance for loan losses is recorded in business units based on the credit score of each loan outstanding. For other consumer and residential mortgage loans, it is allocated based on applying estimated loss ratios to various segments of the loan portfolio. The related loan loss provision is assigned based on the amount necessary to maintain an allowance for loan losses adequate for each product category. Noninterest income and expenses directly attributable to a line of business are assigned to that business segment. Direct expenses incurred by areas whose services support the overall Corporation are allocated to the business segments as follows: product processing expenditures are allocated based on standard unit costs applied to actual volume measurements; administrative expenses are allocated based on estimated time expended; and corporate overhead is assigned 50 percent based on the ratio of the business segment's noninterest expenses to total noninterest expenses incurred by all business segments and 50 percent based on the ratio of the business segment's attributed equity to total attributed equity of all business segments. Equity is attributed based on credit, operational and interest rate risks. Most of the equity attributed relates to credit risk, which is determined based on the credit score and expected remaining life of each loan, letter of credit and unused commitment recorded in the business units. Operational risk is allocated based on loans and letters of credit, deposit balances, non-earning assets, trust assets under management, certain noninterest income items, and the nature and extent of expenses incurred by business units. Virtually all interest rate risk is assigned to Finance, as are the Corporation's hedging activities.
The following discussion provides information about the activities of each business segment. A discussion of the financial results and the factors impacting 2009 performance can be found in the section entitled "Business Segments" in the financial review.
The Business Bank is primarily composed of the following businesses: Middle Market, Commercial Real Estate, National Dealer Services, International Finance, Global Corporate, Leasing, Financial Services, and Technology and Life Sciences. This business segment meets the needs of medium-size businesses, multinational
138
Table of Contents
NOTES TO CONSOLIDATED FINANCIAL STATEMENTS
Comerica Incorporated and Subsidiaries
corporations and governmental entities by offering various products and services, including commercial loans and lines of credit, deposits, cash management, capital market products, international trade finance, letters of credit, foreign exchange management services and loan syndication services.
The Retail Bank includes small business banking and personal financial services, consisting of consumer lending, consumer deposit gathering and mortgage loan origination. In addition to a full range of financial services provided to small business customers, this business segment offers a variety of consumer products, including deposit accounts, installment loans, credit cards, student loans, home equity lines of credit and residential mortgage loans.
Wealth & Institutional Management offers products and services consisting of fiduciary services, private banking, retirement services, investment management and advisory services, investment banking and discount securities brokerage services. This business segment also offers the sale of annuity products, as well as life, disability and long-term care insurance products.
The Finance segment includes the Corporation's securities portfolio and asset and liability management activities. This segment is responsible for managing the Corporation's funding, liquidity and capital needs, performing interest sensitivity analysis and executing various strategies to manage the Corporation's exposure to liquidity, interest rate risk and foreign exchange risk.
The Other category includes discontinued operations, the income and expense impact of equity and cash, tax benefits not assigned to specific business segments and miscellaneous other expenses of a corporate nature.
Business segment financial results are as follows:
| | | | | | | | | | | | | | | | | | | |
| | Year Ended December 31, 2009 | |
|---|
| | Business
Bank | | Retail
Bank | | Wealth &
Institutional
Management | | Finance | | Other | | Total | |
|---|
| | (dollar amounts in millions)
| |
|---|
Earnings summary: | | | | | | | | | | | | | | | | | | | |
Net interest income (expense) (FTE) | | $ | 1,328 | | $ | 510 | | $ | 161 | | $ | (461 | ) | $ | 37 | | $ | 1,575 | |
Provision for loan losses | | | 860 | | | 143 | | | 62 | | | — | | | 17 | | | 1,082 | |
Noninterest income | | | 291 | | | 190 | | | 269 | | | 292 | | | 8 | | | 1,050 | |
Noninterest expenses | | | 638 | | | 642 | | | 302 | | | 17 | | | 51 | | | 1,650 | |
Provision (benefit) for income taxes (FTE) | | | (26 | ) | | (37 | ) | | 23 | | | (76 | ) | | (7 | ) | | (123 | ) |
Income from discontinued operations, net of tax | | | — | | | — | | | — | | | — | | | 1 | | | 1 | |
| | | | | | | | | | | | | | |
Net income (loss) | | $ | 147 | | $ | (48 | ) | $ | 43 | | $ | (110 | ) | $ | (15 | ) | $ | 17 | |
| | | | | | | | | | | | | | |
Net credit-related charge-offs | | $ | 712 | | $ | 119 | | $ | 38 | | $ | — | | $ | — | | $ | 869 | |
Selected average balances: | | | | | | | | | | | | | | | | | | | |
Assets | | $ | 36,102 | | $ | 6,566 | | $ | 4,883 | | $ | 11,777 | | $ | 3,481 | | $ | 62,809 | |
Loans | | | 35,402 | | | 6,007 | | | 4,758 | | | 1 | | | (6 | ) | | 46,162 | |
Deposits | | | 15,395 | | | 17,409 | | | 2,654 | | | 4,564 | | | 69 | | | 40,091 | |
Liabilities | | | 15,605 | | | 17,378 | | | 2,645 | | | 19,586 | | | 496 | | | 55,710 | |
Attributed equity | | | 3,385 | | | 635 | | | 365 | | | 1,043 | | | 1,671 | | | 7,099 | |
Statistical data: | | | | | | | | | | | | | | | | | | | |
Return on average assets (a) | | | 0.41 | % | | (0.27 | )% | | 0.87 | % | | N/M | | | N/M | | | 0.03 | % |
Return on average attributed equity | | | 4.36 | | | (7.63 | ) | | 11.71 | | | N/M | | | N/M | | | (2.37 | ) |
Net interest margin (b) | | | 3.75 | | | 2.93 | | | 3.35 | | | N/M | | | N/M | | | 2.72 | |
Efficiency ratio | | | 39.36 | | | 91.69 | | | 72.60 | | | N/M | | | N/M | | | 69.25 | |
139
Table of Contents
NOTES TO CONSOLIDATED FINANCIAL STATEMENTS
Comerica Incorporated and Subsidiaries
| | | | | | | | | | | | | | | | | | | |
| | Year Ended December 31, 2008 | |
|---|
| | Business
Bank | | Retail
Bank | | Wealth &
Institutional
Management (c) | | Finance | | Other | | Total | |
|---|
| | (dollar amounts in millions)
| |
|---|
Earnings summary: | | | | | | | | | | | | | | | | | | | |
Net interest income (expense) (FTE) | | $ | 1,277 | | $ | 566 | | $ | 148 | | $ | (147 | ) | $ | (23 | ) | $ | 1,821 | |
Provision for loan losses | | | 543 | | | 123 | | | 25 | | | — | | | (5 | ) | | 686 | |
Noninterest income | | | 302 | | | 258 | | | 292 | | | 68 | | | (27 | ) | | 893 | |
Noninterest expenses | | | 709 | | | 645 | | | 422 | | | 11 | | | (36 | ) | | 1,751 | |
Provision (benefit) for income taxes (FTE) | | | 90 | | | 22 | | | (3 | ) | | (42 | ) | | (2 | ) | | 65 | |
Income from discontinued operations,
net of tax | | | — | | | — | | | — | | | — | | | 1 | | | 1 | |
| | | | | | | | | | | | | | |
Net income (loss) | | $ | 237 | | $ | 34 | | $ | (4 | ) | $ | (48 | ) | $ | (6 | ) | $ | 213 | |
| | | | | | | | | | | | | | |
Net credit-related charge-offs | | $ | 392 | | $ | 64 | | $ | 16 | | $ | — | | $ | — | | $ | 472 | |
Selected average balances: | | | | | | | | | | | | | | | | | | | |
Assets | | $ | 41,786 | | $ | 7,074 | | $ | 4,689 | | $ | 10,011 | | $ | 1,625 | | $ | 65,185 | |
Loans | | | 40,867 | | | 6,342 | | | 4,542 | | | 1 | | | 13 | | | 51,765 | |
Deposits | | | 14,993 | | | 16,965 | | | 2,433 | | | 7,252 | | | 360 | | | 42,003 | |
Liabilities | | | 15,706 | | | 16,961 | | | 2,451 | | | 23,893 | | | 732 | | | 59,743 | |
Attributed equity | | | 3,276 | | | 676 | | | 336 | | | 927 | | | 227 | | | 5,442 | |
Statistical data: | | | | | | | | | | | | | | | | | | | |
Return on average assets (a) | | | 0.57 | % | | 0.19 | % | | (0.09 | )% | | N/M | | | N/M | | | 0.33 | % |
Return on average attributed equity | | | 7.24 | | | 4.98 | | | (1.31 | ) | | N/M | | | N/M | | | 3.79 | |
Net interest margin (b) | | | 3.13 | | | 3.34 | | | 3.24 | | | N/M | | | N/M | | | 3.02 | |
Efficiency ratio | | | 45.29 | | | 83.21 | | | 96.97 | | | N/M | | | N/M | | | 66.17 | |
|
|
Year Ended December 31, 2007 |
|
|---|
| | Business
Bank | | Retail
Bank | | Wealth &
Institutional
Management | | Finance | | Other | | Total | |
|---|
| | (dollar amounts in millions)
| |
|---|
Earnings summary: | | | | | | | | | | | | | | | | | | | |
Net interest income (expense) (FTE) | | $ | 1,349 | | $ | 670 | | $ | 145 | | $ | (133 | ) | $ | (25 | ) | $ | 2,006 | |
Provision for loan losses | | | 178 | | | 41 | | | (3 | ) | | — | | | (4 | ) | | 212 | |
Noninterest income | | | 291 | | | 220 | | | 283 | | | 65 | | | 29 | | | 888 | |
Noninterest expenses | | | 709 | | | 654 | | | 322 | | | 10 | | | (4 | ) | | 1,691 | |
Provision (benefit) for income taxes (FTE) | | | 237 | | | 67 | | | 39 | | | (40 | ) | | 6 | | | 309 | |
Income from discontinued operations, net of tax | | | — | | | — | | | — | | | — | | | 4 | | | 4 | |
| | | | | | | | | | | | | | |
Net income (loss) | | $ | 516 | | $ | 128 | | $ | 70 | | $ | (38 | ) | $ | 10 | | $ | 686 | |
| | | | | | | | | | | | | | |
Net credit-related charge-offs | | $ | 117 | | $ | 34 | | $ | 2 | | $ | — | | $ | — | | $ | 153 | |
Selected average balances: | | | | | | | | | | | | | | | | | | | |
Assets | | $ | 40,762 | | $ | 6,880 | | $ | 4,096 | | $ | 5,669 | | $ | 1,167 | | $ | 58,574 | |
Loans | | | 39,721 | | | 6,134 | | | 3,937 | | | 7 | | | 22 | | | 49,821 | |
Deposits | | | 16,253 | | | 17,156 | | | 2,386 | | | 6,174 | | | (35 | ) | | 41,934 | |
Liabilities | | | 17,090 | | | 17,170 | | | 2,392 | | | 16,530 | | | 322 | | | 53,504 | |
Attributed equity | | | 2,936 | | | 850 | | | 332 | | | 627 | | | 325 | | | 5,070 | |
Statistical data: | | | | | | | | | | | | | | | | | | | |
Return on average assets (a) | | | 1.27 | % | | 0.71 | % | | 1.71 | % | | N/M | | | N/M | | | 1.17 | % |
Return on average attributed equity | | | 17.57 | | | 15.04 | | | 21.15 | | | N/M | | | N/M | | | 13.52 | |
Net interest margin (b) | | | 3.40 | | | 3.92 | | | 3.67 | | | N/M | | | N/M | | | 3.66 | |
Efficiency ratio | | | 43.49 | | | 73.43 | | | 75.17 | | | N/M | | | N/M | | | 58.58 | |
- (a)
- Return on average assets is calculated based on the greater of average assets or average liabilities and attributed equity.
- (b)
- Net interest margin is calculated based on the greater of average earning assets or average deposits and purchased funds.
- (c)
- 2008 included an $88 million net charge ($56 million, after-tax) related to the repurchase of auction-rate securities from customers.
FTE — Fully Taxable Equivalent
N/M — Not Meaningful
140
Table of Contents
NOTES TO CONSOLIDATED FINANCIAL STATEMENTS
Comerica Incorporated and Subsidiaries
The Corporation's management accounting system also produces market segment results for the Corporation's four primary geographic markets: Midwest, Western, Texas, and Florida. In addition to the four primary geographic markets, Other Markets and International are also reported as market segments. Market segment results are provided as supplemental information to the business segment results and may not meet all operating segment criteria as set forth in ASC Topic 280, Segment Reporting. The following discussion provides information about the activities of each market segment. A discussion of the financial results and the factors impacting 2008 performance can be found in the section entitled "Geographic Market Segments" in the financial review.
The Midwest market consists of operations located in the states of Michigan, Ohio and Illinois. Currently, Michigan operations represent the significant majority of this geographic market.
The Western market consists of the states of California, Arizona, Nevada, Colorado and Washington. Currently, California operations represent the significant majority of the Western market.
The Texas and Florida markets consist of operations located in the states of Texas and Florida, respectively.
Other Markets include businesses with a national perspective, the Corporation's investment management and trust alliance businesses as well as activities in all other markets in which the Corporation has operations, except for the International market, as described below.
The International market represents the activity of the Corporation's International Finance division, which provides banking services primarily to foreign-owned, North American-based companies and secondarily to international operations of North American-based companies.
The Finance & Other Businesses segment includes the Corporation's securities portfolio, asset and liability management activities, discontinued operations, the income and expense impact of equity and cash not assigned to specific business/market segments, tax benefits not assigned to specific business/market segments and miscellaneous other expenses of a corporate nature. This segment includes responsibility for managing the Corporation's funding, liquidity and capital needs, performing interest sensitivity analysis and executing various strategies to manage the Corporation's exposure to liquidity, interest rate risk and foreign exchange risk.
141
Table of Contents
NOTES TO CONSOLIDATED FINANCIAL STATEMENTS
Comerica Incorporated and Subsidiaries
Market segment financial results are as follows:
| | | | | | | | | | | | | | | | | | | | | | | | | |
| | Year Ended December 31, 2009 | |
|---|
| | Midwest | | Western | | Texas | | Florida | | Other
Markets | | International | | Finance &
Other
Businesses | | Total | |
|---|
| | (dollar amounts in millions)
| |
|---|
Earnings summary: | | | | | | | | | | | | | | | | | | | | | | | | | |
Net interest income (expense) (FTE) | | $ | 807 | | $ | 623 | | $ | 298 | | $ | 44 | | $ | 158 | | $ | 69 | | $ | (424 | ) | $ | 1,575 | |
Provision for loan losses | | | 448 | | | 358 | | | 85 | | | 59 | | | 82 | | | 33 | | | 17 | | | 1,082 | |
Noninterest income | | | 435 | | | 133 | | | 86 | | | 12 | | | 51 | | | 33 | | | 300 | | | 1,050 | |
Noninterest expenses | | | 761 | | | 432 | | | 238 | | | 37 | | | 83 | | | 31 | | | 68 | | | 1,650 | |
Provision (benefit) for income taxes (FTE) | | | (4 | ) | | (20 | ) | | 21 | | | (17 | ) | | (34 | ) | | 14 | | | (83 | ) | | (123 | ) |
Income from discontinued operations, net of tax | | | — | | | — | | | — | | | — | | | — | | | — | | | 1 | | | 1 | |
| | | | | | | | | | | | | | | | | | |
Net income (loss) | | $ | 37 | | $ | (14 | ) | $ | 40 | | $ | (23 | ) | $ | 78 | | $ | 24 | | $ | (125 | ) | $ | 17 | |
| | | | | | | | | | | | | | | | | | |
Net credit-related charge-offs | | $ | 351 | | $ | 327 | | $ | 53 | | $ | 48 | | $ | 72 | | $ | 18 | | $ | — | | $ | 869 | |
Selected average balances: | | | | | | | | | | | | | | | | | | | | | | | | | |
Assets | | $ | 17,575 | | $ | 14,479 | | $ | 7,604 | | $ | 1,741 | | $ | 4,198 | | $ | 1,954 | | $ | 15,258 | | $ | 62,809 | |
Loans | | | 16,965 | | | 14,281 | | | 7,384 | | | 1,745 | | | 3,883 | | | 1,909 | | | (5 | ) | | 46,162 | |
Deposits | | | 17,117 | | | 11,104 | | | 4,512 | | | 311 | | | 1,586 | | | 828 | | | 4,633 | | | 40,091 | |
Liabilities | | | 17,334 | | | 11,022 | | | 4,516 | | | 300 | | | 1,639 | | | 817 | | | 20,082 | | | 55,710 | |
Attributed equity | | | 1,569 | | | 1,378 | | | 697 | | | 173 | | | 404 | | | 164 | | | 2,714 | | | 7,099 | |
Statistical data: | | | | | | | | | | | | | | | | | | | | | | | | | |
Return on average assets (a) | | | 0.19 | % | | (0.10 | )% | | 0.52 | % | | (1.34 | )% | | 1.87 | % | | 1.25 | % | | N/M | | | 0.03 | % |
Return on average attributed equity | | | 2.34 | | | (1.02 | ) | | 5.70 | | | (13.54 | ) | | 19.41 | | | 14.93 | | | N/M | | | (2.37 | ) |
Net interest margin (b) | | | 4.71 | | | 4.36 | | | 4.03 | | | 2.50 | | | 4.09 | | | 3.53 | | | N/M | | | 2.72 | |
Efficiency ratio | | | 61.23 | | | 57.19 | | | 61.88 | | | 66.96 | | | 42.58 | | | 30.31 | | | N/M | | | 69.25 | |
|
|
Year Ended December 31, 2008 |
|
|---|
| | Midwest | | Western | | Texas | | Florida | | Other
Markets (c) | | International | | Finance & Other
Businesses | | Total | |
|---|
| | (dollar amounts in millions)
| |
|---|
Earnings summary: | | | | | | | | | | | | | | | | | | | | | | | | | |
Net interest income (expense) (FTE) | | $ | 776 | | $ | 668 | | $ | 292 | | $ | 47 | | $ | 147 | | $ | 61 | | $ | (170 | ) | $ | 1,821 | |
Provision for loan losses | | | 155 | | | 379 | | | 51 | | | 40 | | | 62 | | | 4 | | | (5 | ) | | 686 | |
Noninterest income | | | 524 | | | 139 | | | 94 | | | 16 | | | 48 | | | 31 | | | 41 | | | 893 | |
Noninterest expenses | | | 813 | | | 448 | | | 246 | | | 42 | | | 186 | | | 41 | | | (25 | ) | | 1,751 | |
Provision (benefit) for income taxes (FTE) | | | 127 | | | (1 | ) | | 36 | | | (6 | ) | | (65 | ) | | 18 | | | (44 | ) | | 65 | |
Income from discontinued operations, net of tax | | | — | | | — | | | — | | | — | | | — | | | — | | | 1 | | | 1 | |
| | | | | | | | | | | | | | | | | | |
Net income (loss) | | $ | 205 | | $ | (19 | ) | $ | 53 | | $ | (13 | ) | $ | 12 | | $ | 29 | | $ | (54 | ) | $ | 213 | |
| | | | | | | | | | | | | | | | | | |
Net credit-related charge-offs (recoveries) | | $ | 152 | | $ | 241 | | $ | 25 | | $ | 27 | | $ | 26 | | $ | 1 | | $ | — | | $ | 472 | |
Selected average balances: | | | | | | | | | | | | | | | | | | | | | | | | | |
Assets | | $ | 19,786 | | $ | 16,855 | | $ | 8,039 | | $ | 1,896 | | $ | 4,624 | | $ | 2,349 | | $ | 11,636 | | $ | 65,185 | |
Loans | | | 19,062 | | | 16,565 | | | 7,776 | | | 1,892 | | | 4,217 | | | 2,239 | | | 14 | | | 51,765 | |
Deposits | | | 16,039 | | | 11,918 | | | 4,023 | | | 288 | | | 1,374 | | | 749 | | | 7,612 | | | 42,003 | |
Liabilities | | | 16,672 | | | 11,895 | | | 4,040 | | | 283 | | | 1,479 | | | 749 | | | 24,625 | | | 59,743 | |
Attributed equity | | | 1,639 | | | 1,339 | | | 627 | | | 130 | | | 396 | | | 157 | | | 1,154 | | | 5,442 | |
Statistical data: | | | | | | | | | | | | | | | | | | | | | | | | | |
Return on average assets (a) | | | 1.04 | % | | (0.11 | )% | | 0.66 | % | | (0.70 | )% | | 0.25 | % | | 1.25 | % | | N/M | | | 0.33 | % |
Return on average attributed equity | | | 12.50 | | | (1.43 | ) | | 8.48 | | | (10.26 | ) | | 2.95 | | | 18.69 | | | N/M | | | 3.79 | |
Net interest margin (b) | | | 4.07 | | | 4.04 | | | 3.75 | | | 2.47 | | | 3.47 | | | 2.66 | | | N/M | | | 3.02 | |
Efficiency ratio | | | 65.25 | | | 55.82 | | | 64.57 | | | 67.78 | | | 97.69 | | | 43.80 | | | N/M | | | 66.17 | |
142
Table of Contents
NOTES TO CONSOLIDATED FINANCIAL STATEMENTS
Comerica Incorporated and Subsidiaries
| | | | | | | | | | | | | | | | | | | | | | | | | |
| | Year Ended December 31, 2007 | |
|---|
| | Midwest | | Western | | Texas | | Florida | | Other
Markets | | International | | Finance &
Other
Businesses | | Total | |
|---|
| | (dollar amounts in millions)
| |
|---|
Earnings summary: | | | | | | | | | | | | | | | | | | | | | | | | | |
Net interest income
(expense) (FTE) | | $ | 889 | | $ | 740 | | $ | 286 | | $ | 46 | | $ | 135 | | $ | 68 | | $ | (158 | ) | $ | 2,006 | |
Provision for loan losses | | | 88 | | | 108 | | | 8 | | | 11 | | | 16 | | | (15 | ) | | (4 | ) | | 212 | |
Noninterest income | | | 471 | | | 130 | | | 86 | | | 14 | | | 55 | | | 38 | | | 94 | | | 888 | |
Noninterest expenses | | | 820 | | | 456 | | | 235 | | | 38 | | | 92 | | | 44 | | | 6 | | | 1,691 | |
Provision (benefit) for income
taxes (FTE) | | | 158 | | | 116 | | | 45 | | | 4 | | | (7 | ) | | 27 | | | (34 | ) | | 309 | |
Income from discontinued operations, net of tax | | | — | | | — | | | — | | | — | | | — | | | — | | | 4 | | | 4 | |
| | | | | | | | | | | | | | | | | | |
Net income (loss) | | $ | 294 | | $ | 190 | | $ | 84 | | $ | 7 | | $ | 89 | | $ | 50 | | $ | (28 | ) | $ | 686 | |
| | | | | | | | | | | | | | | | | | |
Net credit-related charge-offs | | $ | 110 | | $ | 28 | | $ | 9 | | $ | 2 | | $ | 10 | | $ | (6 | ) | $ | — | | $ | 153 | |
Selected average balances: | | | | | | | | | | | | | | | | | | | | | | | | | |
Assets | | $ | 19,133 | | $ | 17,091 | | $ | 7,106 | | $ | 1,688 | | $ | 4,490 | | $ | 2,230 | | $ | 6,836 | | $ | 58,574 | |
Loans | | | 18,559 | | | 16,552 | | | 6,827 | | | 1,672 | | | 4,081 | | | 2,101 | | | 29 | | | 49,821 | |
Deposits | | | 15,772 | | | 13,325 | | | 3,884 | | | 286 | | | 1,433 | | | 1,095 | | | 6,139 | | | 41,934 | |
Liabilities | | | 16,437 | | | 13,361 | | | 3,901 | | | 287 | | | 1,550 | | | 1,116 | | | 16,852 | | | 53,504 | |
Attributed equity | | | 1,723 | | | 1,213 | | | 595 | | | 97 | | | 335 | | | 155 | | | 952 | | | 5,070 | |
Statistical data: | | | | | | | | | | | | | | | | | | | | | | | | | |
Return on average assets (a) | | | 1.53 | % | | 1.11 | % | | 1.19 | % | | 0.41 | % | | 1.99 | % | | 2.25 | % | | N/M | | | 1.17 | % |
Return on average
attributed equity | | | 16.98 | | | 15.69 | | | 14.19 | | | 7.20 | | | 26.68 | | | 32.42 | | | N/M | | | 13.52 | |
Net interest margin (b) | | | 4.78 | | | 4.48 | | | 4.19 | | | 2.77 | | | 3.34 | | | 3.14 | | | N/M | | | 3.66 | |
Efficiency ratio | | | 60.58 | | | 52.37 | | | 63.12 | | | 63.76 | | | 48.40 | | | 42.36 | | | N/M | | | 58.58 | |
- (a)
- Return on average assets is calculated based on the greater of average assets or average liabilities and attributed equity.
- (b)
- Net interest margin is calculated based on the greater of average earning assets or average deposits and purchased funds.
- (c)
- 2008 included an $88 million net charge ($56 million, after-tax) related to the repurchase of auction-rate securities from customers.
FTE — Fully Taxable Equivalent
N/M — Not Meaningful
143
Table of Contents
NOTES TO CONSOLIDATED FINANCIAL STATEMENTS
Comerica Incorporated and Subsidiaries
Note 25 — Parent Company Financial Statements
BALANCE SHEETS — COMERICA INCORPORATED
| | | | | | | | | | |
| | December 31 | |
|---|
| | 2009 | | 2008 | |
|---|
| | (in millions,
except share data)
| |
|---|
ASSETS | | | | | | | |
Cash and due from subsidiary bank | | $ | 5 | | $ | 11 | |
Short-term investments with subsidiary bank | | | 2,150 | | | 2,329 | |
Other short-term investments | | | 86 | | | 80 | |
Investment in subsidiaries, principally banks | | | 5,710 | | | 5,690 | |
Premises and equipment | | | 4 | | | 5 | |
Other assets | | | 186 | | | 210 | |
| | | | | | |
| | | | Total assets | | $ | 8,141 | | $ | 8,325 | |
| | | | | | |
LIABILITIES AND SHAREHOLDERS' EQUITY | | | | | | | |
Medium- and long-term debt | | $ | 986 | | $ | 1,002 | |
Other liabilities | | | 126 | | | 171 | |
| | | | | | |
| | | | Total liabilities | | | 1,112 | | | 1,173 | |
Fixed rate cumulative perpetual preferred stock, series F, no par value, $1,000 liquidation preference per share: | | | | | | | |
| | | Authorized — 2,250,000 shares | | | | | | | |
| | | Issued — 2,250,000 shares at 12/31/09 and 12/31/08 | | | 2,151 | | | 2,129 | |
Common stock — $5 par value: | | | | | | | |
| | | Authorized — 325,000,000 shares | | | | | | | |
| | | Issued — 178,735,252 shares at 12/31/09 and 12/31/08 | | | 894 | | | 894 | |
Capital surplus | | | 740 | | | 722 | |
Accumulated other comprehensive loss | | | (336 | ) | | (309 | ) |
Retained earnings | | | 5,161 | | | 5,345 | |
Less cost of common stock in treasury — 27,555,623 shares at 12/31/09 and 28,244,967 shares at 12/31/08 | | | (1,581 | ) | | (1,629 | ) |
| | | | | | |
| | | | Total shareholders' equity | | | 7,029 | | | 7,152 | |
| | | | | | |
| | | | Total liabilities and shareholders' equity | | $ | 8,141 | | $ | 8,325 | |
| | | | | | |
144
Table of Contents
NOTES TO CONSOLIDATED FINANCIAL STATEMENTS
Comerica Incorporated and Subsidiaries
STATEMENTS OF INCOME — COMERICA INCORPORATED
| | | | | | | | | | | | |
| | Years Ended
December 31 | |
|---|
| | 2009 | | 2008 | | 2007 | |
|---|
| | (in millions)
| |
|---|
INCOME | | | | | | | | | | |
Income from subsidiaries | | | | | | | | | | |
| | Dividends from subsidiaries | | $ | 59 | | $ | 267 | | $ | 614 | |
| | Other interest income | | | 4 | | | 4 | | | 15 | |
| | Intercompany management fees | | | 44 | | | 156 | | | 149 | |
Other noninterest income | | | 6 | | | (32 | ) | | 15 | |
| | | | | | | | |
| | | Total income | | | 113 | | | 395 | | | 793 | |
EXPENSES | | | | | | | | | | |
Interest on medium- and long-term debt | | | 42 | | | 50 | | | 60 | |
Salaries and employee benefits | | | 88 | | | 74 | | | 108 | |
Net occupancy expense | | | 9 | | | 8 | | | 7 | |
Equipment expense | | | 1 | | | 1 | | | 1 | |
Other noninterest expenses | | | 47 | | | 55 | | | 51 | |
| | | | | | | | |
| | | Total expenses | | | 187 | | | 188 | | | 227 | |
| | | | | | | | |
Income before income taxes and equity in undistributed earnings of subsidiaries | | | (74 | ) | | 207 | | | 566 | |
Provision (benefit) for income taxes | | | (47 | ) | | (25 | ) | | (22 | ) |
| | | | | | | | |
Income before equity in undistributed earnings of subsidiaries | | | (27 | ) | | 232 | | | 588 | |
Equity in undistributed earnings (losses) of subsidiaries, principally banks (including discontinued operations) | | | 44 | | | (19 | ) | | 98 | |
| | | | | | | | |
NET INCOME | |
$ |
17 | |
$ |
213 | |
$ |
686 | |
| | | | | | | | |
Net income (loss) attributable to common shares | | $ | (118 | ) | $ | 192 | | $ | 680 | |
| | | | | | | | |
145
Table of Contents
NOTES TO CONSOLIDATED FINANCIAL STATEMENTS
Comerica Incorporated and Subsidiaries
STATEMENTS OF CASH FLOWS — COMERICA INCORPORATED
| | | | | | | | | | | | |
| | Years Ended
December 31 | |
|---|
| | 2009 | | 2008 | | 2007 | |
|---|
| | (in millions)
| |
|---|
OPERATING ACTIVITIES | | | | | | | | | | |
Net income | | $ | 17 | | $ | 213 | | $ | 686 | |
Adjustments to reconcile net income to net cash provided by operating activities: | | | | | | | | | | |
| | Undistributed (earnings) losses of subsidiaries, principally banks (including discontinued operations) | | | (44 | ) | | 19 | | | (98 | ) |
| | Depreciation and software amortization | | | 1 | | | 1 | | | 1 | |
| | Share-based compensation expense | | | 12 | | | 18 | | | 20 | |
| | Provision (benefit) for deferred income taxes | | | 1 | | | (10 | ) | | (15 | ) |
| | Excess tax benefits from share-based compensation arrangements | | | — | | | — | | | (9 | ) |
| | Other, net | | | 14 | | | 19 | | | 49 | |
| | | | | | | | |
| | | Net cash provided by operating activities | | | 1 | | | 260 | | | 634 | |
INVESTING ACTIVITIES | | | | | | | | | | |
Net proceeds from private equity and venture capital investments | | | — | | | 2 | | | 3 | |
Capital transactions with subsidiaries | | | — | | | — | | | (62 | ) |
Net increase in fixed assets | | | — | | | (2 | ) | | (1 | ) |
| | | | | | | | |
| | | Net cash (used in) provided by investing activities | | | — | | | — | | | (60 | ) |
FINANCING ACTIVITIES | | | | | | | | | | |
Proceeds from issuance of medium- and long-term debt | | | — | | | — | | | 665 | |
Repayment of medium- and long-term debt | | | — | | | — | | | (510 | ) |
Proceeds from issuance of common stock | | | — | | | 1 | | | 89 | |
Proceeds from issuance of preferred stock and related warrant | | | — | | | 2,250 | | | — | |
Purchase of common stock for treasury | | | (1 | ) | | (1 | ) | | (580 | ) |
Dividends paid on common stock | | | (72 | ) | | (395 | ) | | (390 | ) |
Dividends paid on preferred stock | | | (113 | ) | | — | | | — | |
Excess tax benefits from share-based compensation arrangements | | | — | | | — | | | 9 | |
| | | | | | | | |
| | | Net cash provided by (used in) financing activities | | | (186 | ) | | 1,855 | | | (717 | ) |
| | | | | | | | |
Net (decrease) increase in cash and cash equivalents | | | (185 | ) | | 2,115 | | | (143 | ) |
Cash and cash equivalents at beginning of year | | | 2,340 | | | 225 | | | 368 | |
| | | | | | | | |
Cash and cash equivalents at end of year | | $ | 2,155 | | $ | 2,340 | | $ | 225 | |
| | | | | | | | |
Interest paid | | $ | 44 | | $ | 51 | | $ | 57 | |
| | | | | | | | |
Income taxes recovered | | $ | (45 | ) | $ | (3 | ) | $ | (39 | ) |
| | | | | | | | |
146
Table of Contents
NOTES TO CONSOLIDATED FINANCIAL STATEMENTS
Comerica Incorporated and Subsidiaries
Note 26 — Sales of Businesses/Discontinued Operations
In December 2006, the Corporation sold its ownership interest in Munder Capital Management (Munder) to an investor group. The sale agreement included an interest-bearing contingent note with an initial principal amount of $70 million, which will be realized if the Corporation's client-related revenues earned by Munder remain consistent with 2006 levels of approximately $17 million per year for the five years following the closing of the transaction (2007-2011). The principal amount of the note may increase, to a maximum of $80 million, or decrease depending on the level of such revenues earned in the five years following the closing. Repayment of the principal is scheduled to begin after the sixth anniversary of the closing of the transaction from Munder's excess cash flows, as defined in the sale agreement. The note matures in December 2013. Future gains related to the contingent note are expected to be recognized periodically through maturity of the note as targets for the Corporation's client-related revenues earned by Munder and revenue recognition criteria are achieved.
As a result of the sale transaction, the Corporation reported Munder as a discontinued operation in all periods presented. The assets and liabilities related to the discontinued operations of Munder are not material and have not been reclassified on the consolidated balance sheets.
The components of net income from discontinued operations for the years ended December 31, 2009, 2008 and 2007, were as follows:
| | | | | | | | | | | |
| | 2009 | | 2008 | | 2007 | |
|---|
| | (in millions,
except per share data)
| |
|---|
Income from discontinued operations before income taxes | | $ | 2 | | $ | 2 | | $ | 6 | |
Provision for income taxes | | | 1 | | | 1 | | | 2 | |
| | | | | | | | |
Net income from discontinued operations | | $ | 1 | | $ | 1 | | $ | 4 | |
| | | | | | | | |
Earnings per common share from discontinued operations: | | | | | | | | | | |
| | Basic | | $ | 0.01 | | $ | 0.01 | | $ | 0.03 | |
| | Diluted | | | 0.01 | | | — | | | 0.03 | |
147
Table of Contents
NOTES TO CONSOLIDATED FINANCIAL STATEMENTS
Comerica Incorporated and Subsidiaries
Note 27 — Summary of Quarterly Financial Statements (Unaudited)
The following quarterly information is unaudited. However, in the opinion of management, the information reflects all adjustments, which are necessary for the fair presentation of the results of operations, for the periods presented.
| | | | | | | | | | | | | | |
| | 2009 | |
|---|
| | Fourth
Quarter | | Third
Quarter | | Second
Quarter | | First
Quarter | |
|---|
| | (in millions, except per share data)
| |
|---|
Interest income | | $ | 479 | | $ | 511 | | $ | 552 | | $ | 563 | |
Interest expense | | | 83 | | | 126 | | | 150 | | | 179 | |
| | | | | | | | | | |
Net interest income | | | 396 | | | 385 | | | 402 | | | 384 | |
Provision for loan losses | | | 256 | | | 311 | | | 312 | | | 203 | |
Net securities gains | | | 10 | | | 107 | | | 113 | | | 13 | |
Noninterest income (excluding net securities gains) | | | 204 | | | 208 | | | 185 | | | 210 | |
Noninterest expenses | | | 425 | | | 399 | | | 429 | | | 397 | |
Provision (benefit) for income taxes | | | (42 | ) | | (29 | ) | | (59 | ) | | (1 | ) |
| | | | | | | | | | |
Income (loss) from continuing operations | | | (29 | ) | | 19 | | | 18 | | | 8 | |
Income from discontinued operations, net of tax | | | — | | | — | | | — | | | 1 | |
| | | | | | | | | | |
Net income (loss) | | $ | (29 | ) | $ | 19 | | $ | 18 | | $ | 9 | |
| | | | | | | | | | |
Net loss attributable to common shares | | $ | (62 | ) | $ | (16 | ) | $ | (16 | ) | $ | (24 | ) |
| | | | | | | | | | |
Basic earnings per common share: | | | | | | | | | | | | | |
| | Loss from continuing operations | | $ | (0.42 | ) | $ | (0.10 | ) | $ | (0.11 | ) | $ | (0.17 | ) |
| | Net loss | | | (0.42 | ) | | (0.10 | ) | | (0.11 | ) | | (0.16 | ) |
Diluted earnings per common share: | | | | | | | | | | | | | |
| | Loss from continuing operations | | | (0.42 | ) | | (0.10 | ) | | (0.11 | ) | | (0.17 | ) |
| | Net loss | | | (0.42 | ) | | (0.10 | ) | | (0.11 | ) | | (0.16 | ) |
148
Table of Contents
NOTES TO CONSOLIDATED FINANCIAL STATEMENTS
Comerica Incorporated and Subsidiaries
| | | | | | | | | | | | | | |
| | 2008 | |
|---|
| | Fourth
Quarter | | Third
Quarter | | Second
Quarter | | First
Quarter | |
|---|
| | (in millions, except per share data)
| |
|---|
Interest income | | $ | 716 | | $ | 735 | | $ | 737 | | $ | 863 | |
Interest expense | | | 285 | | | 269 | | | 295 | | | 387 | |
| | | | | | | | | | |
Net interest income | | | 431 | | | 466 | | | 442 | | | 476 | |
Provision for loan losses | | | 192 | | | 165 | | | 170 | | | 159 | |
Net securities gains | | | 4 | | | 27 | | | 14 | | | 22 | |
Noninterest income (excluding net securities gains) | | | 170 | | | 213 | | | 228 | | | 215 | |
Noninterest expenses | | | 411 | | | 514 | | | 423 | | | 403 | |
Provision (benefit) for income taxes | | | (17 | ) | | — | | | 35 | | | 41 | |
| | | | | | | | | | |
Income from continuing operations | | | 19 | | | 27 | | | 56 | | | 110 | |
Income (loss) from discontinued operations, net of tax | | | 1 | | | 1 | | | — | | | (1 | ) |
| | | | | | | | | | |
Net income | | $ | 20 | | $ | 28 | | $ | 56 | | $ | 109 | |
| | | | | | | | | | |
Net income attributable to common shares | | $ | 2 | | $ | 28 | | $ | 54 | | $ | 108 | |
| | | | | | | | | | |
Basic earnings per common share: | | | | | | | | | | | | | |
| | Income from continuing operations | | $ | 0.01 | | $ | 0.17 | | $ | 0.36 | | $ | 0.73 | |
| | Net income | | | 0.01 | | | 0.18 | | | 0.36 | | | 0.73 | |
Diluted earnings per common share: | | | | | | | | | | | | | |
| | Income from continuing operations | | | 0.01 | | | 0.17 | | | 0.36 | | | 0.73 | |
| | Net income | | | 0.01 | | | 0.18 | | | 0.36 | | | 0.73 | |
149
Table of Contents
REPORT OF MANAGEMENT
The management of Comerica Incorporated (the Corporation) is responsible for the accompanying consolidated financial statements and all other financial information in this Annual Report. The consolidated financial statements have been prepared in conformity with U.S. generally accepted accounting principles and include amounts which of necessity are based on management's best estimates and judgments and give due consideration to materiality. The other financial information herein is consistent with that in the consolidated financial statements.
In meeting its responsibility for the reliability of the consolidated financial statements, management develops and maintains effective internal controls, including those over financial reporting, as defined in the Securities and Exchange Act of 1934, as amended. The Corporation's internal control over financial reporting includes policies and procedures that (1) pertain to the maintenance of records that, in reasonable detail, accurately and fairly reflect the transactions and dispositions of the assets of the Corporation; (2) provide reasonable assurance that transactions are recorded as necessary to permit preparation of the consolidated financial statements in conformity with U.S. generally accepted accounting principles, and that receipts and expenditures of the Corporation are made only in accordance with authorizations of management and directors of the Corporation; and (3) provide reasonable assurance regarding prevention or timely detection of unauthorized acquisition, use or disposition of the Corporation's assets that could have a material effect on the consolidated financial statements.
Management assessed, with participation of the Corporation's Chief Executive Officer and Chief Financial Officer, internal control over financial reporting as it relates to the Corporation's consolidated financial statements presented in conformity with U.S. generally accepted accounting principles as of December 31, 2009. The assessment was based on criteria for effective internal control over financial reporting described in Internal Control — Integrated Framework issued by the Committee of Sponsoring Organizations of the Treadway Commission (COSO). Based on this assessment, management determined that internal control over financial reporting is effective as it relates to the Corporation's consolidated financial statements presented in conformity with U.S. generally accepted accounting principles as of December 31, 2009.
Because of inherent limitations, internal control over financial reporting may not prevent or detect misstatements. Also, projections of any evaluation of effectiveness to future periods are subject to risk that controls may become inadequate because of changes in conditions, or that the degree of compliance with the policies or procedures may deteriorate.
The consolidated financial statements as of December 31, 2009 were audited by Ernst & Young LLP, an independent registered public accounting firm. The audit was conducted in accordance with the standards of the Public Company Accounting Oversight Board (United States), which required the independent public accountants to obtain reasonable assurance about whether the consolidated financial statements are free of material misstatement and whether effective internal control over financial reporting is maintained in all material respects.
The Corporation's Board of Directors oversees management's internal control over financial reporting and financial reporting responsibilities through its Audit Committee as well as various other committees. The Audit Committee, which consists of directors who are not officers or employees of the Corporation, meets regularly with management, internal audit and the independent public accountants to assure that the Audit Committee, management, internal auditors and the independent public accountants are carrying out their responsibilities, and to review auditing, internal control and financial reporting matters.
| | | | |
| | | | | |
Ralph W. Babb, Jr.
Chairman, President and
Chief Executive Officer |
|
Elizabeth S. Acton
Executive Vice President and
Chief Financial Officer |
|
Marvin J. Elenbaas
Senior Vice President and
Chief Accounting Officer |
150
Table of Contents
REPORT OF INDEPENDENT REGISTERED PUBLIC ACCOUNTING FIRM
Board of Directors and Shareholders
Comerica Incorporated
We have audited Comerica Incorporated's internal control over financial reporting as of December 31, 2009, based on criteria established in Internal Control — Integrated Framework issued by the Committee of Sponsoring Organizations of the Treadway Commission (the COSO criteria). Comerica Incorporated's management is responsible for maintaining effective internal control over financial reporting, and for its assessment of the effectiveness of internal control over financial reporting included in the accompanying Report of Management. Our responsibility is to express an opinion on the Corporation's internal control over financial reporting based on our audit.
We conducted our audit in accordance with the standards of the Public Company Accounting Oversight Board (United States). Those standards require that we plan and perform the audit to obtain reasonable assurance about whether effective internal control over financial reporting was maintained in all material respects. Our audit included obtaining an understanding of internal control over financial reporting, assessing the risk that a material weakness exists, testing and evaluating the design and operating effectiveness of internal control based on the assessed risk, and performing such other procedures as we considered necessary in the circumstances. We believe that our audit provides a reasonable basis for our opinion.
A company's internal control over financial reporting is a process designed to provide reasonable assurance regarding the reliability of financial reporting and the preparation of financial statements for external purposes in accordance with generally accepted accounting principles. A company's internal control over financial reporting includes those policies and procedures that (1) pertain to the maintenance of records that, in reasonable detail, accurately and fairly reflect the transactions and dispositions of the assets of the Corporation; (2) provide reasonable assurance that transactions are recorded as necessary to permit preparation of financial statements in accordance with generally accepted accounting principles, and that receipts and expenditures of the Corporation are being made only in accordance with authorizations of management and directors of the Corporation; and (3) provide reasonable assurance regarding prevention or timely detection of unauthorized acquisition, use, or disposition of the Corporation's assets that could have a material effect on the financial statements.
Because of its inherent limitations, internal control over financial reporting may not prevent or detect misstatements. Also, projections of any evaluation of effectiveness to future periods are subject to the risk that controls may become inadequate because of changes in conditions, or that the degree of compliance with the policies or procedures may deteriorate.
In our opinion, Comerica Incorporated maintained, in all material respects, effective internal control over financial reporting as of December 31, 2009, based on the COSO criteria.
We also have audited, in accordance with the standards of the Public Company Accounting Oversight Board (United States), the 2009 consolidated financial statements of Comerica Incorporated and subsidiaries and our report dated February 25, 2010 expressed an unqualified opinion thereon.
/s/ ERNST & YOUNG LLP
Dallas, Texas
February 25, 2010
151
Table of Contents
REPORT OF INDEPENDENT REGISTERED PUBLIC ACCOUNTING FIRM
Board of Directors and Shareholders
Comerica Incorporated
We have audited the accompanying consolidated balance sheets of Comerica Incorporated and subsidiaries as of December 31, 2009 and 2008, and the related consolidated statements of income, shareholders' equity, and cash flows for each of the three years in the period ended December 31, 2009. These financial statements are the responsibility of the Corporation's management. Our responsibility is to express an opinion on these financial statements based on our audits.
We conducted our audits in accordance with the standards of the Public Company Accounting Oversight Board (United States). Those standards require that we plan and perform the audit to obtain reasonable assurance about whether the financial statements are free of material misstatement. An audit includes examining, on a test basis, evidence supporting the amounts and disclosures in the financial statements. An audit also includes assessing the accounting principles used and significant estimates made by management, as well as evaluating the overall financial statement presentation. We believe that our audits provide a reasonable basis for our opinion.
In our opinion, the financial statements referred to above present fairly, in all material respects, the consolidated financial position of Comerica Incorporated and subsidiaries at December 31, 2009 and 2008, and the consolidated results of their operations and their cash flows for each of the three years in the period ended December 31, 2009, in conformity with U.S. generally accepted accounting principles.
We also have audited, in accordance with the standards of the Public Company Accounting Oversight Board (United States), Comerica Incorporated's internal control over financial reporting as of December 31, 2009, based on criteria established in Internal Control-Integrated Framework issued by the Committee of Sponsoring Organizations of the Treadway Commission and our report dated February 25, 2010, expressed an unqualified opinion thereon.
/s/ ERNST & YOUNG LLP
Dallas, Texas
February 25, 2010
152
Table of Contents
HISTORICAL REVIEW — AVERAGE BALANCE SHEETS
Comerica Incorporated and Subsidiaries
CONSOLIDATED FINANCIAL INFORMATION
| | | | | | | | | | | | | | | | | | |
| | Years Ended December 31 | |
|---|
| | 2009 | | 2008 | | 2007 | | 2006 | | 2005 | |
|---|
| | (in millions)
| |
|---|
ASSETS | | | | | | | | | | | | | | | | |
Cash and due from banks | | $ | 883 | | $ | 1,185 | | $ | 1,352 | | $ | 1,557 | | $ | 1,721 | |
Federal funds sold and securities purchased under agreements to resell | | |
18 | | |
93 | | |
164 | | |
283 | | |
390 | |
Interest-bearing deposits with banks | | | 2,440 | | | 219 | | | 15 | | | 110 | | | 30 | |
Other short-term investments | | | 154 | | | 244 | | | 241 | | | 156 | | | 135 | |
Investment securities available-for-sale | | |
9,388 | | |
8,101 | | |
4,447 | | |
3,992 | | |
3,861 | |
Commercial loans | | |
24,534 | | |
28,870 | | |
28,132 | | |
27,341 | | |
24,575 | |
Real estate construction loans | | | 4,140 | | | 4,715 | | | 4,552 | | | 3,905 | | | 3,194 | |
Commercial mortgage loans | | | 10,415 | | | 10,411 | | | 9,771 | | | 9,278 | | | 8,566 | |
Residential mortgage loans | | | 1,756 | | | 1,886 | | | 1,814 | | | 1,570 | | | 1,388 | |
Consumer loans | | | 2,553 | | | 2,559 | | | 2,367 | | | 2,533 | | | 2,696 | |
Lease financing | | | 1,231 | | | 1,356 | | | 1,302 | | | 1,314 | | | 1,283 | |
International loans | | | 1,533 | | | 1,968 | | | 1,883 | | | 1,809 | | | 2,114 | |
| | | | | | | | | | | | |
| | | Total loans | | | 46,162 | | | 51,765 | | | 49,821 | | | 47,750 | | | 43,816 | |
Less allowance for loan losses | | | (947 | ) | | (691 | ) | | (520 | ) | | (499 | ) | | (623 | ) |
| | | | | | | | | | | | |
| | | Net loans | | | 45,215 | | | 51,074 | | | 49,301 | | | 47,251 | | | 43,193 | |
Accrued income and other assets | | | 4,711 | | | 4,269 | | | 3,054 | | | 3,230 | | | 3,176 | |
| | | | | | | | | | | | |
| | | Total assets | | $ | 62,809 | | $ | 65,185 | | $ | 58,574 | | $ | 56,579 | | $ | 52,506 | |
| | | | | | | | | | | | |
LIABILITIES AND SHAREHOLDERS' EQUITY | | | | | | | | | | | | | | | | |
Noninterest-bearing deposits | | $ | 12,900 | | $ | 10,623 | | $ | 11,287 | | $ | 13,135 | | $ | 15,007 | |
Money market and NOW deposits | | |
12,965 | | |
14,245 | | |
14,937 | | |
15,373 | | |
17,282 | |
Savings deposits | | | 1,339 | | | 1,344 | | | 1,389 | | | 1,441 | | | 1,545 | |
Customer certificates of deposit | | | 8,131 | | | 8,150 | | | 7,687 | | | 6,505 | | | 5,418 | |
| | | | | | | | | | | | |
| | Total interest-bearing core deposits | | | 22,435 | | | 23,739 | | | 24,013 | | | 23,319 | | | 24,245 | |
Other time deposits | | | 4,103 | | | 6,715 | | | 5,563 | | | 4,489 | | | 511 | |
Foreign office time deposits | | | 653 | | | 926 | | | 1,071 | | | 1,131 | | | 877 | |
| | | | | | | | | | | | |
| | Total interest-bearing deposits | | | 27,191 | | | 31,380 | | | 30,647 | | | 28,939 | | | 25,633 | |
| | | | | | | | | | | | |
| | | Total deposits | | | 40,091 | | | 42,003 | | | 41,934 | | | 42,074 | | | 40,640 | |
Short-term borrowings | | | 1,000 | | | 3,763 | | | 2,080 | | | 2,654 | | | 1,451 | |
Accrued expenses and other liabilities | | | 1,285 | | | 1,520 | | | 1,293 | | | 1,268 | | | 1,132 | |
Medium- and long-term debt | | | 13,334 | | | 12,457 | | | 8,197 | | | 5,407 | | | 4,186 | |
| | | | | | | | | | | | |
| | | Total liabilities | | | 55,710 | | | 59,743 | | | 53,504 | | | 51,403 | | | 47,409 | |
Total shareholders' equity | | | 7,099 | | | 5,442 | | | 5,070 | | | 5,176 | | | 5,097 | |
| | | | | | | | | | | | |
| | | Total liabilities and shareholders' equity | | $ | 62,809 | | $ | 65,185 | | $ | 58,574 | | $ | 56,579 | | $ | 52,506 | |
| | | | | | | | | | | | |
153
Table of Contents
HISTORICAL REVIEW — STATEMENTS OF INCOME
Comerica Incorporated and Subsidiaries
CONSOLIDATED FINANCIAL INFORMATION
| | | | | | | | | | | | | | | | | | |
| | Years Ended December 31 | |
|---|
| | 2009 | | 2008 | | 2007 | | 2006 | | 2005 | |
|---|
| | (in millions, except per share data)
| |
|---|
INTEREST INCOME | | | | | | | | | | | | | | | | |
Interest and fees on loans | | $ | 1,767 | | $ | 2,649 | | $ | 3,501 | | $ | 3,216 | | $ | 2,554 | |
Interest on investment securities | | | 329 | | | 389 | | | 206 | | | 174 | | | 148 | |
Interest on short-term investments | | | 9 | | | 13 | | | 23 | | | 32 | | | 24 | |
| | | | | | | | | | | | |
| | | Total interest income | | | 2,105 | | | 3,051 | | | 3,730 | | | 3,422 | | | 2,726 | |
INTEREST EXPENSE | | | | | | | | | | | | | | | | |
Interest on deposits | | | 372 | | | 734 | | | 1,167 | | | 1,005 | | | 548 | |
Interest on short-term borrowings | | | 2 | | | 87 | | | 105 | | | 130 | | | 52 | |
Interest on medium- and long-term debt | | | 164 | | | 415 | | | 455 | | | 304 | | | 170 | |
| | | | | | | | | | | | |
| | | Total interest expense | | | 538 | | | 1,236 | | | 1,727 | | | 1,439 | | | 770 | |
| | | | | | | | | | | | |
| | | Net interest income | | | 1,567 | | | 1,815 | | | 2,003 | | | 1,983 | | | 1,956 | |
Provision for loan losses | | | 1,082 | | | 686 | | | 212 | | | 37 | | | (47 | ) |
| | | | | | | | | | | | |
| | | Net interest income after provision for loan losses | | | 485 | | | 1,129 | | | 1,791 | | | 1,946 | | | 2,003 | |
NONINTEREST INCOME | | | | | | | | | | | | | | | | |
Service charges on deposit accounts | | | 228 | | | 229 | | | 221 | | | 218 | | | 218 | |
Fiduciary income | | | 161 | | | 199 | | | 199 | | | 180 | | | 174 | |
Commercial lending fees | | | 79 | | | 69 | | | 75 | | | 65 | | | 63 | |
Letter of credit fees | | | 69 | | | 69 | | | 63 | | | 64 | | | 70 | |
Card fees | | | 51 | | | 58 | | | 54 | | | 46 | | | 39 | |
Foreign exchange income | | | 41 | | | 40 | | | 40 | | | 38 | | | 37 | |
Bank-owned life insurance | | | 35 | | | 38 | | | 36 | | | 40 | | | 38 | |
Brokerage fees | | | 31 | | | 42 | | | 43 | | | 40 | | | 36 | |
Net securities gains | | | 243 | | | 67 | | | 7 | | | — | | | — | |
Income from lawsuit settlement | | | — | | | — | | | — | | | 47 | | | — | |
Other noninterest income | | | 112 | | | 82 | | | 150 | | | 117 | | | 144 | |
| | | | | | | | | | | | |
| | | Total noninterest income | | | 1,050 | | | 893 | | | 888 | | | 855 | | | 819 | |
NONINTEREST EXPENSES | | | | | | | | | | | | | | | | |
Salaries | | | 687 | | | 781 | | | 844 | | | 823 | | | 786 | |
Employee benefits | | | 210 | | | 194 | | | 193 | | | 184 | | | 178 | |
| | | | | | | | | | | | |
| | | Total salaries and employee benefits | | | 897 | | | 975 | | | 1,037 | | | 1,007 | | | 964 | |
Net occupancy expense | | | 162 | | | 156 | | | 138 | | | 125 | | | 118 | |
Equipment expense | | | 62 | | | 62 | | | 60 | | | 55 | | | 53 | |
Outside processing fee expense | | | 97 | | | 104 | | | 91 | | | 85 | | | 77 | |
FDIC insurance expense | | | 90 | | | 16 | | | 5 | | | 5 | | | 7 | |
Software expense | | | 84 | | | 76 | | | 63 | | | 56 | | | 49 | |
Other real estate expense | | | 48 | | | 10 | | | 7 | | | 4 | | | 12 | |
Legal fees | | | 37 | | | 29 | | | 24 | | | 28 | | | 26 | |
Litigation and operational losses | | | 10 | | | 103 | | | 18 | | | 11 | | | 14 | |
Customer services | | | 4 | | | 13 | | | 43 | | | 47 | | | 69 | |
Provision for credit losses on lending-related commitments | | | — | | | 18 | | | (1 | ) | | 5 | | | 18 | |
Other noninterest expenses | | | 159 | | | 189 | | | 206 | | | 246 | | | 206 | |
| | | | | | | | | | | | |
| | | Total noninterest expenses | | | 1,650 | | | 1,751 | | | 1,691 | | | 1,674 | | | 1,613 | |
| | | | | | | | | | | | |
Income (loss) from continuing operations before income taxes | | | (115 | ) | | 271 | | | 988 | | | 1,127 | | | 1,209 | |
Provision (benefit) for income taxes | | | (131 | ) | | 59 | | | 306 | | | 345 | | | 393 | |
| | | | | | | | | | | | |
Income from continuing operations | | | 16 | | | 212 | | | 682 | | | 782 | | | 816 | |
Income from discontinued operations, net of tax | | | 1 | | | 1 | | | 4 | | | 111 | | | 45 | |
| | | | | | | | | | | | |
NET INCOME | | $ | 17 | | $ | 213 | | $ | 686 | | $ | 893 | | $ | 861 | |
| | | | | | | | | | | | |
Net income (loss) attributable to common shares | | $ | (118 | ) | $ | 192 | | $ | 680 | | $ | 886 | | $ | 858 | |
| | | | | | | | | | | | |
Basic earnings per common share: | | | | | | | | | | | | | | | | |
| | Income (loss) from continuing operations | | $ | (0.80 | ) | $ | 1.28 | | $ | 4.43 | | $ | 4.85 | | $ | 4.88 | |
| | Net income (loss) | | | (0.79 | ) | | 1.29 | | | 4.45 | | | 5.53 | | | 5.15 | |
Diluted earnings per common share: | | | | | | | | | | | | | | | | |
| | Income (loss) from continuing operations | | | (0.80 | ) | | 1.28 | | | 4.40 | | | 4.81 | | | 4.84 | |
| | Net income (loss) | | | (0.79 | ) | | 1.28 | | | 4.43 | | | 5.49 | | | 5.11 | |
Cash dividends declared on common stock | | |
30 | | |
348 | | |
393 | | |
380 | | |
367 | |
Cash dividends declared per common share | | | 0.20 | | | 2.31 | | | 2.56 | | | 2.36 | | | 2.20 | |
154
Table of Contents
HISTORICAL REVIEW — STATISTICAL DATA
Comerica Incorporated and Subsidiaries
CONSOLIDATED FINANCIAL INFORMATION
| | | | | | | | | | | | | | | | | | |
| | Years Ended December 31 | |
|---|
| | 2009 | | 2008 | | 2007 | | 2006 | | 2005 | |
|---|
AVERAGE RATES (FULLY TAXABLE EQUIVALENT BASIS) | | | | | | | | | | | | | | | | |
Federal funds sold and securities purchased under agreements to resell | | | 0.32 | % | | 2.08 | % | | 5.28 | % | | 5.15 | % | | 3.29 | % |
Interest-bearing deposits with banks | | | 0.25 | | | 0.61 | | | 4.00 | | | 5.86 | | | 9.97 | |
Other short-term investments | | | 1.74 | | | 3.98 | | | 5.75 | | | 7.26 | | | 6.62 | |
Investment securities available-for-sale | | |
3.61 | | |
4.83 | | |
4.56 | | |
4.22 | | |
3.76 | |
Commercial loans | | |
3.63 | | |
5.08 | | |
7.25 | | |
6.87 | | |
5.62 | |
Real estate construction loans | | | 2.92 | | | 4.89 | | | 8.21 | | | 8.61 | | | 7.23 | |
Commercial mortgage loans | | | 4.20 | | | 5.57 | | | 7.26 | | | 7.27 | | | 6.23 | |
Residential mortgage loans | | | 5.53 | | | 5.94 | | | 6.13 | | | 6.02 | | | 5.74 | |
Consumer loans | | | 3.68 | | | 5.08 | | | 7.00 | | | 7.13 | | | 5.89 | |
Lease financing | | | 3.25 | | | 0.59 | | | 3.04 | | | 4.00 | | | 3.81 | |
International loans | | | 3.79 | | | 5.13 | | | 7.06 | | | 7.01 | | | 5.98 | |
| | | | | | | | | | | | |
| | | Total loans | | | 3.84 | | | 5.13 | | | 7.03 | | | 6.74 | | | 5.84 | |
| | | | | | | | | | | | |
| | | Interest income as a percentage of earning assets | | | 3.64 | | | 5.06 | | | 6.82 | | | 6.53 | | | 5.65 | |
Domestic deposits | | |
1.39 | | |
2.33 | | |
3.77 | | |
3.42 | | |
2.07 | |
Deposits in foreign offices | | | 0.29 | | | 2.77 | | | 4.85 | | | 4.82 | | | 4.18 | |
| | | | | | | | | | | | |
| | | Total interest-bearing deposits | | | 1.37 | | | 2.34 | | | 3.81 | | | 3.47 | | | 2.14 | |
Short-term borrowings | | | 0.24 | | | 2.30 | | | 5.06 | | | 4.89 | | | 3.59 | |
Medium- and long-term debt | | | 1.23 | | | 3.33 | | | 5.55 | | | 5.63 | | | 4.05 | |
| | | | | | | | | | | | |
| | | Interest expense as a percentage of interest-bearing sources | | | 1.29 | | | 2.59 | | | 4.22 | | | 3.89 | | | 2.46 | |
| | | | | | | | | | | | |
Interest rate spread | | | 2.35 | | | 2.47 | | | 2.60 | | | 2.64 | | | 3.19 | |
Impact of net noninterest-bearing sources of funds | | | 0.37 | | | 0.55 | | | 1.06 | | | 1.15 | | | 0.87 | |
| | | | | | | | | | | | |
Net interest margin as a percentage of earning assets | | | 2.72 | % | | 3.02 | % | | 3.66 | % | | 3.79 | % | | 4.06 | % |
| | | | | | | | | | | | |
RATIOS | | | | | | | | | | | | | | | | |
Return on average common shareholders' equity | | | (2.37 | )% | | 3.79 | % | | 13.52 | % | | 17.24 | % | | 16.90 | % |
Return on average assets | | | 0.03 | | | 0.33 | | | 1.17 | | | 1.58 | | | 1.64 | |
Efficiency ratio | | | 69.25 | | | 66.17 | | | 58.58 | | | 58.92 | | | 58.01 | |
Tier 1 common capital as a percentage of risk-weighted assets (a) | | | 8.18 | | | 7.08 | | | 6.85 | | | 7.54 | | | 7.78 | |
Tier 1 capital as a percentage of risk-weighted assets | | | 12.46 | | | 10.66 | | | 7.51 | | | 8.03 | | | 8.38 | |
Total capital as a percentage of risk-weighted assets | | | 16.93 | | | 14.72 | | | 11.20 | | | 11.64 | | | 11.65 | |
Tangible common equity as a percentage of tangible assets (a) | | | 7.99 | | | 7.21 | | | 7.97 | | | 8.62 | | | 9.16 | |
PER COMMON SHARE DATA | | | | | | | | | | | | | | | | |
Book value at year-end | | $ | 31.82 | | $ | 33.31 | | $ | 34.12 | | $ | 32.70 | | $ | 31.11 | |
Market value at year-end | | | 29.57 | | | 19.85 | | | 43.53 | | | 58.68 | | | 56.76 | |
Market value for the year | | | | | | | | | | | | | | | | |
| | | High | | | 32.30 | | | 45.19 | | | 63.89 | | | 60.10 | | | 63.38 | |
| | | Low | | | 11.72 | | | 15.05 | | | 39.62 | | | 50.12 | | | 53.17 | |
OTHER DATA (share data in millions) | | | | | | | | | | | | | | | | |
Average common shares outstanding — basic | | | 149 | | | 149 | | | 153 | | | 160 | | | 167 | |
Average common shares outstanding — diluted | | | 149 | | | 149 | | | 154 | | | 161 | | | 168 | |
Number of banking centers | | |
447 | | |
439 | | |
417 | | |
393 | | |
383 | |
Number of employees (full-time equivalent) | | | | | | | | | | | | | | | | |
| | | Continuing operations | | | 9,330 | | | 10,186 | | | 10,782 | | | 10,700 | | | 10,636 | |
| | | Discontinued operations | | | — | | | — | | | — | | | — | | | 180 | |
- (a)
- See Supplemental Financial Data section for reconcilements of non-GAAP financial measures.
155