Exhibit 99.1
Comerica Incorporated Sandler O’Neill’s 2008 Financial Services Conference Palm Beach, Florida November 12-14, 2008 |
2 Safe Harbor Statement Any statements in this presentation that are not historical facts are forward-looking statements as defined in the Private Securities Litigation Reform Act of 1995. Words such as “anticipates,” “believes,” “feels,” “expects,” “estimates,” “seeks,” “strives,” “plans,” “intends,” “outlook,” “forecast,” “position,” “target,” “mission,” “assume,” “achievable,” “potential,” “strategy,” “goal,” “aspiration,” “outcome,” “continue,” “remain,” “maintain,” “trend,” “objective” and variations of such words and similar expressions, or future or conditional verbs such as “will,” “would,” “should,” “could,” “might,” “can,” “may” or similar expressions, as they relate to Comerica or its management, are intended to identify forward-looking statements. These forward-looking statements are predicated on the beliefs and assumptions of Comerica’s management based on information known to Comerica’s management as of the date of this presentation and do not purport to speak as of any other date. Forward-looking statements may include descriptions of plans and objectives of Comerica’s management for future or past operations, products or services, and forecasts of Comerica’s revenue, earnings or other measures of economic performance, including statements of profitability, business segments and subsidiaries, estimates of credit trends and global stability. Such statements reflect the view of Comerica’s management as of this date with respect to future events and are subject to risks and uncertainties. Should one or more of these risks materialize or should underlying beliefs or assumptions prove incorrect, Comerica’s actual results could differ materially from those discussed. Factors that could cause or contribute to such differences are further economic downturns, changes in the pace of an economic recovery and related changes in employment levels, changes in real estate values, fuel prices, energy costs or other events that could affect customer income levels or general economic conditions, changes related to the headquarters relocation or to its underlying assumptions, the effects of war and other armed conflicts or acts of terrorism, the effects of natural disasters including, but not limited to, hurricanes, tornadoes, earthquakes, fires, droughts and floods, the disruption of private or public utilities, the implementation of Comerica’s strategies and business models, management’s ability to maintain and expand customer relationships, changes in customer borrowing, repayment, investment and deposit practices, management’s ability to retain key officers and employees, changes in the accounting treatment of any particular item, the impact of regulatory examinations, declines or other changes in the businesses or industries in which Comerica has a concentration of loans, including, but not limited to, the automotive production industry and the real estate business lines, the anticipated performance of any new banking centers, the entry of new competitors in Comerica’s markets, changes in the level of fee income, changes in applicable laws and regulations, including those concerning taxes, banking, securities and insurance, changes in trade, monetary and fiscal policies, including the interest rate policies of the Board of Governors of the Federal Reserve System, fluctuations in inflation or interest rates, changes in general economic, political or industry conditions and related credit and market conditions, the interdependence of financial service companies and adverse conditions in the stock market. Comerica cautions that the foregoing list of factors is not exclusive. For discussion of these and other factors that may cause actual results to differ from expectations, please refer to our filings with the Securities and Exchange Commission. Forward-looking statements speak only as of the date they are made. Comerica does not undertake to update forward-looking statements to reflect facts, circumstances, assumptions or events that occur after the date the forward-looking statements are made. For any forward-looking statements made in this presentation or in any documents, Comerica claims the protection of the safe harbor for forward-looking statements contained in the Private Securities Litigation Reform Act of 1995. Legal |
3 Comerica: A Brief Overview Among the top 20 bank holding companies in the U.S. Largest headquartered bank in Texas $65 billion in assets as of September 30, 2008 Founded 160 years ago Major markets include: Continued investments in growth markets Solid capital position • California • Arizona Corporate Overview • Florida • Michigan • Texas At September 30, 2008 |
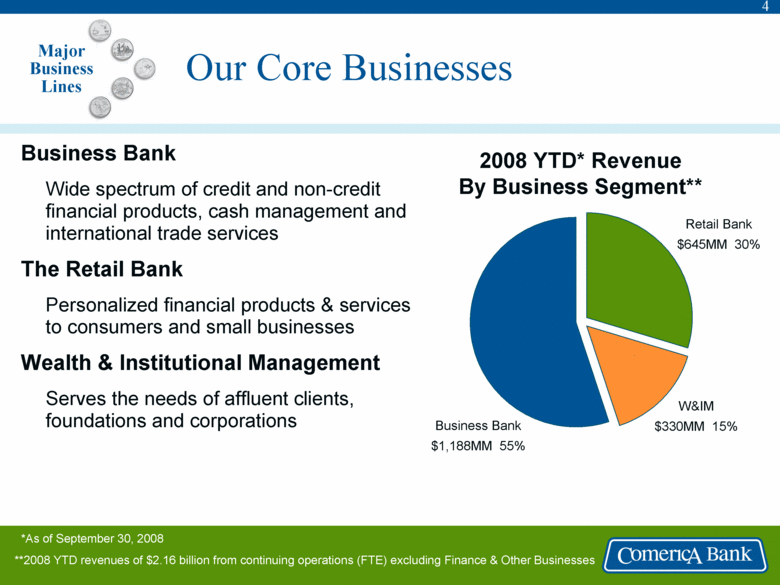
4 Our Core Businesses Business Bank Wide spectrum of credit and non-credit financial products, cash management and international trade services The Retail Bank Personalized financial products & services to consumers and small businesses Wealth & Institutional Management Serves the needs of affluent clients, foundations and corporations Business Bank $1,188MM 55% W&IM $330MM 15% Retail Bank $645MM 30% 2008 YTD* Revenue By Business Segment** Major Business Lines *As of September 30, 2008 **2008 YTD revenues of $2.16 billion from continuing operations (FTE) excluding Finance & Other Businesses |
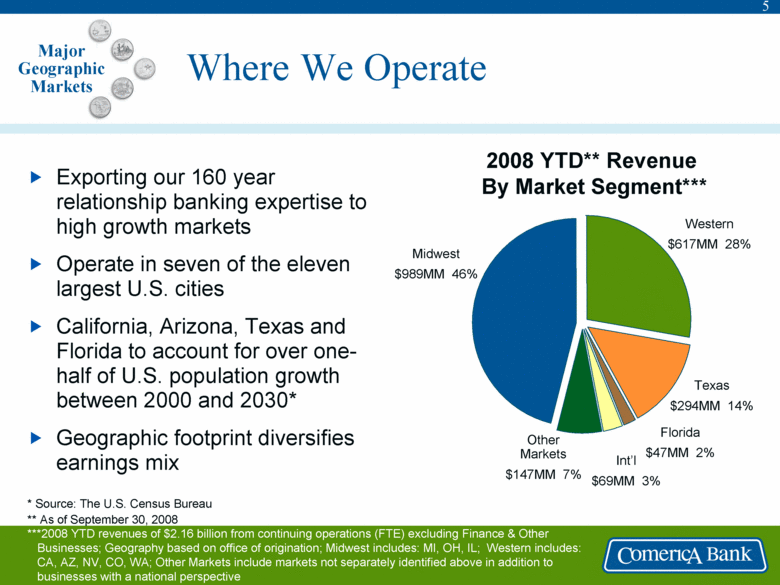
5 Where We Operate Midwest $989MM 46% Western $617MM 28% Texas $294MM 14% Florida $47MM 2% * Source: The U.S. Census Bureau ** As of September 30, 2008 ***2008 YTD revenues of $2.16 billion from continuing operations (FTE) excluding Finance & Other Businesses; Geography based on office of origination; Midwest includes: MI, OH, IL; Western includes: CA, AZ, NV, CO, WA; Other Markets include markets not separately identified above in addition to businesses with a national perspective Other Markets $147MM 7% Int’l $69MM 3% Exporting our 160 year relationship banking expertise to high growth markets Operate in seven of the eleven largest U.S. cities California, Arizona, Texas and Florida to account for over one-half of U.S. population growth between 2000 and 2030* Geographic footprint diversifies earnings mix 2008 YTD** Revenue By Market Segment*** Major Geographic Markets |
6 Our Focus Credit quality Continuous enhancement of risk management processes Loan optimization Building and enhancing customer relationships Expanding in our higher growth markets Leveraging our expertise to Texas and the Western market Deposit growth Continued investments to help achieve balance amongst our businesses Expense control Holding ourselves accountable Capital management Strategic Overview |
7 How Comerica Delivers Credit Risk Management Credit Continuous review of policies Quantitatively based risk models Credit loss forecasting model Migration studies Independent Asset Quality Review function Highly effective Special Asset Group |
8 Third Quarter 2008 Credit Quality Stable net charge-offs (1Q08-3Q08) Nonperforming assets are manageable Nonaccrual loans have been appropriately charged down Allowance to loan ratio increased as we continued to provide in excess of net charge-offs Credit quality concerns focused on CA residential real estate development Credit |
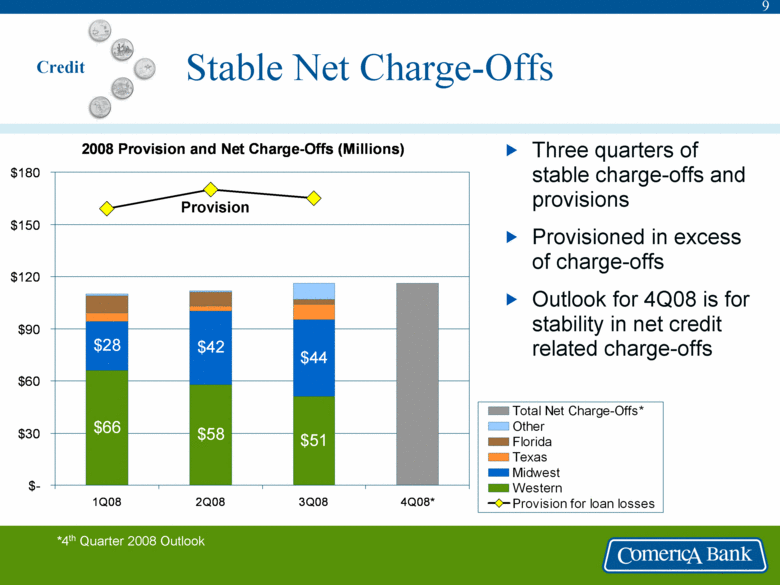
9 2008 Provision and Net Charge-Offs (Millions) $51 $58 $66 $44 $42 $28 $- $30 $60 $90 $120 $150 $180 1Q08 2Q08 3Q08 4Q08* Total Net Charge-Offs* Other Florida Texas Midwest Western Provision for loan losses Stable Net Charge-Offs Credit Three quarters of stable charge-offs and provisions Provisioned in excess of charge-offs Outlook for 4Q08 is for stability in net credit related charge-offs *4th Quarter 2008 Outlook Provision |
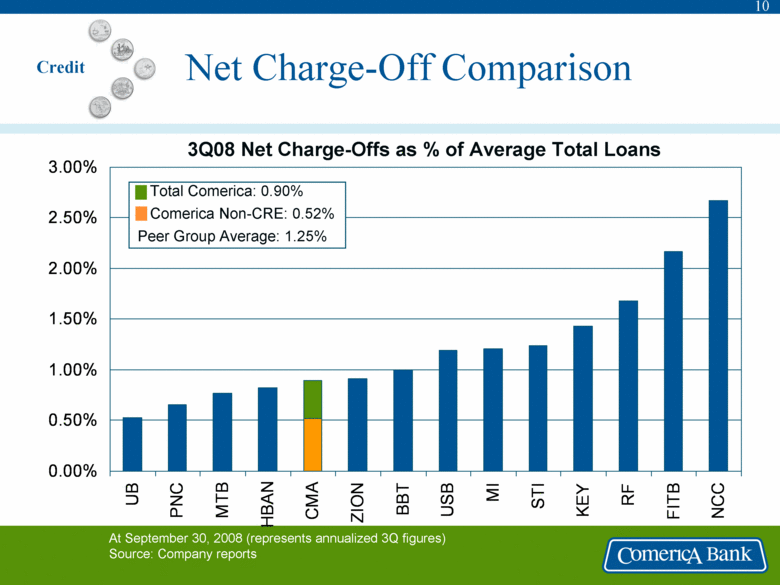
10 0.00% 0.50% 1.00% 1.50% 2.00% 2.50% 3.00% UB PNC MTB HBAN CMA ZION BBT USB MI STI KEY RF FITB NCC 3Q08 Net Charge-Offs as % of Average Total Loans At September 30, 2008 (represents annualized 3Q figures) Source: Company reports Net Charge-Off Comparison Total Comerica: 0.90% Comerica Non-CRE: 0.52% Peer Group Average: 1.25% Credit |
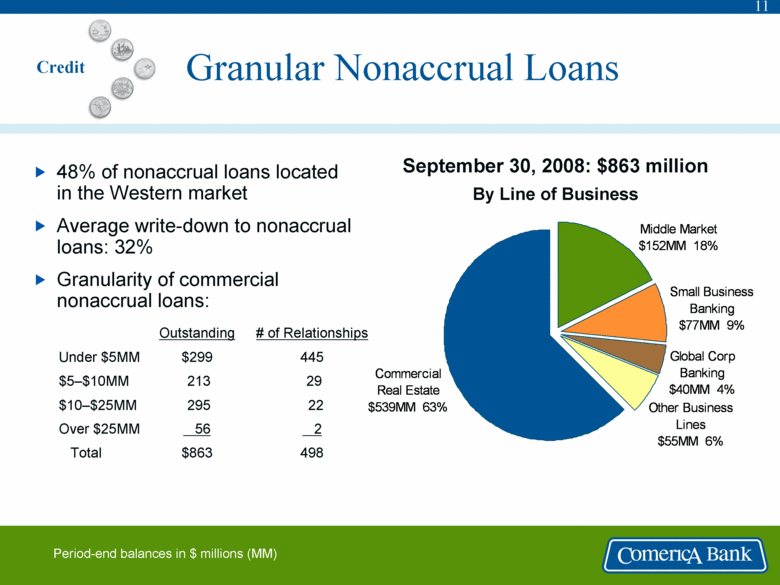
11 Other Business Lines $55MM 6% Global Corp Banking $40MM 4% Small Business Banking $77MM 9% Middle Market $152MM 18% Commercial Real Estate $539MM 63% Granular Nonaccrual Loans September 30, 2008: $863 million By Line of Business Period-end balances in $ millions (MM) 48% of nonaccrual loans located in the Western market Average write-down to nonaccrual loans: 32% Granularity of commercial nonaccrual loans: 2 56 Over $25MM 498 $863 Total 22 295 $10–$25MM 29 213 $5–$10MM 445 $299 Under $5MM # of Relationships Outstanding Credit |
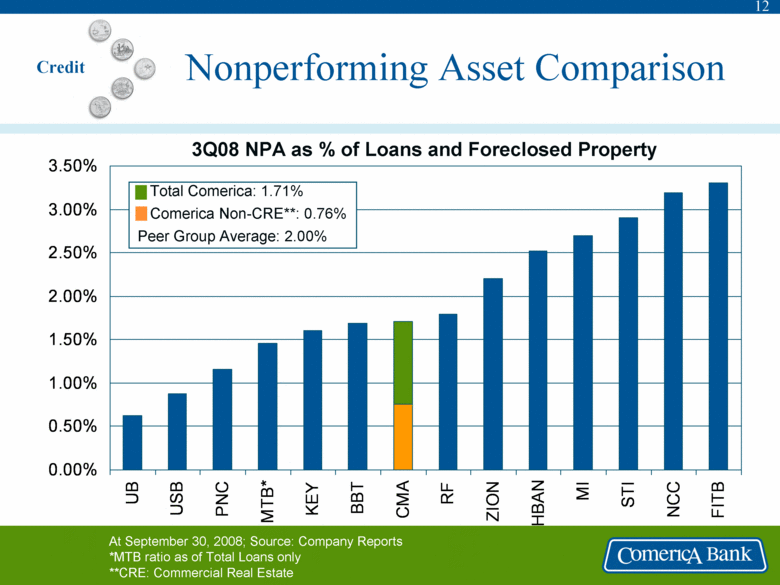
12 0.00% 0.50% 1.00% 1.50% 2.00% 2.50% 3.00% 3.50% UB USB PNC MTB* KEY BBT CMA RF ZION HBAN MI STI NCC FITB 3Q08 NPA as % of Loans and Foreclosed Property At September 30, 2008; Source: Company Reports *MTB ratio as of Total Loans only **CRE: Commercial Real Estate Nonperforming Asset Comparison Total Comerica: 1.71% Comerica Non-CRE**: 0.76% Peer Group Average: 2.00% Credit |
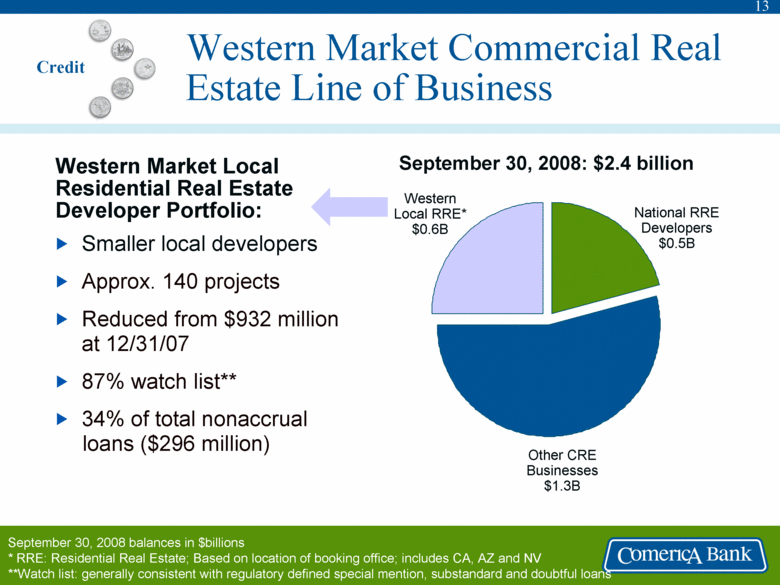
13 Western Market Commercial Real Estate Line of Business Smaller local developers Approx. 140 projects Reduced from $932 million at 12/31/07 87% watch list** 34% of total nonaccrual loans ($296 million) September 30, 2008: $2.4 billion September 30, 2008 balances in $billions * RRE: Residential Real Estate; Based on location of booking office; includes CA, AZ and NV **Watch list: generally consistent with regulatory defined special mention, substandard and doubtful loans Western Local RRE* $0.6B Western Market Local Residential Real Estate Developer Portfolio: Credit National RRE Developers $0.5B Other CRE Businesses $1.3B |
14 Automotive Manufacturer Exposure Declining 12/05 12/06 12/07 8/08 Exposure: Dealer $ 6.6 $ 7.4 $ 7.3 $ 7.1 Other Automotive: - Domestic Ownership $ 3.3 $ 2.9 $ 2.6 $ 2.4 - Foreign Ownership 1.5 1.3 1.1 1.1 Total Other Automotive $ 4.8 $ 4.2 $ 3.7 $ 3.5 Outstandings: Dealer $ 4.8 $ 5.6 $ 5.4 $ 4.7 Other Automotive: - Domestic Ownership $ 2.0 $ 1.7 $ 1.4 $ 1.3 - Foreign Ownership 0.7 0.5 0.4 0.3 Total Other Automotive $ 2.7 $ 2.2 $ 1.8 $ 1.6 $17 $16 $16 $13 $9 $- $10 $20 $30 Millions 3Q07 4Q07 1Q08 2Q08 3Q08 Other Automotive Nonaccrual Loans Period-end in $billions Exposure includes committed and discretionary facilities (undrawn and outstanding) Credit Non-Dealer Auto Highlights: Exposure and outstandings declining Non-accruals continue to decrease FY07 net recovery of $2.2 million YTD 08 net charge-off of $0.1 million down 37% |
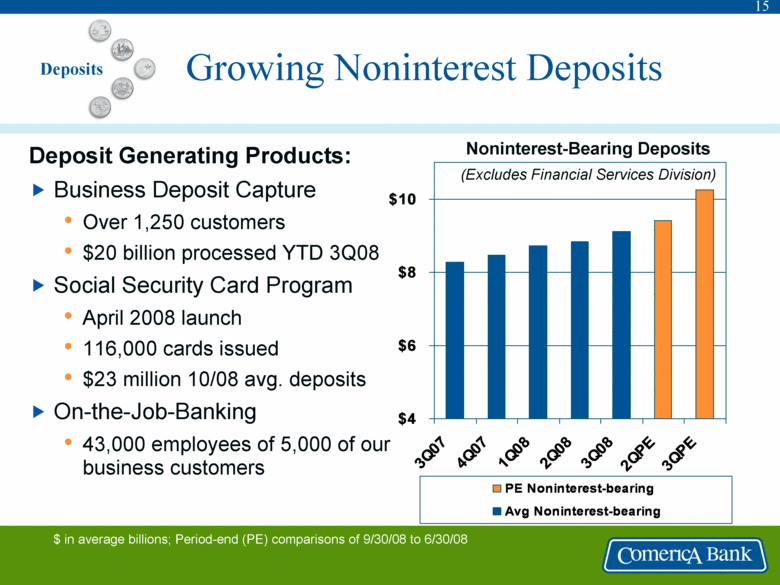
15 $4 $6 $8 $10 3Q07 4Q07 1Q08 2Q08 3Q08 2QPE 3QPE PE Noninterest-bearing Avg Noninterest-bearing Growing Noninterest Deposits Deposit Generating Products: Business Deposit Capture • Over 1,250 customers • $20 billion processed YTD 3Q08 Social Security Card Program • April 2008 launch • 116,000 cards issued • $23 million 10/08 avg. deposits On-the-Job-Banking • 43,000 employees of 5,000 of our business customers $ in average billions; Period-end (PE) comparisons of 9/30/08 to 6/30/08 Deposits Noninterest-Bearing Deposits (Excludes Financial Services Division) |
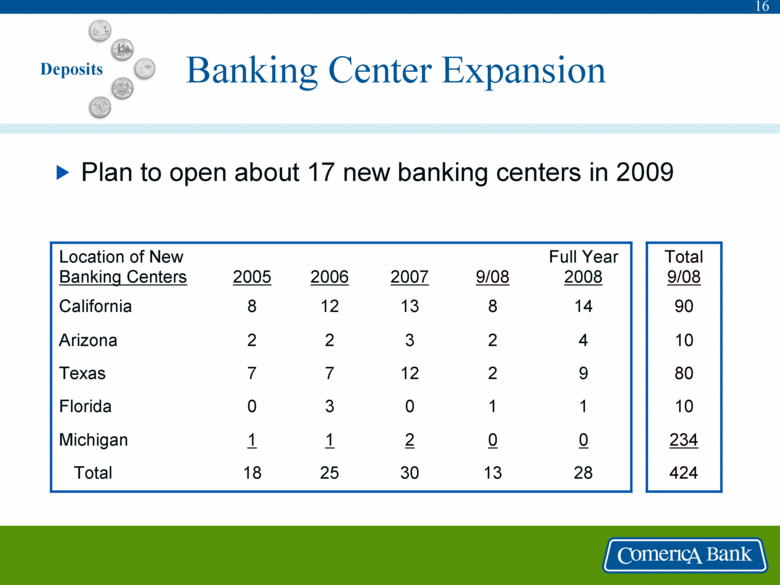
16 Plan to open about 17 new banking centers in 2009 30 2 0 12 3 13 2007 13 0 1 2 2 8 9/08 Total 9/08 Full Year 2008 2006 2005 Location of New Banking Centers 28 0 1 9 4 14 18 1 0 7 2 8 10 2 Arizona 424 25 Total 234 1 Michigan 10 3 Florida 80 7 Texas 90 12 California Banking Center Expansion Deposits |
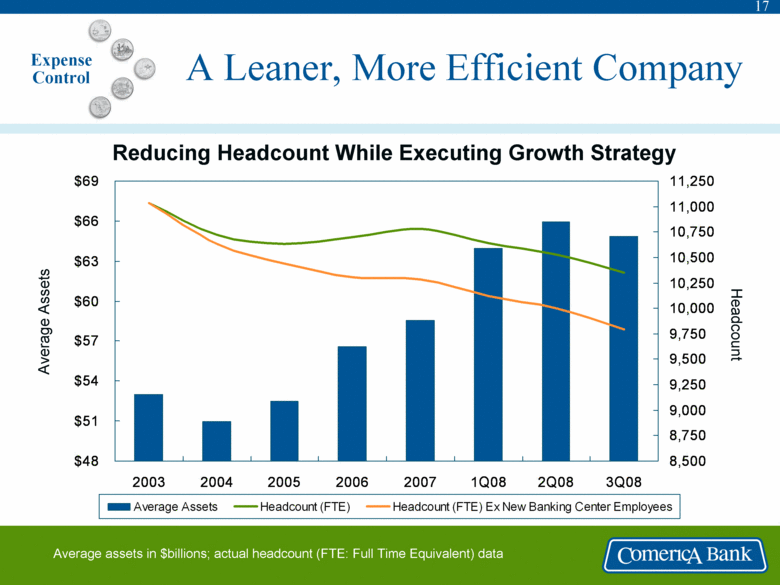
17 A Leaner, More Efficient Company $48 $51 $54 $57 $60 $63 $66 $69 2003 2004 2005 2006 2007 1Q08 2Q08 3Q08 8,500 8,750 9,000 9,250 9,500 9,750 10,000 10,250 10,500 10,750 11,000 11,250 Average Assets Headcount (FTE) Headcount (FTE) Ex New Banking Center Employees Reducing Headcount While Executing Growth Strategy Headcount Average Assets Expense Control Average assets in $billions; actual headcount (FTE: Full Time Equivalent) data |
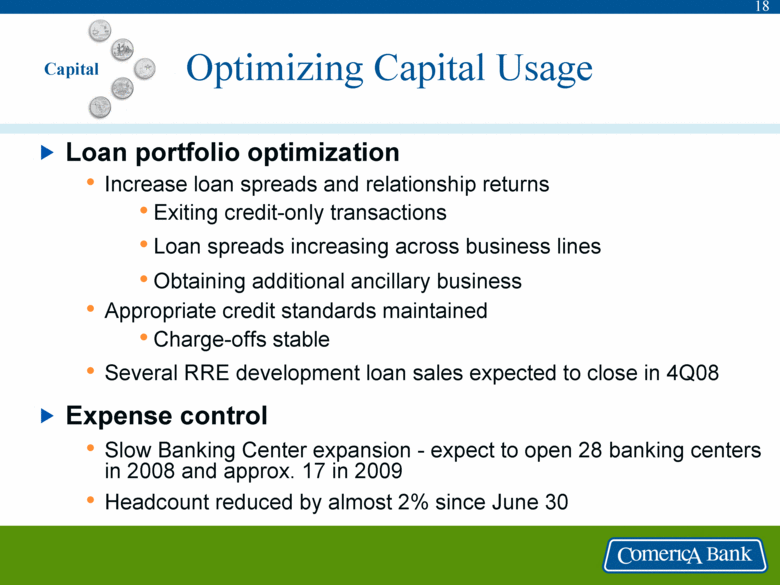
18 Optimizing Capital Usage Capital Loan portfolio optimization • Increase loan spreads and relationship returns • Exiting credit-only transactions • Loan spreads increasing across business lines • Obtaining additional ancillary business • Appropriate credit standards maintained • Charge-offs stable • Several RRE development loan sales expected to close in 4Q08 Expense control • Slow Banking Center expansion - expect to open 28 banking centers in 2008 and approx. 17 in 2009 • Headcount reduced by almost 2% since June 30 |
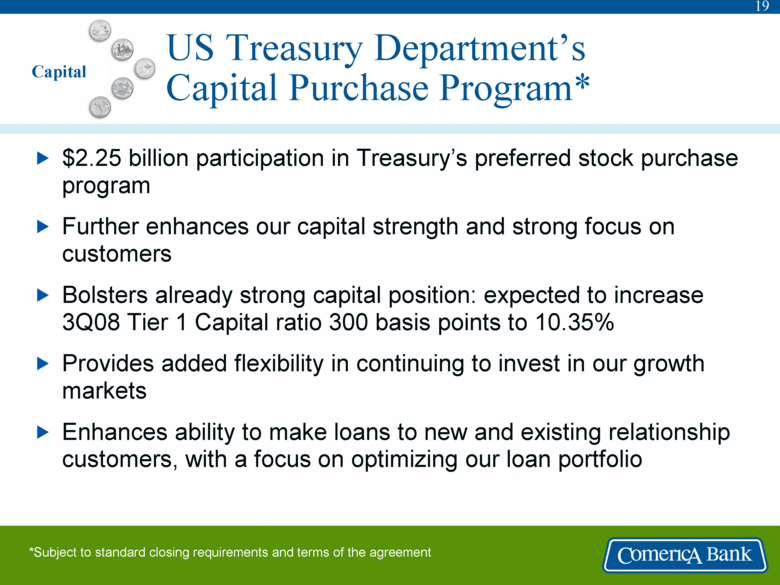
19 US Treasury Department’s Capital Purchase Program* $2.25 billion participation in Treasury’s preferred stock purchase program Further enhances our capital strength and strong focus on customers Bolsters already strong capital position: expected to increase 3Q08 Tier 1 Capital ratio 300 basis points to 10.35% Provides added flexibility in continuing to invest in our growth markets Enhances ability to make loans to new and existing relationship customers, with a focus on optimizing our loan portfolio *Subject to standard closing requirements and terms of the agreement Capital |
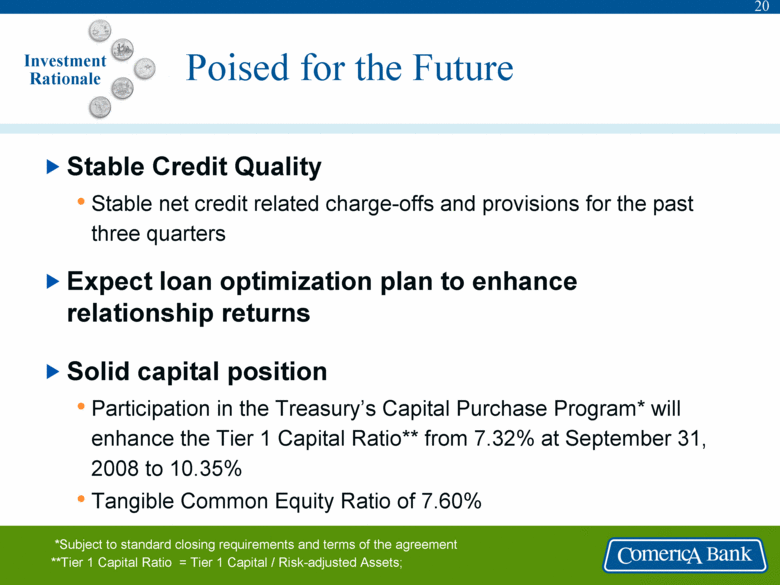
20 Poised for the Future Stable Credit Quality • Stable net credit related charge-offs and provisions for the past three quarters Expect loan optimization plan to enhance relationship returns Solid capital position • Participation in the Treasury’s Capital Purchase Program* will enhance the Tier 1 Capital Ratio** from 7.32% at September 31, 2008 to 10.35% • Tangible Common Equity Ratio of 7.60% Investment Rationale *Subject to standard closing requirements and terms of the agreement **Tier 1 Capital Ratio = Tier 1 Capital / Risk-adjusted Assets; |
21 Questions and Answers Ralph Babb Chairman and CEO Beth Acton Chief Financial Officer Dale Greene Chief Credit Officer Darlene Persons Director of Investor Relations |
22 Appendix |
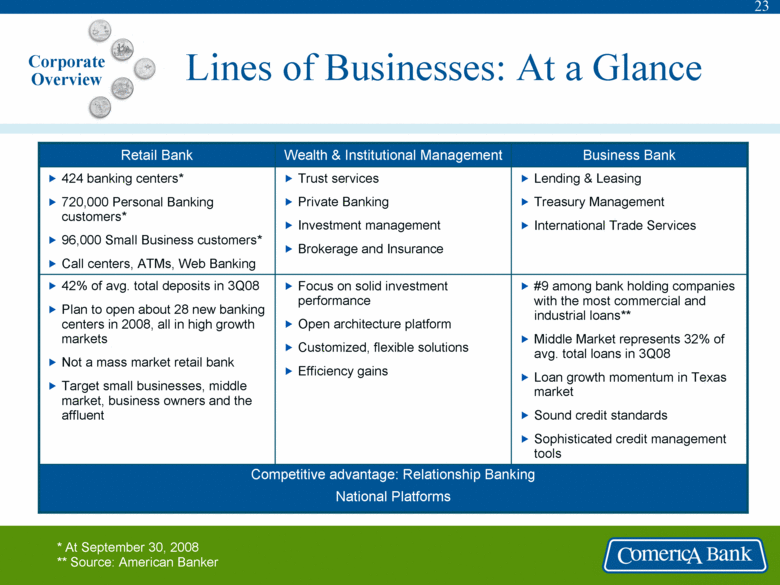
23 Lines of Businesses: At a Glance Lending & Leasing Treasury Management International Trade Services Trust services Private Banking Investment management Brokerage and Insurance 424 banking centers* 720,000 Personal Banking customers* 96,000 Small Business customers* Call centers, ATMs, Web Banking Competitive advantage: Relationship Banking National Platforms #9 among bank holding companies with the most commercial and industrial loans** Middle Market represents 32% of avg. total loans in 3Q08 Loan growth momentum in Texas market Sound credit standards Sophisticated credit management tools Focus on solid investment performance Open architecture platform Customized, flexible solutions Efficiency gains 42% of avg. total deposits in 3Q08 Plan to open about 28 new banking centers in 2008, all in high growth markets Not a mass market retail bank Target small businesses, middle market, business owners and the affluent Business Bank Wealth & Institutional Management Retail Bank * At September 30, 2008 ** Source: American Banker Corporate Overview |
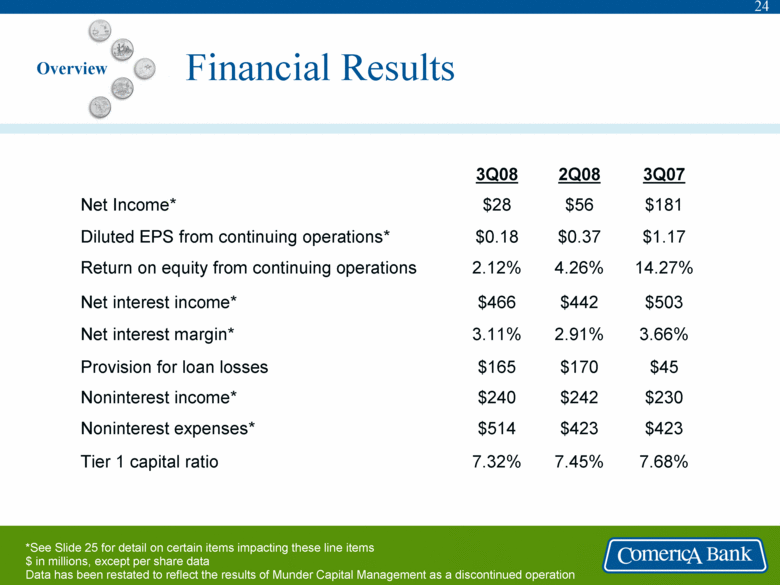
24 Financial Results Overview *See Slide 25 for detail on certain items impacting these line items $ in millions, except per share data Data has been restated to reflect the results of Munder Capital Management as a discontinued operation $423 $423 $514 Noninterest expenses* 7.68% 7.45% 7.32% Tier 1 capital ratio $230 $242 $240 Noninterest income* $45 $170 $165 Provision for loan losses 3.66% 2.91% 3.11% Net interest margin* $503 $442 $466 Net interest income* 14.27% 4.26% 2.12% Return on equity from continuing operations $1.17 $0.37 $0.18 Diluted EPS from continuing operations* $181 $56 $28 Net Income* 3Q07 2Q08 3Q08 |
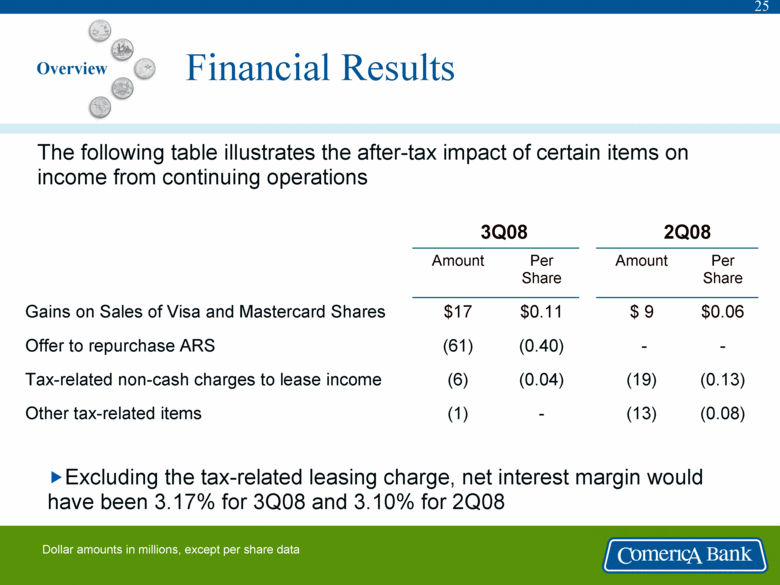
25 The following table illustrates the after-tax impact of certain items on income from continuing operations Overview Financial Results (0.08) (13) - (1) Other tax-related items - - (0.40) (61) Offer to repurchase ARS (0.13) (19) (0.04) (6) Tax-related non-cash charges to lease income $0.06 $ 9 $0.11 $17 Gains on Sales of Visa and Mastercard Shares Per Share Amount Per Share Amount 3Q08 2Q08 Dollar amounts in millions, except per share data Excluding the tax-related leasing charge, net interest margin would have been 3.17% for 3Q08 and 3.10% for 2Q08 |
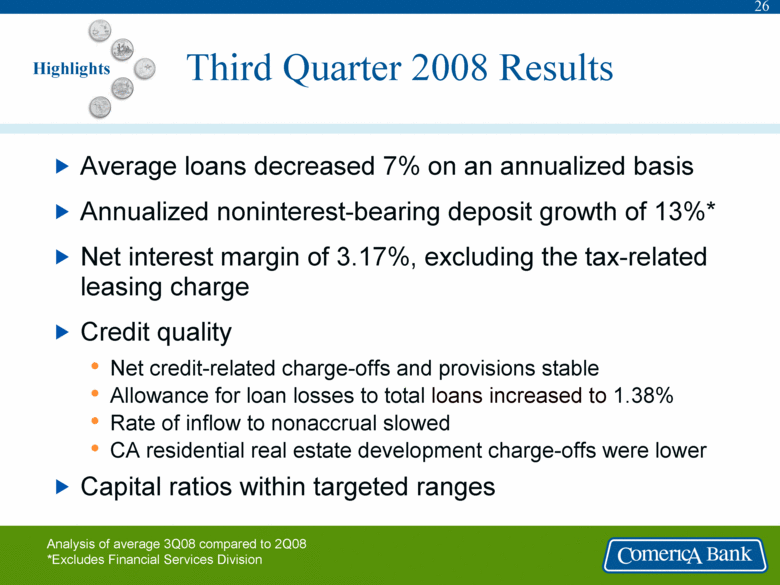
26 Third Quarter 2008 Results Highlights Analysis of average 3Q08 compared to 2Q08 *Excludes Financial Services Division Average loans decreased 7% on an annualized basis Annualized noninterest-bearing deposit growth of 13%* Net interest margin of 3.17%, excluding the tax-related leasing charge Credit quality • Net credit-related charge-offs and provisions stable • Allowance for loan losses to total loans increased to 1.38% • Rate of inflow to nonaccrual slowed • CA residential real estate development charge-offs were lower Capital ratios within targeted ranges |
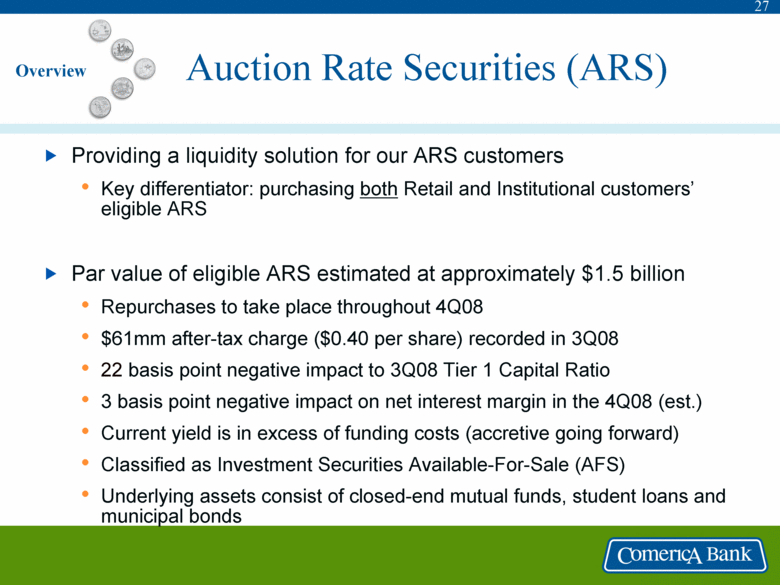
27 Auction Rate Securities (ARS) Providing a liquidity solution for our ARS customers • Key differentiator: purchasing both Retail and Institutional customers’ eligible ARS Par value of eligible ARS estimated at approximately $1.5 billion • Repurchases to take place throughout 4Q08 • $61mm after-tax charge ($0.40 per share) recorded in 3Q08 • 22 basis point negative impact to 3Q08 Tier 1 Capital Ratio • 3 basis point negative impact on net interest margin in the 4Q08 (est.) • Current yield is in excess of funding costs (accretive going forward) • Classified as Investment Securities Available-For-Sale (AFS) • Underlying assets consist of closed-end mutual funds, student loans and municipal bonds Overview |
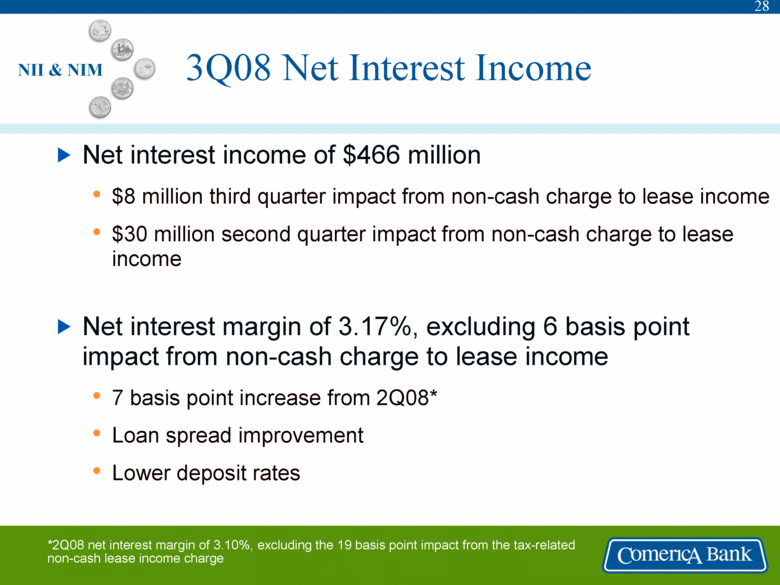
28 3Q08 Net Interest Income NII & NIM Net interest income of $466 million • $8 million third quarter impact from non-cash charge to lease income • $30 million second quarter impact from non-cash charge to lease income Net interest margin of 3.17%, excluding 6 basis point impact from non-cash charge to lease income • 7 basis point increase from 2Q08* • Loan spread improvement • Lower deposit rates *2Q08 net interest margin of 3.10%, excluding the 19 basis point impact from the tax-related non-cash lease income charge |
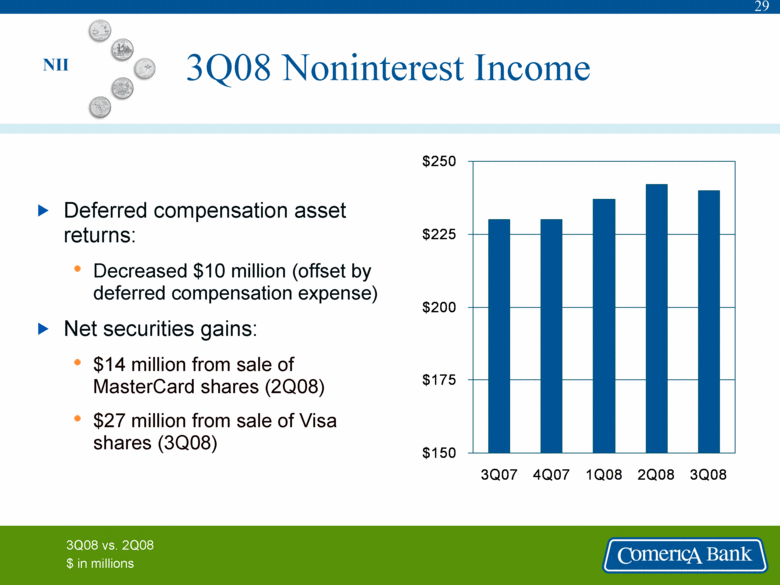
29 3Q08 Noninterest Income Deferred compensation asset returns: • Decreased $10 million (offset by deferred compensation expense) Net securities gains: • $14 million from sale of MasterCard shares (2Q08) • $27 million from sale of Visa shares (3Q08) $150 $175 $200 $225 $250 3Q07 4Q07 1Q08 2Q08 3Q08 3Q08 vs. 2Q08 $ in millions NII |
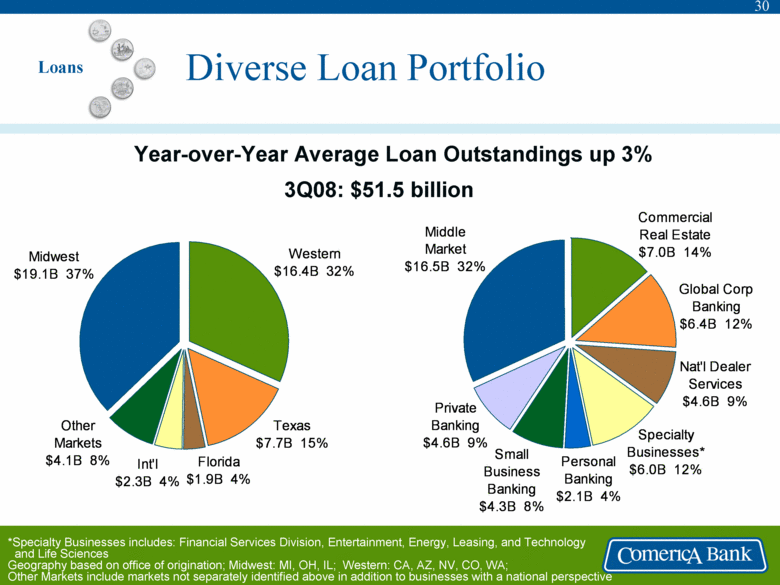
30 Global Corp Banking $6.4B 12% Commercial Real Estate $7.0B 14% Middle Market $16.5B 32% Nat'l Dealer Services $4.6B 9% Specialty Businesses* $6.0B 12% Personal Banking $2.1B 4% Small Business Banking $4.3B 8% Private Banking $4.6B 9% Diverse Loan Portfolio Year-over-Year Average Loan Outstandings up 3% *Specialty Businesses includes: Financial Services Division, Entertainment, Energy, Leasing, and Technology and Life Sciences Geography based on office of origination; Midwest: MI, OH, IL; Western: CA, AZ, NV, CO, WA; Other Markets include markets not separately identified above in addition to businesses with a national perspective 3Q08: $51.5 billion Loans Other Markets $4.1B 8% Int'l $2.3B 4% Florida $1.9B 4% Midwest $19.1B 37% Western $16.4B 32% Texas $7.7B 15% |
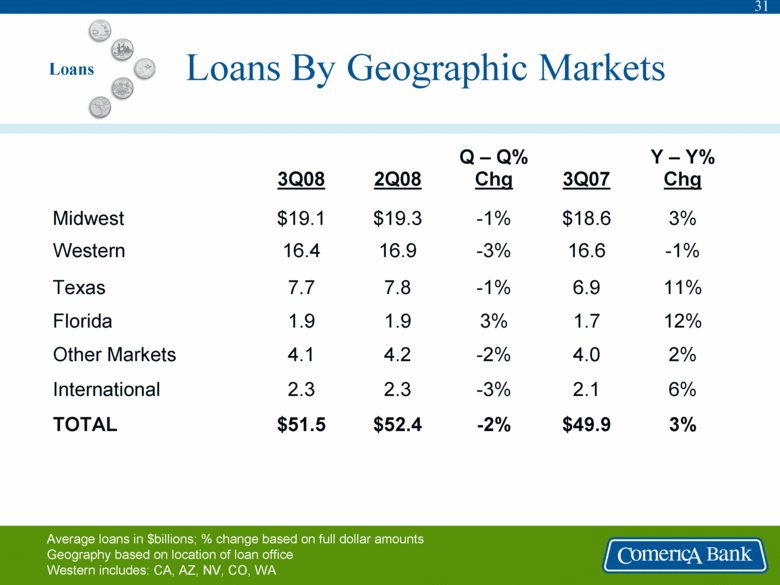
31 Loans By Geographic Markets 2% 4.0 -2% 4.2 4.1 Other Markets 12% 1.7 3% 1.9 1.9 Florida 6% 2.1 -3% 2.3 2.3 International 3% $49.9 -2% $52.4 $51.5 TOTAL 11% 6.9 -1% 7.8 7.7 Texas -1% 16.6 -3% 16.9 16.4 Western 3% $18.6 -1% $19.3 $19.1 Midwest Y – Y% Chg 3Q07 Q – Q% Chg 2Q08 3Q08 Average loans in $billions; % change based on full dollar amounts Geography based on location of loan office Western includes: CA, AZ, NV, CO, WA Loans |
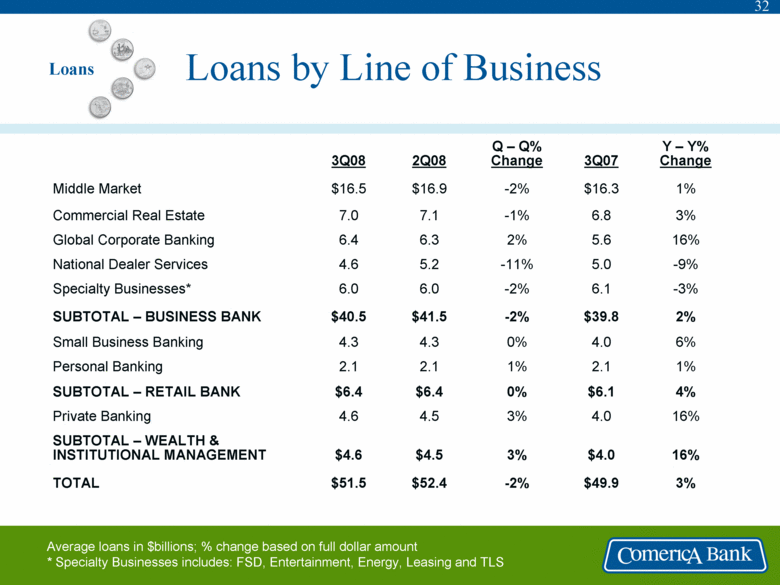
32 Loans by Line of Business 3% $49.9 -2% $52.4 $51.5 TOTAL 16% $4.0 3% $4.5 $4.6 SUBTOTAL – WEALTH & INSTITUTIONAL MANAGEMENT 16% 4.0 3% 4.5 4.6 Private Banking 4% $6.1 0% $6.4 $6.4 SUBTOTAL – RETAIL BANK 1% 2.1 1% 2.1 2.1 Personal Banking 6% 4.0 0% 4.3 4.3 Small Business Banking 2% $39.8 -2% $41.5 $40.5 SUBTOTAL – BUSINESS BANK -3% 6.1 -2% 6.0 6.0 Specialty Businesses* -9% 5.0 -11% 5.2 4.6 National Dealer Services 16% 5.6 2% 6.3 6.4 Global Corporate Banking 3% 6.8 -1% 7.1 7.0 Commercial Real Estate 1% $16.3 -2% $16.9 $16.5 Middle Market Y – Y% Change 3Q07 Q – Q% Change 2Q08 3Q08 Average loans in $billions; % change based on full dollar amount * Specialty Businesses includes: FSD, Entertainment, Energy, Leasing and TLS Loans |
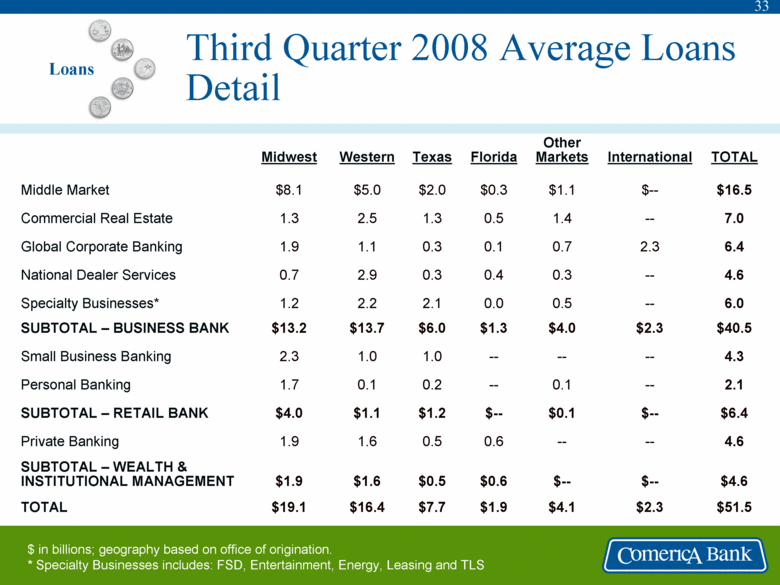
33 Third Quarter 2008 Average Loans Detail $4.1 $-- -- $0.1 0.1 -- $4.0 0.5 0.3 0.7 1.4 $1.1 Other Markets $1.9 $0.6 0.6 $-- -- -- $1.3 0.0 0.4 0.1 0.5 $0.3 Florida $51.5 $2.3 $7.7 $16.4 $19.1 TOTAL $4.6 $-- $0.5 $1.6 $1.9 SUBTOTAL – WEALTH & INSTITUTIONAL MANAGEMENT 4.6 -- 0.5 1.6 1.9 Private Banking $6.4 $-- $1.2 $1.1 $4.0 SUBTOTAL – RETAIL BANK 2.1 -- 0.2 0.1 1.7 Personal Banking 4.3 -- 1.0 1.0 2.3 Small Business Banking $40.5 $2.3 $6.0 $13.7 $13.2 SUBTOTAL – BUSINESS BANK 6.0 -- 2.1 2.2 1.2 Specialty Businesses* 4.6 -- 0.3 2.9 0.7 National Dealer Services 6.4 2.3 0.3 1.1 1.9 Global Corporate Banking 7.0 -- 1.3 2.5 1.3 Commercial Real Estate $16.5 $-- $2.0 $5.0 $8.1 Middle Market TOTAL International Texas Western Midwest $ in billions; geography based on office of origination. * Specialty Businesses includes: FSD, Entertainment, Energy, Leasing and TLS Loans |
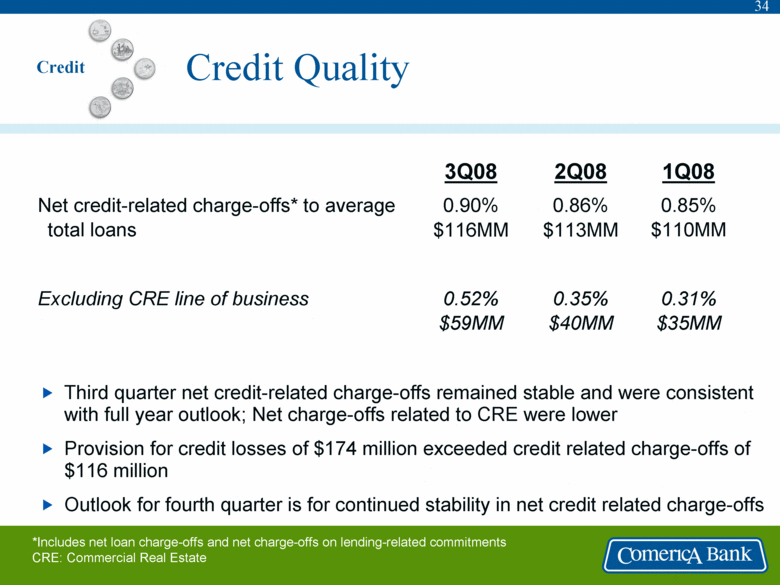
34 Credit Quality 0.85% $110MM 0.86% $113MM 0.90% $116MM Net credit-related charge-offs* to average total loans 0.31% $35MM 0.35% $40MM 0.52% $59MM Excluding CRE line of business 1Q08 2Q08 3Q08 *Includes net loan charge-offs and net charge-offs on lending-related commitments CRE: Commercial Real Estate Credit Third quarter net credit-related charge-offs remained stable and were consistent with full year outlook; Net charge-offs related to CRE were lower Provision for credit losses of $174 million exceeded credit related charge-offs of $116 million Outlook for fourth quarter is for continued stability in net credit related charge-offs |
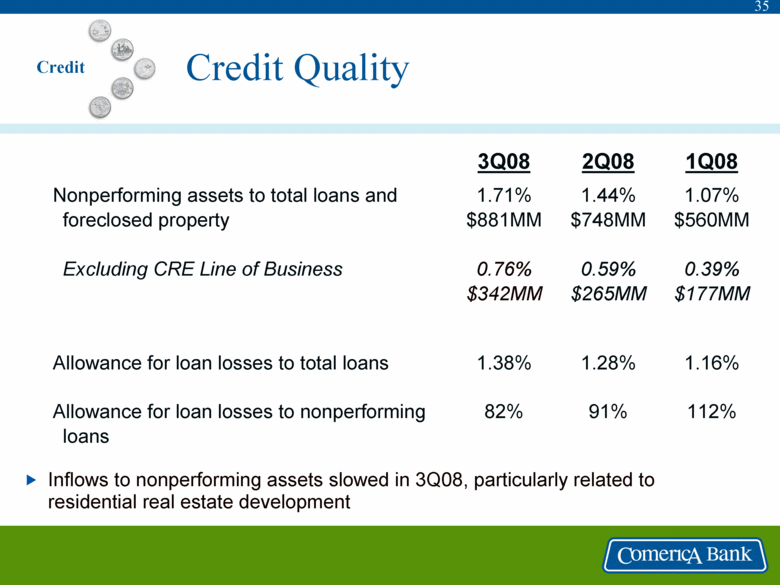
35 Credit Quality 112% 91% 82% Allowance for loan losses to nonperforming loans 1.07% $560MM 0.39% $177MM 1.44% $748MM 0.59% $265MM 1.71% $881MM 0.76% $342MM Nonperforming assets to total loans and foreclosed property Excluding CRE Line of Business 1.16% 1.28% 1.38% Allowance for loan losses to total loans 1Q08 2Q08 3Q08 Credit Inflows to nonperforming assets slowed in 3Q08, particularly related to residential real estate development |
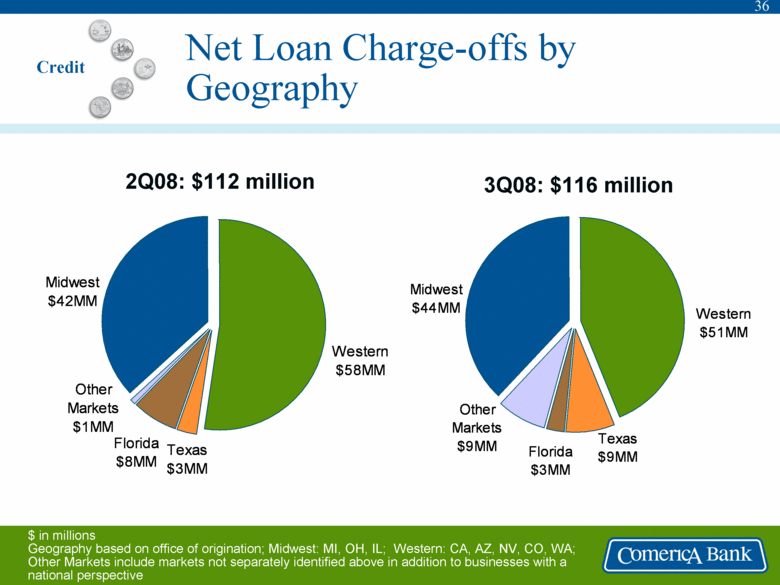
36 Texas $3MM Western $58MM Midwest $42MM Florida $8MM Other Markets $1MM Net Loan Charge-offs by Geography 3Q08: $116 million 2Q08: $112 million $ in millions Geography based on office of origination; Midwest: MI, OH, IL; Western: CA, AZ, NV, CO, WA; Other Markets include markets not separately identified above in addition to businesses with a national perspective Credit Texas $9MM Western $51MM Midwest $44MM Florida $3MM Other Markets $9MM |
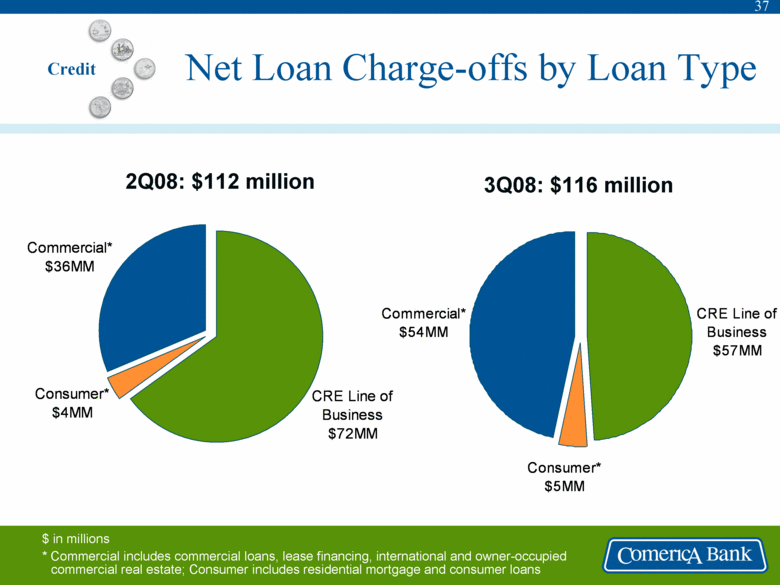
37 CRE Line of Business $72MM Consumer* $4MM Commercial* $36MM CRE Line of Business $57MM Consumer* $5MM Commercial* $54MM Net Loan Charge-offs by Loan Type 3Q08: $116 million 2Q08: $112 million $ in millions * Commercial includes commercial loans, lease financing, international and owner-occupied commercial real estate; Consumer includes residential mortgage and consumer loans Credit |
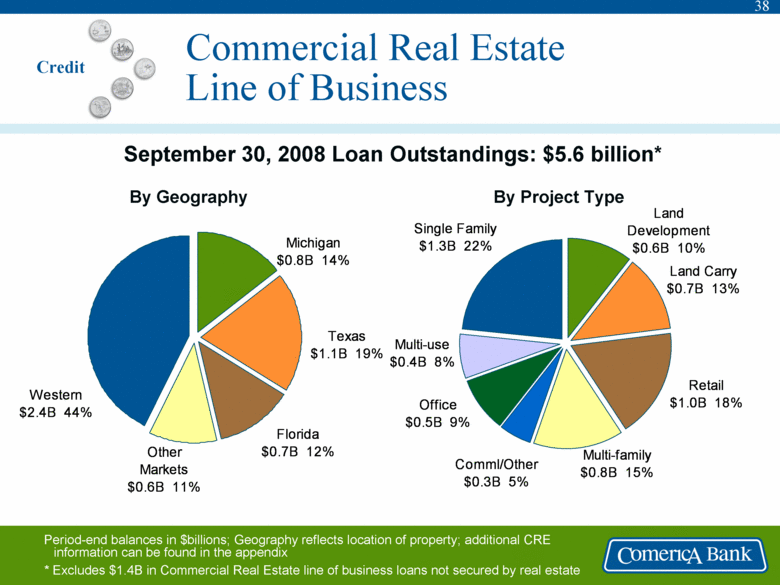
38 Multi-use $0.4B 8% Office $0.5B 9% Comml/Other $0.3B 5% Multi-family $0.8B 15% Retail $1.0B 18% Single Family $1.3B 22% Land Development $0.6B 10% Land Carry $0.7B 13% Texas $1.1B 19% Michigan $0.8B 14% Western $2.4B 44% Florida $0.7B 12% Other Markets $0.6B 11% Commercial Real Estate Line of Business September 30, 2008 Loan Outstandings: $5.6 billion* By Project Type By Geography Period-end balances in $billions; Geography reflects location of property; additional CRE information can be found in the appendix * Excludes $1.4B in Commercial Real Estate line of business loans not secured by real estate Credit |
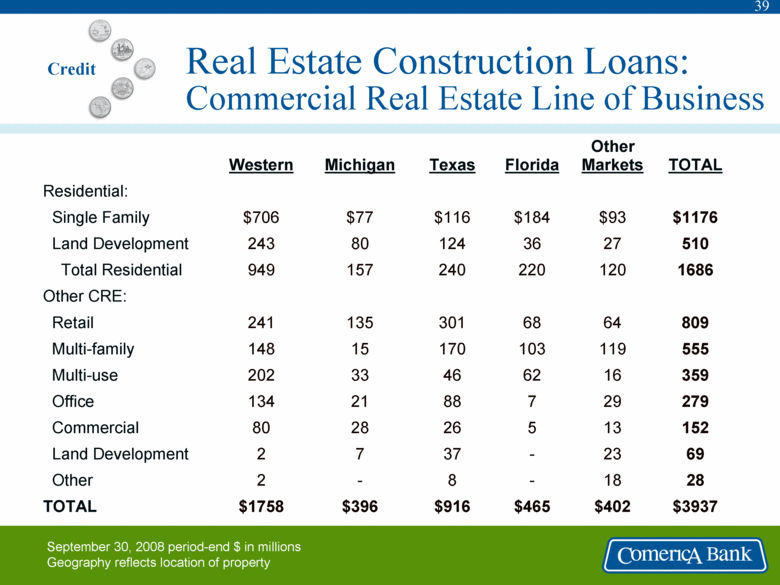
39 Real Estate Construction Loans: Commercial Real Estate Line of Business 69 23 - 37 7 2 Land Development Other CRE: 510 27 36 124 80 243 Land Development 1686 120 220 240 157 949 Total Residential 152 13 5 26 28 80 Commercial 809 64 68 301 135 241 Retail 555 119 103 170 15 148 Multi-family 359 16 62 46 33 202 Multi-use 279 29 7 88 21 134 Office 28 18 - 8 - 2 Other $3937 $402 $465 $916 $396 $1758 TOTAL Residential: $93 Other Markets $1176 $184 $116 $77 $706 Single Family TOTAL Florida Texas Michigan Western September 30, 2008 period-end $ in millions Geography reflects location of property Credit |
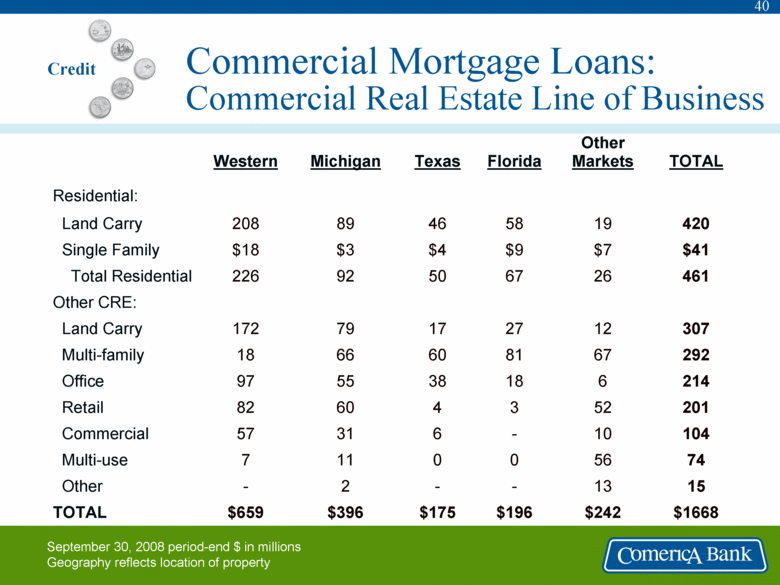
40 Commercial Mortgage Loans: Commercial Real Estate Line of Business 307 12 27 17 79 172 Land Carry 420 19 58 46 89 208 Land Carry Other CRE: 461 26 67 50 92 226 Total Residential $41 $7 $9 $4 $3 $18 Single Family Residential: 74 56 0 0 11 7 Multi-use 104 10 - 6 31 57 Commercial 201 52 3 4 60 82 Retail 214 6 18 38 55 97 Office 292 67 81 60 66 18 Multi-family 15 13 - - 2 - Other $242 Other Markets $1668 $196 $175 $396 $659 TOTAL TOTAL Florida Texas Michigan Western September 30, 2008 period-end $ in millions Geography reflects location of property Credit |
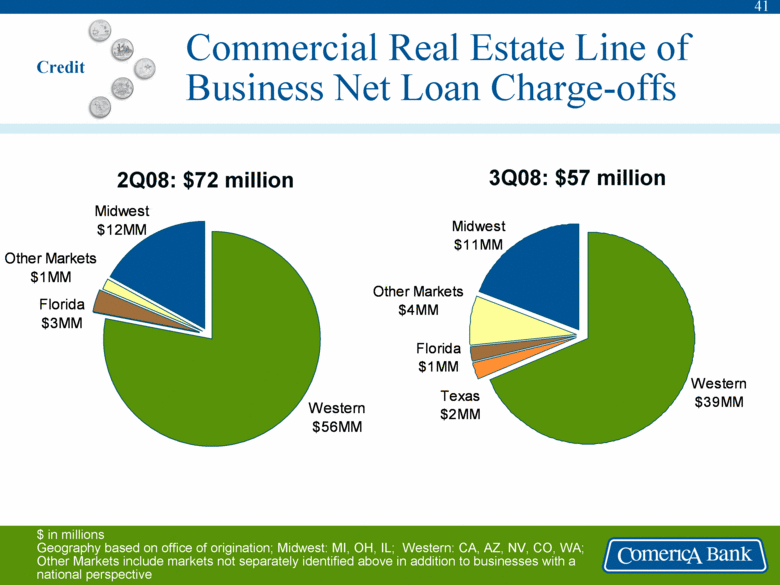
41 Western $56MM Midwest $12MM Florida $3MM Other Markets $1MM Texas $2MM Western $39MM Midwest $11MM Florida $1MM Other Markets $4MM Commercial Real Estate Line of Business Net Loan Charge-offs 3Q08: $57 million 2Q08: $72 million $ in millions Geography based on office of origination; Midwest: MI, OH, IL; Western: CA, AZ, NV, CO, WA; Other Markets include markets not separately identified above in addition to businesses with a national perspective Credit |
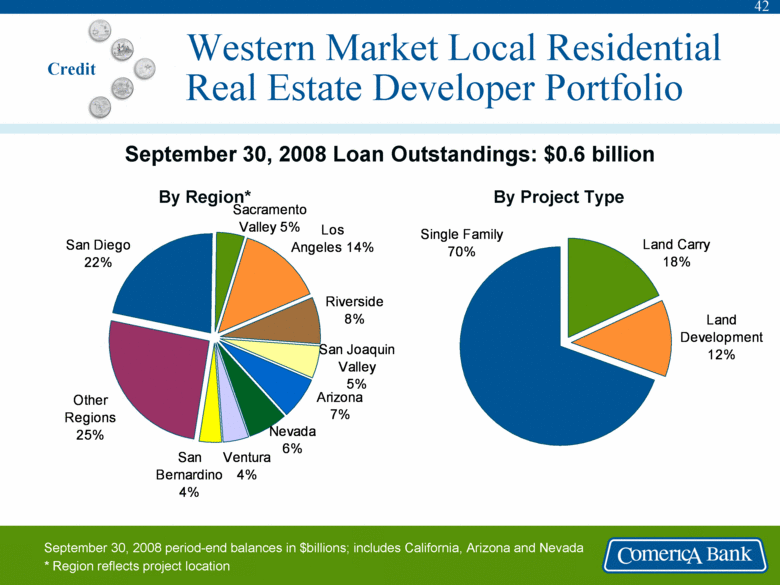
42 Land Development 12% Land Carry 18% Single Family 70% Ventura 4% Nevada 6% Arizona 7% San Joaquin Valley 5% Riverside 8% San Diego 22% Sacramento Valley 5% Los Angeles 14% San Bernardino 4% Other Regions 25% Western Market Local Residential Real Estate Developer Portfolio September 30, 2008 Loan Outstandings: $0.6 billion By Project Type By Region* September 30, 2008 period-end balances in $billions; includes California, Arizona and Nevada * Region reflects project location Credit |
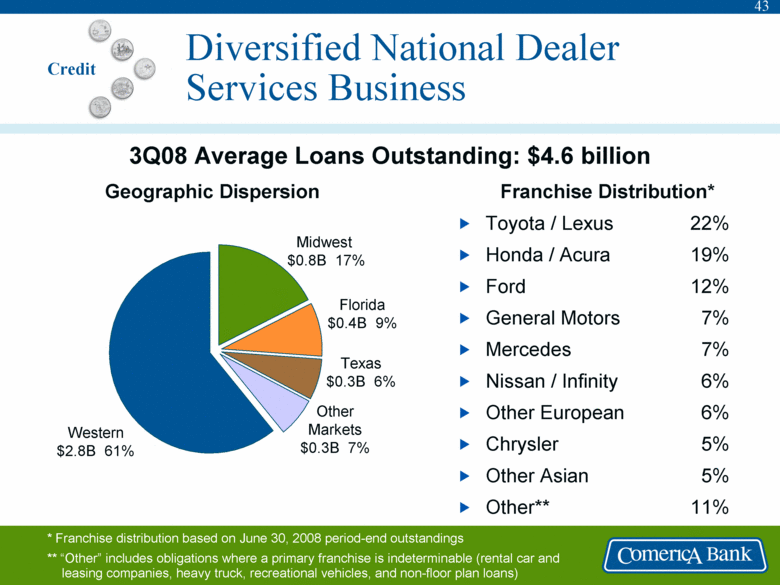
43 Franchise Distribution* Toyota / Lexus 22% Honda / Acura 19% Ford 12% General Motors 7% Mercedes 7% Nissan / Infinity 6% Other European 6% Chrysler 5% Other Asian 5% Other** 11% 3Q08 Average Loans Outstanding: $4.6 billion Midwest $0.8B 17% Western $2.8B 61% Texas $0.3B 6% Florida $0.4B 9% Geographic Dispersion * Franchise distribution based on June 30, 2008 period-end outstandings ** “Other” includes obligations where a primary franchise is indeterminable (rental car and leasing companies, heavy truck, recreational vehicles, and non-floor plan loans) Diversified National Dealer Services Business Other Markets $0.3B 7% Credit |
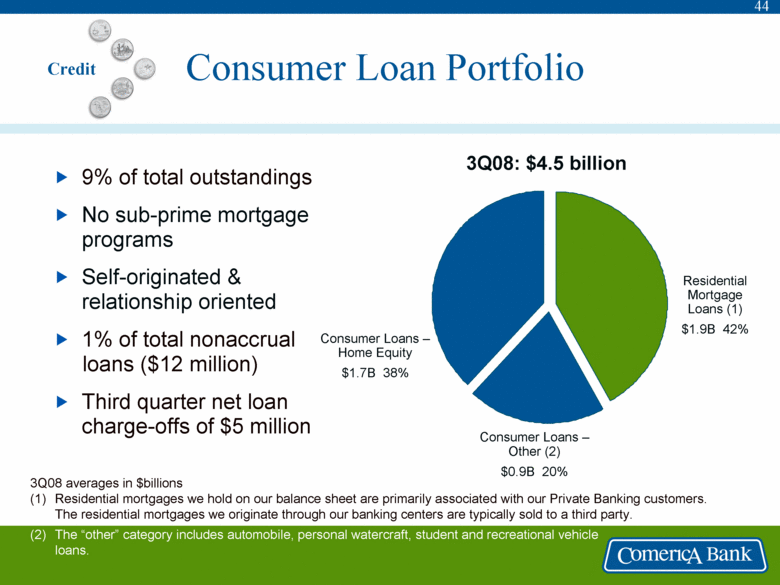
44 Consumer Loan Portfolio 9% of total outstandings No sub-prime mortgage programs Self-originated & relationship oriented 1% of total nonaccrual loans ($12 million) Third quarter net loan charge-offs of $5 million 3Q08: $4.5 billion 3Q08 averages in $billions (1) Residential mortgages we hold on our balance sheet are primarily associated with our Private Banking customers. The residential mortgages we originate through our banking centers are typically sold to a third party. (2) The “other” category includes automobile, personal watercraft, student and recreational vehicle loans. Consumer Loans – Home Equity $1.7B 38% Consumer Loans – Other (2) $0.9B 20% Residential Mortgage Loans (1) $1.9B 42% Credit |
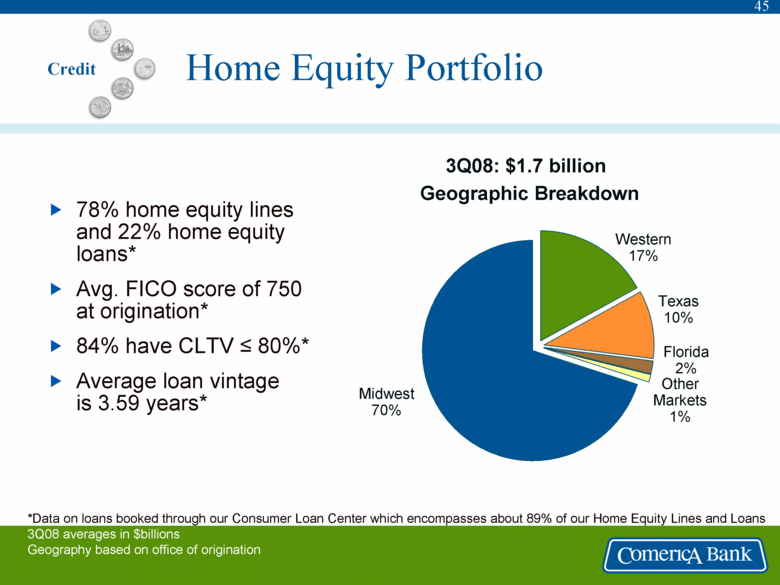
45 Home Equity Portfolio 78% home equity lines and 22% home equity loans* Avg. FICO score of 750 at origination* 84% have CLTV = 80%* Average loan vintage is 3.59 years* Geographic Breakdown Midwest 70% Texas 10% Western 17% *Data on loans booked through our Consumer Loan Center which encompasses about 89% of our Home Equity Lines and Loans 3Q08 averages in $billions Geography based on office of origination 3Q08: $1.7 billion Florida 2% Credit Other Markets 1% |
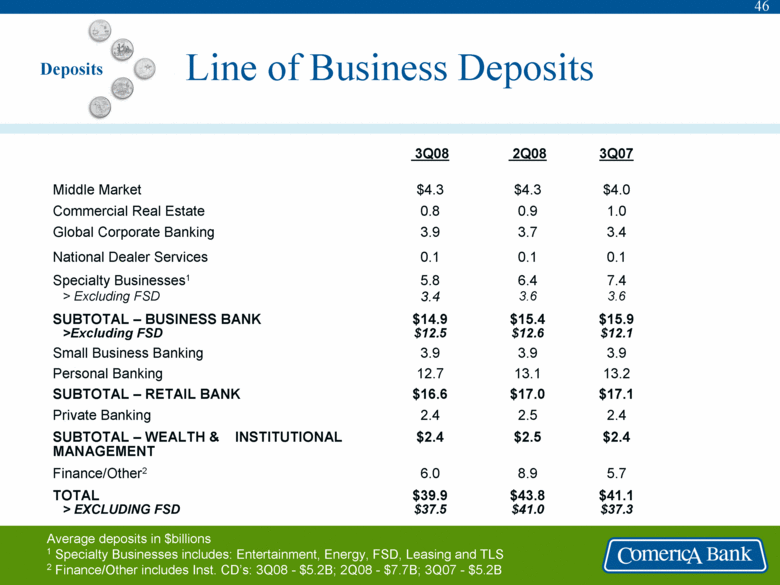
46 Line of Business Deposits 5.7 8.9 6.0 Finance/Other2 $41.1 $37.3 $43.8 $41.0 $39.9 $37.5 TOTAL > EXCLUDING FSD $2.4 $2.5 $2.4 SUBTOTAL – WEALTH & INSTITUTIONAL MANAGEMENT 2.4 2.5 2.4 Private Banking $17.1 $17.0 $16.6 SUBTOTAL – RETAIL BANK 13.2 13.1 12.7 Personal Banking 3.9 3.9 3.9 Small Business Banking $15.9 $12.1 $15.4 $12.6 $14.9 $12.5 SUBTOTAL – BUSINESS BANK >Excluding FSD 7.4 3.6 6.4 3.6 5.8 3.4 Specialty Businesses1 > Excluding FSD 0.1 0.1 0.1 National Dealer Services 3.4 3.7 3.9 Global Corporate Banking 1.0 0.9 0.8 Commercial Real Estate $4.0 $4.3 $4.3 Middle Market 3Q07 2Q08 3Q08 Average deposits in $billions 1 Specialty Businesses includes: Entertainment, Energy, FSD, Leasing and TLS 2 Finance/Other includes Inst. CD’s: 3Q08 - $5.2B; 2Q08 - $7.7B; 3Q07 - $5.2B Deposits |
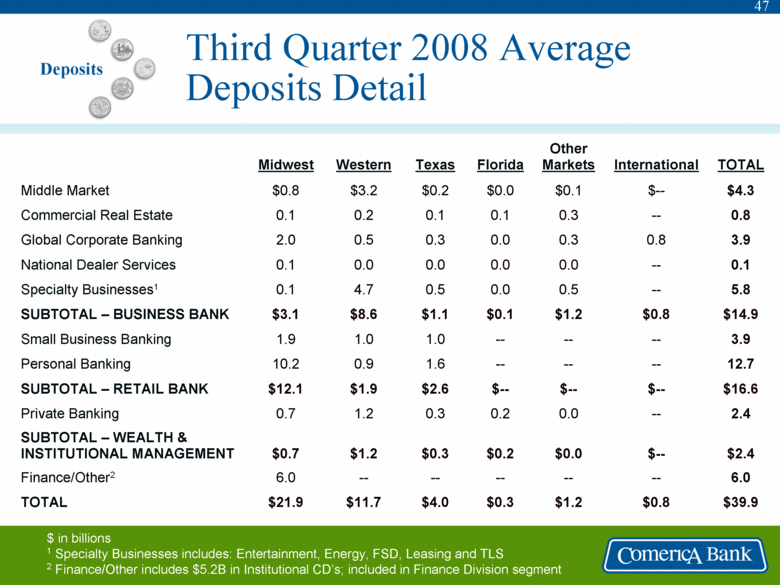
47 Third Quarter 2008 Average Deposits Detail $1.2 -- $0.0 0.0 $-- -- -- $1.2 0.5 0.0 0.3 0.3 $0.1 Other Markets $0.8 -- $-- -- $-- -- -- $0.8 -- -- 0.8 -- $-- International 6.0 -- -- -- 6.0 Finance/Other2 $39.9 $0.3 $4.0 $11.7 $21.9 TOTAL $2.4 $0.2 $0.3 $1.2 $0.7 SUBTOTAL – WEALTH & INSTITUTIONAL MANAGEMENT 2.4 0.2 0.3 1.2 0.7 Private Banking $16.6 $-- $2.6 $1.9 $12.1 SUBTOTAL – RETAIL BANK 12.7 -- 1.6 0.9 10.2 Personal Banking 3.9 -- 1.0 1.0 1.9 Small Business Banking $14.9 $0.1 $1.1 $8.6 $3.1 SUBTOTAL – BUSINESS BANK 5.8 0.0 0.5 4.7 0.1 Specialty Businesses1 0.1 0.0 0.0 0.0 0.1 National Dealer Services 3.9 0.0 0.3 0.5 2.0 Global Corporate Banking 0.8 0.1 0.1 0.2 0.1 Commercial Real Estate $4.3 $0.0 $0.2 $3.2 $0.8 Middle Market TOTAL Florida Texas Western Midwest $ in billions 1 Specialty Businesses includes: Entertainment, Energy, FSD, Leasing and TLS 2 Finance/Other includes $5.2B in Institutional CD’s; included in Finance Division segment Deposits |
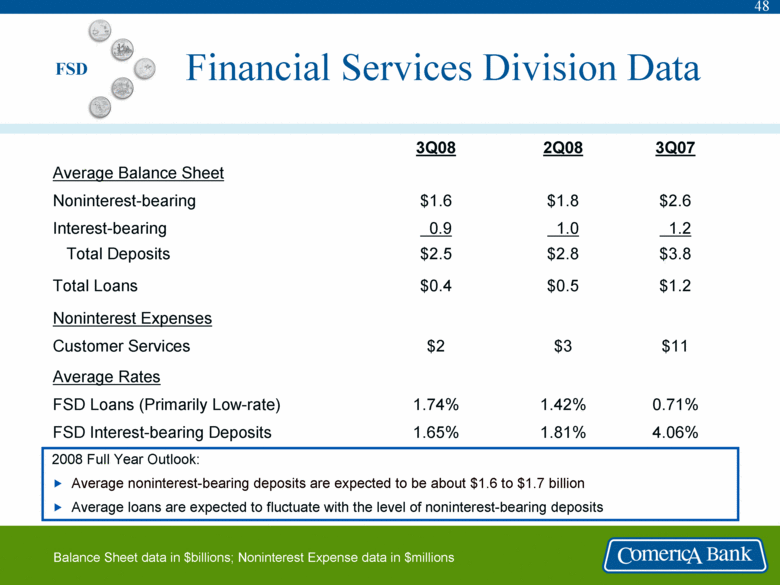
48 Financial Services Division Data 4.06% 1.81% 1.65% FSD Interest-bearing Deposits 0.71% 1.42% 1.74% FSD Loans (Primarily Low-rate) Average Rates $11 $3 $2 Customer Services Noninterest Expenses $1.2 $0.5 $0.4 Total Loans $3.8 $2.8 $2.5 Total Deposits 1.2 1.0 0.9 Interest-bearing $2.6 $1.8 $1.6 Noninterest-bearing Average Balance Sheet 3Q07 2Q08 3Q08 Balance Sheet data in $billions; Noninterest Expense data in $millions 2008 Full Year Outlook: Average noninterest-bearing deposits are expected to be about $1.6 to $1.7 billion Average loans are expected to fluctuate with the level of noninterest-bearing deposits FSD |
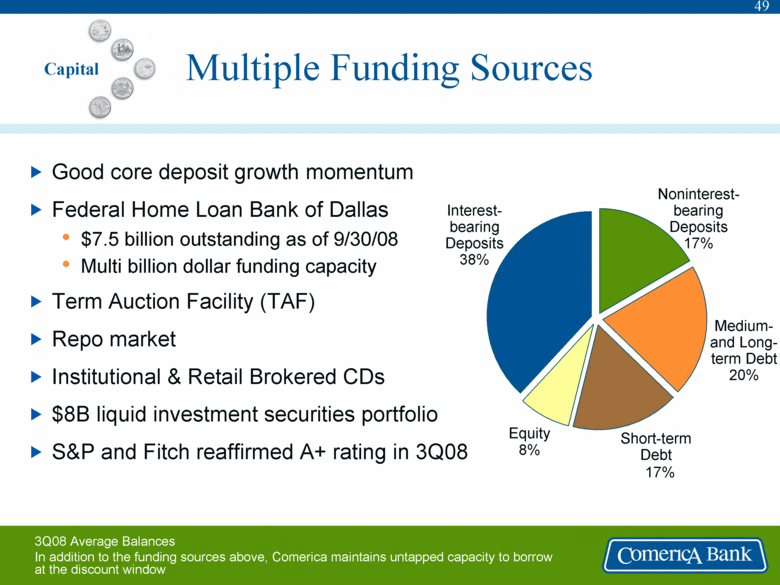
49 Multiple Funding Sources Good core deposit growth momentum Federal Home Loan Bank of Dallas • $7.5 billion outstanding as of 9/30/08 • Multi billion dollar funding capacity Term Auction Facility (TAF) Repo market Institutional & Retail Brokered CDs $8B liquid investment securities portfolio S&P and Fitch reaffirmed A+ rating in 3Q08 Capital Short-term Debt 17% Interest-bearing Deposits 38% Noninterest-bearing Deposits 17% Medium and Long-term Debt 20% Equity 8% 3Q08 Average Balances In addition to the funding sources above, Comerica maintains untapped capacity to borrow at the discount window |
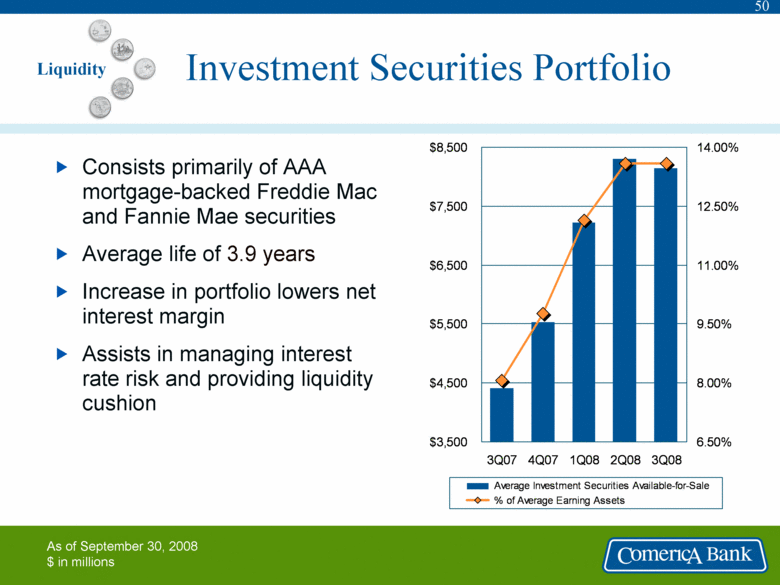
50 Investment Securities Portfolio Consists primarily of AAA mortgage-backed Freddie Mac and Fannie Mae securities Average life of 3.9 years Increase in portfolio lowers net interest margin Assists in managing interest rate risk and providing liquidity cushion As of September 30, 2008 $ in millions $3,500 $4,500 $5,500 $6,500 $7,500 $8,500 3Q07 4Q07 1Q08 2Q08 3Q08 6.50% 8.00% 9.50% 11.00% 12.50% 14.00% Average Investment Securities Available-for-Sale % of Average Earning Assets Liquidity |
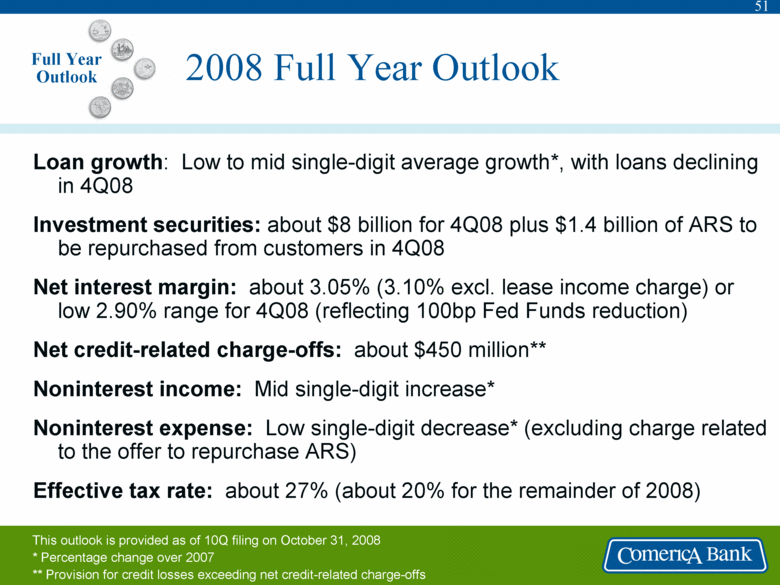
51 2008 Full Year Outlook Loan growth: Low to mid single-digit average growth*, with loans declining in 4Q08 Investment securities: about $8 billion for 4Q08 plus $1.4 billion of ARS to be repurchased from customers in 4Q08 Net interest margin: about 3.05% (3.10% excl. lease income charge) or low 2.90% range for 4Q08 (reflecting 100bp Fed Funds reduction) Net credit-related charge-offs: about $450 million** Noninterest income: Mid single-digit increase* Noninterest expense: Low single-digit decrease* (excluding charge related to the offer to repurchase ARS) Effective tax rate: about 27% (about 20% for the remainder of 2008) This outlook is provided as of 10Q filing on October 31, 2008 * Percentage change over 2007 ** Provision for credit losses exceeding net credit-related charge-offs Full Year Outlook |
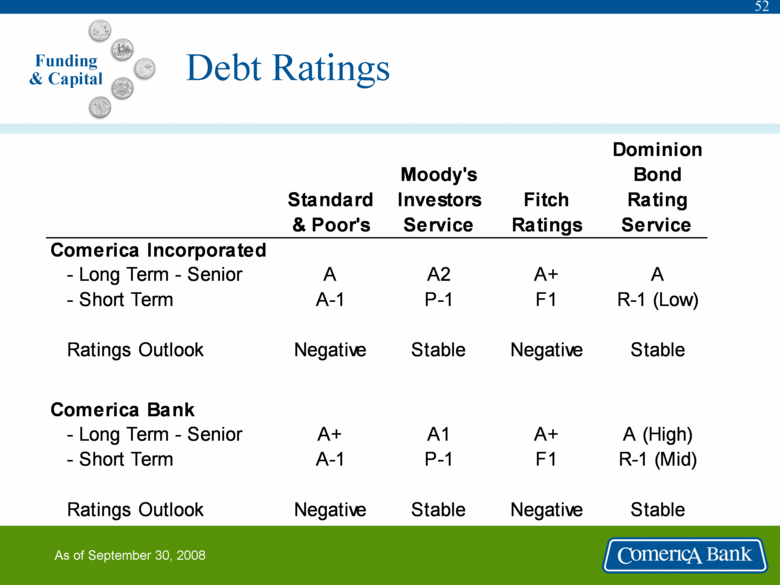
52 Dominion Moody's Bond Standard Investors Fitch Rating & Poor's Service Ratings Service Comerica Incorporated - Long Term - Senior A A2 A+ A - Short Term A-1 P-1 F1 R-1 (Low) Ratings Outlook Negative Stable Negative Stable Comerica Bank - Long Term - Senior A+ A1 A+ A (High) - Short Term A-1 P-1 F1 R-1 (Mid) Ratings Outlook Negative Stable Negative Stable Debt Ratings As of September 30, 2008 Funding & Capital |
[LOGO] |