Exhibit 99.2
| Comerica Incorporated Third Quarter 2011 Financial Review October 19, 2011 |
| Safe Harbor Statement Any statements in this presentation that are not historical facts are forward-looking statements as defined in the Private Securities Litigation Reform Act of 1995. Words such as “anticipates,” “believes,” “feels,” “expects,” “estimates,” “seeks,” “strives,” “plans,” “intends,” “outlook,” “forecast,” “position,” “target,” “mission,” “assume,” “achievable,” “potential,” “strategy,” “goal,” “aspiration,” “opportunity,” “initiative,” “outcome,” “continue,” “remain,” “maintain,” “trend,” “objective,” “pending,” “looks forward” and variations of such words and similar expressions, or future or conditional verbs such as “will,” “would,” “should,” “could,” “might,” “can,” “may” or similar expressions, as they relate to the Corporation or its management, are intended to identify forward-looking statements. These forward-looking statements are predicated on the beliefs and assumptions of the Corporation’s management based on information known to the Corporation’s management as of the date of this presentation and do not purport to speak as of any other date. Forward-looking statements may include descriptions of plans and objectives of the Corporation’s management for future or past operations, products or services, and forecasts of the Corporation’s revenue, earnings or other measures of economic performance, including statements of profitability, business segments and subsidiaries, estimates of credit trends and global stability. Such statements reflect the view of the Corporation’s management as of this date with respect to future events and are subject to risks and uncertainties. Should one or more of these risks materialize or should underlying beliefs or assumptions prove incorrect, the Corporation’s actual results could differ materially from those discussed. Factors that could cause or contribute to such differences are changes in general economic, political or industry conditions and related credit and market conditions; changes in trade, monetary and fiscal policies, including the interest rate policies of the Federal Reserve Board; adverse conditions in the capital markets; the interdependence of financial service companies; changes in regulation or oversight, including the effects of recently enacted legislation, actions taken by or proposed by the U.S. Treasury, the Board of Governors of the Federal Reserve System, the Texas Department of Banking and the Federal Deposit Insurance Corporation, legislation or regulations enacted in the future, and the impact and expiration of such legislation and regulatory actions; unfavorable developments concerning credit quality; the acquisition of Sterling Bancshares, Inc., or any future acquisitions; the effects of more stringent capital or liquidity requirements; declines or other changes in the businesses or industries in which the Corporation has a concentration of loans, including, but not limited to, the automotive production industry and the real estate business lines; the implementation of the Corporation’s strategies and business models, including the anticipated performance of any new banking centers and the implementation of revenue enhancements and efficiency improvements; the Corporation’s ability to utilize technology to efficiently and effectively develop, market and deliver new products and services; operational difficulties or information security problems; changes in the financial markets, including fluctuations in interest rates and their impact on deposit pricing; the entry of new competitors in the Corporation’s markets; changes in customer borrowing, repayment, investment and deposit practices; management’s ability to maintain and expand customer relationships; management’s ability to retain key officers and employees; the impact of legal and regulatory proceedings; the effectiveness of methods of reducing risk exposures; the effects of war and other armed conflicts or acts of terrorism and the effects of catastrophic events including, but not limited to, hurricanes, tornadoes, earthquakes, fires, droughts and floods. The Corporation cautions that the foregoing list of factors is not exclusive. For discussion of factors that may cause actual results to differ from expectations, please refer to our filings with the Securities and Exchange Commission. In particular, please refer to “Item 1A. Risk Factors” beginning on page 16 of the Corporation’s Annual Report on Form 10-K for the year ended December 31, 2010, “Item 1A. Risk Factors” beginning on page 65 of the Corporation’s Quarterly Report on Form 10-Q for the quarter ended March 31, 2011 and “Item 1A. Risk Factors” beginning on page 74 of the Corporation’s Quarterly Report on Form 10-Q for the quarter ended June 30, 2011. Forward-looking statements speak only as of the date they are made. The Corporation does not undertake to update forward-looking statements to reflect facts, circumstances, assumptions or events that occur after the date the forward-looking statements are made. For any forward-looking statements made in this presentation or in any documents, the Corporation claims the protection of the safe harbor for forward-looking statements contained in the Private Securities Litigation Reform Act of 1995. |

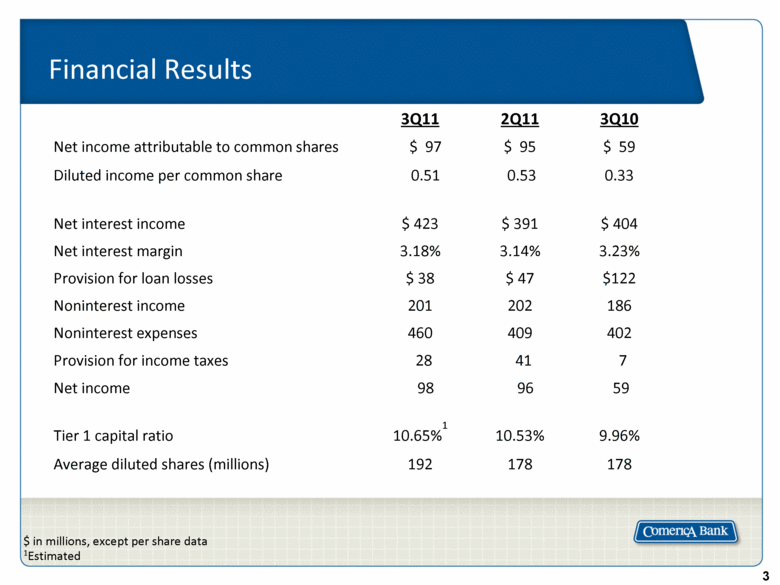
| Financial Results $ in millions, except per share data 1Estimated 3Q11 2Q11 3Q10 Net income attributable to common shares $ 97 $ 95 $ 59 Diluted income per common share 0.51 0.53 0.33 Net interest income $ 423 $ 391 $ 404 Net interest margin 3.18% 3.14% 3.23% Provision for loan losses $ 38 $ 47 $122 Noninterest income 201 202 186 Noninterest expenses 460 409 402 Provision for income taxes 28 41 7 Net income 98 96 59 Tier 1 capital ratio 10.65%1 10.53% 9.96% Average diluted shares (millions) 192 178 178 |
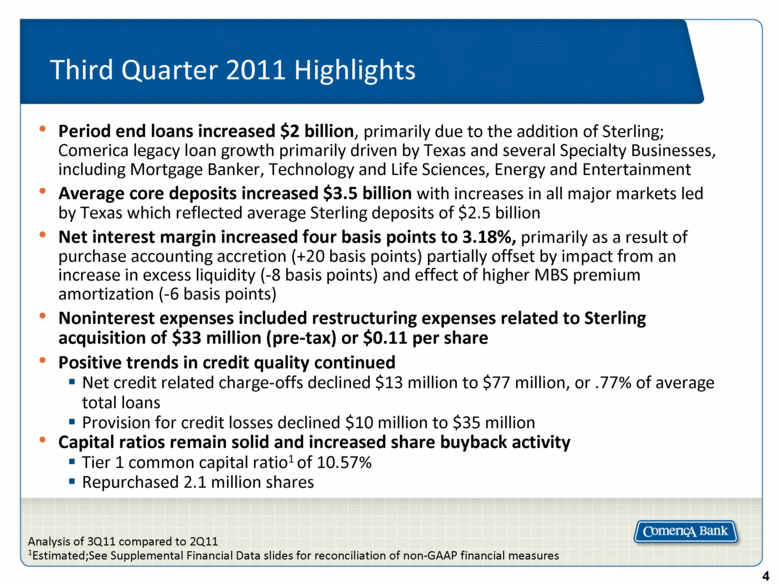
| Third Quarter 2011 Highlights Analysis of 3Q11 compared to 2Q11 1Estimated;See Supplemental Financial Data slides for reconciliation of non-GAAP financial measures Period end loans increased $2 billion, primarily due to the addition of Sterling; Comerica legacy loan growth primarily driven by Texas and several Specialty Businesses, including Mortgage Banker, Technology and Life Sciences, Energy and Entertainment Average core deposits increased $3.5 billion with increases in all major markets led by Texas which reflected average Sterling deposits of $2.5 billion Net interest margin increased four basis points to 3.18%, primarily as a result of purchase accounting accretion (+20 basis points) partially offset by impact from an increase in excess liquidity (-8 basis points) and effect of higher MBS premium amortization (-6 basis points) Noninterest expenses included restructuring expenses related to Sterling acquisition of $33 million (pre-tax) or $0.11 per share Positive trends in credit quality continued Net credit related charge-offs declined $13 million to $77 million, or .77% of average total loans Provision for credit losses declined $10 million to $35 million Capital ratios remain solid and increased share buyback activity Tier 1 common capital ratio1 of 10.57% Repurchased 2.1 million shares |
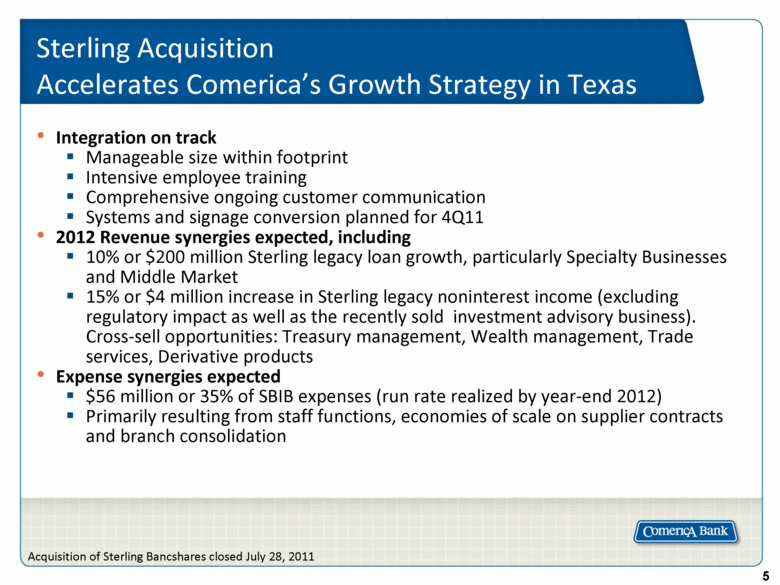
| Sterling Acquisition Accelerates Comerica’s Growth Strategy in Texas Integration on track Manageable size within footprint Intensive employee training Comprehensive ongoing customer communication Systems and signage conversion planned for 4Q11 2012 Revenue synergies expected, including 10% or $200 million Sterling legacy loan growth, particularly Specialty Businesses and Middle Market 15% or $4 million increase in Sterling legacy noninterest income (excluding regulatory impact as well as the recently sold investment advisory business). Cross-sell opportunities: Treasury management, Wealth management, Trade services, Derivative products Expense synergies expected $56 million or 35% of SBIB expenses (run rate realized by year-end 2012) Primarily resulting from staff functions, economies of scale on supplier contracts and branch consolidation Acquisition of Sterling Bancshares closed July 28, 2011 |
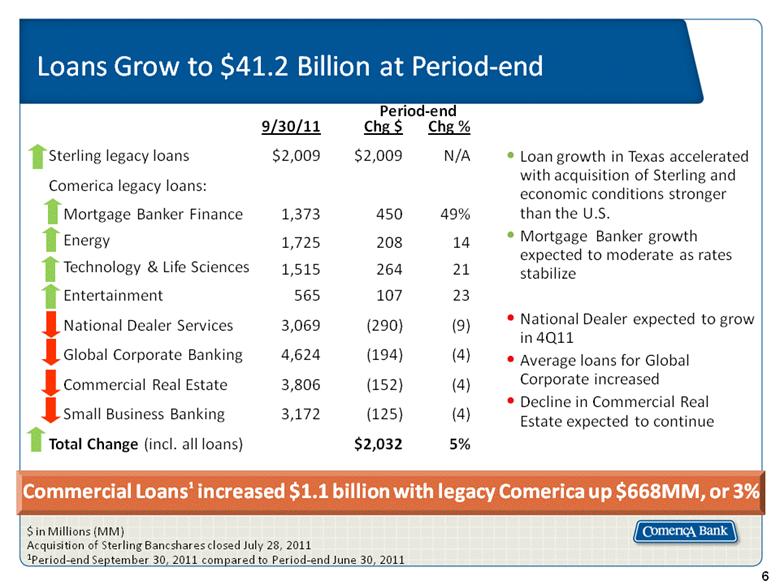
| 6 Loans Grow to $41.2 Billion at Period-end $ in Millions (MM) Acquisition of Sterling Bancshares closed July 28, 2011 1Period-end September 30, 2011 compared to Period-end June 30, 2011 Loan growth in Texas accelerated with acquisition of Sterling and economic conditions stronger than the U.S. Mortgage Banker growth expected to moderate as rates stabilize National Dealer expected to grow in 4Q11 Average loans for Global Corporate increased Decline in Commercial Real Estate expected to continue 9/30/11 Chg $ Chg % Sterling legacy loans $2,009 $2,009 N/A Comerica legacy loans: Mortgage Banker Finance 1,373 450 49% Energy 1,725 208 14 Technology & Life Sciences 1,515 264 21 Entertainment 565 107 23 National Dealer Services 3,069 (290) (9) Global Corporate Banking 4,624 (194) (4) Commercial Real Estate 3,806 (152) (4) Small Business Banking 3,172 (125) (4) Total Change (incl. all loans) $2,032 5% Period-end Commercial Loans1 increased $1.1 billion with legacy Comerica up $668MM, or 3% |
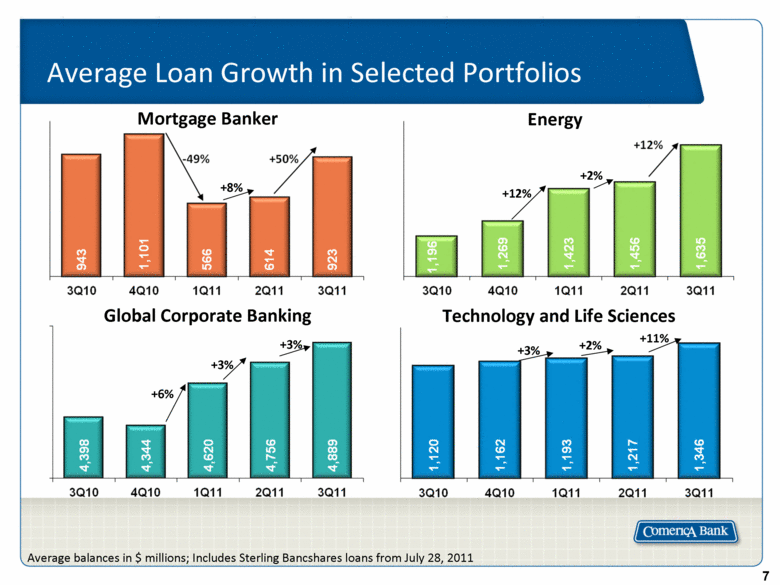
| Average Loan Growth in Selected Portfolios Average balances in $ millions; Includes Sterling Bancshares loans from July 28, 2011 Global Corporate Banking +3% +12% +6% +3% +3% +2% +2% +11% Energy Technology and Life Sciences Mortgage Banker +8% 3Q10 4Q10 1Q11 2Q11 3Q11 3Q10 4Q10 1Q11 2Q11 3Q11 3Q10 4Q10 1Q11 2Q11 3Q11 3Q10 4Q10 1Q11 2Q11 3Q11 943 1,101 566 614 923 1,196 1,269 1,423 1,456 1,635 4,398 4,344 4,620 4,756 4,889 1,120 1,162 1,193 1,217 1,346 |
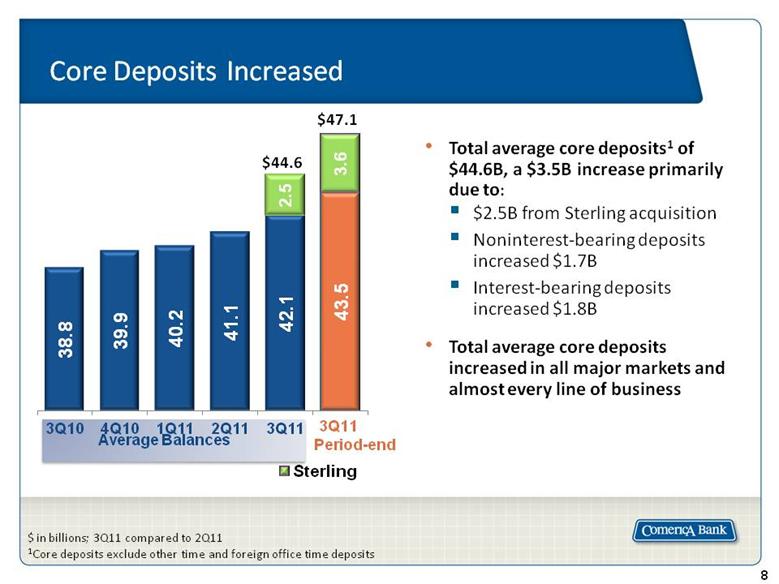
| Core Deposits Increased $ in billions; 3Q11 compared to 2Q11 1Core deposits exclude other time and foreign office time deposits Total average core deposits1 of $44.6B, a $3.5B increase primarily due to: $2.5B from Sterling acquisition Noninterest-bearing deposits increased $1.7B Interest-bearing deposits increased $1.8B Total average core deposits increased in all major markets and almost every line of business $47.1 $44.6 Average Balances Sterling |
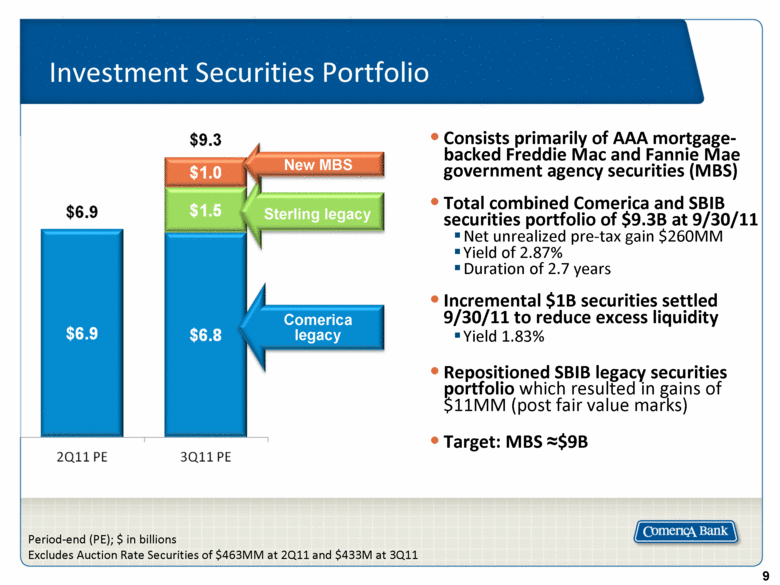
| Investment Securities Portfolio Consists primarily of AAA mortgage-backed Freddie Mac and Fannie Mae government agency securities (MBS) Total combined Comerica and SBIB securities portfolio of $9.3B at 9/30/11 Net unrealized pre-tax gain $260MM Yield of 2.87% Duration of 2.7 years Incremental $1B securities settled 9/30/11 to reduce excess liquidity Yield 1.83% Repositioned SBIB legacy securities portfolio which resulted in gains of $11MM (post fair value marks) Target: MBS = $9B Period-end (PE); $ in billions Excludes Auction Rate Securities of $463MM at 2Q11 and $433M at 3Q11 Sterling legacy New MBS Comerica legacy $6.9 $9.3 $6.9 $1.0 $1.5 $6.8 2Q11 PE 3Q11 PE |
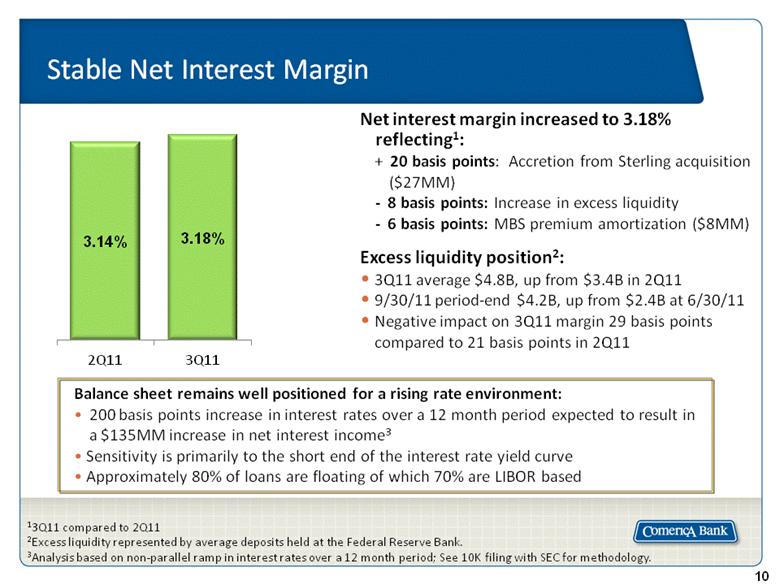
| Stable Net Interest Margin Excess liquidity position2: 3Q11 average $4.8B, up from $3.4B in 2Q11 9/30/11 period-end $4.2B, up from $2.4B at 6/30/11 Negative impact on 3Q11 margin 29 basis points compared to 21 basis points in 2Q11 13Q11 compared to 2Q11 2Excess liquidity represented by average deposits held at the Federal Reserve Bank. 3Analysis based on non-parallel ramp in interest rates over a 12 month period; See 10K filing with SEC for methodology. Net interest margin increased to 3.18% reflecting1: + 20 basis points: Accretion from Sterling acquisition ($27MM) - 8 basis points: Increase in excess liquidity - 6 basis points: MBS premium amortization ($8MM) Balance sheet remains well positioned for a rising rate environment: 200 basis points increase in interest rates over a 12 month period expected to result in a $135MM increase in net interest income3 Sensitivity is primarily to the short end of the interest rate yield curve Approximately 80% of loans are floating of which 70% are LIBOR based |
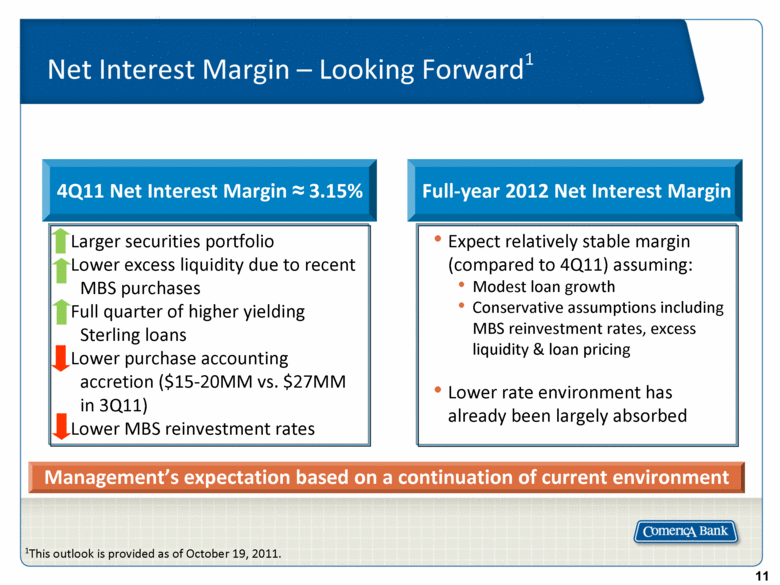
| Net Interest Margin – Looking Forward1 Expect relatively stable margin (compared to 4Q11) assuming: Modest loan growth Conservative assumptions including MBS reinvestment rates, excess liquidity & loan pricing Lower rate environment has already been largely absorbed Larger securities portfolio Lower excess liquidity due to recent MBS purchases Full quarter of higher yielding Sterling loans Lower purchase accounting accretion ($15-20MM vs. $27MM in 3Q11) Lower MBS reinvestment rates 1This outlook is provided as of October 19, 2011. 4Q11 Net Interest Margin = 3.15% Full-year 2012 Net Interest Margin Management’s expectation based on a continuation of current environment |
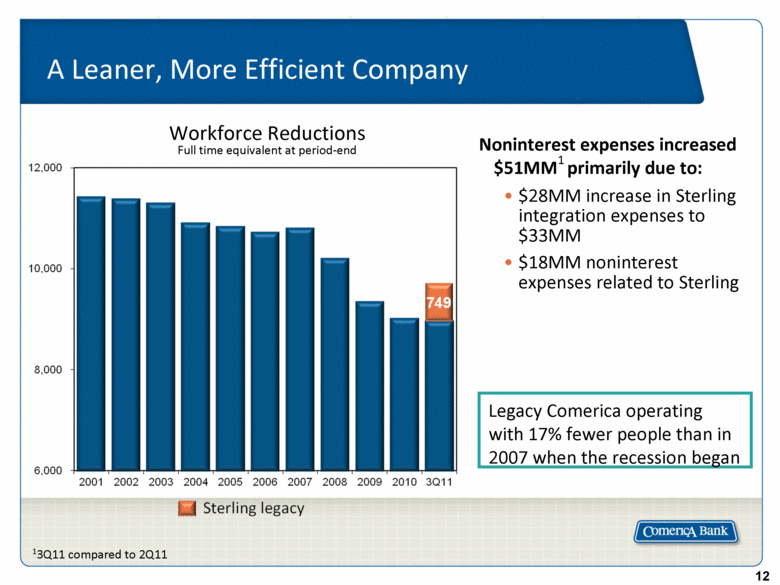
| A Leaner, More Efficient Company Workforce Reductions Full time equivalent at period-end 13Q11 compared to 2Q11 Noninterest expenses increased $51MM1 primarily due to: $28MM increase in Sterling integration expenses to $33MM $18MM noninterest expenses related to Sterling Legacy Comerica operating with 17% fewer people than in 2007 when the recession began |
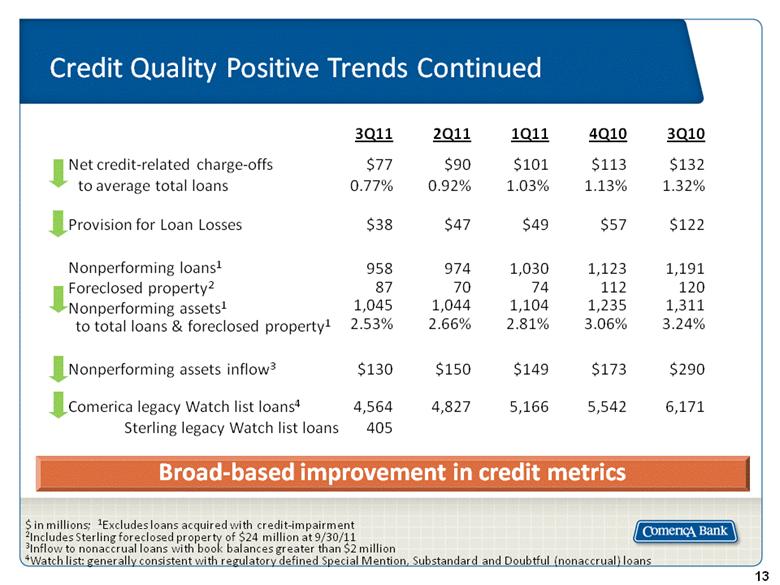
| $ in millions; 1Excludes loans acquired with credit-impairment 2Includes Sterling foreclosed property of $24 million at 9/30/11 3Inflow to nonaccrual loans with book balances greater than $2 million 4Watch list: generally consistent with regulatory defined Special Mention, Substandard and Doubtful (nonaccrual) loans Credit Quality Positive Trends Continued 3Q11 2Q11 1Q11 4Q10 3Q10 Net credit-related charge-offs to average total loans $77 0.77% $90 0.92% $101 1.03% $113 1.13% $132 1.32% Provision for Loan Losses $38 $47 $49 $57 $122 Nonperforming loans1 Foreclosed property2 Nonperforming assets1 to total loans & foreclosed property1 958 87 1,045 2.53% 974 70 1,044 2.66% 1,030 74 1,104 2.81% 1,123 112 1,235 3.06% 1,191 120 1,311 3.24% Nonperforming assets inflow3 $130 $150 $149 $173 $290 Comerica legacy Watch list loans4 Sterling legacy Watch list loans 4,564 405 4,827 5,166 5,542 6,171 Broad-based improvement in credit metrics |
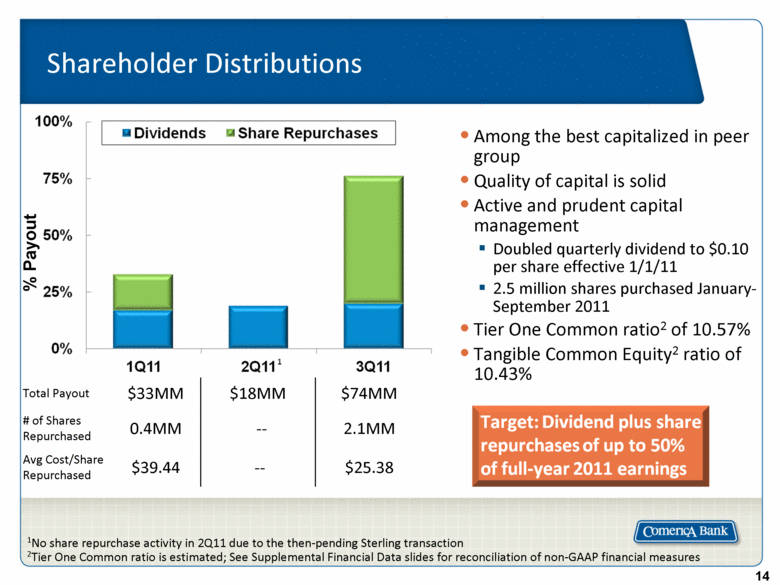
| Shareholder Distributions Total Payout $33MM $18MM $74MM # of Shares Repurchased 0.4MM -- 2.1MM Avg Cost/Share Repurchased $39.44 -- $25.38 % Payout Among the best capitalized in peer group Quality of capital is solid Active and prudent capital management Doubled quarterly dividend to $0.10 per share effective 1/1/11 2.5 million shares purchased January-September 2011 Tier One Common ratio2 of 10.57% Tangible Common Equity2 ratio of 10.43% 1No share repurchase activity in 2Q11 due to the then-pending Sterling transaction 2Tier One Common ratio is estimated; See Supplemental Financial Data slides for reconciliation of non-GAAP financial measures |
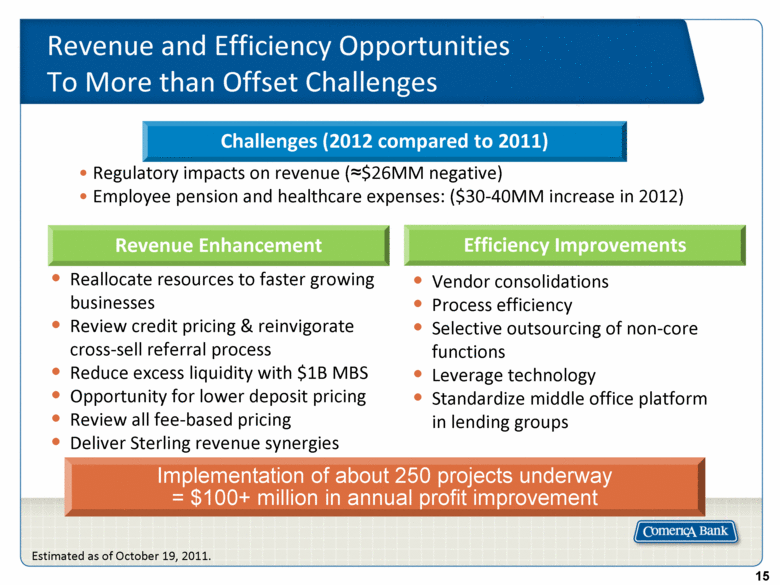
| Revenue and Efficiency Opportunities To More than Offset Challenges Reallocate resources to faster growing businesses Review credit pricing & reinvigorate cross-sell referral process Reduce excess liquidity with $1B MBS Opportunity for lower deposit pricing Review all fee-based pricing Deliver Sterling revenue synergies Vendor consolidations Process efficiency Selective outsourcing of non-core functions Leverage technology Standardize middle office platform in lending groups Revenue Enhancement Efficiency Improvements Implementation of about 250 projects underway = $100+ million in annual profit improvement Regulatory impacts on revenue (»$26MM negative) Employee pension and healthcare expenses: ($30-40MM increase in 2012) Challenges (2012 compared to 2011) Estimated as of October 19, 2011. |
| Management Outlook1 Fourth Quarter 2011 Outlook Compared to Third Quarter 2011: Average loans: low-single digit increase, largely reflecting one additional month of Sterling Period-end loans: relatively stable Average earning assets: approximately $54.5 billion Increase primarily related to Sterling average loans and MBS Net interest margin of about 3.15% Increase in mortgage-backed securities, one additional month of Sterling, lower excess liquidity, offset by a reduction in accretion of purchase discount on acquired Sterling loans ($15-20 million vs. $27 million in 3Q11) and lower MBS reinvestment rates Net credit-related charge-offs of $65-75 million Provision for credit losses to trend modestly lower Noninterest income: mid-single digit decrease Impact of regulatory changes No significant net securities gains expected in 4Q11 One additional month of Sterling noninterest income Noninterest expenses, excluding restructuring costs: low- to mid-single digit increase One additional month of Sterling expenses Income tax expense 36% of pre-tax income less approximately $17 million in fourth quarter 2011 tax benefits 1This outlook is provided as of October 19, 2011. Based on a continuation of current economic environment |

| Appendix |

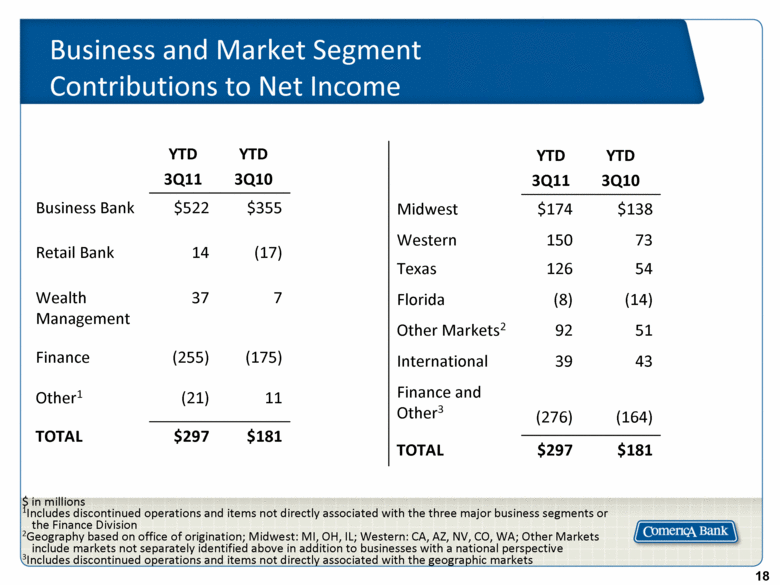
| Business and Market Segment Contributions to Net Income YTD 3Q11 YTD 3Q10 Business Bank $522 $355 Retail Bank 14 (17) Wealth Management 37 7 Finance (255) (175) Other1 (21) 11 TOTAL $297 $181 $ in millions 1Includes discontinued operations and items not directly associated with the three major business segments or the Finance Division 2Geography based on office of origination; Midwest: MI, OH, IL; Western: CA, AZ, NV, CO, WA; Other Markets include markets not separately identified above in addition to businesses with a national perspective 3Includes discontinued operations and items not directly associated with the geographic markets YTD 3Q11 YTD 3Q10 Midwest $174 $138 Western 150 73 Texas 126 54 Florida (8) (14) Other Markets2 92 51 International 39 43 Finance and Other3 (276) (164) TOTAL $297 $181 |
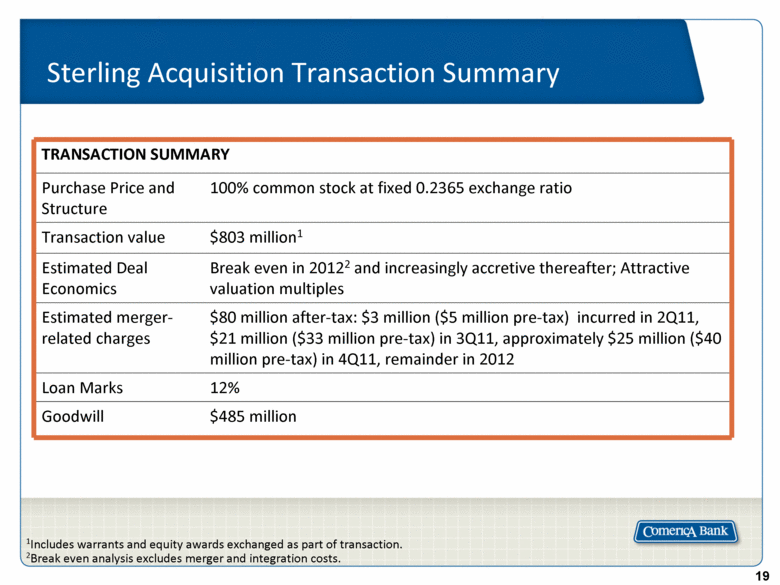
| Sterling Acquisition Transaction Summary 1Includes warrants and equity awards exchanged as part of transaction. 2Break even analysis excludes merger and integration costs. TRANSACTION SUMMARY Purchase Price and Structure 100% common stock at fixed 0.2365 exchange ratio Transaction value $803 million1 Estimated Deal Economics Break even in 20122 and increasingly accretive thereafter; Attractive valuation multiples Estimated merger-related charges $80 million after-tax: $3 million ($5 million pre-tax) incurred in 2Q11, $21 million ($33 million pre-tax) in 3Q11, approximately $25 million ($40 million pre-tax) in 4Q11, remainder in 2012 Loan Marks 12% Goodwill $485 million |
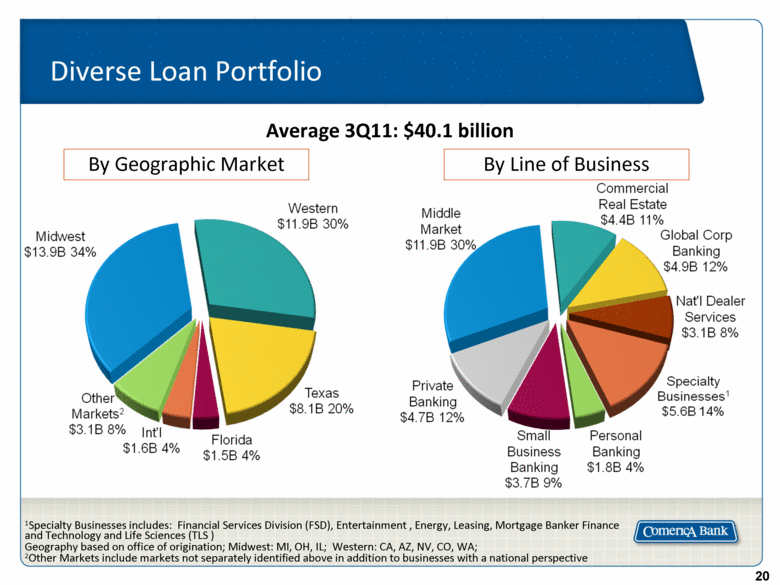
| Diverse Loan Portfolio 1Specialty Businesses includes: Financial Services Division (FSD), Entertainment , Energy, Leasing, Mortgage Banker Finance and Technology and Life Sciences (TLS ) Geography based on office of origination; Midwest: MI, OH, IL; Western: CA, AZ, NV, CO, WA; 2Other Markets include markets not separately identified above in addition to businesses with a national perspective Average 3Q11: $40.1 billion By Geographic Market By Line of Business |
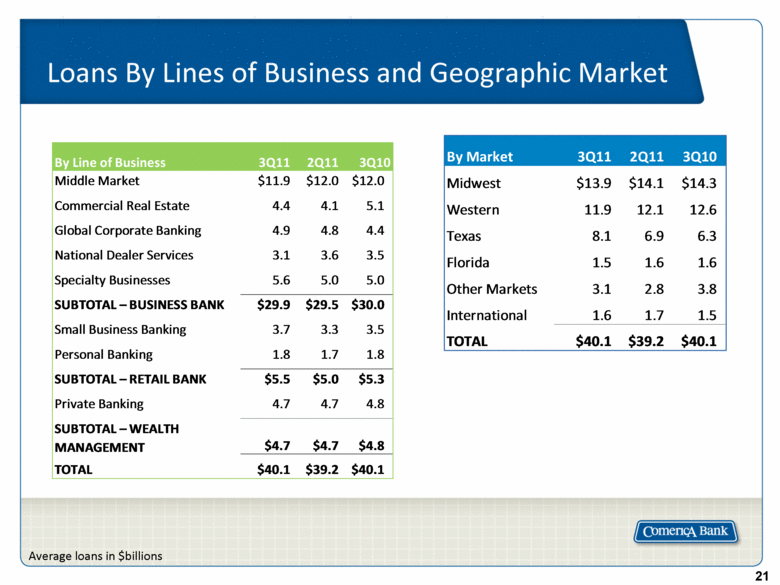
| Loans By Lines of Business and Geographic Market Average loans in $billions By Line of Business 3Q11 2Q11 3Q10 Middle Market $11.9 $12.0 $12.0 Commercial Real Estate 4.4 4.1 5.1 Global Corporate Banking 4.9 4.8 4.4 National Dealer Services 3.1 3.6 3.5 Specialty Businesses 5.6 5.0 5.0 SUBTOTAL – BUSINESS BANK $29.9 $29.5 $30.0 Small Business Banking 3.7 3.3 3.5 Personal Banking 1.8 1.7 1.8 SUBTOTAL – RETAIL BANK $5.5 $5.0 $5.3 Private Banking 4.7 4.7 4.8 SUBTOTAL – WEALTH MANAGEMENT $4.7 $4.7 $4.8 TOTAL $40.1 $39.2 $40.1 By Market 3Q11 2Q11 3Q10 Midwest $13.9 $14.1 $14.3 Western 11.9 12.1 12.6 Texas 8.1 6.9 6.3 Florida 1.5 1.6 1.6 Other Markets 3.1 2.8 3.8 International 1.6 1.7 1.5 TOTAL $40.1 $39.2 $40.1 |
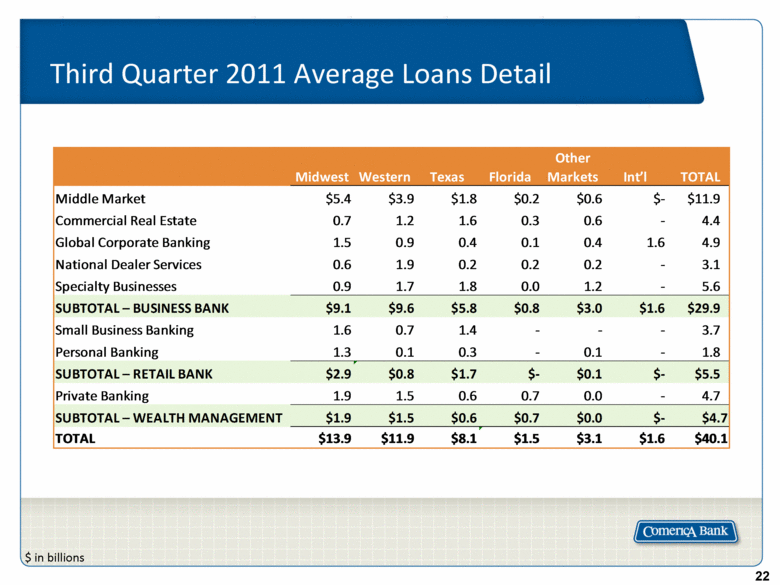
| Third Quarter 2011 Average Loans Detail $ in billions Middle Market $5.4 $3.9 $1.8 $0.2 $0 6 $- $11.9 Commercial Real Estate 0.7 1.2 1.6 0.3 0.6 - 4.4 Global Corporate Banking 1.5 0.9 0.4 0.1 0.4 1.6 4.9 National Dealer Services 0.6 1.9 0.2 0.2 0.2 - 3.1 Specialty Businesses 0.9 1.7 1.8 0.0 1.2 - 5.6 SUBTOTAL – BUSINESS BANK $9.1 $9.6 $5.8 $0.8 $3.0 $1.6 $29.9 Small Busine ss Banking 1.6 0.7 1.4 - - - 3.7 Personal Banking 1.3 0.1 0.3 - 0.1 - 1.8 SUBTOTAL – RETAIL BANK $2.9 $0.8 $1.7 $- $0.1 $- $5.5 Private Banking 1.9 1.5 0.6 0.7 0.0 - 4.7 SUBTOTAL – WEALTH MANAGEMENT TOTAL $1.9 $1.5 $0.6 $0.7 $0.0 $- $4.7 $13.9 $11.9 $8.1 $1.5 $3.1 $1.6 $40.1 |
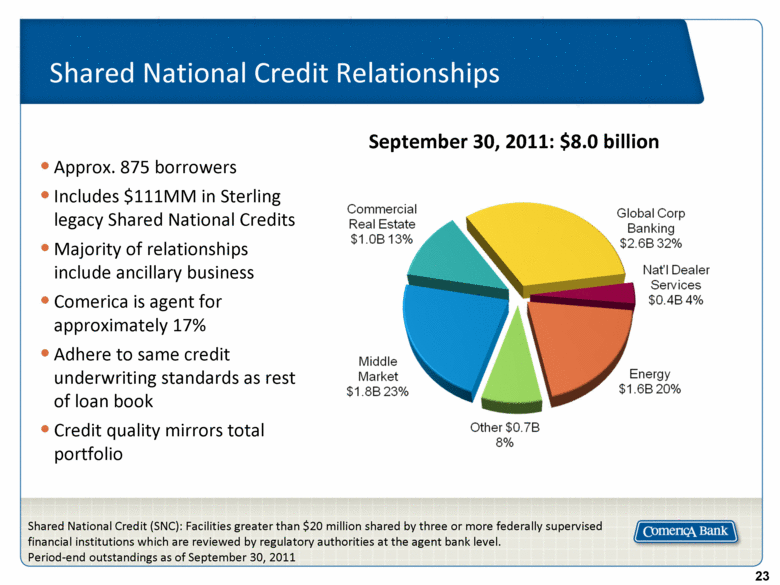
| Shared National Credit Relationships Approx. 875 borrowers Includes $111MM in Sterling legacy Shared National Credits Majority of relationships include ancillary business Comerica is agent for approximately 17% Adhere to same credit underwriting standards as rest of loan book Credit quality mirrors total portfolio September 30, 2011: $8.0 billion Shared National Credit (SNC): Facilities greater than $20 million shared by three or more federally supervised financial institutions which are reviewed by regulatory authorities at the agent bank level. Period-end outstandings as of September 30, 2011 |
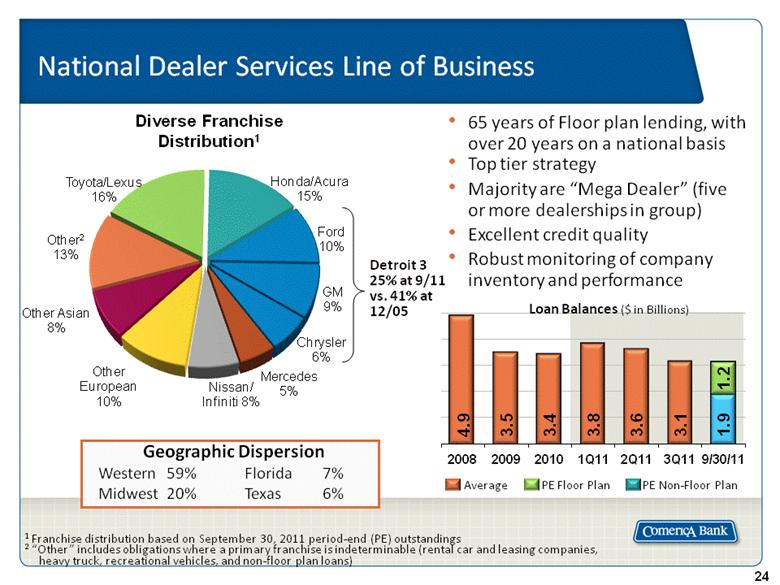
| National Dealer Services Line of Business Detroit 3 25% at 9/11 vs. 41% at 12/05 Geographic Dispersion Western 59% Florida 7% Midwest 20% Texas 6% 1 Franchise distribution based on September 30, 2011 period-end (PE) outstandings 2 “Other” includes obligations where a primary franchise is indeterminable (rental car and leasing companies, heavy truck, recreational vehicles, and non-floor plan loans) 65 years of Floor plan lending, with over 20 years on a national basis Top tier strategy Majority are “Mega Dealer” (five or more dealerships in group) Excellent credit quality Robust monitoring of company inventory and performance Loan Balances ($ in Billions) Average PE Floor Plan PE Non-Floor Plan Diverse Franchise Distribution 1 |
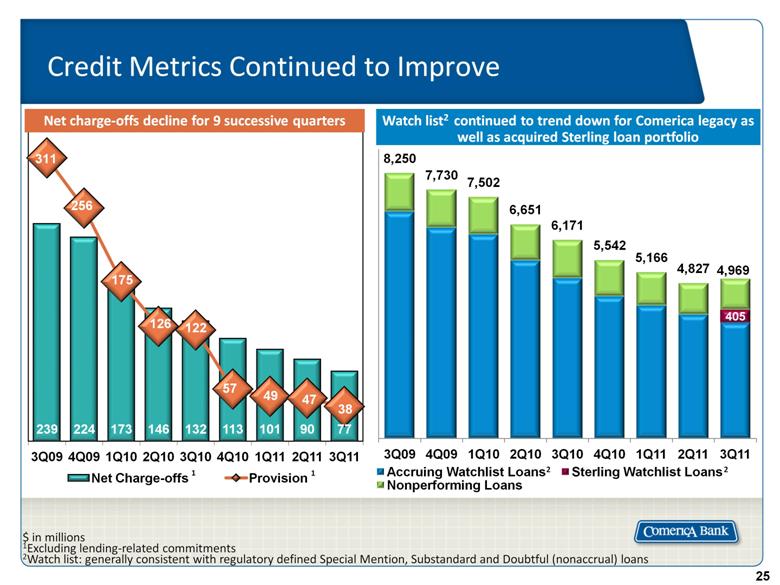
| Credit Metrics Continued to Improve $ in millions 1Excluding lending-related commitments 2Watch list: generally consistent with regulatory defined Special Mention, Substandard and Doubtful (nonaccrual) loans Watch list2 continued to trend down for Comerica legacy as well as acquired Sterling loan portfolio Net charge-offs decline for 9 successive quarters 1 1 2 2 |
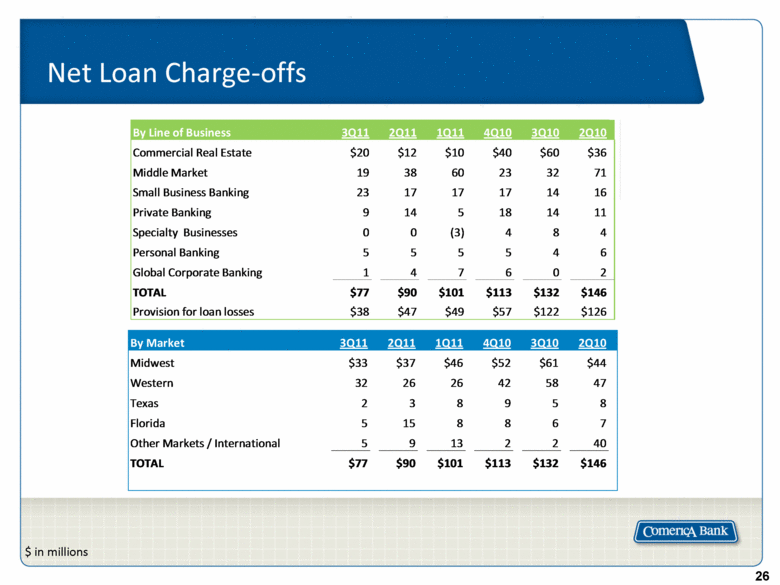
| Net Loan Charge-offs $ in millions By Line of Business 3Q11 2Q11 1Q11 4Q10 3Q10 2Q10 Commercial Real Estate $20 $12 $10 $40 $60 $36 Middle Market 19 38 60 23 32 71 Small Business Banking 23 17 17 17 14 16 Private Banking 9 14 5 18 14 11 Specialty Businesses 0 0 (3) 4 8 4 Personal Banking 5 5 5 5 4 6 Global Corporate Banking 1 4 7 6 0 2 TOTAL $77 $90 $101 $113 $132 $146 Provision for loan losses $38 $47 $49 $57 $122 $126 By Market 3Q11 2Q11 1Q11 4Q10 3Q10 2Q10 Midwest $33 $37 $46 $52 $61 $44 Western 32 26 26 42 58 47 Texas 2 3 8 9 5 8 Florida 5 15 8 8 6 7 Other Markets / International 5 9 13 2 2 40 TOTAL $77 $90 $101 $113 $132 $146 |
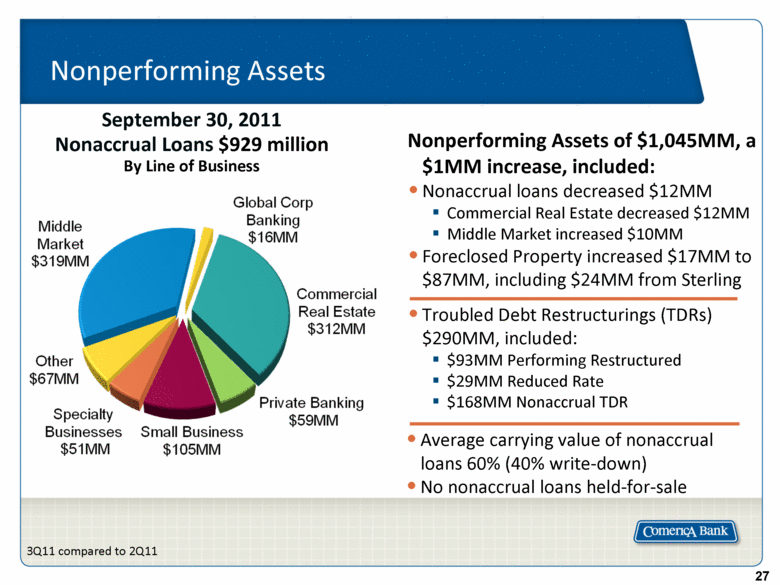
| Average carrying value of nonaccrual loans 60% (40% write-down) No nonaccrual loans held-for-sale 3Q11 compared to 2Q11 Nonperforming Assets of $1,045MM, a $1MM increase, included: Nonaccrual loans decreased $12MM Commercial Real Estate decreased $12MM Middle Market increased $10MM Foreclosed Property increased $17MM to $87MM, including $24MM from Sterling Troubled Debt Restructurings (TDRs) $290MM, included: $93MM Performing Restructured $29MM Reduced Rate $168MM Nonaccrual TDR September 30, 2011 Nonaccrual Loans $929 million By Line of Business Middle Market $319MM Global Corp Banking $16MM Other $67MM Specialty Businesses $51MM Small Business $105MM Private Banking $59MM Commercial Real Estate $312MM |
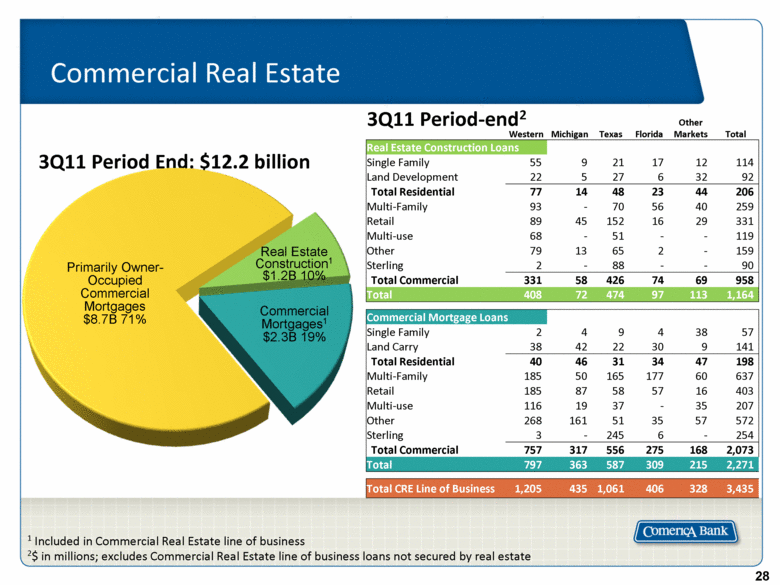
| Western Michigan Texas Florida Other Markets Total Real Estate Construction Loans Single Family 55 9 21 17 12 114 Land Development 22 5 27 6 32 92 Total Residential 77 14 48 23 44 206 Multi-Family 93 - 70 56 40 259 Retail 89 45 152 16 29 331 Multi-use 68 - 51 - - 119 Other 79 13 65 2 - 159 Sterling 2 - 88 - - 90 Total Commercial 331 58 426 74 69 958 Total 408 72 474 97 113 1,164 Commercial Mortgage Loans Single Family 2 4 9 4 38 57 Land Carry 38 42 22 30 9 141 Total Residential 40 46 31 34 47 198 Multi-Family 185 50 165 177 60 637 Retail 185 87 58 57 16 403 Multi-use 116 19 37 - 35 207 Other 268 161 51 35 57 572 Sterling 3 - 245 6 - 254 Total Commercial 757 317 556 275 168 2,073 Total 797 363 587 309 215 2,271 Total CRE Line of Business 1,205 435 1,061 406 328 3,435 Commercial Real Estate 1 Included in Commercial Real Estate line of business 2$ in millions; excludes Commercial Real Estate line of business loans not secured by real estate 3Q11 Period End: $12.2 billion Primarily Owner-Occupied Commercial Mortgages $8.7B 71% Real Estate Construction1 $1.2B 10% Commercial Mortgages1 $2.3B 19% 3Q11 Period-end2 |
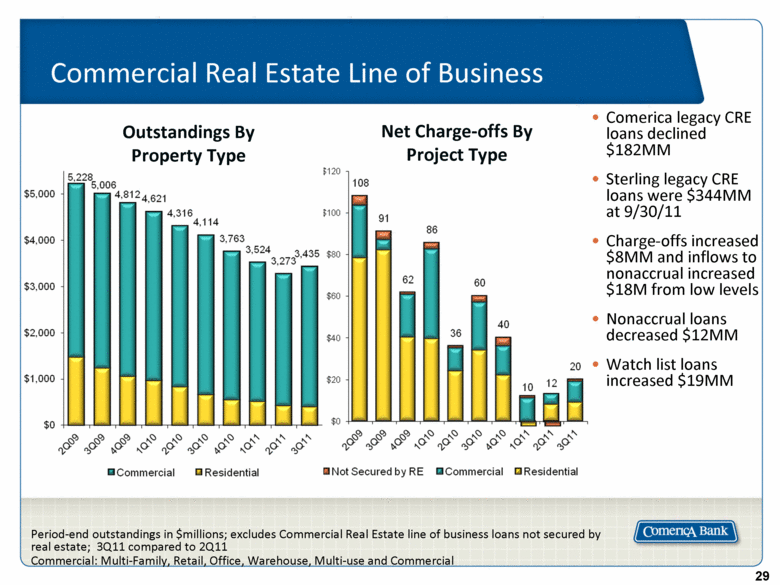
| Commercial Real Estate Line of Business Outstandings By Property Type Net Charge-offs By Project Type Period-end outstandings in $millions; excludes Commercial Real Estate line of business loans not secured by real estate; 3Q11 compared to 2Q11 Commercial: Multi-Family, Retail, Office, Warehouse, Multi-use and Commercial Comerica legacy CRE loans declined $182MM Sterling legacy CRE loans were $344MM at 9/30/11 Charge-offs increased $8MM and inflows to nonaccrual increased $18M from low levels Nonaccrual loans decreased $12MM Watch list loans increased $19MM |
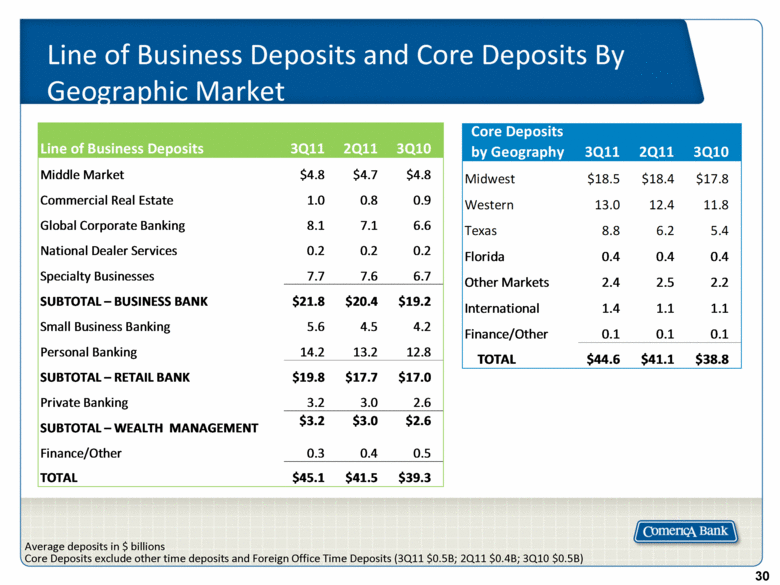
| Line of Business Deposits and Core Deposits By Geographic Market Average deposits in $ billions Core Deposits exclude other time deposits and Foreign Office Time Deposits (3Q11 $0.5B; 2Q11 $0.4B; 3Q10 $0.5B) Line of Business Deposits 3Q11 2Q11 3Q10 Middle Market $4.8 $4.7 $4.8 Commercial Real Estate 1.0 0.8 0.9 Global Corporate Banking 8.1 7.1 6.6 National Dealer Services 0.2 0.2 0.2 Specialty Businesses 7.7 7.6 6.7 SUBTOTAL – BUSINESS BANK $21.8 $20.4 $19.2 Small Business Banking 5.6 4.5 4.2 Personal Banking 14.2 13.2 12.8 SUBTOTAL – RETAIL BANK $19.8 $17.7 $17.0 Private Banking 3.2 3.0 2.6 SUBTOTAL – WEALTH MANAGEMENT $3.2 $3.0 $2.6 Finance/Other 0.3 0.4 0.5 TOTAL $45.1 $41.5 $39.3 Core Deposits by Geography 3Q11 2Q11 3Q10 Midwest $18.5 $18.4 $17.8 Western 13.0 12.4 11.8 Texas 8.8 6.2 5.4 Florida 0.4 0.4 0.4 Other Markets 2.4 2.5 2.2 International 1.4 1.1 1.1 Finance/Other 0.1 0.1 0.1 TOTAL $44.6 $41.1 $38.8 |
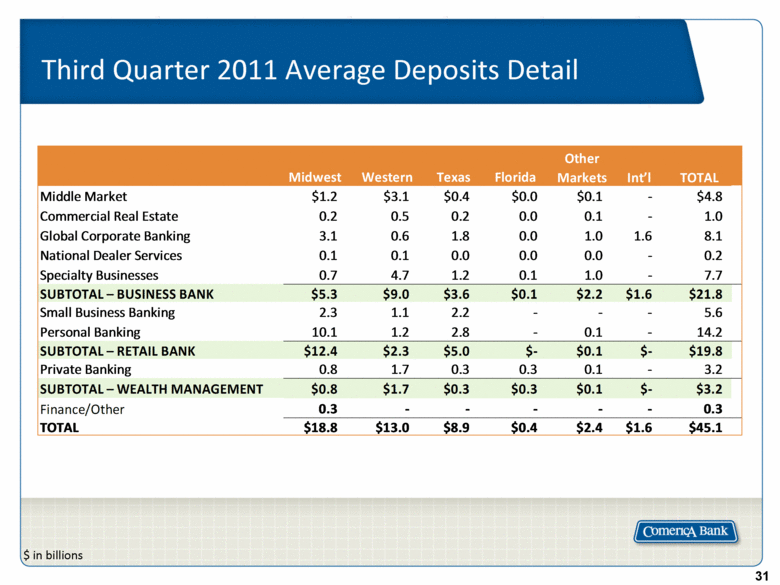
| Third Quarter 2011 Average Deposits Detail $ in billions Other Midwest Western Texas Florida Markets Int’l TOTAL Middle Market $1.2 $3.1 $0.4 $0.0 $0.1 - $4.8 Commercial Real Estate 0.2 0.5 0.2 0.0 0.1 - 1.0 Global Corporate Banking 3.1 0.6 1.8 0.0 1.0 1.6 8.1 National Dealer Services 0.1 0.1 0.0 0.0 0.0 - 0.2 Specialty Businesses 0.7 4.7 1.2 0.1 1.0 - 7.7 SUBTOTAL – BUSINESS BANK $5.3 $9.0 $3.6 $0.1 $2.2 $1.6 $21.8 Small Business Banking 2.3 1.1 2.2 - - - 5.6 Personal Banking 10.1 1.2 2.8 - 0.1 - 14.2 SUBTOTAL – RETAIL BANK $12.4 $2.3 $5.0 $- $0.1 $- $19.8 Private Banking 0.8 1.7 0.3 0.3 0.1 - 3.2 SUBTOTAL – WEALTH MANAGEMENT $0.8 $1.7 $0.3 $0.3 $0.1 $- $3.2 Finance/Other TOTAL 0.3 - - - - - 0.3 $18.8 $13.0 $8.9 $0.4 $2.4 $1.6 $45.1 |
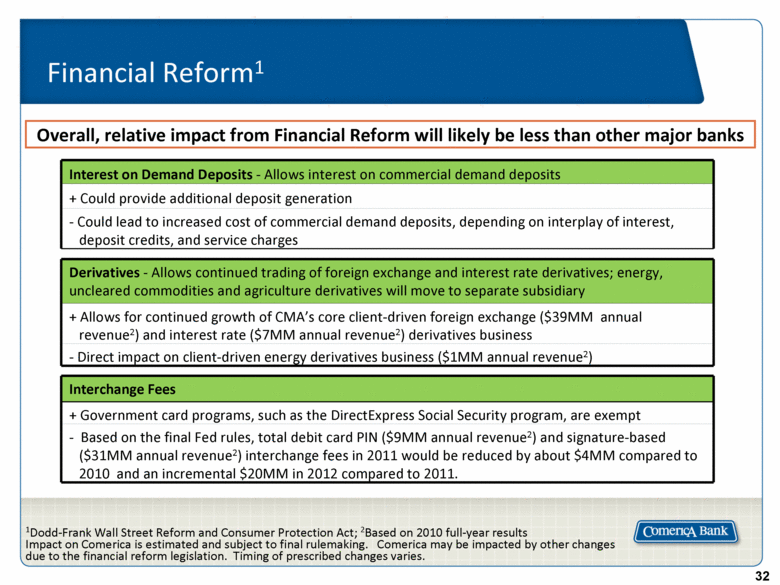
| 1Dodd-Frank Wall Street Reform and Consumer Protection Act; 2Based on 2010 full-year results Impact on Comerica is estimated and subject to final rulemaking. Comerica may be impacted by other changes due to the financial reform legislation. Timing of prescribed changes varies. Overall, relative impact from Financial Reform will likely be less than other major banks Financial Reform1 Interest on Demand Deposits - Allows interest on commercial demand deposits + Could provide additional deposit generation - Could lead to increased cost of commercial demand deposits, depending on interplay of interest, deposit credits, and service charges Derivatives - Allows continued trading of foreign exchange and interest rate derivatives; energy, uncleared commodities and agriculture derivatives will move to separate subsidiary + Allows for continued growth of CMA’s core client-driven foreign exchange ($39MM annual revenue2) and interest rate ($7MM annual revenue2) derivatives business - Direct impact on client-driven energy derivatives business ($1MM annual revenue2) Interchange Fees + Government card programs, such as the DirectExpress Social Security program, are exempt - Based on the final Fed rules, total debit card PIN ($9MM annual revenue2) and signature-based ($31MM annual revenue2) interchange fees in 2011 would be reduced by about $4MM compared to 2010 and an incremental $20MM in 2012 compared to 2011. |
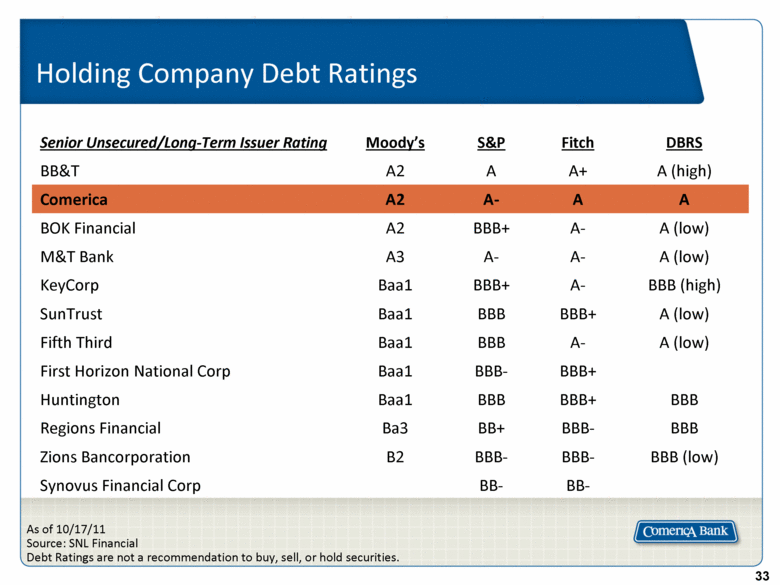
| Senior Unsecured/Long-Term Issuer Rating Moody’s S&P Fitch DBRS BB&T A2 A A+ A (high) Comerica A2 A- A A BOK Financial A2 BBB+ A- A (low) M&T Bank A3 A- A- A (low) KeyCorp Baa1 BBB+ A- BBB (high) SunTrust Baa1 BBB BBB+ A (low) Fifth Third Baa1 BBB A- A (low) First Horizon National Corp Baa1 BBB- BBB+ Huntington Baa1 BBB BBB+ BBB Regions Financial Ba3 BB+ BBB- BBB Zions Bancorporation B2 BBB- BBB- BBB (low) Synovus Financial Corp BB- BB- Holding Company Debt Ratings As of 10/17/11 Source: SNL Financial Debt Ratings are not a recommendation to buy, sell, or hold securities. |
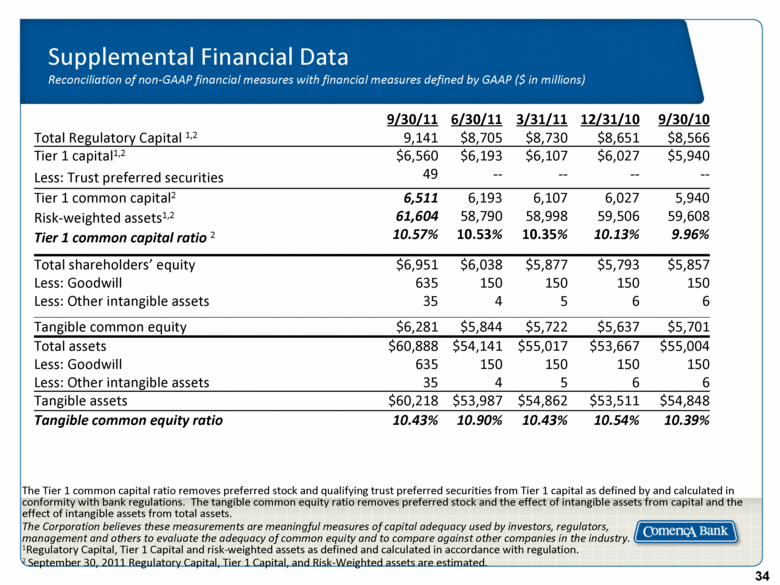
| Supplemental Financial Data Reconciliation of non-GAAP financial measures with financial measures defined by GAAP ($ in millions) The Tier 1 common capital ratio removes preferred stock and qualifying trust preferred securities from Tier 1 capital as defined by and calculated in conformity with bank regulations. The tangible common equity ratio removes preferred stock and the effect of intangible assets from capital and the effect of intangible assets from total assets. The Corporation believes these measurements are meaningful measures of capital adequacy used by investors, regulators, management and others to evaluate the adequacy of common equity and to compare against other companies in the industry. 1Regulatory Capital, Tier 1 Capital and risk-weighted assets as defined and calculated in accordance with regulation. 2 September 30, 2011 Regulatory Capital, Tier 1 Capital, and Risk-Weighted assets are estimated. 9/30/11 6/30/11 3/31/11 12/31/10 9/30/10 Total Regulatory Capital 1,2 9,141 $8,705 $8,730 $8,651 $8,566 Tier 1 capital1,2 Less: Trust preferred securities $6,560 49 $6,193 -- $6,107 -- $6,027 -- $5,940 -- Tier 1 common capital2 Risk-weighted assets1,2 Tier 1 common capital ratio 2 6,511 61,604 10.57% 6,193 58,790 10.53% 6,107 58,998 10.35% 6,027 59,506 10.13% 5,940 59,608 9.96% Total shareholders’ equity Less: Goodwill Less: Other intangible assets $6,951 635 35 $6,038 150 4 $5,877 150 5 $5,793 150 6 $5,857 150 6 Tangible common equity $6,281 $5,844 $5,722 $5,637 $5,701 Total assets Less: Goodwill Less: Other intangible assets $60,888 635 35 $54,141 150 4 $55,017 150 5 $53,667 150 6 $55,004 150 6 Tangible assets $60,218 $53,987 $54,862 $53,511 $54,848 Tangible common equity ratio 10.43% 10.90% 10.43% 10.54% 10.39% |
| [LOGO] |