UNITED STATES
SECURITIES AND EXCHANGE COMMISSION
Washington, D.C. 20549
FORM N-CSR
CERTIFIED SHAREHOLDER REPORT OF REGISTERED
MANAGEMENT INVESTMENT COMPANIES
Investment Company Act file number 811-03480
Fidelity Oxford Street Trust
(Exact name of registrant as specified in charter)
245 Summer St., Boston, Massachusetts 02210
(Address of principal executive offices) (Zip code)
Margaret Carey, Secretary
245 Summer St.
Boston, Massachusetts 02210
(Name and address of agent for service)
Registrant's telephone number, including area code:
617-563-7000
| |
Date of fiscal year end: | July 31 |
|
|
Date of reporting period: | July 31, 2024 |
Item 1.
Reports to Stockholders
| |
| | ANNUAL SHAREHOLDER REPORT | AS OF JULY 31, 2024 | This report describes changes to the Fund that occurred during the reporting period. |
| | Fidelity® SAI Inflation-Focused Fund Fidelity® SAI Inflation-Focused Fund : FIFGX |
| | | |
This annual shareholder report contains information about Fidelity® SAI Inflation-Focused Fund for the period August 1, 2023 to July 31, 2024. You can find additional information about the Fund at fundresearch.fidelity.com/prospectus/sec. You can also request this information by contacting us at 1-800-544-3455 or by sending an e-mail to fidfunddocuments@fidelity.com.
What were your Fund costs for the last year?(based on hypothetical $10,000 investment)
FUND COST (PREVIOUS YEAR)
| | Costs of a $10,000 investment | Costs paid as a percentage of a $10,000 investment | |
| Fidelity® SAI Inflation-Focused Fund | $ 38 | 0.39% | |
What affected the Fund's performance this period?
•For the 12 months ending July 31, 2024, many commodities lost value amid often-favorable supply conditions and a stronger U.S. dollar. Others benefited amid an expanding global economy and a slowing in the pace of inflation in certain markets, as well as moves by some central banks toward monetary easing. Meanwhile, Treasury Inflation Protected Securities lagged money market securities. (The following returns are stated on a total-return basis.)
•For the full 12 months, the grains group (-26%) within the agriculture sector (-16%) detracted most, hampered most by corn (-29%) and soybeans (-21%). Grains faced headwinds from a rising U.S. dollar. Also within agriculture, soybean oil (-27%) experienced weakness, while so-called softs (+9%) were led by coffee (+54%).
•The energy sector (-13%) also detracted, hampered by a sharp decline in natural gas (-54%). However, West Texas Intermediate crude oil (+8%) and Brent crude oil (+7%) gained, benefiting from tighter supplies.
•In contrast, the fund benefited from precious metals (+21%) amid dovish monetary policy expectations and safe-haven demand with gold and silver gaining about 22% and 15%, respectively. Elsewhere, industrial metals returned about -2%, led by copper (+7%), while nickel (-26%) lost value.
•Livestock gained 2%, led by strength in the price of live cattle (+8%) partly counterbalanced by weakness in lean hogs (-7%).
How did the Fund perform over the life of Fund?
CUMULATIVE PERFORMANCE
December 20, 2018 through July 31, 2024.
Initial investment of $10,000.
Fidelity® SAI Inflation-Focused Fund | $10,000 | $10,351 | $9,518 | $13,953 | $17,787 | $15,330 | $14,713 |
Fidelity Commodity Linked Index℠ | $10,000 | $10,166 | $8,938 | $12,538 | $15,952 | $14,695 | $13,960 |
Bloomberg Commodity 50/50 Petroleum and ex-Petroleum Index | $10,000 | $10,351 | $9,518 | $13,953 | $17,787 | $15,671 | $15,549 |
Bloomberg Commodity Index | $10,000 | $10,166 | $8,938 | $12,538 | $15,952 | $14,695 | $13,935 |
| | 2018 | 2019 | 2020 | 2021 | 2022 | 2023 | 2024 |
AVERAGE ANNUAL TOTAL RETURNS: | | 1 Year | 5 Year | Life of Fund A |
| Fidelity® SAI Inflation-Focused Fund | -4.03% | 7.29% | 7.12% |
| Fidelity Commodity Linked Index℠ | -5.00% | 6.55% | 6.12% |
| Bloomberg Commodity 50/50 Petroleum and ex-Petroleum Index | -0.78% | -% | -% |
| Bloomberg Commodity Index | -5.17% | 6.51% | 6.09% |
A From December 20, 2018
Visit www.fidelity.com for more recent performance information. |
The Fund's past performance is not a good predictor of the Fund's future performance. The graph and table do not reflect the deduction of taxes that a shareholder would pay on fund distributions or redemption of fund shares. |
Key Fund Statistics (as of July 31, 2024)
KEY FACTS | | |
| Fund Size | $4,273,799,379 | |
| Number of Holdings | 53 | |
| Total Advisory Fee | $13,403,812 | |
| Portfolio Turnover | 0% | |
What did the Fund invest in?
(as of July 31, 2024)
| Energy | 53.7 |
| Agriculture | 18.5 |
| Precious Metals | 14.3 |
| Industrial Metals | 8.8 |
| Livestock | 4.7 |
COMMODITY SECTOR DIVERSIFICATION (% of Fund's net assets) |
|
|
DERIVATIVE EXPOSURE (% of Fund's net assets) | | |
| Futures Contracts | 100.0 | |
| |
| Futures Contracts | 50.0 |
| Short-Term Investments and Net Other Assets (Liabilities) | 50.0 |
ASSET ALLOCATION (% of Fund's total exposure) |
|
|
How has the Fund changed?
This is a summary of certain changes to the Fund since August 1, 2023. For more complete information, you may review the Fund's next prospectus, which we expect to be available by September 28, 2024 at fundresearch.fidelity.com/prospectus/sec or upon request at 1-800-544-3455 or by sending an e-mail to fidfunddocuments@fidelity.com.
The fund's principal investment strategies were modified to provide more investment flexibility, as described in the prospectus. | |
| Fidelity, the Fidelity Investments Logo and all other Fidelity trademarks or service marks used herein are trademarks or service marks of FMR LLC. Any third-party marks that are used herein are trademarks or service marks of their respective owners. © 2024 FMR LLC. All rights reserved. |
| | For additional information about the Fund; including its prospectus, financial information, holdings and proxy information, scan the QR code or visit fundresearch.fidelity.com/prospectus/sec 1.9913552.100 3318-TSRA-0924 |
| |
| | ANNUAL SHAREHOLDER REPORT | AS OF JULY 31, 2024 | This report describes changes to the Fund that occurred during the reporting period. |
| | Fidelity® Commodity Strategy Fund Fidelity® Commodity Strategy Fund : FYHTX |
| | | |
This annual shareholder report contains information about Fidelity® Commodity Strategy Fund for the period August 1, 2023 to July 31, 2024. You can find additional information about the Fund at fundresearch.fidelity.com/prospectus/sec. You can also request this information by contacting us at 1-800-544-8544 or by sending an e-mail to fidfunddocuments@fidelity.com.
What were your Fund costs for the last year?(based on hypothetical $10,000 investment)
FUND COST (PREVIOUS YEAR)
| | Costs of a $10,000 investment | Costs paid as a percentage of a $10,000 investment | |
| Fidelity® Commodity Strategy Fund | $ 62 | 0.63% | |
What affected the Fund's performance this period?
•For the 12 months ending July 31, 2024, many commodities lost value amid often-favorable supply conditions and a stronger U.S. dollar. Others benefited amid an expanding global economy and a slowing in the pace of inflation in certain markets, as well as moves by some central banks toward monetary easing. (The following returns are stated on a total-return basis.)
•For the full 12 months, the grains group (-26%) within the agriculture sector (-16%) detracted most, hampered most by corn (-29%) and soybeans (-21%). Grains faced headwinds from a rising U.S. dollar. Also within agriculture, soybean oil (-27%) experienced weakness, while so-called softs (+9%) were led by coffee (+54%).
•The energy sector (-13%) also detracted, hampered by a sharp decline in natural gas (-54%). However, West Texas Intermediate crude oil (+8%) and Brent crude oil (+7%) gained, benefiting from tighter supplies.
•In contrast, the fund benefited from precious metals (+21%) amid dovish monetary policy expectations and safe-haven demand with gold and silver gaining about 22% and 15%, respectively. Elsewhere, industrial metals returned about -2%, led by copper (+7%), while nickel (-26%) lost value.
•Livestock gained 2%, led by strength in the price of live cattle (+8%) partly counterbalanced by weakness in lean hogs (-7%).
How did the Fund perform over the life of Fund?
CUMULATIVE PERFORMANCE
May 30, 2017 through July 31, 2024.
Initial investment of $10,000.
Fidelity® Commodity Strategy Fund | $10,000 | $10,150 | $10,329 | $9,675 | $8,505 | $11,820 | $14,785 | $13,505 |
Bloomberg Commodity Index | $10,000 | $10,161 | $10,438 | $9,879 | $8,686 | $12,185 | $15,502 | $14,280 |
| | 2017 | 2018 | 2019 | 2020 | 2021 | 2022 | 2023 | 2024 |
AVERAGE ANNUAL TOTAL RETURNS: | | 1 Year | 5 Year | Life of Fund A |
| Fidelity® Commodity Strategy Fund | -5.45% | 5.71% | 3.47% |
| Bloomberg Commodity Index | -5.17% | 6.51% | 4.32% |
A From May 30, 2017
Visit www.fidelity.com for more recent performance information. |
The Fund's past performance is not a good predictor of the Fund's future performance. The graph and table do not reflect the deduction of taxes that a shareholder would pay on fund distributions or redemption of fund shares. |
Key Fund Statistics (as of July 31, 2024)
KEY FACTS | | |
| Fund Size | $43,751,003 | |
| Number of Holdings | 27 | |
| Total Advisory Fee | $202,579 | |
| Portfolio Turnover | 0% | |
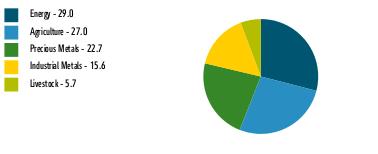
What did the Fund invest in?
(as of July 31, 2024)
| Energy | 29.0 |
| Agriculture | 27.0 |
| Precious Metals | 22.7 |
| Industrial Metals | 15.6 |
| Livestock | 5.7 |
COMMODITY SECTOR DIVERSIFICATION (% of Fund's net assets) |
|
|
DERIVATIVE EXPOSURE (% of Fund's net assets) | | |
| Futures Contracts | 100.2 | |
| |
| Futures Contracts | 50.1 |
| Short-Term Investments and Net Other Assets (Liabilities) | 49.9 |
ASSET ALLOCATION (% of Fund's total exposure) |
|
|
How has the Fund changed?
This is a summary of certain changes to the Fund since August 1, 2023. For more complete information, you may review the Fund's next prospectus, which we expect to be available by September 28, 2024 at fundresearch.fidelity.com/prospectus/sec or upon request at 1-800-544-8544 or by sending an e-mail to fidfunddocuments@fidelity.com.
The fund modified its principal investment strategies during the reporting period. | |
| Fidelity, the Fidelity Investments Logo and all other Fidelity trademarks or service marks used herein are trademarks or service marks of FMR LLC. Any third-party marks that are used herein are trademarks or service marks of their respective owners. © 2024 FMR LLC. All rights reserved. |
| | For additional information about the Fund; including its prospectus, financial information, holdings and proxy information, scan the QR code or visit fundresearch.fidelity.com/prospectus/sec 1.9913546.100 2896-TSRA-0924 |
| |
| | ANNUAL SHAREHOLDER REPORT | AS OF JULY 31, 2024 | This report describes changes to the Fund that occurred during the reporting period. |
| | Fidelity® Series Commodity Strategy Fund Fidelity® Series Commodity Strategy Fund : FCSSX |
| | | |
This annual shareholder report contains information about Fidelity® Series Commodity Strategy Fund for the period August 1, 2023 to July 31, 2024. You can find additional information about the Fund at fundresearch.fidelity.com/prospectus/sec. You can also request this information by contacting us at 1-800-544-8544.
What were your Fund costs for the last year?(based on hypothetical $10,000 investment)
FUND COST (PREVIOUS YEAR)
| | Costs of a $10,000 investment | Costs paid as a percentage of a $10,000 investment | |
| Fidelity® Series Commodity Strategy Fund | $ 0 A | 0.00%B | |
A Amount represents less than $.50
B Amount represents less than 0.005%
What affected the Fund's performance this period?
•For the 12 months ending July 31, 2024, many commodities lost value amid often-favorable supply conditions and a stronger U.S. dollar. Others benefited amid an expanding global economy and a slowing in the pace of inflation in certain markets, as well as moves by some central banks toward monetary easing. (The following returns are stated on a total-return basis.)
•For the full 12 months, the grains group (-26%) within the agriculture sector (-16%) detracted most, hampered most by corn (-29%) and soybeans (-21%). Grains faced headwinds from a rising U.S. dollar. Also within agriculture, soybean oil (-27%) experienced weakness, while so-called softs (+9%) were led by coffee (+54%).
•The energy sector (-13%) also detracted, hampered by a sharp decline in natural gas (-54%). However, West Texas Intermediate crude oil (+8%) and Brent crude oil (+7%) gained, benefiting from tighter supplies.
•In contrast, the fund benefited from precious metals (+21%) amid dovish monetary policy expectations and safe-haven demand with gold and silver gaining about 22% and 15%, respectively. Elsewhere, industrial metals returned about -2%, led by copper (+7%), while nickel (-26%) lost value.
•Livestock gained 2%, led by strength in the price of live cattle (+8%) partly counterbalanced by weakness in lean hogs (-7%).
How did the Fund perform over the past 10 years?
CUMULATIVE PERFORMANCE
July 31, 2014 through July 31, 2024.
Initial investment of $10,000.
Fidelity® Series Commodity Strategy Fund | $10,000 | $7,129 | $6,517 | $6,542 | $6,690 | $6,300 | $5,561 | $7,776 | $9,838 | $9,023 | $8,570 |
Bloomberg Commodity Index | $10,000 | $7,177 | $6,604 | $6,655 | $6,837 | $6,470 | $5,689 | $7,980 | $10,153 | $9,353 | $8,869 |
| | 2014 | 2015 | 2016 | 2017 | 2018 | 2019 | 2020 | 2021 | 2022 | 2023 | 2024 |
AVERAGE ANNUAL TOTAL RETURNS: | | 1 Year | 5 Year | 10 Year |
| Fidelity® Series Commodity Strategy Fund | -5.01% | 6.35% | -1.53% |
| Bloomberg Commodity Index | -5.17% | 6.51% | -1.19% |
Visit www.fidelity.com for more recent performance information. |
The Fund's past performance is not a good predictor of the Fund's future performance. The graph and table do not reflect the deduction of taxes that a shareholder would pay on fund distributions or redemption of fund shares. |
Key Fund Statistics (as of July 31, 2024)
KEY FACTS | | |
| Fund Size | $2,193,676,783 | |
| Number of Holdings | 57 | |
| Total Advisory Fee | $0 | |
| Portfolio Turnover | 0% | |
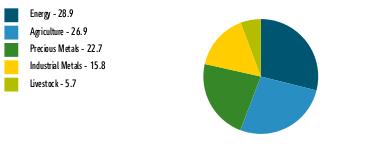
What did the Fund invest in?
(as of July 31, 2024)
| Energy | 28.9 |
| Agriculture | 26.9 |
| Precious Metals | 22.7 |
| Industrial Metals | 15.8 |
| Livestock | 5.7 |
COMMODITY SECTOR DIVERSIFICATION (% of Fund's net assets) |
|
|
DERIVATIVE EXPOSURE (% of Fund's net assets) | | |
| Futures Contracts | 15.7 | |
| Swaps | 87.3 | |
| |
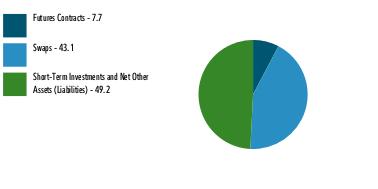
| Futures Contracts | 7.7 |
| Swaps | 43.1 |
| Short-Term Investments and Net Other Assets (Liabilities) | 49.2 |
ASSET ALLOCATION (% of Fund's total exposure) |
|
|
How has the Fund changed?
This is a summary of certain changes to the Fund since August 1, 2023. For more complete information, you may review the Fund's next prospectus, which we expect to be available by September 28, 2024 at fundresearch.fidelity.com/prospectus/sec or upon request at 1-800-544-8544 .
The fund modified its principal investment strategies during the reporting period. | |
| Fidelity, the Fidelity Investments Logo and all other Fidelity trademarks or service marks used herein are trademarks or service marks of FMR LLC. Any third-party marks that are used herein are trademarks or service marks of their respective owners. © 2024 FMR LLC. All rights reserved. |
| | For additional information about the Fund; including its prospectus, financial information, holdings and proxy information, scan the QR code or visit fundresearch.fidelity.com/prospectus/sec 1.9913515.100 2278-TSRA-0924 |
Item 2.
Code of Ethics
As of the end of the period, July 31, 2024, Fidelity Oxford Street Trust (the trust) has adopted a code of ethics, as defined in Item 2 of Form N-CSR, that applies to its President and Treasurer and its Chief Financial Officer. A copy of the code of ethics is filed as an exhibit to this Form N-CSR.
Item 3.
Audit Committee Financial Expert
The Board of Trustees of the trust has determined that Elizabeth S. Acton is an audit committee financial expert, as defined in Item 3 of Form N-CSR. Ms. Acton is independent for purposes of Item 3 of Form N-CSR.
Item 4.
Principal Accountant Fees and Services
Fees and Services
The following table presents fees billed by Deloitte & Touche LLP, the member firms of Deloitte Touche Tohmatsu, and their respective affiliates (collectively, “Deloitte Entities”) in each of the last two fiscal years for services rendered to Fidelity SAI Inflation-Focused Fund (the “Fund”):
Services Billed by Deloitte Entities
July 31, 2024 FeesA
| | | | |
| Audit Fees | Audit-Related Fees | Tax Fees | All Other Fees |
Fidelity SAI Inflation-Focused Fund | $45,700 | $- | $16,700 | $1,200 |
| | | | |
| Audit Fees | Audit-Related Fees | Tax Fees | All Other Fees |
Fidelity SAI Inflation-Focused Fund | $45,900 | $- | $11,800 | $1,200 |
A Amounts may reflect rounding
The following table presents fees billed by PricewaterhouseCoopers LLP (“PwC”) in each of the last two fiscal years for services rendered to Fidelity Commodity Strategy Fund and Fidelity Series Commodity Strategy Fund (the “Funds”):
Services Billed by PwC
July 31, 2024 FeesA
| | | | |
| Audit Fees | Audit-Related Fees | Tax Fees | All Other Fees |
Fidelity Commodity Strategy Fund | $69,800 | $6,300 | $17,100 | $2,700 |
Fidelity Series Commodity Strategy Fund | $70,700 | $6,400 | $17,600 | $2,700 |
| | | | |
| Audit Fees | Audit-Related Fees | Tax Fees | All Other Fees |
Fidelity Commodity Strategy Fund | $70,000 | $6,200 | $17,100 | $2,700 |
Fidelity Series Commodity Strategy Fund | $70,900 | $6,300 | $17,600 | $2,700 |
A Amounts may reflect rounding.
The following table(s) present(s) fees billed by Deloitte Entities and PwC that were required to be approved by the Audit Committee for services that relate directly to the operations and financial reporting of the Fund(s) and that are rendered on behalf of Geode Capital Management, LLC ("Geode") and entities controlling, controlled by, or under common control with Geode (not including any sub-adviser whose role is primarily portfolio management and is subcontracted with or overseen by another investment adviser) that provide ongoing services to the Fund(s) (“Fund Service Providers”):
Services Billed by Deloitte Entities
| | |
| July 31, 2024A | July 31, 2023A |
Audit-Related Fees | $200,000 | $80,000 |
Tax Fees | $- | $- |
All Other Fees | $1,929,500 | $- |
A Amounts may reflect rounding.
Services Billed by PwC
| | |
| July 31, 2024A | July 31, 2023A |
Audit-Related Fees | $9,437,800 | $8,699,200 |
Tax Fees | $61,000 | $1,000 |
All Other Fees | $35,000 | $- |
A Amounts may reflect rounding.
“Audit-Related Fees” represent fees billed for assurance and related services that are reasonably related to the performance of the fund audit or the review of the fund's financial statements and that are not reported under Audit Fees.
“Tax Fees” represent fees billed for tax compliance, tax advice or tax planning that relate directly to the operations and financial reporting of the fund.
“All Other Fees” represent fees billed for services provided to the fund or Fund Service Provider, a significant portion of which are assurance related, that relate directly to the operations and financial reporting of the fund, excluding those services that are reported under Audit Fees, Audit-Related Fees or Tax Fees.
Assurance services must be performed by an independent public accountant.
* * *
The aggregate non-audit fees billed by Deloitte Entities and PwC for services rendered to the Fund(s), Geode (not including any sub-adviser whose role is primarily portfolio management and is subcontracted with or overseen by another investment adviser), and any Fund Service Provider for each of the last two fiscal years of the Fund(s) are as follows:
| | |
Billed By | July 31, 2024A | July 31, 2023A |
Deloitte Entities | $4,966,400 | $3,311,000 |
PwC | $15,061,200 | $14,205,600 |
A Amounts may reflect rounding.
The trust's Audit Committee has considered non-audit services that were not pre-approved that were provided by Deloitte Entities and PwC to Fund Service Providers to be compatible with maintaining the independence of Deloitte Entities and PwC in its(their) audit of the Fund(s), taking into account representations from Deloitte Entities and PwC, in accordance with Public Company Accounting Oversight Board rules, regarding its independence from the Fund(s) and its(their) related entities and Geode’s review of the appropriateness and permissibility under applicable law of such non-audit services prior to their provision to the Fund(s) Service Providers.
Audit Committee Pre-Approval Policies and Procedures
The trust’s Audit Committee must pre-approve all audit and non-audit services provided by a fund’s independent registered public accounting firm relating to the operations or financial reporting of the fund. Prior to the commencement of any audit or non-audit services to a fund, the Audit Committee reviews the services to determine whether they are appropriate and permissible under applicable law.
The Audit Committee has adopted policies and procedures to, among other purposes, provide a framework for the Committee’s consideration of non-audit services by the audit firms that audit the Fidelity funds. The policies and procedures require that any non-audit service provided by a fund audit firm to a Fidelity fund and any non-audit service provided by a fund auditor to a Fund Service Provider that relates directly to the operations and financial reporting of a Fidelity fund (“Covered Service”) are subject to approval by the Audit Committee before such service is provided.
All Covered Services must be approved in advance of provision of the service either: (i) by formal resolution of the Audit Committee, or (ii) by oral or written approval of the service by the Chair of the Audit Committee (or if the Chair is unavailable, such other member of the Audit Committee as may be designated by the Chair to act in the Chair’s absence). The approval contemplated by (ii) above is permitted where the Treasurer determines that action on such an engagement is necessary before the next meeting of the Audit Committee.
Non-audit services provided by a fund audit firm to a Fund Service Provider that do not relate directly to the operations and financial reporting of a Fidelity fund are reported to the Audit Committee periodically.
Non-Audit Services Approved Pursuant to Rule 2-01(c)(7)(i)(C) and (ii) of Regulation S-X (“De Minimis Exception”)
There were no non-audit services approved or required to be approved by the Audit Committee pursuant to the De Minimis Exception during the Fund’s(s’) last two fiscal years relating to services provided to (i) the Fund(s) or (ii) any Fund Service Provider that relate directly to the operations and financial reporting of the Fund(s).
The Registrant has not retained, for the preparation of the audit report on the financial statements included in the Form N-CSR, a registered public accounting firm that has a branch or office that is located in a foreign jurisdiction and that the Public Company Accounting Oversight Board (the “PCAOB”) has determined that the PCAOB is unable to inspect or investigate completely because of a position taken by an authority in the foreign jurisdiction.
The Registrant is not a “foreign issuer,” as defined in 17 CFR 240.3b-4.
Item 5.
Audit Committee of Listed Registrants
Not applicable.
Item 6.
Investments
(a)
Not applicable.
(b)
Not applicable.
Item 7.
Financial Statements and Financial Highlights for Open-End Management Investment Companies
Fidelity® Commodity Strategy Fund
Annual Report
July 31, 2024
Contents
To view a fund's proxy voting guidelines and proxy voting record for the 12-month period ended June 30, visit http://www.fidelity.com/proxyvotingresults or visit the Securities and Exchange Commission's (SEC) web site at http://www.sec.gov.
You may also call 1-800-544-8544 to request a free copy of the proxy voting guidelines.
Standard & Poor's, S&P and S&P 500 are registered service marks of The McGraw-Hill Companies, Inc. and have been licensed for use by Fidelity Distributors Corporation.
Other third-party marks appearing herein are the property of their respective owners.
All other marks appearing herein are registered or unregistered trademarks or service marks of FMR LLC or an affiliated company. © 2024 FMR LLC. All rights reserved.
This report and the financial statements contained herein are submitted for the general information of the shareholders of the Fund. This report is not authorized for distribution to prospective investors in the Fund unless preceded or accompanied by an effective prospectus.
A fund files its complete schedule of portfolio holdings with the SEC for the first and third quarters of each fiscal year on Form N-PORT. Forms N-PORT are available on the SEC's web site at http://www.sec.gov. A fund's Forms N-PORT may be reviewed and copied at the SEC's Public Reference Room in Washington, DC. Information regarding the operation of the SEC's Public Reference Room may be obtained by calling 1-800-SEC-0330.
For a complete list of a fund's portfolio holdings, view the most recent holdings listing, semiannual report, or annual report on Fidelity's web site at http://www.fidelity.com, http://www.institutional.fidelity.com, or http://www.401k.com, as applicable.
NOT FDIC INSURED •MAY LOSE VALUE •NO BANK GUARANTEE
Neither the Fund nor Fidelity Distributors Corporation is a bank.
Item 7: Consolidated Financial Statements and Consolidated Financial Highlights for Open-End Management Investment Companies (Annual Report)
Fidelity® Commodity Strategy Fund
Consolidated Schedule of Investments July 31, 2024
Showing Percentage of Net Assets
| U.S. Treasury Obligations - 11.4% |
| | | Principal Amount (a) | Value ($) |
U.S. Treasury Bills, yield at date of purchase 5.24% to 5.29% 8/1/24 to 8/29/24 (b) (Cost $4,987,761) | | 5,000,000 | 4,987,692 |
| | | | |
| Money Market Funds - 95.2% |
| | | Shares | Value ($) |
Fidelity Cash Central Fund 5.39% (c) (Cost $41,640,073) | | 41,631,748 | 41,640,074 |
| | | | |
| TOTAL INVESTMENT IN SECURITIES - 106.6% (Cost $46,627,834) | 46,627,766 |
NET OTHER ASSETS (LIABILITIES) - (6.6)% | (2,876,763) |
| NET ASSETS - 100.0% | 43,751,003 |
| | |
| Futures Contracts |
| | Number of contracts | Expiration Date | Notional Amount ($) | Value ($) | Unrealized Appreciation/ (Depreciation) ($) |
| Purchased | | | | | |
| | | | | | |
| Commodity Futures Contracts | | | | | |
| CBOT Corn Contracts (United States) | 107 | Sep 2024 | 2,047,713 | (382,905) | (382,905) |
| CBOT HRW Wheat Contracts (United States) | 25 | Sep 2024 | 686,250 | (148,408) | (148,408) |
| CBOT Soybean Contracts (United States) | 42 | Nov 2024 | 2,147,250 | (271,479) | (271,479) |
| CBOT Soybean Meal Contracts (United States) | 41 | Dec 2024 | 1,294,370 | (145,659) | (145,659) |
| CBOT Soybean Oil Contracts (United States) | 51 | Dec 2024 | 1,294,992 | (55,519) | (55,519) |
| CBOT Wheat Contracts (United States) | 40 | Sep 2024 | 1,054,500 | (234,240) | (234,240) |
| CME Lean Hogs Contracts (United States) | 28 | Oct 2024 | 850,360 | 62,120 | 62,120 |
| CME Live Cattle Contracts (United States) | 22 | Oct 2024 | 1,642,740 | 25,165 | 25,165 |
| COMEX Copper Contracts (United States) | 24 | Sep 2024 | 2,512,725 | (191,363) | (191,363) |
| COMEX Gold 100 oz. Contracts (United States) | 30 | Dec 2024 | 7,488,120 | 177,006 | 177,006 |
| COMEX Silver Contracts (United States) | 17 | Sep 2024 | 2,473,695 | (65,114) | (65,114) |
| ICE Brent Crude Contracts (United Kingdom) | 42 | Sep 2024 | 3,389,910 | (117,667) | (117,667) |
| ICE Coffee 'C' Contracts (United States) | 19 | Sep 2024 | 1,633,050 | 40,449 | 40,449 |
| ICE Cotton No. 2 Contracts (United States) | 17 | Dec 2024 | 586,415 | (25,274) | (25,274) |
| ICE Low Sulphur Gasoil Contracts (United States) | 16 | Sep 2024 | 1,203,250 | 11,388 | 11,388 |
| ICE Sugar No. 11 Contracts (United States) | 51 | Sep 2024 | 1,081,853 | 1,774 | 1,774 |
| LME Aluminum Contracts (United Kingdom) | 31 | Sep 2024 | 1,751,260 | (233,684) | (233,684) |
| LME Lead Contracts (United Kingdom) | 7 | Sep 2024 | 363,032 | (18,187) | (18,187) |
| LME Nickel Contracts (United Kingdom) | 11 | Sep 2024 | 1,087,755 | (92,058) | (92,058) |
| LME Zinc Contracts (United Kingdom) | 17 | Sep 2024 | 1,126,582 | (73,640) | (73,640) |
| NYMEX Gasoline RBOB Contracts (United States) | 11 | Aug 2024 | 1,134,164 | 43,088 | 43,088 |
| NYMEX Natural Gas Contracts (United States) | 132 | Aug 2024 | 2,703,140 | (1,275,249) | (1,275,249) |
| NYMEX NY Harbor ULSD Contracts (United States) | 9 | Aug 2024 | 926,327 | 1,720 | 1,720 |
| NYMEX WTI Crude Oil Contracts (United States) | 43 | Aug 2024 | 3,371,290 | 72,760 | 72,760 |
| | | | | | |
| TOTAL FUTURES CONTRACTS | | | | | (2,894,976) |
| The notional amount of futures purchased as a percentage of Net Assets is 100.3% |
For the period, the average monthly notional amount at value for futures contracts in the aggregate was $50,197,826.
Legend
| (a) | Amount is stated in United States dollars unless otherwise noted. |
| (b) | Security or a portion of the security was pledged to cover margin requirements for futures contracts. At period end, the value of securities pledged amounted to $3,943,692. |
| (c) | Affiliated fund that is generally available only to investment companies and other accounts managed by Fidelity Investments. The rate quoted is the annualized seven-day yield of the fund at period end. A complete unaudited listing of the fund's holdings as of its most recent quarter end is available upon request. In addition, each Fidelity Central Fund's financial statements, which are not covered by the Fund's Report of Independent Registered Public Accounting Firm, are available on the SEC's website or upon request. |
Affiliated Central Funds
Fiscal year to date information regarding the Fund's investments in Fidelity Central Funds, including the ownership percentage, is presented below.
| Affiliate | Value, beginning of period ($) | Purchases ($) | Sales Proceeds ($) | Dividend Income ($) | Realized Gain (loss) ($) | Change in Unrealized appreciation (depreciation) ($) | Value, end of period ($) | % ownership, end of period |
| Fidelity Cash Central Fund 5.39% | 47,197,913 | 48,550,325 | 54,108,188 | 2,450,516 | 23 | 1 | 41,640,074 | 0.1% |
| Total | 47,197,913 | 48,550,325 | 54,108,188 | 2,450,516 | 23 | 1 | 41,640,074 | |
| | | | | | | | | |
Amounts in the dividend income column in the above table include any capital gain distributions from underlying funds, which are presented in the corresponding line item in the Consolidated Statement of Operations, if applicable.
Amounts included in the purchases and sales proceeds columns may include in-kind transactions, if applicable.
Investment Valuation
The following is a summary of the inputs used, as of July 31, 2024, involving the Fund's assets and liabilities carried at fair value. The inputs or methodology used for valuing securities may not be an indication of the risk associated with investing in those securities. For more information on valuation inputs, and their aggregation into the levels used below, please refer to the Investment Valuation section in the accompanying Notes to Consolidated Financial Statements.
| Valuation Inputs at Reporting Date: |
| Description | Total ($) | Level 1 ($) | Level 2 ($) | Level 3 ($) |
Investments in Securities: | | | | |
|
| U.S. Government and Government Agency Obligations | 4,987,692 | - | 4,987,692 | - |
|
| Money Market Funds | 41,640,074 | 41,640,074 | - | - |
| Total Investments in Securities: | 46,627,766 | 41,640,074 | 4,987,692 | - |
Derivative Instruments: Assets | | | | |
Futures Contracts | 435,470 | 435,470 | - | - |
| Total Assets | 435,470 | 435,470 | - | - |
| Liabilities | | | | |
Futures Contracts | (3,330,446) | (3,330,446) | - | - |
| Total Liabilities | (3,330,446) | (3,330,446) | - | - |
| Total Derivative Instruments: | (2,894,976) | (2,894,976) | - | - |
Value of Derivative Instruments
The following table is a summary of the Fund's value of derivative instruments by primary risk exposure as of July 31, 2024. For additional information on derivative instruments, please refer to the Derivative Instruments section in the accompanying Notes to Consolidated Financial Statements.
Primary Risk Exposure / Derivative Type | Value |
| Asset ($) | Liability ($) |
| Commodity Risk | | |
Futures Contracts (a) | 435,470 | (3,330,446) |
| Total Commodity Risk | 435,470 | (3,330,446) |
| Total Value of Derivatives | 435,470 | (3,330,446) |
(a)Reflects gross cumulative appreciation (depreciation) on futures contracts as presented in the Consolidated Schedule of Investments. In the Consolidated Statement of Assets and Liabilities, the period end daily variation margin is included in receivable or payable for daily variation margin on futures contracts, and the net cumulative appreciation (depreciation) is included in Total accumulated earnings (loss).
Consolidated Financial Statements
| Consolidated Statement of Assets and Liabilities |
As of July 31, 2024 |
| Assets | | | | |
| Investment in securities, at value - See accompanying schedule: | | | | |
Unaffiliated issuers (cost $4,987,761) | $ | 4,987,692 | | |
Fidelity Central Funds (cost $41,640,073) | | 41,640,074 | | |
| | | | | |
| | | | | |
| Total Investment in Securities (cost $46,627,834) | | | $ | 46,627,766 |
| Cash | | | | 30,661 |
| Receivable for fund shares sold | | | | 28 |
| Distributions receivable from Fidelity Central Funds | | | | 197,644 |
| Receivable for daily variation margin on futures contracts | | | | 76,022 |
| Prepaid expenses | | | | 6,250 |
Total assets | | | | 46,938,371 |
| Liabilities | | | | |
| Payable for fund shares redeemed | $ | 3,162,609 | | |
| Accrued management fee | | 15,997 | | |
| Other affiliated payables | | 7,998 | | |
| Other payables and accrued expenses | | 764 | | |
| Total liabilities | | | | 3,187,368 |
| Net Assets | | | $ | 43,751,003 |
| Net Assets consist of: | | | | |
| Paid in capital | | | $ | 43,088,350 |
| Total accumulated earnings (loss) | | | | 662,653 |
| Net Assets | | | $ | 43,751,003 |
Net Asset Value, offering price and redemption price per share ($43,751,003 ÷ 478,151 shares) | | | $ | 91.50 |
| Consolidated Statement of Operations |
| Year ended July 31, 2024 |
| Investment Income | | | | |
| Interest | | | $ | 291,753 |
| Income from Fidelity Central Funds | | | | 2,450,516 |
| Total income | | | | 2,742,269 |
| Expenses | | | | |
| Management fee | $ | 202,579 | | |
| Transfer agent fees | | 101,156 | | |
| Custodian fees and expenses | | 1,568 | | |
| Independent trustees' fees and expenses | | 153 | | |
| Subsidiary directors' fees | | 15,200 | | |
| Total expenses before reductions | | 320,656 | | |
| Expense reductions | | (243) | | |
| Total expenses after reductions | | | | 320,413 |
| Net Investment income (loss) | | | | 2,421,856 |
| Realized and Unrealized Gain (Loss) | | | | |
| Net realized gain (loss) on: | | | | |
| Investment Securities: | | | | |
| Unaffiliated issuers | | 148 | | |
| Fidelity Central Funds | | 23 | | |
| Futures contracts | | 263,100 | | |
| Total net realized gain (loss) | | | | 263,271 |
| Change in net unrealized appreciation (depreciation) on: | | | | |
| Investment Securities: | | | | |
| Unaffiliated issuers | | (69) | | |
| Fidelity Central Funds | | 1 | | |
| Futures contracts | | (5,773,315) | | |
| Total change in net unrealized appreciation (depreciation) | | | | (5,773,383) |
| Net gain (loss) | | | | (5,510,112) |
| Net increase (decrease) in net assets resulting from operations | | | $ | (3,088,256) |
| Consolidated Statement of Changes in Net Assets |
| |
| | Year ended July 31, 2024 | | Year ended July 31, 2023 |
| Increase (Decrease) in Net Assets | | | | |
| Operations | | | | |
| Net investment income (loss) | $ | 2,421,856 | $ | 2,330,079 |
| Net realized gain (loss) | | 263,271 | | (23,288,239) |
| Change in net unrealized appreciation (depreciation) | | (5,773,383) | | 12,233,929 |
| Net increase (decrease) in net assets resulting from operations | | (3,088,256) | | (8,724,231) |
| Distributions to shareholders | | (2,100,169) | | (34,748,485) |
| | | | | |
| Share transactions | | | | |
| Proceeds from sales of shares | | 14,495,788 | | 10,120,553 |
| Reinvestment of distributions | | 2,100,169 | | 34,748,487 |
| Cost of shares redeemed | | (21,530,147) | | (52,264,227) |
| | | | | |
Net increase (decrease) in net assets resulting from share transactions | | (4,934,190) | | (7,395,187) |
| Total increase (decrease) in net assets | | (10,122,615) | | (50,867,903) |
| | | | | |
| Net Assets | | | | |
| Beginning of period | | 53,873,618 | | 104,741,521 |
| End of period | $ | 43,751,003 | $ | 53,873,618 |
| | | | | |
| Other Information | | | | |
| Shares | | | | |
| Sold | | 152,402 | | 101,775 |
| Issued in reinvestment of distributions | | 21,902 | | 320,935 |
| Redeemed | | (231,848) | | (500,314) |
| Net increase (decrease) | | (57,544) | | (77,604) |
| | | | | |
Share activity has been adjusted to reflect the impact of the 1 for 16 reverse share split that occurred on November 18, 2022. See Note 1 of the Notes to Financial Statements.
Consolidated Financial Highlights
Fidelity® Commodity Strategy Fund |
| |
| Years ended July 31, | | 2024 | | 2023 A | | 2022 A | | 2021 A | | 2020 A |
Selected Per-Share Data | | | | | | | | | | |
| Net asset value, beginning of period | $ | 100.57 | $ | 170.72 | $ | 157.44 | $ | 113.44 | $ | 138.08 |
| Income from Investment Operations | | | | | | | | | | |
Net investment income (loss) B,C | | 4.52 | | 3.52 | | (.48) | | (.80) | | 1.92 |
| Net realized and unrealized gain (loss) | | (9.87) | | (14.51) | | 34.88 | | 44.80 | | (17.28) |
| Total from investment operations | | (5.35) | | (10.99) | | 34.40 | | 44.00 | | (15.36) |
| Distributions from net investment income | | (3.72) | | (59.16) | | (21.12) | | - | | (9.12) |
| Distributions from tax return of capital | | - | | - | | - | | - | | (.16) |
| Total distributions | | (3.72) | | (59.16) | | (21.12) | | - | | (9.28) |
| Net asset value, end of period | $ | 91.50 | $ | 100.57 | $ | 170.72 | $ | 157.44 | $ | 113.44 |
Total Return D | | | | (8.66)% | | 25.08% | | 38.98% | | (12.10)% |
Ratios to Average Net Assets C,E,F | | | | | | | | | | |
| Expenses before reductions | | .63% | | .62% | | .61% | | .62% | | .61% |
| Expenses net of fee waivers, if any | | | | .62% | | .61% | | .62% | | .61% |
| Expenses net of all reductions | | .63% | | .62% | | .61% | | .62% | | .61% |
| Net investment income (loss) | | 4.78% | | 3.27% | | (.31)% | | (.56)% | | 1.41% |
| Supplemental Data | | | | | | | | | | |
| Net assets, end of period (000 omitted) | $ | 43,751 | $ | 53,874 | $ | 104,742 | $ | 153,969 | $ | 22,221 |
Portfolio turnover rate G | | | | 0% | | 0% | | 0% | | 0% |
APer share amounts have been adjusted to reflect the impact of the 1 for 16 reverse share split that occurred on November 18, 2022. See Note 1 of the Notes to Financial Statements.
BCalculated based on average shares outstanding during the period.
CNet investment income (loss) is affected by the timing of the declaration of dividends by any underlying mutual funds or exchange-traded funds (ETFs). Net investment income (loss) of any mutual funds or ETFs is not included in the Fund's net investment income (loss) ratio.
DTotal returns would have been lower if certain expenses had not been reduced during the applicable periods shown.
EFees and expenses of any underlying mutual funds or exchange-traded funds (ETFs) are not included in the Fund's expense ratio. The Fund indirectly bears its proportionate share of these expenses. For additional expense information related to investments in Fidelity Central Funds, please refer to the "Investments in Fidelity Central Funds" note found in the Notes to Consolidated Financial Statements section of the most recent Annual or Semi-Annual report.
FExpense ratios reflect operating expenses of the class. Expenses before reductions do not reflect amounts reimbursed, waived, or reduced through arrangements with the investment adviser, brokerage services, or other offset arrangements, if applicable, and do not represent the amount paid by the class during periods when reimbursements, waivers or reductions occur.
GAmount does not include the portfolio activity of any underlying mutual funds or exchange-traded funds (ETFs).
Notes to Consolidated Financial Statements
For the period ended July 31, 2024
1. Organization.
Fidelity Commodity Strategy Fund (the Fund) is a fund of Fidelity Oxford Street Trust (the Trust) and is authorized to issue an unlimited number of shares. The Trust is registered under the Investment Company Act of 1940, as amended (the 1940 Act), as an open-end management investment company organized as a Massachusetts business trust.
Effective November 18, 2022, the Fund underwent a 1 for 16 reverse share split. The effect of the reverse share split transaction was to divide the number of outstanding shares of the Fund by a split factor of 1:16, with a corresponding increase in net asset value (NAV) per share. This event does not impact the overall net assets of the Fund. The per share data presented in the Consolidated Financial Highlights and Shares activity presented in the Consolidated Statement of Changes in Net Assets for prior fiscal years of the Fund have been retroactively adjusted to reflect this reverse share split.
2. Consolidated Subsidiary.
The Funds included in the table below hold certain commodity-related investments through a wholly owned subsidiary (the "Subsidiary"). As of period end, the investments in the Subsidiaries, were as follows:
| | Subsidiary Name | Net Assets of Subsidiary | % of Fund's Net Assets |
| Fidelity Commodity Strategy Fund | Geode Commodity Strategy Cayman Ltd. | 7,134,925 | 16.3 |
The financial statements have been consolidated to include the Subsidiary accounts where applicable. Accordingly, all inter-company transactions and balances have been eliminated.
3. Investments in Fidelity Central Funds.
Funds may invest in Fidelity Central Funds, which are open-end investment companies generally available only to other investment companies and accounts managed by Fidelity Management & Research Company LLC (FMR) and its affiliates. The Consolidated Schedule of Investments lists any Fidelity Central Funds held as an investment as of period end, but does not include the underlying holdings of each Fidelity Central Fund. An investing fund indirectly bears its proportionate share of the expenses of the underlying Fidelity Central Funds.
Based on its investment objective, each Fidelity Central Fund may invest or participate in various investment vehicles or strategies that are similar to those of the investing fund. These strategies are consistent with the investment objectives of the investing fund and may involve certain economic risks which may cause a decline in value of each of the Fidelity Central Funds and thus a decline in the value of the investing fund.
| Fidelity Central Fund | Investment Manager | Investment Objective | Investment Practices | Expense RatioA |
| Fidelity Money Market Central Funds | Fidelity Management & Research Company LLC (FMR) | Each fund seeks to obtain a high level of current income consistent with the preservation of capital and liquidity. | Short-term Investments | Less than .005% |
A Expenses expressed as a percentage of average net assets and are as of each underlying Central Fund's most recent annual or semi-annual shareholder report.
A complete unaudited list of holdings for each Fidelity Central Fund is available upon request or at the Securities and Exchange Commission website at www.sec.gov. In addition, the financial statements of the Fidelity Central Funds which contain the significant accounting policies (including investment valuation policies) of those funds, and are not covered by the Report of Independent Registered Public Accounting Firm, are available on the Securities and Exchange Commission website or upon request.
4. Significant Accounting Policies.
The Fund is an investment company and applies the accounting and reporting guidance of the Financial Accounting Standards Board (FASB) Accounting Standards Codification Topic 946 Financial Services - Investment Companies. The consolidated financial statements have been prepared in conformity with accounting principles generally accepted in the United States of America (GAAP), which require management to make certain estimates and assumptions at the date of the consolidated financial statements. Actual results could differ from those estimates. Subsequent events, if any, through the date that the consolidated financial statements were issued have been evaluated in the preparation of the consolidated financial statements. The Fund's Consolidated Schedule of Investments lists any underlying mutual funds or exchange-traded funds (ETFs) but does not include the underlying holdings of these funds. The following summarizes the significant accounting policies of the Fund:
Investment Valuation. Investments are valued as of 4:00 p.m. Eastern time on the last calendar day of the period. The Board of Trustees (the Board) has designated the Fund's investment adviser as the valuation designee responsible for the fair valuation function and performing fair value determinations as needed. The investment adviser has established a Fair Value Committee (the Committee) to carry out the day-to-day fair valuation responsibilities and has adopted policies and procedures to govern the fair valuation process and the activities of the Committee. In accordance with these fair valuation policies and procedures, which have been approved by the Board, the Fund attempts to obtain prices from one or more third party pricing services or brokers to value its investments. When current market prices, quotations or currency exchange rates are not readily available or reliable, investments will be fair valued in good faith by the Committee, in accordance with the policies and procedures. Factors used in determining fair value vary by investment type and may include market or investment specific events, transaction data, estimated cash flows, and market observations of comparable investments. The frequency that the fair valuation procedures are used cannot be predicted and they may be utilized to a significant extent. The Committee manages the Fund's fair valuation practices and maintains the fair valuation policies and procedures. The Fund's investment adviser reports to the Board information regarding the fair valuation process and related material matters.
The Fund categorizes the inputs to valuation techniques used to value its investments into a disclosure hierarchy consisting of three levels as shown below:
Level 1 - unadjusted quoted prices in active markets for identical investments
Level 2 - other significant observable inputs (including quoted prices for similar investments, interest rates, prepayment speeds, etc.)
Level 3 - unobservable inputs (including the Fund's own assumptions based on the best information available)
Valuation techniques used to value the Fund's investments by major category are as follows:
Debt securities, including restricted securities, are valued based on evaluated prices received from third party pricing services or from brokers who make markets in such securities. U.S. government and government agency obligations are valued by pricing services who utilize matrix pricing which considers yield or price of bonds of comparable quality, coupon, maturity and type or by broker-supplied prices. When independent prices are unavailable or unreliable, debt securities may be valued utilizing pricing methodologies which consider similar factors that would be used by third party pricing services. Debt securities are generally categorized as Level 2 in the hierarchy but may be Level 3 depending on the circumstances.
Futures contracts are valued at the settlement price or official closing price established each day by the board of trade or exchange on which they are traded and are categorized as Level 1 in the hierarchy. Investments in commodities are valued at their last traded price prior to 4:00 p.m. Eastern time each business day and are categorized as Level 1 in the hierarchy. Investments in open-end mutual funds, including the Fidelity Central Funds, are valued at their closing net asset value (NAV) each business day and are categorized as Level 1 in the hierarchy.
Changes in valuation techniques may result in transfers in or out of an assigned level within the disclosure hierarchy. The aggregate value of investments by input level as of July 31, 2024 is included at the end of the Fund's Consolidated Schedule of Investments.
Investment Transactions and Income. For financial reporting purposes, the Fund's investment holdings and NAV include trades executed through the end of the last business day of the period. The NAV per share for processing shareholder transactions is calculated as of the close of business of the New York Stock Exchange (NYSE), normally 4:00 p.m. Eastern time and includes trades executed through the end of the prior business day. Gains and losses on securities sold are determined on the basis of identified cost. Income and capital gain distributions from Fidelity Central Funds, if any, are recorded on the ex-dividend date. Interest income is accrued as earned and includes coupon interest and amortization of premium and accretion of discount on debt securities as applicable.
Expenses. Expenses directly attributable to a fund are charged to that fund. Expenses attributable to more than one fund are allocated among the respective funds on the basis of relative net assets or other appropriate methods. Expenses included in the accompanying consolidated financial statements reflect the expenses of that fund and do not include any expenses associated with any underlying mutual funds or exchange-traded funds. Although not included in a fund's expenses, a fund indirectly bears its proportionate share of these expenses through the net asset value of each underlying mutual fund or exchange-traded fund. Expense estimates are accrued in the period to which they relate and adjustments are made when actual amounts are known.
Income Tax Information and Distributions to Shareholders. Each year, the Fund intends to qualify as a regulated investment company under Subchapter M of the Internal Revenue Code, including distributing substantially all of its taxable income and realized gains. As a result, no provision for U.S. Federal income taxes is required. As of July 31, 2024, the Fund did not have any unrecognized tax benefits in the consolidated financial statements; nor is the Fund aware of any tax positions for which it is reasonably possible that the total amounts of unrecognized tax benefits will significantly change in the next twelve months. The Fund files a U.S. federal tax return, in addition to state and local tax returns as required. The Fund's federal income tax returns are subject to examination by the Internal Revenue Service (IRS) for a period of three fiscal years after they are filed. State and local tax returns may be subject to examination for an additional fiscal year depending on the jurisdiction.
The Subsidiary is classified as a controlled foreign corporation under Subchapter N of the Internal Revenue Code. Therefore, the Fund is required to increase its taxable income by its share of the Subsidiary's income. Net investment losses of the Subsidiary cannot be deducted by the Fund in the current period nor carried forward to offset taxable income in future periods.
Distributions are declared and recorded on the ex-dividend date. Income and capital gain distributions are determined in accordance with income tax regulations, which may differ from GAAP.
Capital accounts within the consolidated financial statements are adjusted for permanent book-tax differences. These adjustments have no impact on net assets or the results of operations. Capital accounts are not adjusted for temporary book-tax differences which will reverse in a subsequent period.
Book-tax differences are primarily due to controlled foreign corporations and capital loss carryforwards.
As of period end, the cost and unrealized appreciation (depreciation) in securities, and derivatives if applicable, for federal income tax purposes were as follows:
| Gross unrealized appreciation | $2,130,765 |
| Gross unrealized depreciation | (2,499,057) |
| Net unrealized appreciation (depreciation) | $(368,292) |
| Tax Cost | $46,578,490 |
The tax-based components of distributable earnings as of period end were as follows:
| Undistributed ordinary income | $1,031,007 |
| Capital loss carryforward | $(62) |
| Net unrealized appreciation (depreciation) on securities and other investments | $(368,292) |
Capital loss carryforwards are only available to offset future capital gains of the Fund to the extent provided by regulations and may be limited. The capital loss carryforward information presented below, including any applicable limitation, is estimated as of fiscal period end and is subject to adjustment.
Short-term | $(16) |
Long-term | (46) |
| Total capital loss carryforward | $(62) |
Due to large redemptions in a prior period, the Fund is subject to an annual limit on its use of some of its unrealized capital losses to offset capital gains in future periods. If those capital losses are realized and the limitation prevents the Fund from using any of those capital losses in the future period, those capital losses will be available to offset capital gains in subsequent periods.
The tax character of distributions paid was as follows:
| | July 31, 2024 | July 31, 2023 |
| Ordinary Income | $2,100,169 | $ 34,748,485 |
5. Derivative Instruments.
Risk Exposures and the Use of Derivative Instruments. The Fund's investment objectives allow for various types of derivative instruments, including futures contracts. Derivatives are investments whose value is primarily derived from underlying assets, indices or reference rates and may be transacted on an exchange or over-the-counter (OTC). Derivatives may involve a future commitment to buy or sell a specified asset based on specified terms, to exchange future cash flows at periodic intervals based on a notional principal amount, or for one party to make one or more payments upon the occurrence of specified events in exchange for periodic payments from the other party.
Derivatives were primarily used to increase returns, to gain exposure to certain types of assets and to manage exposure to certain risks as defined below. The success of any strategy involving derivatives depends on analysis of numerous economic factors, and if the strategies for investment do not work as intended, the objectives may not be achieved.
Derivatives were used to increase or decrease exposure to the following risk:
| Commodity Risk | Commodity risk is the risk that the value of a commodity will fluctuate as a result of changes in market prices. |
Funds are also exposed to additional risks from investing in derivatives, such as liquidity risk and counterparty credit risk. Liquidity risk is the risk that a fund will be unable to close out the derivative in the open market in a timely manner. Counterparty credit risk is the risk that the counterparty will not be able to fulfill its obligation to a fund. Derivative counterparty credit risk is managed through formal evaluation of the creditworthiness of all potential counterparties. Exchange-traded futures contracts are not covered by the ISDA Master Agreement; however counterparty credit risk related to exchange-traded futures contracts may be mitigated by the protection provided by the exchange's clearinghouse.
Investing in derivatives may involve greater risks than investing in the underlying assets directly and, to varying degrees, may involve risk of loss in excess of any initial investment and collateral received and amounts recognized in the Consolidated Statement of Assets and Liabilities. In addition, there may be the risk that the change in value of the derivative contract does not correspond to the change in value of the underlying instrument.
Futures Contracts. A futures contract is an agreement between two parties to buy or sell a specified underlying instrument for a fixed price at a specified future date. Futures contracts were used to manage exposure to the commodities market.
Upon entering into a futures contract, a fund is required to deposit either cash or securities (initial margin) with a clearing broker in an amount equal to a certain percentage of the face value of the contract. Futures contracts are marked-to-market daily and subsequent daily payments are made or received by a fund depending on the daily fluctuations in the value of the futures contracts and are recorded as unrealized appreciation or (depreciation). This receivable and/or payable, if any, is included in daily variation margin on futures contracts in the Consolidated Statement of Assets and Liabilities. Realized gain or (loss) is recorded upon the expiration or closing of a futures contract. The net realized gain (loss) and change in net unrealized appreciation (depreciation) on futures contracts during the period is presented in the Consolidated Statement of Operations.
Any open futures contracts at period end are presented in the Consolidated Schedule of Investments under the caption "Futures Contracts". The notional amount at value reflects each contract's exposure to the underlying instrument or index at period end. Any securities deposited to meet initial margin requirements are identified in the Consolidated Schedule of Investments. Any cash deposited to meet initial margin requirements is presented as segregated cash with brokers for derivative instruments in the Consolidated Statement of Assets and Liabilities.
6. Fees and Other Transactions with Affiliates.
Management Fee and Administration Agreement. Geode Capital Management, LLC (the investment adviser) provides the Fund with investment management services for which the Fund pays a monthly management fee that is based on an annual rate of .40% of the Fund's average net assets. Under the management contract, the investment adviser pays all other operating expenses, except the compensation of the independent Trustees, transfer agent fees and certain miscellaneous expenses such as proxy and shareholder meeting expenses.
Fidelity Management & Research Company LLC (FMR) provides administrative services to the Fund and the investment adviser pays for these services.
The investment adviser also provides investment management services to the Subsidiary. The Subsidiary does not pay the investment adviser a fee for these services. The Subsidiary pays certain other expenses including custody and directors' fees.
Transfer Agent Fees. Fidelity Investments Institutional Operations Company LLC (FIIOC), an affiliate of the investment adviser, is the Fund's transfer, dividend disbursing and shareholder servicing agent. FIIOC receives an asset-based fee of .20% of the Fund's average net assets. FIIOC pays for typesetting, printing and mailing of shareholder reports, except proxy statements.
Interfund Trades. Funds may purchase from or sell securities to other Fidelity Funds under procedures adopted by the Board. The procedures have been designed to ensure these interfund trades are executed in accordance with Rule 17a-7 of the 1940 Act. During the period, there were no interfund trades.
7. Expense Reductions.
Through arrangements with the Fund's custodian, credits realized as a result of certain uninvested cash balances were used to reduce the Fund's expenses by $243.
8. Other.
A fund's organizational documents provide former and current trustees and officers with a limited indemnification against liabilities arising in connection with the performance of their duties to the fund. In the normal course of business, a fund may also enter into contracts that provide general indemnifications. A fund's maximum exposure under these arrangements is unknown as this would be dependent on future claims that may be made against a fund. The risk of material loss from such claims is considered remote.
At the end of the period, mutual funds and accounts managed by FMR or its affiliates were the owners of record of all of the outstanding shares of the Fund.
9. Risk and Uncertainties.
Many factors affect a fund's performance. Developments that disrupt global economies and financial markets, such as pandemics, epidemics, outbreaks of infectious diseases, war, terrorism, and environmental disasters, may significantly affect a fund's investment performance. The effects of these developments to a fund will be impacted by the types of securities in which a fund invests, the financial condition, industry, economic sector, and geographic location of an issuer, and a fund's level of investment in the securities of that issuer. Significant concentrations in security types, issuers, industries, sectors, and geographic locations may magnify the factors that affect a fund's performance.
Report of Independent Registered Public Accounting Firm
To the Board of Trustees of Fidelity Oxford Street Trust and Shareholders of Fidelity Commodity Strategy Fund
Opinion on the Financial Statements
We have audited the accompanying consolidated statement of assets and liabilities, including the consolidated schedule of investments, of Fidelity Commodity Strategy Fund and its subsidiary (one of the funds constituting Fidelity Oxford Street Trust, referred to hereafter as the "Fund") as of July 31, 2024, the related consolidated statement of operations for the year ended July 31, 2024, the consolidated statement of changes in net assets for each of the two years in the period ended July 31, 2024, including the related notes, and the consolidated financial highlights for each of the five years in the period ended July 31, 2024 (collectively referred to as the "consolidated financial statements"). In our opinion, the consolidated financial statements present fairly, in all material respects, the financial position of the Fund as of July 31, 2024, the results of its operations for the year then ended, the changes in its net assets for each of the two years in the period ended July 31, 2024 and the financial highlights for each of the five years in the period ended July 31, 2024 in conformity with accounting principles generally accepted in the United States of America.
Basis for Opinion
These consolidated financial statements are the responsibility of the Fund's management. Our responsibility is to express an opinion on the Fund's consolidated financial statements based on our audits. We are a public accounting firm registered with the Public Company Accounting Oversight Board (United States) (PCAOB) and are required to be independent with respect to the Fund in accordance with the U.S. federal securities laws and the applicable rules and regulations of the Securities and Exchange Commission and the PCAOB.
We conducted our audits of these consolidated financial statements in accordance with the standards of the PCAOB. Those standards require that we plan and perform the audit to obtain reasonable assurance about whether the consolidated financial statements are free of material misstatement, whether due to error or fraud.
Our audits included performing procedures to assess the risks of material misstatement of the consolidated financial statements, whether due to error or fraud, and performing procedures that respond to those risks. Such procedures included examining, on a test basis, evidence regarding the amounts and disclosures in the consolidated financial statements. Our audits also included evaluating the accounting principles used and significant estimates made by management, as well as evaluating the overall presentation of the consolidated financial statements. Our procedures included confirmation of securities owned as of July 31, 2024 by correspondence with the custodian and brokers. We believe that our audits provide a reasonable basis for our opinion.
/s/ PricewaterhouseCoopers LLP
Boston, Massachusetts
September 12, 2024
We have served as the auditor of one or more investment companies in the Fidelity group of funds since 1932.
Distributions
(Unaudited)
The dividend and capital gains distributions for the fund(s) are available on Fidelity.com or Institutional.Fidelity.com.
A total of 19.81% of the dividends distributed during the fiscal year was derived from interest on U.S. Government securities which is generally exempt from state income tax.
The fund designates $1,703,939 of distributions paid in the calendar year 2023 as qualifying to be taxed as interest-related dividends for nonresident alien shareholders.
The fund designates $2,065,909 of distributions paid during the fiscal year ended 2024 as qualifying to be taxed as section 163(j) interest dividends.
The fund will notify shareholders in January 2025 of amounts for use in preparing 2024 income tax returns.
Item 8: Changes in and Disagreements with Accountants for Open-End Management Investment Companies
Note: This is not applicable for any fund included in this document.
Item 9: Proxy Disclosures for Open-End Management Investment Companies
| A special meeting of shareholders was held on October 18, 2023. The results of votes taken among shareholders on the proposal before them are reported below. Each vote reported represents one dollar of net asset value held on the record date for the meeting. |
| Proposal 1 |
| To elect a Board of Trustees. |
| | # of Votes | % of Votes |
| Abigail P. Johnson |
| Affirmative | 4,544,611,126.80 | 98.03 |
| Withheld | 91,192,086.11 | 1.97 |
| TOTAL | 4,635,803,212.91 | 100.00 |
| Jennifer Toolin McAuliffe |
| Affirmative | 4,535,410,229.89 | 97.83 |
| Withheld | 100,392,983.02 | 2.17 |
| TOTAL | 4,635,803,212.91 | 100.00 |
| Christine J. Thompson |
| Affirmative | 4,544,351,180.03 | 98.03 |
| Withheld | 91,452,032.88 | 1.97 |
| TOTAL | 4,635,803,212.91 | 100.00 |
| Elizabeth S. Acton |
| Affirmative | 4,535,006,791.00 | 97.83 |
| Withheld | 100,796,421.91 | 2.17 |
| TOTAL | 4,635,803,212.91 | 100.00 |
| Laura M. Bishop |
| Affirmative | 4,543,484,037.23 | 98.01 |
| Withheld | 92,319,175.68 | 1.99 |
| TOTAL | 4,635,803,212.91 | 100.00 |
| Ann E. Dunwoody |
| Affirmative | 4,541,959,864.61 | 97.98 |
| Withheld | 93,843,348.30 | 2.02 |
| TOTAL | 4,635,803,212.91 | 100.00 |
| John Engler |
| Affirmative | 4,523,457,866.32 | 97.58 |
| Withheld | 112,345,346.59 | 2.42 |
| TOTAL | 4,635,803,212.91 | 100.00 |
| Robert F. Gartland |
| Affirmative | 4,533,525,068.87 | 97.79 |
| Withheld | 102,278,144.04 | 2.21 |
| TOTAL | 4,635,803,212.91 | 100.00 |
| Robert W. Helm |
| Affirmative | 4,539,288,934.76 | 97.92 |
| Withheld | 96,514,278.15 | 2.08 |
| TOTAL | 4,635,803,212.91 | 100.00 |
| Arthur E. Johnson |
| Affirmative | 4,526,773,659.17 | 97.65 |
| Withheld | 109,029,553.74 | 2.35 |
| TOTAL | 4,635,803,212.91 | 100.00 |
| Michael E. Kenneally |
| Affirmative | 4,535,412,506.96 | 97.83 |
| Withheld | 100,390,705.95 | 2.17 |
| TOTAL | 4,635,803,212.91 | 100.00 |
| Mark A. Murray |
| Affirmative | 4,533,792,953.42 | 97.80 |
| Withheld | 102,010,259.49 | 2.20 |
| TOTAL | 4,635,803,212.91 | 100.00 |
| Carol J. Zierhoffer |
| Affirmative | 4,540,811,737.27 | 97.95 |
| Withheld | 94,991,475.64 | 2.05 |
| TOTAL | 4,635,803,212.91 | 100.00 |
| | | |
| Proposal 1 reflects trust-wide proposal and voting results. |
Item 10: Remuneration Paid to Directors, Officers, and others of Open-End Management Investment Companies
Note: This information is disclosed as part of the consolidated financial statements for each Fund as part of Item 7: Consolidated Financial Statements and Consolidated Financial Highlights for Open-End Management Investment companies.
Item 11: Statement Regarding Basis for Approval of Investment Advisory Contract
Note: This is not applicable for any fund included in this document.
1.9879552.107
CSZ-ANN-0924
Fidelity® SAI Inflation-Focused Fund
Annual Report
July 31, 2024
Offered exclusively to certain clients of Strategic Advisers LLC or its affiliates - not available for sale to the general public. Fidelity SAI is a product name of Fidelity® funds dedicated to certain programs affiliated with Strategic Advisers LLC, an affiliate of Fidelity Management & Research Company LLC.
Contents
To view a fund's proxy voting guidelines and proxy voting record for the 12-month period ended June 30, visit http://www.fidelity.com/proxyvotingresults or visit the Securities and Exchange Commission's (SEC) web site at http://www.sec.gov.
You may also call 1-800-544-3455 to request a free copy of the proxy voting guidelines.
Standard & Poor's, S&P and S&P 500 are registered service marks of The McGraw-Hill Companies, Inc. and have been licensed for use by Fidelity Distributors Corporation.
Other third-party marks appearing herein are the property of their respective owners.
All other marks appearing herein are registered or unregistered trademarks or service marks of FMR LLC or an affiliated company. © 2024 FMR LLC. All rights reserved.
This report and the financial statements contained herein are submitted for the general information of the shareholders of the Fund. This report is not authorized for distribution to prospective investors in the Fund unless preceded or accompanied by an effective prospectus.
A fund files its complete schedule of portfolio holdings with the SEC for the first and third quarters of each fiscal year on Form N-PORT. Forms N-PORT are available on the SEC's web site at http://www.sec.gov. A fund's Forms N-PORT may be reviewed and copied at the SEC's Public Reference Room in Washington, DC. Information regarding the operation of the SEC's Public Reference Room may be obtained by calling 1-800-SEC-0330.
For a complete list of a fund's portfolio holdings, view the most recent holdings listing, semiannual report, or annual report on Fidelity's web site at http://www.fidelity.com, http://www.institutional.fidelity.com, or http://www.401k.com, as applicable.
NOT FDIC INSURED •MAY LOSE VALUE •NO BANK GUARANTEE
Neither the Fund nor Fidelity Distributors Corporation is a bank.
Item 7: Consolidated Financial Statements and Consolidated Financial Highlights for Open-End Management Investment Companies (Annual Report)
Fidelity® SAI Inflation-Focused Fund
Consolidated Schedule of Investments July 31, 2024
Showing Percentage of Net Assets
| U.S. Treasury Obligations - 10.0% |
| | | Principal Amount (a) | Value ($) |
U.S. Treasury Bills, yield at date of purchase 5.24% to 5.31% 8/1/24 to 10/17/24 (b) (Cost $428,553,235) | | 430,000,000 | 428,553,740 |
| | | | |
| Money Market Funds - 87.9% |
| | | Shares | Value ($) |
Fidelity Cash Central Fund 5.39% (c) (Cost $3,754,296,007) | | 3,753,545,298 | 3,754,296,007 |
| | | | |
| TOTAL INVESTMENT IN SECURITIES - 97.9% (Cost $4,182,849,242) | 4,182,849,747 |
NET OTHER ASSETS (LIABILITIES) - 2.1% | 90,949,632 |
| NET ASSETS - 100.0% | 4,273,799,379 |
| | |
| Futures Contracts |
| | Number of contracts | Expiration Date | Notional Amount ($) | Value ($) | Unrealized Appreciation/ (Depreciation) ($) |
| Purchased | | | | | |
| | | | | | |
| Commodity Futures Contracts | | | | | |
| CBOT Corn Contracts (United States) | 2,301 | Dec 2024 | 45,991,238 | (731,198) | (731,198) |
| CBOT Corn Contracts (United States) | 408 | Mar 2025 | 8,481,300 | (114,709) | (114,709) |
| CBOT Corn Contracts (United States) | 2,017 | Jul 2025 | 43,844,538 | (5,765,725) | (5,765,725) |
| CBOT KC HRW Wheat Contracts (United States) | 796 | Dec 2024 | 22,516,850 | (179,556) | (179,556) |
| CBOT KC HRW Wheat Contracts (United States) | 260 | Mar 2025 | 7,546,500 | (297,461) | (297,461) |
| CBOT Soybean Contracts (United States) | 3,183 | Nov 2024 | 162,730,875 | (27,742,215) | (27,742,215) |
| CBOT Soybean Meal Contracts (United States) | 2,215 | Dec 2024 | 69,927,550 | (9,324,476) | (9,324,476) |
| CBOT Soybean Meal Contracts (United States) | 1,411 | Mar 2025 | 44,855,690 | (4,339,695) | (4,339,695) |
| CBOT Soybean Oil Contracts (United States) | 4,465 | Dec 2024 | 113,375,280 | (8,555,677) | (8,555,677) |
| CBOT Wheat Contracts (United States) | 113 | Mar 2025 | 3,238,863 | (177,376) | (177,376) |
| CBOT Wheat Contracts (United States) | 1,532 | Dec 2024 | 42,283,200 | (160,104) | (160,104) |
| CME Lean Hogs Contracts (United States) | 2,484 | Oct 2024 | 75,439,080 | 1,993,100 | 1,993,100 |
| CME Lean Hogs Contracts (United States) | 692 | Apr 2025 | 21,493,520 | 653,233 | 653,233 |
| CME Live Cattle Contracts (United States) | 1,259 | Oct 2024 | 94,009,530 | 1,444,724 | 1,444,724 |
| CME Live Cattle Contracts (United States) | 102 | Apr 2025 | 7,732,824 | 9,717 | 9,717 |
| COMEX Copper Contracts (United States) | 989 | Dec 2024 | 104,474,438 | 2,003,765 | 2,003,765 |
| COMEX Copper Contracts (United States) | 500 | Mar 2025 | 53,286,600 | (4,025,021) | (4,025,021) |
| COMEX Gold 100 oz. Contracts (United States) | 1,848 | Dec 2024 | 460,980,480 | 10,266,341 | 10,266,341 |
| COMEX Silver Contracts (United States) | 1,034 | Sep 2024 | 150,365,775 | (3,539,644) | (3,539,644) |
| ICE Brent Crude Contracts (United Kingdom) | 9,440 | Sep 2024 | 761,610,200 | (25,654,190) | (25,654,190) |
| ICE Coffee 'C' Contracts (United States) | 1,554 | Dec 2024 | 132,954,413 | (1,066,280) | (1,066,280) |
| ICE Cotton No. 2 Contracts (United States) | 709 | Dec 2024 | 24,456,955 | (1,429,837) | (1,429,837) |
| ICE Low Sulphur Gasoil Contracts (United States) | 238 | Sep 2024 | 17,885,700 | 243,909 | 243,909 |
| ICE Low Sulphur Gasoil Contracts (United States) | 1,206 | Nov 2024 | 90,094,500 | 747,022 | 747,022 |
| ICE Low Sulphur Gasoil Contracts (United States) | 1,943 | Jan 2025 | 144,524,250 | 260,917 | 260,917 |
| ICE Sugar No. 11 Contracts (United States) | 1,841 | Sep 2024 | 39,052,765 | 1,428,056 | 1,428,056 |
| ICE Sugar No. 11 Contracts (United States) | 1,310 | Feb 2025 | 28,331,632 | 74,718 | 74,718 |
| LME Aluminum Contracts (United Kingdom) | 694 | Nov 2024 | 39,853,818 | 340,943 | 340,943 |
| LME Aluminum Contracts (United Kingdom) | 641 | Jan 2025 | 37,278,958 | (4,579,512) | (4,579,512) |
| LME Lead Contracts (United Kingdom) | 295 | Nov 2024 | 15,444,873 | 202,707 | 202,707 |
| LME Lead Contracts (United Kingdom) | 148 | Jan 2025 | 7,820,764 | (360,690) | (360,690) |
| LME Nickel Contracts (United Kingdom) | 467 | Nov 2024 | 46,688,101 | 2,027,141 | 2,027,141 |
| LME Nickel Contracts (United Kingdom) | 233 | Jan 2025 | 23,528,228 | (1,923,046) | (1,923,046) |
| LME Zinc Contracts (United Kingdom) | 354 | Nov 2024 | 23,775,702 | 67,753 | 67,753 |
| LME Zinc Contracts (United Kingdom) | 345 | Jan 2025 | 23,303,888 | (1,297,391) | (1,297,391) |
| NYMEX Gasoline RBOB Contracts (United States) | 76 | Aug 2024 | 7,908,953 | 430,081 | 430,081 |
| NYMEX Gasoline RBOB Contracts (United States) | 2,563 | Oct 2024 | 236,326,028 | 5,725,880 | 5,725,880 |
| NYMEX Natural Gas Contracts (United States) | 5,539 | Aug 2024 | 113,377,170 | (44,337,523) | (44,337,523) |
| NYMEX Natural Gas Contracts (United States) | 1,395 | Oct 2024 | 36,812,570 | (462,444) | (462,444) |
| NYMEX Natural Gas Contracts (United States) | 23 | Dec 2024 | 801,320 | (69) | (69) |
| NYMEX NY Harbor ULSD Contracts (United States) | 74 | Aug 2024 | 7,616,465 | (21,373) | (21,373) |
| NYMEX NY Harbor ULSD Contracts (United States) | 1,216 | Feb 2025 | 125,315,366 | (311,549) | (311,549) |
| NYMEX NY Harbor USLD Contracts (United States) | 206 | Oct 2024 | 21,377,362 | 114,092 | 114,092 |
| NYMEX WTI Crude Oil Contracts (United States) | 6,354 | Aug 2024 | 497,953,780 | 21,023,320 | 21,023,320 |
| NYMEX WTI Crude Oil Contracts (United States) | 3,076 | Oct 2024 | 235,190,960 | 2,200,945 | 2,200,945 |
| | | | | | |
| TOTAL FUTURES CONTRACTS | | | | | (95,138,397) |
| The notional amount of futures purchased as a percentage of Net Assets is 100.1% |
For the period, the average monthly notional amount at value for futures contracts in the aggregate was $3,587,647,432.
Legend
| (a) | Amount is stated in United States dollars unless otherwise noted. |
| (b) | Security or a portion of the security was pledged to cover margin requirements for futures contracts. At period end, the value of securities pledged amounted to $400,167,740. |
| (c) | Affiliated fund that is generally available only to investment companies and other accounts managed by Fidelity Investments. The rate quoted is the annualized seven-day yield of the fund at period end. A complete unaudited listing of the fund's holdings as of its most recent quarter end is available upon request. In addition, each Fidelity Central Fund's financial statements, which are not covered by the Fund's Report of Independent Registered Public Accounting Firm, are available on the SEC's website or upon request. |
Affiliated Central Funds
Fiscal year to date information regarding the Fund's investments in Fidelity Central Funds, including the ownership percentage, is presented below.
| Affiliate | Value, beginning of period ($) | Purchases ($) | Sales Proceeds ($) | Dividend Income ($) | Realized Gain (loss) ($) | Change in Unrealized appreciation (depreciation) ($) | Value, end of period ($) | % ownership, end of period |
| Fidelity Cash Central Fund 5.39% | 467,515,911 | 7,344,077,985 | 4,057,305,098 | 149,613,713 | 7,209 | - | 3,754,296,007 | 7.4% |
| Total | 467,515,911 | 7,344,077,985 | 4,057,305,098 | 149,613,713 | 7,209 | - | 3,754,296,007 | |
| | | | | | | | | |
Amounts in the dividend income column in the above table include any capital gain distributions from underlying funds, which are presented in the corresponding line item in the Consolidated Statement of Operations, if applicable.
Amounts included in the purchases and sales proceeds columns may include in-kind transactions, if applicable.
Investment Valuation
The following is a summary of the inputs used, as of July 31, 2024, involving the Fund's assets and liabilities carried at fair value. The inputs or methodology used for valuing securities may not be an indication of the risk associated with investing in those securities. For more information on valuation inputs, and their aggregation into the levels used below, please refer to the Investment Valuation section in the accompanying Notes to Consolidated Financial Statements.
| Valuation Inputs at Reporting Date: |
| Description | Total ($) | Level 1 ($) | Level 2 ($) | Level 3 ($) |
Investments in Securities: | | | | |
|
| U.S. Government and Government Agency Obligations | 428,553,740 | - | 428,553,740 | - |
|
| Money Market Funds | 3,754,296,007 | 3,754,296,007 | - | - |
| Total Investments in Securities: | 4,182,849,747 | 3,754,296,007 | 428,553,740 | - |
Derivative Instruments: Assets | | | | |
Futures Contracts | 51,258,364 | 51,258,364 | - | - |
| Total Assets | 51,258,364 | 51,258,364 | - | - |
| Liabilities | | | | |
Futures Contracts | (146,396,761) | (146,396,761) | - | - |
| Total Liabilities | (146,396,761) | (146,396,761) | - | - |
| Total Derivative Instruments: | (95,138,397) | (95,138,397) | - | - |
Value of Derivative Instruments
The following table is a summary of the Fund's value of derivative instruments by primary risk exposure as of July 31, 2024. For additional information on derivative instruments, please refer to the Derivative Instruments section in the accompanying Notes to Consolidated Financial Statements.
Primary Risk Exposure / Derivative Type | Value |
| Asset ($) | Liability ($) |
| Commodity Risk | | |
Futures Contracts (a) | 51,258,364 | (146,396,761) |
| Total Commodity Risk | 51,258,364 | (146,396,761) |
| Total Value of Derivatives | 51,258,364 | (146,396,761) |
(a)Reflects gross cumulative appreciation (depreciation) on futures contracts as presented in the Consolidated Schedule of Investments. In the Consolidated Statement of Assets and Liabilities, the period end daily variation margin is included in receivable or payable for daily variation margin on futures contracts, and the net cumulative appreciation (depreciation) is included in Total accumulated earnings (loss).
Consolidated Financial Statements
| Consolidated Statement of Assets and Liabilities |
As of July 31, 2024 |
| Assets | | | | |
| Investment in securities, at value - See accompanying schedule: | | | | |
Unaffiliated issuers (cost $428,553,235) | $ | 428,553,740 | | |
Fidelity Central Funds (cost $3,754,296,007) | | 3,754,296,007 | | |
| | | | | |
| | | | | |
| Total Investment in Securities (cost $4,182,849,242) | | | $ | 4,182,849,747 |
| Receivable for fund shares sold | | | | 5,337,337 |
| Distributions receivable from Fidelity Central Funds | | | | 17,898,709 |
| Receivable for daily variation margin on futures contracts | | | | 71,537,726 |
| Prepaid expenses | | | | 1,064 |
Total assets | | | | 4,277,624,583 |
| Liabilities | | | | |
| Payable for fund shares redeemed | $ | 2,410,168 | | |
| Accrued management fee | | 1,365,742 | | |
| Other payables and accrued expenses | | 49,294 | | |
| Total liabilities | | | | 3,825,204 |
| Net Assets | | | $ | 4,273,799,379 |
| Net Assets consist of: | | | | |
| Paid in capital | | | $ | 4,400,796,761 |
| Total accumulated earnings (loss) | | | | (126,997,382) |
| Net Assets | | | $ | 4,273,799,379 |
Net Asset Value, offering price and redemption price per share ($4,273,799,379 ÷ 48,018,121 shares) | | | $ | 89.00 |
Shares outstanding have been adjusted to reflect the impact of the reverse share split. See Organization note.
| Consolidated Statement of Operations |
| Year ended July 31, 2024 |
| Investment Income | | | | |
| Interest | | | $ | 33,381,002 |
| Income from Fidelity Central Funds | | | | 149,613,713 |
| Total income | | | | 182,994,715 |
| Expenses | | | | |
| Management fee | $ | 13,403,812 | | |
| Custodian fees and expenses | | 1,038 | | |
| Independent trustees' fees and expenses | | 9,882 | | |
| Registration fees | | 116,387 | | |
| Audit fees | | 71,341 | | |
| Subsidiary directors' fees | | 15,200 | | |
| Legal | | 5,292 | | |
| Miscellaneous | | 63,511 | | |
| Total expenses before reductions | | 13,686,463 | | |
| Expense reductions | | (1,015) | | |
| Total expenses after reductions | | | | 13,685,448 |
| Net Investment income (loss) | | | | 169,309,267 |
| Realized and Unrealized Gain (Loss) | | | | |
| Net realized gain (loss) on: | | | | |
| Investment Securities: | | | | |
| Unaffiliated issuers | | (130,492,455) | | |
| Fidelity Central Funds | | 7,209 | | |
| Futures contracts | | 20,147,706 | | |
| Total net realized gain (loss) | | | | (110,337,540) |
| Change in net unrealized appreciation (depreciation) on: | | | | |
| Investment Securities: | | | | |
| Unaffiliated issuers | | 103,909,691 | | |
| Futures contracts | | (208,199,816) | | |
| Total change in net unrealized appreciation (depreciation) | | | | (104,290,125) |
| Net gain (loss) | | | | (214,627,665) |
| Net increase (decrease) in net assets resulting from operations | | | $ | (45,318,398) |
| Consolidated Statement of Changes in Net Assets |
| |
| | Year ended July 31, 2024 | | Year ended July 31, 2023 |
| Increase (Decrease) in Net Assets | | | | |
| Operations | | | | |
| Net investment income (loss) | $ | 169,309,267 | $ | 94,114,531 |
| Net realized gain (loss) | | (110,337,540) | | (717,918,620) |
| Change in net unrealized appreciation (depreciation) | | (104,290,125) | | 141,249,000 |
| Net increase (decrease) in net assets resulting from operations | | (45,318,398) | | (482,555,089) |
| Distributions to shareholders | | (62,922,322) | | (367,599,443) |
| | | | | |
| Share transactions | | | | |
| Proceeds from sales of shares | | 2,673,861,966 | | 1,827,721,666 |
| Reinvestment of distributions | | 54,807,789 | | 340,697,420 |
| Cost of shares redeemed | | (1,200,949,856) | | (2,374,358,613) |
| | | | | |
Net increase (decrease) in net assets resulting from share transactions | | 1,527,719,899 | | (205,939,527) |
| Total increase (decrease) in net assets | | 1,419,479,179 | | (1,056,094,059) |
| | | | | |
| Net Assets | | | | |
| Beginning of period | | 2,854,320,200 | | 3,910,414,259 |
| End of period | $ | 4,273,799,379 | $ | 2,854,320,200 |
| | | | | |
| Other Information | | | | |
| Shares | | | | |
| Sold | | 30,494,029 | | 18,991,925 |
| Issued in reinvestment of distributions | | 617,401 | | 3,230,634 |
| Redeemed | | (13,183,050) | | (23,870,391) |
| Net increase (decrease) | | 17,928,380 | | (1,647,832) |
| | | | | |
Share activity amounts in the Other Information section have been adjusted to reflect the impact of the reverse share split. See Organization note.
Consolidated Financial Highlights
Fidelity® SAI Inflation-Focused Fund |
| |
| Years ended July 31, | | 2024 | | 2023 A | | 2022 A | | 2021 A | | 2020 A |
Selected Per-Share Data | | | | | | | | | | |
| Net asset value, beginning of period | $ | 94.90 | $ | 123.20 | $ | 132.10 | $ | 93.10 | $ | 103.40 |
| Income from Investment Operations | | | | | | | | | | |
Net investment income (loss) B,C | | 4.32 | | 3.20 | | 8.90 | | 5.00 | | 1.20 |
| Net realized and unrealized gain (loss) | | (8.17) | | (19.10) | | 18.10 | | 37.20 | | (9.30) |
| Total from investment operations | | (3.85) | | (15.90) | | 27.00 | | 42.20 | | (8.10) |
| Distributions from net investment income | | (2.05) | | (12.20) | | (35.40) | | (3.20) | | (2.00) |
| Distributions from net realized gain | | - | | (.10) | | (.50) | | - | | (.20) |
| Total distributions | | (2.05) | | (12.40) D | | (35.90) | | (3.20) | | (2.20) |
| Net asset value, end of period | $ | 89.00 | $ | 94.90 | $ | 123.20 | $ | 132.10 | $ | 93.10 |
Total Return E | | | | (13.81)% | | 27.48% | | 46.61% | | (8.05)% |
Ratios to Average Net Assets C,F,G | | | | | | | | | | |
| Expenses before reductions | | .39% | | .39% | | .40% | | .40% | | .41% |
| Expenses net of fee waivers, if any | | | | .39% | | .40% | | .40% | | .41% |
| Expenses net of all reductions | | .39% | | .39% | | .40% | | .40% | | .41% |
| Net investment income (loss) | | 4.80% | | 3.29% | | 7.18% | | 4.15% | | 1.18% |
| Supplemental Data | | | | | | | | | | |
| Net assets, end of period (000 omitted) | $ | 4,273,799 | $ | 2,854,320 | $ | 3,910,414 | $ | 1,768,220 | $ | 32,230 |
Portfolio turnover rate H | | | | 61% | | 135% | | 101% | | 40% |
APer share amounts have been adjusted to reflect the impact of the 1 for 10 reverse share split that occurred on September 22, 2023.
BCalculated based on average shares outstanding during the period.
CNet investment income (loss) is affected by the timing of the declaration of dividends by any underlying mutual funds or exchange-traded funds (ETFs). Net investment income (loss) of any mutual funds or ETFs is not included in the Fund's net investment income (loss) ratio.
DTotal distributions per share do not sum due to rounding.
ETotal returns would have been lower if certain expenses had not been reduced during the applicable periods shown.
FFees and expenses of any underlying mutual funds or exchange-traded funds (ETFs) are not included in the Fund's expense ratio. The Fund indirectly bears its proportionate share of these expenses. For additional expense information related to investments in Fidelity Central Funds, please refer to the "Investments in Fidelity Central Funds" note found in the Notes to Consolidated Financial Statements section of the most recent Annual or Semi-Annual report.
GExpense ratios reflect operating expenses of the class. Expenses before reductions do not reflect amounts reimbursed, waived, or reduced through arrangements with the investment adviser, brokerage services, or other offset arrangements, if applicable, and do not represent the amount paid by the class during periods when reimbursements, waivers or reductions occur.
HAmount does not include the portfolio activity of any underlying mutual funds or exchange-traded funds (ETFs).
Notes to Consolidated Financial Statements
For the period ended July 31, 2024
1. Organization.
Fidelity SAI Inflation-Focused Fund (the Fund) is a fund of Fidelity Oxford Street Trust (the Trust) and is authorized to issue an unlimited number of shares. Shares are offered exclusively to certain clients of Strategic Advisers LLC or its affiliates. The Trust is registered under the Investment Company Act of 1940, as amended (the 1940 Act), as an open-end management investment company organized as a Delaware statutory trust.
Effective September 22, 2023, the Fund underwent a 1 for 10 reverse share split. The effect of the reverse share split transaction was to divide the number of outstanding shares of the Fund by a split factor of 1:10, with a corresponding increase in net asset value (NAV) per share. This event does not impact the overall net assets of the Fund. The per share data presented in the Consolidated Financial Highlights and Shares activity presented in the Consolidated Statement of Changes in Net Assets for the Fund have been retroactively adjusted to reflect this reverse share split.
2. Consolidated Subsidiary.
The Funds included in the table below hold certain commodity-related investments through a wholly owned subsidiary (the "Subsidiary"). As of period end, the investments in the Subsidiaries, were as follows:
| | Subsidiary Name | Net Assets of Subsidiary | % of Fund's Net Assets |
| Fidelity SAI Inflation-Focused Fund | Geode SAI Inflation-Focused Cayman Ltd. | 593,549,432 | 13.9 |
The financial statements have been consolidated to include the Subsidiary accounts where applicable. Accordingly, all inter-company transactions and balances have been eliminated.
3. Investments in Fidelity Central Funds.
Funds may invest in Fidelity Central Funds, which are open-end investment companies generally available only to other investment companies and accounts managed by Fidelity Management & Research Company LLC (FMR) and its affiliates. The Consolidated Schedule of Investments lists any Fidelity Central Funds held as an investment as of period end, but does not include the underlying holdings of each Fidelity Central Fund. An investing fund indirectly bears its proportionate share of the expenses of the underlying Fidelity Central Funds.
Based on its investment objective, each Fidelity Central Fund may invest or participate in various investment vehicles or strategies that are similar to those of the investing fund. These strategies are consistent with the investment objectives of the investing fund and may involve certain economic risks which may cause a decline in value of each of the Fidelity Central Funds and thus a decline in the value of the investing fund.
| Fidelity Central Fund | Investment Manager | Investment Objective | Investment Practices | Expense RatioA |
| Fidelity Money Market Central Funds | Fidelity Management & Research Company LLC (FMR) | Each fund seeks to obtain a high level of current income consistent with the preservation of capital and liquidity. | Short-term Investments | Less than .005% |
A Expenses expressed as a percentage of average net assets and are as of each underlying Central Fund's most recent annual or semi-annual shareholder report.
A complete unaudited list of holdings for each Fidelity Central Fund is available upon request or at the Securities and Exchange Commission website at www.sec.gov. In addition, the financial statements of the Fidelity Central Funds which contain the significant accounting policies (including investment valuation policies) of those funds, and are not covered by the Report of Independent Registered Public Accounting Firm, are available on the Securities and Exchange Commission website or upon request.
4. Significant Accounting Policies.
The Fund is an investment company and applies the accounting and reporting guidance of the Financial Accounting Standards Board (FASB) Accounting Standards Codification Topic 946 Financial Services - Investment Companies. The consolidated financial statements have been prepared in conformity with accounting principles generally accepted in the United States of America (GAAP), which require management to make certain estimates and assumptions at the date of the consolidated financial statements. Actual results could differ from those estimates. Subsequent events, if any, through the date that the consolidated financial statements were issued have been evaluated in the preparation of the consolidated financial statements. The Fund's Consolidated Schedule of Investments lists any underlying mutual funds or exchange-traded funds (ETFs) but does not include the underlying holdings of these funds. The following summarizes the significant accounting policies of the Fund:
Investment Valuation. Investments are valued as of 4:00 p.m. Eastern time on the last calendar day of the period. The Board of Trustees (the Board) has designated the Fund's investment adviser as the valuation designee responsible for the fair valuation function and performing fair value determinations as needed. The investment adviser has established a Fair Value Committee (the Committee) to carry out the day-to-day fair valuation responsibilities and has adopted policies and procedures to govern the fair valuation process and the activities of the Committee. In accordance with these fair valuation policies and procedures, which have been approved by the Board, the Fund attempts to obtain prices from one or more third party pricing services or brokers to value its investments. When current market prices, quotations or currency exchange rates are not readily available or reliable, investments will be fair valued in good faith by the Committee, in accordance with the policies and procedures. Factors used in determining fair value vary by investment type and may include market or investment specific events, transaction data, estimated cash flows, and market observations of comparable investments. The frequency that the fair valuation procedures are used cannot be predicted and they may be utilized to a significant extent. The Committee manages the Fund's fair valuation practices and maintains the fair valuation policies and procedures. The Fund's investment adviser reports to the Board information regarding the fair valuation process and related material matters.
The Fund categorizes the inputs to valuation techniques used to value its investments into a disclosure hierarchy consisting of three levels as shown below:
Level 1 - unadjusted quoted prices in active markets for identical investments
Level 2 - other significant observable inputs (including quoted prices for similar investments, interest rates, prepayment speeds, etc.)
Level 3 - unobservable inputs (including the Fund's own assumptions based on the best information available)
Valuation techniques used to value the Fund's investments by major category are as follows:
Debt securities, including restricted securities, are valued based on evaluated prices received from third party pricing services or from brokers who make markets in such securities. U.S. government and government agency obligations are valued by pricing services who utilize matrix pricing which considers yield or price of bonds of comparable quality, coupon, maturity and type or by broker-supplied prices. When independent prices are unavailable or unreliable, debt securities may be valued utilizing pricing methodologies which consider similar factors that would be used by third party pricing services. Debt securities are generally categorized as Level 2 in the hierarchy but may be Level 3 depending on the circumstances.
Futures contracts are valued at the settlement price or official closing price established each day by the board of trade or exchange on which they are traded and are categorized as Level 1 in the hierarchy. Investments in open-end mutual funds, including the Fidelity Central Funds, are valued at their closing net asset value (NAV) each business day and are categorized as Level 1 in the hierarchy.
Changes in valuation techniques may result in transfers in or out of an assigned level within the disclosure hierarchy. The aggregate value of investments by input level as of July 31, 2024 is included at the end of the Fund's Consolidated Schedule of Investments.
Investment Transactions and Income. For financial reporting purposes, the Fund's investment holdings and NAV include trades executed through the end of the last business day of the period. The NAV per share for processing shareholder transactions is calculated as of the close of business of the New York Stock Exchange (NYSE), normally 4:00 p.m. Eastern time and includes trades executed through the end of the prior business day. Gains and losses on securities sold are determined on the basis of identified cost. Income and capital gain distributions from Fidelity Central Funds, if any, are recorded on the ex-dividend date. Interest income is accrued as earned and includes coupon interest and amortization of premium and accretion of discount on debt securities as applicable. For Treasury Inflation-Protected Securities (TIPS) the principal amount is adjusted daily to keep pace with inflation. Interest is accrued based on the adjusted principal amount. The adjustments to principal due to inflation are reflected as increases or decreases to Interest in the accompanying Consolidated Statement of Operations. Such adjustments may result in negative Interest and may have a significant impact on the Fund's distributions.
Expenses. Expenses directly attributable to a fund are charged to that fund. Expenses attributable to more than one fund are allocated among the respective funds on the basis of relative net assets or other appropriate methods. Expenses included in the accompanying consolidated financial statements reflect the expenses of that fund and do not include any expenses associated with any underlying mutual funds or exchange-traded funds. Although not included in a fund's expenses, a fund indirectly bears its proportionate share of these expenses through the net asset value of each underlying mutual fund or exchange-traded fund. Expense estimates are accrued in the period to which they relate and adjustments are made when actual amounts are known.
Income Tax Information and Distributions to Shareholders. Each year, the Fund intends to qualify as a regulated investment company under Subchapter M of the Internal Revenue Code, including distributing substantially all of its taxable income and realized gains. As a result, no provision for U.S. Federal income taxes is required. As of July 31, 2024, the Fund did not have any unrecognized tax benefits in the consolidated financial statements; nor is the Fund aware of any tax positions for which it is reasonably possible that the total amounts of unrecognized tax benefits will significantly change in the next twelve months. The Fund files a U.S. federal tax return, in addition to state and local tax returns as required. The Fund's federal income tax returns are subject to examination by the Internal Revenue Service (IRS) for a period of three fiscal years after they are filed. State and local tax returns may be subject to examination for an additional fiscal year depending on the jurisdiction.
The Subsidiary is classified as a controlled foreign corporation under Subchapter N of the Internal Revenue Code. Therefore, the Fund is required to increase its taxable income by its share of the Subsidiary's income. Net investment losses of the Subsidiary cannot be deducted by the Fund in the current period nor carried forward to offset taxable income in future periods.
Distributions are declared and recorded on the ex-dividend date. Income and capital gain distributions are determined in accordance with income tax regulations, which may differ from GAAP.
Capital accounts within the consolidated financial statements are adjusted for permanent book-tax differences. These adjustments have no impact on net assets or the results of operations. Capital accounts are not adjusted for temporary book-tax differences which will reverse in a subsequent period.
Book-tax differences are primarily due to market discount, controlled foreign corporation, capital loss carryforwards and losses deferred due to wash sales.
As of period end, the cost and unrealized appreciation (depreciation) in securities, and derivatives if applicable, for federal income tax purposes were as follows:
| Gross unrealized appreciation | $423,946 |
| Gross unrealized depreciation | - |
| Net unrealized appreciation (depreciation) | $423,946 |
| Tax Cost | $4,178,593,617 |
The tax-based components of distributable earnings as of period end were as follows:
| Undistributed ordinary income | $99,561,018 |
| Capital loss carryforward | $(226,982,346) |
| Net unrealized appreciation (depreciation) on securities and other investments | $423,946 |
Capital loss carryforwards are only available to offset future capital gains of the Fund to the extent provided by regulations and may be limited. The capital loss carryforward information presented below, including any applicable limitation, is estimated as of fiscal period end and is subject to adjustment.
Short-term | $(111,338,474) |
Long-term | (115,643,872) |
| Total capital loss carryforward | $(226,982,346) |
Due to large subscriptions and redemptions in prior periods, the Fund is subject to annual limits on its use of some of its unrealized capital losses to offset capital gains in future periods. If those capital losses are realized and the limitation prevents the Fund from using any of those capital losses in the future period, those capital losses will be available to offset capital gains in subsequent periods.
The tax character of distributions paid was as follows:
| | July 31, 2024 | July 31, 2023 |
| Ordinary Income | $62,922,322 | $ 367,599,443 |
| Total | $62,922,322 | $ 367,599,443 |
5. Derivative Instruments.
Risk Exposures and the Use of Derivative Instruments. The Fund's investment objectives allow for various types of derivative instruments, including futures contracts. Derivatives are investments whose value is primarily derived from underlying assets, indices or reference rates and may be transacted on an exchange or over-the-counter (OTC). Derivatives may involve a future commitment to buy or sell a specified asset based on specified terms, to exchange future cash flows at periodic intervals based on a notional principal amount, or for one party to make one or more payments upon the occurrence of specified events in exchange for periodic payments from the other party.
Derivatives were primarily used to increase returns, to gain exposure to certain types of assets and to manage exposure to certain risks as defined below. The success of any strategy involving derivatives depends on analysis of numerous economic factors, and if the strategies for investment do not work as intended, the objectives may not be achieved.
Derivatives were used to increase or decrease exposure to the following risk:
| Commodity Risk | Commodity risk is the risk that the value of a commodity will fluctuate as a result of changes in market prices. |
Funds are also exposed to additional risks from investing in derivatives, such as liquidity risk and counterparty credit risk. Liquidity risk is the risk that a fund will be unable to close out the derivative in the open market in a timely manner. Counterparty credit risk is the risk that the counterparty will not be able to fulfill its obligation to a fund. Derivative counterparty credit risk is managed through formal evaluation of the creditworthiness of all potential counterparties. Exchange-traded futures contracts are not covered by the ISDA Master Agreement; however counterparty credit risk related to exchange-traded futures contracts may be mitigated by the protection provided by the exchange's clearinghouse.
Investing in derivatives may involve greater risks than investing in the underlying assets directly and, to varying degrees, may involve risk of loss in excess of any initial investment and collateral received and amounts recognized in the Consolidated Statement of Assets and Liabilities. In addition, there may be the risk that the change in value of the derivative contract does not correspond to the change in value of the underlying instrument.
Futures Contracts. A futures contract is an agreement between two parties to buy or sell a specified underlying instrument for a fixed price at a specified future date. Futures contracts were used to manage exposure to the commodities market.
Upon entering into a futures contract, a fund is required to deposit either cash or securities (initial margin) with a clearing broker in an amount equal to a certain percentage of the face value of the contract. Futures contracts are marked-to-market daily and subsequent daily payments are made or received by a fund depending on the daily fluctuations in the value of the futures contracts and are recorded as unrealized appreciation or (depreciation). This receivable and/or payable, if any, is included in daily variation margin on futures contracts in the Consolidated Statement of Assets and Liabilities. Realized gain or (loss) is recorded upon the expiration or closing of a futures contract. The net realized gain (loss) and change in net unrealized appreciation (depreciation) on futures contracts during the period is presented in the Consolidated Statement of Operations.
Any open futures contracts at period end are presented in the Consolidated Schedule of Investments under the caption "Futures Contracts". The notional amount at value reflects each contract's exposure to the underlying instrument or index at period end. Any securities deposited to meet initial margin requirements are identified in the Consolidated Schedule of Investments. Any cash deposited to meet initial margin requirements is presented as segregated cash with brokers for derivative instruments in the Consolidated Statement of Assets and Liabilities.
6. Fees and Other Transactions with Affiliates.
Management Fee and Administration Agreement. Geode Capital Management, LLC (the investment adviser) provides the Fund with investment management services for which the Fund pays a monthly management fee that is based on an annual rate of .38% of the Fund's average net assets.
Fidelity Management & Research Company LLC (FMR) provides administrative services to the Fund and the investment adviser pays for these services.
The investment adviser also provides investment management services to the Subsidiary. The Subsidiary does not pay the investment adviser a fee for these services. The Subsidiary pays certain other expenses including custody and directors' fees.
Interfund Trades. Funds may purchase from or sell securities to other Fidelity Funds under procedures adopted by the Board. The procedures have been designed to ensure these interfund trades are executed in accordance with Rule 17a-7 of the 1940 Act. During the period, there were no interfund trades.
7. Committed Line of Credit.
Certain Funds participate with other funds managed by the investment adviser or an affiliate in a $4.25 billion credit facility (the "line of credit") to be utilized for temporary or emergency purposes to fund shareholder redemptions or for other short-term liquidity purposes. The participating funds have agreed to pay commitment fees on their pro-rata portion of the line of credit, which are reflected in Miscellaneous expenses on the Consolidated Statement of Operations, and are listed below. During the period, there were no borrowings on this line of credit.
| | Amount ($) |
| Fidelity SAI Inflation-Focused Fund | 5,704 |
8. Expense Reductions.
Through arrangements with the Fund's custodian, credits realized as a result of certain uninvested cash balances were used to reduce the Fund's expenses by $1,015.
9. Other.
A fund's organizational documents provide former and current trustees and officers with a limited indemnification against liabilities arising in connection with the performance of their duties to the fund. In the normal course of business, a fund may also enter into contracts that provide general indemnifications. A fund's maximum exposure under these arrangements is unknown as this would be dependent on future claims that may be made against a fund. The risk of material loss from such claims is considered remote.
10. Risk and Uncertainties.
Many factors affect a fund's performance. Developments that disrupt global economies and financial markets, such as pandemics, epidemics, outbreaks of infectious diseases, war, terrorism, and environmental disasters, may significantly affect a fund's investment performance. The effects of these developments to a fund will be impacted by the types of securities in which a fund invests, the financial condition, industry, economic sector, and geographic location of an issuer, and a fund's level of investment in the securities of that issuer. Significant concentrations in security types, issuers, industries, sectors, and geographic locations may magnify the factors that affect a fund's performance.
Report of Independent Registered Public Accounting Firm
To the Board of Trustees of Fidelity Oxford Street Trust and the Shareholders of Fidelity SAI Inflation-Focused Fund:
Opinion on the Financial Statements and Financial Highlights
We have audited the accompanying consolidated statement of assets and liabilities of Fidelity SAI Inflation-Focused Fund (the "Fund"), a fund of Fidelity Oxford Street Trust, including the consolidated schedule of investments, as of July 31, 2024, the related consolidated statement of operations for the year then ended, the consolidated statement of changes in net assets for each of the two years in the period then ended, the consolidated financial highlights for each of the five years in the period then ended, and the related notes. In our opinion, the consolidated financial statements and consolidated financial highlights present fairly, in all material respects, the financial position of the Fund as of July 31, 2024, and the results of its operations for the year then ended, the changes in its net assets for each of the two years in the period then ended, and the financial highlights for each of the five years in the period then ended in conformity with accounting principles generally accepted in the United States of America.
Basis for Opinion
These financial statements and financial highlights are the responsibility of the Fund's management. Our responsibility is to express an opinion on the Fund's financial statements and financial highlights based on our audits. We are a public accounting firm registered with the Public Company Accounting Oversight Board (United States) (PCAOB) and are required to be independent with respect to the Fund in accordance with the U.S. federal securities laws and the applicable rules and regulations of the Securities and Exchange Commission and the PCAOB.
We conducted our audits in accordance with the standards of the PCAOB. Those standards require that we plan and perform the audit to obtain reasonable assurance about whether the financial statements and financial highlights are free of material misstatement, whether due to error or fraud. The Fund is not required to have, nor were we engaged to perform, an audit of its internal control over financial reporting. As part of our audits, we are required to obtain an understanding of internal control over financial reporting but not for the purpose of expressing an opinion on the effectiveness of the Fund's internal control over financial reporting. Accordingly, we express no such opinion.
Our audits included performing procedures to assess the risks of material misstatement of the financial statements and financial highlights, whether due to error or fraud, and performing procedures that respond to those risks. Such procedures included examining, on a test basis, evidence regarding the amounts and disclosures in the financial statements and financial highlights. Our audits also included evaluating the accounting principles used and significant estimates made by management, as well as evaluating the overall presentation of the financial statements and financial highlights. Our procedures included confirmation of securities owned as of July 31, 2024, by correspondence with the custodian and brokers; when replies were not received from brokers, we performed other auditing procedures. We believe that our audits provide a reasonable basis for our opinion.
/s/ Deloitte & Touche LLP
Boston, Massachusetts
September 12, 2024
We have served as the auditor of one or more of the Fidelity investment companies since 1999.
Distributions
(Unaudited)
The dividend and capital gains distributions for the fund(s) are available on Fidelity.com or Institutional.Fidelity.com.
A total of 30.47% of the dividends distributed during the fiscal year was derived from interest on U.S. Government securities which is generally exempt from state income tax.
The fund designates $62,922,316 of distributions paid during the fiscal year ended 2024 as qualifying to be taxed as section 163(j) interest dividends.
The fund will notify shareholders in January 2025 of amounts for use in preparing 2024 income tax returns.
Item 8: Changes in and Disagreements with Accountants for Open-End Management Investment Companies
Note: This is not applicable for any fund included in this document.
Item 9: Proxy Disclosures for Open-End Management Investment Companies
| A special meeting of shareholders was held on October 18, 2023. The results of votes taken among shareholders on the proposal before them are reported below. Each vote reported represents one dollar of net asset value held on the record date for the meeting. |
| Proposal 1 |
| To elect a Board of Trustees. |
| | # of Votes | % of Votes |
| Abigail P. Johnson |
| Affirmative | 4,544,611,126.80 | 98.03 |
| Withheld | 91,192,086.11 | 1.97 |
| TOTAL | 4,635,803,212.91 | 100.00 |
| Jennifer Toolin McAuliffe |
| Affirmative | 4,535,410,229.89 | 97.83 |
| Withheld | 100,392,983.02 | 2.17 |
| TOTAL | 4,635,803,212.91 | 100.00 |
| Christine J. Thompson |
| Affirmative | 4,544,351,180.03 | 98.03 |
| Withheld | 91,452,032.88 | 1.97 |
| TOTAL | 4,635,803,212.91 | 100.00 |
| Elizabeth S. Acton |
| Affirmative | 4,535,006,791.00 | 97.83 |
| Withheld | 100,796,421.91 | 2.17 |
| TOTAL | 4,635,803,212.91 | 100.00 |
| Laura M. Bishop |
| Affirmative | 4,543,484,037.23 | 98.01 |
| Withheld | 92,319,175.68 | 1.99 |
| TOTAL | 4,635,803,212.91 | 100.00 |
| Ann E. Dunwoody |
| Affirmative | 4,541,959,864.61 | 97.98 |
| Withheld | 93,843,348.30 | 2.02 |
| TOTAL | 4,635,803,212.91 | 100.00 |
| John Engler |
| Affirmative | 4,523,457,866.32 | 97.58 |
| Withheld | 112,345,346.59 | 2.42 |
| TOTAL | 4,635,803,212.91 | 100.00 |
| Robert F. Gartland |
| Affirmative | 4,533,525,068.87 | 97.79 |
| Withheld | 102,278,144.04 | 2.21 |
| TOTAL | 4,635,803,212.91 | 100.00 |
| Robert W. Helm |
| Affirmative | 4,539,288,934.76 | 97.92 |
| Withheld | 96,514,278.15 | 2.08 |
| TOTAL | 4,635,803,212.91 | 100.00 |
| Arthur E. Johnson |
| Affirmative | 4,526,773,659.17 | 97.65 |
| Withheld | 109,029,553.74 | 2.35 |
| TOTAL | 4,635,803,212.91 | 100.00 |
| Michael E. Kenneally |
| Affirmative | 4,535,412,506.96 | 97.83 |
| Withheld | 100,390,705.95 | 2.17 |
| TOTAL | 4,635,803,212.91 | 100.00 |
| Mark A. Murray |
| Affirmative | 4,533,792,953.42 | 97.80 |
| Withheld | 102,010,259.49 | 2.20 |
| TOTAL | 4,635,803,212.91 | 100.00 |
| Carol J. Zierhoffer |
| Affirmative | 4,540,811,737.27 | 97.95 |
| Withheld | 94,991,475.64 | 2.05 |
| TOTAL | 4,635,803,212.91 | 100.00 |
| | | |
| Proposal 1 reflects trust-wide proposal and voting results. |
Item 10: Remuneration Paid to Directors, Officers, and others of Open-End Management Investment Companies
Note: This information is disclosed as part of the consolidated financial statements for each Fund as part of Item 7: Consolidated Financial Statements and Consolidated Financial Highlights for Open-End Management Investment companies.
Item 11: Statement Regarding Basis for Approval of Investment Advisory Contract
Note: This is not applicable for any fund included in this document.
1.9892162.105
IFF-ANN-0924
Fidelity® Series Commodity Strategy Fund
Annual Report
July 31, 2024
Contents
To view a fund's proxy voting guidelines and proxy voting record for the 12-month period ended June 30, visit http://www.fidelity.com/proxyvotingresults or visit the Securities and Exchange Commission's (SEC) web site at http://www.sec.gov.
You may also call 1-800-544-8544 to request a free copy of the proxy voting guidelines.
Standard & Poor's, S&P and S&P 500 are registered service marks of The McGraw-Hill Companies, Inc. and have been licensed for use by Fidelity Distributors Corporation.
Other third-party marks appearing herein are the property of their respective owners.
All other marks appearing herein are registered or unregistered trademarks or service marks of FMR LLC or an affiliated company. © 2024 FMR LLC. All rights reserved.
This report and the financial statements contained herein are submitted for the general information of the shareholders of the Fund. This report is not authorized for distribution to prospective investors in the Fund unless preceded or accompanied by an effective prospectus.
A fund files its complete schedule of portfolio holdings with the SEC for the first and third quarters of each fiscal year on Form N-PORT. Forms N-PORT are available on the SEC's web site at http://www.sec.gov. A fund's Forms N-PORT may be reviewed and copied at the SEC's Public Reference Room in Washington, DC. Information regarding the operation of the SEC's Public Reference Room may be obtained by calling 1-800-SEC-0330.
For a complete list of a fund's portfolio holdings, view the most recent holdings listing, semiannual report, or annual report on Fidelity's web site at http://www.fidelity.com, http://www.institutional.fidelity.com, or http://www.401k.com, as applicable.
NOT FDIC INSURED •MAY LOSE VALUE •NO BANK GUARANTEE
Neither the Fund nor Fidelity Distributors Corporation is a bank.
Item 7: Consolidated Financial Statements and Consolidated Financial Highlights for Open-End Management Investment Companies (Annual Report)
Fidelity® Series Commodity Strategy Fund
Consolidated Schedule of Investments July 31, 2024
Showing Percentage of Net Assets
| U.S. Treasury Obligations - 13.7% |
| | | Principal Amount (a) | Value ($) |
U.S. Treasury Bills, yield at date of purchase 5.26% to 5.32% 8/1/24 to 10/17/24 (b)(c) (Cost $300,745,997) | | 303,000,000 | 300,757,806 |
| | | | |
| Money Market Funds - 89.7% |
| | | Shares | Value ($) |
Fidelity Cash Central Fund 5.39% (d) (Cost $1,968,101,200) | | 1,967,965,235 | 1,968,358,828 |
| | | | |
| TOTAL INVESTMENT IN SECURITIES - 103.4% (Cost $2,268,847,197) | 2,269,116,634 |
NET OTHER ASSETS (LIABILITIES) - (3.4)% | (75,439,851) |
| NET ASSETS - 100.0% | 2,193,676,783 |
| | |
| Futures Contracts |
| | Number of contracts | Expiration Date | Notional Amount ($) | Value ($) | Unrealized Appreciation/ (Depreciation) ($) |
| Purchased | | | | | |
| | | | | | |
| Commodity Futures Contracts | | | | | |
| CBOT Corn Contracts (United States) | 840 | Sep 2024 | 16,075,500 | (2,937,249) | (2,937,249) |
| CBOT HRW Wheat Contracts (United States) | 198 | Sep 2024 | 5,435,100 | (1,139,126) | (1,139,126) |
| CBOT Soybean Contracts (United States) | 321 | Nov 2024 | 16,411,125 | (2,064,893) | (2,064,893) |
| CBOT Soybean Meal Contracts (United States) | 327 | Dec 2024 | 10,323,390 | (1,168,335) | (1,168,335) |
| CBOT Soybean Oil Contracts (United States) | 400 | Dec 2024 | 10,156,800 | (453,038) | (453,038) |
| CBOT Wheat Contracts (United States) | 313 | Sep 2024 | 8,251,463 | (1,806,963) | (1,806,963) |
| CME Lean Hogs Contracts (United States) | 218 | Oct 2024 | 6,620,660 | 465,842 | 465,842 |
| CME Live Cattle Contracts (United States) | 173 | Oct 2024 | 12,917,910 | 190,413 | 190,413 |
| COMEX Copper Contracts (United States) | 190 | Sep 2024 | 19,887,988 | (1,518,734) | (1,518,734) |
| COMEX Gold 100 oz. Contracts (United States) | 239 | Dec 2024 | 59,618,780 | 1,333,107 | 1,333,107 |
| COMEX Silver Contracts (United States) | 131 | Sep 2024 | 19,050,675 | (525,642) | (525,642) |
| ICE Brent Crude Contracts (United Kingdom) | 331 | Sep 2024 | 26,704,630 | (944,925) | (944,925) |
| ICE Coffee 'C' Contracts (United States) | 148 | Sep 2024 | 12,720,600 | 269,630 | 269,630 |
| ICE Cotton No. 2 Contracts (United States) | 134 | Dec 2024 | 4,622,330 | (206,125) | (206,125) |
| ICE Low Sulphur Gasoil Contracts (United States) | 126 | Sep 2024 | 9,468,900 | 41,710 | 41,710 |
| ICE Sugar No. 11 Contracts (United States) | 406 | Sep 2024 | 8,612,397 | (40,156) | (40,156) |
| LME Aluminum Contracts (United Kingdom) | 248 | Sep 2024 | 14,010,078 | (1,862,095) | (1,862,095) |
| LME Lead Contracts (United Kingdom) | 57 | Sep 2024 | 2,956,120 | (156,777) | (156,777) |
| LME Nickel Contracts (United Kingdom) | 90 | Sep 2024 | 8,899,816 | (747,810) | (747,810) |
| LME Zinc Contracts (United Kingdom) | 133 | Sep 2024 | 8,813,844 | (614,136) | (614,136) |
| NYMEX Gasoline RBOB Contracts (United States) | 84 | Aug 2024 | 8,660,887 | 311,991 | 311,991 |
| NYMEX Natural Gas Contracts (United States) | 1,041 | Aug 2024 | 21,308,720 | (9,964,087) | (9,964,087) |
| NYMEX NY Harbor ULSD Contracts (United States) | 68 | Aug 2024 | 6,998,914 | (18,862) | (18,862) |
| NYMEX WTI Crude Oil Contracts (United States) | 341 | Aug 2024 | 26,722,790 | 453,617 | 453,617 |
| | | | | | |
| TOTAL FUTURES CONTRACTS | | | | | (23,102,643) |
| The notional amount of futures purchased as a percentage of Net Assets is 15.6% |
For the period, the average monthly notional amount at value for futures contracts in the aggregate was $327,040,627.
| Total Return Swaps |
Underlying Reference(1) | Pay/ Receive Reference | Reference Payment Frequency | Financing Rate | Financing Frequency | Counterparty | Maturity Date | Notional Amount ($) | Value ($) | Upfront Premium Received/ (Paid) ($) | Unrealized Appreciation/ (Depreciation) ($) |
| Bloomberg Commodity Index | Receives | At Maturity | 3-month US auction rate T-Bill plus 12 basis points | At Maturity | Canadian Imperial Bank Of Commerce | Sep 2024 | | 75,000,000 | (4,875,046) | 0 | (4,875,046) |
| Bloomberg Commodity Index | Receives | At Maturity | 3-month US auction rate T-Bill plus 12 basis points | At Maturity | Canadian Imperial Bank Of Commerce | Oct 2024 | | 79,000,000 | (559,742) | 0 | (559,742) |
| Bloomberg Commodity Index | Receives | At Maturity | 3-month US auction rate T-Bill plus 12 basis points | At Maturity | Canadian Imperial Bank Of Commerce | Oct 2024 | | 28,000,000 | 7,086 | 0 | 7,086 |
| Bloomberg Commodity Index | Receives | At Maturity | 3-month US auction rate T-Bill plus 11 basis points | At Maturity | Citibank, N.A. | Sep 2024 | | 76,000,000 | (2,998,434) | 0 | (2,998,434) |
| Bloomberg Commodity Index | Receives | At Maturity | 3-month US auction rate T-Bill plus 11 basis points | At Maturity | Citibank, N.A. | Oct 2024 | | 84,000,000 | (594,985) | 0 | (594,985) |
| Bloomberg Commodity Index | Receives | At Maturity | 3-month US auction rate T-Bill plus 11 basis points | At Maturity | Citibank, N.A. | Oct 2024 | | 74,000,000 | (1,631,416) | 0 | (1,631,416) |
| Bloomberg Commodity Index | Receives | At Maturity | 3-month US auction rate T-Bill plus 11 basis points | At Maturity | Citibank, N.A. | Oct 2024 | | 38,000,000 | (1,066,733) | 0 | (1,066,733) |
| Bloomberg Commodity Index | Receives | At Maturity | 3-month US auction rate T-Bill plus 11 basis points | At Maturity | Goldman Sachs Bank USA | Sep 2024 | | 83,000,000 | (3,219,875) | 0 | (3,219,875) |
| Bloomberg Commodity Index | Receives | At Maturity | 3-month US auction rate T-Bill plus 11 basis points | At Maturity | Goldman Sachs Bank USA | Sep 2024 | | 75,000,000 | (4,778,861) | 0 | (4,778,861) |
| Bloomberg Commodity Index | Receives | At Maturity | 3-month US auction rate T-Bill plus 13 basis points | At Maturity | JPMorgan Chase Bank, N.A. | Sep 2024 | | 50,000,000 | (2,901,834) | 0 | (2,901,834) |
| Bloomberg Commodity Index | Receives | At Maturity | 3-month US auction rate T-Bill plus 13 basis points | At Maturity | JPMorgan Chase Bank, N.A. | Oct 2024 | | 101,000,000 | (2,461,230) | 0 | (2,461,230) |
| Bloomberg Commodity Index | Receives | At Maturity | 3-month US auction rate T-Bill plus 13 basis points | At Maturity | JPMorgan Chase Bank, N.A. | Oct 2024 | | 92,000,000 | 1,330,231 | 0 | 1,330,231 |
| Bloomberg Commodity Index | Receives | At Maturity | 3-month US auction rate T-Bill plus 12 basis points | At Maturity | Macquarie Bank Ltd. | Sep 2024 | | 82,000,000 | (3,235,601) | 0 | (3,235,601) |
| Bloomberg Commodity Index | Receives | At Maturity | 3-month US auction rate T-Bill plus 12 basis points | At Maturity | Macquarie Bank Ltd. | Sep 2024 | | 75,000,000 | (4,779,868) | 0 | (4,779,868) |
| Bloomberg Commodity Index | Receives | At Maturity | 3-month US auction rate T-Bill plus 12 basis points | At Maturity | Macquarie Bank Ltd. | Sep 2024 | | 66,000,000 | (3,839,005) | 0 | (3,839,005) |
| Bloomberg Commodity Index | Receives | At Maturity | 3-month US auction rate T-Bill plus 9 basis points | At Maturity | Merrill Lynch International | Sep 2024 | | 74,000,000 | (3,721,413) | 0 | (3,721,413) |
| Bloomberg Commodity Index | Receives | At Maturity | 3-month US auction rate T-Bill plus 9 basis points | At Maturity | Merrill Lynch International | Sep 2024 | | 71,000,000 | (2,583,377) | 0 | (2,583,377) |
| Bloomberg Commodity Index | Receives | At Maturity | 3-month US auction rate T-Bill plus 11 basis points | At Maturity | Merrill Lynch International | Sep 2024 | | 66,000,000 | (3,838,228) | 0 | (3,838,228) |
| Bloomberg Commodity Index | Receives | At Maturity | 3-month US auction rate T-Bill plus 7 basis points | At Maturity | Merrill Lynch International | Oct 2024 | | 87,000,000 | 22,734 | 0 | 22,734 |
| Bloomberg Commodity Index | Receives | At Maturity | 3-month US auction rate T-Bill plus 9 basis points | At Maturity | Merrill Lynch International | Oct 2024 | | 48,000,000 | (243,387) | 0 | (243,387) |
| Bloomberg Commodity Index | Receives | At Maturity | 3-month US auction rate T-Bill plus 12 basis points | At Maturity | Royal Bank of Canada | Sep 2024 | | 103,000,000 | (8,597,278) | 0 | (8,597,278) |
| Bloomberg Commodity Index | Receives | At Maturity | 3-month US auction rate T-Bill plus 12 basis points | At Maturity | Royal Bank of Canada | Sep 2024 | | 75,000,000 | (4,875,046) | 0 | (4,875,046) |
| Bloomberg Commodity Index | Receives | At Maturity | 3-month US auction rate T-Bill plus 12 basis points | At Maturity | Royal Bank of Canada | Oct 2024 | | 88,000,000 | (2,470,692) | 0 | (2,470,692) |
| Bloomberg Commodity Index | Receives | At Maturity | 3-month US auction rate T-Bill plus 12 basis points | At Maturity | Royal Bank of Canada | Oct 2024 | | 32,000,000 | (162,442) | 0 | (162,442) |
| Bloomberg Commodity Index | Receives | At Maturity | 3-month US auction rate T-Bill plus 11 basis points | At Maturity | Societe Generale | Sep 2024 | | 74,000,000 | (3,723,684) | 0 | (3,723,684) |
| Bloomberg Commodity Index | Receives | At Maturity | 3-month US auction rate T-Bill plus 11 basis points | At Maturity | Societe Generale | Oct 2024 | | 61,000,000 | (1,486,018) | 0 | (1,486,018) |
| Bloomberg Commodity Index | Receives | At Maturity | 3-month US auction rate T-Bill plus 11 basis points | At Maturity | Societe Generale | Oct 2024 | | 58,000,000 | 838,655 | 0 | 838,655 |
| TOTAL RETURN SWAPS | | | | | | | | | (66,445,489) | 0 | (66,445,489) |
| | | | | | | | | | | | |
(1)Each open total return swap is an agreement to receive the total return of the Bloomberg Commodity Index and pay a floating rate based on the 3-month US auction rate T-Bill plus a specified spread.
|
For the period, the average monthly notional amount at value for swaps in the aggregate was $1,603,916,667.
Legend
| (a) | Amount is stated in United States dollars unless otherwise noted. |
| (b) | Security or a portion of the security was pledged to cover margin requirements for futures contracts. At period end, the value of securities pledged amounted to $28,781,225. |
| (c) | Security or a portion of the security has been segregated as collateral for open bi-lateral over the counter (OTC) swaps. At period end, the value of securities pledged amounted to $250,466,569. |
| (d) | Affiliated fund that is generally available only to investment companies and other accounts managed by Fidelity Investments. The rate quoted is the annualized seven-day yield of the fund at period end. A complete unaudited listing of the fund's holdings as of its most recent quarter end is available upon request. In addition, each Fidelity Central Fund's financial statements, which are not covered by the Fund's Report of Independent Registered Public Accounting Firm, are available on the SEC's website or upon request. |
Affiliated Central Funds
Fiscal year to date information regarding the Fund's investments in Fidelity Central Funds, including the ownership percentage, is presented below.
| Affiliate | Value, beginning of period ($) | Purchases ($) | Sales Proceeds ($) | Dividend Income ($) | Realized Gain (loss) ($) | Change in Unrealized appreciation (depreciation) ($) | Value, end of period ($) | % ownership, end of period |
| Fidelity Cash Central Fund 5.39% | 1,596,851,197 | 1,402,432,150 | 1,030,904,807 | 92,524,973 | (1,256) | (18,456) | 1,968,358,828 | 3.9% |
| Total | 1,596,851,197 | 1,402,432,150 | 1,030,904,807 | 92,524,973 | (1,256) | (18,456) | 1,968,358,828 | |
| | | | | | | | | |
Amounts in the dividend income column in the above table include any capital gain distributions from underlying funds, which are presented in the corresponding line item in the Consolidated Statement of Operations, if applicable.
Amounts included in the purchases and sales proceeds columns may include in-kind transactions, if applicable.
Investment Valuation
The following is a summary of the inputs used, as of July 31, 2024, involving the Fund's assets and liabilities carried at fair value. The inputs or methodology used for valuing securities may not be an indication of the risk associated with investing in those securities. For more information on valuation inputs, and their aggregation into the levels used below, please refer to the Investment Valuation section in the accompanying Notes to Consolidated Financial Statements.
| Valuation Inputs at Reporting Date: |
| Description | Total ($) | Level 1 ($) | Level 2 ($) | Level 3 ($) |
Investments in Securities: | | | | |
|
| U.S. Government and Government Agency Obligations | 300,757,806 | - | 300,757,806 | - |
|
| Money Market Funds | 1,968,358,828 | 1,968,358,828 | - | - |
| Total Investments in Securities: | 2,269,116,634 | 1,968,358,828 | 300,757,806 | - |
Derivative Instruments: Assets | | | | |
Futures Contracts | 3,066,310 | 3,066,310 | - | - |
Swaps | 2,198,706 | - | 2,198,706 | - |
| Total Assets | 5,265,016 | 3,066,310 | 2,198,706 | - |
| Liabilities | | | | |
Futures Contracts | (26,168,953) | (26,168,953) | - | - |
Swaps | (68,644,195) | - | (68,644,195) | - |
| Total Liabilities | (94,813,148) | (26,168,953) | (68,644,195) | - |
| Total Derivative Instruments: | (89,548,132) | (23,102,643) | (66,445,489) | - |
Value of Derivative Instruments
The following table is a summary of the Fund's value of derivative instruments by primary risk exposure as of July 31, 2024. For additional information on derivative instruments, please refer to the Derivative Instruments section in the accompanying Notes to Consolidated Financial Statements.
Primary Risk Exposure / Derivative Type | Value |
| Asset ($) | Liability ($) |
| Commodity Risk | | |
Futures Contracts (a) | 3,066,310 | (26,168,953) |
Swaps (b) | 2,198,706 | (68,644,195) |
| Total Commodity Risk | 5,265,016 | (94,813,148) |
| Total Value of Derivatives | 5,265,016 | (94,813,148) |
(a)Reflects gross cumulative appreciation (depreciation) on futures contracts as presented in the Consolidated Schedule of Investments. In the Consolidated Statement of Assets and Liabilities, the period end daily variation margin is included in receivable or payable for daily variation margin on futures contracts, and the net cumulative appreciation (depreciation) is included in Total accumulated earnings (loss).
(b)For bi-lateral over-the-counter (OTC) swaps, reflects gross value which is presented in the Consolidated Statement of Assets and Liabilities in the bi-lateral OTC swaps, at value line-items.
The following table is a summary of the Fund's derivatives inclusive of potential netting arrangements.
| | | | | | | | | | | |
| Counterparty | | Value of Derivative Assets ($) | | Value of Derivative Liabilities ($) | | Collateral Received(a) ($) | | Collateral Pledged(a) ($) | | Net(b) ($) |
| Canadian Imperial Bk. of Comm. | | 7,086 | | (5,434,788) | | - | | 5,427,702 | | - |
| Citibank, N.A. | | - | | (6,291,568) | | - | | 6,291,568 | | - |
| Goldman Sachs Bank USA | | - | | (7,998,736) | | - | | 7,998,736 | | - |
| JPMorgan Chase Bank, N.A. | | 1,330,231 | | (5,363,064) | | - | | 4,032,833 | | - |
| Macquarie Bank Ltd. | | - | | (11,854,474) | | - | | 11,854,474 | | - |
| Merrill Lynch Intl. | | 22,734 | | (10,386,405) | | - | | 10,363,671 | | - |
| Royal Bank of Canada | | - | | (16,105,458) | | - | | 16,105,458 | | - |
| Societe Generale S.A. | | 838,655 | | (5,209,702) | | - | | 4,371,047 | | - |
| Total | $ | 2,198,706 | $ | (68,644,195) | $ | - | $ | 66,445,489 | $ | - |
| | | | | | | | | | | |
(a) Reflects collateral received from or pledged to an individual counterparty, excluding any excess or initial collateral amounts.
(b) Net represents the receivable / (payable) that would be due from / (to) the counterparty in an event of default. Netting may be allowed across transactions traded under the same legal agreement with the same legal entity. Please refer to Derivative Instruments - Risk Exposures and the Use of Derivative Instruments section in the accompanying Notes to Consolidated Financial Statements.
Consolidated Financial Statements
| Consolidated Statement of Assets and Liabilities |
As of July 31, 2024 |
| Assets | | | | |
| Investment in securities, at value - See accompanying schedule: | | | | |
Unaffiliated issuers (cost $300,745,997) | $ | 300,757,806 | | |
Fidelity Central Funds (cost $1,968,101,200) | | 1,968,358,828 | | |
| | | | | |
| | | | | |
| Total Investment in Securities (cost $2,268,847,197) | | | $ | 2,269,116,634 |
| Receivable for fund shares sold | | | | 369,224 |
| Distributions receivable from Fidelity Central Funds | | | | 9,373,878 |
| Receivable for daily variation margin on futures contracts | | | | 621,940 |
| Bi-lateral OTC swaps, at value | | | | 2,198,706 |
| Prepaid expenses | | | | 6,250 |
Total assets | | | | 2,281,686,632 |
| Liabilities | | | | |
| Payable for investments purchased | $ | 18,486,560 | | |
| Payable for fund shares redeemed | | 873,295 | | |
| Bi-lateral OTC swaps, at value | | 68,644,195 | | |
| Other payables and accrued expenses | | 5,799 | | |
| Total liabilities | | | | 88,009,849 |
| Net Assets | | | $ | 2,193,676,783 |
| Net Assets consist of: | | | | |
| Paid in capital | | | $ | 2,321,589,091 |
| Total accumulated earnings (loss) | | | | (127,912,308) |
| Net Assets | | | $ | 2,193,676,783 |
Net Asset Value, offering price and redemption price per share ($2,193,676,783 ÷ 23,408,195 shares) | | | $ | 93.71 |
| Consolidated Statement of Operations |
| Year ended July 31, 2024 |
| Investment Income | | | | |
| Interest | | | $ | 11,334,926 |
| Income from Fidelity Central Funds | | | | 92,524,973 |
| Total income | | | | 103,859,899 |
| Expenses | | | | |
| Custodian fees and expenses | $ | 19,683 | | |
| Independent trustees' fees and expenses | | 5,546 | | |
| Subsidiary directors' fees | | 15,100 | | |
| Miscellaneous | | 59 | | |
| Total expenses before reductions | | 40,388 | | |
| Expense reductions | | (17) | | |
| Total expenses after reductions | | | | 40,371 |
| Net Investment income (loss) | | | | 103,819,528 |
| Realized and Unrealized Gain (Loss) | | | | |
| Net realized gain (loss) on: | | | | |
| Investment Securities: | | | | |
| Unaffiliated issuers | | 46,364 | | |
| Fidelity Central Funds | | (1,256) | | |
| Futures contracts | | 12,317,142 | | |
| Swaps | | (75,300,545) | | |
| Total net realized gain (loss) | | | | (62,938,295) |
| Change in net unrealized appreciation (depreciation) on: | | | | |
| Investment Securities: | | | | |
| Unaffiliated issuers | | 27,910 | | |
| Fidelity Central Funds | | (18,456) | | |
| Futures contracts | | (44,371,602) | | |
| Swaps | | (103,798,645) | | |
| Total change in net unrealized appreciation (depreciation) | | | | (148,160,793) |
| Net gain (loss) | | | | (211,099,088) |
| Net increase (decrease) in net assets resulting from operations | | | $ | (107,279,560) |
| Consolidated Statement of Changes in Net Assets |
| |
| | Year ended July 31, 2024 | | Year ended July 31, 2023 |
| Increase (Decrease) in Net Assets | | | | |
| Operations | | | | |
| Net investment income (loss) | $ | 103,819,528 | $ | 80,600,683 |
| Net realized gain (loss) | | (62,938,295) | | (456,436,168) |
| Change in net unrealized appreciation (depreciation) | | (148,160,793) | | 140,177,298 |
| Net increase (decrease) in net assets resulting from operations | | (107,279,560) | | (235,658,187) |
| Distributions to shareholders | | (73,675,794) | | (1,838,993,555) |
| | | | | |
| Share transactions | | | | |
| Proceeds from sales of shares | | 820,344,193 | | 467,749,069 |
| Reinvestment of distributions | | 73,675,794 | | 1,838,558,731 |
| Cost of shares redeemed | | (375,566,680) | | (1,858,797,324) |
| | | | | |
Net increase (decrease) in net assets resulting from share transactions | | 518,453,307 | | 447,510,476 |
| Total increase (decrease) in net assets | | 337,497,953 | | (1,627,141,266) |
| | | | | |
| Net Assets | | | | |
| Beginning of period | | 1,856,178,830 | | 3,483,320,096 |
| End of period | $ | 2,193,676,783 | $ | 1,856,178,830 |
| | | | | |
| Other Information | | | | |
| Shares | | | | |
| Sold | | 8,472,573 | | 4,555,676 |
| Issued in reinvestment of distributions | | 752,001 | | 16,569,112 |
| Redeemed | | (3,849,588) | | (16,991,884) |
| Net increase (decrease) | | 5,374,986 | | 4,132,904 |
| | | | | |
Share activity has been adjusted to reflect the impact of the 1 for 50 reverse share split that occurred on November 18, 2022. See Note 1 of the Notes to Financial Statements.
Consolidated Financial Highlights
Fidelity® Series Commodity Strategy Fund |
| |
| Years ended July 31, | | 2024 | | 2023 A | | 2022 A | | 2021 A | | 2020 A |
Selected Per-Share Data | | | | | | | | | | |
| Net asset value, beginning of period | $ | 102.93 | $ | 250.50 | $ | 282.50 | $ | 203.00 | $ | 233.50 |
| Income from Investment Operations | | | | | | | | | | |
Net investment income (loss) B,C | | 5.24 | | 4.47 | | .50 | | - D | | 3.00 |
| Net realized and unrealized gain (loss) | | (10.26) | | (16.96) | | 53.00 | | 80.50 | | (30.00) |
| Total from investment operations | | (5.02) | | (12.49) | | 53.50 | | 80.50 | | (27.00) |
| Distributions from net investment income | | (4.20) | | (135.08) | | (85.50) | | (1.00) | | (3.50) |
| Total distributions | | (4.20) | | (135.08) | | (85.50) | | (1.00) | | (3.50) |
| Net asset value, end of period | $ | 93.71 | $ | 102.93 | $ | 250.50 | $ | 282.50 | $ | 203.00 |
Total Return E | | | | (8.29)% | | 26.51% | | 39.82% | | (11.72)% |
Ratios to Average Net Assets C,F,G | | | | | | | | | | |
Expenses before reductions H | | -% | | -% | | -% | | -% | | -% |
Expenses net of fee waivers, if any H | | | | -% | | -% | | -% | | -% |
Expenses net of all reductions H | | -% | | -% | | -% | | -% | | -% |
| Net investment income (loss) | | 5.42% | | 3.89% | | .26% | | .07% | | 1.30% |
| Supplemental Data | | | | | | | | | | |
| Net assets, end of period (000 omitted) | $ | 2,193,677 | $ | 1,856,179 | $ | 3,483,320 | $ | 7,474,716 | $ | 5,808,312 |
Portfolio turnover rate I | | | | 0% | | 0% | | 0% | | 0% |
APer share amounts have been adjusted to reflect the impact of the 1 for 50 reverse share split that occurred on November 18, 2022. See Note 1 of the Notes to Financial Statements.
BCalculated based on average shares outstanding during the period.
CNet investment income (loss) is affected by the timing of the declaration of dividends by any underlying mutual funds or exchange-traded funds (ETFs). Net investment income (loss) of any mutual funds or ETFs is not included in the Fund's net investment income (loss) ratio.
DAmount represents less than $.005 per share.
ETotal returns would have been lower if certain expenses had not been reduced during the applicable periods shown.
FFees and expenses of any underlying mutual funds or exchange-traded funds (ETFs) are not included in the Fund's expense ratio. The Fund indirectly bears its proportionate share of these expenses. For additional expense information related to investments in Fidelity Central Funds, please refer to the "Investments in Fidelity Central Funds" note found in the Notes to Consolidated Financial Statements section of the most recent Annual or Semi-Annual report.
GExpense ratios reflect operating expenses of the class. Expenses before reductions do not reflect amounts reimbursed, waived, or reduced through arrangements with the investment adviser, brokerage services, or other offset arrangements, if applicable, and do not represent the amount paid by the class during periods when reimbursements, waivers or reductions occur.
HAmount represents less than .005%.
IAmount does not include the portfolio activity of any underlying mutual funds or exchange-traded funds (ETFs).
Notes to Consolidated Financial Statements
For the period ended July 31, 2024
1. Organization.
Fidelity Series Commodity Strategy Fund (the Fund) is a fund of Fidelity Oxford Street Trust (the Trust) and is authorized to issue an unlimited number of shares. Shares are offered only to certain other Fidelity funds, Fidelity managed 529 plans, and Fidelity managed collective investment trusts. The Trust is registered under the Investment Company Act of 1940, as amended (the 1940 Act), as an open-end management investment company organized as a Massachusetts business trust.
Effective November 18, 2022, the Fund underwent a 1 for 50 reverse share split. The effect of the reverse share split transaction was to divide the number of outstanding shares of the Fund by a split factor of 1:50, with a corresponding increase in net asset value (NAV) per share. This event does not impact the overall net assets of the Fund. The per share data presented in the Consolidated Financial Highlights and Shares activity presented in the Consolidated Statement of Changes in Net Assets for prior fiscal years of the Fund have been retroactively adjusted to reflect this reverse share split.
2. Consolidated Subsidiary.
The Funds included in the table below hold certain commodity-related investments through a wholly owned subsidiary (the "Subsidiary"). As of period end, the investments in the Subsidiaries, were as follows:
| | Subsidiary Name | Net Assets of Subsidiary | % of Fund's Net Assets |
| Fidelity Series Commodity Strategy Fund | Geode Series Commodity Return Cayman Ltd. | 252,714,965 | 11.5 |
The financial statements have been consolidated to include the Subsidiary accounts where applicable. Accordingly, all inter-company transactions and balances have been eliminated.
3. Investments in Fidelity Central Funds.
Funds may invest in Fidelity Central Funds, which are open-end investment companies generally available only to other investment companies and accounts managed by Fidelity Management & Research Company LLC (FMR) and its affiliates. The Consolidated Schedule of Investments lists any Fidelity Central Funds held as an investment as of period end, but does not include the underlying holdings of each Fidelity Central Fund. An investing fund indirectly bears its proportionate share of the expenses of the underlying Fidelity Central Funds.
Based on its investment objective, each Fidelity Central Fund may invest or participate in various investment vehicles or strategies that are similar to those of the investing fund. These strategies are consistent with the investment objectives of the investing fund and may involve certain economic risks which may cause a decline in value of each of the Fidelity Central Funds and thus a decline in the value of the investing fund.
| Fidelity Central Fund | Investment Manager | Investment Objective | Investment Practices | Expense RatioA |
| Fidelity Money Market Central Funds | Fidelity Management & Research Company LLC (FMR) | Each fund seeks to obtain a high level of current income consistent with the preservation of capital and liquidity. | Short-term Investments | Less than .005% |
A Expenses expressed as a percentage of average net assets and are as of each underlying Central Fund's most recent annual or semi-annual shareholder report.
A complete unaudited list of holdings for each Fidelity Central Fund is available upon request or at the Securities and Exchange Commission website at www.sec.gov. In addition, the financial statements of the Fidelity Central Funds which contain the significant accounting policies (including investment valuation policies) of those funds, and are not covered by the Report of Independent Registered Public Accounting Firm, are available on the Securities and Exchange Commission website or upon request.
4. Significant Accounting Policies.
The Fund is an investment company and applies the accounting and reporting guidance of the Financial Accounting Standards Board (FASB) Accounting Standards Codification Topic 946 Financial Services - Investment Companies. The consolidated financial statements have been prepared in conformity with accounting principles generally accepted in the United States of America (GAAP), which require management to make certain estimates and assumptions at the date of the consolidated financial statements. Actual results could differ from those estimates. Subsequent events, if any, through the date that the consolidated financial statements were issued have been evaluated in the preparation of the consolidated financial statements. The Fund's Consolidated Schedule of Investments lists any underlying mutual funds or exchange-traded funds (ETFs) but does not include the underlying holdings of these funds. The following summarizes the significant accounting policies of the Fund:
Investment Valuation. Investments are valued as of 4:00 p.m. Eastern time on the last calendar day of the period. The Board of Trustees (the Board) has designated the Fund's investment adviser as the valuation designee responsible for the fair valuation function and performing fair value determinations as needed. The investment adviser has established a Fair Value Committee (the Committee) to carry out the day-to-day fair valuation responsibilities and has adopted policies and procedures to govern the fair valuation process and the activities of the Committee. In accordance with these fair valuation policies and procedures, which have been approved by the Board, the Fund attempts to obtain prices from one or more third party pricing services or brokers to value its investments. When current market prices, quotations or currency exchange rates are not readily available or reliable, investments will be fair valued in good faith by the Committee, in accordance with the policies and procedures. Factors used in determining fair value vary by investment type and may include market or investment specific events, transaction data, estimated cash flows, and market observations of comparable investments. The frequency that the fair valuation procedures are used cannot be predicted and they may be utilized to a significant extent. The Committee manages the Fund's fair valuation practices and maintains the fair valuation policies and procedures. The Fund's investment adviser reports to the Board information regarding the fair valuation process and related material matters.
The Fund categorizes the inputs to valuation techniques used to value its investments into a disclosure hierarchy consisting of three levels as shown below:
Level 1 - unadjusted quoted prices in active markets for identical investments
Level 2 - other significant observable inputs (including quoted prices for similar investments, interest rates, prepayment speeds, etc.)
Level 3 - unobservable inputs (including the Fund's own assumptions based on the best information available)
Valuation techniques used to value the Fund's investments by major category are as follows:
Debt securities, including restricted securities, are valued based on evaluated prices received from third party pricing services or from brokers who make markets in such securities. U.S. government agency mortgage securities are valued by pricing services who utilize matrix pricing which considers yield or price of bonds of comparable quality, coupon, maturity and type or by broker-supplied prices. Swaps are marked-to-market daily based on valuations from third party pricing services, registered derivatives clearing organizations (clearinghouses) or broker-supplied valuations. These pricing sources may utilize inputs such as movements in the underlying index, interest rate curves, credit spread curves, default possibilities and recovery rates. When independent prices are unavailable or unreliable, debt securities and swaps may be valued utilizing pricing methodologies which consider similar factors that would be used by third party pricing services. Debt securities and swaps are generally categorized as Level 2 in the hierarchy but may be Level 3 depending on the circumstances.
Futures contracts are valued at the settlement price or official closing price established each day by the board of trade or exchange on which they are traded and are categorized as Level 1 in the hierarchy. Investments in commodities are valued at their last traded price prior to 4:00 p.m. Eastern time each business day and are categorized as Level 1 in the hierarchy. Investments in open-end mutual funds, including the Fidelity Central Funds, are valued at their closing net asset value (NAV) each business day and are categorized as Level 1 in the hierarchy.
Changes in valuation techniques may result in transfers in or out of an assigned level within the disclosure hierarchy. The aggregate value of investments by input level as of July 31, 2024 is included at the end of the Fund's Consolidated Schedule of Investments.
Investment Transactions and Income. For financial reporting purposes, the Fund's investment holdings and NAV include trades executed through the end of the last business day of the period. The NAV per share for processing shareholder transactions is calculated as of the close of business of the New York Stock Exchange (NYSE), normally 4:00 p.m. Eastern time and includes trades executed through the end of the prior business day. Gains and losses on securities sold are determined on the basis of identified cost. Income and capital gain distributions from Fidelity Central Funds, if any, are recorded on the ex-dividend date. Interest income is accrued as earned and includes coupon interest and amortization of premium and accretion of discount on debt securities as applicable.
Expenses. Expenses directly attributable to a fund are charged to that fund. Expenses attributable to more than one fund are allocated among the respective funds on the basis of relative net assets or other appropriate methods. Expenses included in the accompanying consolidated financial statements reflect the expenses of that fund and do not include any expenses associated with any underlying mutual funds or exchange-traded funds. Although not included in a fund's expenses, a fund indirectly bears its proportionate share of these expenses through the net asset value of each underlying mutual fund or exchange-traded fund. Expense estimates are accrued in the period to which they relate and adjustments are made when actual amounts are known.
Income Tax Information and Distributions to Shareholders. Each year, the Fund intends to qualify as a regulated investment company under Subchapter M of the Internal Revenue Code, including distributing substantially all of its taxable income and realized gains. As a result, no provision for U.S. Federal income taxes is required. As of July 31, 2024, the Fund did not have any unrecognized tax benefits in the consolidated financial statements; nor is the Fund aware of any tax positions for which it is reasonably possible that the total amounts of unrecognized tax benefits will significantly change in the next twelve months. The Fund files a U.S. federal tax return, in addition to state and local tax returns as required. The Fund's federal income tax returns are subject to examination by the Internal Revenue Service (IRS) for a period of three fiscal years after they are filed. State and local tax returns may be subject to examination for an additional fiscal year depending on the jurisdiction.
The Subsidiary is classified as a controlled foreign corporation under Subchapter N of the Internal Revenue Code. Therefore, the Fund is required to increase its taxable income by its share of the Subsidiary's income. Net investment losses of the Subsidiary cannot be deducted by the Fund in the current period nor carried forward to offset taxable income in future periods.
Distributions are declared and recorded on the ex-dividend date. Income and capital gain distributions are determined in accordance with income tax regulations, which may differ from GAAP.
Capital accounts within the consolidated financial statements are adjusted for permanent book-tax differences. These adjustments have no impact on net assets or the results of operations. Capital accounts are not adjusted for temporary book-tax differences which will reverse in a subsequent period.
Book-tax differences are primarily due to controlled foreign corporations and capital loss carryforwards.
As of period end, the cost and unrealized appreciation (depreciation) in securities, and derivatives if applicable, for federal income tax purposes were as follows:
| Gross unrealized appreciation | $- |
| Gross unrealized depreciation | (67,887,497) |
| Net unrealized appreciation (depreciation) | $(67,887,497) |
| Tax Cost | $2,267,177,823 |
The tax-based components of distributable earnings as of period end were as follows:
| Undistributed ordinary income | $53,687,788 |
| Capital loss carryforward | $(113,712,596) |
| Net unrealized appreciation (depreciation) on securities and other investments | $(67,887,497) |
Capital loss carryforwards are only available to offset future capital gains of the Fund to the extent provided by regulations and may be limited. The capital loss carryforward information presented below, including any applicable limitation, is estimated as of fiscal period end and is subject to adjustment.
Short-term | $(85,414,793) |
Long-term | (28,297,803) |
| Total capital loss carryforward | $(113,712,596) |
The tax character of distributions paid was as follows:
| | July 31, 2024 | July 31, 2023 |
| Ordinary Income | $73,675,794 | $ 1,838,993,555 |
5. Derivative Instruments.
Risk Exposures and the Use of Derivative Instruments. The Fund's investment objectives allow for various types of derivative instruments, including futures contracts and swaps. Derivatives are investments whose value is primarily derived from underlying assets, indices or reference rates and may be transacted on an exchange or over-the-counter (OTC). Derivatives may involve a future commitment to buy or sell a specified asset based on specified terms, to exchange future cash flows at periodic intervals based on a notional principal amount, or for one party to make one or more payments upon the occurrence of specified events in exchange for periodic payments from the other party.
Derivatives were primarily used to increase returns, to gain exposure to certain types of assets and to manage exposure to certain risks as defined below. The success of any strategy involving derivatives depends on analysis of numerous economic factors, and if the strategies for investment do not work as intended, the objectives may not be achieved.
Derivatives were used to increase or decrease exposure to the following risk:
| Commodity Risk | Commodity risk is the risk that the value of a commodity will fluctuate as a result of changes in market prices. |
Funds are also exposed to additional risks from investing in derivatives, such as liquidity risk and counterparty credit risk. Liquidity risk is the risk that a fund will be unable to close out the derivative in the open market in a timely manner. Counterparty credit risk is the risk that the counterparty will not be able to fulfill its obligation to a fund. Derivative counterparty credit risk is managed through formal evaluation of the creditworthiness of all potential counterparties. On certain OTC derivatives such as bi-lateral swaps, a fund attempts to reduce its exposure to counterparty credit risk by entering into an International Swaps and Derivatives Association, Inc. (ISDA) Master Agreement with each of its counterparties. The ISDA Master Agreement gives a fund the right to terminate all transactions traded under such agreement upon the deterioration in the credit quality of the counterparty beyond specified levels. The ISDA Master Agreement gives each party the right, upon an event of default by the other party or a termination of the agreement, to close out all transactions traded under such agreement and to net amounts owed under each transaction to one net payable by one party to the other. Upon entering into a swap, a fund is required to post an initial collateral amount (referred to as "Independent Amount"), as defined in the ISDA Master Agreement. A fund is required to post additional collateral for the benefit of counterparties to meet the counterparty's unrealized appreciation on outstanding swap contracts and any such posted collateral is identified on the Consolidated Schedule of Investments. To mitigate counterparty credit risk on bi-lateral OTC derivatives, a fund receives collateral in the form of cash or securities once net unrealized appreciation on outstanding derivative contracts under an ISDA Master Agreement exceeds certain applicable thresholds, subject to certain minimum transfer provisions. The collateral received is held in segregated accounts with the custodian bank in accordance with the collateral agreements entered into between a fund, the counterparty and the custodian bank. A fund could experience delays and costs in gaining access to the collateral even though it is held by the custodian bank. The maximum risk of loss to a fund from counterparty credit risk related to bi-lateral OTC derivatives is generally the aggregate unrealized appreciation and unpaid counterparty payments in excess of any collateral pledged by the counterparty to a fund. A fund may be required to pledge collateral for the benefit of the counterparties on bi-lateral OTC derivatives in an amount not less than each counterparty's unrealized appreciation on outstanding derivative contracts, subject to certain minimum transfer provisions, and any such pledged collateral is identified in the Consolidated Schedule of Investments. Exchange-traded futures contracts are not covered by the ISDA Master Agreement; however counterparty credit risk related to exchange-traded futures contracts may be mitigated by the protection provided by the exchange's clearinghouse. A summary of derivatives inclusive of potential netting arrangements is presented at the end of the Consolidated Schedule of Investments.
Investing in derivatives may involve greater risks than investing in the underlying assets directly and, to varying degrees, may involve risk of loss in excess of any initial investment and collateral received and amounts recognized in the Consolidated Statement of Assets and Liabilities. In addition, there may be the risk that the change in value of the derivative contract does not correspond to the change in value of the underlying instrument.
Net Realized Gain (Loss) and Change in Net Unrealized Appreciation (Depreciation) on Derivatives. The table below, which reflects the impacts of derivatives on the financial performance, summarizes the net realized gain (loss) and change in net unrealized appreciation (depreciation) for derivatives during the period as presented in the Consolidated Statement of Operations.
| Primary Risk Exposure / Derivative Type | Net Realized Gain (Loss)(S) | Change in Net Unrealized Appreciation (Depreciation)($) |
| Commodity Risk | | |
| Futures Contracts | 12,317,142 | (44,371,602) |
| Swaps | (75,300,545) | (103,798,645) |
| Total Commodity Risk | (62,983,403) | (148,170,247) |
A summary of the value of derivatives by primary risk exposure is included at the end of the Consolidated Schedule of Investments.
Futures Contracts. A futures contract is an agreement between two parties to buy or sell a specified underlying instrument for a fixed price at a specified future date. Futures contracts were used to manage exposure to the commodities market.
Upon entering into a futures contract, a fund is required to deposit either cash or securities (initial margin) with a clearing broker in an amount equal to a certain percentage of the face value of the contract. Futures contracts are marked-to-market daily and subsequent daily payments are made or received by a fund depending on the daily fluctuations in the value of the futures contracts and are recorded as unrealized appreciation or (depreciation). This receivable and/or payable, if any, is included in daily variation margin on futures contracts in the Consolidated Statement of Assets and Liabilities. Realized gain or (loss) is recorded upon the expiration or closing of a futures contract. The net realized gain (loss) and change in net unrealized appreciation (depreciation) on futures contracts during the period is presented in the Consolidated Statement of Operations.
Any open futures contracts at period end are presented in the Consolidated Schedule of Investments under the caption "Futures Contracts". The notional amount at value reflects each contract's exposure to the underlying instrument or index at period end. Any securities deposited to meet initial margin requirements are identified in the Consolidated Schedule of Investments. Any cash deposited to meet initial margin requirements is presented as segregated cash with brokers for derivative instruments in the Consolidated Statement of Assets and Liabilities.
Swaps. A swap is a contract between two parties to exchange future cash flows at periodic intervals based on a notional principal amount. A bi-lateral OTC swap is a transaction between a fund and a dealer counterparty where cash flows are exchanged between the two parties for the life of the swap. Once cleared, the clearinghouse serves as a central counterparty, with whom a fund exchanges cash flows for the life of the transaction, similar to transactions in futures contracts.
Bi-lateral OTC swaps are marked-to-market daily and changes in value are reflected in the Consolidated Statement of Assets and Liabilities in the bi-lateral OTC swaps at value line items. Any unamortized upfront premiums are presented in the Consolidated Schedule of Investments.
Payments are exchanged at specified intervals, accrued daily commencing with the effective date of the contract and recorded as realized gain or (loss). Some swaps may be terminated prior to the effective date and realize a gain or loss upon termination. The net realized gain (loss) and change in net unrealized appreciation (depreciation) on swaps during the period is presented in the Consolidated Statement of Operations.
Any open swaps at period end are included in the Consolidated Schedule of Investments under the caption "Swaps".
Total Return Swaps. Total return swaps are agreements between counterparties to exchange cash flows, one based on a market-linked return of an individual asset or a basket of assets (i.e., an index), and the other on a fixed or floating rate. To the extent the total return of the instrument or index underlying the transaction exceeds or falls short of the offsetting payment obligation, a fund will receive a payment from or make a payment to the counterparty. A fund enters into total return swaps to manage its market exposure.
6. Fees and Other Transactions with Affiliates.
Management Fee and Administration Agreement. Geode Capital Management, LLC (the investment adviser) provides the Fund with investment management related services for which the Fund does not pay a management fee. Under the management contract, the investment adviser pays all ordinary operating expenses of the Fund, except custody fees, fees and expenses of the independent Trustees, and certain miscellaneous expenses such as proxy and shareholder meeting expenses.
FMR provides administrative services to the Fund and the investment adviser pays for these services.
The investment adviser also provides investment management services to the Subsidiary. The Subsidiary does not pay the investment adviser a fee for these services. The Subsidiary pays certain other expenses including custody and directors' fees.
Interfund Trades. Funds may purchase from or sell securities to other Fidelity Funds under procedures adopted by the Board. The procedures have been designed to ensure these interfund trades are executed in accordance with Rule 17a-7 of the 1940 Act. During the period, there were no interfund trades.
7. Committed Line of Credit.
Certain Funds participate with other funds managed by FMR or an affiliate in a $4.25 billion credit facility (the "line of credit") to be utilized for temporary or emergency purposes to fund shareholder redemptions or for other short-term liquidity purposes. The commitment fees on the pro-rata portion of the line of credit are borne by the investment adviser. During the period, there were no borrowings on this line of credit.
8. Expense Reductions.
Through arrangements with the Fund's custodian, credits realized as a result of certain uninvested cash balances were used to reduce the Fund's expenses by $17.
9. Other.
A fund's organizational documents provide former and current trustees and officers with a limited indemnification against liabilities arising in connection with the performance of their duties to the fund. In the normal course of business, a fund may also enter into contracts that provide general indemnifications. A fund's maximum exposure under these arrangements is unknown as this would be dependent on future claims that may be made against a fund. The risk of material loss from such claims is considered remote.
At the end of the period, mutual funds and accounts managed by FMR or its affiliates were the owners of record of all of the outstanding shares of the Fund.
10. Risk and Uncertainties.
Many factors affect a fund's performance. Developments that disrupt global economies and financial markets, such as pandemics, epidemics, outbreaks of infectious diseases, war, terrorism, and environmental disasters, may significantly affect a fund's investment performance. The effects of these developments to a fund will be impacted by the types of securities in which a fund invests, the financial condition, industry, economic sector, and geographic location of an issuer, and a fund's level of investment in the securities of that issuer. Significant concentrations in security types, issuers, industries, sectors, and geographic locations may magnify the factors that affect a fund's performance.
Report of Independent Registered Public Accounting Firm
To the Board of Trustees of Fidelity Oxford Street Trust and Shareholders of Fidelity Series Commodity Strategy Fund
Opinion on the Financial Statements
We have audited the accompanying consolidated statement of assets and liabilities, including the consolidated schedule of investments, of Fidelity Series Commodity Strategy Fund and its subsidiary (one of the funds constituting Fidelity Oxford Street Trust, referred to hereafter as the "Fund") as of July 31, 2024, the related consolidated statement of operations for the year ended July 31, 2024, the consolidated statement of changes in net assets for each of the two years in the period ended July 31, 2024, including the related notes, and the consolidated financial highlights for each of the five years in the period ended July 31, 2024 (collectively referred to as the "consolidated financial statements"). In our opinion, the consolidated financial statements present fairly, in all material respects, the financial position of the Fund as of July 31, 2024, the results of its operations for the year then ended, the changes in its net assets for each of the two years in the period ended July 31, 2024 and the financial highlights for each of the five years in the period ended July 31, 2024 in conformity with accounting principles generally accepted in the United States of America.
Basis for Opinion
These consolidated financial statements are the responsibility of the Fund's management. Our responsibility is to express an opinion on the Fund's consolidated financial statements based on our audits. We are a public accounting firm registered with the Public Company Accounting Oversight Board (United States) (PCAOB) and are required to be independent with respect to the Fund in accordance with the U.S. federal securities laws and the applicable rules and regulations of the Securities and Exchange Commission and the PCAOB.
We conducted our audits of these consolidated financial statements in accordance with the standards of the PCAOB. Those standards require that we plan and perform the audit to obtain reasonable assurance about whether the consolidated financial statements are free of material misstatement, whether due to error or fraud.
Our audits included performing procedures to assess the risks of material misstatement of the consolidated financial statements, whether due to error or fraud, and performing procedures that respond to those risks. Such procedures included examining, on a test basis, evidence regarding the amounts and disclosures in the consolidated financial statements. Our audits also included evaluating the accounting principles used and significant estimates made by management, as well as evaluating the overall presentation of the consolidated financial statements. Our procedures included confirmation of securities owned as of July 31, 2024 by correspondence with the custodian and brokers; when replies were not received from brokers, we performed other auditing procedures. We believe that our audits provide a reasonable basis for our opinion.
/s/ PricewaterhouseCoopers LLP
Boston, Massachusetts
September 17, 2024
We have served as the auditor of one or more investment companies in the Fidelity group of funds since 1932.
Distributions
(Unaudited)
The dividend and capital gains distributions for the fund(s) are available on Fidelity.com or Institutional.Fidelity.com.
A total of 19.86% of the dividends distributed during the fiscal year was derived from interest on U.S. Government securities which is generally exempt from state income tax.
The fund designates $73,191,697 of distributions paid during the fiscal year ended 2024 as qualifying to be taxed as section 163(j) interest dividends.
The fund will notify shareholders in January 2025 of amounts for use in preparing 2024 income tax returns.
Item 8: Changes in and Disagreements with Accountants for Open-End Management Investment Companies
Note: This is not applicable for any fund included in this document.
Item 9: Proxy Disclosures for Open-End Management Investment Companies
| A special meeting of shareholders was held on October 18, 2023. The results of votes taken among shareholders on the proposal before them are reported below. Each vote reported represents one dollar of net asset value held on the record date for the meeting. |
| Proposal 1 |
| To elect a Board of Trustees. |
| | # of Votes | % of Votes |
| Abigail P. Johnson |
| Affirmative | 4,544,611,126.80 | 98.03 |
| Withheld | 91,192,086.11 | 1.97 |
| TOTAL | 4,635,803,212.91 | 100.00 |
| Jennifer Toolin McAuliffe |
| Affirmative | 4,535,410,229.89 | 97.83 |
| Withheld | 100,392,983.02 | 2.17 |
| TOTAL | 4,635,803,212.91 | 100.00 |
| Christine J. Thompson |
| Affirmative | 4,544,351,180.03 | 98.03 |
| Withheld | 91,452,032.88 | 1.97 |
| TOTAL | 4,635,803,212.91 | 100.00 |
| Elizabeth S. Acton |
| Affirmative | 4,535,006,791.00 | 97.83 |
| Withheld | 100,796,421.91 | 2.17 |
| TOTAL | 4,635,803,212.91 | 100.00 |
| Laura M. Bishop |
| Affirmative | 4,543,484,037.23 | 98.01 |
| Withheld | 92,319,175.68 | 1.99 |
| TOTAL | 4,635,803,212.91 | 100.00 |
| Ann E. Dunwoody |
| Affirmative | 4,541,959,864.61 | 97.98 |
| Withheld | 93,843,348.30 | 2.02 |
| TOTAL | 4,635,803,212.91 | 100.00 |
| John Engler |
| Affirmative | 4,523,457,866.32 | 97.58 |
| Withheld | 112,345,346.59 | 2.42 |
| TOTAL | 4,635,803,212.91 | 100.00 |
| Robert F. Gartland |
| Affirmative | 4,533,525,068.87 | 97.79 |
| Withheld | 102,278,144.04 | 2.21 |
| TOTAL | 4,635,803,212.91 | 100.00 |
| Robert W. Helm |
| Affirmative | 4,539,288,934.76 | 97.92 |
| Withheld | 96,514,278.15 | 2.08 |
| TOTAL | 4,635,803,212.91 | 100.00 |
| Arthur E. Johnson |
| Affirmative | 4,526,773,659.17 | 97.65 |
| Withheld | 109,029,553.74 | 2.35 |
| TOTAL | 4,635,803,212.91 | 100.00 |
| Michael E. Kenneally |
| Affirmative | 4,535,412,506.96 | 97.83 |
| Withheld | 100,390,705.95 | 2.17 |
| TOTAL | 4,635,803,212.91 | 100.00 |
| Mark A. Murray |
| Affirmative | 4,533,792,953.42 | 97.80 |
| Withheld | 102,010,259.49 | 2.20 |
| TOTAL | 4,635,803,212.91 | 100.00 |
| Carol J. Zierhoffer |
| Affirmative | 4,540,811,737.27 | 97.95 |
| Withheld | 94,991,475.64 | 2.05 |
| TOTAL | 4,635,803,212.91 | 100.00 |
| | | |
| Proposal 1 reflects trust-wide proposal and voting results. |
Item 10: Remuneration Paid to Directors, Officers, and others of Open-End Management Investment Companies
Note: This information is disclosed as part of the consolidated financial statements for each Fund as part of Item 7: Consolidated Financial Statements and Consolidated Financial Highlights for Open-End Management Investment companies.
Item 11: Statement Regarding Basis for Approval of Investment Advisory Contract
Note: This is not applicable for any fund included in this document.
1.899299.114
SCR-S-ANN-0924
Item 8.
Changes in and Disagreements with Accountants for Open-End Management Investment Companies
See Item 7.
Item 9.
Proxy Disclosures for Open-End Management Investment Companies
See Item 7.
Item 10.
Remuneration Paid to Directors, Officers, and Others of Open-End Management Investment Companies
See Item 7.
Item 11.
Statement Regarding Basis for Approval of Investment Advisory Contract
See Item 7.
Item 12.
Disclosure of Proxy Voting Policies and Procedures for Closed-End Management Investment Companies
Not applicable.
Item 13.
Portfolio Managers of Closed-End Management Investment Companies
Not applicable.
Item 14.
Purchase of Equity Securities by Closed-End Management Investment Company and Affiliated Purchasers
Not applicable.
Item 15.
Submission of Matters to a Vote of Security Holders
There were no material changes to the procedures by which shareholders may recommend nominees to the trust’s Board of Trustees.
Item 16.
Controls and Procedures
(a)(i) The President and Treasurer and the Chief Financial Officer have concluded that the trust’s disclosure controls and procedures (as defined in Rule 30a-3(c) under the Investment Company Act) provide reasonable assurances that material information relating to the trust is made known to them by the appropriate persons, based on their evaluation of these controls and procedures as of a date within 90 days of the filing date of this report.
(a)(ii) There was no change in the trust’s internal control over financial reporting (as defined in Rule 30a-3(d) under the Investment Company Act) that occurred during the period covered by this report that has materially affected, or is reasonably likely to materially affect, the trust’s internal control over financial reporting.
Item 17.
Disclosure of Securities Lending Activities for Closed-End Management Investment Companies
Not applicable.
Item 18.
Recovery of Erroneously Awarded Compensation
(a)
Not applicable.
(b)
Not applicable.
Item 19.
Exhibits
SIGNATURES
Pursuant to the requirements of the Securities Exchange Act of 1934 and the Investment Company Act of 1940, the registrant has duly caused this report to be signed on its behalf by the undersigned, thereunto duly authorized.
Fidelity Oxford Street Trust
|
By: | /s/Laura M. Del Prato |
| Laura M. Del Prato |
| President and Treasurer (Principal Executive Officer) |
|
|
Date: | September 20, 2024 |
Pursuant to the requirements of the Securities Exchange Act of 1934 and the Investment Company Act of 1940, this report has been signed below by the following persons on behalf of the registrant and in the capacities and on the dates indicated.
|
By: | /s/Laura M. Del Prato |
| Laura M. Del Prato |
| President and Treasurer (Principal Executive Officer) |
|
|
Date: | September 20, 2024 |
|
By: | /s/John J. Burke III |
| John J. Burke III |
| Chief Financial Officer (Principal Financial Officer) |
|
|
Date: | September 20, 2024 |