UNITED STATES
SECURITIES AND EXCHANGE COMMISSION
Washington, D.C. 20549
FORM N-CSR
CERTIFIED SHAREHOLDER REPORT OF REGISTERED
MANAGEMENT INVESTMENT COMPANIES
Investment Company Act file number 811-03480
Fidelity Oxford Street Trust
(Exact name of registrant as specified in charter)
245 Summer St., Boston, Massachusetts 02210
(Address of principal executive offices) (Zip code)
Marc Bryant, Secretary
245 Summer St.
Boston, Massachusetts 02210
(Name and address of agent for service)
Registrant's telephone number, including area code:
617-563-7000
| |
Date of fiscal year end: | July 31 |
| |
Date of reporting period: | July 31, 2017 |
Item 1.
Reports to Stockholders
Fidelity® Commodity Strategy Fund
Annual Report July 31, 2017 |
 |
Contents
To view a fund's proxy voting guidelines and proxy voting record for the 12-month period ended June 30, visit http://www.fidelity.com/proxyvotingresults or visit the Securities and Exchange Commission's (SEC) web site at http://www.sec.gov.
You may also call 1-800-544-8544 to request a free copy of the proxy voting guidelines.
Standard & Poor's, S&P and S&P 500 are registered service marks of The McGraw-Hill Companies, Inc. and have been licensed for use by Fidelity Distributors Corporation.
Other third-party marks appearing herein are the property of their respective owners.
All other marks appearing herein are registered or unregistered trademarks or service marks of FMR LLC or an affiliated company. © 2017 FMR LLC. All rights reserved.
This report and the financial statements contained herein are submitted for the general information of the shareholders of the Fund. This report is not authorized for distribution to prospective investors in the Fund unless preceded or accompanied by an effective prospectus.
A fund files its complete schedule of portfolio holdings with the SEC for the first and third quarters of each fiscal year on Form N-Q. Forms N-Q are available on the SEC’s web site at http://www.sec.gov. A fund's Forms N-Q may be reviewed and copied at the SEC’s Public Reference Room in Washington, DC. Information regarding the operation of the SEC's Public Reference Room may be obtained by calling 1-800-SEC-0330.
For a complete list of a fund's portfolio holdings, view the most recent holdings listing, semiannual report, or annual report on Fidelity's web site at http://www.fidelity.com, http://www.institutional.fidelity.com, or http://www.401k.com, as applicable.
NOT FDIC INSURED •MAY LOSE VALUE •NO BANK GUARANTEE
Neither the Fund nor Fidelity Distributors Corporation is a bank.
Consolidated Investment Summary (Unaudited)
The information in the following tables is based on the Fund's commodity-linked investments and excludes short-term investment-grade debt securities, cash and cash equivalents.
Commodity Instruments as of July 31, 2017*
| % of fund's total commodity-linked investments |
| | Commodity Swaps | 78.9% |
| | Commodity Futures | 21.1% |

Commodity Sector Diversification as of July 31, 2017*
| % of fund's total commodity-linked investments |
| | Agriculture | 30.5% |
| | Energy | 28.1% |
| | Industrial Metals | 19.1% |
| | Precious Metals | 16.3% |
| | Livestock | 6.0% |

* Investments in Commodity Swaps provide exposure to the commodities market via the Bloomberg Commodity Index Total Return, an unmanaged index composed of futures contracts on 22 physical commodities. The Fund does not invest directly in physical commodities.
Consolidated Investments July 31, 2017
Showing Percentage of Net Assets
| U.S. Treasury Obligations - 8.7% | | | |
| | | Principal Amount | Value |
| U.S. Treasury Bills, yield at date of purchase 0.94% 9/14/17(a)(b) | | | |
| (Cost $59,931,470) | | 60,000,000 | 59,928,480 |
| | | Shares | Value |
|
| Money Market Funds - 89.7% | | | |
| Fidelity Cash Central Fund, 1.11% (c) | | | |
| (Cost $617,529,402) | | 617,405,921 | 617,529,402 |
| TOTAL INVESTMENT PORTFOLIO - 98.4% | | | |
| (Cost $677,460,872) | | | 677,457,882 |
| NET OTHER ASSETS (LIABILITIES) - 1.6% | | | 10,926,085 |
| NET ASSETS - 100% | | | $688,383,967 |
| Futures Contracts | | | |
| | Expiration Date | Underlying Face Amount at Value | Unrealized Appreciation/(Depreciation) |
| Purchased | | | |
| Commodity Futures Contracts | | | |
| 600 CBOT Corn Contracts (United States) | Sept. 2017 | 11,122,500 | $(588,052) |
| 79 CBOT HRW Wheat Contracts (United States) | Sept. 2017 | 1,875,263 | 9,929 |
| 171 CBOT Soybean Contracts (United States) | Nov. 2017 | 8,611,988 | 564,718 |
| 135 CBOT Soybean Meal Contracts (United States) | Dec. 2017 | 4,392,900 | 221,836 |
| 195 CBOT Soybean Oil Contracts (United States) | Dec. 2017 | 4,110,210 | 326,313 |
| 227 CBOT Wheat Contracts (United States) | Sept. 2017 | 5,385,575 | 148,026 |
| 118 CME Lean Hogs Contracts (United States) | Oct. 2017 | 3,116,380 | (141,782) |
| 125 CME Live Cattle Contracts (United States) | Oct. 2017 | 5,597,500 | (227,012) |
| 173 COMEX Copper Contracts (United States) | Sept. 2017 | 12,512,225 | 1,188,244 |
| 138 COMEX Gold 100 oz. Contracts (United States) | Dec. 2017 | 17,612,940 | 701,679 |
| 72 COMEX Silver Contracts (United States) | Sept. 2017 | 6,057,000 | (145,870) |
| 198 ICE Brent Crude Contracts (United Kingdom) | Sept. 2017 | 10,470,240 | 871,188 |
| 64 ICE Coffee 'C' Contracts (United States) | Sept. 2017 | 3,342,000 | 252,113 |
| 56 ICE Cotton No. 2 Contracts (United States) | Dec. 2017 | 1,928,080 | (95,757) |
| 213 ICE Sugar No. 11 Contracts (United States) | Oct. 2017 | 3,556,930 | 146,693 |
| 154 LME Aluminum Contracts (United Kingdom) | Sept. 2017 | 7,347,725 | 29,159 |
| 60 LME Nickel Contracts (United Kingdom) | Sept. 2017 | 3,669,300 | 478,575 |
| 59 LME Zinc Contracts (United Kingdom) | Sept. 2017 | 4,114,881 | 440,129 |
| 78 NYMEX Gasoline RBOB Contracts (United States) | Sept. 2017 | 5,489,266 | 650,412 |
| 352 NYMEX Natural Gas Contracts (United States) | August 2017 | 9,919,360 | (745,614) |
| 77 NYMEX NY Harbor ULSD Contracts (United States) | Sept. 2017 | 5,396,252 | 703,988 |
| 189 NYMEX WTI Crude Oil Contracts (United States) | August 2017 | 9,495,360 | 720,309 |
| TOTAL FUTURES CONTRACTS | | | $5,509,224 |
The face value of futures purchased as a percentage of Net Assets is 21.1%
For the period, the average monthly underlying face amount at value for futures contracts in the aggregate was $138,865,576.
Swaps
| Counterparty | Expiration Date | Notional Amount | Unrealized Appreciation/(Depreciation) |
| Total Return Swaps(1) | | | |
| CIBC | Aug. 2017 | $$95,000,000 | $1,444,929 |
| CIBC | Oct. 2017 | 10,000,000 | 190,048 |
| Citibank, N.A. | Sep. 2017 | 76,300,000 | 0 |
| Citibank, N.A. | Sep. 2017 | 5,000,000 | 95,024 |
| Goldman Sachs Bank USA | Oct. 2017 | 9,500,000 | 180,545 |
| Goldman Sachs Bank USA | Nov. 2017 | 63,800,000 | 1,994,617 |
| JPMorgan Chase Bank, N.A. | Nov. 2017 | 35,000,000 | 105,708 |
| Macquarie Bank Ltd. | Sep. 2017 | 30,000,000 | 570,906 |
| Merrill Lynch International | Oct. 2017 | 115,000,000 | 2,559,445 |
| Societe Generale | Aug. 2017 | 80,000,000 | 1,218,142 |
| Societe Generale | Oct. 2017 | 15,000,000 | 285,199 |
|
| TOTAL RETURN SWAPS | | | $8,644,563 |
|
(1) Each open total return swap is an agreement to receive the total return of the Bloomberg Commodity Index Total Return and pay a floating rate based on the 3-month US auction rate T-Bill plus a specified spread.
For the period, the average monthly notional amount for swaps in the aggregate was $511,366,667.
Legend
(a) Security or a portion of the security was pledged to cover margin requirements for futures contracts. At period end, the value of securities pledged amounted to $7,046,590.
(b) Security or a portion of the security has been segregated as collateral for open bi-lateral over-the-counter (OTC) swaps. At period end, the value of securities pledged amounted to $27,021,752.
(c) Affiliated fund that is generally available only to investment companies and other accounts managed by Fidelity Investments. The rate quoted is the annualized seven-day yield of the fund at period end. A complete unaudited listing of the fund's holdings as of its most recent quarter end is available upon request. In addition, each Fidelity Central Fund's financial statements, which are not covered by the Fund's Report of Independent Registered Public Accounting Firm, are available on the SEC's website or upon request.
Affiliated Central Funds
Information regarding fiscal year to date income earned by the Fund from investments in Fidelity Central Funds is as follows:
| Fund | Income earned |
| Fidelity Cash Central Fund | $1,014,019 |
| Total | $1,014,019 |
Consolidated Subsidiary
| | Value, beginning
of period | Purchases | Sales
Proceeds | Dividend
Income | Value, end
of period |
| Geode Commodity Strategy Cayman Ltd. | $-- | $100,000,000 | $-- | $-- | $110,645,081 |
Investment Valuation
The following is a summary of the inputs used, as of July 31, 2017, involving the Fund's assets and liabilities carried at fair value. The inputs or methodology used for valuing securities may not be an indication of the risk associated with investing in those securities. For more information on valuation inputs, and their aggregation into the levels used below, please refer to the Investment Valuation section in the accompanying Notes to Consolidated Financial Statements.
| | Valuation Inputs at Reporting Date: |
| Description | Total | Level 1 | Level 2 | Level 3 |
| Investments in Securities: | | | | |
| U.S. Government and Government Agency Obligations | $59,928,480 | $-- | $59,928,480 | $-- |
| Money Market Funds | 617,529,402 | 617,529,402 | -- | -- |
| Total Investments in Securities: | $677,457,882 | $617,529,402 | $59,928,480 | $-- |
| Derivative Instruments: | | | | |
| Assets | | | | |
| Futures Contracts | $7,453,311 | $7,453,311 | $-- | $-- |
| Swaps | 8,644,563 | -- | 8,644,563 | -- |
| Total Assets | $16,097,874 | $7,453,311 | $8,644,563 | $-- |
| Liabilities | | | | |
| Futures Contracts | $(1,944,087) | $(1,944,087) | $-- | $-- |
| Total Liabilities | $(1,944,087) | $(1,944,087) | $-- | $-- |
| Total Derivative Instruments: | $14,153,787 | $5,509,224 | $8,644,563 | $-- |
Value of Derivative Instruments
The following table is a summary of the Fund's value of derivative instruments by primary risk exposure as of July 31, 2017. For additional information on derivative instruments, please refer to the Derivative Instruments section in the accompanying Notes to Consolidated Financial Statements.
| Primary Risk Exposure / Derivative Type | Value |
| | Asset | Liability |
| Commodity Risk | | |
| Futures Contracts(a) | $7,453,311 | $(1,944,087) |
| Swaps(b) | 8,644,563 | 0 |
| Total Commodity Risk | $16,097,874 | $(1,944,087) |
(a) Reflects gross cumulative appreciation (depreciation) on futures contracts as presented in the Consolidated Schedule of Investments. In the Consolidated Statement of Assets and Liabilities, the period end daily variation margin is included in receivable or payable for daily variation margin for derivative instruments, and the net cumulative appreciation (depreciation) is included in net unrealized appreciation (depreciation).
(b) For bi-lateral over-the-counter (OTC) swaps, reflects gross value which is presented in the Consolidated Statement of Assets and Liabilities in the bi-lateral OTC swaps, at value line-items.
The following table is a summary of the Fund's derivatives inclusive of potential netting arrangements.
| Counterparty | Value of Derivative Assets | Value of Derivative Liabilities | Collateral Received(a) | Collateral Pledged(a) | Net(b) |
| Merrill Lynch International | $2,559,445 | $-- | $-- | $-- | $2,559,445 |
| Goldman Sachs Bank USA | 2,175,162 | -- | -- | -- | 2,175,162 |
| CIBC | 1,634,977 | -- | -- | -- | 1,634,977 |
| Societe Generale | 1,503,341 | -- | -- | -- | 1,503,341 |
| Macquarie Bank Ltd. | 570,906 | -- | -- | -- | 570,906 |
| JPMorgan Chase Bank, N.A. | 105,708 | -- | -- | -- | 105,708 |
| Citibank, N.A. | 95,024 | -- | -- | -- | 95,024 |
| Exchange Traded Futures | 7,453,311 | (1,944,087) | -- | -- | 5,509,224 |
| Total | $16,097,874 | $(1,944,087) | | | |
(a) Reflects collateral received from or pledged to an individual counterparty, excluding any excess or initial collateral amounts.
(b) Net represents the receivable / (payable) that would be due from / (to) the counterparty in an event of default. Netting may be allowed across transactions traded under the same legal agreement with the same legal entity. Please refer to Derivative Instruments - Risk Exposures and the Use of Derivative Instruments section in the accompanying Notes to Consolidated Financial Statements.
See accompanying notes which are an integral part of the consolidated financial statements.
Consolidated Financial Statements
Consolidated Statement of Assets and Liabilities
| | | July 31, 2017 |
| Assets | | |
Investment in securities, at value — See accompanying schedule:
Unaffiliated issuers (cost $59,931,470) | $59,928,480 | |
| Fidelity Central Funds (cost $617,529,402) | 617,529,402 | |
| Total Investments (cost $677,460,872) | | $677,457,882 |
| Cash | | 423,010 |
| Receivable for investments sold | | 1,056,288 |
| Receivable for fund shares sold | | 74,278 |
| Distributions receivable from Fidelity Central Funds | | 571,489 |
| Receivable for daily variation margin for derivative instruments | | 884,891 |
| Bi-lateral OTC swaps, at value | | 8,644,563 |
| Total assets | | 689,112,401 |
| Liabilities | | |
| Payable for fund shares redeemed | $433,059 | |
| Accrued management fee | 225,427 | |
| Transfer agent fees payable | 69,645 | |
| Other payables and accrued expenses | 303 | |
| Total liabilities | | 728,434 |
| Net Assets | | $688,383,967 |
| Net Assets consist of: | | |
| Paid in capital | | $677,295,676 |
| Undistributed net investment income | | 534,865 |
| Accumulated undistributed net realized gain (loss) on investments | | (3,597,371) |
| Net unrealized appreciation (depreciation) on investments | | 14,150,797 |
| Net Assets | | $688,383,967 |
| Commodity Strategy: | | |
| Net Asset Value, offering price and redemption price per share ($422,999,114 ÷ 41,661,755 shares) | | $10.15 |
| Class F: | | |
| Net Asset Value, offering price and redemption price per share ($265,384,853 ÷ 26,129,084 shares) | | $10.16 |
See accompanying notes which are an integral part of the consolidated financial statements.
Consolidated Statement of Operations
| | | For the period
May 30, 2017 (commencement of operations) to
July 31, 2017 |
| Investment Income | | |
| Interest | | $96,565 |
| Income from Fidelity Central Funds | | 1,014,019 |
| Total income | | 1,110,584 |
| Expenses | | |
| Management fee | $477,576 | |
| Transfer agent fees | 129,680 | |
| Custodian fees and expenses | 303 | |
| Independent trustees' fees and expenses | 270 | |
| Subsidiary directors' fees | 15,000 | |
| Total expenses before reductions | 622,829 | |
| Expense reductions | (47,110) | 575,719 |
| Net investment income (loss) | | 534,865 |
| Realized and Unrealized Gain (Loss) | | |
| Net realized gain (loss) on: | | |
| Investment securities: | | |
| Unaffiliated issuers | (63) | |
| Futures contracts | (3,269,017) | |
| Swaps | (328,291) | |
| Total net realized gain (loss) | | (3,597,371) |
| Change in net unrealized appreciation (depreciation) on: | | |
| Investment securities | (2,990) | |
| Futures contracts | 5,509,224 | |
| Swaps | 8,644,563 | |
| Total change in net unrealized appreciation (depreciation) | | 14,150,797 |
| Net gain (loss) | | 10,553,426 |
| Net increase (decrease) in net assets resulting from operations | | $11,088,291 |
See accompanying notes which are an integral part of the consolidated financial statements.
Consolidated Statement of Changes in Net Assets
| | For the period
May 30, 2017 (commencement of operations) to
July 31, 2017 |
| Increase (Decrease) in Net Assets | |
| Operations | |
| Net investment income (loss) | $534,865 |
| Net realized gain (loss) | (3,597,371) |
| Change in net unrealized appreciation (depreciation) | 14,150,797 |
| Net increase (decrease) in net assets resulting from operations | 11,088,291 |
| Share transactions - net increase (decrease) | 677,295,676 |
| Total increase (decrease) in net assets | 688,383,967 |
| Net Assets | |
| Beginning of period | – |
| End of period | $688,383,967 |
| Other Information | |
| Undistributed net investment income end of period | $534,865 |
See accompanying notes which are an integral part of the consolidated financial statements.
Consolidated Financial Highlights — Fidelity Commodity Strategy Fund
| Years ended July 31, | 2017 A |
| Selected Per–Share Data | |
| Net asset value, beginning of period | $10.00 |
| Income from Investment Operations | |
| Net investment income (loss)B | .01 |
| Net realized and unrealized gain (loss) | .14 |
| Total from investment operations | .15 |
| Net asset value, end of period | $10.15 |
| Total ReturnC,D | 1.50% |
| Ratios to Average Net AssetsE,F | |
| Expenses before reductions | .65%G |
| Expenses net of fee waivers, if any | .60%G |
| Expenses net of all reductions | .60%G |
| Net investment income (loss) | .44%G |
| Supplemental Data | |
| Net assets, end of period (000 omitted) | $422,999 |
| Portfolio turnover rateH | 0% |
A For the period May 30, 2017 (commencement of operations) to July 31, 2017.
B Calculated based on average shares outstanding during the period.
C Total returns for periods of less than one year are not annualized.
D Total returns would have been lower if certain expenses had not been reduced during the applicable periods shown.
E Fees and expenses of any underlying Fidelity Central Funds are not included in the Fund's expense ratio. The Fund indirectly bears its proportionate share of the expenses of any underlying Fidelity Central Funds.
F Expense ratios reflect operating expenses of the class. Expenses before reductions do not reflect amounts reimbursed by the investment adviser or reductions from expense offset arrangements and do not represent the amount paid by the class during periods when reimbursements or reductions occur. Expense ratios before reductions for start-up periods may not be representative of longer-term operating periods. Expenses net of fee waivers reflect expenses after reimbursement by the investment adviser but prior to reductions from expense offset arrangements. Expenses net of all reductions represent the net expenses paid by the class.
G Annualized
H Amount does not include the portfolio activity of any underlying Fidelity Central Funds.
See accompanying notes which are an integral part of the consolidated financial statements.
Consolidated Financial Highlights — Fidelity Commodity Strategy Fund Class F
| Years ended July 31, | 2017 A |
| Selected Per–Share Data | |
| Net asset value, beginning of period | $10.00 |
| Income from Investment Operations | |
| Net investment income (loss)B | .01 |
| Net realized and unrealized gain (loss) | .15 |
| Total from investment operations | .16 |
| Net asset value, end of period | $10.16 |
| Total ReturnC,D | 1.60% |
| Ratios to Average Net AssetsE,F | |
| Expenses before reductions | .45%G |
| Expenses net of fee waivers, if any | .40%G |
| Expenses net of all reductions | .40%G |
| Net investment income (loss) | .65%G |
| Supplemental Data | |
| Net assets, end of period (000 omitted) | $265,385 |
| Portfolio turnover rateH | 0% |
A For the period May 30, 2017 (commencement of operations) to July 31, 2017.
B Calculated based on average shares outstanding during the period.
C Total returns for periods of less than one year are not annualized.
D Total returns would have been lower if certain expenses had not been reduced during the applicable periods shown.
E Fees and expenses of any underlying Fidelity Central Funds are not included in the Fund's expense ratio. The Fund indirectly bears its proportionate share of the expenses of any underlying Fidelity Central Funds.
F Expense ratios reflect operating expenses of the class. Expenses before reductions do not reflect amounts reimbursed by the investment adviser or reductions from expense offset arrangements and do not represent the amount paid by the class during periods when reimbursements or reductions occur. Expense ratios before reductions for start-up periods may not be representative of longer-term operating periods. Expenses net of fee waivers reflect expenses after reimbursement by the investment adviser but prior to reductions from expense offset arrangements. Expenses net of all reductions represent the net expenses paid by the class.
G Annualized
H Amount does not include the portfolio activity of any underlying Fidelity Central Funds.
See accompanying notes which are an integral part of the consolidated financial statements.
Notes to Consolidated Financial Statements
For the period ended July 31, 2017
1. Organization.
Fidelity Commodity Strategy Fund (the Fund) is a non-diversified fund of Fidelity Oxford Street Trust (the Trust) and is authorized to issue an unlimited number of shares. Shares of the Fund are only available for purchase by mutual funds and accounts for which Fidelity Management & Research Company (FMR) or an affiliate serves as an investment manager. The Trust is registered under the Investment Company Act of 1940, as amended (the 1940 Act), as an open-end management investment company organized as a Massachusetts business trust. The Fund offers Commodity Strategy and Class F shares, each of which has equal rights as to assets and voting privileges. Each class has exclusive voting rights with respect to matters that affect that class.
2. Consolidated Subsidiary.
The Fund invests in certain commodity-related investments through Geode Commodity Strategy Cayman Ltd., a wholly owned subsidiary (the "Subsidiary"). As of period end, the Fund held an investment of $110,645,081 in the Subsidiary, representing 16.1% of the Fund's net assets.
The financial statements have been consolidated and include accounts of the Fund and the Subsidiary. Accordingly, all inter-company transactions and balances have been eliminated.
3. Investments in Fidelity Central Funds.
The Fund invests in Fidelity Central Funds, which are open-end investment companies generally available only to other investment companies and accounts managed by the investment adviser and its affiliates. The Fund's Consolidated Schedule of Investments lists each of the Fidelity Central Funds held as of period end, if any, as an investment of the Fund, but does not include the underlying holdings of each Fidelity Central Fund. As an Investing Fund, the Fund indirectly bears its proportionate share of the expenses of the underlying Fidelity Central Funds.
The Money Market Central Funds seek preservation of capital and current income and are managed by Fidelity Investments Money Management, Inc. (FIMM), an affiliate of the investment adviser. Annualized expenses of the Money Market Central Funds as of their most recent shareholder report date are less than .005%.
A complete unaudited list of holdings for each Fidelity Central Fund is available upon request or at the Securities and Exchange Commission (the SEC) website at www.sec.gov. In addition, the financial statements of the Fidelity Central Funds, which are not covered by the Fund's Report of Independent Registered Public Accounting Firm, are available on the SEC website or upon request.
4. Significant Accounting Policies.
The Fund is an investment company and applies the accounting and reporting guidance of the Financial Accounting Standards Board (FASB) Accounting Standards Codification Topic 946 Financial Services – Investments Companies. The consolidated financial statements have been prepared in conformity with accounting principles generally accepted in the United States of America (GAAP), which require management to make certain estimates and assumptions at the date of the consolidated financial statements. Actual results could differ from those estimates. Subsequent events, if any, through the date that the consolidated financial statements were issued have been evaluated in the preparation of the consolidated financial statements. The following summarizes the significant accounting policies of the Fund:
Investment Valuation. Investments are valued as of 4:00 p.m. Eastern time on the last calendar day of the period. The Board of Trustees (the Board) has delegated the day to day responsibility for the valuation of the Fund's investments to the Fair Value Committee (the Committee) established by the Fund's investment adviser. In accordance with valuation policies and procedures approved by the Board, the Fund attempts to obtain prices from one or more third party pricing vendors or brokers to value its investments. When current market prices, quotations or currency exchange rates are not readily available or reliable, investments will be fair valued in good faith by the Committee, in accordance with procedures adopted by the Board. Factors used in determining fair value vary by investment type and may include market or investment specific events, changes in interest rates and credit quality. The frequency with which these procedures are used cannot be predicted and they may be utilized to a significant extent. The Committee oversees the Fund's valuation policies and procedures and reports to the Board on the Committee's activities and fair value determinations. The Board monitors the appropriateness of the procedures used in valuing the Fund's investments and ratifies the fair value determinations of the Committee.
The Fund categorizes the inputs to valuation techniques used to value its investments into a disclosure hierarchy consisting of three levels as shown below:
- Level 1 – quoted prices in active markets for identical investments
- Level 2 – other significant observable inputs (including quoted prices for similar investments, interest rates, prepayment speeds, etc.)
- Level 3 – unobservable inputs (including the Fund's own assumptions based on the best information available)
Valuation techniques used to value the Fund's investments by major category are as follows:
Debt securities, including restricted securities, are valued based on evaluated prices received from third party pricing vendors or from brokers who make markets in such securities. U.S. government and government agency obligations are valued by pricing vendors who utilize matrix pricing which considers yield or price of bonds of comparable quality, coupon, maturity and type or by broker-supplied prices. Swaps are marked-to-market daily based on valuations from third party pricing vendors, registered derivatives clearing organizations (clearinghouses) or broker-supplied valuations. These pricing sources may utilize inputs such as movements in the underlying index, interest rate curves, credit spread curves, default possibilities and recovery rates. When independent prices are unavailable or unreliable, debt securities and swaps may be valued utilizing pricing methodologies which consider similar factors that would be used by third party pricing vendors. Debt securities and swaps are generally categorized as Level 2 in the hierarchy but may be Level 3 depending on the circumstances.
Futures contracts are valued at the settlement price or official closing price established each day by the board of trade or exchange on which they are traded and are categorized as Level 1 in the hierarchy. Investments in open-end mutual funds, including the Fidelity Central Funds, are valued at their closing net asset value (NAV) each business day and are categorized as Level 1 in the hierarchy.
Changes in valuation techniques may result in transfers in or out of an assigned level within the disclosure hierarchy. The aggregate value of investments by input level as of July 31, 2017 is included at the end of the Fund's Consolidated Schedule of Investments.
Investment Transactions and Income. For financial reporting purposes, the Fund's investment holdings and NAV include trades executed through the end of the last business day of the period. The NAV per share for processing shareholder transactions is calculated as of the close of business of the New York Stock Exchange (NYSE), normally 4:00 p.m. Eastern time and includes trades executed through the end of the prior business day. Gains and losses on securities sold are determined on the basis of identified cost. Income and capital gain distributions from Fidelity Central Funds, if any, are recorded on the ex-dividend date. Interest income is accrued as earned and includes coupon interest and amortization of premium and accretion of discount on debt securities as applicable. Investment income is recorded net of foreign taxes withheld where recovery of such taxes is uncertain.
Class Allocations and Expenses. Investment income, realized and unrealized capital gains and losses, common expenses of the Fund, and certain fund-level expense reductions, if any, are allocated daily on a pro-rata basis to each class based on the relative net assets of each class to the total net assets of the Fund. Each class differs with respect to transfer agent fees incurred. Certain expense reductions may also differ by class. For the reporting period, the allocated portion of income and expenses to each class as a percent of its average net assets may vary due to the timing of recording these transactions in relation to fluctuating net assets of the classes. Expenses directly attributable to a fund are charged to that fund. Expenses attributable to more than one fund are allocated among the respective funds on the basis of relative net assets or other appropriate methods. Expense estimates are accrued in the period to which they relate and adjustments are made when actual amounts are known.
Income Tax Information and Distributions to Shareholders. Each year, the Fund intends to qualify as a regulated investment company under Subchapter M of the Internal Revenue Code, including distributing substantially all of its taxable income and realized gains. As a result, no provision for U.S. Federal income taxes is required. As of July 31, 2017, the Fund did not have any unrecognized tax benefits in the consolidated financial statements; nor is the Fund aware of any tax positions for which it is reasonably possible that the total amounts of unrecognized tax benefits will significantly change in the next twelve months. The Fund files a U.S. federal tax return, in addition to state and local tax returns as required. The Fund's federal income tax returns are subject to examination by the Internal Revenue Service (IRS) for a period of three fiscal years after they are filed. State and local tax returns may be subject to examination for an additional fiscal year depending on the jurisdiction.
The Subsidiary is classified as a controlled foreign corporation under Subchapter N of the Internal Revenue Code. Therefore, the Fund is required to increase its taxable income by its share of the Subsidiary's income. Net investment losses of the Subsidiary cannot be deducted by the Fund in the current period nor carried forward to offset taxable income in future periods.
Distributions are declared and recorded on the ex-dividend date. Income dividends and capital gain distributions are declared separately for each class. Income and capital gain distributions are determined in accordance with income tax regulations, which may differ from GAAP.
Capital accounts within the consolidated financial statements are adjusted for permanent book-tax differences. These adjustments have no impact on net assets or the results of operations. Capital accounts are not adjusted for temporary book-tax differences which will reverse in a subsequent period.
Book-tax differences are primarily due to controlled foreign corporations.
The federal tax cost of investment securities and unrealized appreciation (depreciation) as of period end on an unconsolidated basis were as follows:
| Gross unrealized appreciation | $9,686,002 |
| Gross unrealized depreciation | – |
| Net unrealized appreciation (depreciation) on securities | $9,686,002 |
| Tax Cost | $678,791,496 |
The tax-based components of distributable earnings as of period end were as follows:
| Undistributed ordinary income | $1,402,289 |
| Net unrealized appreciation (depreciation) on securities and other investments | $23,839,789 |
5. Derivative Instruments.
Risk Exposures and the Use of Derivative Instruments. The Fund's investment objective allows the Fund to enter into various types of derivative contracts, including futures contracts and swaps. Derivatives are investments whose value is primarily derived from underlying assets, indices or reference rates and may be transacted on an exchange or over-the-counter (OTC). Derivatives may involve a future commitment to buy or sell a specified asset based on specified terms, to exchange future cash flows at periodic intervals based on a notional principal amount, or for one party to make one or more payments upon the occurrence of specified events in exchange for periodic payments from the other party.
The Fund primarily used derivatives to increase returns, to gain exposure to certain types of assets and to manage exposure to certain risks as defined below. The success of any strategy involving derivatives depends on analysis of numerous economic factors, and if the strategies for investment do not work as intended, the Fund may not achieve its objectives.
The Fund's use of derivatives increased or decreased its exposure to the following risk:
| Commodity Risk | Commodity risk is the risk that the value of a commodity will fluctuate as a result of changes in market prices.
|
The Fund is also exposed to additional risks from investing in derivatives, such as liquidity risk and counterparty credit risk. Liquidity risk is the risk that the Fund will be unable to close out the derivative in the open market in a timely manner. Counterparty credit risk is the risk that the counterparty will not be able to fulfill its obligation to the Fund. Derivative counterparty credit risk is managed through formal evaluation of the creditworthiness of all potential counterparties. On certain OTC derivatives such as bi-lateral swaps, the Fund attempts to reduce its exposure to counterparty credit risk by entering into an International Swaps and Derivatives Association, Inc. (ISDA) Master Agreement with each of its counterparties. The ISDA Master Agreement gives the Fund the right to terminate all transactions traded under such agreement upon the deterioration in the credit quality of the counterparty beyond specified levels. The ISDA Master Agreement gives each party the right, upon an event of default by the other party or a termination of the agreement, to close out all transactions traded under such agreement and to net amounts owed under each transaction to one net payable by one party to the other. Upon entering into a swap, the Fund is required to post an initial collateral amount (referred to as "Independent Amount"), as defined in the ISDA Master Agreement. The Fund is required to post additional collateral for the benefit of counterparties to meet the counterparty's unrealized appreciation on outstanding swap contracts and any such posted collateral is identified on the Consolidated Schedule of Investments. To mitigate counterparty credit risk on bi-lateral OTC derivatives, the Fund receives collateral in the form of cash or securities once the Fund's net unrealized appreciation on outstanding derivative contracts under an ISDA Master Agreement exceeds certain applicable thresholds, subject to certain minimum transfer provisions. The collateral received is held in segregated accounts with the Fund's custodian bank in accordance with the collateral agreements entered into between the Fund, the counterparty and the Fund's custodian bank. The Fund could experience delays and costs in gaining access to the collateral even though it is held by the Fund's custodian bank. The Fund's maximum risk of loss from counterparty credit risk related to bi-lateral OTC derivatives is generally the aggregate unrealized appreciation and unpaid counterparty payments in excess of any collateral pledged by the counterparty to the Fund. Exchange-traded futures contracts are not covered by the ISDA Master Agreement; however counterparty credit risk related to exchange-traded futures contracts may be mitigated by the protection provided by the exchange's clearinghouse. A summary of the Fund's derivatives inclusive of potential netting arrangements is presented at the end of the Consolidated Schedule of Investments.
Investing in derivatives may involve greater risks than investing in the underlying assets directly and, to varying degrees, may involve risk of loss in excess of any initial investment and collateral received and amounts recognized in the Consolidated Statement of Assets and Liabilities. In addition, there may be the risk that the change in value of the derivative contract does not correspond to the change in value of the underlying instrument.
Net Realized Gain (Loss) and Change in Net Unrealized Appreciation (Depreciation) on Derivatives. The table below, which reflects the impacts of derivatives on the financial performance of the Fund, summarizes the net realized gain (loss) and change in net unrealized appreciation (depreciation) for derivatives during the period as presented in the Consolidated Statement of Operations.
| Primary Risk Exposure / Derivative Type | Net Realized Gain (Loss) | Change in Net Unrealized Appreciation (Depreciation) |
| Commodity Risk | | |
| Futures Contracts | $(3,269,017) | $5,509,224 |
| Swaps | (328,291) | 8,644,563 |
| Total Commodity Risk | $(3,597,308) | $14,153,787 |
A summary of the value of derivatives by primary risk exposure as of period end is included at the end of the Consolidated Schedule of Investments.
Futures Contracts. A futures contract is an agreement between two parties to buy or sell a specified underlying instrument for a fixed price at a specified future date. The Fund used futures contracts to manage its exposure to the commodities market.
Upon entering into a futures contract, a fund is required to deposit either cash or securities (initial margin) with a clearing broker in an amount equal to a certain percentage of the face value of the contract. Futures contracts are marked-to-market daily and subsequent daily payments are made or received by a fund depending on the daily fluctuations in the value of the futures contracts and are recorded as unrealized appreciation or (depreciation). This receivable and/or payable, if any, is included in daily variation margin for derivative instruments in the Consolidated Statement of Assets and Liabilities. Realized gain or (loss) is recorded upon the expiration or closing of a futures contract. The net realized gain (loss) and change in net unrealized appreciation (depreciation) on futures contracts during the period is included in the Consolidated Statement of Operations.
Any open futures contracts at period end are presented in the Consolidated Schedule of Investments under the caption "Futures Contracts". The underlying face amount at value reflects each contract's exposure to the underlying instrument or index at period end. Securities deposited to meet initial margin requirements are identified in the Consolidated Schedule of Investments.
Swaps. A swap is a contract between two parties to exchange future cash flows at periodic intervals based on a notional principal amount. A bi-lateral OTC swap is a transaction between a fund and a dealer counterparty where cash flows are exchanged between the two parties for the life of the swap.
Bi-lateral OTC swaps are marked-to-market daily and changes in value are reflected in the Consolidated Statement of Assets and Liabilities in the bi-lateral OTC swaps at value line items.
Payments are exchanged at specified intervals, accrued daily commencing with the effective date of the contract and recorded as realized gain or (loss). Some swaps may be terminated prior to the effective date and realize a gain or loss upon termination. The net realized gain (loss) and change in net unrealized appreciation (depreciation) on swaps during the period is included in the Consolidated Statement of Operations.
Any open swaps at period end are included in the Consolidated Schedule of Investments under the caption "Swaps".
Total Return Swaps. Total return swaps are agreements between counterparties to exchange cash flows, one based on a market-linked return of an individual asset or a basket of assets (i.e., an index), and the other on a fixed or floating rate. To the extent the total return of the instrument or index underlying the transaction exceeds or falls short of the offsetting payment obligation, the Fund will receive a payment from or make a payment to the counterparty. The Fund entered into total return swaps to manage its commodities market exposure.
6. Fees and Other Transactions with Affiliates.
Management Fee and Administration Agreement. Geode Capital Management, LLC (the investment adviser) provides the Fund with investment management services for which the Fund pays a monthly management fee that is based on an annual rate of .40% of the Fund's average net assets. Under the management contract, the investment adviser pays all other fund-level expenses, except the compensation of the independent Trustees and certain other expenses such as interest expense, including commitment fees.
FMR provides administrative services to the Fund and the investment adviser pays for these services.
The investment adviser also provides investment management services to the Subsidiary. The Subsidiary pays the investment adviser a monthly management fee at an annual rate of .30% of its net assets. The Subsidiary also pays certain other expenses including custody and directors' fees.
For the reporting period, the total consolidated annual management fee rate which includes the management fee of the Fund and the Subsidiary was .45% of the Fund's average net assets.
During the period, the investment adviser waived a portion of its management fee as described in the Expense Reductions note.
Transfer Agent Fees. Fidelity Investments Institutional Operations Company, Inc., (FIIOC), an affiliate of FMR, is the transfer, dividend disbursing and shareholder servicing agent for each class of the Fund. FIIOC receives an asset-based fee of Commodity Strategy's average net assets. FIIOC receives no fees for providing transfer agency services to Class F. FIIOC pays for typesetting, printing and mailing of shareholder reports, except proxy statements.
For the period, transfer agent fees for each applicable class were as follows:
| | Amount | % of
Class-Level Average
Net Assets(a) |
| Commodity Strategy | $129,680 | .20 |
(a) Annualized
Interfund Trades. The Fund may purchase from or sell securities to other Fidelity Funds under procedures adopted by the Board. The procedures have been designed to ensure these interfund trades are executed in accordance with Rule 17a-7 of the 1940 Act.
7. Expense Reductions.
The investment adviser has contractually agreed to waive the Fund's management fee in an amount equal to the management fee paid by the Subsidiary. During the period, this waiver reduced the Fund's management fee by $47,110.
8. Share Transactions.
Transactions for each class of shares were as follows:
| | Shares | Dollars |
| | Year ended
July 31, 2017(a) | Year ended
July 31, 2017 (a) |
| Commodity Strategy | | |
| Shares sold | 42,231,995 | $421,807,485 |
| Shares redeemed | (570,240) | (5,676,193) |
| Net increase (decrease) | 41,661,755 | $416,131,292 |
| Class F | | |
| Shares sold | 26,286,898 | $262,719,273 |
| Shares redeemed | (157,814) | (1,554,889) |
| Net increase (decrease) | 26,129,084 | $261,164,384 |
(a) For the period May 30, 2017 (commencement of operations) to July 31, 2017.
9. Other.
The Fund's organizational documents provide former and current trustees and officers with a limited indemnification against liabilities arising in connection with the performance of their duties to the Fund. In the normal course of business, the Fund may also enter into contracts that provide general indemnifications. The Fund's maximum exposure under these arrangements is unknown as this would be dependent on future claims that may be made against the Fund. The risk of material loss from such claims is considered remote.
At the end of the period, mutual funds and accounts managed by FMR or its affiliates were the owners of record of all of the outstanding shares of the Fund.
Report of Independent Registered Public Accounting Firm
To the Trustees of Fidelity Oxford Street Trust and Shareholders of Fidelity Commodity Strategy Fund:
In our opinion, the accompanying consolidated statement of assets and liabilities, including the consolidated investments, and the related consolidated statements of operations and of changes in net assets and the consolidated financial highlights present fairly, in all material respects, the consolidated financial position of Fidelity Commodity Strategy Fund (a fund of Fidelity Oxford Street Trust) (the "Fund") and its subsidiary as of July 31, 2017, the consolidated results of their operations for the period then ended, the changes in their net assets for the period then ended and the consolidated financial highlights for the period indicated, in conformity with accounting principles generally accepted in the United States of America. These financial statements and financial highlights (hereafter referred to as “financial statements”) are the responsibility of the Fund's management. Our responsibility is to express an opinion on these financial statements based on our audits. We conducted our audits of these financial statements in accordance with the standards of the Public Company Accounting Oversight Board (United States). Those standards require that we plan and perform the audit to obtain reasonable assurance about whether the financial statements are free of material misstatement. An audit includes examining, on a test basis, evidence supporting the amounts and disclosures in the financial statements, assessing the accounting principles used and significant estimates made by management, and evaluating the overall financial statement presentation. Our procedures included confirmation of securities owned as of July 31, 2017 by correspondence with the custodians and brokers; when replies were not received from brokers, we performed other auditing procedures. We believe that our audits provide a reasonable basis for our opinion.
PricewaterhouseCoopers LLP
Boston, Massachusetts
September 21, 2017
Trustees and Officers
The Trustees, Members of the Advisory Board (if any), and officers of the trust and fund, as applicable, are listed below. The Board of Trustees governs the fund and is responsible for protecting the interests of shareholders. The Trustees are experienced executives who meet periodically throughout the year to oversee the fund's activities, review contractual arrangements with companies that provide services to the fund, oversee management of the risks associated with such activities and contractual arrangements, and review the fund's performance. Each of the Trustees oversees 261 funds.
The Trustees hold office without limit in time except that (a) any Trustee may resign; (b) any Trustee may be removed by written instrument, signed by at least two-thirds of the number of Trustees prior to such removal; (c) any Trustee who requests to be retired or who has become incapacitated by illness or injury may be retired by written instrument signed by a majority of the other Trustees; and (d) any Trustee may be removed at any special meeting of shareholders by a two-thirds vote of the outstanding voting securities of the trust. Each Trustee who is not an interested person (as defined in the 1940 Act) of the trust and the fund is referred to herein as an Independent Trustee. Each Independent Trustee shall retire not later than the last day of the calendar year in which his or her 75th birthday occurs. The Independent Trustees may waive this mandatory retirement age policy with respect to individual Trustees. Officers and Advisory Board Members hold office without limit in time, except that any officer or Advisory Board Member may resign or may be removed by a vote of a majority of the Trustees at any regular meeting or any special meeting of the Trustees. Except as indicated, each individual has held the office shown or other offices in the same company for the past five years.
The fund’s Statement of Additional Information (SAI) includes more information about the Trustees. To request a free copy, call Fidelity at 1-800-544-8544.
Experience, Skills, Attributes, and Qualifications of the Trustees. The Governance and Nominating Committee has adopted a statement of policy that describes the experience, qualifications, attributes, and skills that are necessary and desirable for potential Independent Trustee candidates (Statement of Policy). The Board believes that each Trustee satisfied at the time he or she was initially elected or appointed a Trustee, and continues to satisfy, the standards contemplated by the Statement of Policy. The Governance and Nominating Committee also engages professional search firms to help identify potential Independent Trustee candidates who have the experience, qualifications, attributes, and skills consistent with the Statement of Policy. From time to time, additional criteria based on the composition and skills of the current Independent Trustees, as well as experience or skills that may be appropriate in light of future changes to board composition, business conditions, and regulatory or other developments, have also been considered by the professional search firms and the Governance and Nominating Committee. In addition, the Board takes into account the Trustees' commitment and participation in Board and committee meetings, as well as their leadership of standing and ad hoc committees throughout their tenure.
In determining that a particular Trustee was and continues to be qualified to serve as a Trustee, the Board has considered a variety of criteria, none of which, in isolation, was controlling. The Board believes that, collectively, the Trustees have balanced and diverse experience, qualifications, attributes, and skills, which allow the Board to operate effectively in governing the fund and protecting the interests of shareholders. Information about the specific experience, skills, attributes, and qualifications of each Trustee, which in each case led to the Board's conclusion that the Trustee should serve (or continue to serve) as a trustee of the fund, is provided below.
Board Structure and Oversight Function. Abigail P. Johnson is an interested person and currently serves as Chairman. The Trustees have determined that an interested Chairman is appropriate and benefits shareholders because an interested Chairman has a personal and professional stake in the quality and continuity of services provided to the fund. Independent Trustees exercise their informed business judgment to appoint an individual of their choosing to serve as Chairman, regardless of whether the Trustee happens to be independent or a member of management. The Independent Trustees have determined that they can act independently and effectively without having an Independent Trustee serve as Chairman and that a key structural component for assuring that they are in a position to do so is for the Independent Trustees to constitute a substantial majority for the Board. The Independent Trustees also regularly meet in executive session. Marie L. Knowles serves as Chairman of the Independent Trustees and as such (i) acts as a liaison between the Independent Trustees and management with respect to matters important to the Independent Trustees and (ii) with management prepares agendas for Board meetings.
Fidelity® funds are overseen by different Boards of Trustees. The fund's Board oversees Fidelity's investment-grade bond, money market, asset allocation and certain equity funds, and other Boards oversee Fidelity's high income, sector and other equity funds. The asset allocation funds may invest in Fidelity® funds that are overseen by such other Boards. The use of separate Boards, each with its own committee structure, allows the Trustees of each group of Fidelity® funds to focus on the unique issues of the funds they oversee, including common research, investment, and operational issues. On occasion, the separate Boards establish joint committees to address issues of overlapping consequences for the Fidelity® funds overseen by each Board.
The Trustees operate using a system of committees to facilitate the timely and efficient consideration of all matters of importance to the Trustees, the fund, and fund shareholders and to facilitate compliance with legal and regulatory requirements and oversight of the fund's activities and associated risks. The Board, acting through its committees, has charged the adviser and FMR and its affiliates with (i) identifying events or circumstances the occurrence of which could have demonstrably adverse effects on the fund's business and/or reputation; (ii) implementing processes and controls to lessen the possibility that such events or circumstances occur or to mitigate the effects of such events or circumstances if they do occur; and (iii) creating and maintaining a system designed to evaluate continuously business and market conditions in order to facilitate the identification and implementation processes described in (i) and (ii) above. Because the day-to-day operations and activities of the fund are carried out by or through the adviser, FMR and its affiliates, and other service providers, the fund's exposure to risks is mitigated but not eliminated by the processes overseen by the Trustees. While each of the Board's committees has responsibility for overseeing different aspects of the fund's activities, oversight is exercised primarily through the Operations and Audit Committees. In addition, an ad hoc Board committee of Independent Trustees has worked with FMR to enhance the Board's oversight of investment and financial risks, legal and regulatory risks, technology risks, and operational risks, including the development of additional risk reporting to the Board. Appropriate personnel, including but not limited to the fund's Chief Compliance Officer (CCO), FMR's internal auditor, the independent accountants, the fund's Treasurer and portfolio management personnel, make periodic reports to the Board's committees, as appropriate, including an annual review of Fidelity's risk management program for the Fidelity® funds. The responsibilities of each standing committee, including their oversight responsibilities, are described further under "Standing Committees of the Trustees."
Interested Trustees*:
Correspondence intended for a Trustee who is an interested person may be sent to Fidelity Investments, 245 Summer Street, Boston, Massachusetts 02210.
Name, Year of Birth; Principal Occupations and Other Relevant Experience+
Abigail P. Johnson (1961)
Year of Election or Appointment: 2009
Trustee
Chairman of the Board of Trustees
Ms. Johnson also serves as Trustee of other Fidelity® funds. Ms. Johnson serves as Chairman (2016-present), Chief Executive Officer (2014-present), and Director (2007-present) of FMR LLC (diversified financial services company), President of Fidelity Financial Services (2012-present) and President of Personal, Workplace and Institutional Services (2005-present). Ms. Johnson is Chairman and Director of FMR Co., Inc. (investment adviser firm, 2011-present) and Chairman and Director of FMR (investment adviser firm, 2011-present). Previously, Ms. Johnson served as Vice Chairman (2007-2016) and President (2013-2016) of FMR LLC, President and a Director of FMR (2001-2005), a Trustee of other investment companies advised by FMR, Fidelity Investments Money Management, Inc. (investment adviser firm), and FMR Co., Inc. (2001-2005), Senior Vice President of the Fidelity® funds (2001-2005), and managed a number of Fidelity® funds. Ms. Abigail P. Johnson and Mr. Arthur E. Johnson are not related.
Jennifer Toolin McAuliffe (1959)
Year of Election or Appointment: 2016
Trustee
Ms. McAuliffe also serves as Trustee of other Fidelity® funds. Ms. McAuliffe previously served as a Member of the Advisory Board of certain Fidelity® funds (2016) and as Co-Head of Fixed Income of Fidelity Investments Limited (now known as FIL Limited (FIL)) (diversified financial services company). Earlier roles at FIL included Director of Research for FIL’s credit and quantitative teams in London, Hong Kong and Tokyo. Ms. McAuliffe also was the Director of Research for taxable and municipal bonds at Fidelity Investments Money Management, Inc. Ms. McAuliffe is also a director or trustee of several not-for-profit entities.
* Determined to be an “Interested Trustee” by virtue of, among other things, his or her affiliation with the trust or various entities under common control with FMR.
+ The information includes the Trustee's principal occupation during the last five years and other information relating to the experience, attributes, and skills relevant to the Trustee's qualifications to serve as a Trustee, which led to the conclusion that the Trustee should serve as a Trustee for the fund.
Independent Trustees:
Correspondence intended for an Independent Trustee may be sent to Fidelity Investments, P.O. Box 55235, Boston, Massachusetts 02205-5235.
Name, Year of Birth; Principal Occupations and Other Relevant Experience+
Elizabeth S. Acton (1951)
Year of Election or Appointment: 2013
Trustee
Ms. Acton also serves as Trustee of other Fidelity® funds. Prior to her retirement in April 2012, Ms. Acton was Executive Vice President, Finance (2011-2012), Executive Vice President, Chief Financial Officer (2002-2011), and Treasurer (2004-2005) of Comerica Incorporated (financial services). Prior to joining Comerica, Ms. Acton held a variety of positions at Ford Motor Company (1983-2002), including Vice President and Treasurer (2000-2002) and Executive Vice President and Chief Financial Officer of Ford Motor Credit Company (1998-2000). Ms. Acton currently serves as a member of the Board of Directors and Audit and Finance Committees of Beazer Homes USA, Inc. (homebuilding, 2012-present). Previously, Ms. Acton served as a Member of the Advisory Board of certain Fidelity® funds (2013-2016).
John Engler (1948)
Year of Election or Appointment: 2014
Trustee
Mr. Engler also serves as Trustee of other Fidelity® funds. He serves on the board of directors for Universal Forest Products (manufacturer and distributor of wood and wood-alternative products, 2003-present) and K12 Inc. (technology-based education company, 2012-present). Previously, Mr. Engler served as a Member of the Advisory Board of certain Fidelity® funds (2014-2016), president of the Business Roundtable (2011-2017), a trustee of The Munder Funds (2003-2014), president and CEO of the National Association of Manufacturers (2004-2011), member of the Board of Trustees of the Annie E. Casey Foundation (2004-2015), and as governor of Michigan (1991-2003). He is a past chairman of the National Governors Association.
Albert R. Gamper, Jr. (1942)
Year of Election or Appointment: 2006
Trustee
Mr. Gamper also serves as Trustee of other Fidelity® funds. Prior to his retirement in December 2004, Mr. Gamper served as Chairman of the Board of CIT Group Inc. (commercial finance). During his tenure with CIT Group Inc. Mr. Gamper served in numerous senior management positions, including Chairman (1987-1989; 1999-2001; 2002-2004), Chief Executive Officer (1987-2004), and President (2002-2003). Mr. Gamper currently serves as a member of the Board of Directors of Public Service Enterprise Group (utilities, 2000-present), and Member of the Board of Trustees of Barnabas Health Care System (1997-present). Previously, Mr. Gamper served as Chairman (2012-2015) and Vice Chairman (2011-2012) of the Independent Trustees of certain Fidelity® funds and as Chairman of the Board of Governors, Rutgers University (2004-2007).
Robert F. Gartland (1951)
Year of Election or Appointment: 2010
Trustee
Mr. Gartland also serves as Trustee of other Fidelity® funds. Mr. Gartland is Chairman and an investor in Gartland & Mellina Group Corp. (consulting, 2009-present). Previously, Mr. Gartland served as a partner and investor of Vietnam Partners LLC (investments and consulting, 2008-2011). Prior to his retirement, Mr. Gartland held a variety of positions at Morgan Stanley (financial services, 1979-2007) including Managing Director (1987-2007).
Arthur E. Johnson (1947)
Year of Election or Appointment: 2008
Trustee
Vice Chairman of the Independent Trustees
Mr. Johnson also serves as Trustee of other Fidelity® funds. Mr. Johnson serves as a member of the Board of Directors of Eaton Corporation plc (diversified power management, 2009-present) and Booz Allen Hamilton (management consulting, 2011-present). Prior to his retirement, Mr. Johnson served as Senior Vice President of Corporate Strategic Development of Lockheed Martin Corporation (defense contractor, 1999-2009). He previously served on the Board of Directors of IKON Office Solutions, Inc. (1999-2008), AGL Resources, Inc. (holding company, 2002-2016), and Delta Airlines (2005-2007). Mr. Arthur E. Johnson is not related to Ms. Abigail P. Johnson.
Michael E. Kenneally (1954)
Year of Election or Appointment: 2009
Trustee
Mr. Kenneally also serves as Trustee of other Fidelity® funds. Prior to his retirement, Mr. Kenneally served as Chairman and Global Chief Executive Officer of Credit Suisse Asset Management. Before joining Credit Suisse, he was an Executive Vice President and Chief Investment Officer for Bank of America Corporation. Earlier roles at Bank of America included Director of Research, Senior Portfolio Manager and Research Analyst, and Mr. Kenneally was awarded the Chartered Financial Analyst (CFA) designation in 1991.
Marie L. Knowles (1946)
Year of Election or Appointment: 2001
Trustee
Chairman of the Independent Trustees
Ms. Knowles also serves as Trustee of other Fidelity® funds. Prior to Ms. Knowles' retirement in June 2000, she served as Executive Vice President and Chief Financial Officer of Atlantic Richfield Company (ARCO) (diversified energy, 1996-2000). From 1993 to 1996, she was a Senior Vice President of ARCO and President of ARCO Transportation Company (pipeline and tanker operations). Ms. Knowles currently serves as a Director and Chairman of the Audit Committee of McKesson Corporation (healthcare service, since 2002). Ms. Knowles is a member of the Board of the Santa Catalina Island Company (real estate, 2009-present). Ms. Knowles is a Member of the Investment Company Institute Board of Governors and a Member of the Governing Council of the Independent Directors Council (2014-present). She also serves as a member of the Advisory Board for the School of Engineering of the University of Southern California. Previously, Ms. Knowles served as a Director of Phelps Dodge Corporation (copper mining and manufacturing, 1994-2007), URS Corporation (engineering and construction, 2000-2003) and America West (airline, 1999-2002). Ms. Knowles previously served as Vice Chairman of the Independent Trustees of certain Fidelity® funds (2012-2015).
Mark A. Murray (1954)
Year of Election or Appointment: 2016
Trustee
Mr. Murray also serves as Trustee of other Fidelity® funds. Mr. Murray is Vice Chairman (2013-present) of Meijer, Inc. (regional retail chain). Previously, Mr. Murray served as a Member of the Advisory Board of certain Fidelity® funds (2016) and as Co-Chief Executive Officer (2013-2016) and President (2006-2013) of Meijer, Inc. Mr. Murray serves as a member of the Board of Directors and Nuclear Review and Public Policy and Responsibility Committees of DTE Energy Company (diversified energy company, 2009-present). Mr. Murray also serves as a member of the Board of Directors of Spectrum Health (not-for-profit health system, 2015-present). Mr. Murray previously served as President of Grand Valley State University (2001-2006), Treasurer for the State of Michigan (1999-2001), Vice President of Finance and Administration for Michigan State University (1998-1999), and a member of the Board of Directors and Audit Committee and Chairman of the Nominating and Corporate Governance Committee of Universal Forest Products, Inc. (manufacturer and distributor of wood and wood-alternative products, 2004-2016). Mr. Murray is also a director or trustee of many community and professional organizations.
+ The information includes the Trustee's principal occupation during the last five years and other information relating to the experience, attributes, and skills relevant to the Trustee's qualifications to serve as a Trustee, which led to the conclusion that the Trustee should serve as a Trustee for the fund.
Advisory Board Members and Officers:
Correspondence intended for an officer may be sent to Fidelity Investments, 245 Summer Street, Boston, Massachusetts 02210. Officers appear below in alphabetical order.
Name, Year of Birth; Principal Occupation
Elizabeth Paige Baumann (1968)
Year of Election or Appointment: 2017
Anti-Money Laundering (AML) Officer
Ms. Baumann also serves as AML Officer of other funds. She is Chief AML Officer (2012-present) and Senior Vice President (2014-present) of FMR LLC (diversified financial services company) and is an employee of Fidelity Investments. Previously, Ms. Baumann served as AML Officer of the funds (2012-2016), and Vice President (2007-2014) and Deputy Anti-Money Laundering Officer (2007-2012) of FMR LLC.
Marc R. Bryant (1966)
Year of Election or Appointment: 2015
Secretary and Chief Legal Officer (CLO)
Mr. Bryant also serves as Secretary and CLO of other funds. Mr. Bryant serves as CLO, Secretary, and Senior Vice President of Fidelity Management & Research Company (investment adviser firm, 2015-present) and FMR Co., Inc. (investment adviser firm, 2015-present); Secretary of Fidelity SelectCo, LLC (investment adviser firm, 2015-present) and Fidelity Investments Money Management, Inc. (investment adviser firm, 2015-present); and CLO of Fidelity Management & Research (Hong Kong) Limited and FMR Investment Management (UK) Limited (investment adviser firms, 2015-present) and Fidelity Management & Research (Japan) Limited (investment adviser firm, 2016-present). He is Senior Vice President and Deputy General Counsel of FMR LLC (diversified financial services company). Previously, Mr. Bryant served as Secretary and CLO of Fidelity Rutland Square Trust II (2010-2014) and Assistant Secretary of Fidelity's Fixed Income and Asset Allocation Funds (2013-2015). Prior to joining Fidelity Investments, Mr. Bryant served as a Senior Vice President and the Head of Global Retail Legal for AllianceBernstein L.P. (2006-2010), and as the General Counsel for ProFund Advisors LLC (2001-2006).
Jonathan Davis (1968)
Year of Election or Appointment: 2010
Assistant Treasurer
Mr. Davis also serves as Assistant Treasurer of other funds, and is an employee of Fidelity Investments. Previously, Mr. Davis served as Vice President and Associate General Counsel of FMR LLC (diversified financial services company, 2003-2010).
Adrien E. Deberghes (1967)
Year of Election or Appointment: 2010
Assistant Treasurer
Mr. Deberghes also serves as an officer of other funds. He serves as Executive Vice President of Fidelity Investments Money Management, Inc. (FIMM) (investment adviser firm, 2016-present) and is an employee of Fidelity Investments (2008-present). Prior to joining Fidelity Investments, Mr. Deberghes was Senior Vice President of Mutual Fund Administration at State Street Corporation (2007-2008), Senior Director of Mutual Fund Administration at Investors Bank & Trust (2005-2007), and Director of Finance for Dunkin' Brands (2000-2005). Previously, Mr. Deberghes served in other fund officer roles.
Stephanie J. Dorsey (1969)
Year of Election or Appointment: 2013
President and Treasurer
Ms. Dorsey also serves as an officer of other funds. She is an employee of Fidelity Investments (2008-present) and has served in other fund officer roles. Prior to joining Fidelity Investments, Ms. Dorsey served as Treasurer (2004-2008) of the JPMorgan Mutual Funds and Vice President (2004-2008) of JPMorgan Chase Bank.
Howard J. Galligan III (1966)
Year of Election or Appointment: 2014
Chief Financial Officer
Mr. Galligan also serves as Chief Financial Officer of other funds. Mr. Galligan serves as President of Fidelity Pricing and Cash Management Services (FPCMS) (2014-present) and as a Director of Strategic Advisers, Inc. (investment adviser firm, 2008-present). Previously, Mr. Galligan served as Chief Administrative Officer of Asset Management (2011-2014) and Chief Operating Officer and Senior Vice President of Investment Support for Strategic Advisers, Inc. (2003-2011).
Colm A. Hogan (1973)
Year of Election or Appointment: 2016
Assistant Treasurer
Mr. Hogan also serves as an officer of other funds. Mr. Hogan is an employee of Fidelity Investments (2005-present).
Chris Maher (1972)
Year of Election or Appointment: 2013
Assistant Treasurer
Mr. Maher serves as Assistant Treasurer of other funds. Mr. Maher is Vice President of Valuation Oversight and is an employee of Fidelity Investments. Previously, Mr. Maher served as Vice President of Asset Management Compliance (2013), Vice President of the Program Management Group of FMR (investment adviser firm, 2010-2013), and Vice President of Valuation Oversight (2008-2010).
John B. McGinty, Jr. (1962)
Year of Election or Appointment: 2016
Chief Compliance Officer
Mr. McGinty also serves as Chief Compliance Officer of other funds. Mr. McGinty is Senior Vice President of Asset Management Compliance for Fidelity Investments and is an employee of Fidelity Investments (2016-present). Mr. McGinty previously served as Vice President, Senior Attorney at Eaton Vance Management (investment management firm, 2015-2016), and prior to Eaton Vance as global CCO for all firm operations and registered investment companies at GMO LLC (investment management firm, 2009-2015). Before joining GMO LLC, Mr. McGinty served as Senior Vice President, Deputy General Counsel for Fidelity Investments (2007-2009).
Rieco E. Mello (1969)
Year of Election or Appointment: 2017
Assistant Treasurer
Mr. Mello also serves as Assistant Treasurer of other funds. Mr. Mello is an employee of Fidelity Investments (1995-present).
Jason P. Pogorelec (1975)
Year of Election or Appointment: 2015
Assistant Secretary
Mr. Pogorelec also serves as Assistant Secretary of other funds. Mr. Pogorelec serves as Vice President, Associate General Counsel (2010-present) and is an employee of Fidelity Investments (2006-present).
Stacie M. Smith (1974)
Year of Election or Appointment: 2013
Assistant Treasurer
Ms. Smith also serves as an officer of other funds. She is an employee of Fidelity Investments (2009-present) and has served in other fund officer roles. Prior to joining Fidelity Investments, Ms. Smith served as Senior Audit Manager of Ernst & Young LLP (accounting firm, 1996-2009). Previously, Ms. Smith served as Deputy Treasurer of certain Fidelity® funds (2013-2016).
Marc L. Spector (1972)
Year of Election or Appointment: 2016
Deputy Treasurer
Mr. Spector also serves as an officer of other funds. Mr. Spector is an employee of Fidelity Investments (2016-present). Prior to joining Fidelity Investments, Mr. Spector served as Director at the Siegfried Group (accounting firm, 2013-2016), and prior to Siegfried Group as audit senior manager at Deloitte & Touche (accounting firm, 2005-2013).
Renee Stagnone (1975)
Year of Election or Appointment: 2016
Assistant Treasurer
Ms. Stagnone also serves as an officer of other funds. Ms. Stagnone is an employee of Fidelity Investments (1997-present). Previously, Ms. Stagnone served as Deputy Treasurer of certain Fidelity® funds (2013-2016).
Shareholder Expense Example
As a shareholder of the Fund, you incur two types of costs: (1) transaction costs and (2) ongoing costs, including management fees and other Fund expenses. This Example is intended to help you understand your ongoing costs (in dollars) of investing in the Fund and to compare these costs with the ongoing costs of investing in other mutual funds.
The actual expense Example is based on an investment of $1,000 invested at the beginning of the period and held for the entire period (May 30, 2017 to July 31, 2017). The hypothetical expense Example is based on an investment of $1,000 invested for the one-half year period (February 1, 2017 to July 31, 2017).
Actual Expenses
The first line of the accompanying table for each class of the Fund provides information about actual account values and actual expenses. You may use the information in this line, together with the amount you invested, to estimate the expenses that you paid over the period. Simply divide your account value by $1,000.00 (for example, an $8,600 account value divided by $1,000.00 = 8.6), then multiply the result by the number in the first line for a class of the Fund under the heading entitled "Expenses Paid During Period" to estimate the expenses you paid on your account during this period. In addition, the Fund, as a shareholder in the underlying Fidelity Central Funds, will indirectly bear its pro-rata share of the fees and expenses incurred by the underlying Fidelity Central Funds. These fees and expenses are not included in the Fund's annualized expense ratio used to calculate the expense estimate in the table below.
Hypothetical Example for Comparison Purposes
The second line of the accompanying table for each class of the Fund provides information about hypothetical account values and hypothetical expenses based on a Class' actual expense ratio and an assumed rate of return of 5% per year before expenses, which is not the Class' actual return. The hypothetical account values and expenses may not be used to estimate the actual ending account balance or expenses you paid for the period. You may use this information to compare the ongoing costs of investing in the Fund and other funds. To do so, compare this 5% hypothetical example with the 5% hypothetical examples that appear in the shareholder reports of the other funds. In addition, the Fund, as a shareholder in the underlying Fidelity Central Funds, will indirectly bear its pro-rata share of the fees and expenses incurred by the underlying Fidelity Central Funds. These fees and expenses are not included in the Fund's annualized expense ratio used to calculate the expense estimate in the table below.
Please note that the expenses shown in the table are meant to highlight your ongoing costs only and do not reflect any transaction costs. Therefore, the second line of the table is useful in comparing ongoing costs only, and will not help you determine the relative total costs of owning different funds.
| | Annualized Expense Ratio-A | Beginning
Account Value | Ending
Account Value
July 31, 2017 | Expenses Paid
During Period |
| Commodity Strategy | .60% | | | |
| Actual | | $1,000.00 | $1,015.00 | $1.04-B |
| Hypothetical-C | | $1,000.00 | $1,021.82 | $3.01-D |
| Class F | .40% | | | |
| Actual | | $1,000.00 | $1,016.00 | $.70-B |
| Hypothetical-C | | $1,000.00 | $1,022.81 | $2.01-D |
A Annualized expense ratio reflects consolidated expenses net of applicable fee waivers.
B Actual expenses are equal to each Class' annualized expense ratio, multiplied by the average account value over the period, multiplied by 63/365 (to reflect the period May 30, 2017 to July 31, 2017).
C 5% return per year before expenses
D Hypothetical expenses are equal to each Class' annualized expense ratio, multiplied by the average account value over the period, multiplied by 181/365 (to reflect the one-half year period).
Distributions (Unaudited)
The Board of Trustees of Fidelity Commodity Strategy Fund voted to pay to shareholders of record at the opening of business on record date, the following distributions per share derived from capital gains realized from sales of portfolio securities, and dividends derived from net investment income:
| | Pay Date | Record Date | Dividends | Capital Gains |
| Fidelity Commodity Strategy Fund | | | | |
| Commodity Strategy | 09/18/17 | 09/15/17 | $0.007 | $0.015 |
| Class F | 09/18/17 | 09/15/17 | $0.010 | $0.015 |
|
Board Approval of Investment Advisory Contracts and Management Fees
On September 15, 2016, the Board of Trustees, including the Independent Trustees (together, the Board), voted to approve the management contract with Geode Capital Management, LLC (Geode) (the Advisory Contract) and the administration agreement with Fidelity Management & Research Company for the fund. The Board, assisted by the advice of fund counsel and Independent Trustees' counsel, considered a broad range of information.
Nature, Extent, and Quality of Services Provided. The Board considered staffing as it relates to the fund, including the backgrounds of investment personnel of Geode, and also considered the fund's investment objective, strategies, and related investment philosophy. The Board also considered that, although the fund is a new fund, Fidelity has utilized Geode as a sub-adviser for other products and is familiar with Geode's management abilities with respect to a fund that pursues an identical investment strategy.
Resources Dedicated to Investment Management and Support Services. The Board reviewed the general qualifications and capabilities of Geode's investment staff, including their size, education, experience, and resources, as well as Geode's approach to recruiting, training, managing, and compensating investment personnel. The Board noted that Geode's analysts have extensive resources, tools and capabilities that allow them to conduct sophisticated quantitative and fundamental analysis, as well as credit analysis of issuers, counterparties and guarantors. Further, the Board considered that Geode's investment professionals have sufficient access to information and data so as to provide competitive investment results over time, and that those professionals also have access to sophisticated tools that permit them to assess portfolio construction and risk and performance attribution characteristics continuously. The Board also noted the extensive resources devoted by Fidelity to providing non-advisory services to the fund. Additionally, in its deliberations, the Board considered Geode's trading, risk management compliance, and technology and operations capabilities and resources, which are integral parts of the investment management process.
Shareholder and Administrative Services. The Board considered (i) the nature, extent, quality, and cost of advisory services performed by Geode under the Advisory Contract and administrative and shareholder services performed by Fidelity under separate agreements covering administration, transfer agency, pricing and bookkeeping, and securities lending services for the fund; (ii) the nature and extent of the supervision of third party service providers, principally custodians, subcustodians, and pricing vendors; and (iii) the resources devoted to, and the record of compliance with, the fund's compliance policies and procedures.
The Board noted that the growth of fund assets over time across the complex allows Fidelity to reinvest in the development of services designed to enhance the value or convenience of the Fidelity funds as investment vehicles. These services include 24-hour access to account information and market information through telephone representatives and over the Internet, investor education materials and asset allocation tools, and the expanded availability of Fidelity Investor Centers.
Investment Performance. The fund is a new fund and therefore had no historical performance for the Board to review at the time it approved the fund's Advisory Contract. The Board considered the Investment Advisers' strength in fundamental, research-driven security selection, which the Board is familiar with through its supervision of other Fidelity funds.
Based on its review, the Board concluded that the nature, extent, and quality of services to be provided to the fund under the Advisory Contract should benefit the shareholders of the fund.
Competitiveness of Management Fee and Total Expense Ratio. The Board considered the fund's proposed management fee out of which Geode will pay all "fund-level" expenses, with certain limited exceptions, and the projected total expense ratio of each class of the fund in reviewing the Advisory Contract. The Board noted that the fund's proposed management fee rate is higher than the median fee rate of funds in its Lipper peer group. The Board considered that, unlike most other funds in this peer group, which track performance of broad based equity stock indexes, the fund will track the performance of a more specialized index, and that its proposed management fee is higher because of its specialized commodity-linked derivative strategy. The Board also considered that the projected total expense ratio of each class of the fund is above the median for those funds and classes used by the Board for management fee comparisons that have a similar sales load structure.
Based on its review, the Board concluded that the fund's management fee and the projected total expense ratio of each class of the fund were reasonable in light of the services that the fund and its shareholders will receive and the other factors considered.
Costs of the Services and Profitability. The fund is a new fund and therefore no revenue, cost, or profitability data was available for the Board to review in respect of the fund at the time it approved the Advisory Contract. In connection with its future renewal of the fund's Advisory Contract, the Board will consider the revenues earned and the expenses incurred by Geode and Fidelity in conducting the business of developing, marketing, distributing, managing, administering and servicing the fund and servicing the fund's shareholders.
Economies of Scale. The Board will consider economies of scale when there is operating experience to permit assessment thereof. It noted that, notwithstanding the entrepreneurial risk associated with a new fund, the management fee was at a level normally associated, by comparison with competitors, with very high fund net assets, and Fidelity asserted to the Board that the level of the fee anticipated economies of scale at lower asset levels even before, if ever, economies of scale are achieved. The Board also noted that the fund and its shareholders would have access to the very considerable number and variety of services available through Fidelity and its affiliates.
Based on its evaluation of all of the conclusions noted above, and after considering all factors it believed relevant, the Board concluded that the advisory fee structures are fair and reasonable, and that the fund's Advisory Contract should be approved.

Corporate Headquarters
245 Summer St.
Boston, MA 02210
www.fidelity.com
CSZ-ANN-0917
1.9879552.100
Fidelity® Commodity Strategy Fund Class F
Annual Report July 31, 2017 |
|
Contents
To view a fund's proxy voting guidelines and proxy voting record for the 12-month period ended June 30, visit http://www.fidelity.com/proxyvotingresults or visit the Securities and Exchange Commission's (SEC) web site at http://www.sec.gov.
You may also call 1-800-835-5092 to request a free copy of the proxy voting guidelines.
Standard & Poor's, S&P and S&P 500 are registered service marks of The McGraw-Hill Companies, Inc. and have been licensed for use by Fidelity Distributors Corporation.
Other third-party marks appearing herein are the property of their respective owners.
All other marks appearing herein are registered or unregistered trademarks or service marks of FMR LLC or an affiliated company. © 2017 FMR LLC. All rights reserved.
This report and the financial statements contained herein are submitted for the general information of the shareholders of the Fund. This report is not authorized for distribution to prospective investors in the Fund unless preceded or accompanied by an effective prospectus.
A fund files its complete schedule of portfolio holdings with the SEC for the first and third quarters of each fiscal year on Form N-Q. Forms N-Q are available on the SEC’s web site at http://www.sec.gov. A fund's Forms N-Q may be reviewed and copied at the SEC’s Public Reference Room in Washington, DC. Information regarding the operation of the SEC's Public Reference Room may be obtained by calling 1-800-SEC-0330.
For a complete list of a fund's portfolio holdings, view the most recent holdings listing, semiannual report, or annual report on Fidelity's web site at http://www.fidelity.com, http://www.institutional.fidelity.com, or http://www.401k.com, as applicable.
NOT FDIC INSURED •MAY LOSE VALUE •NO BANK GUARANTEE
Neither the Fund nor Fidelity Distributors Corporation is a bank.
Consolidated Investment Summary (Unaudited)
The information in the following tables is based on the Fund's commodity-linked investments and excludes short-term investment-grade debt securities, cash and cash equivalents.
Commodity Instruments as of July 31, 2017*
| % of fund's total commodity-linked investments |
| | Commodity Swaps | 78.9% |
| | Commodity Futures | 21.1% |

Commodity Sector Diversification as of July 31, 2017*
| % of fund's total commodity-linked investments |
| | Agriculture | 30.5% |
| | Energy | 28.1% |
| | Industrial Metals | 19.1% |
| | Precious Metals | 16.3% |
| | Livestock | 6.0% |

* Investments in Commodity Swaps provide exposure to the commodities market via the Bloomberg Commodity Index Total Return, an unmanaged index composed of futures contracts on 22 physical commodities. The Fund does not invest directly in physical commodities.
Consolidated Investments July 31, 2017
Showing Percentage of Net Assets
| U.S. Treasury Obligations - 8.7% | | | |
| | | Principal Amount | Value |
| U.S. Treasury Bills, yield at date of purchase 0.94% 9/14/17(a)(b) | | | |
| (Cost $59,931,470) | | 60,000,000 | 59,928,480 |
| | | Shares | Value |
|
| Money Market Funds - 89.7% | | | |
| Fidelity Cash Central Fund, 1.11% (c) | | | |
| (Cost $617,529,402) | | 617,405,921 | 617,529,402 |
| TOTAL INVESTMENT PORTFOLIO - 98.4% | | | |
| (Cost $677,460,872) | | | 677,457,882 |
| NET OTHER ASSETS (LIABILITIES) - 1.6% | | | 10,926,085 |
| NET ASSETS - 100% | | | $688,383,967 |
| Futures Contracts | | | |
| | Expiration Date | Underlying Face Amount at Value | Unrealized Appreciation/(Depreciation) |
| Purchased | | | |
| Commodity Futures Contracts | | | |
| 600 CBOT Corn Contracts (United States) | Sept. 2017 | 11,122,500 | $(588,052) |
| 79 CBOT HRW Wheat Contracts (United States) | Sept. 2017 | 1,875,263 | 9,929 |
| 171 CBOT Soybean Contracts (United States) | Nov. 2017 | 8,611,988 | 564,718 |
| 135 CBOT Soybean Meal Contracts (United States) | Dec. 2017 | 4,392,900 | 221,836 |
| 195 CBOT Soybean Oil Contracts (United States) | Dec. 2017 | 4,110,210 | 326,313 |
| 227 CBOT Wheat Contracts (United States) | Sept. 2017 | 5,385,575 | 148,026 |
| 118 CME Lean Hogs Contracts (United States) | Oct. 2017 | 3,116,380 | (141,782) |
| 125 CME Live Cattle Contracts (United States) | Oct. 2017 | 5,597,500 | (227,012) |
| 173 COMEX Copper Contracts (United States) | Sept. 2017 | 12,512,225 | 1,188,244 |
| 138 COMEX Gold 100 oz. Contracts (United States) | Dec. 2017 | 17,612,940 | 701,679 |
| 72 COMEX Silver Contracts (United States) | Sept. 2017 | 6,057,000 | (145,870) |
| 198 ICE Brent Crude Contracts (United Kingdom) | Sept. 2017 | 10,470,240 | 871,188 |
| 64 ICE Coffee 'C' Contracts (United States) | Sept. 2017 | 3,342,000 | 252,113 |
| 56 ICE Cotton No. 2 Contracts (United States) | Dec. 2017 | 1,928,080 | (95,757) |
| 213 ICE Sugar No. 11 Contracts (United States) | Oct. 2017 | 3,556,930 | 146,693 |
| 154 LME Aluminum Contracts (United Kingdom) | Sept. 2017 | 7,347,725 | 29,159 |
| 60 LME Nickel Contracts (United Kingdom) | Sept. 2017 | 3,669,300 | 478,575 |
| 59 LME Zinc Contracts (United Kingdom) | Sept. 2017 | 4,114,881 | 440,129 |
| 78 NYMEX Gasoline RBOB Contracts (United States) | Sept. 2017 | 5,489,266 | 650,412 |
| 352 NYMEX Natural Gas Contracts (United States) | August 2017 | 9,919,360 | (745,614) |
| 77 NYMEX NY Harbor ULSD Contracts (United States) | Sept. 2017 | 5,396,252 | 703,988 |
| 189 NYMEX WTI Crude Oil Contracts (United States) | August 2017 | 9,495,360 | 720,309 |
| TOTAL FUTURES CONTRACTS | | | $5,509,224 |
The face value of futures purchased as a percentage of Net Assets is 21.1%
For the period, the average monthly underlying face amount at value for futures contracts in the aggregate was $138,865,576.
Swaps
| Counterparty | Expiration Date | Notional Amount | Unrealized Appreciation/(Depreciation) |
| Total Return Swaps(1) | | | |
| CIBC | Aug. 2017 | $$95,000,000 | $1,444,929 |
| CIBC | Oct. 2017 | 10,000,000 | 190,048 |
| Citibank, N.A. | Sep. 2017 | 76,300,000 | 0 |
| Citibank, N.A. | Sep. 2017 | 5,000,000 | 95,024 |
| Goldman Sachs Bank USA | Oct. 2017 | 9,500,000 | 180,545 |
| Goldman Sachs Bank USA | Nov. 2017 | 63,800,000 | 1,994,617 |
| JPMorgan Chase Bank, N.A. | Nov. 2017 | 35,000,000 | 105,708 |
| Macquarie Bank Ltd. | Sep. 2017 | 30,000,000 | 570,906 |
| Merrill Lynch International | Oct. 2017 | 115,000,000 | 2,559,445 |
| Societe Generale | Aug. 2017 | 80,000,000 | 1,218,142 |
| Societe Generale | Oct. 2017 | 15,000,000 | 285,199 |
|
| TOTAL RETURN SWAPS | | | $8,644,563 |
|
(1) Each open total return swap is an agreement to receive the total return of the Bloomberg Commodity Index Total Return and pay a floating rate based on the 3-month US auction rate T-Bill plus a specified spread.
For the period, the average monthly notional amount for swaps in the aggregate was $511,366,667.
Legend
(a) Security or a portion of the security was pledged to cover margin requirements for futures contracts. At period end, the value of securities pledged amounted to $7,046,590.
(b) Security or a portion of the security has been segregated as collateral for open bi-lateral over-the-counter (OTC) swaps. At period end, the value of securities pledged amounted to $27,021,752.
(c) Affiliated fund that is generally available only to investment companies and other accounts managed by Fidelity Investments. The rate quoted is the annualized seven-day yield of the fund at period end. A complete unaudited listing of the fund's holdings as of its most recent quarter end is available upon request. In addition, each Fidelity Central Fund's financial statements, which are not covered by the Fund's Report of Independent Registered Public Accounting Firm, are available on the SEC's website or upon request.
Affiliated Central Funds
Information regarding fiscal year to date income earned by the Fund from investments in Fidelity Central Funds is as follows:
| Fund | Income earned |
| Fidelity Cash Central Fund | $1,014,019 |
| Total | $1,014,019 |
Consolidated Subsidiary
| | Value, beginning
of period | Purchases | Sales
Proceeds | Dividend
Income | Value, end
of period |
| Geode Commodity Strategy Cayman Ltd. | $-- | $100,000,000 | $-- | $-- | $110,645,081 |
Investment Valuation
The following is a summary of the inputs used, as of July 31, 2017, involving the Fund's assets and liabilities carried at fair value. The inputs or methodology used for valuing securities may not be an indication of the risk associated with investing in those securities. For more information on valuation inputs, and their aggregation into the levels used below, please refer to the Investment Valuation section in the accompanying Notes to Consolidated Financial Statements.
| | Valuation Inputs at Reporting Date: |
| Description | Total | Level 1 | Level 2 | Level 3 |
| Investments in Securities: | | | | |
| U.S. Government and Government Agency Obligations | $59,928,480 | $-- | $59,928,480 | $-- |
| Money Market Funds | 617,529,402 | 617,529,402 | -- | -- |
| Total Investments in Securities: | $677,457,882 | $617,529,402 | $59,928,480 | $-- |
| Derivative Instruments: | | | | |
| Assets | | | | |
| Futures Contracts | $7,453,311 | $7,453,311 | $-- | $-- |
| Swaps | 8,644,563 | -- | 8,644,563 | -- |
| Total Assets | $16,097,874 | $7,453,311 | $8,644,563 | $-- |
| Liabilities | | | | |
| Futures Contracts | $(1,944,087) | $(1,944,087) | $-- | $-- |
| Total Liabilities | $(1,944,087) | $(1,944,087) | $-- | $-- |
| Total Derivative Instruments: | $14,153,787 | $5,509,224 | $8,644,563 | $-- |
Value of Derivative Instruments
The following table is a summary of the Fund's value of derivative instruments by primary risk exposure as of July 31, 2017. For additional information on derivative instruments, please refer to the Derivative Instruments section in the accompanying Notes to Consolidated Financial Statements.
| Primary Risk Exposure / Derivative Type | Value |
| | Asset | Liability |
| Commodity Risk | | |
| Futures Contracts(a) | $7,453,311 | $(1,944,087) |
| Swaps(b) | 8,644,563 | 0 |
| Total Commodity Risk | $16,097,874 | $(1,944,087) |
(a) Reflects gross cumulative appreciation (depreciation) on futures contracts as presented in the Consolidated Schedule of Investments. In the Consolidated Statement of Assets and Liabilities, the period end daily variation margin is included in receivable or payable for daily variation margin for derivative instruments, and the net cumulative appreciation (depreciation) is included in net unrealized appreciation (depreciation).
(b) For bi-lateral over-the-counter (OTC) swaps, reflects gross value which is presented in the Consolidated Statement of Assets and Liabilities in the bi-lateral OTC swaps, at value line-items.
The following table is a summary of the Fund's derivatives inclusive of potential netting arrangements.
| Counterparty | Value of Derivative Assets | Value of Derivative Liabilities | Collateral Received(a) | Collateral Pledged(a) | Net(b) |
| Merrill Lynch International | $2,559,445 | $-- | $-- | $-- | $2,559,445 |
| Goldman Sachs Bank USA | 2,175,162 | -- | -- | -- | 2,175,162 |
| CIBC | 1,634,977 | -- | -- | -- | 1,634,977 |
| Societe Generale | 1,503,341 | -- | -- | -- | 1,503,341 |
| Macquarie Bank Ltd. | 570,906 | -- | -- | -- | 570,906 |
| JPMorgan Chase Bank, N.A. | 105,708 | -- | -- | -- | 105,708 |
| Citibank, N.A. | 95,024 | -- | -- | -- | 95,024 |
| Exchange Traded Futures | 7,453,311 | (1,944,087) | -- | -- | 5,509,224 |
| Total | $16,097,874 | $(1,944,087) | | | |
(a) Reflects collateral received from or pledged to an individual counterparty, excluding any excess or initial collateral amounts.
(b) Net represents the receivable / (payable) that would be due from / (to) the counterparty in an event of default. Netting may be allowed across transactions traded under the same legal agreement with the same legal entity. Please refer to Derivative Instruments - Risk Exposures and the Use of Derivative Instruments section in the accompanying Notes to Consolidated Financial Statements.
See accompanying notes which are an integral part of the consolidated financial statements.
Consolidated Financial Statements
Consolidated Statement of Assets and Liabilities
| | | July 31, 2017 |
| Assets | | |
Investment in securities, at value — See accompanying schedule:
Unaffiliated issuers (cost $59,931,470) | $59,928,480 | |
| Fidelity Central Funds (cost $617,529,402) | 617,529,402 | |
| Total Investments (cost $677,460,872) | | $677,457,882 |
| Cash | | 423,010 |
| Receivable for investments sold | | 1,056,288 |
| Receivable for fund shares sold | | 74,278 |
| Distributions receivable from Fidelity Central Funds | | 571,489 |
| Receivable for daily variation margin for derivative instruments | | 884,891 |
| Bi-lateral OTC swaps, at value | | 8,644,563 |
| Total assets | | 689,112,401 |
| Liabilities | | |
| Payable for fund shares redeemed | $433,059 | |
| Accrued management fee | 225,427 | |
| Transfer agent fees payable | 69,645 | |
| Other payables and accrued expenses | 303 | |
| Total liabilities | | 728,434 |
| Net Assets | | $688,383,967 |
| Net Assets consist of: | | |
| Paid in capital | | $677,295,676 |
| Undistributed net investment income | | 534,865 |
| Accumulated undistributed net realized gain (loss) on investments | | (3,597,371) |
| Net unrealized appreciation (depreciation) on investments | | 14,150,797 |
| Net Assets | | $688,383,967 |
| Commodity Strategy: | | |
| Net Asset Value, offering price and redemption price per share ($422,999,114 ÷ 41,661,755 shares) | | $10.15 |
| Class F: | | |
| Net Asset Value, offering price and redemption price per share ($265,384,853 ÷ 26,129,084 shares) | | $10.16 |
See accompanying notes which are an integral part of the consolidated financial statements.
Consolidated Statement of Operations
| | | For the period
May 30, 2017 (commencement of operations) to
July 31, 2017 |
| Investment Income | | |
| Interest | | $96,565 |
| Income from Fidelity Central Funds | | 1,014,019 |
| Total income | | 1,110,584 |
| Expenses | | |
| Management fee | $477,576 | |
| Transfer agent fees | 129,680 | |
| Custodian fees and expenses | 303 | |
| Independent trustees' fees and expenses | 270 | |
| Subsidiary directors' fees | 15,000 | |
| Total expenses before reductions | 622,829 | |
| Expense reductions | (47,110) | 575,719 |
| Net investment income (loss) | | 534,865 |
| Realized and Unrealized Gain (Loss) | | |
| Net realized gain (loss) on: | | |
| Investment securities: | | |
| Unaffiliated issuers | (63) | |
| Futures contracts | (3,269,017) | |
| Swaps | (328,291) | |
| Total net realized gain (loss) | | (3,597,371) |
| Change in net unrealized appreciation (depreciation) on: | | |
| Investment securities | (2,990) | |
| Futures contracts | 5,509,224 | |
| Swaps | 8,644,563 | |
| Total change in net unrealized appreciation (depreciation) | | 14,150,797 |
| Net gain (loss) | | 10,553,426 |
| Net increase (decrease) in net assets resulting from operations | | $11,088,291 |
See accompanying notes which are an integral part of the consolidated financial statements.
Consolidated Statement of Changes in Net Assets
| | For the period
May 30, 2017 (commencement of operations) to
July 31, 2017 |
| Increase (Decrease) in Net Assets | |
| Operations | |
| Net investment income (loss) | $534,865 |
| Net realized gain (loss) | (3,597,371) |
| Change in net unrealized appreciation (depreciation) | 14,150,797 |
| Net increase (decrease) in net assets resulting from operations | 11,088,291 |
| Share transactions - net increase (decrease) | 677,295,676 |
| Total increase (decrease) in net assets | 688,383,967 |
| Net Assets | |
| Beginning of period | – |
| End of period | $688,383,967 |
| Other Information | |
| Undistributed net investment income end of period | $534,865 |
See accompanying notes which are an integral part of the consolidated financial statements.
Consolidated Financial Highlights — Fidelity Commodity Strategy Fund
| Years ended July 31, | 2017 A |
| Selected Per–Share Data | |
| Net asset value, beginning of period | $10.00 |
| Income from Investment Operations | |
| Net investment income (loss)B | .01 |
| Net realized and unrealized gain (loss) | .14 |
| Total from investment operations | .15 |
| Net asset value, end of period | $10.15 |
| Total ReturnC,D | 1.50% |
| Ratios to Average Net AssetsE,F | |
| Expenses before reductions | .65%G |
| Expenses net of fee waivers, if any | .60%G |
| Expenses net of all reductions | .60%G |
| Net investment income (loss) | .44%G |
| Supplemental Data | |
| Net assets, end of period (000 omitted) | $422,999 |
| Portfolio turnover rateH | 0% |
A For the period May 30, 2017 (commencement of operations) to July 31, 2017.
B Calculated based on average shares outstanding during the period.
C Total returns for periods of less than one year are not annualized.
D Total returns would have been lower if certain expenses had not been reduced during the applicable periods shown.
E Fees and expenses of any underlying Fidelity Central Funds are not included in the Fund's expense ratio. The Fund indirectly bears its proportionate share of the expenses of any underlying Fidelity Central Funds.
F Expense ratios reflect operating expenses of the class. Expenses before reductions do not reflect amounts reimbursed by the investment adviser or reductions from expense offset arrangements and do not represent the amount paid by the class during periods when reimbursements or reductions occur. Expense ratios before reductions for start-up periods may not be representative of longer-term operating periods. Expenses net of fee waivers reflect expenses after reimbursement by the investment adviser but prior to reductions from expense offset arrangements. Expenses net of all reductions represent the net expenses paid by the class.
G Annualized
H Amount does not include the portfolio activity of any underlying Fidelity Central Funds.
See accompanying notes which are an integral part of the consolidated financial statements.
Consolidated Financial Highlights — Fidelity Commodity Strategy Fund Class F
| Years ended July 31, | 2017 A |
| Selected Per–Share Data | |
| Net asset value, beginning of period | $10.00 |
| Income from Investment Operations | |
| Net investment income (loss)B | .01 |
| Net realized and unrealized gain (loss) | .15 |
| Total from investment operations | .16 |
| Net asset value, end of period | $10.16 |
| Total ReturnC,D | 1.60% |
| Ratios to Average Net AssetsE,F | |
| Expenses before reductions | .45%G |
| Expenses net of fee waivers, if any | .40%G |
| Expenses net of all reductions | .40%G |
| Net investment income (loss) | .65%G |
| Supplemental Data | |
| Net assets, end of period (000 omitted) | $265,385 |
| Portfolio turnover rateH | 0% |
A For the period May 30, 2017 (commencement of operations) to July 31, 2017.
B Calculated based on average shares outstanding during the period.
C Total returns for periods of less than one year are not annualized.
D Total returns would have been lower if certain expenses had not been reduced during the applicable periods shown.
E Fees and expenses of any underlying Fidelity Central Funds are not included in the Fund's expense ratio. The Fund indirectly bears its proportionate share of the expenses of any underlying Fidelity Central Funds.
F Expense ratios reflect operating expenses of the class. Expenses before reductions do not reflect amounts reimbursed by the investment adviser or reductions from expense offset arrangements and do not represent the amount paid by the class during periods when reimbursements or reductions occur. Expense ratios before reductions for start-up periods may not be representative of longer-term operating periods. Expenses net of fee waivers reflect expenses after reimbursement by the investment adviser but prior to reductions from expense offset arrangements. Expenses net of all reductions represent the net expenses paid by the class.
G Annualized
H Amount does not include the portfolio activity of any underlying Fidelity Central Funds.
See accompanying notes which are an integral part of the consolidated financial statements.
Notes to Consolidated Financial Statements
For the period ended July 31, 2017
1. Organization.
Fidelity Commodity Strategy Fund (the Fund) is a non-diversified fund of Fidelity Oxford Street Trust (the Trust) and is authorized to issue an unlimited number of shares. Shares of the Fund are only available for purchase by mutual funds and accounts for which Fidelity Management & Research Company (FMR) or an affiliate serves as an investment manager. The Trust is registered under the Investment Company Act of 1940, as amended (the 1940 Act), as an open-end management investment company organized as a Massachusetts business trust. The Fund offers Commodity Strategy and Class F shares, each of which has equal rights as to assets and voting privileges. Each class has exclusive voting rights with respect to matters that affect that class.
2. Consolidated Subsidiary.
The Fund invests in certain commodity-related investments through Geode Commodity Strategy Cayman Ltd., a wholly owned subsidiary (the "Subsidiary"). As of period end, the Fund held an investment of $110,645,081 in the Subsidiary, representing 16.1% of the Fund's net assets.
The financial statements have been consolidated and include accounts of the Fund and the Subsidiary. Accordingly, all inter-company transactions and balances have been eliminated.
3. Investments in Fidelity Central Funds.
The Fund invests in Fidelity Central Funds, which are open-end investment companies generally available only to other investment companies and accounts managed by the investment adviser and its affiliates. The Fund's Consolidated Schedule of Investments lists each of the Fidelity Central Funds held as of period end, if any, as an investment of the Fund, but does not include the underlying holdings of each Fidelity Central Fund. As an Investing Fund, the Fund indirectly bears its proportionate share of the expenses of the underlying Fidelity Central Funds.
The Money Market Central Funds seek preservation of capital and current income and are managed by Fidelity Investments Money Management, Inc. (FIMM), an affiliate of the investment adviser. Annualized expenses of the Money Market Central Funds as of their most recent shareholder report date are less than .005%.
A complete unaudited list of holdings for each Fidelity Central Fund is available upon request or at the Securities and Exchange Commission (the SEC) website at www.sec.gov. In addition, the financial statements of the Fidelity Central Funds, which are not covered by the Fund's Report of Independent Registered Public Accounting Firm, are available on the SEC website or upon request.
4. Significant Accounting Policies.
The Fund is an investment company and applies the accounting and reporting guidance of the Financial Accounting Standards Board (FASB) Accounting Standards Codification Topic 946 Financial Services – Investments Companies. The consolidated financial statements have been prepared in conformity with accounting principles generally accepted in the United States of America (GAAP), which require management to make certain estimates and assumptions at the date of the consolidated financial statements. Actual results could differ from those estimates. Subsequent events, if any, through the date that the consolidated financial statements were issued have been evaluated in the preparation of the consolidated financial statements. The following summarizes the significant accounting policies of the Fund:
Investment Valuation. Investments are valued as of 4:00 p.m. Eastern time on the last calendar day of the period. The Board of Trustees (the Board) has delegated the day to day responsibility for the valuation of the Fund's investments to the Fair Value Committee (the Committee) established by the Fund's investment adviser. In accordance with valuation policies and procedures approved by the Board, the Fund attempts to obtain prices from one or more third party pricing vendors or brokers to value its investments. When current market prices, quotations or currency exchange rates are not readily available or reliable, investments will be fair valued in good faith by the Committee, in accordance with procedures adopted by the Board. Factors used in determining fair value vary by investment type and may include market or investment specific events, changes in interest rates and credit quality. The frequency with which these procedures are used cannot be predicted and they may be utilized to a significant extent. The Committee oversees the Fund's valuation policies and procedures and reports to the Board on the Committee's activities and fair value determinations. The Board monitors the appropriateness of the procedures used in valuing the Fund's investments and ratifies the fair value determinations of the Committee.
The Fund categorizes the inputs to valuation techniques used to value its investments into a disclosure hierarchy consisting of three levels as shown below:
- Level 1 – quoted prices in active markets for identical investments
- Level 2 – other significant observable inputs (including quoted prices for similar investments, interest rates, prepayment speeds, etc.)
- Level 3 – unobservable inputs (including the Fund's own assumptions based on the best information available)
Valuation techniques used to value the Fund's investments by major category are as follows:
Debt securities, including restricted securities, are valued based on evaluated prices received from third party pricing vendors or from brokers who make markets in such securities. U.S. government and government agency obligations are valued by pricing vendors who utilize matrix pricing which considers yield or price of bonds of comparable quality, coupon, maturity and type or by broker-supplied prices. Swaps are marked-to-market daily based on valuations from third party pricing vendors, registered derivatives clearing organizations (clearinghouses) or broker-supplied valuations. These pricing sources may utilize inputs such as movements in the underlying index, interest rate curves, credit spread curves, default possibilities and recovery rates. When independent prices are unavailable or unreliable, debt securities and swaps may be valued utilizing pricing methodologies which consider similar factors that would be used by third party pricing vendors. Debt securities and swaps are generally categorized as Level 2 in the hierarchy but may be Level 3 depending on the circumstances.
Futures contracts are valued at the settlement price or official closing price established each day by the board of trade or exchange on which they are traded and are categorized as Level 1 in the hierarchy. Investments in open-end mutual funds, including the Fidelity Central Funds, are valued at their closing net asset value (NAV) each business day and are categorized as Level 1 in the hierarchy.
Changes in valuation techniques may result in transfers in or out of an assigned level within the disclosure hierarchy. The aggregate value of investments by input level as of July 31, 2017 is included at the end of the Fund's Consolidated Schedule of Investments.
Investment Transactions and Income. For financial reporting purposes, the Fund's investment holdings and NAV include trades executed through the end of the last business day of the period. The NAV per share for processing shareholder transactions is calculated as of the close of business of the New York Stock Exchange (NYSE), normally 4:00 p.m. Eastern time and includes trades executed through the end of the prior business day. Gains and losses on securities sold are determined on the basis of identified cost. Income and capital gain distributions from Fidelity Central Funds, if any, are recorded on the ex-dividend date. Interest income is accrued as earned and includes coupon interest and amortization of premium and accretion of discount on debt securities as applicable. Investment income is recorded net of foreign taxes withheld where recovery of such taxes is uncertain.
Class Allocations and Expenses. Investment income, realized and unrealized capital gains and losses, common expenses of the Fund, and certain fund-level expense reductions, if any, are allocated daily on a pro-rata basis to each class based on the relative net assets of each class to the total net assets of the Fund. Each class differs with respect to transfer agent fees incurred. Certain expense reductions may also differ by class. For the reporting period, the allocated portion of income and expenses to each class as a percent of its average net assets may vary due to the timing of recording these transactions in relation to fluctuating net assets of the classes. Expenses directly attributable to a fund are charged to that fund. Expenses attributable to more than one fund are allocated among the respective funds on the basis of relative net assets or other appropriate methods. Expense estimates are accrued in the period to which they relate and adjustments are made when actual amounts are known.
Income Tax Information and Distributions to Shareholders. Each year, the Fund intends to qualify as a regulated investment company under Subchapter M of the Internal Revenue Code, including distributing substantially all of its taxable income and realized gains. As a result, no provision for U.S. Federal income taxes is required. As of July 31, 2017, the Fund did not have any unrecognized tax benefits in the consolidated financial statements; nor is the Fund aware of any tax positions for which it is reasonably possible that the total amounts of unrecognized tax benefits will significantly change in the next twelve months. The Fund files a U.S. federal tax return, in addition to state and local tax returns as required. The Fund's federal income tax returns are subject to examination by the Internal Revenue Service (IRS) for a period of three fiscal years after they are filed. State and local tax returns may be subject to examination for an additional fiscal year depending on the jurisdiction.
The Subsidiary is classified as a controlled foreign corporation under Subchapter N of the Internal Revenue Code. Therefore, the Fund is required to increase its taxable income by its share of the Subsidiary's income. Net investment losses of the Subsidiary cannot be deducted by the Fund in the current period nor carried forward to offset taxable income in future periods.
Distributions are declared and recorded on the ex-dividend date. Income dividends and capital gain distributions are declared separately for each class. Income and capital gain distributions are determined in accordance with income tax regulations, which may differ from GAAP.
Capital accounts within the consolidated financial statements are adjusted for permanent book-tax differences. These adjustments have no impact on net assets or the results of operations. Capital accounts are not adjusted for temporary book-tax differences which will reverse in a subsequent period.
Book-tax differences are primarily due to controlled foreign corporations.
The federal tax cost of investment securities and unrealized appreciation (depreciation) as of period end on an unconsolidated basis were as follows:
| Gross unrealized appreciation | $9,686,002 |
| Gross unrealized depreciation | – |
| Net unrealized appreciation (depreciation) on securities | $9,686,002 |
| Tax Cost | $678,791,496 |
The tax-based components of distributable earnings as of period end were as follows:
| Undistributed ordinary income | $1,402,289 |
| Net unrealized appreciation (depreciation) on securities and other investments | $23,839,789 |
5. Derivative Instruments.
Risk Exposures and the Use of Derivative Instruments. The Fund's investment objective allows the Fund to enter into various types of derivative contracts, including futures contracts and swaps. Derivatives are investments whose value is primarily derived from underlying assets, indices or reference rates and may be transacted on an exchange or over-the-counter (OTC). Derivatives may involve a future commitment to buy or sell a specified asset based on specified terms, to exchange future cash flows at periodic intervals based on a notional principal amount, or for one party to make one or more payments upon the occurrence of specified events in exchange for periodic payments from the other party.
The Fund primarily used derivatives to increase returns, to gain exposure to certain types of assets and to manage exposure to certain risks as defined below. The success of any strategy involving derivatives depends on analysis of numerous economic factors, and if the strategies for investment do not work as intended, the Fund may not achieve its objectives.
The Fund's use of derivatives increased or decreased its exposure to the following risk:
| Commodity Risk | Commodity risk is the risk that the value of a commodity will fluctuate as a result of changes in market prices.
|
The Fund is also exposed to additional risks from investing in derivatives, such as liquidity risk and counterparty credit risk. Liquidity risk is the risk that the Fund will be unable to close out the derivative in the open market in a timely manner. Counterparty credit risk is the risk that the counterparty will not be able to fulfill its obligation to the Fund. Derivative counterparty credit risk is managed through formal evaluation of the creditworthiness of all potential counterparties. On certain OTC derivatives such as bi-lateral swaps, the Fund attempts to reduce its exposure to counterparty credit risk by entering into an International Swaps and Derivatives Association, Inc. (ISDA) Master Agreement with each of its counterparties. The ISDA Master Agreement gives the Fund the right to terminate all transactions traded under such agreement upon the deterioration in the credit quality of the counterparty beyond specified levels. The ISDA Master Agreement gives each party the right, upon an event of default by the other party or a termination of the agreement, to close out all transactions traded under such agreement and to net amounts owed under each transaction to one net payable by one party to the other. Upon entering into a swap, the Fund is required to post an initial collateral amount (referred to as "Independent Amount"), as defined in the ISDA Master Agreement. The Fund is required to post additional collateral for the benefit of counterparties to meet the counterparty's unrealized appreciation on outstanding swap contracts and any such posted collateral is identified on the Consolidated Schedule of Investments. To mitigate counterparty credit risk on bi-lateral OTC derivatives, the Fund receives collateral in the form of cash or securities once the Fund's net unrealized appreciation on outstanding derivative contracts under an ISDA Master Agreement exceeds certain applicable thresholds, subject to certain minimum transfer provisions. The collateral received is held in segregated accounts with the Fund's custodian bank in accordance with the collateral agreements entered into between the Fund, the counterparty and the Fund's custodian bank. The Fund could experience delays and costs in gaining access to the collateral even though it is held by the Fund's custodian bank. The Fund's maximum risk of loss from counterparty credit risk related to bi-lateral OTC derivatives is generally the aggregate unrealized appreciation and unpaid counterparty payments in excess of any collateral pledged by the counterparty to the Fund. Exchange-traded futures contracts are not covered by the ISDA Master Agreement; however counterparty credit risk related to exchange-traded futures contracts may be mitigated by the protection provided by the exchange's clearinghouse. A summary of the Fund's derivatives inclusive of potential netting arrangements is presented at the end of the Consolidated Schedule of Investments.
Investing in derivatives may involve greater risks than investing in the underlying assets directly and, to varying degrees, may involve risk of loss in excess of any initial investment and collateral received and amounts recognized in the Consolidated Statement of Assets and Liabilities. In addition, there may be the risk that the change in value of the derivative contract does not correspond to the change in value of the underlying instrument.
Net Realized Gain (Loss) and Change in Net Unrealized Appreciation (Depreciation) on Derivatives. The table below, which reflects the impacts of derivatives on the financial performance of the Fund, summarizes the net realized gain (loss) and change in net unrealized appreciation (depreciation) for derivatives during the period as presented in the Consolidated Statement of Operations.
| Primary Risk Exposure / Derivative Type | Net Realized Gain (Loss) | Change in Net Unrealized Appreciation (Depreciation) |
| Commodity Risk | | |
| Futures Contracts | $(3,269,017) | $5,509,224 |
| Swaps | (328,291) | 8,644,563 |
| Total Commodity Risk | $(3,597,308) | $14,153,787 |
A summary of the value of derivatives by primary risk exposure as of period end is included at the end of the Consolidated Schedule of Investments.
Futures Contracts. A futures contract is an agreement between two parties to buy or sell a specified underlying instrument for a fixed price at a specified future date. The Fund used futures contracts to manage its exposure to the commodities market.
Upon entering into a futures contract, a fund is required to deposit either cash or securities (initial margin) with a clearing broker in an amount equal to a certain percentage of the face value of the contract. Futures contracts are marked-to-market daily and subsequent daily payments are made or received by a fund depending on the daily fluctuations in the value of the futures contracts and are recorded as unrealized appreciation or (depreciation). This receivable and/or payable, if any, is included in daily variation margin for derivative instruments in the Consolidated Statement of Assets and Liabilities. Realized gain or (loss) is recorded upon the expiration or closing of a futures contract. The net realized gain (loss) and change in net unrealized appreciation (depreciation) on futures contracts during the period is included in the Consolidated Statement of Operations.
Any open futures contracts at period end are presented in the Consolidated Schedule of Investments under the caption "Futures Contracts". The underlying face amount at value reflects each contract's exposure to the underlying instrument or index at period end. Securities deposited to meet initial margin requirements are identified in the Consolidated Schedule of Investments.
Swaps. A swap is a contract between two parties to exchange future cash flows at periodic intervals based on a notional principal amount. A bi-lateral OTC swap is a transaction between a fund and a dealer counterparty where cash flows are exchanged between the two parties for the life of the swap.
Bi-lateral OTC swaps are marked-to-market daily and changes in value are reflected in the Consolidated Statement of Assets and Liabilities in the bi-lateral OTC swaps at value line items.
Payments are exchanged at specified intervals, accrued daily commencing with the effective date of the contract and recorded as realized gain or (loss). Some swaps may be terminated prior to the effective date and realize a gain or loss upon termination. The net realized gain (loss) and change in net unrealized appreciation (depreciation) on swaps during the period is included in the Consolidated Statement of Operations.
Any open swaps at period end are included in the Consolidated Schedule of Investments under the caption "Swaps".
Total Return Swaps. Total return swaps are agreements between counterparties to exchange cash flows, one based on a market-linked return of an individual asset or a basket of assets (i.e., an index), and the other on a fixed or floating rate. To the extent the total return of the instrument or index underlying the transaction exceeds or falls short of the offsetting payment obligation, the Fund will receive a payment from or make a payment to the counterparty. The Fund entered into total return swaps to manage its commodities market exposure.
6. Fees and Other Transactions with Affiliates.
Management Fee and Administration Agreement. Geode Capital Management, LLC (the investment adviser) provides the Fund with investment management services for which the Fund pays a monthly management fee that is based on an annual rate of .40% of the Fund's average net assets. Under the management contract, the investment adviser pays all other fund-level expenses, except the compensation of the independent Trustees and certain other expenses such as interest expense, including commitment fees.
FMR provides administrative services to the Fund and the investment adviser pays for these services.
The investment adviser also provides investment management services to the Subsidiary. The Subsidiary pays the investment adviser a monthly management fee at an annual rate of .30% of its net assets. The Subsidiary also pays certain other expenses including custody and directors' fees.
For the reporting period, the total consolidated annual management fee rate which includes the management fee of the Fund and the Subsidiary was .45% of the Fund's average net assets.
During the period, the investment adviser waived a portion of its management fee as described in the Expense Reductions note.
Transfer Agent Fees. Fidelity Investments Institutional Operations Company, Inc., (FIIOC), an affiliate of FMR, is the transfer, dividend disbursing and shareholder servicing agent for each class of the Fund. FIIOC receives an asset-based fee of Commodity Strategy's average net assets. FIIOC receives no fees for providing transfer agency services to Class F. FIIOC pays for typesetting, printing and mailing of shareholder reports, except proxy statements.
For the period, transfer agent fees for each applicable class were as follows:
| | Amount | % of
Class-Level Average
Net Assets(a) |
| Commodity Strategy | $129,680 | .20 |
(a) Annualized
Interfund Trades. The Fund may purchase from or sell securities to other Fidelity Funds under procedures adopted by the Board. The procedures have been designed to ensure these interfund trades are executed in accordance with Rule 17a-7 of the 1940 Act.
7. Expense Reductions.
The investment adviser has contractually agreed to waive the Fund's management fee in an amount equal to the management fee paid by the Subsidiary. During the period, this waiver reduced the Fund's management fee by $47,110.
8. Share Transactions.
Transactions for each class of shares were as follows:
| | Shares | Dollars |
| | Year ended
July 31, 2017(a) | Year ended
July 31, 2017 (a) |
| Commodity Strategy | | |
| Shares sold | 42,231,995 | $421,807,485 |
| Shares redeemed | (570,240) | (5,676,193) |
| Net increase (decrease) | 41,661,755 | $416,131,292 |
| Class F | | |
| Shares sold | 26,286,898 | $262,719,273 |
| Shares redeemed | (157,814) | (1,554,889) |
| Net increase (decrease) | 26,129,084 | $261,164,384 |
(a) For the period May 30, 2017 (commencement of operations) to July 31, 2017.
9. Other.
The Fund's organizational documents provide former and current trustees and officers with a limited indemnification against liabilities arising in connection with the performance of their duties to the Fund. In the normal course of business, the Fund may also enter into contracts that provide general indemnifications. The Fund's maximum exposure under these arrangements is unknown as this would be dependent on future claims that may be made against the Fund. The risk of material loss from such claims is considered remote.
At the end of the period, mutual funds and accounts managed by FMR or its affiliates were the owners of record of all of the outstanding shares of the Fund.
Report of Independent Registered Public Accounting Firm
To the Trustees of Fidelity Oxford Street Trust and Shareholders of Fidelity Commodity Strategy Fund:
In our opinion, the accompanying consolidated statement of assets and liabilities, including the consolidated investments, and the related consolidated statements of operations and of changes in net assets and the consolidated financial highlights present fairly, in all material respects, the consolidated financial position of Fidelity Commodity Strategy Fund (a fund of Fidelity Oxford Street Trust) (the "Fund") and its subsidiary as of July 31, 2017, the consolidated results of their operations for the period then ended, the changes in their net assets for the period then ended and the consolidated financial highlights for the period indicated, in conformity with accounting principles generally accepted in the United States of America. These financial statements and financial highlights (hereafter referred to as “financial statements”) are the responsibility of the Fund's management. Our responsibility is to express an opinion on these financial statements based on our audits. We conducted our audits of these financial statements in accordance with the standards of the Public Company Accounting Oversight Board (United States). Those standards require that we plan and perform the audit to obtain reasonable assurance about whether the financial statements are free of material misstatement. An audit includes examining, on a test basis, evidence supporting the amounts and disclosures in the financial statements, assessing the accounting principles used and significant estimates made by management, and evaluating the overall financial statement presentation. Our procedures included confirmation of securities owned as of July 31, 2017 by correspondence with the custodians and brokers; when replies were not received from brokers, we performed other auditing procedures. We believe that our audits provide a reasonable basis for our opinion.
PricewaterhouseCoopers LLP
Boston, Massachusetts
September 21, 2017
Trustees and Officers
The Trustees, Members of the Advisory Board (if any), and officers of the trust and fund, as applicable, are listed below. The Board of Trustees governs the fund and is responsible for protecting the interests of shareholders. The Trustees are experienced executives who meet periodically throughout the year to oversee the fund's activities, review contractual arrangements with companies that provide services to the fund, oversee management of the risks associated with such activities and contractual arrangements, and review the fund's performance. Each of the Trustees oversees 261 funds.
The Trustees hold office without limit in time except that (a) any Trustee may resign; (b) any Trustee may be removed by written instrument, signed by at least two-thirds of the number of Trustees prior to such removal; (c) any Trustee who requests to be retired or who has become incapacitated by illness or injury may be retired by written instrument signed by a majority of the other Trustees; and (d) any Trustee may be removed at any special meeting of shareholders by a two-thirds vote of the outstanding voting securities of the trust. Each Trustee who is not an interested person (as defined in the 1940 Act) of the trust and the fund is referred to herein as an Independent Trustee. Each Independent Trustee shall retire not later than the last day of the calendar year in which his or her 75th birthday occurs. The Independent Trustees may waive this mandatory retirement age policy with respect to individual Trustees. Officers and Advisory Board Members hold office without limit in time, except that any officer or Advisory Board Member may resign or may be removed by a vote of a majority of the Trustees at any regular meeting or any special meeting of the Trustees. Except as indicated, each individual has held the office shown or other offices in the same company for the past five years.
The fund’s Statement of Additional Information (SAI) includes more information about the Trustees. To request a free copy, call Fidelity at 1-800-835-5092.
Experience, Skills, Attributes, and Qualifications of the Trustees. The Governance and Nominating Committee has adopted a statement of policy that describes the experience, qualifications, attributes, and skills that are necessary and desirable for potential Independent Trustee candidates (Statement of Policy). The Board believes that each Trustee satisfied at the time he or she was initially elected or appointed a Trustee, and continues to satisfy, the standards contemplated by the Statement of Policy. The Governance and Nominating Committee also engages professional search firms to help identify potential Independent Trustee candidates who have the experience, qualifications, attributes, and skills consistent with the Statement of Policy. From time to time, additional criteria based on the composition and skills of the current Independent Trustees, as well as experience or skills that may be appropriate in light of future changes to board composition, business conditions, and regulatory or other developments, have also been considered by the professional search firms and the Governance and Nominating Committee. In addition, the Board takes into account the Trustees' commitment and participation in Board and committee meetings, as well as their leadership of standing and ad hoc committees throughout their tenure.
In determining that a particular Trustee was and continues to be qualified to serve as a Trustee, the Board has considered a variety of criteria, none of which, in isolation, was controlling. The Board believes that, collectively, the Trustees have balanced and diverse experience, qualifications, attributes, and skills, which allow the Board to operate effectively in governing the fund and protecting the interests of shareholders. Information about the specific experience, skills, attributes, and qualifications of each Trustee, which in each case led to the Board's conclusion that the Trustee should serve (or continue to serve) as a trustee of the fund, is provided below.
Board Structure and Oversight Function. Abigail P. Johnson is an interested person and currently serves as Chairman. The Trustees have determined that an interested Chairman is appropriate and benefits shareholders because an interested Chairman has a personal and professional stake in the quality and continuity of services provided to the fund. Independent Trustees exercise their informed business judgment to appoint an individual of their choosing to serve as Chairman, regardless of whether the Trustee happens to be independent or a member of management. The Independent Trustees have determined that they can act independently and effectively without having an Independent Trustee serve as Chairman and that a key structural component for assuring that they are in a position to do so is for the Independent Trustees to constitute a substantial majority for the Board. The Independent Trustees also regularly meet in executive session. Marie L. Knowles serves as Chairman of the Independent Trustees and as such (i) acts as a liaison between the Independent Trustees and management with respect to matters important to the Independent Trustees and (ii) with management prepares agendas for Board meetings.
Fidelity® funds are overseen by different Boards of Trustees. The fund's Board oversees Fidelity's investment-grade bond, money market, asset allocation and certain equity funds, and other Boards oversee Fidelity's high income, sector and other equity funds. The asset allocation funds may invest in Fidelity® funds that are overseen by such other Boards. The use of separate Boards, each with its own committee structure, allows the Trustees of each group of Fidelity® funds to focus on the unique issues of the funds they oversee, including common research, investment, and operational issues. On occasion, the separate Boards establish joint committees to address issues of overlapping consequences for the Fidelity® funds overseen by each Board.
The Trustees operate using a system of committees to facilitate the timely and efficient consideration of all matters of importance to the Trustees, the fund, and fund shareholders and to facilitate compliance with legal and regulatory requirements and oversight of the fund's activities and associated risks. The Board, acting through its committees, has charged the adviser and FMR and its affiliates with (i) identifying events or circumstances the occurrence of which could have demonstrably adverse effects on the fund's business and/or reputation; (ii) implementing processes and controls to lessen the possibility that such events or circumstances occur or to mitigate the effects of such events or circumstances if they do occur; and (iii) creating and maintaining a system designed to evaluate continuously business and market conditions in order to facilitate the identification and implementation processes described in (i) and (ii) above. Because the day-to-day operations and activities of the fund are carried out by or through the adviser, FMR and its affiliates, and other service providers, the fund's exposure to risks is mitigated but not eliminated by the processes overseen by the Trustees. While each of the Board's committees has responsibility for overseeing different aspects of the fund's activities, oversight is exercised primarily through the Operations and Audit Committees. In addition, an ad hoc Board committee of Independent Trustees has worked with FMR to enhance the Board's oversight of investment and financial risks, legal and regulatory risks, technology risks, and operational risks, including the development of additional risk reporting to the Board. Appropriate personnel, including but not limited to the fund's Chief Compliance Officer (CCO), FMR's internal auditor, the independent accountants, the fund's Treasurer and portfolio management personnel, make periodic reports to the Board's committees, as appropriate, including an annual review of Fidelity's risk management program for the Fidelity® funds. The responsibilities of each standing committee, including their oversight responsibilities, are described further under "Standing Committees of the Trustees."
Interested Trustees*:
Correspondence intended for a Trustee who is an interested person may be sent to Fidelity Investments, 245 Summer Street, Boston, Massachusetts 02210.
Name, Year of Birth; Principal Occupations and Other Relevant Experience+
Abigail P. Johnson (1961)
Year of Election or Appointment: 2009
Trustee
Chairman of the Board of Trustees
Ms. Johnson also serves as Trustee of other Fidelity® funds. Ms. Johnson serves as Chairman (2016-present), Chief Executive Officer (2014-present), and Director (2007-present) of FMR LLC (diversified financial services company), President of Fidelity Financial Services (2012-present) and President of Personal, Workplace and Institutional Services (2005-present). Ms. Johnson is Chairman and Director of FMR Co., Inc. (investment adviser firm, 2011-present) and Chairman and Director of FMR (investment adviser firm, 2011-present). Previously, Ms. Johnson served as Vice Chairman (2007-2016) and President (2013-2016) of FMR LLC, President and a Director of FMR (2001-2005), a Trustee of other investment companies advised by FMR, Fidelity Investments Money Management, Inc. (investment adviser firm), and FMR Co., Inc. (2001-2005), Senior Vice President of the Fidelity® funds (2001-2005), and managed a number of Fidelity® funds. Ms. Abigail P. Johnson and Mr. Arthur E. Johnson are not related.
Jennifer Toolin McAuliffe (1959)
Year of Election or Appointment: 2016
Trustee
Ms. McAuliffe also serves as Trustee of other Fidelity® funds. Ms. McAuliffe previously served as a Member of the Advisory Board of certain Fidelity® funds (2016) and as Co-Head of Fixed Income of Fidelity Investments Limited (now known as FIL Limited (FIL)) (diversified financial services company). Earlier roles at FIL included Director of Research for FIL’s credit and quantitative teams in London, Hong Kong and Tokyo. Ms. McAuliffe also was the Director of Research for taxable and municipal bonds at Fidelity Investments Money Management, Inc. Ms. McAuliffe is also a director or trustee of several not-for-profit entities.
* Determined to be an “Interested Trustee” by virtue of, among other things, his or her affiliation with the trust or various entities under common control with FMR.
+ The information includes the Trustee's principal occupation during the last five years and other information relating to the experience, attributes, and skills relevant to the Trustee's qualifications to serve as a Trustee, which led to the conclusion that the Trustee should serve as a Trustee for the fund.
Independent Trustees:
Correspondence intended for an Independent Trustee may be sent to Fidelity Investments, P.O. Box 55235, Boston, Massachusetts 02205-5235.
Name, Year of Birth; Principal Occupations and Other Relevant Experience+
Elizabeth S. Acton (1951)
Year of Election or Appointment: 2013
Trustee
Ms. Acton also serves as Trustee of other Fidelity® funds. Prior to her retirement in April 2012, Ms. Acton was Executive Vice President, Finance (2011-2012), Executive Vice President, Chief Financial Officer (2002-2011), and Treasurer (2004-2005) of Comerica Incorporated (financial services). Prior to joining Comerica, Ms. Acton held a variety of positions at Ford Motor Company (1983-2002), including Vice President and Treasurer (2000-2002) and Executive Vice President and Chief Financial Officer of Ford Motor Credit Company (1998-2000). Ms. Acton currently serves as a member of the Board of Directors and Audit and Finance Committees of Beazer Homes USA, Inc. (homebuilding, 2012-present). Previously, Ms. Acton served as a Member of the Advisory Board of certain Fidelity® funds (2013-2016).
John Engler (1948)
Year of Election or Appointment: 2014
Trustee
Mr. Engler also serves as Trustee of other Fidelity® funds. He serves on the board of directors for Universal Forest Products (manufacturer and distributor of wood and wood-alternative products, 2003-present) and K12 Inc. (technology-based education company, 2012-present). Previously, Mr. Engler served as a Member of the Advisory Board of certain Fidelity® funds (2014-2016), president of the Business Roundtable (2011-2017), a trustee of The Munder Funds (2003-2014), president and CEO of the National Association of Manufacturers (2004-2011), member of the Board of Trustees of the Annie E. Casey Foundation (2004-2015), and as governor of Michigan (1991-2003). He is a past chairman of the National Governors Association.
Albert R. Gamper, Jr. (1942)
Year of Election or Appointment: 2006
Trustee
Mr. Gamper also serves as Trustee of other Fidelity® funds. Prior to his retirement in December 2004, Mr. Gamper served as Chairman of the Board of CIT Group Inc. (commercial finance). During his tenure with CIT Group Inc. Mr. Gamper served in numerous senior management positions, including Chairman (1987-1989; 1999-2001; 2002-2004), Chief Executive Officer (1987-2004), and President (2002-2003). Mr. Gamper currently serves as a member of the Board of Directors of Public Service Enterprise Group (utilities, 2000-present), and Member of the Board of Trustees of Barnabas Health Care System (1997-present). Previously, Mr. Gamper served as Chairman (2012-2015) and Vice Chairman (2011-2012) of the Independent Trustees of certain Fidelity® funds and as Chairman of the Board of Governors, Rutgers University (2004-2007).
Robert F. Gartland (1951)
Year of Election or Appointment: 2010
Trustee
Mr. Gartland also serves as Trustee of other Fidelity® funds. Mr. Gartland is Chairman and an investor in Gartland & Mellina Group Corp. (consulting, 2009-present). Previously, Mr. Gartland served as a partner and investor of Vietnam Partners LLC (investments and consulting, 2008-2011). Prior to his retirement, Mr. Gartland held a variety of positions at Morgan Stanley (financial services, 1979-2007) including Managing Director (1987-2007).
Arthur E. Johnson (1947)
Year of Election or Appointment: 2008
Trustee
Vice Chairman of the Independent Trustees
Mr. Johnson also serves as Trustee of other Fidelity® funds. Mr. Johnson serves as a member of the Board of Directors of Eaton Corporation plc (diversified power management, 2009-present) and Booz Allen Hamilton (management consulting, 2011-present). Prior to his retirement, Mr. Johnson served as Senior Vice President of Corporate Strategic Development of Lockheed Martin Corporation (defense contractor, 1999-2009). He previously served on the Board of Directors of IKON Office Solutions, Inc. (1999-2008), AGL Resources, Inc. (holding company, 2002-2016), and Delta Airlines (2005-2007). Mr. Arthur E. Johnson is not related to Ms. Abigail P. Johnson.
Michael E. Kenneally (1954)
Year of Election or Appointment: 2009
Trustee
Mr. Kenneally also serves as Trustee of other Fidelity® funds. Prior to his retirement, Mr. Kenneally served as Chairman and Global Chief Executive Officer of Credit Suisse Asset Management. Before joining Credit Suisse, he was an Executive Vice President and Chief Investment Officer for Bank of America Corporation. Earlier roles at Bank of America included Director of Research, Senior Portfolio Manager and Research Analyst, and Mr. Kenneally was awarded the Chartered Financial Analyst (CFA) designation in 1991.
Marie L. Knowles (1946)
Year of Election or Appointment: 2001
Trustee
Chairman of the Independent Trustees
Ms. Knowles also serves as Trustee of other Fidelity® funds. Prior to Ms. Knowles' retirement in June 2000, she served as Executive Vice President and Chief Financial Officer of Atlantic Richfield Company (ARCO) (diversified energy, 1996-2000). From 1993 to 1996, she was a Senior Vice President of ARCO and President of ARCO Transportation Company (pipeline and tanker operations). Ms. Knowles currently serves as a Director and Chairman of the Audit Committee of McKesson Corporation (healthcare service, since 2002). Ms. Knowles is a member of the Board of the Santa Catalina Island Company (real estate, 2009-present). Ms. Knowles is a Member of the Investment Company Institute Board of Governors and a Member of the Governing Council of the Independent Directors Council (2014-present). She also serves as a member of the Advisory Board for the School of Engineering of the University of Southern California. Previously, Ms. Knowles served as a Director of Phelps Dodge Corporation (copper mining and manufacturing, 1994-2007), URS Corporation (engineering and construction, 2000-2003) and America West (airline, 1999-2002). Ms. Knowles previously served as Vice Chairman of the Independent Trustees of certain Fidelity® funds (2012-2015).
Mark A. Murray (1954)
Year of Election or Appointment: 2016
Trustee
Mr. Murray also serves as Trustee of other Fidelity® funds. Mr. Murray is Vice Chairman (2013-present) of Meijer, Inc. (regional retail chain). Previously, Mr. Murray served as a Member of the Advisory Board of certain Fidelity® funds (2016) and as Co-Chief Executive Officer (2013-2016) and President (2006-2013) of Meijer, Inc. Mr. Murray serves as a member of the Board of Directors and Nuclear Review and Public Policy and Responsibility Committees of DTE Energy Company (diversified energy company, 2009-present). Mr. Murray also serves as a member of the Board of Directors of Spectrum Health (not-for-profit health system, 2015-present). Mr. Murray previously served as President of Grand Valley State University (2001-2006), Treasurer for the State of Michigan (1999-2001), Vice President of Finance and Administration for Michigan State University (1998-1999), and a member of the Board of Directors and Audit Committee and Chairman of the Nominating and Corporate Governance Committee of Universal Forest Products, Inc. (manufacturer and distributor of wood and wood-alternative products, 2004-2016). Mr. Murray is also a director or trustee of many community and professional organizations.
+ The information includes the Trustee's principal occupation during the last five years and other information relating to the experience, attributes, and skills relevant to the Trustee's qualifications to serve as a Trustee, which led to the conclusion that the Trustee should serve as a Trustee for the fund.
Advisory Board Members and Officers:
Correspondence intended for an officer may be sent to Fidelity Investments, 245 Summer Street, Boston, Massachusetts 02210. Officers appear below in alphabetical order.
Name, Year of Birth; Principal Occupation
Elizabeth Paige Baumann (1968)
Year of Election or Appointment: 2017
Anti-Money Laundering (AML) Officer
Ms. Baumann also serves as AML Officer of other funds. She is Chief AML Officer (2012-present) and Senior Vice President (2014-present) of FMR LLC (diversified financial services company) and is an employee of Fidelity Investments. Previously, Ms. Baumann served as AML Officer of the funds (2012-2016), and Vice President (2007-2014) and Deputy Anti-Money Laundering Officer (2007-2012) of FMR LLC.
Marc R. Bryant (1966)
Year of Election or Appointment: 2015
Secretary and Chief Legal Officer (CLO)
Mr. Bryant also serves as Secretary and CLO of other funds. Mr. Bryant serves as CLO, Secretary, and Senior Vice President of Fidelity Management & Research Company (investment adviser firm, 2015-present) and FMR Co., Inc. (investment adviser firm, 2015-present); Secretary of Fidelity SelectCo, LLC (investment adviser firm, 2015-present) and Fidelity Investments Money Management, Inc. (investment adviser firm, 2015-present); and CLO of Fidelity Management & Research (Hong Kong) Limited and FMR Investment Management (UK) Limited (investment adviser firms, 2015-present) and Fidelity Management & Research (Japan) Limited (investment adviser firm, 2016-present). He is Senior Vice President and Deputy General Counsel of FMR LLC (diversified financial services company). Previously, Mr. Bryant served as Secretary and CLO of Fidelity Rutland Square Trust II (2010-2014) and Assistant Secretary of Fidelity's Fixed Income and Asset Allocation Funds (2013-2015). Prior to joining Fidelity Investments, Mr. Bryant served as a Senior Vice President and the Head of Global Retail Legal for AllianceBernstein L.P. (2006-2010), and as the General Counsel for ProFund Advisors LLC (2001-2006).
Jonathan Davis (1968)
Year of Election or Appointment: 2010
Assistant Treasurer
Mr. Davis also serves as Assistant Treasurer of other funds, and is an employee of Fidelity Investments. Previously, Mr. Davis served as Vice President and Associate General Counsel of FMR LLC (diversified financial services company, 2003-2010).
Adrien E. Deberghes (1967)
Year of Election or Appointment: 2010
Assistant Treasurer
Mr. Deberghes also serves as an officer of other funds. He serves as Executive Vice President of Fidelity Investments Money Management, Inc. (FIMM) (investment adviser firm, 2016-present) and is an employee of Fidelity Investments (2008-present). Prior to joining Fidelity Investments, Mr. Deberghes was Senior Vice President of Mutual Fund Administration at State Street Corporation (2007-2008), Senior Director of Mutual Fund Administration at Investors Bank & Trust (2005-2007), and Director of Finance for Dunkin' Brands (2000-2005). Previously, Mr. Deberghes served in other fund officer roles.
Stephanie J. Dorsey (1969)
Year of Election or Appointment: 2013
President and Treasurer
Ms. Dorsey also serves as an officer of other funds. She is an employee of Fidelity Investments (2008-present) and has served in other fund officer roles. Prior to joining Fidelity Investments, Ms. Dorsey served as Treasurer (2004-2008) of the JPMorgan Mutual Funds and Vice President (2004-2008) of JPMorgan Chase Bank.
Howard J. Galligan III (1966)
Year of Election or Appointment: 2014
Chief Financial Officer
Mr. Galligan also serves as Chief Financial Officer of other funds. Mr. Galligan serves as President of Fidelity Pricing and Cash Management Services (FPCMS) (2014-present) and as a Director of Strategic Advisers, Inc. (investment adviser firm, 2008-present). Previously, Mr. Galligan served as Chief Administrative Officer of Asset Management (2011-2014) and Chief Operating Officer and Senior Vice President of Investment Support for Strategic Advisers, Inc. (2003-2011).
Colm A. Hogan (1973)
Year of Election or Appointment: 2016
Assistant Treasurer
Mr. Hogan also serves as an officer of other funds. Mr. Hogan is an employee of Fidelity Investments (2005-present).
Chris Maher (1972)
Year of Election or Appointment: 2013
Assistant Treasurer
Mr. Maher serves as Assistant Treasurer of other funds. Mr. Maher is Vice President of Valuation Oversight and is an employee of Fidelity Investments. Previously, Mr. Maher served as Vice President of Asset Management Compliance (2013), Vice President of the Program Management Group of FMR (investment adviser firm, 2010-2013), and Vice President of Valuation Oversight (2008-2010).
John B. McGinty, Jr. (1962)
Year of Election or Appointment: 2016
Chief Compliance Officer
Mr. McGinty also serves as Chief Compliance Officer of other funds. Mr. McGinty is Senior Vice President of Asset Management Compliance for Fidelity Investments and is an employee of Fidelity Investments (2016-present). Mr. McGinty previously served as Vice President, Senior Attorney at Eaton Vance Management (investment management firm, 2015-2016), and prior to Eaton Vance as global CCO for all firm operations and registered investment companies at GMO LLC (investment management firm, 2009-2015). Before joining GMO LLC, Mr. McGinty served as Senior Vice President, Deputy General Counsel for Fidelity Investments (2007-2009).
Rieco E. Mello (1969)
Year of Election or Appointment: 2017
Assistant Treasurer
Mr. Mello also serves as Assistant Treasurer of other funds. Mr. Mello is an employee of Fidelity Investments (1995-present).
Jason P. Pogorelec (1975)
Year of Election or Appointment: 2015
Assistant Secretary
Mr. Pogorelec also serves as Assistant Secretary of other funds. Mr. Pogorelec serves as Vice President, Associate General Counsel (2010-present) and is an employee of Fidelity Investments (2006-present).
Stacie M. Smith (1974)
Year of Election or Appointment: 2013
Assistant Treasurer
Ms. Smith also serves as an officer of other funds. She is an employee of Fidelity Investments (2009-present) and has served in other fund officer roles. Prior to joining Fidelity Investments, Ms. Smith served as Senior Audit Manager of Ernst & Young LLP (accounting firm, 1996-2009). Previously, Ms. Smith served as Deputy Treasurer of certain Fidelity® funds (2013-2016).
Marc L. Spector (1972)
Year of Election or Appointment: 2016
Deputy Treasurer
Mr. Spector also serves as an officer of other funds. Mr. Spector is an employee of Fidelity Investments (2016-present). Prior to joining Fidelity Investments, Mr. Spector served as Director at the Siegfried Group (accounting firm, 2013-2016), and prior to Siegfried Group as audit senior manager at Deloitte & Touche (accounting firm, 2005-2013).
Renee Stagnone (1975)
Year of Election or Appointment: 2016
Assistant Treasurer
Ms. Stagnone also serves as an officer of other funds. Ms. Stagnone is an employee of Fidelity Investments (1997-present). Previously, Ms. Stagnone served as Deputy Treasurer of certain Fidelity® funds (2013-2016).
Shareholder Expense Example
As a shareholder of the Fund, you incur two types of costs: (1) transaction costs and (2) ongoing costs, including management fees and other Fund expenses. This Example is intended to help you understand your ongoing costs (in dollars) of investing in the Fund and to compare these costs with the ongoing costs of investing in other mutual funds.
The actual expense Example is based on an investment of $1,000 invested at the beginning of the period and held for the entire period (May 30, 2017 to July 31, 2017). The hypothetical expense Example is based on an investment of $1,000 invested for the one-half year period (February 1, 2017 to July 31, 2017).
Actual Expenses
The first line of the accompanying table for each class of the Fund provides information about actual account values and actual expenses. You may use the information in this line, together with the amount you invested, to estimate the expenses that you paid over the period. Simply divide your account value by $1,000.00 (for example, an $8,600 account value divided by $1,000.00 = 8.6), then multiply the result by the number in the first line for a class of the Fund under the heading entitled "Expenses Paid During Period" to estimate the expenses you paid on your account during this period. In addition, the Fund, as a shareholder in the underlying Fidelity Central Funds, will indirectly bear its pro-rata share of the fees and expenses incurred by the underlying Fidelity Central Funds. These fees and expenses are not included in the Fund's annualized expense ratio used to calculate the expense estimate in the table below.
Hypothetical Example for Comparison Purposes
The second line of the accompanying table for each class of the Fund provides information about hypothetical account values and hypothetical expenses based on a Class' actual expense ratio and an assumed rate of return of 5% per year before expenses, which is not the Class' actual return. The hypothetical account values and expenses may not be used to estimate the actual ending account balance or expenses you paid for the period. You may use this information to compare the ongoing costs of investing in the Fund and other funds. To do so, compare this 5% hypothetical example with the 5% hypothetical examples that appear in the shareholder reports of the other funds. In addition, the Fund, as a shareholder in the underlying Fidelity Central Funds, will indirectly bear its pro-rata share of the fees and expenses incurred by the underlying Fidelity Central Funds. These fees and expenses are not included in the Fund's annualized expense ratio used to calculate the expense estimate in the table below.
Please note that the expenses shown in the table are meant to highlight your ongoing costs only and do not reflect any transaction costs. Therefore, the second line of the table is useful in comparing ongoing costs only, and will not help you determine the relative total costs of owning different funds.
| | Annualized Expense Ratio-A | Beginning
Account Value | Ending
Account Value
July 31, 2017 | Expenses Paid
During Period |
| Commodity Strategy | .60% | | | |
| Actual | | $1,000.00 | $1,015.00 | $1.04-B |
| Hypothetical-C | | $1,000.00 | $1,021.82 | $3.01-D |
| Class F | .40% | | | |
| Actual | | $1,000.00 | $1,016.00 | $.70-B |
| Hypothetical-C | | $1,000.00 | $1,022.81 | $2.01-D |
A Annualized expense ratio reflects consolidated expenses net of applicable fee waivers.
B Actual expenses are equal to each Class' annualized expense ratio, multiplied by the average account value over the period, multiplied by 63/365 (to reflect the period May 30, 2017 to July 31, 2017).
C 5% return per year before expenses
D Hypothetical expenses are equal to each Class' annualized expense ratio, multiplied by the average account value over the period, multiplied by 181/365 (to reflect the one-half year period).
Distributions (Unaudited)
The Board of Trustees of Fidelity Commodity Strategy Fund voted to pay to shareholders of record at the opening of business on record date, the following distributions per share derived from capital gains realized from sales of portfolio securities, and dividends derived from net investment income:
| | Pay Date | Record Date | Dividends | Capital Gains |
| Fidelity Commodity Strategy Fund | | | | |
| Commodity Strategy | 09/18/17 | 09/15/17 | $0.007 | $0.015 |
| Class F | 09/18/17 | 09/15/17 | $0.010 | $0.015 |
|
Board Approval of Investment Advisory Contracts and Management Fees
On September 15, 2016, the Board of Trustees, including the Independent Trustees (together, the Board), voted to approve the management contract with Geode Capital Management, LLC (Geode) (the Advisory Contract) and the administration agreement with Fidelity Management & Research Company for the fund. The Board, assisted by the advice of fund counsel and Independent Trustees' counsel, considered a broad range of information.
Nature, Extent, and Quality of Services Provided. The Board considered staffing as it relates to the fund, including the backgrounds of investment personnel of Geode, and also considered the fund's investment objective, strategies, and related investment philosophy. The Board also considered that, although the fund is a new fund, Fidelity has utilized Geode as a sub-adviser for other products and is familiar with Geode's management abilities with respect to a fund that pursues an identical investment strategy.
Resources Dedicated to Investment Management and Support Services. The Board reviewed the general qualifications and capabilities of Geode's investment staff, including their size, education, experience, and resources, as well as Geode's approach to recruiting, training, managing, and compensating investment personnel. The Board noted that Geode's analysts have extensive resources, tools and capabilities that allow them to conduct sophisticated quantitative and fundamental analysis, as well as credit analysis of issuers, counterparties and guarantors. Further, the Board considered that Geode's investment professionals have sufficient access to information and data so as to provide competitive investment results over time, and that those professionals also have access to sophisticated tools that permit them to assess portfolio construction and risk and performance attribution characteristics continuously. The Board also noted the extensive resources devoted by Fidelity to providing non-advisory services to the fund. Additionally, in its deliberations, the Board considered Geode's trading, risk management compliance, and technology and operations capabilities and resources, which are integral parts of the investment management process.
Shareholder and Administrative Services. The Board considered (i) the nature, extent, quality, and cost of advisory services performed by Geode under the Advisory Contract and administrative and shareholder services performed by Fidelity under separate agreements covering administration, transfer agency, pricing and bookkeeping, and securities lending services for the fund; (ii) the nature and extent of the supervision of third party service providers, principally custodians, subcustodians, and pricing vendors; and (iii) the resources devoted to, and the record of compliance with, the fund's compliance policies and procedures.
The Board noted that the growth of fund assets over time across the complex allows Fidelity to reinvest in the development of services designed to enhance the value or convenience of the Fidelity funds as investment vehicles. These services include 24-hour access to account information and market information through telephone representatives and over the Internet, investor education materials and asset allocation tools, and the expanded availability of Fidelity Investor Centers.
Investment Performance. The fund is a new fund and therefore had no historical performance for the Board to review at the time it approved the fund's Advisory Contract. The Board considered the Investment Advisers' strength in fundamental, research-driven security selection, which the Board is familiar with through its supervision of other Fidelity funds.
Based on its review, the Board concluded that the nature, extent, and quality of services to be provided to the fund under the Advisory Contract should benefit the shareholders of the fund.
Competitiveness of Management Fee and Total Expense Ratio. The Board considered the fund's proposed management fee out of which Geode will pay all "fund-level" expenses, with certain limited exceptions, and the projected total expense ratio of each class of the fund in reviewing the Advisory Contract. The Board noted that the fund's proposed management fee rate is higher than the median fee rate of funds in its Lipper peer group. The Board considered that, unlike most other funds in this peer group, which track performance of broad based equity stock indexes, the fund will track the performance of a more specialized index, and that its proposed management fee is higher because of its specialized commodity-linked derivative strategy. The Board also considered that the projected total expense ratio of each class of the fund is above the median for those funds and classes used by the Board for management fee comparisons that have a similar sales load structure.
Based on its review, the Board concluded that the fund's management fee and the projected total expense ratio of each class of the fund were reasonable in light of the services that the fund and its shareholders will receive and the other factors considered.
Costs of the Services and Profitability. The fund is a new fund and therefore no revenue, cost, or profitability data was available for the Board to review in respect of the fund at the time it approved the Advisory Contract. In connection with its future renewal of the fund's Advisory Contract, the Board will consider the revenues earned and the expenses incurred by Geode and Fidelity in conducting the business of developing, marketing, distributing, managing, administering and servicing the fund and servicing the fund's shareholders.
Economies of Scale. The Board will consider economies of scale when there is operating experience to permit assessment thereof. It noted that, notwithstanding the entrepreneurial risk associated with a new fund, the management fee was at a level normally associated, by comparison with competitors, with very high fund net assets, and Fidelity asserted to the Board that the level of the fee anticipated economies of scale at lower asset levels even before, if ever, economies of scale are achieved. The Board also noted that the fund and its shareholders would have access to the very considerable number and variety of services available through Fidelity and its affiliates.
Based on its evaluation of all of the conclusions noted above, and after considering all factors it believed relevant, the Board concluded that the advisory fee structures are fair and reasonable, and that the fund's Advisory Contract should be approved.
Corporate Headquarters
245 Summer St.
Boston, MA 02210
www.fidelity.com
CSZ-F-ANN-0917
1.9879564.100
Fidelity® Series Commodity Strategy Fund Fidelity® Series Commodity Strategy Fund
Class F
Annual Report July 31, 2017 |
|
Contents
To view a fund's proxy voting guidelines and proxy voting record for the 12-month period ended June 30, visit http://www.fidelity.com/proxyvotingresults or visit the Securities and Exchange Commission's (SEC) web site at http://www.sec.gov.
You may also call 1-800-544-8544, or for Class F, call 1-800-835-5092, to request a free copy of the proxy voting guidelines.
Standard & Poor's, S&P and S&P 500 are registered service marks of The McGraw-Hill Companies, Inc. and have been licensed for use by Fidelity Distributors Corporation.
Other third-party marks appearing herein are the property of their respective owners.
All other marks appearing herein are registered or unregistered trademarks or service marks of FMR LLC or an affiliated company. © 2017 FMR LLC. All rights reserved.
This report and the financial statements contained herein are submitted for the general information of the shareholders of the Fund. This report is not authorized for distribution to prospective investors in the Fund unless preceded or accompanied by an effective prospectus.
A fund files its complete schedule of portfolio holdings with the SEC for the first and third quarters of each fiscal year on Form N-Q. Forms N-Q are available on the SEC’s web site at http://www.sec.gov. A fund's Forms N-Q may be reviewed and copied at the SEC’s Public Reference Room in Washington, DC. Information regarding the operation of the SEC's Public Reference Room may be obtained by calling 1-800-SEC-0330.
For a complete list of a fund's portfolio holdings, view the most recent holdings listing, semiannual report, or annual report on Fidelity's web site at http://www.fidelity.com, http://www.institutional.fidelity.com, or http://www.401k.com, as applicable.
NOT FDIC INSURED •MAY LOSE VALUE •NO BANK GUARANTEE
Neither the Fund nor Fidelity Distributors Corporation is a bank.
Performance: The Bottom Line
Average annual total return reflects the change in the value of an investment, assuming reinvestment of distributions from dividend income and capital gains (the profits earned upon the sale of securities that have grown in value, if any) and assuming a constant rate of performance each year. The hypothetical investment and the average annual total returns do not reflect the deduction of taxes that a shareholder would pay on fund distributions or the redemption of fund shares. During periods of reimbursement by Fidelity, a fund’s total return will be greater than it would be had the reimbursement not occurred. How a fund did yesterday is no guarantee of how it will do tomorrow.
Average Annual Total Returns
| For the periods ended July 31, 2017 | Past 1 year | Past 5 years | Life of fundA |
| Fidelity® Series Commodity Strategy Fund | 0.38% | (10.55)% | (5.43)% |
| Class F | 0.38% | (10.38)% | (5.26)% |
A From October 1, 2009
$10,000 Over Life of Fund
Let's say hypothetically that $10,000 was invested in Fidelity® Series Commodity Strategy Fund, a class of the fund, on October 1, 2009, when the fund started.
The chart shows how the value of your investment would have changed, and also shows how the Bloomberg® Commodity Index Total Return performed over the same period.
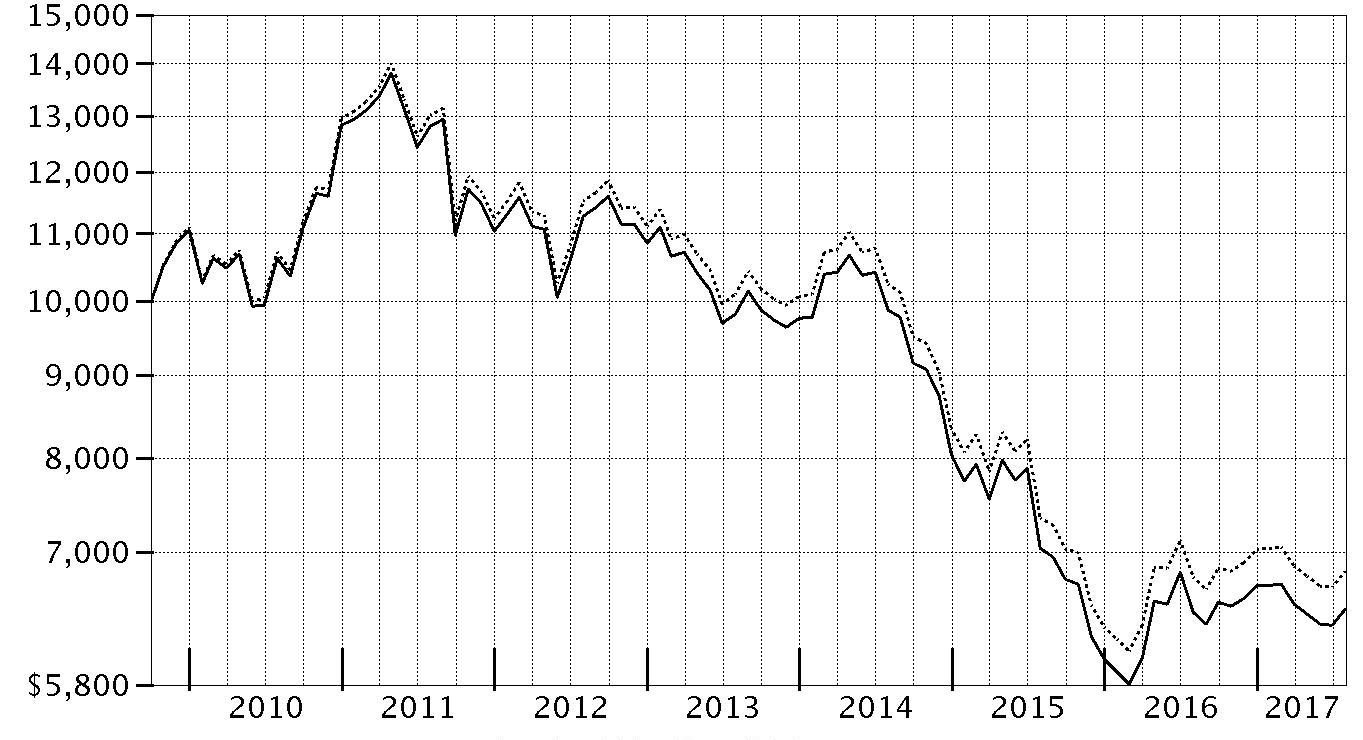
| Period Ending Values |
| $6,459 | Fidelity® Series Commodity Strategy Fund |
| $6,812 | Bloomberg® Commodity Index Total Return |
Management's Discussion of Fund Performance
Market Recap: The U.S. equity bellwether S&P 500
® index gained 16.04% for the year ending July 31, 2017, rising sharply following the November election and continuing to rally through the end of February on optimism for President Trump’s pro-business agenda. Equity markets leveled off, however, as the fledgling administration faced the first test of its domestic agenda. Stocks reacted with uncertainty to efforts by Congress in March to repeal and replace the Affordable Care Act, and then reverted upward through July 31. Growth stocks surged ahead of value, while small-caps’ advantage over large-caps narrowed. Sector-wise, financials (+36%) fared best, riding an uptick in bond yields and a surge in banks, particularly post-election. Information technology gained 29%, as a handful of major index constituents posted stellar returns. Industrials (+18%) was boosted by a call for increased infrastructure spending. Consumer discretionary (+14%) slightly lagged the broader market because brick-and-mortar retailers continued to suffer from increased online competition. Energy (0%) was hurt by low oil prices. Utilities (+6%), consumer staples (+4%), telecommunication services (-7%) and real estate (-2%) all struggled amid an improved backdrop for riskier assets that curbed demand for dividend-rich sectors, as well as the likelihood of further interest rate hikes later in 2017.
Comments from Bobe Simon, who oversees the fund as Senior Portfolio Manager for Geode Capital Management, LLC: For the year, the fund’s share classes slightly lagged the 0.77% gain of the benchmark Bloomberg Commodity Index Total Return℠. The strategy aims to provide broad-based exposure to commodities via commodity-linked futures/swaps or structured notes. Commodity-linked investments may be more volatile and less liquid than the underlying commodity, instruments or measures, and thus fund performance may at times vary from the benchmark. This period, the fund was helped by its exposure to industrial metals, with copper (+28%), aluminum (+14%) and zinc (+23%) riding strengthening demand from China – a key consumer for these economically important metals – and possible increased U.S. infrastructure spending following the November elections. Precious metals, however, were decidedly negative, with gold and silver prices returning -7% and -19%, respectively, as the U.S. dollar strengthened and interest rates climbed. Meanwhile, within agriculture, various so-called “softs” were sluggish performers for the year, with sugar (-25%) and coffee (-13%) retreating amid excess supply. In the energy sector, natural gas was the weakest commodity type of the period, returning -24% on generally milder-than-expected weather conditions. However, Brent and WTI crude oil gained 8% and 6%, respectively, lifted in part by the late-2016 decision by OPEC to reduce oil production, even as optimism about the effectiveness of the agreement waned.
The views expressed above reflect those of the portfolio manager(s) only through the end of the period as stated on the cover of this report and do not necessarily represent the views of Fidelity or any other person in the Fidelity organization. Any such views are subject to change at any time based upon market or other conditions and Fidelity disclaims any responsibility to update such views. These views may not be relied on as investment advice and, because investment decisions for a Fidelity fund are based on numerous factors, may not be relied on as an indication of trading intent on behalf of any Fidelity fund.
Consolidated Investment Summary (Unaudited)
The information in the following tables is based on the Fund's commodity-linked investments and excludes short-term investment-grade debt securities, cash and cash equivalents.
Commodity Instruments as of July 31, 2017*
| % of fund’s total commodity-linked investments |
| | Commodity Swaps | 83.0% |
| | Commodity Futures | 17.0% |

| % of fund’s total commodity-linked investments 6 months ago |
| | Commodity Swaps | 78.9% |
| | Commodity Futures | 21.1% |

Commodity Sector Diversification as of July 31, 2017*
| % of fund’s total commodity-linked investments |
| | Agriculture | 30.5% |
| | Energy | 28.1% |
| | Industrial Metals | 19.1% |
| | Precious Metals | 16.3% |
| | Livestock | 6.0% |

| % of fund’s total commodity-linked investments 6 months ago |
| | Agriculture | 30.8% |
| | Energy | 29.0% |
| | Industrial Metals | 18.2% |
| | Precious Metals | 15.8% |
| | Livestock | 6.2% |

* Investments in Commodity Swaps provide exposure to the commodities market via the Bloomberg Commodity Index Total Return, an unmanaged index composed of futures contracts on 22 physical commodities. The Fund does not invest directly in physical commodities.
Consolidated Investments July 31, 2017
Showing Percentage of Net Assets
| U.S. Treasury Obligations - 6.1% | | | |
| | | Principal Amount | Value |
| U.S. Treasury Bills, yield at date of purchase 1.03% to 1.12% 10/19/17 to 11/2/17 (a)(b) | | | |
| (Cost $234,409,015) | | 235,000,000 | 234,396,870 |
| | | Shares | Value |
|
| Money Market Funds - 91.7% | | | |
| Fidelity Cash Central Fund, 1.11% (c) | | | |
| (Cost $3,540,586,003) | | 3,540,381,685 | 3,541,089,761 |
| TOTAL INVESTMENT PORTFOLIO - 97.8% | | | |
| (Cost $3,774,995,018) | | | 3,775,486,631 |
| NET OTHER ASSETS (LIABILITIES) - 2.2% | | | 84,326,134 |
| NET ASSETS - 100% | | | $3,859,812,765 |
| Futures Contract | | | |
| | Expiration Date | Underlying Face Amount at Value | Unrealized Appreciation/(Depreciation) |
| Purchased | | | |
| Commodity Futures Contracts | | | |
| 2,714 CBOT Corn Contracts (United States) | Sept. 2017 | 50,310,775 | $(2,656,222) |
| 358 CBOT HRW Wheat Contracts (United States) | Sept. 2017 | 8,498,025 | 162,898 |
| 769 CBOT Soybean Contracts (United States) | Nov. 2017 | 38,728,763 | 2,593,956 |
| 611 CBOT Soybean Meal Contracts (United States) | Dec. 2017 | 19,881,940 | 1,025,195 |
| 877 CBOT Soybean Oil Contracts (United States) | Dec. 2017 | 18,485,406 | 1,488,291 |
| 1,027 CBOT Wheat Contracts (United States) | Sept. 2017 | 24,365,575 | 840,414 |
| 536 CME Lean Hogs Contracts (United States) | Oct. 2017 | 14,155,760 | (637,423) |
| 568 CME Live Cattle Contracts (United States) | Oct. 2017 | 25,435,040 | (1,030,402) |
| 782 COMEX Copper Contracts (United States) | Sept. 2017 | 56,558,150 | 5,383,860 |
| 624 COMEX Gold 100 oz. Contracts (United States) | Dec. 2017 | 79,641,120 | 3,150,005 |
| 327 COMEX Silver Contracts (United States) | Sept. 2017 | 27,508,875 | (680,432) |
| 898 ICE Brent Crude Contracts (United Kingdom) | Sept. 2017 | 47,486,240 | 3,927,616 |
| 290 ICE Coffee 'C' Contracts (United States) | Sept. 2017 | 15,143,438 | 1,135,081 |
| 257 ICE Cotton No. 2 Contracts (United States) | Dec. 2017 | 8,848,510 | (453,106) |
| 958 ICE Sugar No. 11 Contracts (United States) | Oct. 2017 | 15,997,834 | 647,242 |
| 701 LME Aluminum Contracts (United Kingdom) | Sept. 2017 | 33,446,463 | 138,752 |
| 270 LME Nickel Contracts (United Kingdom) | Sept. 2017 | 16,511,850 | 2,173,226 |
| 270 LME Zinc Contracts (United Kingdom) | Sept. 2017 | 18,830,813 | 2,042,996 |
| 353 NYMEX Gasoline RBOB Contracts (United States) | Sept. 2017 | 24,842,446 | 2,952,642 |
| 1,590 NYMEX Natural Gas Contracts (United States) | August 2017 | 44,806,200 | (3,385,140) |
| 347 NYMEX NY Harbor ULSD Contracts (United States) | Sept. 2017 | 24,318,176 | 3,210,403 |
| 857 NYMEX WTI Crude Oil Contracts (United States) | August 2017 | 43,055,680 | 3,281,711 |
| TOTAL FUTURES CONTRACTS | | | $25,311,563 |
The face value of futures purchased as a percentage of Net Assets is 17%
For the period, the average monthly underlying face amount at value for futures contracts in the aggregate was $731,420,373.
Swaps
| Counterparty | Expiration Date | Notional Amount | Unrealized Appreciation/(Depreciation) |
| Total Return Swaps(1) | | | |
| Barclays Bank PLC | Oct. 2017 | $90,000,000 | $2,316,172 |
| CIBC | Aug. 2017 | 70,000,000 | 1,387,827 |
| CIBC | Aug. 2017 | 25,000,000 | 380,244 |
| CIBC | Sep. 2017 | 100,000,000 | 1,900,478 |
| CIBC | Oct. 2017 | 62,500,000 | 1,187,799 |
| CIBC | Oct. 2017 | 52,000,000 | 1,339,131 |
| CIBC | Oct. 2017 | 50,000,000 | 1,250,998 |
| Citibank, N.A. | Sep. 2017 | 111,000,000 | 3,104,336 |
| Citibank, N.A. | Sep. 2017 | 98,000,000 | 4,412,422 |
| Citibank, N.A. | Sep. 2017 | 55,000,000 | 1,045,263 |
| Citibank, N.A. | Oct. 2017 | 50,000,000 | 1,250,998 |
| Credit Suisse International | Aug. 2017 | 64,000,000 | 1,600,838 |
| Credit Suisse International | Sep. 2017 | 95,000,000 | 906,502 |
| Goldman Sachs Bank USA | Aug. 2017 | 62,000,000 | 777,900 |
| Goldman Sachs Bank USA | Aug. 2017 | 61,000,000 | 1,475,689 |
| Goldman Sachs Bank USA | Sep. 2017 | 99,000,000 | 5,840,894 |
| Goldman Sachs Bank USA | Oct. 2017 | 51,000,000 | 969,244 |
| Goldman Sachs Bank USA | Oct. 2017 | 25,000,000 | 643,813 |
| Goldman Sachs Bank USA | Nov. 2017 | 79,000,000 | 2,469,823 |
| JPMorgan Chase Bank, N.A. | Sep. 2017 | 78,000,000 | 2,754,485 |
| JPMorgan Chase Bank, N.A. | Nov. 2017 | 55,000,000 | 166,113 |
| Macquarie Bank Ltd. | Sep. 2017 | 76,000,000 | 1,446,294 |
| Macquarie Bank Ltd. | Sep. 2017 | 10,000,000 | 505,401 |
| Macquarie Bank Ltd. | Oct. 2017 | 75,000,000 | 1,878,032 |
| Macquarie Bank Ltd. | Nov. 2017 | 55,000,000 | 1,417,339 |
| Merrill Lynch International | Aug. 2017 | 57,000,000 | 1,360,850 |
| Merrill Lynch International | Aug. 2017 | 50,000,000 | 1,251,336 |
| Merrill Lynch International | Sep. 2017 | 104,000,000 | 4,627,652 |
| Merrill Lynch International | Sep. 2017 | 69,500,000 | 4,487,469 |
| Merrill Lynch International | Oct. 2017 | 75,000,000 | 1,425,996 |
| Merrill Lynch International | Oct. 2017 | 50,000,000 | 1,287,914 |
| Merrill Lynch International | Nov. 2017 | 107,000,000 | 2,381,396 |
| Merrill Lynch International | Nov. 2017 | 70,000,000 | 1,124,867 |
| Morgan Stanley Capital Group, Inc. | Aug. 2017 | 83,000,000 | (235,896) |
| Morgan Stanley Capital Group, Inc. | Oct. 2017 | 50,000,000 | 824,892 |
| Societe Generale | Aug. 2017 | 78,000,000 | 711,827 |
| Societe Generale | Aug. 2017 | 25,000,000 | 380,670 |
| Societe Generale | Oct. 2017 | 75,000,000 | 1,877,003 |
| Societe Generale | Oct. 2017 | 74,000,000 | 1,406,983 |
| Societe Generale | Oct. 2017 | 25,000,000 | 643,957 |
| Societe Generale | Nov. 2017 | 110,000,000 | 1,043,422 |
| UBS AG | Aug. 2017 | 122,000,000 | 1,856,630 |
| UBS AG | Sep. 2017 | 110,000,000 | 5,971,967 |
| UBS AG | Oct. 2017 | 84,500,000 | 2,114,476 |
| UBS AG | Nov. 2017 | 58,000,000 | 550,080 |
|
| TOTAL RETURN SWAPS | | | $77,521,526 |
|
(1) Each open total return swap is an agreement to receive the total return of the Bloomberg Commodity Index Total Return and pay a floating rate based on the 3-month US auction rate T-Bill plus a specified spread.
For the period, the average monthly notional amount for swaps in the aggregate was $2,757,783,333.
Legend
(a) Security or a portion of the security was pledged to cover margin requirements for futures contracts. At period end, the value of securities pledged amounted to $31,796,928.
(b) Security or a portion of the security has been segregated as collateral for open bi-lateral over-the-counter (OTC) swaps. At period end, the value of securities pledged amounted to $140,400,085.
(c) Affiliated fund that is generally available only to investment companies and other accounts managed by Fidelity Investments. The rate quoted is the annualized seven-day yield of the fund at period end. A complete unaudited listing of the fund's holdings as of its most recent quarter end is available upon request. In addition, each Fidelity Central Fund's financial statements, which are not covered by the Fund's Report of Independent Registered Public Accounting Firm, are available on the SEC's website or upon request.
Affiliated Central Funds
Information regarding fiscal year to date income earned by the Fund from investments in Fidelity Central Funds is as follows:
| Fund | Income earned |
| Fidelity Cash Central Fund | $20,466,902 |
| Total | $20,466,902 |
Consolidated Subsidiary
| | Value, beginning
of period | Purchases | Sales Proceeds | Dividend
Income | Value,
end of period |
Geode Series Comm-
odity Return Cayman Ltd. | $320,129,691 | $299,999,931 | $120,000,065 | $- | $513,941,534 |
Investment Valuation
The following is a summary of the inputs used, as of July 31, 2017, involving the Fund's assets and liabilities carried at fair value. The inputs or methodology used for valuing securities may not be an indication of the risk associated with investing in those securities. For more information on valuation inputs, and their aggregation into the levels used below, please refer to the Investment Valuation section in the accompanying Notes to Consolidated Financial Statements.
| | Valuation Inputs at Reporting Date: |
| Description | Total | Level 1 | Level 2 | Level 3 |
| Investments in Securities: | | | | |
| U.S. Government and Government Agency Obligations | $234,396,870 | $-- | $234,396,870 | $-- |
| Money Market Funds | 3,541,089,761 | 3,541,089,761 | -- | -- |
| Total Investments in Securities: | $3,775,486,631 | $3,541,089,761 | $234,396,870 | $-- |
| Derivative Instruments: | | | | |
| Assets | | | | |
| Futures Contracts | $34,154,288 | $34,154,288 | $-- | $-- |
| Swaps | 77,757,422 | -- | 77,757,422 | -- |
| Total Assets | $111,911,710 | $34,154,288 | $77,757,422 | $-- |
| Liabilities | | | | |
| Futures Contracts | $(8,842,725) | $(8,842,725) | $-- | $-- |
| Swaps | (235,896) | -- | (235,896) | -- |
| Total Liabilities | $(9,078,621) | $(8,842,725) | $(235,896) | $-- |
| Total Derivative Instruments: | $102,833,089 | $25,311,563 | $77,521,526 | $-- |
Value of Derivative Instruments
The following table is a summary of the Fund's value of derivative instruments by primary risk exposure as of July 31, 2017. For additional information on derivative instruments, please refer to the Derivative Instruments section in the accompanying Notes to Consolidated Financial Statements.
| Primary Risk Exposure / Derivative Type | Value |
| | Asset | Liability |
| Commodity Risk | | |
| Futures Contracts(a) | $34,154,288 | $(8,842,725) |
| Swaps(b) | 77,757,422 | (235,896) |
| Total Commodity Risk | $111,911,710 | $(9,078,621) |
(a) Reflects gross cumulative appreciation (depreciation) on futures contracts as presented in the Consolidated Schedule of Investments. In the Consolidated Statement of Assets and Liabilities, the period end daily variation margin is included in receivable or payable for daily variation margin for derivative instruments, and the net cumulative appreciation (depreciation) is included in net unrealized appreciation (depreciation).
(b) For bi-lateral over-the-counter (OTC) swaps, reflects gross value which is presented in the Consolidated Statement of Assets and Liabilities in the bi-lateral OTC swaps, at value line-items.
The following table is a summary of the Fund's derivatives inclusive of potential netting arrangements.
| Counterparty | Value of Derivative Assets | Value of Derivative Liabilities | Collateral Received(a) | Collateral Pledged(a) | Net(b) |
| Merrill Lynch International | $17,947,480 | $-- | $-- | $-- | $17,947,480 |
| Goldman Sachs Bank USA | 12,177,363 | -- | -- | -- | 12,177,363 |
| UBS AG | 10,493,153 | -- | -- | -- | 10,493,153 |
| Citibank, N.A. | 9,813,019 | -- | -- | -- | 9,813,019 |
| CIBC | 7,446,477 | -- | -- | -- | 7,446,477 |
| Societe Generale | 6,063,862 | -- | -- | -- | 6,063,862 |
| Macquarie Bank Ltd. | 5,247,066 | -- | -- | -- | 5,247,066 |
| JPMorgan Chase Bank, N.A. | 2,920,598 | -- | -- | -- | 2,920,598 |
| Credit Suisse International | 2,507,340 | -- | -- | -- | 2,507,340 |
| Barclays Bank PLC | 2,316,172 | -- | -- | -- | 2,316,172 |
| Morgan Stanley Capital Group, Inc. | 824,892 | (235,896) | -- | -- | 588,996 |
| Exchange Traded Futures | 34,154,288 | (8,842,725) | -- | -- | 25,311,563 |
| Total | $111,911,710 | $(9,078,621) | | | |
(a) Reflects collateral received from or pledged to an individual counterparty, excluding any excess or initial collateral amounts.
(b) Net represents the receivable / (payable) that would be due from / (to) the counterparty in an event of default. Netting may be allowed across transactions traded under the same legal agreement with the same legal entity. Please refer to Derivative Instruments - Risk Exposures and the Use of Derivative Instruments section in the accompanying Notes to Consolidated Financial Statements.
See accompanying notes which are an integral part of the consolidated financial statements.
Consolidated Financial Statements
Consolidated Statement of Assets and Liabilities
| | | July 31, 2017 |
| Assets | | |
Investment in securities, at value — See accompanying schedule:
Unaffiliated issuers (cost $234,409,015) | $234,396,870 | |
| Fidelity Central Funds (cost $3,540,586,003) | 3,541,089,761 | |
| Total Investments (cost $3,774,995,018) | | $3,775,486,631 |
| Cash | | 652,645 |
| Receivable for fund shares sold | | 705,627 |
| Distributions receivable from Fidelity Central Funds | | 3,117,480 |
| Receivable for daily variation margin for derivative instruments | | 4,084,222 |
| Bi-lateral OTC swaps, at value | | 77,757,422 |
| Prepaid expenses | | 6,250 |
| Other receivables | | 229 |
| Total assets | | 3,861,810,506 |
| Liabilities | | |
| Payable for fund shares redeemed | $1,648,897 | |
| Bi-lateral OTC swaps, at value | 235,896 | |
| Accrued management fee | 111,327 | |
| Other payables and accrued expenses | 1,621 | |
| Total liabilities | | 1,997,741 |
| Net Assets | | $3,859,812,765 |
| Net Assets consist of: | | |
| Paid in capital | | $3,886,826,028 |
| Undistributed net investment income | | 4,541,285 |
| Accumulated undistributed net realized gain (loss) on investments | | (134,879,250) |
| Net unrealized appreciation (depreciation) on investments | | 103,324,702 |
| Net Assets | | $3,859,812,765 |
| Series Commodity Strategy: | | |
| Net Asset Value, offering price and redemption price per share ($1,805,456,811 ÷ 344,876,323 shares) | | $5.24 |
| Class F: | | |
| Net Asset Value, offering price and redemption price per share ($2,054,355,954 ÷ 387,564,558 shares) | | $5.30 |
See accompanying notes which are an integral part of the consolidated financial statements.
Consolidated Statement of Operations
| | | Year ended July 31, 2017 |
| Investment Income | | |
| Interest | | $2,110,663 |
| Income from Fidelity Central Funds | | 20,466,902 |
| Total income | | 22,577,565 |
| Expenses | | |
| Management fee | $13,543,268 | |
| Transfer agent fees | 2,846,016 | |
| Custodian fees and expenses | 4,764 | |
| Independent trustees' fees and expenses | 13,715 | |
| Subsidiary directors' fees | 15,000 | |
| Miscellaneous | 9,183 | |
| Total expenses before reductions | 16,431,946 | |
| Expense reductions | (1,592,441) | 14,839,505 |
| Net investment income (loss) | | 7,738,060 |
| Realized and Unrealized Gain (Loss) | | |
| Net realized gain (loss) on: | | |
| Investment securities: | | |
| Unaffiliated issuers | (1,338,535) | |
| Fidelity Central Funds | 113,950 | |
| Futures contracts | (58,235,513) | |
| Swaps | (135,015,801) | |
| Total net realized gain (loss) | | (194,475,899) |
| Change in net unrealized appreciation (depreciation) on: | | |
| Investment securities | 471,524 | |
| Futures contracts | 55,380,965 | |
| Swaps | 151,406,289 | |
| Total change in net unrealized appreciation (depreciation) | | 207,258,778 |
| Net gain (loss) | | 12,782,879 |
| Net increase (decrease) in net assets resulting from operations | | $20,520,939 |
See accompanying notes which are an integral part of the consolidated financial statements.
Consolidated Statement of Changes in Net Assets
| | Year ended July 31, 2017 | Year ended July 31, 2016 |
| Increase (Decrease) in Net Assets | | |
| Operations | | |
| Net investment income (loss) | $7,738,060 | $(3,673,811) |
| Net realized gain (loss) | (194,475,899) | (85,574,268) |
| Change in net unrealized appreciation (depreciation) | 207,258,778 | 47,377,522 |
| Net increase (decrease) in net assets resulting from operations | 20,520,939 | (41,870,557) |
| Share transactions - net increase (decrease) | 490,413,996 | 1,778,252,704 |
| Total increase (decrease) in net assets | 510,934,935 | 1,736,382,147 |
| Net Assets | | |
| Beginning of period | 3,348,877,830 | 1,612,495,683 |
| End of period | $3,859,812,765 | $3,348,877,830 |
| Other Information | | |
| Undistributed net investment income end of period | $4,541,285 | $– |
| Accumulated net investment loss end of period | $– | $(1,609,743) |
See accompanying notes which are an integral part of the consolidated financial statements.
Consolidated Financial Highlights — Fidelity Series Commodity Strategy Fund
| Years ended July 31, | 2017 | 2016 | 2015 | 2014 | 2013 |
| Selected Per–Share Data | | | | | |
| Net asset value, beginning of period | $5.22 | $5.71 | $8.01 | $7.96 | $9.15 |
| Income from Investment Operations | | | | | |
| Net investment income (loss)A | .01 | (.01) | (.03) | (.04) | (.04) |
| Net realized and unrealized gain (loss) | .01 | (.48) | (2.27) | .09 | (1.15) |
| Total from investment operations | .02 | (.49) | (2.30) | .05 | (1.19) |
| Net asset value, end of period | $5.24 | $5.22 | $5.71 | $8.01 | $7.96 |
| Total ReturnB | .38% | (8.58)% | (28.71)% | .63% | (13.01)% |
| Ratios to Average Net AssetsC,D | | | | | |
| Expenses before reductions | .56% | .65% | .64% | .64% | .64% |
| Expenses net of fee waivers, if any | .52% | .60% | .60% | .60% | .60% |
| Expenses net of all reductions | .52% | .60% | .60% | .60% | .60% |
| Net investment income (loss) | .13% | (.28)% | (.48)% | (.50)% | (.45)% |
| Supplemental Data | | | | | |
| Net assets, end of period (000 omitted) | $1,805,457 | $1,629,749 | $775,700 | $1,136,843 | $6,152,604 |
| Portfolio turnover rateE | 0% | 0% | 237% | 23% | 83% |
A Calculated based on average shares outstanding during the period.
B Total returns would have been lower if certain expenses had not been reduced during the applicable periods shown.
C Fees and expenses of any underlying Fidelity Central Funds are not included in the Fund's expense ratio. The Fund indirectly bears its proportionate share of the expenses of any underlying Fidelity Central Funds.
D Expense ratios reflect operating expenses of the class. Expenses before reductions do not reflect amounts reimbursed by the investment adviser or reductions from expense offset arrangements and do not represent the amount paid by the class during periods when reimbursements or reductions occur. Expenses net of fee waivers reflect expenses after reimbursement by the investment adviser but prior to reductions from expense offset arrangements. Expenses net of all reductions represent the net expenses paid by the class.
E Amount does not include the portfolio activity of any underlying Fidelity Central Funds.
See accompanying notes which are an integral part of the consolidated financial statements.
Consolidated Financial Highlights — Fidelity Series Commodity Strategy Fund Class F
| Years ended July 31, | 2017 | 2016 | 2015 | 2014 | 2013 |
| Selected Per–Share Data | | | | | |
| Net asset value, beginning of period | $5.28 | $5.76 | $8.07 | $8.00 | $9.17 |
| Income from Investment Operations | | | | | |
| Net investment income (loss)A | .02 | –B | (.02) | (.02) | (.02) |
| Net realized and unrealized gain (loss) | –B | (.48) | (2.29) | .09 | (1.15) |
| Total from investment operations | .02 | (.48) | (2.31) | .07 | (1.17) |
| Net asset value, end of period | $5.30 | $5.28 | $5.76 | $8.07 | $8.00 |
| Total ReturnC | .38% | (8.33)% | (28.62)% | .88% | (12.76)% |
| Ratios to Average Net AssetsD,E | | | | | |
| Expenses before reductions | .39% | .45% | .44% | .44% | .44% |
| Expenses net of fee waivers, if any | .35% | .40% | .40% | .40% | .40% |
| Expenses net of all reductions | .35% | .40% | .40% | .40% | .40% |
| Net investment income (loss) | .30% | (.08)% | (.28)% | (.30)% | (.25)% |
| Supplemental Data | | | | | |
| Net assets, end of period (000 omitted) | $2,054,356 | $1,719,128 | $836,796 | $1,048,777 | $6,114,419 |
| Portfolio turnover rateF | 0% | 0% | 237% | 23% | 83% |
A Calculated based on average shares outstanding during the period.
B Amount represents less than $.005 per share.
C Total returns would have been lower if certain expenses had not been reduced during the applicable periods shown.
D Fees and expenses of any underlying Fidelity Central Funds are not included in the Fund's expense ratio. The Fund indirectly bears its proportionate share of the expenses of any underlying Fidelity Central Funds.
E Expense ratios reflect operating expenses of the class. Expenses before reductions do not reflect amounts reimbursed by the investment adviser or reductions from expense offset arrangements and do not represent the amount paid by the class during periods when reimbursements or reductions occur. Expenses net of fee waivers reflect expenses after reimbursement by the investment adviser but prior to reductions from expense offset arrangements. Expenses net of all reductions represent the net expenses paid by the class.
F Amount does not include the portfolio activity of any underlying Fidelity Central Funds.
See accompanying notes which are an integral part of the consolidated financial statements.
Notes to Consolidated Financial Statements
For the period ended July 31, 2017
1. Organization.
Fidelity Series Commodity Strategy Fund (the Fund) is a non-diversified fund of Fidelity Oxford Street Trust (the Trust) and is authorized to issue an unlimited number of shares. Shares of the Fund are only available for purchase by mutual funds and accounts for which Fidelity Management & Research Company (FMR) or an affiliate serves as an investment manager. The Trust is registered under the Investment Company Act of 1940, as amended (the 1940 Act), as an open-end management investment company organized as a Massachusetts business trust. The Fund offers Series Commodity Strategy and Class F shares, each of which has equal rights as to assets and voting privileges. Each class has exclusive voting rights with respect to matters that affect that class.
Effective August 28, 2017, the Fund no longer offered Class F, and all outstanding shares of Class F were exchanged for shares of Series Commodity Strategy.
2. Consolidated Subsidiary.
The Fund invests in certain commodity-related investments through Geode Series Commodity Return Cayman Ltd., a wholly owned subsidiary (the "Subsidiary"). As of period end, the Fund held an investment of $513,941,534 in the Subsidiary, representing 13.3% of the Fund's net assets.
The financial statements have been consolidated and include accounts of the Fund and the Subsidiary. Accordingly, all inter-company transactions and balances have been eliminated.
3. Investments in Fidelity Central Funds.
The Fund invests in Fidelity Central Funds, which are open-end investment companies generally available only to other investment companies and accounts managed by FMR and its affiliates. The Fund's Consolidated Schedule of Investments lists each of the Fidelity Central Funds held as of period end, if any, as an investment of the Fund, but does not include the underlying holdings of each Fidelity Central Fund. As an Investing Fund, the Fund indirectly bears its proportionate share of the expenses of the underlying Fidelity Central Funds.
The Money Market Central Funds seek preservation of capital and current income and are managed by Fidelity Investments Money Management, Inc. (FIMM), an affiliate of FMR. Annualized expenses of the Money Market Central Funds as of their most recent shareholder report date are less than .005%.
A complete unaudited list of holdings for each Fidelity Central Fund is available upon request or at the Securities and Exchange Commission (the SEC) website at www.sec.gov. In addition, the financial statements of the Fidelity Central Funds, which are not covered by the Fund's Report of Independent Registered Public Accounting Firm, are available on the SEC website or upon request.
4. Significant Accounting Policies.
The Fund is an investment company and applies the accounting and reporting guidance of the Financial Accounting Standards Board (FASB) Accounting Standards Codification Topic 946 Financial Services – Investments Companies. The consolidated financial statements have been prepared in conformity with accounting principles generally accepted in the United States of America (GAAP), which require management to make certain estimates and assumptions at the date of the consolidated financial statements. Actual results could differ from those estimates. Subsequent events, if any, through the date that the consolidated financial statements were issued have been evaluated in the preparation of the consolidated financial statements. The following summarizes the significant accounting policies of the Fund:
Investment Valuation. Investments are valued as of 4:00 p.m. Eastern time on the last calendar day of the period. The Board of Trustees (the Board) has delegated the day to day responsibility for the valuation of the Fund's investments to the Fair Value Committee (the Committee) established by the Fund's investment adviser. In accordance with valuation policies and procedures approved by the Board, the Fund attempts to obtain prices from one or more third party pricing vendors or brokers to value its investments. When current market prices, quotations or currency exchange rates are not readily available or reliable, investments will be fair valued in good faith by the Committee, in accordance with procedures adopted by the Board. Factors used in determining fair value vary by investment type and may include market or investment specific events, changes in interest rates and credit quality. The frequency with which these procedures are used cannot be predicted and they may be utilized to a significant extent. The Committee oversees the Fund's valuation policies and procedures and reports to the Board on the Committee's activities and fair value determinations. The Board monitors the appropriateness of the procedures used in valuing the Fund's investments and ratifies the fair value determinations of the Committee.
The Fund categorizes the inputs to valuation techniques used to value its investments into a disclosure hierarchy consisting of three levels as shown below:
- Level 1 – quoted prices in active markets for identical investments
- Level 2 – other significant observable inputs (including quoted prices for similar investments, interest rates, prepayment speeds, etc.)
- Level 3 – unobservable inputs (including the Fund's own assumptions based on the best information available)
Valuation techniques used to value the Fund's investments by major category are as follows:
Debt securities, including restricted securities, are valued based on evaluated prices received from third party pricing vendors or from brokers who make markets in such securities. U.S. government and government agency obligations are valued by pricing vendors who utilize matrix pricing which considers yield or price of bonds of comparable quality, coupon, maturity and type or by broker-supplied prices. Swaps are marked-to-market daily based on valuations from third party pricing vendors, registered derivatives clearing organizations (clearinghouses) or broker-supplied valuations. These pricing sources may utilize inputs such as movements in the underlying index, interest rate curves, credit spread curves, default possibilities and recovery rates. When independent prices are unavailable or unreliable, debt securities and swaps may be valued utilizing pricing methodologies which consider similar factors that would be used by third party pricing vendors. Debt securities and swaps are generally categorized as Level 2 in the hierarchy but may be Level 3 depending on the circumstances.
Futures contracts are valued at the settlement price or official closing price established each day by the board of trade or exchange on which they are traded and are categorized as Level 1 in the hierarchy. Investments in open-end mutual funds, including the Fidelity Central Funds, are valued at their closing net asset value (NAV) each business day and are categorized as Level 1 in the hierarchy.
Changes in valuation techniques may result in transfers in or out of an assigned level within the disclosure hierarchy. The aggregate value of investments by input level as of July 31, 2017 is included at the end of the Fund's Consolidated Schedule of Investments.
Investment Transactions and Income. For financial reporting purposes, the Fund's investment holdings and NAV include trades executed through the end of the last business day of the period. The NAV per share for processing shareholder transactions is calculated as of the close of business of the New York Stock Exchange (NYSE), normally 4:00 p.m. Eastern time and includes trades executed through the end of the prior business day. Gains and losses on securities sold are determined on the basis of identified cost. Income and capital gain distributions from Fidelity Central Funds, if any, are recorded on the ex-dividend date. Interest income is accrued as earned and includes coupon interest and amortization of premium and accretion of discount on debt securities as applicable. Investment income is recorded net of foreign taxes withheld where recovery of such taxes is uncertain.
Class Allocations and Expenses. Investment income, realized and unrealized capital gains and losses, common expenses of the Fund, and certain fund-level expense reductions, if any, are allocated daily on a pro-rata basis to each class based on the relative net assets of each class to the total net assets of the Fund. Each class differs with respect to transfer agent fees incurred. Certain expense reductions may also differ by class. For the reporting period, the allocated portion of income and expenses to each class as a percent of its average net assets may vary due to the timing of recording these transactions in relation to fluctuating net assets of the classes. Expenses directly attributable to a fund are charged to that fund. Expenses attributable to more than one fund are allocated among the respective funds on the basis of relative net assets or other appropriate methods. Expense estimates are accrued in the period to which they relate and adjustments are made when actual amounts are known.
Income Tax Information and Distributions to Shareholders. Each year, the Fund intends to qualify as a regulated investment company under Subchapter M of the Internal Revenue Code, including distributing substantially all of its taxable income and realized gains. As a result, no provision for U.S. Federal income taxes is required. As of July 31, 2017, the Fund did not have any unrecognized tax benefits in the consolidated financial statements; nor is the Fund aware of any tax positions for which it is reasonably possible that the total amounts of unrecognized tax benefits will significantly change in the next twelve months. The Fund files a U.S. federal tax return, in addition to state and local tax returns as required. The Fund's federal income tax returns are subject to examination by the Internal Revenue Service (IRS) for a period of three fiscal years after they are filed. State and local tax returns may be subject to examination for an additional fiscal year depending on the jurisdiction.
The Subsidiary is classified as a controlled foreign corporation under Subchapter N of the Internal Revenue Code. Therefore, the Fund is required to increase its taxable income by its share of the Subsidiary's income. Net investment losses of the Subsidiary cannot be deducted by the Fund in the current period nor carried forward to offset taxable income in future periods.
Distributions are declared and recorded on the ex-dividend date. Income dividends and capital gain distributions are declared separately for each class. Income and capital gain distributions are determined in accordance with income tax regulations, which may differ from GAAP.
Capital accounts within the consolidated financial statements are adjusted for permanent book-tax differences. These adjustments have no impact on net assets or the results of operations. Capital accounts are not adjusted for temporary book-tax differences which will reverse in a subsequent period.
Book-tax differences are primarily due to controlled foreign corporations, capital loss carryforwards and losses deferred due to excise tax regulations.
The federal tax cost of investment securities and unrealized appreciation (depreciation) as of period end on an unconsolidated basis were as follows:
| Gross unrealized appreciation | $– |
| Gross unrealized depreciation | (3,162,178,482) |
| Net unrealized appreciation (depreciation) on securities | $(3,162,178,482) |
| Tax Cost | $7,019,950,620 |
The tax-based components of distributable earnings as of period end were as follows:
| Undistributed ordinary income | $4,541,284 |
| Capital loss carryforward | $(114,104,328) |
| Net unrealized appreciation (depreciation) on securities and other investments | $(3,059,345,393) |
Capital loss carryforwards are only available to offset future capital gains of the Fund to the extent provided by regulations and may be limited. Under the Regulated Investment Company Modernization Act of 2010 (the Act), the Fund is permitted to carry forward capital losses incurred in taxable years beginning after December 22, 2010 for an unlimited period and such capital losses are required to be used prior to any losses that expire. The capital loss carryforward information presented below, including any applicable limitation, is estimated as of fiscal period end and is subject to adjustment.
| No expiration | |
| Short-term | $(85,585,111) |
| Long-term | (28,519,217) |
| Total capital loss carryforward | $(114,104,328) |
5. Derivative Instruments.
Risk Exposures and the Use of Derivative Instruments. The Fund's investment objective allows the Fund to enter into various types of derivative contracts, including futures contracts and swaps. Derivatives are investments whose value is primarily derived from underlying assets, indices or reference rates and may be transacted on an exchange or over-the-counter (OTC). Derivatives may involve a future commitment to buy or sell a specified asset based on specified terms, to exchange future cash flows at periodic intervals based on a notional principal amount, or for one party to make one or more payments upon the occurrence of specified events in exchange for periodic payments from the other party.
The Fund primarily used derivatives to increase returns, to gain exposure to certain types of assets and to manage exposure to certain risks as defined below. The success of any strategy involving derivatives depends on analysis of numerous economic factors, and if the strategies for investment do not work as intended, the Fund may not achieve its objectives.
The Fund's use of derivatives increased or decreased its exposure to the following risk:
| Commodity Risk | Commodity risk is the risk that the value of a commodity will fluctuate as a result of changes in market prices.
|
The Fund is also exposed to additional risks from investing in derivatives, such as liquidity risk and counterparty credit risk. Liquidity risk is the risk that the Fund will be unable to close out the derivative in the open market in a timely manner. Counterparty credit risk is the risk that the counterparty will not be able to fulfill its obligation to the Fund. Derivative counterparty credit risk is managed through formal evaluation of the creditworthiness of all potential counterparties. On certain OTC derivatives such as bi-lateral swaps, the Fund attempts to reduce its exposure to counterparty credit risk by entering into an International Swaps and Derivatives Association, Inc. (ISDA) Master Agreement with each of its counterparties. The ISDA Master Agreement gives the Fund the right to terminate all transactions traded under such agreement upon the deterioration in the credit quality of the counterparty beyond specified levels. The ISDA Master Agreement gives each party the right, upon an event of default by the other party or a termination of the agreement, to close out all transactions traded under such agreement and to net amounts owed under each transaction to one net payable by one party to the other. Upon entering into a swap, the Fund is required to post an initial collateral amount (referred to as "Independent Amount"), as defined in the ISDA Master Agreement. The Fund is required to post additional collateral for the benefit of counterparties to meet the counterparty's unrealized appreciation on outstanding swap contracts and any such posted collateral is identified on the Consolidated Schedule of Investments. To mitigate counterparty credit risk on bi-lateral OTC derivatives, the Fund receives collateral in the form of cash or securities once the Fund's net unrealized appreciation on outstanding derivative contracts under an ISDA Master Agreement exceeds certain applicable thresholds, subject to certain minimum transfer provisions. The collateral received is held in segregated accounts with the Fund's custodian bank in accordance with the collateral agreements entered into between the Fund, the counterparty and the Fund's custodian bank. The Fund could experience delays and costs in gaining access to the collateral even though it is held by the Fund's custodian bank. The Fund's maximum risk of loss from counterparty credit risk related to bi-lateral OTC derivatives is generally the aggregate unrealized appreciation and unpaid counterparty payments in excess of any collateral pledged by the counterparty to the Fund. Exchange-traded futures contracts are not covered by the ISDA Master Agreement; however counterparty credit risk related to exchange-traded futures contracts may be mitigated by the protection provided by the exchange's clearinghouse. A summary of the Fund's derivatives inclusive of potential netting arrangements is presented at the end of the Consolidated Schedule of Investments.
Investing in derivatives may involve greater risks than investing in the underlying assets directly and, to varying degrees, may involve risk of loss in excess of any initial investment and collateral received and amounts recognized in the Consolidated Statement of Assets and Liabilities. In addition, there may be the risk that the change in value of the derivative contract does not correspond to the change in value of the underlying instrument.
Net Realized Gain (Loss) and Change in Net Unrealized Appreciation (Depreciation) on Derivatives. The table below, which reflects the impacts of derivatives on the financial performance of the Fund, summarizes the net realized gain (loss) and change in net unrealized appreciation (depreciation) for derivatives during the period as presented in the Consolidated Statement of Operations.
| Primary Risk Exposure / Derivative Type | Net Realized Gain (Loss) | Change in Net Unrealized Appreciation (Depreciation) |
| Commodity Risk | | |
| Futures Contracts | $(58,235,513) | $55,380,965 |
| Swaps | (135,015,801) | 151,406,289 |
| Total Commodity Risk | $(193,251,314) | $206,787,254 |
A summary of the value of derivatives by primary risk exposure as of period end is included at the end of the Consolidated Schedule of Investments.
Futures Contracts. A futures contract is an agreement between two parties to buy or sell a specified underlying instrument for a fixed price at a specified future date. The Fund used futures contracts to manage its exposure to the commodities market.
Upon entering into a futures contract, a fund is required to deposit either cash or securities (initial margin) with a clearing broker in an amount equal to a certain percentage of the face value of the contract. Futures contracts are marked-to-market daily and subsequent daily payments are made or received by a fund depending on the daily fluctuations in the value of the futures contracts and are recorded as unrealized appreciation or (depreciation). This receivable and/or payable, if any, is included in daily variation margin for derivative instruments in the Consolidated Statement of Assets and Liabilities. Realized gain or (loss) is recorded upon the expiration or closing of a futures contract. The net realized gain (loss) and change in net unrealized appreciation (depreciation) on futures contracts during the period is included in the Consolidated Statement of Operations.
Any open futures contracts at period end are presented in the Consolidated Schedule of Investments under the caption "Futures Contracts". The underlying face amount at value reflects each contract's exposure to the underlying instrument or index at period end. Securities deposited to meet initial margin requirements are identified in the Consolidated Schedule of Investments.
Swaps. A swap is a contract between two parties to exchange future cash flows at periodic intervals based on a notional principal amount. A bi-lateral OTC swap is a transaction between a fund and a dealer counterparty where cash flows are exchanged between the two parties for the life of the swap.
Bi-lateral OTC swaps are marked-to-market daily and changes in value are reflected in the Consolidated Statement of Assets and Liabilities in the bi-lateral OTC swaps at value line items.
Payments are exchanged at specified intervals, accrued daily commencing with the effective date of the contract and recorded as realized gain or (loss). Some swaps may be terminated prior to the effective date and realize a gain or loss upon termination. The net realized gain (loss) and change in net unrealized appreciation (depreciation) on swaps during the period is included in the Consolidated Statement of Operations.
Any open swaps at period end are included in the Consolidated Schedule of Investments under the caption "Swaps".
Total Return Swaps. Total return swaps are agreements between counterparties to exchange cash flows, one based on a market-linked return of an individual asset or a basket of assets (i.e., an index), and the other on a fixed or floating rate. To the extent the total return of the instrument or index underlying the transaction exceeds or falls short of the offsetting payment obligation, the Fund will receive a payment from or make a payment to the counterparty. The Fund entered into total return swaps to manage its commodities market exposure.
6. Fees and Other Transactions with Affiliates.
Management Fee and Administration Agreement. Effective June 1, 2017, under the management contract approved by the Board and shareholders, Geode Capital Management, LLC (the investment adviser) provides the Fund with investment management related services for which the Fund does not pay a management fee. In addition, the investment adviser pays all ordinary operating expenses of the Fund, except custody fees, fees and expenses of the independent Trustees, and certain miscellaneous expenses such as proxy and shareholder meeting expenses. FMR provides administrative services to the Fund and the investment adviser pays for these services. The investment adviser also provides investment management services to the Subsidiary. The Subsidiary pays the investment adviser a monthly management fee at an annual rate of .30% of its net assets. The Subsidiary also pays certain other expenses including custody and directors' fees.
Prior to June 1, 2017, the investment adviser provided the Fund with investment management services for which the Fund paid a monthly management fee that was based on an annual rate of .40% of the Fund's average net assets. Under the management contract, the investment adviser paid all other fund-level expenses, except the compensation of the independent Trustees and certain other expenses such as interest expense, including commitment fees.
FMR provided administrative services to the Fund and the investment adviser paid for these services.
The investment adviser also provided investment management services to the Subsidiary. The Subsidiary paid the investment adviser a monthly management fee at an annual rate of .30% of its net assets. The Subsidiary also paid certain other expenses including custody and directors' fees.
During the period, the investment adviser waived a portion of its management fee as described in the Expense Reductions note.
Transfer Agent Fees. Fidelity Investments Institutional Operations Company, Inc., (FIIOC), an affiliate of FMR, is the transfer, dividend disbursing and shareholder servicing agent for each class of the Fund. Effective June 1, 2017, fees for these services are no longer charged to the classes. Prior to June 1, 2017, FIIOC received an asset-based fee of Series Commodity Strategy's average net assets. FIIOC received no fees for providing transfer agency services to Class F. FIIOC pays for typesetting, printing and mailing of shareholder reports, except proxy statements.
For the period, transfer agent fees for each applicable class were as follows:
| | Amount | % of
Class-Level Average
Net Assets |
| Series Commodity Strategy | $2,846,016 | .17 |
Interfund Trades. The Fund may purchase from or sell securities to other Fidelity Funds under procedures adopted by the Board. The procedures have been designed to ensure these interfund trades are executed in accordance with Rule 17a-7 of the 1940 Act.
7. Committed Line of Credit.
The Fund participates with other funds managed by the investment adviser FMR or an affiliate in a $4.25 billion credit facility (the "line of credit") to be utilized for temporary or emergency purposes to fund shareholder redemptions or for other short-term liquidity purposes. The Fund has agreed to pay commitment fees on its pro-rata portion of the line of credit, which amounted to $9,183 and is reflected in Miscellaneous expenses on the Consolidated Statement of Operations. During the period, the Fund did not borrow on this line of credit.
8. Expense Reductions.
Prior to June 1, 2017, the investment adviser had contractually agreed to waive the Fund's management fee in an amount equal to the management fee paid by the Subsidiary. During the period, this waiver reduced the Fund's management fee by $1,591,037.
In addition, through arrangements with the Fund's custodian, credits realized as a result of certain uninvested cash balances were used to reduce the Fund's expenses. During the period, these credits reduced the Fund's custody expenses by $1,404.
9. Share Transactions.
Transactions for each class of shares were as follows:
| | Shares | Shares | Dollars | Dollars |
| | Year ended
July 31, 2017 | Year ended July 31, 2016 | Year ended
July 31, 2017 | Year ended July 31, 2016 |
| Series Commodity Strategy | | | | |
| Shares sold | 140,012,492 | 196,370,858 | $726,441,438 | $981,345,997 |
| Shares redeemed | (107,128,488) | (20,330,804) | (557,446,852) | (105,633,955) |
| Net increase (decrease) | 32,884,004 | 176,040,054 | $168,994,586 | $875,712,042 |
| Class F | | | | |
| Shares sold | 154,625,146 | 199,476,367 | $810,732,745 | $1,003,953,028 |
| Shares redeemed | (92,610,373) | (19,303,963) | (489,313,335) | (101,412,366) |
| Net increase (decrease) | 62,014,773 | 180,172,404 | $321,419,410 | $902,540,662 |
10. Other.
The Fund's organizational documents provide former and current trustees and officers with a limited indemnification against liabilities arising in connection with the performance of their duties to the Fund. In the normal course of business, the Fund may also enter into contracts that provide general indemnifications. The Fund's maximum exposure under these arrangements is unknown as this would be dependent on future claims that may be made against the Fund. The risk of material loss from such claims is considered remote.
At the end of the period, mutual funds and accounts managed by FMR or its affiliates were the owners of record of all of the outstanding shares of the Fund.
Report of Independent Registered Public Accounting Firm
To the Trustees of Fidelity Oxford Street Trust and Shareholders of Fidelity Series Commodity Strategy Fund:
In our opinion, the accompanying consolidated statement of assets and liabilities, including the consolidated investments, and the related consolidated statements of operations and of changes in net assets and the consolidated financial highlights present fairly, in all material respects, the consolidated financial position of Fidelity Series Commodity Strategy Fund (a fund of Fidelity Oxford Street Trust) (the "Fund") and its subsidiary as of July 31, 2017, the consolidated results of their operations for the year then ended, the changes in their net assets for each of the two years in the period then ended and the consolidated financial highlights for each of the five years in the period then ended, in conformity with accounting principles generally accepted in the United States of America. These financial statements and financial highlights (hereafter referred to as “financial statements”) are the responsibility of the Fund's management. Our responsibility is to express an opinion on these financial statements based on our audits. We conducted our audits of these financial statements in accordance with the standards of the Public Company Accounting Oversight Board (United States). Those standards require that we plan and perform the audit to obtain reasonable assurance about whether the financial statements are free of material misstatement. An audit includes examining, on a test basis, evidence supporting the amounts and disclosures in the financial statements, assessing the accounting principles used and significant estimates made by management, and evaluating the overall financial statement presentation. Our procedures included confirmation of securities owned as of July 31, 2017 by correspondence with the custodians and brokers; when replies were not received from brokers, we performed other auditing procedures. We believe that our audits provide a reasonable basis for our opinion.
PricewaterhouseCoopers LLP
Boston, Massachusetts
September 20, 2017
Trustees and Officers
The Trustees, Members of the Advisory Board (if any), and officers of the trust and fund, as applicable, are listed below. The Board of Trustees governs the fund and is responsible for protecting the interests of shareholders. The Trustees are experienced executives who meet periodically throughout the year to oversee the fund's activities, review contractual arrangements with companies that provide services to the fund, oversee management of the risks associated with such activities and contractual arrangements, and review the fund's performance. Each of the Trustees oversees 261 funds.
The Trustees hold office without limit in time except that (a) any Trustee may resign; (b) any Trustee may be removed by written instrument, signed by at least two-thirds of the number of Trustees prior to such removal; (c) any Trustee who requests to be retired or who has become incapacitated by illness or injury may be retired by written instrument signed by a majority of the other Trustees; and (d) any Trustee may be removed at any special meeting of shareholders by a two-thirds vote of the outstanding voting securities of the trust. Each Trustee who is not an interested person (as defined in the 1940 Act) of the trust and the fund is referred to herein as an Independent Trustee. Each Independent Trustee shall retire not later than the last day of the calendar year in which his or her 75th birthday occurs. The Independent Trustees may waive this mandatory retirement age policy with respect to individual Trustees. Officers and Advisory Board Members hold office without limit in time, except that any officer or Advisory Board Member may resign or may be removed by a vote of a majority of the Trustees at any regular meeting or any special meeting of the Trustees. Except as indicated, each individual has held the office shown or other offices in the same company for the past five years.
The fund’s Statement of Additional Information (SAI) includes more information about the Trustees. To request a free copy, call Fidelity at 1-800-544-8544 for Fidelity® Series Commodity Strategy Fund or 1-800-835-5092 for Class F.
Experience, Skills, Attributes, and Qualifications of the Trustees. The Governance and Nominating Committee has adopted a statement of policy that describes the experience, qualifications, attributes, and skills that are necessary and desirable for potential Independent Trustee candidates (Statement of Policy). The Board believes that each Trustee satisfied at the time he or she was initially elected or appointed a Trustee, and continues to satisfy, the standards contemplated by the Statement of Policy. The Governance and Nominating Committee also engages professional search firms to help identify potential Independent Trustee candidates who have the experience, qualifications, attributes, and skills consistent with the Statement of Policy. From time to time, additional criteria based on the composition and skills of the current Independent Trustees, as well as experience or skills that may be appropriate in light of future changes to board composition, business conditions, and regulatory or other developments, have also been considered by the professional search firms and the Governance and Nominating Committee. In addition, the Board takes into account the Trustees' commitment and participation in Board and committee meetings, as well as their leadership of standing and ad hoc committees throughout their tenure.
In determining that a particular Trustee was and continues to be qualified to serve as a Trustee, the Board has considered a variety of criteria, none of which, in isolation, was controlling. The Board believes that, collectively, the Trustees have balanced and diverse experience, qualifications, attributes, and skills, which allow the Board to operate effectively in governing the fund and protecting the interests of shareholders. Information about the specific experience, skills, attributes, and qualifications of each Trustee, which in each case led to the Board's conclusion that the Trustee should serve (or continue to serve) as a trustee of the fund, is provided below.
Board Structure and Oversight Function. Abigail P. Johnson is an interested person and currently serves as Chairman. The Trustees have determined that an interested Chairman is appropriate and benefits shareholders because an interested Chairman has a personal and professional stake in the quality and continuity of services provided to the fund. Independent Trustees exercise their informed business judgment to appoint an individual of their choosing to serve as Chairman, regardless of whether the Trustee happens to be independent or a member of management. The Independent Trustees have determined that they can act independently and effectively without having an Independent Trustee serve as Chairman and that a key structural component for assuring that they are in a position to do so is for the Independent Trustees to constitute a substantial majority for the Board. The Independent Trustees also regularly meet in executive session. Marie L. Knowles serves as Chairman of the Independent Trustees and as such (i) acts as a liaison between the Independent Trustees and management with respect to matters important to the Independent Trustees and (ii) with management prepares agendas for Board meetings.
Fidelity® funds are overseen by different Boards of Trustees. The fund's Board oversees Fidelity's investment-grade bond, money market, asset allocation and certain equity funds, and other Boards oversee Fidelity's high income, sector and other equity funds. The asset allocation funds may invest in Fidelity® funds that are overseen by such other Boards. The use of separate Boards, each with its own committee structure, allows the Trustees of each group of Fidelity® funds to focus on the unique issues of the funds they oversee, including common research, investment, and operational issues. On occasion, the separate Boards establish joint committees to address issues of overlapping consequences for the Fidelity® funds overseen by each Board.
The Trustees operate using a system of committees to facilitate the timely and efficient consideration of all matters of importance to the Trustees, the fund, and fund shareholders and to facilitate compliance with legal and regulatory requirements and oversight of the fund's activities and associated risks. The Board, acting through its committees, has charged the adviser and FMR and its affiliates with (i) identifying events or circumstances the occurrence of which could have demonstrably adverse effects on the fund's business and/or reputation; (ii) implementing processes and controls to lessen the possibility that such events or circumstances occur or to mitigate the effects of such events or circumstances if they do occur; and (iii) creating and maintaining a system designed to evaluate continuously business and market conditions in order to facilitate the identification and implementation processes described in (i) and (ii) above. Because the day-to-day operations and activities of the fund are carried out by or through the adviser, FMR and its affiliates, and other service providers, the fund's exposure to risks is mitigated but not eliminated by the processes overseen by the Trustees. While each of the Board's committees has responsibility for overseeing different aspects of the fund's activities, oversight is exercised primarily through the Operations and Audit Committees. In addition, an ad hoc Board committee of Independent Trustees has worked with FMR to enhance the Board's oversight of investment and financial risks, legal and regulatory risks, technology risks, and operational risks, including the development of additional risk reporting to the Board. Appropriate personnel, including but not limited to the fund's Chief Compliance Officer (CCO), FMR's internal auditor, the independent accountants, the fund's Treasurer and portfolio management personnel, make periodic reports to the Board's committees, as appropriate, including an annual review of Fidelity's risk management program for the Fidelity® funds. The responsibilities of each standing committee, including their oversight responsibilities, are described further under "Standing Committees of the Trustees."
Interested Trustees*:
Correspondence intended for a Trustee who is an interested person may be sent to Fidelity Investments, 245 Summer Street, Boston, Massachusetts 02210.
Name, Year of Birth; Principal Occupations and Other Relevant Experience+
Abigail P. Johnson (1961)
Year of Election or Appointment: 2009
Trustee
Chairman of the Board of Trustees
Ms. Johnson also serves as Trustee of other Fidelity® funds. Ms. Johnson serves as Chairman (2016-present), Chief Executive Officer (2014-present), and Director (2007-present) of FMR LLC (diversified financial services company), President of Fidelity Financial Services (2012-present) and President of Personal, Workplace and Institutional Services (2005-present). Ms. Johnson is Chairman and Director of FMR Co., Inc. (investment adviser firm, 2011-present) and Chairman and Director of FMR (investment adviser firm, 2011-present). Previously, Ms. Johnson served as Vice Chairman (2007-2016) and President (2013-2016) of FMR LLC, President and a Director of FMR (2001-2005), a Trustee of other investment companies advised by FMR, Fidelity Investments Money Management, Inc. (investment adviser firm), and FMR Co., Inc. (2001-2005), Senior Vice President of the Fidelity® funds (2001-2005), and managed a number of Fidelity® funds. Ms. Abigail P. Johnson and Mr. Arthur E. Johnson are not related.
Jennifer Toolin McAuliffe (1959)
Year of Election or Appointment: 2016
Trustee
Ms. McAuliffe also serves as Trustee of other Fidelity® funds. Ms. McAuliffe previously served as a Member of the Advisory Board of certain Fidelity® funds (2016) and as Co-Head of Fixed Income of Fidelity Investments Limited (now known as FIL Limited (FIL)) (diversified financial services company). Earlier roles at FIL included Director of Research for FIL’s credit and quantitative teams in London, Hong Kong and Tokyo. Ms. McAuliffe also was the Director of Research for taxable and municipal bonds at Fidelity Investments Money Management, Inc. Ms. McAuliffe is also a director or trustee of several not-for-profit entities.
* Determined to be an “Interested Trustee” by virtue of, among other things, his or her affiliation with the trust or various entities under common control with FMR.
+ The information includes the Trustee's principal occupation during the last five years and other information relating to the experience, attributes, and skills relevant to the Trustee's qualifications to serve as a Trustee, which led to the conclusion that the Trustee should serve as a Trustee for the fund.
Independent Trustees:
Correspondence intended for an Independent Trustee may be sent to Fidelity Investments, P.O. Box 55235, Boston, Massachusetts 02205-5235.
Name, Year of Birth; Principal Occupations and Other Relevant Experience+
Elizabeth S. Acton (1951)
Year of Election or Appointment: 2013
Trustee
Ms. Acton also serves as Trustee of other Fidelity® funds. Prior to her retirement in April 2012, Ms. Acton was Executive Vice President, Finance (2011-2012), Executive Vice President, Chief Financial Officer (2002-2011), and Treasurer (2004-2005) of Comerica Incorporated (financial services). Prior to joining Comerica, Ms. Acton held a variety of positions at Ford Motor Company (1983-2002), including Vice President and Treasurer (2000-2002) and Executive Vice President and Chief Financial Officer of Ford Motor Credit Company (1998-2000). Ms. Acton currently serves as a member of the Board of Directors and Audit and Finance Committees of Beazer Homes USA, Inc. (homebuilding, 2012-present). Previously, Ms. Acton served as a Member of the Advisory Board of certain Fidelity® funds (2013-2016).
John Engler (1948)
Year of Election or Appointment: 2014
Trustee
Mr. Engler also serves as Trustee of other Fidelity® funds. He serves on the board of directors for Universal Forest Products (manufacturer and distributor of wood and wood-alternative products, 2003-present) and K12 Inc. (technology-based education company, 2012-present). Previously, Mr. Engler served as a Member of the Advisory Board of certain Fidelity® funds (2014-2016), president of the Business Roundtable (2011-2017), a trustee of The Munder Funds (2003-2014), president and CEO of the National Association of Manufacturers (2004-2011), member of the Board of Trustees of the Annie E. Casey Foundation (2004-2015), and as governor of Michigan (1991-2003). He is a past chairman of the National Governors Association.
Albert R. Gamper, Jr. (1942)
Year of Election or Appointment: 2006
Trustee
Mr. Gamper also serves as Trustee of other Fidelity® funds. Prior to his retirement in December 2004, Mr. Gamper served as Chairman of the Board of CIT Group Inc. (commercial finance). During his tenure with CIT Group Inc. Mr. Gamper served in numerous senior management positions, including Chairman (1987-1989; 1999-2001; 2002-2004), Chief Executive Officer (1987-2004), and President (2002-2003). Mr. Gamper currently serves as a member of the Board of Directors of Public Service Enterprise Group (utilities, 2000-present), and Member of the Board of Trustees of Barnabas Health Care System (1997-present). Previously, Mr. Gamper served as Chairman (2012-2015) and Vice Chairman (2011-2012) of the Independent Trustees of certain Fidelity® funds and as Chairman of the Board of Governors, Rutgers University (2004-2007).
Robert F. Gartland (1951)
Year of Election or Appointment: 2010
Trustee
Mr. Gartland also serves as Trustee of other Fidelity® funds. Mr. Gartland is Chairman and an investor in Gartland & Mellina Group Corp. (consulting, 2009-present). Previously, Mr. Gartland served as a partner and investor of Vietnam Partners LLC (investments and consulting, 2008-2011). Prior to his retirement, Mr. Gartland held a variety of positions at Morgan Stanley (financial services, 1979-2007) including Managing Director (1987-2007).
Arthur E. Johnson (1947)
Year of Election or Appointment: 2008
Trustee
Vice Chairman of the Independent Trustees
Mr. Johnson also serves as Trustee of other Fidelity® funds. Mr. Johnson serves as a member of the Board of Directors of Eaton Corporation plc (diversified power management, 2009-present) and Booz Allen Hamilton (management consulting, 2011-present). Prior to his retirement, Mr. Johnson served as Senior Vice President of Corporate Strategic Development of Lockheed Martin Corporation (defense contractor, 1999-2009). He previously served on the Board of Directors of IKON Office Solutions, Inc. (1999-2008), AGL Resources, Inc. (holding company, 2002-2016), and Delta Airlines (2005-2007). Mr. Arthur E. Johnson is not related to Ms. Abigail P. Johnson.
Michael E. Kenneally (1954)
Year of Election or Appointment: 2009
Trustee
Mr. Kenneally also serves as Trustee of other Fidelity® funds. Prior to his retirement, Mr. Kenneally served as Chairman and Global Chief Executive Officer of Credit Suisse Asset Management. Before joining Credit Suisse, he was an Executive Vice President and Chief Investment Officer for Bank of America Corporation. Earlier roles at Bank of America included Director of Research, Senior Portfolio Manager and Research Analyst, and Mr. Kenneally was awarded the Chartered Financial Analyst (CFA) designation in 1991.
Marie L. Knowles (1946)
Year of Election or Appointment: 2001
Trustee
Chairman of the Independent Trustees
Ms. Knowles also serves as Trustee of other Fidelity® funds. Prior to Ms. Knowles' retirement in June 2000, she served as Executive Vice President and Chief Financial Officer of Atlantic Richfield Company (ARCO) (diversified energy, 1996-2000). From 1993 to 1996, she was a Senior Vice President of ARCO and President of ARCO Transportation Company (pipeline and tanker operations). Ms. Knowles currently serves as a Director and Chairman of the Audit Committee of McKesson Corporation (healthcare service, since 2002). Ms. Knowles is a member of the Board of the Santa Catalina Island Company (real estate, 2009-present). Ms. Knowles is a Member of the Investment Company Institute Board of Governors and a Member of the Governing Council of the Independent Directors Council (2014-present). She also serves as a member of the Advisory Board for the School of Engineering of the University of Southern California. Previously, Ms. Knowles served as a Director of Phelps Dodge Corporation (copper mining and manufacturing, 1994-2007), URS Corporation (engineering and construction, 2000-2003) and America West (airline, 1999-2002). Ms. Knowles previously served as Vice Chairman of the Independent Trustees of certain Fidelity® funds (2012-2015).
Mark A. Murray (1954)
Year of Election or Appointment: 2016
Trustee
Mr. Murray also serves as Trustee of other Fidelity® funds. Mr. Murray is Vice Chairman (2013-present) of Meijer, Inc. (regional retail chain). Previously, Mr. Murray served as a Member of the Advisory Board of certain Fidelity® funds (2016) and as Co-Chief Executive Officer (2013-2016) and President (2006-2013) of Meijer, Inc. Mr. Murray serves as a member of the Board of Directors and Nuclear Review and Public Policy and Responsibility Committees of DTE Energy Company (diversified energy company, 2009-present). Mr. Murray also serves as a member of the Board of Directors of Spectrum Health (not-for-profit health system, 2015-present). Mr. Murray previously served as President of Grand Valley State University (2001-2006), Treasurer for the State of Michigan (1999-2001), Vice President of Finance and Administration for Michigan State University (1998-1999), and a member of the Board of Directors and Audit Committee and Chairman of the Nominating and Corporate Governance Committee of Universal Forest Products, Inc. (manufacturer and distributor of wood and wood-alternative products, 2004-2016). Mr. Murray is also a director or trustee of many community and professional organizations.
+ The information includes the Trustee's principal occupation during the last five years and other information relating to the experience, attributes, and skills relevant to the Trustee's qualifications to serve as a Trustee, which led to the conclusion that the Trustee should serve as a Trustee for the fund.��
Advisory Board Members and Officers:
Correspondence intended for an officer may be sent to Fidelity Investments, 245 Summer Street, Boston, Massachusetts 02210. Officers appear below in alphabetical order.
Name, Year of Birth; Principal Occupation
Elizabeth Paige Baumann (1968)
Year of Election or Appointment: 2017
Anti-Money Laundering (AML) Officer
Ms. Baumann also serves as AML Officer of other funds. She is Chief AML Officer (2012-present) and Senior Vice President (2014-present) of FMR LLC (diversified financial services company) and is an employee of Fidelity Investments. Previously, Ms. Baumann served as AML Officer of the funds (2012-2016), and Vice President (2007-2014) and Deputy Anti-Money Laundering Officer (2007-2012) of FMR LLC.
Marc R. Bryant (1966)
Year of Election or Appointment: 2015
Secretary and Chief Legal Officer (CLO)
Mr. Bryant also serves as Secretary and CLO of other funds. Mr. Bryant serves as CLO, Secretary, and Senior Vice President of Fidelity Management & Research Company (investment adviser firm, 2015-present) and FMR Co., Inc. (investment adviser firm, 2015-present); Secretary of Fidelity SelectCo, LLC (investment adviser firm, 2015-present) and Fidelity Investments Money Management, Inc. (investment adviser firm, 2015-present); and CLO of Fidelity Management & Research (Hong Kong) Limited and FMR Investment Management (UK) Limited (investment adviser firms, 2015-present) and Fidelity Management & Research (Japan) Limited (investment adviser firm, 2016-present). He is Senior Vice President and Deputy General Counsel of FMR LLC (diversified financial services company). Previously, Mr. Bryant served as Secretary and CLO of Fidelity Rutland Square Trust II (2010-2014) and Assistant Secretary of Fidelity's Fixed Income and Asset Allocation Funds (2013-2015). Prior to joining Fidelity Investments, Mr. Bryant served as a Senior Vice President and the Head of Global Retail Legal for AllianceBernstein L.P. (2006-2010), and as the General Counsel for ProFund Advisors LLC (2001-2006).
Jonathan Davis (1968)
Year of Election or Appointment: 2010
Assistant Treasurer
Mr. Davis also serves as Assistant Treasurer of other funds, and is an employee of Fidelity Investments. Previously, Mr. Davis served as Vice President and Associate General Counsel of FMR LLC (diversified financial services company, 2003-2010).
Adrien E. Deberghes (1967)
Year of Election or Appointment: 2010
Assistant Treasurer
Mr. Deberghes also serves as an officer of other funds. He serves as Executive Vice President of Fidelity Investments Money Management, Inc. (FIMM) (investment adviser firm, 2016-present) and is an employee of Fidelity Investments (2008-present). Prior to joining Fidelity Investments, Mr. Deberghes was Senior Vice President of Mutual Fund Administration at State Street Corporation (2007-2008), Senior Director of Mutual Fund Administration at Investors Bank & Trust (2005-2007), and Director of Finance for Dunkin' Brands (2000-2005). Previously, Mr. Deberghes served in other fund officer roles.
Stephanie J. Dorsey (1969)
Year of Election or Appointment: 2013
President and Treasurer
Ms. Dorsey also serves as an officer of other funds. She is an employee of Fidelity Investments (2008-present) and has served in other fund officer roles. Prior to joining Fidelity Investments, Ms. Dorsey served as Treasurer (2004-2008) of the JPMorgan Mutual Funds and Vice President (2004-2008) of JPMorgan Chase Bank.
Howard J. Galligan III (1966)
Year of Election or Appointment: 2014
Chief Financial Officer
Mr. Galligan also serves as Chief Financial Officer of other funds. Mr. Galligan serves as President of Fidelity Pricing and Cash Management Services (FPCMS) (2014-present) and as a Director of Strategic Advisers, Inc. (investment adviser firm, 2008-present). Previously, Mr. Galligan served as Chief Administrative Officer of Asset Management (2011-2014) and Chief Operating Officer and Senior Vice President of Investment Support for Strategic Advisers, Inc. (2003-2011).
Vince Gubitosi (1972)
Year of Election or Appointment: 2012
Vice President
Mr. Gubitosi is the President and Chief Investment Officer of Geode Capital Management, LLC (Geode). Mr. Gubitosi was an employee of Geode from 2002 to 2005, and rejoined Geode in 2007.
Colm A. Hogan (1973)
Year of Election or Appointment: 2016
Assistant Treasurer
Mr. Hogan also serves as an officer of other funds. Mr. Hogan is an employee of Fidelity Investments (2005-present).
Chris Maher (1972)
Year of Election or Appointment: 2013
Assistant Treasurer
Mr. Maher serves as Assistant Treasurer of other funds. Mr. Maher is Vice President of Valuation Oversight and is an employee of Fidelity Investments. Previously, Mr. Maher served as Vice President of Asset Management Compliance (2013), Vice President of the Program Management Group of FMR (investment adviser firm, 2010-2013), and Vice President of Valuation Oversight (2008-2010).
John B. McGinty, Jr. (1962)
Year of Election or Appointment: 2016
Chief Compliance Officer
Mr. McGinty also serves as Chief Compliance Officer of other funds. Mr. McGinty is Senior Vice President of Asset Management Compliance for Fidelity Investments and is an employee of Fidelity Investments (2016-present). Mr. McGinty previously served as Vice President, Senior Attorney at Eaton Vance Management (investment management firm, 2015-2016), and prior to Eaton Vance as global CCO for all firm operations and registered investment companies at GMO LLC (investment management firm, 2009-2015). Before joining GMO LLC, Mr. McGinty served as Senior Vice President, Deputy General Counsel for Fidelity Investments (2007-2009).
Rieco E. Mello (1969)
Year of Election or Appointment: 2017
Assistant Treasurer
Mr. Mello also serves as Assistant Treasurer of other funds. Mr. Mello is an employee of Fidelity Investments (1995-present).
Jason P. Pogorelec (1975)
Year of Election or Appointment: 2015
Assistant Secretary
Mr. Pogorelec also serves as Assistant Secretary of other funds. Mr. Pogorelec serves as Vice President, Associate General Counsel (2010-present) and is an employee of Fidelity Investments (2006-present).
Stacie M. Smith (1974)
Year of Election or Appointment: 2013
Assistant Treasurer
Ms. Smith also serves as an officer of other funds. She is an employee of Fidelity Investments (2009-present) and has served in other fund officer roles. Prior to joining Fidelity Investments, Ms. Smith served as Senior Audit Manager of Ernst & Young LLP (accounting firm, 1996-2009). Previously, Ms. Smith served as Deputy Treasurer of certain Fidelity® funds (2013-2016).
Marc L. Spector (1972)
Year of Election or Appointment: 2016
Deputy Treasurer
Mr. Spector also serves as an officer of other funds. Mr. Spector is an employee of Fidelity Investments (2016-present). Prior to joining Fidelity Investments, Mr. Spector served as Director at the Siegfried Group (accounting firm, 2013-2016), and prior to Siegfried Group as audit senior manager at Deloitte & Touche (accounting firm, 2005-2013).
Renee Stagnone (1975)
Year of Election or Appointment: 2016
Assistant Treasurer
Ms. Stagnone also serves as an officer of other funds. Ms. Stagnone is an employee of Fidelity Investments (1997-present). Previously, Ms. Stagnone served as Deputy Treasurer of certain Fidelity® funds (2013-2016).
Shareholder Expense Example
As a shareholder of the Fund, you incur two types of costs: (1) transaction costs and (2) ongoing costs, including management fees and other Fund expenses. This Example is intended to help you understand your ongoing costs (in dollars) of investing in the Fund and to compare these costs with the ongoing costs of investing in other mutual funds.
The Example is based on an investment of $1,000 invested at the beginning of the period and held for the entire period (February 1, 2017 to July 31, 2017).
Actual Expenses
The first line of the accompanying table for each class of the Fund provides information about actual account values and actual expenses. You may use the information in this line, together with the amount you invested, to estimate the expenses that you paid over the period. Simply divide your account value by $1,000.00 (for example, an $8,600 account value divided by $1,000.00 = 8.6), then multiply the result by the number in the first line for a class of the Fund under the heading entitled "Expenses Paid During Period" to estimate the expenses you paid on your account during this period. In addition, the Fund, as a shareholder in the underlying Fidelity Central Funds, will indirectly bear its pro-rata share of the fees and expenses incurred by the underlying Fidelity Central Funds. These fees and expenses are not included in the Fund's annualized expense ratio used to calculate the expense estimate in the table below.
Hypothetical Example for Comparison Purposes
The second line of the accompanying table for each class of the Fund provides information about hypothetical account values and hypothetical expenses based on a Class' actual expense ratio and an assumed rate of return of 5% per year before expenses, which is not the Class' actual return. The hypothetical account values and expenses may not be used to estimate the actual ending account balance or expenses you paid for the period. You may use this information to compare the ongoing costs of investing in the Fund and other funds. To do so, compare this 5% hypothetical example with the 5% hypothetical examples that appear in the shareholder reports of the other funds. In addition, the Fund, as a shareholder in the underlying Fidelity Central Funds, will indirectly bear its pro-rata share of the fees and expenses incurred by the underlying Fidelity Central Funds. These fees and expenses are not included in the Fund's annualized expense ratio used to calculate the expense estimate in the table below.
Please note that the expenses shown in the table are meant to highlight your ongoing costs only and do not reflect any transaction costs. Therefore, the second line of the table is useful in comparing ongoing costs only, and will not help you determine the relative total costs of owning different funds.
| | Annualized Expense Ratio-A | Beginning
Account Value
February 1, 2017 | Ending
Account Value
July 31, 2017 | Expenses Paid
During Period-B
February 1, 2017
to July 31, 2017 |
| Series Commodity Strategy | .43% | | | |
| Actual | | $1,000.00 | $966.80 | $2.10** |
| Hypothetical-C | | $1,000.00 | $1,022.66 | $2.16** |
| Class F | .29% | | | |
| Actual | | $1,000.00 | $965.40 | $1.41** |
| Hypothetical-C | | $1,000.00 | $1,023.36 | $1.45** |
A Annualized expense ratio reflects consolidated expenses net of applicable fee waivers.
B Expenses are equal to each Class' annualized expense ratio, multiplied by the average account value over the period, multiplied by 181/365 (to reflect the one-half year period).
C 5% return per year before expenses
** If fees and changes to the class level expense contract and/or expense cap, effective June 1, 2017, had been in effect during the entire period, the annualized expense ratio and the expenses paid in the actual and hypothetical examples above would have been as shown in the table below:
| | Annualized Expense Ratio-(a)
| Expenses Paid
|
| Series Commodity Strategy | .05% | |
| Actual | | $.24 |
| Hypothetical-(b) | | $.25 |
| Class F | .05% | |
| Actual | | $.24 |
| Hypothetical-(b) | | $.25 |
(a) Annualized expense ratio reflects consolidated expenses net of applicable fee waivers.
(b) 5% return per year before expenses
Corporate Headquarters
245 Summer St.
Boston, MA 02210
www.fidelity.com
SCR-S-ANN-0917
1.899299.107
Item 2.
Code of Ethics
As of the end of the period, July 31, 2017, Fidelity Oxford Street Trust (the trust) has adopted a code of ethics, as defined in Item 2 of Form N-CSR, that applies to its President and Treasurer and its Chief Financial Officer. A copy of the code of ethics is filed as an exhibit to this Form N-CSR.
Item 3.
Audit Committee Financial Expert
The Board of Trustees of the trust has determined that Elizabeth S. Acton is an audit committee financial expert, as defined in Item 3 of Form N-CSR. Ms. Acton is independent for purposes of Item 3 of Form N-CSR.
Item 4.
Principal Accountant Fees and Services
Fees and Services
The following table presents fees billed by PricewaterhouseCoopers LLP (“PwC”) in each of the last two fiscal years for services rendered to Fidelity Commodity Strategy Fund and Fidelity Series Commodity Strategy Fund (the “Funds”):
Services Billed by PwC
July 31, 2017 FeesA,B
| | | | |
| Audit Fees | Audit-Related Fees | Tax Fees | All Other Fees |
Fidelity Commodity Strategy Fund | $56,000 | $900 | $6,700 | $400 |
Fidelity Series Commodity Strategy Fund | $115,000 | $10,800 | $7,100 | $5,300 |
| | | | |
| Audit Fees | Audit-Related Fees | Tax Fees | All Other Fees |
Fidelity Commodity Strategy Fund | $- | $- | $- | $- |
Fidelity Series Commodity Strategy Fund | $108,000 | $8,300 | $7,100 | $3,500 |
A Amounts may reflect rounding.
B Fidelity Commodity Strategy Fund commenced operations on May 30, 2017.
C Certain amounts have been reclassified to align with current period presentation.
The following table presents fees billed by PwC that were required to be approved by the Audit Committee for services that relate directly to the operations and financial reporting of the Funds and that are rendered on behalf of Geode Capital Management, LLC (“Geode”) and entities controlling, controlled by, or under common control with Geode (not including any sub-adviser whose role is primarily portfolio management and is subcontracted with or overseen by another investment adviser) that provide ongoing services to the Funds (“Fund Service Providers”):
Services Billed by PwC
| | |
| July 31, 2017A,B | July 31, 2016A,B,C |
Audit-Related Fees | $5,990,000 | $5,780,000 |
Tax Fees | $115,000 | $- |
All Other Fees | $- | $- |
A Amounts may reflect rounding.
B May include amounts billed prior to the Fidelity Commodity Strategy Fund’s commencement of operations.
C Certain amounts have been reclassified to align with current period presentation.
“Audit-Related Fees” represent fees billed for assurance and related services that are reasonably related to the performance of the fund audit or the review of the fund's financial statements and that are not reported under Audit Fees.
“Tax Fees” represent fees billed for tax compliance, tax advice or tax planning that relate directly to the operations and financial reporting of the fund.
“All Other Fees” represent fees billed for services provided to the fund or Fund Service Provider, a significant portion of which are assurance related, that relate directly to the operations and financial reporting of the fund, excluding those services that are reported under Audit Fees, Audit-Related Fees or Tax Fees.
Assurance services must be performed by an independent public accountant.
* * *
The aggregate non-audit fees billed by PwC for services rendered to the Funds, Geode (not including any sub-adviser whose role is primarily portfolio management and is subcontracted with or overseen by another investment adviser), and any Fund Service Provider for each of the last two fiscal years of the Funds are as follows:
| | |
Billed By | July 31, 2017 A,B | July 31, 2016 A,B,C |
PwC | $8,130,000 | $6,900,000 |
A Amounts may reflect rounding.
B May include amounts billed prior to the Fidelity Commodity Strategy Fund’s commencement of operations.
C Certain amounts have been reclassified to align with current period presentation.
The trust's Audit Committee has considered non-audit services that were not pre-approved that were provided by PwC to Fund Service Providers to be compatible with maintaining the independence of PwC in its audit of the Funds, taking into account representations from PwC, in accordance with Public Company Accounting Oversight Board rules, regarding its independence from the Funds and their related entities and Geode’s review of the appropriateness and permissibility under applicable law of such non-audit services prior to their provision to the Fund Service Providers.
Audit Committee Pre-Approval Policies and Procedures
The trust’s Audit Committee must pre-approve all audit and non-audit services provided by a fund’s independent registered public accounting firm relating to the operations or financial reporting of the fund. Prior to the commencement of any audit or non-audit services to a fund, the Audit Committee reviews the services to determine whether they are appropriate and permissible under applicable law.
The Audit Committee has adopted policies and procedures to, among other purposes, provide a framework for the Committee’s consideration of non-audit services by the audit firms that audit the Fidelity funds. The policies and procedures require that any non-audit service provided by a fund audit firm to a Fidelity fund and any non-audit service provided by a fund auditor to a Fund Service Provider that relates directly to the operations and financial reporting of a Fidelity fund (“Covered Service”) are subject to approval by the Audit Committee before such service is provided.
All Covered Services must be approved in advance of provision of the service either: (i) by formal resolution of the Audit Committee, or (ii) by oral or written approval of the service by the Chair of the Audit Committee (or if the Chair is unavailable, such other member of the Audit Committee as may be designated by the Chair to act in the Chair’s absence). The approval contemplated by (ii) above is permitted where the Treasurer determines that action on such an engagement is necessary before the next meeting of the Audit Committee.
Non-audit services provided by a fund audit firm to a Fund Service Provider that do not relate directly to the operations and financial reporting of a Fidelity fund are reported to the Audit Committee on a periodic basis.
Non-Audit Services Approved Pursuant to Rule 2-01(c)(7)(i)(C) and (ii) of Regulation S-X (“De Minimis Exception”)
There were no non-audit services approved or required to be approved by the Audit Committee pursuant to the De Minimis Exception during the Funds’ last two fiscal years relating to services provided to (i) the Funds or (ii) any Fund Service Provider that relate directly to the operations and financial reporting of the Funds.
Item 5.
Audit Committee of Listed Registrants
Not applicable.
Item 6.
Investments
(a)
Not applicable.
(b)
Not applicable
Item 7.
Disclosure of Proxy Voting Policies and Procedures for Closed-End Management Investment Companies
Not applicable.
Item 8.
Portfolio Managers of Closed-End Management Investment Companies
Not applicable.
Item 9.
Purchase of Equity Securities by Closed-End Management Investment Company and Affiliated Purchasers
Not applicable.
Item 10.
Submission of Matters to a Vote of Security Holders
There were no material changes to the procedures by which shareholders may recommend nominees to the trust’s Board of Trustees.
Item 11.
Controls and Procedures
(a)(i) The President and Treasurer and the Chief Financial Officer have concluded that the trust’s disclosure controls and procedures (as defined in Rule 30a-3(c) under the Investment Company Act) provide reasonable assurances that material information relating to the trust is made known to them by the appropriate persons, based on their evaluation of these controls and procedures as of a date within 90 days of the filing date of this report.
(a)(ii) There was no change in the trust’s internal control over financial reporting (as defined in Rule 30a-3(d) under the Investment Company Act) that occurred during the second fiscal quarter of the period covered by this report that has materially affected, or is reasonably likely to materially affect, the trust’s internal control over financial reporting.
Item 12.
Exhibits
| | |
(a) | (1) | Code of Ethics pursuant to Item 2 of Form N-CSR is filed and attached hereto as EX-99.CODE ETH. |
(a) | (2) | Certification pursuant to Rule 30a-2(a) under the Investment Company Act of 1940 (17 CFR 270.30a-2(a)) is filed and attached hereto as Exhibit 99.CERT. |
(a) | (3) | Not applicable. |
(b) | | Certification pursuant to Rule 30a-2(b) under the Investment Company Act of 1940 (17 CFR 270.30a-2(b)) is furnished and attached hereto as Exhibit 99.906CERT. |
SIGNATURES
Pursuant to the requirements of the Securities Exchange Act of 1934 and the Investment Company Act of 1940, the registrant has duly caused this report to be signed on its behalf by the undersigned, thereunto duly authorized.
Fidelity Oxford Street Trust
| |
By: | /s/Stephanie J. Dorsey |
| Stephanie J. Dorsey |
| President and Treasurer |
| |
Date: | September 26, 2017 |
Pursuant to the requirements of the Securities Exchange Act of 1934 and the Investment Company Act of 1940, this report has been signed below by the following persons on behalf of the registrant and in the capacities and on the dates indicated.
| |
By: | /s/ Stephanie J. Dorsey |
| Stephanie J. Dorsey |
| President and Treasurer |
| |
Date: | September 26, 2017 |
| |
By: | /s/Howard J. Galligan III |
| Howard J. Galligan III |
| Chief Financial Officer |
| |
Date: | September 26, 2017 |