UNITED STATES
SECURITIES AND EXCHANGE COMMISSION
WASHINGTON, D.C. 20549
FORM N-CSR
CERTIFIED SHAREHOLDER REPORT OF REGISTERED
MANAGEMENT INVESTMENT COMPANIES
Investment Company Act file number: 811-00126
ALLIANCEBERNSTEIN GROWTH AND INCOME FUND, INC.
(Exact name of registrant as specified in charter)
1345 Avenue of the Americas, New York, New York 10105
(Address of principal executive offices) (Zip code)
Joseph J. Mantineo
AllianceBernstein L.P.
1345 Avenue of the Americas
New York, New York 10105
(Name and address of agent for service)
Registrant’s telephone number, including area code: (800) 221-5672
Date of fiscal year end: October 31, 2013
Date of reporting period: April 30, 2013
ITEM 1. REPORTS TO STOCKHOLDERS.
SEMI-ANNUAL REPORT
AllianceBernstein Growth & Income Fund
April 30, 2013
Semi-Annual Report

Investment Products Offered
•Are Not FDIC Insured •May Lose Value •Are Not Bank Guaranteed |
Investors should consider the investment objectives, risks, charges and expenses of the Fund carefully before investing. For copies of our prospectus or summary prospectus, which contain this and other information, visit us online at www.alliancebernstein.com or contact your AllianceBernstein Investments representative. Please read the prospectus and/or summary prospectus carefully before investing.
This shareholder report must be preceded or accompanied by the Fund’s prospectus for individuals who are not current shareholders of the Fund.
You may obtain a description of the Fund’s proxy voting policies and procedures, and information regarding how the Fund voted proxies relating to portfolio securities during the most recent 12-month period ended June 30, without charge. Simply visit AllianceBernstein’s website at www.alliancebernstein.com, or go to the Securities and Exchange Commission’s (the “Commission”) website at www.sec.gov, or call AllianceBernstein at (800) 227-4618.
The Fund files its complete schedule of portfolio holdings with the Commission for the first and third quarters of each fiscal year on Form N-Q. The Fund’s Forms N-Q are available on the Commission’s website at www.sec.gov. The Fund’s Forms N-Q may also be reviewed and copied at the Commission’s Public Reference Room in Washington, DC; information on the operation of the Public Reference Room may be obtained by calling (800) SEC-0330. AllianceBernstein publishes full portfolio holdings for the Fund monthly at www.alliancebernstein.com.
AllianceBernstein Investments, Inc. (ABI) is the distributor of the AllianceBernstein family of mutual funds. ABI is a member of FINRA and is an affiliate of AllianceBernstein L.P., the manager of the funds.
AllianceBernstein® and the AB Logo are registered trademarks and service marks used by permission of the owner, AllianceBernstein L.P.
June 13, 2013
Semi-Annual Report
This report provides management’s discussion of fund performance for AllianceBernstein Growth & Income Fund (the “Fund”) for the semi-annual reporting period ended April 30, 2013.
Investment Objectives and Policies
The Fund’s investment objective is long-term growth of capital. The Fund invests primarily in the equity securities of U.S. companies that AllianceBernstein L.P. (the “Adviser”) believes are undervalued, focusing on dividend-paying securities. The Adviser believes that, over time, a company’s stock price will come to reflect its intrinsic economic value. The Fund may invest in companies of any size and in any industry. The Adviser anticipates that the Fund normally will include approximately 60–90 companies.
The Fund may enter into derivatives transactions, such as options, futures contracts, forwards, and swap agreements. The Fund may use options strategies involving the purchase and/or writing of various combinations of call and/or put options, including on individual securities and stock indexes, futures contracts (including futures contracts on individual securities and stock indexes) or shares of exchange traded funds (“ETFs”). These transactions may be used, for example, in an effort to earn extra income, to adjust exposure to individual securities or markets, or to protect all or a portion of the Fund’s portfolio from a decline in value, sometimes within certain ranges.
The Fund may, at times, invest in shares of ETFs in lieu of making direct investments in equity securities. ETFs
may provide more efficient and economical exposure to the type of companies and geographic locations in which the Fund seeks to invest than direct investments.
Investment Results
The table on page 4 shows the Fund’s performance compared to its benchmark, the Russell 1000 Value Index, for the six- and 12-month periods ended April 30, 2013. Also included in the table are returns for the Fund’s peer group, as represented by the Lipper Large-Cap Core Funds Average (the “Lipper Average”). Funds in the Lipper Average have generally similar investment objectives to the Fund, although some may have different investment policies and sales and management fees.
All share classes of the Fund underperformed its benchmark and Lipper Average for the six-month period, before sales charges. For the 12-month period, all share classes of the Fund underperformed the benchmark and outperformed the Lipper Average, before sales charges.
For the six-month period, stocks with highly-depressed valuations outperformed relative value stocks. As a result, the Fund’s overweight exposure to relative value stocks, combined with stock selection in the technology sector, led to underperformance. Strong stock selection in industrials and financials helped to mitigate some of the relative performance shortfall. The financial sector outperformed as investor sentiment continued to improve due actions by the U.S. Federal Reserve, which helped alleviate systematic fears.
| ALLIANCEBERNSTEIN GROWTH & INCOME FUND • | 1 |
For the 12-month period, the Fund’s underweight to deep-value technology detracted from returns. Also detracting was the Fund’s stock selection in the technology sector, as some of the Fund’s biggest technology holdings turned in weak performance. Stock selection in the financials sector contributed to relative returns.
The Fund did not utilize derivatives during the six- or 12-month periods.
Market Review and Investment Strategy
Leading indicators continue to suggest that in the U.S., the economic recovery is strengthening despite policy risks posed by ongoing battles over the federal budget. The beginnings of a modest rebound in housing, the natural gas boom, excess liquidity in the financial system and further improvements in household balance sheets are, in aggregate, supportive of improved economic growth. Indeed, despite a global recession and credit crisis, the U.S. economy is larger today than when it reached its peak in the fourth quarter of 2007. The current surge in the U.S. equity market can be attributed largely to the U.S. Federal Reserve’s accommodative monetary
policies, attractive valuations compared to other asset classes and strong profits from S&P 500 Index companies.
Absent any erosion of profit margins, the research of the Relative Value Investment Team (the “Team”) suggests that the U.S. stock market rally further. From a historical perspective, the new high reached by the S&P 500 at the end of March 2013, bodes well for a sustained rally. Since 1945, the Index has climbed for 30 additional months almost every time it has exceeded a previous record. The average gain for those 30-month periods was 59% cumulatively, or 18% annualized. Only the bull markets of 1972, 1980 and 2007 have lasted less than a year after the Index hit a new high. Although there is certainly no guarantee that history will repeat itself, the Team remains confident in its belief of a continued U.S. stock market rally.
The Team continues to identify companies meeting the Fund’s relative value philosophy, and pursue companies that the Team considers to be cash rich and having attractive valuations and smart capital allocation behavior.
| 2 | • ALLIANCEBERNSTEIN GROWTH & INCOME FUND |
DISCLOSURES AND RISKS
Benchmark Disclosure
The unmanaged Russell 1000® Value Index does not reflect fees and expenses associated with the active management of a mutual fund portfolio. The Russell 1000 Value Index represents the performance of 1,000 large-cap value companies within the U.S. An investor cannot invest directly in an index or average, and their results are not indicative of the performance for any specific investment, including the Fund.
A Word About Risk
Market Risk: The value of the Fund’s investments will fluctuate as the stock or bond market fluctuates. The value of its investments may decline, sometimes rapidly and unpredictably, simply because of economic changes or other events that affect large portions of the market. It includes the risk that a particular style of investing, such as the Fund’s value approach, may be underperforming the market generally.
Foreign (Non-U.S.) Risk: Investments in securities of non-U.S. issuers may involve more risk than those of U.S. issuers. These securities may fluctuate more widely in price and may be less liquid due to adverse market, economic, political, regulatory or other factors.
Currency Risk: Fluctuations in currency exchange rates may negatively affect the value of the Fund’s investments or reduce its returns.
Derivatives Risk: Investments in derivatives may be illiquid, difficult to price, and leveraged so that small changes may produce disproportionate losses for the Fund, and may be subject to counterparty risk to a greater degree than more traditional investments.
Industry/Sector Risk: Investments in a particular industry or group of related industries may have more risk because market or economic factors affecting that industry could have a significant effect on the value of the Fund’s investments.
Management Risk: The Fund is subject to management risk because it is an actively managed investment fund. The Adviser will apply its investment techniques and risk analyses in making investment decisions for the Fund, but there is no guarantee that its techniques will produce the intended results.
These risks are fully discussed in the Fund’s prospectus.
An Important Note About Historical Performance
The investment return and principal value of an investment in the Fund will fluctuate, so that shares, when redeemed, may be worth more or less than their original cost. Performance shown on the following pages represents past performance and does not guarantee future results. Current performance may be lower or higher than the performance information shown. You may obtain performance information current to the most recent month-end by visiting www.alliancebernstein.com.
All fees and expenses related to the operation of the Fund have been deducted. net asset value (“NAV”) returns do not reflect sales charges; if sales charges were reflected, the Fund’s quoted performance would be lower. SEC returns reflect the applicable sales charges for each share class: a 4.25% maximum front-end sales charge for Class A shares; the applicable contingent deferred sales charge for Class B shares (4% year 1, 3% year 2, 2% year 3, 1% year 4); a 1% 1-year contingent deferred sales charge for Class C shares. Returns for the different share classes will vary due to different expenses associated with each class. Performance assumes reinvestment of distributions and does not account for taxes.
| ALLIANCEBERNSTEIN GROWTH & INCOME FUND • | 3 |
Disclosures and Risks
HISTORICAL PERFORMANCE
THE FUND VS. ITS BENCHMARK PERIODS ENDED APRIL 30, 2013 | NAV Returns | |||||||||
| 6 Months | 12 Months | |||||||||
| AllianceBernstein Growth & Income Fund | ||||||||||
Class A | 13.49% | 17.02% | ||||||||
| ||||||||||
Class B* | 12.91% | 16.15% | ||||||||
| ||||||||||
Class C | 12.97% | 16.19% | ||||||||
| ||||||||||
Advisor Class† | 13.48% | 17.30% | ||||||||
| ||||||||||
Class R† | 13.29% | 16.86% | ||||||||
| ||||||||||
Class K† | 13.33% | 17.18% | ||||||||
| ||||||||||
Class I† | 13.67% | 17.74% | ||||||||
| ||||||||||
| Russell 1000 Value Index | 16.31% | 21.80% | ||||||||
| ||||||||||
| Lipper Large-Cap Core Funds Average | 14.09% | 15.74% | ||||||||
| ||||||||||
* Includes the impact of proceeds received and credited to the Fund resulting from class action settlements, which enhanced the performance of all share classes of the Portfolio for the six- and 12-month periods ended April 30, 2013 by 0.07% and 0.53%, respectively.
* Effective January 31, 2009, Class B shares are no longer available for purchase to new investors. Please see Note A for additional information.
† Please note that these share classes are for investors purchasing shares through accounts established under certain fee-based programs sponsored and maintained by certain broker-dealers and financial intermediaries, institutional pension plans and/or investment advisory clients of, and certain other persons associated with, the Adviser and its affiliates or the Fund.
Please keep in mind that high, double-digit returns are highly unusual and cannot be sustained. Investors should also be aware that these returns were primarily achieved during favorable market conditions. | ||||||||||
See Disclosures, Risks and Note about Historical Performance on page 3.
(Historical Performance continued on next page)
| 4 | • ALLIANCEBERNSTEIN GROWTH & INCOME FUND |
Historical Performance
HISTORICAL PERFORMANCE
(continued from previous page)
| AVERAGE ANNUAL RETURNS AS OF APRIL 30, 2013 | ||||||||
| NAV Returns | SEC Returns | |||||||
| Class A Shares | ||||||||
1 Year | 17.02 | % | 12.09 | % | ||||
5 Years | 4.46 | % | 3.56 | % | ||||
10 Years | 7.28 | % | 6.82 | % | ||||
| Class B Shares | ||||||||
1 Year | 16.15 | % | 12.15 | % | ||||
5 Years | 3.61 | % | 3.61 | % | ||||
10 Years(a) | 6.65 | % | 6.65 | % | ||||
| Class C Shares | ||||||||
1 Year | 16.19 | % | 15.19 | % | ||||
5 Years | 3.70 | % | 3.70 | % | ||||
10 Years | 6.50 | % | 6.50 | % | ||||
| Advisor Class Shares† | ||||||||
1 Year | 17.30 | % | 17.30 | % | ||||
5 Years | 4.72 | % | 4.72 | % | ||||
10 Years | 7.59 | % | 7.59 | % | ||||
| Class R Shares† | ||||||||
1 Year | 16.86 | % | 16.86 | % | ||||
5 Years | 4.21 | % | 4.21 | % | ||||
Since Inception* | 5.63 | % | 5.63 | % | ||||
| Class K Shares† | ||||||||
1 Year | 17.18 | % | 17.18 | % | ||||
5 Years | 4.54 | % | 4.54 | % | ||||
Since Inception* | 4.48 | % | 4.48 | % | ||||
| Class I Shares† | ||||||||
1 Year | 17.74 | % | 17.74 | % | ||||
5 Years | 4.93 | % | 4.93 | % | ||||
Since Inception* | 4.83 | % | 4.83 | % | ||||
The Fund’s current prospectus fee table shows the Fund’s total operating expense ratios as 1.11%, 1.91%, 1.84%, 0.82%, 1.36%, 1.05% and 0.72% for Class A, Class B, Class C, Advisor Class, Class R, Class K and Class I shares, respectively. The Financial Highlights section of this report sets forth expense ratio data for the current reporting period; the expense ratios shown above may differ from the expense ratios in the Financial Highlights section since they are based on different time periods.
| (a) | Assumes conversion of Class B shares into Class A shares after eight years. |
| * | Inception dates: 11/3/03 for Class R shares; 3/1/05 for Class K and Class I shares. |
| † | These share classes are offered at NAV to eligible investors and their SEC returns are the same as the NAV returns. Please note that these share classes are for investors purchasing shares through accounts established under certain fee-based programs sponsored and maintained by certain broker-dealers and financial intermediaries, institutional pension plans and/or investment advisory clients of, and certain other persons associated with, the Adviser and its affiliates or the Fund. The inception dates for Class R, K and I shares are listed above. |
See Disclosures, Risks and Note about Historical Performance on page 3.
(Historical Performance continued on next page)
| ALLIANCEBERNSTEIN GROWTH & INCOME FUND • | 5 |
Historical Performance
HISTORICAL PERFORMANCE
(continued from previous page)
SEC AVERAGE ANNUAL RETURNS (WITH ANY APPLICABLE SALES CHARGES) AS OF THE MOST RECENT CALENDAR QUARTER-END (MARCH 31, 2013) | ||||
| SEC Returns | ||||
| Class A Shares | ||||
1 Year | 10.04 | % | ||
5 Years | 4.34 | % | ||
10 Years | 7.50 | % | ||
| Class B Shares | ||||
1 Year | 10.25 | % | ||
5 Years | 4.46 | % | ||
10 Years(a) | 7.29 | % | ||
| Class C Shares | ||||
1 Year | 13.30 | % | ||
5 Years | 4.49 | % | ||
10 Years | 7.21 | % | ||
| Advisor Class Shares† | ||||
1 Year | 15.39 | % | ||
5 Years | 5.55 | % | ||
10 Years | 8.30 | % | ||
| Class R Shares† | ||||
1 Year | 14.93 | % | ||
5 Years | 5.05 | % | ||
Since Inception* | 5.55 | % | ||
| Class K Shares† | ||||
1 Year | 15.26 | % | ||
5 Years | 5.37 | % | ||
Since Inception* | 4.38 | % | ||
| Class I Shares† | ||||
1 Year | 15.60 | % | ||
5 Years | 5.72 | % | ||
Since Inception* | 4.71 | % | ||
| (a) | Assumes conversion of Class B shares into Class A shares after eight years. |
| * | Inception dates: 11/3/03 for Class R shares; 3/1/05 for Class K and Class I shares. |
| † | Please note that these share classes are for investors purchasing shares through accounts established under certain fee-based programs sponsored and maintained by certain broker-dealers and financial intermediaries, institutional pension plans and/or investment advisory clients of, and certain other persons associated with, the Adviser and its affiliates or the Fund. The inception dates for Class R, K and I shares are listed above. |
See Disclosures, Risks and Note about Historical Performance on page 3.
| 6 | • ALLIANCEBERNSTEIN GROWTH & INCOME FUND |
Historical Performance
EXPENSE EXAMPLE
(unaudited)
As a shareholder of the Fund, you incur two types of costs: (1) transaction costs, including sales charges (loads) on purchase payments, contingent deferred sales charges on redemptions and (2) ongoing costs, including management fees; distribution (12b-1) fees; and other Fund expenses. This example is intended to help you understand your ongoing costs (in dollars) of investing in the Fund and to compare these costs with the ongoing costs of investing in other mutual funds.
The Example is based on an investment of $1,000 invested at the beginning of the period and held for the entire period as indicated below.
Actual Expenses
The table below provides information about actual account values and actual expenses. You may use the information, together with the amount you invested, to estimate the expenses that you paid over the period. Simply divide your account value by $1,000 (for example, an $8,600 account value divided by $1,000 = 8.6), then multiply the result by the number under the heading entitled “Expenses Paid During Period” to estimate the expenses you paid on your account during this period.
Hypothetical Example for Comparison Purposes
The table below also provides information about hypothetical account values and hypothetical expenses based on the Fund’s actual expense ratio and an assumed annual rate of return of 5% before expenses, which is not the Fund’s actual return. The hypothetical account values and expenses may not be used to estimate the actual ending account balance or expenses you paid for the period. You may use this information to compare the ongoing costs of investing in the Fund and other funds by comparing this 5% hypothetical example with the 5% hypothetical examples that appear in the shareholder reports of other funds.
Please note that the expenses shown in the table are meant to highlight your ongoing costs only and do not reflect any transactional costs, such as sales charges (loads), or contingent deferred sales charges on redemptions. Therefore, the hypothetical example is useful in comparing ongoing costs only, and will not help you determine the relative total costs of owning different funds. In addition, if these transactional costs were included, your costs would have been higher.
| Beginning Account Value November 1, 2012 | Ending Account Value April 30, 2013 | Expenses Paid During Period* | Annualized Expense Ratio* | |||||||||||||
| Class A | ||||||||||||||||
Actual | $ | 1,000 | $ | 1,134.90 | $ | 5.88 | 1.11 | % | ||||||||
Hypothetical** | $ | 1,000 | $ | 1,019.29 | $ | 5.56 | 1.11 | % | ||||||||
| Class B | ||||||||||||||||
Actual | $ | 1,000 | $ | 1,129.10 | $ | 9.87 | 1.87 | % | ||||||||
Hypothetical** | $ | 1,000 | $ | 1,015.52 | $ | 9.35 | 1.87 | % | ||||||||
| Class C | ||||||||||||||||
Actual | $ | 1,000 | $ | 1,129.70 | $ | 9.72 | 1.84 | % | ||||||||
Hypothetical** | $ | 1,000 | $ | 1,015.67 | $ | 9.20 | 1.84 | % | ||||||||
| Advisor Class | ||||||||||||||||
Actual | $ | 1,000 | $ | 1,134.80 | $ | 4.39 | 0.83 | % | ||||||||
Hypothetical** | $ | 1,000 | $ | 1,020.68 | $ | 4.16 | 0.83 | % | ||||||||
| Class R | ||||||||||||||||
Actual | $ | 1,000 | $ | 1,132.90 | $ | 7.19 | 1.36 | % | ||||||||
Hypothetical** | $ | 1,000 | $ | 1,018.05 | $ | 6.80 | 1.36 | % | ||||||||
| Class K | ||||||||||||||||
Actual | $ | 1,000 | $ | 1,133.30 | $ | 5.55 | 1.05 | % | ||||||||
Hypothetical** | $ | 1,000 | $ | 1,019.59 | $ | 5.26 | 1.05 | % | ||||||||
| Class I | ||||||||||||||||
Actual | $ | 1,000 | $ | 1,136.70 | $ | 3.50 | 0.66 | % | ||||||||
Hypothetical** | $ | 1,000 | $ | 1,021.52 | $ | 3.31 | 0.66 | % | ||||||||
| * | Expenses are equal to the classes’ annualized expense ratios multiplied by the average account value over the period, multiplied by 181/365 (to reflect the one-half year period). |
| ** | Assumes 5% annual return before expenses. |
| ALLIANCEBERNSTEIN GROWTH & INCOME FUND • | 7 |
Expense Example
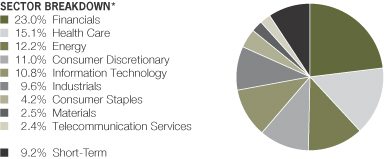
PORTFOLIO SUMMARY
April 30, 2013 (unaudited)
PORTFOLIO STATISTICS
Net Assets ($mil): $1,453.2
TEN LARGEST HOLDINGS**
April 30, 2013 (unaudited)
| Company | U.S. $ Value | Percent of Net Assets | ||||||
JPMorgan Chase & Co. | $ | 60,442,073 | 4.2 | % | ||||
Boeing Co. (The) | 55,077,267 | 3.8 | ||||||
UnitedHealth Group, Inc. | 53,148,321 | 3.7 | ||||||
Liberty Interactive Corp. | 52,907,332 | 3.6 | ||||||
Berkshire Hathaway, Inc. | 50,562,602 | 3.5 | ||||||
Exxon Mobil Corp. | 49,271,983 | 3.4 | ||||||
Wells Fargo & Co. | 48,810,756 | 3.4 | ||||||
Chevron Corp. | 47,330,119 | 3.2 | ||||||
Apple, Inc. | 42,145,815 | 2.9 | ||||||
Amgen, Inc. | 41,397,214 | 2.8 | ||||||
| $ | 501,093,482 | 34.5 | % | |||||
| * | All data are as of April 30, 2013. The Fund’s sector breakdown is expressed as a percentage of total investments (excluding collateral for security loaned) and may vary over time. |
| ** | Long-term investments. |
Please note: The sector classifications presented herein are based on the Global Industry Classification Standard (GICS) which was developed by Morgan Stanley Capital International and Standard & Poor’s. The components are divided into sector, industry group, and industry sub-indices as classified by the GICS for each of the market capitalization indices in the broad market. These sector classifications are broadly defined. The “Portfolio of Investments” section of the report reflects more specific industry information and is consistent with the investment restrictions discussed in the Fund’s prospectus.
| 8 | • ALLIANCEBERNSTEIN GROWTH & INCOME FUND |
Portfolio Summary and Ten Largest Holdings
PORTFOLIO OF INVESTMENTS
April 30, 2013 (unaudited)
| Company | Shares | U.S. $ Value | ||||||
| ||||||||
COMMON STOCKS – 91.7% | ||||||||
Financials – 23.2% | ||||||||
Capital Markets – 7.1% | ||||||||
BlackRock, Inc. – Class A | 132,474 | $ | 35,304,321 | |||||
Goldman Sachs Group, Inc. (The) | 237,690 | 34,719,378 | ||||||
State Street Corp. | 566,170 | 33,103,960 | ||||||
|
| |||||||
| 103,127,659 | ||||||||
|
| |||||||
Commercial Banks – 4.3% | ||||||||
Fifth Third Bancorp | 789,090 | 13,438,203 | ||||||
Wells Fargo & Co. | 1,285,170 | 48,810,756 | ||||||
|
| |||||||
| 62,248,959 | ||||||||
|
| |||||||
Consumer Finance – 0.8% | ||||||||
Capital One Financial Corp. | 197,000 | 11,382,660 | ||||||
|
| |||||||
Diversified Financial Services – 4.1% | ||||||||
JPMorgan Chase & Co. | 1,233,260 | 60,442,073 | ||||||
|
| |||||||
Insurance – 6.9% | ||||||||
ACE Ltd. | 259,640 | 23,144,310 | ||||||
Berkshire Hathaway, Inc.(a) | 475,570 | 50,562,602 | ||||||
Hartford Financial Services Group, Inc. | 213,210 | 5,989,069 | ||||||
MetLife, Inc. | 215,498 | 8,402,267 | ||||||
Travelers Cos., Inc. (The) | 143,450 | 12,252,065 | ||||||
|
| |||||||
| 100,350,313 | ||||||||
|
| |||||||
| 337,551,664 | ||||||||
|
| |||||||
Health Care – 15.3% | ||||||||
Biotechnology – 3.4% | ||||||||
Amgen, Inc. | 397,248 | 41,397,214 | ||||||
Celgene Corp.(a) | 70,650 | 8,341,646 | ||||||
|
| |||||||
| 49,738,860 | ||||||||
|
| |||||||
Health Care Equipment & Supplies – 0.8% | ||||||||
Zimmer Holdings, Inc. | 139,310 | 10,650,249 | ||||||
|
| |||||||
Health Care Providers & Services – 5.5% | ||||||||
Humana, Inc. | 174,680 | 12,945,535 | ||||||
McKesson Corp. | 127,790 | 13,522,738 | ||||||
UnitedHealth Group, Inc. | 886,840 | 53,148,321 | ||||||
|
| |||||||
| 79,616,594 | ||||||||
|
| |||||||
Pharmaceuticals – 5.6% | ||||||||
Bristol-Myers Squibb Co. | 554,080 | 22,008,058 | ||||||
Merck & Co., Inc. | 637,260 | 29,951,220 | ||||||
Pfizer, Inc. | 1,025,980 | 29,825,238 | ||||||
|
| |||||||
| 81,784,516 | ||||||||
|
| |||||||
| 221,790,219 | ||||||||
|
| |||||||
Energy – 12.4% | ||||||||
Energy Equipment & Services – 2.9% | ||||||||
Diamond Offshore Drilling, Inc.(b) | 338,737 | 23,406,727 | ||||||
National Oilwell Varco, Inc. | 149,149 | 9,727,498 | ||||||
| ALLIANCEBERNSTEIN GROWTH & INCOME FUND • | 9 |
Portfolio of Investments
| Company | Shares | U.S. $ Value | ||||||
| ||||||||
Transocean Ltd.(a) | 168,360 | $ | 8,665,489 | |||||
|
| |||||||
| 41,799,714 | ||||||||
|
| |||||||
Oil, Gas & Consumable Fuels – 9.5% | ||||||||
Chevron Corp. | 387,920 | 47,330,119 | ||||||
ConocoPhillips | 275,570 | 16,658,206 | ||||||
Exxon Mobil Corp. | 553,680 | 49,271,983 | ||||||
HollyFrontier Corp. | 244,210 | 12,076,185 | ||||||
Occidental Petroleum Corp. | 142,720 | 12,739,187 | ||||||
|
| |||||||
| 138,075,680 | ||||||||
|
| |||||||
| 179,875,394 | ||||||||
|
| |||||||
Consumer Discretionary – 11.1% | ||||||||
Diversified Consumer Services – 0.5% | ||||||||
DeVry, Inc. | 269,966 | 7,561,748 | ||||||
|
| |||||||
Internet & Catalog Retail – 3.6% | ||||||||
Liberty Interactive Corp.(a) | 2,485,079 | 52,907,332 | ||||||
|
| |||||||
Leisure Equipment & Products – 0.4% | ||||||||
Mattel, Inc. | 123,360 | 5,632,617 | ||||||
|
| |||||||
Media – 5.3% | ||||||||
Comcast Corp. – Class A | 844,350 | 34,871,655 | ||||||
Scripps Networks Interactive, Inc. – Class A | 200,840 | 13,371,927 | ||||||
Viacom, Inc. – Class B | 439,490 | 28,122,965 | ||||||
|
| |||||||
| 76,366,547 | ||||||||
|
| |||||||
Multiline Retail – 0.9% | ||||||||
Macy’s, Inc. | 283,400 | 12,639,640 | ||||||
|
| |||||||
Specialty Retail – 0.4% | ||||||||
O’Reilly Automotive, Inc.(a) | 58,190 | 6,244,951 | ||||||
|
| |||||||
| 161,352,835 | ||||||||
|
| |||||||
Information Technology – 10.9% | ||||||||
Communications Equipment – 2.3% | ||||||||
Cisco Systems, Inc. | 1,581,470 | 33,084,352 | ||||||
|
| |||||||
Computers & Peripherals – 2.9% | ||||||||
Apple, Inc. | 95,191 | 42,145,815 | ||||||
|
| |||||||
Internet Software & Services – 0.9% | ||||||||
Yahoo!, Inc.(a) | 527,790 | 13,052,247 | ||||||
|
| |||||||
IT Services – 0.7% | ||||||||
Amdocs Ltd. | 283,304 | 10,113,953 | ||||||
|
| |||||||
Semiconductors & Semiconductor Equipment – 1.2% | ||||||||
NVIDIA Corp. | 870,490 | 11,986,648 | ||||||
Taiwan Semiconductor Manufacturing Co., Ltd. (Sponsored ADR) | 321,440 | 6,133,075 | ||||||
|
| |||||||
| 18,119,723 | ||||||||
|
| |||||||
| 10 | • ALLIANCEBERNSTEIN GROWTH & INCOME FUND |
Portfolio of Investments
| Company | Shares | U.S. $ Value | ||||||
| ||||||||
Software – 2.9% | ||||||||
Cadence Design Systems, Inc.(a) | 840,760 | $ | 11,602,488 | |||||
Microsoft Corp. | 599,310 | 19,837,161 | ||||||
Oracle Corp. | 306,080 | 10,033,302 | ||||||
|
| |||||||
| 41,472,951 | ||||||||
|
| |||||||
| 157,989,041 | ||||||||
|
| |||||||
Industrials – 9.7% | ||||||||
Aerospace & Defense – 4.7% | ||||||||
Boeing Co. (The) | 602,530 | 55,077,267 | ||||||
Raytheon Co. | 219,720 | 13,486,414 | ||||||
|
| |||||||
| 68,563,681 | ||||||||
|
| |||||||
Airlines – 0.4% | ||||||||
Delta Air Lines, Inc.(a) | 359,080 | 6,154,631 | ||||||
|
| |||||||
Industrial Conglomerates – 3.0% | ||||||||
Carlisle Cos., Inc. | 127,740 | 8,286,494 | ||||||
General Electric Co. | 1,594,840 | 35,548,983 | ||||||
|
| |||||||
| 43,835,477 | ||||||||
|
| |||||||
Machinery – 1.6% | ||||||||
Actuant Corp. – Class A | 183,051 | 5,729,496 | ||||||
Dover Corp. | 150,960 | 10,413,221 | ||||||
Lincoln Electric Holdings, Inc. | 121,482 | 6,409,391 | ||||||
|
| |||||||
| 22,552,108 | ||||||||
|
| |||||||
| 141,105,897 | ||||||||
|
| |||||||
Consumer Staples – 4.2% | ||||||||
Food & Staples Retailing – 1.7% | ||||||||
CVS Caremark Corp. | 419,184 | 24,388,125 | ||||||
|
| |||||||
Food Products – 1.5% | ||||||||
Smithfield Foods, Inc.(a) | 878,481 | 22,489,114 | ||||||
|
| |||||||
Household Products – 1.0% | ||||||||
Energizer Holdings, Inc. | 155,070 | 14,978,211 | ||||||
|
| |||||||
| 61,855,450 | ||||||||
|
| |||||||
Materials – 2.5% | ||||||||
Chemicals – 0.3% | ||||||||
CF Industries Holdings, Inc. | 24,580 | 4,584,416 | ||||||
|
| |||||||
Metals & Mining – 0.6% | ||||||||
Reliance Steel & Aluminum Co. | 127,800 | 8,315,946 | ||||||
|
| |||||||
Paper & Forest Products – 1.6% | ||||||||
Domtar Corp. | 338,980 | 23,562,500 | ||||||
|
| |||||||
| 36,462,862 | ||||||||
|
| |||||||
| ALLIANCEBERNSTEIN GROWTH & INCOME FUND • | 11 |
Portfolio of Investments
| Company | Shares | U.S. $ Value | ||||||
| ||||||||
Telecommunication Services – 2.4% | ||||||||
Diversified Telecommunication | ||||||||
AT&T, Inc. | 939,590 | $ | 35,197,041 | |||||
|
| |||||||
Total Common Stocks | 1,333,180,403 | |||||||
|
| |||||||
SHORT-TERM INVESTMENTS – 9.3% | ||||||||
Investment Companies – 9.3% | ||||||||
AllianceBernstein Fixed-Income Shares, Inc. – Government STIF Portfolio, 0.09%(c) | 135,019,237 | 135,019,237 | ||||||
|
| |||||||
Total Investments Before Security Lending Collateral for Securities Loaned – 101.0% | 1,468,199,640 | |||||||
|
| |||||||
INVESTMENTS OF CASH COLLATERAL FOR SECURITIES LOANED – 1.7% | ||||||||
Investment Companies – 1.7% | ||||||||
AllianceBernstein Exchange | 23,880,959 | 23,880,959 | ||||||
|
| |||||||
Total Investments – 102.7% | 1,492,080,599 | |||||||
Other assets less liabilities – (2.7)% | (38,925,852 | ) | ||||||
|
| |||||||
Net Assets – 100.0% | $ | 1,453,154,747 | ||||||
|
| |||||||
| (a) | Non-income producing security. |
| (b) | Represents entire or partial securities out on loan. See Note E for securities lending information. |
| (c) | Investment in affiliated money market mutual fund. The rate shown represents the 7-day yield as of period end. |
Glossary:
ADR – American Depositary Receipt
See notes to financial statements.
| 12 | • ALLIANCEBERNSTEIN GROWTH & INCOME FUND |
Portfolio of Investments
STATEMENT OF ASSETS & LIABILITIES
April 30, 2013 (unaudited)
| Assets | ||||
Investments in securities, at value | ||||
Unaffiliated issuers (cost $1,044,142,795) | $ | 1,333,180,403 | (a) | |
Affiliated issuers (cost $158,900,196—including investment of cash collateral for securities loaned of $23,880,959) | 158,900,196 | |||
Receivable for investment securities sold | 10,094,412 | |||
Receivable for capital stock sold | 2,741,071 | |||
Dividends and interest receivable | 1,177,791 | |||
|
| |||
Total assets | 1,506,093,873 | |||
|
| |||
| Liabilities | ||||
Payable for investment securities purchased | 25,245,690 | |||
Payable for collateral received on securities loaned | 23,880,959 | |||
Payable for capital stock redeemed | 2,163,203 | |||
Advisory fee payable | 652,239 | |||
Distribution fee payable | 443,442 | |||
Transfer Agent fee payable | 246,464 | |||
Administrative fee payable | 18,985 | |||
Accrued expenses | 288,144 | |||
|
| |||
Total liabilities | 52,939,126 | |||
|
| |||
Net Assets | $ | 1,453,154,747 | ||
|
| |||
| Composition of Net Assets | ||||
Capital stock, at par | $ | 3,243,551 | ||
Additional paid-in capital | 1,367,197,119 | |||
Undistributed net investment income | 5,858,177 | |||
Accumulated net realized loss on investment transactions | (212,181,708 | ) | ||
Net unrealized appreciation on investments | 289,037,608 | |||
|
| |||
| $ | 1,453,154,747 | |||
|
|
Net Asset Value Per Share—21 billion shares of capital stock authorized, $.01 par value
| Class | Net Assets | Shares Outstanding | Net Asset Value | |||||||||
| ||||||||||||
| A | $ | 1,120,440,538 | 250,019,053 | $ | 4.48 | * | ||||||
| ||||||||||||
| B | $ | 43,524,134 | 9,753,097 | $ | 4.46 | |||||||
| ||||||||||||
| C | $ | 182,303,241 | 40,782,281 | $ | 4.47 | |||||||
| ||||||||||||
| Advisor | $ | 100,289,059 | 22,313,494 | $ | 4.49 | |||||||
| ||||||||||||
| R | $ | 4,134,306 | 935,124 | $ | 4.42 | |||||||
| ||||||||||||
| K | $ | 2,256,933 | 506,662 | $ | 4.45 | |||||||
| ||||||||||||
| I | $ | 206,536 | 45,423 | $ | 4.55 | |||||||
| ||||||||||||
| (a) | Includes securities on loan with a value of $23,406,727 (see Note E). |
| * | The maximum offering price per share for Class A shares was $4.68 which reflects a sales charge of 4.25%. |
See notes to financial statements.
| ALLIANCEBERNSTEIN GROWTH & INCOME FUND • | 13 |
Statement of Assets & Liabilities
STATEMENT OF OPERATIONS
Six Months Ended April 30, 2013 (unaudited)
| Investment Income | ||||||||
Dividends | ||||||||
Unaffiliated issuers | $ | 14,298,687 | ||||||
Affiliated issuers | 45,251 | |||||||
Interest | 22 | |||||||
Securities lending income | 3,388 | $ | 14,347,348 | |||||
|
| |||||||
| Expenses | ||||||||
Advisory fee (see Note B) | 3,807,926 | |||||||
Distribution fee—Class A | 1,500,193 | |||||||
Distribution fee—Class B | 224,862 | |||||||
Distribution fee—Class C | 869,432 | |||||||
Distribution fee—Class R | 9,704 | |||||||
Distribution fee—Class K | 2,982 | |||||||
Transfer agency—Class A | 1,220,203 | |||||||
Transfer agency—Class B | 60,872 | |||||||
Transfer agency—Class C | 204,081 | |||||||
Transfer agency—Advisor Class | 100,106 | |||||||
Transfer agency—Class R | 5,046 | |||||||
Transfer agency—Class K | 2,386 | |||||||
Transfer agency—Class I | 8 | |||||||
Custodian | 106,330 | |||||||
Printing | 95,576 | |||||||
Registration fees | 55,267 | |||||||
Directors’ fees | 28,216 | |||||||
Administrative | 25,093 | |||||||
Legal | 20,506 | |||||||
Audit | 19,916 | |||||||
Miscellaneous | 22,302 | |||||||
|
| |||||||
Total expenses | 8,381,007 | |||||||
|
| |||||||
Net investment income | 5,966,341 | |||||||
|
| |||||||
| Realized and Unrealized Gain on Investment Transactions | ||||||||
Net realized gain on investment transactions | 81,173,568 | |||||||
Net change in unrealized appreciation/depreciation of investments | 88,611,374 | |||||||
|
| |||||||
Net gain on investment transactions | 169,784,942 | |||||||
|
| |||||||
Net Increase in Net Assets from Operations | $ | 175,751,283 | ||||||
|
|
See notes to financial statements.
| 14 | • ALLIANCEBERNSTEIN GROWTH & INCOME FUND |
Statement of Operations
STATEMENT OF CHANGES IN NET ASSETS
| Six Months Ended April 30, 2013 (unaudited) | Year Ended October 31, 2012 | |||||||
| Increase in Net Assets from Operations | ||||||||
Net investment income | $ | 5,966,341 | $ | 11,757,573 | ||||
Net realized gain on investment transactions | 81,173,568 | 116,032,987 | ||||||
Net change in unrealized appreciation/depreciation of investments | 88,611,374 | 76,897,157 | ||||||
|
|
|
| |||||
Net increase in net assets from operations | 175,751,283 | 204,687,717 | ||||||
| Dividends to Shareholders from | ||||||||
Net investment income | ||||||||
Class A | (8,683,698 | ) | (12,185,822 | ) | ||||
Class B | – 0 | – | (17,704 | ) | ||||
Class C | (131,803 | ) | (712,852 | ) | ||||
Advisor Class | (914,533 | ) | (1,093,023 | ) | ||||
Class R | (29,001 | ) | (25,662 | ) | ||||
Class K | (21,463 | ) | (38,887 | ) | ||||
Class I | (147 | ) | – 0 | – | ||||
| Capital Stock Transactions | ||||||||
Net decrease | (77,402,062 | ) | (155,148,493 | ) | ||||
| Capital Contributions | ||||||||
Proceeds from third party regulatory settlement (see Note F) | – 0 | – | 119,766 | |||||
|
|
|
| |||||
Total increase | 88,568,576 | 35,585,040 | ||||||
| Net Assets | ||||||||
Beginning of period | 1,364,586,171 | 1,329,001,131 | ||||||
|
|
|
| |||||
End of period (including undistributed net investment income of $5,858,177 and $9,672,481, respectively) | $ | 1,453,154,747 | $ | 1,364,586,171 | ||||
|
|
|
| |||||
See notes to financial statements.
| ALLIANCEBERNSTEIN GROWTH & INCOME FUND • | 15 |
Statement of Changes in Net Assets
NOTES TO FINANCIAL STATEMENTS
April 30, 2013 (unaudited)
NOTE A
Significant Accounting Policies
AllianceBernstein Growth and Income Fund, Inc. (the “Fund”) is registered under the Investment Company Act of 1940 as a diversified, open-end management investment company. The Fund offers Class A, Class B, Class C, Advisor Class, Class R, Class K and Class I shares. Class A shares are sold with a front-end sales charge of up to 4.25% for purchases not exceeding $1,000,000. With respect to purchases of $1,000,000 or more, Class A shares redeemed within one year of purchase may be subject to a contingent deferred sales charge of 1%. Class B shares are currently sold with a contingent deferred sales charge which declines from 4% to zero depending on the period of time the shares are held. Effective January 31, 2009, sales of Class B shares of the Fund to new investors were suspended. Class B shares will only be issued (i) upon the exchange of Class B shares from another AllianceBernstein Mutual Fund, (ii) for purposes of dividend reinvestment, (iii) through the Fund’s Automatic Investment Program (the “Program”) for accounts that established the Program prior to January 31, 2009, and (iv) for purchases of additional shares by Class B shareholders as of January 31, 2009. The ability to establish a new Program for accounts containing Class B shares was suspended as of January 31, 2009. Class B shares will automatically convert to Class A shares eight years after the end of the calendar month of purchase. Class C shares are subject to a contingent deferred sales charge of 1% on redemptions made within the first year after purchase. Class R and Class K shares are sold without an initial or contingent deferred sales charge. Advisor Class and Class I shares are sold without an initial or contingent deferred sales charge and are not subject to ongoing distribution expenses. All seven classes of shares have identical voting, dividend, liquidation and other rights, except that the classes bear different distribution and transfer agency expenses. Each class has exclusive voting rights with respect to its distribution plan. The financial statements have been prepared in conformity with U.S. generally accepted accounting principles (“U.S. GAAP”) which require management to make certain estimates and assumptions that affect the reported amounts of assets and liabilities in the financial statements and amounts of income and expenses during the reporting period. Actual results could differ from those estimates. The following is a summary of significant accounting policies followed by the Fund.
1. Security Valuation
Portfolio securities are valued at their current market value determined on the basis of market quotations or, if market quotations are not readily available or are deemed unreliable, at “fair value” as determined in accordance with procedures established by and under the general supervision of the Fund’s Board of Directors (the “Board”).
In general, the market value of securities which are readily available and deemed reliable are determined as follows: Securities listed on a national securities exchange (other than securities listed on the NASDAQ Stock Market, Inc.
| 16 | • ALLIANCEBERNSTEIN GROWTH & INCOME FUND |
Notes to Financial Statements
(“NASDAQ”)) or on a foreign securities exchange are valued at the last sale price at the close of the exchange or foreign securities exchange. If there has been no sale on such day, the securities are valued at the last traded price from the previous day. Securities listed on more than one exchange are valued by reference to the principal exchange on which the securities are traded; securities listed only on NASDAQ are valued in accordance with the NASDAQ Official Closing Price; listed or over the counter (“OTC”) market put or call options are valued at the mid level between the current bid and ask prices. If either a current bid or current ask price is unavailable, AllianceBernstein L.P. (the “Adviser”) will have discretion to determine the best valuation (e.g. last trade price in the case of listed options); open futures contracts are valued using the closing settlement price or, in the absence of such a price, the most recent quoted bid price. If there are no quotations available for the day of valuation, the last available closing settlement price is used; U.S. government securities and other debt instruments having 60 days or less remaining until maturity are valued at amortized cost if their original maturity was 60 days or less; or by amortizing their fair value as of the 61st day prior to maturity if their original term to maturity exceeded 60 days; fixed-income securities, including mortgage backed and asset backed securities, may be valued on the basis of prices provided by a pricing service or at a price obtained from one or more of the major broker/dealers. In cases where broker/dealer quotes are obtained, the Adviser may establish procedures whereby changes in market yields or spreads are used to adjust, on a daily basis, a recently obtained quoted price on a security. Swaps and other derivatives are valued daily, primarily using independent pricing services, independent pricing models using market inputs, as well as third party broker-dealers or counterparties. Investments in money market funds are valued at their net asset value each day.
Securities for which market quotations are not readily available (including restricted securities) or are deemed unreliable are valued at fair value. Factors considered in making this determination may include, but are not limited to, information obtained by contacting the issuer, analysts, analysis of the issuer’s financial statements or other available documents. In addition, the Fund may use fair value pricing for securities primarily traded in non-U.S. markets because most foreign markets close well before the Fund values its securities at 4:00 p.m., Eastern Time. The earlier close of these foreign markets gives rise to the possibility that significant events, including broad market moves, may have occurred in the interim and may materially affect the value of those securities.
2. Fair Value Measurements
In accordance with U.S. GAAP regarding fair value measurements, fair value is defined as the price that the Fund would receive to sell an asset or pay to transfer a liability in an orderly transaction between market participants at the measurement date. U.S. GAAP establishes a framework for measuring fair value, and a three-level hierarchy for fair value measurements based upon the transparency of inputs to the valuation of an asset or liability (including those valued based on their market
| ALLIANCEBERNSTEIN GROWTH & INCOME FUND • | 17 |
Notes to Financial Statements
values as described in Note 1 above). Inputs may be observable or unobservable and refer broadly to the assumptions that market participants would use in pricing the asset or liability. Observable inputs reflect the assumptions market participants would use in pricing the asset or liability based on market data obtained from sources independent of the Fund. Unobservable inputs reflect the Fund’s own assumptions about the assumptions that market participants would use in pricing the asset or liability based on the best information available in the circumstances. Each investment is assigned a level based upon the observability of the inputs which are significant to the overall valuation. The three-tier hierarchy of inputs is summarized below.
| • | Level 1—quoted prices in active markets for identical investments |
| • | Level 2—other significant observable inputs (including quoted prices for similar investments, interest rates, prepayment speeds, credit risk, etc.) |
| • | Level 3—significant unobservable inputs (including the Fund’s own assumptions in determining the fair value of investments) |
Where readily available market prices or relevant bid prices are not available for certain equity investments, such investments may be valued based on similar publicly traded investments, movements in relevant indices since last available prices or based upon underlying company fundamentals and comparable company data (such as multiples to earnings or other multiples to equity). Where an investment is valued using an observable input, such as another publicly traded security, the investment will be classified as Level 2. If management determines that an adjustment is appropriate based on restrictions on resale, illiquidity or uncertainty, and such adjustment is a significant component of the valuation, the investment will be classified as Level 3. An investment will also be classified as Level 3 where management uses company fundamentals and other significant inputs to determine the valuation.
The following table summarizes the valuation of the Fund’s investments by the above fair value hierarchy levels as of April 30, 2013:
Investments in Securities: | Level 1 | Level 2 | Level 3 | Total | ||||||||||||
Assets: | ||||||||||||||||
Common Stocks* | $ | 1,333,180,403 | $ | – 0 | – | $ | – 0 | – | $ | 1,333,180,403 | ||||||
Short-Term Investments | 135,019,237 | – 0 | – | – 0 | – | 135,019,237 | ||||||||||
Investments of Cash Collateral for Securities Loaned in Affiliated Money Market Fund | 23,880,959 | – 0 | – | – 0 | – | 23,880,959 | ||||||||||
|
|
|
|
|
|
|
| |||||||||
Total Investments in Securities | 1,492,080,599 | – 0 | – | – 0 | – | 1,492,080,599 | ||||||||||
Other Financial Instruments** | – 0 | – | – 0 | – | – 0 | – | – 0 | – | ||||||||
|
|
|
|
|
|
|
| |||||||||
Total+ | $ | 1,492,080,599 | $ | – 0 | – | $ | – 0 | – | $ | 1,492,080,599 | ||||||
|
|
|
|
|
|
|
| |||||||||
| * | See Portfolio of Investments for sector classifications. |
| ** | Other financial instruments are derivative instruments, such as futures, forwards and swap contracts, which are valued at the unrealized appreciation/depreciation on the instrument. |
| + | There were no transfers between Level 1 and Level 2 during the reporting period. |
| 18 | • ALLIANCEBERNSTEIN GROWTH & INCOME FUND |
Notes to Financial Statements
The Fund recognizes all transfers between levels of the fair value hierarchy assuming the financial instruments were transferred at the beginning of the reporting period.
The Adviser has established a Valuation Committee (the “Committee”) which is responsible for overseeing the pricing and valuation of all securities held in the Fund. The Committee operates under pricing and valuation policies and procedures established by the Adviser and approved by the Board, including pricing policies which set forth the mechanisms and processes to be employed on a daily basis to implement these policies and procedures. In particular, the pricing policies describe how to determine market quotations for securities and other instruments. The Committee’s responsibilities include: 1) fair value and liquidity determinations (and oversight of any third parties to whom any responsibility for fair value and liquidity determinations is delegated), and 2) regular monitoring of the Adviser’s pricing and valuation policies and procedures and modification or enhancement of these policies and procedures (or recommendation of the modification of these policies and procedures) as the Committee believes appropriate.
The Committee is also responsible for monitoring the implementation of the pricing policies by the Adviser’s Pricing Group (the “Pricing Group”) and a third party which performs certain pricing functions in accordance with the pricing policies. The Pricing Group is responsible for the oversight of the third party on a day-to-day basis. The Committee and the Pricing Group perform a series of activities to provide reasonable assurance of the accuracy of prices including: 1) periodic vendor due diligence meetings, review of methodologies, new developments and process at vendors, 2) daily compare of security valuation versus prior day for all securities that exceeded established thresholds, and 3) daily review of unpriced, stale, and variance reports with exceptions reviewed by senior management and the Committee.
In addition, several processes outside of the pricing process are used to monitor valuation issues including: 1) performance and performance attribution reports are monitored for anomalous impacts based upon benchmark performance, and 2) portfolio managers review all portfolios for performance and analytics (which are generated using the Adviser’s prices).
3. Taxes
It is the Fund’s policy to meet the requirements of the Internal Revenue Code applicable to regulated investment companies and to distribute all of its investment company taxable income and net realized gains, if any, to shareholders. Therefore, no provisions for federal income or excise taxes are required. The Fund may be subject to taxes imposed by countries in which it invests. Such taxes are generally based on income and/or capital gains earned or repatriated. Taxes are accrued and applied to net investment income, net realized gains and net unrealized appreciation/depreciation as such income and/or gains are earned.
In accordance with U.S. GAAP requirements regarding accounting for uncertainties in income taxes, management has analyzed the Fund’s tax positions
| ALLIANCEBERNSTEIN GROWTH & INCOME FUND • | 19 |
Notes to Financial Statements
taken or expected to be taken on federal and state income tax returns for all open tax years (the current and the prior three tax years) and has concluded that no provision for income tax is required in the Fund’s financial statements.
4. Investment Income and Investment Transactions
Dividend income is recorded on the ex-dividend date or as soon as the Fund is informed of the dividend. Interest income is accrued daily. Investment transactions are accounted for on the date the securities are purchased or sold. Investment gains or losses are determined on the identified cost basis. The Fund amortizes premiums and accretes discounts as adjustments to interest income.
5. Class Allocations
All income earned and expenses incurred by the Fund are borne on a pro-rata basis by each outstanding class of shares, based on the proportionate interest in the Fund represented by the net assets of such class, except for class specific expenses which are allocated to the respective class. Realized and unrealized gains and losses are allocated among the various share classes based on respective net assets.
6. Dividends and Distributions
Dividends and distributions to shareholders, if any, are recorded on the ex-dividend date. Income dividends and capital gains distributions are determined in accordance with federal tax regulations and may differ from those determined in accordance with U.S. GAAP. To the extent these differences are permanent, such amounts are reclassified within the capital accounts based on their federal tax basis treatment; temporary differences do not require such reclassification.
NOTE B
Advisory Fee and Other Transactions with Affiliates
Under the terms of the investment advisory agreement, the Fund pays the Adviser an advisory fee at an annual rate of .55% of the first $2.5 billion, .45% of the next $2.5 billion and .40% in excess of $5 billion, of the Fund’s average daily net assets. The fee is accrued daily and paid monthly.
Pursuant to the investment advisory agreement, the Fund may reimburse the Adviser for certain legal and accounting services provided to the Fund by the Adviser. For the six months ended April 30, 2013, the reimbursement for such services amounted to $25,093.
The Fund compensates AllianceBernstein Investor Services, Inc. (“ABIS”), a wholly-owned subsidiary of the Adviser, under a Transfer Agency Agreement for providing personnel and facilities to perform transfer agency services for the Fund. ABIS may make payments to intermediaries that provide omnibus account services, sub-accounting services and/or networking services. Such compensation retained by ABIS amounted to $702,804 for the six months ended April 30, 2013.
| 20 | • ALLIANCEBERNSTEIN GROWTH & INCOME FUND |
Notes to Financial Statements
AllianceBernstein Investments, Inc. (the “Distributor”), a wholly-owned subsidiary of the Adviser, serves as the distributor of the Fund’s shares. The Distributor has advised the Fund that it has retained front-end sales charges of $9,453 from the sale of Class A shares and received $4,528, $9,042 and $1,071 in contingent deferred sales charges imposed upon redemptions by shareholders of Class A, Class B and Class C shares, respectively, for the six months ended April 30, 2013.
The Fund may invest in the AllianceBernstein Fixed-Income Shares, Inc.—Government STIF Portfolio (“Government STIF Portfolio”), an open-end management investment company managed by the Adviser. The Government STIF Portfolio is offered as a cash management option to mutual funds and other institutional accounts of the Adviser, and is not available for direct purchase by members of the public. The Government STIF Portfolio pays no investment management fees but does bear its own expenses. A summary of the Fund’s transactions in shares of the Government STIF Portfolio for the six months ended April 30, 2013 is as follows:
Market Value October 31, 2012 (000) | Purchases at Cost (000) | Sales Proceeds (000) | Market Value April 30, 2013 (000) | Dividend Income (000) | ||||||||||||
| $ 84,364 | $ | 295,766 | $ | 245,111 | $ | 135,019 | $ | 43 | ||||||||
Brokerage commissions paid on investment transactions for the six months ended April 30, 2013 amounted to $912,340, of which $0 and $0, respectively, was paid to Sanford C. Bernstein & Co. LLC and Sanford C. Bernstein Limited, affiliates of the Adviser.
NOTE C
Distribution Services Agreement
The Fund has adopted a Distribution Services Agreement (the “Agreement”) pursuant to Rule 12b-1 under the Investment Company Act of 1940. Under the Agreement, the Fund pays distribution and servicing fees to the Distributor at an annual rate of up to .30% of the Fund’s average daily net assets attributable to Class A shares, 1% of the Fund’s average daily net assets attributable to both Class B and Class C shares, .50% of the Fund’s average daily net assets attributable to Class R shares and .25% of the Fund’s average daily net assets attributable to Class K shares. There are no distribution and servicing fees on the Advisor Class and Class I shares. Payments under the Class A plan are currently limited to .28% of the Fund’s average daily net assets attributable to Class A shares. The fees are accrued daily and paid monthly. Since the commencement of the Fund’s operations, the Distributor has incurred expenses in excess of the distribution costs reimbursed by the Fund in the amounts of $20,149,282, $10,606,316, $202,182 and $65,942 for Class B, Class C, Class R and Class K shares, respectively. While such costs may be recovered from the Fund in future periods so long as the Agreement is in effect, the rate of the distribution and servicing
| ALLIANCEBERNSTEIN GROWTH & INCOME FUND • | 21 |
Notes to Financial Statements
fees payable under the Agreement may not be increased without a shareholder vote. In accordance with the Agreement, there is no provision for recovery of unreimbursed distribution costs incurred by the Distributor beyond the current fiscal year for Class A shares. The Agreement also provides that the Adviser may use its own resources to finance the distribution of the Fund’s shares.
NOTE D
Investment Transactions
Purchases and sales of investment securities (excluding short-term investments) for the six months ended April 30, 2013 were as follows:
| Purchases | Sales | |||||||
Investment securities (excluding U.S. government securities) | $ | 474,363,231 | $ | 594,133,868 | ||||
U.S. government securities | – 0 | – | – 0 | – | ||||
The cost of investments for federal income tax purposes was substantially the same as the cost for financial reporting purposes. Accordingly, gross unrealized appreciation and unrealized depreciation are as follows:
Gross unrealized appreciation | $ | 295,455,100 | ||
Gross unrealized depreciation | (6,417,492 | ) | ||
|
| |||
Net unrealized appreciation | $ | 289,037,608 | ||
|
|
1. Derivative Financial Instruments
The Fund may use derivatives in an effort to earn income and enhance returns, to replace more traditional direct investments, to obtain exposure to otherwise inaccessible markets (collectively, “investment purposes”), or to hedge or adjust the risk profile of its portfolio.
The Fund did not engage in derivatives transactions for the six months ended April 30, 2013.
2. Currency Transactions
The Fund may invest in non-U.S. Dollar securities on a currency hedged or unhedged basis. The Fund may seek investment opportunities by taking long or short positions in currencies through the use of currency-related derivatives, including forward currency exchange contracts, futures and options on futures, swaps, and other options. The Fund may enter into transactions for investment opportunities when it anticipates that a foreign currency will appreciate or depreciate in value but securities denominated in that currency are not held by the Fund and do not present attractive investment opportunities. Such transactions may also be used when the Adviser believes that it may be more efficient than a direct investment in a foreign currency-denominated security. The Fund may also conduct currency exchange contracts on a spot basis (i.e., for cash at the spot rate prevailing in the currency exchange market for buying or selling currencies).
| 22 | • ALLIANCEBERNSTEIN GROWTH & INCOME FUND |
Notes to Financial Statements
NOTE E
Securities Lending
The Fund may enter into securities lending transactions. Under the Fund’s securities lending program, all loans of securities will be collateralized continually by cash. The Fund will be compensated for the loan from a portion of the net return from the income earned on cash collateral after a rebate is paid to the borrower (in some cases, this rebate may be a “negative rebate” or fee paid by the borrower to the Fund in connection with the loan), and payments are made for fees of the securities lending agent and for certain other administrative expenses. It is the policy of the Fund to receive collateral consisting of cash in an amount exceeding the value of the securities loaned. The Fund will have the right to call a loan and obtain the securities loaned at any time on notice to the borrower within the normal and customary settlement time for the securities. While the securities are on loan, the borrower is obligated to pay the Fund amounts equal to any income or other distributions from the securities. The Fund will not have the right to vote any securities during the existence of a loan, but will have the right to regain ownership of loaned securities in order to exercise voting or other ownership rights. The lending agent has agreed to indemnify the Fund in the case of default of any securities borrower. Collateral received and securities loaned are marked to market daily to ensure that the securities loaned are secured by collateral. The lending agent will invest the cash collateral received in AllianceBernstein Exchange Reserves, an eligible money market vehicle, in accordance with the investment restrictions of the Fund, and as approved by the Board. The collateral received on securities loaned is recorded as an asset as well as a corresponding liability in the statement of assets and liabilities. When the Fund lends securities, its investment performance will continue to reflect changes in the value of the securities loaned. At April 30, 2013, the Fund had securities on loan with a value of $23,406,727 and had received cash collateral which has been invested into AllianceBernstein Exchange Reserves of $23,880,959. The cash collateral will be adjusted on the next business day to maintain the required collateral amount. The Fund earned securities lending income of $3,388 and $2,685 from the borrowers and AllianceBernstein Exchange Reserves, respectively, for the six months ended April 30, 2013; these amounts are reflected in the statement of operations. A principal risk of lending portfolio securities is that the borrower will fail to return the loaned securities upon termination of the loan and that the collateral will not be sufficient to replace the loaned securities. A summary of the Fund’s transactions in shares of AllianceBernstein Exchange Reserves for the six months ended April 30, 2013 is as follows:
Market Value October 31, 2012 (000) | Purchases at Cost (000) | Sales Proceeds (000) | Market Value April 30, 2013 (000) | Dividend Income (000) | ||||||||||||
| $ 26,074 | $ | 87,563 | $ | 89,756 | $ | 23,881 | $ | 3 | ||||||||
| ALLIANCEBERNSTEIN GROWTH & INCOME FUND • | 23 |
Notes to Financial Statements
NOTE F
Capital Stock
Each class consists of 3,000,000,000 authorized shares. Transactions in capital shares for each class were as follows:
| Shares | Amount | |||||||||||||||||||
| Six Months Ended April 30, 2013 (unaudited) | Year Ended 2012 | Six Months Ended April 30, 2013 (unaudited) | Year Ended 2012 | |||||||||||||||||
|
| |||||||||||||||||||
| Class A | ||||||||||||||||||||
Shares sold | 5,952,816 | 12,743,941 | $ | 25,208,975 | $ | 47,456,853 | ||||||||||||||
| ||||||||||||||||||||
Shares issued in reinvestment of dividends | 1,845,896 | 3,204,519 | 7,457,443 | 10,575,261 | ||||||||||||||||
| ||||||||||||||||||||
Shares converted from Class B | 1,558,715 | 4,765,365 | 6,538,875 | 17,825,496 | ||||||||||||||||
| ||||||||||||||||||||
Shares redeemed | (24,497,692 | ) | (49,435,731 | ) | (102,879,513 | ) | (183,361,838 | ) | ||||||||||||
| ||||||||||||||||||||
Net decrease | (15,140,265 | ) | (28,721,906 | ) | $ | (63,674,220 | ) | $ | (107,504,228 | ) | ||||||||||
| ||||||||||||||||||||
| Class B | ||||||||||||||||||||
Shares sold | 323,889 | 723,491 | $ | 1,356,578 | $ | 2,667,931 | ||||||||||||||
| ||||||||||||||||||||
Shares issued in reinvestment of dividends | – 0 | – | 4,250 | – 0 | – | 13,433 | ||||||||||||||
| ||||||||||||||||||||
Shares converted to Class A | (1,564,703 | ) | (4,794,159 | ) | (6,538,875 | ) | (17,825,496 | ) | ||||||||||||
| ||||||||||||||||||||
Shares redeemed | (901,749 | ) | (2,368,922 | ) | (3,769,878 | ) | (8,726,426 | ) | ||||||||||||
| ||||||||||||||||||||
Net decrease | (2,142,563 | ) | (6,435,340 | ) | $ | (8,952,175 | ) | $ | (23,870,558 | ) | ||||||||||
| ||||||||||||||||||||
| Class C | ||||||||||||||||||||
Shares sold | 765,443 | 1,108,708 | $ | 3,263,439 | $ | 4,101,200 | ||||||||||||||
| ||||||||||||||||||||
Shares issued in reinvestment of dividends | 28,051 | 187,565 | 113,325 | 618,965 | ||||||||||||||||
| ||||||||||||||||||||
Shares redeemed | (3,394,246 | ) | (7,546,877 | ) | (14,155,573 | ) | (27,976,396 | ) | ||||||||||||
| ||||||||||||||||||||
Net decrease | (2,600,752 | ) | (6,250,604 | ) | $ | (10,778,809 | ) | $ | (23,256,231 | ) | ||||||||||
| ||||||||||||||||||||
| Advisor Class | ||||||||||||||||||||
Shares sold | 2,779,095 | 4,649,405 | $ | 11,919,722 | $ | 17,453,961 | ||||||||||||||
| ||||||||||||||||||||
Shares issued in reinvestment of dividends | 213,618 | 311,109 | 865,151 | 1,029,770 | ||||||||||||||||
| ||||||||||||||||||||
Shares redeemed | (1,447,241 | ) | (5,227,523 | ) | (6,022,087 | ) | (19,511,252 | ) | ||||||||||||
| ||||||||||||||||||||
Net increase (decrease) | 1,545,472 | (267,009 | ) | $ | 6,762,786 | $ | (1,027,521 | ) | ||||||||||||
| ||||||||||||||||||||
| Class R | ||||||||||||||||||||
Shares sold | 273,682 | 463,103 | $ | 1,134,642 | $ | 1,722,833 | ||||||||||||||
| ||||||||||||||||||||
Shares issued in reinvestment of dividends | 7,269 | 7,848 | 29,001 | 25,662 | ||||||||||||||||
| ||||||||||||||||||||
Shares redeemed | (354,283 | ) | (175,803 | ) | (1,446,721 | ) | (656,772 | ) | ||||||||||||
| ||||||||||||||||||||
Net increase (decrease) | (73,332 | ) | 295,148 | $ | (283,078 | ) | $ | 1,091,723 | ||||||||||||
| ||||||||||||||||||||
| 24 | • ALLIANCEBERNSTEIN GROWTH & INCOME FUND |
Notes to Financial Statements
| Shares | Amount | |||||||||||||||||||
| Six Months Ended April 30, 2013 (unaudited) | Year Ended 2012 | Six Months Ended April 30, 2013 (unaudited) | Year Ended 2012 | |||||||||||||||||
|
| |||||||||||||||||||
| Class K | ||||||||||||||||||||
Shares sold | 89,347 | 118,375 | $ | 376,040 | $ | 441,627 | ||||||||||||||
| ||||||||||||||||||||
Shares issued in reinvestment of dividends | 5,352 | 11,856 | 21,463 | 38,887 | ||||||||||||||||
| ||||||||||||||||||||
Shares redeemed | (254,097 | ) | (281,627 | ) | (1,064,805 | ) | (1,062,192 | ) | ||||||||||||
| ||||||||||||||||||||
Net decrease | (159,398 | ) | (151,396 | ) | $ | (667,302 | ) | $ | (581,678 | ) | ||||||||||
| ||||||||||||||||||||
| Class I | ||||||||||||||||||||
Shares sold | 42,373 | – 0 | – | $ | 190,736 | $ | – 0 | – | ||||||||||||
| ||||||||||||||||||||
Net increase | 42,373 | – 0 | – | $ | 190,736 | $ | – 0 | – | ||||||||||||
| ||||||||||||||||||||
For the year ended October 31, 2012, the Fund received $119,766 related to a third-party’s settlement of regulatory proceedings involving allegations of improper trading. This amount is presented in the Fund’s statement of changes in net assets. Neither the Fund nor its affiliates were involved in the proceedings or the calculation of the payment.
NOTE G
Risks Involved in Investing in the Fund
Foreign Securities Risk—Investing in securities of foreign companies or foreign governments involves special risks which include changes in foreign currency exchange rates and the possibility of future political and economic developments which could adversely affect the value of such securities. Moreover, securities of many foreign companies or foreign governments and their markets may be less liquid and their prices more volatile than those of comparable U.S. companies or of the U.S. government.
Derivatives Risk—The Fund may enter into derivative transactions such as forwards, options, futures and swaps. Derivatives may be illiquid, difficult to price, and leveraged so that small changes may produce disproportionate losses for the Fund, and subject to counterparty risk to a greater degree than more traditional investments. Derivatives may result in significant losses, including losses that are far greater than the value of the derivatives reflected in the statement of assets and liabilities.
Currency Risk—This is the risk that changes in foreign currency exchange rates may negatively affect the value of the Fund’s investments or reduce the returns of the Fund. For example, the value of the Fund’s investments in foreign currency-denominated securities or currencies may decrease if the U.S. Dollar is strong (i.e., gaining value relative to other currencies) and other currencies are weak (i.e., losing value relative to the U.S. Dollar). Currency markets are generally not as regulated as securities markets. Independent of the Fund’s
| ALLIANCEBERNSTEIN GROWTH & INCOME FUND • | 25 |
Notes to Financial Statements
investments denominated in foreign currencies, the Fund’s positions in various foreign currencies may cause the Fund to experience investment losses due to the changes in exchange rates and interest rates.
Indemnification Risk—In the ordinary course of business, the Fund enters into contracts that contain a variety of indemnifications. The Fund’s maximum exposure under these arrangements is unknown. However, the Fund has not had prior claims or losses pursuant to these indemnification provisions and expects the risk of loss thereunder to be remote. Therefore, the Fund has not accrued any liability in connection with these indemnification provisions.
NOTE H
Joint Credit Facility
A number of open-end mutual funds managed by the Adviser, including the Fund, participate in a $140 million revolving credit facility (the “Facility”) intended to provide short-term financing, if necessary, subject to certain restrictions in connection with abnormal redemption activity. Commitment fees related to the Facility are paid by the participating funds and are included in miscellaneous expenses in the statement of operations. The Fund did not utilize the Facility during the six months ended April 30, 2013.
NOTE I
Distributions to Shareholders
The tax character of distributions to be paid for the year ending October 31, 2013 will be determined at the end of the current fiscal year. The tax character of distributions paid during the fiscal years ended October 31, 2012 and October 31, 2011 were as follows:
| 2012 | 2011 | |||||||
Distributions paid from: | ||||||||
Ordinary income | $ | 14,073,950 | $ | 9,904,301 | ||||
|
|
|
| |||||
Total taxable distributions paid | $ | 14,073,950 | $ | 9,904,301 | ||||
|
|
|
| |||||
As of October 31, 2012, the components of accumulated earnings/(deficit) on a tax basis were as follows:
Undistributed ordinary income | $ | 9,672,481 | ||
Accumulated capital and other losses | (285,331,039 | )(a) | ||
Unrealized appreciation/(depreciation) | 192,401,997 | (b) | ||
|
| |||
Total accumulated earnings/(deficit) | $ | (83,256,561 | ) | |
|
|
| (a) | On October 31, 2012, the Fund had a net capital loss carryforward of $285,331,039. During the fiscal year, the Fund utilized $111,167,881 of capital loss carryforwards to offset current year net realized gains. |
| (b) | The difference between book-basis and tax-basis unrealized appreciation/(depreciation) is attributable primarily to the tax deferral of losses on wash sales. |
| 26 | • ALLIANCEBERNSTEIN GROWTH & INCOME FUND |
Notes to Financial Statements
For tax purposes, net capital losses may be carried over to offset future capital gains, if any. Under the Regulated Investment Company Modernization Act of 2010, funds are permitted to carry forward capital losses incurred in taxable years beginning after December 22, 2010 for an indefinite period. These post-enactment capital losses must be utilized prior to the pre-enactment capital losses, which are subject to expiration. Post-enactment capital loss carryforwards will retain their character as either short-term or long-term capital losses rather than being considered short-term as under previous regulation.
As of October 31, 2012, the Fund had a net capital loss carryforward of $285,331,039 which will expire as follows:
Short-Term | Long-Term Amount | Expiration | ||
$285,331,039 | n/a | 2017 |
NOTE J
Recent Accounting Pronouncements
In December 2011, the Financial Accounting Standards Board (“FASB”) issued an Accounting Standards Update (“ASU”) related to disclosures about offsetting assets and liabilities in financial statements. The amendments in this update require an entity to disclose both gross and net information for derivatives and other financial instruments that are either offset in the statement of assets and liabilities or subject to an enforceable master netting arrangement or similar agreement. In January 2013, the FASB issued an ASU to clarify the scope of disclosures about offsetting assets and liabilities. The ASU limits the scope of the new balance sheet offsetting disclosures to derivatives, repurchase agreements and securities lending transactions. The ASU is effective during interim or annual reporting periods beginning on or after January 1, 2013. At this time, management is evaluating the implication of this ASU and its impact on the financial statements has not been determined.
NOTE K
Subsequent Events
Management has evaluated subsequent events for possible recognition or disclosure in the financial statements through the date the financial statements are issued. Management has determined that there are no material events that would require disclosure in the Fund’s financial statements through this date.
| ALLIANCEBERNSTEIN GROWTH & INCOME FUND • | 27 |
Notes to Financial Statements
FINANCIAL HIGHLIGHTS
Selected Data For A Share Of Capital Stock Outstanding Throughout Each Period
| Class A | ||||||||||||||||||||||||
Six Months April 30, 2013 (unaudited) | Year Ended October 31, | |||||||||||||||||||||||
| 2012 | 2011 | 2010 | 2009 | 2008 | ||||||||||||||||||||
|
| |||||||||||||||||||||||
Net asset value, beginning of period | $ 3.98 | $ 3.46 | $ 3.16 | $ 2.78 | $ 2.49 | $ 4.82 | ||||||||||||||||||
|
| |||||||||||||||||||||||
Income From Investment Operations | ||||||||||||||||||||||||
Net investment income(a) | .02 | .04 | .03 | .03 | .03 | .04 | ||||||||||||||||||
Net realized and unrealized gain (loss) on investment transactions | .51 | .52 | .30 | .39 | .31 | (1.92 | ) | |||||||||||||||||
Contributions from Adviser | – 0 | – | – 0 | – | – 0 | – | – 0 | – | – 0 | – | .00 | (b) | ||||||||||||
|
| |||||||||||||||||||||||
Net increase (decrease) in net asset value from operations | .53 | .56 | .33 | .42 | .34 | (1.88 | ) | |||||||||||||||||
|
| |||||||||||||||||||||||
Less: Dividends and Distributions | ||||||||||||||||||||||||
Dividends from net investment income | (.03 | ) | (.04 | ) | (.03 | ) | (.04 | ) | (.05 | ) | (.05 | ) | ||||||||||||
Distributions from net realized gain on investment transactions | – 0 | – | – 0 | – | – 0 | – | – 0 | – | – 0 | – | (.40 | ) | ||||||||||||
|
| |||||||||||||||||||||||
Total dividends and distributions | (.03 | ) | (.04 | ) | (.03 | ) | (.04 | ) | (.05 | ) | (.45 | ) | ||||||||||||
|
| |||||||||||||||||||||||
Net asset value, end of period | $ 4.48 | $ 3.98 | $ 3.46 | $ 3.16 | $ 2.78 | $ 2.49 | ||||||||||||||||||
|
| |||||||||||||||||||||||
Total Return | ||||||||||||||||||||||||
Total investment return based on net asset value(c)* | 13.49 | % | 16.50 | % | 10.36 | % | 15.02 | % | 13.99 | % | (42.92 | )% | ||||||||||||
Ratios/Supplemental Data | ||||||||||||||||||||||||
Net assets, end of period (000,000’s omitted) | $1,120 | $1,056 | $1,017 | $1,173 | $1,186 | $1,180 | ||||||||||||||||||
Ratio to average net assets of: | ||||||||||||||||||||||||
Expenses | 1.11 | %(d) | 1.11 | % | 1.15 | % | 1.16 | %(e) | 1.18 | % | 1.04 | % | ||||||||||||
Net investment income | .96 | %(d) | .98 | % | .97 | % | .92 | %(e) | 1.14 | % | 1.09 | % | ||||||||||||
Portfolio turnover rate | 36 | % | 79 | % | 72 | % | 73 | % | 123 | % | 183 | % | ||||||||||||
See footnote summary on page 35.
| 28 | • ALLIANCEBERNSTEIN GROWTH & INCOME FUND |
Financial Highlights
Selected Data For A Share Of Capital Stock Outstanding Throughout Each Period
| Class B | ||||||||||||||||||||||||
Six Months (unaudited) | Year Ended October 31, | |||||||||||||||||||||||
| 2012 | 2011 | 2010 | 2009 | 2008 | ||||||||||||||||||||
|
| |||||||||||||||||||||||
Net asset value, | $ 3.95 | $ 3.42 | $ 3.12 | $ 2.74 | $ 2.43 | $ 4.71 | ||||||||||||||||||
|
| |||||||||||||||||||||||
Income From Investment Operations | ||||||||||||||||||||||||
Net investment income(a) | .00 | (b) | .01 | .01 | .00 | (b) | .01 | .01 | ||||||||||||||||
Net realized and unrealized gain (loss) on investment transactions | .51 | .52 | .29 | .39 | .31 | (1.88 | ) | |||||||||||||||||
Contributions from Adviser | – 0 | – | – 0 | – | – 0 | – | – 0 | – | – 0 | – | .00 | (b) | ||||||||||||
|
| |||||||||||||||||||||||
Net increase (decrease) in net asset value from operations | .51 | .53 | .30 | .39 | .32 | (1.87 | ) | |||||||||||||||||
|
| |||||||||||||||||||||||
Less: Dividends and Distributions | ||||||||||||||||||||||||
Dividends from net investment income | – 0 | – | (.00 | )(b) | – 0 | – | (.01 | ) | (.01 | ) | (.01 | ) | ||||||||||||
Distributions from net realized gain on investment transactions | – 0 | – | – 0 | – | – 0 | – | – 0 | – | – 0 | – | (.40 | ) | ||||||||||||
|
| |||||||||||||||||||||||
Total dividends and distributions | – 0 | – | – 0 | – | – 0 | – | (.01 | ) | (.01 | ) | (.41 | ) | ||||||||||||
|
| |||||||||||||||||||||||
Net asset value, end of period | $ 4.46 | $ 3.95 | $ 3.42 | $ 3.12 | $ 2.74 | $ 2.43 | ||||||||||||||||||
|
| |||||||||||||||||||||||
Total Return | ||||||||||||||||||||||||
Total investment return based on net asset value(c)* | 12.91 | % | 15.53 | % | 9.62 | % | 14.10 | % | 13.25 | % | (43.47 | )% | ||||||||||||
Ratios/Supplemental Data | ||||||||||||||||||||||||
Net assets, end of period (000’s omitted) | $43,524 | $46,977 | $62,615 | $93,065 | $174,272 | $321,375 | ||||||||||||||||||
Ratio to average net assets of: | ||||||||||||||||||||||||
Expenses | 1.87 | %(d) | 1.91 | % | 1.96 | % | 1.98 | %(e) | 2.02 | % | 1.81 | % | ||||||||||||
Net investment income | .22 | %(d) | .18 | % | .16 | % | .15 | %(e) | .39 | % | .32 | % | ||||||||||||
Portfolio turnover rate | 36 | % | 79 | % | 72 | % | 73 | % | 123 | % | 183 | % | ||||||||||||
See footnote summary on page 35.
| ALLIANCEBERNSTEIN GROWTH & INCOME FUND • | 29 |
Financial Highlights
Selected Data For A Share Of Capital Stock Outstanding Throughout Each Period
| Class C | ||||||||||||||||||||||||
Six Months 2013 (unaudited) | Year Ended October 31, | |||||||||||||||||||||||
| 2012 | 2011 | 2010 | 2009 | 2008 | ||||||||||||||||||||
|
| |||||||||||||||||||||||
Net asset value, beginning of period | $ 3.96 | $ 3.44 | $ 3.13 | $ 2.75 | $ 2.44 | $ 4.72 | ||||||||||||||||||
|
| |||||||||||||||||||||||
Income From Investment Operations | ||||||||||||||||||||||||
Net investment income(a) | .00 | (b) | .01 | .01 | .01 | .01 | .01 | |||||||||||||||||
Net realized and unrealized gain (loss) on investment transactions | .51 | .52 | .30 | .38 | .31 | (1.88 | ) | |||||||||||||||||
Contributions from Adviser | – 0 | – | – 0 | – | – 0 | – | – 0 | – | – 0 | – | .00 | (b) | ||||||||||||
|
| |||||||||||||||||||||||
Net increase (decrease) in net asset value from operations | .51 | .53 | .31 | .39 | .32 | (1.87 | ) | |||||||||||||||||
|
| |||||||||||||||||||||||
Less: Dividends and Distributions | ||||||||||||||||||||||||
Dividends from net investment income | (.00 | )(b) | (.01 | ) | – 0 | – | (.01 | ) | (.01 | ) | (.01 | ) | ||||||||||||
Distributions from net realized gain on investment transactions | – 0 | – | – 0 | – | – 0 | – | – 0 | – | – 0 | – | (.40 | ) | ||||||||||||
|
| |||||||||||||||||||||||
Total dividends and distributions | – 0 | – | (.01 | ) | – 0 | – | (.01 | ) | (.01 | ) | (.41 | ) | ||||||||||||
|
| |||||||||||||||||||||||
Net asset value, end of period | $ 4.47 | $ 3.96 | $ 3.44 | $ 3.13 | $ 2.75 | $ 2.44 | ||||||||||||||||||
|
| |||||||||||||||||||||||
Total Return | ||||||||||||||||||||||||
Total investment return based on net asset value(c)* | 12.97 | % | 15.63 | % | 9.90 | % | 14.05 | % | 13.19 | % | (43.37 | )% | ||||||||||||
Ratios/Supplemental Data | ||||||||||||||||||||||||
Net assets, end of period (000’s omitted) | $182,303 | $171,708 | $170,572 | $188,360 | $206,651 | $235,302 | ||||||||||||||||||
Ratio to average net assets of: | ||||||||||||||||||||||||
Expenses | 1.84 | %(d) | 1.84 | % | 1.89 | % | 1.91 | %(e) | 1.94 | % | 1.77 | % | ||||||||||||
Net investment income | .23 | %(d) | .24 | % | .22 | % | .18 | %(e) | .41 | % | .35 | % | ||||||||||||
Portfolio turnover rate | 36 | % | 79 | % | 72 | % | 73 | % | 123 | % | 183 | % | ||||||||||||
See footnote summary on page 35.
| 30 | • ALLIANCEBERNSTEIN GROWTH & INCOME FUND |
Financial Highlights
Selected Data For A Share Of Capital Stock Outstanding Throughout Each Period
| Advisor Class | ||||||||||||||||||||||||
Six Months 2013 (unaudited) | Year Ended October 31, | |||||||||||||||||||||||
| 2012 | 2011 | 2010 | 2009 | 2008 | ||||||||||||||||||||
|
| |||||||||||||||||||||||
Net asset value, beginning of period | $ 4.00 | $ 3.48 | $ 3.17 | $ 2.79 | $ 2.51 | $ 4.85 | ||||||||||||||||||
|
| |||||||||||||||||||||||
Income From Investment Operations | ||||||||||||||||||||||||
Net investment income(a) | .03 | .05 | .04 | .04 | .04 | .05 | ||||||||||||||||||
Net realized and unrealized gain (loss) on investment transactions | .50 | .52 | .31 | .38 | .30 | (1.93 | ) | |||||||||||||||||
Contributions from Adviser | – 0 | – | – 0 | – | – 0 | – | – 0 | – | – 0 | – | .00 | (b) | ||||||||||||
|
| |||||||||||||||||||||||
Net increase (decrease) in net asset value from operations | .53 | .57 | .35 | .42 | .34 | (1.88 | ) | |||||||||||||||||
|
| |||||||||||||||||||||||
Less: Dividends and Distributions | ||||||||||||||||||||||||
Dividends from net investment income | (.04 | ) | (.05 | ) | (.04 | ) | (.04 | ) | (.06 | ) | (.06 | ) | ||||||||||||
Distributions from net realized gain on investment transactions | – 0 | – | – 0 | – | – 0 | – | – 0 | – | – 0 | – | (.40 | ) | ||||||||||||
|
| |||||||||||||||||||||||
Total dividends and distributions | (.04 | ) | (.05 | ) | (.04 | ) | (.04 | ) | (.06 | ) | (.46 | ) | ||||||||||||
|
| |||||||||||||||||||||||
Net asset value, end of period | $ 4.49 | $ 4.00 | $ 3.48 | $ 3.17 | $ 2.79 | $ 2.51 | ||||||||||||||||||
|
| |||||||||||||||||||||||
Total Return | ||||||||||||||||||||||||
Total investment return based on net asset value(c)* | 13.48 | % | 16.78 | % | 10.95 | % | 15.23 | % | 14.02 | % | (42.69 | )% | ||||||||||||
Ratios/Supplemental Data | ||||||||||||||||||||||||
Net assets, end of period (000’s omitted) | $100,289 | $83,077 | $73,155 | $79,873 | $83,924 | $97,668 | ||||||||||||||||||
Ratio to average net assets of: | ||||||||||||||||||||||||
Expenses | .83 | %(d) | .82 | % | .87 | % | .88 | %(e) | .91 | % | .76 | % | ||||||||||||
Net investment income | 1.23 | %(d) | 1.26 | % | 1.24 | % | 1.20 | %(e) | 1.44 | % | 1.38 | % | ||||||||||||
Portfolio turnover rate | 36 | % | 79 | % | 72 | % | 73 | % | 123 | % | 183 | % | ||||||||||||
See footnote summary on page 35.
| ALLIANCEBERNSTEIN GROWTH & INCOME FUND • | 31 |
Financial Highlights
Selected Data For A Share Of Capital Stock Outstanding Throughout Each Period
| Class R | ||||||||||||||||||||||||
Six Months (unaudited) | Year Ended October 31, | |||||||||||||||||||||||
| 2012 | 2011 | 2010 | 2009 | 2008 | ||||||||||||||||||||
|
| |||||||||||||||||||||||
Net asset value, beginning of period | $ 3.93 | $ 3.42 | $ 3.12 | $ 2.75 | $ 2.47 | $ 4.77 | ||||||||||||||||||
|
| |||||||||||||||||||||||
Income From Investment Operations | ||||||||||||||||||||||||
Net investment income(a) | .01 | .03 | .03 | .02 | .02 | .03 | ||||||||||||||||||
Net realized and unrealized gain (loss) on investment transactions | .51 | .52 | .29 | .38 | .31 | (1.90 | ) | |||||||||||||||||
Contributions from Adviser | – 0 | – | – 0 | – | – 0 | – | – 0 | – | – 0 | – | .00 | (b) | ||||||||||||
|
| |||||||||||||||||||||||
Net increase (decrease) in net asset value from operations | .52 | .55 | .32 | .40 | .33 | (1.87 | ) | |||||||||||||||||
|
| |||||||||||||||||||||||
Less: Dividends and Distributions | ||||||||||||||||||||||||
Dividends from net investment income | (.03 | ) | (.04 | ) | (.02 | ) | (.03 | ) | (.05 | ) | (.03 | ) | ||||||||||||
Distributions from net realized gain on investment transactions | – 0 | – | – 0 | – | – 0 | – | – 0 | – | – 0 | – | (.40 | ) | ||||||||||||
|
| |||||||||||||||||||||||
Total dividends and distributions | (.03 | ) | (.04 | ) | (.02 | ) | (.03 | ) | (.05 | ) | (.43 | ) | ||||||||||||
|
| |||||||||||||||||||||||
Net asset value, end of period | $4.42 | $3.93 | $3.42 | $3.12 | $2.75 | $2.47 | ||||||||||||||||||
|
| |||||||||||||||||||||||
Total Return | ||||||||||||||||||||||||
Total investment return based on net asset value(c)* | 13.29 | % | 16.16 | % | 10.39 | % | 14.69 | % | 13.50 | % | (42.99 | )% | ||||||||||||
Ratios/Supplemental Data | ||||||||||||||||||||||||
Net assets, end of period (000’s omitted) | $4,134 | $3,964 | $2,438 | $2,569 | $2,135 | $1,848 | ||||||||||||||||||
Ratio to average net assets of: | ||||||||||||||||||||||||
Expenses | 1.36 | %(d) | 1.36 | % | 1.36 | % | 1.39 | %(e) | 1.35 | % | 1.24 | % | ||||||||||||
Net investment income | .72 | %(d) | .71 | % | .75 | % | .67 | %(e) | .95 | % | .87 | % | ||||||||||||
Portfolio turnover rate | 36 | % | 79 | % | 72 | % | 73 | % | 123 | % | 183 | % | ||||||||||||
See footnote summary on page 35.
| 32 | • ALLIANCEBERNSTEIN GROWTH & INCOME FUND |
Financial Highlights
Selected Data For A Share Of Capital Stock Outstanding Throughout Each Period
| Class K | ||||||||||||||||||||||||
Six Months (unaudited) | Year Ended October 31, | |||||||||||||||||||||||
| 2012 | 2011 | 2010 | 2009 | 2008 | ||||||||||||||||||||
|
| |||||||||||||||||||||||
Net asset value, beginning of period | $ 3.96 | $ 3.44 | $ 3.14 | $ 2.77 | $ 2.48 | $ 4.82 | ||||||||||||||||||
|
| |||||||||||||||||||||||
Income From Investment Operations | ||||||||||||||||||||||||
Net investment income(a) | .02 | .04 | .04 | .03 | .03 | .04 | ||||||||||||||||||
Net realized and unrealized gain (loss) on investment transactions | .50 | .53 | .29 | .38 | .31 | (1.91 | ) | |||||||||||||||||
Contributions from Adviser | – 0 | – | – 0 | – | – 0 | – | – 0 | – | – 0 | – | .00 | (b) | ||||||||||||
|
| |||||||||||||||||||||||
Net increase (decrease) in net asset value from operations | .52 | .57 | .33 | .41 | .34 | (1.87 | ) | |||||||||||||||||
|
| |||||||||||||||||||||||
Less: Dividends and Distributions | ||||||||||||||||||||||||
Dividends from net investment income | (.03 | ) | (.05 | ) | (.03 | ) | (.04 | ) | (.05 | ) | (.07 | ) | ||||||||||||
Distributions from net realized gain on investment transactions | – 0 | – | – 0 | – | – 0 | – | – 0 | – | – 0 | – | (.40 | ) | ||||||||||||
|
| |||||||||||||||||||||||
Total dividends and distributions | (.03 | ) | (.05 | ) | (.03 | ) | (.04 | ) | (.05 | ) | (.47 | ) | ||||||||||||
|
| |||||||||||||||||||||||
Net asset value, end of period | $ 4.45 | $ 3.96 | $ 3.44 | $ 3.14 | $ 2.77 | $ 2.48 | ||||||||||||||||||
|
| |||||||||||||||||||||||
Total Return | ||||||||||||||||||||||||
Total investment return based on net asset value(c)* | 13.33 | % | 16.77 | % | 10.53 | % | 14.86 | % | 14.16 | % | (42.93 | )% | ||||||||||||
Ratios/Supplemental Data | ||||||||||||||||||||||||
Net assets, end of period (000’s omitted) | $2,257 | $2,637 | $2,815 | $4,365 | $3,825 | $3,606 | ||||||||||||||||||
Ratio to average net assets of: | ||||||||||||||||||||||||
Expenses | 1.05 | %(d) | 1.05 | % | 1.05 | % | 1.09 | %(e) | 1.04 | % | 1.02 | % | ||||||||||||
Net investment income | 1.04 | %(d) | 1.03 | % | 1.08 | % | .97 | %(e) | 1.28 | % | 1.11 | % | ||||||||||||
Portfolio turnover rate | 36 | % | 79 | % | 72 | % | 73 | % | 123 | % | 183 | % | ||||||||||||
See footnote summary on page 35.
| ALLIANCEBERNSTEIN GROWTH & INCOME FUND • | 33 |
Financial Highlights
Selected Data For A Share Of Capital Stock Outstanding Throughout Each Period
| Class I | ||||||||||||||||||||||||
Six Months (unaudited) | Year Ended October 31, | |||||||||||||||||||||||
| 2012 | 2011 | 2010 | 2009 | 2008 | ||||||||||||||||||||
|
| |||||||||||||||||||||||
Net asset value, beginning of period | $ 4.05 | $ 3.46 | $ 3.15 | $ 2.78 | $ 2.49 | $ 4.83 | ||||||||||||||||||
|
| |||||||||||||||||||||||
Income From Investment Operations | ||||||||||||||||||||||||
Net investment income(a) | .02 | .05 | .06 | .04 | .04 | .05 | ||||||||||||||||||
Net realized and unrealized gain (loss) on investment transactions | .53 | .54 | .29 | .38 | .32 | (1.92 | ) | |||||||||||||||||
Contributions from Adviser | – 0 | – | – 0 | – | – 0 | – | – 0 | – | – 0 | – | .00 | (b) | ||||||||||||
|
| |||||||||||||||||||||||
Net increase (decrease) in net asset value from operations | .55 | .59 | .35 | .42 | .36 | (1.87 | ) | |||||||||||||||||
|
| |||||||||||||||||||||||
Less: Dividends and Distributions | ||||||||||||||||||||||||
Dividends from net investment income | (.05 | ) | – 0 | – | (.04 | ) | (.05 | ) | (.07 | ) | (.07 | ) | ||||||||||||
Distributions from net realized gain on investment transactions | – 0 | – | – 0 | – | – 0 | – | – 0 | – | – 0 | – | (.40 | ) | ||||||||||||
|
| |||||||||||||||||||||||
Total dividends and distributions | (.05 | ) | – 0 | – | (.04 | ) | (.05 | ) | (.07 | ) | (.47 | ) | ||||||||||||
|
| |||||||||||||||||||||||
Net asset value, end of period | $ 4.55 | $ 4.05 | $ 3.46 | $ 3.15 | $ 2.78 | $ 2.49 | ||||||||||||||||||
|
| |||||||||||||||||||||||
Total Return | ||||||||||||||||||||||||
Total investment return based on net asset value(c)* | 13.67 | % | 17.05 | % | 11.18 | % | 15.16 | % | 14.84 | % | (42.82 | )% | ||||||||||||
Ratios/Supplemental Data | ||||||||||||||||||||||||
Net assets, end of period (000’s omitted) | $207 | $12 | $11 | $1,444 | $2,146 | $1,629 | ||||||||||||||||||
Ratio to average net assets of: | ||||||||||||||||||||||||
Expenses | .66 | %(d) | .72 | % | .74 | % | .75 | %(e) | .71 | % | .68 | % | ||||||||||||
Net investment income | .85 | %(d) | 1.36 | % | 1.65 | % | 1.40 | %(e) | 1.57 | % | 1.42 | % | ||||||||||||
Portfolio turnover rate | 36 | % | 79 | % | 72 | % | 73 | % | 123 | % | 183 | % | ||||||||||||
See footnote summary on page 35.
| 34 | • ALLIANCEBERNSTEIN GROWTH & INCOME FUND |
Financial Highlights
| (a) | Based on average shares outstanding. |
| (b) | Amount is less than $.005. |
| (c) | Total investment return is calculated assuming an initial investment made at the net asset value at the beginning of the period, reinvestment of all dividends and distributions at net asset value during the period, and redemption on the last day of the period. Initial sales charges or contingent deferred sales charges are not reflected in the calculation of total investment return. Total return does not reflect the deduction of taxes that a shareholder would pay on fund distributions or the redemption of fund shares. Total investment return calculated for a period of less than one year is not annualized. |
| (d) | Annualized. |
| (e) | The ratio includes expenses attributable to costs of proxy solicitation. |
| * | Includes the impact of proceeds received and credited to the Fund resulting from class action settlements, which enhanced the Fund’s performance for the six months ended April 30, 2013 and years ended October 31, 2012, October 31, 2011, October 31, 2010, October 31, 2009 and October 31, 2008 by 0.07%, 0.49%, 0.15%, 0.84%, 1.93% and 0.06%, respectively. |
See notes to financial statements.
| ALLIANCEBERNSTEIN GROWTH & INCOME FUND • | 35 |
Financial Highlights
BOARD OF DIRECTORS
William H. Foulk, Jr.(1), Chairman John H. Dobkin(1) Michael J. Downey(1) D. James Guzy(1) Nancy P. Jacklin(1) | Robert M. Keith, President and Garry L. Moody(1) Marshall C. Turner, Jr.(1) Earl D. Weiner(1) |
OFFICERS
Philip L. Kirstein, Senior Vice President Frank V. Caruso(2), Senior Vice President | Emilie D. Wrapp, Secretary Joseph J. Mantineo, Treasurer and Chief Financial Officer Stephen M. Woetzel, Controller |
Custodian and Accounting Agent State Street Bank and Trust Company One Lincoln Street Boston, MA 02111
Principal Underwriter AllianceBernstein Investments, Inc. 1345 Avenue of the Americas New York, NY 10105
Legal Counsel Seward & Kissel LLP One Battery Park Plaza New York, NY 10004 | Transfer Agent AllianceBernstein Investor Services, Inc. P.O. Box 786003 San Antonio, TX 78278-6003 Toll-Free (800) 221-5672
Independent Registered Public Accounting Firm Ernst & Young LLP 5 Times Square New York, NY 10036 |
| (1) | Member of the Audit Committee, the Governance and Nominating Committee and the Independent Directors Committee. Mr. Foulk is the sole member of the Fair Value Pricing Committee. |
| (2) | The day-to-day management of, and investment decisions for, the Fund’s portfolio are made by the Adviser’s Relative Value Investment Team. Mr. Caruso is the investment professional with the most significant responsibility for the day-to-day management of the Fund’s portfolio. |
| 36 | • ALLIANCEBERNSTEIN GROWTH & INCOME FUND |
Board of Directors
THE FOLLOWING IS NOT PART OF THE SHAREHOLDER REPORT OR THE FINANCIAL STATEMENTS
SUMMARY OF SENIOR OFFICER’S EVALUATION OF INVESTMENT ADVISORY AGREEMENT1
The following is a summary of the evaluation of the Investment Advisory Agreement between AllianceBernstein L.P. (the “Adviser”) and the AllianceBernstein Growth & Income Fund, Inc. (the “Fund”),2 prepared by Philip L. Kirstein, the Senior Officer of the Fund for the Directors of the Fund, as required by the August 2004 agreement between the Adviser and the New York State Attorney General (the “NYAG”). The Senior Officer’s evaluation of the Investment Advisory Agreement is not meant to diminish the responsibility or authority of the Board of Directors to perform its duties pursuant to Section 15 of the Investment Company Act of 1940 (the “40 Act”) and applicable state law. The purpose of the summary is to provide shareholders with a synopsis of the independent evaluation of the reasonableness of the advisory fees proposed to be paid by the Fund which was provided to the Directors in connection with their review of the proposed approval of the continuance of the Investment Advisory Agreement.
The Senior Officer’s evaluation considered the following factors:
| 1. | Advisory fees charged to institutional and other clients of the Adviser for like services; |
| 2. | Advisory fees charged by other mutual fund companies for like services; |
| 3. | Costs to the Adviser and its affiliates of supplying services pursuant to the advisory agreement, excluding any intra-corporate profit; |
| 4. | Profit margins of the Adviser and its affiliates from supplying such services; |
| 5. | Possible economies of scale as the Fund grows larger; and |
| 6. | Nature and quality of the Adviser’s services including the performance of the Fund. |
| 1 | The information in the fee evaluation was completed on April 22, 2013 and discussed with the Board of Directors on April 30-May 2, 2013. |
| 2 | Future references to the Fund do not include “AllianceBernstein.” References in the fee summary pertaining to performance and expense ratio rankings refer to the Class A shares of the Fund. |
| ALLIANCEBERNSTEIN GROWTH & INCOME FUND • | 37 |
These factors, with the exception of the first factor, are generally referred to as the “Gartenberg factors,” which were articulated by the United States Court of Appeals for the Second Circuit in 1982. Gartenberg v. Merrill Lynch Asset Management, Inc., 694 F. 2d 923 (2d Cir. 1982). On March 30, 2010, the Supreme Court held the Gartenberg decision was correct in its basic formulation of what §36(b) requires: to face liability under §36(b), “an investment adviser must charge a fee that is so disproportionately large that it bears no reasonable relationship to the services rendered and could not have been the product of arm’s length bargaining.” Jones v. Harris Associates L.P., 130 S. Ct. 1418 (2010). In Jones, the Court stated the Gartenberg approach fully incorporates the correct understanding of fiduciary duty within the context of section 36(b) and noted with approval that “Gartenberg insists that all relevant circumstances be taken into account” and “uses the range of fees that might result from arm’s length bargaining as the benchmark for reviewing challenged fees.”3
FUND ADVISORY FEES, NET ASSETS & EXPENSE RATIOS
The Adviser proposed that the Fund pays the advisory fee set forth in the table below for receiving the services to be provided pursuant to the Investment Advisory Agreement. The fee schedule below, implemented in January 2004 in consideration of the Adviser’s settlement with the NYAG in December 2003, is based on a master schedule that contemplates eight categories of funds with almost all funds in each category having the same advisory fee schedule.4
| Category | Advisory Fee5 | Net Assets 3/31/13 ($MIL) | Fund | |||||
| Value | 0.55%on 1st $2.5 billion 0.45% on next $2.5 billion 0.40% on the balance | $ | 1,444.3 | Growth & Income Fund, Inc. | ||||
The Adviser is reimbursed as specified in the Investment Advisory Agreement for certain clerical, legal, accounting, administrative and other services provided to the Fund. During the Fund’s most recently completed fiscal year, the Adviser received $64,093 (0.005% of the Fund’s average daily net assets) for such services.
| 3 | Jones v. Harris at 1427. |
| 4 | Most of the AllianceBernstein Mutual Funds, which the Adviser manages, were affected by the Adviser’s settlement with the NYAG. |
| 5 | The advisory fee of the Fund is based on the percentage of the Fund’s average daily net assets and is paid on a monthly basis |
| 38 | • ALLIANCEBERNSTEIN GROWTH & INCOME FUND |
Set forth below are the Fund’s total expense ratios for the most recently completed fiscal year:
| Fund | Total Expense Ratio | Fiscal Year | ||||||||
| Growth & Income Fund, Inc. | Advisor Class A Class B Class C Class R Class K Class I |
| 0.82 1.11 1.91 1.84 1.36 1.05 0.72 | % % % % % % % | October 31 | |||||
| I. | ADVISORY FEES CHARGED TO INSTITUTIONAL AND OTHER CLIENTS |
The advisory fees charged to investment companies which the Adviser manages and sponsors are normally higher than those charged to similar sized institutional accounts, including pension plans and sub-advised investment companies. The fee differential reflects, among other things, different services provided to such clients, and different liabilities assumed. Services to be provided by the Adviser to the Fund that are not provided to non-investment company clients include providing office space and personnel to serve as Fund Officers, who among other responsibilities make the certifications required under the Sarbanes–Oxley Act of 2002, and coordinating with and monitoring the Fund’s third party service providers such as Fund counsel, auditors, custodians, transfer agents and pricing services. The accounting, administrative, legal and compliance requirements for the Fund are more costly than those for institutional client assets due to the greater complexities and time required for investment companies, although as previously noted, the Adviser is reimbursed for providing such services. The Adviser also believes that it incurs substantial entrepreneurial risk when offering a new mutual fund, since establishing a new mutual fund requires a large upfront investment and it may take a long time for the fund to achieve profitability since the fund must be priced to scale from inception in order to be competitive and assets are acquired one account at a time. In addition, managing the cash flow of an investment company may be more difficult than managing that of a stable pool of assets, such as an institutional account with little cash movement in either direction, particularly, if a fund is in net redemption and the Adviser is frequently forced to sell securities to raise cash for redemptions. However, managing a fund with positive cash flow may be easier at times than managing a stable pool of assets. Finally, in recent years, investment advisers have been sued by institutional clients and have suffered reputational damage both by the attendant publicity and outcomes other than complete victories. Accordingly, the legal and reputational risks associated with institutional accounts are greater than previously thought, although still not equal to those related to the mutual fund industry.
Notwithstanding the Adviser’s view that managing an investment company is not comparable to managing other institutional accounts because the services
| ALLIANCEBERNSTEIN GROWTH & INCOME FUND • | 39 |
provided are different, the Supreme Court has indicated consideration should be given to the advisory fees charged to institutional accounts with a similar investment style as the Fund.6 In addition to the AllianceBernstein institutional fee schedule, set forth below is the Fund’s advisory fee and what would have been the effective advisory fee of the Fund had the AllianceBernstein institutional fee schedule been applicable to the Fund based on March 31, 2013 net assets:7
| Fund | Net Assets 3/31/13 ($MIL) | AllianceBernstein (“AB”) Fee Schedule | Effective Adv. Fee | Fund Advisory | ||||||||
| Growth & Income Fund, Inc. | $1,444.3 | U.S. Growth and Income 0.65% on 1st $25 million 0.50% on next $25 million 0.40% on next $50 million 0.30% on next $100 million 0.25% on the balance Minimum Account Size: $25 m | 0.270% | 0.550% | ||||||||
The adviser also manages the AllianceBernstein Variable Products Series Fund, Inc. (“AVPS”), which is available through variable annuity and variable life contracts offered by other financial institutions and offers policyholders the option to utilize certain AVPS portfolios as the investment option underlying their insurance contracts. Set forth below is the fee schedule of the AVPS portfolio that has a substantially similar investment style as the Fund.8 Also shown is the Fund’s advisory fee and what would have been the effective advisory fee of the Fund had the AVPS fee schedule been applicable to the Fund based on March 31, 2013 net assets:
| Fund | AVPS Portfolio | Fee Schedule | Effective Adv. Fee | Fund Advisory Fee | ||||||||
| Growth & Income Fund, Inc. | Growth & Income Portfolio | 0.55% on first $2.5 billion 0.45% on next $2.5 billion 0.40% on the balance | 0.550% | 0.550% | ||||||||
| 6 | The Supreme Court stated that “courts may give such comparisons the weight that they merit in light of the similarities and differences between the services that the clients in question require, but the courts must be wary of inapt comparisons.” Among the significant differences the Supreme Court noted that may exist between services provided to mutual funds and institutional accounts are “higher marketing costs.” Jones v. Harris at 1428. |
| 7 | The Adviser has indicated that with respect to institutional accounts with assets greater than $300 million, it will negotiate a fee schedule. Discounts that are negotiated vary based upon each client relationship. |
| 8 | The AVPS portfolio was also affected by the settlement between the Adviser and the NYAG. As a result, the Fund has the same breakpoints in its advisory fee schedule as the AVPS portfolio. |
| 40 | • ALLIANCEBERNSTEIN GROWTH & INCOME FUND |
The Adviser represented that it does not sub-advise any registered investment company with a substantially similar investment style as the Fund.
| II. | MANAGEMENT FEES CHARGED BY OTHER MUTUAL FUND COMPANIES FOR LIKE SERVICES. |
Lipper, Inc. (“Lipper”), an analytical service that is not affiliated with the Adviser, compared the fees charged to the Fund with fees charged to other investment companies for similar services offered by other investment advisers.9 Lipper’s analysis included the comparison of the Fund’s contractual management fee, estimated at the approximate current asset level of the Fund, to the median of the Fund’s Lipper Expense Group (“EG”)10 and the Fund’s contractual management fee ranking.11
Lipper describes an EG as a representative sample of comparable funds. Lipper’s standard methodology for screening funds to be included in an EG entails the consideration of several fund criteria, including fund type, investment classification/objective, load type and similar 12b-1/non-12b-1 service fees, asset (size) comparability, expense components and attributes. An EG will typically consist of seven to twenty funds.
| Fund | Contractual Management Fee (%)12 | Lipper EG Median (%) | Lipper EG Rank | |||||
| Growth and Income Fund, Inc. | 0.550 | 0.690 | 3/15 | |||||
| 9 | The Supreme Court cautioned against accepting mutual fund fee comparisons without careful scrutiny since “these comparisons are problematic because these fees, like those challenged, may not be the product of negotiations conducted at arm’s length.” Jones v. Harris at 1429. |
| 10 | Lipper does not consider average account size when constructing EGs. Funds with relatively small average account sizes tend to have higher transfer agent expense ratio than comparable sized funds that have relatively large average account sizes. Note that there are limitations on Lipper expense category data because different funds categorize expenses differently. |
| 11 | The contractual management fee is calculated by Lipper using the Fund’s contractual management fee rate at a hypothetical asset level. The hypothetical asset level is based on the combined net assets of all classes of the Fund, rounded up to the next $25 million. Lipper’s total expense ratio information is based on the most recent annual report except as otherwise noted. A ranking of “1” would mean that the Fund had the lowest effective fee rate in the Lipper peer group. |
| 12 | The contractual management fee rate does not reflect any expense reimbursement payments made by the Fund to the Adviser for certain clerical, legal, accounting, administrative, and other services. |
| ALLIANCEBERNSTEIN GROWTH & INCOME FUND • | 41 |
Lipper also compared the Fund’s total expense ratio to the medians of the Fund’s EG and Lipper Expense Universe (“EU”). The EU is a broader group compared to the EG, consisting of all funds that have the same investment classifications/objective and load type as the subject Fund.13 Set forth below is Lipper’s comparison of the Fund’s total expense ratio and the medians of the Fund’s EG and EU. The Fund’s total expense ratio rankings are also shown.
| Fund | Total Expense Ratio (%)14 | Lipper EG Median (%) | Lipper EG Rank | Lipper EU Median (%) | Lipper EU Rank | |||||||||||
| Growth and Income Fund, Inc. | 1.105 | 1.165 | 4/15 | 1.219 | 19/76 | |||||||||||
Based on this analysis, the Fund has a more favorable ranking on a contractual management fee basis than on a total expense ratio basis.
| III. | COSTS TO THE ADVISER AND ITS AFFILIATES OF SUPPLYING SERVICES PURSUANT TO THE MANAGEMENT FEE ARRANGEMENT, EXCLUDING ANY INTRA-CORPORATE PROFIT. |
The Adviser utilizes two profitability reporting systems, which operate independently but are aligned with each other, to estimate the Adviser’s profitability in connection with investment advisory services provided to the Fund. The Senior Officer has retained a consultant to provide independent advice regarding the alignment of the two profitability systems as well as the methodologies and allocations utilized by both profitability systems. See Section IV for additional discussion.
| IV. | PROFIT MARGINS OF THE ADVISER AND ITS AFFILIATES FOR SUPPLYING SUCH SERVICES. |
The Fund’s profitability information, prepared by the Adviser for the Board of Directors, was reviewed by the Senior Officer and the consultant. The Adviser’s profitability from providing investment advisory services to the Fund increased during calendar year 2012, relative to 2011.
In addition to the Adviser’s direct profits from managing the Fund, certain of the Adviser’s affiliates have business relationships with the Fund and may earn a profit from providing other services to the Fund. The courts have referred to this type of business opportunity as “fall-out benefits” to the Adviser and indicated
| 13 | Except for asset (size) comparability, Lipper uses the same criteria for selecting an EG peer when selecting an EU peer. Unlike the EG, the EU allows for the same adviser to be represented by more than just one fund. |
| 14 | Most recently completed fiscal year end Class A total expense ratio. |
| 42 | • ALLIANCEBERNSTEIN GROWTH & INCOME FUND |
that such benefits should be factored into the evaluation of the total relationship between the Fund and the Adviser. Neither case law nor common business practice precludes the Adviser’s affiliates from earning a reasonable profit on this type of relationship provided the affiliates’ charges and services are competitive and the relationship otherwise complies with the 40 Act restrictions. These affiliates provide transfer agent, distribution and brokerage related services to the Fund and receive transfer agent fees, Rule 12b-1 payments, front-end sales loads, contingent deferred sales charges (“CDSC”) and brokerage commissions. In addition, the Adviser benefits from soft dollar arrangements which offset expenses the Adviser would otherwise incur.
AllianceBernstein Investments, Inc. (“ABI”), an affiliate of the Adviser, is the Fund’s principal underwriter. ABI and the Adviser have disclosed in the Fund’s prospectus that they may make revenue sharing payments from their own resources, in addition to resources derived from sales loads and Rule 12b-1 fees, to firms that sell shares of the Fund. In 2012, ABI paid approximately 0.05% of the average monthly assets of the AllianceBernstein Mutual Funds or approximately $19 million for distribution services and educational support (revenue sharing payments).
During the Fund’s most recently completed fiscal year, ABI received from the Fund $12,989, $5,199,057 and $39,214 in front-end sales charges, Rule 12b-1 and CDSC fees, respectively.
Fees and reimbursements for out of pocket expenses charged by AllianceBernstein Investor Services, Inc. (“ABIS”), the affiliated transfer agent for the Fund, are charged on a per account basis, based on the level of service provided and the class of share held by the account. ABIS also receives a fee per shareholder sub-account for each account maintained by an intermediary on an omnibus basis. During the Fund’s most recently completed fiscal year, ABIS received $1,657,251 in fees from the Fund.
The Fund effected brokerage transactions through the Adviser’s affiliate, Sanford C. Bernstein & Co., LLC (“SCB & Co.”) and/or its U.K. affiliate, Sanford C. Bernstein Limited (“SCB Ltd.”), collectively “SCB”, and paid commissions for such transactions during the Fund’s most recently completed fiscal year. The Adviser represented that SCB’s profitability from any business conducted with the Fund is comparable to the profitability of SCB’s dealings with other similar third party clients. In the ordinary course of business, SCB receives and pays liquidity rebates from electronic communications networks (“ECNs”) derived from trading for its clients. These credits and charges are not being passed onto any SCB client. The Adviser also receives certain soft dollar benefits from brokers that execute agency trades for its clients. These soft dollar benefits reduce the Adviser’s cost of doing business and increase its profitability.
| ALLIANCEBERNSTEIN GROWTH & INCOME FUND • | 43 |
| V. | POSSIBLE ECONOMIES OF SCALE |
The Adviser has indicated that economies of scale are being shared with shareholders through pricing to scale, breakpoints, fee reductions/waivers and enhancement to services.
In May 2012, an independent consultant, retained by the Senior Officer, provided the Board of Directors information on the Adviser’s firm-wide average costs from 2005 through 2011 and the potential economies of scale. The independent consultant noted that from 2005 through 2007 the Adviser experienced significant growth in assets under management (“AUM”). During this period, operating expenses increased, in part to keep up with growth, and in part reflecting market returns. However, from 2008 through the first quarter of 2009, AUM rapidly and significantly decreased due to declines in market value and client withdrawals. When AUM rapidly decreased, some operating expenses categories, including base compensation and office space, adjusted more slowly during this period, resulting in an increase in average costs. Since 2009, AUM has experienced less significant changes. The independent consultant noted that changes in operating expenses reflect changes in business composition and business practices in response to changes in financial markets. Finally, the independent consultant concluded that the increase in average cost and the decline in net operating margin across the Adviser since late 2008 are inconsistent with the view that there are currently reductions in average costs due to economies of scale that can be shared with the AllianceBernstein Mutual Funds managed by the Adviser through lower fees.
Previously, in February 2008, the independent consultant provided the Board of Directors an update of the Deli15 study on advisory fees and various fund characteristics.16 The independent consultant first reiterated the results of his previous two dimensional comparison analysis (fund size and family size) with the Board of Directors.17 The independent consultant then discussed the results
| 15 | The Deli study, originally published in 2002 based on 1997 data and updated for the February 2008 Presentation, may be of diminished value due to the age of the data used in the presentation and the changes experienced in the industry over the last four years. |
| 16 | As mentioned previously, the Supreme Court cautioned against accepting mutual fund fee comparisons without careful scrutiny since the fees may not be the product of negotiations conducted at arm’s length. See Jones V. Harris at 1429. |
| 17 | The two dimensional analysis showed patterns of lower advisory fees for funds with larger asset sizes and funds from larger family sizes compared to funds with smaller asset sizes and funds from smaller family sizes, which according to the independent consultant is indicative of a sharing of economies of scale and scope. However, in less liquid and active markets, such is not the case, as the empirical analysis showed potential for diseconomies of scale in those markets. The empirical analysis also showed diminishing economies of scale and scope as funds surpassed a certain high level of assets. |
| 44 | • ALLIANCEBERNSTEIN GROWTH & INCOME FUND |
of the regression model that was utilized to study the effects of various factors on advisory fees. The regression model output indicated that the bulk of the variation in fees predicted were explained by various factors, but substantially by fund AUM, family AUM, index fund indicator and investment style. The independent consultant also compared the advisory fees of the AllianceBernstein Mutual Funds to similar funds managed by 19 other large asset managers, regardless of the fund size and each Adviser’s proportion of mutual fund assets to non-mutual fund assets.
| VI. | NATURE AND QUALITY OF THE ADVISER’S SERVICES, INCLUDING THE PERFORMANCE OF THE FUND |
With assets under management of approximately $433 billion as of March 31, 2013, the Adviser has the investment experience to manage and provide non-investment services (described in Section I) to the Fund.
The information prepared by Lipper shows the 1, 3, 5 and 10 year performance returns and rankings18 of the Fund relative to its Lipper Performance Group (“PG”) and Lipper Performance Universe (“PU”)19 for the periods ended February 28, 2013.20
Fund Return (%) | PG Median (%) | PU Median (%) | PG Rank | PU Rank | ||||||||||||
| 1 year | 13.33 | 13.17 | 11.12 | 7/15 | 38/124 | |||||||||||
| 3 year | 14.12 | 10.93 | 11.27 | 3/15 | 17/107 | |||||||||||
| 5 year | 3.52 | 5.25 | 4.08 | 10/13 | 58/94 | |||||||||||
| 10 year | 7.65 | 9.07 | 8.21 | 9/10 | 39/58 | |||||||||||
| 18 | The performance returns and rankings of the Fund are for the Fund’s Class A shares. The Fund’s performance returns were provided by Lipper. |
| 19 | The Fund’s PG is identical to the Fund’s EG. The Fund’s PU is not identical to the Fund’s EU as the criteria for including/excluding a fund from a PU is somewhat different from that of an EU. |
| 20 | The current Lipper investment classification/objective dictates the PG and PU throughout the life of the Fund even if a Fund had a different investment classification/objective at a different point in time. |
| ALLIANCEBERNSTEIN GROWTH & INCOME FUND • | 45 |
Set forth below are the 1, 3, 5 and 10 year and since inception performance returns of the Fund (in bold)21 versus its benchmark.22 Fund and benchmark volatility and reward-to-variability ratio (“Sharpe Ratio”) information is also shown.23
Periods Ending February 28, 2013 Annualized Performance | ||||||||||||||||||||||||||||||||
Since Inception (%) | Annualized | Risk | ||||||||||||||||||||||||||||||
1 Year (%) | 3 Year (%) | 5 Year (%) | 10 Year (%) | Volatility (%) | Sharpe (%) | |||||||||||||||||||||||||||
| Growth & Income Fund, Inc. | 13.33 | 14.12 | 3.52 | 7.65 | 9.92 | 15.35 | 0.44 | 10 | ||||||||||||||||||||||||
| Russell 1000 Value Index | 17.63 | 13.66 | 3.88 | 8.77 | N/A | 15.68 | 0.50 | 10 | ||||||||||||||||||||||||
| Inception Date: July 1, 1932 | ||||||||||||||||||||||||||||||||
Based on the factors discussed above the Senior Officer’s conclusion is that the proposed fee for the Fund is reasonable and within the range of what would have been negotiated at arm’s-length in light of all the surrounding circumstances. This conclusion in respect of the Fund is based on an evaluation of all of these factors and no single factor was dispositive.
Dated: May 29, 2013
| 21 | The performance returns and risk measures shown in the table are for the Class A shares of the Fund. |
| 22 | The Adviser provided Fund and benchmark performance return information for periods through February 28, 2013. |
| 23 | Fund and benchmark volatility and Sharpe Ratio information was obtained through Lipper LANA, a database maintained by Lipper. Volatility is a statistical measure of the tendency of a market price or yield to vary over time. The Sharpe Ratio is a risk adjusted measure of return that divides a fund’s return in excess of the riskless return by the fund’s standard deviation. A fund with a greater volatility would be viewed as more risky than a fund with equivalent performance but lower volatility; for that reason, a greater return would be demanded for the more risky fund. A fund with a higher Sharpe Ratio would be viewed as better performing than a fund with a lower Sharpe Ratio. |
| 46 | • ALLIANCEBERNSTEIN GROWTH & INCOME FUND |
THIS PAGE IS NOT PART OF THE SHAREHOLDER REPORT OR THE FINANCIAL STATEMENTS
ALLIANCEBERNSTEIN FAMILY OF FUNDS
Wealth Strategies
Balanced Wealth Strategy
Conservative Wealth Strategy
Wealth Appreciation Strategy
Tax-Managed Balanced Wealth Strategy
Tax-Managed Conservative Wealth Strategy
Tax-Managed Wealth Appreciation Strategy
Asset Allocation/Multi-Asset Funds
Emerging Markets Multi-Asset Portfolio
International Portfolio
Tax-Managed International Portfolio
Growth Funds
Domestic
Discovery Growth Fund**
Growth Fund
Large Cap Growth Fund
Select US Equity Portfolio
Small Cap Growth Portfolio
Global & International
Global Thematic Growth Fund
International Discovery Equity Portfolio
International Growth Fund
Value Funds
Domestic
Core Opportunities Fund
Discovery Value Fund**
Equity Income Fund
Growth & Income Fund
Value Fund
Global & International
Emerging Markets Equity Portfolio
Global Value Fund
International Value Fund
Taxable Bond Funds
Bond Inflation Strategy
Global Bond Fund
High Income Fund
Intermediate Bond Portfolio
Limited Duration High Income Portfolio
Short Duration Portfolio
Municipal Bond Funds
Arizona Portfolio California Portfolio High Income Portfolio Massachusetts Portfolio Michigan Portfolio Minnesota Portfolio Municipal Bond Inflation Strategy | National Portfolio New Jersey Portfolio New York Portfolio Ohio Portfolio Pennsylvania Portfolio Virginia Portfolio |
Intermediate Municipal Bond Funds
Intermediate California Portfolio
Intermediate Diversified Portfolio
Intermediate New York Portfolio
Closed-End Funds
Alliance California Municipal Income Fund
Alliance New York Municipal Income Fund
AllianceBernstein Global High Income Fund
AllianceBernstein Income Fund
AllianceBernstein National Municipal Income Fund
Alternatives
Dynamic All Market Fund
Global Real Estate Investment Fund
Global Risk Allocation Fund**
Market Neutral Strategy-Global
Market Neutral Strategy-U.S.
Real Asset Strategy
Select US Long/Short Portfolio
Unconstrained Bond Fund
Retirement Strategies
2000 Retirement Strategy | 2020 Retirement Strategy | 2040 Retirement Strategy | ||
2005 Retirement Strategy | 2025 Retirement Strategy | 2045 Retirement Strategy | ||
2010 Retirement Strategy | 2030 Retirement Strategy | 2050 Retirement Strategy | ||
2015 Retirement Strategy | 2035 Retirement Strategy | 2055 Retirement Strategy |
We also offer Exchange Reserves,* which serves as the money market fund exchange vehicle for the AllianceBernstein mutual funds.
Investors should consider the investment objectives, risks, charges and expenses of the Fund carefully before investing. For copies of our prospectus or summary prospectus, which contain this and other information, visit us online at www.alliancebernstein.com or contact your AllianceBernstein investments representative. Please read the prospectus and/or summary prospectus carefully before investing.
| * | An investment in Exchange Reserves is not a deposit in a bank and is not insured or guaranteed by the Federal Deposit Insurance Corporation or any other government agency. Although the Fund seeks to preserve the value of your investment at $1.00 per share, it is possible to lose money by investing in the Fund. |
| ** | Prior to October 8, 2012, Global Risk Allocation Fund was named Balanced Shares. Prior to November 1, 2012, Discovery Growth Fund was named Small/Mid Cap Growth Fund and Discovery Value Fund was named Small/Mid Cap Value Fund. |
| ALLIANCEBERNSTEIN GROWTH & INCOME FUND • | 47 |
AllianceBernstein Family of Funds
NOTES
| 48 | • ALLIANCEBERNSTEIN GROWTH & INCOME FUND |
NOTES
| ALLIANCEBERNSTEIN GROWTH & INCOME FUND • | 49 |
NOTES
| 50 | • ALLIANCEBERNSTEIN GROWTH & INCOME FUND |
NOTES
| ALLIANCEBERNSTEIN GROWTH & INCOME FUND • | 51 |
NOTES
| 52 | • ALLIANCEBERNSTEIN GROWTH & INCOME FUND |
ALLIANCEBERNSTEIN GROWTH & INCOME FUND
1345 Avenue of the Americas
New York, NY 10105
800.221.5672
| GI-0152-0413 |  | |
ITEM 2. CODE OF ETHICS.
Not applicable when filing a semi-annual report to shareholders.
ITEM 3. AUDIT COMMITTEE FINANCIAL EXPERT.
Not applicable when filing a semi-annual report to shareholders.
ITEM 4. PRINCIPAL ACCOUNTANT FEES AND SERVICES.
Not applicable when filing a semi-annual report to shareholders.
ITEM 5. AUDIT COMMITTEE OF LISTED REGISTRANTS.
Not applicable to the registrant.
ITEM 6. SCHEDULE OF INVESTMENTS.
Please see Schedule of Investments contained in the Report to Shareholders included under Item 1 of this Form N-CSR.
ITEM 7. DISCLOSURE OF PROXY VOTING POLICIES AND PROCEDURES FOR CLOSED-END MANAGEMENT INVESTMENT COMPANIES.
Not applicable to the registrant.
ITEM 8. PORTFOLIO MANAGERS OF CLOSED-END MANAGEMENT INVESTMENT COMPANIES.
Not applicable to the registrant.
ITEM 9. PURCHASES OF EQUITY SECURITIES BY CLOSED-END MANAGEMENT INVESTMENT COMPANY AND AFFILIATED PURCHASERS.
Not applicable to the registrant.
ITEM 10. SUBMISSION OF MATTERS TO A VOTE OF SECURITY HOLDERS.
There have been no material changes to the procedures by which shareholders may recommend nominees to the Fund’s Board of Directors since the Fund last provided disclosure in response to this item.
ITEM 11. CONTROLS AND PROCEDURES.
(a) The registrant’s principal executive officer and principal financial officer have concluded that the registrant’s disclosure controls and procedures (as defined in Rule 30a-2(c) under the Investment Company Act of 1940, as amended) are effective at the reasonable assurance level based on their evaluation of these controls and procedures as of a date within 90 days of the filing date of this document.
(b) There were no changes in the registrant’s internal controls over financial reporting that occurred during the second fiscal quarter of the period that has materially affected, or is reasonably likely to materially affect, the registrant’s internal control over financial reporting.
ITEM 12. EXHIBITS.
The following exhibits are attached to this Form N-CSR:
EXHIBIT NO. | DESCRIPTION OF EXHIBIT | |
| 12 (b) (1) | Certification of Principal Executive Officer Pursuant to Section 302 of the Sarbanes-Oxley Act of 2002 | |
| 12 (b) (2) | Certification of Principal Financial Officer Pursuant to Section 302 of the Sarbanes-Oxley Act of 2002 | |
| 12 (c) | Certification of Principal Executive Officer and Principal Financial Officer Pursuant to Section 906 of the Sarbanes-Oxley Act of 2002 | |
SIGNATURES
Pursuant to the requirements of the Securities Exchange Act of 1934 and the Investment Company Act of 1940, the registrant has duly caused this report to be signed on its behalf by the undersigned, thereunto duly authorized.
| (Registrant): AllianceBernstein Growth and Income Fund, Inc. | ||
| By: | /s/ Robert M. Keith | |
| Robert M. Keith | ||
| President | ||
Date: June 21, 2013
Pursuant to the requirements of the Securities Exchange Act of 1934 and the Investment Company Act of 1940, this report has been signed below by the following persons on behalf of the registrant and in the capacities and on the dates indicated.
| By: | /s/ Robert M. Keith | |
| Robert M. Keith | ||
| President | ||
| Date: | June 21, 2013 | |
| By: | /s/ Joseph J. Mantineo | |
| Joseph J. Mantineo | ||
| Treasurer and Chief Financial Officer | ||
| Date: | June 21, 2013 | |