investorpresentation1109

November 2012 Investor Presentation Contact: Jon Faulkner CFO The Dixie Group Phone: 706-876-5814 jon.faulkner@dixiegroup.com Exhibit 99.1
• Statements in this presentation which relate to the future, are subject to risk factors and uncertainties that could cause actual results to differ materially from those indicated in such forward-looking statements. Such factors include the levels of demand for the products produced by the Company. Other factors that could affect the Company’s results include, but are not limited to, raw material and transportation costs related to petroleum prices, the cost and availability of capital, and general economic and competitive conditions related to the Company’s business. Issues related to the availability and price of energy may adversely affect the Company’s operations. Additional information regarding these and other factors and uncertainties may be found in the Company’s filings with the Securities and Exchange Commission. • General information set forth in this presentation concerning market conditions, sales data and trends in the U.S. carpet and rug markets are derived from various public and, in some cases, non-public sources. Although we believe such data and information to be accurate, we have not attempted to independently verify such information. 2 Forward Looking Statements The Dixie Group, Inc.

• Began operations in 1920 • Entered floorcovering in 1993 and exited textiles in 1999 – now 100% floorcovering • Refined focus on upper-end markets in 2004 • For over 90 years we have focused on specialized products • Traditionally we have outperformed the industry and expect to do so in the future 3 Dixie History

Dixie Today • Commitment to brands in the upper- end market with strong growth potential • Diversified between Commercial and Residential markets • Diversified customer base – Top 10 carpet customers • 13% of sales – Top 20 carpet customers • 16% of sales 4

New and Existing Home Sales Seasonally Adjusted Annual Rate New 1,000 Existing 1,000 New in July-Existing in August: New home sales increased 3.6% from June. The rate of 372,000 was 25.3% better than one year ago. The West leads the regions with YTD sales up 34.7%. Existing home sales increased from a rate of 4.47 million in July to 4.82 million in August. The August rate was 9.3% better than one year ago. Existing house sales are picking up quickly. Source: National Association of Realtors (existing) and census.gov/const/c25 (new). Next release September 26 (new); October 19 (existing). 5
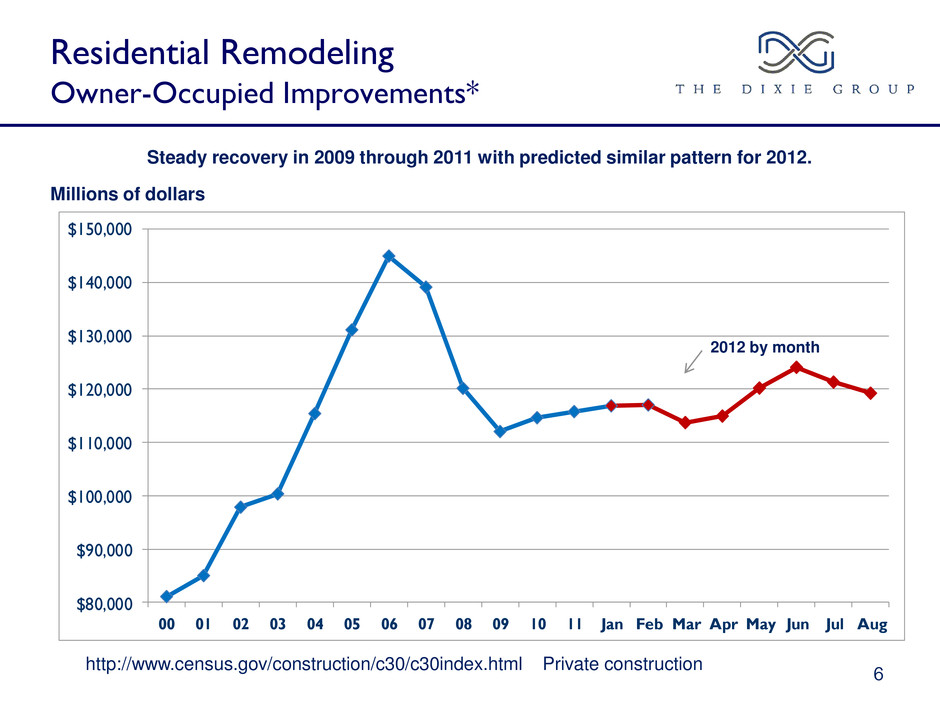
$80,000 $90,000 $100,000 $110,000 $120,000 $130,000 $140,000 $150,000 00 01 02 03 04 05 06 07 08 09 10 11 Jan Feb Mar Apr May Jun Jul Aug 6 Steady recovery in 2009 through 2011 with predicted similar pattern for 2012. Millions of dollars http://www.census.gov/construction/c30/c30index.html Private construction Residential Remodeling Owner-Occupied Improvements* 2012 by month
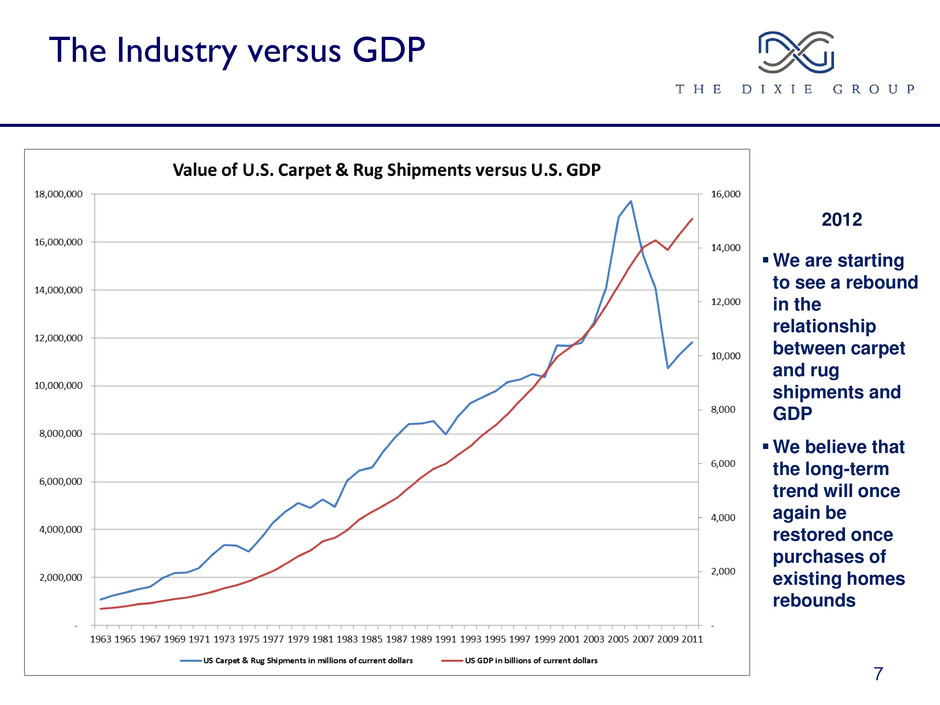
7 2012 We are starting to see a rebound in the relationship between carpet and rug shipments and GDP We believe that the long-term trend will once again be restored once purchases of existing homes rebounds The Industry versus GDP
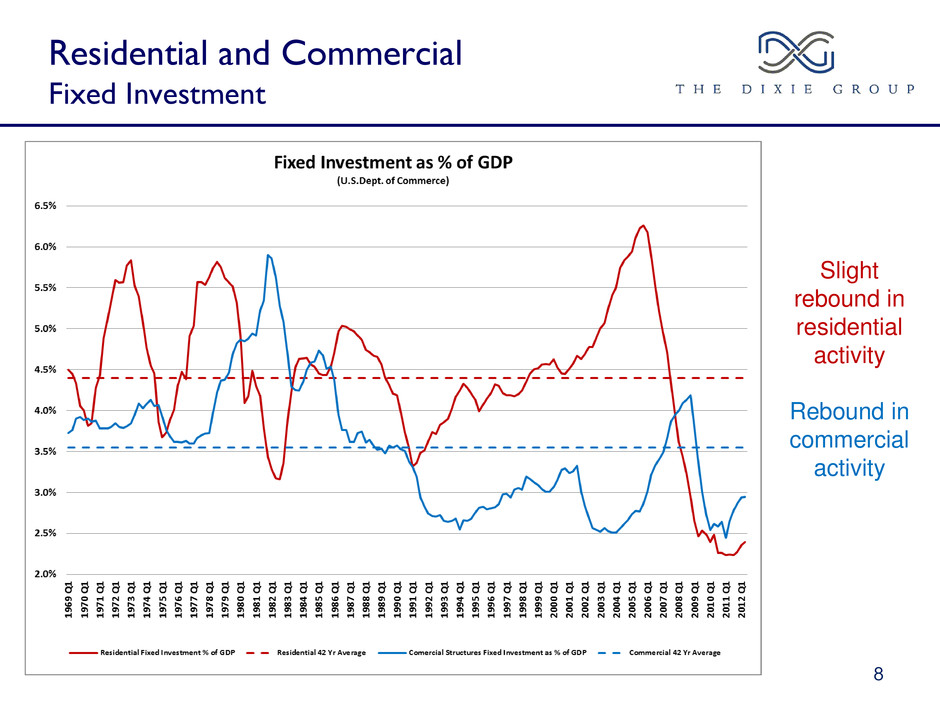
Residential and Commercial Fixed Investment 8 Slight rebound in residential activity Rebound in commercial activity
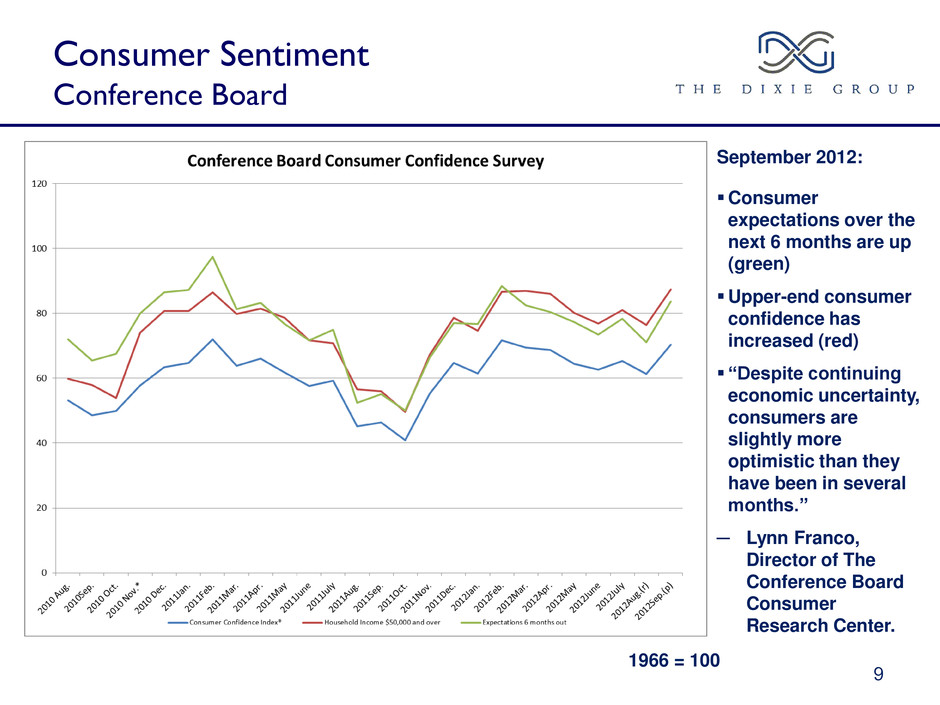
9 Consumer Sentiment Conference Board September 2012: Consumer expectations over the next 6 months are up (green) Upper-end consumer confidence has increased (red) “Despite continuing economic uncertainty, consumers are slightly more optimistic than they have been in several months.” ─ Lynn Franco, Director of The Conference Board Consumer Research Center. 1966 = 100

The Stock Market 10 October 2012 The stock market has rebounded to pre-recession levels 2012 is positive but is still subject to macro events: Europe, US Election, China
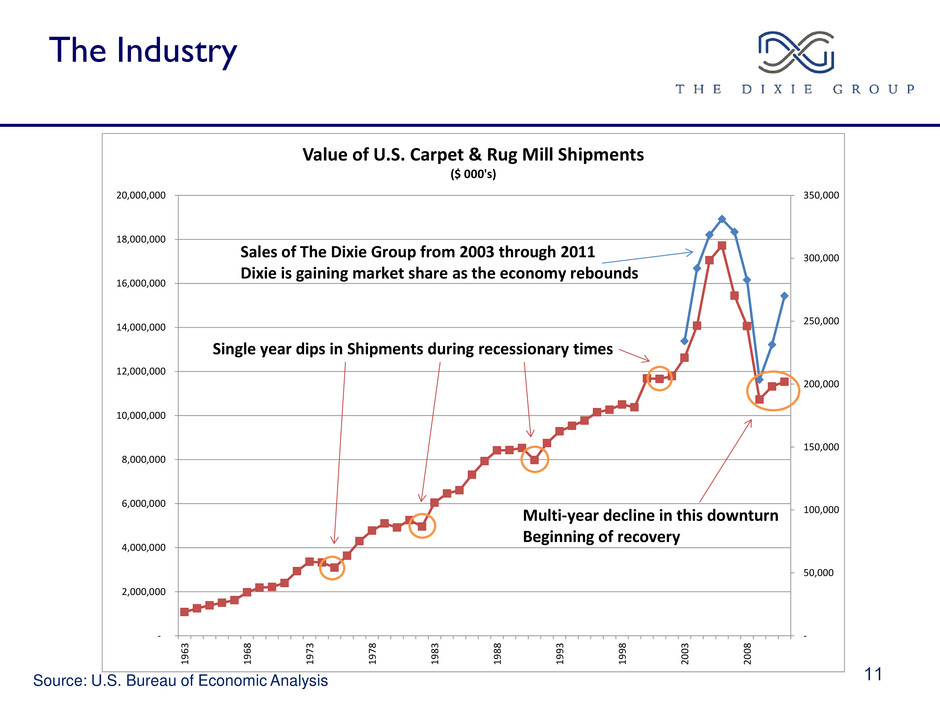
The Industry 11 Source: U.S. Bureau of Economic Analysis - 50,000 100,000 150,000 200,000 250,000 300,000 350,000 - 2,000,000 4,000,000 6,000,000 8,000,000 10,000,000 12,000,000 14,000,000 16,000,000 18,000,000 20,000,000 19 63 19 68 19 73 19 78 19 83 19 88 19 93 19 98 20 03 20 08 Value of U.S. Carpet & Rug Mill Shipments ($ 000's) Single year dips in Shipments during recessionary times Multi-year decline in this downturn Beginning of recovery Sales of The Dixie Group from 2003 through 2011 Dixie is gaining market share as the economy rebounds
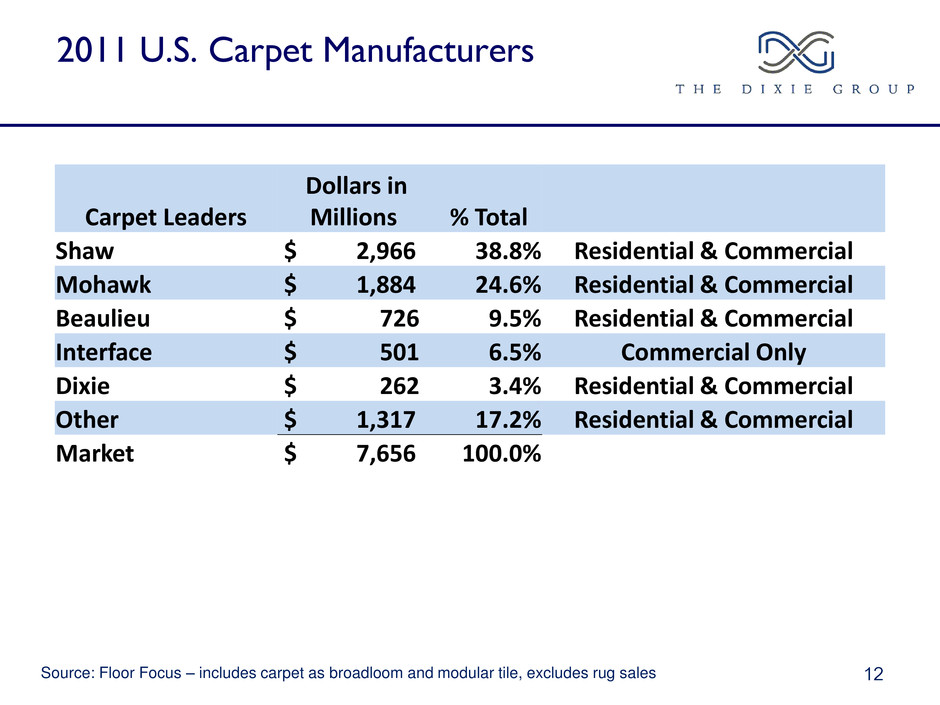
2011 U.S. Carpet Manufacturers 12 Source: Floor Focus – includes carpet as broadloom and modular tile, excludes rug sales Carpet Leaders Dollars in Millions % Total Shaw $ 2,966 38.8% Residential & Commercial Mohawk $ 1,884 24.6% Residential & Commercial Beaulieu $ 726 9.5% Residential & Commercial Interface $ 501 6.5% Commercial Only Dixie $ 262 3.4% Residential & Commercial Other $ 1,317 17.2% Residential & Commercial Market $ 7,656 100.0%

2006 Carpet End Use TTM 2012 Q3 Carpet End Use 13 Sales $10.19 Billion Sales $7.45 Billion Commercial % 2001 – 2012 From 32% to 43% Source: Floor Focus – Broadloom & Carpet Tile Residential 65% Commercial 35% Residential 57% Commercial 43% The Industry

Dixie Group Carpet Sales High-End Residential 74% High-End Commercial 26% 14 Dixie TTM Q3 2012 Carpet and Rug Sales by End Market Commercial % 2001 – 2012 From 25% to 38%
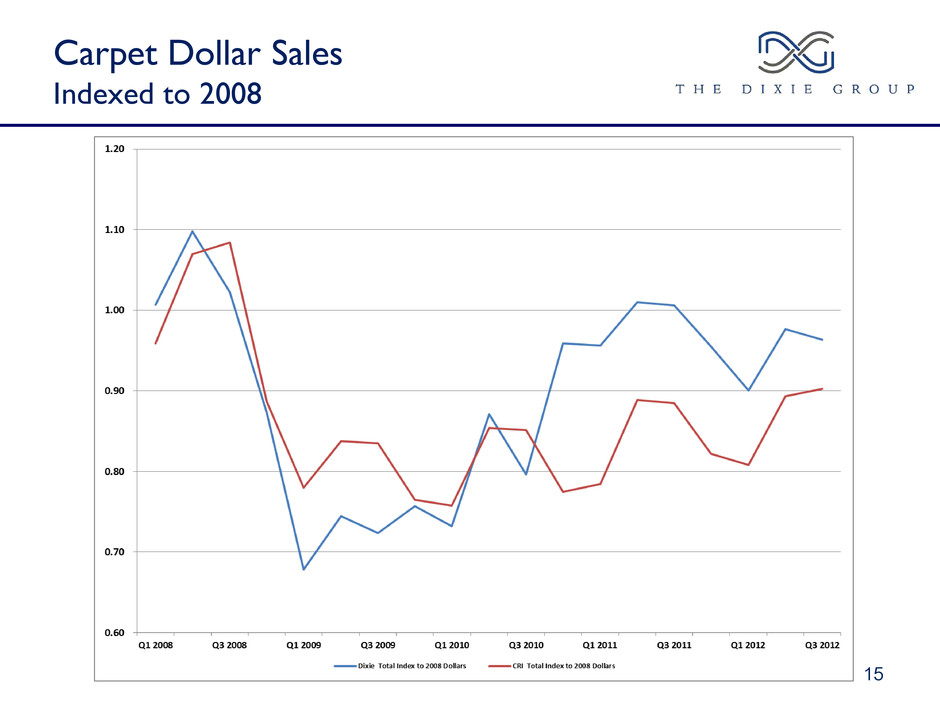
Carpet Dollar Sales Indexed to 2008 15

Carpet Unit Sales Indexed to 2008 16

Residential Positioning The Dixie Group 17 BROADLOOM RESIDENTIAL SALES = $7.0 Billion (2009 $’s) 35% Market Share T O T A L M A R K E T : S QUA R E Y A R DS OR S AL E S DO L L A R S ESTIMATED TOTAL WHOLESALE MARKET FOR CARPETS AND RUGS: VOLUME AND PRICE POINTS Positioning of Dixie Brands by Price Point Segment (Over $20 per SQ YD) Dixie Home Fabrica INDUSTRY AVERAGE PRICE/ SQ YD $0 $14 $21 $28 $35 $42 $49 Note: Industry average price is based on sales reported through industry sources. Excerpt from KSA Study dated May 2004, Titled "KSA Assessment of Dixie's Residential and Contract Carpet Businesses", commissioned by The Dixie Group, Inc. $8 Masland

Dixie Group High-End Residential Sales All Brands Masland, 43% Dixie Home, 38% Fabrica, 19% 18 TTM Q3 2012

Dixie Group High-End Residential Sales All Brands Retailer, 61% Designer, 19% Mass Merchant, 11% National Retailers, 2% Builder, 3% Commercial, 2% Other, 0.9% Distributor, 0.4% Specialty - OEM, 0.7% 19 Sales by Channel for TTM Q3 2012
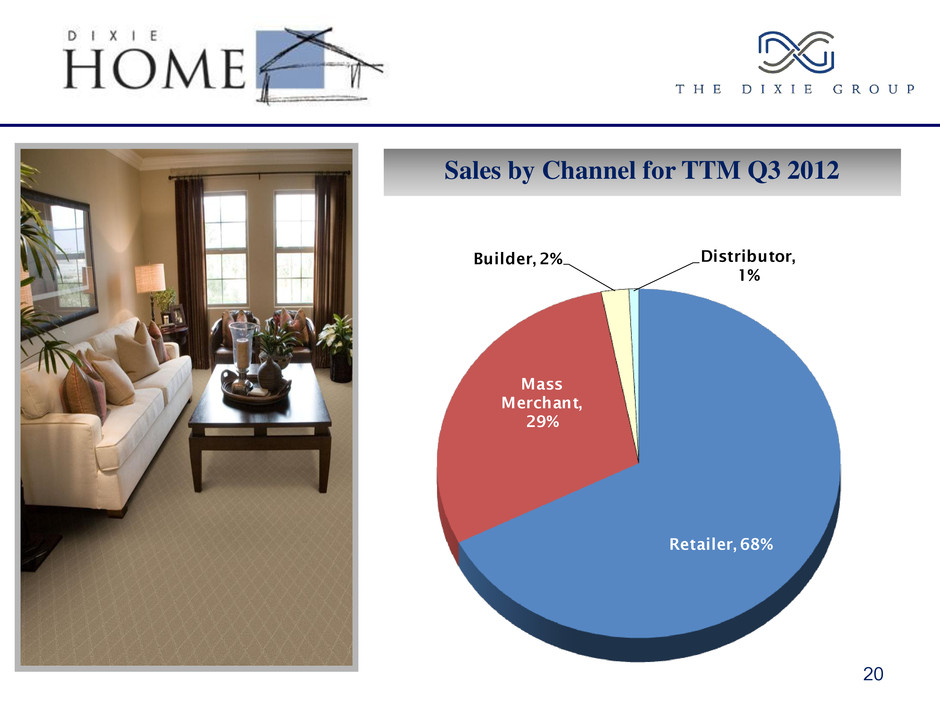
20 Sales by Channel for TTM Q3 2012 Retailer, 68% Mass Merchant, 29% Builder, 2% Distributor, 1%
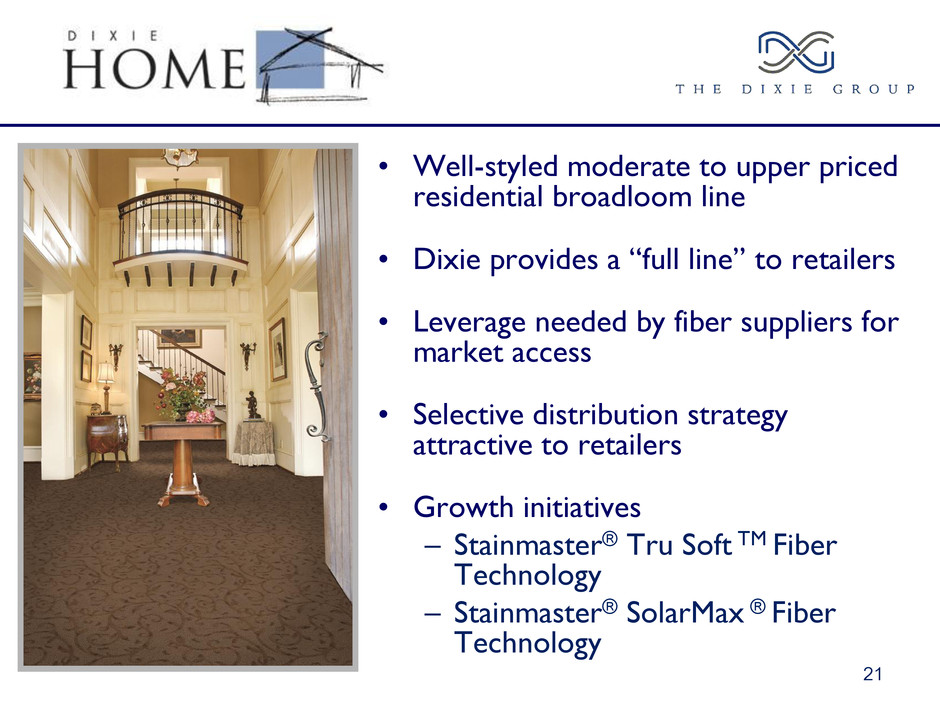
• Well-styled moderate to upper priced residential broadloom line • Dixie provides a “full line” to retailers • Leverage needed by fiber suppliers for market access • Selective distribution strategy attractive to retailers • Growth initiatives – Stainmaster® Tru Soft TM Fiber Technology – Stainmaster® SolarMax ® Fiber Technology 21
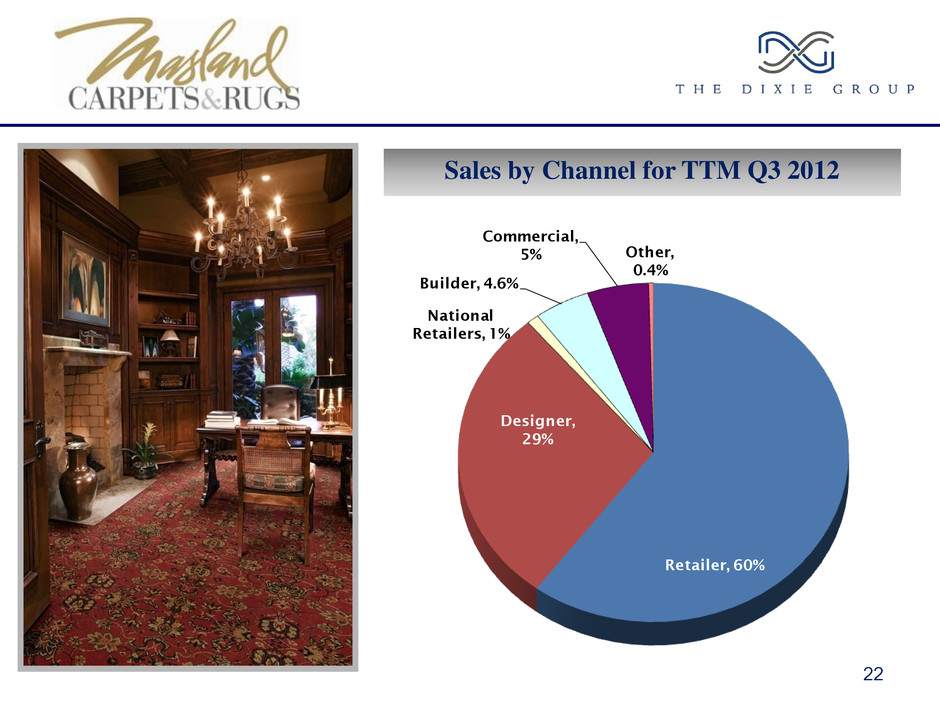
Retailer, 60% Designer, 29% National Retailers, 1% Builder, 4.6% Commercial, 5% Other, 0.4% 22 Sales by Channel for TTM Q3 2012
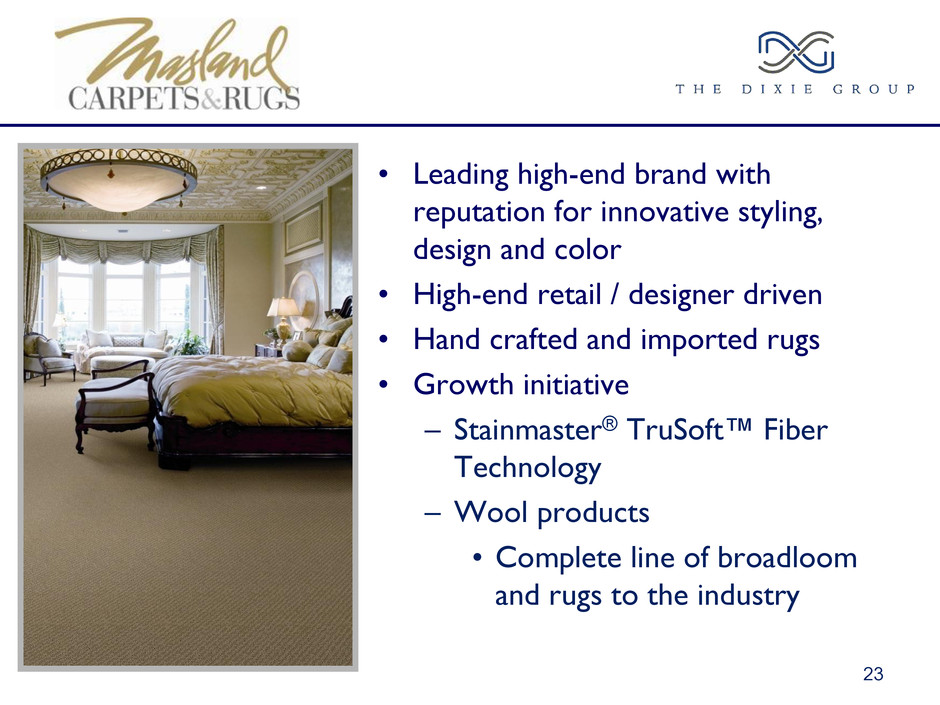
• Leading high-end brand with reputation for innovative styling, design and color • High-end retail / designer driven • Hand crafted and imported rugs • Growth initiative – Stainmaster® TruSoft™ Fiber Technology – Wool products • Complete line of broadloom and rugs to the industry 23
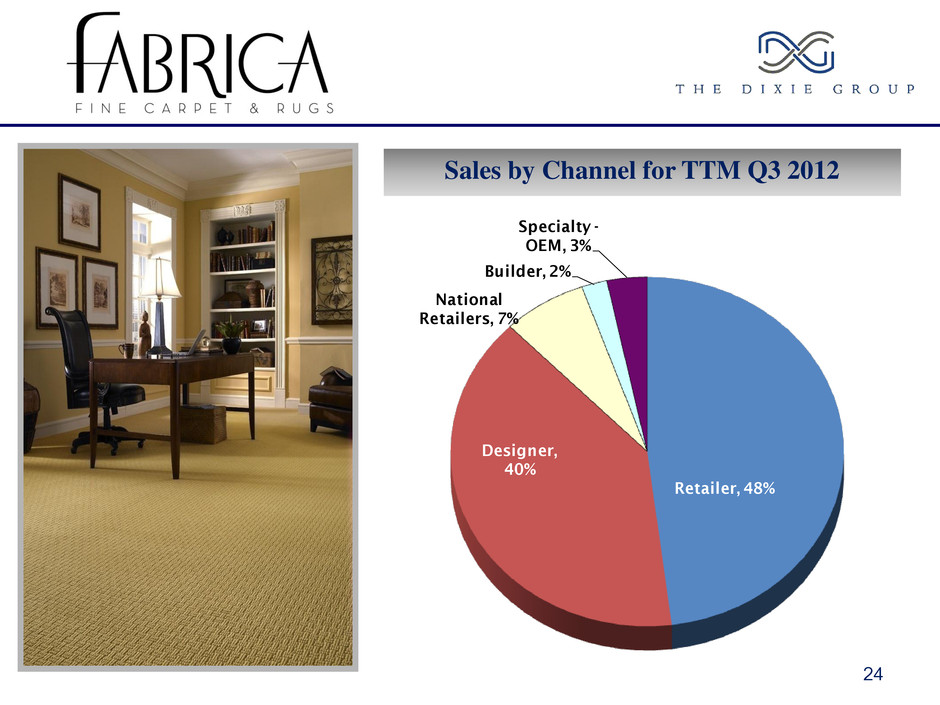
24 Retailer, 48% Designer, 40% National Retailers, 7% Builder, 2% Specialty - OEM, 3% Sales by Channel for TTM Q3 2012

• Premium high-end brand – Superior quality in all aspects • Designer focused • Hand crafted and imported rugs • Growth initiatives – Stainmaster® TruSoft™ Fiber Technology – Fabrica Permaset dyeing process allows unlimited color selection in select wool products – Expand select retail distribution 25
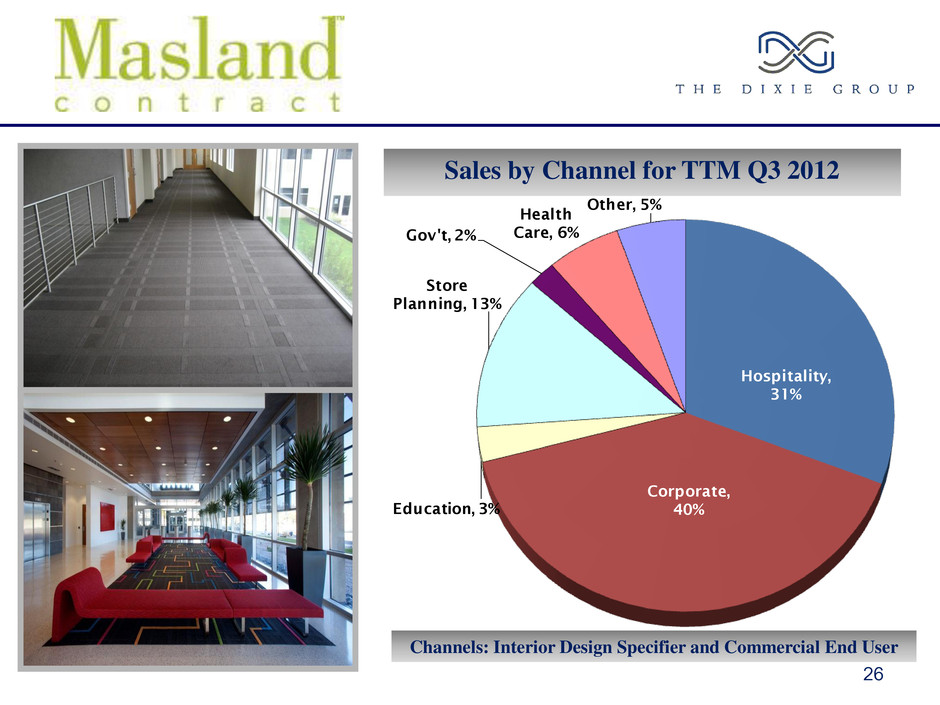
26 Sales by Channel for TTM Q3 2012 Channels: Interior Design Specifier and Commercial End User Hospitality, 31% Corporate, 40%Education, 3% Store Planning, 13% Gov't, 2% Health Care, 6% Other, 5%
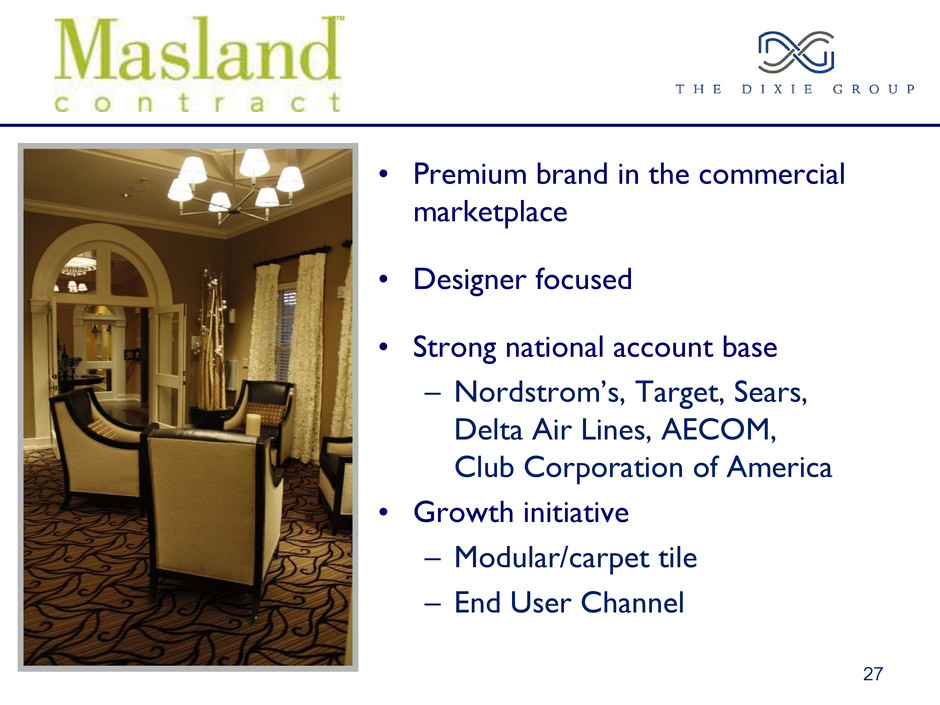
• Premium brand in the commercial marketplace • Designer focused • Strong national account base – Nordstrom’s, Target, Sears, Delta Air Lines, AECOM, Club Corporation of America • Growth initiative – Modular/carpet tile – End User Channel 27

- 50 100 150 200 250 300 350 2006 2007 2008 2009 2010 2011 2012 Seasonally Adjusted 314 305 272 199 225 263 260 17 16 11 6 6 7 5 Carpet Sales Processing Sales 28 $331 $321 $283 $203 $231 $270 Dixie Group Sales $ in millions $265

Sales & Operating Income $ in millions 29 • In 2012, we have: – Improved Residential Retail Sales (non mass merchant) by 6.5% in Q3 while the industry was flat – Completed acquisition of Colormaster enhancing our piece dye capabilities – Estimated 2012 investments of normal capital expenditures and the Colormaster acquisition of $9.5 million vs. D & A of $9.6 million Note: Non-GAAP reconciliation starting on slide 33 Y 2007 Y 2008 Y 2009 Y 2010 Y 2011 YTD 2012 Net Sales 320.8 282.7 203.5 231.3 270.1 195.2 Net Income (Loss) 6.2 (31.5) (42.2) (4.7) 1.0 (0.5) Non-GAAP Adjusted Op. Income (Loss) 16.7 1.5 (8.4) (1.0) 5.1 2.5 Non-GAAP Adjusted EBITDA 29.6 15.2 5.1 10.6 14.8 9.6 Q1 2011 Q2 2011 Q3 2011 Q4 2011 Q1 2012 Q2 2012 Q3 2012 Net Sales 66.0 69.2 69.6 65.3 62.9 66.6 65.8 Net Income (Loss) 0.6 0.8 (0.0) (0.4) (0.2) (0.4) 0.1 Non-GAAP Adjusted Op. Income (Loss) 1.7 1.7 1.2 0.5 0.8 0.5 1.1 Non-GAAP Adjusted EBITDA 4.2 4.1 3.6 2.9 3.2 2.9 3.5 Note: Q1 2011 had 14 operating weeks, all other periods had 13 operating weeks
Current Business Conditions 2012 Activity Activity: • Third quarter as compared to prior year: - Residential non mass merchant sales up 6.5% compared to the industry being down slightly - New commercial sector management team is in place - New high value performance modular carpet tile being launched • Opportunities in new products: • Stainmaster® TruSoft™ product introductions during the third and fourth quarters, offering the new standard in “soft” • Successful launch of our “permaset process” for wool that will allow our designer customers unlimited choices in colorations • Introduced our award winning Chrome Collection in the commercial marketplace 30
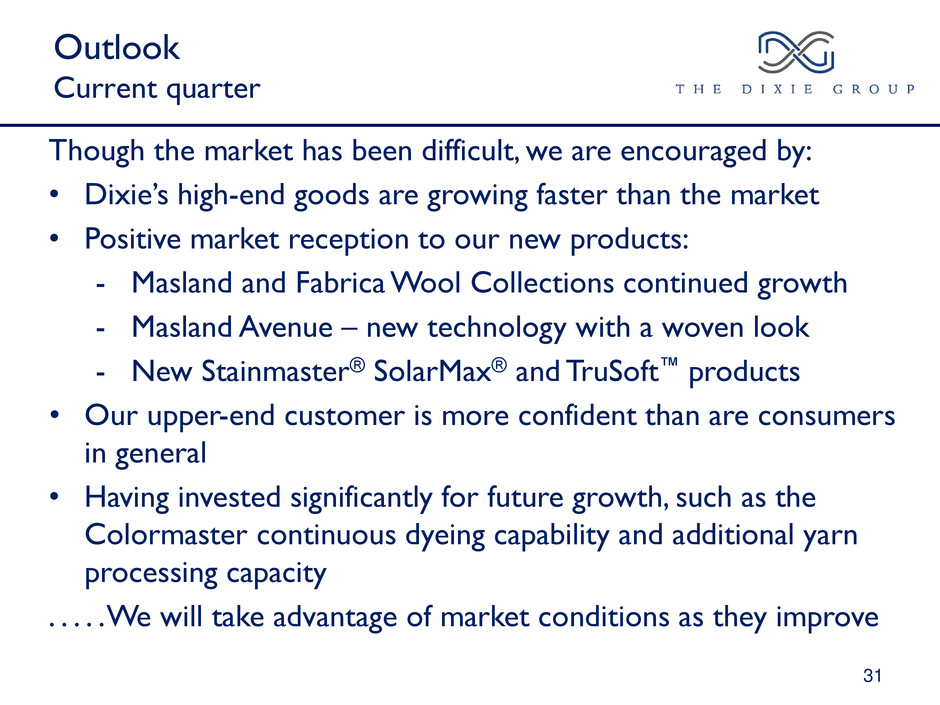
Outlook Current quarter Though the market has been difficult, we are encouraged by: • Dixie’s high-end goods are growing faster than the market • Positive market reception to our new products: - Masland and Fabrica Wool Collections continued growth - Masland Avenue – new technology with a woven look - New Stainmaster® SolarMax® and TruSoft™ products • Our upper-end customer is more confident than are consumers in general • Having invested significantly for future growth, such as the Colormaster continuous dyeing capability and additional yarn processing capacity . . . . . We will take advantage of market conditions as they improve 31

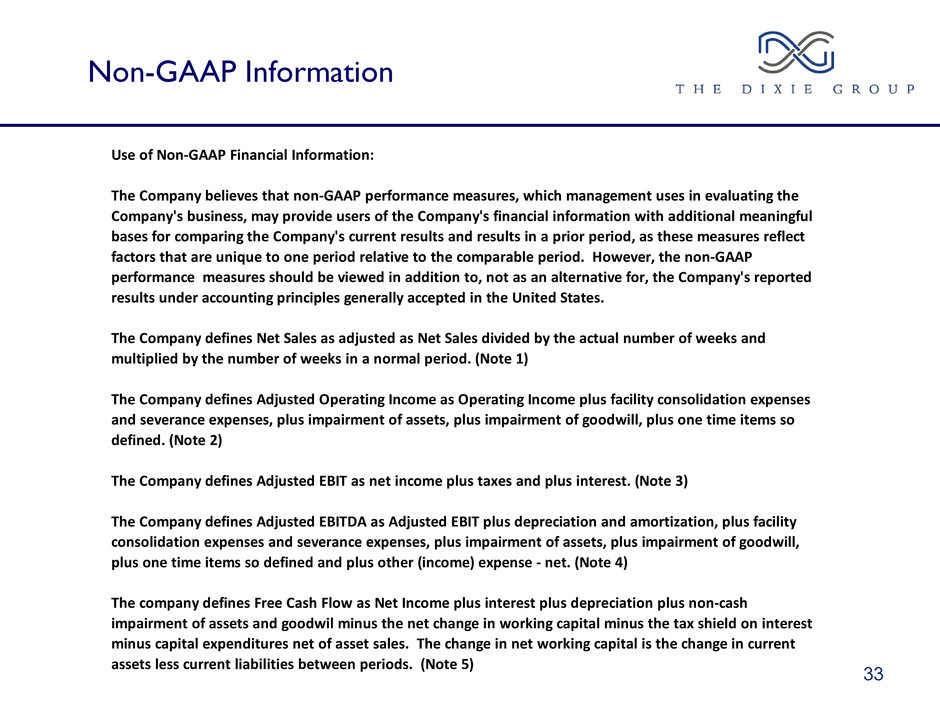
Non-GAAP Information 33 Use of Non-GAAP Financial Information: The Company believes that non-GAAP performance measures, which management uses in evaluating the Company's business, may provide users of the Company's financial information with additional meaningful bases for comparing the Company's current results and results in a prior period, as these measures reflect factors that are unique to one period relative to the comparable period. However, the non-GAAP performance measures should be viewed in addition to, not as an alternative for, the Company's reported results under accounting principles generally accepted in the United States. The Company defines Net Sales as adjusted as Net Sales divided by the actual number of weeks and multiplied by the number of weeks in a normal period. (Note 1) The Company defines Adjusted Operating Income as Operating Income plus facility consolidation expenses and severance expenses, plus impairment of assets, plus impairment of goodwill, plus one time items so defined. (Note 2) The Company defines Adjusted EBIT as net income plus taxes and plus interest. (Note 3) The Company defines Adjusted EBITDA as Adjusted EBIT plus depreciation and amortization, plus facility consolidation expenses and severance expenses, plus impairment of assets, plus impairment of goodwill, plus one time items so defined and plus other (income) expense - net. (Note 4) The company defines Free Cash Flow as Net Income plus interest plus depreciation plus non-cash impairment of assets and goodwil minus the net change in working capital minus the tax shield on interest minus capital expenditures net of asset sales. The change in net working capital is the change in current assets less current liabilities between periods. (Note 5)
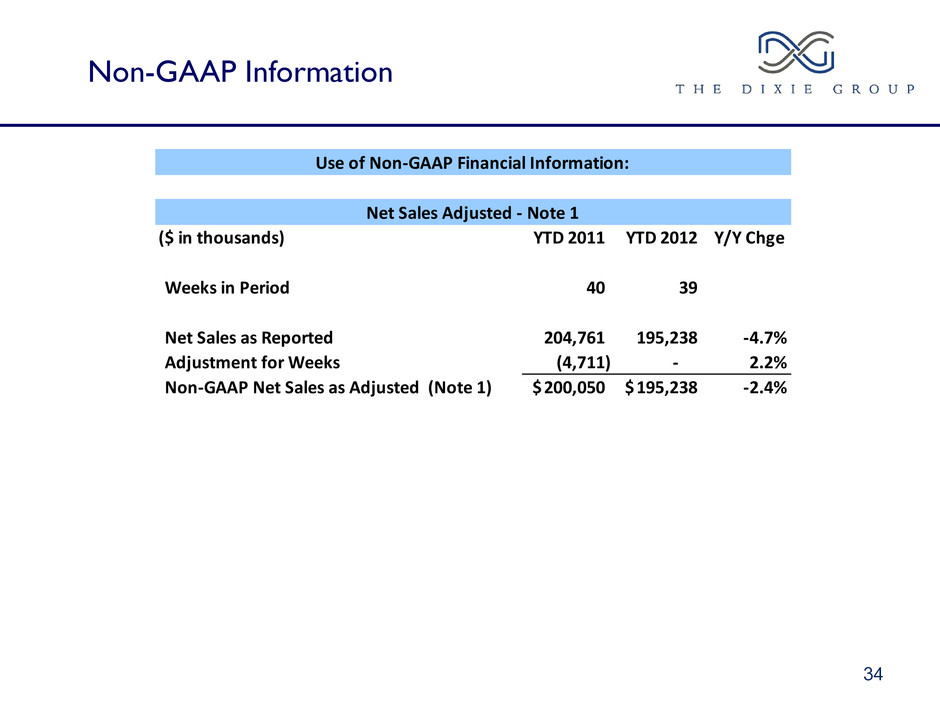
34 Non-GAAP Information ($ in thousands) YTD 2011 YTD 2012 Y/Y Chge Weeks in Period 40 39 Net Sales as Reported 204,761 195,238 -4.7% Adjustment for Weeks (4,711) - 2.2% Non-GAAP Net Sales as Adjusted (Note 1) 200,050$ 195,238$ -2.4% Use of Non-GAAP Financial Information: Net Sales Adjusted - Note 1

Note a: Restated ($ in thousands) 2007 (a) 2008 (a) 2009 (a) 2010 2011 2012 YTD Operating income (loss) 16,707 (28,460) (45,389) (2,570) 5,668 1,400 Plus: Facility consolidation and severance expenses - 2,317 4,091 1,556 (563) - Plus: Impairment of assets - 4,478 1,459 - - - Plus: Impairment of goodwill - 23,121 31,406 - - - Plus: Manufacturing Realignment - - - - - 1,067 Non-GAAP Adjusted Operating Income (Loss) (Note 2) 16,707$ 1,456$ (8,433)$ (1,014)$ 5,105$ 2,467$ ($ in thousands) 2007 (a) 2008 (a) 2009 (a) 2010 2011 2012 YTD Net income (loss) as reported 6,247 (31,481) (42,241) (4,654) 986 (512) Less: Income (loss) from discontinued operations, net of tax (521) (313) (382) (281) (286) (273) Plus: Taxes 3,686 (2,931) (8,870) (2,604) 684 (349) Plus: Interest 6,347 5,965 5,521 4,124 3,470 2,269 Non-GAAP Adjusted EBIT (Note 3) 16,801$ (28,134)$ (45,208)$ (2,853)$ 5,426$ 1,681$ ($ in thousands) 2007 (a) 2008 (a) 2009 (a) 2010 2011 2012 YTD Non-GAAP Adjusted EBIT (from above) 16,801 (28,134) (45,208) (2,853) 5,426 1,681 Plus: Depreciation and amortization 12,941 13,752 13,504 11,575 9,649 7,137 Plus: Facility consolidation and severance expenses - 2,317 4,091 1,556 (563) - Plus: Impairment of assets - 4,478 1,459 - - - Plus: Impairment of goodwill - 23,121 31,406 - - - Plus: Manufacturing Realignment - - - - - 1,067 Plus: Other (income) expense - net (94) (326) (181) 282 242 (281) Non-GAAP Adjusted EBITDA (Note 4) 29,648$ 15,208$ 5,071$ 10,560$ 14,754$ 9,604$ Use of Non-GAAP Financial Information: Adjusted Operating Income (Loss) - Note 2 Adjusted Earnings before Interest and Taxes (EBIT) - Note 3 Earnings before Interest, Taxes, Depreciation and Amortization (EBITDA) - Note 4
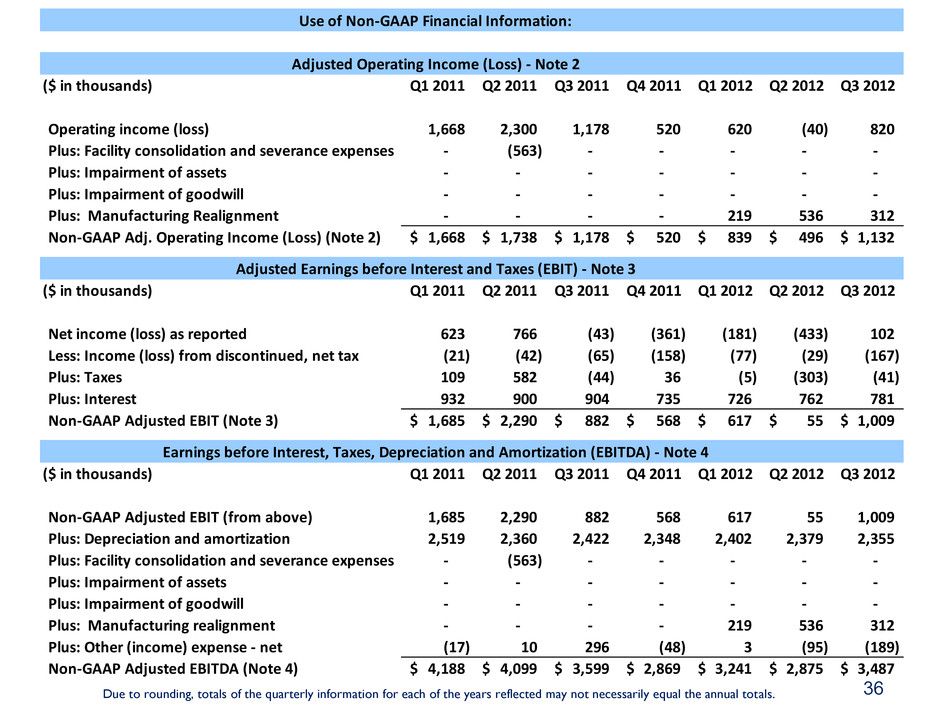
36 Due to rounding, totals of the quarterly information for each of the years reflected may not necessarily equal the annual totals. ($ in thousands) Q1 2011 Q2 2011 Q3 2011 Q4 2011 Q1 2012 Q2 2012 Q3 2012 Operating income (loss) 1,668 2,300 1,178 520 620 (40) 820 Plus: Facility consolidation and severance expenses - (563) - - - - - Plus: Impairment of assets - - - - - - - Plus: Impairment of goodwill - - - - - - - Plus: Manufacturing Realignment - - - - 219 536 312 Non-GAAP Adj. Operating Income (Loss) (Note 2) 1,668$ 1,738$ 1,178$ 520$ 839$ 496$ 1,132$ ($ in thousands) Q1 2011 Q2 2011 Q3 2011 Q4 2011 Q1 2012 Q2 2012 Q3 2012 Net income (loss) as reported 623 766 (43) (361) (181) (433) 102 Less: Income (loss) from discontinued, net tax (21) (42) (65) (158) (77) (29) (167) Plus: Taxes 109 582 (44) 36 (5) (303) (41) Plus: Interest 932 900 904 735 726 762 781 Non-GAAP Adjusted EBIT (Note 3) 1,685$ 2,290$ 882$ 568$ 617$ 55$ 1,009$ ($ in thousands) Q1 2011 Q2 2011 Q3 2011 Q4 2011 Q1 2012 Q2 2012 Q3 2012 Non-GAAP Adjusted EBIT (from above) 1,685 2,290 882 568 617 55 1,009 Plus: Depreciation and amortization 2,519 2,360 2,422 2,348 2,402 2,379 2,355 Plus: Facility consolidation and severance expenses - (563) - - - - - Plus: Impairment of assets - - - - - - - Plus: Impairment of goodwill - - - - - - - Plus: Manufacturing realignment - - - - 219 536 312 Plus: Other (income) expense - net (17) 10 296 (48) 3 (95) (189) Non-GAAP Adjusted EBITDA (Note 4) 4,188$ 4,099$ 3,599$ 2,869$ 3,241$ 2,875$ 3,487$ Use of Non-GAAP Financial Information: Adjusted Operating Income (Loss) - Note 2 Adjusted Earnings before Interest and Taxes (EBIT) - Note 3 Earnings before Interest, Taxes, Depreciation and Amortization (EBITDA) - Note 4

37 Non-GAAP Information ($ in thousands) Q1 2011 Q2 2011 Q3 2011 Q4 2011 Q1 2012 Q2 2012 Q3 2012 Non-GAAP Adjusted EBIT (from above) 1,685 2,290 882 568 617 55 1,009 Times: 1 - Tax Rate = EBIAT 1,096 1,489 573 369 401 36 656 Plus: Depreciation and Amortization 2,519 2,360 2,422 2,348 2,402 2,379 2,355 Plus: Non Cash Impairment of Assets and Goodwill - - - - - - - Minus: Net change in Working Capital 5,110 (779) 1,991 3,599 5,431 4,250 812 Non-GAAP Cash from Operations (1,495) 4,628 1,004 (881) (2,628) (1,835) 2,199 Minus: Capital Expenditures net of Asset Sales 1,100 1,038 2,053 2,544 1,132 557 298 Non-GAAP Free Cash Flow (Note 5) (2,595) 3,590 (1,049) (3,425) (3,760) (2,392) 1,901 Current Assets 108,035 111,153 111,280 100,999 106,235 111,395 111,841 Current Liabilities 46,429 50,326 48,462 34,582 34,387 35,297 34,931 Net Working Capital 61,606 60,827 62,818 66,417 71,848 76,098 76,910 Change in Net Working Capital 5,110 (779) 1,991 3,599 5,431 4,250 812 Due to rounding, totals of the quarterly information for each of the years Use of Non-GAAP Financial Information: Free Cash Flow (FCF) - Note 5


