Exhibit 99.1
January, 2005
1
Forward Looking Statement
Statements in this presentation, which relate to the future, are subject to risk factors and uncertainties that could cause actual results to differ materially from those indicated in such forward-looking statements. Such factors include the levels of demand for the products produced by the Company. Other factors that could affect the Company’s results include, but are not limited to, raw material and transportation costs related to petroleum prices, the cost and availability of capital, and general economic and competitive conditions related to the Company’s business. Issues related to the availability and price of energy may adversely affect the Company’s operations. Additional information regarding these and other risk factors and uncertainties may be found in the Company’s filings with the Securities and Exchange Commission.
General information set forth in this presentation concerning market conditions, sales data and trends in the U.S carpet and rug markets are derived from various public and, in some cases, non-public sources. Although we believe such data and information to be accurate, we have not attempted to independently verify such information.
2
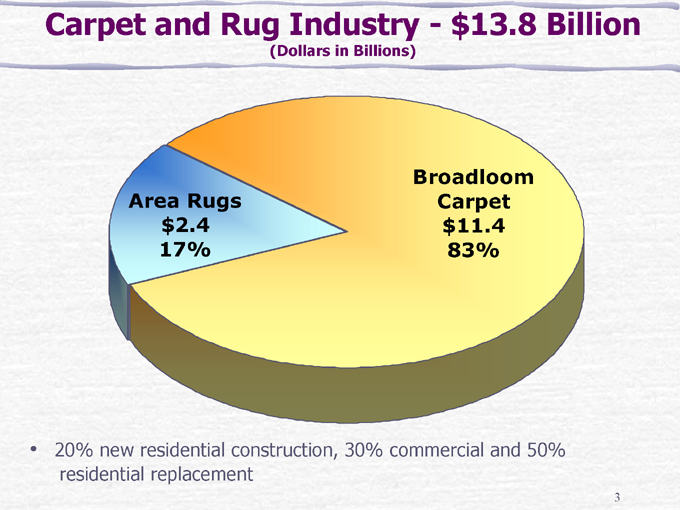
Carpet and Rug Industry—$13.8 Billion
(Dollars in Billions)
Area Rugs $2.4 17%
Broadloom Carpet $11.4 83%
20% new residential construction, 30% commercial and 50% residential replacement
3
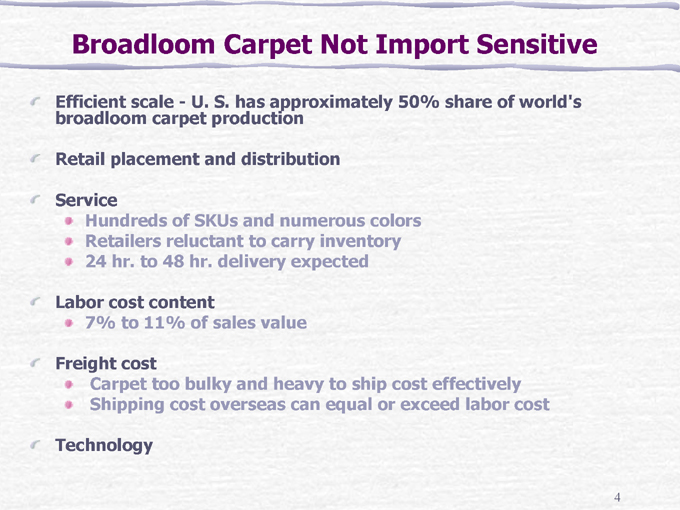
Broadloom Carpet Not Import Sensitive
Efficient scale - U. S. has approximately 50% share of world’s broadloom carpet production
Retail placement and distribution
Service
Hundreds of SKUs and numerous colors Retailers reluctant to carry inventory 24 hr. to 48 hr. delivery expected
Labor cost content
7% to 11% of sales value
Freight cost
Carpet too bulky and heavy to ship cost effectively Shipping cost overseas can equal or exceed labor cost
Technology
4
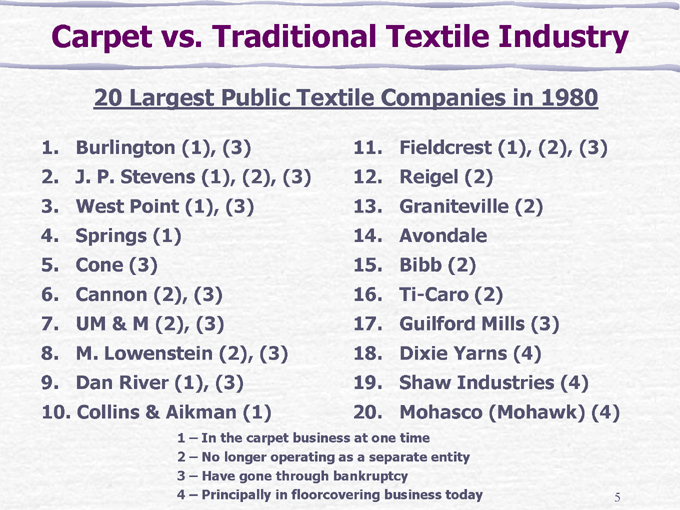
Carpet vs. Traditional Textile Industry
20 Largest Public Textile Companies in 1980
1. Burlington (1), (3)
2. J. P. Stevens (1), (2), (3)
3. West Point (1), (3)
4. Springs (1)
5. Cone (3)
6. Cannon (2), (3)
7. UM & M (2), (3)
8. M. Lowenstein (2), (3)
9. Dan River (1), (3) 10. Collins & Aikman (1)
11. Fieldcrest (1), (2), (3)
12. Reigel (2)
13. Graniteville (2)
14. Avondale
15. Bibb (2)
16. Ti-Caro (2)
17. Guilford Mills (3)
18. Dixie Yarns (4)
19. Shaw Industries (4)
20. Mohasco (Mohawk) (4)
1 – In the carpet business at one time 2 – No longer operating as a separate entity 3 – Have gone through bankruptcy 4 – Principally in floorcovering business today
5
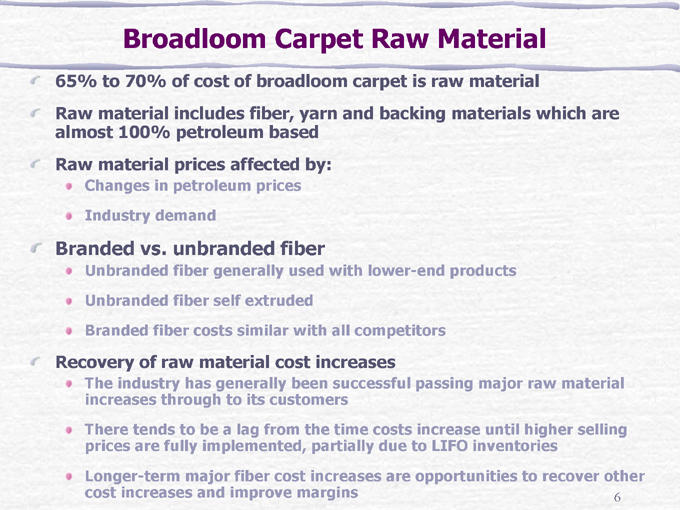
Broadloom Carpet Raw Material
65% to 70% of cost of broadloom carpet is raw material
Raw material includes fiber, yarn and backing materials which are almost 100% petroleum based Raw material prices affected by:
Changes in petroleum prices Industry demand
Branded vs. unbranded fiber
Unbranded fiber generally used with lower-end products Unbranded fiber self extruded Branded fiber costs similar with all competitors
Recovery of raw material cost increases
The industry has generally been successful passing major raw material increases through to its customers There tends to be a lag from the time costs increase until higher selling prices are fully implemented, partially due to LIFO inventories Longer-term major fiber cost increases are opportunities to recover other cost increases and improve margins
6
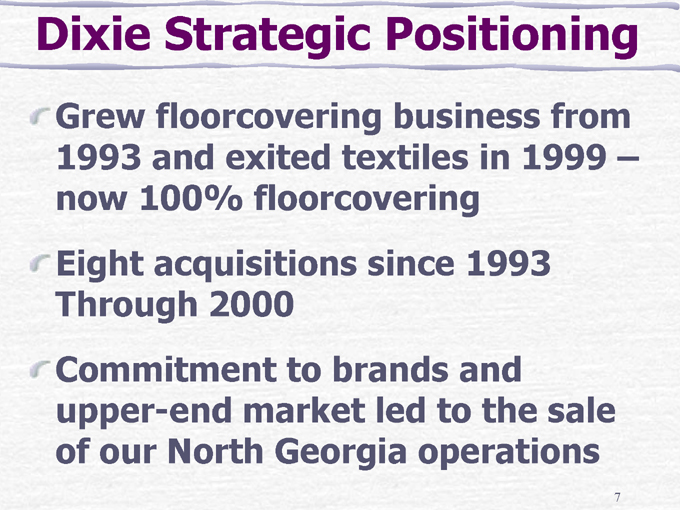
Dixie Strategic Positioning
Grew floorcovering business from 1993 and exited textiles in 1999 – now 100% floorcovering
Eight acquisitions since 1993 Through 2000
Commitment to brands and upper-end market led to the sale of our North Georgia operations
7
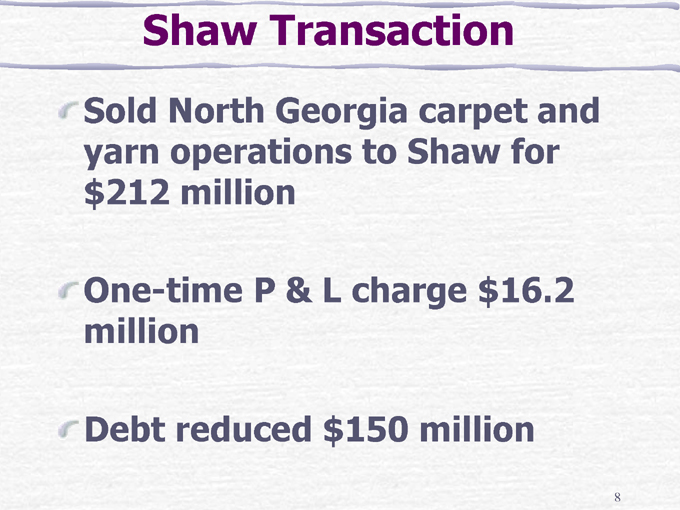
Shaw Transaction
Sold North Georgia carpet and yarn operations to Shaw for $212 million
One-time P & L charge $16.2 million
Debt reduced $150 million
8
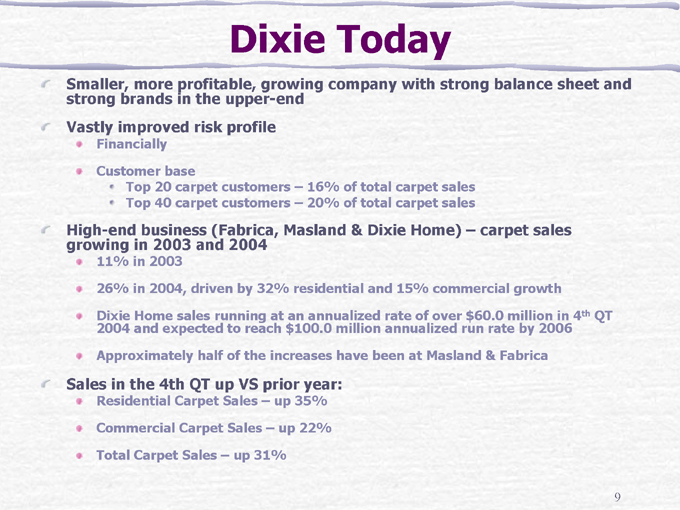
Dixie Today
Smaller, more profitable, growing company with strong balance sheet and strong brands in the upper-end Vastly improved risk profile
Financially Customer base
Top 20 carpet customers – 16% of total carpet sales Top 40 carpet customers – 20% of total carpet sales
High-end business (Fabrica, Masland & Dixie Home) – carpet sales growing in 2003 and 2004
11% in 2003
26% in 2004, driven by 32% residential and 15% commercial growth Dixie Home sales running at an annualized rate of over $60.0 million in 4th QT 2004 and expected to reach $100.0 million annualized run rate by 2006 Approximately half of the increases have been at Masland & Fabrica
Sales in the 4th QT up VS prior year:
Residential Carpet Sales – up 35% Commercial Carpet Sales – up 22% Total Carpet Sales – up 31%
9
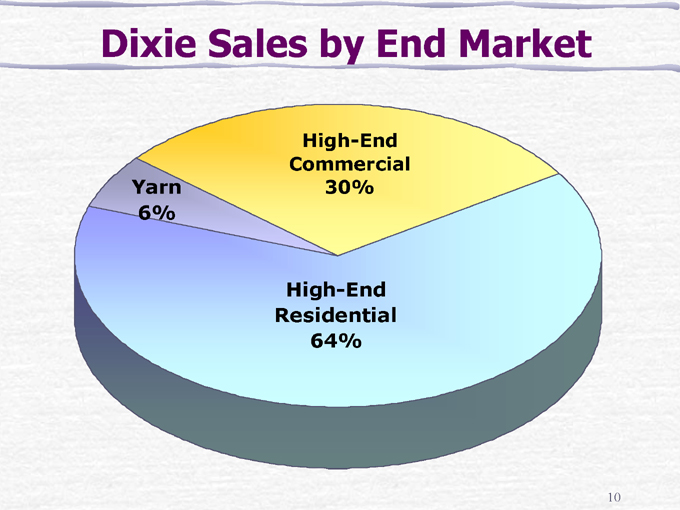
Dixie Sales by End Market
High-End Commercial 30%
Yarn 6%
High-End Residential 64%
10
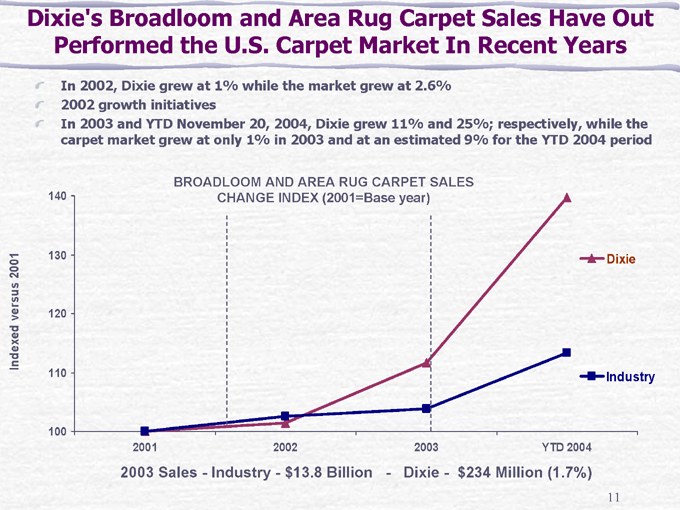
Dixie’s Broadloom and Area Rug Carpet Sales Have Out Performed the U.S. Carpet Market In Recent Years
In 2002, Dixie grew at 1% while the market grew at 2.6% 2002 growth initiatives
In 2003 and YTD November 20, 2004, Dixie grew 11% and 25%; respectively, while the carpet market grew at only 1% in 2003 and at an estimated 9% for the YTD 2004 period
BROADLOOM AND AREA RUG CARPET SALES
CHANGE INDEX (2001=Base year)
Indexed versus 2001
140 130 120 110 100
2001
2002
2003
YTD 2004
Dixie
Industry
2003 Sales—Industry—$13.8 Billion—Dixie—$234 Million (1.7%)
11
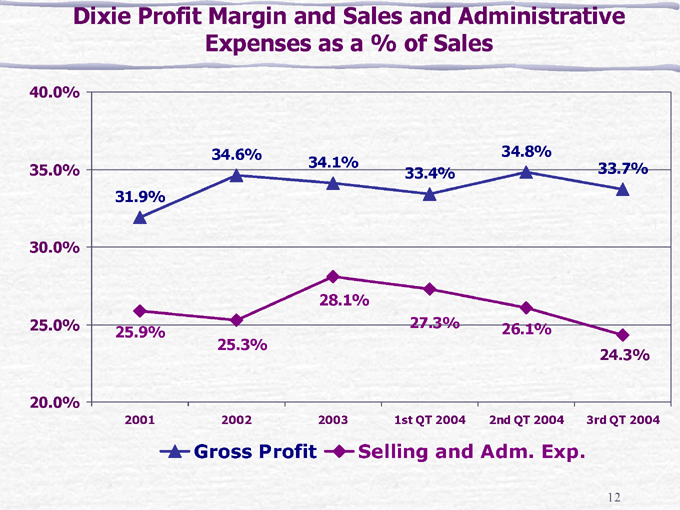
Dixie Profit Margin and Sales and Administrative Expenses as a % of Sales
40.0%
35.0% 30.0% 25.0% 20.0%
31.9%
34.6%
34.1%
33.4%
34.8%
33.7%
25.9%
25.3%
28.1%
27.3%
26.1%
24.3%
2001
2002
2003
1st QT 2004
2nd QT 2004
3rd QT 2004
Gross Profit
Selling and Adm. Exp.
12
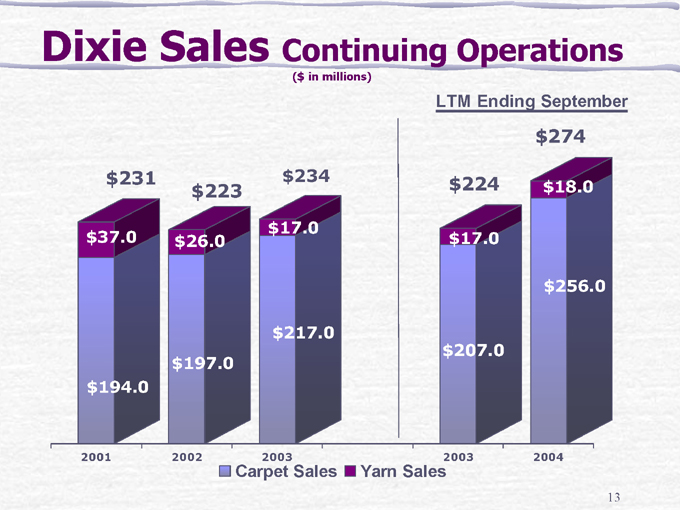
Dixie Sales Continuing Operations
($in millions)
$231
$37.0
$194.0
$223
$26.0
$197.0
$234
$17.0
$217.0
2001
2002
2003
$224
$17.0
$207.0
$274
$18.0
$256.0
2003
2004
Carpet Sales
Yarn Sales
13
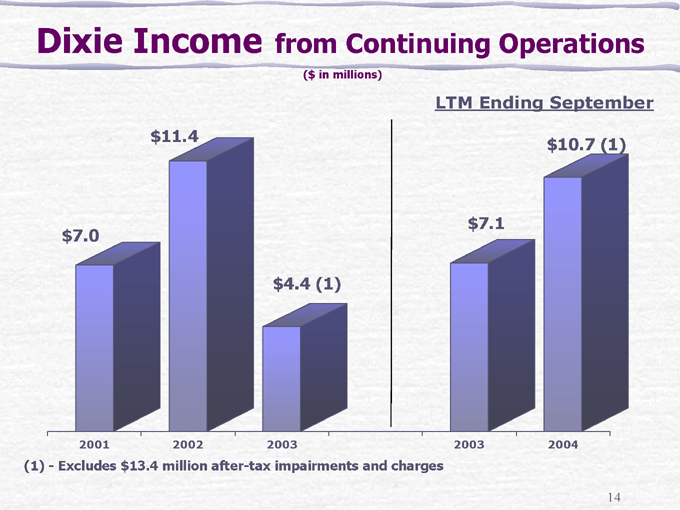
Dixie Income from Continuing Operations
($ in millions)
$7.0
$11.4
$4.4 (1)
2001
2002
2003
LTM Ending September $7.1 $10.7 (1)
2003 2004
(1)—Excludes $13.4 million after-tax impairments and charges
14
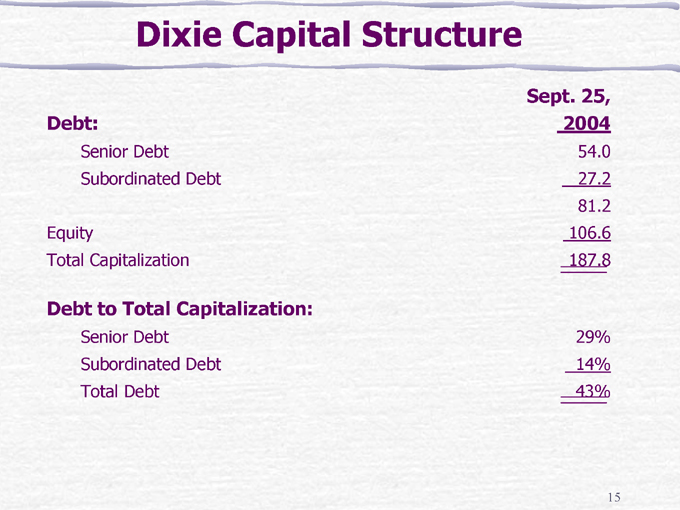
Dixie Capital Structure
Sept. 25,
Debt: 2004
Senior Debt 54.0
Subordinated Debt 27.2
81.2
Equity 106.6
Total Capitalization 187.8
Debt to Total Capitalization:
Senior Debt 29%
Subordinated Debt 14%
Total Debt 43%
15
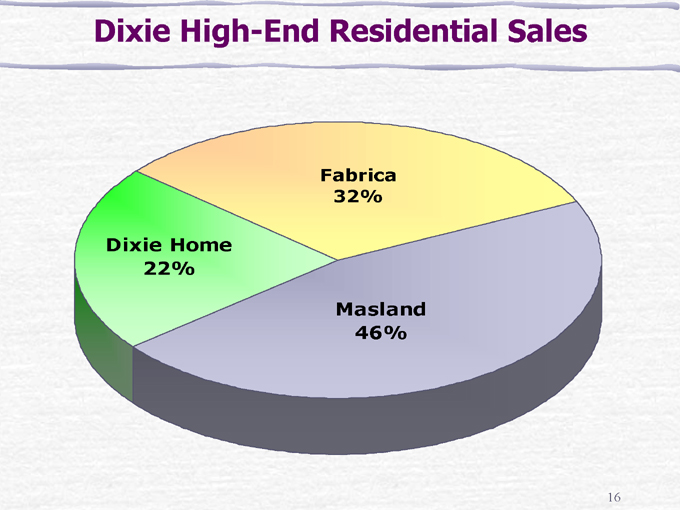
Dixie High-End Residential Sales
Fabrica 32%
Dixie Home 22%
Masland 46%
16
Residential Positioning
Goal is to be a highly profitable, high-styled supplier at the upper-end of the residential marketplace Retailers rate the Masland and Fabrica lines as leaders in quality, service and innovation. Together, these lines have the largest market share in the > $22 price range However, we see the $10 - $20 price range having a much larger potential market that fits Dixie’s high-end strategy Our objective is to make Dixie Home the “go to” line in the $10 - $20 range for styling, service and quality
17
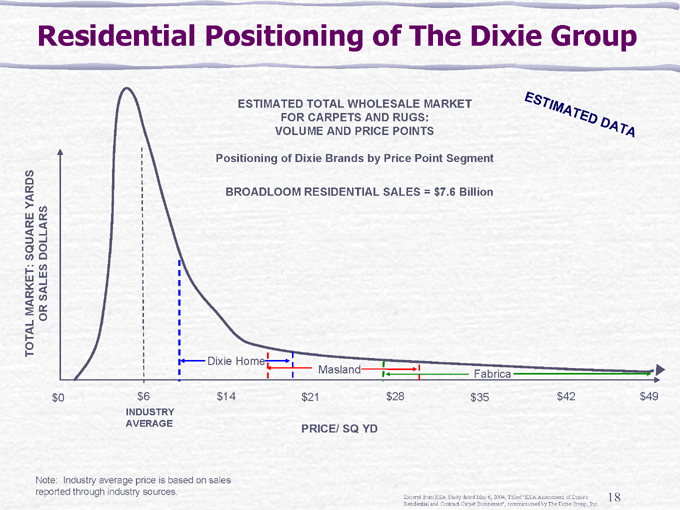
Residential Positioning of The Dixie Group
ESTIMATED TOTAL WHOLESALE MARKET
FOR CARPETS AND RUGS: VOLUME AND PRICE POINTS
Positioning of Dixie Brands by Price Point Segment
BROADLOOM RESIDENTIAL SALES = $7.6 Billion
TOTAL MARKET: SQUARE YARDS
OR SALES DOLLARS
Dixie Home
Masland
Fabrica
$0
$6
$14
$21
$28
$35
$42
$49
ESTIMATED DATA
INDUSTRY AVERAGE
PRICE/ SQ YD
Note: Industry average price is based on sales reported through industry sources.
Excerpt from KSA Study dated May 6, 2004, Titled “KSA Assessment of Dixie’s Residential and Contract Carpet Businesses”, commissioned by The Dixie Group, Inc.
18
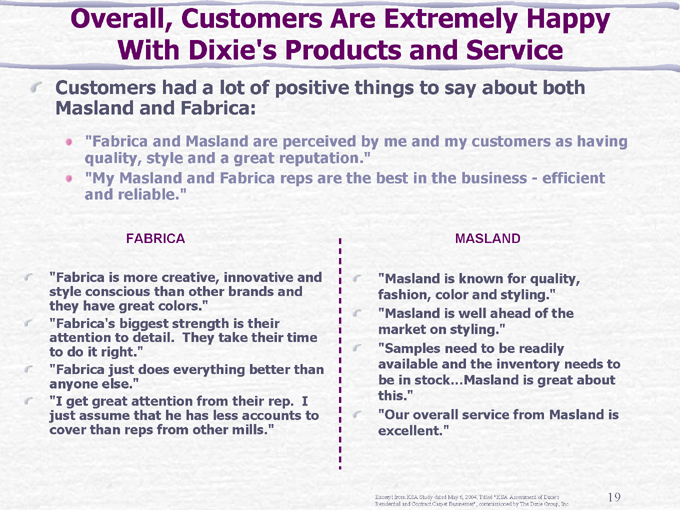
Overall, Customers Are Extremely Happy With Dixie’s Products and Service
Customers had a lot of positive things to say about both Masland and Fabrica:
“Fabrica and Masland are perceived by me and my customers as having quality, style and a great reputation.” “My Masland and Fabrica reps are the best in the business - efficient and reliable.”
FABRICA
“Fabrica is more creative, innovative and style conscious than other brands and they have great colors.” “Fabrica’s biggest strength is their attention to detail. They take their time to do it right.” “Fabrica just does everything better than anyone else.” “I get great attention from their rep. I just assume that he has less accounts to cover than reps from other mills.”
MASLAND
“Masland is known for quality, fashion, color and styling.” “Masland is well ahead of the market on styling.” “Samples need to be readily available and the inventory needs to be in stock…Masland is great about this.” “Our overall service from Masland is excellent.”
Excerpt from KSA Study dated May 6, 2004, Titled “KSA Assessment of Dixie’s Residential and Contract Carpet Businesses”, commissioned by The Dixie Group, Inc.
19
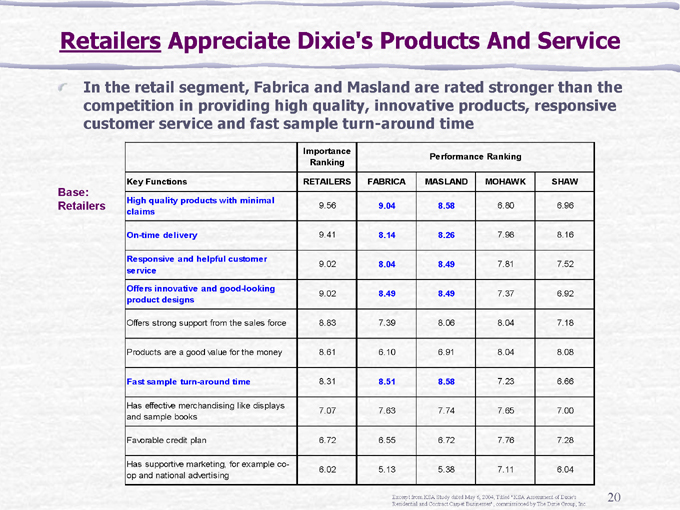
Retailers Appreciate Dixie’s Products And Service
In the retail segment, Fabrica and Masland are rated stronger than the competition in providing high quality, innovative products, responsive customer service and fast sample turn-around time
Base: Retailers
Importance Ranking Performance Ranking
Key Functions RETAILERS FABRICA MASLAND MOHAWK SHAW
High quality products with minimal claims 9.56 9.04 8.58 6.80 6.96
On-time delivery 9.41 8.14 8.26 7.98 8.16
Responsive and helpful customer service 9.02 8.04 8.49 7.81 7.52
Offers innovative and good-looking
9.02 8.49 8.49 7.37 6.92
product designs
Offers strong support from the sales force 8.83 7.39 8.06 8.04 7.18
Products are a good value for the money 8.61 6.10 6.91 8.04 8.08
Fast sample turn-around time 8.31 8.51 8.58 7.23 6.66
Has effective merchandising like displays and sample books 7.07 7.63 7.74 7.65 7.00
Favorable credit plan 6.72 6.55 6.72 7.76 7.28
Has supportive marketing, for example co-op and national advertising 6.02 5.13 5.38 7.11 6.04
Excerpt from KSA Study dated May 6, 2004, Titled “KSA Assessment of Dixie’s Residential and Contract Carpet Businesses”, commissioned by The Dixie Group, Inc.
20
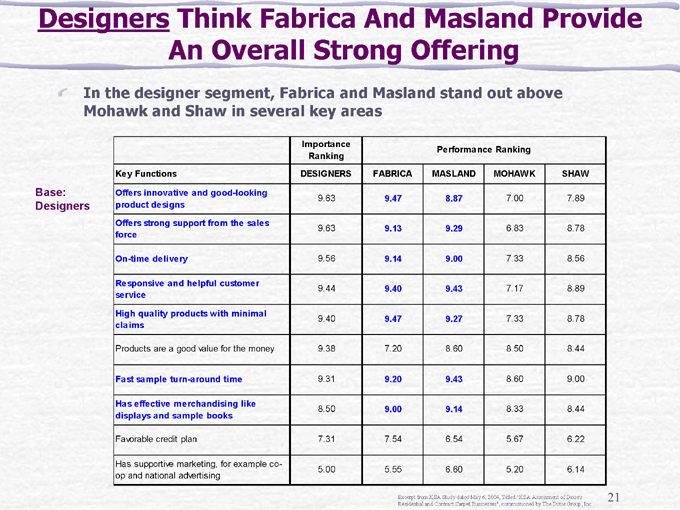
Designers Think Fabrica And Masland Provide An Overall Strong Offering
In the designer segment, Fabrica and Masland stand out above Mohawk and Shaw in several key areas
Base: Designers
Importance Ranking Performance Ranking
Key Functions DESIGNERS FABRICA MASLAND MOHAWK SHAW
Offers innovative and good-looking product designs 9.63 9.47 8.87 7.00 7.89
Offers strong support from the sales force 9.63 9.13 9.29 6.83 8.78
On-time delivery 9.56 9.14 9.00 7.33 8.56
Responsive and helpful customer service 9.44 9.40 9.43 7.17 8.89
High quality products with minimal claims 9.40 9.47 9.27 7.33 8.78
Products are a good value for the money 9.38 7.20 8.60 8.50 8.44
Fast sample turn-around time 9.31 9.20 9.43 8.60 9.00
Has effective merchandising like displays and sample books 8.50 9.00 9.14 8.33 8.44
Favorable credit plan 7.31 7.54 6.54 5.67 6.22
Has supportive marketing, for example co-op and national advertising 5.00 5.55 6.60 5.20 6.14
Excerpt from KSA Study dated May 6, 2004, Titled “KSA Assessment of Dixie’s Residential and Contract Carpet Businesses”, commissioned by The Dixie Group, Inc.
21
Residential Summary
Fabrica and Masland are among the most respected brands in high-end residential carpet Fabrica’s and Masland’s combined residential sales are estimated to be about 35% of total U.S. industry sales at $22.00 and higher Dixie Home at $10-$20
Provides access for Dixie to a larger sector of the market Creates an opportunity to utilize Masland’s assets, thereby reducing overall costs Helps Dixie become more important to upper-middle & high-end customers
Excerpt from KSA Study dated May 6, 2004, Titled “KSA Assessment of Dixie’s Residential and Contract Carpet Businesses”, commissioned by The Dixie Group, Inc.
22
Residential Broadloom — Dixie Home
Fulfill market need for third player.
Well-styled moderate to upper priced line
Leverage need by fiber suppliers for market access.
Branded high-styled goods – not “me too” Support fiber suppliers’ branded products
Limited distribution strategy attractive to retailers.
Drive more volume on existing capacity at Masland/Dixie.
23
Today’s Situation
Dixie Home is now well positioned with retailers
2,468 active retail stores
1,598 active mass merchant stores
Impact of 2004 introductions
Potential impact of January 2005 Surfaces introductions
24
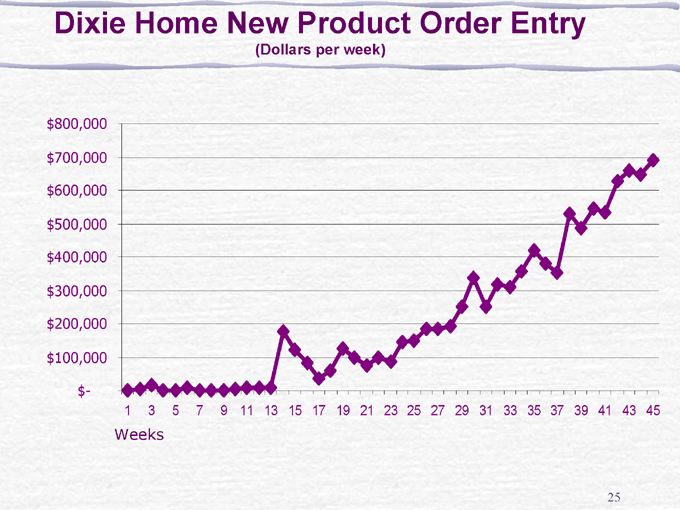
Dixie Home New Product Order Entry
(Dollars per week) $800,000 $700,000 $600,000 $500,000 $400,000 $300,000 $200,000 $100,000 $-
1
3
5
7
9
11
13
15
17
19
21
23
25
27
29
31
33
35
37
39
41
43
45
Weeks
25
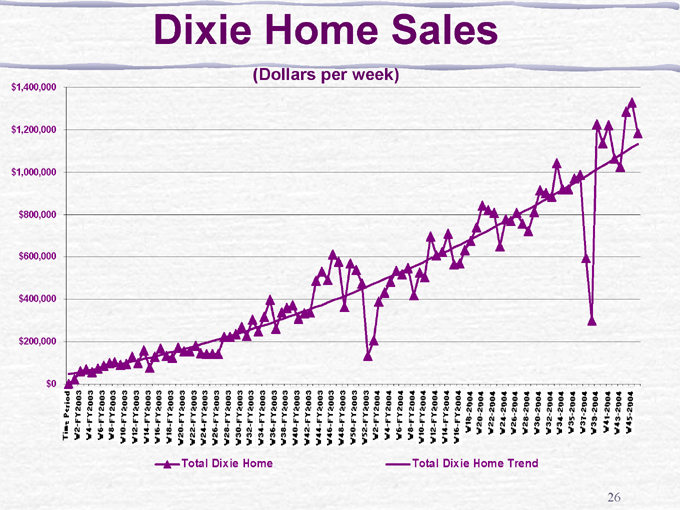
Dixie Home Sales
(Dollars per week) $1,400,000 $1,200,000 $1,000,000 $800,000 $600,000 $400,000 $200,000 $0
Total Dixie Home
Total Dixie Home Trend
26
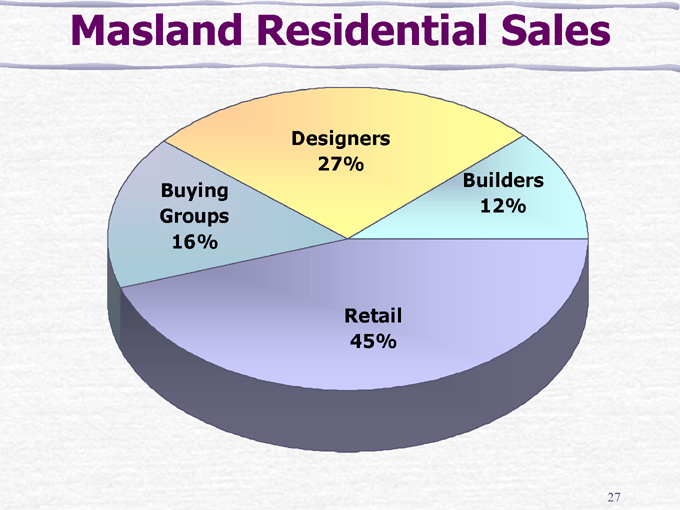
Masland Residential Sales
Designers 27%
Buying Groups 16%
Retail 45%
Builders 12%
27
Masland Residential
Leading high-end brand with reputation for development of products with innovative styling, design and color Doubling product introductions to increase market penetration Drive more volume on existing capacity at Masland/Dixie
28
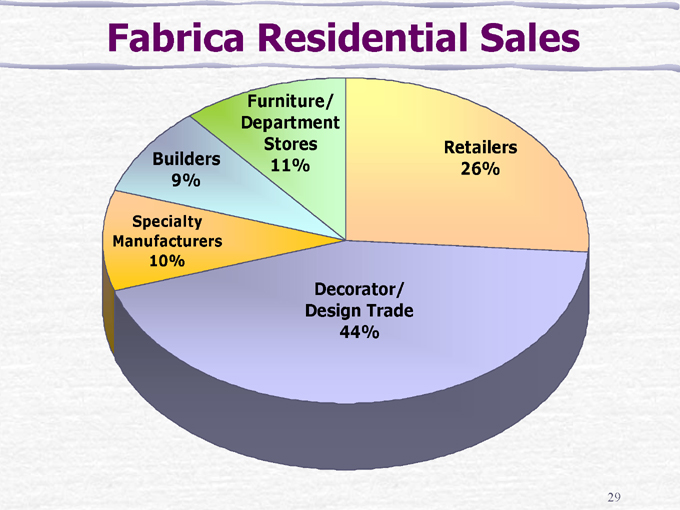
Fabrica Residential Sales
Furniture/ Department Stores 11%
Builders 9%
Specialty Manufacturers 10%
Retailers 26%
Decorator/ Design Trade 44%
29
Fabrica Residential
Premium high-end brand
Leader in styling/patterns/color
Consistent sales and profit growth
12 years consecutive sales growth Over 50% profit growth since July 2000 acquisition
30
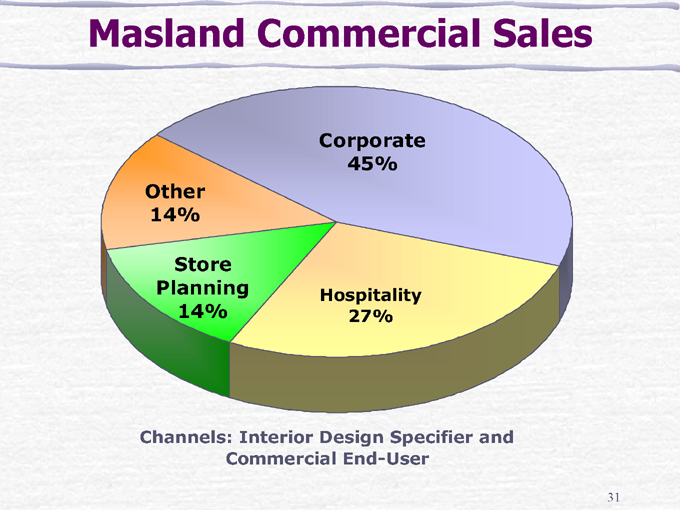
Masland Commercial Sales
Corporate 45%
Other 14%
Store Planning 14%
Hospitality 27%
Channels: Interior Design Specifier and Commercial End-User
31
Masland Commercial
Good and growing position with premium brand Designer focused Strong national account base Strong growth from new “Energy
Collection”
KSA study – identified potential opportunities
32
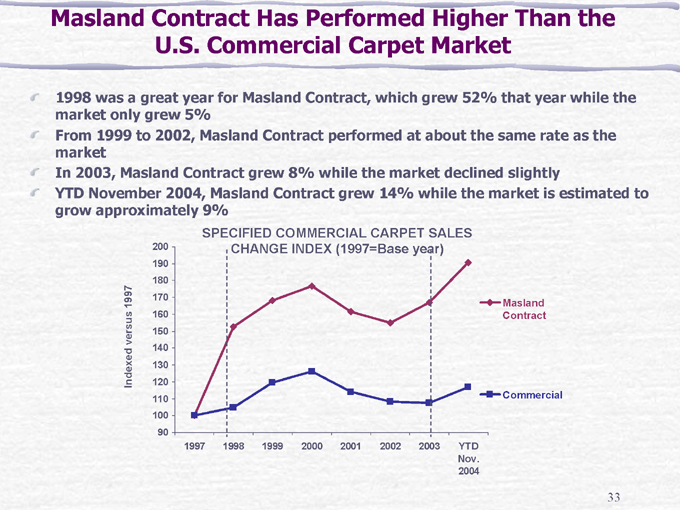
Masland Contract Has Performed Higher Than the U.S. Commercial Carpet Market
1998 was a great year for Masland Contract, which grew 52% that year while the market only grew 5% From 1999 to 2002, Masland Contract performed at about the same rate as the market In 2003, Masland Contract grew 8% while the market declined slightly YTD November 2004, Masland Contract grew 14% while the market is estimated to grow approximately 9%
SPECIFIED COMMERCIAL CARPET SALES
CHANGE INDEX (1997=Base year)
Indexed versus 1997
200 190 180 170 160
150
140
130
120
110
100
90
1997
1998
1999
2000
2001
2002
2003
YTD
Nov. 2004
Masland Contract
Commercial
33
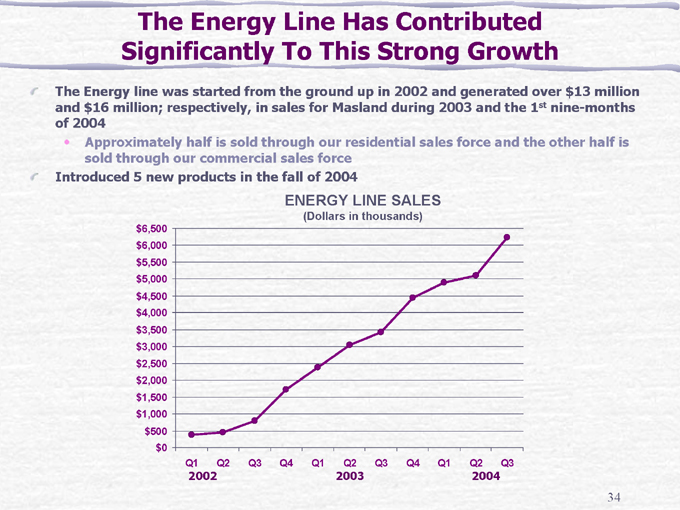
The Energy Line Has Contributed Significantly To This Strong Growth
The Energy line was started from the ground up in 2002 and generated over $13 million and $16 million; respectively, in sales for Masland during 2003 and the 1st nine-months of 2004
Approximately half is sold through our residential sales force and the other half is sold through our commercial sales force
Introduced 5 new products in the fall of 2004
ENERGY LINE SALES
(Dollars in thousands)
$6,500
$6,000
$5,500
$5,000
$4,500
$4,000
$3,500
$3,000
$2,500
$2,000
$1,500
$1,000
$500
$0
Q1 Q2 Q3 Q4 Q1 Q2 Q3 Q4 Q1 Q2 Q3
2002 2003 2004
34
Summary
Smaller, highly profitable, growing company with strong brands in the upper-end Vastly improved risk profile
Financially – strong balance sheet Customer base
Focused on internal profitable growth
35